PowerPoint Presentationsiteresources.worldbank.org/.../StephenHo… · PPT file · Web view ·...
38
WILL INDIA BECOME AN ECONOMIC SUPERPOWER, DOES IT MATTER & WHAT MIGHT PREVENT IT? Stephen Howes, Lead Economist (India), World Bank March 2005 [email protected] Disclaimer: This represents my views, not those of the World Bank
Transcript of PowerPoint Presentationsiteresources.worldbank.org/.../StephenHo… · PPT file · Web view ·...
WILL INDIA BECOME AN ECONOMIC SUPERPOWER, DOES IT MATTER & WHAT
MIGHT PREVENT IT?Stephen Howes, Lead Economist (India), World Bank
March [email protected]
Disclaimer: This represents my views, not those of the World Bank
A. WILL INDIA BECOME AN ECONOMIC SUPERPOWER?

India currently has the 11th largest GDP in the world…
WDI: Constant 1995 US$ billion, 2002
230248268282347411414452477515637650716
11811237
14101552
19763979
10417
Sw edenBelgium
Sw itzerlandTaiw anRussia
AustraliaNetherlands
BrazilSouth Korea
IndiaMexico
SpainCanada
ItalyChina
FranceUnited Kingdom
GermanyJapan
United States

…accounting for 1.6% of the global GDP in 2002…
1.1%
1.3%
1.3%
1.4%
1.5%
1.6%
2.0%
2.1%
2.3%
3.7%
3.9%
4.5%
4.9%
6.3%
12.6%
33.0%
Russia
Australia
Netherlands
Brazil
Korea, Rep.
India
Mexico
Spain
Canada
Italy
China
France
United Kingdom
Germany
Japan
United States
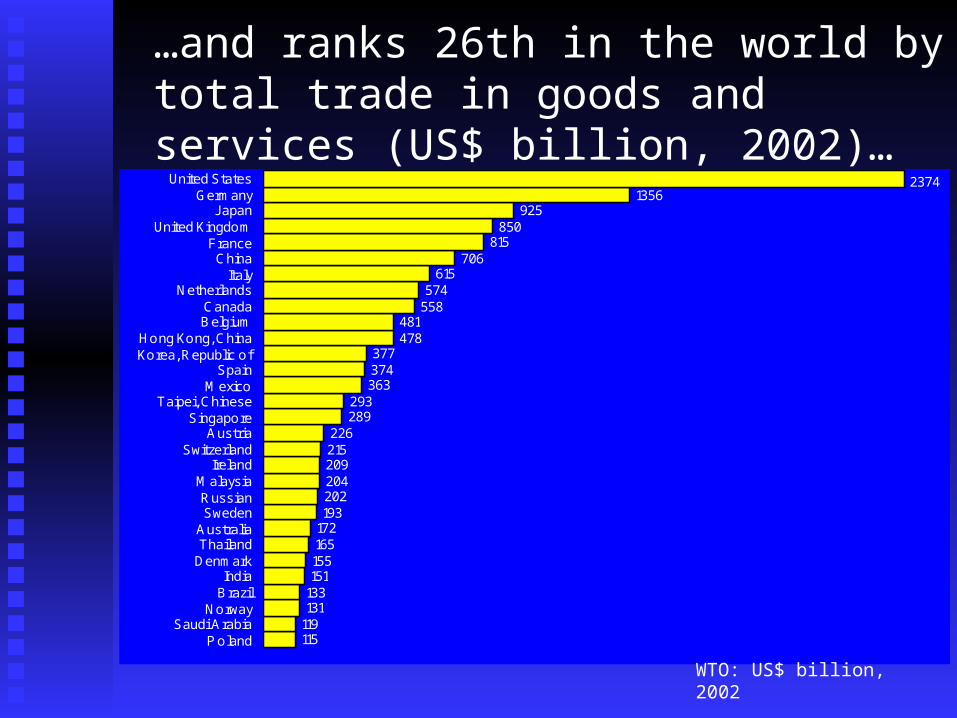
…and ranks 26th in the world by total trade in goods and services (US$ billion, 2002)…
115119131133151155165172193202204209215226
289293
363374377
478481
558574
615706
815850
9251356
2374
P olandSaudi Arabia
NorwayBrazilIndia
DenmarkThailandAustraliaSwedenRussian
MalaysiaIreland
SwitzerlandAustria
SingaporeTaipei, Chinese
MexicoSpain
Korea, Republic ofHong Kong, China
BelgiumCanada
NetherlandsItaly
ChinaFrance
United KingdomJ apan
GermanyUnited States
WTO: US$ billion, 2002
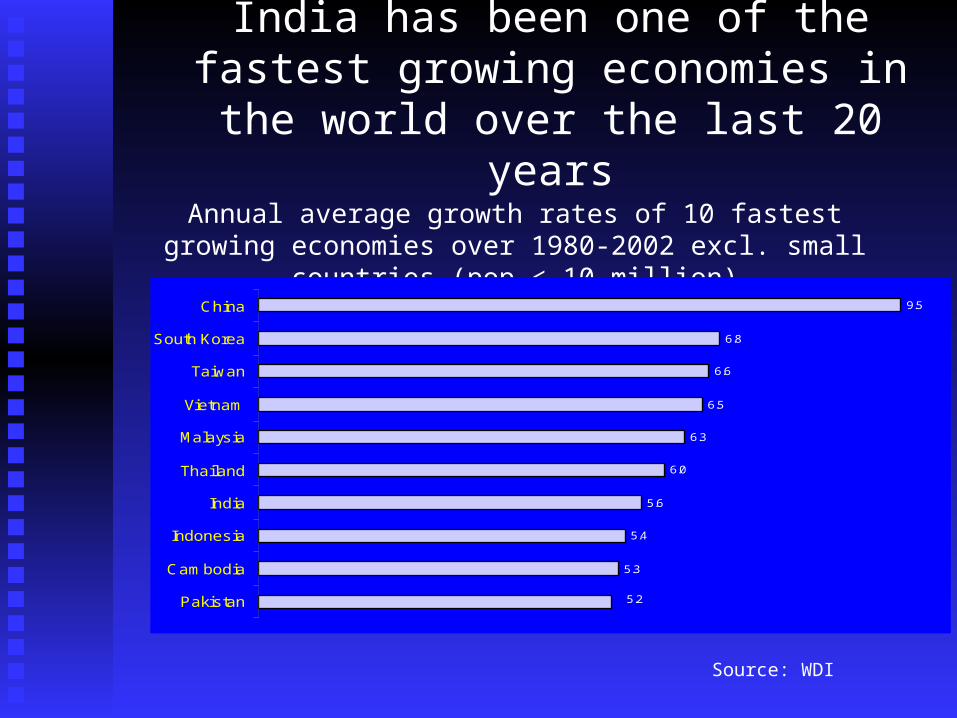
India has been one of the fastest growing economies in the world over the last 20 years
Annual average growth rates of 10 fastest growing economies over 1980-2002 excl. small countries (pop < 10 million)
Source: WDI
5.3
5.4
5.6
6.0
6.3
6.5
6.6
6.8
9.5
5.2Pakistan
Cambodia
Indonesia
India
Thailand
Malaysia
Vietnam
Taiwan
South Korea
China

What does the Goldman Sachs BRIC Report say?(BRIC=Brazil, Russia, India, China)
2.5%1.9% 1.8%
2.1% 2.2%2.9%
2.4%
-0.1%
9.5%
5.6%
0.9%1.3% 1.3%
1.8% 2.0%2.6%
4.2%
5.6%
7.7%
8.5%
-1%
1%
2%
3%
4%
5%
6%
7%
8%
9%
10%
Japa
n
Italy
Ger
man
y
Fran
ce
UK
US
Braz
il
Rus
sia
Chi
na
Indi
a
Historical (1980-2002) Goldman Sachs (2000-2050)
Goldman Sachs in their BRIC report have higher than historical projections for Brazil and Russia and lower predictions for China…
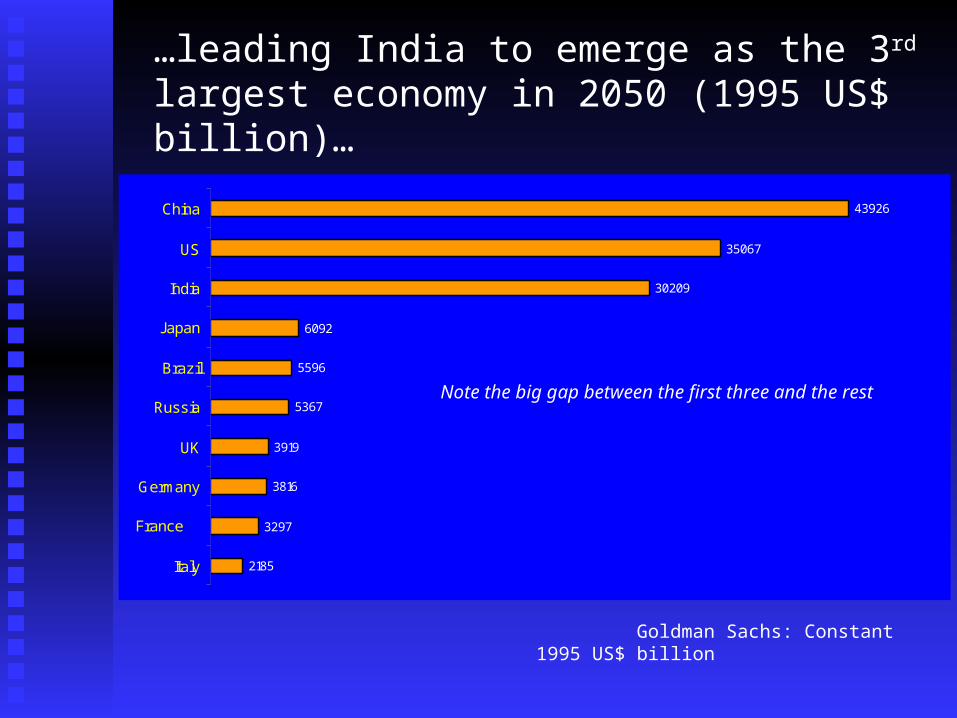
…leading India to emerge as the 3rd largest economy in 2050 (1995 US$ billion)…
2185
3297
3816
3919
5367
5596
6092
30209
35067
43926
Italy
France
Germany
UK
Russia
Brazil
Japan
India
US
China
Goldman Sachs: Constant 1995 US$ billion
Note the big gap between the first three and the rest
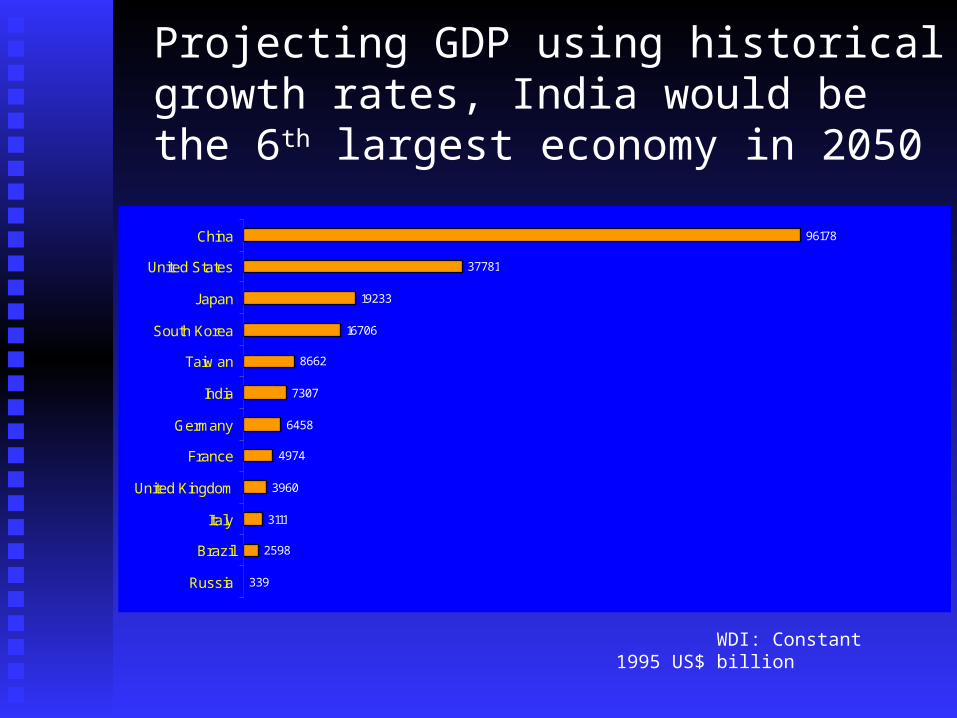
Projecting GDP using historical growth rates, India would be the 6th largest economy in 2050
339
2598
3111
3960
4974
6458
7307
8662
16706
19233
37781
96178
Russia
Brazil
Italy
United Kingdom
France
Germany
India
Taiw an
South Korea
Japan
United States
China
WDI: Constant 1995 US$ billion

Under GS assumptions, India would be the world’s 3rd largest trader in 2050
948
1013
1238
1421
2021
2054
3018
5575
6969
13842
0 2000 4000 6000 8000 10000 12000 14000 16000
Italy
Brazil
Japan
France
Germany
UK
Russia
India
US
China
Goldman Sachs & WDI: Constant 1995 US$ billion, projected at historical Trade-to-GDP ratios

Using historical growth rates, India would be the 10th largest trader in 2050
0.4%
0.9%
2.6%
2.6%
4.1%
4.2%
6.7%
7.6%
14.7%
15.5%
21.1%
59.1%
Russia
Brazil
India
Italy
United Kingdom
France
Germany
Japan
United States
Taiw an
South Korea
China

Will India Become an Economic Superpower?
India is already a large player.
It will become larger.
But it may not become one of three giants

B. DOES IT MATTER IF AND WHEN INDIA
BECOMES AN ECONOMIC SUPERPOWER?
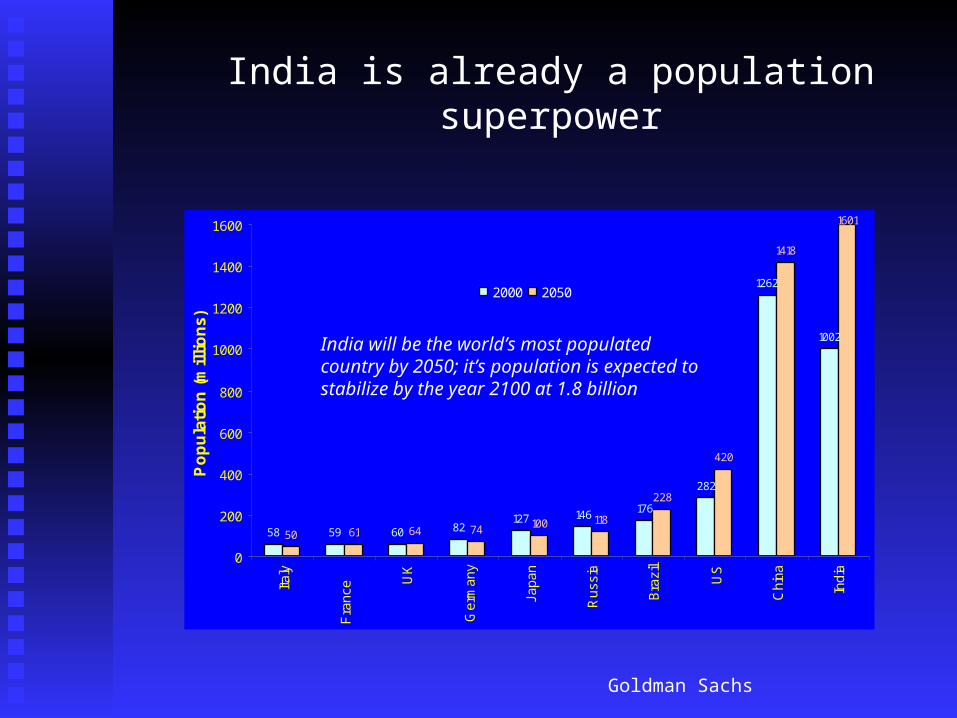
India is already a population superpower
58 59 60 82 127 146 176282
1262
1002
50 61 64 74 100 118228
420
1418
1601
0
200
400
600
800
1000
1200
1400
1600
Italy
Fra
nce
UK
Ger
man
y
Japa
n
Rus
sia
Bra
zil
US
Chi
na
Indi
a
Popu
latio
n (m
illio
ns)
2000 2050
Goldman Sachs
India will be the world’s most populated country by 2050; it’s population is expected to stabilize by the year 2100 at 1.8 billion
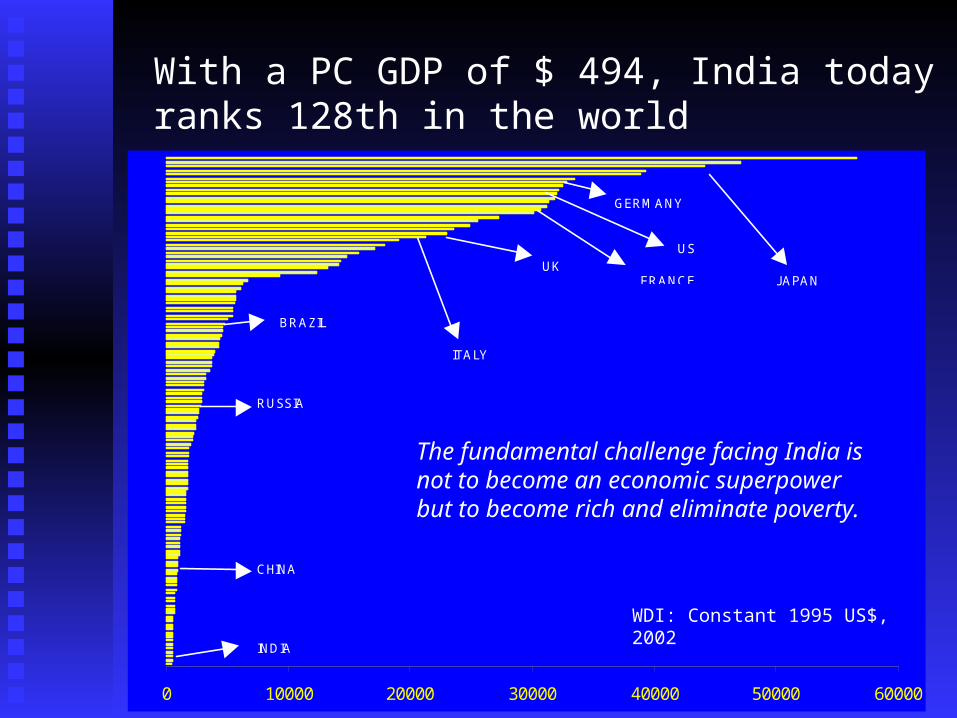
With a PC GDP of $ 494, India today ranks 128th in the world
0 10000 20000 30000 40000 50000 60000
INDIA
US
GERMANY
FRANCEUK
ITALY
J APAN
CHINA
BRAZIL
RUSSIA
WDI: Constant 1995 US$, 2002
The fundamental challenge facing India is not to become an economic superpower but to become rich and eliminate poverty.

Alternative Scenarios
If India grew at GS rates it would be the poorest of the BRIC and G6 countries If India grew at GS rates it would be the poorest of the BRIC and G6 countries in 2050, but equivalent to a low-end high income country like Spain today in 2050, but equivalent to a low-end high income country like Spain today
If India grows at historical growth rates (6.5%) for the next 50 years, India If India grows at historical growth rates (6.5%) for the next 50 years, India would have in 2050 a GDP PC of US $ 4564 (constant 1995 US$) equivalent would have in 2050 a GDP PC of US $ 4564 (constant 1995 US$) equivalent to a lower-middle-income country like Brazil today.to a lower-middle-income country like Brazil today.
If India reverts to the “Hindu growth rate” (3.5%), its 2050 GDP p.c. will be If India reverts to the “Hindu growth rate” (3.5%), its 2050 GDP p.c. will be US$ 1723, equivalent to Iran today.US$ 1723, equivalent to Iran today.
Summary of scenariosSummary of scenarios
todayGrowth scenario 8% 6.50% 3.50%PC Income (USD) 494 18731 4564 1723Ranking of economy in 2050 11th 3rd 6th top 12Ranking of PC income today 128th 23rd 44th 77th
2050

C. WHAT MIGHT PREVENT INDIA FROM BECOMING
AN ECONOMIC SUPERPOWER?

RISKS TO GROWTH
• So far, just doing trend analysis. But economic growth can slow down as well as speed up. Countries can catch up, but also be left behind.
• Argentina: 1889 GDP pc = 91% of US GDP pc 1999 GDP pc = 33% of US GDP pc
• What are the factors which might slow down growth in India?

1. MACRO SHOCKSHas the economy been shock-proofed?
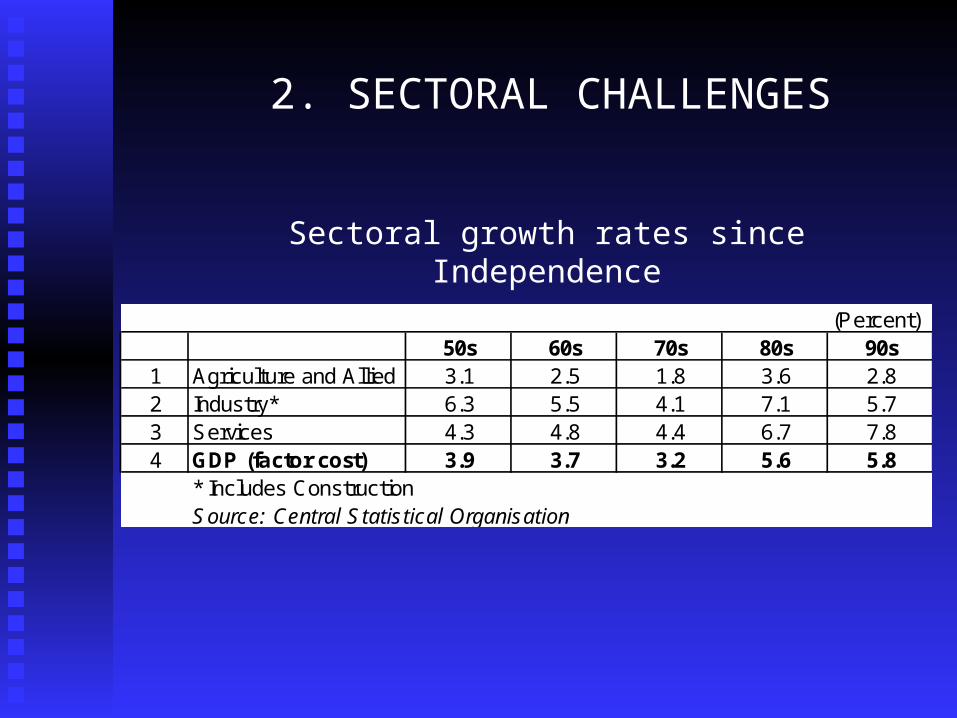
2. SECTORAL CHALLENGES
Sectoral growth rates since Independence
(Percent)50s 60s 70s 80s 90s
1 Agriculture and Allied 3.1 2.5 1.8 3.6 2.82 Industry* 6.3 5.5 4.1 7.1 5.73 Services 4.3 4.8 4.4 6.7 7.84 GDP (factor cost) 3.9 3.7 3.2 5.6 5.8
* Includes ConstructionSource: Central Statistical Organisation

2. SECTORAL CHALLENGES: Industry
35.724.9
17.3 15.6 15.9
22.126.6
29.647.0 50.9
42.2 48.5
69.553.1
37.4 33.3
1.9
28.6
0%
10%
20%
30%
40%
50%
60%
70%
80%
90%
100%
LDCs India OECD Sub-SaharanAfrica
East Asia &Pacif ic
China
Agriculture IndustryServices WDI
India’s low share of industry in GDP compared to East Asia.

3. GROWING UNEMPLOYMENT: jobless growth?
Elasticity of Employment to GDP
1977-78 1983 1993-94to to to
1983 1993-94 1999-00
1 Agriculture 0.45 0.50 0.002 Mining & Quarrying 0.80 0.69 0.003 Manufacturing 0.67 0.33 0.264 Electricity 0.73 0.52 0.005 Construction 1.00 1.00 1.00
6Wholesale & Retail Trade 0.78 0.63 0.55
7Transport Storage & Construction 1.00 0.49 0.69
8
Finance, Real Estate, Insurance & Business Services 1.00 0.92 0.73
9Community, Social and Personal Services 0.83 0.50 0.07All Sectors 0.53 0.41 0.15
Source: Planning Commission Reports on Labour and Employment
Sector

3. GROWING UNEMPLOYMENT (cont): Will moderate growth be enough?

4. GROWING REGIONAL INEQUALITY
Central Statistical Organization
189282
309351
383465474
494514
577582
603659
715738
0 100 200 300 400 500 600 700 800
Bihar
OrissaUttar Pradesh
Madhya Pradesh
RajasthanAndhra Pradesh
West Bengal
All India Karnataka
Kerala
Tamil NaduGujarat
Haryana
MaharashtraPunjab
State GDP p.c. USD, 1999-00

4. GROWING REGIONAL INEQUALITY (cont).
Central Statistical Organization
165466
573729
9031301
17371924
22052258
23522352
27713460
3765
0 500 1000 1500 2000 2500 3000 3500 4000
Bihar
OrissaUttar Pradesh
Madhya Pradesh
West Bengal
RajasthanAll India
Haryana
GujaratKarnataka
Andhra Pradesh
Punjab
KeralaMaharashtra
Tamil Nadu
GDP PC in constant US$, projected for the year 2050 using historical growth rates

5. POPULATION GROWTH
1991
"BIMARU"41%
North5%
East15%
West15%
South24%
2051
South19%
West14%
East14%
North5%
"BIMARU"48%
Economic & Political Weekly, Vol. XXXVIII No. 45, November 8-14, 2003
India’s Regional Distribution of Population will Change Over Time

6. URBANIZATION
24.328.1
37.6 38.2
76.279.3
0
10
20
30
40
50
60
70
80
90
LDCs India China South EastAsia
Latin America OECD
Source: WDI
India’s urbanization has only just begun
Urbanization as a proportion of total population, year 2002

6. URBANIZATION (cont.) If India does grow rapidly, one would expect about 75% If India does grow rapidly, one would expect about 75%
of India’s population would be urbanized by 2050of India’s population would be urbanized by 2050 Urban population in 2050 = 75% of 1.6 billion = 1.2 Urban population in 2050 = 75% of 1.6 billion = 1.2
billionbillion Urban population today = 28% of 1.002 billion = 280 Urban population today = 28% of 1.002 billion = 280
millionmillion Urban population would increase by 920 million by Urban population would increase by 920 million by
2050 (almost 20 million new urban residents a year)2050 (almost 20 million new urban residents a year) Can India cope with such rapid urbanization, or will Can India cope with such rapid urbanization, or will
it stymie India’s growth?it stymie India’s growth?
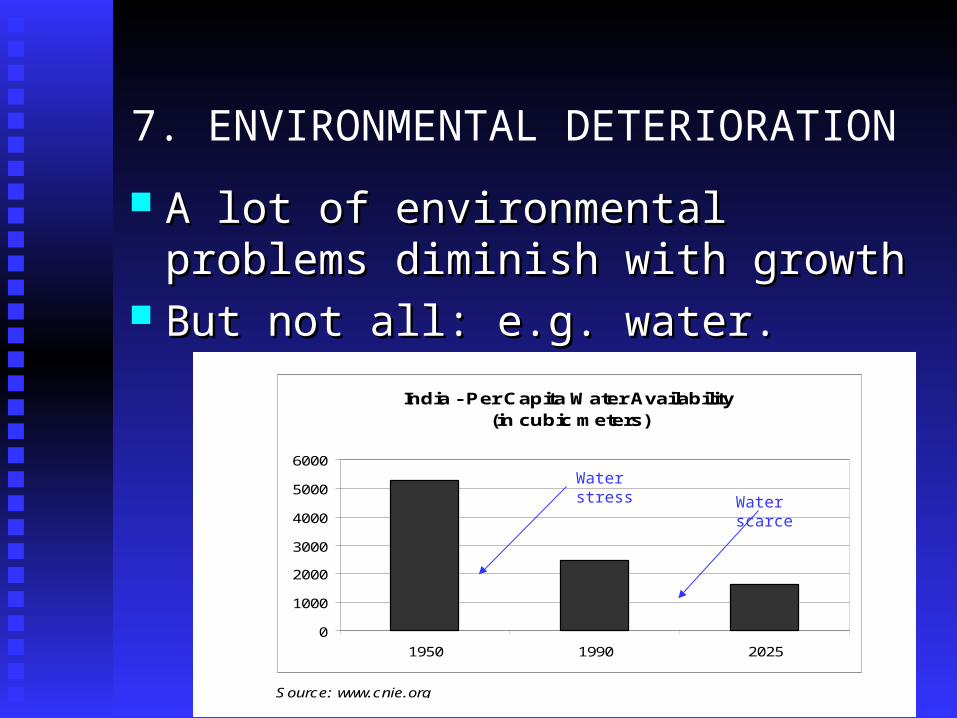
7. ENVIRONMENTAL DETERIORATION
A lot of environmental problems diminish A lot of environmental problems diminish with growthwith growth
But not all: e.g. water.But not all: e.g. water.
Source: www.cnie.org
India - Per Capita Water Availability (in cubic meters)
0
1000
2000
3000
4000
5000
6000
1950 1990 2025
Water stressWater scarce

8. HEALTH THREATS: AIDS
Water stressWater scarce
Prevalence of HIV as a proportion of working population in 2001: India next only to, but well below, Sub-Saharan Africa,
0.10 0.10 0.19 0.23 0.45 0.64 0.67 0.80
8.36
0123456789

8. HEALTH THREATS (cont.): AIDS
Water stressWater scarce
HIV Prevalence: STD Patients in South Africa, Major Urban Areas, 1990-2000 Compared to Selected States of India in 2002
(Median Prevalence in percent)
1.6 5.6 6.2 9.5 11.3 13.6 14.7 15.3 18.7 21.830.4
39.947.1
52.3 49.2 53.7 57.2
But are parts of India only a decade or less behind parts of Africa?
Source: UNAIDS/NACO

8. HEALTH THREATS (cont.): AIDS IMPACT
Water stressWater scarce

9. WEAKENING GOVERNANCE
Water stressWater scarce
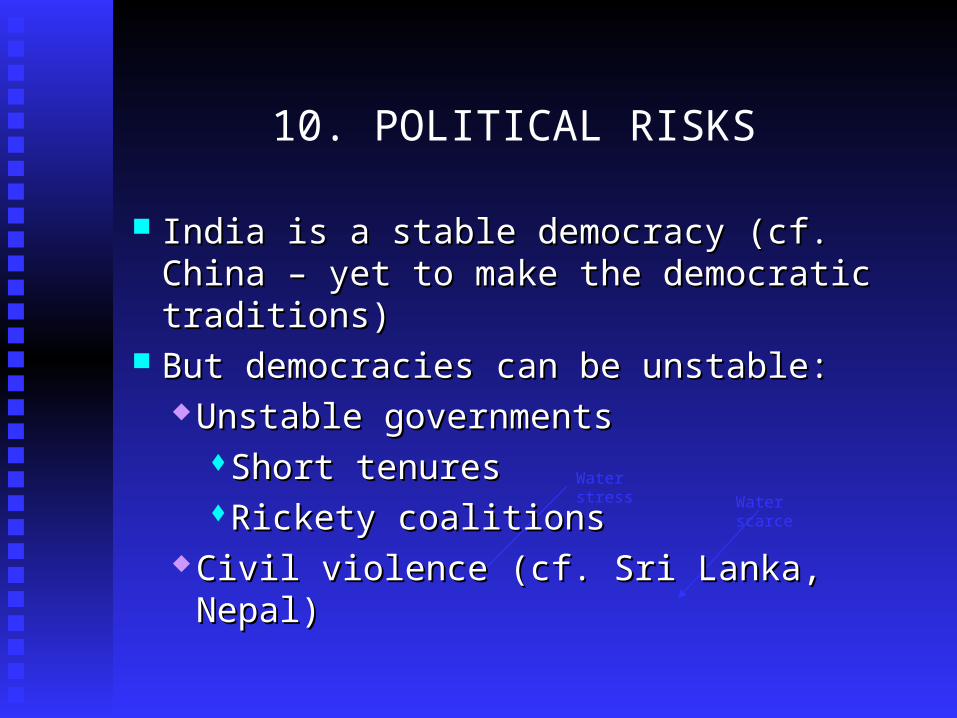
10. POLITICAL RISKS
Water stressWater scarce
India is a stable democracy (cf. China – yet India is a stable democracy (cf. China – yet to make the democratic traditions)to make the democratic traditions)
But democracies can be unstable: But democracies can be unstable: Unstable governmentsUnstable governments
Short tenuresShort tenuresRickety coalitionsRickety coalitions
Civil violence (cf. Sri Lanka, Nepal)Civil violence (cf. Sri Lanka, Nepal)

11. SECURITY RISKS
Water stressWater scarce
Regional conflictRegional conflict TerrorismTerrorism

12. GLOBAL RISKS
Water stressWater scarce
Global recessionGlobal recession Spread of global terrorism or other forms of Spread of global terrorism or other forms of
conflictconflict Global warming or other environmental Global warming or other environmental
threats to growththreats to growth Any slowing down of global growth will Any slowing down of global growth will
tend to perpetuate the current economic tend to perpetuate the current economic configuration.configuration.

WHAT SHOULD INDIA WORRY ABOUT?
Water stressWater scarce
India should worry most about those risks or India should worry most about those risks or challenges which:challenges which: Will tip India from base to low case growth Will tip India from base to low case growth
(rather than high to base)(rather than high to base) Have a reasonable probability of occurringHave a reasonable probability of occurring Are at least partially within India’s controlAre at least partially within India’s control
2 leading candidates: AIDS, conflict2 leading candidates: AIDS, conflict

IN SUMMARY: THE ANSWERS
Water stressWater scarce
Will India become an economic superpower?Will India become an economic superpower? On current trends, yes. On current trends, yes.
Does it matter?Does it matter? Yes, but primarily as an indicator of prosperity.Yes, but primarily as an indicator of prosperity.
What might prevent it?What might prevent it? 12 risk areas identified, some very serious and daunting. 12 risk areas identified, some very serious and daunting.
Lots of unknowns. Plenty of challenges to confront.Lots of unknowns. Plenty of challenges to confront. India is certainly heading in the right direction, but into India is certainly heading in the right direction, but into
unchartered territory. Its voyage will be one of the great unchartered territory. Its voyage will be one of the great voyages of the 21voyages of the 21stst Century. Century.