
Powerline Communications for Smart Grids Prof. Brian L. Evans Department of Electrical & Computer...
39
Powerline Communications for Smart Grids Prof. Brian L. Evans Department of Electrical & Computer Engineering Wireless Networking & Communications Group The University of Texas at Austin 17 July 2012 Seminar at the American University of Beirut Co-sponsored by the local IEEE chapter In collaboration with PhD students Ms. Jing Lin, Mr. Marcel Nassar and Mr. Yousof Mortazavi and TI R&D engineers Dr. Anand Dabak and Dr. Il Han Kim
-
Upload
douglas-allison -
Category
Documents
-
view
214 -
download
0
Transcript of Powerline Communications for Smart Grids Prof. Brian L. Evans Department of Electrical & Computer...
Powerline Communications forSmart Grids
Prof. Brian L. EvansDepartment of Electrical & Computer Engineering
Wireless Networking & Communications GroupThe University of Texas at Austin
17 July 2012
Seminar at the American University of BeirutCo-sponsored by the local IEEE chapter
In collaboration with PhD students Ms. Jing Lin, Mr. Marcel Nassar andMr. Yousof Mortazavi and TI R&D engineers Dr. Anand Dabak and Dr. Il Han Kim
2
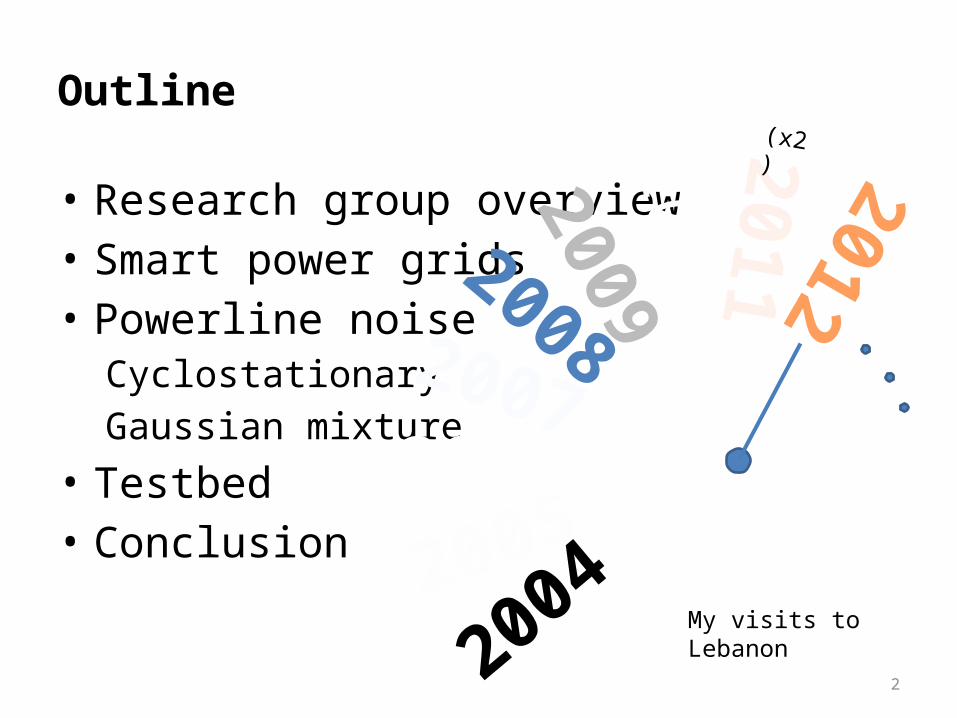
Outline
• Research group overview• Smart power grids• Powerline noise
CyclostationaryGaussian mixture
• Testbed• Conclusion
2004200520062007
20082009
20102011
2012
My visits to Lebanon
(x2)
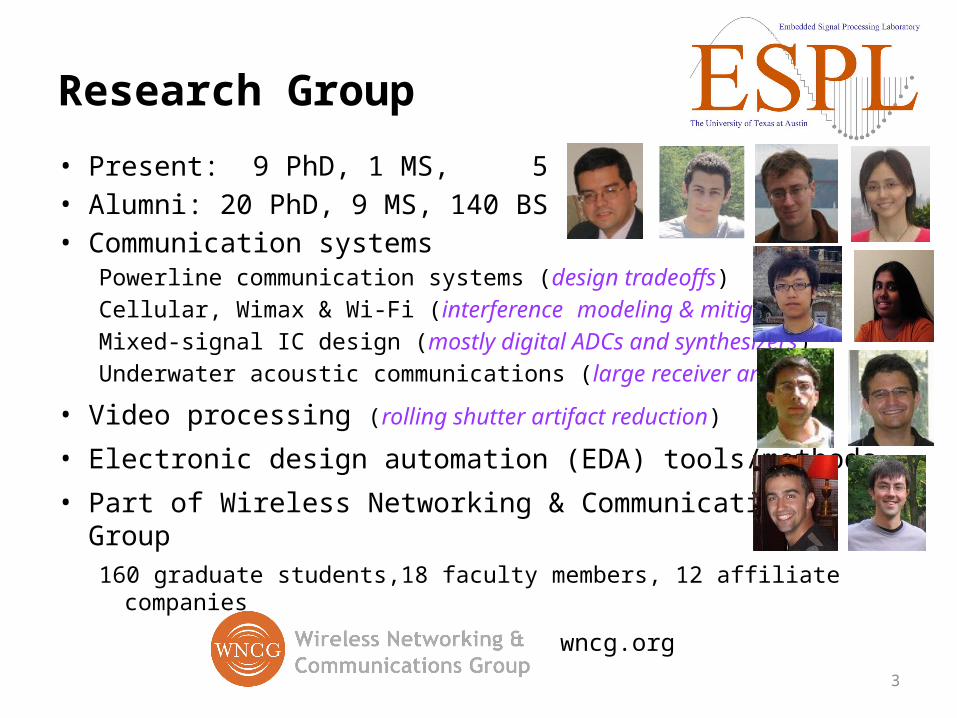
Research Group
• Present: 9 PhD, 1 MS, 5 BS• Alumni: 20 PhD, 9 MS, 140 BS• Communication systems
Powerline communication systems (design tradeoffs)Cellular, Wimax & Wi-Fi (interference modeling & mitigation)Mixed-signal IC design (mostly digital ADCs and synthesizers)Underwater acoustic communications (large receiver arrays)
• Video processing (rolling shutter artifact reduction)
• Electronic design automation (EDA) tools/methods
• Part of Wireless Networking & Communications Group160 graduate students,18 faculty members, 12 affiliate companies
3
wncg.org

Research Group – Completed Projects
System Contribution SW release
Prototype Companies
ADSL equalization Matlab DSP/C Freescale, TI
MIMO testbed LabVIEW LabVIEW/PXI Oil&Gas
Wimax/LTE resource allocation LabVIEW DSP/C Freescale, TI
Camera image acquisition Matlab DSP/C Intel, Ricoh
Display image halftoning Matlab C HP, Xerox
video halftoning Matlab Qualcomm
EDA tools fixed point conv. Matlab FPGA Intel, NI
distributed comp. Linux/C++ Navy sonar Navy, NI
DSP Digital Signal Processor LTE Long-Term Evolution (cellular) MIMO Multi-Input Multi-Output PXI PCI Extensions for Instrumentation
20 PhD and 9 MS alumni
4
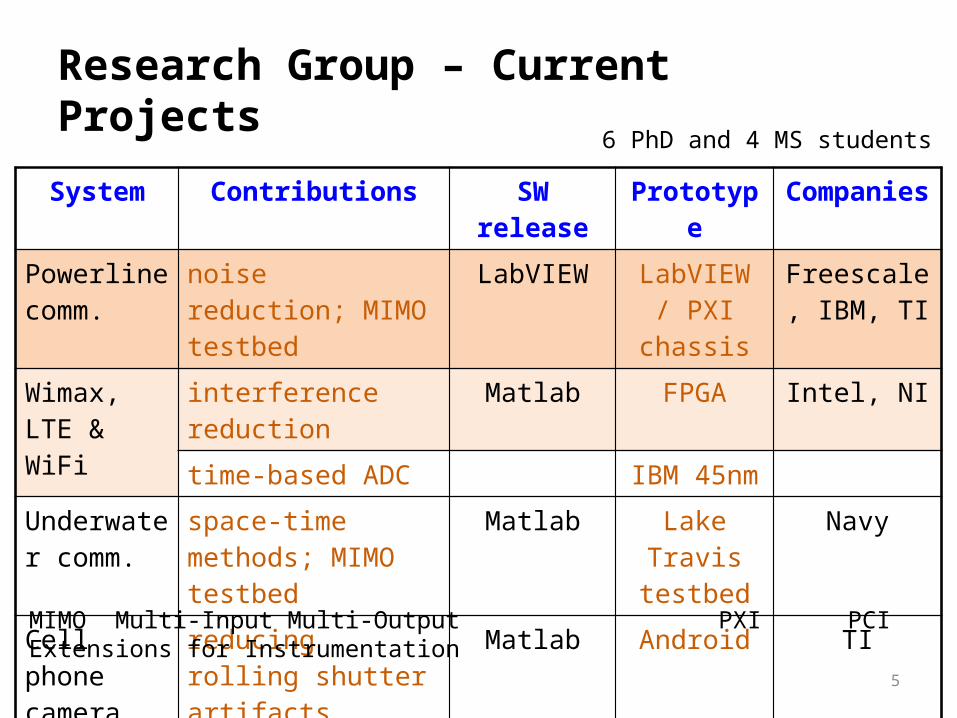
Research Group – Current Projects
System Contributions SW release Prototype Companies
Powerline comm.
noise reduction; MIMO testbed
LabVIEW LabVIEW / PXI chassis
Freescale, IBM, TI
Wimax, LTE & WiFi
interference reduction
Matlab FPGA Intel, NI
time-based ADC IBM 45nm
Underwater comm.
space-time methods; MIMO testbed
Matlab Lake Travis testbed
Navy
Cell phone camera
reducing rolling shutter artifacts
Matlab Android TI
EDA Tools reliability patterns NI
6 PhD and 4 MS students
MIMO Multi-Input Multi-Output PXI PCI Extensions for Instrumentation
5
6
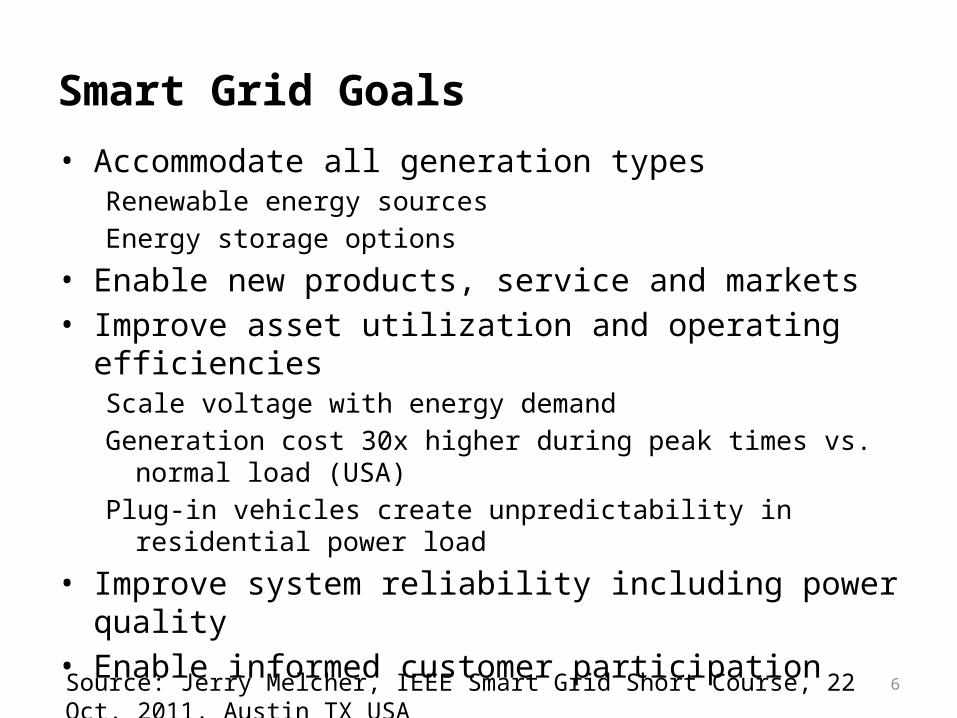
Smart Grid Goals
• Accommodate all generation typesRenewable energy sourcesEnergy storage options
• Enable new products, service and markets• Improve asset utilization and operating efficiencies
Scale voltage with energy demandGeneration cost 30x higher during peak times vs. normal load (USA)Plug-in vehicles create unpredictability in residential power load
• Improve system reliability including power quality• Enable informed customer participation
Source: Jerry Melcher, IEEE Smart Grid Short Course, 22 Oct. 2011, Austin TX USA
7
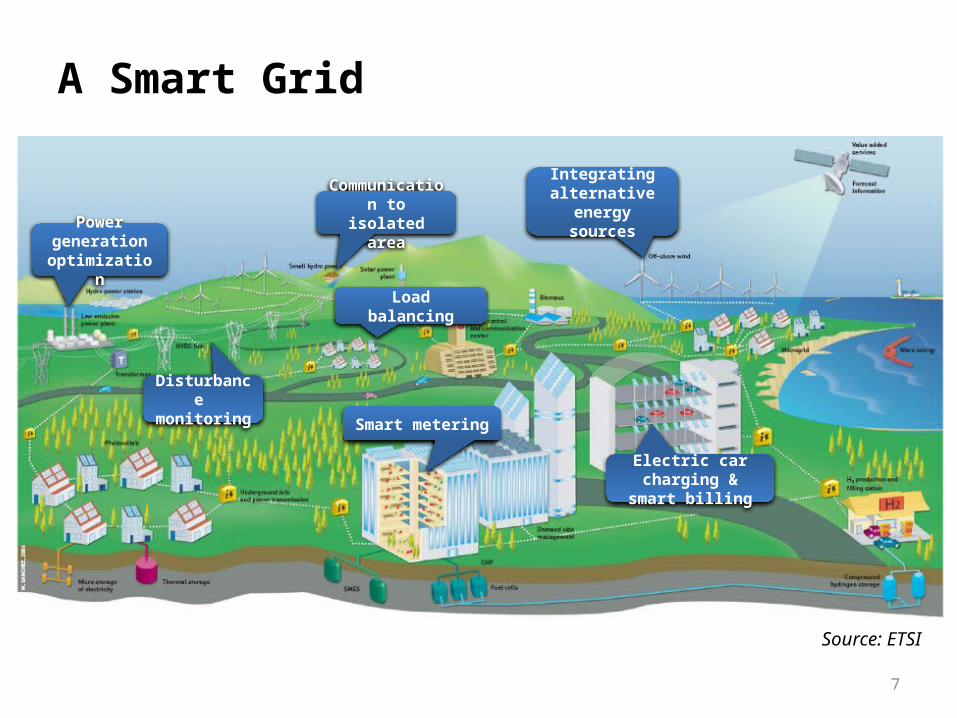
A Smart Grid
Electric car charging & smart billing
Communication to isolated area
Power generation optimization
Disturbance monitoring
Smart metering
Integrating alternative energy
sources
Source: ETSI
Load balancing
8
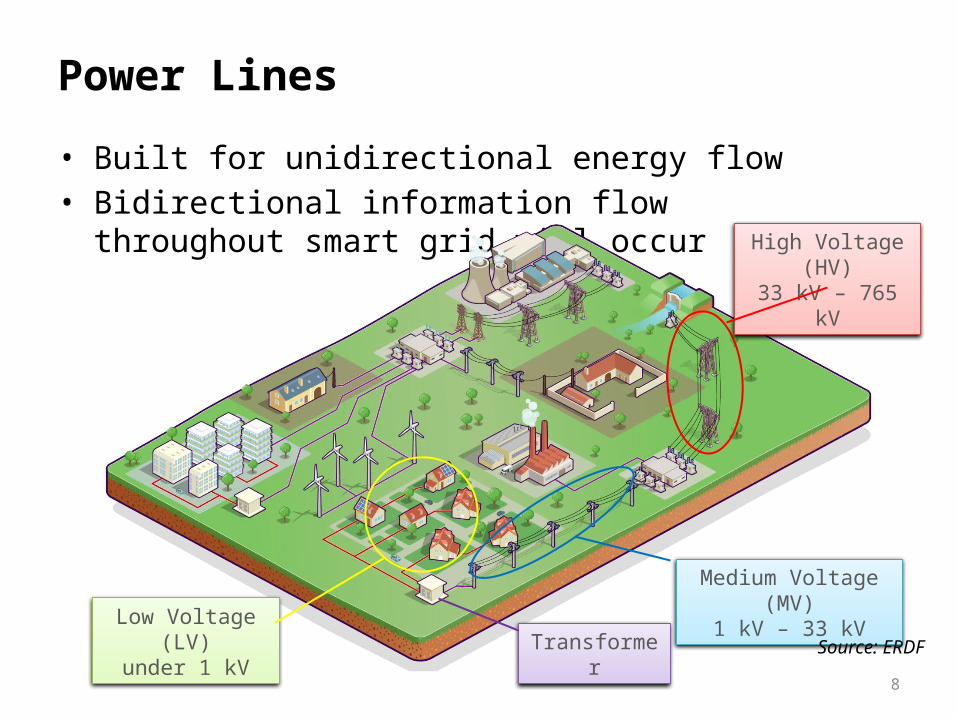
• Built for unidirectional energy flow• Bidirectional information flow
throughout smart grid will occur
Power Lines
Medium Voltage (MV)1 kV – 33 kV
Low Voltage (LV)under 1 kV
High Voltage (HV)33 kV – 765 kV
Source: ERDFTransformer
9
Today’s Situation in USA
• 7 large-scale power grids each managed by a regional utility companyWestern US, Eastern US, Texas, and others700 GW generation capacity in total for long-haul high-voltage power transmissionSynchronized independently, and exchange power via DC transfer
• 130+ medium-scale power grids each managed by a local utilityLocal power distribution to residential, commercial and industrial customers
• Heavy penalties in US for blackouts (2003 legislation)Utilities generate expected energy demand plus 12%
• Traditional ways to increase capacity to meet peak demand increaseBuild new large-scale power generation plant at cost of $1-10B if permit issuedBuild new transmission line at $0.6M/km which will take 5-10 years to complete
Source: Jerry Melcher, IEEE Smart Grid Short Course, 22 Oct. 2011, Austin TX USA
10
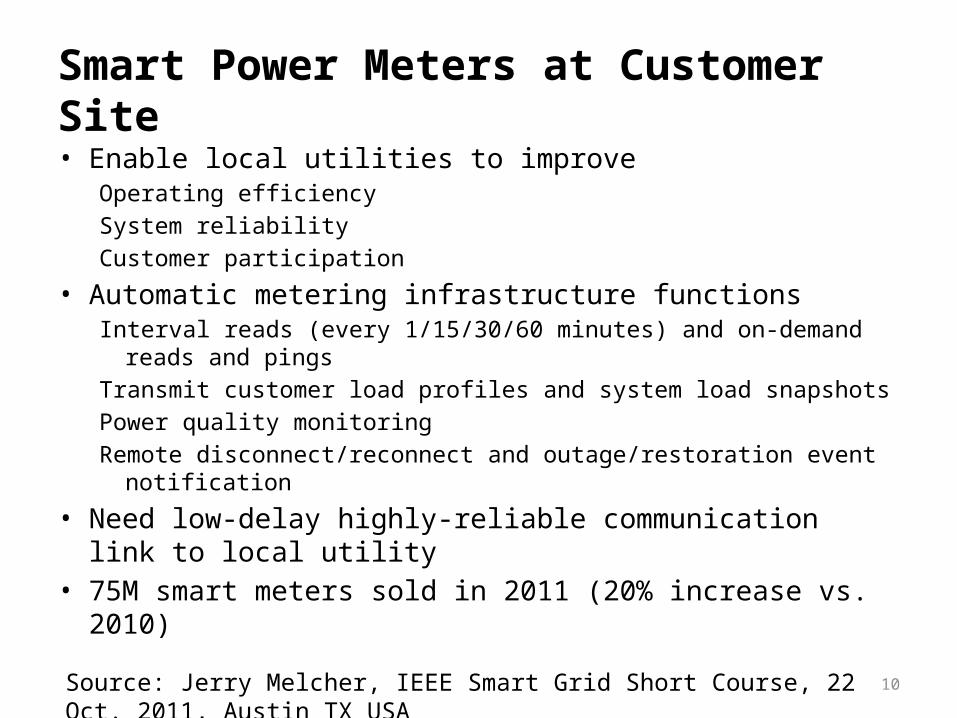
Smart Power Meters at Customer Site
• Enable local utilities to improveOperating efficiencySystem reliabilityCustomer participation
• Automatic metering infrastructure functionsInterval reads (every 1/15/30/60 minutes) and on-demand reads and pingsTransmit customer load profiles and system load snapshotsPower quality monitoringRemote disconnect/reconnect and outage/restoration event notification
• Need low-delay highly-reliable communication link to local utility• 75M smart meters sold in 2011 (20% increase vs. 2010)
Source: Jerry Melcher, IEEE Smart Grid Short Course, 22 Oct. 2011, Austin TX USA
11
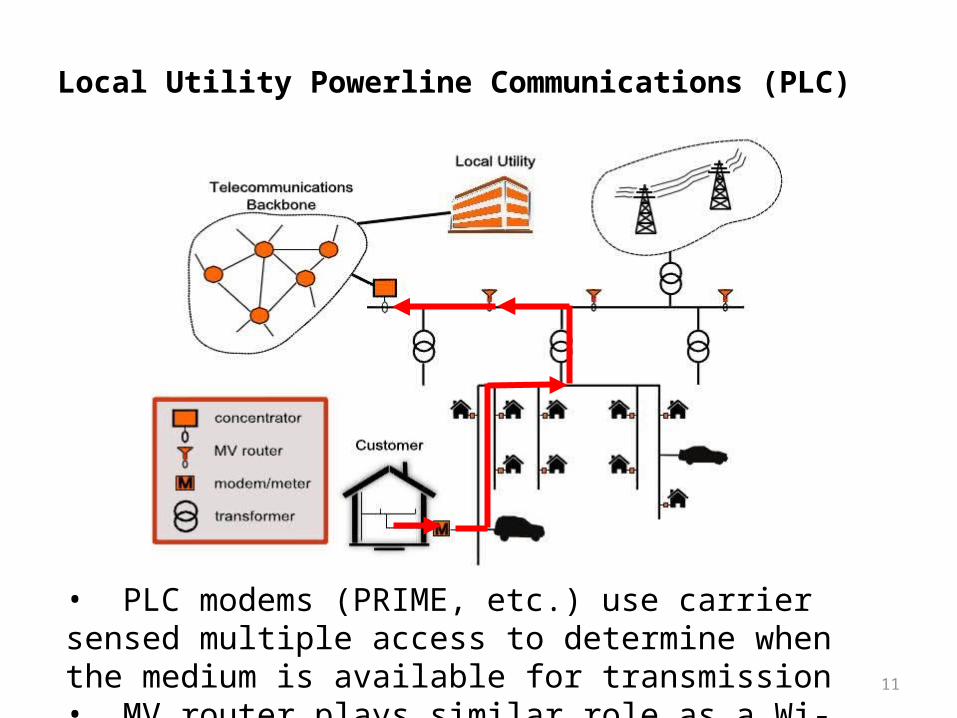
Local Utility Powerline Communications (PLC)
• PLC modems (PRIME, etc.) use carrier sensed multiple access to determine when the medium is available for transmission• MV router plays similar role as a Wi-Fi access point
12
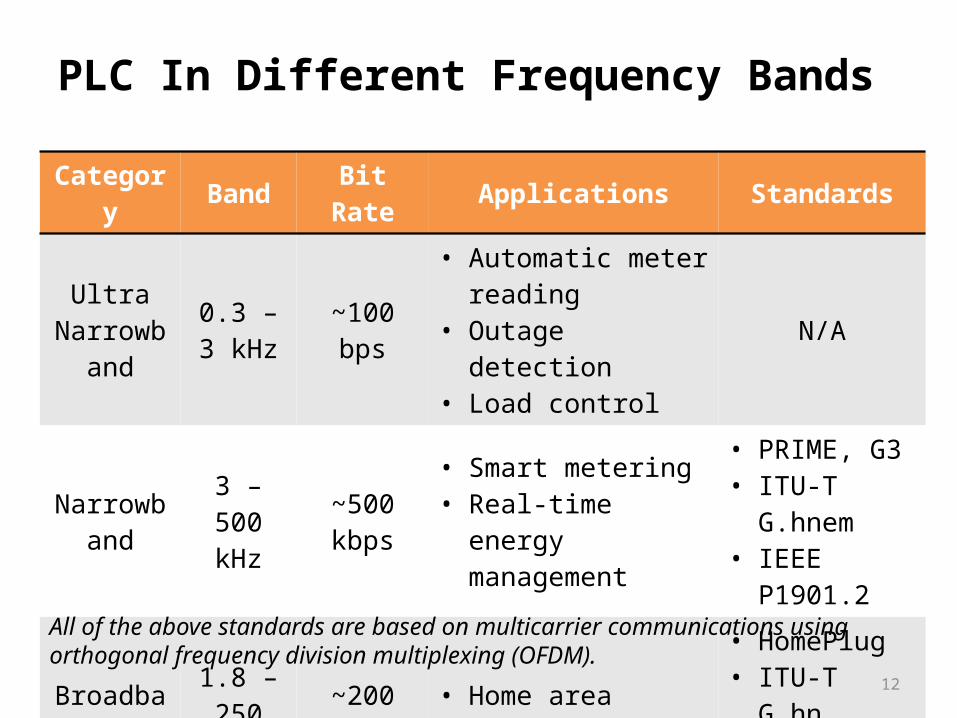
PLC In Different Frequency Bands
Category Band Bit Rate Applications Standards
Ultra Narrowband
0.3 – 3 kHz ~100 bps
• Automatic meter reading• Outage detection• Load control
N/A
Narrowband 3 – 500 kHz ~500 kbps
• Smart metering• Real-time energy
management
• PRIME, G3• ITU-T G.hnem• IEEE P1901.2
Broadband 1.8 – 250 MHz ~200 Mbps • Home area networks
• HomePlug• ITU-T G.hn• IEEE P1901
All of the above standards are based on multicarrier communications using orthogonal frequency division multiplexing (OFDM).
13
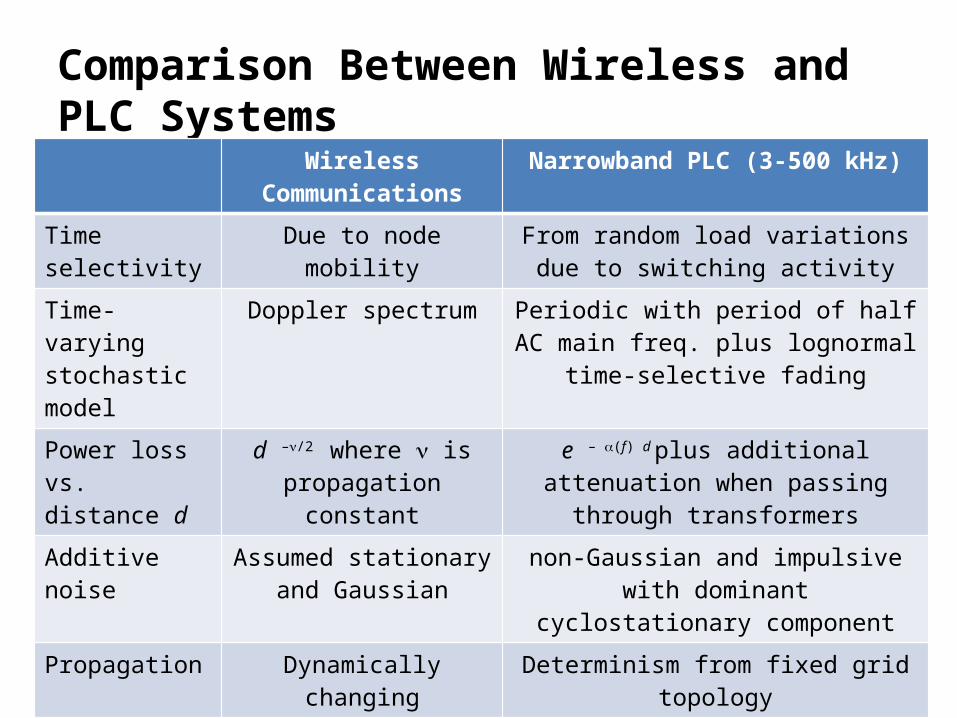
Comparison Between Wireless and PLC SystemsWireless Communications Narrowband PLC (3-500 kHz)
Time selectivity Due to node mobility From random load variationsdue to switching activity
Time-varying stochastic model
Doppler spectrum Periodic with period of half AC main freq. plus lognormal time-selective fading
Power loss vs. distance d
d –n/2 where n is propagation constant
e – a(f) d plus additional attenuation when passing through transformers
Additive noise Assumed stationaryand Gaussian
non-Gaussian and impulsive with dominant cyclostationary component
Propagation Dynamically changing Determinism from fixed grid topology
Interference limited
In Wi-Fi deployments and increasing in cellular
Increasing due to uncoordinated users using different standards
MIMO Standardized forWi-Fi and cellular
Order of #wires minus 1;G.9964 standard for broadband PLC
Synchronization Difficult across network AC main frequency makes simpler
14
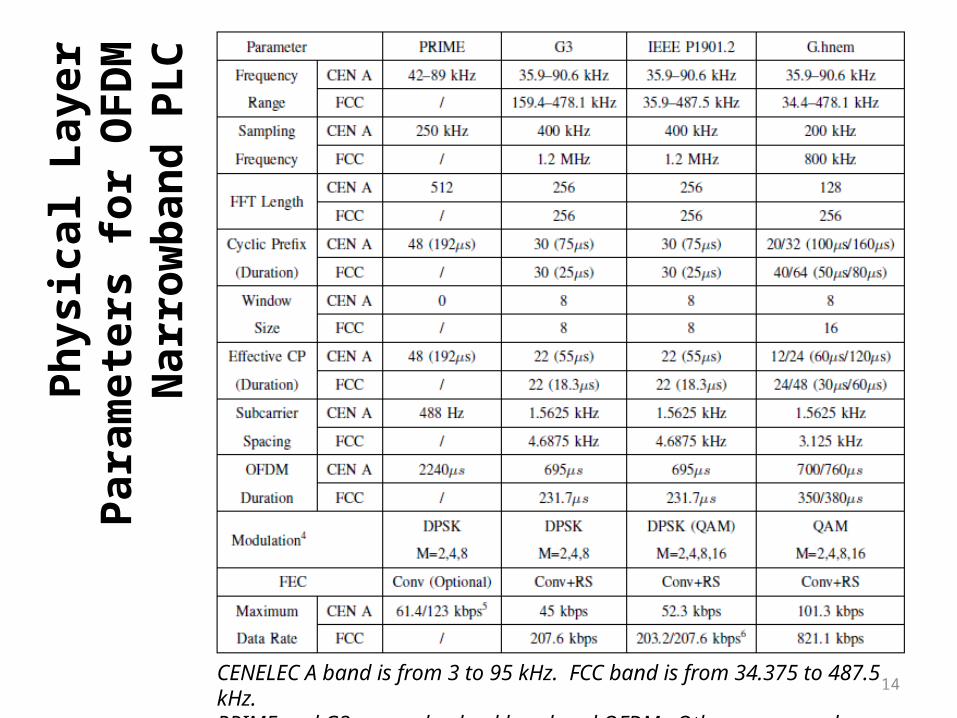
Phys
ical
Lay
er P
aram
eter
s fo
r O
FDM
Nar
row
band
PLC
Sta
ndar
ds
CENELEC A band is from 3 to 95 kHz. FCC band is from 34.375 to 487.5 kHz.PRIME and G3 use real-valued baseband OFDM. Others are complex-valued.
15
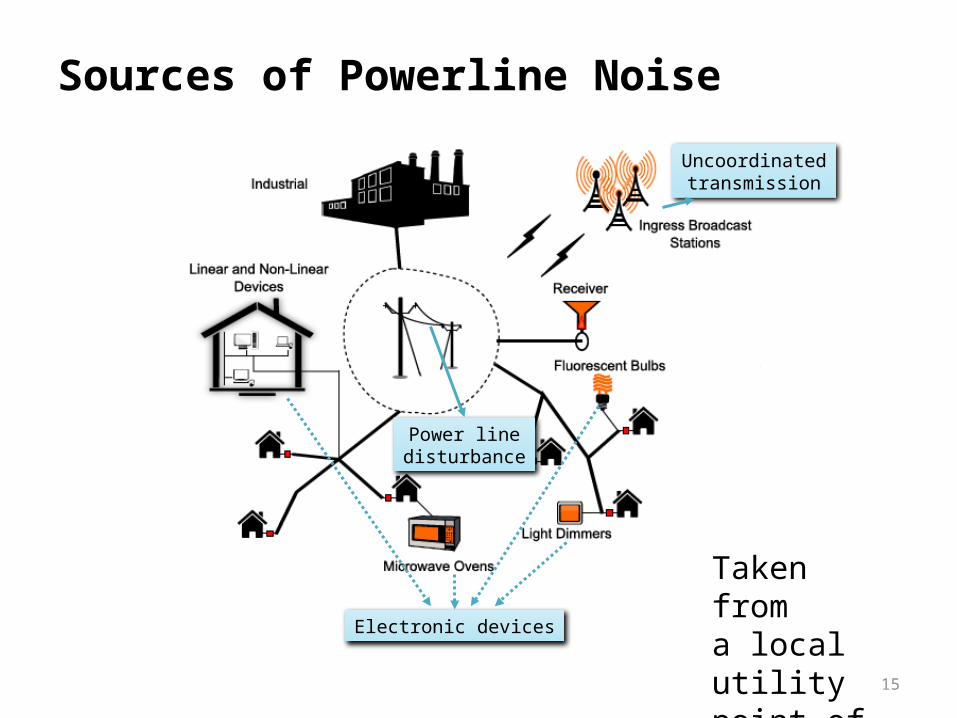
Sources of Powerline Noise
Electronic devices
Uncoordinatedtransmission
Power linedisturbance
Taken froma local utility point of view

16
Types of Powerline Noise
Background Noise Cyclostationary Noise Impulsive Noise
Spectrally shaped noise with 1/f spectral decay
Period synchronous to half of the AC cycle Random impulsive bursts
Superposition of low intensity noise sources
Switching power supplies and rectifiers
Circuit transient noise and uncoordinated interference
Present in all PLC Dominant inNarrowband PLC
Dominant inBroadband PLC
0 100 200 300 400 500-150
-100
-50
Frequency (kHz)time

17
• Performance of conventional communication system degrades in non-AWGN environment
• Statistical modeling of powerline noise
• Noise mitigation exploiting the noise model or structure
Non-Gaussian Noise: Challenge to PLC
Listen to the environment
Estimate noise model
Use model or structure to mitigate noise
18
Cyclostationary Noise Modeling in Narrowband PLC (3-500 kHz)
1. M. Nassar, A. Dabak, I. H. Kim, T. Pande and B. L. Evans, “Cyclostationary Noise Modeling In Narrowband Powerline Communication For Smart Grid Applications”, Proc. IEEE Int. Conf. on Acoustics, Speech, and Signal Proc., Mar. 25-30, 2012, Kyoto, Japan.
2. M. Nassar, J. Lin, Y. Mortazavi, A. Dabak, I. H. Kim and B. L. Evans, “Local Utility Powerline Communications in the 3-500 kHz Band: Channel Impairments, Noise, and Standards”, IEEE Signal Processing Magazine, Special Issue on Signal Processing Techniques for the Smart Grid, Sep. 2012, 14 pages.
19
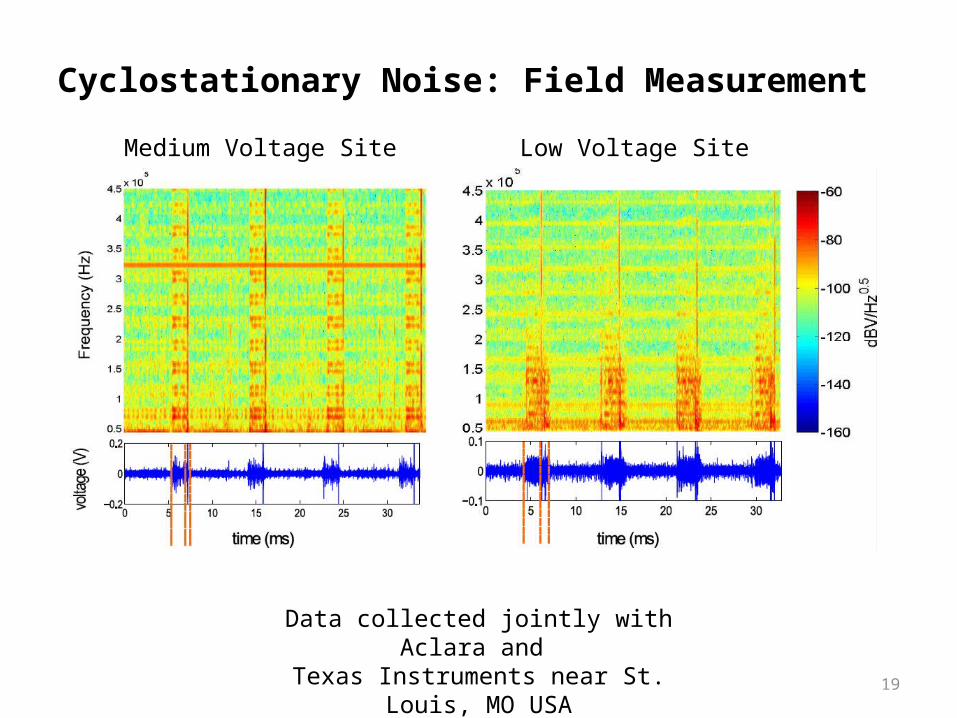
Cyclostationary Noise: Field Measurement
Medium Voltage Site Low Voltage Site
Data collected jointly with Aclara and Texas Instruments near St. Louis, MO USA
20
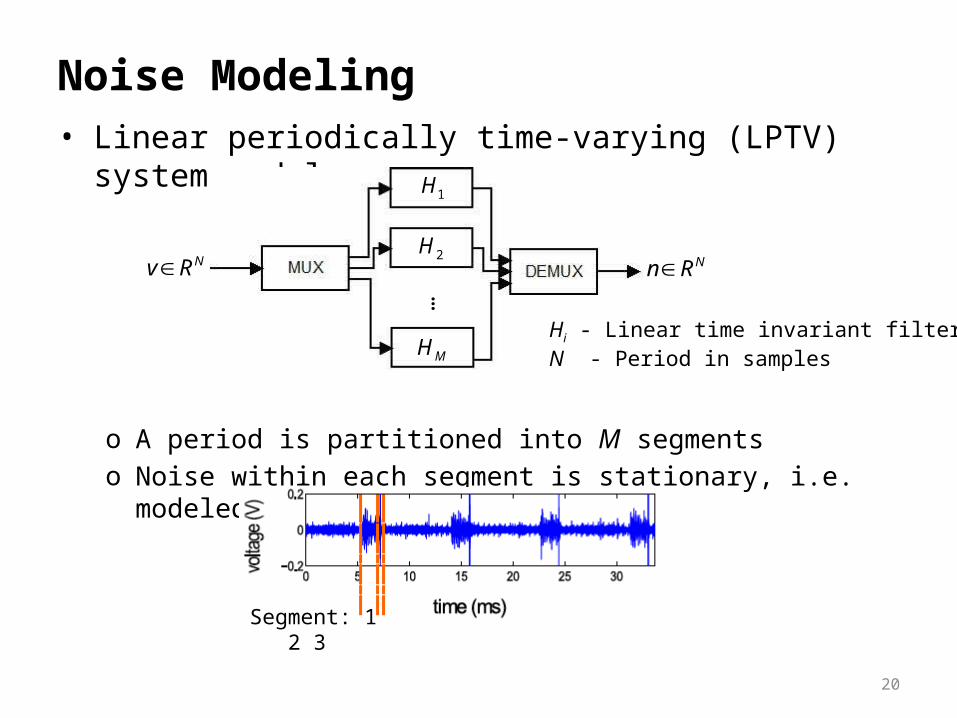
• Linear periodically time-varying (LPTV) system model
o A period is partitioned into M segmentso Noise within each segment is stationary, i.e. modeled by an LTI system
Noise Modeling
1H
2H
MH
…
Nv R
Hi - Linear time invariant filterN - Period in samples
Nn R
Segment: 1 2 3
21
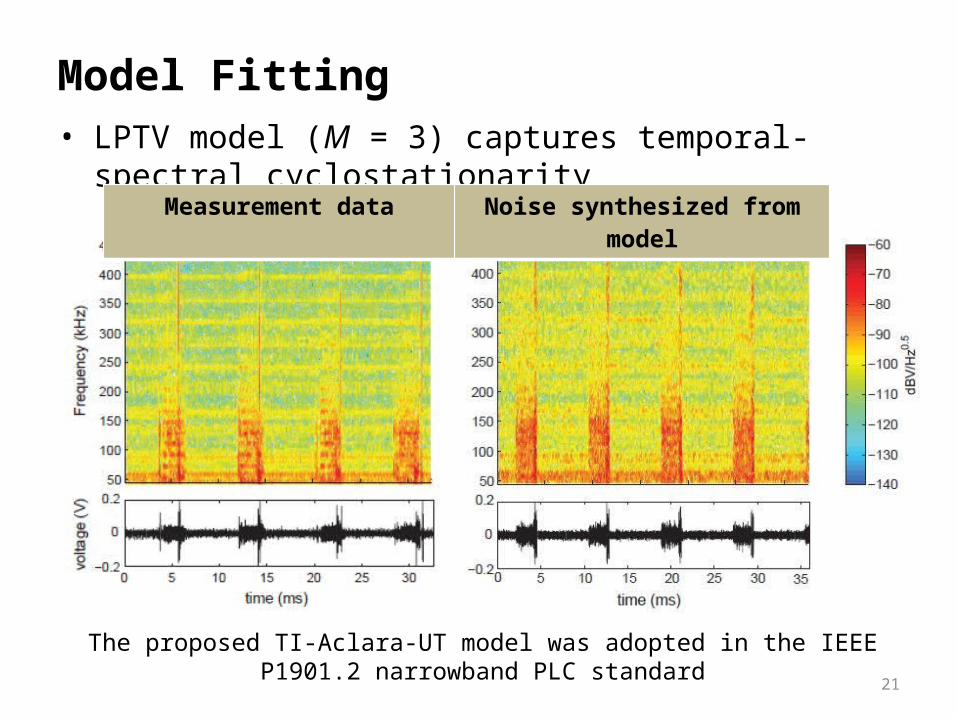
• LPTV model (M = 3) captures temporal-spectral cyclostationarity
Model Fitting
Measurement data Noise synthesized from model
The proposed TI-Aclara-UT model was adopted in the IEEE P1901.2 narrowband PLC standard

22
A Lebanese Interlude
JezzineSidon
Beiteddine
Jbeil/Byblos
Baruk Cedars
Ghine
Notshown:Baalbek,Beirut,Tripoli,Tyre,Zahle,and other great places
23
Impulsive Noise in Broadband PLC: Modeling and Mitigation
3. M. Nassar, K. Gulati, Y. Mortazavi, and B. L. Evans, “Statistical Modeling of Asynchronous Impulsive Noise in Powerline Communication Networks”, Proc. IEEE Int. Global Communications Conf., Dec. 5-9, 2011, Houston, TX USA.
4. J. Lin, M. Nassar and B. L. Evans, “Non-Parametric Impulsive Noise Mitigation in OFDM Systems Using Sparse Bayesian Learning”, Proc. IEEE Int. Global Communications Conf., Dec. 5-9, 2011, Houston, TX USA.
24
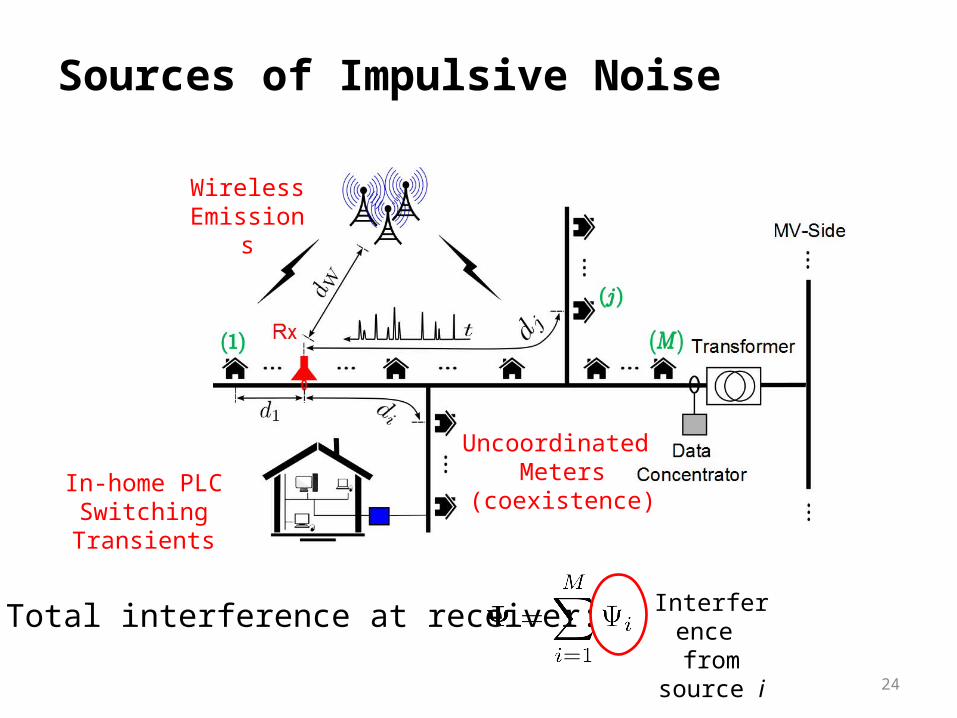
Sources of Impulsive Noise
Wireless Emissions
In-home PLC Switching Transients
Uncoordinated Meters
(coexistence)
Total interference at receiver: Interference from source i
25
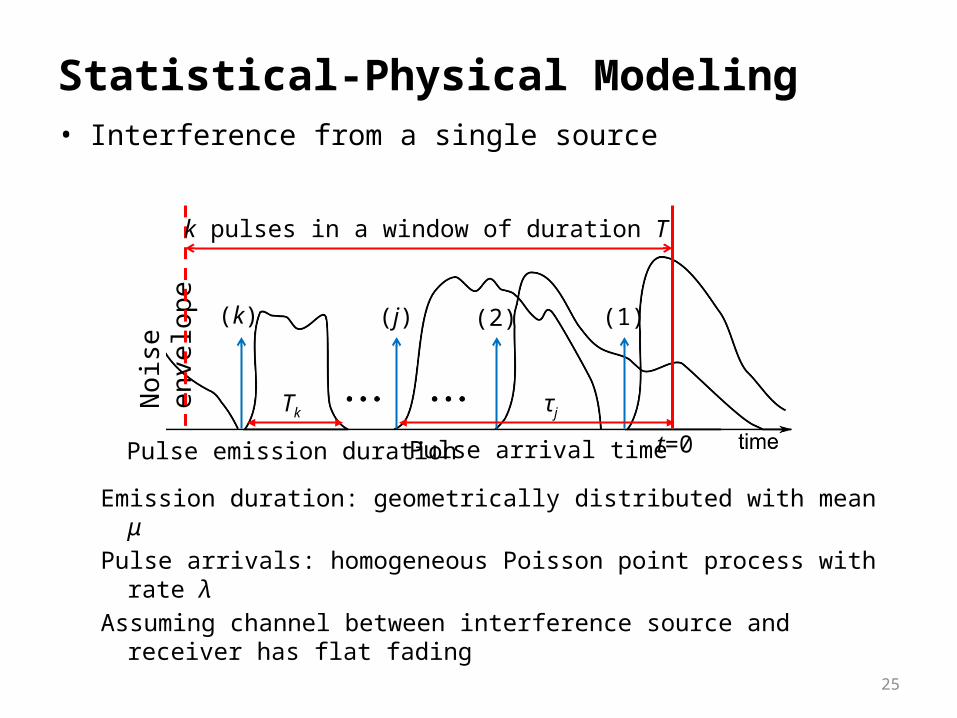
• Interference from a single source
Emission duration: geometrically distributed with mean μPulse arrivals: homogeneous Poisson point process with rate λAssuming channel between interference source and receiver has flat fading
Statistical-Physical Modeling
t=0
Noise
env
elop
e
(k) (j) (2) (1)
k pulses in a window of duration T
Tk
Pulse emission duration
τj
Pulse arrival time
26
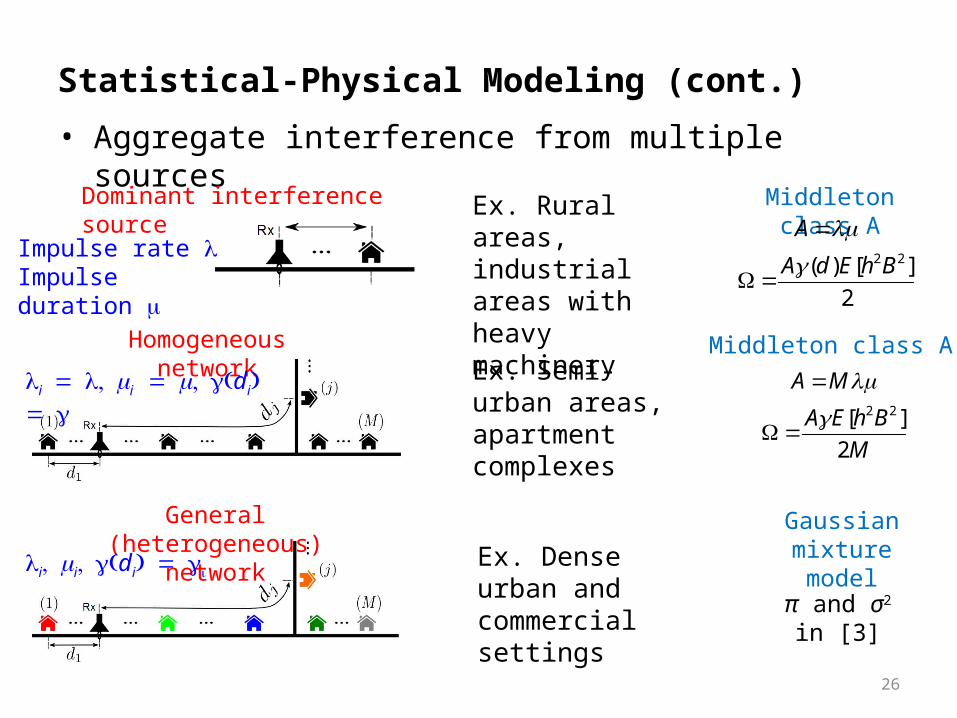
• Aggregate interference from multiple sources
Statistical-Physical Modeling (cont.)
Ex. Rural areas, industrial areas with heavy machinery
Dominant interference source Middleton class A
2 2( ) [ ]
2
A
A d E h B
Impulse rate lImpulse duration m
Homogeneous networkEx. Semi-urban areas, apartment complexes
Middleton class A
2 2[ ]
2
A M
A E h B
M
li = , l mi = m, (g di) = g
General (heterogeneous) network
Ex. Dense urban and commercial settings
Gaussian mixture model
π and σ2 in [3]
li, mi, (g di) = gi
27
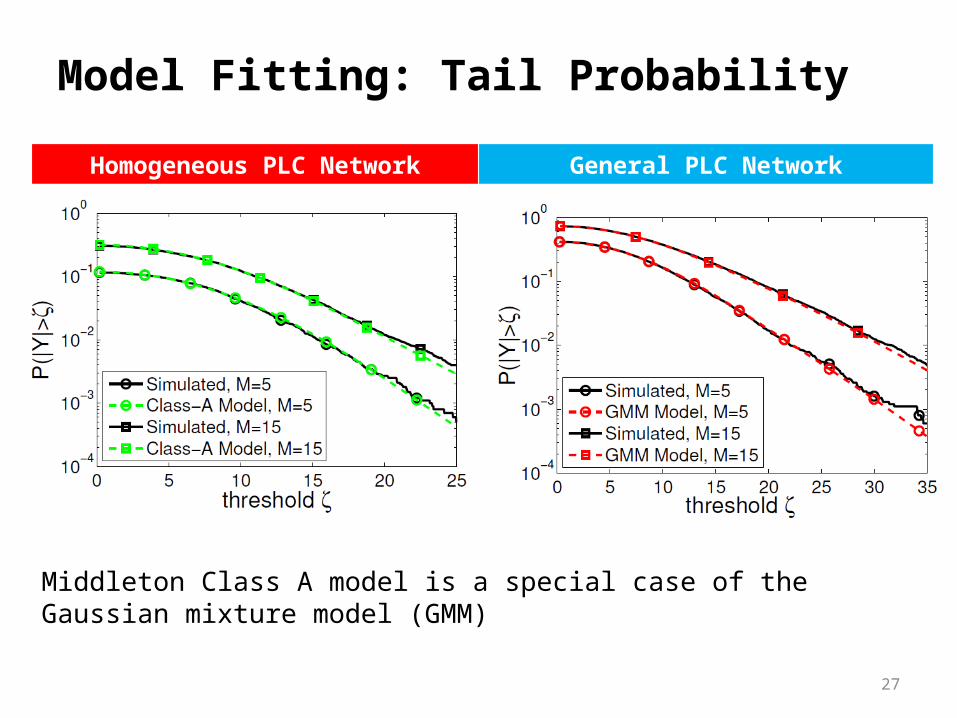
Model Fitting: Tail Probability
Homogeneous PLC Network General PLC Network
Middleton Class A model is a special case of the Gaussian mixture model (GMM)
28
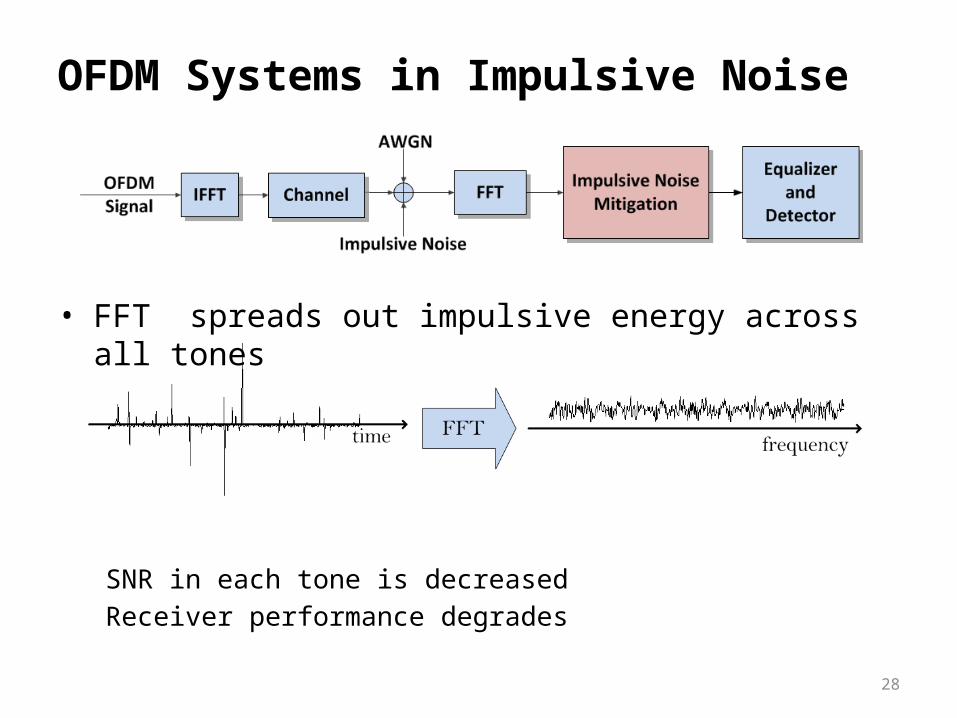
• FFT spreads out impulsive energy across all tones
SNR in each tone is decreasedReceiver performance degrades
OFDM Systems in Impulsive Noise
29
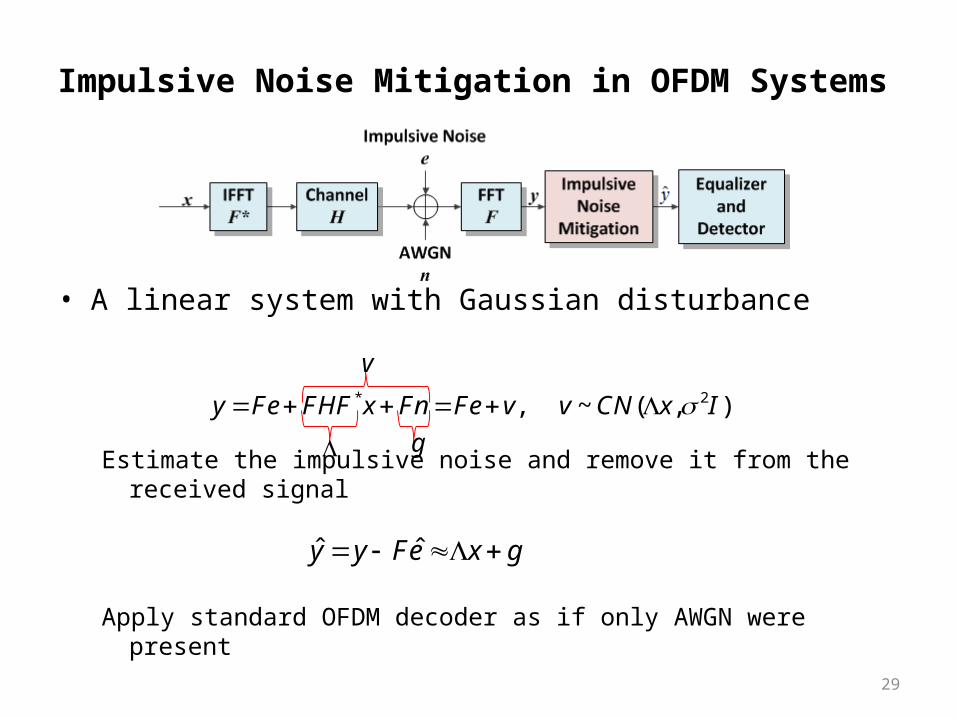
• A linear system with Gaussian disturbance
Estimate the impulsive noise and remove it from the received signal
Apply standard OFDM decoder as if only AWGN were present
Impulsive Noise Mitigation in OFDM Systems
* 2, ~ ( , )y Fe FHF x Fn Fe v v CN x I
g
v
ˆ ˆy y Fe x g
30
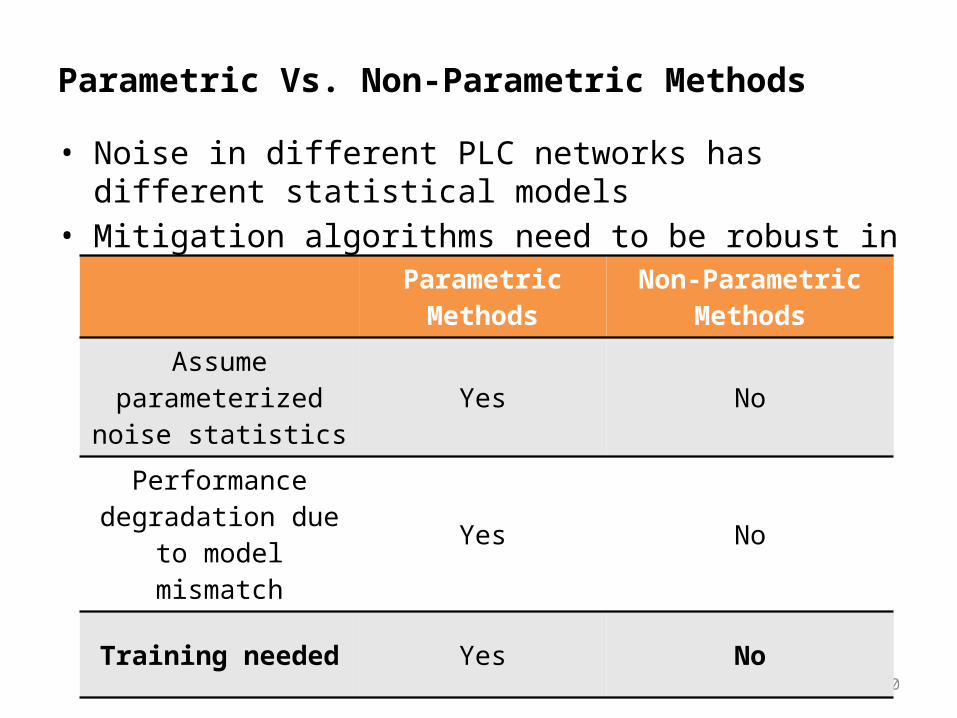
• Noise in different PLC networks has different statistical models• Mitigation algorithms need to be robust in different noise scenarios
Parametric Vs. Non-Parametric Methods
Parametric Methods Non-Parametric Methods
Assume parameterized noise statistics Yes No
Performance degradation due to model mismatch Yes No
Training needed Yes No
31
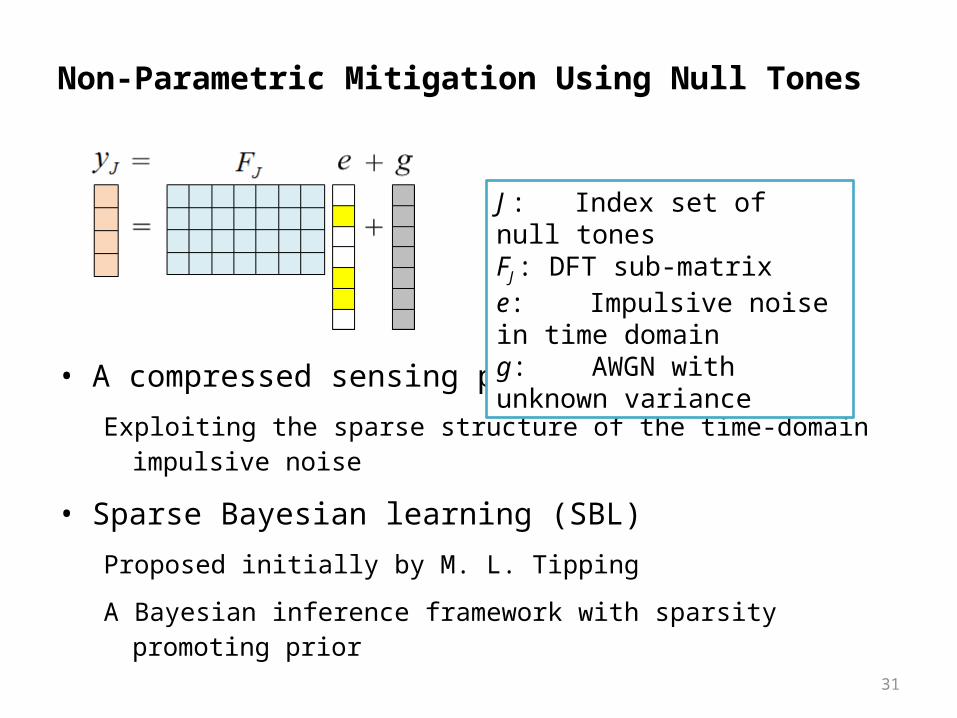
• A compressed sensing problemExploiting the sparse structure of the time-domain impulsive noise
• Sparse Bayesian learning (SBL)Proposed initially by M. L. Tipping
A Bayesian inference framework with sparsity promoting prior
Non-Parametric Mitigation Using Null Tones
J : Index set of null tonesFJ : DFT sub-matrixe: Impulsive noise in time domaing: AWGN with unknown variance
32
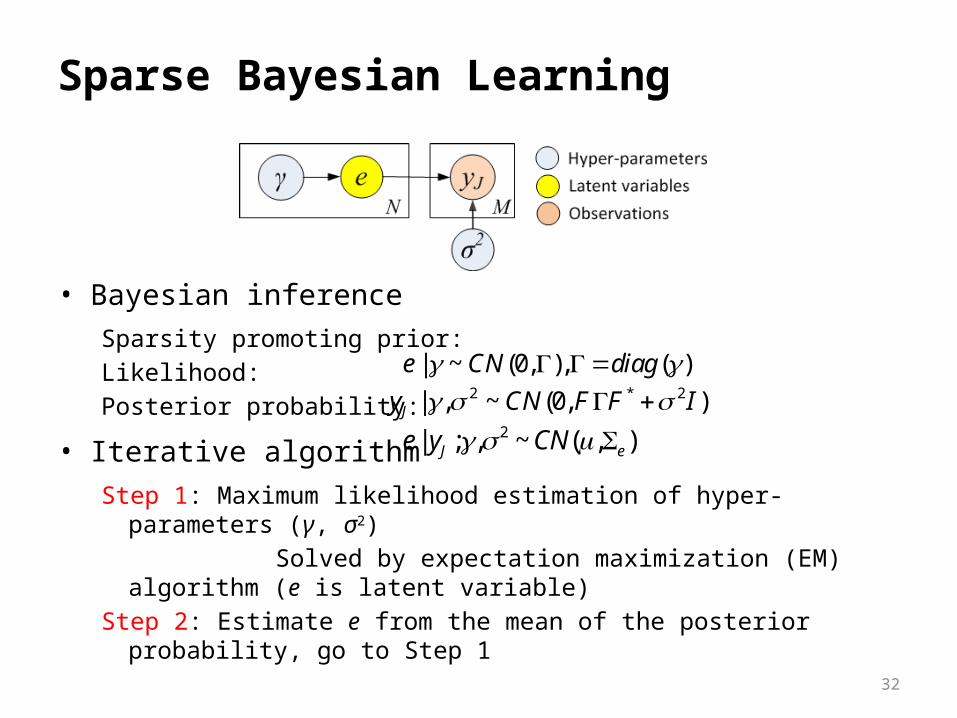
• Bayesian inferenceSparsity promoting prior: Likelihood:Posterior probability:
• Iterative algorithmStep 1: Maximum likelihood estimation of hyper-parameters (γ, σ2) Solved by expectation maximization (EM) algorithm (e is latent variable)Step 2: Estimate e from the mean of the posterior probability, go to Step 1
Sparse Bayesian Learning
| ~ (0, ), ( )e CN diag 2 * 2| , ~ (0, )Jy CN F F I
2| ; , ~ ( , )J ee y CN
33
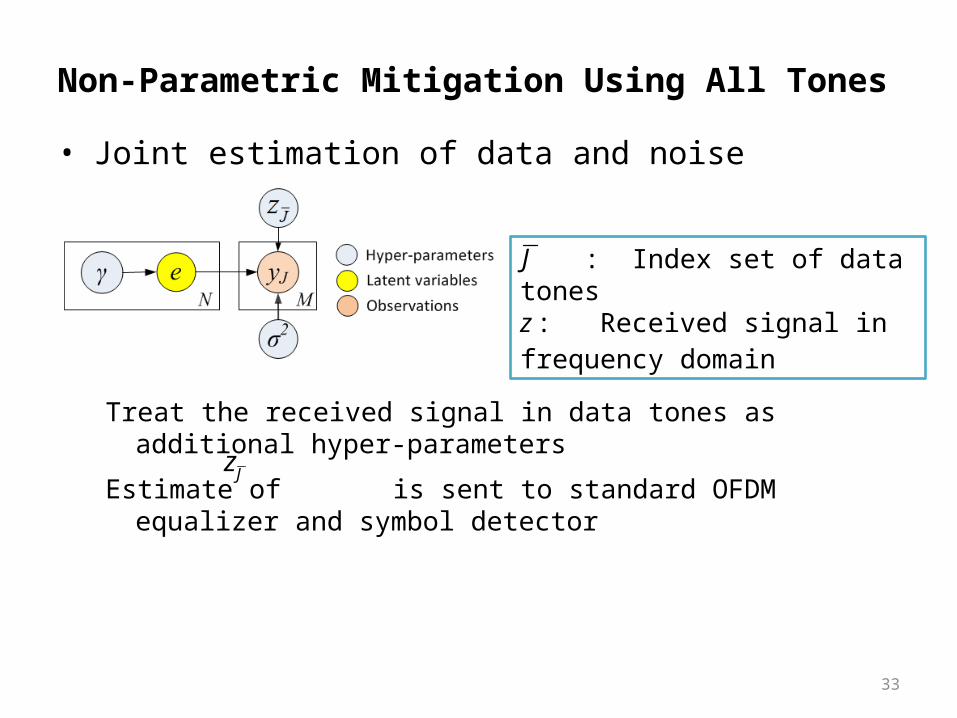
• Joint estimation of data and noise
Treat the received signal in data tones as additional hyper-parameters
Estimate of is sent to standard OFDM equalizer and symbol detector
Non-Parametric Mitigation Using All Tones
: Index set of data tonesz : Received signal in frequency domainJ
Jz
-10 -5 0 5 10
10-5
10-4
10-3
10-2
10-1
SNR (dB)
Sym
bol E
rror
Rat
e
No cancellationSBL w/ null tonesSBL w/ all tones
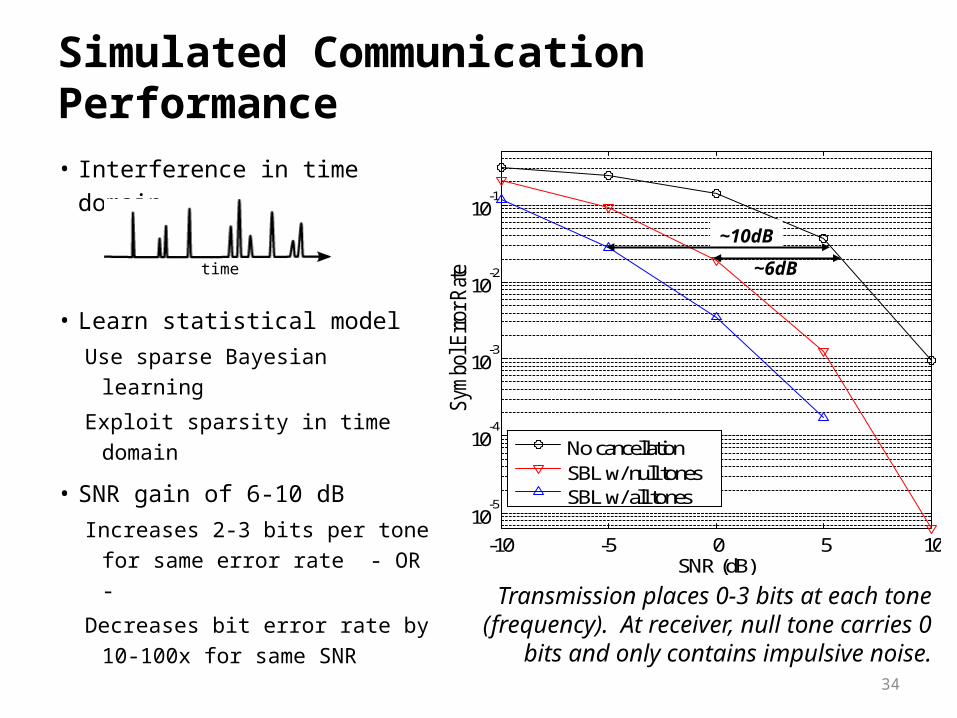
• Interference in time domain
• Learn statistical modelUse sparse Bayesian learning
Exploit sparsity in time domain
• SNR gain of 6-10 dBIncreases 2-3 bits per tone for
same error rate - OR -
Decreases bit error rate by 10-100x for same SNR
Simulated Communication Performance
34
~10dB
~6dBtime
Transmission places 0-3 bits at each tone (frequency). At receiver, null tone carries 0 bits
and only contains impulsive noise.
Our PLC Testbed
• Quantify application performance vs. complexity tradeoffsExtend our real-time DSL testbed (deployed in field)Integrate ideas from multiple narrowband PLC standardsProvide suite of user-configurable algorithms and system settingsDisplay statistics of communication performance
• 1x1 PLC testbed (completed)Adaptive signal processing algorithmsImproved communication performance 2-3x on indoor power lines
• 2x2 PLC testbed (on-going)Use one phase, neutral and groundGoal: Improve communication performance by another 2x
35
Our PLC Testbed
36
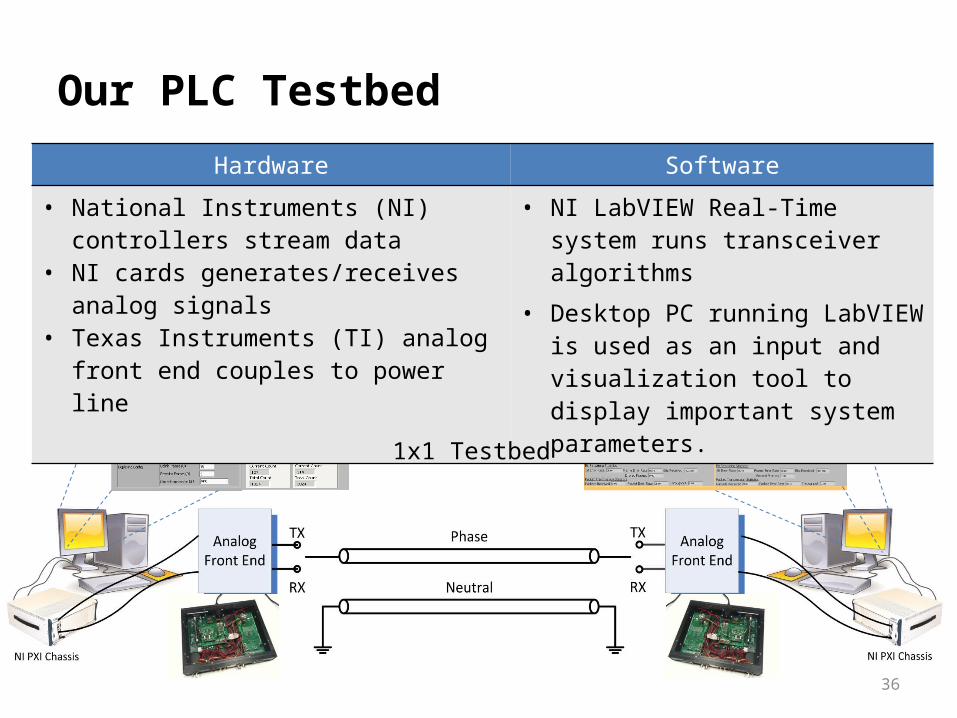
Hardware Software
• National Instruments (NI) controllers stream data
• NI cards generates/receives analog signals• Texas Instruments (TI) analog front end
couples to power line
• NI LabVIEW Real-Time system runs transceiver algorithms
• Desktop PC running LabVIEW is used as an input and visualization tool to display important system parameters.
1x1 Testbed
37
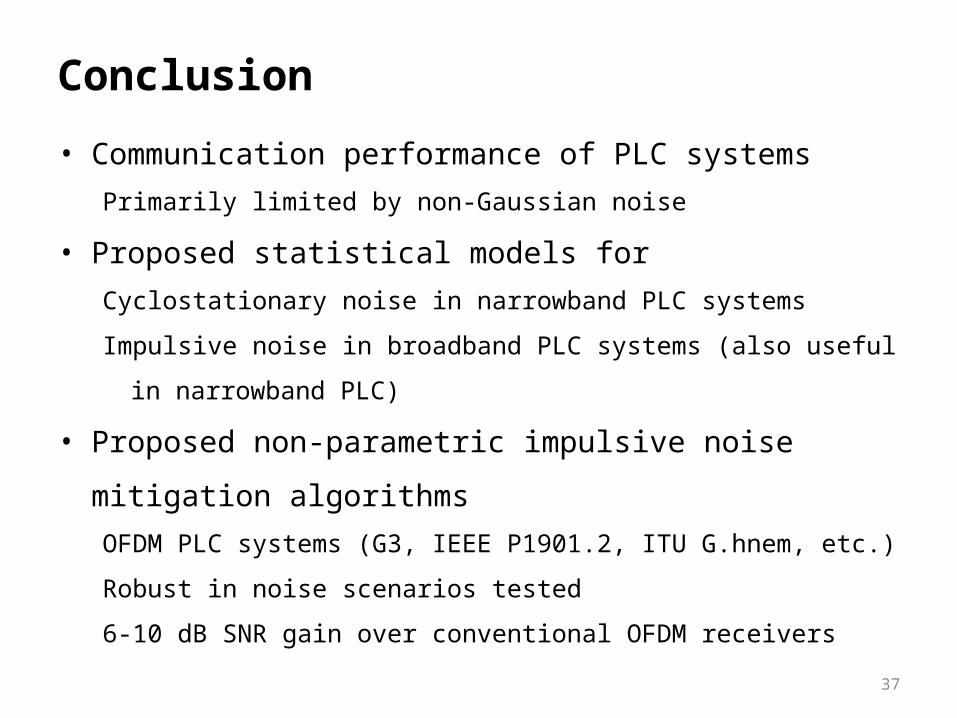
Conclusion
• Communication performance of PLC systems
Primarily limited by non-Gaussian noise
• Proposed statistical models for
Cyclostationary noise in narrowband PLC systems
Impulsive noise in broadband PLC systems (also useful in narrowband PLC)
• Proposed non-parametric impulsive noise mitigation algorithms
OFDM PLC systems (G3, IEEE P1901.2, ITU G.hnem, etc.)
Robust in noise scenarios tested
6-10 dB SNR gain over conventional OFDM receivers

Thank you …
38
39
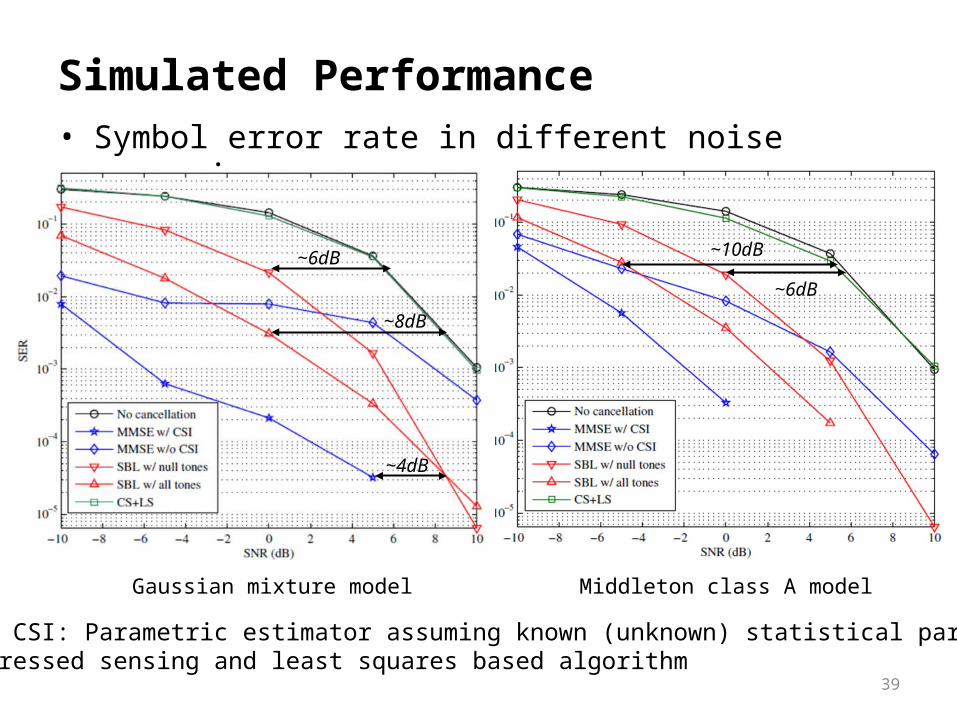
• Symbol error rate in different noise scenarios
Simulated Performance
Middleton class A modelGaussian mixture model
~6dB
~8dB
~4dB
~6dB
~10dB
• MMSE w/ (w/o) CSI: Parametric estimator assuming known (unknown) statistical parameters of noise• CS+LS: A compressed sensing and least squares based algorithm