Powering reliable solutions for you Development of a ...
46
The 11th IERE GM/The IERE – IIE Latin American Forum, 1 – 3 November 2011, Cancún, Mexico Development of a Combined, Experimental and Analytical Tool for Real-Time Estimation of Emergency Loading Capability of Power Transformers Enrique Betancourt, Gustavo Tamez Prolec GE email: [email protected] Roberto Liñan, Francisco Lopez Instituto de Investigaciones Electricas [email protected] Powering reliable solutions for you
Transcript of Powering reliable solutions for you Development of a ...

The 11th IERE GM/The IERE – IIE Latin American Forum, 1 – 3 November 2011, Cancún, Mexico
Development of a Combined,
Experimental and Analytical Tool
for Real-Time Estimation of
Emergency Loading Capability
of Power Transformers
Enrique Betancourt, Gustavo Tamez
Prolec GE email: [email protected]
Roberto Liñan, Francisco Lopez
Instituto de Investigaciones Electricas [email protected]
Powering reliable solutions for you

The 11th IERE GM/The IERE – IIE Latin American Forum, 1 – 3 November 2011, Cancún, Mexico
Contents
1. Summary
2. Background – Introduction to Prolec GE
3. Development of Models and Tools – Thermal behavior of transformers
– Bubble evolution model
– Moisture migration model
4. Conclusion and Next Steps
Contents 1. Summary 3. Models and Tools
2. Background 3-1. 3-2.
4. Conclusion
2
The 11th IERE GM/The IERE – IIE Latin American Forum, 1 – 3 November 2011, Cancún, Mexico
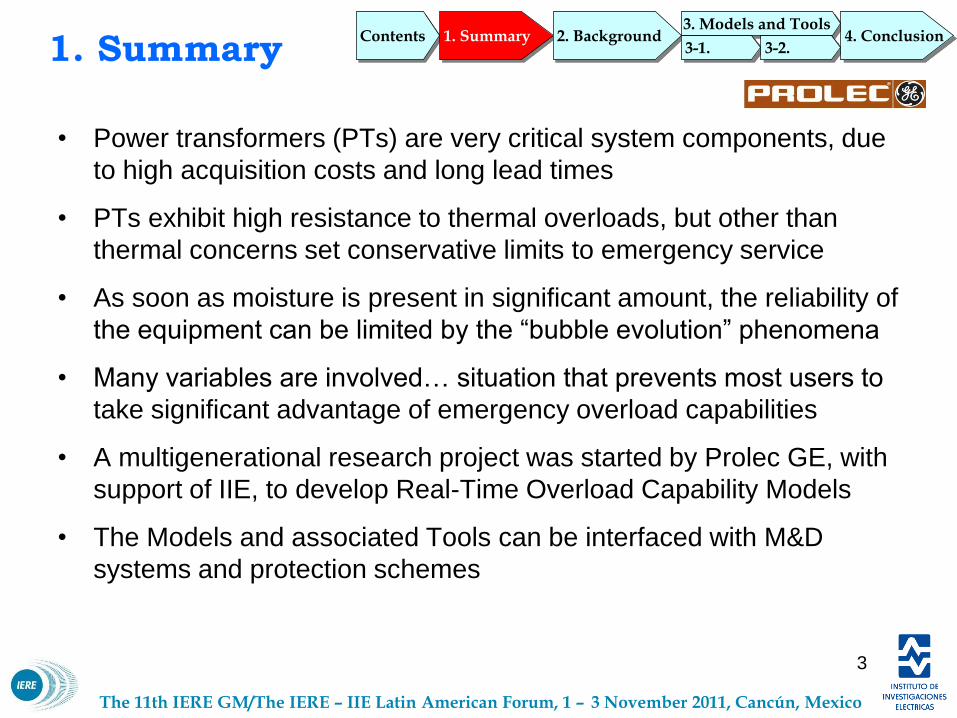
1. Summary
• Power transformers (PTs) are very critical system components, due
to high acquisition costs and long lead times
• PTs exhibit high resistance to thermal overloads, but other than
thermal concerns set conservative limits to emergency service
• As soon as moisture is present in significant amount, the reliability of
the equipment can be limited by the “bubble evolution” phenomena
• Many variables are involved… situation that prevents most users to
take significant advantage of emergency overload capabilities
• A multigenerational research project was started by Prolec GE, with
support of IIE, to develop Real-Time Overload Capability Models
• The Models and associated Tools can be interfaced with M&D
systems and protection schemes
Contents 1. Summary 3. Models and Tools
2. Background 3-1. 3-2.
4. Conclusion
3

The 11th IERE GM/The IERE – IIE Latin American Forum, 1 – 3 November 2011, Cancún, Mexico
Introduction to
• Manufacturer of power and distribution transformers: Five product lines
• A Joint Venture between GE and Xignux, started 1995
• Facilities in Monterrey, Mexico, with more than 30 years experience in industry, and
Chennai, India
• Full capabilities, including design, manufacturing, testing, installation, and service
2. Background Contents 1. Summary
3. Models and Tools 2. Background
3-1. 3-2. 4. Conclusion
Apodaca facilities (10 mi from Monterrey), NL, Mexico
4

The 11th IERE GM/The IERE – IIE Latin American Forum, 1 – 3 November 2011, Cancún, Mexico
Generator Step-Up
• 1,000 MVA 3ϕ ó 500 MVA 1ϕ
• 550 kV (1,675 kV BIL) 50 or 60 Hz
• LTC in HV or LV, DETC in HV
Autotransformers
• 1,200 MVA 3ϕ , 600 MVA 1ϕ
• 550 kV (1,675 kV BIL) 50 or 60 Hz
• LTC in HV or LV, DETC in HV
Auxiliary Unit and Station Transformers
• 230 kV (1,050 kV BIL) 50 or 60 Hz
• LTC in HV or LV, DETC in HV
Shunt Reactors
50 MVAr 1ϕ
• 550 kV (1,550 kV BIL)
• 50 or 60 Hz
Power Transformers
Full range of products for T&D
Lo
gi
sti
cs More than 35 countries around the world
5

The 11th IERE GM/The IERE – IIE Latin American Forum, 1 – 3 November 2011, Cancún, Mexico
Primary facilities – Americas
Distribution and
Industrial Transformers
• 5 kVA - 167 kVA
• 225 kVA – 12,000 kVA,
up to 69 kV, 200 kV BIL
• 45 kVA – 5,000 kVA,
Up to 34.5kV, 200kV BIL
Residential
Industrial
Commercial
Industrial and Distribution Products
6

The 11th IERE GM/The IERE – IIE Latin American Forum, 1 – 3 November 2011, Cancún, Mexico
Prolec GE India - Global presence
• Acquisition of major share of IndoTech
Transformers Limited
• Serving Industrial and Utility markets in India
• Two facilities located in Chennai, with
modern equipment and qualified
personnel to handle up to 400 kV
7

The 11th IERE GM/The IERE – IIE Latin American Forum, 1 – 3 November 2011, Cancún, Mexico
Prolec GE’s R&D Program -Transformers for Smart Grids
• High reliability of energy delivery
Performance models for load management in real time
On line monitoring of operation reliability
• Environmental friendly manufacturing and operation
Application of biodegradable fluids
Low noise and lower losses
High-efficiency wind generator transformers
• Flexible, efficient operation of distribution grids
Distribution transformer with electronic control
Integral Solutions to prevent electricity theft
Electronic transformers
8

The 11th IERE GM/The IERE – IIE Latin American Forum, 1 – 3 November 2011, Cancún, Mexico
3. Development of Models and Tools
• 3-1. Thermal Behavior of Transformers
Contents 1. Summary 3. Models and Tools
2. Background 3-1. 3-2.
4. Conclusion
9

The 11th IERE GM/The IERE – IIE Latin American Forum, 1 – 3 November 2011, Cancún, Mexico
Thermal behavior of transformers -Rated Load
Winding Hottest Spot Temperature:
It is the hottest temperature of current carrying components of a transformer in contact with paper or insulating fluid
Temperature
Height
Prolec GE
Oil Copper Min.
Avg.
Max.
gr Winding to oil Gradient
H Hottest Spot Multiplier
P Hottest Spot temperature
Q Winding Average Temperature by resistance
A Top Oil Temperature
Hottest Spot Temperature
Model for
Steady state:
P= A + H x gr
IEEE C57.12.80
Traditional WTI
10
The 11th IERE GM/The IERE – IIE Latin American Forum, 1 – 3 November 2011, Cancún, Mexico
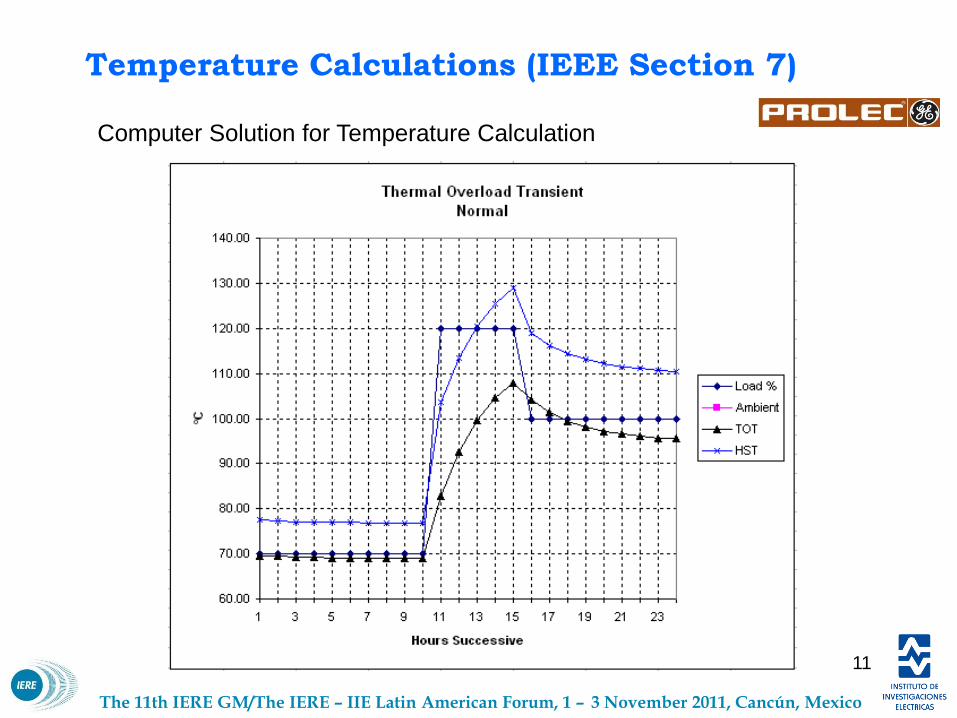
Computer Solution for Temperature Calculation
Temperature Calculations (IEEE Section 7)
11

The 11th IERE GM/The IERE – IIE Latin American Forum, 1 – 3 November 2011, Cancún, Mexico
Overloads- IEEE Definitions
Operation above the maximum nameplate capacity or design ambient temperature
Results on higher temperatures than those specified in standards
Faster aging and degradation of materials and components.
• Planned Overload
• Long Term Emergency Overload
• Short Term Emergency Overload
Overloading a transformer implies some risk
Risks should be identified and assessed in advance
12

The 11th IERE GM/The IERE – IIE Latin American Forum, 1 – 3 November 2011, Cancún, Mexico
Is that accepted by the user as normal and repetitive. Maximum hottest spot temperature is in the range of 120 -130°C. Is not related to system outages. Higher loss of life than rated load. Medium risk.
IEEE C57.91
Suggested Temperature Limits: (IEEE C57.91, table 8)
Winding Hottest Spot 130 °C
Metallic Parts 150 °C
Top Oil 110 °C
Planned Overloads
13
The 11th IERE GM/The IERE – IIE Latin American Forum, 1 – 3 November 2011, Cancún, Mexico
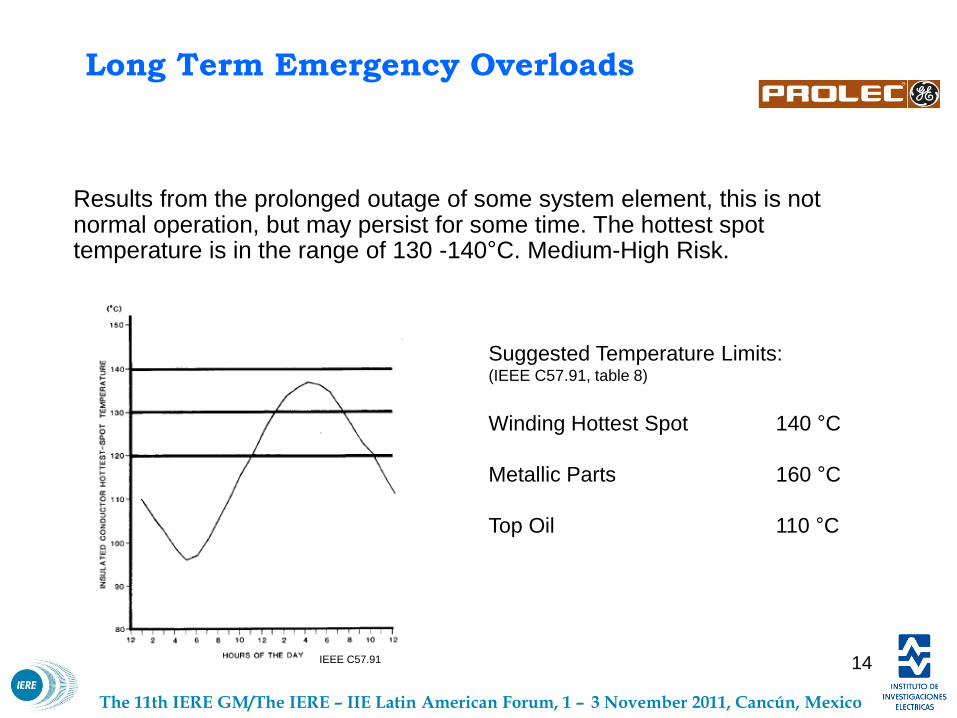
Long Term Emergency Overloads
Results from the prolonged outage of some system element, this is not normal operation, but may persist for some time. The hottest spot temperature is in the range of 130 -140°C. Medium-High Risk.
Suggested Temperature Limits: (IEEE C57.91, table 8)
Winding Hottest Spot 140 °C
Metallic Parts 160 °C
Top Oil 110 °C
IEEE C57.91 14

The 11th IERE GM/The IERE – IIE Latin American Forum, 1 – 3 November 2011, Cancún, Mexico
Unusually heavy loading brought about by the occurrence of one or more unlikely events (second or third contingencies) that seriously disturb the system. Hottest spot temperature may exceed 140°C for a short time. Acceptance of this condition may be preferable to other alternatives. High risk.
IEEE C57.91
Suggested Temperature Limits: (IEEE C57.91, table 8)
Winding Hottest spot 180 °C*
Metallic Parts 200 °C
Top Oil 110 °C
*Possible Bubble Evolution
Short Term Emergency Overloads
15

The 11th IERE GM/The IERE – IIE Latin American Forum, 1 – 3 November 2011, Cancún, Mexico
IEEE C57.91
Comparative table of loading types
Temperature limits suggested in IEEE C57.91
16

The 11th IERE GM/The IERE – IIE Latin American Forum, 1 – 3 November 2011, Cancún, Mexico
Risk Assessment
Risk
of
Failure
Temp. Current
120°C
130°C
140°C
160°C+
1.0 pu
1.3 pu
1.5 pu
1.8 pu+
Pressure
Normal Loading
Planned Overload
Short Term Emergency Overload
Long Term Emergency Overload
17

The 11th IERE GM/The IERE – IIE Latin American Forum, 1 – 3 November 2011, Cancún, Mexico
Moisture Migration and Bubble Evolution Models
Assumption: Under any
significant load, oil’s
absolute moisture contents
is uniform.
Relative moisture contents
can be measured with the
moisture sensor.
When thermal equilibrium is
reached, known moisture in
oil vs. Moisture in paper
curves can be applied.
Moisture contents in
conductor insulation
Bubble evolution
threshold
Moisture condensation
threshold
INPUTS/SENSORS RULES OUTPUTS
Moisture in oil sensor
Oil temperature (top,
middle, bottom)
Oil temperature profile
Load current H (A,B,C)
Load current X (a,b,c)
Load current Y
(a1,b1,c1)
Win
din
g
tem
pe
ratu
re
pro
file
Moisture contents of paper
Overload capability
18
The 11th IERE GM/The IERE – IIE Latin American Forum, 1 – 3 November 2011, Cancún, Mexico
3. Development of Models and Tools
• 3-2. Bubble Evolution Model
Contents 1. Summary 3. Models and Tools
2. Background 3-1. 3-2.
4. Conclusion
19
The 11th IERE GM/The IERE – IIE Latin American Forum, 1 – 3 November 2011, Cancún, Mexico
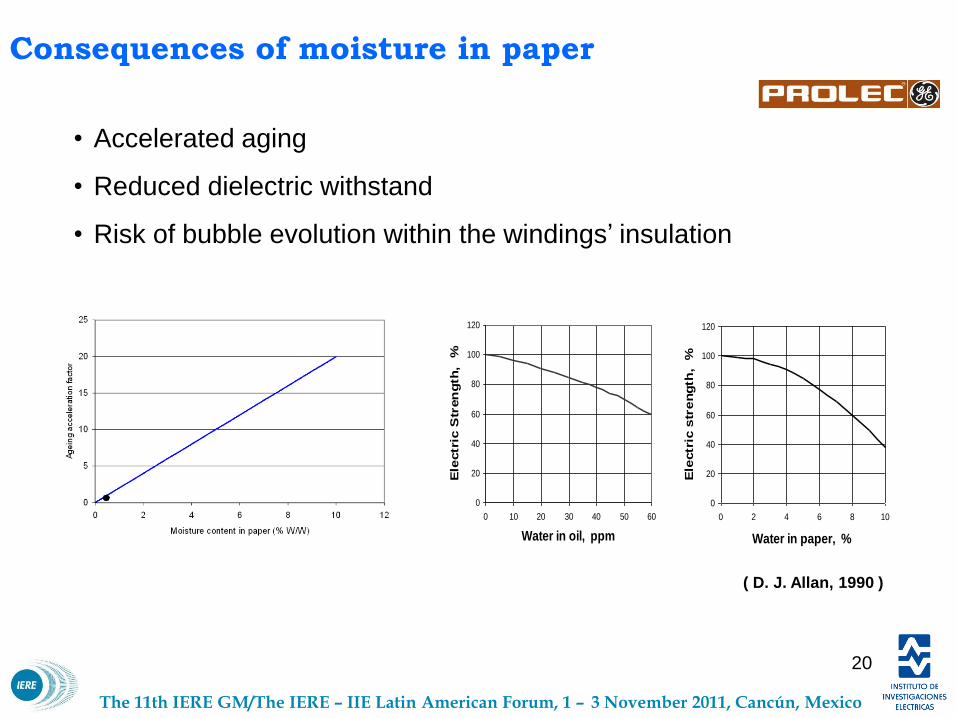
Consequences of moisture in paper
• Accelerated aging
• Reduced dielectric withstand
• Risk of bubble evolution within the windings’ insulation
0
20
40
60
80
100
120
0 10 20 30 40 50 60
Water in oil, ppm
Ele
ctr
ic S
tren
gth
, %
0
20
40
60
80
100
120
0 2 4 6 8 10
Water in paper, %
Ele
ctr
ic s
tre
ng
th,
%
( D. J. Allan, 1990 )
20
The 11th IERE GM/The IERE – IIE Latin American Forum, 1 – 3 November 2011, Cancún, Mexico
40
60
80
100
120
140
160
180
200
0 1 2 3 4 5 6 7 8 9 10
WCP (%)
Te
mp
era
tura
(C
)
Kobayashi rapido
Kobayashi lento
Oommen sin gas
Scala baja presión
Scala alta presión
Oommen gas N2
Mc Nutt 50C
Mc Nutt 75C
Oommen tres discos
Oommen un disco
Davydov
Bubble evolution phenomena
Bubble evolution models. Test specimen.
21
The 11th IERE GM/The IERE – IIE Latin American Forum, 1 – 3 November 2011, Cancún, Mexico
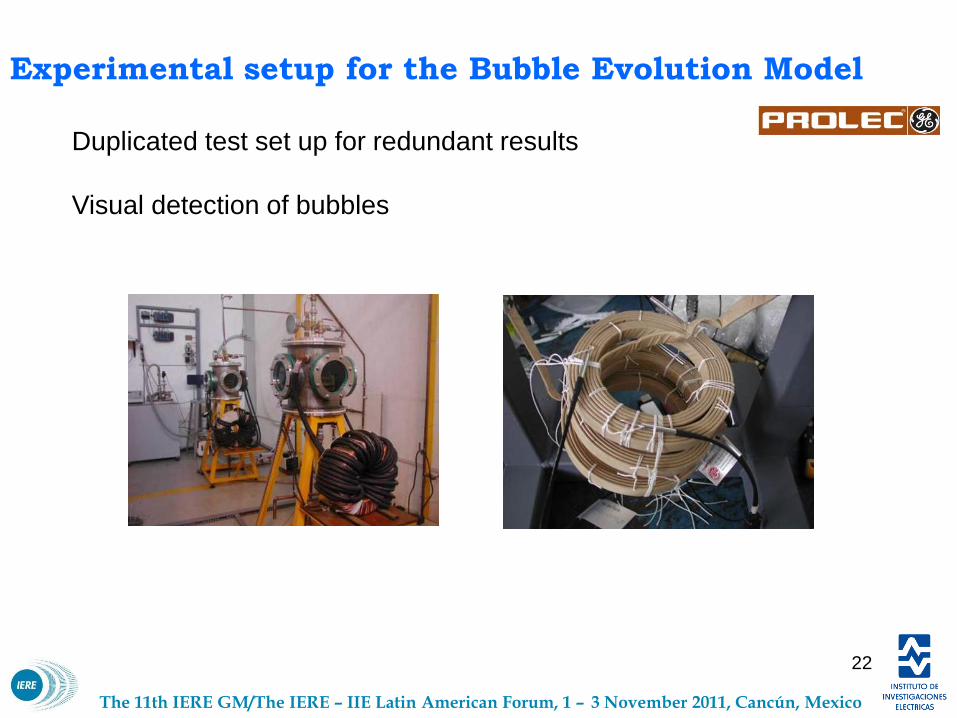
Experimental setup for the Bubble Evolution Model
Duplicated test set up for redundant results
Visual detection of bubbles
22

The 11th IERE GM/The IERE – IIE Latin American Forum, 1 – 3 November 2011, Cancún, Mexico
Experimentation variables
Factors:
• Moisture contents in paper
• (Over-) Load profile
• Hydrostatic pressure
• Oil solubility
• Aging degree of paper
• Total gas contents in oil
• Geometrical data from windings and packages
• Thermo-hydraulic factors of windings
23

The 11th IERE GM/The IERE – IIE Latin American Forum, 1 – 3 November 2011, Cancún, Mexico
Experimental results
Comparison with models reported in literature
Those models include only a few variables each, not as
comprehensive as the model developed here
Water contents of paper (%)
Tem
pera
ture
(ºC
)
24

The 11th IERE GM/The IERE – IIE Latin American Forum, 1 – 3 November 2011, Cancún, Mexico
• 3-3. Moisture Migration Model
Contents 1. Summary 3. Models and Tools
2. Background 3-2. 3-3.
4. Conclusion
3. Development of Models and Tools
25

The 11th IERE GM/The IERE – IIE Latin American Forum, 1 – 3 November 2011, Cancún, Mexico
Sources of moisture in transformers
• Residual moisture
• Insulation structural components can release moisture
retained during factory and, or field processing, to reach
equilibrium with surrounding oil
• Moisture ingress
• Moisture penetration through seals and gaskets
• Ineffective free breathing dessicant
• Moisture brought in during internal inspection
• Molecular infiltration (small contribution)
• Thermal decomposition of solid insulating materials
26

The 11th IERE GM/The IERE – IIE Latin American Forum, 1 – 3 November 2011, Cancún, Mexico
Moisture migration between oil and paper
• In normal operation, moisture migrates with cyclic
dynamism between cellulosic (hygroscopic)
insulation components and oil, according to
changes in operating temperature
• A «pseudo-equillibrium» can be defined
• Paper insulation of windings is the material that
experiences the most intensive dynamics,
because of its proximitty to high temperature
components, and its low density.
• At higher temperatures, moisture goes from paper
to oil, at lower temperatures moisture comes back
to paper (and other insulating components).
27
The 11th IERE GM/The IERE – IIE Latin American Forum, 1 – 3 November 2011, Cancún, Mexico
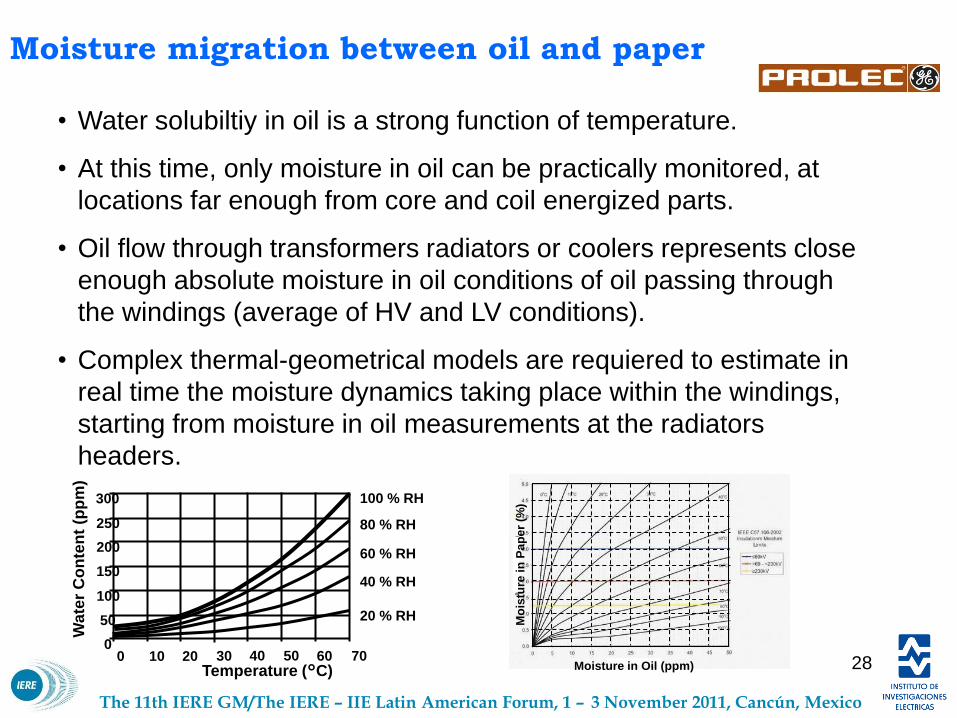
Moisture migration between oil and paper
• Water solubiltiy in oil is a strong function of temperature.
• At this time, only moisture in oil can be practically monitored, at
locations far enough from core and coil energized parts.
• Oil flow through transformers radiators or coolers represents close
enough absolute moisture in oil conditions of oil passing through
the windings (average of HV and LV conditions).
• Complex thermal-geometrical models are requiered to estimate in
real time the moisture dynamics taking place within the windings,
starting from moisture in oil measurements at the radiators
headers.
Temperature (°C)
Wa
ter
Co
nte
nt
(pp
m)
0 10 20 30 40 50 60 70 0
50
100
150
200
250
300 100 % RH
80 % RH
60 % RH
40 % RH
20 % RH
Moisture in Oil (ppm)
Mo
istu
re in
Pa
pe
r (%
)
28

The 11th IERE GM/The IERE – IIE Latin American Forum, 1 – 3 November 2011, Cancún, Mexico
Distribution of moisture among transformers
components
Wooden
Blocks (55%)
Oil
(1%)
PB Barriers
(22%)
Paper in Wdgs.
(22%)
( Source: CIGRE )
29

The 11th IERE GM/The IERE – IIE Latin American Forum, 1 – 3 November 2011, Cancún, Mexico
Absorption of moisture in paper
• Paper can absorb 10% of its weight in water
• Water has a low solubility in transformers mineral oil; saturation
is reached at ambient temperature with as few as 50 ppm of
water
• In order of magnitude, paper can absorb as much as 2000
times more moisture than oil
30

The 11th IERE GM/The IERE – IIE Latin American Forum, 1 – 3 November 2011, Cancún, Mexico
Experimental Phase I: Feasibility
Experimental setup to investigate
feasibility of a dynamic moisture
migration model for primary
station transformers.
A reduced scale model was
designed to investigate dynamic
moisture relationships and
compare with state of art
publications
Moisture and temperature
sensors were incorporated into a
few section-model of a winding
package
A temperature profile was
created, axially and radially within
the windings
31

The 11th IERE GM/The IERE – IIE Latin American Forum, 1 – 3 November 2011, Cancún, Mexico
Experimental Phase I: Location of sensors
32
The 11th IERE GM/The IERE – IIE Latin American Forum, 1 – 3 November 2011, Cancún, Mexico
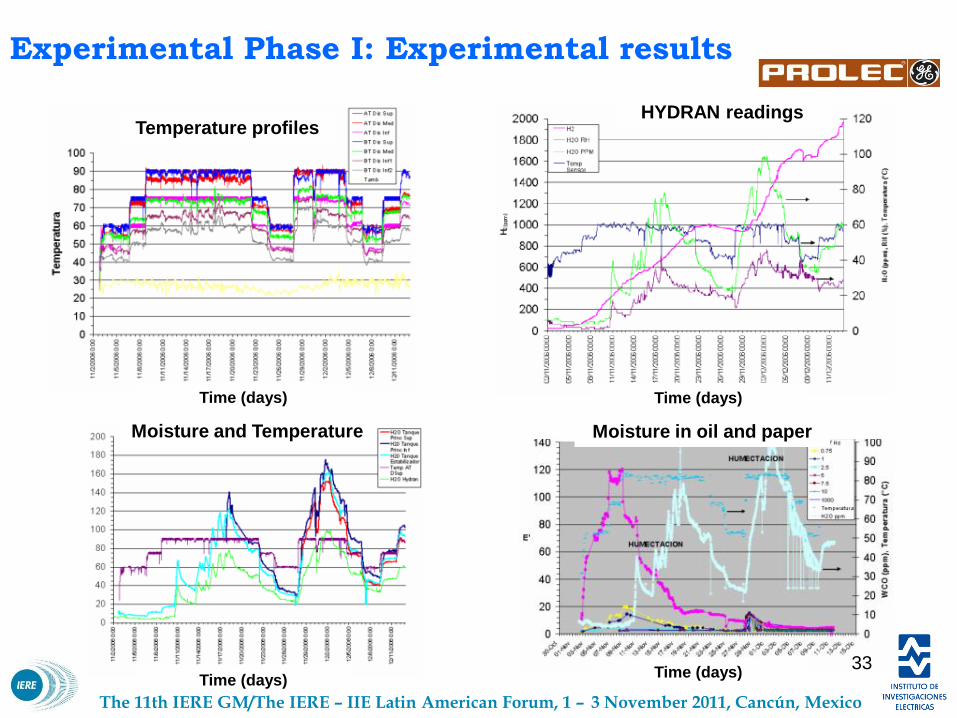
Experimental Phase I: Experimental results
Temperature profiles
Time (days)
HYDRAN readings
Time (days)
Time (days) Time (days)
Moisture and Temperature Moisture in oil and paper
33

The 11th IERE GM/The IERE – IIE Latin American Forum, 1 – 3 November 2011, Cancún, Mexico
Experimental Phase I: Validation of results
• The experimentation process
released formulas for estimation of
moisture in paper from moisture in
oil measurements, for a steady
state condition in the transformer.
• Three isothermal curves were
developed, for 60, 75 and 90°C
HST, with three points of dynamic
equilibrium on each curve.
• The steady state curves show
good similarity with T.V.
Oommen’s static equilibrium
curves. Moisture equilibrium curves (T.V.Oommen’s) compared
to experimental results. Hot spot is reference temperature.
34

The 11th IERE GM/The IERE – IIE Latin American Forum, 1 – 3 November 2011, Cancún, Mexico
Experimental Phase II : Moisture Distribution Model
35

The 11th IERE GM/The IERE – IIE Latin American Forum, 1 – 3 November 2011, Cancún, Mexico
Experimental Phase II: Formulas for local moisture
levels
Basic formula for the model:
Temperature distribution on windings, dielectric properties of paper as a
function of moisture and temperature, are the main parameters of the
experimental model.
36

The 11th IERE GM/The IERE – IIE Latin American Forum, 1 – 3 November 2011, Cancún, Mexico
Experimental Phase II : Model
The resultant mathematical model can estimate moisture in paper within an interval
of 0.7% to 3.0% moisture contents.
• The model allows for estimation of axial distribution of moisture on
transformers winding paper insulation.
• The model integrated to a computational tool can be used for on-line or off
line applications.
• Critical variables are moisture in oil passing through the windings, top oil
temperature and oil’s acidity level, to estimate moisture in insulation.
The variables used in the model are:
• Moisture in oil
• Transformers design parameters (termohydraulic models)
• Transformers operation parameters: load and corresponding temperature
distribution, steady dtate and transient
• Water solubility of insulating oil
• Aging conditions of paper
• Load profile (load current vs. time)
37

The 11th IERE GM/The IERE – IIE Latin American Forum, 1 – 3 November 2011, Cancún, Mexico
Experimental Phase III : Validation of Computational
Tools
38

The 11th IERE GM/The IERE – IIE Latin American Forum, 1 – 3 November 2011, Cancún, Mexico
Experimental Phase III: Full scale Validation
MOISTURE VARIATION , MEASUREMENTS VS. MODEL ESTIMATIONS
DIRECT MEASUREMENT (%) MODEL ESTIMATION (%) VARIATION (%)
CONDITION 1
Disk 40 0.85 0.71 -16.47
Disk 10 1.75 1.89 8.00
CONDITION 2
Disk 40 1.92 1.95 1.56
Disk 10 3.84 3.29 -14.32
CONDITION 3
Disk 40 2.51 2.56 1.99
Disk 10 4.03 4.14 2.72
• Paper strips were used as witness samples within each of the three stages of load
profiles. Methodology recommended in IEC 60814 was applied for evaluation of
samples.
• At each experimental heat-up stage the samples were extracted under
pseudoequilibrium conditions, and tested with the Karl Fischer method (KFT).
• Results were compared with our model predictions.
39

The 11th IERE GM/The IERE – IIE Latin American Forum, 1 – 3 November 2011, Cancún, Mexico
Numerical Models
• Each transformer design has a different temperature profile
• In general, performance parameters will change with time,
making necessary manual correction of models
• Using Adaptative Models, individual differences can be corrected
for each transformer; factory heat runs allow fine tuning of
thermal models
40

The 11th IERE GM/The IERE – IIE Latin American Forum, 1 – 3 November 2011, Cancún, Mexico
Moisture Migration and Bubble Evolution Models
Assumption: Under any
significant load, oil’s
absolute moisture contents
is uniform.
Relative moisture contents
can be measured with the
moisture sensor.
When thermal equilibrium is
reached, known moisture in
oil vs. Moisture in paper
curves can be applied.
Moisture contents in
conductor insulation
Bubble evolution
threshold
Moisture condensation
threshold
INPUTS/SENSORS RULES OUTPUTS
Moisture in oil sensor
Oil temperature (top,
middle, bottom)
Oil temperature profile
Load current H (A,B,C)
Load current X (a,b,c)
Load current Y
(a1,b1,c1)
Win
din
g
tem
pe
ratu
re
pro
file
Moisture contents of paper
Overload capability
41

The 11th IERE GM/The IERE – IIE Latin American Forum, 1 – 3 November 2011, Cancún, Mexico
This model is intended for estimation of moisture contents in paper insulation of
transformers windings.
Moisture Migration Tool
®®
42
The 11th IERE GM/The IERE – IIE Latin American Forum, 1 – 3 November 2011, Cancún, Mexico
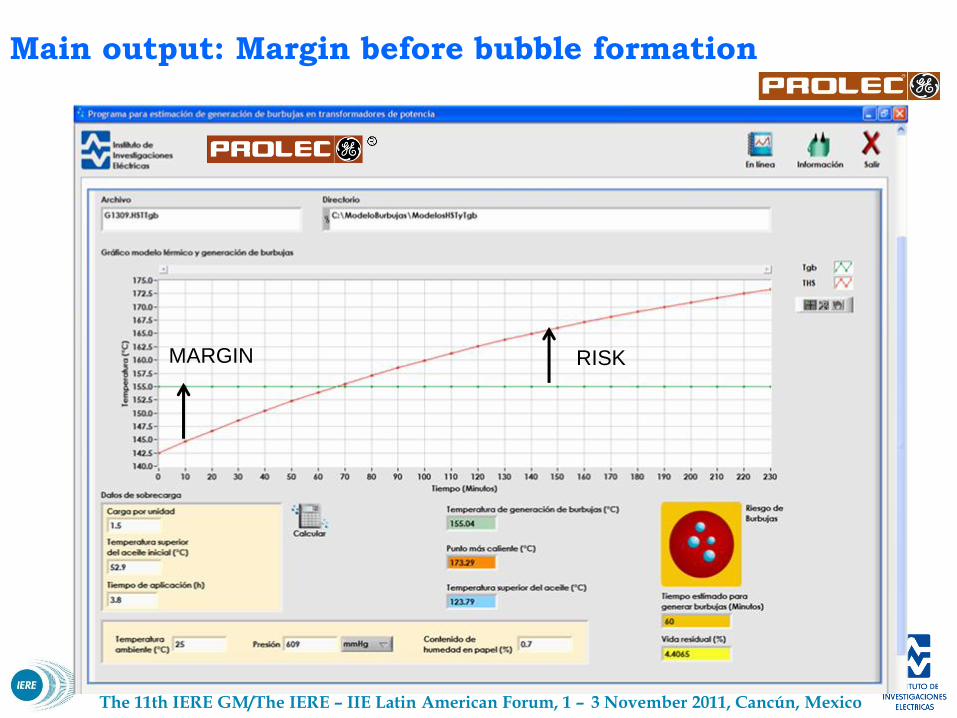
Main output: Margin before bubble formation
MARGIN RISK

The 11th IERE GM/The IERE – IIE Latin American Forum, 1 – 3 November 2011, Cancún, Mexico
4. Conclusion
• A Real Time Loadability Margin (RTLM) is an important parameter
for equipment operating in future, smart grids
• For the particular case of Transformers, the parameters can be
derived from material properties and design data
• The challenge to develop an RTLM is to consider all relevant
variables for any particular design
• Extensive experimentation can yield practical models to estimate
bubble evolution margins under given overload profiles
• Without RTLM models, utilities either leave unused potential
emergency capacity… or run unknown risks
Contents 1. Summary 3. Subject
2. Background 3-1. 3-2.
4. Conclusion
44

The 11th IERE GM/The IERE – IIE Latin American Forum, 1 – 3 November 2011, Cancún, Mexico
Next Steps
• Validation of accuracy and reliability of the new computational tools,
by monitoring aged transformers in the field, that fall within the
scope of the model: power transformers up to 100 MVA
• Development of an electronic device incorporating the Real Time
Loadability models
• Future incorporation of a Real Time Loadability Margin within
transformer’s parameters monitored for System Operation, and
within asset management control, for a reliable Network Health
Index
• Expand model´s scope and incorporate automatic verification and
correction of models parameters over time
45

The 11th IERE GM/The IERE – IIE Latin American Forum, 1 – 3 November 2011, Cancún, Mexico
Questions or Comments?
…
Thank you for your attention!
Powering reliable solutions for you