
Power Workers' Union (PWU) INTERROGATORY #1 · Filed: 2014-07-17 2015-2016 Tx Rates Exhibit I Tab 7...
34
Filed: 2014-07-17 2015-2016 Tx Rates Exhibit I Tab 7 Schedule 1 Page 1 of 2 Power Workers' Union (PWU) INTERROGATORY #1 1 2 Interrogatory 3 4 Ref (a): Participant Information Package: Exhibit C1-2-1, Page 5 of 6, Table 2 (OM&A 5 Expenditures) 6 7 Table 2: 2013 Board Approved versus 2013 Actual OM&A Expenditures 8 9 OM&A Categories 2013 Board Approved ($ million) 2013 Actuals ($ million) Variance ($ million) Sustaining 235.7 221.0 (14.8) Development 13.7 8.6 (5.1) Operations 57.7 56.7 (1.0) Customer Care 4.9 5.3 0.4 Common Corporate & Other Costs 61.9 75.8 13.9 Taxes other than Income Taxes 66.0 21.2 (44.8) Total OM&A 440.3 388.4 (51.6) 10 Ref (b): Exhibit C1-2-1, Page 5 of 6, Lines 4-8: 11 12 Hydro One Transmission’s actual 2013 OM&A costs were $51.6 million lower 13 than the $440.3 million approved by the Board in Proceeding EB-2012-0031. The 14 reduction in the Sustaining, Development, and Operations work program spend 15 reflects Cornerstone savings (both are included in the Board Approved Shared 16 Services and Other total in Table 2). 17 18 a) The actual sustaining OM&A spending in 2013 was less than the Board-approved 19 amount by about $15M (Ref a). Is the variance fully attributable to Cornerstone 20 savings? If not, please identify and describe any Board-approved planned sustaining 21 work that was later cancelled, deferred or reduced in scope and explain why. 22 23 Response 24 25 a) The actual Sustaining OM&A expenditures in 2013 are lower than Board Approved amounts 26 primarily for the following reasons: 27 • Lower than anticipated cost of corrective work for both Lines and Stations assets, 28 partially attributed to the capital replacement programs addressing end of life 29 components; 30 • Lower than anticipated costs to complete required work in Site Infrastructure 31 Maintenance; 32 • Lower than anticipated volume of work on Cyber Security partially associated 33 with external delays in the approval of new standards; and 34
Transcript of Power Workers' Union (PWU) INTERROGATORY #1 · Filed: 2014-07-17 2015-2016 Tx Rates Exhibit I Tab 7...

Filed: 2014-07-17 2015-2016 Tx Rates Exhibit I Tab 7 Schedule 1 Page 1 of 2
Power Workers' Union (PWU) INTERROGATORY #1 1
2
Interrogatory 3
4
Ref (a): Participant Information Package: Exhibit C1-2-1, Page 5 of 6, Table 2 (OM&A 5
Expenditures) 6
7
Table 2: 2013 Board Approved versus 2013 Actual OM&A Expenditures 8
9 OM&A Categories 2013 Board
Approved ($ million)
2013 Actuals ($ million) Variance ($
million)
Sustaining 235.7 221.0 (14.8) Development 13.7 8.6 (5.1) Operations 57.7 56.7 (1.0) Customer Care 4.9 5.3 0.4 Common Corporate & Other Costs 61.9 75.8 13.9 Taxes other than Income Taxes 66.0 21.2 (44.8) Total OM&A 440.3 388.4 (51.6) 10
Ref (b): Exhibit C1-2-1, Page 5 of 6, Lines 4-8: 11
12 Hydro One Transmission’s actual 2013 OM&A costs were $51.6 million lower 13 than the $440.3 million approved by the Board in Proceeding EB-2012-0031. The 14 reduction in the Sustaining, Development, and Operations work program spend 15 reflects Cornerstone savings (both are included in the Board Approved Shared 16 Services and Other total in Table 2). 17
18
a) The actual sustaining OM&A spending in 2013 was less than the Board-approved 19
amount by about $15M (Ref a). Is the variance fully attributable to Cornerstone 20
savings? If not, please identify and describe any Board-approved planned sustaining 21
work that was later cancelled, deferred or reduced in scope and explain why. 22 23
Response 24
25 a) The actual Sustaining OM&A expenditures in 2013 are lower than Board Approved amounts 26
primarily for the following reasons: 27
• Lower than anticipated cost of corrective work for both Lines and Stations assets, 28
partially attributed to the capital replacement programs addressing end of life 29
components; 30
• Lower than anticipated costs to complete required work in Site Infrastructure 31
Maintenance; 32
• Lower than anticipated volume of work on Cyber Security partially associated 33
with external delays in the approval of new standards; and 34
Filed: 2014-07-17 2015-2016 Tx Rates Exhibit I Tab 7 Schedule 1 Page 2 of 2
• Delays in the Engineering and Environmental Support category for Class EA 1
process documentation updates due to slower than planned progress associated 2
with on-going external stakeholder consultations. 3

Filed: 2014-07-17 2015-2016 Tx Rates Exhibit I Tab 7 Schedule 2 Page 1 of 1
Power Workers' Union (PWU) INTERROGATORY #2 1
2
Interrogatory 3
4
Ref (a): Participant Information Package. Exhibit C1-2-1, Page 6 of 6, Table 3 (OM&A 5
Expenditures) 6
7
Table 3: 2014 Board Approved versus 2014 Projected OM&A Expenditures 8
9 OM&A Categories 2014 Board 2014 Variance Approved Projected ($ million) ($ million) ($ million) Sustaining 246.5 236.2 (10.3) Development2 14.7 12.9 (1.8) Operations 58.0 57.4 (1.6) Customer Care 4.7 5.8 1.1 Common Corporate & Other Costs 59.0 70.6 11.6 Taxes other than Income Taxes 66.8 65.6 (1.2) Total 449.7 448.5 (1.2) 10
Ref (b): Participant Information Package. Exhibit C1-2-1, Page 6 of 6, Lines 9-11: 11
12 The reduction in the Sustaining, Development, and Operations work program 13 spend was driven by the need to stay within the overall Transmission business 14 OM&A envelope approved in the Board’s last Decision, and also reflects 15 Cornerstone savings. These variances are partially offset by an increase in 16 Common Corporate and Other Costs primarily in the Real Estate and Facilities 17 area. 18
19 a) The sustaining OM&A spending in 2014 is projected to be less than the Board-approved 20
amount by about $10M (Ref b). Please identify and describe any planned sustaining work that 21 was later cancelled, deferred or reduced in scope as a result of “the need to stay within the 22 overall Transmission business OM&A envelope approved in the Board’s last Decision” 23 described in Ref b. What proportion of the $10M variance is attributable to Cornerstone 24 savings? 25
26
Response 27
28 a) The actual Sustaining OM&A expenditures in 2014 are lower than Board Approved amounts 29
primarily for the following reasons: 30
• Lower than anticipated costs to complete Power Equipment maintenance 31
program; 32
• Lower than anticipated costs to complete the Ancillary Equipment maintenance 33
program; and 34
• Lower than anticipated costs to complete the Site Infrastructure maintenance 35
program. 36

Filed: 2014-07-17 2015-2016 Tx Rates Exhibit I Tab 7 Schedule 3 Page 1 of 1
Power Workers' Union (PWU) INTERROGATORY #3 1
2
Interrogatory 3
4
Ref (a): Participant Information Package. Exhibit C1-2-2, Page 39 of 51, Lines 20-22 5
(Vegetation Management): 6
7 In addition to the condition patrols, Hydro One Transmission will be required to inspect 8 applicable lines annually as outlined in the recent revision to the NERC Vegetation 9 Management Standard (FAC-003-2); which became enforceable in 2014. 10
11
a) Please describe the new or additional requirements relating to vegetation management 12
that are included in the revised NERC Vegetation Management Standard. 13
14
b) Please provide the NERC Vegetation Management Standard (FAC-003-2). 15
16
Response 17
18
a) Hydro One is now required to annually inspect vegetation on all circuits operating at 19
230kV and above by either helicopter or ground to comply with the NERC standard 20
that states “Each applicable Transmission Owner and applicable Generator Owner 21
shall perform a Vegetation Inspection of 100% of its applicable transmission lines 22
(measured in units of choice - circuit, pole line, line miles or kilometers, etc.) at least 23
once per calendar year and with no more than 18 calendar months between 24
inspections on the same ROW [right of way].”. 25
26
b) Please refer to the following link for the latest version (Version 3) of the NERC 27
Transmission Vegetation Management standard. http://www.nerc.com/files/FAC-003-28
3.pdf 29

Filed: 2014-07-17 2015-2016 Tx Rates Exhibit I Tab 7 Schedule 4 Page 1 of 1
Power Workers' Union (PWU) INTERROGATORY #4 1
2
Interrogatory 3
4
Ref (a): Participant Information Package. Exhibit C1-2-2, Page 37 of 51, Table 11 5
(Vegetation Management) 6
7
Vegetation Management OM&A ($ Millions) 8
9
Description Historic Years Bridge
Year Test Years
2011 2012 2013 2014 2015 2016 Brush Control 17.0 15.5 19.8 18.3 18.6 19.0 Line Clearing 4.3 5.3 5.2 6.4 6.5 6.4 Property Owner Contact 1.2 1.3 1.2 1.8 1.8 1.8 Condition Patrols 1.3 1.4 1.6 1.6 1.6 1.6 Demand Maintenance 1.0 1.4 0.9 1.4 1.4 1.4 Grounds Maintenance 1.9 2.2 2.3 2.8 2.9 2.9 Total 26.6 27.1 31.1 32.2 32.8 33.2 10
a) Please provide the corresponding historic and planned levels of accomplishment for 11
the test years for brush control (ha) and line clearing (km). 12
13
Response 14
15
The corresponding historic accomplishment and planned levels for brush control and line 16
clearing are as follows: 17
2011 2012 2013 2014 2015 2016 Brush Control (ha) 11,580 11,048 11,687 13,000 13,000 13,000 Line Clearing (km) 2,878 2,704 2,864 3,400 3,400 3,300
18

Filed: 2014-07-17 2015-2016 Tx Rates Exhibit I Tab 7 Schedule 5 Page 1 of 1
Power Workers' Union (PWU) INTERROGATORY #5 1
2
Interrogatory 3
4
Ref (a): Participant Information Package. Exhibit D1-3-1, Page 1, Lines 3-8. 5
6 1.0 SUMMARY OF CAPITAL BUDGET 7 The proposed capital expenditures result from a rigorous business planning and 8 work prioritization process that reflects risk-based decision-making to ensure 9 that the appropriate, cost-effective solutions are put into place to meet Hydro 10 One Transmission objectives. These processes are described in detail in Exhibit 11 A, Tab 16, Schedules 1 to 7. 12 13
Ref (b): EB-2013-0416. Exhibit D1-3-1, Page 1, Lines 3-8. 14
15 1.0 SUMMARY OF CAPITAL EXPENDITURES 16 The requested capital expenditures result from the rigorous business planning 17 and work prioritization processes described in detail at Exhibit A, Tab 17, 18 Schedules 1 through 7. These processes reflect a risk-based decision-making 19 approach to ensure appropriate and cost-effective investments. 20
21
a) As per Ref (a), the business planning and work prioritization processes for this 22
application are described in Exhibit A, Tab 16, Schedules 1 to 7 as provided in the 23
Participant Information Package. As per Ref (b), the business planning and work 24
prioritization processes for HONI’s 2015-2019 Distribution Custom Rate Application 25
are described EB-2013-0416, Exhibit A, Tab 17, Schedule 1 to 7. Please confirm that 26
HONI’s business planning and work prioritization processes outlined in the 27
distribution and transmission applications are identical. If not, please provide Exhibit 28
A, Tab 16, Schedule 1 to 7. 29
30
Response 31
32
HONI’s business planning and work prioritization processes outlined in the distribution 33
and transmission applications are identical. 34

Filed: 2014-07-17 2015-2016 Tx Rates Exhibit I Tab 7 Schedule 6 Page 1 of 2
Power Workers' Union (PWU) INTERROGATORY #6 1
2
Interrogatory 3
4
Ref (a): Participant Information Package. Exhibit D1-2-1, Page 7, Lines 6-10. 5
6 4.0 TRANSMISSION ASSET RISK ANALYSIS 7 The information presented below entails the asset risk analysis summaries for 8 key transmission assets, based on the asset risk assessment process introduced in 9 Exhibit A, Tab 16, Schedule 7. 10 11
Ref (b): EB-2013-0416, Exhibit A-17-7. Asset Risk Assessment. Page 1, Lines 11-21. 12
13 2.0 ASSET RISK ASSESSMENT PROCESS 14 Hydro One’s Asset Risk Assessment methodology is built on the foundation of the 15 Asset Condition Assessment approach previously filed in proceeding EB-2009-16 0096. Since then, Hydro One has completed an asset inventory of its key 17 distribution assets that was collected during routine maintenance and 18 inspections. This information is centralized in a repository and has been linked to 19 other non-condition based information such as outage and customer data. This 20 has enabled Hydro One to extended its assessment methodology to improve its 21 focus on non-condition risk factors. This newly coined “Asset Risk Assessment” 22 enables a holistic view of asset risk, and ultimately, improved decision making. 23 24
Ref (c): EB-2012-0031. Exhibit C1-2-2. Transmission Assets and Sustaining Investment 25
Overview. 26
27
a) The PWU notes that in the current application the condition of assets for a 28
transmission asset class is assessed based on risk while in EB-2012-0031 it was based 29
on the state of condition of the asset class. Is there equivalence between the two asset 30
condition assessments? Specifically, is there equivalence or matching between levels 31
of risk such as very low, low, fair, high and very high AND states of condition such 32
as very poor, poor, fair, good and very good? What is Hydro One’s recommendation 33
to parties that wish to conduct a comparative trend analysis of the condition of Hydro 34
One’s transmission assets? 35
36
Response 37
38
Correct, Hydro One no longer uses the terminology “Very Good”, “Good”, “Fair”, 39
“Poor”, and “Very Poor” of the Asset Condition Assessment applied in previous 40
proceedings; rather Hydro One now utilizes an Asset Risk Assessment methodology that 41
classifies equipment condition based on level of risk relative to the asset population. The 42
overall asset risk assessment methodology is more comprehensive than the Asset 43
Condition Assessment review in that it provides additional information on non-condition 44
risk factors. 45
46

Filed: 2014-07-17 2015-2016 Tx Rates Exhibit I Tab 7 Schedule 6 Page 2 of 2 However for the condition risk factor of the asset risk assessment, the condition 1
assessment scale used in the current application of Very Low Risk to Very High Risk is 2
comparable to the Very Good to Very Poor condition assessment scale used in the EB-3
2012-0031 proceeding. 4
5
As such condition information presented for key transmission assets in Exhibit D1, Tab 6
2, Schedule 1 could be utilized to conduct a high level comparative analysis to the 7
condition information presented in previous applications. 8

Filed: 2014-07-17 2015-2016 Tx Rates Exhibit I Tab 7 Schedule 7 Page 1 of 3
Power Workers' Union (PWU) INTERROGATORY #7 1
2
Interrogatory 3
4
Ref (a): EB-2012-0031. Exhibit I-5-8.15 PWU 16, Page 4. 5
6
7 a) Based on the table provided in the reference, please update the following table with 8
most recent data on a best effort basis: 9

Filed: 2014-07-17 2015-2016 Tx Rates Exhibit I Tab 7 Schedule 7 Page 2 of 3
# Asset Class Transformers Breakers Protection Cables Towers Conductors Wood
Pole
1 Fleet Size (#units)
2 ESL (years)
3 Historic Replacement Rate (%/yr)
4 Proposed Replace Rate (%/yr)
5 % of assets beyond ESL 2006 17 3 6 16
6 % of assets beyond ESL 2009 24 6 18 15 16 27
7 % of assets beyond ESL 2012 21 8 31 19 15 16 27
8 % of assets beyond ESL 2014
9a % of assets beyond ESL 2024 assuming historic rate
9b % of assets beyond ESL 2024 assuming proposed rate
10 % of assets in “poor and very poor” condition - 2006 3 1 10 0 2 10
11 % of assets in “poor and very poor” condition -2012 10 16 17 6 1 16 10
12 % of assets in “poor and very poor” condition - 2014
13 % of assets in “very high and high “ risk
14 Equipment Frequency of forced outages compared to CEA Average
Notes: 1 1. The 2012 and future year data are from pre-filed evidence: Exhibit C1, Tab 2, Schedule 2; Exhibit D1, Tab 3, Schedule 2; Exhibit A, Tab 13, Schedule 2; 2 The 2009 year data are from Appendix A of Exhibit C1, Tab 02, Schedule 2 of EB-2010-0002. 3 The 2006 year data are from Appendix A of Exhibit D1, Tab 2, Schedule 1 of EB-2005-0501. 4 2. With the exception of Breakers and Cables, the “At a Glance Tables” in EB-2012-0031, Exhibit C1, Tab 2, Schedule 2 were not updated as part of the August 15 update filed in EB-5 2012-0031. 6

Filed: 2014-07-17 2015-2016 Tx Rates Exhibit I Tab 7 Schedule 7 Page 3 of 3
Response 1
2
a) Please see below for the updated table with most recent data on a best effort basis. 3
4
# Asset Class Transformers Breakers Protection Systems
U/G Cables
Steel Towers
Overhead Conductors
Wood Pole Structures
1 Fleet Size (#units) 722 4,537 1 12,135 290 km 50,000 30,000 km 42,000 2 ESL (years) 40 / 50 / 60 2 40 / 55 3 20 / 25 / 45 4 50 80-100 5 70 50 3 Historic Replacement Rate (%/yr) 2.0 1.5 3.1 0.5 0.3 0.2 2.0 4 Proposed Replace Rate (%/yr) 3.6 3.1 3.2 1.4 0.7 0.3 2.0 5 % of assets beyond ESL 2006 17 3 N/A 6 N/A N/A 16 6 % of assets beyond ESL 2009 24 6 N/A 18 N/A N/A 21 7 % of assets beyond ESL 2012 21 8 31 19 14 16 27 8 % of assets beyond ESL 2014 24 8 17 16 21 19 26
9a % of assets beyond ESL 2024 assuming historic rate 35 13 25 30 24 37 18
9b % of assets beyond ESL 2024 assuming proposed rate 19 10 22 20 18 35 18
10 % of assets in “poor and very poor” condition - 2006 3 1 10 0 N/A 2 10
11 % of assets in “poor and very poor” condition -2012 10 16 17 6 1 16 10
12 % of assets in “poor and very poor” condition - 2014 See Row 13 6
13 % of assets with “very high and high” condition risk factors 8 16 26 2 1 4 9
14 Equipment Frequency of forced outages compared to CEA Average Worse Worse Worse Worse Better Better Worse
Notes: 5 1 As per Exhibit I, Tab 7, Schedule 10. 6 2 ESL of 40 to 60 years is used for transformers based on the type of transformer; as outlined in Table 3 of Exhibit D1, Tab 2, Schedule 1, page 11. 7 3 ESL of 40 years for all circuit breakers, with exception of oil circuit breakers which has an ESL of 55 years; as outlined in Exhibit D1, Tab 2, Schedule 1, page 19. 8 4 ESL of 20 to 45 years is used for protection systems based on type of technology as outlined in Table 6of Exhibit D1, Tab 2, Schedule 1, page 29. 9 5 ESL of 80 to 100 years is used for steel structures if the structures are not re-coated; as outlined in Exhibit D1, Tab 2, Schedule 1, page 54. 10 6 Consistent with Exhibit I, Tab 7, Schedule 6, Hydro One now uses a condition risk factor ranging from Very Low to Very High risk. 11

Filed: 2014-07-17 2015-2016 Tx Rates Exhibit I Tab 7 Schedule 8 Page 1 of 1
Power Workers' Union (PWU) INTERROGATORY #8 1
2
Interrogatory 3
4
Ref (a): Participant Information Package. Exhibit D1-2-1, Page 11. Figure 7: Demographics of 5
the Transformer Fleet. 6
7
8 9
a) Please provide a table showing the number and corresponding percentage of transformers by 10
age group and voltage class. 11
12
Response 13
14
Please see table below for the transformer demographics in tabular form by voltage class. 15
16
Voltage Class 115 kV 230 kV 345 kV 500 kV Total %
Age Group (years)
1-10 52 73 - 10 135 19% 11-20 10 8 - 3 21 3% 21-30 21 81 2 10 114 16% 31-40 33 76 1 9 119 16% 41-50 40 123 1 10 174 24% > 50 129 30 - - 159 22% Total 285 391 4 42 722 100%
% 39% 54% 1% 6% 100% 17

Filed: 2014-07-17 2015-2016 Tx Rates Exhibit I Tab 7 Schedule 9 Page 1 of 2
Power Workers' Union (PWU) INTERROGATORY #9 1
2
Interrogatory 3
4
Ref (a): EB-2012-0031. Exhibit C1-2-2. Transmission Assets and Sustaining Investment 5
Overview. Page 24, Figure 10: Transformer Forced Outage Frequency and Comparison to CEA. 6
7
8 a) Please update Figure 10 from the reference by including most recent data. 9
10
Response 11
12
a) The figure below contains the most recent Transformer Forced Outage Frequency data and 13
includes a comparison to CEA data. 14

Filed: 2014-07-17 2015-2016 Tx Rates Exhibit I Tab 7 Schedule 9 Page 2 of 2
0
0.05
0.1
0.15
0.2
0.25
2004 2005 2006 2007 2008 2009 2010 2011 2012 2013
Num
ber o
f Out
ages
per
Com
pone
nt Y
ear
Transformer Forced Outage Frequency (2004-2013)
Hydro One CEA 5 Year Moving Average Hydro One 5 Year Moving Average
1

Filed: 2014-07-17 2015-2016 Tx Rates Exhibit I Tab 7 Schedule 10 Page 1 of 1
Power Workers' Union (PWU) INTERROGATORY #10 1
2
Interrogatory 3
4
Ref (a): EB-2012-0031. Exhibit C1-2-2, Page 11. Demographics of Circuit Breakers by 5
Breaker Type. 6
7
8 9
a) Please update the demographics of the circuit breaker by breaker type using the same format 10
of Ref (a). 11
12
Response 13
14
Please see table below for the circuit breaker demographics in tabular form by breaker type. 15
16
Breaker Type
Air Blast Oil SF6 Metalclad Vacuum GIS Total %
Age Group (years)
1 - 10 0 3 744 209 16 34 1006 22% 11 - 20 0 287 265 108 19 14 693 15% 21 - 30 0 72 520 242 6 18 858 19% 31 - 40 67 600 10 149 0 46 872 19% 41 - 50 120 619 0 109 0 0 848 19%
> 50 0 237 0 23 0 0 260 6% Total 187 1818 1539 840 41 112 4537 100%
% 4% 40% 34% 19% 1% 2% 100.0% Note: due to typographical errors in Table 4 in Exhibit D1, Tab 2, Schedule 1, the total numbers in the table above 17 are different in some categories. 18

Filed: 2014-07-17 2015-2016 Tx Rates Exhibit I Tab 7 Schedule 11 Page 1 of 2
Power Workers' Union (PWU) INTERROGATORY #11 1
2
Interrogatory 3
4
Ref (a): Participant Information Package. Exhibit D1-2-1, Pages 16-25.4.1.2, Circuit Breakers. 5
Ref (b): EB-2012-0031. Exhibit C1-2-2, Page 13. Figure 5: Breaker Forced Outage Frequency 6
2007-2011. 7
8
9 10
a) Please provide the demographics of the circuit breaker fleet by breaker type and age group. 11
12
b) Has the trend on forced outages per breaker type as shown in Ref (b) been maintained over 13
the last three years? 14
15

Filed: 2014-07-17 2015-2016 Tx Rates Exhibit I Tab 7 Schedule 11 Page 2 of 2 Response 1
2
a) Please see response Exhibit I, Tab 7, Schedule 10 for demographics of the circuit breaker 3
fleet by breaker type. 4
5
b) An updated performance trend was provided in Exhibit D1, Tab 2, Schedule 1, Figure 15. 6
The trends are generally the same, please refer to table below for the summary for each 7
breaker type. 8
9
Breaker Type Trend AIR BLAST Degrading
OIL Stable SF6 Improving
VACUUM Degrading GIS Improving
METALCLAD Stable 10

Filed: 2014-07-17 2015-2016 Tx Rates Exhibit I Tab 7 Schedule 12 Page 1 of 2
Power Workers' Union (PWU) INTERROGATORY #12 1
2
Interrogatory 3
4
Ref (a): EB-2012-0031. Exhibit C1-2-2, Page 12. Figure 4: Hydro One Circuit Breaker 5
Performance, All Voltages vs. CEA Benchmark. 6
7 8
a) Please update Figure 4 from Ref (a) by including most recent data. 9
10
11
Response 12
13
a) The figure below contains updated Circuit Breaker Forced Outage Frequency data and 14
includes a comparison to CEA data. 15

Filed: 2014-07-17 2015-2016 Tx Rates Exhibit I Tab 7 Schedule 12 Page 2 of 2
0.00
0.01
0.02
0.03
0.04
0.05
0.06
0.07
0.08
0.09
0.10
2004 2005 2006 2007 2008 2009 2010 2011 2012 2013
Num
ber o
f Out
ages
per
Com
pone
nt Y
ear
Circuit Breaker Forced Outage Frequency (2004-2013)
All Hydro One Breakers All Canada CEA Breakers
1

Filed: 2014-07-17 2015-2016 Tx Rates Exhibit I Tab 7 Schedule 13 Page 1 of 2
Power Workers' Union (PWU) INTERROGATORY #13 1
2
Interrogatory 3
4
Ref (a): EB-2012-0031. Exhibit A-13-2, Page 50, Figure 5.9c: All Equipment Direct Forced 5
Outage Frequency Caused by Protection and Control Equipment (2002-2011) 6
7
8 a) Please update Figure 5.9c from Ref (a) by including most recent data. 9

Filed: 2014-07-17 2015-2016 Tx Rates Exhibit I Tab 7 Schedule 13 Page 2 of 2 Response 1
2
a) Figure 5.9c from Ref (a) pooled transmission lines and station equipment together to 3
calculate forced outage frequencies caused by protection and control equipment. In current 4
rate filing, this figure was replaced by Figure 20 in Exhibit D1 Tab 2 Schedule 1 on Page 32. 5
In the updated figure, protection and control equipment caused outage frequencies were split 6
into two categories, one for station equipment and one for transmission lines. Station 7
equipment outage frequency has been normalized by number of components. Transmission 8
lines outage frequency has been normalized by number of terminals. Therefore, the station 9
equipment outage frequency and the transmission line outage frequency cannot be added. 10
Due to the change of methodology Figure 5.9c won’t be updated. 11
Filed: 2014-07-17 2015-2016 Tx Rates Exhibit I Tab 7 Schedule 14 Page 1 of 2
Power Workers' Union (PWU) INTERROGATORY #14 1
2
Interrogatory 3
4
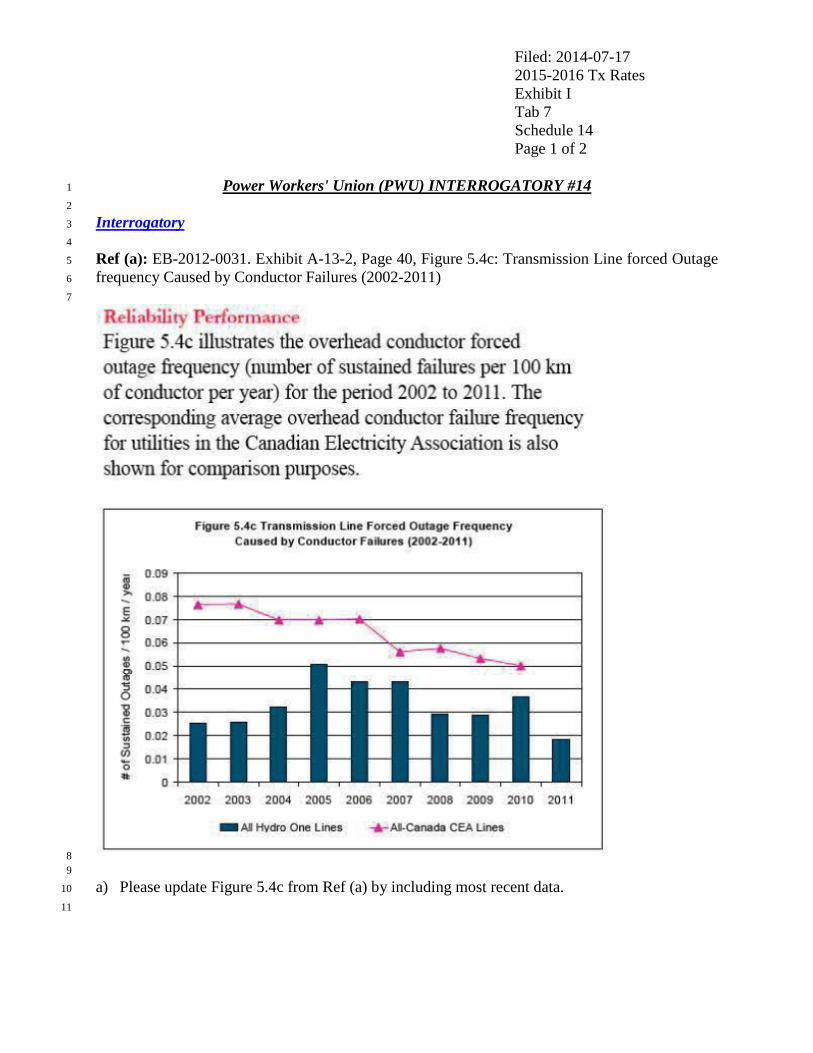
Ref (a): EB-2012-0031. Exhibit A-13-2, Page 40, Figure 5.4c: Transmission Line forced Outage 5
frequency Caused by Conductor Failures (2002-2011) 6
7
8 9
a) Please update Figure 5.4c from Ref (a) by including most recent data. 10
11

Filed: 2014-07-17 2015-2016 Tx Rates Exhibit I Tab 7 Schedule 14 Page 2 of 2
0
0.01
0.02
0.03
0.04
0.05
0.06
0.07
0.08
2004 2005 2006 2007 2008 2009 2010 2011 2012 2013Num
ber o
f Sus
tain
ed O
utag
es p
er 1
00 k
m p
er y
ear
Transmission Line Forced Outage Frequency Caused by Conductor Failures (2004-2013)
All Hydo One Lines All Canada CEA Lines
1
Response 2
3
a) Updated Transmission Line Forced Outage Frequency caused by conductor failures (2004-4
2013) figure is provided below. 5
6

Filed: 2014-07-17 2015-2016 Tx Rates Exhibit I Tab 7 Schedule 15 Page 1 of 1
Power Workers' Union (PWU) INTERROGATORY #15 1
2
Interrogatory 3
4
Ref (a): Participant Information Package. Exhibit D1-2-1, Page 47, Figure 30: Demographics of 5
the Wood Pole Fleet. 6
7
8 9
a) Please provide a table showing the number and corresponding percentage of wood poles by 10
pole type and age group. 11
12
Response 13
Please see table below for wood pole structure demographics in tabular form by circuit voltage. 14
15
Voltage Class <115 kV 115 kV 230 kV Total %
Age Group (years)
1 - 10 6 6,387 1,884 8,277 20% 11 - 20 124 7,044 1,612 8,780 21% 21 - 30 133 4,265 692 5,090 12% 31 - 40 1 3,167 838 4,006 10% 41 - 50 98 3,532 1,440 5,070 12% 51 - 60 283 3,521 460 4,264 10% 61 - 70 83 5,879 558 6,520 16% Total 728 33,795 7,484 42,007 100%
% 2% 80% 18% 100% 16

Filed: 2014-07-17 2015-2016 Tx Rates Exhibit I Tab 7 Schedule 16 Page 1 of 2
Power Workers' Union (PWU) INTERROGATORY #16 1
2
Interrogatory 3
4
Ref (a): EB-2012-0031, Exhibit A-13-2, Page 46, Figure 5.7c: Transmission Line Forced Outage 5
Frequency Caused by Wood Pole Failures (2002-2011) 6
7
8 9
a) Please update Figure 5.7c from Ref (a) by including most recent data. 10
11

Filed: 2014-07-17 2015-2016 Tx Rates Exhibit I Tab 7 Schedule 16 Page 2 of 2
0
0.2
0.4
0.6
0.8
1
1.2
1.4
1.6
1.8
2
2004 2005 2006 2007 2008 2009 2010 2011 2012 2013Num
ber o
f Sus
tain
ed O
utag
es p
er 1
00 k
m p
er y
ear
Transmission Line Forced Outage Frequency Caused by Wood Pole Failures (2004-2013)
All Hydo One Lines All Canada CEA Lines
Response 1
2
a) An updated Transmission Line Forced Outage Frequency Caused by Wood Pole Failure 3
figure is provided. 4
5
6

Filed: 2014-07-17 2015-2016 Tx Rates Exhibit I Tab 7 Schedule 17 Page 1 of 1
Power Workers' Union (PWU) INTERROGATORY #17 1
2
Interrogatory 3
4
Ref (a): Participant Information Package. Exhibit D1-2-1, Page 54, Figure 36: Demographics of 5
Steel Structure Fleet. 6
7 b) Please provide a table showing the number and corresponding percentage of steel structures 8
by age group and voltage class. 9
10
Response 11
Please see table below for the steel structure demographics in tabular form by voltage class. 12 13
Voltage Class <115 kV 115 kV 230 kV 345 kV 500 kV Total %
Age Group (years)
1 - 10 0 203 976 0 725 1,904 4% 11 - 20 0 417 125 0 712 1,254 3% 21 - 30 0 63 1,085 0 3,121 4,269 9% 31 - 40 0 64 2,958 3 2,952 5,977 12% 41 - 50 0 203 5,641 15 2,024 7,883 16% 51 - 60 22 1,551 3,100 0 863 5,536 11% 61 - 70 246 3,259 6,259 0 0 9,764 20% 71 - 80 109 1,907 963 0 0 2,979 6% 81 - 90 0 2,171 4,729 0 0 6,900 14%
91 - 100 530 1,154 2 0 0 1,686 3% 100+ 99 1,733 8 0 0 1,840 4% Total 1,006 12,725 25,846 18 10,397 49,992 100%
% 2% 25% 52% 0% 21% 100% 14

Filed: 2014-07-17 2015-2016 Tx Rates Exhibit I Tab 7 Schedule 18 Page 1 of 2
Power Workers' Union (PWU) INTERROGATORY #18 1
2
Interrogatory 3
4
Ref (a): EB-2012-0031, Exhibit A-13-2, Page 44, Figure 5.6c: Transmission Line Forced Outage 5
Frequency Caused by Steel Structure Failures (2002-2011) 6
7
8 9
a) Please update Figure 5.6c from Ref (a) by including most recent data. 10
11
Response 12
13
a) An updated Transmission Line Forced Outage Frequency Caused by Steel Structure Failure 14
figure is provided. 15

Filed: 2014-07-17 2015-2016 Tx Rates Exhibit I Tab 7 Schedule 18 Page 2 of 2
1
0
0.1
0.2
0.3
0.4
0.5
0.6
2004 2005 2006 2007 2008 2009 2010 2011 2012 2013
Num
ber o
f Sus
tain
ed O
utag
es p
er 1
00 k
m p
er y
ear
Transmission Line Forced Outage Frequency Caused by Steel Structure Failures (2004-2013)
All Hydo One Lines All Canada CEA Lines

Filed: 2014-07-17 2015-2016 Tx Rates Exhibit I Tab 7 Schedule 19 Page 1 of 1
Power Workers' Union (PWU) INTERROGATORY #19 1
2
Interrogatory 3
4
Ref (a): Participant Information Package. Exhibit D1-2-1, Page 62, Figure 42: Demographics of 5
Underground Cables Fleet. 6
7 8
a) Please provide a table showing the length (km) and corresponding percentage of underground 9
transmission cables by age group and voltage class. 10
11
Response 12
13
Please see table below for the underground cable demographics in tabular form by voltage class. 14
Voltage Class
115 kV 230 kV Total %
Age Group (years)
1 - 10 19 20 39 14% 11 - 20 14 0 14 5% 21 - 30 29 16 45 16% 31 - 40 57 25 82 28% 41 - 50 60 0 60 21% 51 - 60 44 0 44 15% 61 - 70 3 0 3 1% Total 226 61 287 100%
% 79% 21% 100% 15

Filed: 2014-07-17 2015-2016 Tx Rates Exhibit I Tab 7 Schedule 20 Page 1 of 2
Power Workers' Union (PWU) INTERROGATORY #20 1
2
Interrogatory 3
4
Ref (a): EB-2012-0031, Exhibit A-13-2, Page 42, Figure 5.5c: Underground Cable Forced 5
Outage Frequency (2002-2011) 6
7
8
9 10
a) Please update Figure 5.5c from Ref (a) by including most recent data. 11
12
Response 13
14
a) An updated Underground Cable Forced Outage Frequency figure is provided. 15

Filed: 2014-07-17 2015-2016 Tx Rates Exhibit I Tab 7 Schedule 20 Page 2 of 2
0.0
1.0
2.0
3.0
4.0
5.0
6.0
7.0
2004 2005 2006 2007 2008 2009 2010 2011 2012 2013
Num
ber o
f Sus
tain
ed O
utag
es p
er 1
00 k
m y
ear
Year
Underground Cable Forced Outage Frequency (2004-2013)
Hydro One 1 Year Cables CEA All Canada 5 Year Cables
1

Filed: 2014-07-17 2015-2016 Tx Rates Exhibit I Tab 7 Schedule 21 Page 1 of 1
Power Workers' Union (PWU) INTERROGATORY #21 1
2
Interrogatory 3
4
Ref (a): Participant Information Package. Exhibit D1-3-1, Sustaining Capital, Page 3, Lines 4-5. 5
6 Investment Summary Documents in support of capital projects with cash flows in excess 7 of $3.0 million in either 2015 or 2016 are filed at Exhibit D2, Tab 2, Schedule 3. 8 9
a) The Participant Information Package does not include Exhibit D2, Tab 2, Schedule 3. Please 10
provide that exhibit. 11
12
Response 13
14
a) Please refer to Exhibit I, Tab 10, Schedule 14. 15

Filed: 2014-07-17 2015-2016 Tx Rates Exhibit I Tab 7 Schedule 22 Page 1 of 1
Power Workers' Union (PWU) INTERROGATORY #22 1
2
Interrogatory 3
4
Ref (a): Participant Information Package. Exhibit D1-3-3, Development Capital, Page 13 of 36, 5
Lines 25-27: 6
7 Funding levels for 2015 and 2016 for Inter-Area Network Transfer Capability projects, 8 along with the spending levels for the bridge and historic years are provided in Table 2 of 9 Appendix A to this exhibit. 10 11
a) The Participant Information Package does not include Appendix A. Please provide that 12
exhibit. 13
14
Response 15
16
a) Please refer to Exhibit I, Tab 10, Schedule 15 (SEC Interrogatory # 15). 17


![[PWU-13-10] [RES-1302] Art Forms and Architecture](https://static.fdocuments.us/doc/165x107/577ccfe31a28ab9e7890d7a4/pwu-13-10-res-1302-art-forms-and-architecture.jpg)


