Power System Restructuring and Deregulation Trading, Performance and Information Technology
499
-
Upload
hareeshmakesu -
Category
Documents
-
view
1.289 -
download
3
Transcript of Power System Restructuring and Deregulation Trading, Performance and Information Technology


Copyright Q 2001 by John Wiley & Sons Ltd Daffins Lane, Chichester, West Sussex, PO 19 IUD, England
National 012.43 779777 Lntmabonal (+44) 1243 779777
e-mail (for orders and customer sewicc enquines): [email protected]
Rzprmted April 2002
Visit our Home Page on http:/h.wiley.co.uk or
http:/lwv.wiley.com
All Rights Reserved. No part of this publication may be reproduced, stored in a rettieval systern, or hdnsmitted, in any form or by my means, etectxonic, niechariical, photocopyng, recording, scmrnng or otheMise, except under the terms of the Copyright Designs and Patents Act 1988 or under the tenns of a licence tssiied by the Copyright Licensing Agency, 90 Totienhirm Court Road, London, WlP 9HE, UK, without the permission in writing of the Publisher, with the exception of any material supplied specifically for the purpose of being entered and executed on a computer system, for exclusive use by the purchaser of the publication.
Neither the nuthors nor John Wiley & Sons Ltd accept any responsibility OT liability for loss or damage occasioned to any person or property though using the material, instructions, methods or ideas contained herein, or acting or r&iuning from acting as a result of such use. The authors and Publisher expressly disclaim all implied warranties, including merchantability of fitness for any particular purpose.
Designations used by companies to distinguish theu products arc often claimed as aadetnarks. In all instances where John Wiley & Sons is aware of a claim, the product names appear in initial capital 01
capital letters, Readers, however, should contact the appropriate companies for more complete information regarding trademarks and registration.
Other W h y Editorial Ofices
John Wiley & Sons, Inc ,605 Thwd Avenue, New York, NY 10158-0U12, USA
Wiley-VCH Verlag GmbH Pappelalloe 3, D-69469 Weinheim, G m y
Jacdranda Wiley Ltd, 33 Park Road, Milton, Queensland 4064, Australia
John Wiley & Sons (Canada} Ltd, 22 Worcester Road Rexdale, Ontario, M9W lLI, Canadta
John Wiley & Sons (Am) Pte Ltd, 2 Clement1 Loop #02-01, Jin Xing Distnpark, Singapore 129809
Libraq of Congress C a t a l o ~ t n g - i ~ ~ u b l i ~ ~ o n &&U
Power system reshvctunng and daegulatian: trading, perfomance. and inlomrion technology/ edited by L.L. h i .
p. em
Includes bibliograpliical rsfemces and index. fS%N 0 471 49500 X 1. BIcciriml power systems - Control. 2. Electric utilities - Cost control. 3. Elcch’ic
Utilities ~ Deregulation. 4. Elecmc utilities . Technological innovation% 1. Lai, h i Lei
TK1007. P68.2001 333.793’2- dc21 200 1045404
British Libraty C Q t a l o ~ u ~ ~ g in Pu~li~aCion Dafa
A catalogue record for this book is avatlahle from the Bntish Library
TSBN 0 47149500 X
Produced from Word files supplied by the Editor Pnnted and bound in Great Britam by Antony Rowe Ltd , Chippenham, Wtlts This hwk is pnnted on acid-free paper responsibly manufactured from sustainable forestry, in which at least two trees arc planted for each onc used for paper production

............................................................................................................................. xv
reface ............................................................................................................................... 5
e~~~ ............................................................................................................ xxi
................................................................................................................. ent ..........................................................
............. 1 1.2 Competitive Market for Generation ............. .................................................. 2
1.3 1.4
The Advantages of Competitive Generation .................................................. The Role of the Existing Power lndustry .............
Electricity Demand Operation and Reliability ............................................. 1.5.1 Power Plant Operation .................................. 1.5.2 Reliability Assessment ...................................................... 7
....................... 4 1.4.1 Reconfiguring the Electricity System . ............................................ 1.4.2 Trends in Conventional Electricity G
1.5
1.5.3 Availability of Fuel .......................................
s ...........................................
1,6.5 Solar .....................................................
.................................................................... 17 1.9.1 Capital Costs for New Plants ........................
..............................
................................................. 25
1 . 10.4
1.11.1 Introduction ..........
Coimectioii and Use of System Charges .

vi Contents
1 . I J . 2 Circuit Connection and P 1.11.3 Performance Analysis ..... 1.11.4 Solution Technique ......... 1.1 1.5 1.1 1.6 S i ~ p l i ~ e d Phase-balanci
Case Study 2: Controlling a S
Results and Discussion ...........................
1 . 1 1.7 Appendix ......................... ..................................................... 1 . 12
1.12.1 1.12.2 The Solar Power Plant .................................................................................. 38 1 . 12.3 Control Structure of the Plant ....... ................................ 1 A2.4 CA Formulation ............................................................................................ 40 1 .1 2.5 Experimental Results ........... .................................................................. 42
1 . I3 Conclusions ........................................................................ 1 . 14 References ...... ............................................................... ......................... 46
l a ~ ~ o n of E ~ ~ c ~ ~ i c ~ ~ ~ ~ i t ~ e s .................................................................................... 2.1 Introduction ............................ .......................... 50 2.2 Traditional Central Utility MO 2.3 Reform Motivations ...................... ................... 2.4 Separation of Ownership and
2.4.1 Central Dispatch Versus 2.5 Competition and Direct Access in the Electricity Market .................................... 54
2.5.1 Competition in the Energy Market ..... .............................................. 54 2.5.2 2.5.3 Direct A c c e s s ~ ~ e e ~ ~ ~ ~ ..
Competition and Auction Mechanism .....................................
2.6 Independent System Operator .............................................................................. 60 2.6. I Pricing and Market Clearing .................... 61
2.7 Retail Electric Providers., . ............................................................ 63 2.8 Different Experiences ........................................................
2.8.1 England and Wales .......... ........................................................ 64 2.8.2 Norway ................... 2.8.3 California ................ ........................................ 71 2.8.4 Scotland ..................................................................... 2.8.5 New Zealand ........... ........................................ 72 2.8.6 The European Union and Gennany .............................................................. 73
2.9 ...................................... ............................. 74
3 CO a ~ ~ e ~ ~ ................................................................. 76 3.1 Introdtiction ................................................................. .................................. 76 3.2 The Independent System Operator ................... ............................................. 79 3.3 Wholesale Electricity Market Characteristics ............ .................... 80
3.3.1 Small Test System ............ .......................................... 81 ............................................... .................... 82
2.6.2 Risk Taking .............
3.3.2

Contents vii
3.3.3 Bidding ..................................................................... ........................... 83 3.3.4 Market Clearing and Pricing ........ ............................................ 3.3.5 Market Timing ...........................................
Sequential and Simultaneous Markets ............................................... 3.3.7 Bilateral Trading ............................................... .............................. 89 3.3.8 Scheduling ..................
3.3.6
3.3.1 1 Physical and Financial Markets ......................................
.................................................... 97
stem Capacity ..........................................................................
3.5.4 Technical 'Issues ......................................................................
4.2. I Competition in Supply ..
4.2.4
4.2.6
4.2.8 Competition in Metering ..........................
4.3 Maintaining Distribution Planning ...................
Key Issues €or Distribution Businesses ..................
Use of System Billing .................................................
4.3.5 Network Planning Tools ............................................................................. 124 4.3.6 Asset Replacement Planning ................... . 125 4.3.7 Risk Assessment ......................................................................................... 125 4.3.8 Skills and Resources ................................. .......... 125 4.3.9 Neiwork Design ....... ............................................................................. 126 4.3.10 ~ i s ~ ~ ~ u t i on Automation .......................................................

Contents viii
4.3.1 1 Automation Case Study . Remote Control in London Electricity ............. 129 4.4 Future Devclopmeiit .............................. 4.5 Appendix: Distribution Automation i
4.5. I Introduction ................................ 4.5.2 Remote Terminal Units .................................................. 4.5.3 SCADA Master Station . ....................................................................... 134
4.5.5 Operations and Maintenance (O&M) ......................................................... 136
4.5.4 S o h a r e Functionality .................................... .... 136
4.5.6 System Integration, Design and Management ................... ............... 137 4S.l Coi~~inunication Systems . ............................................................ 140
4.6 References ...............................................................
.................................................... 1 5.1 Introduction ........................................................................................................ 153 5.2 Role of the TP ....... ................................................. 155
5.2.1 5.2.2 5.2.3
5.3.1 5.3.2 Priority Insurance Scheme ........................................................
5.3 New Market Organisation .
5.3.3 Transmission Expansion ........................... 169 5.4 Conclusions ........................................................................................................ 170 5.5 References .............................................. .................... 171
pen Access ........................................................... ...*..........= ........ ........ 17 6.1 Introduction ....................................................................
6.1.1 The Traditional Power Industry 6.1.2 Motivations for Restructuring the Power Industry .. 6.1.3 Unbundling Cencration, Transmission and Distribution ........................... 174
6.2 Components of Restructured Systems ........................................ ...... 175 6.2.1 Gencos ................................. ............ ..................................... 175 6.2.2 BOT Plant Operators and Contracted IPPs .. 175 6.2.3 Discos and Retailers ..................................................... 175 6.2.4 6.2.5 Independent System .................................................... 176 6.2.4 Power Exchange (P 6.2.7 .................................................... 176
6.3.1 .................................... 176
6.3.3 IS0 Functions and Responsibil~ties ........... ..................................... 178
6.4 Trading A~angements ................................ .......................... 183
6.3 PX and ISO: Functio
6.3.2 California Power Exchange ...........................................
6.3.4 Classification of IS0 types .....................................................

6.4. I 6.4.2 6.4.3
6.5.1 6.5.2 6.5.3 6.5.4 6.5.5
6.6.1 6.6.2 6.6.3 6.6.4
6.7.1 6.7.2 6.7.3 6.7.4 6.7.5
6.8.1 6.8.2 6.5.3 6.8.4 6.8.5
6.5
6.6
6.7
6.8
6.9 6.10 6.1 1 6.22
The Pool ....................... ......................................... .......................... 184
ulti 1 at era1 Trades ......... T r ~ s ~ i s s i o n Pricing in .......................... 186
olled-in Pricing Methods .............. ......................... 187
System Control ............... hicillary Sewice Provision. ............................................
Congestion ~ a n a g e ~ e n t ii? Open-access Transmissioo Systems ...................... 195 Congestion Management in Nomial Operation.. ........ Integrated Transmission patch Strategy ................ ~~~ust ra~ io i i Using a Sma Sfatic Security-constrained Rescheduling ...................................... 202
wer System ........................
Dynamic Secmity-constrained Rescheduling .................
Price Elasticity as a Me Relieving ~ongestion ~oord ina~~on betwce ~l~ustrat~on o€ Traii~action Coordiiiatioii ...... ~ n t e ~ r ~ t e d Coordinati
Open-access ~oordi~iatioii Strategies ..... ........................... 209
Conclusions .......................... ............................................................................. 2 16
...... 216 .................................................................................... 217
a ............................................ *.** a***...
7.1 7.2 Development of Electric Power Industry
S ~ c c e ~ ~ ~ v e Growth of Power Produ Further Expansion of Power Nehvo Continuo~I~ increase of Electricity C
7.2.1 1.2.2 7.2.3
7.3 ~ a n a ~ e i n e ~ ~ System of Electric 7.3.1 The State Power Corporation ......... .................. 225
hilosophy aiid Strategy o f tlie SP ............................................................. 23 1 7.3.2
7.4. I ~ o ~ i v a t i o ~ s for Reformation ...................................................................... 234 7.4.2 efonn PLaii of t i le SP ........ 235
7 '4 Market in China.. .

x Contents
7.4.3
7.5.1 7.5.2 7.5.3
7.6. I 7.6.2 7.6.3 7.6.4
7.5
7.6
7.7 7.8 7.9
Obstacles in Establishing the Power Market in China Electricity Pricing ..... .. ..... . . .. .. .... . .. . .... . . .. .. .... . .. ... . . . . ..
Basic Theory of Predicting Electricity Costs .. Electricity Cost Derivation.. ...... .. .. . .... .... . .... . . . . Elcctricity Pricing of Inter-provincial Power
Traiismission pricing ... .. . . . . . . , . . . . , . . . . . . . . . . . . . . . . . . . . . . . , . , , . Current Decomposition Axioms ~athematical Models . , .. . . . . . . . . . . . . . . . . . . . . . . . . . . . . . . . . Methodology of Graph The0 ry..... Algorithms and Case Studies ............................ .... ...... 253
................................... '......'.....~..,.. 252
......................................... ......................... ~ 254 Acknowledgenients . . . . . . . . . . . . . . . ...............
8.1.1
8.2.1 System Stability ....................................
Benefits of FACTS Technology ....................... 8.2 Transmission System Limitations .... . .. .
s..............._... 261 8.2.4 Thermal Limits ......
8.3 FACTS TeGhnology ............. .......................................................... 262
Control Methods and DSPiMicroprocessor Technology ........................... 264 8.3.2 8.3.3 Present Status on FACTS
8.4.1 Fundamental Concepts of 8.4.2 Skuiit Controllers.. ............................................................................. 266 8.4.3 Series Controllers ............. ..................................... 8.4.4 8.4.5 Phase Angle Controllers .................... 8.4.6 8.4.7
8.5.1 85.2 8.5.3 8.5.4 UPFC ~ ..................................
Concluding Remarks .. . .. .. Ackaowledgements . . . . . . . . . . . . . . . . . . . . . . . . . . .
8.4 Solution Options with FACTS ............
Combined ScriedShuiit Controllers . .. , . ... .. .. ... . ,. . . . .. . ...... .
HVDC Transmission Controllers ............................................................... 278 Other Controllers ........." .. . . .... . .. . .
8.5 ........................ ' ........ 281
8.6 8.7 8.8 .........l............................ .... "_........_._. ~ ..... 284
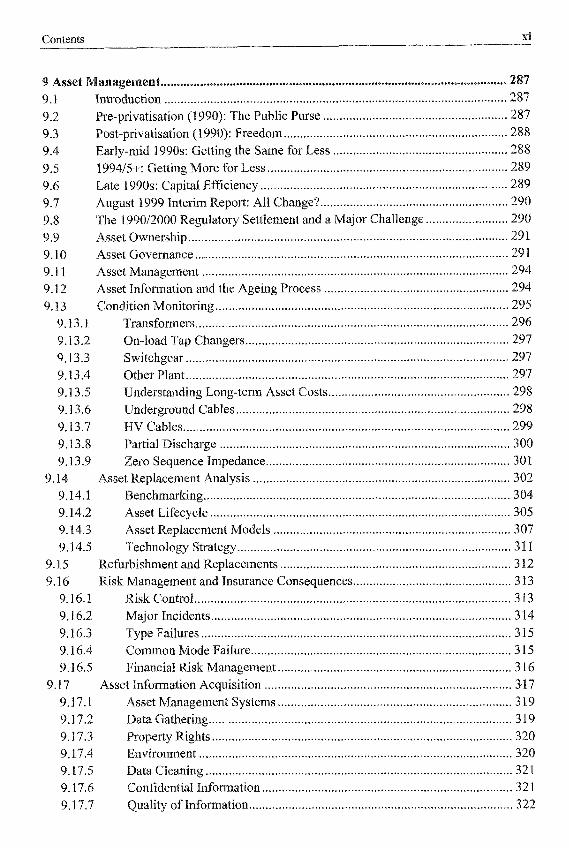
Contents Xi
anagenment ......................................................................................................... ............................................................... 287
9.2 Pre-privatisation (1 990): Th 9.3 Post-privatisation (1990): F 9.4 Early-inid 1990s: Getting t
9.6 Late 1990s: Capital Effici 9.7 9.8 The 1990/2000 Regulato
9.10 Asset Governance. 9.11 Asset Management ...................................... 9.12 Asset Information and t 9. I3 Condition Monitoring ..................................
9.13.1 Transforniers .....
9.13.3 Switchgear ..
9.5 1994/5+: Getting More for Less .................... ....................... 289
August 1999 Interim Report: All Change? ....
9.9 Asset Ownership .............................
...............
9.1 3.5 ~nders~a i id in~ Long-term Asset Costs ......................................... 298 9.13.6 Underground Cables ..................................................... 9.13.7 HV Cables .................... .............................
9.13.9 Zero Sequence Impedance
...................
...............
9.16.4 Common Mode Failure ..................
9.1 7 Asset Infoimation Acquisition ...........
9.17.5 Data Cleaning ...........................................

Contcnts -- I-
Xi i
9.18 Conclusions .......................................... ........................ .322 Appendix: Fuzzy DGA for Diagnosis of Multiple Incipient Faults ................... 323 9.19
9.19.1 The IEC DGA Codes ...... .........................................
9. i 9.3 Fuzzy C)iagnosis Results ... ............................. 9.19.4 Trend Analysis of Individual Faults .... ........................................ 327
9.19.2 The Fuzzy IEC Code -
9.1 9.5 Comments ........................... ............................. 9.20 Refesences .
y .............................................................................................................. .....................................................................................
10.1.1 A General Overview .................................... 10.1.2 PQIS
10.2.1 The Wavelet Transform. ........................................... 336 10.2.2 Wavelet Analysis ..................................................... 102.3 Application to PQ [25] . ..................................... 339
........................................... 342
10.3.4 ~ p c s i o ~ i c Distortion
10.6 ~ ~ f ~ r c ~ c e s
........................................................ 353 11.2 S o h a r e Agents .....................................
11.2.2 Genesal Issues and the Future of Agents.
.................................... 362
.4
11.4.2 EP.. ................................... .............................................. 373
Evolutionasy Programming-based Optimal Power Flow Algorithln ..............................
11.4.4 Load flow Solution .......... 11.4.5 Gradient Acceleration ........................................................
........................... 379

'.* Contents U
11.5 Complex Artificial Neural Networks for Load Flow Analysis ..... 11.5.1 1 I .5.2 11.5.3 11 3.4 Applicati
1 1.6.1
Conventional A" for Real Numbers .. New ANN for Complex Numbers ......... Comparison of the two ANNs by Coinputer Sirnulatiou ........................... 388
1 1.6 Virtual Reali Types of' VR systems ...................
1 1.6.2 Non-immersive (Desktop) Systems. ............................................. 396
11.6.6 Cave ....................................................
1 1.6.8 Augmented ...............................
11.7.1 The Hardware ................. ................................................................... 401 11.7.2 The Correspondence ......................................
X 1.7.4 Iinp~eiiientation Example ........................ 11.8 Coiiclusioris ........................... 11.9 Acknowledgements ..
.................
12.2 The Internet ................................ ...................... 12.2.1 What Is the Internet? .................................................................................. 416 12.2.2 oes the Internet Work .... ............ 417 12.2.3 What Would Happm Without the Intcrnet? ............................................... 417 12.2.4 Wow Can the Power lndustry Benefit from the Internet?. 12.2.5 ow Can I Find the Inromiation I Need? .................................................. 419
12.3.1 12.3.2 12.3.3 Internet Products .......... 12.3.4 12.3.5 iltimedia Access .............. 12.3.6
12.3~8
12.3 Usability of the Interne
0x1-line Setvices ......................................................................................... 42 I
The Power Industry and the liitemet .......................................................... 422 12.3.7 Support for Professionals ........... 422
12.3.9 Recent Improvements on the Inteilnet ....... 424
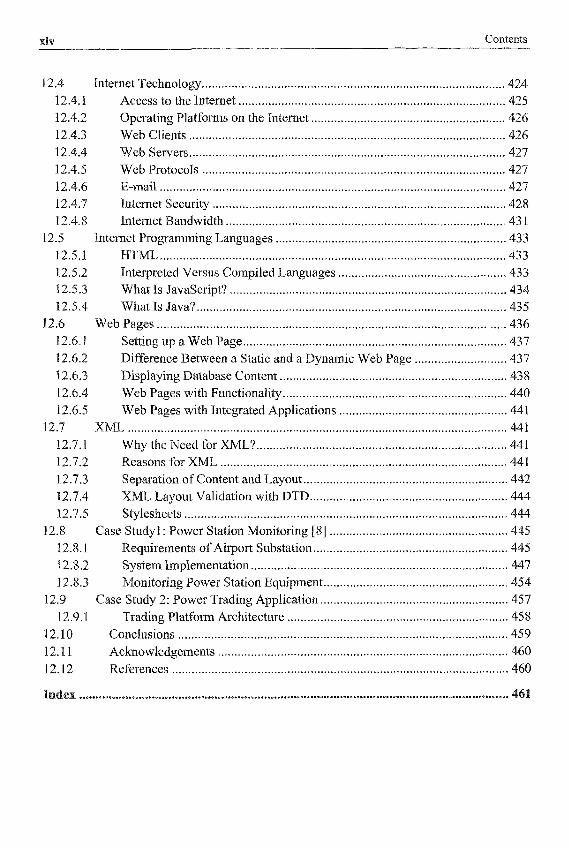
xiv Contents
12.4 Internct Technology ............. .... ....... ................. 424 12.4.1 12.4.2
Access to the Internet ................................................................................. 425 Operating Platforms on the Internet ..
12.4.7 Internet Sccurity ......................
...................... 433
Interpreled Versus Compiled Iaiguages .... 12.5.3 What Is JavaScript? .................................................................................... 434 12.5.4 What Is Java? .............. .......... ........ ........ 435
12.6 Web Pages. ................................................ 436 12.6.1 .. 437 12.6.2 Difference Between a Static and a Dynamic Web Page ............................ 437
12.6.4 Web Pages with Fuuctionality .................................................................... 440 12.6.5
12.7.1
12.6.3 Displayiiig Database Content ................................... 43 8
Web Pages with Integrated Applications ......
Why the Need for XML
ation of Content and I .ayout.. Layout Validation with DTD ..............................
....................
12.75 Styleshects ....... ..................... 445
12.8.3
12.9.1
Monitoring Power Station Equipment ........................................................ 454
Trading Platform Architecture ................................................................... 458 12.5) Case Study 2: Power Trading Application .... .457
12.10 Conclusions ................................
12.12 Refercnces .................... 12.11 Acknowlc~~ements ...... ................................................................... 460
ex ..................................................................................................................................

The electricity power utilities in many countries have been, or are being, rest~c~ured. There are many reasons for restructur~ng, In some countries restruc~uring has been driven by the desire of gove~ment to meet ~ncreasing demands for electricity by encouraging independent power production, which relieves government of a financial obligat~on. In countries where ownership of assets is in private hands, restructuring has been driven by mergers and ac~Liisi~ion~, as companies seek to gain competiti~e advantage.
In the most a ~ v a n c ~ countries, restruciuring is being driven by the desire to allow consu~ers to choose their electricity supplier on the basis of price and service provided~ These drarna~~c changes in the organisation of electricity power utilities bring with them new challenges and opportunities, as the previous centrally designed and operated systems are di~mantled and replace by a new competitive framework.
~ o m p a n i ~ s operating in a competitive market need more so~~~ is t i ca~ed control and management systems to ensure that their business objectives can be achieved. The development and application of new technologies is also accelerated in this new environmen~~ as companies seek to improve their effecliveness and efficiency.
This book is con~ributed by a group of world authorities. It explains in depth the reason ring, without including superfluous detail. Examples are given from tails are provide^ on new s~rate~ie$ and tec~nologie~ which are being f ~ e ~ ~ e ~ a t i o n ~ ~ransmission and supply. The implications for the ~ n v i r o n ~ e ~ ~
are also reviewed. Tools being ~ t i ~ ~ s ~ for asset an age men^ and fo management of ~nfrastruc~ur~ are i~l~strated with practical examples. mode~l in~ and general analysis of ~ompet i~~ve power markets are also illus
This book provides a com~rehensive review of all the many facers place in a dyna~ ic ~ ~ d u s ~ y . Xt i s co~pu~sory reading for graduates and e n g i ~ e ~ ~ s , and other pro~essiona~s, who are entering or involved in the electricity power industry.
avid G. Jefferies CBE, B;


This book was written as a result of the ongoing stimulating worldwide dere of the power industry. This move away from the ~aditional mo
towards greater competition, in the form of increased numbers of indepe producers and an u ~ b u ~ ~ ~ ~ n ~ of the main service, starred in the United King and this change was driven by the large differences in electricity tariffs across regions, by adva~icemen~s in technologies which &low small producers to co~pe te with large ones, and by a strong belief that competition will produce an all-win situat~on.
The book was contributed by an ititernat~ona~ group of experts to produce a broad and of the main issues. The intent has been to provide the reader with an in
ut without excessive specialisation, to avoid a purely ~ualitative trea~meIi~ by ~ ~ ~ ~ l ~ d ~ ~ ~ some a ~ a ~ y ~ c a ~ and numerical methods, and to offer9 whenever possible, real case studies, worked examples and project discussions.
Since each power utility is unique, it will not be possible to present the best path to fotlow in the restructuring exercise. The market models, regulation and tariffs used by
orks, and the r r ~ e c h ~ ~ ~ s m for ~ ~ i n t a ~ ~ ~ n g a high level of r e ~ ~ a ~ ~ ~ i ~ y , will use of the advancement of communications technology and increased
etail epth
compu~ii i~ power, i t is possible to consider different market structures. a d v ~ n c ~ ~ e n t ~ no ~ n f ~ ~ a ~ ~ o n could be availabtbte in time for the business o ~ ~ r a t ~ ~ n .
Different markets have been considered in the book. In brief, they could be §u~mar~sed types. In the complete1 ~ar~et-dr iven env~~onment rket ~orces seek to the b e h a v i ~ ~ r of various layers in the market, e.g. the regulators. In the kransiti 1 markec there is a process o
r ~ ~ u i a t ~ d env i ron~~n t to a d ~ r e g u l a ~ e ~ ~nvironment. In the embry~nic free m a ~ ~ e ~ , state retains own~rship of the generators and some of the ~ a n s ~ ~ s s i o n infrast~uct~re, opens up the market to ~ ~ m ~ ~ e d competition at the distribution level.
As there is much u i i c e ~ ~ n t y in these environments, due to the s t ~ c t ~ r e of the t
E long-term planning, it is likely that the electricity power industry would be at great risk, as it ~~~$~~ not be able to supply the growing d ~ ~ n ~ ~ or to ~~~~a~~ the service as it is c ~ r r e ~ t l y providing to its consu~ers. The recent chaos in
his could have very serious con~~quences to the lon ~ n d u s ~ ~ .
This book shows how new ~ e c ~ i n o ~ o ~ y will allow us to cha market structure to one that relies on co~~petition to set the tec~~o~og ies , we can use less energy, result in^ in lower ene avoid OX defer addi~~ona~ expensive plant c o n ~ ~ r ~ ~ ~ ~ o ~ . The a ~ d ~ ~ ~ o ~ OF new p ~ ~ ~ ~ ~ a ~ ~ ~ s , such as independent power producers, power marketers and brokers, has a~ded a new
task of maintai~ing a reliab~e electric system. This book will detail into accou$it some of these issues.
p i ~ n i n g over a long-term horizon is perce iv~ as very difficult at present. Yet,
In the new market e n v ~ r o n ~ ~ ~ ~ ~ ~ , generation represents most of the CO
r e p o ~ ~ on the deve~opment of new strategies and compares ~ ~ f f e ~ e n t tec e le~ t r~c i~y ~ e n e r a ~ i o ~ with ~ n v i r o n m ~ n ~ ~ and political considerat~ons. This i ~ c i ~ d e s

xviii Preface
decen~a~ised power supplies, renewables, regulatory constraints, new technical challenges ifferent mechanisms, such as the pool, have been set up for the operation
of the new emerging electrical market. The market should dictate when new generation is needed and where it is located.
type of bidding, or negotiation strategies that each player can use. It is especially ~ ~ p o ~ a n t to work out the information content of the bidding strategies. Chapter 2 covers expe~ence from various countries on power utility res~ctur ing and deregulation. An~lyt~cal tools for the ~ o d e l ~ i n g and analysis of c o m ~ t ~ t i v e power markets are presented. Chapter 3 also discusses several wholesale electricity markets around the world and most of these are in a continuous process of change. This evolutionary process is being d~veK~ by the need to address some of the outs~anding issues in the design and implementation of these markets. Some challenges, such as reliability, market power evaluation and mitigation, are outlined.
Various issues such as planning, control, load forecasting, metering, customer services and risk assess men^ have been considered. A case study on the remote control of London ~ l ~ ~ r i c ~ l y is included,
Chapter 5 deals with transmission expansion. Following develop men^ of the market, the transmission provider transforms into the independent transmission company (TTG) so as to adnilmir a highly sophisticated market. The ITC is required to make c~mplex business
5 over a wide range of time scales, such as the long-term, short-term and near real- is chapter discusses future directions and ~od i~ca t ions to the ~ g u l a ~ o r y policies
r. ssion open access. The
ince there i s a large number of players in the m ~ k ~ t , it i s i m p o ~ n t to WO
hapter 4 reports on the change in ~~s~nbutio13 business in a dere~ula~e
0th a market maker and a service economic issues associaked with scussion of some ~rnpor~an~ opera~oiia~ issues in the e ~ e r g ~ n
mal dispatch, congestion mana~ement and the e ~ f e c ~ of ~ e c ~ i n en discussed with examples from the open-access viewpo~nt.
Chapt~r 7 deals with the Chinese market. A industry is given. It also explains why the approaches a opted by the d e v ~ ~ o p are not suitable. The chapter also proposes a new app ch to c a l c u ~ ~ ~ ~ trans To operate the ever i transmission loss m
tailed back~round on the
power systems with better e f ~ c i ~ n c y , an ac~urate
ironment, reactive power control to assure v o ~ ~ ~ ~ e Row control to avoid line overloading
op~ra t io~ . Flexi ctronics technology presents the applica ms. The impact of
entrants is discussed. Chap~er 9 deals with asset management. A comprehensive awe
required to support business in the deregulated e ~ e c ~ i ~ i ~ y market. characteristics 06 the model components are descdbcd in detail. It wit1 benefit all internal and external users in the open-access environ~ent, resulting in realistic and traflspa~ent open-access charges, and bring long-term ecoi~omic benefits to all pa
anagemene in power industry r e s ~ ~ ~ c t u n n ~ tire i ~ ~ u ~ ~ a t e d with practical e x ~ ~ p l ~ s .
Preface xix
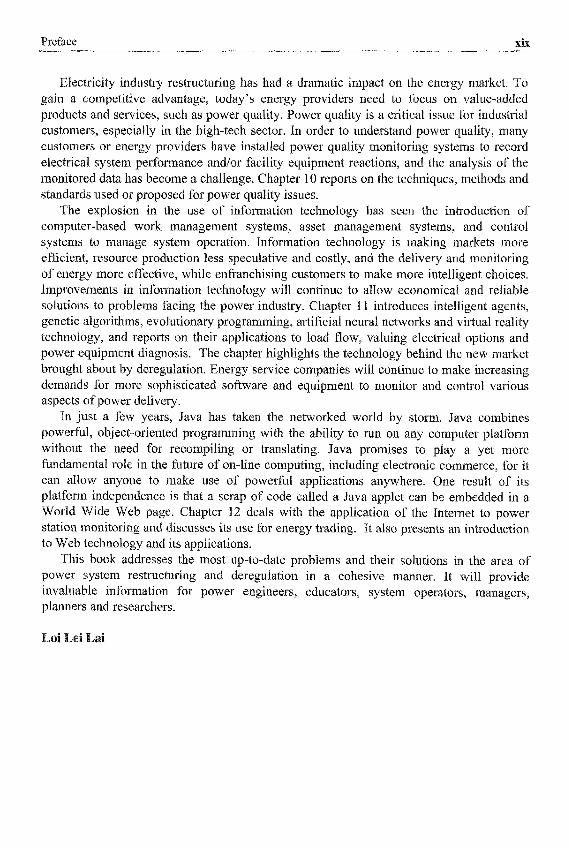
Elechicity industry restructuring has had a dramatic impact on the energy market. To gain a conipetitive advantage, toclay’s energy providers need to focus on value-aclded products and services, such as power quality. Powcr quality is a critical issue for industrial customers, especially in the high-tech sector. In order to understand power quality, many customers or energy providers have installed power quality monitoring systems to record electrical system perfo~iance andor facility equipmcnt reactions, and the analysis of the monitored data has become a challenge. Chapter 10 reports on the techniques, methods and standards used or proposed for power quality issues.
The explosion in thc use of information technology has seen the introduction of computer-based work management systems, asset management systems, and control systems to manage system operation. Information teclinology is rnalcing markets more efficient, resource production less speculative and costly, and the delivery and monitoring of energy more etficctive, while enfi-anchising customers to make more intelligent choices. Improvements in infomation technology will continue to allow economical aiid reliable solutions to problems facing tlie power industry. Chapter 11 introduces intelligent agents, genetic algorithms, evolutionary programming, artificial neural networks and virtual reality technology, and reports on their applications to load flow, valuing electrical options and power equipment diagnosis. Tlic chapter highlights the technology behind the new market brought about by deregulation. Energy service companies will continue to make iucreasing demands for more sophisticated software and equipment to monitor and control various aspects of power delivery.
In just a few years, Java has taken the networked world by storm. Java comnbiries powerful, object-oriented programming with the ability to run on any computer platform without the need for recompiling or translating. Java promises to play a yet more kndaiental role in the future of on-line computing, including electronic commerce, for it can allow anyone to make use of powerful applications anywhere. One result of its platform iI~~lepe~idence i s that a scrap of code called a Java applet can be embedded in a World Wide Web page. Chapter 12 deals with the application of the Intcmet to power station monitoring and discusses its use for energy trading. It also presents an introduction to Web technology and i ts applications.
This book addresses the most up-to-date problems and their solutions in the arm of power system restructuring aid deregulation in a cohesive manner. It will provide invaluable information for power engineers, educators, system operators, managers, planners and researchers.
i


The editor wishes to thank Mr Peter Mitchell of Wiley and his team in supporting this project.
The editor also wishes to thank all the contributors, without whose siipport this book could not have been coiiipleted. In particular, the editor thanks Harald Brawn in maiiagiiig to complete the man~~scr ip~ despite great diffkulties caused by software ~iico~patibility. The editor also wishes to thank rs Vinay Sood and Professor Sood for their creation of the iuitial manuscript. The editor i s very grateful to Dr D a d Jefferies for writing the ~o r$w(? r~ . The permission to reproduce copyright materials by the IEEE and IEE for a number of papers mentioned in some of the chapters i s most helpful. The arrange~ent o f the index by Miss Qi Ling Eai and Chun Sing Lai is imch appreciated.
Last but not least, we all thank Wiley for supporting the prcparat~~n oftbis book and for the extremely pleasant co-operation.


ei Eai was appointed Senior Lecturer at Staffordshire Polytechnic (now Staffordshire University) in 1984. From 1986 to 1987, he was a Royal Academy of Engineering Industrial Fellow to both GEC Alsthom Turbine Generators Ltd and its Engineering Research Ceutre. He is currently Head of Energy Systems Croup and Reader in Electrical Engineering at City University, London. He is also an I-lonorary Professor at the North China Electric Power University, Beijing. Dr Lai is a Senior Member of the IEEE and a Corporate Member ofthe TEE. We has authoredlco-authored over 100 technical papers. Tn 1998, lie also wrote a book entitled Ivrtelligenf System Applications in Power Engineering - Evolutionary P r o ~ a ~ m i n ~ and Neural Networks published by Wiley. Recently, he was awarded the IEEE Third Milleiiiiium Medal and 2000 IEEE Power Engineering Society UKRl Chapter Outstanding Engineer Award. In 1995, he received a high-quality paper prize from the International Association of Desalination, USA. Among his professional activities are his contributions to the organisation of several ~nternat~ona~ conferences in power engineering and evolutionary computing, and be was the Conference Chairman of the International Conference on Power Utility Dercgulation, ~ e s ~ c ~ f l n g and Power Technologies 2000. Recently, he was invited by the Hong Kong Institution of Engineers to be the Chairman of an Accreditation Visit fo accredit the University (IIons) degree in electrical engineering. Dr Lai is also Student Recruitment Officer, IEEE UI(R1 Section. In 1999, he was included in The Dictionury of Contemporary Celebrities qf Worldwide Chinese. In 2000, his biography was included in the 18th Edition of J%zo ’5 !4%0 in the FVorld, Marquis, 1JSA. His b i ~ ~ g r a ~ ~ y has also been selected €or inclusion in the 2001 Who I;yho in Science and Engineering, Marquis, USA.
Sc, PhD and DSc from UEUIIST, ~anches~er , IJK. of the Royal Society of New Zealand. From 19’70
to 1975, he was Head ofthe Power Systems and High Voltage Groups, UMIST. From 1975 to 1999 he was Professor of Electrical Engineering, University of Canterbury, ~ h i ~ s t c ~ ~ u r c h , New Zealand. From 1982 to 1995, he was also the Director of Systems Software & Instrumentation (a Christchurch-based consulting conipany established in 1982). From 1985 to 1990, hc was Head of Department, Electrical and Electronic ~ n g ~ n e e r i ~ ~ ~ , University of Canterbury. From 1988 to 1995, he was a ~ e i n b ~ r of the CIGRE-I4 Working Group on HVdc harmonics (14-03). From 1989 to 19525, he was Convenor of GIGRE Task Force 36-05114-03-03 on AC System Harmonic ~ o d e l ~ i n g for AC Filter Design. From 1990 to 1996, he was a Member of CIGRE JWG 11/14-09 on Unit Connection. From 1996 to 1999, he was Convenor of CIGRE Task Force 14.25 on Wannonic Cross-inodulation in HVdc Traiisniission. Since 1990 and 1995 respectively, he has been Dircctor of CHART Instniments, Clx-istchurch and Director o Consulting, a Christchurch-based consulting conipany. Professor Arrillaga h many awards, such as John Hopkins Premium of the IEE, UM, 1975; the Premium, IEEE Conference on Harmonics and Quality of Power, ~ ~ ~ Q P 9 Electrotechnical Paper, IPENZ Annual Conference, 1996; Uno Lamm Hig Current Award, IEEE, 199’7; John Munganest International Power Quali Power Industry, 199’7; President’s (Gold Medal) Award, Annual Meeting
xxiii

XXIV ~ o g r a ~ h y
~otechn~cal paper, I P ~ ~ ~ Annual ~onferen~e, 1999; Silver a1 S o c i e ~ €or Innovatio~ in S~ience and ~ e c h n Q ~ o ~ y , 2
~echn iea~ Committees Award, 2000,
trained in the area of ~ o ~ e r e~ec~ronics with ~emen$, ~ r a n k f u ~ , Germany, from 1985 to 1989. He obtained his Diploma in ~e~ecom~unicat ion at F r i e d ~ ~ r ~ - ~ ~ e s s e n University, G ~ ~ a n y , in 1994. He was a ~ a ~ - t i m e lec~ re r at City
~ e a c ~ i n ~ o b j ~ c ~ - ~ r i e n t ~ d ~ r o g ~ a ~ r n i ~ ~ in C++. EST I n t ~ ~ a t i o n a ~ Etd, ~ o ~ ~ o n , from 1996 to
A L T I ~ , London, deve~op~ng new at City ~ n i v e r s i ~ on a p a ~ - ~ i m e
arch interest is the e~traction of
~ ~ ~ ~ r s i t y , ~ Q n ~ o n , from 1994 to 1996 e was a Senior Programmer at A M .
esent, he is a Senior Software ~ n ~ i n e e r nology s o f ~ a r e . He is w ~ r k i n ~ for his
ects to achieve it in July 2001. His i n f o ~ a ~ ~ ~ ~ from data using neural nehvor
~0~~~~~~ A. is Chair Professor and ~ngin~er ing, The Hong Kong Polytechni ity. His BE degree is from the U n ~ ~ ~ r s i ~ of Geylon and PhD from ~ ~ p e r i a l Londo~. He has ~ ~ e v i o u s ~ y worked in Sri Lanka, USA, ~imbabwe and Sweden a search interests are in power system r e s ~ ~ ~ ~ i n g , pricing, control, MVDC, ~ a n s ~ e n ~ stability, ~ro~ect ion and ~ e l i a b i ~ i ~ . ~ r ~ € e s s o r David was elected an IEEE FeItow in 2000 for his ou~s~and~ng ~ o ~ ~ i b ~ ~ i o n s to electricity supply in dust^ reform an trans~i~$sion acces He is the regional editor for Asia of the ~ n ~ e r n a t ~ o ~ ~ l Journal tric ~ o w ~ r Systems
is r~$p~nsible for skate s the dis~ibution eonip ~ ~ n c e of the pian~ing a n systems in the UK and abroa
and helped deve~op the d~s~ibut jon businesses, artered ~ n ~ ~ n e e r and
lie has been at MIT since 1984 as a Senior Research Scientist in the here she conducts research and teache§ ~ r a d ~ a t e courses in the area of
systeni§~ Since September 1999
Young Investigator Award for ~ s ~ i n ~ ~ i s ~ ~ e d Lec~rer . Pro~ess
ale ~ i e c t ~ c power sys

Biography xxv
has been Chairman of the National Grid Company plc since 1990, when the Company was formed as part of the privatisation of the UM electricity sector. His bold and far-sighted leadership has been a key ingre~ient in its success of the National Grid Group plc from the performance of the transmission system during a decade of major change in the industxy, though the conception and development of Energis, to the growth of the group internationally. He retired as the Chairman of the National Grid Group plc in July 1999. Dr Jefferies was previously Chairman of the London Electricity and of Viridian plc. He was the 1997/98 TEE President. Owing to his huge contrihution made to thc institution, he i s an Honorary Fellow of the IEE. He i s also a Fellow of the Royal Academy of Enginecring. He was a pioneer in the restnicturing and deregulation of the UK electric power utility.
ia received his PhD from the University of California, Berkeley, in 1983. Since then, he has been at the University of Washington, Seatile. He is currently Professor of Electrical Engineering and Associate Dean of Engineering at the University. Dr Liu is a Fellow of the IEEE and the US representative on CTGRE Study Committee 38. His areas of interest include power system economics, intelligent system applications and vulnerability assessment.
o obtained his MSc and PhD from the University of Manchester Institute of Science and Technology. He is currently the Head of the Power Systems Research Group at the University of Strathclyde. His group specialises in energy management systems, issues concerning the electricity market and deregulation, simulation, analysis, monitoring and control of powcr networks. Professor Lo has been an international advisor and member of many organising committees of international conferences, consultant/visiting professor to over 12 educational institutions, and has lectwed extensively in the Far East, Europe and America. He is the author of over 260 technical pL~blications. He is a Fellow of the TEE and a Fellow of the Royal Society of Edinburg~~.
is a member of London Electricity’s Executive and is currently the Managing Director of both London Power Networks (LPN), which i s the distribution business of London Electricity, and London Electricity Services (LES), which is the private networks business of London Electricity. As Head of the Public Distribution Business he led the work during 1999 which culminated in the formation of 24sevei1, the joint venture network management services provider formed by LE and TXU Europe (Eastern Electricity). He has been in the electricity supply industry for 25 years in a variety of both operational and strategic roles within the distribution business. He has a practical engineering background having worked in a number of operational, project manager and leadership roles i n utility power distribution. Mr Morton is a Chartered Electrical Engineer and a Fellow of the IEE. He also represents the UK in the business area of distribution at ~ U ~ E ~ ~ ~ ~ ~ C ~ the pan-European association of electricity companies.
SS ~~~y received his BE and PhD degrees from the National University of Ireland, Dublin, in 1983 and 1989 respectively. He is currently a Professor at the National University of Ireland, Dublin, with research interests in power systems, control theory and biomedical engineering.

XXVi Biography
ebllk is a Professor of Electrical and Coinputer Engineering, Iowa State University, Ames, Iowa. He received his BS and MS degrees in electrical engineering from Purdue University and his PhD in electrical engineering from Virginia Tech. His industrial experience includes over 15 years with a public utility (Commonwealth Edison), with a research and development film (Systems Control), with a computer vendor (Control Data Corporation) and with a consulting firin (Energy and Control Consultants). He has participated in the functional definition, analysis and design of power system applications for several energy management systems since 1971. Dr Sheble also designed the optimisation package in use at over 50 electric utilities to schedule electrical production. He has consulted since entering the academic world with companies in North America and Europe on electric industry deregulation as well as expert witness testimony on the National Electric Code and lntellectual Property Rights. His consulting experience includes significant projects with over 40 companies. He developed and implemented one of the first electric market simulators for the Electric Power Research Institute using genetic algorithms to simulate the competing players. He conducts approximately 24 seminars each year on optimisation, artificial neural networks, genetic algorithl~~s and genetic programming, and electric power deregulation around the world. His primay expertise is in power system optimisation, scheduling and control. Dr Sheblt? has been awarded over 1 million dollars of research support over tlie last 10 years, primarily in the application of adaptive agents to market bidding. He has authored a review of adaptivc agent market-playing algorithms for the Kluwer press release Powr Systems Restmcluring: Engineerin'q and Economics edited by Ilk, Galiana md Fink. He has written a monograph on tools and techniques for energy deregulation entitled Conjputational Auction Mechanisms.for Restructured Power Industry. He has also been an invited guest on radio talk shows and a resource for several news articles on electric power deregulation and industrial trends. His research interests include power system optimisation, scheduling and control. Professor SheblC is an IEEE Fellow.
~ o ~ e ~ s ~ ~ Vijay So0 obtained his BSc ftom University College, Nairobi, and his MSc degree fi-om Strathclyde University, Glasgow, in 1969. He obtained his PhD degree in power electronics from the University of Bradford, England, in 1977. From 1969 to 1976, DK Sood was einployed at the Railway Technical Centre, Derby. Since 1976, he has been employed as a Researcher at IREQ (Hydro-Qukbec) in Montreal. Dr Sood also has held Adjunct Professorship at Concordia University, Montreal, since 1979. Dr Sood is a Member of the Ordre dcs ingknieurs du Quebec, a Senior Member of the IEEE, a member of the IEE and a Fellow of the Engineering Institute of Canada. He is the recipient of the 1998 Outstanding Service Award f%om IEEE Canada, the 1999 Meritas Award from the Ordre des IngBnieurs du Quebec, and the IEEE Third Millennium Medal. Dr Sood is presently the Managing Editor of the IEEE Canadian Review (a quarterly journal for IEEE Canada). He is a Director and Treasurer of IEEE Montreal Conferences Inc. He has worked on the analog and digital modelling of electrical power systems and their controllers for over 25 years. His research interests are focused on the monitoring, control and protection of power systems using artificial intelligence techniques. Recently, Dr Sood has been interested in the Internet and its applications for teaching purposes and was mandated by IEEE Canada to publish the journal IEEE Camdian Review on the Internet (www.ieee.ca). Dr Sood has published over 70 articles and written two book chapters. He has supervised 14 postgraduate students and examined 13 PhD candidates frotn universities all over the world. He is well known amongst thc electrical engineering community in Canada.

Biography xxvii
r Cliff is Technical 2% Regulation Manager of London Power Networks (LPN). LPN is the distribution business of the London Electricity Group. In his current position, he is responsible for all technical and regulatory matters regarding the public cleclricity distribution system in London and particularly the quality of supply and reliability performance that sets London apart. He has previously been Strategy Manager, Asset Manager and Planning IvIaager for London Electricity's Public Networks Group. In his recent roles he has championed the development of an integrated technology strategy, strategic asset management, fault causation analysis, incipient fault detection and location techniques, as well as creating the strategies behind the implementation of one of the largest distribution remote control, telemetry and automation pro-jects. Mr Walton joined LPN whea it was established in April 2000; his career in electricity distribution spans 29 years. IIe has worked with a number of overseas utilities and has written and presented many papers on a wide variety of technical and asset governance and m ~ a g e ~ e n ~ issues. He is a Chartered Electrical Engineer and a Member of both the IEE and IEEE.
r ~ ~ ~ s s ~ r was born in May 1936. He graduated from Xi'an Jiaotong University in 1957. He has since been with the School of Electrical Engineering of the university, where he now holds the rank of Professor and is the Dircctor of the Electric Power System Department. He is a Senior Member of the IEEE. From September 1981 to September 1983, he worked iii the School of Electrical Engineering at Cornell University in Ithaca, New York, USA as a Visiting Scientist. From September 1991 to September 1993 he worked at the Kyushu Institute of Technology in Kitakyushu, Japan, as a Visiting Professor. Prof Wang has a 40-year experience of researching and teaching in electric power system analysis and planning. His main research fields include reliability evaluation, generation and transmission network planning, operation planning, system contingency analysis, dynamic and transient stability, short-circuit current calculation, optimal load flow, and probabilistic load flow. He is especially proficient in constructing mathematical models and developing application software in the above areas. He also took part in many research and planning tasks of key electric power projects in China, such as the Three Gorges Hydro-Power Station. He proposed a new transmission system, namely the fractional frequency transmission system (FFTS) which uses a lower frequency to reduce the reactance of AC h-ansniission systems. In recent years, he has been researching the electric power market.
~ t s ~ ~ received his BE (€Ions) and PhD degrees fiom the University o f Canterbury (New Zealand), where he is now a Senior Lecturer. Dr Watson has authored and co-authored approximately 100 technical papers and 3 books. Paper awards received include; Best Paper Award (The Sixth International Conference on Harmonics in Power Systems, 1994), the William Perry Award (TPENZ) and Finalist for the Carter Holt Harvey Packing Award for Innovative Technology (IPENZ). He has also given a nuinbcr of invited lectwes in Singapore, Australia and Canada,
ail Wen received his BEng and h4Xng degrees from Tiarijin University, China, in 1985 and 1988, respectively, and his PIiD from Zhejiang University, China, in 1991, all in electrical engineering. He was a Postdoctoral Fellow at Zhejiang University Eroin 1991 to 1993. He joined the faculty of Zhejiang University in 1993, and has been a Professor of Electrical Engineering since 1997. We held a visiting position at the National
xxviii ~ i o ~ a p l i y
apore from 1995 to 1997. e is on leave from Zh ong Polytechnic Universi as a research fellow. ral Science Award of China, Zhejiang Provin~~aI Top Young ~cientist
and several other awards from the Ministry of Education (China), Zhejiang ial gove~ment, Zhejiang University and the National University of Si~gapore. He
is a ~ e ~ b e r of the editorial board of the JournQz o ~ ~ ~ ? o m u ~ ~ o n ofEleclric Power ~ y s ~ e ~ s ese) and was a guest editor of a special issue on ‘Artificial intelligence ~pplicat~ons r systems’. His research interests are in power system r e s t ~ c ~ r i n g and artificial
lications in power systems.
obtained MSc, PhD and DEng from University of ~ a n c h e s ~ e r echnology in 1971, 1974 and 2001 res~eceive~y. C u ~ e n ~ ~ ~ he is
Electrical En~ineering at the University of Western Australia. system dynamics, protection, electromagnetic transient evaluatio n, artificial intelligence and co~pu~at iona~ in~elligence in power system
operation and planning. Professor Wong has published over 140 research papers and has been awarded the Sir John Madsen Medal of the Knstitution of Engineers Australia. He was the Founding Chairman of the Western Australia Chapter o f the IEEE Power Eiigineer~ng Society and was the Chairman of the Western Australia Section of the IEEE from 1999 to 2000. He h a member of numerous technical committees for intema~i~nal co~~erences~ r Wong was the General C h a i ~ a n of the IEEE ~ ~ S / C S E ~ 2000 Inte~ational nce on Power Systems Technology powerc con 2000). We is an editorial board member of the interna~ional journal Electric Power Systems Research and
Jour~~ul of ~ ~ t e f l i g e ~ f ~n fo r~u t ion Processing Syst~ms. In 1999, he was uts~nding Engineer Award of the lEEE Power Enginee~ng Society WA
Chapter. He was a recipient of the IEEE Third Miflennium Medal in 2000. Professor Wong is a Fellow of the Hong Mong ~i ist i~ut~on of Engineers, Fellow of ~nstitu~ion of ~ngjneers Aus~alia, Fellow of the IEEE, and Fellow of the TEE.
ee S SYS
cquired her degree of Bachelor of Engineering in Electrical The University of Hong Kong in 1996. In the same year
Miss Yuen was awarded The China Light & Power Company Prize in Electrical Energy, because of the dis~inction of her final year project en~~tled ‘The applic~~ion of ~ i ~ c i a l neural n e ~ o r k s on the detection o f high i~pedance faults’. During 1994 to 1998 Miss Yuen pursued the degree o f Master of Philosophy with a thesis entitled ‘Fault detection and oven tection in low voltage power systems’. In 1998 she was awarded the China Light Co. Led. Electricai Energy Postgraduate Scholarship. In the same year she was awarded John Swire & Sons Ltd. James Henry Scott ~cholarship for ~ngineering Studies at the U n i v e r ~ i ~ ~ of S~athclyde which enabled her to pursue the degree of Doctor of ~hilosophy in Scotland. Miss Yuen is also an Associatc Member of the IEE. Her current research interests include the analysis of international energy markets, congestion m a n a g e ~ e n ~ ~ transmission piicing and the application of i n f o ~ ~ ~ i o n tcc~nology in energy markets.
received SB degrees in applied ma th~~a t i cs and in electrical engineering and com~uter science and MEng degree in electrical engineer~ng and computer science from the Massachusetts Institute of Technology (MIT), Cambridge, in 1995 and in 1997, respectively. He completed his PhD degree in electrical engineer i~~ and computer

IT, c~ncent~ t ing on e l ~ ~ r ~ c power system economics engineer^ is entitled ‘Electric network economics: underlying p~inciple§ independent transmiss mpany (ITC) and designing a ~ c ~ ~ t e c ~ r ~ for re research in t~res~s include ~ o d e l l i ~ g of energy markets as stochastic dyn
epts for the 1°C and ~esigning software tools for various en~rgy m a ~ ~ e ~ has a strong b a c ~ ~ r o u n ~ in control, estimation, m a ~ h e ~ a ~ ~ ~ s , research
design and r ~ g u l a t o ~ economics.


Dr Loi Lei Lai City University, London UM
Restructuring of the ele&icity supply industries is a very complex exercise bas na~~onal energy strategies and policies, macroe~onomic develo conditions, and its application varies from country to country. It is i m p o ~ ~ t to point out that there is no single solution applicable to all countries and there is a broad range of diverse trends,
~ ~ b e r a ~ i s ~ t i o n , ~eregulation (or reregulation) and pr~vatisation are all processes under the general label of market reform. Liberalisation refers to the ~~troduction of a less restrictive regulatory framework for companies within a power sector. This could deregulation, which is the modification of existing regulation. It can reregulation is a more accurate term than deregulation since new laws are on the industry with reguIato~ watchdogs appointed to protect c o n s ~ ~ e r ~nterests. I~eally, then, a true liberalised energy market would work within a set regulato~ framework, overseen by a regulator and with no external political influence upon the particip
sation is the sale of g o v e ~ e n t assets to the pnv~te sector, by itself, ~rivati~ation is not sufficient to introduce competition into a reformed sector. ~ompet~t ion will be the result of careful regulation of the privatised entities to allow new e n ~ r a ~ ~ ~ access to the ~ a r ~ e t . ~ompetition is ~undamen~1 to most market reforms and it is introduced in order to reduce costs and increase efficiency. There is considerable variation in the extent
tion which is introduced. For example, competition could be introduced just n of new gene~ating capacity and referred to as competitive bid din^ where
the existing gen~rating company invites contractors to tender to build, operate and sell ower to the monopoly at a ~ p e c i ~ e d price. Alternative~y all licensed g~nerator~
e allowed to compete to supply wholesalers or retailers through a short-term market ~ k ~ t ~ or via longer term contracts; this is called compet~t~ve g e ~ ~ ~ t i o ~ . The next
vel i s wholesale competi~ion~ i.e. competit~on in the sale of electricity to wholesale ies for resale to a retail level or directly to final customers. This usually allows the n s ~ ~ e r s to choose their own s ion at final c o n s ~ ~ m ~ r level,
~ousehold consumers, is calle This is us~al ly the very last step o f the reforms, as it requires a complex information technology system because of the
of small users involved. Retail c o ~ p e ~ t i o n is usually i n t r ~ d u c ~ the larger i n d u s ~ ~ ~ ~ consumers, then the medium cons~mers
und the world are currently in ~ a n s i t i ~ ~ towards more arkets. The changes were initiated by:
8 r~alisat~on that generation and dis~ibution nctions need not be mono a feeling that public service obligations are
lion potential of competition; availability and fuel supply s ~ ~ b i l i t y ~ and
the develop men^ of new technologies in power generation and in fo~at ion technolo
The ~ont inu~ng growth of competition i the 1978 passage of the Public Utility conservation measure, PURPA establ
erican electricity m latory Pokes Act (
ducers (IPFs) to sell electricity to local regulated investor-owne~ utilities (IOUs). were broadened s ~ b s t ~ t i a ~ ~ y by the passage of the Energy Policy Act of 1992
which requires transmission line owners to wheel bulk power [l]. Thus, under current fe(iera1 regu~ations non-utility power producers can sell electr ici~ to any utility on the grid, F u ~ h e r ~ o r e , in April 1994, the California Public Utility Co~miss~on adopted a policy establishing complete open access to all power producers. By 1996 ~ndepend~n~ generators could compete to sell electricity directly to large industrid customers, ef~ectiveiy
~ d i t i o n a ~ utilities. By 2002, the policy will pennit all ele consu~ers, of size, to purchase electricity any utility or independe rator on the
grid. No longer will the consumer be res to buying e lec~ci ty from the local utility. A ~ o ~ p e t i ~ i v e market for gene~t ion will have been es~abli§hed [2,3].
The system evolving in the USA provides i ing competition and div~rsity among gen~r~tors. They vary from established utilities and co-generators to small producers that use renewable fuels and other non-utility genera~ors y 1990, a decade after
reform movement got under way in the USA, co-gen enerating capacity than were the ~aditionai utili
Ca~~forn~a Edison buys 30% of its power from NUGs. in M ~ c ~ ~ g a n consists of 12 gas turbines with a generati
b~~~ custo~ers, n a ~ e l y the Tucson Electric Power Edison 141. Compared with the deregulation of I0 monopoly requires a complete and ~ d ~ e n ~ ~ chan
C ~ ~ p a n y , in ~ i z o n a , is an indepen~~nt power
Energy Generation under thc New Environment 3
property rights in the electricity supply industry in order to obtain the benefits of increased efficiency and innovation. A shift from public to private ownership refocuses the goal Of the producer towards profits. Pursuit of the latter provides a strong econon~ic incen~ive, in a competitive environment, to improve and maintain the quality of customer services, monitor costs more closely, and invest in productivity-enh~cing t e c ~ o l o ~ i e s ~ These incentives are blunted by state ownership. With respect: to privatisation, the since 1989 seems more germane than does the regulatory reform the USA has been undergoing since 1978.
The European C o i ~ ~ i ~ is addressing these same issues and has agreed to draft directives calling for open access in energy markets. As of January 1993, the E u r o p e ~ Commission seeks to let large users of electricity, those using 100 g i g a w a ~ or more of power per annum (aluminium, steel, chemicals, glass and fertiliser producers), to purchase electricity from any supplier in the Community.
.3 Th
Competitive generation provides a market within which independent fimis compete on the basis of price to sell electricity directly to large industrial customers, and to supply electricity, via common carrier transmission, to distributors who in twn sell power to final users [5,6], Produc~rs may specialise or diversify by load characteristic. For example, some may prefer to compete for long-term base-load contracts. These firms are likely to own hydro and nuclear power plants. On the other hand, fms with fossil fuel plants might seek to supply base and cycling loads. Finally, producers with gas combustion turbines and co-generators could compete to meet peak loads. Other firms may diversify and be ready to compete for base, cycling and peak loads.
Prices charged for each type of service (peak and off-peak load, daily to ~easonal~ could be established by contract, 24 hour advance notice, and in spot markets. Unit could vary by the amount of electricity purchased per period. As a result, customers face more service options and a more complex pricing scheme. There are a nu advantages to having a variety of types of generators linked to the transmission grid.
The first major advantage involves cost savings. At any given moment^ power is supplied to the transmission grid by the firm with the lowest marginal costs. according to merit saves resources and reduces the cost of generating electricity. Because the different plants may have different load characteristics, peak and load duration curves, generating capacity can be more fully utilised and additional capital resou~ces saved.
The second ~ d v a n ~ g ~ of competitive generation is that a spot market for electricity will develop. The ability to sell electricity on the spot market increases the ge~erator’s ~exibility in scheduling production. The presence of a spot market means that less idle capacity must be maintained in order to provide a given level of service re Shortfalls and emergencies can be met by purchasing power on the spot market. and supply are eq~librated by flexible spot prices.
The third advantage o f competitive generation is that the market will provide an anray of service standards that more closely match consumer preferences. Consumers could be offered priority service with a schedule of electricity rates increas~ng with the level of reliability. According to reference [7], priority service offers significant efficiency gains over random ration~ng with fixed electricity rates. A compet~tive market in elec

Power System Restructuring and ~ e ~ e ~ l a t i o n
generation would offer a much broader may of services than do state n i~~opol ies or r e ~ l a t e d generators. erhaps it is not surprising that 70% of USA private utilities, facing new c o ~ p e ~ ~ t i v e pressure at the generation stage, now offer some form of voluntary inte~up~ible service 181.
The fourth advantage of competit~ve generation is innovation. Compe~i~ i~n not only leads firms to be more responsive to consumer demands, monitor costs more closely, and compete: on the basis of price, but also provides an incentive to be i~~ovat ive, Devel a new consu~er service, a better method of reducing costs, or a faster way of d e a l ~ n ~ with p ro~~ems promises the innova~or a competitive edge.
xis~i
The nature of the existing generating plants will affect the speed of reforms. In countries where the coal industry has dominated the economy there has been opposition to r e s t ~ c ~ r i n g the electricity industry, which usually includes a s u b s ~ t i a l a ~ o ~ n t of coal- fired capacity. Deregulation of the electricity sector meant loss of a secured market for coal wh i~h now has to compete for its share in the market.
The nuclear industry in the UK was initially excluded from competition and subsidised. The nuclear power s ions bid into the power pool and were electricity due to the n-Fossil Fuel Obligation (NFFO). The on the distribution companies to buy a set percentage of their electricity from stations using non-fossif. hels. In 1990, this was mainly nuclear power. A Fossil Fuel Levy was placed on the e l e c ~ i c i ~ bill of all electricity consumers (which ~ ~ u n t e d to 10% of the total bill) and over 90% of the money collected was given to Nuclear Electric to cover gen not recouped from sales of electricity to the pool [9]. In 1996, when British formed, the subsidy to the nuclear power industry was abolished. The levy and since then it has been used to support renewable energy projects.
Prices tend to go down as competition is introduced and are expected to fall sign~~cantly in the long-term. For example, in the UK prices have fallen since the market open in^ and they are expected to fall even lower. In 1995 real prices, the price of elect~city for industry decreased by almost 13% and the price for households by 6.3% between 1991 and 1995. It is has been observed that i n d u s ~ a ~ prices have decreased more
ousehold prices in most of the countries where reductions have occurred [IO]. ne of the conse~uences of p~vatisation is the ~eve~opment of the i n t e ~ a ~ i o n ~ ~ energy
co~pany concept - a company whose focus is becoming more global and more multi- le US electricity and gas companies have been ~ u r c h ~ i n ~ electricity
Australian and UK companies have been heavily involved in setting r projects in developing countries. Another change with privatisation older value. Privately owned companies have to compete for funds in
the capital market and it is important to show that they operate efficiently to do well in the business environment to attract investors. That means a comple~ely new organisational structure and strategies for companies from what were used in the highly r e ~ l a t e d power industry.
Goal is expected to retain a strong position in power generation worldwide in the future. In 1995 solid fuel, mainly coal, accounted for almost 40% of world electricity pro~uction and is expected to retain this percen~ge until 2020. In 1995,60% of total world

Energy Generation under the New ~ n v i r o ~ e n t
consumption was for power generation and this is expected to grow to 65% in 2020. The emand for coal will increasing~y be dominated by Asia. expect^ to increase from 25% in 1995 to 43% in 2020 E1 11.
There are a number of issues that will affect future use of coal and in some cases the results are quite u n c e ~ i n . The Inte~ational Energy Agency (IEA) points projections of coal use are subject to the outcome of competition between coal
urope, and to the policies adopted by governments to improve nnance and comply with greenhouse gas reduction c o ~ i ~ e n ~ s [I I].
In the past, power systems were developed to transmit large amounts of power at hi voltage from remote generati~g stations and to diskibute power at lower voltage down millions of small consumers. This was the favoured pattern, allowing ever-l~ger power stations, mostly coalfired, to be built and achieving economies of scale and high efficiency. The national grid evolved to ensure secure supplies to all consumers and centralised conkol and supe~ision was essential. In the present privatised electricity supply ~ n d u s ~ based on free trading of electricity as a commodity, central control is unwelcome. er ever possible, electricity generation should be closely i ed with space and process heating in a diverse array of combined heat and power stems. newab able energy sources should be harnessed by large numbers of wind and wave machines, marine t ida l~~urren~ or sm~~-hyd ro plant, solar photovoltaic generators on roofs and small generating plant close to farms supplying wood fuel or to sources of combustible waste products. Generating plant will be small and dispersed and since CHP systems must be located close to their heat loads there will be a natural tendency for most e ~ e c ~ c i ~ generation capacity to lie close to the consumer. There will be little need to transmit large amounts of electric power over long distances. The h c t i o n of the power system will be to handle the f l u ~ ~ a t i o n s in load and in the output from the renewable power generators. ~ i g ~ - p o w e r ~ long~distance kansmission will be much less important,
In the current energy structure, a central power plant is the key facility providing energy for houses, factories and offices. With decentralised co-gener power and the d ~ l o ~ e n t of renewables, this situation would change. would be less centralised and more dispersed. Network stability and frequency regulation would gain in importance and energy storage would become very ~mportant. Ele genera~ion is provided by a large number of small units rather than a small number units, Co-generation is the generation, on site, of your own power and at the same time taking advan~age of the exhaust heat from your gas turbine or other engine to meet on-site heat needs. Heat can be used to heat buildings, heat dryers, generate steam ~ o u ~ h an HRSG (heat recovery steam generator), or to provide air-conditio abso~t ion chiller. Power and beat can be generated locally from na~ural using an efficient, reliable gas turbine.
The uncertainty in the USA today is what will happen to electricity prices. The major c o ~ p e t i n ~ factors are limited deregulation and lack of new generat~ng stations ~ ~ c u ~ a r l y large coal or nuclear stations). Estimates range from modest decreases in prices, to the levelling of local inequities, and significant increases driven by demand without supply. Our view is that prices over the long haul will increase slightly with some local equities

Power System Restructuring and ~eregulation
being eased. All this means that for many sites cogen (distributed power) will be a viable option for those willing to improve their competitive position through ~ e d ~ c e d e n e r ~ costs.
New enabling technologies have now improved transport of eleclkcity in ~~gh-vo~tage C systems to the point where this may be cheaper, and use less energy, than ~ a n s p o ~ i n g
fossil fuels, for distances o f 5000 km and above. This might make it possible to link low- COz power sources where demand is low to distant regions where demand is high.
1.4.2 Trends in Conventional Electricity Generation Tec~n~logies
Co~ventional sources of electricity supply will m a i n ~ i ~ their central role in ~ r i ~ a r y energy supply for many years to come. Further advancement of fossil fuel generation technologies will increase the options for mitigating greenhouse gas (GBG) emissions. This is particularly important for some developing countries and transitiona~ economies with abundant, low-cost fossil fuels, where electricity demand is increasin~ rapidly. The large share of nuclear and hydro in the generating mix of some countries already makes a s i ~ i ~ c a n t ~ontribution to mitigation of GHGs.
atio
World electricity production is expected to grow by an annual rate of 3% in the period 1995 to 2020 according to IEA projections. Coal retains a strong position in world power generation and will continue so. However, gas is expected to grow faster - at 6% - than solid fuels at 2.9% (e.g. coal) [I 13. This is because, in countries where gas is available at competitive prices, gas-fired plants are cheaper to build and operate. D e r e ~ l a t ~ o n has played a role in opening the way for gas to compete with other fuels. Coal is still the favoured fuel in locations close to low-cost coal production (e.g. pats of North America, Australia and South Africa), in areas where gas is unavailable or expensive (as in those deveIop~g countries that have coal available, like China and India), and in areas where there are existing coal-fwed units.
Prior to deregulation, utilities tried to predict the future energy demand in their area and build new capacity accordingly. In a deregulated energy market gener current demand is and try to fill as much of the demand as possible plants. The predicted growth in the demand for energy on a wor provide an incentive for generators to build new plant or extend their existing capacity to take advantage of this trend. Competition rules will determine the market players. However, the only players in practice who can invest in new capacity are those who feel they can achieve a competitive advantage. In deregulated markets this should not be market access or cost of capital but a genuine advantage such as feedstock, technology, captive market of heat, extension of existing plant to take advantage of existing assets, refurbishme~t, etc. The possibility of having stranded costs would seem to rule out new,
ensive power plants. Most of the additional capacity is expected to come from incremental i nves~en t in extensions done as part of general ~ p ~ v e ~ e n t s or ma~ntenance. New plants are likely to be smaller, more cost effective, and close to areas of demand that can compete effectively for local market share. This means that there could be a swing away from large fossil-fuel-fired plants in the ene y mix towards sma~ler, less
Energv ~enera~~on under the New Envirolment 7
intrusive plants sited close to the area o f demand. The fact that industrial sites are now allowed to install their own genera~ng capacity and export electricity to the grid could lead to an increase in smaller scale distributed g~era t ing capacity.
1.5.1 ~ Q w ~ r
The operation o f power plants is also changing dramatically in dere Generating companies are no longer obliged to generate electricity; generate and sell their electricity when they think it is profitable for them. This means that most of the generators will want to operate their plants at base load where most profit can be made. There is little incen~ve for the generator to provide electric~ty for more expens~ve intermediate and peak demand, which make up only a small portion of the market. As d e r e ~ l a ~ i o n proceeds an increasing number of players enter the system which is no centrally controlled. This makes the quality and reliability issues more difficult to m Experience so far shows that deregulated markets can reliably meet demand and are expected to do so in the foreseeable future. The UK system’s re~iability and availa~i~ity actually increased between 1992 and 1997 when the transmission and dis~ibu~ion network was restructured [4]. It i s believed that the system will work without problems of security of supply for the next 5-10 years.
Coal contracts are also affected by changes in power plant operation. There is a general move to shorter term fuel supply contracts to match the electri sales contracts in deregulated markets. ~ ~ e x i ~ i l i ~ in plant operation i s an adv the competitive market where conditions change quickly. Distributed gene small-scale units could also give more flexibility to the system. An advantage of coal is the fact that it cm be easily stored in stock~iles, whereas storing gas is much more complicated and expensive and restricted to certain quantities. In deregulated markets demand and a v a i ~ ~ ~ i l i ~ of
dictable and therefore the risk of disruption in fuel su~ply is more es can ensure security of supply for the generator.
Utilities are forced to operate in a more reliable, economic and efficient manner and plan their expansion investments more accurately. There are a number of reasons promoting int~rcon~ec~ions among utilities. These include economic interch~nge, Brm power and energy transactions, wheeling, improved operating reliability and ~ ~ x i b i l i ~ and reduction in installed generation reserves. Usually utilities construct new power plants to meet the increas~ng demand or to rep~ace old plants, which need large investments, ~ o w e v e r ~ ~ t ~ r ~ o ~ ~ e c t e d utilities may jointly install a generating unit in which the utilities may have different or similar shares or the interconnected utilities may buy a certain perce the output of a generating unit, which already exists in the other utility, Therefore, the failure of a jointly owned generating unit will cause a decrease in the available capacities of all the sharing utilities simu~taneous~~. Because of this correlation, the conventional model of a ~enerating unit cannot be used to represent a jointly o ~ e d generating unit,
The re~iability modelling and evaluatio~ methods of composite ~efieration and transmission systems need to be extended when the system being analysed includes generating units that are jointly owned with other interconnected systems. This is because

Power System R ~ ~ ~ c ~ r i ~ ~ and ~ ~ r e g u l ~ t i o n
the modelling of jointly owned units causes two major problems. The first problem is that they cannot be included in the area generation model in a conven~ional manner because a jointly owned generator contributes generating capacity to two or more areas. Consequently, a failure or derated state of a jointly owned generator affects all the sharing areas. This condition cannot be incorporated in the traditional generation model, which has an inherent assumpt~on of independence among generation models of various areas. The second prob~em is with the transmission model. In the absence of jointly owned units the transmission links are used only for emergency help and energy transaction^^ Since the
ontracts and the transmission c n e ~ g h b o ~ n g areas is fixed.
ity states are fixed, emergency help th when jointly owned units are includ
reliability analysis of the system, common generation flows are present and vary depending on the states of jointly owned units. Consequently, the emergency help that can be given to neighbouring areas is dependent not only on the tr~nsmission capacity states and energy contracts, but also on the common generation flows which vary according to the states of the jointly owned generating units [12,13]. Further research on a detailed system representati~n is necessary to consider the particular operating features of jointly o w e d units so that their impact on the reliability performance of the respective power systems can be inves~ iga t~ .
It is impo~ant to ~nderstand the market response to the increased risk associated with the introduction of competition into the market for generating electricity, Typically a ve~ ica l~y in te~ated state monopoly deals with fluc~ations in demand and r ~ d o m equipment failure by carrying excess capacity, including redundant backup capacity. It may also address predictable fluctuations in demand by offering peak-load pricing schemes, although the incentive to do so is weakened by state ownership or regula~on.
complex pricing structure, and loop flow problems when independent electricity into the transmission network. Moreover, electricity flows along the path of least resistance. Thus, for example, electricity sold by Generator A to Industrial Customer may not travel along the ‘contract path’ that is, the shortest line within the network tha directly links the buyer and seller, Depending on circumstances, electricity introduced into the network at any point may give rise to ‘loop flow’ affecting ail suppl~ers to the grid. Loop Bow can disrupt the quality and reliability of service to everybody taking electricity from the grid at the moment additional power is introduced.
If decentralised markets introduce additional risk, they have to provide a bro ways of dealing with it. All of these sources of risk potentially influence the service to the final consumer of electricity. In general, the market offers methods to reduce risk and to price risk so that it can be spread or shared optimally.
Consider how a generator faces the risk of uncertain prices for electricity. Firstly, the producer can sell power by long-term contract to large industrial customers and regional distributors. ~ o n ~ a c t s specifL prices and adjustment clauses. Thus, only a small proportion of its output may even be exposed to unknown price fluctuations [ 141. Se the spot market on a regular basis offers normal returns because prices mean over a large number of sales. By selling regular~y on the spot market, the producer is reducing risk through diversification. Thirdly, the producer can hedge spot market sales in the futures market.
Competitive generation produces at least two additional sources of

Energy Generation under the New Environment
Fuels used to generate eleclricity are produced using the follow~ng fuel sources: namely, coal, nuclear, natural gas, ail, hydrogen and renewable resources. ~enewab~e resources include hydro power, geothermal, biomass, wind, solar and p~otovolt~ics. Coal is the predominant fuel source. ~ u c l e ~ power is projected to decline her over the next 20 years owing to retirements of existing units, Generation from both natural gas and coal i s pro~ected to increas~ to o€fset these retire~ents and to meet the growing demand for e lect r~c i~. The coal trade has been increasing and is expected to continue doing so in the future. It is expected to increase faster than coal production. Between 1992 and 2010 the coal trade is projected to grow by an annual 4.3% whereas coal product~0n will 2.3% ann~a l~y [15j. Coal prices dropped during the 1990s in line with compet~t~on and with the fact that there is excess capacity for mining coal for the international market. Cheap coal i s seen as being readily availabie in the short and medium tern. The ~ollowing sections s ~ a r i s e the discussions of issues related to the markets for coal nuclear, natural gas, oil and renewable fuels, followed by electric power industry res fuel markets.
Goal Power generators will attempt to pass on market r isks to coal producers and carriers wherever they can. As a result^ coal purchase contracts will ~ i k e ~ y become s ~ ~ ~ e r in duration and lower in price.
The existing capacity of the power industry in each country will play an important role in its ~ t u r e fuel mix. In the EU, 17% of the conventional thermal capacity is over 30 years old, indicating that much of the plant is in need of refurbishment or replacement [16]. Where coal-fired plants already exist it is usually more economic to operate them rather than build new gas-fired capacity. Refurbishing or repowering an existing coal-fired plant can reduce costs as the entire i n f ras~c~ure remains in place. Retrofit of pollution ~ n t r o ~ e ~ ~ i p m e n t may be necessary to meet environmental standards. In cases where h y d ~ e l e ~ ~ ~ ~ i t y a n ~ o r nuclear power dominate base-load generation other fuels ~ notab~y coal and gas - wiIl compete more strongly for position in the mid-merit market for electricity,
wer plants are expected to become uneconomical. ~ompe~i t ive e l e c ~ i c ~ ~ prices may be so low that nuclear power plant operators will not ee enough income to enable them to recover the costs of operating and maintaining the ants and the costs of capital ~~provenients, such as steam generator replacements. In the immediate f u ~ e , some nuclear power units will be at risk of early retirement as a result of r e s t ~ c ~ ~ n g . The additional inability of plant operators to cover a plant’s full costs, ~ n c ~ u d ~ n g capital costs, under restructuring produces ‘stranded costs’. For nuclear plants, operating costs after deregulatio~ will be driven mainly by plant size, age, capacity factors, and requirements for new c a p i ~ l improvements. Average fuel costs make up only about 0 n e - f o ~ h of the operating costs for nuclear power plants, but the competitive environment created by a r e s ~ c ~ e d electric power industry will encourage nuclear power plant operators to ~ d u c ~ all o ~ e r a t i n ~ costs, inc~uding the costs of purchasing and managing nuclear fuel. ore over, if early retirements of nuclear power plants result from competition in electricity markets, the deniand for nuclear fuel will be reduced. To compete, suppliers in the n u c l e ~ fuel

0 Power System ~ e s ~ c ~ r i n g and ~ e r e ~ l a t i o n
~dus t ry will be forced to reduce prices or improve efficiency, In 1996, 434 nuclear reaclors in operation in 32 countries produced 2400 TWh of electricity avoiding an estimated 10% of global human-made emissions of carbon dioxide.
S
gas is primarily used during peak demand periods and is the prefe~ed energy source for new generating capacity. The electric power and natural gas industries are both network industries, in which energy sources are connected to energy users through ~ s m i s s i o n and distribution networks. As the restructuring of electric^^ m a r k e ~ proceeds, the develop~ent of htures contract markets and electronic auction markets could lead to greater integration of the electricity and natural gas industries and the em~rgence of competitive energy markets. The availability of market information and public markets for natural gas and electricity will be a key to the development of an integrate for those commodities.
The use of natural gas in electricity generation has been growing rapidly. According to the IEA World Energy Outlook, gas-fired e lec~ci ty output will almos~ double ~etween 1993 and 2010, even under an energy savings scenario. Low capital cost, short construction time and competitive fuel price make natural gas generation attractive, especially in deregulated markets. Technologies being in current c o ~ e r c i a l operation are gas turbines and gas engines. The rapid devel o f gas turbines in recent years - bringing higher efficiency, lower cost, reduced NO, emissions and increased ope~ational flexibility .. puts natural gas electricity generation tec~ologies in a position to make a large contribution to GHG mitigation. For large gas turbines, complex cycles (Le. reheat, intercoo~ed cycles, etc.) may hrther improve efficiency. Gombined-cycle power plants attained thermal efficiencies of 40% in 1970, and are now close to 60% ~ ~ i c i e n t , Gas turbines and gas engines for small-scale generation need firther to improve their e~c iency , price and env i ro~enta l performance to gain wider application in the market, Conver~ion technology using electrochemical reactions, namely he1 cells, should become competitive in the near future. Natural gas-fuelled fbel cells can attain 50% e f ~ c i e n ~ y (under very h i g h ~ t e ~ p e r a ~ e operation), which would be further i ~ ~ r o v e d to 70% if used in combined cycle.
Oil prices have ranged between US$l0 and 20 per barrel during the 1990s and &ere is no sign of any shortage in the short or medium term. Owing to assumptions about electricity industry restrucbxing prompting the construction of Iess capita-intensive and more efficient natural gas generation technologies, the share of coal generation will e ~ e n ~ a l l y decline while the natural gas share will continue to increase. With the d e r e ~ ~ a t i o n of electricity generation and the resulting incentive for power generators to lower fuel costs, the use of relatively expensive residual he1 oil for electricity production is likely to decline even fisther. As a result, petroleum refiners may be faced with a growing ~roblem: that is, how to dispose o f leftover residual fuel and petroleum coke. Among other options, two po$s~bilities are related to electricity markets: (1) selling petroleum coke to e lec~ci ty generators for use as a fuel component, and (2) gas~~cat ion at the refine^ by using integrated gasification combined-cycle (IGCC) technology to produce steam for process heat and for electricity production.
a

Energy ~en~ra t i on under the New ~ n v i ~ o ~ e n t 11
~ecause e lec~ci ty genera~ion from renewable sources generally is more conventiona~ sources, constrained competition in electri result in a reduced role for renewables. As a result, a variety of propos~~s,
schemes and policies incIude specific ~rovisions which are used to s~pport the c ~ n t i n ~ e system
ing and pric~ng prog~ammes, already being im~lemented by electric utilities, may also provide a
se c o n s u ~ ~ r demand for electricity from renewable fuels. The role of y sources in competitive electricity markets will also depend an the cost of the indiv~dual renewable fuels. In addition, because renewab~e e~ergy
generat~g ~acilities generally depend on the availability of energy resources at s p e c ~ ~ c sites, often at sites remote from major electricity grids, transmission issues will affect the pene~ation of renewable fuels in the electricity ~eneration market.
ment and use of renewable energy. Renewable portfolio standar charges are among the programmes being considered. Green
e an essential element of the climate change p r o g ~ ~ ssions and ~ ~ ~ i ~ c a n ~ l y lower levels of other ~ ~ l ~ u t a n ~ s ~
ort for renew~bles, policies and prog stry to become comp~titive.
supply a proportion of renewable powcr ren~wable ~enerators c ~ n ~ ~ e n c e that there will be a market for their pro ren e~~ctricity genera~ion schemes, using established te Pro power at prices which are more or less competitive mains~eam coal and gas. Figures 1.1 the geneTa~ion mix ~ ~ s p e c t i v ~ ~ y in the
1.2 show the changes in the arke et shares and
Links First Hydro Others
1pp* 7% 7 1% ,/- 1% lPPs National
-. . . Energy \-Mission 18% 4%
1.1 C ~ a ~ ~ e s in the market shares

12 Power System Restructuring and Deregulation
8% 33%
igure 1.2 The generation mix
Althou~h a number of the technologies are inherently small-scale c o m p ~ e ~ with central station power generation, this has some distinct advantages suc
d operation. As electricity markets are restnuc is likely to expand and renewables will become There is a more diverse range oE techno~ogies,
0th their technical and economic devel energy crops, ph~tovol~ ics, fuel cells,
ass residues, wave power and geothetrnal energy. The world is c h a n ~ i n ~ and es are driven by the use of energy.
n operates on a small to m d combined cycles can also
a d v ~ ~ g e of r e m o v ~ ~ g all p~ icu la tes from the co iency of over 85%. This teclmology is close Eurther ~evelopment is the fuel cell, where a
version at conve~ing che i authorities, difficult f trade or promotional orga~isatio~s w tariffs for sale of bi ackup electric supplie
costs also const i~te serious barriers.

Energy Generation under the New Environment' 13
6.6.2 Fuel Cell
A fuel cell consists of two e~ectrodes sandwiched around an e ~ e c t r o l ~ e ~ over one electrode and hydrogen over the other, generating electricity, water and heat. Fuel cell systems will compete with other distributed generation technologies, inc~uding micro~rbines and reciprocating e n ~ ~ i ~ s , available at prices competitive with ex i s t~g forms o f power ~eneration. Fuel cell systems will have a competitive advan~age in that they can be more easily scaled to residential size and will be more efficient in handling the load profile of residential customers. They will be quieter, e n v ~ o n m e n ~ l ~ y cleaner, more efficient, and less expensive to install, service and maintain. Fuel cell systems will also
te with solar and w~d- ower red systems. enerative fuel cell technology, National Power rece developed a new electricity storage technolo
change the way power systems of the future are planned and opera the world's most ad~anced re~enera t~v~ fuel cell t e c ~ o ~ o g y . Re be attractive as a closed-loop form of power generation. Water is separated into and oxygen by a solar-powere~ el cell, which genera~es electricity, h solarpowered ~ ~ e c ~ o ~ y s e r and the
The e ~ e ~ ~ ~ o ~ h e m ~ ~ a l process, which operates like a giant rechargeable b a ~ ~ e ~ ~ has the potential to deliver commercial, operational and environmen~~ benefits for electricity suppliers worldwide. It stores electricity when demand and costs u e low and releases it when demand and prices are high, removing the need to call up more expensive pawer plants. The system, which can deliver power instantly, can therefo~e assist deman~ planning, improve the use of power station assets so that less capacity is n~eded, enhance operational. control and give customers greater security of delivery. It will also offer lower lifetime costs than convent~onal storage. The single biggest i n v e s ~ e n ~ Regenesys is that: it will offer lower lifetime costs than either pump
ry plants - energy storage that could curtail peak demands stored, power electronic developments offer 8 fast respo Work and electrical DC energy stored in batteries. These considerations
underline the potential value of energy storage in curtailing daily peak periods and that it would most e~ectively be located near the source of load variations, the consumers in the distribut~on networks [ 183. Coupkd with advanced power electronics, storage systems can reduce h ~ o ~ i c dis~o~ions and elimina~e voltage sags and surges. Most ~istribu~ed ene storage § y ~ ~ m § can be made ~ u l t ~ - ~ n c t ~ o n a ~ with little or no ~ d d ~ t i o n ~ ~ cost, so that, example, both uninterrutable power supply (UPS) and energy ageme me^^ applications can be served by the same equipment. In combination with renewable reso~ces, energy storage can increase the values of p~otovoltaic (PV) and w~nd-generated e ~ e c ~ ~ c ~ t y ,
supply ~oinc id~nt with periods of peak consumer demand. Energy storage systems used to follow load, stabilise frequency and manage peak loads. ~egenesys has a.
number of distinct adv~tages over existing electricity storage technologies like hydro rind battery storage. I t offers all the benefits of pumped-hydro, but can be located here on a power system thus avoiding environmental problems. Though similar to a battery storage plant, ~egenesys is much more flexible. Unlike a battery, the power o u ~ u ~ and storage capacity can be specified individually, Based on h e 1 cell technology, ~egene§ys can be built in modules to the required size ranging from 5 to 500 megawa~s of
water. The water i
I4 Power System R ~ s ~ c ~ r i n g and ~ ~ r ~ g u l ~ t i o n
capacity. It i s able to provide vital services to elec~icity grids, ~ncIudin voltage control. Regenesys could meet peak demand and maximise inve allows better use to be made of the cleanest generating plant by reducing the need to operate less efficient peaking plant. It can also enhance the value of renewable generators such as wind and solar power.
1.6.3 Wind
Cunently some 50 countries have major wind power ins~allations~ Europe is presently the most important market but demand in Asia is growing strongly. Ease o f rapid installation (six to nine months) and a free local source of power make wind an attractive technology in developing countries.
Over 1300 MW of wind-electric capacity has already been instal~ed in Germany and more than 1000 MW is on-line in Denmark. The Danish goal is to provide 10 % of its elecwicity consumption through wind-electric energy by 2005 and more than 40 94 by 2030. At about 4 US cents per kW of installed power, electricity from Danish turbines now costs around the same as the average cost for electricity from coalfired power plant. However, there is no such thing as a single price for wind energy as the costs depend on both wind speed and the accessibility of sites. Wind-electric energy has the potential to supply 25 % of Europe’s electricity needs. Some countries could also export power to neighbour in^ countries.
Potential applications of PVs range €rom basic electrification for the 2 billion people of the world without electricity to the integration of PVs in building structures in deve~oped, urban areas. Customers need complete systems of PV modules, panels and arrays to provide electricity appropriate to their needs. Improved light-to-electricity conversion efficiency of individual cells is less important than reliable, integrated systems. The flexible thin-film amorphous silicon panel is at the forefront of PV technology. D is~ ib~ ted generat~on with PVs has been tested to relieve substation o v ~ ~ h e ~ ~ ~ n g and as a means to defer transmission or distribution system upgrades. Remote locations in developed countries are also prac~ical applications for PVs. ~xamples include water pum~~ngq fence elect~~cation, and radio station power supply. PV is one of the most flexible technology s u ~ ~ l y options available for electric power product~on because they can supply loads from several watts to megawatts.
More than 350 MW of electricity are generated by commercial solar-thermal power plants in the USA. To exploit s o i ~ - t h e ~ a l power hlly, broad~r coop~~ation g o v ~ ~ m e n t , electric utilities and private industry i s ne~ded. The major investments ~ieeded to develop and market solar technology must be supported by stable ~ o n g - t e ~ r e ~ l a ~ o ~ policies, which can only be provided by government. For example, in the UK recent
Energy Gen~r~ t i on under the New Environment 1
studies point to the need of tax equity to improve the economic ~ompetit~veness of solar- thermal plants more than ~echnolog~cal ~reakthroughs.
World concern over carbon emissions, new domestic pollution regulations, ~mprov~ng small-scale technology, and the: prospect of open competition for energy markets are forces that converge to demand greater efficiency in energy generation - to lower hel costs, iiicrease marketable products and reduce emissions. These forces argue strongly for a new paradigm o f dispersed, combined heat and power (CMP) plants that have double the efficiency and produce half the pollution. Although large units will continue to operate in the short term, most will eventually be replaced by new facilities and virtually all new growth will come in the form of small units.
Readily available technologies now exist to combine the generation and supply of heat and power. By capturing unused heat energy, generators and consumers can, in effect, use the same fuel twice. Combining heat and power production reduces the net fuel demands for energy generation by supplying otherwise unused heat to residential, commercial and industrial consumers who have heating and air-conditioning needs.
CHP technologies can be widely implemented. In almost every case, such teGhnologies will save enough money, now spent on fuel, to pay for their capital cost. By combining
roduction and supply, 80 to 90 % of the useful energy in fuel can be put to beneficial use. When these plants extraGt steam from the turbines ar relatively low pressure to drive industrial processes or provide heat, they lose some electricity production, but capture all of the heat, eliminating the use of other fuel to make this heat. Total ef~ciencies can reach 90%, depen~ng on how well the electric and thermal needs are matched or balanced. CHP takes energy from a central electric plant and distributes it to end users as steam, hot water and chilied water using piping networks.
An increase in efficiency of 1% would result in a 2.5% reduction in CO, em~§sions, An UK study suggests that half of the CO, savings required up to 2010 can be met most cast- effectively with CHP. CHP can reduce fuel use, cut emissions and save money. Policy makers should take a ~ ~ ~ a ~ i v e steps to encourage use of CHP. The technology is ~eadily available, has a net economic benefit and can cut fuel consumption and pollutant emissions in the e n e ~ ~ ~ supply industry in half. There are many ways in which r e ~ l a c i n ~ separate heat and power generatiQn with CHP systems can reduce emissions s ign~~c~nt iy . For example, producing 1 kWh of electricity, and a given amount of heat, from hard coal in a CHP system can reduce emissions by almost 30% compared with producin~ both s ~ p a ~ a t e ~ y from the sanie fuel. Using natural gas in the CHP system can reduce e~issions by almost two-thirds compared with generating the heat and power separately from coal.
CHP meets energy needs and can save money for a wide range of energy c~stomers - incl~ding public sector users - and also helps preserve the earth’s precious energy resources, reducing the impact on the environment of harmfbl pollutanls. The GHP shares of European power generation range from about 34% in the Netherlands to about 6% in Sweden, s~~ges t ing scope for large increases in some countries. Energy m ~ k e t deregulation could produce more favourable conditions for CHP, by increasing investmen< innovation and market entry, and decreasing the costs of backup power and natural gas.

16 structuring and ~ e ~ ~ l ~ t ~ ~ n
capital costs of these systems may deter er such inves~ents under
consumers’ inter is fair. In some
renewable energy sources. In Italy, for example, new legislation requires that from 2001 all generators and ~ m p o ~ e r s of electricity will have to supply into the system a quota generated by renewable sources [ X 91. The EU directive allows member states to
n with public services where this is necessary in the general interest of the vided they comply with Community law. Examples could be an oblig~tion for
to p ~ c h a s e a certain percentage of electricity from r~newable energy sources or an obIigation for distributors to supply all customers in their area at an equal
s been good value, and now it is even more so, with the UK d-quality CHP from the Climate Chan will apply to electricity generated fro
gov~~ment ’ s decision to exempt starts in April 2001. This exemp CNP and used on site or sold directly to other bus~e§§es. The govemm$nt belie~es with
f a fair and appropriate fiscal and r e ~ i a t o ~ ~ ~ e w o r k ~ other measures such as negotiated ag~eements with indu ewable genera~ion and efgcient CRP will be ~creased, This should
deliver substantial increases in CBP capacity in the coming years. It should en govemment to a ~ ~ o u n c e , in the coming months, a new CBP target of around 10
of the draft Climate Change P r ~ ~ a ~ m e that would ’s CHP capacity. Action by the UK government an
essential to provide a market environmen~ with incentives and penaiti that the new tec~ologies become available at competit~ve cost and in ample quantity. For dis~bL~ted generators, there have been concerns about treatment of ~ ~ s ~ i b ~ t e d generation by public electricity suppliers (PESs), especially distributed e n e ~ ~ t i o ~ i that they do not
er the new a~angements a dis~ibuted generat~r owned by a PES will be to formal arrangements with the distribution business in the same w
ted generator. The same re~ui reme~t to p u b ~ i ~ h the a ~ ~ ~ m
resent more than
minimise the risk of the ~S-owned generator bein treated in a more favourable way than others.
n e ~ o r k s w311 d e t e ~ i ~ e success or failure in meeting the target. Private deve~o~ers will install the CHP and the renewable energy plant if they see a return for their investment, If
developmen~s are to happen, unpopular measures will be required, such as ssions, incentives for the deve~opmen~ of s u i ~ ~ ~ ~ in§~~lat ions~ and the
relaxing of restrictions imposed by ~ ~ ~ ~ ~ i n g regulations. In order to meet the new o b ~ ~ ~ a t i o n a ~uppIier can either supply the requ~red amount of renewable e l e c ~ i c ~ ~ , or buy
upplier who fails to meet the obl~gation will be required to make a government has recently announced the basis for its new renewable
energy support mechanism. Suppliers will be able to meet their obl~~at ion ~ ~ t h e r by
The p o ~ ~ t ~ ~ a l decisions set the economic framework in which

purchas~g ~enewable energy or by able to buy out a
e total cast of meet
chasing tradable green ce~ i~ca tes . A ~ ~ e ~ i a ~ v e ~ y , of their obligatio~~ ligaticsn and the associated inc
t ~ o ~ g ~ to the end user. In addition, the provision of a le sources at p r e ~ ~ u m prices via the NFFO and also the D 's New and Renewable Energy ~ r o g r ~ i ~ has resulted
There are a number of le~~slative and policy ~ e ~ ~ l o ~ m e n t s c ~ e n ~ l y in hand h hat will impact on d i s~ r i~u~ed ge~~rat ion and influence its growth. The Utility Bill is aimed at p u ~ ~ g the customer first. The Bill will ~ntrodu~e i r n ~ o ~ t changes to the I98 Act. These changes will include the in~oduction of new ~ a d i n g and seXling electricity, separation ofthe PES supply and dis~ibuti
ion on s u ~ ~ l i e r s to meet targets an renewable electricity. AI1 of these c e ~m~ l i~a t i ons for some if not all distributed generator^. In gove
d e p a r ~ e ~ t has a ' een ~inister ' with responsibi~~~y for ensunn that energy e f~c~ency targets are met. Tar~ets have been set in some ~ ~ ~ a ~ e n ~ s for sourc~ng ene renewable sources (such as wind) rather than conven~~onal genera~~on.
e~egulatio~ has led the e lec~ci ty i ~ d u s t ~ to focus a~ention on the costs of ors to reduce their costs and ~ ~ i r n i s e their ri
~ Capital costs, construction time, h e 1 costs, up and provides incen~ives investing in smaller scale rn~ tenance costs will d~c~s ion on what p~ants are
osts ~ e ~ e ~ ~ on the s p e c i ~ ~ site as well as the s ~ e c i ~ c a ~ i o n (size, oper~tiona~ reliability, e n v i r ~ n m e ~ ~ ~ performance, safety r e q u i r ~ m ~ n ~ , etc.). Costs will be
ant built an the gr~enbelt CO
existing ~ i i f r ~ s ~ c ~ r e can be used. Plants close oses and avoid costs for CO
rent sourc~s as each project is site s-fired plant can vary &om US$300 om ~ S $ 9 ~ ~ ~ W e for
advanced c o a ~ - ~ r e

1 Power System Restructuring and ~ e r e ~ i a ~ o n
corresponding to the replacement of major plant components after 20-25 years, whereas coal-fired plants can reach up to 30-40 years of life.
A l ~ o u g h gas-fired tecknology is cheaper in U S $ ~ W e terns there are other factors that should be taken into account. Natural gas is not available in every country and prices are not always competitive. Moreover the i n f ~ ~ ~ c t u r e to produce and more capital ~ntens~ve than the equivalent costs for coal. As discussed upstream capital costs are considered in the competitiveness of gas coalfired plants then the capital expenditure associated with both ~echnologies could be the same. The high costs of the pipeline network to t r a n ~ p o ~ gas can outweigh the difference in capital costs for plant construction. If in place, the electricity generator can benefit from
d build cheaper gas-fired plant. However, as d e ~ a n d cture will be needed. It is estimated that to c in Europe (1.7% annual growth from t 999 to
i n f r ~ s ~ c ~ ~ ~ of US$l00-200 billion will be required [23]. Such inv unde~akeii only in the fr~mework of long-term contracts and it i s unc
rofitable in competitive electricity and gas markets.
1.9.2
Clean coal technolog~es is a tern used for ~ e c ~ o l o g i e s that achieve a higher effici~ncy and
Technology Advances - Clean Coal ~ ~ c ~ n o ~ o ~ i ~ s
ns for converting thermal energy to electricity than conventio~al pul on (PCC) with subcritical steam and without emissions control. The
also u s ~ d to include e ~ s s i o n control systems such as 0, control equipment. Clean coal technol~gies are the way forward for coal as they can ensure compliance with the ~ig~tening env~onmental standa . There has been considerable effort to develop these t e c ~ o l o g ~ e s at compe~itive cost eserves of coal are large and widel~ ~~str ibuted likely to continu~ to be widely used, so more efficient and cleaner coal technologies (CCTs) are an i i npo~an~ option in a future energy strategy. CCTs will enable the use of coal with higher ene~gy efficiency and minimum e n v i ~ o n ~ e n ~ a ~ i~pacts . .
types of coal technologies applicable to large-scale power ~eneration: PCC t e c ~ o l o g ~ e s with emiss control e q ~ i p ~ e n ~ ( ng fluidised bed combustion C); pressurised fluidi and ~ntegrated gasi~cation combined cycle (IGCC) tec~o log~es.
status of these technologies today and a compa~son
ing and construction of plants using these technologies worldwide technologie~ with gas-fired power generation in various c
(241. CCTs can also be used to repower existing coal-fired power stations a~proaching the end of their lifetime, instead of buil~ing new plant, and therefore red~ce overall costs. ~ e ~ o f i ~ ~ n g pollution control equip men^ is also important as future and exis~jng coal-fired plant may need to meet increasingly stringent environmentai standards.
nergy is one of the most critical reso~ces for that energy c o ~ s ~ p ~ i o n will at least do
facto~ of up to five in the next 100 years. At present 1

19 Energy Generation under the New Environment -
energy poses threats to the climate, with potentially severe enviroi~men~al consequences~ given the levels of consumption likely in future, it will be an immense chal the global demand for energy without unsus~inable long-term damage to the environment. This situation has attracted the attention of political leaders across the world, and at the Kyoto meeting of the parties to the UN Framework Convention on Climate Change in Dece~ber I997 there was agreement to tackle one aspect - the amount of greenhous~ gases emitted to the atmosphere. The levels of atmospheric CO,, for example, have increased from 285 ppm before the ~ndustrial Revolution to about 350 ppm now. Xt is now generally accepted that there is a strong case for acting to mitigate the threat of drastic clima~e change associated with the unrestrained continuation of this trend. The Kyoto meeting produced pledges by the industrialised nations to cut their GWG emissions, by 20 12, to an average of 5% below the 1990 levels.
Deregulation could play a positive role by giving flexibility to different plants or even countries to trade emissions. In this way a generator could have a portfolio of plants including some using renewable energy and therefore meet overall environmen~al requirements. It could also help the development of less costly pollution coatrol technologies. In the single European electricity market, however, where electricity will be traded between member states, it is not yet clear where to allocate emissions. It could be the country where electricity is produced or where it is actually used, This is particularly important in the view of commitments to reduce GHG emissions.
US env~ron~enta~ regula~ions have caused a niajor shift in demand for lower sulphur coal supplies. Since the 1990 amendment to the Clean Air Act, there has been a noticeable shift in coal use by ~enerating companies in the USA towards lower sulphur coal.
~ e r e g u I a ~ i ~ n increases the oppo~ni t ies for using CEiP, since the power ~enera~ed can more easily be distributed and sold. GWP units can supply both electricity and heat at the same time, achieving high efficiencies and therefore reducing emissions to th compared with separate generation of electricity and heat. In all c o u i i ~ ~ s economical on industrial sites or community heating schemes where there is heat. In deregula~ed markets industrial users can set up a small CHP plant on their sites to sup~ly heat and sell any surplus electricity to the local grid. Before deregulat~on this practice was either not allowed, or at least not encouraged in many countries 1241.
There are two ways to reduce GHG emissions. One way is to increase our re l~~nce on nuclear power; the other is to develop a wide range of alternative methods of ex~ac t~ng energy from nature. The nuclear option is clean and feasible but it is hard to See opin~on would switch from its present hostility to the acceptance of a massive pr of c o ~ s ~ c t ~ o n of new nuclear power stations. The role of nuclear power is ex decrease in Europe as the perception of its environmental and economic p e ~ f ~ ~ a n c e has substan~ially chang~d, In the 1970s nuclear power was regarded as a source of cheap and em~ss~ons-free electricity. High costs invoived in decommissionin~ nuclear reac~ors and the unresolved issue of nuclear waste have changed the image of nuclear plants. Italy has phased out nuclear generation since the early 1990s after the Chernobyl accident. ~ e ~ a n y decided in late 1998 to phase out nuclear power and is now d~seuss~ng possible ways for implementation. The UK ~ o v e r n ~ ~ n t has plans to start phasing out nuclear power in It is clear that the construct~on of new nuclear plants in Europe will cause pubI~c oppos~~ion and is unlikely to materialise, particularly in deregulated markets where such ~ n v e s ~ ~ n ~ s are not competitive, as they are too expensive. The contribution frorn nuclear power to the fuel mix is expected to decrease and will be replaced by other sources ~ne~uding coal.

Power System R e ~ ~ c ~ i n ~ and ~ e r ~ ~ u l a t i o n _sl__
power, the power system must evolve to deliver 11 reinfor~e the need 10 ensure diversity f b m
~ a ~ ~ d market the e n v ~ r o ~ e n t a ~ image of fuels and t e decisions taken by developers and ~ o ~ ~ ~ ~ c i a n s fo ~ompet i t~on in retail will certainly create
c o n s u ~ ~ ~ s to influence ~ ~ v e l o p ~ e n t s . Although cost an ~~a~~ f a c ~ o ~ a~f~c t ing c ~ ~ t o ~ e r choice^ as e ~ v ~ r o n ~ be ~ n f l u ~ c e d by the e n ~ i r o ~ e n ~ considera~io~~ suppliers are ~ ~ ~ n ~ j n g or have launched environm
e l e ~ ~ i c i ~ from r~~ewab le energy projects. An opinion poll in the 6% of c o ~ s ~ i ~ e r s w o u ~ ~ prefer to buy e l e c ~ c ~ ~ from renewable sources, but only 21%
e p r e p a r ~ ~ to pay more for it. In ~ a ~ ~ f o r n i a an energy supply company has ~nergy scheme which gives eustomers the option to buy a part of or all om r e n ~ ~ a b l e energy sources 1251.
some c o u ~ ~ ~ e s there has been opposition to the cons 1 r~a§o~§ . The poor environmen~l im erive from the pollu act on new projects.
plants of an earlier g e ~ e r ~ ~ i o n . This state-of-the-art pl
where the r e s i d u ~ ~ are re~sed in building ~ater ia ls can ~ o ~ e ~ n ~ e ~ the ~romotion of CCTs and their excellent en~~ronmen~al perfo
a role for coal plants in the re [24f.
f the ge~erating ~ ~ n c t i o n have chan d new capacity, and, if t h e i ~ ~ u d g e ~ ~ ~ t is face an additio~al u n k ~ o ~ n that is, . To ~ i n i ~ ~ s e their risks, they
ds and low unit capital CO
e, it is expected that ne
ercut c ~ n ~ a l § ~ ~ ~ i o ~ u ~ i l ~ ~ costs and have
grid is fin e l e c ~ ~ ~ ~ l ~ y ~ s ~ ~ a t e ~ set of gene~f i~~rs of c ~ s ~ o m ~ r § [28-403.

Energy Generation under the New Environment 1
any studies indicate that distributed generation (DG) might play a s ign~~cant role in the future power system structure. A study by the Electric Power Resea (EPRI), for example, indicates that by 2010,25 % of the new generation will be distributed [41]. Owing to variations in ~ o v e ~ m e n t regulat~ons, different de~nitions for DG are used in different countries. In England and Wales, the term ‘dis~ibuted generation’ is predominantly used for power units with less than 100 MW capacity. In Sweden, DG is oRen defined as generat~on up to 1504 kW. In Austra~~a DG is ofken defined as power generation with a capacity of less than 30 MW. In New Zealand, DG is often considered as generation up to 5 MW. There is no special definition of DG in the Californian and N o ~ e g i a n electricity markets.
A general ~ e ~ n i t i o n for DG could be an electric energy source c o n n e c ~ ~ directly to the distribution network or load centre. DG is decentralised and located closer eo the point of
reater economic and env~ronmen~l sense. Several main reasons have combincd to make DG a technically, commercially, environmentally and, to an extent, politicalIy attractive proposition.
Customers benefit from the success of DG because:
The use of distributed energy will allow improvements in the dispatchab~li~ of resources and improve the integrity of the ~nstnission and dis~ribu~ion systems. Identii~cation and use of alternatives to power generation, transmission and systems controls will ~mprove load levelling, load manage men^ and overall power quality, The system will become more robust in its ability to tolerate natural disasters, suffer less damage and minimise the dependence upon the need for ~ ~ e d i a t e res~oration of rhe grid system. Over~ll system reliability will improve.
To get a better unders~nding of the possible fbture develop men^ of DG in a com~eti~ive market, some examples of typical DG applications are as follows:
~eiiewable energy technologies, e.g. wind power or solar power. These projects receive certain subsidies, or customers might pay premium prices for renewable en Peak supply systems, based for example on emergency generators or on-site uch systems ~ ~ i c a l l y sell to the wer exchange for only a very short period per year
to capture exlremely high peak pri CWP systems, e.g. district heating, whereby a high efficiency can be achieved and additiona~ revenue from selling heat can be obtained. On-site generation based on microturbines or fuel cells. Electricity as well as hear are most likely to be used locally.
1. I U. 1
In competitive power markets, DG competes with cenlralised power generation. Hence, market regulatiosls should ensure that DG can act freely within power markets, similar to centralised generation. Tt is, however, often argued that most market ~ e g ~ l a t i ~ n s used
Market Regulation

Power System K e s ~ c ~ ~ n g and ~ ~ r ~ ~ l a t ~ o ~
worldwide have been designed with large centxalised generation in mind and that, therefore, DG ofien faces significant barriers w~thin the competi~~ve market.
1.10.2 The Power Pool
The power pool is used to create an efficient marketplace for trading electricity. The power by a c e n ~ a ~ ~ s e d , independent or sation that defines the
s, as well as organising the bidding and eva~uation procedure. The evaluation of power pod r e ~ ~ a t i o n s regarding the t r e a ~ ~ n t of DC is a very complex issue.
The main difference between various approaches for e lec~ci ty ~ ~ r k e t s is that the trading o f electricity through a power pool (or power exchange) is optional in some countries, e.g. in Nord Pool ( S c a ~ d ~ a v i a ~ , and m a ~ d a t o ~ in others, e.g. ~ n g ~ a ~ d and ~ a ~ e s as well as in the National Electricity Market in Austra~ia. In ~ a l i f o ~ i a , the
ation in the pool market is optional, except for three large private utilities. They trade through the power exchange until the year 2002.
The rea~on for a regulator to set up a man~ to ry pool system instead of an op~ional market is usually to achieve a high market transparency~ e.g. to prevent some large ~ ~ n e r ~ t o r s from gaining market power. In ge~eral, all market pa~icipants will b e n e ~ t from
arent power market however, other options are also possible to prevent large rs g e ~ ~ n g market power, e.g. by splitting up the generators as was done in New The disadvan~age of a mandatory pool approach is that all market p a ~ i c i p a n ~
have to join the pool. That leads to various fixed costs, e.g. members~ip fees, and or energy fees. Both fees are a way to recover the cost for the operation of the power pool. The me~bership fee is usually a fixed annual fee and the energy fee is based on the energy a c ~ a l l y traded via the power exchange. These costs may be a major b ~ndepe~dently owned generation companies that focus on DG to enter the electricity market. Therefore, exception§ to the mandatory rule were incl~ded in the re ~ n ~ l a n d and Austra~ia for small-scale generation. The exce~~ions depend on ~ n s ~ l l e d capacity (30 to 50 M ~ ) of the DG source. N source with a capacity of 25 MW to be treat
aural iand an urban distribution network. Mence, regulations based on a certain installed capacity influence the way certain market pa~ic ipan~s to behave.
The cost problem for p a ~ ~ c i p a t ~ g in the pool market, however emains, even if certain capacity limits are removed, This issue is of particular interest €or 6 concepts that aim at
power generation, probably for only a few hours r year. To c a ~ ~ r e the ing e ~ ~ e m ~ ~ o a ~ p ~ c e peaks, these dis~ibuted ~enerators must p~~ ic ipa te change. Therefore, high annual fees can be seen as a major barrier for
nerators to participate in a power market. As a solu~ion, the cost recover for of the pool e x c h ~ g e should mainly be based on energy fees, In additio~, it
oned that within the national electricity market in Australia d i s ~ ~ u t e d to sell all generated power within the d ~ s ~ b u t i o n n e ~ o r k [ i~cantly reduces the market o ~ p o ~ n i t ~ e s of small-scale gene~ation. With e treatment of the individual imbalance of each market ~ ~ i c i p a ~ t is ant for fluctuating power sources, such as wind or solar power. Such
is usually ards for ele rice bids and the eva~uation of thes
ver, there is no obvious reason for a fferently from one with a capac~ty o
u ~ h e ~ o r e , technical limitations in a distribution n e ~ o r k may

Energy ~cneration under the New E n v i r o ~ e n t a
t e c ~ o l o ~ i e s have the d ~ ~ a ~ v ~ ~ g e that the power output during an upcornin urs, can only be pre~icted with some ~ c e ~ a i n ~ for e
are three main ~ r o b l e ~ ~ associated with the pool price:
ts effectively bypass the pool. a1 price is paid to all, it i s ~ a t h e m a ~ ~ c a l l ~
3. Average pool prices bear no relation to any real price p hence of gene ratio^ has been falling steadily since 1990. until about 1994, s t e a d ~ e ~ ~ and now seem set on an U
Figures 1.3 and 1.4 show the pool and cen~ra~ised an er at ion, but most renew low (33 kV or below) voltztge networks. So c l e c ~ i c i ~ wholesale prices, w h is wrong. The c h ~ a c t e ~ s t ~ c s o c o ~ p l e ~ i ~ of bids 001 capacity ~ a y ~ ~ n t s . These
lack of tr~sparency in contracts for onsumer con~~ence . As a result, n
Contracts for
re I. 001

needed reforms

Energy Generation under the New Environment 5
renewable and CWP enerators, are conce~ed since the a ~ ~ ~ e ~ e n t s will f a v o ~ tors with flexible and predic~ble redictable o u ~ u t will face
ill b e ~ ~ ~ t from the
and those gene~tors with ~nflexibl
oked at in a wider context. er d is~buted generators are likely to grow s
coming years and the government has, therefore, paid cmfbl attention to new e l e c ~ c ~ ~ market that may adversely ens~re that ~ i s ~ b ~ ~ e d ~enerators, inch d ~ s ~ i b u ~ ~ o ~ market on fair terms. As p
t the economics of DC. It is i ~ p o ~ a n t to CHP, obtain access to the el META, a ~ ~ g e i ~ e n t s that wil
to ana age their risks and achieve fair osals too, to deal with the needs of
generators.
A n ~ i ~ l a ~ s ~ ~ i c e s are those nctions ~ e r f o ~ ~ d to s u p p o ~ the basic services of c a p a c i ~ ~ energy supply and power delivery. The costs for ancillary servic s i~n i~cant ; for e x ~ p ~ e , in the USA the total costs for ancillary services are about
and mark^^ ~ a ~ i c i p a n ~ s that we able , the ancillary services are split up i
erat~on of ~ l e c ~ i c i ~ y ~istrib~ited ~enerators with~n distri issues concerning real and reactive r qua~ity [ 1 ~,30,~4] .
ution networks operate on a radial or open-r designed broadly on principle that load reduces along the I of each distr~~utor. d i s t ~ ~ ~ t e ~ g ~ ~ e r a t effectively reverse th point on a distributor or interconnected network and this could affect c o n v e n ~ ~ Q ~ ~ 1 automatic voltage control schemes which cater only for conveneio the design of protect~ve relaying systems i s much more complic going both ways.
buted generators, such as the majority of wind gene~ators a d sma1I”s~a~e ased on induction ~ach ines which have no stead~-sta~e reactiv
generation c a p a ~ i ~ i ~ . There is a need to import react~ve power to provide Geld exci
ators, partic~lar~y s~~chronous genera~ors, can lead to localised increases ich can potentially exceed the sho~-time ratings and ~ a ~ i n g ~ t i n ~ s o f
~ o t e n ~ ~ ~ p r o ~ l e ~ ~ arise with systems us create h a ~ o ~ i c disto s y s t e ~ s s ~ b ~ e c t to rap
inversion (e.g. PVs
erspective, the effect of DG is that networks will be~ome more active in le in behavio~r. From a gene~~or ’s perspective^ althoug~ it may to overall capacity, the char~c~e~st ics of ge~erators and tible, and network c o n s ~ a ~ n ~ s could result in ~enera~ors
Inc r~as~d use of CMP and co-generatiQn will result in lower usage of the ~ e ~ o r ~ in? terms of energy ~ a n s ~ o ~ ~ a t i o n and, therefore, po~entially lower lev~ls of income. The
e to i n c r ~ s e rather ~han r e ~ u ~ e c a p ~ ~ l e olling a more compl~x and increasingly
~ ~ e r a t Q r s suitably located may also offer benefits to a d~s~ibutor by, for ex o f f s ~ ~ ~ ~ the need for re~nforcement or provis~on of other s e ~ i c e s such as voltage
ayments to generators will be s u ~ s t i ~ t i n g for other ex~enditur
1.10.
uppose t is a need to replace a circuit breaker as the fault level. It is i ~ p o ~ a n t to s~ress
Energy ~ e n ~ ~ t i o n under the New E n v i r o ~ ~ n t 7
installed because of all ge~erators. The contr~bution of each generator can be re~dily onventional short-circuit analysis tools. These con~butions to the s h o ~ -
ate the cost of replacing the circuit b such as there would not be a need to ear, cannot be credibly used to re
entry to recover all system reinforcement cost. In this case, the distri rep~aces the circuit breaker, and in the following price review peri system charges accordingly to all generators with respect to their con~ibution in order to recover the system investment.
The der~vation of charges for assets that provide the connection of a discre~e plant to the system should be differentiated from those for the use of the system. In the former case the asset i s provided for a sole user and could have been financed directly, and even owned, by that user. In this instance charges should be based on the histo~c cost of the asset and a fair return on the cost of the capital provided by the d~stribution company. In the latter case the assets are used by a number of system users, past, present and fbture, and charges should be on the basis of a tariff differentiated by voltage. The d ~ ~ c u ~ ~ arises as to how reinforce~ent costs of the infrastructure of the system should be treated when a new user joins. There is also a d i ~ ~ u 1 ~ with the costs of s ~ r ~ d e d i n ~ a s ~ c t u r e assets when an existing user departs.
In regions where renewable energy resources are abundant but usually situated in remote locations, connection to the central power grid is expensive and in many cases ~ ~ ~ ~ c u ~ t to provide. Small-scale, autonomous generation schemes, on the other hand, are both economical and practicable. They utilise the energy resources available and supply the consumers in the local regions. The system cost can be reduced by using c a g e - ~ e , sdf- excited i n d ~ c t i o ~ ge~ierators (SEIGs) [47-521 since these machines are cheap and r ~ a d ~ l y available.
~utonomous power systems often employ single-phase g ~ n e ~ t i o n and dis~bution schemes for reasons of low cost, ease of maintenance and simplicity in protect~on [53]. When a three-phase SEIG is used to supply single-phase loads, however, the stzator c are ser io~s~y unba~anc causing degrada~ion in generator perfo ov~rcu~ent , overvoltage can be alleviated to a c the excitation c a p a c i ~ c e and load are connected across different phases. For isolated operation, however, perfect phase balance cannot be achieved when the load is purely resistive.
The objective of this case study is to introduce a modified ~ t e i n m e ~ c o ~ e c ~ i o n that enab~es perfect phase b a ~ a ~ c e to be achieved in a ~ e e ~ ~ h a s e SElG which supp~ies single- phase loads. A general performance analysis is presented and experimental results are given to validate the princip~es.
efficiency and machine vibration. These xtent by the use of the Steinmetz c o ~ n ~

~ ~ r ~ ~ i t ~ ~ ~ n ~ ~ ~ ~ ~ n and ~ ~ ~ ~ ~ ~ l e
Figure 1.5 shows the mdified Steinmetz connection (MSC) for a ~ ~ l ~ - c o n n ~ t e d SEIG, which supp~~es a s ~ n g ~ e - ~ ~ a s e load. It is assumed that the rotor is driven in such a d~~ection that it ~ ~ v ~ ~ s e s the stator winding in the sequence A-B-C, i.e. in h e same direction as the positive-sequence rotating field. Hence, if A-phase is taken as the reference phase, B-phase is regarded as the lagging phase. The main excitation capaci~nce G2 and the auxiliary load res~~~ance RL2 are c ~ ~ ~ t e d across B-phase (the lagging phase), while the ~ u x i ~ i a ~ excitation Gapacitance 6, and the main load resistance R,, are connected across A-phase (the reference phase). Compared with the original Steinmetz connection [54], it is no that the auxiliary load r ~ s ~ s ~ c e RL2 and a u x ~ l ~ ~ excitation capaci t~ce C, have introdu~ed. These circuit elements provide additional current components that result in the flow of bdmced line currents into the SEIG.
load resistmce RL2 cm be local loads such as lighting, storage heating or battery charging Alternatively, it could be a portion of the remote loads.
For the purpose of analysis, all the circuit parameters in Figure 1.5 have been referred to the base (rated) frequency hose by introducing the per-unit frequency a and the per-unit speed b [55] . Thus, each voltage shown in Figure 1.5 has to be m~ltipl~ed by a in order to give the actual value and the per-unit slip is equal to (U - b)/a. Besides, the motor convention has been adopted for the direction of phase and line currents.
The ~hase-balancing capabiIity of the MSC for a three-phase S E E may be studied by re€erence to a ~ o l t a g e / c ~ ~ n t phasor diagram. It is assumed that the values of C, and C, are su~cient ly large so that the SEIG has built up its voltage and is supplying the loads. Figure S.6 shows the phaasor diagram for the SEIG under balanced conditions. Because the
is delta ~onnected, the line currents I,, I, and I3 lag the c o ~ ~ o n d ~ ~ ~ phase voltages V,, V, and V, by ( ld , f d 6 ) rad, where lli, is the positive-sequ~nce impedance angle of the S E E .
The line current 1, is contributed by the current Ia through C, and the current lR2 through RL2. ~ ~ e a n w h i ~ e , the line current I , is contributed by -Icl (where Ict is the current through 6,) and -IR, (where IR, is the current through RLl) . It can be shown that the angle y between 1, and I, is equal to (4 ~ 2 d 3 ) rad, while the angle Sbetween -IR, and I , is (5x16 - bP) rad. The phasor diagram in Figure 1.6 can be drawn only when la leads 12, which implies that perfect balance can be achieved for values of #p ~xceeding 2x13 rad.
In a practical aut~nomous power system, the auxili

Energy Generation under the New E ~ v i ~ o ~ e ~ t
_/_3__
a ~~g~~~ 1.5 Modified Steinmetz connection for three-phase SEIG
From the current phasor triangles in Figure 1.6, the following relationships can be deduced:
For a given total output power, (1.1) to (1.4) can be used to determine the values of the load and phase converter elements required for perfect phase balance, provi and a of the SEIG are known.
Equation (1.2) shows that B, vanishes when 53, = 5n/6 rad, which innplies that the auxiliary capacitance C, can be dispensed with. When #,, exceeds 5a/6 xad, B, becoines negative, i~p ly ing that perfect balance can be achieved with an auxiliary induc~ance. In practice, however, the full-load power factor angle of an SEIG ranges from 2 d 3 rad to 4n/5 rad, and hence it is very likely that an inductive element need be used.

B
Phasor diagram of SEIG with MSC under balanced conditions
A general analysis of the SEIG with MSC can be carried out using the method of s ~ ~ e ~ i c a ~ Gompone s. All the equivalent circuit parmeters are as be ~ o n s t a ~ t except the magnetisi reactance, which is a fbnction of the posit nce air gap voltage. With reference to Fig. 1.5, the following 'inspection equations' E561 may be w ~ ~ e n :
where,
1
Z1
y , = - = G1 + J
and
~ q ~ a t ~ o n (1.6 j implies that z~ ro -sequ~ce voltages and Gu~ents are absent in the SE1 solving (1.5) to (1.8) in terms of the delta system of synmetrical ~ o r n p o ~ ~ ~ [57], the ~osi~ive-se~uence volta~e V, and nega~ive-sequ~nce voltage V, cm be d e t ~ ~ i n e a :

Energy ~ e n e r ~ t i o ~ under the New Enviro~ent 1
Y,+-Y2
Y2 -t- Y p + Y,, v,=&v. A ( 1 . 1 1 )
v,=J?v. (1.12) Y2 + Yp+ Yn
where Yp and Yn are the positive-sequence and negative-sequence admittances of the SEIG. The input i ~ p c d ~ c e Z,, of the SEIG when viewed across stator terminals 1 and 3
(Figure 1 .S) is given by
Yz + Y p + Y n
3 Y p Y , -i- Y p Y2 + Yri y2
Appiying ~ ~ c ~ o f ~ s voltage law to loop 1345 in Figure 1.5,
(1.13)
For successful voltage build-up, I , f 0; hence
L + z,, = 0 (1.15)
Equation (1.15) can be solved for the excitation fkequency a and ma~et is ing reactance X,. d X, have been de te~ ined, the positive-sequence air gap voltage is found from tisation curve. The generator performance can then be comput~d using (1.5) to
(1.12).
The input impedance Z,n as given by (1.13) involves the generator admittances 5 and Y, whose real and i m a g i ~ a ~ parts are high-order polynomials of a X,. As a result ofthe algebraic manipulations involved, both R,, and &,! in (1.13) are extremely complicated functio~s of the above ~ W O variables. Serious difficulties will be encount~red when solving (1.15) using conventional techniques such as the Newton-Raphson method [47] owing to the lengthy mathematical derivations required. To overcome these d ~ ~ c u l ~ ~ ~ s , a function minimisation t e c ~ i ~ u e is employed in this case study for solving (1.15). This is based on the o b s e ~ ~ t ~ o n that, €or given values of a and X,, the input i m p ~ ~ ~ c e Z,, can be ~ o ~ ~ u t ~ readily.
The following scalar impedance function is first defmed:
z (a , x,> = (1.16)
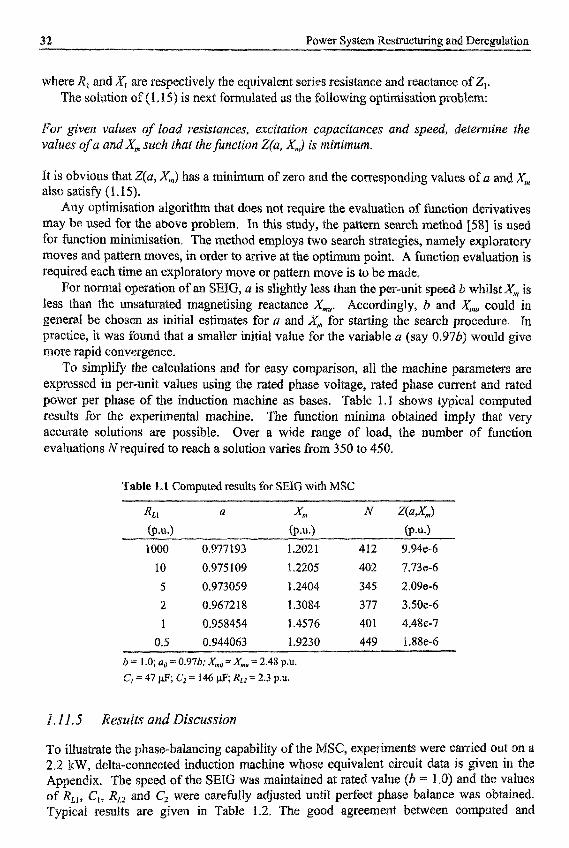
32 Power System Restructuring and Deregulation
and X , are respectively the equivalent series resistance and reactance of&. olution of (1.15) is next formulated as the following opti~isation
For given values of load resistances, excitation capxitancm and speed, determine the values of a and X, such that the function Z(a, XJ is minimum.
It is obvious that Z(a, ) has a minimum of zero and the corresponding values of a and X, also satisfj (1.15).
Any o p t ~ ~ ~ s a t i o n algorithm that does not require the evaluation of ~ ~ c t i o n d~va t i ves may be used for the above problem. In this study, the pattern search method 1583 is used for ~ n c t i o n ~ ~ i m i s a t i o n . The method employs two search strategies, namely exploratory
rn moves, in order to a r b e at the optimum point. A ~ n c ~ i o n evaluation is required each time an expioratory move or pattern move is to be made.
For normal opera~ion of an SEE, a is slightly less than the per-unit speed b whilst X, is less than the unsa~a ted magnetising reactance Xmu. A c ~ o r d i ~ ~ l y , b and X,,, could in general be chosen as initial estimates for a and X, for starting the search procedure. In practice, it was found that a smaller initial value for the variable a (say 0.97b) would give more rapid converge~ce.
To simplify the calculations and for easy comparison, all the machine p~ameter$ are expressed in per-unit values using the rated phase voltage, rated phase current and rated power per phase of the induction machine as bases. TabIe I . 1 shows typical computed results for the $xper i~en~al machine. The hnction minima obtained imply that very accurate so~utions are possible. Over a wide range of load, the number of hnction evaluations Nrequired to reach a solution varies from 350 to 450.
~ a b ~ e 8.1 Computed results for SE16 with MSC
RL, U xtn N z(Rm (P.U.1 (P.U.) @.U-)
1000 0.977 193 1.202 1 412 9.94e-6
10 0.975 109 1.2205 402 7.73e-6
5 0.973059 1.2404 345 2.09e-6
1 0.958454 1.4576 401 4.48e-7
2 0.9672 18 1.3084 377 3.5Oe-6
0.5 0.944063 1.9230 449 1.88e-6
b = 1.0; ail = 0.97b: X,,, - z,,, = 2.48 p . ~ . C, = 47 PF; Cl 146 PF; R u = 2.3 P.U.
To illustrate the phase-bal~cing capability of the MSC, ex~eriments were c 2.2 kW, de~~-conn~cted induction machine whose equivalent circuit data i s given in the Appendix. The speed of the S E E was m a i n ~ i ~ e d at rated value (b = 1 .0> and the values of RLi9 C,, RI.2 and C, were carefully adjusted until perfect phase balance was obtained.
ical results are given in Table 1.2, The good ~greement between ~ o ~ p ~ t e d and

neration under the New Environment 33
results confirms the principle of phase ba l~c ing for a three-phase
~ondi~ions for perfect phase balance in three-phase S E E with MSC
v Zph YP @P RL, c, RL2 c2
@.U,) @.U,) @.u.) (deg) @.u.> ($1 @.U*) @.U*)
0.918 0.967 1.053 130.8 0.59 50 2.73 146
(0.56) (49) (2.82) (146)
0.835 1.037 1.214 134.7 0.51 49 1.78 I68
(0.49) (46) (1.87) (167)
0.805 0.954 1.186 135.5 0.52 44 I .64 161
(0.50) (4%) (1.83) (160)
0.796 0.789 0.992 133.8 0.62 41 2.26 136
(0.61) (39) (2.
Normal: experimental values; bracketed: computed values
~igures I .7- I ,9 show the steady-s~ate per fo~ance of the SEIG with elements fixed at the following values: C, = 47 pF, C2 = 146 pF and RL2 seen that the SEIG i s balanced at a load current (experimental value) of 1 co~esponds to a phase voltage of 0.86 p.u. and a phase cunent of 0.92 electrical power output is 1.63 p.u. (1940 W, or 88% of rated power), of which 80% is delivered to the main load RL, while 20% i s consumed by the auxiliary load RL2. Under the above conditions, the p e r ~ o ~ a n c e of the SEIG is the same as if it were excited with balanced capacitances and supplying a balanced load. For loads close to the balanced opera tin^ point, an experimen~al efficiency of 80% can be obtained. Very good c ~ ~ e l a t i o n between computed and exper imen~~ results is obtained; hence the validity of the
1.7 and 1.8 show that, when the values of the phase converter elements are ents and voltages in A-phase and B-phase may exceed the rated values when
the load is reduced, particularly when the SEIG has been balanced at heavy loads. metho~ to alleviate this unde§irable effect i s to balance the SEIG at part load (say 80% of full-load current). The ~ e r f o ~ a n c e of the SEIG will then be §a t~s fac to~ etw we^ this load and full load. Another method is to balance the SEIG again at smaller loads, which involves ~ ~ l t i ~ v a l u ~ ~ phase c o n v ~ ~ e r elements controlled by a s ~ p ~ e swi~hing s ~ a t e ~ .
a1 component analysis and solution technique is verified.
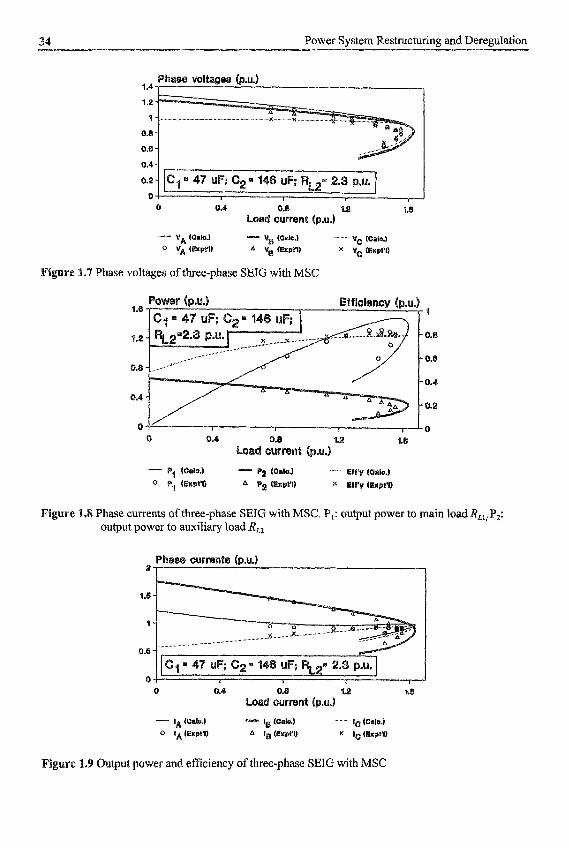
4 Power System Restructuring and ~ e r e ~ ~ a ~ i o ~
volt 4.1
igure 3.7 Phase voltages of three-phase SEIG with MSC
Phase ciurents ofthree-phase SEIC with MSC. P,: output power to main load RLI: P,: output power to auxiliary load R,,
2
1.6
1
0.6
re 1.9 Output power and efficiency of three-phase SEIG with MSC
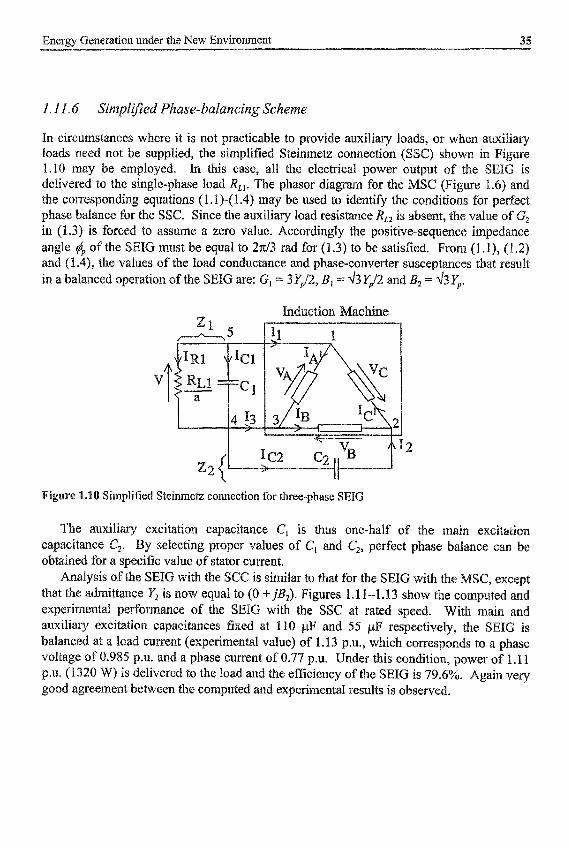
Energy ~ e n ~ ~ a ~ o n under the New ~ n v i ~ o ~ e n t 5
1.1 1.6 ~ i m ~ i i ~ ~ d P~a~e-balancing ~ ~ ~ ~ r n e
In circumstances where it is not pract~cable to provide auxiliary loads, or when a u x i ~ i a ~ loads need not be supplied, the simplified Steinmetz connection (SSC) shown in ~ ~ g ~ e
be employed. In this case, all the electrical power output o f the $E to the sing~e-phase load &,. The phasor diagam for the MSC (Figure 1.6) and ondiiig equations (1.1)-(1.4) may be used to identify the conditions for perfect
phase balance for the SSC. Since the auxiliary load resistance R,, is absent, in (I .3) is forced to a s s u ~ e a zero value. Accordingly the posit~ve-seque angle bp o f the S E E must be equal to 2n/3 rad for (1.3) to be satisficd. F and (1.4), the values of the load conductance and phase-conve~er s in a b a ~ ~ c e d opera~i~n of the SEIG are: G, = 3 YJ2, B, = 43 YJ2 and
T
~ j ~ p i i ~ e ~ Steinmetz connection for three-phase SEIG
The a u x i ~ i a ~ e x c i t a ~ ~ o ~ capacitance C, is thus one-half of the main exci~a~ion y s e l ~ c t i ~ g proper values of C, and C,, perfect phase balance can be
of stator current. with the SGG is simiIar to that for the SE1 ow equal to (0 +&). Figures 1.11-1.13 s
e x p ~ r i ~ e n t a ~ p e ~ o ~ a n c e of the SEIG with the SSC at rated s excitation capacitances fixed at 110 pF and 55 pF re at a load c ~ e n t ( e x p e r i ~ e n ~ l value) of 1.13 P.u., whic
voltage of 0.985 p.u. and a phase current of 0.77 p.u. Under this p.u. (1320 W) is delivered to the load and the efficiency o f the SEIG is 79.6%. Again very good agree~ent b e ~ w e ~ n the co~puted and experimental results is observed.

1.
1”
0.
El.
0.4 -/ I
4 Phase vohges of t ~ ~ ~ p h a s e SEIC with S
hase currents of ~ h ~ ~ - p h a s e SEIG with S
1
0 1.
- 0
Fi 3 ~ u ~ ~ t powe
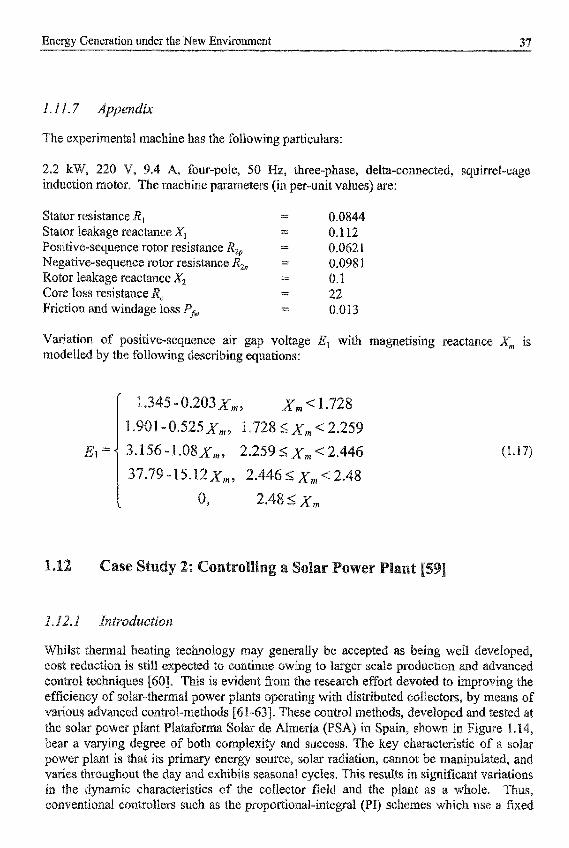
Energy ~ e n e r a ~ ~ ~ n under the New ~ ~ v i r o ~ e n t 7
1 ~ ~ a c h ~ n e has the follow~ng pa~icula~s:
.4 A, four-~ole, 50 e ~ i a c ~ i ~ i ~ p a r a ~ ~ ~ e ~ s (in per-unit values) are:
~ three-phase, de l ta -~on~e~te
0.0844 0.112 0 . 0 ~ 2 1 0.098 1 0.1 22 0.013
- _I
- - - - - -
(1.17)
de A l m e r ~ ~ (PSA) in Spain, xi@ and success. The key c
its sea§ona~ cycles. This results in s i the collector f X d and the plant a

set of system p~ameters optimised for a prescribed range of operations have proved to cently, fuzzy logic control (FLC) schemes, which enco
like approach of processing and handling of information, have been of n o n - ~ i n e ~ p l a ~ ~ s with pKomising results. However, early studies show that in such FLC schemes the optimis~t~on of the ‘if-then’ rule base is often a c ~ b e r s o ~ e and la~orious rocess ~ ~ v o l v i n ~ ‘trial and error’. Genetic algorithms based on the i ia tu r~~ law of volutio~ lend themse~ves as an ideal op~i~isat ion tool to be used in c o n j ~ n c ~ i o ~ with FLC
syst~ms. This s ~ ~ y is one of the first of its kind to show the d e v e l o ~ ~ e n t of a scheme aimed at o p t i ~ ~ s i n g the response time of a solar power plant to input power and t e m ~ e r a ~ r ~ demand.
The solar power plant under investigation, Plataforma Solar do Almeria (PSA), in Almeria, Spain
Figure 1.15 shows the block diagram o a d i s ~ ~ ~ ~ t e d collector field called the solar collectors a r r ~ g d in 20 rows foming 10 p long. The oil is pump d through the receiver tub the receiver tube walls. The storage tank is filled with oil in the far end. The oil is heated and then in~roduced into the storage tank to be used for e l e c ~ c ~ energ feeding the heat exchanger of a desa~~nation plant [64]. The system three-way valve located in the field outlet that all its outlet t e ~ p e r a ~ K e is adequate for entering into the
m in a dis~ibuted collector field is sired level in spite of disturba
level, cloud ~ ~ v e ~ e n t , mirror reflectivi~ or inlet oil te
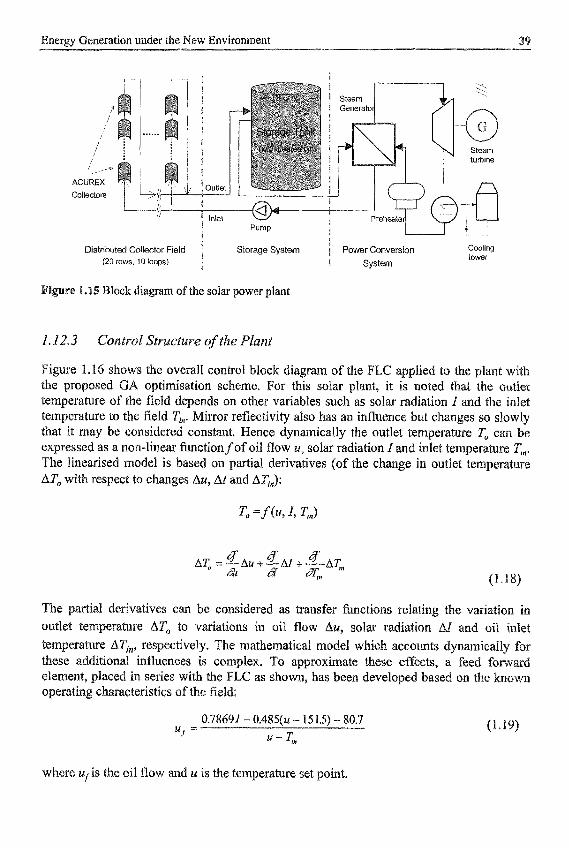
Energy ~ ~ n ~ ~ a t i o ~ under the New ~ n v i r o n ~ ~ n t
4
/ / /*
ACUREX
Collectors
I--
I
I Pump I
I Steam 1 Generato
Steam turbine
I
A - -
Distributed Collector Field ! Storage System 1 Power Conversion Cooling tower
(20 mws, 1 D loops) j 1 System
Block diagram of the solar power plant
1.12.3 ~ o n t r ~ l ~ t r ~ c t u r e of the Plant
shows the overall control bloc diagram of the FLC ed to the plant with the proposed GA optimisa~ion scheme. For this solar plant, it ted that the o ~ t ~ e ~ t e ~ ~ e r a ~ r e of the field depends on other variables such as solar ra~at ion I and the inlet tempera~re to the field 7;.,. Mirror re f lect iv~~ also has an influence but ch that it may be co~s~dered constant. Hence dynamically the out1 e ~ ~ ~ e s s e d as a n o n - l i ~ e ~ ~ n c ~ i o n f of oil flow U, solar radiation The linearised model is based on p a ~ ~ a l derivatives (of the ch ATo with respect. to changes Au, dl and AT,,):
(1.18)
The ~ a ~ i a ~ de~vatives can be co~isidered as transfer fitnctions re~a~ing the var~a~ion in outlet t e m ~ e r a ~ ~ e AT, to variations in oil flaw Au, solar rad ia~io~
ATin, res~ec~vely. The mathemat~~a~ model which accoLin~s B ~ ~ f l u e n ~ ~ ~ i s complex. To approximate these effects, in series with the FLC s shown, has been develo
0.78691 - 0.485(~ - 15 1.5) - 80.7 U f =
U - T r l
(1.19)
where !,is the oil flow U i s the t e ~ p e r a ~ r e set point,

radiation Tin radiation Tin
1.16 Control structure of plant 1.16 Control structure of plant
‘ i f -~~en’ mles in ase ofthe FLC as
where aj , pi xi , 6 i , E, E [Q, I],
~0000 I } , Rule 1 is not s ign i~~ant ; wher~as as . It is found that using a higher number of
r o v e ~ e n ~ s in ~ e r f o ~ a n ~ e but i ~ c r ~ a s ~ i ~ n ~ ~ ~ a ~ t i y . The entire ~ h r o m o s o ~ e X is o f the f o ~ a ~
e there~ore has a total of 245 bits of in fo~~at ion. icai ~ ~ o r n ~ ~ o ~ e

Energy ~ ~ n e r a t ~ o n under the New Environment a
~01010101000Q0101 1 101Q1Q~0101010~01 11 10101010~01Q111~0~01012 11 11 1101 10000 11100011100101111Q10101010l000000000000101~11101100111110
1 1 1 Z 1000 1 1 1 1 1 I 10001 10000~00011111Q0 I1 ~0001001~ 101 110001 I1 0001 I 100 1000111101110111111001010~
The chromosome
Rule base consisting of 49 rules
7 ~ ~ r o ~ o ~ ~ ~ e s linked to rule base
re~ro~uction, crossover 1.18. Firstly, the GA r
nto an ini~~alisatio~

2 Power System Restructuring and ~ e r ~ g u ~ ~ ~ ~ o n
Step 1:
Step 2:
Step 4:
Step 6:
Initiaiising pool by geiierating chromosomes randomly. (size=30)
run = run i 1 ; /*mn = 0 initially */
Ben = gen + 1; /*gen = 0 initially" / /*Reproduction */ Calculating fitness of individual chromosome fram initialisation or mutation pool. Copying high fitness chromosomes to reproduction pool. (Roulette Wheel method) /*Crossover */ Selecting chromosomes randomly from mating pool and crossover. /*Mutation */ Copying new chromosome into mutation pool, mutation probability is 0.001.
If gen = no-gen Goto step 3 If run = no-run Goto step 2 End
~ s e u d o ~ c o ~ e €or the GA
~ x p e r ~ ~ e n ~ l results on the simulator of the plant have been taken to verify the proposed GA-FLC s c ~ e ~ e . In Figure 1.19, the effect of GA o p ~ ~ ~ i s a ~ i o ~ of the rule base on the e r f o ~ a n c e of the plant is illustrated. The upper graph shows the eiTor versus the number
of generations. The error, an index of the fitness of the c h r o ~ ~ ~ o ~ o ~ e , is seen to decrease as . The middle graph show
bottom one shows the corre emcnt of the dynamic response o
scheme on a day wh tional PI control sche~e . It is
the plant's robustness when external . Since there is only on
u n ~ ~ u ~ l y d~fferen~ in any time interval, we concurr~n~ly in real-time. The validity of the comparison ~ e ~ e e n the PI and GA-FLC ~ 0 ~ ~ ~ 0 1 sche~es lies in the fact that the simulator i s a proven ~ o ~ e ~ of the plant [63] and one can ~ ~ p ~ r e the solar radiation in a particu~ar period and use it as one of the i n p ~ ~ s to the simulator. The simulator's output is then compared under different control schemes. The current ~nvestigation is based on this principle.
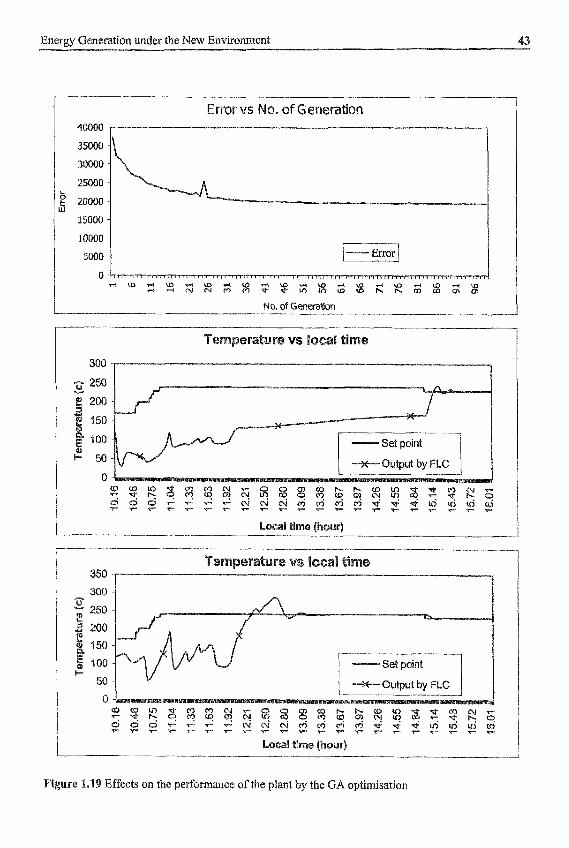
Energy ~ e n e ~ a t i o n under the New E n v i r o ~ c n t
35000 -
30000 -
25000 -
20000 - j
5000
10000
isaoo
300 -
0
300
25Q
00
150
100
1 1
et point I----
~ ~ f c c t s on the ~ e ~ f o ~ ~ ~ ~ of the plant by the GA optimisa~~on
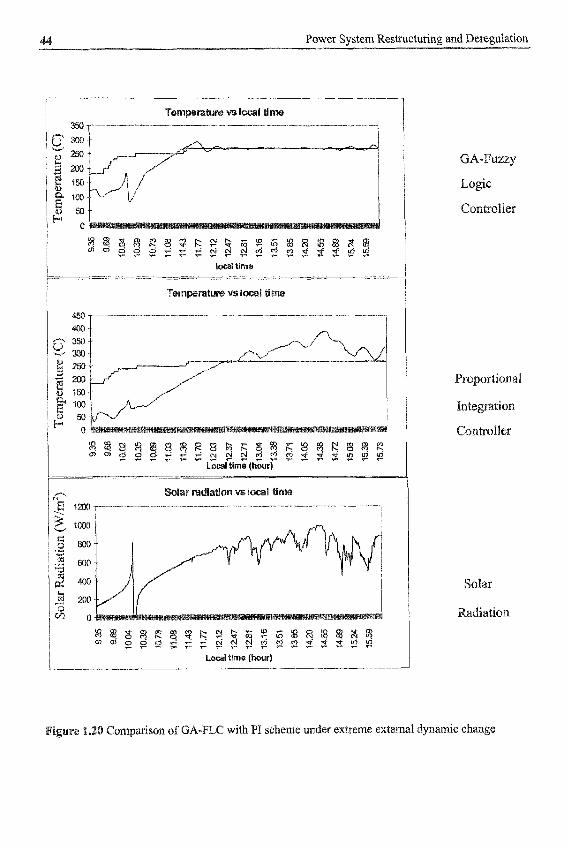
arison of GA-FLC with PI scheme un er extreme external dynamic c ~ a ~ ~ ~
_I___p
neration under the New ~nvi ronm~nt
such as l a r ~ e ~ s c a ~ ~ expen e ~ ~ s t o ~ ~ ~ s cannot be sec

Energy Generat~on under the New E n v i r o ~ e n t 4 _ll_l*
shnell and S.S. Qren, ‘ idder cost revelation in electric power auctions’, J o ~ r n u ~ of ory Economics, Vol.6, 1994, pp.5-26. o and R. Wilson, ‘Priority service: Pricing, investment, a d market organization’,
Anzerieun Economic Review, Vo1.77, 1987, pp.899-916. ‘Priority pricing of ~ n t e ~ p t i b ~ ~ electric service with early
notifica~ion’, Energy , V01.14, 1993, pp.175-196. A. Midtun and S. Thornas, ‘Theoretical ambiguity and the weight of historical heritage: a co~n~ara~ ive study of the ritish and ~ o ~ c g i a n electricity l i h ~ r a l i ~ a t i o ~ ~ , EmerB Policy, V01.26, 1998, pp.179-197.
aas, N. Auer, C. Huber, and M. Tranger, ‘Limits for competition in restructured electricity ~ ~ k e t s - the European pe~ceptive’, 19th annuui North Amer~cun Con~erence, United States Association for Energy Economics and International Association for Energy Economics, 1998,
[ I I] IEA, World energy outlook: I998 edition, Paris, France, QECDIIEA, 475pp, 1998. [I21 C, Singh and N. Gubbala, ‘Reliability evaluation of interconnected power systems including
jointly owned ~enerators’, IEEE Transactions on Power Systems, Vo1.9, No.), 199 412.
[S ] T. Straws, and S.S.
[9]
pp.103-112.
an, ‘Evaluation of the reliability and production cost of i~i~eKconnc~~ed
Jaskow, ‘Price a ~ j ~ s ~ e n t in long-term contracts: The case of coal’, ~ ~ ~ r n u l qfLaw and ems with jointly owned units’, IEE Proceedings, Vol. 134, No.6, 1997, pp.377-382.
~conomics, Vo1.3 1, 1998, pp.47-84. [ 1151 IEA, rroje~ted costs o~ge~eru t i i~g electricity, Update, Paris, OECD/ IEA, 243pp, 1998. [ 161 J. Lane ‘Sweeping thc board’, Power EngineeringInt$~u~ional~ Vol.6, 1998, pp.25-29.
on Embedded Generation, IEE, 28 February 2000. utanto, ‘Battery storage plant within large load c e n ~ ~ s 9 , ~ E E ~
terns, Vol.?, No.2, May 1992, pp.762-767. [ 191 Gmzettu Uficiule delta Republica Italians, Decrelo legislatho 16.3.1999 n. 79, Attuazione
comuni per il mercato in afico e Zecca dello Stato -
[20] EC, ‘Guide to the electricity directive’, available from: http:J/www,~uropa.eu.in~en/ c o ~ ~ d g ~ ~ / e l e c . m e i n o r . h ~ , Brussels, Belgium, European Com~ission, D ~ r e c t o r a ~ ~ ~ ~ e n e r a ~
E211 P. Baruya and D. Goidsacks, ‘European coal issues - European tibcralisation af coal’, ~ o ~ l d
road ben^, ~ G o ~ p e t i ~ i v e n e s ~ of coal - the evolution of price’, CS/05, London, U
II ( ~ n ~ r g y ) , IOpp, March 1999.
Coal, Vol. 7 (10); 1998, pp.29-34.
Goal Research, 20pp, [23] UNEGE, ‘Security supply in a changing European natura1 gas
~ ~ P . 3 / ~ ~ . 4 / 1 9 9 6 / 6 , Geneva, Switzerland, United Nations Economic C o ~ m ~ s s i o n for Europe, Committee an Sustainable Energy, 17pp, June 1999.
E241 Couch G., ‘OECD coal-fired power generation - trends in the 199Os’, IE
[E] Modern POWCK Systems, ‘World digest: Green power launched,’ Modern Power Sjwterns, VoI.19, ~ e ~ ~ a ~ 1999.
esearch, 83pp, April 1997.
lobal Private Power, ‘Own coal?’, GIobuE Private Climate, report, The ociety and The Royal ~ c a d e ~ y of
hugar, 'The value of grid-sup T r ~ n s ~ c ~ i o ~ oiz Energy ~ o n ~ e r s i o ~ , Vol. 10, 1995, eloping CHP in the public sector and beyond'
up Ltd., April 2000, pp.2-22. Ilan, Pcter Gaossley, Daniel
icks, Fuel Cell Systems ~ x ~ ~ Q i n
hluture far ~ i s t ~ ~ u t e ~ g~nera~~onq, E i e c ~ ~ i ~ ~ ~
ket ~ a n a g ~ ~ ~ n t IiwM.w.nemmco.com.a~aulne

Energy Generation under the New E n v ~ r o ~ e n ~ 9
. Wa~son, J. Arrillaga and T. Densem, ‘Controllable d.c. power supply from wind driven se~f-excited induction m~chines*, 1EE Procee~ings, Vo1.126, W0.12, 1979, p p . 1 ~ ~ ~ - $ 2 4 ~ .
[SO] T.F. Chan and L.L. Lai, ‘Phase b a l ~ c i t ~ g for n se~f”exc~~ed ~ n d u c ~ ~ o ~ ~ g e n e ~ ~ t o r ’ ~ ~ r o ~ e e ~ i n g s of the In~erna~ional Conference on Power Utility De lation, ~estructuring and Power ~ec~nologies 2000 ( ~ ~ T 2 0 0 0 ) , City ~niversity, London, TEEE
[SI] T.F. Chm and L.L. Lai, ‘S~eady~state analysis o f a thr~e-phase co~iection’, IEEE Power Engineering Review, V01.20, NO. 10,
[SZ] T.F. Chan and L.L. Lai, ‘A novel s i n ~ ~ e - ~ h ~ s e s e l € - r e ~ ~ l a ~ ~ d self-excited i using a ~hree-~hase machine’, IEEE ~ r a n ~ ~ u c ~ i Q n s on Energy ~onvers~on , Vol. 16,
ropriate technology - rural electri~ca~ion in ~ e v e ~ o ~ ~ n g c o ~ ~ ~ e s ’ , ZEE
E541 T.F. Chan, ‘Per fo~~ance Analysis o f a three-phase induction generator se~f-e~cited with a single capacitan~e~, ~~E~ Power Engineer~n~ Society 1998 ~ ~ n t e ~ ~ e e t i ~ ~ ~ ~ a p ~ r 0 ~ 8 ~ ~ C - 0 - 1 0 ~ ~ 9 ~ 7 , ~ e b r u ~ 1-5, 1998, Tampa, Florida, U.S.A.
evzew, Vo1.35, No.7, August 1989, pp.25 1-254.
nt ~ ~ c h i n e s , London: Pitman (EL S), 5th Ed,, 1983, p ~ . 3 ~ ~ ~ ~ 3 6 . method o f analysis of 3 ~ ~ h a s e ~nduc~ion ~ o ~ ~ r ~ with Proceedin~s, VoI.~OOA, PI. E, 1953, of a 3-phase induction motor connected to a single-
~ r o c e e ~ ~ n ~ s ~ 1959, Vol.l06A, 1959, p ~ . 1 8 3 ~ 1 9 ~ ” 1 W e i ~ ~ a ~ ~ I n t r o d u ~ ~ i ~ n to ~ ~ ~ i m i ~ u t i o ~ ~ h e o ~ ,
L.L. Lai, T.E. Tong, ‘ A opt~~isation o f rule base in a fuzz plant’, ~roceedings ox the In~~rna~ional ~ ~ n ~ ~ r ~ n c e on Powe~ Utilip
~ ~ ~ e ~ ~ a ~ ~ o ~ , ~ e s ~ ~ ~ ~ ~ r ~ n g and Power Technologies 2000, City University, London, IRE]E, p d 2000, pp.22~-22~
A. ~ ~ ~ ~ a i ~ ~ ‘Experience of using the neural
and genetic algorithm €or fault secdon estimation’, P E PrQceeding~ - ~ e n ~ ~ f f ~ Q ~ , ~ r a ~ ~ ~ ~ . ~ s ~ o ~ and ~ ~ $ ~ r ~ ~ u ~ ~ o ~ , vol. 145, No.5, ~ e ~ ~ e ~ ~ e s 1998, p ~ . ~ ~ ~ - ~ 2 ~ ~

Prof. Mwok Lun Lo The University of ~ ~ a t ~ c ~ ~ d e ~ ~ a s ~ o w , ~ c o t ~ a ~ d
Miss Vee Shan Uuen The U n i v e ~ § i ~ of S ~ l a s g o w ~ ~ c o ~ l ~
The success tisation o f the airline, teleco ~ e r e g u l a ~ ~ ~ tructming of the electricity
ers in ~ r i v a ~ ~ ~ n g i ts vertically i n ~ ~ g r ~ ~ e d el ~o~lowed in 1990 and 1996 ~es~ectively. The d Norway has encouraged other countries worldwide at have been ergoin in^ energy ~ e r e ~ i l a ~ i ~ n ~ c ~ ~ d e
ain, Taiwan and ~alays ia. s used to refer to what one wouM regard as
‘ d e r e ~ u l a ~ ~ ~ ~ ~ of ~ l ~ c ~ c utiliti le the two words are d ~ f f e r e ~ ~ ~iteral~y,
Ironically, neither is th ~ e ~ t i o ~ 2.5, none o f
titi ion or o ono^^^^. It i s ther~fo sive exercise of rn

~ e ~ ~ ~ a t ~ o n af Electric Utiliti~s 1.
v
an

structuring and ~ e r e ~ l ~ t i o n
the details of der

latiara of Electric ~ $ ~ l i t i e ~
2.4. I

exercise market power and control the price of e l e c t r ~ ~ i ~ . itions where the providers of a service can c
ose that would be established by a coinp~ti~ive mark actual prices and the prices that would arise from
the assumption that the generators are priceta en a major impediment to price reduction in the Engl
Pool. Efforts are being made to eliminate market ~ a ~ ~ c u l a r , here will be a d r a ~ a ~ i c reform of the energy market the year 2000.
Access to the ~ansmission system is one of the main issues in energy and sound r~gulations are required to facilitate ~ransmiss~on open acces
ng, TOA refers to the regulating construct such as the rights, obli dures, economic cond~~ions9 etc., enablin~ two or more parties to use a transniission
etwork. With equal rights of access to the transmission network, it has become ~ ~ a s i b l ~ or loads to arrange transactions with each other and hence co~pe~i t ion is am on^ the key elemen~s for facilitating competi~ion in the ~ ~ e r g y on will look at the details of the two issues.
2.5.1 it^^^ in the ~~~e~~
~ o m p e ~ ~ ~ ~ o n is the main goal of energy pr~~a~~sat ion . Ideally, from view, perfect ~ o ~ p e t ~ ~ ~ o i ~ is the iiiost desirable market structure.
cmre ~hara~terised most notably by a situation in whic are p r i ~ e ~ a ~ e r s and there is freedom of entry into and exit from ih
ng to these three criteria: inde~endence, product s~ i~st~tu~abi l i wever, in any real markets, it is rare that all of the
Considering also the te can be d ~ d u ~ e d that
ints caused by the intrinsic properties etition does not exist in the e n e r ~ ~ by its social welfare. Social we~fare i
d the benefit of the energy to socie for it. ~ a x i m ~ m social welfare i s
~equently operates at a s ~ i b o p t ~ ~ a l level. been introduced in most deregulated m their own s u ~ p ~ ~ ~ r . Retail ~ o m ~ e ~ i t i o n cus~om~rs are abie to select their
ated by the issue of direct access tec~nQlogy. In some countries9 solid regul
costly for res~dent~a~ customers t
e issue of energ~ subsid~es the depos~t~on of s~randed costs have also c o m ~ ~ ~ c a ~ e d efforts on energy ~ ~ v a ~ i s a ~ ~ ~ ~ ne form of energy subsidies refers to those given to generators to purchase highly priced coal in order to sustain the Iocal coal industry. Generators receive s ~ ~ n i ~ c a n ~ i y fewer subsidies after

e r ~ ~ l a ~ i o n OS Electric U t i ~ i ~ ~ e ~
that time were su
e less WQ~hy and i~vesto~s could end up b e ~ n ~ ba n involves the d e t e ~ ~ ~ a t i o n of the degree of recove
e ~ a l i f o ~ ~ a n Pool, the 8
in the e ~ e c ~ i c i ~ bill.
a price and the ~ a x i ~ u ~ IIU
tted offers are r ~ e d lowest
, each seller i ~ ~ ~ i a l l y sub are w ~ ~ l i ~ i ~ to make avail


om a seIler 10 a buy ed ~ a r k ~ ~ s , the Q
~ n s u f ~ c ~ e ~ t because ne
r ion ~acilities~ henever each whee

~ ~ r e ~ l a t i o ~ i of Electric Utilities
of the line is now res~aine by its t h e ~ a l limit (Fi per€ect~y inelastic (e~as t ic i~ i s zero) generator 61 is met when 6 1 is forced ~heoret~cai~y raise its price as hi ~ i i I ~ ~ ~ t e d m w ~ ~ ~ ~ower.
mand which is no Buy some of its el
as ~ossib~e. ~enerator 6 2 is said to have a c ~ ~ i r e d
Transfer L i ~ ~ ~ = 1 0 ~ ~ ~ / line olution
~ l ~ ~ s ~ r a t i o n of m ~ k ~ t power caused by congestion
~ i g ~ e 2.3 ~l lus~ates iflerent ~ongestion pricing ~ ~ t h o d o l o s is ~ ~ n e n t (e.g. diffe
coordination betwe c la$s~~~at ion. Priva~~sation a Europe and different states in e$sential to alleviate congest co~gestiofl ~ ~ c i n ~ . calculated as dual ~ u l t i p ~ ~ e r s from optimal po ~ ~ c i ~ g . In places where nodal pricing is adopte~, differences in nodal prices cm ~ e s u ~ t in
arket ~ a ~ ~ c i ~ a n t § can hedge cong
ons. These we based
congestion contracts which are also and give their holders ~ a ~ s m i s s ~ o n system,
[9, Z 51.


Q e r ~ g ~ l ~ t i o ~ of Electric Utilities
a ha~f~hour~y basis. Many customers will pay for electric power based on this price^ e~ther
e Pool price. The IS0 can also operate markers for a n c ~ l t a ~ wer, spinning/non-spinning reserve and losses. The roles of the
irectly ~l~rough their distribu~~on utility or t ~ o ~ g h a private power supp~y
2.6. I ~ ~ i ~ ~ ~ g and
n Section 2.5.2 ~ifferent kinds of auction ~echan i~rns were discussed. T uty to set the e l e c ~ c i ~ y price. Pricing is done essentially in eith ex ante or ex post. An ex ante market is one in which the price of the CO
is set prior to its del~very while an ex posl marke~ is one in which the comI~ iod i~ i s d e ~ e ~ ~ n e d at the time o f delivery. In an electricity market, a is like a b~~ateral con~rac~ market in which ~aders/pa~ic~pants agree on the a ~ ~ o ~ ~ ~ ~ t electricity to be delivered at a certain time in the future at a certain price Nord Pool combines ex ante and ex post pricing. In its spot market, syst prices are set up the day prior to delivery. Any differcnce in the forecast wi delivery results in a discrepancy with the pre-set price and the spot price. This is co~pensa~cd by the presence of the ex post mechaiiism. In the ord Pool, there is a buy~ack market to make up for this difference. ~imilarly, genera~or bids are also s u ~ i ~ i ~ e d on a o ~ ~ ~ ~ a y - a l ~ ~ ~ d basis in the England and Wales Pool, and participants are paid at the end of each day for their transactions plus CoInpensation. The England and ~ a ~ e s Pool is the~efore also an ex ante market with an ex post mechan~sm. Ex post markets also exist and examples are the New Zealand and Australia markets. In the New Zealand e l e c ~ r ~ ~ i ~ mar~et, ge~erators and loads are aflowed to change their bids until 2 hours prior to d e l i v e ~ and the market is cleared re larly dur i~g the bidding process. Ex post prices are c a ~ c ~ ~ a t e using arke et-c~ea~ng software with the latest offershids and the actual r n e ~ ~ r ~ ~ demand together with losses. Figure 2.5 illustrates the ~n~eraction of ex a m and t?x post p r ~ c i n ~ for e i e c ~ r i c i ~ markets.
As in any other c o m r n Q ~ ~ ~ market, all particip ts Rave to bear a certain degr rket. The $ys~em o~erator o has a share of the risk rep an^^ of the forecast wi chal demand. The degree
IS0 depends on the pricing ~ ~ c h a n i s m of the market. For ex sate s of market p a ~ ~ c ~ ~ a n t s in ~ i ~ a t e ~ ~ l c o n ~ a c ~ s depe stem price in the future. In a ~ ~ b ~ ~ d m a ~ k e ~ like ior to delivery, and any real-time power imbalan
xhibiEs the ex post m ~ c ~ a n i ~ i ~ is therefore much more susc y financial comrni
e a serious issue w h ~ n c~ngestion is comm
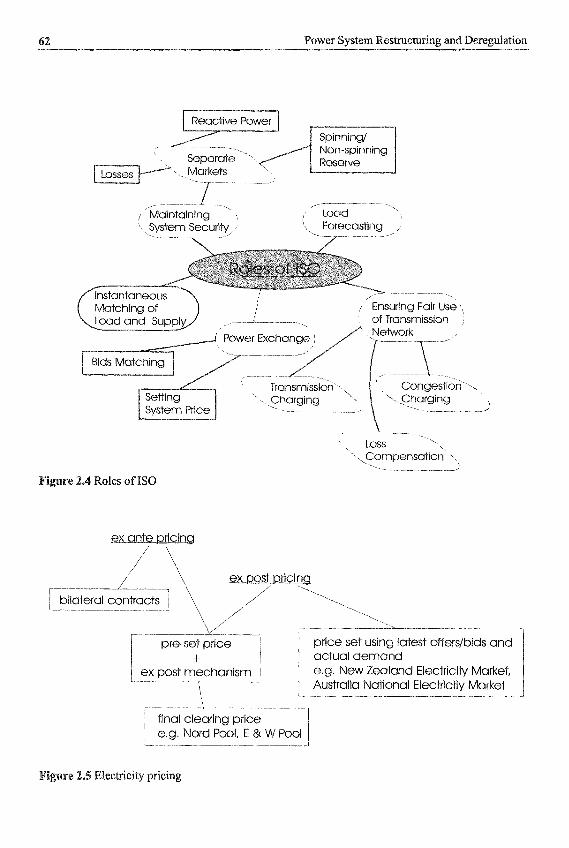
Power System ~ ~ s ~ c ~ n g and ~ e r e ~ ~ l a t i o ~
I
- ~ - _____
- '.. ' , LOSS \
Compensation
actual demand
final clearing price I 1 e.g. Nord Pool, E & W Pool 1

~ ~ r e ~ l ~ ~ i o ~ of Electric U~i l i t i~s 3
tier prov~ders~ play an
nine years after the e s t a b ~ ~ s ~ ~ e n ~ of B
c o n s ~ e r s rather than be c B ~ t u 11 c o ~ s u ~ e r s should have access
is a type of b i l~ te r~ l

I

eregulation of Electric Utilities 5
to meet forecast demand. It is a ma
By 10.00 am. every
= 3 + 0 . 0 2 ~ ~ ~ and

.7 (a) The network; (b) unconstrained dispatch; (c) constrained d i s p a t ~ (Source: [ 151)
h is shown in Figure 2.7b Wh (~igure 2.8a). A § § ~ ~ that
e ex ante price the day tice during real-time opera
costs of u ~ ~ ~ ~ s ~ a ~ ~ ~ ~ and constrained dispatch ~ e n t ~ are listed in Table 2.1.

Deregulation of Electric UtiIities 67
(a) SMP; (b) G1 cost function and adjustment; (c) G2 cost function and adjustment (Source: 11 51)
Me 2.1 Gmerator payments and demand charges (Source: [IS])
Demand Payments L1 L2
Demand Charges (PSP) (Eh)
Total Charge (E/h)
308 1156
1464
~enerator Payments G1 6 2
Gen~ra t in~ Costs (Light-shaded Areas) (Eh) 616 487
Generating Payments from Pool (Ou~ut*PFF) (E/h) 952 340
Adjustments (Dark-shaded Areas) (E/h) 25 147
Total Payment (Sum of Generating Payments and 1464 Adjustments) (f/h)
has been a significant drop in electricity prices in ~ngland and Wales this price drop does not hlly emulate the cost reduction of g are not passed on to customers entirely but are partially r es in the form of higher profit. Also, there has not yet been a
decrease of price in the retail market. A possible reason for the i n e f ~ c ~ wholesale market is that the three largest generators could game and m ~ ~ p u l a t e the who l~sa l~ market. The market lacks small IPPs which could potentially f ~ v o u ~ ~o~pe t i t i on and reduce the market power of the large generators.
In view of the existing problems of the pool, the director of the Office of Gas and ~ l e ~ ~ i c i ~ Markets ( ~ f ~ ~ m ~ published the NETA [$I, for England and Wales in 1898. The reforms should commence in 2001 and should lead to significant chang~s in the exis market. First of all, a d ~ ~ ~ ~ m i n a t o ~ auction will replace the uniform auction. Sec de~~and-s i~e bid din^ is allowed so the market will transform into a bila~eral rn reform§ are designe~ in such a way that pa~icipan~s can choose over a i f f e ~ e ~ ~ ways they
ate in the market. In a different time frame before actual delivery ~ a ~ c i p a n ~ s can choose to trade in the following markets:
Forwards markets: these are optional and are operated by i n d e ~ ~ d e n t o r ~ ~ i s a ~ ~ 5 ~ s .
S h o ~ - t e ~ bilateral market: this is optional and open from 24 to 4 h ~ u r s ahead of the P a ~ i c i ~ ~ ~ can sign bilateral contracts that are up to sev~ral years ahead as desired.
period, All trades will be organised by a market operator (MO). s is also optional and it is open 4 hours ahead to
he SO obtains full control of the system after the close market. 4t would engage in trades to ensure that generation and d ~ ~ a n d are balan~cd,
into a c c o ~ t and resolving any constraints on the ~ansmiss~on network. al-time power ~ ~ ~ a ~ ~ ~ e charges are imposed on p a ~ c i p ~ ~ whose c o ~ ~ a c ~ e d
~ o u n t is different from the actual metered amount and they could be based on the costs 0 to settle the imbalances. The r ~ f o ~ $ feature full dem bids and simple offers and bids, and they aim to higher flexibility over different ways of tradin , Neve~he~ess, many
eptical about the proposed r e f ~ ~ s and believe this is not the solu~ion to get rid of market power and reduce prices [20,21], Moreover, there i s concern^ under the
sed reforms, over the possibilities of exploitation of generators’ market power in the ing r n a r ~ e ~ through the incremen~ and d ~ c r e ~ e n t bids. Inerement bids r e p r ~ s e ~ t the p a ~ i c i p ~ t s wish to be paid for an increase in output or are willin
ecrement bids represent the prices they are willing to pay for a increase in demand. d e c ~ e ~ s ~ in output or wish to be paid for a decrease in demand.
d eration e o m ~ e n c e ~ in Norway two years a&er the pass
d from the former ‘C optional pool was sufficient because o f the la~ge n
Norwegian power system ha ission n e ~ o r k , which w
tatnett, which is also ket. The ~ o ~ e g i ~ spot market, the Nord Pool or Elspot, is icipants are free to trade in the bilateral contract
power is in ~ a l ~ c e for gene~~ors , large custo~ers
land and Wales Pool, the Nord 001 utilises ex ante pricing to set the or to delivery and compens s power imbal~ces using ex post
generator offers and ahead of actual delivery, the Nord Pool acc our of the following day. The system pric emand curve meets the ag
price auction by paying all generators the last en bidding areas d~r ing this process, reas. In the s u ~ ~ ~ s area, the area price is by an amount equal to the line capac y the right shifting of its supply curve
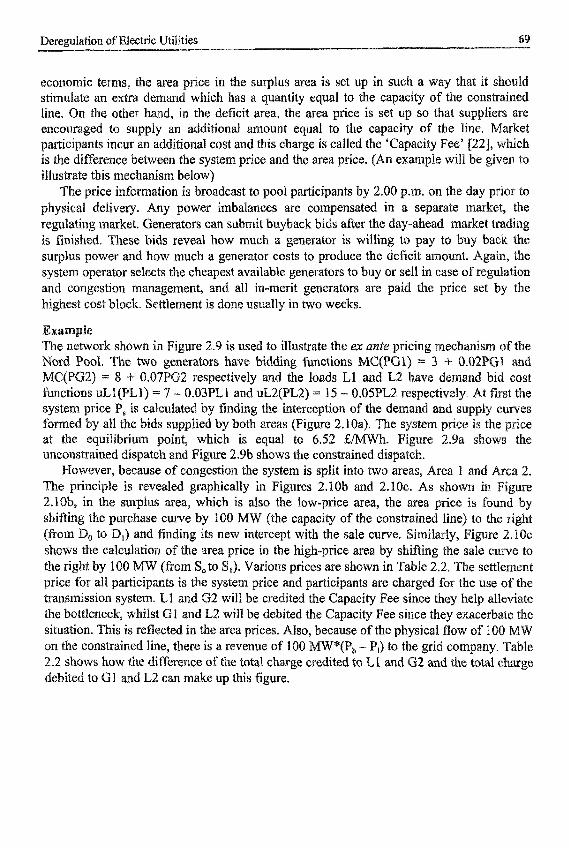
Deregulation of Electric Utilities 9
~ ~ Q I ~ Q ~ ~ c t e ~ ~ s , the area price in the su lus area is set up in such a way that it should demand which has a quantity equal to the capacity of the c o n s ~ ~ ~ ~ e d hand, in the deficit area, the area pkce is set
encouraged to supply an ~dditional amount equal to the capa p a ~ i c i ~ a n ~ s incur an ad itional cost and this charge is called the ' is the dif~erence b e ~ e e n the system price and the area price. (A i i lus~ate this m e c h a n ~ s ~ below)
on is broadcast to pool participants by 2.00 p.m. on th power imbal~nces are compe~sa~ed in a separate
rators can submit buyback bids after the d a ~ - ~ e a d m is ~ ~ i s ~ ~ e d . These bids reveal how much a generator is willing to pay to buy surplus power and how much a gener~~or costs to produce the deficit a ~ o u n t . system operator selects the cheapest avai~a~le generators to buy or sell in case Q
and c ~ ~ g e s ~ i o n ~ ~ a g e m e n t , and all in-merit generators are paid the price set by the h i ~ ~ e s t cost block. S ~ ~ ~ e m e n t is done ~ s ~ ~ a l l y in WO weeks.
situation. This is reflected in the area prices. Also, because of the physical flow of 10
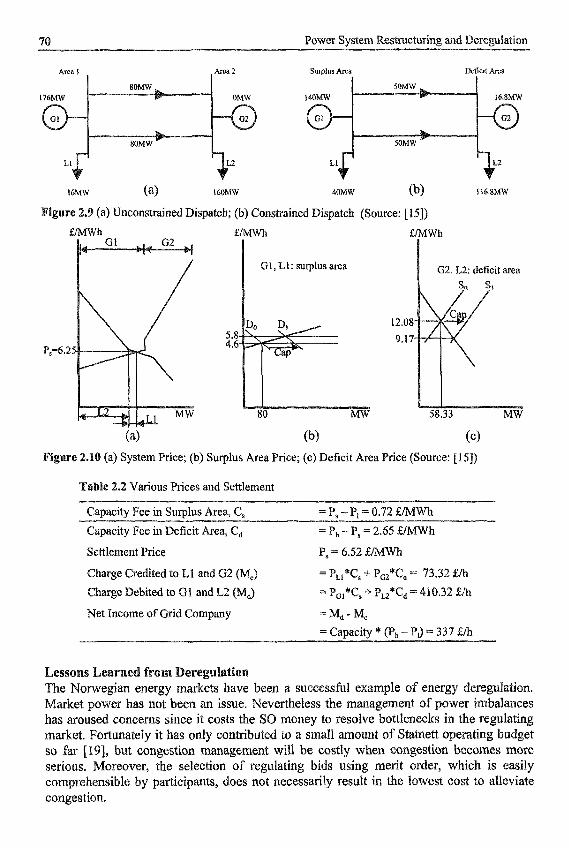
7 Power System ~ e s ~ c ~ i i i ~ and ~ e r ~ ~ ~ a t i o i ~
I Area 1
LI 2
Sumlus Area DCftClt Area
140MW
LI 2
16MW (a1 1 b0MW 40MW @> 1 16.8MW
(a) Unconstrained Dispatch; (b) Constrained Dispatch (Source: [ 151)
E M W h EMWh
61, Ll: surplus area
5.8 4.6
80 MW
f,l/MWh
G2, L2: deficit area
(b> (c) .I0 (a) System Price; (b) Surplus Area Price; (c) Deficit Area Price (Source: 1151)
Various Prices and Settlement
I
Capacity Fee in Surplus Area, C,
Capacity Fce in Deficit Area, C,
= P, -Pi = 0.72 f M h
= PI, - P, = 2.65 f/&W?h
Settlement Price P, = 6.52 E/IMwh
Charge Credited to Ll and G2 (Mc) = PLl*C, + PG,*Cd = 73.32 51% ebited to C1 and L2 (Md) = PGI*Cs + PLZ*C, = 410.32 Eh
Net Income of Grid Company = M d - M , = Capacity * (Ph - PI) = 337 E h
The ~ o ~ e g i a n energy markets have been a successful example of energy ~eregu~a~ion. ket power has not been an issue, ~ e v e ~ h ~ l e s s the management of power im~a~ances arouse^ concerns since it costs the SO money to resolve bo~Ienecks in the regulating
market. ~ o ~ n a ~ $ ~ y it has only contributed to a sniall amount of S tmett operating ~udget SO f a [I cong~stion ~ ~ a g e ~ e n t will be costly when con~est~on becomes more serious. er, the selection of ~egulating bids using merit order, which is easily c o m ~ ~ ~ ~ ~ n s i b l e by participants, does not necessarily result in the lowest cost to alleviate co~gestion.

Deregulation of Electric Utilities 71
2.8.3 Gal i jh iu
The ~nergy Policy Act PACT) of 1992 clarified the de te~na t ion of the USA for a com~etitive energy market. It is not mandato~ to implement a whole§ale c energy market in the nation. Individual states pursuit difl'erent policies an
ending on their electricity prices. States with relatively high California, New York, Massachusetts, etc., arc more aggressive in
implemcnting reforms. In 1998, California embarked on a four-year transitional period of deregula~ion.
~ t r a n d e ~ costs have com~licated deregulation in California. The state gov solved this problem by issuing bonds to inflicted companies to compensate for thei Customers' bills include a small amount of charge (e.g. 4 cents~Wh), the so-calk competi~ion ~ansfer charge (CTC), to account for stranded costs.
large private utilities, which have to trade through the PX until March 2002. One ~i§tinct d i ~ ~ r e n c e b e ~ e e n the Californian Pool and the England and Wales Pool i s that in the former case market clearing and bids matching are under a separate entity, the PX, rather than embedded in the duties of the ISQ, as in the England and W Ca~~~orn ia, two types of bilateral contracts exist: Contract for Access Contracts. The fact that CFDs are tied to pool prices has 1 game the market using their market power, The idea of Direct Access Contrac~s is to c o ~ t e ~ a c t this problem: Direct Access Contracts are not bonded to the PX and pa~ic ipan~s only have to request their transactions through the ISd).
During this transitional period, participation in the pool is optional, ap
ge (CalPX) is responsible for holding auctions for the competitive forward markets (day-ahead and day of markets). Th,e day-ahead market is similar to its c o u n t c ~ a ~ in Norway and England. Market pa~ic ipan~s provide hourly supply/demand bids to CalPX one day prior to physical delivery. MCP is actually the equivalent of system rice in Norway or system marginal price in England and Wales. ~ n ~ ~ o r m pricing is adopted and all pa~icipant§ are paid or debited the market provides pa~icipants with the chance to make up for system imbalances by ~ o l d ~ g auctions at various times during the delivery day.
Zonal pr~cing is cm~loyed for congestion ~ ~ a g e m e n t . Markcl p ~ c ~ ~ a n t s can submit the so-called schedule a d j u s ~ e n ids (SABs) which are similar in nature to the r e ~ l a ~ ~ g bids in the Nord Pool, The S represents the desire of the ~ a ~ i c i ~ a n t to adjust its
price varies. When there i s congestion, the region is ~ ~ v i d e d into zones ates the zonal prices using SABs. The PX uses this in fo~at ion to work
out the final prices for participants so that upon settlement the PX remains revenue neu~a l P31.
tion stage in California and it is premature to c o ~ ~ ~ on the various markets. However, there is concern over the
operation of the spinning and non-spinning reserve markets. ~enera~ors have to reserve a ce~a in amo~nt of their c a p ~ c i ~ in order to bid in the reserve ~arke ts , They are not

72 Power System ~ e s t ~ c ~ i n g and ~ e r e ~ ~ a ~ i o ~
e n c o ~ a ~ e d to do SO unless they can make more money in the reserve markets than in the ecause of that reason, generators submit very high bids to the r e s e ~ e
markets, resulting in non~co~pe~i t ive reserve prices. ~on~spinning reserve has a relatively higher price than spinning reserve because there are insufficient pa~cipants in the non-
certain amount of both reserves. Since non~spinnin~ res spinnin~ reserve, the consequence is a higher price for a 10 r e s ~ ~ e is not as ‘worthy’ to the system as spinning reserve is). These exemplify ~ ~ k e t ine~~ciencies caused by unapt market rules.
inning res~rve ~ a r k e ~ . For maintenance of system security, the IS0 has
Since the commencement of energy privatisation in 1989 in the ~ n ~ l a n d and Wales, has not acquired a competitive and e f ~ c ~ e n t for various reasons, Scottish customers have benefited much less than their counte
and Wales, despite the fact that the England and Wales PO mar~inal generation COS& in Scotland, even after into ac~ount the smission losses, interconnector access charges, r transmission and distribution are regulated using the ‘price-cap’ con~o l
which depends on the inflation rate and electricity prices are set based on the pool ~r ices in ~ngland and ales with ad jus~ents made after ~ i n g into account the ~iffe~ences of the markets.
Scotland, u n ~ i ~ e sale m a r ~ ~ t . Also,
land is chara~te~sed by a surplus of generation capacity on capac i~ almost two limes the total maximum demand [2
g e n e r a ~ o ~ types inch ing dual oil and gas, coal-fired, hydro, pumpe~-storage and nuclear. The two ~enera t io~ comp~ies, Scottish Power and S c o ~ ~ s h ~ y ~ o - ~ l e c ~ c have ~ n t e r c o ~ e c ~ e d grids and Scottish Hydro-Elec~ic can access the grid in Eng~and via cottish Power’s transmission system. Even ough these two d o ~ i n a ~ i ~ privatised
~e~era t ion ~ o ~ p a n i e s ~ remain vertically inte~rat after ~rivatisation, they are re~uired to keep separate accounts for separate busine s, i.e. tr~smission, d is~ i~ut ion. C o ~ p e t i t i o ~ between the two companies is made possible t h r o ~ g ~ ‘$econd- tier suppliers’ who are autho~ised to supply ~ ~ e c ~ i c i ~ to customers ou~side their supply areas.
ent trading in Scotland. Firstly, the ~ W Q
ondly, the market is loo small to be eneration capacity indicates that there i s
otential obstacles to e ertically integrated.
compe~i~ve, Moreover, the substantial surplus no need to build new generators in the coming hture. Finally c ~ o t c o ~ ~ ~ e t e with Scottish Power or Scottish ~ y d r o - ~ l e c
etween the two countries. In view of the above, and ~lectricity ~ a r k e ~ s , will focus QXI reforms for the Scottish markets which will remove the obstacles and be consis~en~ with the NETA [25].
The voluntary wholesale electricity market in New Zealand c o ~ ~ e n c e d in 1996, but before that there had already been limited competition in the supply sector. It is operate^

73
etplace Company L (M-CO Ltd) which has recently b s in the C a l i f o ~ i ~ Pool, market p ~ c i p a n t s in New
outside the pool through bilateral contracts, provided that the system o p e r a ~ r is ~ f o ~ e d of the ~ansactions.
Island. The load con~en~ates on the North Island which is connected to the ~ o u t h ~sland by an HVDC interconnec~or. Even though the three gove~ment"owned generation ~ o ~ p a n i e s ~ominate the wholesale market, the market remains s spa rent t ~ o u g h the broa~cast of predicted prices and load forecast. Effort was spent only on i n ~ o d ~ ~ ~ i n g co~petition in the retail sector between distibutor§ and the state-owne~ generation co~pany, but it was soon realised that retail compet~tion alone was not enou~h to re elecwicity prices and hence the wholesale market was developed subsequently.
In New ~ealand ~eneration is dom~~ated by hydro power, which is located in the
The New Zealand spot market: is an ex post market featuring nodal pricing. Nodal on the theory of spot pricing [26] . Under nodal pricing, if the arke et is
s h o ~ - t e ~ price signals so generated should enhance the efficient . ~owever, there have been ongoing discu§sions on effe~tive opera~ion of the m
als and the management o f the losses and ~ o n s ~ a i n ~ . Expost pricing in the physical spot market is acco
using the latest supply and demand bids and the actual measured plus losses actual demand i s vital and it is one of the main roles of onciliadon Agreement. Final prices are published a few
actual dispatch.
Afler years of negot~a~on and debate, The Council for the European ~ n i o n even adopted Directive 96/92/EC in ~ e c e m ~ e r 1996 to liberalise the e lec~ic~ty in8 According to the ~~rect ive, members of the EU are required to open their
y the year 2006 at least one-third of the EU-wide energy market will h rent European countries can liberalise their markets at their own pace, as long
nts set by the directive are met, Apart from i n ~ o d u ~ ~ g competition in the . ~ o u n ~ e s at the wholesale and retail sectors, the directive also features U
forefront of liberalisation include Spain and the Netherlands the existing one in England and Wales, will be developed hourly supply and demand bids, while in the Nether l~ds the Elec m ~ d a t e s a complete l ~ ~ e ~ ~ l i s a t i o n of the generation section by the year 2 0 ~ ~ . However, there are also coun~ies, like France, Italy and Belgium, which keep their l~be~alisation
ess to the minimum level requ~red by the direc~ive because of domes~ic poIi~ica~ reasons.
e ~ a n y opened its market to all suppliers and end users. As it is n ely few natural resources, two-thirds of the energy con~umed is
imported from other countries, Effort in deregulation is therefore focused on the ~8intenance of security of supply. Under the Energy Law A~endment net owners are required to provide o en access to facilitate competition. However, only 8 few out of about 700 net users have so far published the charges for using their networks [29]. At present, nmst net owners also operate the grid; t~erefore the issue of se~aration of owne~sh~p and

7 Power System R e s ~ c t u ~ x i g and ~ e r e ~ l a t i o n
opera~ion would need to be looked into, Also, practically small custo~er$ have not bcen able to change their suppliers easily under the current legislation.
The ~ e ~ a n project group on the energy market is ~ r a ~ n g a poten~~al project sketch and it is likely that concept for the pote~~t ia~ energy ark et will be similar to the
EX [30] (European Energy Exchange). It is envisaged &at the d ~ v ~ l o p ~ e n t of ill be done step by step. The first step will be the ~ e v ~ l o p ~ e n t of a futures
market where bilateral contracts can be traded ahead of time. Then a spot market will be founded for physical and short-term power trading. efore reaching that step, Gemany has to work on the i n ~ a s ~ ~ ~ r e and r e ~ ~ a t i o n s for fast and rel~ab~e w ~ e e l ~ g which is essential for efficient ~ ~ i n g of the spot market.
Energy Information Administration, ~ t tp : / /~ .e ia .doe .gov /emeu l~e~e lec~c i . BTM consult Aps, hnp://www.btm.dWArticle~~ed-globaf/Eed-glo~al.h~. Stefmo Zamagni, Microeconomic Theory: An Introduction, Basil Blackwell, Oxford, 1987, John Bernard, Robert Ethier, Timothy Mount, William Schulze, Ray D, Zimmerman, Beqiang Gan, Carlos Murillo-Sachez, Rober J. Thornas and Richard Scbuler, ‘Markets for electric power: Experimental results for alternative auction institutions’, availablc via h~ tp : / /~~ .pserc .w isc .ed~ index~ub l ica t ions .~~ l , Proceedings of the Hawaii ~n~ernation~l Conjerence on Sysfern Sciences, January 1997. John Bernard, Timothy Mount, William Schulze, Ray D. Zimmennan, Robert J, Thoinas and
chard Schuler, ’Alternative auction institutions for purchasing electric power’, available via bttp:/ /www.pserc.wise.edulpsercbin/tcsl/ , 1998. Frank A. Wolak, and R. H. Patrick, ‘The impact of market rules and market structure on the price determination process in the England and Wales electricity market’, selected paper presented at the POWER Conference, March 1997, University of California, Berkeley, Berkeley, California, February 1997. Tim Mount, ‘Market power and price volatility in restructured ~~~e~ for electricity’, available via hnp://~.pserc.wisc.edulindex.gublications.html, November 1998. NETA, New Electricity Trading Arrangements for England and Wales, are based on proposals published by OFFER, Office of Electricity Regulation, July 1998, available via ~ ~ : / t ~ . o f g e m . g o v . ~ ~ lielix F. Wu, ‘Coordinated multilateral trades for electric power networks’, 12th Power Systems Compu~a~ion Conference, Dresden, August 1996. K.L. Lo and Z.Q. MO, ‘Methods for determining wheeling rates’, submitted to the special issue of International Journal of @stem Science on the Beslnicttmring of the Electric Power Industry, 2000. lgnacio 3. Perez-Arriaga, Hugh Rudnick and Walter 0. StadIin, 'international power system transmission open access experience’, IEEE Transactions on Power Systems, Vol. 10, No.1, February 1995. Young-Moon Park, Jong-Bae Park, Jung-Uk Lim and Jong-Ryul Won, ‘An analytical a ~ ~ r o a c ~ for transmis5ion costs allocation in transmission system’, IEEE Transactions on Power Systems, Vol. 13, No.4, November 1998.

Deregulation of Electric ~ t i ~ i t i e s 75
[13] J.W. Marangon Lima, M.V.F. Pereira and J.L.R Pereira, ‘An integrated f r ~ e w o r k for cost a~location in a mu~~-owned transmission system’, IEEE Transuct~ons on Power ~ s ~ e m s , V01.10, No.2, May 1995.
[14] J.W. ~ a r a n g o n Lima and E.J. de Oliveira, ‘The long-term impact o f transmission pricing’, IEEE ~ ~ n s a c t j o n s on Power Systems, Vol. 13, No.4, November 1998.
[ lS] K. Lo, Y.S. h e n and L.A. Snider, ‘Congestion management in d e r e ~ l a ~ e d electricity markets’, Proceedings of the I~~erna~ionul Conference on Power Utility ~ ~ r e ~ ~ a ~ ~ o ~ , ~ e s t ~ c ~ u r ~ n g and Power Tec~no lo~ ie~ 2000, City Universiw, London, IEEE, April 2000,
[16] Michael D, Cadwalader, Scott M. Rarvey, William W. Hogan and Susan L. Pope, ‘Coord~~ation congestion relief across multiple regions’, Harvard Energy Policy Papers, available via ~ . k s g . h a r v a r d , ~ d ~ p e o ~ ~ e / w h o g a i ~ ~ d e x . h t ~ , October, 1999.
[17] R.S. Fang and A, . David, ‘Qptimal dispatch under transmission ~ontrac~s’, IEEE Transa~~~ons on PO
sco Galiana, Lester Fink, Power Systems R e s t ~ ~ ~ ~ ~ ~ n ~ : E i ~ ~ i n e e r i r ~ ~ and r Academic Publishers, 1998. ie and Ivar Wan~ensteen, ‘The energy market in Norway and Sweden:
pp.47-52.
Systems, Vol.14, No.2, May 1999.
Energy Institute, September 1999, available via http://www.ucci.berkeley.edu/ucei. [22] The Nordic Power Exchange, ‘The spot market’, available via w~.nordpool.com. [23] For derails and examples refer to, ’Zonal clearing market prices: A tutorial*, available via
h~:/ lwww.calpx.comtnews/publ~cations/in. [24] $ c o ~ i ~ d has 10,000 MW generation capacity against maxim^ demand of around 5,750
data taken from ‘Review of Scottish trading arrangements: A c ~ n ~ u l ~ a t i o ~ ~ docu~en~ ’ , The Office of Gas
[ZS] Details of future proposals can be found in the latest documents publishe~ by O f g e ~ via its web site: h ~ ~ : l t ~ .ofgem.gov .uM ,
t261 Fred C. Schweppe, Mchael C. Caraminis, Richard D. Tablors and Roger E. Bohn, Spot Pricing o ~ ~ l e c t ~ ~ i ~ ~ Kluwer Academic ~ b l i ~ h e r s , 1988.
associated with a discussion of the losses and c o n s ~ ~ i n ~ surplus’9 Marketplace Company Limited, July 1999, available via
[2S] Greenpeac~, G e ~ ~ a n y , * S ~ r o ~ a r ~ in Deutschland: Vom Monopol zum ell', ~ o v e ~ b ~ r 1898, a v a ~ ~ ~ b I e via h~://www.greenpeace.de.
[29] ~ n ~ o ~ a t i o n obtained in the ‘Strombijrsen’ section at: h ~ t ~ : / / ~ . s t r o m . d e .
Electricity Markets, October 1999, availabIe via http://w.ofgem.gov.uW.

Un~versity College Dublin Ireland
Prof. Chen~Ching Liu Universi~ of ~ashingtQn Seattle, USA
~ l e c ~ ~ ~ ~ ~ markets throughout the world are undergoing major chan es 111. These changes are varied in their nature but h e uiiderly~g trend is towards a more CO
and this results in electricity being traded as a c o m ~ o d ~ ~ e markets to facilitate this trade. Political forces [a33 are driving these
changes. (ge~~erators) are com~e~ing to sell their e l e c t r ~ c ~ ~ to a number (loads). Here we are concerned with c o ~ ~ e ~ i t i o n in a wholesale electricity ~ a r ~ e t where the c~istomers are lap c o ~ s ~ ~ e r s .
A compe~~tive electricity market is one in wh
consumers or a retailer who will resell the e l e c ~ i c ~ ~ to th
A l t ~ o ~ g h electric energy can be stored in batteries it w tities and hence ~ l e c t ~ c i ~ is a r ~ a l - t i ~ e corn i~stan~ly. The electr ici~ demand
d also has a significant random Id in an ~ ~ ~ c ~ c i ~ ~ ~ r ~ e t is energy, Th
active ~ o w e r and au~omatic gen~rator contrQ~ Er that the electricity system can
need to be ~ r o v ~ d e d and an e$ec~icity m of t ~ e s e services [6 ] . The g ~ e r a t o ~
ically and K ~ c ~ o f ~ s laws system. The consequence o
iates this c ~ ~ ~ ~ e s t i o n [7]. ystem and altering the s u ~ ~ l ~ (g~~ierator o u ~ u t s )
y, a n ~ ~ l l a ~ services and

Competetive Wholesale Electricity arke et§ 77
with the real-time stochastic nature o f the electricity deman makes des~gning an arket a great challenge.
s in a wholesale electr ici~ market will be connected to the high- system as opposed to the Iow-voltage distribution system. This
~ansmission system an sports the electricity. In some markets single entities generati~g units, transmission systems and supply the customers directly. These are ~o~ as vertically integrated utilities (VIUs) and can be monopolies. Where
opol~es exist or where a ~ o ~ i n a n ~ market position is held in one part of the ~ndustr~, c ~ i ~ a r l ~ genera~ion, au~orit ies are implementing new market s ~ c ~ r e s to e n c o u r a ~ ~
corn~et~tion [2,3]. It is ~ i f o ~ ~ y accepted that the transrnissi~n sys n~o~opoly and in this new environmen~ it should be regulated to ensure open market [9]. Here it is assumed that all other aspects of the w market are competitiv~, a it is recognised that many who
tive. For example, in Norway redefined limit are compensate
limit are not [no]. Co~sumer demand is largely inelastic but demand- c o ~ p e ~ ~ t i v e ~ a ~ k e t s i s tec~ica l ly feasible and is becoming more CO
In a monopo~istic ~amework a re lated VIU makes pl isions based on a least cost objective, subject to constraints ( ~ ~ i l i ~ c ~ ~ t e r ~ a ~ 1 ~ ~ 1 3 1 . This p ~ a ~ i ~ g and operationa~ process
f scheduling algorithms, each one s roblem over a distinct time frame.
~nvo~ves econom ch ~~gorithms which achieve a real-ti and demand in a least cost manner. More advanced economic the optimal ~ o w e r flow ~~~~~ e consider the optimal con~~a in ts ~ncluaing transmissi e limits, voltage levels,
e frames unit commitment (UC)
s which are limited by these type
replaced by ~robabilistic models [IS]. Ln this ns are made. This planning and o ~ ~ r a t i o n e time for delivery approaches, the sc~edules and ~ ~ s ~ a t c h are to current c i rcu~stan~es.

7 Power System ~ e ~ ~ c ~ ~ n ~ and
these markets result in cost m~nimisation in the short tern but their CO
aspect should in the long Tun serve to reduce these costs even further. In the com~e~ i t~ve market situation ~here€ore a set of markets need to be developed that mimic the VIU least cost objective, subject to opera~io~al and re~iabi~~ty constrain~s. In p ~ i c u l
are being replaced by markets for energy, transmission and Just as with scheduliiig algorithms these markets have di
The real-time or ba~ancing markets are run very frequ~ntly to main~hn ~alance ~ e ~ e e n supply and demand and to ensure system security and are similar to economic d~spatch and OPF al~orithms. In many markets there may be a need to run day-ahead ~ a r k e t s that will be like the unit ~ o ~ i t m e n t process [22]. L ~ n g - ~ e ~ c a p a c i ~ markets may also be a feature hn some systems where €or reliability reasons generators are compensa~ed for keeping available capacity 1231.
~ompet i t~ve electricity inarket design is a highly complex exercise not only by economic and engineering considerations but also by histo social cons~aints. Many of the current designs have ~ecQgnisabIe flaws
ibutcd to both technical and non-tec~ical i ~ ~ u e n c e s . to be assessed with these factors in mind. Lessons can be generally every market has particular c i rcums~ces wh
ity market designs in di~erent circums~nces can be e q ~ i a ~ ~ y e f f ~ ~ ~ i v ired result, an efficient and reliable electricity supply. Different rna
~ i r c ~ s ~ c e s may also roduce the same desired results. There i s no olution to the complex problem o f e l e c ~ c i ~ m ~ k ~ t de ators will agree that competitive e~ec t r i c i~~ markets will resat1
society there are some very s i ~ i ~ c ~ t dif€erenc~s of op~nion on some issues, These differe~ces of opinion can be d o ~ ~ a ~ i c in nature and s to cloud the issues. Each regiodcountry should choose a design tha
ition but suits their particufar social, e c o ~ o ~ ~ c and political e re a broad o ~ e ~ i e w of wholesale elecbi
on of the independent system operator in which describes wholesale e~ectricity market charact~r~st~cs follows in ~ e c ~ i o n
c~arac~erist~cs incl~de auctions, b idd~n~ , prici~ig, f o ~ a r d ential markets, congestion man ary services, physical and ~ n a n c ~ a l m s are given to illustrate these cha ty markets Section 3.4 describes
le e ~ e c ~ i c i ~ markets are still an active area o f rese the challenge^ in the design and opera~ion of these
A c ~ o ~ ~ ~ d g e m e ~ ~ are In Section 3.6 and a CO
S e c ~ i o ~ 3.7.

C o ~ ~ ~ t e ~ i v e ~ h o l e s ~ ~ Electricity Markets 79
As more and more regions/countries open up their electricity markets to competit~on, the ~uestion of how to des~gn the market in the best interests of the consumers and s u p p ~ i e ~ is of prime importance. Central to this are the energy, transmissio and ancillary services markets and how they are coordinated. The competitive market demand ~ n c ~ ~ o n s effect~vely in many markets, e.g. stock market delivery of a product is required by a stock market whereas in an electricity market a p r o ~ u c ~ must e v e n ~ a ~ l y be de~ivered ins~nt ly (i.e. no storage) and its
ower system. The closer we get to physical delivery th the operational and reliability constraints. These basic principles are
n many ~ ~ c ~ i o n i n g markets and it is universally accepted that e i~dependen~ system opcrator (ISO). Although an accepted pri
the IS0 is a hotly debated topic. S market structures require a large role for the w h ~ l ~ others require roach. This operator disc rim in at^^ to all e market hence the operator. In general responsible for tasks such
g of load for all users and ensu~ng com standards. The IS0 will o ~ ~ r a ~ e the
gestion and constraints on a n e ~ o ~ ~ b system reliability the IS0 should also
hancements, The IS0 may also pro led basis and perform the s e # ~ e ~ e ~ t
, open access to the transmission grid to all users
of aspects that need ~ ~ a g i n g , ranging from c o ~ e c ~ i o n ~o l i c~es , con~est~on management and the a~in is t ra t ion of ene
n po~icies are an ~ m p o ~ a n t aspect of the ESO res~onsibili~~es. and charges that all participants must meet in order to connect to the grid and
in the marke~. The trans~ssion system is made up of a enera~rs and cons~mers are located, and these buses are
lines. These lines transport the electrical energy around the hi t r a n s ~ ~ s s i o ~ system and have limited capacities, which for security
[26], When a line is at its limit the system is congested er inj~ctions at every node in the system. Relieving th
generator^ andfor consumers to alter their quantities. ~ ~ e f o r e congestion puts a c o ~ s ~ r a i ~ t on the e n e r ~ markets and in many instances may render them non-compe~itiv~ [27]. Losses on an e l e ~ ~ i c i ~ grid are unavoi~ble and can be substantial. A market
nt’s p~ysical location on the transmission system, i.e. portan ant factor in wholesale electricity markets. Th
~ d ~ e n ~ a ~ s of establishing the instantaneous Iocati of electricity. For exa~p ie , a generator that is injecting pow~r location at one i n s ~ n t in time can cause substa~tiaIly different losses and c o n ~ e ~ t i o ~ than a similar in ject~o~~ at another location andlor time. The cost of these loss
sm~ss~on s y ~ t e ~ n e ~ ~ to be ~ l ~ o c a t e ~ in some manner to the

Power System ~ e s ~ c ~ ~ n g and
electricity market and this is not a trivial task [29]. The revenues collecte~ by the TSO from the ~enera~or§ and loads for these ~ansmiss~on s e ~ ~ c e § (co~ect ion, age,
ay for the ~ans~ iss ion § y s t e ~ in tbe short an
In the VHU environ~ent the least cost objective ~ p ~ c a l ~ y r e ~ e ~ e d ~ i i l y to the cost of an6i l la~ services such as r ~ s e ~ e and vol~dge ~ o n t r o ~ were ~ e a t e ~ as opt~~isat ion process and their cost may not have been e x p l i ~ i ~ ~ y
illary services is costly, and the ~ u a ~ ~ ~ ~ ~ ~ t i o n of reserv~ are services that generat~ng units provide
they have significant costs associated wit11 them D23. ~ ~ ~ ~ a ~ o ~ s will not provide these services unless they are ade~uately compensa~ed [33]. In s o ~ e cases, howev~r, g ~ n ~ r a ~ o r § may be obliged to provide these services in order to be al l~wed to
arket. Ancillary services can be self-~~ovided by the e ~ ~ r g y ce. ~hys ica~ly self- nsible for a ~ q u ~ ~ n ~ the
ient and ener~y ~~k~~ ~ro~ is iQn af these s these services from others. Therefore in c o ~ p e t i t ~ v ~ whole
a state where load shed and reserve that must
rocess, then the ex
~ncentive to ~ a i n t a i ~ units [41]. A strong ar fines are not n ~ ~ e s s a ~ , as pure market forces
in the competitive enviro the event of a shortfall in gen
In a ~ ~ o ~ e s a l ~ electricity market ~ u l t i ~ l e being traded over
number of choices s ~ s ~ e ~ model is used to i ~ ~ u s ~ a t e the basic c~arac~e~st ics
d ~ $ i ~ i ~ ~ an e l e ~ ~ r i ~ i ~
refe~ences to existing wholesale ele characteri§ti~s but it should be no
ity markets are used here to illus eneral these exist in^ m
ecul~ar~t~es which do not allow them to be c lso be noted that even at the time of this writing rn re a v a ~ ~ a b l ~ the relevant web sites are giv
the r sh
3.3.1 ~ r n ~ ~ l Test ~ys~ern
test system cons~s~~ng of a supply si d a simple ~ ~ e e - b u s network.
tors have quadratic production cost con§~aints given by ~ i n i ~ u m and r n a x ~ ~ u ~ gen
are the power outputs in MW of generator #1 and
ic utility curves and n i m ~ m and max~mum

2 Power System ~ e ~ t ~ ~ ~ i n g a d
Line A (3.5)
Line AC (3.6)
The coef~cients of P, and Pz are the line sen~~~ivit ies of the respectiv~ lines to inj~ctions at buses r~spectively [27].
us A Line A us
istinct ~ a d ~ n g ~ ~ c h a n i s ~ s ~ the central auction iers and ~ustomers both s u b ~ i t the market clears, i.e. d e t e ~ i n ~ §
m [46]. In their simplest forms these centralised auctions to a §im~le merit order economic ~ s p ~ ~ c h a l g o ~ i ~ h ~ [12]. The
d auction for ~~~~~~
auction m e c ~ a n i s ~ ~
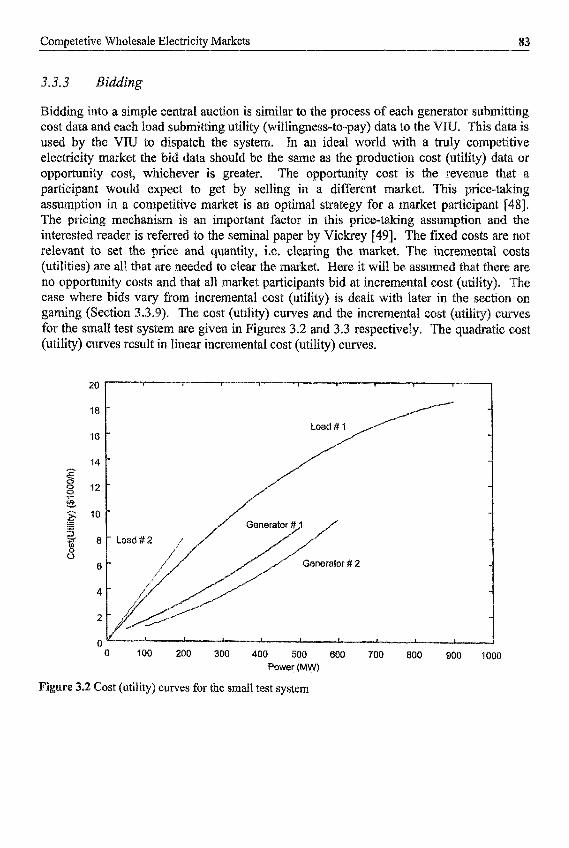
Competetive Wholesale Electricity Markets 3
3.3.3 ~ddin
idding into a simple central auction i s similar to the process of each generator submi~i cost data and each load submi~ing utility ( ~ l l i ~ ~ e s s - t o - p a y ) data to the used by the VIU to dispatch the system. In an ideal world with a electricity market the bid data should be the same as the ~roduction cost (utility) data or o p p o ~ n i t y cost, wRicRever is eater. The o p p o ~ n i ~ cost is the r~venue p ~ i c i p ~ t would expect to get by selling in a different market. This price assu~ption in a competitiv~ market is an optimal strategy for a market particip The p ~ c i n ~ mechan~sm i an important factor in this p r i ce -~ ing a s s ~ ~ p t i o n and the
to the seminal paper by Vickrey [49]. The fixed costs are not d ~uan~i ty , i.e. clearing the market. The incrementa1 costs
(ut~~ities) are all that are needed to clear the market. Here it will be assumed no opportunity costs and that all market p~ ic ipants bid at ~ c r e m ~ n ~ l cost case where bids vary from incremental cost (utility) is dealt with later in the section on
~ S e ~ t i o n 3.3.9). The cost (uti~ity) curves and the increme~tal cos small test system are given in ~ ~ ~ r e s 3.2 and 3.3 respective~y. T
(utility) curves result in linear increnienta~ cost (utility) curves.
20
w
0 100 200 300 400 500 BOO 700 Power (MW) Power (MW)
Cost ( ~ t i l i ~ ~ curves for the small test system

5
n u 0 100 200 300 400 500 600 7
3 I ~ ~ r e ~ e i i ~ a l cost (utility) curves for the small test system

C o ~ ~ e t e ~ i v e Wholesale Electricity Markets
Profits for the ~ e n ~ r a ~ ~ r s are c a ~ c u ~ a ~ e ~ by t a ~ i n ~ the di~erence between the r e ~ e n ~ ~ e cost. The cost in t h ~ § ~ calcu~ations is taken to be the i~nore§ other fixed costs such as eapit ce ~ e ~ e e n the utility
p r ~ c i ~ ~ ~ ~ c h a n i s i n is pay as you bid w h ~ r ~ p a ~ i c i ~ a n ~ s p is prQ~osed that this type of d iscr~~ina~ory pricing wi
ts (3.11, (3.2), (3.3) and (3.4) and (be load balanc~ c o ~ s ~ a ~ ~ ~
roce~§ (a ~ ~ a d r a ~ i c p r o g ~ a ~ i n g ils of solution) the no-load and fixed
et in h i s m ~ n e r with~ut amb ~ ~ c r e a s ~ n g [ d ~ c r e a s ~ ~ g ~ ,

Power System R ~ s ~ c ~ n g and ~ e r e ~ l a t i Q n
constraint (3.9) and the assumption of a lossless system, the pool (central auction) is revenue neutral, i.e. what is paid in by the loads is paid out to the ~enerators,
le 3.1 Market clearing, transmission uncQns~ained
G e n ~ ~ ~ Q r / ~ Q a ~ Quantity (MW) Price ( $ ~ ~ ) Profit ( S u ~ l ~ s ) ($A) Generator #I 313.6 18.3 683.7
~eneratQr #2 409. I 18.3 21 10.3
Load #\ 522.7 18.3 437 1.9 Load #2 200.00 18.3 4345.5
3.3.5 ~ a r ~ ~ t Timing
to the stochas~ic nature of the demand [ and the need to s c h e d ~ e ~e~era t i on resources in advance, electricity markets can characterised by timing. Forward
s are run in advance of the delivery time. This enables suppliers to e~eration to meet the demand and for the IS0 to coo~dinate ~ a n s r n i ~ s i ~ n and ervice needs. The forward markets also perform a very important financial
ractice [SZ]. In power unit constraints these
1. There may be a m u ~ t i ~ d e of f o ~ ~ d ~ a r k e ~ s at ahead, month ahead and day ahead. In Cal i fo~ ia the power
(PX) m s three different types of forward markets [53,54]. The day-ahead lishes prices and quantity of electricity for delivery d ~ ~ n ~ each how of the
ants by locking in prices an I-time (spot) markets and is
systems with large themal plants that are in
. The day-of~our-ahead market o erates similar to the day ding closer to the delivery hour.
pa~icipants can buy and sell energy months in ad order of min~tes in ance of delivery are deeme a ~ p r o ~ ~ h e s real-time markets are needed to ensure supply and adapt to unforesee~ c~rcumstances. These real-time markets are in
market for real-time a d ~ u s ~ e n ~ [55, 101. The p r e a ~ - ~ i ~ ~ basis but this is set to change with the ~t roduc~ion of a binding day-a~ead ~ a r ~ e t
d Norway the respecti~e lSOs operate
E567.
The core product being soid in electricity markets is energy. U l t i ~a~e ly the coordi~&t i~n of units (sc~eduling) and of the ~ransmission and a n c i 1 1 ~ services enables its seque~t ia~ e l e c ~ c i ~ market structure is one in which the energy t ~ a ~ ~ d
ndently of the transmission and ancillary services. The provision of the e~ergy ~ a d ~ n ~ in a tlal trans~ission and ancillary services needs follows
sequentia~ ~~anner . In ~ a l ~ f o ~ i a forward energy ~ a r k e t s are con real-tinre energy, congestion management and ancillary services
a l i f o~~ ia [58]. There i s a strong physicai coup1
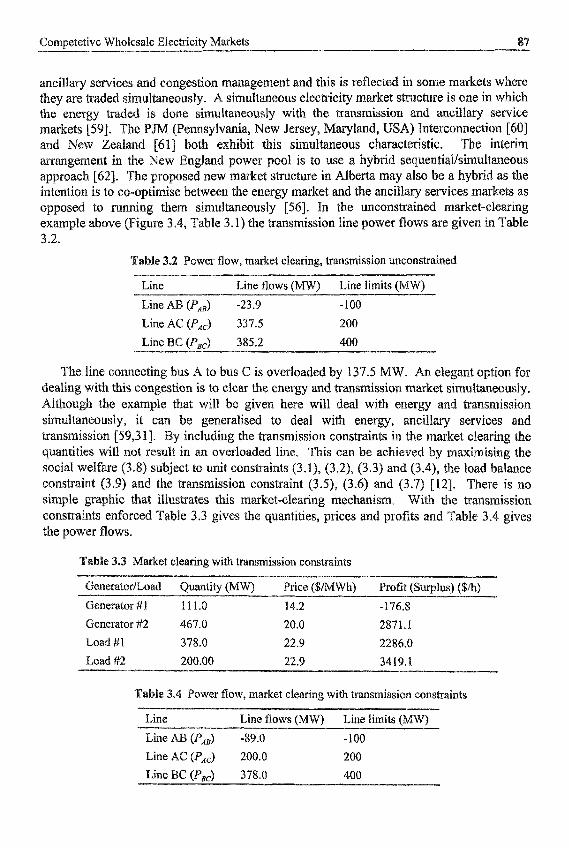
Compete~ive Wholesale Electricity 7
s e ~ i c e s and congest~on management and this is reflec~ed ded s~~u l tan~ous ly . A s~muItaneo~s electricity market
some markets where cbre is one in which
a n ~ ~ u s l y with the transmission and ~ c i l l a r y s ania, New Jersey, Maryland, USA) ~ n t e ~ c o ~ e c ~ ~ o n [60]
this simultaneous c~arac~e~§t ic . The i ~ t ~ ~ r n r pool is to use a hybri se~uent~a~simul~aneous
arket structure in Alberta may also be a h y b ~ $ as the the energy market and the ancillary services markets as
eously [56]. In the uncons ined market -c~e~ng the ~ a n s ~ i s s i o n line power ws are given in Table
3.2.
le 3.2 Power flow, market clearing, transmission ~ n c o n s ~ ~ n e d
-100
Line AC (PAc) 337.5 200
Line BC (PBc) 385.2 400
The line c ~ n ~ e c t i ~ ~ bus A to bus C is overloaded by 137.5 M with this ~ o n g e s ~ o n is to clear the ~nergy and transmission mar h the e x a ~ ~ ~ ~ e that will be given here will deal with
~imulta~eously it c to deal with energy smission constraints in the
ed line. This can be ac~~eved social welfare (3.8) subject to unit const~aints (3.1), (3.2), (3.3) a ons strain^ (3.9) and the transmission ~ons~raint (3.5), (3.6) and
hic that illus~ates this arke et-clea~ng mechan is~~ cons~a~nts en€~rced Table 3.3 gives the ~uant~ties, prices and p the power flows.
Market clearing with transmission constraints
Generator #2 467.0 20.0 2871.1
h a d #I 378.0 22.9 228~.0
Load #2 200.00 22.9 3419.1.
Power flow, market clearing with ~ransmissio~ cons~aints
Line Line flows (MW) Line limits &IW)
-100
Line AC (PAJ 200.0 200
400
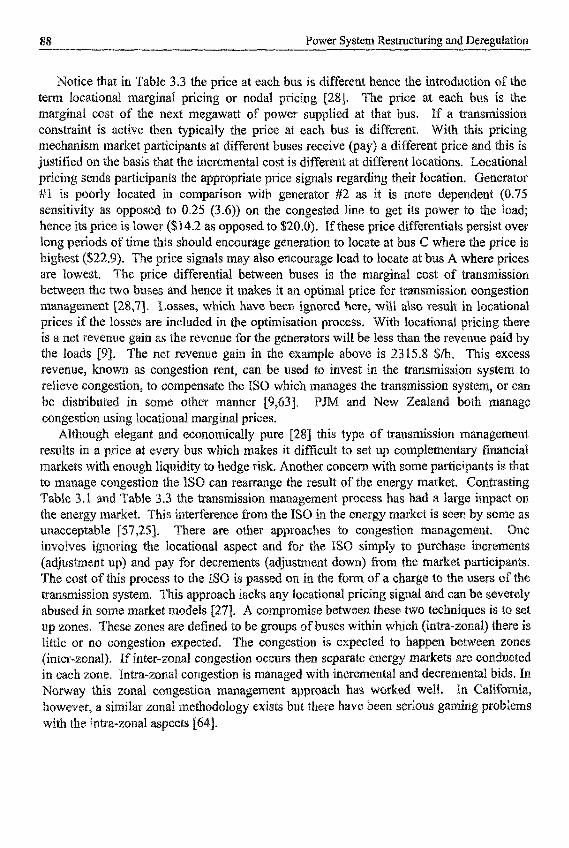
structuring and Deregulation
~ o t i c e that in Table 3.3 the price at each bus is differe ce the ~ n ~ o d u ~ t i o n of the price at each bus is the term locationa~ marginal pricing or nodal
1 cost of the next ~ ~ g a w a t t of po I is active then typically the price at each bus
ipants at different buses receive (pay) a d~f~erent price and this is the ~ c r e ~ e n t a l cost i s different at d~fferent locat~~ns, ~o~a t iona l the appropriate price signals regard in^ their location. ~ e n e ~ t o r
#l is poorly located in co~parisQn with generator #2 as it is
~ e ~ e e ~ the ~o buses.
ain as the revenue for the generators will be les
and New ~ e a l ~ ~
can r e a ~ a n g ~ the result of the ener

~om~ete t ive Wholesale Electricity Markers
~ q ~ a n t i ~ and price) ar is trading ap~roach has the
ot c ~ e n t l y ~ e ~ i ~ e d in must be traded through the cen
is set to change in Engl
may be net inject~ons which may c n management process these
ut the cheapest generators.
If these transacti m have been changed as
se bilateral trade transmission co~$~a in ts for the central auction:
Line A
ine A
Li (3.12)
arket clearing with transmission constraints and bilateral ~ ~ ~ s a ~ ~ ~ o ~ s
~ e n e ~ a t o ~ #I 92.6 13.9 -214.3 ~ e n ~ r a t o r fc2 472.2 20.2 2945.3
Load #I 364.8 23.3 2129.6
Load #2 200.0 23.3
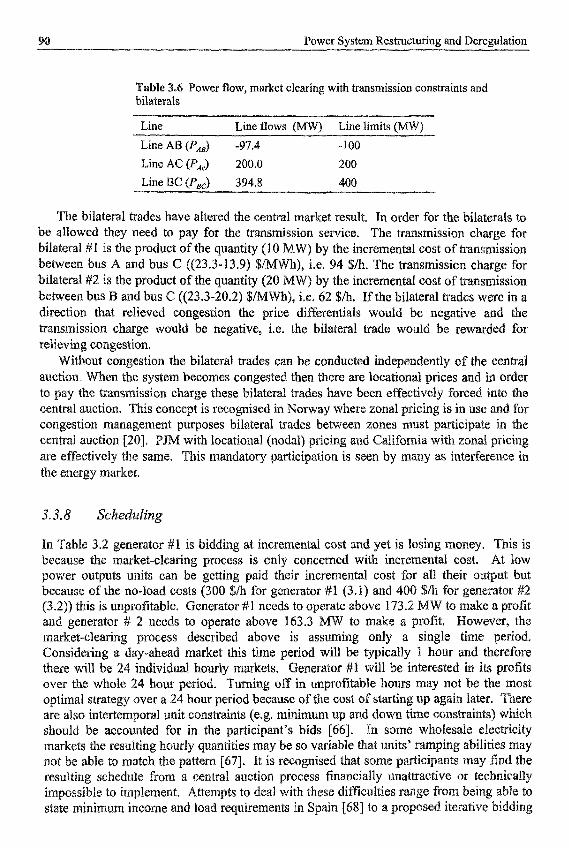
9 Power System Restructuring and
Table 3.6 Power flow, market clearing with transmission constraints and bilaterals
Line Line Rows (MW) Line limits (MW)
Line AB (P&) -97.4 -100
Line AG (PAJ 200.0 200
The bilateral trades have altered the central market result. In order for be allowed they need to pay for the tran§m~ss~on service. The ~ ~ s ~ i s b i l~ te~al W1 is the product of the q u ~ t ~ ~ (10 MW) by the i n c r e m ~ n ~ l cost of ~rans~ission between bus A and bus C ((23.3-13.9) $ i.e. 94 $/h. The ~ ~ s m i s § i o n charge for
product of the quantity ntal cost of ~ansmi§sion d bus G ((2~.3-20.2) $ / ~ W ~ ~ ~ i. ilatera~ trades re in a
d~rect~on that relieved congestion the price diff~rential~ would be negativ ~ ~ ~ s m i s s i o n charge would be negativ~, i.e. the bilateral trade would be re
estion the bilateral trades can be ~Qnducted indep
to pay the ~ a n s ~ i s s ~ o n charge these i latera~ ~ a d e s have been eEe central auction. This concept is reco~n is~d in Norway where zonal
ement ~ u ~ o § e s bilateral trades b e ~ e e n zones c e ~ ~ a l auc~ion [20J P
stem becomes c~nges~ed then there
ith locarional (nodal is mandatory partic
able to match the p a ~ e ~ [67]. It is ng schedul~ from a central a~iction
Competetive Wholesale Els&icity Mmkets 1
scheme in the ~ a l i f o ~ i a P proposed for California proved impractical and has not been
In the VIU envi~onment generators were typically
[54]. It is interesting to note that this iterative bid~ing scheme
This UC a ~ g o ~ t h ~ uses cost ts and accounts for the inter r a m ~ ~ n g rates [l5]. In so
need to be ~nte~a l ised in the bids of the p a ~ i c i p ~ t s 16 the prices in advance [69] and bid so that the pro~table. This self-schedu~~ng approach is in existence in the ~ a ~ i f o r n ~ ~
and Norway [70]. Bilateral trades are by their nature self-s security reasons, self-scheduling may be subject to approval by the IS0 "711. a central auction process can also involve a firm that owns mui~ple units
submitting portfolio bids. These bids represent an aggregate offer. Afier market clearing the firm can then decide how it will schedule its own units to supply the qu~t i t ies , The CalPX allows portfolio bids.
is used to clear the market [41]. ~idd ing in fo~at io i i in this auction mech~ ism is very ~ e t ~ ~ ~ e ~ 9 ~ n ~ ~ u d ~ g all cost data and a p p r Q ~ ~ a t e technical cons~aints. In the clearing examples above the optimisation problem variables were which are con~inuo~s. In a centrally scheduled system the objective is th of social welfare, subject to ~onstraiiits9 but the variables are both continuous (quan~ities~ and discrete (turn a generator on or off) [72]. In PJM some units can choos scheduled while others with bilateral contracts can self-schedule. In the e n e r ~ market i s a centrally optimised UC process but this is set to change
An alternative to self-scheduljng is centralised scheduling where a UC-type algorit
In perfectly competitive electricity markets the most profitable swate p~ ic ipan t is to act as a price taker and bid at incremental cost [48]. a s s ~ p t i o n assumes an infinite number of competitors so the bidding beh player cannot affect the markets, i.e. influence prices. In the real world, however, there are only a finite number of market participants and each participant has to some degre power, i.e. they can bid s~a~egical ly to increase their own profits. There is a mu possibilities for this type of gaming behaviour in ellectricity markets [73,74]. De bids from ~ncremen~al cost can also occur because a p~ ic ipan t wants to en schedule [66] or it knows it has another opportunity in anorher market incremental opportunity cost.
As an example consider generator #I in the constrained market above. i n c r e m e ~ ~ ~ cost ~enera~or # I is making a loss (Table 3.3). In this: case ge alter its bidding strategy so as to avoid this loss. Table 3.7 gives the result for one strategy wbere gen~ratQr #I ~ncrease~ the linear part of its bid (3.1) from 12 ~ ~ W h to 14

Power System R e s t ~ ~ ~ n g and --
atkec clearing with ~ansmission constrain~§ and ~en~sato t kt l bidding strategically, i.e. the linear coefficient is changed from 12 $ M ~ to 14 $MWh
~enerator/Load Quantity (MW) Price ($/NIwh) Profit (Surplus) ($/h)
~enesator #I 106.3 16.1 25.2
Generator R 48 1.3 20.4 3075.1
Load #1 387.6 22.6 2403.2
Goad #2 200.0 22.6 3480.4
erator # I by a~tenng its bid away from ~ncremen~l cost has tu le 3.3) into a profit of 25.2 $/h (Table 3.7). ~enerator ## 2
incre~ing its profits from 2871.1 $k (Table 3.3) to 3075.1 $k (Tab 3.7). Load# 1 and 2 have both also gained as their surpluses have increased. y b ~ d d ~ g above its ntal cost generator # 1 has increased its price and reduced s quantiw and most
are a balance betureen ~ c r e a s ~ g price and reduc q~antity, ~ i t h inelastic e is more scope for driving up prices w~thout excessi ads can also bid strategically. The price differenti
bus B: has reduc~d (T revenue from the c~~gest ion
7) and hence the loser in this g ment has reduced from 23 15 ties and these exist in
here pa~icipan~s are in collusion 176,733. Cen the market power. ~ o w ~ v e r , t r ~ ~ ~ i s s i o n
mall pockets with very few ~ ~ i c i p ~ ~ . s with little market power ~ loba~ ly c
ransmission systems that are prone to tive electricity market difficult. S
their nature [26] pose s i ~ i l a r diffic ed that must run for re~~ab i l~w reas
In this
R) generators are ~o~pensa ted outsi
market results [8OJ. In the example above it should be noted that the strategy of g~nerator # I is not op~imal.
ptirnal s~a~eg ies can be found, however [S 1,821. Successful ~ a ~ i n ~ behaviour r e ~ u ~ e s ts to have good information about other p a ~ i c ~ p ~ ~ s ’ bi and to consider the n a ~ r e of the p r o b ~ e ~ [83].
onstra~~ts and g a ~ i n g behaviour act to reduce social we~fare. Table 3.8 below the social welfare for some of the ex sion c o n s ~ a ~ t s and all ~ a ~ c i p ~ t s
social welf~re is a ~aximum. With the ~ a n s m ~ §
are bi~ding away from ~ncre~enta l cost ( ~ t i l i ~ ) then the social we~fare is her r~duced, lace of cheaper power and the social we1

Coin~etetiv~ Wholesale Electricity Markets
Social welfare
Market Social welfare ($h)
No t ~ ~ s ~ i s s i Q n constra~nts tab^^ 3.1) 11,511
~ r a n s ~ i s s ~ o n constraints (Table 3.3) 10,715
Gaming and transmission constraints (Table 3.7) 10,711
3.3.10 A n c ~ i ~ u ~ Services
s e ~ i c e s are required for the reliable operation of the power sys s ~ n ~ r d d e ~ n i ~ ~ o n of these services is not globally accepted. AGC, resesve (s s ta~dby~ , load fo~~owing, v o ~ ~ g e control and b ~ a c ~ - s t a ~ c a p a ~ ~ i ~ w o u ~ ~ be
ised services. The generat5rs ically provide these ~ n c ~ l ~ a ~ can also provide some. New
these s e ~ i c e s are not
term contract. Some of ~ ~ k e t . In ~ J ~ , AGC is se then the IS8 operates a acquired by cons~aining
e process of a c q u ~ ~ n ~ this
they are L ~ w i l ~ ~ ~ ~ or
energy and ~ansmi§s~on congestion manageme~t markets.
spi~i ing reserve is required for system r e l i a b ~ ~ i ~ and advance by acquiring it in a ~ o ~ a r d market, e.g. day ahead. Spinning reserve is the a~~~~~ of an on-line erator tor (bad) to increase (decrease) its output (c period of time. The time per~od will be d e t e ~ ~ e d by the s y s t e ~ t for smaller s y s ~ e ~ s the time period is nemlly smaller in order to avoid large ~ e ~ u e ~ ~ c ~ ~eviati5ns [38,86]. Assume that gesler r # 1 and generator #- 2 can ramp up by 25% and 50% respectively of
acihes in the s ~ ~ ~ i n g reserve time period. It is also ass loads are ~ncapable of p r o v i d ~ ~ ~ spinn~n reserve. Therefore the ~ e ~ ~ ~ e
Consider the simple test system. Assume that the IS
1 I- 0 . 5 ~ ~ 0 0 - P2) 2 200 (3.13)
Table 3. the r e s ~ ~ ~ s of clear m~ssion co~s~a in ts
the market with the above constraint (3.13)

Power System ~ e s ~ c ~ ~ i n g and ~ e r e ~ I a ~ ~ n
Market clearing, reserve constraint, transmission un~ons~ained __.II_.
G e n e ~ a ~ o r ~ o a ~ Quantity (MW) Price ($/MWh) Profit (Surplus) ($h)
Generator #1 3 16.9 21.9 1842.4
Generator #2 291.5 21.9 2969.2
Load #I 408.4 21.9 2669.3
Load #2 200.00 21.9 3614.1
The first thing to notice about Table 3.9 is tkdt in comparison with Table 3.1 the quantities have altered substantially. In order to meet the reserve cons~a in~ (3.13) gen~ator #2 has had its quantity reduced and loa is largely unchanged and load #2 is unchanged. Although generator reduc~ion in quantity it i s more profitable than the unc~nstrained cas reason for this is that the price has increased. Although generator #2 cannot complain about its profits. The biggest gainer out o f this si whose profits have more than tripled. This high1 with ~ e c ~ i c a l parameters, i.e. generator # 1 has It should be noted that if both generator #I and #2 had the ability to ramp up to m a x ~ ~ u m output within the s p ~ n i n g reserve time period then the market would clear at the same price and q ~ ~ ~ i t y as in Table 3.1, i.e. the reserve constraint (3.13) will not be ~~nd ing . Here the binding reserve constraint has caused the social welfare to reduce to 11095 $/h from 1151 1 $/h in the ~ c ~ n s ~ i n e d case (Table 3.8). It shou~d also be noted that in the event of this reserve being used then generators # I and #2 woufd be paid the real-t i~e price for their energy. This scenario, where both g e n ~ r ~ t o ~ are bettcr off because of the ~ c ~ ~ l a ~ services, i s not always the case and eref fore if a constraint causes a red~ction in profits a p~ ic ipan t should be compensated for its o p p o ~ n i ~ cost [60]. The ~ y b r ~ d approach in the New England Pool requires the ca~culation of this o p p o ~ n ~ ~ cost for
An alte~at ive approach for the provision of ancillary services is to set up m~~ke ts . In a competitive e n v i r o ~ e n t the bid curves for reserve and other ancillary services should reflect a pa~cipant’s expected o p p o ~ ~ ~ cost. Expected o p ~ o ~ ~ n i t y cost will require f o ~ e c ~ s t i ~ g ofthe energy spot price [69]. In Cal i fo~ ia the ancillary services markets fo in sequence after the energy and congestion management markets. In this way capaci progressive~y a s s i ~ e d to the various tasks 1551. In New Zealand the ~eserve m ~ k e t is cleared simul~neously with the energy and transmission markets. With ~ a n s ~ i s s i o n and reserve constrai~ts there may be a need to account for the interact~Qn between the two, i.e. in the event that reserve is needed it will require ~ a ~ s m ~ s s i o n [87].
3.3.11 ieal and Finan~ial Markets
~ a r k e ~ § can be physical or financial. If the markeE is physical then the quantities are to be physic~lly delivered in contrast to a financial arke et where no p ~ ~ s i c a l d e ~ i v e ~ is reqMired. In advance of physical d e l i v e ~ the IS may well receive in fo~at ion that is ~ndicat~ve of the physical deliveries. However, at some point in time the I ~ n f ~ ~ e d of the bin~ing physical commi~ents so it can coo r~ i~a te the

C o ~ ~ e t e t ~ ~ e Wholesale Electricity Markets
security and reIiabi1~~. Deviations from these binding c o ~ i ~ e n ~ are with by buying or selli the differences at the real-time price. In C a l i f o ~ submit binding schedu and any imba~ances are adjusted in the real-time m ~ k e t that is operated by the CAISO.
ecause of price volatility many ~articipants in a central auction rocess may wish to acquire financial contracts which hedge their position. In Alberta effectively hedged against the pool price. Alberta currently has only and this has been possible because of the large-scale hedging w p a ~ i c i ~ ~ t s fiom price volatility, This situation is set to change wi being introduced in the near future 1561.
teral trading is one m e c h ~ i s ~ that can be used to hedge the vola~lity in a central a load that are participating in a central auction can ~iave a a price P,,. If the pool market has a uniform price of P, then
his can be ach~eved MW and i n d ~ c ~ t ~ g
oad. If the market price P,, is lower than the P, - P,) to the generator. The net effect is
and the load pays the same amount. at zero price and the load requesting he market price P, is higher than
that thc ~enerator and load h bil~teral c o ~ ~ a c t are perfectly hedge is known as a Contract for Difference (CFD).
congested and has a ~ocational congestion ~anagcmen~ system. If are at the same bus then the hedge is still perfect. If, however, the I different buses they will have to pay for transferring Q MW from the gen load bus. This p~yn ien~ could be revenue depending on the price d~fferenti and the generator split this payment (revenue) between them is their own business. There
involved: the IS0 which collects the charges for co~ges~ion ~ a ~ i o n a ~ prices can be very variable and ~ e n c e the price of ly voIatile. A solution to this difficulty is the conc
~ r a ~ s ~ i s s i o n rights ~ ~ T ~ ) where pa~icipants can in advance ~ ~ r c h a s e fr right to collect the ~ a ~ s ~ i s s i o n charge for Q MW between two buses [63]. load and generator are again hedged. If these transmission rights are compe~~tively traded then their price should reflect the expected price ~~fferential b ~ ~ e e n the load an generator buses. The IS0 must also ensure that these ~ a n s m ~ s s ~ o n rights are feasible9 i.e. its t rans~ iss io~ congestion income in the physical market covers the p these rights. Trans~ission rights may also be subject to gaming behav~our ex~s~ence of ~u l t ip le trading oppo~ni t ies (bilateral, spot market, forwar the wholesale electricity market ~ a ~ i c i ~ a n ~ s win endeavour to optimise their portfcdios [89,90].
W at a price P,,. The two of the uniform price. The s
~owever , this hedging mechanism is unde~ ined in a system that

From the el~ctr~city arke et characte~stics de§c~~bed above it is eviden~ that there is a esign choices for electrici
lco r n o ~ ~ l and the ~ i~atera l sion and ~ ~ c i l ~ a r ~ s e ~ i c e s
pool and bilateral aspects with
rates all ~ h y s ~ ~ a ~ markets forward
and cost ( u t ~ i ~ ~ ~ inform

p a ~ c i p a n t ~ self-schedule. This model oflers all the ~ e n ~ ~ t § of co~prehensive CO
ic ipa~io~ in the cen c ~ ~ i c i s ~ of this type of ically not ~ i q u e and the
is very sensitive to algor i th~ p ~ a ~ e t e r s which could lead consequence of the i~teger n opt i~~§at ion proce dificulty the prices are set by lex algorithm whic
oach should m i ~ i ~ i s e any

~ l e ~ ~ c i ~ markets are highly complex systems that consist of a number of ~ t ~ e l a t e d m ~ k e t s for different commodities (energy, ~ansmission and a n c i ~ l ~ ~ services) and different time frames (real-time, hour ahead and day ahead). There are still man
lems in the design and operation of e l e c ~ ~ i t y mar~ets. when the pure economic theory is applied to a power syst
e economists want the electricity markets to embrace the laws d with simply ideal examples they can show the benefits af such a . The real-time nature, physical constraints and reliability issue all
act to make the development of an ideal market impossible. It should be noted that it is well accepted that all markets, even those for simple c o ~ o d i t i e ~ , are not ideal. The~efor~ the goal should be to develop a market that is a bestfit to the ideal.
Several wholesale electricity markets have been established around the world and most of these are in a con~nuous process of change. This evolut by the need to address some of the outstanding issues in the these markets. Here some of these challenges are outlined.
3.5. I
valuation of market models can have many differe~t v i e ~ o i n ~ s . The ~ a r ~ e t must dmction in a reliable, efgcient and fair manner. The generators will want to maximise their profits t ~ o u g h the markets. The consume^ will seek the best value for the service they receive which may conflict with the aims of the generators [SS ] . This will ne~essitate analysin~ the social benefit that the market offers and the prices that are charged. It will also be dent to ensure that market power and gaming do not exist and that m ~ k e t s are not overly volatile.
~ a r ~ ~ t Power Evulualion and ~itig~lion
on there are some avai lab~~ simuiat~on and a ~ a l ~ i c tools. simulation model that considers the market s ~ c t u r e and estimates and ~uantities. Kumar and SheblB [93] have dev~loped an auctio~
market simulator. Green
and ~ e w b e ~ [94] investigated the UK market using the supply curve exercised regularly in many electricity
m ~ r k ~ ~ s [95,96~. This practice is characterised rices, which are well above co~petitive levels, The result is ~ i c a l ~ y very profitable for the ge~erator and ult~mately costly for
s power can be exercised in many ways. aerators with global market power can manipulate the marginal (spot) price as in the gland and Wales p o ~ e r pool [96]. ~ransmission congest~~n can give p~ ic ipants local market power and they can ~ a n i ~ ~ ~ ~ t e the Iocational marginal prices 1971. Some possible solutions to this problem i n c ~ u d ~ the following [76]:
s et al. @ I ] have developed a framework to in supply when all p ~ c i p a n t s are maximising their own
T h ~ ~ e is little doubt that market power is bei
Competelive Wholesale Electricity Markets 99
Better market design. Some markets have experienced difficulties, which could be resolved by better design [24]. The congestion management process in California has a gaming problem and the Federal Energy Regulatory Commission (FEW) appears to be encouraging the adoption of locational marginal pricing as a solution [3,64].
reaking up the large generating companies into smaller co~petitive WI
oliticd issue, which may not fully solve the problem. In the perceived that the two dominant generation companies exercised their market power to raise prices above competit~ve levels [96]. ~ u ~ ~ ~ n g more ~ansmission so as to avoid creating o p ~ o ~ n i t i e s for local mar~et power. Over-building transmission may seem wasteful but with this ~ a n s r n ~ s ~ ~ o n capacity in place local market power can be removed and generators may act more
e ~ ~ v e l y [8]. This additional ~ansmission will also increase the re l i ab i~ i~ o f the system. There is, however, significant environmental concerns related to b ~ ~ d i n g more transmiss~on lines. Making the load more responsive to price. In the examples n here the load is responsive (3.3); however, this masks the reality where in mo markets the load i s largely inelastic. Any generator hoping to find that a responsive load will reduce its quantity and reduce
. For domestic customers this may be very difficult to i e customers may be capable of ~nsta~~ing equipment that can respond to the mar~et
In the long run new technologies may make distributed generation (e.g. fuel cells) more prevalent and this will reduce the need for further investment in transmission [%I. It will also combat market power, in particular, if this type of generation is owned by groups of consumers (i.e. if the market price is too high they will generate themselves). If this does happen then the electricity market will become part o f a larger energy market. In some markets if the price rises above certain levels the prices are capped; however, this distorts the price s a1 and may have long-term negative consequences~ Price capping has been used at one time or another in most wholesale electricity markets. For e x ~ ~ ~ I e , the California ancillary services markets have had price caps i m p ~ ~ e d [79].
e.
3.5.2 ~ y s t e ~ Capacity
The issue of p l a ~ i n g in generation and transmission must be ad~essed with a view to ma~ntenance and enhancemen~s to meet increasing demand. On the generation side these functions are generally left to the market, the assumption being that energy prices will signal the best times to maintain units and when to build new plant. The energy price spikes in the Mid West (USA) in June 1998 highlight this issue. A market for generating capacity over a fonger time frame (more than one year) may provide the necessary market signals h ensure that the system will expand according to the needs of the co~sum~rs 1233. The concept of marginal cost pricing [99,100] for electricity is based on ~ndamental microeconomic principles [50]. In an ideal market bidding at ~ n c r e m e n ~ cost is an optima^ strategy [48]. However, the resulting schedule may be unprofi~able because of costs such as no-load costs, startup costs and fixed costs (Table 3.3). In the VRJ environment with spot pricing Schweppe et al. (281 introduced the concept of revenue reconci~~a~ion where ~ a r g i n a ~ pricing may not be sufficient to cover all costs and give a

1 Power System R e ~ ~ ~ ~ r i n ~ and Dere
reasonab~e profit. ln competitive markets revenue reconciliation shou~d be redun that m ~ ~ ~ a l cost pricing will in the long i-un resolve this issue. In the lon
not suf~cient to cover business. However, this i in the ~ n g l a ~ d arid Wales power pool ere are
p~ic ipants receive in addition to the market spot st in the energy market but there is
ctures would appear to fail in
c a p a ~ i ~ p a ~ e n t s ~ a l i f o ~ ~ a no such
in new trans~ission [8,102]. This may be a p r ~ a ~ r e t ra~smissio~ i n v e s ~ e n ~ is a long-term issue [30 in t r~~uced. Also it could be argued that the tran and the excess capacity is only being utilised rec are also a factor in the lack of investment in the tran§~ission sys i nves~en t in transmission does not keep pace with the increasing de there will be ~ o n g - t e ~ economic and reliability problems. The
when transmiss~on capacity is needed the market &I
d the markets have only been recently sion system was over-bu~lt in the past , In addition environmenta~ c o n c e ~ s
ction delays etc. this could lead to periods of u ~ e l ~ a b i ~ ~ t y and i~e f~c~enc ies .
.5.3 Reliability
W h ~ ~ e it is desirabIe to encourage co~npetition in the e l e c ~ i c i ~ arke et to reduce the costs e quality for consumers, also v ~ ~ a ~ l y i m p o ~ t to ~ a i n ~ i n the . In an operational envir ent, an important re~~ability ~ea§ure is em security refers to system’s a b i l i ~ to w ~ ~ h s t ~ ~ l i~e ly
erating constraints in case of a like c o n ~ n ~ e n c y ~ such as a line or In other words, s e c u ~ ~ is defin with re spec^ to a set of next
A system is said to be in a secure state if it is able to meet the Load d without viol at^^ the g ~ ~ e r a t o ~ o u ~ g e 11
ies that are likely to occur. Gatas hic failures of power c ~ c a d e d events that are co~binat i n a ~ r a l ca la~~ t ies (e. q ~ i ~ m e n t ~ a l ~ n c t ~ o n s , design flaws andor h ~ a n e ~ o r s [
uch effort in the past decades has been devoted to the develop~ent of c for s y s t e ~ § e ~ ~ r i t y assessment. These tools include state estima~ion,
security assessment is to reduce the likelihood of catastrophic failures.
select~on contingency evaluation, external network equivalents and 10 ustry evolves into a competitive environ~ent, system securi ~nc t ion . In this new env~ronmen~, the p~~~ responsible
or a similar entity. Since the e n v i r o n ~ ~ n ~ is m ical challenges. For example, the level of unce
as increased s i ~ i ~ c ~ t l y . This is due to the fact that ~ e n e r a ~ o n patterns and the market outcome may not be easily p r e ~ ~ c ~ ~ b l e . Con~eque~~ly , a s y s ~ e ~ eng~neer at the IS0 who studies system security may find it d ~ ~ ~ u l t to predict the
is defined fo city market triC ity Gouncil nes ATG as
eneration and load conditions for evaluation of system security.

Competetive Wholesale Electricity 1
‘the Total Transfer Capability (TTC), less the Transmission ~el iabi l~ty Margin ( T ~ ~ , less the sum of e ~ i s ~ i n ~ ~ansmission c o ~ ~ t m e n t s (which includes retail customer s e ~ ~ c e ) an
11061. Note that ATC is de~ned for a ~ c t ~ t ~ o u presents the amount of power that can be Van
ng the ~ a n s ~ i s s i o n system con§traints~ such as line flow limits. ing condit~on of a power system; the syste
de thermal, voltage and stability limits.
smission ~ansfer capability reserved by load-serving entities to ensure ~ h e i ~ the effect of various unce~int ies in system condi~ions on ATC,
erations from interco~ections to meet the system r e l ~ a b i l ~ ~ requirernents. e x a ~ p ~ e of the d e t e ~ i n a ~ ~ o n based on power flow c ~ ~ ~ ~ l a t i ~ i ~ s can
in Bergen and Vittal [ To determine the ATC for a path from X to Y, one can ~nject an a ~ o ~ n t of power at node X and remove the same amount of power at Y and calculate the power flows. ~ansin~ssion line
the i n j e c t e ~ r ~ ~ o v e d amount i s increased to a level that c h its capacity, the amount can no longer be increase
wer ~ a n s ~ e r is the TTG. hen a iven line cont~ngency is ~ a ~ e n in
transmission line conskaints. ~onsequeiit~y~ the ATC may not be as high the ~oiitingency conditio~ i s not considered. The s~eady-s~te power flow metho~ can be exte~ded to include s y s t e ~ d y n a ~ ~ c s ~ Time domain simulatio~s can various levels of power ~ansfer to evaluate system stability including vo s y ~ c h r o n i s ~ o f the ~enerator rotors. When dynamic security is considered in ad~ition to the steady-state operating cons~aints~ the resu~t~ng ATC may further be the availability of ancillary services such EIS reactive power sources can
flows of the post-continge~cy operating conditions also nee
e aware of the ~im~~at ion§ of the path-based ATC concept [ 1081. The existence of the multiple transactions is a reality in the market environment. When the ATC of a path from X to Y is being evaluated, one needs to consider other t ransac~~ns that have to be ~ccommodated. For the power flow method, other transactio
wer inject^^ into and removed from other areas of the system. These taken into ~ccount s imul~~eously when the ATC for path X to U i
le kansact~on ~ a ~ e ~ s will lead to differen~ values of illustrates the concept of multi-dimension ower transfers over tie lines 1 ,2 and 3 re
projection of the thr~e~~imensional region on the P,,-P, plane resern describe the secure power transfer point inside the ~~ree-dimens~ona~ re
ot violate the security conska~nts. similar manner. Now suppose the power 1 P,, is at the value of P,,,, the maxi
eases to the value of PTIZ,
The projec~ion on other
Waisfer level for P,, increases to Pn2. NQW it is not difEcult to see th p o ~ e r ~ a n s ~ e r level P,, increases fro^ the zero level. To s u ~ a r i s e , the
parameters of the operating con , represented by a tie line in F
ented by other tie lines.
the other ~EIn~~ctions. on the levds of other

Power System R ~ $ ~ c ~ ~ n ~ and
T3
Illustration ofa power system security region

Comp~te~ive Wholesale Electricity Markets
3.5.4 Techveical Issues
~ e g ~ d l e s s of wholesale electricity markets power system p l a ~ i n g and opera~~on has many technical challenges. With the advent of wholesale electricity markets new and d~fferent technical challenges may arise which need to be addressed. The comp~~at iona~ aspects of the electricity markets are one obvious area of interest [l09]. There are also interesting technical challenges related to the management of a large number of transactions [I 101. The OPF algorithm which i s at the heart of the marginal cost pricing paradigm [ZS] and of power system security analysis will have to meet ever-~cr~asing challenges [ 1 1 17.
In the m ~ ~ m a l i s t IS0 model with ~elf~schedu~ing the UC a l g o r i t ~ is being implicitly solved in a d is~buted m a ~ e r by the market particip~ts 11121, which may or may not produce results which are as good as conventional UC algorithms. In the interest of efficiency these decentralised UC approaches need to be analysed. In the r n ~ ~ ~ ~ ~ s t IS0 model a cen~alised U ~ / ~ ~ F - t y p e algorithm is required [ 1 131, Although s e c ~ t y - constrained UC afgori~ms exist [ 16,171 a UC algorithm with a full QPF formulation for a practical-size power system is still a significant computational challenge. The UC algorithm itself is still a very active research area with many issues unresolved [114,14]. In particular, solutions are invariably suboptimal and not robust [92].
In the short-term, regulators, system operators and market ~ a ~ c i p a n t s will have to face the challenges described above. However, any actions need to allow market forces to push the indusfxy towards possible long-term competitive solutions.
.6
The authors would like to thank ESB National Grid, UCD President Res~arch A w ~ d s and Fu~bright for their financial support. This work is partially supported by US ~ a t ~ o n a l Science Foundation through Grant ECS-9612636 with matching funds fiom Alstom ESCA Corp. The authors would also like to thank Prof. Richard Christie, Universi~ of Washington, and Mr John Kennedy, ES National Grid, for their useful c~mments and insights.
.7
[ I ] S. Hunt and 6. Shuttleworth, CompefitioPt and choice in Electricity, John Wiley & Sons, 1996. [2] EU, European Union Council Directive 96/92/EC, 1996. [3] FERC, Regional Transmission Organisations, Docket No. R ~ 9 9 - 2 ~ 0 ~ , ava~~able at
~ . ~ e ~ , f ~ . u s ~ 2000. 141 D.W. Bunn, ‘Forecasting loads and prices in competitive power markets’, IEEE Proceedings,
[ 5 ] T. Gjengedat, J.Q. Gjerde and R. Flolo, ‘Ancillary services in deregulated power systems: What are they: Who need them and who pays’, Proceediags of the Power System Technology Conference, 1 , 1998, pp.704-709.
V01.88, pp. 163-169.

[6] H. Singh and A. Papalexopoulos, ‘Competitive procurement of ancillary services by an ~nd~penaen~ systeni operator’, ZEEE Transactions on Power Systems, Paper No. PE-427-
[7] T.W. Gedra, ‘On tra~mission congestion and pricing’, IEEE ~ransac~ io~ is on Power Systems,
181 L. Hyman, ‘‘Transmission, congestion, pricing, and incentives’, ZEEE Power ~ n g i n e e ~ ~ n g Revinu, August 1999, pp.4-10.
191 R.D. Christie, B.F. Wollenberg and I. Wangensteen, ‘Transmission ma~agemen~ in the deregulated environment’, IEEE Proceedings, Vo1.88,2000, pp.170-195.
I101 R.D. Christie and I. Wangensteen, ‘The energy market in Noway and we den: ~ n ~ o d u c ~ i o n ’ ~ IEEE Power Engineering Review, February 1998, pp.4445.
[ 1 13 G. Strbac, E.D. Farmer and B.J. Cory, ‘Framework for the incorporation of demand-side in a competitive electricity markt’, ZEE Proceedings I Generation, ~ranstn i~~s~on and ~ ~ s ~ r i b ~ ~ i o ~ ~
[12] A.J. Wood and B.F. Wollenberg, Power Generation, Operation and Control, Wiley Interscience, New York, 1996.
[ 131 R. ~ i l ~ ~ ~ o n and R.N. Allen, Reliability Evalua~ion of Power Systems, Lo 1996.
[ 141 K. Baldick, ‘The generalized unit commitment problem’, IEEE Transactions on Power Systems, Vol. 10, 1995, pp.465-475.
[I51 M. Walsh and M.J. Q’Malley, ‘Augmented Hopfield network for constrained generator scheduling’, IEEE Tramactions on Power Systems, Vol.14, 1999, pp.765 - 771.
[I61 J. Batut and A. Renaud, ‘Daily generation scheduling o p t ~ i ~ a t i o n with constraints: a new class of algoriths’, IEEE Tramactions on Power Systems, Vo1.7, 1992,
[I71 JJ, Shaw, ‘A direct method for security constrained unit c o ~ ~ e n t ’ , IEEE Trans~cfion on Power System, Vol.lO, 1995, pp.1329-1340.
[ 181 L.F. Escudero, J. Salmeron, I. Paradinas and M. Sanchez, ‘SEGEM. A simulation approach for electric generation management’, IEEE Transactions on Power Systems, Vol. 13, 1998, pp.738- 747.
[ 191 R.J. Green, ‘Competition in generation: the economic foundation’, IEEE Proceedings, Vo1.88, 2000, pp.128-139.
[20] R.D. Christie and I, ~ a n g ~ n s ~ e e n , ‘The energy market in Norway &nd Sweden: Congestion ~ n a g e m e n t ~ , IEEE Power Engineering Review, May 1998, ~p.61-~3.
[21] R.D. Christie and I, Wangensteen, ‘The energy market in Horny and Sweden: The spot and htures markets’, IEEE Power Engineering Review, March 1998, pp.55-54.
1225 J. ~ c o n a , ‘A bid solicitation and selection method for developing a eompetit~v~ spot priced electric market’, IEEE Transactions on Power Systems, Vol. 12, 1997, pp.743-748.
1231 N.S. Rau, ‘The need for capacity markets in the ~ e r e g u l a ~ ~ ~ electrical industry - a review’, ~ r o c e @ d ~ n ~ s of the IEEE Power Engineering Society, ~ ~ ~ t e r ~ e e ~ ~ n ~ , New York, 1, 199%
1241 J.M. Jacobs, ‘Artificial power markets and unintended consequerices’, IE .E fiansacfions POWW S y s t ~ ~ , V01.12, 1997, pp.968-972.
[25] ET. Singh, S. Nao and A. Pa~alexopoulos~ “Transmiss~o~ congestion managei~ent in competitive electricity markets’, IEEE Transaclions an Power System, Vol. 13, 1998, pp.672- 680,
PWRS-0- 06- 1998,2000.
Vol. 14, 1999, pp.241-248.
VOI.143, 1996, pp.232-237.
pp.982-989.

Competetive Wholesale Electricity Markets 105
[26] C. Taylor, Power System Yoltage Stabifity, McGraw Wil l , 1994. 1271 K. Seeley, J. Lawanee, J, and C.-6. Liu, ‘Analysis of electricity market rules and their effect
on strategic behavior in a non congested grid‘, IEEE Transactions on Power Systems, V01.15,
F.C. Schweppe, M.C. Caraminis, R.D. Tabors and R.E. Bahn, Spot Pricing of Electricity,
Kluwer ~cademic Publishers, 1998. G. Strbac, D. Kirschen and S. Ahmed, ‘Allocating transmission usage on the basis of traceable
contributions of generators and loads to flows’, IEEE Transaclions on Power Systems, Vol. 13,
[30] J.W. Marangon Lima and E.J. de Oliveiw, ‘The long-term impact of transmission pricing’, LEEE Transactions on Power Systems, Vol. 13, 1998, pp. 15 14-1520.
[31] N.S. Rau, ‘Optimal system dispatch o f a system based on offers and bids - a mixed integer LP formulation’, IEEE Transaciions on Power Syslenns, Vol. 14, 1999, pp.274-279.
[32] B.H. BaWtcn, Technical and Economic Aspects of Operation of Thermal and Hydro Power Systems, Phn thesis, Norwegian ~niversity of Science and T e c h n o ~ o ~ , 199’7.
[33] M. Flynn, NI.. Walsh and M.J. O’Malley, ‘Efficient use of generator resources in emerging electricity markets’, IEEE Transactions on Power Systems, Vol. 15, 2000, pp.24 1-249.
E341 J. Kumar and G.B. Shebl6, Tramework for energy brokerage system with reserve margin and transmission losses’, IEEE Transactions on Power Systems, Vol.11, 1996, pp. 1763-1769.
[3S] N.S. Rau, ‘Assignment capability obligation to entities in competitive markets -the concept of reliability equity’, IEEE Transuctions on Power Systems, Vol. 14, 1999, pp.8~4-889.
[36] R. Billinton, L. Salvaderi, J.D. McCallcy, H. Chao, T. Seitz, R.N. J. Qdom and G. Fallon, ‘Reliability issues in today’s power utility environment’, Systems, Vo1.12, 1997, pp.1706-1714.
[37] C Concordia, L.H. Fink and G. Pouiilkas, ‘Load shedding on an isolated System’, IEEE Trans f fc~~on~ Power Systems, Voi.10, 1995, pp.1467-1472.
[38] J.W. O ’ ~ u 1 ~ ~ v a n and .J. alley^ ‘Economic dispatch of a small utility with a ~ ~ q u e n c y based reserve policy’, IEEE Transactions on Power Systems, VoI.11, 1996, pp.1648-1653.
[39] G.B. ShebltS, ‘Priced based operation in an auction market structure’, IEEE ~rans~c~~oy1s oy1
Power Systems, Vol.11, 1996, pp.1770-1777. I401 H.A. Cooi, D.P. Mendes, K.R.W. Bell, and D.S. Kirschen, ‘Optimal scheduling of spinning
reserve’, IEEE Transactions on Power Systems, Vo1.14, 1999, pp. 1485-1492. lynn, P. S h e r ~ ~ n , J. Dillon and M.J. O’Malley, ‘Reliability and reserve in compe
electricity market scheduling’, IEEE Trcansactions on Power Systems, Tdol. 16,2001, pp.78
[42] M.J. Sullivan, B.N. Suddeth, T. Vardeli and A. Vojdani, ‘Intemption costs, us tom er satisfaction and expectations for service reliability’, IEEE ~raf ls~ct ions on Power ~ y s ~ e m s , Vol.1 I, 1996, pp.989-995.
1431 J.W. O*Sullivan and M.J. O ’ ~ d i ~ e y , ‘A new methodolagy for the provision of reserve in an isolated power system’, XEEE Transactions on Power Systems, Vol.14, 1999, p p , ~ 7 4 - ~ ~ 3 .
[44] T.W. Gedra and P. Varaiya, ‘LiWarkets and pricing far interruptible electric power’, XEEE Transacti[)ns on Power Systems, Vo1.8, 1993, pp.122-128.
[45] N. Rudnick, K. Varela and W. Hogan, ‘Evaluation of alternatives for power sys~em coordination and pooling in a competitive environment’, IEEE Transactions on Power
2000, pp.157-$62.
[28]
[29]
1998, pp.527-533.
Sysfems, vO1.12, 1997, pp.605-613.

10 Power System R e s ~ c ~ r i n g and Dere
R.P. McAfee and J, ~ c ~ i l l a n , ‘Auctions and bidding’, Journal of Economic Li~erature, June
R.D. Tabors, ‘Lessons form the UK and Norway’, IEEE Spectrum, August 1996, pp.45-49. G. Gross, D. Finlay 6. and Deltas, ‘Strategic bidding in electricity generation supply markets’, Proceedings ofthe lEEE Power Engineering Society, Winter Meeting, New York, 1, 1999,
W. Vickrey, ‘Counterspeculation, auctions, and competitive sealed ~e~ders’, J o ~ ~ ~ ~ of Finance, March 1961, pp.8-37. H.R. Varian, ~ n t e ~ e d i a t e Microeconornics: A mo~ern approach, 5th Edition, Norton, New York, 1999. OFFER (2000) Office of Electricity Regulation, United Kingdom. www.ofgas.g0V.uk.
electricity market’, IEEE Transactions on Power Systems, Vo1.14, 1999, pp.p.1285-1292.
1987, pp.699-738.
pp.309-3 15.
. Bjorgan, C.-C. Liu and J. Lawarrbe, ‘Financial risk managem~nt in a competitive
.J. Kaye, H.R. Outhred and C.B. Bannister, ‘Forward contracts for the operation of an ectricity industry under spot pricing’, IEEE Transactions Power System, Vo1.5, 1990, pp.46-
52. CalPX, California Power Exchange, www.calpx.com, 2000. CAISO, California Independent System Operator, m.caiso,com, 2000. Power Pool of Alberta, ~ . p o w e ~ o o i . a b . c a , 2000. P.R. Gribik, G.A. Angelidis and R.R. Kovacs, ‘Trmsmission access and pricing with multiple separate energy forward markets’, IEEE Transuc~ions Power systems, Vol.14, 1999, pp. 865- 876. J.J. Gonzalez and P. Basagotti, ‘Spanish power exchange market and information system design concepts, and operating experience’, ProceediBgs of the 21” Power dndustry Computer Applica~ions Conference, 1999, pp.245 -252. X. Ma, D. Sun and K. Cheung, ‘Energy and reserve dispatch in a multi-zone electricity market’, IEEE Transactions on Power Systems, VoLl4, 1999, pp.913-919.
Pennsylvania, New-Jersey and Maryland Interconnection, ~ . p j m . c o m , 2000. hey, D. Goodwin, X. Ma, D. Streiffert, and D. Sun, ‘A security-constrained bid-clearing
system for the New Zealand wholesale electricity market’, IEEE Transaciions 08 Power Systems, Vol.13, 1998, pp.340-346. K.W. Cheung, P. Shamsollahi, D. SUR, J. Milligan and M. Potishnretc, ‘Energy and ancillary service dispatch for the interim IS0 New England electricity market’, Proceedings of the 2Ist Power Industry Computer Applications Conference, 1999, pp.47-53. W.W. Hogan, ‘Contract networks for electric power transmission’, Journal of Regufoto9
mics, Vo1.4, 1992, pp.211-242. Order accepting for filing in part and rejecting in part proposed tariff amendment and
on revaluation o f approach to addressing intrazonal congestion, California ISO, Docket No. ER00-555-00, available at www.ferc.fed.us, 2000. ME. Baran, V. Banunarayanan and K.E.A. Garren, ‘Transaction assessment method for allocation o f transmission services’, [E!?.. Tramactions on Power Systems, Vol. 14, 1999,
C. Li, A.J. Svoboda, X. Guan H. and Singh, ‘Revenue adequate bidding strategies in competitive electricity markets’, IEEE Transactions on Power Systems, Vol. 14, 1999, 497.
pp.920-928.

Competetive Wholesale Electricity Markets 7 -
[67] TEEE Current Operating Problems subcommittee, ‘Operational aspects of generation cycling’, IEEE T r u y ~ a c t j o ~ Power Systems, V01.5, 1990, pp.1194-1203.
E681 I. Q~~ro-Novas, C. Mese~er , C. Batlle and J.J. Alba, ‘A simulation model for a competitive generation market’, IEEE Transactions on Power Systems, Vol.15, 2000, p ~ . 2 ~ 0 - ~ 5 4 ~
Szkuta, L A cial neural ne Fosso, A. Gjelsvik, A. Haugstad, R. MO and I. Wangenstcen, ‘Generation sched~ling in a
d e r e ~ l ~ t e d system: The No~eg ian case’, IEEE Transactions on Power Systems, v01.14,
[71] J.W.M. Cheng, F. , Galiana and D.T. McGillis, ‘Studies of bilateral co~tracts with respect to steady state security in a deregulated env~ro~en t ’ , IEEE Trunsuc~ions Power Systems, Vol. 13,
[72] Z, Yu, ‘Mixed integer sociat welfare maximization (MI-SWM) and i~plications in opt~mal electricity pricing’, IEEE Power Engineering Review, July 1999, pp.53-54.
[73] ET. Singh, IEEE tutorial on game theory upplications in electric power markets, IEEE Catdog
[74] J.W. Lamont and S. Rajan, ‘Strategic bidding in an energy brokerage’, IEEE Truns~~~ ions on Power Systems, Vol.12, 1997, pp.1729-1733.
[75] P. She~idan, M. Flynn and M.J. O’Malley, ‘Generator scheduiin~ with demand bids’, Procee~~ngs of the IEEE Power Engineering Society, Summer ~ e e t i n g , Seattle, Paper No.
A. Lusan, Z.Yu and F.T. Sparrow, ‘Market gaming and market power gatio ion in regulated electricity markets’, Proceedings of the IEEE Power Engineering Society, Winter
ria and T.S. Dillon, ‘Electricity price s h o ~ - g e ~ forecastin , IEEE Trunsuctions on Power Systems, V01.14, 1999, pp.851
1999, pp.75-81.
1998, pp.1020-1025.
NO. ~ 9 ~ F l 3 4 - 0 , 1999.
2~OSM-012~ 2000.
Meeting, New York, 2, 1999, pp.839-843. [77] Z. Younnes and M. Ilic, ‘Generation strategies for gaming transmission constraints:
d e r e ~ ~ a t e d electric power market be an oligopoly’, Proceedings of the 31’‘ ~ n n ~ ~ tional Conference on System Sciences, 3, 1998, pp.112-121. and A. Papalexopoi~los, ‘Reactive power pricing and management’, IEEE Tr~nsac~ions Systems, V01.12, 1997, pp.95-104.
Nordhaus and C. Shapiro, Preliminary report on the operation of ancillary eh of the California Independent System Operator, ~ a l i f o ~ i a ~ndependen~
t paths, phase shifters, and efficient electricity trade’, IEEE
. Pang, ‘Strategic gaming analysis for electric power Transactions on Power Systems, Vo1.15, 2000, pp.638-
I821 C.W. Richter and G.B. Sheblb, ‘Genetic algorithm cvolution of utility bidding s~ategies for the competitive marketplace’, IEEK Transactions on Power Systems, Vol. 13, 1998, pp.256-261.
E831 M. Song, C.-6. Liu, I. Lawarrbe and R. Dahlgren, ’Optimal electricity supply b ~ ~ d i i i ~ by M~rko* decision process’, IEEE Transactions on Power Systems, Vol. IS, 2000, pp.618-624.
~ Gibescu and C.-C. Liu, ‘Optimization o f ancillary services for system security’, roceeditzgs Bulk Power System Dynamics and Control W - Res~~~ctur ing, ~ y m p o s ~ ~ ~ s , 1998,
N. Allen and D. Ilk, ‘Reserve markets for power systems reliability’, IEEE ~ ~ u n s a c ~ ~ o ~ s on ower Systems, Vo1.15,2000, pp.228-233.
System Qpe~ator. ~ . e a i s o . c o m ) 1998.
01.12, 1997, pp.749-755.
pp.35 1-358.

x Power System R e s t ~ c ~ ~ and Dere
.R. Bobo, D.M. Mauzy and P.J. Trefny, ‘Economic generation dispatch with responsive reserve constraints’, IEEE Transactions on Power Systems, Vo1.9, 1994, pp.555-559. agic, K.H. Abdul-Rahman and J.G. Waight, ‘Spot pricing of capacities for
and transmission of reserve in an extended poolco model’, IEEE Transactions Systems, Vo1.13, 1998, pp.1128-1135.
[88] J.B. Cardell, C.C. Hilt and W.W. Hogan, ‘Market power and strategic intcraction in electricity networks’, Resource and Energy Economics, Vol.19, 1997, ppiO9-134.
[89] T.W. Gedra, ‘Optional forward contracts for electric power niafkets’, IfiEE Transactions on Power Systems, Vo1.9, 1994, pp.1766-1773.
1901 organ, R., H. Song, (2.4. Liu and R. Dah flexible electricity con~acts’, IEEE %amactiom on Power Systems, Vol. 15,20
f9 I] R.J. Thornas and T.R. Schneider, ‘Underlying technical issues in electricity ~ e r e ~ ~ a ~ ~ o n ’ , Proceedings of the 30th annual Hawaii ~nternat i~na~ Conference on System Sciences, 5, 1997,
1921 $3. Oren, A.J. Svoboda and R.B. Johnson, ‘Volatility of unit commitment in competitive electricity markets’, Proceedings of the 30th Annual Hawaii I n t ~ r n a ~ ~ o ~ a ~ Conference on
~ ~ s ~ e ~ Sciences, 5, 1997, pp.594~60~. (931 J. Kmar and G.B. Shebli-5, ‘Auction market simulator for priced based operation’. 6EEE
Transactions on Rower Systems, Vol. 13, 1998, pp.250-255. [94] K.J. Green and D.M. Newbery, ‘Competition in the British electricity spot market’, Journal of
Political Economy, 100, 1992, pp.929-953. [SS] S. Borenstein, J. Bushnell and F. Wolak, Diagnosing market power in California’s
wholesale electricity ~ ~ k ~ ~ , University of California Energy Ins t~~ tc , 1999, I Wolfim, ‘Strategic bidding in a multiunit auction: AD empirical analysis o f bids to
supply electricity in England and Wales’, RandJournaE of Ec’conollzics, 29, 1998, pp.903-725. [97] K. Miyaknwa, Analysis of strategic behaviors in an open access transrrrission grid. MSc
Thesis, University of Washington, 2000. ration’, ~ ~ ~ c e e $ i ~ g s of the IEEE ~ ~ w e r
‘Advanced pricing in electrical systems. 1.
.N. Siddiqi and J.W. Zarnikau, ‘Advanced pricing in e k t r i c d systems. 11.
ughman, ‘The economic efficiency impacts of alternatives for revenue
pp.561-570.
1, 1999, pp.568-572.
1.12, 1997, pp.48~-49~.
nscactions on Power Systems, Vol. 12, 199’7, pp.496-502.
nsactions on Power Systems, Vol.l2,1997, pp.1129-1135. [kola B.H. W m and
[1025 1.1. Perez-Arriaga, F.J. Rubio, J.F. Yuerta, J. Arceluz, and J. Marin, ‘Marpi ~raiis~ission services: An analysis of cost recovery’, IEEE Tramactions on RQWeV Syslems,
[ I031 DOE, Maintaining reliability in a competitive U.S. eiectriciQ industry, Final report of the task
[I041 C.-C. Liu and R. C istie, Energy Management Systsni, in Encyclopaedia of Computer Science A. Kent, J.G. WiBiams, C.M. Hall and R. ~e~~~~ 26, ~ ~ ~ p l e ~ ~ ~ ~ 11,
report for the power system outage that occurred on the Mrestcm Interconnection on August loth, 1996 at 1548 PAST, Western Systm Coordinating Council, ~ ~ w s ~ c . c o ~ ~ 1996.
V01.10, 1995, pp.546-553.
force an clectric system reliability, United States Department of Energy, 1998.

Competetive Wholesale Electricity Markets
[ 1061 ~ ~ ~ C , Available Transfer Capability Definitions and Determination, North American Ekctsk ~ e l ~ a b i l ~ t y Council, 1996.
[ 1071 A.R. ~ ~ r g e n and V. Vittai, Power System Analysis, 2nd Edition, senti ice Hall, 2 0 ~ 0 ~ pp.436- 440.
. Ilic, T.Y. Yong and A. Zobian, ‘Available transfer capacity (ATC) and its value under open access’, IEEE Transactions on Power Systems, Vol. 12, 1997, pp.636-645.
[ 1091 C.B. SheblC, Computational Auction Mechanisms for Restructured Power Indusrry Operation, ~ l u w e s Academic ~ b l ~ s h e ~ ~ , 1999.
[ 1101 G.W. ~ o s ~ n w a l ~ and C.-C. Liu, ‘Consistency evaluation in an o p ~ r a ~ ~ o n a ~ ~ n v ~ r o ~ $ n t involving many transactions’, IEEE Transactions on Power Systems, v01.11, 1996, pp.1757- 1762.
‘Challenges to optimal power flow’, IEEE Transactions on Power S’lstems, V01.12, 1997,
. Angelidis, H. Singh, and A. Papalexopoulos, ‘Consu~$r p a y ~ e n ~ m i ~ m ~ ~ t i o n in power pool auctions’, IEEE Transactions on Power Systems, Vo1.13, 1998, pp.886-991.
[ 1131 D. C~a~opadhyay, ‘Daily generation scheduling: Quest for new models’, JEEE T r u ~ s a c t i o ~ on Power Systems, Vol. 13, 1998, pp.624-629.
Walsh aind M,J. O’Malley, ‘Augmented Hopfield network for unit commitment and economic ~ i s p a ~ ~ , IEEE Transucfi~ns on Power Systems, V01.12,~ 1997, pp. 1 7 6 5 - ~ 7 7 ~ .
[111] J.A. Momoh, R.Y. Kosselar, N.S. Bond, B. Stott, D. Sun, Papalexpoulos and P.

Cliff Walton Robert Frief Dr Loi Lei Lai London Electricity Group London Electricity Group City University, London UK UK UK
Transmission and d i s ~ i b ~ ~ ~ i o n are still regarded as the natural monopoly elements in the r e s t ~ c ~ r e d UK energy market. Since privatisation in 1990 there have been a number of changes in the structure of the industry which have impacted on the dis~ibution businesses and the i~~ t roduc t~o~ of the Utilities Bill heralds a further change in the relationship with g o v ~ ~ ~ e n t , the regulatory body and consumers.
One of the main objectives of privatisatio~ was to promote compe~ition. This has focused on the supply (Le. the retailing) of electricity and gas and has encompassed the associated aspects of metering.
A c o ~ p e ~ t i v e framework was developed for new connections to distri~ution networks defining certain elements as contestable work, but to date this area has not seen the wide- scale competitive activity expected and the regulator has indicated his in~~nt ion to review competition in the gas and electricity connection markets by March 2001.
The biggest effects on the distribution businesses have resulted from the price control mechanism. Distribution businesses in the UK are price regulated, a part of which is to allow a return on the assets purchased at vesting and the i~vestmen~s made in the subsequent years. The latest price review, which came into effect in April 2000, saw the regulator propose reductions in distribution business income similar to those following the last review, None of the UK ~ i s ~ ~ b u t i o n com~anies have c ~ d i ~ e ~ ~ ~ e d the o u ~ c ~ r n ~ of the latest review, which implies that the companies believe that they can achieve these savings. The only st~ctural change at the time of writing has been the announce~ent by London
Distribution in a Deregulated Market
Electricity and Eastern Electricity of a joint venture to operate their n e ~ o r k s , with the asset ownership remaining with the parent companies,
the ~ ~ f o ~ a t i a ~ prav~ded by the regulated di§~ibution companies and incentives to introduce an element of competition. The details of any such scheme are still to be decided, but it sends a clear signal that after 10 years there remains much scope for
Since the latest price control the UK r e ~ ~ a t o r has i ~ ~ l e m e n t e d a pr
menls in ~ e ~ l a ~ o ~ practice and the electricity distribution industry.
4.2. I ~ o ~ ~ e t i ~ i o n in Supply
The development of competition in the energy supply market in the develop~nent of two distinct activities in the UK public electricity suppl and distribut~on. The supply businesses are responsible for the sale of e ~ e c ~ c i t y and gas whilst the d~stribMtion businesses manage the cables, lines, ~ a n s f o ~ e r s and switchgear which form the power supply networks between the EHV grid system and the end users.
subject in its own right. Certain aspects of the process to deliver a CO
market have had a significant impact on the PESs’ distribution businesses. The most visible aspect of this has been the moves both physically and ~ ~ ~ c i a l ~ y to
separate the retail and ~is~ ibu t ion business, and in some cases the sale of retail businesses to third parties. This process has involved the rebranding of the separate bus~esses. It was intended that the PES distribution businesses be rebranded and this will case, although those generators who have acquired retail interests (National and PowerGen) have essentially rebranded their retail arms (Mid~ands and respectively).
The development of competition in supply as part of the process of d
4.2.2 The ~ ~ s p 5 n s i b i l i t ~ ~ s of ~ e ~ a i l and ~ is t~ ibu t ion
retail business bulk hases both electricity and gas and supplies them to their custo~ers over the electricity and gas networks. A great deal of work has been required to
the necessary systems to effect a competitive market. of this ~ a r k e ~ l a c e the retail businesses have taken responsib~li~ for meter
read~g , with the intent that this service be procured from ~~ter- reading service providers on a compe~itive basis. The development of competition in the mete~ng sector will even~al ly see the pr~vision of meters to suppliers by meter asset ana age^ and opera to^.
The distrib~tion companies manage and maintain the electricity d~stributio~ network. This involves both the technical asset manage~ent and planning services and the b ~ ~ l ~ g of use of system charges from suppliers and the management and maintenance of the existing meter assets.

12 Power System Restructuring and
eration services organ~sation in London has been estabiishe from the n ~ ~ o r k asset manager, with an a ed scope and level o f s ~ ~ ~ c e b e ~ e e n
ive for separation o f businesses is a re¶ui~ement o f establishing a ~ o r n p ~ ~ i ~ ~ v e in the supply of energy [I]. In essence the incumben~ d is~ ibu~or may
the position of the domina~t host supplier to the d e ~ r n e ~ t of custom~r§ comp~~itors. Five potential means of achieving this have been i d e n t i ~ ~ ~ :
a combined dis~bution could disadvantage comp charges to support the suppliers’ retail tariffs.
s pote~tially has access to i n fo~at ion that other ~upp~iers will not le, the names o f customers supp~~ed by a second-tier supplier. intentions of a dis~ibution business. For e x ~ p l e , ad
ze and nature of changes to use of system 4. Cross-subsidisa~ion by a d is~ropo~onate allocation of costs
overheads to the d i ~ ~ i b u ~ i o n business. A small reallocat~on will have i ~ p a c ~ in a retail i n d u s ~ that has very small ~arg ins . The regul
this issue in the 1999 price control review by realloc tion to supply before assessing the relative ef~ciencies
businesses. ution business will in some way ~ o ~ g r ~ d e the service to a custo
s ~ ~ p ~ ~ e r . For example, the response to power o u ~ ~ ~ ~ .
ion businesses ~esu l t i n~ from c ~ m ~ e ~ i t i o n in s s e p ~ a t i ~ n of the two business areas are:
on businesses of the i ~ ~ l e m e n ~ t i o ~ of the e§tablished at the time e in resolving system-b
constraining s u p ~ ~ ~ e r s ’ sales for e ~ b e d d e ~ e n e r a t ~ ~ ~ energy sales.

istribution in a Deregulated Market
. It was decided that t ~ e r ~ was
required s e ~ ~ e ~ a t i o n
e a p e r ~ Q ~ a ~ s ~ ~ v i c e to i ~ ~ i ~ i d u a ~ c ~ s t o ~ e ~ s . torner^ er^ still receive the level of service the
i s conkoiled via
on ~alf-hou~ly c Q ~ s u ~ ~ t i o n data) for 1
e s t i ~ a t ~ s ) for smaller (mainly quarterly
st o f a fixed portion or stan

11 Power System ~ e s ~ c ~ ~ n ~ and Der~gu~atiQn
4.2.7 C ~ t o ~ e ~ Service
The ma~iagement of customer relations is another area where competition in supply cre~tes a number o f options.
In New Zealand, the initial approach routed a11 customer contact throu businesses. This simplifies the contact issues for the customer, manage~ent of the interface between suppliers and dis~but ion b the correct in fo~at ion is available to inform the customer.
the UK, the distribution businesses have kept an interface with c u s t o ~ e ~ in relation ly outages. Hence customers have two points of contact. ~ l t ~ o u g ~ this s i m ~ ~ i ~ e s
the m ~ a g e m e n ~ of information flows on outages between istribution businesses and suppliers (there is none) the management of the routing of calls to the wro care. The future solution to some of these issues i s already apparent in call systems. These are already being installed to provide i n f o ~ a ~ i o n on outages and are of particular use in the extreme circumstances of wide-scale power outages when call centres become overwhelnied.
Internet technology will soon provide accurate supply of in fo~at ion on outages and torat~on times to both customers and suppliers - the inte~at ion of fault reporting lephone network. It is possibie to generate specific y~ice-ac~~vated messages
g to postcodes or dialling code i n f ~ ~ a t i o n . It may even go as f8r as pro ~ f o ~ i a t i o n (i.e. ring the customer).
d e ~ i ~ ~ g c ~ e n t power outages on its internal web site for so make this facility available via the Internet once suitable security safeguards h proven.
London ~ l e c ~ c i ~ h
4.2.8 ~ a ~ ~ ~ t i t i o ~ in Metering
Competit~on has existed in the 1 respectively. Third parties have bee areas since 1995. In conjunction with the hi1 co~~e t i t i on in energy physi~al and financial separation of the dis~ibution and supply b~sinesses~ competitive metering are being extended to the remainin market sectors. This has created two distinct business streams, meter rea asset m~agement (otherwise known as meter o provide data retrieval and data processing @R
and 100 kW markets since I991 and 1994 to own and operate meter assets in both these
s will provide meter asset provision and m~agement ( k n o ~ as dis~ibution businesses no longer have any part in the reading of meters, which is by the energy retail business via a contractual ~ a n g e m e n t with a meter reader.
ssion in that meter readers could provide services for r e a ~ ~ n g any o n g - t e ~ developments are likely to result in meters that are read
This is a n a ~ a l pro utility service meter. remotely.
The existing meter assets are presently owned by the distribut energy supplier, via a meter asset man~gement ~ompany, can provide new cu$tomers DT as r lacements for existing meters. In the me will develop in the p~ov~sion of meters and the ~anagement o f these assets,
Distribution in a ~ ~ r ~ ~ u l a t ~ d Market 1
To ensure the availability of these services, the PES energy retail businesses will ovide a meter-~eading service of last resort and the
erat~ons service of last resort.
d-side ~ ~ n a g e m e n ~
s to reduce the peak demand either of more efficient usage or by mov
the system load factor. real alternatives to
the ~ansmission and generation level where the cumulative effec
peak tariffs for storage heating. In this i n s ~ c e the move away
elements of the 10
rcernent. In general terms these
ema and-side ma~agement has been encouraged by the use of tariffs, e.
. heat~ng to off-peak storage w e installed c a p a c i ~ require^.
ating has resulted in pe
ated ~ a r ~ e t the promot~on of energy effi ess clear.
cts exist between energy §uppliers or retailers or respons~ble for bala~cing the system’s
m a ~ ~ ~ ~ n i ~ ~ system voltage, ~ e q u e n c ~ and security. Large c
impact on both generation and &arm wever, at a distribution ievel the wi mand occurring at nig
The generation capacity availabl~ b
ing themselves available for disconnection as istrative complexities of participating in such
this to a few very large bu§ine$ses. recourse to modifying use of system tariffs to promote alternati , the energy § u ~ ~ l i e r may not be obliged to
any re§ulting ~ n c e n t i ~ e ~ . Addit~onall~ in the stomer contact and knowledge of their partic
erator to m ~ a g e the syste
bedded generation to offset the need for re in~orceme~~ has become a major subject of debate. The principal difficulty is that p~omo~ing and ennsurhg the ~n§ta~lation of suitable generation in advance of the reinforcement ~e~uirement is far from a simple task. Not only this but the ~ p p r o p r i a ~ commercial a ~ a n g e ~ ~ ~ ~ s must be in place for the risk to be m i n i ~ ~ ~ s e d s ~ f ~ c i e n ~ l y for the generation to repre§~n~ an ~ q u ~ ~ a b l e ~ ~ ~ e ~ a t i v e to t~aditiona~ ~ ~ ~ n f o r c e m e ~ t .
re~uire a time of ~enerat~on, ~an§mi
Therefore it can be seen that in the marketplace active d e ~ ~ a n d - s ~ ~ e to be sent to custome~ via tariff a
lion levels designed to reflect the local cmt this would be in reducing the need ive if system security is
allow for the effects of would require careful risk assessment. Variances between actual would need to be reflected in va r~a~ le use of system charges in

1
d. It is not the intent to discuss here whether variable use of system a: ticable as these woul on to ~ u s t o ~ ~ r ~ thro
t in asset replace~enr, s ~ § ~ ~ ~ rein for^

~ i ~ ~ b u t i o n in a ~ ~ r ~ g u l a t e d Market 117 -
Voltage tolerances, faul r e ~ a i n as they were before the priv~tisation of th r changes to h a ~ o n i s e within the E ~ o p e a n Union).
reflect EM1 standards and
This has not been due to the ~ e s ~ c ~ ~ n g of the indu e unwiIlingness of
What has chang~d th~ough r~gulat~on i s quality of supply a number and d ~ r a t i o ~ of i n ~ e ~ ~ t i o n s and customer service. s u ~ ~ l y drivers is discus in the f o ~ l o w ~ ~ section.
on covers the drivers affecting planning ncepts of p l a ~ i n g asset rep la~e~en t
4.3.3 ~~~~~~~~
y ~ i s ~ i b u t i o ~ system design muse meet the following r e ~ ~ ~ r e m e n ~ ~ :
e able to supply the system demand whilst meeting the
s~stems the n e ~ o r ~ s must also:
ng costs of the network.
mic and risk assessment. Whilst much h ndard was written in the 1970s, the st
ai~hough it only addresses the scaIe and duration of a loss of supply and not the ncy of which such incidents can be e~pected to occur.
rmance, which are beginning to drive network the s ~ a n d ~ ~ , pa~icu~arly in ~espect of the fre
e d i f ~ c u l ~ here has been to find a common ance levels that from the different e n. The most recen er for change has come from
to make the best use of embedded generation connected to the d is~ ibu t io~ networ~s at 132 elow. This generation has not been considered in system security to date. This is
due to:

1
s O f tion of most gener~tion. 1 PPr commercial framework. The ~ i ~ ~ c u I t ~ e s of ~ s u ~ n g the presence of the necessary generation before systems need ~e i~o rc ing .
be solved at the time of w~t ing 1 be a~~ended with a means of asse
has been measure
A~ai lab i l i~ : S y s t e ~ average i n ~ e ~ p t i o n duration
r some time by the f o l l ~ w i ~
) or customer minu~es
stem average i n t ~ ~ p t ~ o n ~ e q u e ~ c y index ~S~~~~ or its e ~ u ~ v a l e ~ ~ in r 100 connected custo~ers.
These measures represent the average performance of the system and so do not a ~ c u r ~ ~ ~ l y ind~~idual custo~er may e x ~ e ~ e n c e [2,3]. In the Of than I minu~e is cou~ted towards these statistic 3 rm to allow for the benefits of system automation. dica~es that customers prefer not to be ~ n t e ~ p t ~ d , but in the event of an d of restorat~on and accurate in fo~at ion kely outage times ~ecome The provision of such i ~ ~ o ~ a ~ ~ ~ n is po both through call centre

Ristribution in a Deregulated Market 11
re 4.1 demonstrates the relationship between incidents, ~ t e ~ p t i o n s and customer minutes lost. This cl shows that whilst by far the most inciden~s occw at low vol~age, the medium-vol~ge ) 11 kV and 6.6 kV systems cause by far the most custo~er dis~ption. It is also siest area in which to improve network e r f o ~ a ~ c e as ere are cos~~effec~ive solutio~s available. It comes as no surprise eref fore that i nves~en t has centred on reducing the impact of MV system incidents and disruption.
The most ~ o u b ~ e s o ~ e impact on customers is that r~sulting from ~ e ~ u e n t or ~ u ~ t i p l e The p ~ m a ~ measures discussed above have there for^ recently been
tl measure of multiple interruptions, which will determine the ~ e r c c ~ ~ a ~ e rs who experience more than a given number of i n t e ~ p t ~ o n s per amum, the second post-pr~vatisation price control the d i s ~ b u ~ ~ o n companies s
eved by the end of the second review period. During the third review place in 199842, the e l e c ~ c i ~ industry regulator decided to set targets for the e l~c t~c i t y c o m p ~ i e s rather than to allow the co~panies to set their own. In addition to this a syst of incentives based around per fo~ance against some of these measures is to i ~ p ~ e ~ e n ~ e d in e ~ ~ h a s i s to be measures will further aEect the development o f distribution p lann~g. The de networks to meet quality of supply requirements targets the reduction of the i network failures at two main areas:
[4]. Much discussion remained at the time of writing as to the to which measures and therefore it is dif~cult to resolve haw these
The p r e v ~ t ~ o ~ of ~ n t e ~ ~ t ~ o n ~ The restoration of supplies
Since deregulation, the U has increased the focus an imp aspect of c~stomer servi rent approaches have bee different companies driven by their particular regional and network pro s i ~ i ~ c a n t areas of ~ v e s ~ e n t have been in insulated or semi4 auto reclosers on overhead lines and network remote control and §
Insulated overhead conductors have been used to reduc ~ n t ~ ~ p t i o n s due to trees tou~hing lines, which can lead to mor ~o~e-mounted auto reclosers have been in~oduced in conj intemptions a u ~ a ~ a t i c a ~ ~ y and are therefore sometimes considered as a form of n e ~ o r k au~omation.
V systems~ remote c o n ~ o ~ sys~ems have been ~ e ~ o r k secondary system (i.e. varying degrees by distributors in the UK. The most s ~ ~ n i ~ c a n t inves
~ o n ~ o n Elec~ic~ty, E a s t e ~ Elec~icity and S o ~ ~ e ~ ~ ~ e c ~ c i ~ . much faster res~ora~ion of supplies following faults on cable network^ or on ely distant fiom o ~ ~ r a t i o n a ~ centres. They also reduce the n cing the amount of time an engineer needs to spend swi
reducin~ the risks associated with this activity. The case study at the end of this section considers the scheme impIemented by London Electricity, the b e ~ i e ~ t s realised and the long-term potent~ai foreseen for the system.
These projects have as part of their implementation s ign i~ca~t ly c o n ~ b u ~ e d to the ~ e p l a c e ~ ~ n t or u p ~ a d i ~ g of pro~~emat~c network apparatus, be it overhead line or swi~hgear.


re, they can o p t i ~ i ~ e their e l e c ~ c i ~ a~~l icat iQn sched~ling to
ve power m ~ k e t , utilities tend to maintai cost savin~s ~n~~~ the
In a d ~ r e ~ ~ a t ~ d ~ c

12 Power System ~ e s ~ c ~ n ~ and ~ ~ ~ ~ l a t i o n
roposed method for a VSTLF has been success~ l~y ~mp~emented in a ~ o w e r utility in the USA, and is used by dispatchers for on-line load forecasting. The developed f o r e c ~ t i ~ g system predicts eight values of load for the time leads from 20 to 90 minutes in 10 ~~u~ increments. To provide dispatchers with the information about e~pected forecast e ~ o r s , mean absolute percentage errors ( ~ ~ E s ) are calculated base forecasts for which load ~ n f o ~ a ~ i o n has become available. For the 20, 30, .,, 40 minute fore~asts, the mean absolute percentage error lies in a range o f 0.4~~.~% [9]. Load data is
from the automati~ generation control ( A ~ C ) system every g data is converted into lminute integrated loads which are consider~d as
COUS) loads. These loads are used as input i n f o ~ a ~ ~ o n for c o m ~ u ~ ~ g load pre~ictions and they are also stored for training. automatically retrained once a day.
where the installed capacity in the distribution n e ~ o r k s can be es~ab~ished.
e forecaster~s neural nehvo
It is not the intent to discuss in detail load forecast~ng and its d i s a g ~ ~ ~ a t i o n to a level
The advent of the increased demand for telecoms data and Internet services has also to add s i ~ i ~ c a n t loads to the d i s ~ ~ b u t ~ o n systems pa~~cular ly f x the associated ing centres. The magni~de of such loads (10-4.0 ~ W ) and time scales (12-18
months) for such developments are such that the d~stribut~on com~any has to be in a position to ~espond creatively and ~exibly if it is to avoid l o s ~ n ~ the either to another company in a di~erent location where supply can be a
r to a competitor who is prepared to establish a separate dis The large urban centres such as London are not see in^ the
m a ~ i ~ u ~ demand due to more efficient loads as these are being offset by these ~T-related increases.
sed d~s~ibut io1~ businesses have adop a five-year p ~ a n ~ ~ n g horizon, culties of predic~ing ~ e m ~ d
shuction times related to major s y s t e ~ changes, changes in bstation projects make the ~ ~ e - y e a r ~ e ~ o d ~ ~ ~ a ~ v e l y short
networks must be tail in the ~o~lowing
l a r ~ ~ l y due to the ~ve-yearly review period and the
e tec~ologies and s ~ c ~ r e o ieve this end are discussed in In
asset management and planning is to integra~e as replace men^ of poorly performi a ~ ~ ~ g d e ~ a r ~ e ~ t s will need
or high~risk asset ay an i n ~ ~ ~ a s i n g ~ ~
asset r ~ ~ l a c e ~ ~ n t p r o ~ r a m ~ e s with n e ~ o r k reinforcement and major new c o ~ e c t ~ o n s works. The p l a ~ i n g of asset rep~acement i s discussed later.
4.3.4 Long-tt?m
int of l o n ~ - t e ~ p~anning is to d e t e r ~ ~ n e how extema~ ~n~uences, of new business and changes in the regulatory env f the network and the levels of i nves~en t that will


24 Power § y s t e ~ R e s ~ ~ ~ n g and ~ ~ r e g ~ l a ~ i o ~ -
In time adopting such a me~hodology should Lead to an ~mproved m a t c ~ be ents and the d e ~ a n ~ s they must d in a number of projects worldw ians for ~ n t e ~ a t i o n a ~ financing agencies.
on ~~scussed the use of a set of 10 A similar ~ e c ~ i q ~ ~ using three altem ness ~ l a ~ n i n g . Three views of all ent and investment drivers are normally eve loped being:
uch t e c ~ ~ q u e s hav d are ~ i c a l l y standard ~ r ~ c t ~ c e
she goes’ view: a sable environme~t based on exi mic and
s p e ~ ~ c l e s ~ view: a positive view of the dev~lopmen~ of the economy
oomy’ view: a more n e ~ a ~ v e view conside~n the impact of a
ions encompassing a reasonable view of the effects of known de
how this will impact on the demands on the business.
~ o n t r a c ~ ~ g economic env~ronm~n~ and how is wo~ ld impact on the business.
e would look at a range of business factors, d priate s ~ a t c ~ or strategies. A ~ ~ ~ l a t i o n of the s ss fxtors allows the p l a ~ e r to i d e n ~ i ~ key s ~ ~ t e g i e
an one scenario, as i ~ ~ u § ~ a t e d in Tab1
winess Factor 1 Business Factor 2 Business Factor 3 Business Factor 4
S c ~ n a ~ o 1 §~ra~egy 1A S ~ a ~ e ~ 2A Strategy 3.4 S~ra te~y 4A
~ c e n ~ i o 2 Strategy I Strategy 2A Strategy 3 § ~ r a ~ e ~ 4B
Scenario 3 Strategy 16 Strategy 2 6 §trategy 3 Strategy 4C
are robust to more than one scena~o,
h t e ~ ~ i q u e s are widely used n i d e n t i ~ ~ ~ key long-term le
di f f~~cnt software tools exist to aid the esign of power s y s t e ~ ~ . a ~ a ~ ~ i c ~ ~ load Row and fault level s studies and a few
use a fa^^^ rate c a ~ ~ ~ a t i o n hols. which does not, in
a fault rate a ~ p r o a c ~ is that it on ofthe under~ying causatioii

The asset ~ ~ a g e m e n t d~scip~ine and network p l ~ n i n g ~ s most s i ~ i ~ c a ~ t i~iter~ace i s in the planning of asset rep lace~~nt . The developrnent of asset ~ ~ n a g e m e n ~ covered in detail eIsewhere, The p l ~ e r ’ s role is to convert these policies &to programmes. In doing this the objectives and the condition and carried out.
lamer must consider the asset mana
4.3.7 Risk Assessment
Risk assessment methodolo es are useful in any business and distribution b u s ~ e s ~ e s are sk assessment is applied at two levels, the business level and for
~ n d i ~ i d u a ~ asset asse~sments as part of the asset replacement p l ~ i n g process. ~usiness risk analysis considers all areas, including network perfo~ance, finance,
commercial (e.g. use of system income), contractual and regulation. Potential risks in each area are identified and probabilities and consequences determined. Fin measures and appropriate actions to control the risks identified are establish
d distribution businesses, particularly where there is n supply, the largest risks are often associated with the
income streams owing to the complexities of the data acquisition and ag and the number of different parties involved.
However, network risks must not be ignored. Historic control measures exist through planning and construction standards such as the UK’s Engineering Recom~~ndation PU5. In planning individual i n ~ e s ~ e n t s , risk assessments are normally con likely ~a~~~~~ mode f ~ i ~ ~ ~ e ~ etc. Major n e ~ ~ r k failures such as that Auckland, New Zealand, and the recent weather-related i n c ~ d ~ n ~ in Canada and France have prompted further debate on the appropriateness of existing design standards and the cost and be~efit of c ~ ~ ~ n g these,
4 . ~ . 8 ills and
ince the privatisation 0%: the d ~ ~ ~ b u t o ~ ~ in the there has been angain ~educe costs. This has ~ e v i t a b ~ y resulte in a very signi~cant red~ct~on in
up asset m a n a g e ~ ~ n t o r ~ ~ n ~ s a t i o r i ~ these have a
incipal activiti~s, new c o n n e c ~ ~ ~ ~ s and en separated, the practical i m ~ ~ ~ ~ of
ng of the n ~ t w o r ~ s . It is e ~ i ~ e n t
E the staf~ng of these org es a di f fer~n~ set of coi~petencies than
it levels of various c ~ m ~ a n i ~ s ’ pl orn the d o ~ s i z i n g under~ken
ibt one can no Ion

12 Power System K ~ s ~ ~ c ~ ~ ~ and Deregulation
h i g ~ y quali~ed but able technicians has been es~ablished. The p~anning skills of the more expe~enced staff are gradually being transferred to the less experienced team members and the lost competencies being replaced.
Whilst it can be argued that these skills have been re~ined by some of those utiiities rt to best practice, the skills gap is being gradual~y redressed. With ing of competition in connections design and provision, the area of
will be to ~ ~ ~ ~ n t a i n and develop the i n f r a s ~ c ~ r e planning skills necessary to review the overall network successfully and d e t e ~ i n e where action will be required to ma in~ jn and ~ ~ p r o v ~ existing levels of service. This is probably one of the areas most under pressure at the present time, especialiy with the increasing c o m p ~ e x i ~ of systems such as remote control and automat~o~ being introduced and the increasing asset-manag~nient-derived workload. The use of expert systems to capture experience and make it widely available has not yet been widely adopted but is an obvious opportunity to suppleme~t process charts in more complex and/or less routine operations.
4.3.9 ~ e ~ ~ r k Design
There are three elements to network planning that need to be conside~ed~ these being the connection of new load, the reinforcement of the system and improvements to meet quality of supply targets,
f new connections is driven by the regulato~ requirement to offer the lowest cost connection and the need to meet larger customer’s needs. The former of these has given rise to a conflict with some aspects of network desi to meet ~ u a l i ~ of supply targets.
For example, the simplest design to connect a voltage load of less than 1 NW to the system is to create a new substation and connect it to the existing network via a tee off xisting circuit. If a large number of customers are supplied from this single source,
such as a large housing development, then ideally the substation should be connected so as to be ~ o o ~ e ~ into the existing circuit, as shown in Figure 4.3, in order to lessen the ri repair time outage.
.3 Tee vs. loop connections
D ~ s ~ b u t ~ o n in a Deregulated Market 127
ecision as to whether to fund this out of quality of supply monies will depend on the number of customers, the distance from the main circuit and the additiona~ e n e r ~ losses incurred. The advent of competition in connection services would further compl~cate this issue. The network manager will have either to pay the contractor to hstall the additiona~ cable at the same time or retrofit the additional cable at a later date. The customer will not be expected to pay for the additional costs related to the quality of s~pply as part of his connec~on charge.
This c o n ~ ~ ~ m will also apply to the installation of spurs to feed a number of customers at low voltage (LV) where no alternative back-feed arrangements from o&er n ~ ~ o r ~ s are available or where the installation of remote terminal units for SCA remote control may be desirab~e. Evid~ntly this becomes easier to manage as the size of the load increases and the number of connection requests decreases.
Genernl load growth and the connection of new load drive the need for n e ~ ~ ~ ~ reinforcement. Typically the impact affects the thermal ratings of the network appara~s, security of supply or the voltage per fo~ance of the networks, but recently greater is having to be given to managing power quality issues, particularly harmonics.
In most estab~ished networks the general growth of load is relatively low. In ce~a in areas, p a ~ i c u l ~ l y highly urbanised areas, redevelopment has seen prospective loads increase owing to new office developments and the associated IT-related loads. At the time of writing this would seem to be a developing trend, the forecasting of which represents a significan~ challenge.
The management of reinforcement with the connection of new load has become the most s i ~ i f i ~ a n t challenge. The management of the new connections process is b~coming progressively more detached and this is likely to lead to an increased need for manager to monitor connections activity and identify reinforcement requirements and implement them in an appropriate time scale. The failure of this process will ultimately impact upon a distributor’s ability to meet a customer’s connection requir$ments within its schedule. In large urban areas this may have not simply a financial impact on the distributor but also an economic one,
The present regulatory process in the UK which involves five-yearly reviews to fix income for the following five-year period increases the risk of increased re in forc~~ent exp$ndi~re affecting other capital programmes,
As discussed in the previous section distribution automation in its simplest form has begun to be used to ~ m ~ r o v e quality of supply. At this level the automation inst~lIed c~n§ists of auto reclosers and auto change-over devices.
The ins~allation of remote terminal units provides the basis for a dist~buted co I~~un ica~ ions system that could be used to implement some degree of automa~io~. For the convenienc~ of the readers, an appendix is included below to detail ~ i s ~ b u t ~ o n automation and comm~~nication systems under a competitive env~onment.
Power System ~ e s t ~ ~ ~ ~ n g and ~ e r e ~ l a ~ i o n
Two levels of automa~on exist:
Via cen~ral con~Q1 systems Via e~bedded systems.
bedded automation systems suc as auto reclosers ge-over sy§tems are probably the easiest dis~ibution autom~t ement. No ~ i g ~ - s p e e ~ c Q r n m ~ i ~ ~ t i Q n systems are required as the
rn of co~n~un ica t i o~ to infarm the central control room or system e but not essential LO realis systems have grea~er ilities if h~~h-§peed local
bene~ts.
C Q m ~ u ~ ~ c a t i o i ~ systems can be ~ m p l e m ~ ~ ~ e d . ~oss~bilities could include on of f a ~ ~ ~ e d c i r ~ i t s all~wing ~ e s ~ e d n e ~ o r ~ oper~tiarn w ~ t ~ o ~ ~ the
ctional protection s c h e ~ e s or unit ~ ro tec~on . he hi ~ornmu~~~cations requir~d could be achieved by a ~ ~ m b e r o f means i n ~ ~ ~ ~ i n g :
Id produce many of the Same b e ~ e ~ t s , but it WO
ickly. The c o ~ ~ i c a t i o n § path and c e n t r ~ ~ in fo~at ion tralTc from the entire n
rocess several scenarios simul~neously . However, such s or changes in n e ~ o ~ k c
e can be ~ a i n t ~ i n e d system.
r the following benefits:
e ~ u c ~ ~ ~ O r ~ I o a ~ on control engineer§,

data and the presentation ofuseful information to the control engineer as to the actions that have been taken by the system. Improvements in the speed of restorat~on or securing of supplies f o ~ ~ o w ~ g a netw fault may in fume allow increase asset utiiisat~on by permitting higher short-time loading levels as the duration automatically. 'This will of G Q U ~ S ~ depend upon the network configuration, but it increases the potent i~~ bene~ts of r n o v ~ n ~ towards ~ e s h e d network operation in the m e d i u ~ to on^ term. A reduction in the need to carry out manual switching has a significant safety benefit, particularly with ageing oil- ~ ~ ~ e d i ~ ~ ~ vicinity. This is and rcmote indication of alarms 1e:elating to possible hazardous conditions.
itchgear, as an operative does not need to be in ed by the possibilities for local cond~tion m~nitor
4.3.16 Autor~ation Case Study - Remote Control in London Electricity
se study considers the planning issues concerned with the 10 term d ~ v e ~ o p m e ~ t of ve qua~ity of § u ~ p l ~ .
The ~ ~ ~ o d u c t ~ 5 ~ of a remote control and data acqui§ition system has been c ~ ~ ~ a ~ to lectricity' s development lans €or its secondary (MV and LV) networks over the
London ~ ~ e c t r i c i ~ ' ~ networks, p a ~ ~ c u ~ a r ~ y the changes m d e to i
This case s ~ d y consid~rs the p~ilo$ophy behind the ~ r Q g ~ ~ e ~ the deployed, the ~ d v a n t a g ~ ~ London believes these offer over alternative system performance d e ~ ~ v e r ~ ~ to date.
review of secondary syst m m e was brought to th
control review in 1994/~ when the re lator's focus on quality 06 supply ~ ~ p r ~ v increased.
The remote o ~ e r a t i o ~ of network ~ w ~ t ~ h e s allows swi~c~ing to o an engineer can reach the a~~ected area, often in excess of an hour i reducing the intemplion time seen by a large number of aEected cust ~ ~ o g r a ~ ~ e was therefore tar eted to ~ e d u ~ e c u s ~ o ~ e r ~ i n u t e s lost from am to a targct level of 40 in 2000.
all asset ~ana~ernen t plan required that the remote to deliver data ~cquis~tion and ~ ~ ~ e ~ l i g e n t oni it or in^
the basic control necessities. This approach has proved well foun as will. be discussed later. et performance improve men^ a ~ ~ r e e - $ ~ g e approach was
s across the 6.6 kV and I I kV ~ e ~ o r k ~ .
approach a i ~ e d to d e l i v ~ ~ as much benefit as possible in the initial phase. The first stage was aime ~ e r f o ~ ~ g ~ e ~ o r ~ s . Th groups of about four circ between them, e f f e c ~ ~ ~ e ~ y creating an open four-feeder ring. However, d i v ~ d ~ d into two er ~ a t ~ g o ~ i e s ~ e ~ ~ n ~ n ~ on w~ether the ~ssoc ia te~
targeting one in every four ring mail1 units in networks in London E~~c~ ic i t y ' s syste
ese groups are run radially with a nu
13 Power System Restructuring and ~ ~ r e ~ l a t i o n
operated radially or interconnected, i.e. operated as a mesh. The meshed LV systems are typical of the centre of London and assist in coping with the hi ~ e § t ~ i n s t e r and the City of London.
The greatest initial benefit in quality of supply performance was to be gained fiom ~ r g e ~ i n g the areas where the LV networks are operated radially (the radial areas) no ~ u p p o ~ in the event of an MV fault, which is a characteristi~ of the in~erconnected LV system. The feeder groups supplying thc radial areas were ranked in order of their
e over the pervious years, bearing in mind any major asset repla~ment to correct high fault rates. U installation programme was then targeted in these networks at open points
urth ring main unit which offered suitable switching point. In order to achieve the switching ~ n c t i o n ~ i ~ in the existin ring main units a p r o g r ~ m e of retrofit actuator solutions was developed to mitigate the ed to replace switchgear. Initially this was ta rge~e~ at modern SF, ring main units and some of the more m o ~ e ~ oi~-fil~ed units which were deemed suitable. This resulted in remote switching being ava~lab~e at an open point and at the approximate mid point of each circuit. A fault passage indicator with provision for remote indication was fitted with each ins~al~ation. This would allow approx~matel~ 50% of each feeder to be restored by remote switching,
The second stage of the programme extended the provision of remote control facilities to ~pproximately one in two ring main units, again with the initial concen on the w o r s t - p e ~ o ~ i n g feeder groups, In turn this would allow up to 75% of be restored by remote switching.
The third stage extended these facilities to those ne interconn~cted LV systems. This is a more complex task as ea equipped with an LV air circuit breaker (ACB). This is installed to prevent network collapse in the event of an MV feeder fault, due to either a fault infeed or resulting network overloading (it being preferable for the ACB to op network fuses which then have to be identified). It is operationally desirable for th to be con~olled to reduce the number of site visits by e ers in the event of a supply. It is also necessary to know the status of the while a ~ e m p t i n ~ to secure s u ~ ~ ~ i ~ s following a fault, so remote indication had to be prov~ded.
A one-in-two strategy was adopted as this was felt to be the m i n i ~ u ~ n e ~ s s a ~ to e the degree of control required to secure supplies remotely without the need for an
eng~neer to be present in the field.
f 1999, London Electricity had equipped 3000 MVLV substations with emote control facilities as part of stages I and 2 of the ~ r o ~ a m ~ e described 3 was ~nitiated in late 1999 and would begin to take effect in the least we interco~nected networks during 2000. The majority of these, 2000 of them,
1999. The performance of the programme has been excellent with customer minutes lost visibly reducing with the numbers of units in commission. Supplies are now restored to all customers within 1 hour for over 50% of all M Y network faults. Most pleasing of all has been the n ~ b e r of routine switching operations that were soon being carried oat using the system.
Figure 4.4 shows the theoretical performance estimates made when the project was co~ceived. The t ~ p curve shows the predicted p e ~ o ~ a n ~ e against the b o t t o ~ curve,

~ution in B I
0 2000 4000 BOO0 8000 10000 'I 2000 24000
RTU P O P U L A ~ I Q ~
trend. (HV) . " - . - I - Trend. (Overall) ._.-__.

estorafion performance
The original vision for the development of the initial remote control system was to create an n e ~ o r ~ ~ ~ a g e m e n t system. The advance , ex~andab l~ and to a l~rnited
ent RTUs were chosen ta facilitate this deve ment. The ~ ~ i i t ~ a l e lemen~ of the ans &re already being imple~~nted. An auto change-over ~ ~ e c h a ~ ~ s m has been imp le~en te~ in the 1 ~ ~ u t e fo~~owing ~ ~ ~ o r k fault. This de~ivers an
s logic to allow supplies at open poi to be r e s t o ~ e ~ in 1
1 as the customer minutes lost. expanded to deliver There are still many
location logic and c o ~ ~ ~ ~ i c a t i o n s . The need t than ~ n c e in less than a minu~e will pose a s ig~ i~cant challen
There are, howe~er, other aspects of network ana age
ated res~oration o f to be overco~e inc unicate to a ~ ~ m b
R W was specified to cope d ~ o n i t o ~ n g and con to inte~ace with the
the LV s y s t e ~ via ~ d ~ ~ t i o n ~
e developed to include discharge levels in cables and v ~ r ~ ~ ~ s i n ~ ~ 6 a ~ o r s of the con~i~ ion of switchge~ and rno~ i to~ng of the LV load on a s~ngle-phase
s even the location of faults.
e of the main rea§on§ for uti~~ties to advance a u t o ~ a t i ~ n of ~ ~ s ~ i mice. ~ere~ulat ion is evolving to establish some o penalise utilities in case of ~ o w - ~ u a ~ i ~ §e~ ice . h cy will grow, and high peak prices fo
cast load control will help manage the risk associ
ion auto~ation ~ ~ o v i ~ e s the ability to c o ~ u ~ i c a t e vital in gives the ability to monitor and control that information from a central location. In sho the s y § t e ~ could tell whose e l e c ~ r i c ~ ~ i s out ~ before anyone calls to ~ o ~ ~ ~ a i n . And 1 could save money by re§tori~g power sooner than ever before. i§tribution a u ~ o ~ ~ t i o ~ allows ~ o ~ t ~ n ~ ~ ~ s ~ o ~ ~ t o ~ ~ g to provide the real-time ~ ~ w ~ e d ~ e needed to o p ~ ~ i s €
can ~aximise customer satjs~ac~ion with
ns with remote
e ~ech~ology require

134 structuring and ~ ~ ~ ~ ~ l a t i o n
improving revenues and reducing costs. ~istribution automation i s a complex subject g the following major coi~ponents:
A master station (open systems design, full ~ p h i c s ) ; remote terminal units (KTUs);
~nctionality (feeder sectionalisa~ion, cold load p i c ~ p , topology processor, voltage/var control, graphic feeder tracing, switching order preparation, special reports, automatic meter reading, etc.); operations and maintenance procedures (safety, tagging, pe its, c~earances, work orders, preventative, routine and restorative practices, spare parts, service ~greemeiits~~ s y s t e ~ integration, design and management; and c o ~ ~ ~ c a t i o ~ system (e.g. cellular phone, radio, power line carrier, ~ ~ ~ p ~ e ) .
4.52 emote mina^ Units
C o n s t ~ t ~ y involved with improvements in RTCT technology are things such as the develop men^ of ladd~r/sequence logic/PID algorithm ca~abili~ies, multiple serial interfaces to a c c o ~ o d a t e smart meters and relays, peer-to-peer rotocols arid direct ~A~
For d is~b~ i t ion automation purposes, small, low-power, w of, c o ~ p a ~ t RTUs are available. These come in a variety of enclosure packages, fically cons~ained points counts, direct CTNT inputs, AC analyser modules to give a variety of calcu~ated i n f o ~ a ~ i o n , and more. The units can p e ~ o ~ data logging to m ~ i m ~ s e the need for constant polling via the communications system, In some applications, peer-to-peer com~unications have been utilised to facilitate independen~ islands of automation ( volta~e/var control) that do not rely on the master stat~on for decisio~ ~ a ~ i n g and control actions.
initiated repo~-by-exceptjon protocols are being utilised by sorne vendors to keep power draw (from constant co~m~nicat ions with the master stat~on) to a
~olar-powered units are in common usage. Compact, ~ow-mainte er i s also available. With the advent of two-way commun~cat~on its, a great future lies ahead for dis~bution automation and
manage~ent app~ications at the customer level for functions such as remote selective control of customer loads, surveillance of customer installations, choice of electricity rates.
The d e ~ ~ ~ of modem ‘open systems’ SCADA c o n ~ ~ a t ~ o n s makes use of consid~~able communic~~ons tec~o logy to spread the risk that a single f a i ~ ~ e will wipe out or ~ s a b ~ ~ a mission-c~tical system. odern ~~~A~ technology permits hi processing and achievem of graceful degradation upon failure works~ations and personal computers give users ful often in proper ~ ~ o g r a p ~ c orient~ti~n, and prov systems they are controlling. The dissem~nation of computing elements and the ~ex ib i l~ ty of full graphics interfaces have in~reased the b~rden upon the system
hics d~pictions of system assets, very ex^^^^ win~ow into the

Risti~bu~io~i in a ~ e r e ~ ~ a t e d Market 135
these numerous features. The control system ~ ie~archy for the whole o f must be flexible, with its topology adaptable to meet the c h ~ ~ i n g
da~bases need to be kept synchronised so that all users view must be c o n s ~ c t e d in a manner that makes operator na~igation
nition simple under the most stressful situations. These items, if can lead to poor operator acceptance of the new tool. system architec~re can now be dynamic, allowing change and enha~cement
over time as both user needs and technology change. Relational database ~ a n a g ~ ~ e n t systems have facilitated easier, more functional interchange of data with other co~ora te s y s ~ e ~ s (accQ~~t ing, custonier records, maintenance manage~~n t , work dispatc~, etc.). Compact, high-de~sity storage media have simplified the tasks of lar b a c ~ p , keeping historical data and managing archives. Disk shadowing pro hot standby data req~irements for key operational areas.
Distribution ~ u t o m a ~ i o ~ functionality in the ~ C A ~ A must work with the actions reactions of the distribution system protectiQn equipment. Actions taken by the logic or c o n ~ o ~ a~gor i t h~s of both $ys te~s (e.g. protection and SCADA) must not compete with
r to cause additional roblems. Those applying distribution a~tomat~on to wer systems must ensu that all protection schemes and systems are thorough^^ and catered for. One needs to have consid~rable expe~ence with protect~on
schemes involving:
smart relays which f e a ~ r e ~ u ~ t i p I e se~ings and co~un ica t ions inte~ace capabilit~es; relay, recIoser and tap/transfo~er fuse coordination; and
lel opera~~ons between buses or substations.
~~C
ddit standard power system SCA
feeder load shedding - coord~a~ed manual, rotational and under frequency schemes; processor - provides up to the moment topology and energisation status; cedure generation and management^
dis~but ion power flow; -load p i c ~ p estimation; former load ~ a n a g e ~ e n t ;
supply interruption reporting and outage management; fault ~ o ~ a ~ i a n ; t~ansfer o~timisat~on (load transfer and recon~guration capabi~ i~) ; automated feeder r e c o n ~ ~ r a t i o n and service restoration; voltage/var control - t rans fo~er tap and sw~tched-capacitor m ~ a g e ~ ~ n t ; d is~ibut~on short-circuit analysi~; d e ~ ~ d - s i d e manage~~ent - load management and time of use strategies;
aphics capability to lemetere~), feeder c
ide schematic display, switch posi~ion mar~in tivity status, and energisation status info
in real-time an the operators’ VDUs; md training $imulato~s.
4.5.4 Softwui-e F ~ n ~ ~ i o n a l i ~
1st the ~ a ~ d w ~ e of a S C ~ ~ A system is of gr primarily in system and applications software. The
odem systems buil~ to inte~ationaiiy accepted
Windows e n v ~ r o n ~ e n t ~
lity, s u p p o ~ b i i i ~ and mainta
r ease of pro~ramming and p ~ ~ a b i l i ~ ; t any language to
e-critical and comput~~g- ompete for co~puting
ase co~nection to allow easy passing of real-ti~e and ~ i s t o ~ ~ a l
database and system t o p o ~ o ~ - assists wi~h ease of s ~ s ~ ~ b es ~opo lo~y proble~s much easier; and
that are based on tried and proven 8
n have significant co~sequen~es gorous design ~ h e c ~ ~ ~ ~ , v e r i ~ ~ a t i o ~ proced~es, and
4.5.5
~ u n i c a t i o ~ system for ~ ~ s ~ b u t ~ o ~ auto~ation is s ~ i ~ e r s , rece~vers and data links. The s y s t e ~ s h o u ~ ~ be desi nt~nance will be as easy as possib~~. ~ersonnel will have to b
involved and new tools will need to be purchased (the of a pote~tial system).
ent will s ~ ~ i ~ c a n t l y i ~p rove use of s~andardised componen
~ o ~ $ d not only allow better compati~i~ity with existing communicatio also i ~ c ~ u ~ e the likelihood that the s y s t e ~ will remain and a ~ ~ o m a ~ i o ~ e ~ u i p m ~ ~ t developed in the future. This ~ ~ i n ~ e ~ a n c e costs to the u t i i i ~ .
deve~op approp~ate 0 k m a n a g e m ~ ~ ~ analysi roached by each u ~ i i ~ .

~ i ~ ~ r i b u t i o n in a Deregulated Market
There are several aspects of O& for distribution automation to be considere include:
bution automation installed (who does what, why,
ion automat~on ~ u i ~ m e n t .
ation equipment, software, da~base an ( ~ o n ~ g u r a t i o ~ manag~ment~ spare parts holding^ service contracts~~ Training to suppor~ the accepted p~losophies of operations and ma~ntenance - both cl~ssroom style and using simulator scenarios.
int-to-poin~’ w ~ ~ n g between the and impossible to solution i s needed
into fbture techo addi~ion, an inexp
emote monito~ng and control.
n-line con~guration. ~ d l i n ~ a large number of points while ~ a i n t a i n i ~ g real
nications ports with
ion of SCADA s o ~ a r e , field equipment, system integr ion, commun~ca~ons
on of an integrat~d system with both high-voltage sub smissio~ networks au~omation has to be
feeders. This would help to optimise operations requirin rew working at d~fferent voltage levels.
of power n ~ ~ o r k diagrams, plant data and teleme ntrol (remote or manu ltiple ~ a t a b a s ~ s and
01s for p~anning and o~timi§at~on studies. faces to fault maiiagem~nt and custom~r in fo~at iQn
and map h an age men^ systenis.
Systems ~ n ~ g r a t i o ~ is critical to the success of any ~e~ecomm~~icat ions and n ~ ~ ~ o r k ~ n g in i t~a t~~e . Since most sy~tems are not developed in a vacuum, ~ntegration o f ex is^^^ or
essed. This ~ntegration must be r ~ ~ u n ~ c a t i o n s level, which ensures that ex of working in the new system to e n s ~ e integr
applica~~ons level, which ensures that ~ n f o ~ a t ~ o n genera~ed an a p p l ~ c a ~ o ~ can be accessed by another application. 0th levels are critic~l to the success of the system and the organisation’s ope~ations. Access and a v a ~ ~ a b i l i ~ o f fflformat~on in a timely~ accurate and user-fiiendly manner are necessary for the system to be a success. The develop men^ and im~ lemen~~ ion of any te leco~un ica t i 5~ system will affect o ~ ~ ~ ~ s a t ~ o ~ ~ l operations. The success of any project i s a direct result of the a~ention to detail given to system specification, design and i~s~ l l a t i o~ i . This ~nc~udes ~erificat~on that what was specified and procured has been delivered, testing of system co~ponents and a p ~ ~ ~ c a ~ ~ o n s ~ and ensuring that the system satisfies ~ ~ n p l e ~ ~ t a t i o ~ r ~ ~ u ~ r e n i e ~ i t s and r e ~ l a t o ~ guidelines.
ana age men^ i n fo~at ion systems (MIS) are becoming an ~ncre~ingly i ~ p ~ ~ a n t tool in the daily operations of electric ut~iities. The i n f o ~ a t ~ o n system is more col~ec~or, r e p o s i ~ o ~ and transpo~ ~ e c ~ ~ i ~ ~ for i n f o ~ ~ a ~ i o n . A w d
a
i n f o ~ a ~ i o n system is a combination of hardware, software and c o ~ n ~ ~ c a t i o n s ~ a ~ a b j ~ ~ ~ rnis the foundation of efficient opera~ions and dec~sion m ~ ~ i ~ ~ . ode^ ~ntegrate~ network management s~stem is used to control
remotely and to supervise manual operations on MV distribution equipment. The system au~omaticaliy processes topology and highlights d~-ener~ised feeders when devices change state after telemetry input or manual dressing. System Alterations and s w i t c h i ~ ~ sc~edules are prepared in advance and operations can be a ~ t ~ n i a t i ~ a ~ l y ch d ~ ~ n e ~ safety ales. Power analysis functions can ~ a l y s e the n e ~ o r ~ or individual distribution feeders. One of the major ben world-map schematic diagrams, plant parameters and network CO
one co~sis~ent system. Data is held at a variety of levels of de analys~s and detailed device operation.
twork operation functions are ‘those functions which enable control an d i s ~ ~ u t i o n network facilities’ and inc~ude control, mon~toring, fault erating statistics. ~perational planning functions are ‘facilities to de
optimise the sequence of operations required for carrying out maintenance work on the system’ and include network s ~ u l a t i ~ ~ and switch action ~ c ~ e d u l ~ g [IO, 1 13.
The primary purpose of a network management system for network operations is to the network, safely and whose primary ~ u r p o s ~
is the dispatch of power (MW and MVAr}. The modem ~ompet~ t~ve market emphasises that utilities need to monitor and improve levels of customer satisfac~ion as well as o p t ~ ~ s i n g network ~p~rat ions and controlling operationa~ costs.
ion creates a new wave of electronic brokering as electricity is bought and odities market, Tracking of these ~ansa~t ions w ~ t h i ~ a given utility should
be ma~a~eable; how~ve~, most of these ~ ~ s a c t i o n s will span mul~ple c o ~ p ~ i e s . In order to achieve interoperability, implement of a common information
patch o f field crew (people) to ~ a i n ~ i ~ and r differs from an energy management s y s t e ~ (
, The common information S p r o ~ r ~ e t a ~ systems.
el has a data structure that is c
Most infornaation networks wil! be connected to the EMS to provide accurate real data to stipport the available transfer c a p a b i ~ i ~ (ATC) calcu~a~~ons. ~ ~ e r t e ~ ~ mar
ge ~ ~ T ~ L ) will be used to present in fo~at ion to customers. d by the transmission services i for customers to use to request
col ( ~ T T P ~ i s used for data ~urchases from a provider. The

Distribution in a ~ e r ~ ~ l a t e d x -
then: IED on the n e ~ o ~ k .
increa~ingly c o ~ ~ e t i ~
ovide m e a ~ ~ e ~ o f d ~ a m i c security to allow the system
A will allow ~tab i~ i ty -cons~a~ed utilities safely to inc~ease the loadin
essment of the security impact of ~ a n s ~ ~ ~ ~ o n s can also i ~p rove s y s t e ~ reliability, will also allow ~ i ~ e l y
lt af open axess to the
that a p r e ~ i ~ i n a ~ d e ~ o n s ~ a ~ i o n usi has resulted in a p o t e n ~ ~ l savings of
enefit of the p ~ o d ~ c t ~ o n version ~ i ~ ~ t be a 5 % inc~eas~ in ove
t r a ~ s ~ i s s i o ~ capacity across a cons grease^ capacity could be used on

B
integrat~on process should drive all utilit~es towards the standardisatioi~ of data ~ ~ o d e l s c o ~ m ~ i c a ~ ~ o n protocols.
ay an ~ncrea§ingly important role in the daily o ~ ~ a ~ ~ o n of ust a means of ~roviding connectivity b e ~ ~ e n one person and
t e l e c o ~ u n i c a t ~ ~ n systems are the c o ~ i e r ~ ~ o n e of ing b e ~ ~ r coin~unication, not only b e ~ e e n e ~ p ~ o ~ e e s
recent ~ h a ~ g e s in the teleco
r ~ l ~ ~ i o n s h ~ ~ s . ~ o ~ ~ u n ~ ~ a t ~ o n requires ~ a n s ~ i § s i o n channels, which
services from the carriers who

c o r n ~ a ~ ~ ~ s found themselves with campus-wide EANs capabl~ o f ~ f ~ c i e n ~ ~ y h a n ~ ~ ~ n y com~arison, the data
and not well s u i ~ e ~ to computer~~o-co
e early 199Os, ~ a ~ e ~ ~ began
s, lower delay and lower CO
ment at each end, much as is
s users, because they concen~ate traffic fkom m links from their premises to the carrier’s centra
the c a ~ a c i ~ of fiber. Fiber not o sion of capac i~ s ~ m p ~ y by i n s ~ l l i ~ g more by businesses for ~ber-based access has i
and an a ~ ~ e ~ a t e
ase s ~ t i o n to a cell served by another, the wire~ess access link is automatical~y to the new base station.
~ ~ s ~ b u t ~ ~ ~ in a Deregulated Market
services digital networ~s whicb bring common channel si alling right to the
~ t h e ~ e t was chQsen as the dab link layer because of its predominance in the e subsequent availability of low-cost imp~ementations and assoc~ated
s b~dges and routers). In addition, the scalability o i i~p~ementa~ons being fairly common and 1Gb Eth
i ts way. ~ r o c e § ~ o ~ are av~i~abIe tooday with multiple 10 Mb Ethernet the chip, and next-generation d e s i ~ s are planned with 100
As it was deeme~ desirab~e to be able to access data device, two solutions : Transmission Control Pro~oco l / In t~~et PrQtOcQi nterco~ect (OS). TCPlIP is a networ ational ~ ~ d ~ d ~ s a t i o n [l4,15], it was
e IS0 network layers. These layers have robust flow control ery useful on a busy sub§ta~ion LAN. th network layers s u ~ p o ~ the ng a message for all devices on the to hear. This f e a ~ r e is very s such as data capture triggering, time s ~ c h ~ o n i s a t i o ~ , and even
eel models [ 16,171 are used because they can easily ay makes measurements of voltage, current and The mea§~ments made by the re~ay can be
conta~ing all the elements mentioned above. If r quality and power factor are added at a later date,
e shared with others. Fo owes on a monitored hr
the ori~inal model i s easily expanded to ~ c o ~ m o d a t e this data.
voiceldata transfer, remote access and controj, entertainment and e d u ~ a ~ ~ o n . ~ d ~ e d c o ~ ~ u n ~ c a t ~ o n s , n ~ ~ o r k capabi l i~ and services may also have an impact on the s t a f ~ n
Qr~anis~tional needs of the organisation. An evaluation of the existing staff, roles r~spo~s~bil i t ie§ i s necessary to determine if the required capabilities exist or if new s
Fully in~~ractive co~munication systems provide a full range of
staff are requir~d. ith the con§~ntly changin ~e~ecommunications ~ n v i r o ~ e n t and
almost any ~ ~ ~ a n i s a ~ o n to ffer te~eco~unicat ions capa~iiities c o ~ ~ ~ r ~ i a l ~ y , the legal issues related to a system must be evaluated at
the organisation can address these early in the development process. power distribution systems requires the use of an effective
c o ~ u n i c a ~ i o n system to trmsniit control and data signals between control cen~es and a large number of ~ e ~ o t e ~ y located devices. Since there are a wide range of available c o m ~ ~ ~ i ~ c a t ~ o n t e c h ~ o ~ ~ g i e s capable o f performing this task, selecting tbe appro~r~ate co~munication system requi~es a thorough understand~ng of the s ~ e n ~ h s and weaknesses of each com~unication t ~ ~ o l o g y . ~resently, no single communication techno~ogy has been de~onstrated as being best suited for all distribution auto~ation needs. Each d i s ~ b u t i o ~ automa~iQn scheme has ~n ique c o ~ u n i c a ~ o n requirements, and th~ r~ fo re a ~o~mun~ca t ions t e c ~ i q u e for d~stribution automation must be chosen based on those unique r~quirements.
The c o ~ m u n ~ c ~ t i o n r e q ~ ~ r e m e ~ ~ s for distribution automation depend on the size, complexity and de~ree of au~omation of the d ~ s ~ b u t i o n system. In general, it is de§irab~e
~~~~~t~~ eats

ower System ~ e s ~ c ~ ~ n
nt and re data rate r ~ q ~ i ~ e r n ~ ~ ~ s .

ishibution in a ~ ~ r e ~ l a t e ~ 1
There is no i ~ ~ e r ~ ~ t to the further dev ations. It can be
the isolate^ area.

t e c ~ o l o ~ y provides near-instantaneous ~ n f o ~ a t i o n of a single household. It supports rapid, report netwo
d to optimise network loading for reduced e~ergy losses - in effec~, A facilities for the lower levels of the d ~ s ~ b u ~ i o n i i e~o rk . And ~ecause
ogy can monitor deviations from establishe f possib~e t a ~ p e ~ n g . Variable rates can be f debts ( t ~ o u g h flexible p r e p a ~ e n t ~ can be e
an empty b ~ i l ~ i n g , remote disco~ection can take place with complete c e ~ a i ~ ~ , ~ u ~ h e r new tariffs can be quickly and easily p r o ~ ~ ~ e d into any ~ ~ s t 0 ~ e r 9 s ete er
down the wires whenever required. The data can be ~ a n s f e ~ e d inte~activel~ throu~h the e l e c ~ ~ c i ~ d ~ s ~ i b u t ~ o n system to the dis~ibutor’s o supplier and custo~er. ~ i n a ~ c i a l app~ications, suc b e ~ ~ e n stores and finance organisations, can bec
could use the existing e l e c ~ ~ c i ~ txnd supplier. As a result, no
s ~ p ~ a t e carrier media. Two-way data ~ ~ s ~ i s s i o n not only on LV n e ~ o r ~ s ,
2233 that a circularly $7 linder in free space. And a e, by the early 1960s ther ion in what was then c
and ~~~k~ 124 ised that the losses
ties. They ~ o ~ e a paper tlz into accoun~ repe~ter costs
[25]. This set the stage for the commercial devel and i n d i ~ a t ~ ~ to the telepho~e companies in ~ a r t i c u ~ a ~ the way to b e n e ~ ~ c o s t ratio. For a ~elephone appiica~on, the economics are most two conditions:
e b e ~ ~ e n rep~aters should be maximised~ eat~rs are expen$ive nd the fewer the better. idth of the channel should be max~~ ised. In this way the ~ a x i ~ u be routed on a given channel, and the cost shared ~ ~ o n g ~ ~ n y s
Because of these factors, the first widespread use of fiber optics for c o ~ u n ~ c a t i o n s was the ~ong”distance trunk lines of the telepho~e e o ~ p ~ i e s . The s to ~ ~ ~ r o v e ~ e n t s in the ~ e ~ o ~ a n c e of the fiber, to the exte rs are usable over large distances. At the same t h e , the cost
to the point where it is co~parable, on a l e n ~ h - ~ o r ~ ~ or. The i ~ ~ ~ ~ c a ~ i o n of these deve~opments is that fo er optics can be used to replace copper trunk cables,
ne optic~l cables could c

le of an ~ u ~ s ~ n a ~ i c ~ ~ ~ c ~ i ~ ~ ~ ~ q ~ i ~ n ~ bm-way c Q ~ ~ u n i ~ a t i Q n s . In this case fault detectors must c o ~ m ~ i c a ~ e wi cisntrol centre so that the fault location cm be d e t ~ ~ i ~ e ~ , then signals must
automation will be e ~ ~ a s u ~ e to adverse
flashes, ~aults or switc

1

Free Space External
Optical Fiber Yes
Free Space Yes
of the ~ u r n b ~ ~ of us

I lation
The scheme uses local i n t e l ~ ~ g ~ n c ~ to e ~ a m i ~ e local d ~ t ~ to see if there is ~ ~ h ~ ~ g
roblern, b e c a u ~ ~ each local set of nctions such as feeder d e ~ ~ ~ y r n e n t s
for less than $3000 per km.
i s ~ ~ ~ ~ ~ t i Q ~ §yst~m, w ~ e r e tr energy is very close, ~~r~ is
n is r e q u ~ ~ d , it is usually n from Scratch, For example,
to add ~ o ~ ~ K w feeder monito

Dis~bution in a Deregu~ated 1
Q V ~ any Qb~tacles that might be p r e s e ~ t ~ d by the c o ~ v ~ ~ t i o n a l media. Fiber allows the c Q ~ u n ~ c a t i ~ ~ engineer to design a s ~ s ~ ~ ~ that will meet all the worst-case require ents, that can acce as many locations as necessa~ and can handle the
ee
~epa~at ion of bMsinesses: proposals and cons~tation. Office of Gas and E l e c ~ i c i ~
.N. Allan, ‘A~sessmen~ of customer outage costs due to ~ l e c ~ ~ c s e ~ ~ c e i ~ t ~ ~ p ~ i ~ ~ s : r e s i ~ e ~ t i a ~ sector’, IEE Proceedings - ~eneration, Transmi.~sion and
N. Allan, ‘Eva~uation of reliability worth and value of lost load’, ZEE ~ r o c e e ~ i n g s ~ ~eneration, ~ransmi .~s io~ a n ~ ~ ~ s t r i b u t i o n , Vol. 143, 1996, pp. 171-180, ‘ ~ ~ f o ~ a t i o ~ and Incentives Project: Defining output measures and incentive regimes for PES dis~~ihutioi~ businesses Up~ate’, Office of Gas and E l c ~ ~ ~ c i ~ ~~~e~~ ( O f g e ~ ) arc^ 2000.
, ‘ ~ a ~ y s i s and evaluation of five s h o r t - t e ~ load f o ~ c a ~ t i n g
P. Van Olinda, ‘ N o n p ~ a m e t ~ c r e ~ e s s ~ o ~ based ~ ~ o ~ - ~ e r m ons on Power Systems, Vo1.13, No.3, August 1998,
i. T.L. Lu, A. Abaye, M. Davis, and D.J. M
I 1996, pp.163-170.
asactinns on Power Systems, vo1.4, No.$, October 1989, ~ ~ . ~ 4 8 4 - ~ 4 9 ~ .
‘ANNSTL~: A neu~ai-network-based electric load forecasting system’, IEEE Tr~nsac~~ons on Neural Networks, Vo1.8, No.4, July 1997, pp.835-846.
.L. Ring and R. Luck, ‘Very short term load forecasting a l g o ~ ~ ~ s ’ , E~~ E l e c f ~ c ~ ~ i l i ~ orec casting in an Era of Deregulation Conference, Dallas, TX, November 1996. Wiktor Gharytoniuk and MO-Shing Chen, ‘Very short-term load ~ o r e c ~ s t i n ~ using a ~ ~ ~ c i a l neural n e ~ o r k s ~ ~ IEEE Transact~ons on Power Systems, Vol.15, No.1, ~ e b ~ a ~ 2000, pp.263- 268.
ED Ad-Hoc W o r ~ ~ g Group 2, ‘Distribution Automation: hnctions and data’, CI

structuring and ~ e r e ~ l ~ ~ ~ o n
IEG 61968 System Interfaces for ~istribution anagenient - Part 1: Interface A rc~ i tec~ re and General R~quiremen~, IEG 1999.
Cauley, Peter Hirsch, Ali Vojdani, Terry Saxton, and Frames C l e v e ~ ~ d , ‘ I n ~ o ~ a ~ i o n n e ~ o r ~ s u p ~ o ~ s open access’, IEEE Camputer ~ ~ ~ l i c a t i o ~ in Power, 1996, ~ ~ . 1 2 - ~ 9 .
[ 131 Peter Hirsch and Stephen Lee, ‘Security applications and arch~tec~re for an open mar~et’,
A ~ ~ ~ a k and ~ i l l i a m Premerlani, ‘ ata c o ~ u ~ i c a t y o n s in a d ~ ~ e ~ u ~ a ~ ~ d ~nvironrnen~’, E ~ ~ ~ ~ t ~ r A p p l ~ c a t i o ~ in Power, July 1999, pp.2~~31.
~p~l icut ians in Power, July 1999, pp.36-39. 11 188-3: I994 ~ f o ~ a ~ i o n ~ e c h n o ~ o ~ - ~ n t e ~ a ~ i o n a l Stan
~ o ~ o n TJpper Layer equirernents ~ Part 3: ~ ~ n i n i a l OSI aha and W. P r ~ ~ e ~ l a ~ , Object Oriented Mode [I61 tions, Prentice Wall, 1998.
est M~t~~odo io~ ies , Setup, and Result ~ o c u ~ e n ~ a t i o n ’ ~ EPRI S~onsor~d hernet for Protection CO EE ~ o r ~ i i i g Group on
ersion 1 .O, May 1997. ution Auto~ation (Edited)
Tutorial Course 8 8 ~ ~ 0 2 8 0 - 8 - ~ ~ ~ , 1988.
Vo1.82, 1910, pp.4
e on Electric Utility Power Lines
Power System Restruc

eals to ~ h ~ s i c a 1 ~ansfers, this risk i s e x ~ e ~ e l y h f~ancia l tools that can be of help. of b i ~ a ~ r a ~ contracts (and various other ~nancial deals on the
P faces not only an increase in o~era~ional d ~ f ~ c u l ~ ~ e s with also a c o n ~ d ~ ~ in plannin~ as the market need far ore
ission system can evolve. This has serious ences in ~ e ~ i ~ b ~ ~ i ~ as eviden~ed by recent system-wi~e blackouts. Tn the subse~uent ~ections below, we present a pa~~cu lar market structure that equips the TP with ~ a r k e t ~ , b a s e ~ solutions to conducti~ as energy m a ~ k e ~ with a large umber of bilateral ~ a ~ ~ a c t i o n s .
to become actively involv allowing the TP t~ pupsue
em can also be solved in an ~ f ~ c i e n t way as inten with the in~Qduction of compet~tion.
The e ~ ~ ~ ~ ~ ~ c ~ ~ s ~ i s s i ~ ~ system is one of the most complex c o n s ~ c t e ~ system§. to tbe e ~ t e ~ a l i ~ s t e ~ i n ~ from the opera~ion of the ~ a n s m i s ~ ~ o n system, imple the market mechanisni to the ~ n d u s ~ re~uires a fair level of u n d e r s ~ n d ~ n ~ of not
cial and r e ~ u l a t o ~ aspects but also the ~ n g i n e ~ r i ~ g consequences of
~ i ~ u r e 5.1 shows the evo~ution of the role of the TP in the industry (as at the time of writing).
~ ~ o ~ u ~ i o ~ of the role of tbe TP
In the dependent phase the TP functions as a part of the vertically integrated utility. In the ~ u ~ ~ ~ Y ~ phase the TP stands alone and oversees overall market activities, The ark et pa~icipants are ~equired to submit their intended use of the system to the TP and based on that in fo~at ion the TF allocates transmission capacities foIlowing strict ru'les set
e TP assumes no ~nanc~a l respo~sibilities and has mi~imal interac~~Q

ants. As shown in Figure 5.1 there are three differ nt s ~ c ~ r e s of the TP
phase the TP ~ a ~ c i p a t e s in every ~ ~ a ~ e of market nction§ of the TP in this phase can be ca te~o~sed as that of marke~ m
s e ~ i ~ e ~rov~der . Of ~ e s e two only the function of market As a service ~rov~der the TP assumes full financial l i ~ b i l ~ ~
We will disc~ss the role of the TP in each phase in deta
the TP exists only as a part of a v e ~ i c a ~ ~ y ~nte~rated u ~ i l i ~ ~ The ity owns and operates a ~ ~ ~ 5 i d e r ~ ~ ~
e utility is a an teed to ~ e ~ o v e ning of the system by lem of short-term generation sc n to b ~ l a ~ ~ e load demand devi~tio
and to do this at the lowes ~ 0 ~ ~ ~ ~ ~ ~ 0 ~ of this problem is given in [ 11:

Trans~ission Expansion in the New E n v i r o ~ e n t I57
where
e amou~t o ~ i n s ~ l l e d generation capacity at node i and tec
the ~ ~ o u n t of ~ n s t a ~ ~ e ~ transm~ssion capacity for line 1
the rate of i nves~en t in generation capacity using t e c ~ o ~ o g y (I
fa ( i ) , ~ ~ ~ ( i ) , I) : the cost of invest men^ using techno~ogy a at node i
a
,? : 1;' 1
: the cost i n v e s ~ e n ~ in line I
logy a at node i, exc~u
,
(t), PL ~ t ) ) : the flow on line 1 as a function of system
) : the ~ a x i m ~ m a~~owable flow on line 1 as a function of the a ~ o u n t of ~ n s ~ ~ l e
~ i s § ~ o n c a p a c ~ ~ ; owing to secure c o n s ~ ~ ~ t s ~ &max << K,
rresponding cons~ain~§.
The o p t ~ ~ ~ ~ ~ § a t ~ o ~ per~od~ T in ~ r o b l e ~ (%I)* is the longer of two time ~ n ~ e ~ a I s ov lion or ~ ~ s ~ i s s ~ o ~ i ~ v e ~ ~ e n ~ § are valued. As the syste
d a r serve as control variables in this fo
ides the level of production and the rate of investment on ~ e ~ e ~ a ~ ~ o n
and tra~sm~ssion, P,Jt),
for the status of the system
This ~ o ~ ~ ~ ~ t i o ~ captures many well-&own trade-offs relevant for the e ~ ~ c ~ ~ n c ~ of the the re~at~~nsh lp bemeen the i n v e s t ~ e ~ ~ timing and the balance o f the costs er time, the value of different ~ e c ~ o l o g i e s at
produce powerl and C o i ~ ~ ~ e m e n ~ a K ~ ~ ~ o ~ ~ e ~ e r a t i ~ ~ ~ capacity and There are two n ~ ~ ~ c e a b ~ ~ features ~ o n s i ~ e ~ i ~ g the operation
by the TP (as a p a t of the v e ~ c a ~ ~ ~ i ~ t e g ~ ~ t e d utility) as the problem: the apparent compiexity of the problem (5.1) and the
o ~ ~ r a t i ~ n cm be accw ciated by ~ x a ~ ~ i n i n g these variables.
G on ~ ~ ~ e ~ ~ ~ n ~ based on costs .,ag 6J,Tand e ,,',, Owing to the ~ o ~ ~ l ~ x j ~ , the
s o ~ u t i ~ n to the p r o b l e ~ is not readily available, and thus the actual o p ~ ~ a t ~ o ~ and m are performed s u b ~ p ~ i m ~ l ~ y in many cases. Further, since the rate nt is d e ~ ~ r ~ ~ n e ~ based on costs, the o p t ~ ~ ~ ~ i ~ condition of the fom
limited to concern [fa 1: and e:(t). Nevertheless, problem (5.1) i s B
ark in studying the e f ~ c i e ~ ~ ~ of the industry as the r e s ~ c ~ ~ r ~ ~ takes place.
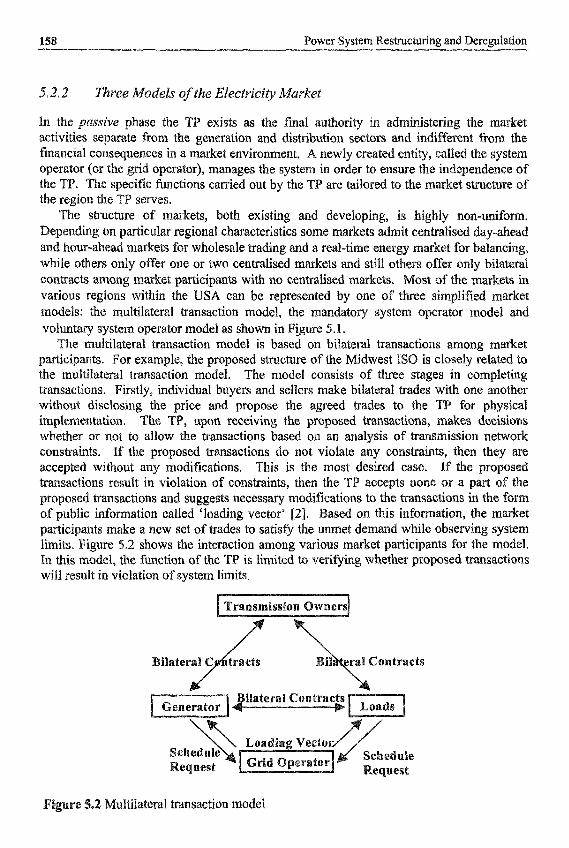
15 structuring and Dere
ln the passive phase the TP exists as act~v~ties s e ~ ~ a t e fiom the ~eneration
final authority in dist~~bution sectors
market env~ronmen~. A newly cre , manages the system in order to ens cai~ied out by the TP are tailor^
, both existing and eveloping, is highly ~ o n - ~ i f o ~ . reg~onal characteri§~ics some markets admit cen~alise for whoIesa~e trad~ng and a r e a ~ - t i ~ e ene ne or two centralised markets and still a~icipants with no centra~ised marke e USA can be represented by one
as shown in Figure 5.1.
the proposed structure of the Midw
multilateral transaction model, the mandatory systena operatQr model and
model is based on bi~ateral ~ ~ s a c t i o n $ among arke et
n model. transactions. Firstly, ~ d i v i d ~ a l buyers and sellers make bil ~ i t h o ~ ~ disclosing the i ~ ~ l e m ~ ~ t i o ~ . The ~ h ~ t h e r or not to allo constra~ts. If the proposed transactions do not violate any cons~aints, then they are
The model consists of
without any modi~cations. This is the most esired case. If the ns result in violation of co~straints, then the T accepts none or a p
ansactions and suggests necessary mo ion called ‘loading vector’ [2]. a new set of trades to satisfy the
limits. Figure 5.2 shows the interaction among various market p ~ ~ c i p ~ t s for the ~ o d e l . In this model, the function of the TP is limited to ~ e ~ ~ ~ g w ~ e ~ e ~ ~roposed ~ a n s a c ~ ~ o n s will result in violation of system limits.
~ ~ i l a t e ~ a ~ ~ansaction model

Tr~smis$ion Expansion in the New ~nvironment
Mandatory system operator model
~ i t i a ~ l y ~ m ~ k e t p a ~ i c i p ~ ~ ~ s bid supply curves to the TP, although a be made to include elastic d e ~ a n d in the f o ~ u l a t i o n ~ for the rest of the the consumers' demand is inelastic since not much is lost in term the chapter^ The TP then simul~neo~$ly dispatches generators an capacity using an optimal power flow p r o g ~ ~ , which determines the most ~conomica~ mix of g ~ n e ~ t i o n s for given load. The voluntary system operator model ports a m~1t~"~iered s ~ c ~ r e that min~mises the TP's ~ ~ ~ u e n c e on profits by m
model. acc~ptable levels of reliability. Figure 5.4 shows the basic schematic o
U l U
Y
~ o ~ u ~ ~ r y system operator model

bilat~ral and c e ~ ~ a l i s e r e s e ~ c ~ of spot market ~ansact~ons is desired b a l a ~ ~ e of i ~ s ~ n t ~ e ~ u s supply with u
i n d ~ s ~ , while direct access and custo~er
~ a n d a t o ~ system operator model lead to an equi l~b~um solution of the f o ~ l o w i ~ ~ o ~ t i ~ ~ s a t i ~ n ~ r o b i e ~ :
(5.1 1) i,o i
The ~ ~ ~ ~ ~ i $ a t i o ~ defined in (5.8) . The result of solving the
(5.12)

~ r ~ § ~ i ~ § i o n Expansion in the New Environment 141
tive economic e n t ~ ~ in e energy market before such a prw
tion sector so that any r e ~ u l a t o ~ pendence based on the reasons given. f ~ c i ~ n t opera~iQn of the ~ s m i s than ~ u l t i p l ~ grids serving c to the high degree of the econ
ng a wide area of the
v ~ ~ o ~ s ~ansa~t ions which c as well as system users ben tamers w h o s ~ ~ e n e r a ~ i o ~
t amQu~t of syste~-w For instance, it is easy
v ~ o ~ ~ s loads is far s~a l l e r
on of the TP, especially at the time of scarci
ent to say that the s u ~ ~ e s s ss work9 so that the tm

1 Power System Restruc
TP ta ~ d d . Therefore, the ~ a n § ~ ~ § § i level m o ~ ~ l , the TP sets the bundled energy and tran§mission price that ~ ~ n ~ ~ i s e § the o
~ ~ i s ~ i n ~ the system load at each given instant. The ~ a n s ~ ~ s s i Q n revenue i
the rate of re^^ reg~la~iQn,
first cut is specifie to consumers and to sup
and the c o ~ ~ u t e u§age charges a § s i ~ e d
In the ~ o ~ u n t a ~ system operator model the
t market for the rest. market and is subject to ng the ~ e c e s § ~ ~ s ~ § s ~
s as a service provider, As a service p e charged to each bilate
under strict r e g ~ a ~ o n , there is
act more custQ~ers.
ssion line in (5.9, For ~ ~ a r n ~ l e , b etter control d e ~ ~ ~ n the 1TC can e
c o ~ i ~ i n g to any major transmiss~on prQjec~ the
e 5.1. In the wti
~ i s s ~ o n $ y $ t e ~ cong~~tion only when th e ~ ~ g ~ ~ a ~ cost of the investment. As
1 structuring and Dere
ystern because of the ineffici high, some users will choose EQ
total cost of ~ i s ~ b ~ t ~ d
TP and the TTC lies in the clus us ion of the ~ ~ n ~ - ~ n ~ n v e s ~ $ n t in the s h o ~ - ~ ime-scale ~nct ions becom C in i ~ p l ~ ~ $ n ~ i ~ ~ bilatera
es are create^ BS part of
maker.
5.3. I I ~ c e ~ ~ ~ v e RGalte Des
ows and thus r

Transmissioii Expansion in the New ~ n v i r o ~ ~ ~ t
lator of the ITC’s profit
ITC for a higher ~ ~ c ~ ~ a ~ e in efficiency.

The ark et- base^ usage charges are commonly referred to as conge§t~o~ charges, The zonal pricing met~ods are two widely used metho~s
s. The nodal pricing method computes the ~ansm~§sio (5.8). For a given time instant 1, the problem
gian function of the form
L ' i (5.13)
where ,u, f 0 if and only if FXP,, PL) = F;"'". For si in the system.
icity, we use DG power Raw in e DC power flow equations in
(5.14)
u t ~ g the flows on each line ix notation are written as
where &is the voltage angle vector, Taking the first derivative of L with respect to Pi,, and it equal to zero yields
4- &(t) = A ( t ) t i I
(5.15)
Suppo§e the generation cost of supplier i, ciPa, is a quadratic function ofthe ou
(5.16)
Then, under the perfectly competitive market condition, the optimal s~pply i, b,,, is the marginal cost bid given by
(5.17)
~ a t c h ~ g the solution in (5.15) and the supply bid in (5.17) the system price at node i , p, and the dispatch amount, P,r,, as
(5.18)
Finally, the ~ a ~ s ~ i s s i o ~ rate is set by the difference in the ,q, i.e.
into zones and (2) compu~tion of zonal prices. The system is first divide^ i of smaller markets by a~gregat i~g individual nodes into zones w ~ e n
e c t a t ~ Q ~ of c ~ n g e s ~ ~ o n within each market. The ~ansmiss~an rate is so~ving a similar optlmisation prQblem as given in (5.8); the cost C,,@'~,~) n the average cost of generation in zone i. The line Row constraints are now ~ i t e ~ a c e flow limit c ~ n s ~ a i n ~ s , i,e. the ower flow on any line I along on^^ the ~ ~ ~ g e s t i ~ ~
=,q -4. The zonal pricing method consists of two steps: (I) aggregation of i n d i v i d ~ ~ ~ nodes
Transmission Expansion in the Mew Environment
interfaces is within the m imum rating of the line. The transmission rate is ,U]
resent zones rat he^ than nodes. ophistication may be requ~red in order to i ~ p ~ e m e
ective, a sign^^^^^ reduction in computat~Qn rice~cap r e ~ ~ a t i o n since only a small rather than many nodal prices as is
ricing. Further, there is a greater advanta~e to be gained in ~ m p l e m e ~ i ~ ccQm~odat~ng b~latera~ ~ a d ~ s as is i ~ ~ u s ~ a t e d in the su~sequent section.
The a6cess fees are intended to recover the fixed part of the costs and are thus ~ndependent of actual usage. However, usage-ind~penden~ charging for the access fees is impractical and may result in improp~r incentives for the ETC. In order to s t ~ ~ u l ~ t ~ a meaning~l ~ h ~ ~ ~ g mech~i§m, some measure of base-load capacity needs to be ~ v e n .
practical approach is to compute the access charges based on a coincidental peak n s u ~ p ~ ~ o n o f loads. The ‘12-CP’ method [3] i s one such approach. The po~ ion of
a1 access fees is computed as
i
where S,(t> is the load i’s share of system coincident peak, and LXt} is the load in month I at peak load~ng con~ition of each day. As the total r~venu charge is equal to the product of access charge and the coincidental peak o approach provides the ITC with incentives to increase individual base-load ca
heref fore, price-cap r e ~ ~ a t i o n and the rate design consisting of es and regulator-approved access fees o
ver the ~ v e s ~ e n t with some incen~iv~s for improvement in ~ ~ c i e n c y , Ho~ever9 the resul~ing rate structure does not i ~ e ~ ~ a t e l y yield prop~r incen~~ves for transmis§ion ex~anding. In the subsequent section, a market mechanism called the pr~ority i ~ s u r a ~ c e service is d~scusse~ in terns of compl~menting price-cap regulation in o ~rovide the right set of incent~ves to e ~ a n c e the t r ~ s m i ~ s i o n s y s ~ e ~ ,
The driving forces of dere~lat ion aim to establish a more c o m p e t ~ ~ ~ v ~ market in achieve lower rates for consumers and higher ~ f ~ c i e n c ~ for suppliers. T ~ o u g h trades, consume^ can establi§h various service obtain the lowest rate and most desirable service. of power9 the time and duration of the servic compensation are n
ntracts with any supplier in order to lateral contracts s p e c i ~ i n ~ the a ~ o u n t
d the associated rate and ed and agreed upon between the suppliers and 6ons~mer tition is directly related to the bilateral trades which allow e, the success of the market is dependent on the ETG’s abi
Since the t ran~miss~o~ grid is a physical system, the 1TC is able to honour and e x ~ ~ ~ I ~ e these bilateral c o n ~ a c ~ as far as the system design and opera tin^ condit~on§ Unlike in the spot m 1: the ITG i s not allowed to pa~icipate directly in re~dispatchin
Thus, the ITG relieves ~ ~ n s m ~ ~ ~ ~ o 1 trades or by 6reating counter ~ Q W S in
168 Power System R e s ~ c ~ ~ n g and Deregulation
systematically adjusting the rate structure. All bilateral on^^^^ are the replacement resources in case of ~ n t e ~ p ~ o n s die to either the
ent or ~e~erator-re~ated contingencies, W ~ t ~ o ~ t loss of genemlity all bilateral contracts consist ofthe fofbwing s
q ~ n t ~ t y of e~ergy transfer
injection point and the c o ~ e s p o n ~ ~ g zone
J’, z : the w i ~ h ~ a w ~ ~ point and the c o ~ e ~ p o n d ~ n g zone enalty payment by generator i for generator~related contin
ante.
e ~ a t ~ o ~ purc~ased in the spot market of zon
ovcr the p ~ r ~ o d t E T = it,, 4. c ~ n g ~ s t i ~ n , the load is respons
ex ante for each time the tr
robability of be in^ c u ~ a ~ l e d with the upper bound g~ven as ~~~.
In r e a l - ~ i ~ e oper~tion~ the ITG determi relieve ~ a n ~ ~ i s § i o n con~estion along with

as long as the market can take it. s creates an a~ac t i ve incentive far ss~on ~ y s t e ~ as a subs~ntial effort by the ITC is expected in order to i T base for priority insurance service. The advantage of this method is tha
of the spot arke et^ which is under strict regulation, the w~li in~ness to take the ITC’s profit is well capped, Over time, the sho
the spot market or bi~a~eral trade is ex~ec~ed to lev meet the c ~ ~ g i n ~ needs of the market. The I
t tn mark~t evolution is likely to have a ~ e ~ a ~ v e l y ~ g ~ e ~ level priority insurance service and to enjoy profits from bus~es§
in we discuss the effect of reduced regulato~ unce insurance services on transmiss~on exp~s ion .
5.3.3 T r a ~ ~ ~ i s s i ~ ~ ~ ~ p a n s i ~ ~
The ~ e w ~ a r k e ~ org e s c ~ ~ ~ e d at the ~ e g i ~ ~ ~ n g of th ~ ~ n d a n ~ $ ~ t a l s e ~ ~ n g for s~s temat i~ ~ ~ s r n ~ § s ~ o n expansion. This ta
Qf ~ s e d ITG § ~ c ~ r e . A fo~ard-look in^ ~ a n s ~ s s i o n S t of its c u s ~ o ~ e r § based on ~re¶uency and r n a ~ i ~ d e of
its ~ a ~ ~ ~ ~ s s i o n system, tools necess~y for e rovides a basis for su e n ~ a ~ c e ~ ~ ~ t and ex of these ~ n h ~ c e ~ e ~ t
elopment of new market tools for operating the ~ansm~ssion s y s t e ~ b as the ITC moves into the active phase of m ~ a g e ~ e n t ~ In this phase to make complex business decisions over a wide r a n ~ e of time scales: long-te
deal with ex~ansi d to ~omputing the i
c o ~ s ~ a i n t s and makin~ system reinforceme~ts in order to meet this roposed ~ a n s ~ ~ s s ~ o n rate design that the i n v e s ~ e ~ ~ t cost is
on rent on the spot market owing to the r i nves t~en~ decision is required for the
Even when there is s ~ ~ i ~ c a ~ t con~~st ion sustain needed for relieving this congestion is ing the performance of the ITC, since
rate lies wit^ the r e ~ i a t o r and not the ITC. The a ed prioriv insurance s
on the h is t~~ica l p a ~ ~ e ~ s of users ority insurance services
nt in a new efficie~t gen t for i ~ p ~ e m e n t ~ g bilateral rrad
the ITC makes and subs The better the projection that the new market
The s h o ~ ~ t e ~ dec~sions deal with the most ~ i f ~ c u ~ ~ task for the ITC
s on the ITC's ability to funct three aspects to consider in the pr~cing. The first is ~ e ~ ~ i n g s from the long-term m
v ~ l ~ m e is i r n ~ o ~ ~ n t in making investrne proj~ction a€ the lo~ational and temp~ral
n, Over time, the market f the costs by ~ x ~ a ~ ~ l a t ~
s the vahation of insurance services given the s p e c ~ ~ c a t i o n s ~ f a b ~ ~ a t ~ r a l d in Section 5.3. The ITC has a menu ofpr
In this ~ o ~ u l a ~ o n , the re~iability is explic i n ~ ~ ~ ~ p t i o n s xq by thc ITC over the contra valuation and may be solved us spect of pricing is ~e la t i~g the
activities. Because the mount of ~ c t ~ b l e c , ~ as well as the rices at the spot ~ ~ k e ~ , there
es


Transmission Qpen Access 173
e either set or ~egulated in ac
a ~reaso~~b Ieq or ‘fair’ prooft ~ a r g i ~ above its cost.
r e ~ u ~ r ~ to operate in a manner that min~mis~d o v ~ r a l ~ r e v e ~ u ~
~~~e~ c ~ ~ ~ ~ s the ~~~~~~0~ to serve was often m concept was usually rep~ace~ by g

Power System Restructuring and Deregulation __I
174 -----._.__ -
~ove~ment-owned e ~ e ~ ~ c i ~ indus~y ~ncoura~e es not have to be part of a r e s ~ c ~ r i n g effort. I
early 3990s several Western governments were do a ~ e ~ e r job of ~ n n i n g the power ~ n d u s t ~ , r e d u c t i ~ ~ in labo~r could be achieved by p
ise rates and have a greater interest in e l i n ~ ~ ~ a ~ ~ ~ g power lace i n e ~ ~ c ~ e n c ~ e s . In other countries either Qwnersh~p or
to cooperative or to p r i v a ~ ~ o r ~ ~ ~ s a t i o ~ s ~ or to new types of ions or ~uasi-gov~rn~ental entities ts, ~ w n e r s h ~ ~ and ~nct ional re5
1 invo~~enient of private capit d as private sector p ~ ~ ~ c i p ut b e c o ~ e more ~ o l ~ ~ i l e .
also a serious conb: . Compe~i~on breeds imov
ism. A competitive powe use of new technologi
~ o n o ~ o l y s c h e ~ e was unable to ~rovide incen~ tiva~ion to use new ideas and ~ e c ~ o l o g ~ e
ework. Lack of compe~~tion also gave in c~untries such as India and Chin
very low. A more b : o ~ ~ e r c i a ~ ethos could be h ~ u ~ t o ~ ~ r s .
.1.3 ~ n ~ ~ n d ~ i n g ~ e n e ~ ~ t i ~ ~ ~ T ~ a n s ~ i ~ s ~ ~ n hznd is^^^^^^^^
the variatio~s dis~ussed ab amms in certain respects: (I) se lec t~o~ of ~ n e r ~ y sources, rangi
cost r ~ s o u r ~ ~ s to others with low capital and hi econo~ies of scale or n ~ ~ r a ~ monopo~y f e a ~ r e s ~ electric ~ o t e n t ~ ~ ~ ~ are not an i ~ p ~ ~ ~ e n ~ to clear e c o n Q ~ i e ~ of scale, but there is a
ref fore some form ofregula her unbundled into (a) a wires ides facilities fox e l e ~ ~ c i ~ d ~ ~ i v ~ ~ ~ and (b) lectric e n e r ~ to end consu~ers, (3). The tr in the ~ c o n o ~ ~ c , the geographic and the b c
dion in the gen~ration and ret mission system and ensure
~h~refore must ~ o n ~ ~ ~ u e to f ~ ~ i c ~ o n as an i n ~ e ~ r a t $ ~ and re
e q ~ ~ t a b ~ e basis to all power ~ ~ ~ o ~ e s the focus of attention field’, and the rules for managing access by ~ ~ s ~ r i m i ~ a t ~ ~ . This cha~ter focuses on this c ~ ~ ~ ~ a ~ subject,

nal, state, provincial or independent generators coexist. In these cases the ~ e c h n i c ~ inte~e~ationshi~s are murky and are in a process of rapid ev~lution.
rate and transfer BOT; {or build, operate and own) plant of ing, ~ s u a ~ I y ~at~onal , ~ ~ ~ i t i e € ~ I a y an on in many f a s t - ~ ~ n g systems. T
~ ~ r c ~ ~ e a ~ e e ~ e ~ ~ are often in force as an economic incentive to investors.
n s i b i i i ~ on the dis~bution side as in a ~ a ~ i t i o n a ~ s ~ ~ r e g u l a t ~ ~ ~ is that Discos may now be restrict
scos a d ~ ~ o ~ j d ~ ~ l e ~ t ~ ~ ~ n e ~ ~ ~ sales e ~ o p ~ ~ ~ countries is to sell to an ~nvestor~ or to coxp em so that ~ ~ v e s ~ m e n t for reinforceme~t can be
o p ~ r ~ t i ~ g prac~ices ~ m ~ ~ e ~ e ~ ~ e ~ .
Where the t rans~~ssion netwo was state owned before r e s ~ ~ ~ ~ n g , o i n t ~ g r ~ ~ will be r ~ ~ n e d and a d ~ s ~ i n e ~ o n between owner and operator is r
SA, f o ~ e r e ~ e c ~ ~ c ~ t ~ ~ i ~ ~ ~ s may sell off their other assets ~ Q r n ~ ~ ~ ~ s ~ h basic pr~mise o f open ~ a n s ~ ~ ~ s i o n ~ccess i s that
t r a n s ~ i s s ~ o ~ operat~rs treat lalt users on a non-discriminato~ basis i use of services. This re~uirement cannot be ensured if transmission
~~~~~~~~e~~ $ ~ s t e ~ y generation or supply. A requirement, therefore, is
at^^ to Q ~ e r a t ~ the t r ~ s ~ ~ s s i ~ n system,


markets are ess~n~a l ly s h o ~ - t e ~ forward ~arkeEs i serve toad and loads bid for the opportu
c ~ ~ ~ ~ ~ t ~ two ~ s t i n c ~ ~ ~ k e ~ s : day ahead e ~ ~ s ~ ~ ~ s of 24 s ~ ~ a r a t e d ~ u ~ i ~ a ~ ~ t ~ o n ~ ,
ansmission costs, constraint management or congestio bidders may bid. as a single generator or as a ~ o ~ f ~ l i o of ~ e n ~ ~ ~ t Q ~ ; hQwe~er, a unit may
Iy one p ~ ~ ~ ~ o ~ ~ ~ t h o ~ ~ h a ~ j d ~ e r ~~y s ~ b ~ ~ ~ m ~ l ~ i ~ ~ e ~ ~ ~ f o ~ ~ ~ bids. n there is conges~i5n the CalPX sets a ~ a x ~ ~ u m price and buyers may su
rnand bids for ~ Q n - c ~ i ~ a b ~ ~ loads;
auction ~ o ~ d ~ c ~ ~ a single i d~~~~~~~~ ~ a ~ ~ e g , This occas~on p r o v i ~ ~ s a c ~ ~ ~ ~ t i t i ~ ~ g~n$ra~ors ta adjust their day~ahead sched~Ies in the lig s ~ ~ ~ - ~ ~ ~ n load forecasts md unit status.
as well as the o ~ i ~ r s h la the new ~ ~ k e ~
151.


Transmission Open Access
1 the new ~ad ing § ~ c ~ r e s into a few alte
ion system is ~ ~ n ~ a ~ l y
I


a

T r a ~ s ~ i s s ~ o n Open Access 7

1 ower System Restruc lation
ostage stamp ra~e, and ~ h e ~ e are no i ~ ~ e ~ ~ ~ ~ n a l charges if power is ~ ~ s p o ~ ~ in the ~ n g e s ~ e d zone when con E" usem to sei1 or buy
~~~~s are a d j ~ ~ ~ b
the flow ~ a ~ e ~ in a n e ~ o r ~ will de s a c ~ o ~ s at v ~ ~ ~ ~ ~ s times. cb line I;a meet the n, the load of tine j

For each transaction, the rel~ab~Iity of ~ ~ ~ s m i s s ~ o n with all lines but l inej in $ e ~ ~ c e , are first calculate^. The r e ~ i a b i l ~ ~ bene~ t RJ:Ti ~ a n § ~ c ~ ~ o n T, is c~lculated as the i n ~ r c ~ e n t in ~ a n s ~ ~ ~ i o ~ fai~ure a ~ s e n c ~ of the line. Similar ~ r o ~ ~ ~ ~ ~ i t i e s are c a ~ c ~ ~ a t e ~ in respect o
ect to line j . The e~bedded cost of the ~ r ~ s r n i s s ~ o ~ line j , all based on ~eliability b e n e ~ ~ s oniy i s now de~ned as:
where P, is rRe m a ~ n i ~ d e of ~ n s a c ~ ~ o n r n e ~ ~ o d used to co~pute p r o ~ a b i l i ~ of ~ansaction
example, the failure probability o f ility that a path will not exist from the t r ~ s a ~ ~ i o n s e ~ d ~ n
This ~ ~ p r o a c h to failure c ~ l c u l a t i ~ ~ is r e a ~ ~ l ~ ut becomes com~~~cated and v i ~ a l ~ y unworkable i
and E;. is the same as in (6.1). The s ~ e c i ~ c is in itself not c e n ~ a ~ to this ction may simply be taken as
e ~ ~ r ~ e d circuits, a cut set eth hod [Is] or B ~ o ~ d ~ t ~ o ~ a ~ pr le for ca~culat~ng this a v a ~ l a b ~ ~ i ~ .
efits in a ratio which has to specified e x ~ ~ e n ~ u § ~ y and depends on the j u ~ ~ e m e n ~ of the ~ ~ ~ s r n i s ~ ~ ~ n p ~ a n n ~ r ,
ace, the co rn~o§~~e charge is set at
a
i 1 It § ~ ~ u l d be noted that e ~ b ~ ~ d e d ~ a ~ § ~ ~ i s s i o ~ costs Rave to ~nc~ude ~ a c ~ ~ i ~ i e § sue
ers, § ~ ~ s ~ a t i o n e ~ u i p m ~ ~ t ~ switch ear and shun~§eries c acitors in additio~ to ~ a n s ~ i s s i o n lines and cables.
and d~~ferent m ~ ~ ~ o d s rn
ed us^^ ~i f~erent r n ~ t h o ~ ~ ~ hence, ewices, as i o the case in s
d with time of use, g ~ o g ~ p h ~ c ~ ~ , ~uantj~ative and customer- s ~ c ~ i ~ c v ~ ~ a t i o n s in ~ ~ n d .

A brief ~ ~ s c ~ ~ ~ ~ ~ n of the ~ansm~ssion pr~c~ng in the NCC, subsection.
rovide~ f17] in this
to cover the costs of its assets but the ~osts of
is the price quoted by e nlo§~ e ~ p ~ n s ~ ~ e dis~atch during each half-hourly time slot w ~ e n - simple unco~st ra~ed dispatch,
The NCC i s altow c O ~ § ~ m ~ ~ § ~
generator which is ac transm~ss~on constraints
d c ~ ~ ~ ~ i ~ f“lass of load p r o b a ~ ~ ~ ~ ~ 9 ~ is ca~c~ i la t~d by c o ~ n ~ ~ i n g e x ~ e c t ~ d d e ~ ~ d with the c a ~ a c ~ ~ expected to be a order to encourage capcity offers from generators the pool purchase pmce ~ ~ ~ ~ ~ ~ e d by aug~en t~ng S ~ s ~ ~ ~ t ~ ~ e n ~ ~ a t o ~ is alseady se le~~ed in the u ~ c o ~ s ~ a ~ n ~ ~ ~ i s ~ a t c ~ but preve enerating owing to € u ~ n § ~ i s s i o ~ constraints or other factors the generator
with this ~ ~ ~ b a b ~ ~ ~ t y ” w ~ ~ g h ~ ~ d ~verage. IF
n compe~lsato~ pay , This p a ~ e n t consists o f the ~ ~ ~ ~ $ s e n c e
hand, same ~ ~ c o n o ~ ~ c g e n e r a ~ o ~ who are n called u ~ o n to g ~ ~ ~ s a ~ e ~ w ~ n g to ~ a n s r n i $ ~ ~ o ‘bid’ price, which is h~gher than the puev of-merit ge~e~a to r ~pera~ion. Constrain
and ancillary sewices c~arges are passed on to c o n s ~ ~ ~ e ~ s in the ~~~~.
. This is, e~ect~vely, a ts, out-of-merit paym ges, ~ ~ n s ~ i s ~ ~ o n losses, start up ~ ~ s ~ s ,
The ~ ~ s t o m e u side of the market is simpler: a11 energy is puscha$ed at the pool selling
EzjY and s ~ s ~ ~ ~ over all h a l ~ - ~ o ~ ~ l ~ c o ~ s u ~ e r ~ r ~ c e ~
~ ~ c t l y in^^ t ~ e ~ e ~ o ~ e , the PSP is fixed on a r e v e n ~ ~ ~ r e c o ~ ~ ~ ~ ~ a ~ o ~ basis; t ~ a t is, P the e l e c ~ ~ c ~ ~ sold is made equal to payment to generators p ~ ~ s other 60
ce, the costs o ~ t r ~ s m i s s i o ~ ~ losses are also rolled into
poiiy p o § ~ ~ ~ o ~ , albeit regu~a~ed, the srnission access are
~ o ~ s ~ ~ e r s . Fur this ~ea§on md since average ~ 1 ~ ~ c a t ~ Q n s of upl ~h~~~~ to d ~ ~ e ~ ~ n ~ users, ~~~~~ 11% been the prima^ focus of con
share the costs of o ~ e ~ a t ~ g the system and bear not but an ~ ~ e r ~ g ~ of the OS& i n c ~ ~ a by all r is ~ ~ - e x ~ ~ ~ ~ n ~ these r o b l ~ ~ s and r ~ ~ ~ n t ~ y
SP), All of the extra costs of energy above the PPP are simply 1 is by ~ u s t o ~ e ~ ~ t ~ o ~ g ~ the calcar.
~ § ~ ~ ~ ~ ~ + ~ ~ l l ~
ta ~ r o v i ~ e aaequat~
2

T~ansmission Open Access


is ap~roach can work in a market s ~ c ~ e where the organ~sa~on e for pro cur in^ a n ~ i l l a ~ services is also respoxisible for opera~~ng the e n e r ~ amples of this include New Zealand and New England.
llary s e ~ ~ c e s ~ separate from the energy m ~ ~ e t , is b ~ ~ e r n l ~ ~ ~ ~ t s ~ c ~ ~ s where the IS0 is se~arate from the PX, as is the case i ~ c i ~ ~ ~ services which the ~al~forn ia IS0 is responsible for p r Q c ~ ~ n g incl
inning reserves, AGC, replacement reserves, voltage supp start. The first four services can be procured by the ESQ through d or be s e ~ ~ - ~ r o ~ i ~ e d by users, ~ ~ w e ~ e r ~ s~lf~provision is li c o ~ ~ c ~ a l ~ ~ n g e m k e ~ ~ ~ ” The use of all. anci~~ary services, incfud the exclus~ve r e s p o n s ~ b ~ ~ i ~ of the TSQ. ~ l a c k ~ § t a ~ capabi l i~ and reac must be provided or purchased by tbe ISO.
ompet~tive auc~ons to ~ a n d a ~ # ~ or
In some e ~ e c ~ c ~ t ~ markets, both the mandatory and marke~~ba~ed approach~s are . For e ~ ~ ~ l e , in Spain, the ~ Q ~ c a ~ l e ~ ~ ~ ~ ~ m a ~ reserves~ service is ~ ~ ~ ~ ~ o r y for
rs, All plant must be ~ ~ u i p p ~ ~ with a governor and there is no r ~ ~ ~ e r ~ ~ o n associated. This is intended to reduce power i ~ ~ a ~ a n c e s . If a generator can from other ge~~era~ors. On the othke ~ o ~ p ~ ~ ~ ~ ~ ~ ~ a ~ c t ~ o n ~ m ~ ~ ~ e t ~
of frequency deviations ~ ~ n g ~o~ e the required primary r e s e ~ ~ it m ~ s t procure~ent of AGC service is
.7
~onges~ ion [21] is not a new prob~em in power s y ~ ~ e ~ o p ~ r ~ t ~ o n and was a r o ~ t ~ e ~ r o b ~ e m for the ~ y § t e ~ opera~o~ in the t r a d i ~ o n ~ system. In e n v ~ r o ~ ~ e n ~ s , however, pre~~ously established practices for dea~ing w no longer be relied on since coo~eration between market p ~ i ~ i p ~ t s cannot be ~ a ~ n ~ e e d . Any control ~easures adopted by the system o~erator ta eliminate cong~st io~ must not ody be t e c ~ ~ ~ a ~ ~ ~ ~ u s t ~ ~ a b 1 ~ ~ but also be fair to users and c o ~ e r c i ~ ~ ~ ~ ~ a n s p some e ~ ~ ~ i c i ~ markets with bilateral and multi~a~era~ con~act ~ ~ s ~ c t i o n s this p ~ o b ~ e ~ is more d ~ f ~ c u l t to solve since these contract transactions introduce additional c~nstra~nts on the system o ~ e ~ t o r . For example, c u ~ a i l ~ ~ n ~ of a ~ilateral ~ ~ s a c t i o n ~equires s i ~ u l ~ e o u s and equal reduction at the entry and exit points, All this makes CO
~ a n a ~ e ~ e n t a ~ h a l l e n g ~ ~ l ~ p r o b ~ e ~ and ~equires a comb~ation of ~ o ~ ~ c ~ ~ pri o p ~ ~ ~ o n a ~ respo~se$. It i s perhaps the t h o r n ~ ~ ~ t issue in t r ~ ~ ~ i s s ~ o n ope~ation.
Boot md c o ~ ~ a c t models are s e ~ ~ r a t e ~ y addressed first and an app~oach to reconcile h t h models i s then explored. Conges~i~n ma~agement issues without Cons~de~~t~Qn of co~~ngency/secur i~ problems are discussed in this subsection. A fbller ~ e a ~ e n ~ of topics can be found in [22],
tion given beIow assumes ~~ce-based dispatch built on spot p ~ ~ ~ n ~ theory [ I I ] and in its simplest terms, ~eg lec t in~ price elasticity effects md the signific location, the dispatch a ~ g o ~ t ~ ~ may be stated as:
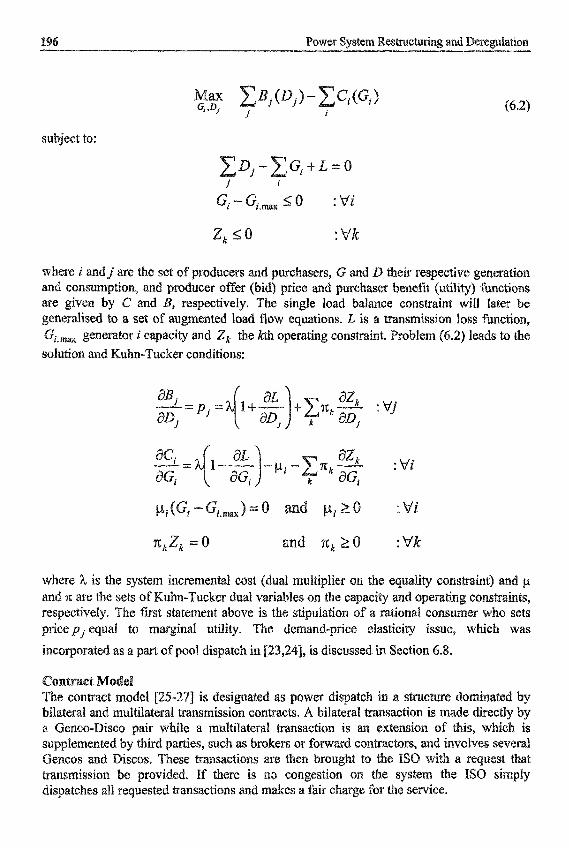
subject to:
ere i andj are the set of ~ r o d ~ c e ~ s and ~ ~ c ~ a ~ ~ s ~ G and D their ~ ~ s ~ ~ ~ ~ e ~ e n e r ~ ~ ~ o ~
we g~ven by C and B, respectively. Tltc single load balance constraint will later be ~ e ~ ~ ~ a l i s e d to a set of a ~ g ~ ~ n t e d load flow equations. L is a ~ ~ s m i s s ~ o n loss ~ ~ ~ t i o n , Gi.ma g ~ n ~ a t o r i e a ~ a ~ ~ ~ and 2, the kt f i o~erat~ng c o ~ s ~ ~ n t . ~ ~ o b l e ~ (6.2) leads to the so lu t~o~ and ~ ~ ~ ~ - T ~ c ~ e ~ eond~t io~~:
c o n s u ~ ~ ~ ~ ~ o n ~ and ~ r o ~ ~ c ~ offer (bid) prise and ~ ~ r c h a s ~ ~ ~ e n ~ ~ ~ ~ u t ~ ~ i ~ ~
Mi
af y ~ i a b l ~ on the c nt above is the $tipu~ation
ty. The demand-price elasticity issue, which was
I [25-271 is desig~~ate~ as power ~ i ~ ~ a t ~ ~ in a s
Disco pair while a m ~ l ~ i ~ a t e ~ ~ ~ transaction is 2ibp extens b ~ l ~ ~ e ~ a ~ and multilateral ~ans~ iss ion c o ~ ~ c ~ . A bilateral ~ ~ s a s t i o n
s, such as broken or ~ o ~ a K d CO
~ a ~ s ~ ~ ~ § ~ o n be provided. I f there is no con dis~atch~s all r e q ~ e s ~ ~ ~ ~ansactions and makes
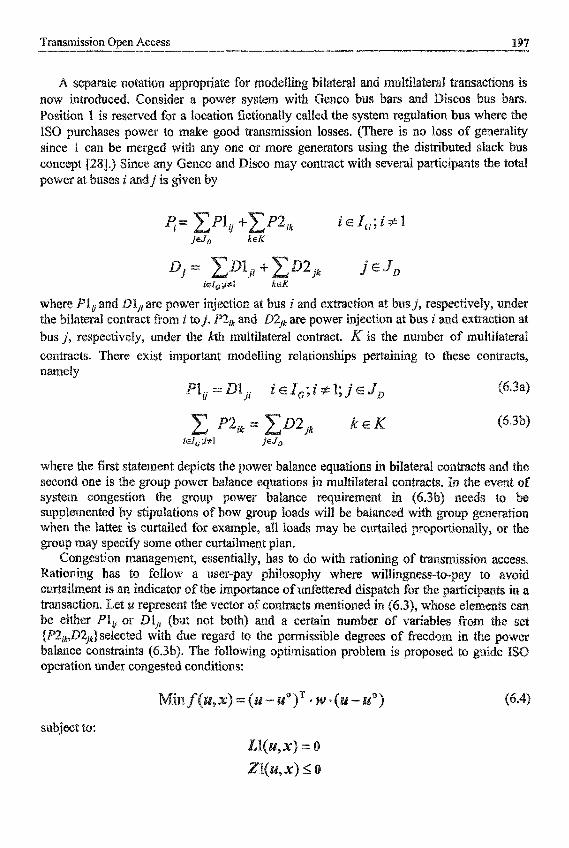
Transmission Open Access
A s ~ ~ a ~ ~ ~ ~ o ~ t ~ ~ n
~Qs i t~Qn 1 is r e s e ~ ~ d for ISQ pur~hases power to
. ~ o ~ s i d ~ r a p o ~ ~ r system
ission losses. (There ed with any one or my aenG0 and Disc
ik z' E I , ; i f
subject ta:
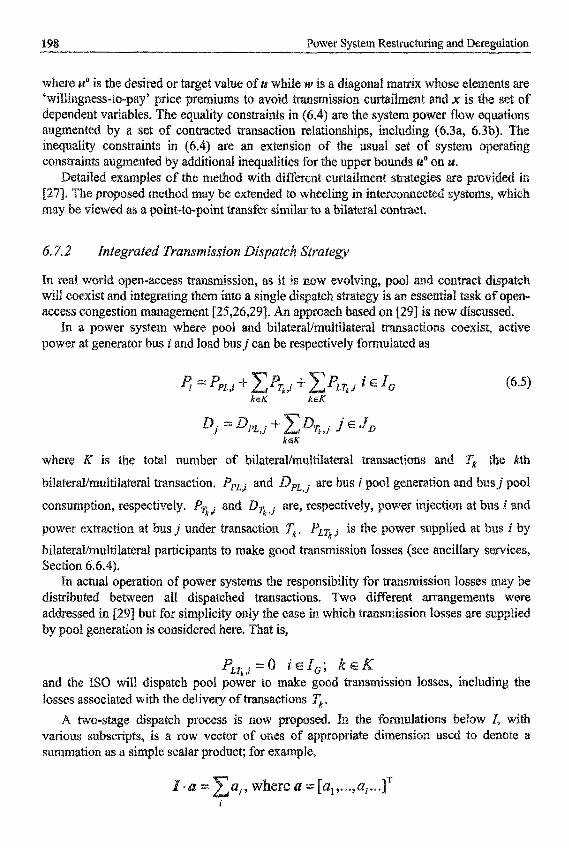
i s the desired or target YaIue of
a u g ~ e n ~ e d by a set of contracted tram ~ n e ~ ~ a l i t y c o n s ~ i ~ t s in (6.4) are an extension of the c o n s ~ ~ ~ n t s augmented by additional inequalities for the up
led e~amples of the method with d ~ ~ f e r ~ ~ ~ c u ~ a i ~ e n ~
ewed as a p o i ~ t - t o - ~ o ~ n ~ transfer s ~ ~ ~ i l ~ to a b i l a t e ~ ~ ont tract^
is the total number of bilatera~muitilat~r~i ~ ~ s a c t ~ o ~ s and Tk the Mh
bifaterallmultilaterl t~nsac~ion, PpL,i and , j are bus i pool g e n ~ a t ~ o n and bus j pool
~ o n s u ~ p t ~ o n , r ~ ~ ~ e c t i v ~ l ~ . PT., and BTkJ are, r ~ ~ ~ c ~ i v e ~ y ~ power ~ ~ j e c t i o ~ at bus i Etnd
owe^ ~ x ~ ~ ~ ~ i o ~ at bas j nu er ~ a ~ s a c t i ~ n Tk , PLT, ,; is
bilaterallmultilat~~al pa~icipants to make good transmissio~ Section 6.6.4).
In actual ope~a~ion of power systems the ~esponsibi l i~ d ~ s t r i ~ u ~ ~ ~ between all dispatched ~ansactions. Twa ~d~~~~~ in [29] but for s i m ~ ~ i ~ i ~ on by pool ~ ~ n ~ ~ t ~ o ~ is c ~ ~ s ~ d e r ~ d here,
T*,i = o i d G ; k E and the IS0 will dispatch pool power to make good t r ~ s ~ ~ s s i o ~ losses, kncludin
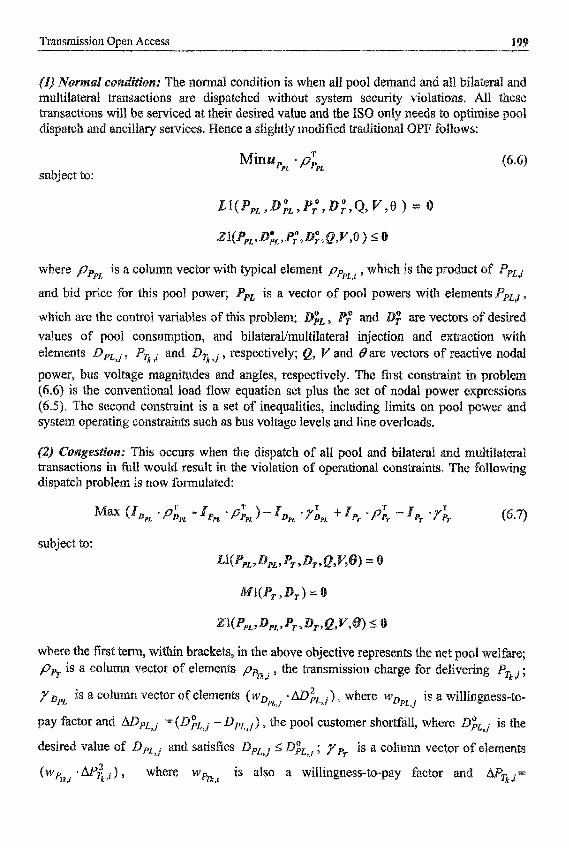
-- Transmission Open Access
: The n o ~ a ~ condi~ion is when all pool demand and all bila ns me dispatched without system security violations.
ir des~red value and the ISSO only ~ i e e ~ s to op ~ a n s ~ c t ~ o n s will be s ~ ~ ~ c e ~ at ~ i s ~ a t ~ h and a ~ ~ ~ l ~ a ~ ice^. ce a s ~ ~ g ~ t ~ y ~ o d ~ ~ e ~ ~ a d ~ ~ o n ~ OPF ~ 0 1 ~ 0 ~ ~ :
(6.6) T
PPL a PPPL subject to:
where
and bid price for this pool power;
~~~~~~ we the c ~ n ~ ~ ~ ~ v ~ a b ~ e s of this p ~ ~ ~ ~ e ~ ; values of pool ~ o n s ~ n ~ ~ ~ i o n ~ and bilaterailm elements DpL,i, Pq ,i and ,?Iq ,j , respectively~
~ ~ w e r , bus v o l ~ ~ e m a ~ ~ ~ ~ e s and ~~~e~~ r~s~ectiyely. The ftrst ~ o ~ s ~ ~ n t (6.6) is the conve~t io~a~ load flow equation set plus the set of n o ~ a ~ power
i s a c o ~ ~ ~ ~ vector with typical element pppL,i , which is the
i s a vector of pool powers with e ~ e ~ e ~ t s PPLI
arrd e x ~ ~ c ~ i o n ~~h tors o f r e a ~ t ~ ~ e ~ o ~ a l
second con$~a in~ is a set o f ineq~lities, incl~iding limits on pool p~~~~ an rating cons^^^^ such as bus voltage levels and line overloads.
~ ~ s a c t i o ~ s in full would result in the violat~on of operational cons~a~nts. The f o ~ l ~ w i ~ dispatch ~ r o b ~ e ~ is now f ~ ~ u i a ~ e d :
subject to:
T ) =
e first tern, within brackets, in the above objective r$pres~nts the net pool w ~ ~ f a r ~ ~ , the ~ a ~ s m i s s ~ o ~ charge for d e ~ ~ v e r ~ ~ PTkj ;
is a w ~ l ~ i n ~ ~ ~ s ~ ~ t o -
pL, j =(D:L,i - D P L J ) , the pool customer shortfall, w h ~ ~ e D & j i s the
and s a t i s ~ ~ s DPL,] 5 B& ; y4. is a c o ~ ~ ~ v ~ ~ ~ o r of e ~ e ~ ~ ~ t s
pPT is a columi vector of elements
yo,, i s a c ~ ~ ~ n ~ vector of e I e ~ ~ n t s . ~ ~ L , i ~ where wo PLJ
~ e s ~ r e ~ value of
- (w,,,,, AP<,~ 1 wher~ whs i s also a willingness-to~pa~ factor ,i -
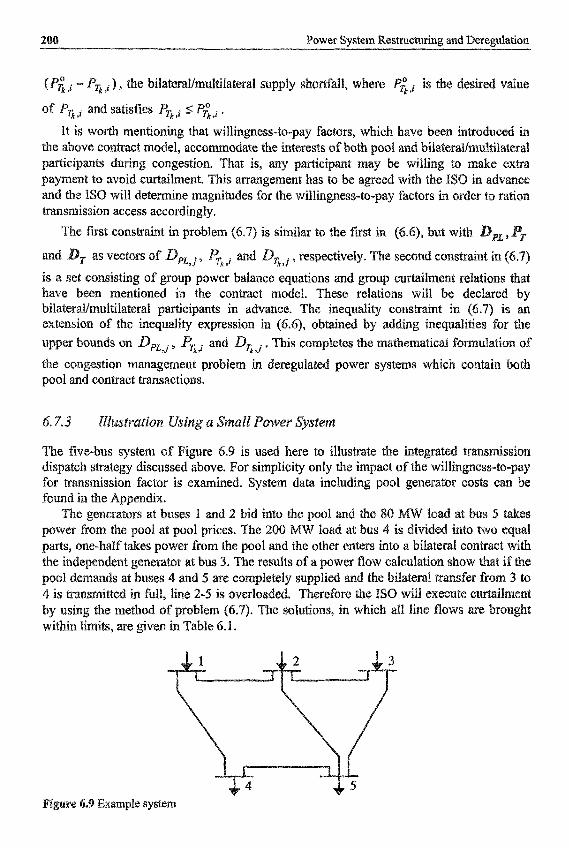
,[ and satisfies F$;, ,! 5 P; ,i . It is worth mentioning that willin~ess"to-pay factors, which have been ~n~5duced in
the above con~act model a ~ ~ ~ m ~ o d a ~ ~ the interests of of and bila~erallmulsitaterd p ~ c ~ p ~ ~ ~~~~n~ c o ~ g e s t ~ ~ n . That is, any p ~ ~ ~ ~ j ~ a n t be w~l~ ing to make ex^^
~ a ~ ~ ~ ~ t to avoid c u ~ ~ ~ m e n t . This a ~ a ~ g e ~ e ~ t has to be ~ g r e e ~ with the IS0 in a d v ~ c e and the 1S0 will d e t e ~ i ~ e m ~ g n i ~ d e s for the w i l l ~ ~ e s s - t o ~ ay factors in order to ration ~ a n s ~ ~ s s i o n access accordingly.
The first c o n s ~ ~ t in rob^^^ (6.7) is ~ ~ ~ ~ a r to the 5rst in ~ ~ ~ 6 ) 9 but with
, r ~ s ~ ~ ~ t ~ v ~ ~ y . The second c o ~ ~ ~ ~ n t in (6.7)
b a ~ a ~ ~ e equations and ntract model. Th
bi lat~r~l /~ul t i latera~ ~ ~ ~ c ~ p a n t s in advance. The i ~ ~ t e ~ s ~ o n of the i n e ~ u a ~ i ~ ~ x p r e s ~ ~ ~ n in (6.6), obtai
die c o ~ ~ e s ~ i o n ~ ~ ~ a g e ~ $ n t problem in d ~ ~ e g u l a ~ e ~ power systems whic pool and ~ o n ~ a c t t r ~ ~ a c t i o n s ~
.%3 ~~~~~~~~~~~~ ~~~~~ a ~~~~~
The e bus system o f Figure 6.9 is used here to ~ l ~ u s ~ a t ~ the ira discussed above. For simplicity only the i €actor is examined. ~ y s t e ~ data i n c ~ ~ d
found in the A p ~ ~ n d ~ x ~ e g ~ ~ ~ r a t ~ r ~ at buses 1 and 2 bid into the pool and the 80
51 at pool prices. The 200 ~~ load at bus 4 is ~ i ~ ~ d ~ d into two ne-half takes power from the pool and the other enters into a
gene~at~r at bus 3. The re~uits of a pow buses 4 and S are c o ~ ~ ~ e ~ e l y ~ ~ p p l ~ e ~
fuft, line 2-5 it; ~ ~ e r ~ o ~ ~ e d . ~ h ~ ~ ~ o od of ~ r o b l e ~ (6.7). The s o ~ u ~ o n s ~ in w ~ i c ~
wit hi^ ~ ~ ~ i ~ 9 are giv$n in Table 6.1.
Example system

Case 1 ~ s § u ~ e § ~ ~ i n ~ i e s s - t o - ~ a ~ factors of the pool d e ~ ~ ~ ~ at b same as that of the ~ ~ ~ a t e ~ a ~ ~ n s ~ e r from 3 to 4? namely 20 $1
~ ~ ~ - ~ o - ~ a ~ €actors of all pool ~ e n ~ ~ d s we ~ o u b ~ e ~ while unchanged. As expected, the pool d ~ ~ a n d § at buses 4 md 5
case 2 ~han case I and the bilateral transfer from 3 to 4 was curta consumers were willing to pay more.
I
Pool ~ e n ~ r a ~ ~ o n at bus 1 54.6 56.1
Pool generation at bus 2 119.1 119.5
Pool demand at bus 4 94.5 95.2 1' Pool demand at bus 5 73.8 75.2 1' Transfer from bus 3 to 4 96-8 94.3 -k
The ~ e ~ a ~ o ~ i ~ ~ ~ v ~ e ~ ~ i g ~ ~ 6.10 is ~ b t a i n e ~ as varied fiom 0.0 to 60.0 $ /MW2 h In 10 $ /MW2 h steps while other factors are r e t ~ n ~ ~ the same as case 1.
The non- l i~~ar curve in Figure 6.10 shows that the more the w i ~ I i n ~ ~ s ~ - t ~ - p a y , the less the c ~ ~ ~ ~ r n e ~ t and that when it becomes larger the bilateral transfer tends to tb
ents and w ~ ~ ~ i n ~ ~ s s - t o - ~ ~ ~ r n a ~ ~ ~ ~ i n ~ ~ s ~ - t o - ~ a ~ of the b i ~ a t ~ ~ transfer
. It is i m ~ ~ ~ t and ing to ~ ~ ~ h a § i ~ e that willi Iment of its own ~ s a c t ~
i ~ ~ r e ~ ~ ~ m ~ u e ~ ~ e on the ~ ~ i l ~ ~ ~ of other loads and ~ a n s ~ c t i ~ R s .
105
100
95
90
85
80 -
0.0 10.0 20.0 30.0 40.0 50.0 60.0
W ~ I I i ~ ~ ~ s s - ~ o - ~ a y ( ~ ~ ~ ~ ~ 1 )
I _. _I__ __
67 .4 Static $ ~ c u ~ i ~ - c o ~ ~ t ~ ~ i ~ ~ d
doIogy E301 to reschedu~e pool and b i~a~era~ ~ansact~ons t inp: account of s y s ~ e ~ which may be helpful in ~~ov id ing an insight into the security c ~ a l I e ~ ~ e s faced by the context of system der~gulatio~ i s l resented next.
~esched~ling [3 1,321 is the ~ r e v e n ~ ~ v ~ ~ a ~ g e r o ~ s o p e ~ a t ~ n ~ co~~ i t i ons and b~inging a w state. This is an ~ d ~ ~ c ~ t5 on-line ~ ~ u r ~ ~ ~ o n ~ g Q ~ n g and GO
i m ~ ~ ~ e n t e ~ only when the s y s t e ~ is found to be in a ~ ~ n e r a b ~ e state. It is r e c o ~ ~ s e d from [33] that transaction o ~ ~ - c ~ n t ~ ~ ~ e n c y c o ~ e c ~ i v e c a p a b ~ l ~ ~ will be
~ e l p ~ l f5r e l ~ ~ a t i n g c o ~ s ~ a i n ~ ~ o ~ a t ~ o ~ . Both ~ o ~ t - c o ~ ~ ~ n ~ ~ n c y ~ ~ ~ e c t ~ v ~ control md p r e ~ e n t ~ ~ e control are, therefo~, taken into accoun~ here.
The aim of the method is to m i n ~ ~ i s e dev~a~~ons from ~ a n s ~ ~ i ~ n s c h e ~ u ~ ~ ~ w h ~ ~ e tive and ~ ~ s t - c Q n ~ n g e ~ c y corrce;ctive for the case ofpre~entive c ~ ~ ~ o ~ i d ~ l e d ~ ~ ~ s a c ~ i o n is the most
es to enswe s~~~~ on the ~ s ~ u ~ ~ t ~ o n
c ~ ~ e ~ ~ ~ ~ $ control, the conisidertition is to reduce benefit loss of the ~ e v i o ~ $ ~ y s c l ~ e ~ ~ ~ ~ d ~ ~ s ~ c ~ i o n ~ when a ~ o ~ t ~ g e n c y o c c ~ .
C d
ion to the case where the may be out o f sus reschedu~~ng o f pool ~ ~ ~ r a t i ~ ~ and demand as well as bilateral transactions. A new nota~ion is i ~ ~ o d ~ ~ e d here.
der ~ i i ~ e ~ o ~ t ~ ~ e con ons and deals wi
ieNG !END i f N T
where QG,,
pool to ~ u s t o ~ e ~ sales ~ansact~on PDi md b~latera~ ~ ~ s a c ~ ~ o n PE, resp and NT are the total ~ ~ ~ b e ~ s of t r~~sac~ ions of the
pGi and pw are ~ a r ~ ~ ~ ~ prices of pool ~ ~ s a c t ~ ~ ~ § PGi
~ ~ ~ e ~ e ~ t s price i n f o ~ a t i ~ n in respect of bilateral transacti
and AFT{ we: ~ r e ~ e n ~ i ~ e c ~ a n ~ e s in ~ a ~ ~ ~ c ~ ~ o n .PG~
The Q~jec~ive ~ ~ c t i o n for the klh line-outage con~i~gency is taken to be:
ieNG ieND ieNT

the ~ ~ ~ c ~ $ pcj, p& armd pTi U1
s u b ~ i t ~ i f f e ~ e ~ ~ prices for n o ~ a ~ states and for con~ingen~ c o n ~ i ~ 5 n s depen aversion to occasional s h ~ ~ ~ ~ i m e in te~pt ions or c ~ a i ~ m e n t s .
ltiple o b ~ e c ~ ~ v e ~ ~ h e d ~ l ~ n ~ probliern is now f o ~ u l a t ~ as folfows:
Min F = WO .Fo f RER
(6.8)
where "0 is a weight attached to PO and satisfies
pdce at bus m (the calculation of pool price i s outside the scope of this c [233/); 2) pTj,n is set equal to pTj,m plus the ~ a n 5 ~ ~ § 5 i o ~ price of later^^ ~ ~ a c ~ ~ o n Pn ,
The prices p;f under ~on~ingency can be obtained in a simiiar way to pR .
~~~~~$~ ~reventive and pos~-c~n~ing~ncy G
onse~ation of power in the pool, A s s ~ ~ ~ ~ ~ g that only transact ide system regulation the associated generatQr bus can be ch to say, the slack bus power a ~ j u s ~ e n t must balance the c h ~ g e s in ~ e ~ ~ ~ ~ ~ o ~
and load power with due regard for ~ ~ s ~ i § s ~ Q ~ fosses. A linear pool power b a ~ ~ c e equ~tion in the or^^^ state can then be written as
where rGi, rDi and rn are sensitivities o ~ ~ a n s a c ~ ~ o n ~ PO, @. I), PDi and BTi with ~ ~ ~ ~ e c t
to slack bus power any ~ Q S ~ ~ ~ ~ ~ ~ contingency a d ~ i t i o n ~ ~ Ateratio
y ~ o s ~ ~ c o n ~ ~ e n c y co~e~t iQn§ the linear power b a ~ ~ c e equatiQ~ ~ n d e ~
in the n ~ ~ a ~ state.
~ ~ ~ ~ ~ n ~ ~ ~ c ~ can be witten as
w: The flow of power in a line c since c u ~ ~ r i ~ c a ~ o ~ be allo
limits, 0 2 1; I ~ I ~ , ~ ~ ~ z I E
The c h ~ ~ e ~ of line flow in the normal state ~ ~ u s t ~ ~ t ~ § ~
where sGj, sni and sTI are sensitivities of the c o ~ e ~ p o n d ~ ~ ~ ~ r a n s ~ ~ ~ ~ Q n § to the s q ~ ~ e of the c ~ ~ ~ e n ~ in line E in the normal state.
Transmission Open Access 5
Similarly, the changes of line flow under contingencies must satisfy

2 0 ~ Power System R e s ~ c t ~ n g and D ~ ~ ~ l a ~ i o n
as a h e out^^^^ could c a ~ s e generator§ to lose ~ ~ c ~ r ~ n ~ s ~ , then the o reventiive action to modify the operating state, Hence, d y n ~ ~ c se
resc~edu~ing in the context of both pool and lateral dispa~ch is also a very i ~ p o ~ a n t issue.
~ h ~ o ~ e the a~t ion which will not only ensure s~stem s ~ b ~ ~ ~ ~ e q ~ ~ ~ a ~ ~ ~ ~ ~ in an a~en-~~cess environ~ent. A ~ r ~ s i e n t ener described in this section. The TEF is a Lyapunov-like huncti
An erati tin^ state can be ~ ~ d ~ ~ e d in many ~~f ferent ways, and the operator
oint (UEP) €or a particular fault is the most c ~ t ~ ~ ~ ~ point on state spase of generator angles. The transient energy m ~ g i n (TE d i ~ ~ r e n ~ e between the ~ n § ~ ~ ~ t energy of the sys
~ ~ s ~ ~ n ~ of ~ ~ u ~ t c ~ ~ ~ ~ n g and its value at the ~ o n ~ r o l ~ ~ n ~ UEP, %e ~ o ~ e s ~ o ~ ~ d i n ~ to the find p~~~-disturbance system and t o ~ l o ~ , the t ran~~ent energy is less than the potential energy Cone the system possesses transient stability for the fault in que
The chief a ~ a c ~ i a n of a TEN method Is that it lends itself very ~onve~en t l y to a s e n s i t i ~ ~ ~ - b a s e ~ ~ ~ p r o ~ c ~ [34]. The sensitivities ~ ~ ~ r ~ a t e s ~ ~ ~ ~ ~ i ~ ~ ~ n c e are the c h ~ ~ ~ s af EM with r e s ~ e ~ t to ~ ~ d ~ v i d ~ ~ ~ ge~ ie~a ta~ ~ o w ~ r 0 ~ ~ ~ ~ . In the eve d i s ~ a t c ~ c o n ~ ~ u r a t ~ o ~ po§sesses d ~ ~ a ~ i c security riskscs, the most available to the IS0 is to ~ ~ d ~ § ~ a ~ ~ h generator power outputs so as ~ e ~ s i t ~ ~ ~ ~ ~ ~ f o ~ a ~ o n provi~es a clear signal of the most
he~e, The a ~ p ~ o ~ ~ d e s c ~ b e ~ here is to use the sensi pe in ~enera~ion from critical generators to non-c~tica~ genera to^.
-based methods we available, ine~~iding ethod [XI, the con~ol~ ing uns~b le equ
~ e t h ~ ~ s can be used to ~ o ~ p u t ~ the UEP, and thw EM and the s~~sitivities can be obtained then. A eth hod E39 c Q ~ § ~ a ~ ~ e d r~schedu l~n~ is resented next in which the ~ o s s ~ ~ s e § many ~ v ~ n ~ a ~ e s [40].

P,,,, = ~echanical power input Gii = dr~ving point c o n d u c ~ c e Ei I- consta~t v o l ~ ~ e behind direct axis transient reactance
MY, w y s = inertia constants of the critical generators and the rema~ni~g gene~a~ors,
= speed of inertial centres of the critical generators and the r e ~ ~ n i n g res~ective~y
generators, respectively, at the instant when the fault is cleare -cl -cl @cr ' m8ys
~ u p e r ~ c r i p ~ pr' stands for tbe values of variables in the final post-fault system confi~ration. The a p ~ r o x i ~ a t ~ contro~~ing unstable e q u i l i b r ~ ~ ~ point (8 ') is c a ~ ~ u ~ a t e d using a method which is used as s ~ r t i ~ ~ oint for solving the post-fault system equ ~e r i va t~on ofthese results can be found in [42$
where AEM = Eit4""" - EM'. The sign of qi-+j ~ n ~ ~ c a ~ e s the direction in which g e n ~ ~ ~ n is tar be s ~ ~ ~ e ~ to en~ance the EM. The m a g n i ~ ~ e of s e n s ~ t i ~ ~ c o ~ e ~ ~ o ~ d i n change in the ~eneration from the most a d v ~ c ~ critical generator to tbe least
ilical) ~ ~ ~ e ~ a t o r ~ will be high and, hence, the best c~ndidate for the ~ ~ c h e d u ~ ~ ~ l g . er ~ ~ ~ e ~ t i a n of the ~r i t i ca~ and ~on~cr~ t ica i ~enerators ~ ~ o u l d be set as


Transmission O ~ ~ n Access -
a, b,
c. d.
e.
f.
gm
~ h o o s e ;a contingency from the given set. btain the optima^ dispatch using equation (6.2) (enskng post-fault system static
of this p ~ o b l e ~ ) . corre§~onding EM (eq~ation (6.23)).
If EM is positive, then go to step a and select the next con~ inge~c~ . If go to step e.
ute the n u m e ~ ~ a l sens~t;vities, qiY9 for the set of system g di§cussed above. For computation of new energy margin for ch g e n e ~ t ~ o n from ~enerator i toj, the base loading 6r has been used to get the new UEP co~espondin~ to the change in the gen~ation. It is fa
rbatiQn in power gives the best result. the sens~~~vities by m ~ k e t price als; c o ~ p u t e the c o n s ~ ~ n t s on
~en~ratQrs; red~spatc~ the ~ ~ n e r a t o ~ s in pairs a If all critical contin encies we tested, then stop, Otherwise: go to step a.
~ e ~ i l e d nu~erical s ~ d i ~ § reveal that:
f cr~~ica~non-cr i~cal generator buses is reduce~ in~ rease~ s i g n ; ~ c ~ ~ l y
~ y n a m ~ ~ sec~rity incre~ses spot prices at the buyer’s bus but the ~ncre~se i s not
e p r e s ~ c e of b~latera~ contracts er increases the spot prices at the
systems become more 11 entail a more comple S S U ~ S in relation to con than discus§ed s
d price e i a s ~ i c ~ ~ issue [23,2
oraneo~s price but also ral price depend~~ce of
ory and is central to pool d~s~atch. The fo of elasticity are ~ ~ ~ o d u c e ~ :
the conve:ntio~~~ price elasticity o f demand and
e ~ ~ s ~ ~ c i ~ of d ~ m a n ~ . The a~~ i t i on ;a~ subsc~pt j on e 2

10 Power System Resestructuring and
elasticity and the pool demand, denotes each p ~ c h a s ~ ~ sepa~ately~ p t is an e ~ e m e ~ ~ o f a me-dependent price vector p (for e x ~ ~ ~ ~ e 24 ~0~~~ pod pr i c~ ) .
The fol low~n~ ~ u ~ ~ ~ T u c k e r conditions can be d e ~ ~ e ~ from the pool
where: C md C me ~ r ~ d ~ c ~ ~ offer price and power sets of matrices of dual variables, at: time b, on the set of
respect~ve~y, as Ic
t r - Eet r., -3 G$ r.2 )* * 9 et,, I
where J i s the n ~ ~ ~ e r of pool loads (load busbars). The ~~spatch ~ r o ~ ~ d u r e would begin with a fore~asE of the d~y ’s prices, say a% half-
h~~~~~ ~ n ~ ~ ~ a ~ ~ , and the c ~ ~ ~ § ~ o ~ d ~ ~ expecte~ set of ~~~~d ~ e c t o ~ . The s ~ ~ ~ t ~ ~ n of the lem as well as (6.25) will provide an a I t ~ ~ a ~ i v e set of rchatxaser expec~tio~s, If these match the m i s solved. Tf they do nrot, the exp
~ Q ~ i ~ ~ ~ using the eia§t~~~ties in (6.24) and the p ~ c ~ ~ e v i a t ~ o ~ § ain. The p ~ o c e ~ ~ ~ e is repeated till c~nver~ence o b ~ ~ i ~ ~ ~
p r ~ ~ ~ d ~ K r e are ~ r o ~ i ~ e ~ in [23].

Transmission Open Access 1
~~~~~~ under a normal cQndi~~on is d e ~ e ~ i ~ ~ d by defini a La~rangian A and fin its derivativ~ with res ect Eo all the v ~ a b l e s :


is the matrix whose elements are s e n s ~ ~ ~ v ~ ~ refations ~ e ~ e e n and when ~ ~ ~ 3 8 ~ r ~ ~ ~ ~ n §
where the e ~ e ~ ~ ~ t s of vector d ~ p ~ n d on the state A. Inequ AT as^^ at state
e for a set o f i n c r e ~ e n ~ ~ ~ transactions A , this also satis~es
~ ~ . 3 ~ ~ er than or eqml to zero, whose values dition that an ~ d ~ t i o ~ ~ ~ ~ ~ s ~ ~ t ~ ~ i i set
nce E257 ~~~~~ an
subset o€ Z ( A ) of constraints in state A, w ich are on limit, If
for the next interval, is in a feasible d i ~ e c t ~ ~ n . ~ ~ ~ v ~ t ~ o ~ and ~ e € ~ ~ ~ ~ c ~ [QJ the ~ n i ~ ~ a ~ linear
(6%)
The e ~ a ~ ~ ~ I e ~ ~ s t e ~ e ~ ~ s ~ d e r e ~ here is &-ke same as Figure 6.9 line 2-3 now has its square o f the ~~ansact~on set shown as ~ ~ x e d + A d ~ i t
W at bus 5 is Genco at bus 3, for c o ~ ~ ~ r c ~ a l reasons, is ~ e s ~ Q ~ s i b l e for sup ~ e ~ r e s e ~ ~ e d by ~ansaction TA (78 MW initially fiom bus 3 to 5),
atch. How ~ o o ~ ~ n a t ~ o n ~ e ~ ~ ~ n ~ a r ~ ~ t p a ~ ~ ~ ~

Power System ~ ~ s ~ c ~ i n ~ ;;and Dere
s ~ ~ ~ ~ ~ c ~ t l y a ~ e c ~ ~ i s ~ a ~ c h is now i ~ ~ u s ~ a ~ e d . The e x ~ s ~ ~ n ~ pool ~ e ~ a n and the ~ i ~ a ~ e r a ~ ~ansaction fkom 3 to 4 are given oricy in the fWo they are ~ s ~ u ~ ~ ~ to have ~ b ~ i n e ~ prior ~ o ~ i ~ ~ ~ ~ from the ISO.
us 3 Genco s u ~ ~ ~ ~ e s the ~ d i t ~ ~ n a ~ er TA alone md only bus I i s
~ ~ ~ i n ~ l ~ ~ r e ~ ~ s p a ~ c h e ~ to make up the ~ ~ s ~ ~ ~ s ~ o n losses c ~ ~ s e ~ by the d 3 ~ e n c o ~ v ~ t e $ bus 2 Genco to join in the ~ran§~ction r making good extra lasses.
~ e n ~ ~ is w ~ ~ ~ ~ n g not only to ~ o o ~ d ~ n ~ t e w pool ~ ~ ~ s a c ~ ~ o n s ~ ~ o u g h the ISO.
s 2 ~ e ~ c o but dso to
ispatch results of cases 1-3 are given in Table 6.2, Case 1 is the *nom- ase md new ~ ~ s a c ~ ~ o ~ ~ T", which i s ~ i i a ~ e r a ~ ( f r Q ~ bus 3 tdlt 5) in
is h ~ ~ ~ y c u ~ ~ ~ ~ e ~ . Case 2 shows coQ~dinat~o~ witbin ~ ~ s ~ ~ t i o ~ Td, w~~~~ ~ o w ~ u l t i l a ~ ~ r a l since both t r a ~ 3 and 2 supply the ex s ~ n s i t ~ v ~ ~ of line 2-3 with respect to the ~ a ~ s f e r from the ~ e ~ $ i ~ i ~ ~ ~ with r e ~ p e c ~ to the ~ s ~ e r EFom 3 to 5 is ~ ~ ~ o ~ ~ ~ e some ~oor~na t ion ( e q u a ~ ~ Q ~ (6.38)) where both ~ a n s f e ~ we
case I, not only is the ~ ~ s ~ e r f?om 3 to 5 ~ u ~ ~ ~ ~ d less in cme
s 5. Since the l o a d ~ ~ g
transfer is s a ~ i s ~ e d in fbll. That is, ~ansacE~on TA is c o r n p ~ ~ ~ e ~ y
of c ~ ~ r ~ i n a t i ~ n is i l l ~ s ~ a t e ~ in case 3. hen the a d d ~ ~ ~ ~ ~ a ~ 70 -5 is ~0~~ to be close to i ts c a ~ ~ c i
a s i ~ ~ the ~ a n s f e ~ s eref fore inore expensive power at bus I can be s h ~ ~ e d to bus 2 ~ h ~ ~ e ~ to bus 2, the less the ~ o a ~ i n ~ of pro bus 3 ~ e n c o i s to p ~ o ~ i ~ ~ a smaller share
a i l~en t to ~an§ac~ion TA, Overall ~ e ~ e ~ ~ s are improve^.
Tramxtion Fixed+ Case 1 Case 2 GaEe 3
~ d d ~ ~ i o ~ a ~
Poo1 gen. at bus1 38.8 39.8 t 40,6 t 29.2 Pool gen. at bus2 75.0 75.0 75.0 146.8 f
001 demand at bus4 100.0 ~00.0 100.0 ~00.0
10.0 10.0 10.0 10.0
~ i i a t ~ r a l from 3 to 4 80.0 80.0 80-0 80.0
~~~~~ from 3 to 5 70.0 38.1 47.3 49.0
Lateral from 2 to 5 "" 22.7 2n.o P 1
-- No data
apprQaches towards ~ ~ s m i s s i o n system operation in power ~ ~ r k e t s w ~ r ~ ~ n g in an opea

skied ~ u u ~ d i ~ ~ ~ ~ ~ ~ Prmedikre
price ~ ~ ~ s t ~ c ~ ~ issue d i§cu~~e ~ i ~ a ~ t s are ~er~ec t ly rational
Section 6.8.1 i s based on the ass able to respond prope~~y and ~ o w e v e ~ , d e m ~ ~ elastic~~~e$ of c ~ s t o ~ c r s
range from h ~ ~ h ~ y elastic to h ~ ~ h l y ~ e ~ ~ ~ ~ ~ c . ~ ~ s ~ o m e r s with high elastic~~~es will b s e ~ s i ~ ~ ~ to power prices while to tom er^ who are more ~ n ~ ~ a s t i ~ will be inert to prices and fail to react in time.
~ r a n § a ~ . t ~ ~ ~ ~Qord~na i i~n as d e ~ a n s ~ a t e d & Q V ~ explores an a ~ t e ~ a t ~ v e a p ~ r o ~ c ~ ~ to ameliorate c o ~ g e s ~ o n and provides useful ~ u i d e l ~ n e ~ for market pa~ic~pants to n ~ ~ ~ ~ ~ a t ~ puwer e x c h ~ n ~ e s that avoid ~ ~ n ~ e s t i o ~ and learn to d e ~ e n ~ on geo h ~ c a ~ ~ ~ d ~ ~ ~ ~ s i ~ e ~ ~~~~r s u ~ ~ l y (and d ~ m ~ n d ~ ~ o ~ f o ~ ~ o § ~ ~ ~ t ~ a d .
An ~ n ~ ~ ~ a ~ e ~ ~ o n g e s ~ ~ ~ m ~ a g e r n ~ ~ ~ ~ ~ o c e d ~ ~ [45] as $ ~ o ~ in ~i~~ orates the ~bove two issues into the wi i l~ngnes$~to-~a~ ~ ~ $ ~ a t c h ate
describe^.
~ # ~ i ~ e s ~ ~ o n ~0~~~ t ~ ~ e ~ t i o n by the IS R
e U
arket response
~ ~ r ~ ~ n a ~ ~ o ~ procedure for congestion relief
sent a short time ~ e ~ ~ o d ~ which i s divided in e ~ E ~ ~ ~ ~ ~ $ need not be equal to each
~ y s t e ~ e er at ion conge§~ion is found i n ~ o ~ ~ a i i o n , which may op~ra t i n~ status i n ~ l u ~ ~ n
(6.7) during i n t e ~ a l
procedure must iterate in the whole ~ansi~ission operation time ~omain.
rig~ts, which are defined in a airwise manner l46] or as rights on i n ~ i v i ~ ~ a l lines t47J. This in tegrat~~ co~rd~na~ion procedure can be seen as a practical a l iemat~~e to c a ~ ~ ~ i ~

e s ~ c ~ r ~ ~ of the power in& last two decades and up to now about 20 countries have r e s ~ c ~ r e d their systems and
others are ac~~vely p~su ing similar paths. One of the mo c~~~~ efforts is the t r ~ s ~ ~ s ~ ~ o ~ open access and this has
Firstly, this chapte~ d ~ s ~ ~ b e $ ~ h a r ~ ~ t e ~ $ ~ ~ ~ s of Uie ~ ~ d ~ ~ o ~ ~ ~ c ~ a p ~ ~ ~ ,
and the necessity of open ~ ~ ~ ~ i s s ~ o ~ access to f a ~ ~ ~ ~ t ~ t e , a s~~~~ disc~ssion of e l e c ~ i c ~ ~ market s ~ c t ~ ~ e ~ and asso
c ~ ~ p ~ ~ ~ e ~ ~ s has been provided. The fiinc~ion~ and r e s ~ ~ n s i b ~ ~ i ~ ~ ~ rns have been d ~ s c ~ i ~ e ~ and disc sion open ~ c ~ e s s , i,e. costs of ~ ~ ~ s r n i s s ~ o n ~ ~ e ~ ~ n ~ e ~ briefly. ~ ~ n ~ l l ~ ~ this c nal issues in the e ~ e ~ ~ ~ g raz ment and effects of security c o n s ~ d ~ ~ a t i ~ ~ s o
h ~ ~ e all been isc cussed from the o~e~-access v i e w ~ o ~ ~ ~ , and of this chapt~r~ Most of the discussion is based

T~nsmission Open Access 17
80.0 IO.OCI,L,, 20.0
Bilateral Transfer Delivery ~ i l ~ ~ n g n e ~ (w) Contract MW Price $k $/MW 2h
T 100.0 4.WF .3 80.0
I 1.02 _ _ 2 1-04 _- 3 1 .OS -- 4 ** 20.0
4 ** 20.0
** Voltages are kept within the range of0.95-f.05. -“ No data

21 Power System ~ e s ~ c ~ r i n ~ and Dere~Ia~ ion
Transmission Open Access 239
. David and R.S. Pang, ‘ S e c u ~ ~ ” ~ a s e d r~cheduling o € ~ r ~ ~ a c ~ i o n s in a d ~ r e ~ l a ~ ~ d pQwer system’, IEE Proceedings - Generstion, Transmission and Distribution, Vol. 146> No. 1, January 1999, pp.13-18, J.G. ~a~tenbach and L.P. Hajdu, ‘Q t i i a l corrective re-scheduling for power system security’, r E E ~ Trsnsac#~ons on Power ~ p ~ a r a r ~ and ~ y ~ ~ e ~ s ~ Vol~PAS-~, No.2, 1971, pp ,$~3-a~ 1. A. T ~ ~ ~ k a c ~ l a m an Tudor, ‘ ~ p ~ ~ ~ ~ 1 r e s c ~ ~ d ~ ~ ~ n g of power for s y ~ ~ e ~ ~ ~ ~ a ~ j l ~ ~ * , IEEE ~ra~sac~~oFis on ~ ~ ~ a r a ~ s undsvs~ems, Vol.PAS 71, 1971, pp.2~86-2~92. A. Monticelli, M.V.F, Pcreira and S. Granville, ‘ S e c u r i ~ ” ~ o n s ~ ~ n ~ d optimal power flow with post-con~~n~ency co~ective reschedu~ing~, IEEE TrQ~#c~ ions on Power Sy~~ems, V01.2, No, 1, February 1987, pp.175-182.
Davivid and R.S. Fang, ~ ~ i ~ ~ c a n $ operational issues in open access ~ y s ~ ~ s ’ , ~ ~ ~ ~ a ~ ~ a ~ srch C o ~ n ~ ~ ~ hop, paper ~resen~ed at U n i ~ e r s ~ ~ o f ~ e s t e ~ A ~ s ~ l ~ a ~ Jufy ~ 9 9 ~ .
M, Kakimoto, Y. Ohsawa and M. Hayasbi, ‘Transient stability anal~sis of electric power Lyapunov hnction, Part I and 11’, IEE Japan, VoI.98, 1978, pp.62-79. re and S. Virmani, ‘A practical ~e~~~ of direct analysis o f ~ransient
stab^^^^', iEEE Tram. on Power ~ p p a r s ~ ~ s and Systems, Vo1.98, 1979, ~ ~ . 5 7 ~ ~ 5 $ 4 . Y. Xue, T.V. GuEsen and M. Pavella, ‘Reai time analytic s ~ ~ s ~ ~ ~ v ~ t y i t ~ e ~ ~ o d for sec^^^ a ~ s e s s i ~ e ~ t and ~r~vent ive control’, IEE P ~ o c e e ~ i ~ g , Part @, Vol. 135,No.2, I H.D, Chiang, F.F. Wu and P.P. Varaiya, ‘Foundations of direct methods of power $ y $ ~ ~ ~ ~ ~ a ~ i ~ ~ ~ analysis’, ZEEE Transffctions on Circuits and Systems, Vu1.34, No.2, 1987. S.N. S~ngh and A.K. David, ‘Dynamic security constrained congestion ~ a ~ a g c ~ e n t in c o m ~ ~ ~ ~ v ~ ~ ~ e c ~ ~ i € ~ ~ ~ r ~ e ~ ’ ~ Proceedings af the IEEE PES ZOO0 ~~~~e~ ~~~~~~~~
S~ngapore, January 2000,
Thesis, Hong Kong Polytechnic University, 1995. B.M. Anderson and A.A. Fouad, Power System Control and ~ t u ~ ~ ~ ~ ~ , Iowa State ~ n i v e r s i ~ Press, 1977. P.W. Sauer md MA. Pai, POMW ~ y s g e ~ ~ y n a ~ ~ ~ and ~ ~ u b ~ ~ ~ ~ , Prentice Hall, Mew Jersey, 1998. S. Sterling, &LA, Pai and P.W. Sauer, ‘A ~ e t h o d o l o ~ of secure and 0 ~ ~ ~ ~ 1 opera~on of a power system for dynamic contingencies’, Electric Machines and Power Systems, Vol. 19,
H. ~ l a ~ ~ ~ ~ ~ and F. Alvarado, ~ ~ a n a ~ e ~ e n ~ of ~ u ~ ~ p ~ ~ c~ng~sred c o n d i ~ ~ ~ n ~ in ~ ~ ~ n d ~ e d ration of a power system’, IEEE ~ ~ u n s a c t ~ o ~ 5n Power ~ y s ~ e ~ ~ Vo1.13, No.3, ~ ~ ~ s t 2998, p p . ~ ~ ~ ~ - ~ O 1 9 .
.S. Fang and A.K. David, ‘&I i ~ ~ e ~ a t ~ congestion manage men^ strategy for real-time system operation’, IEEE Power ~ n g i n e e r ~ ~ g Review, Vo1.19, No.5, May 1999, pp.52-54. W,W, Nogan, ‘~on~rac t networks for electric power ~ ~ ~ s s i o i ~ ’ ~ J o ~ ~ a ~ of ~ e ~ ~ ~ ~ ~ o ~
.P. Chao aid S.G. Peck, ‘A market m ~ h a n i s ~ for electsic power ~ ~ ~ ~ ~ i s s i o ~ ~ , J o ~ ~ f f ~ of
, On-line A l g o ~ ~ s for Transient S~ability assess men^ and Security Control, P
1991, p~.639”6~5.
~ ~ o ~ ~ ~ ~ ~ s , V01.4, 1992, p@f1-242,
La8~0ry ECOPZOP~~CS, Vol. 10, 1996, pp.25-59.
XYan ~ i a o T o n ~ U ~ ~ v e r s i ~ China
Dr Loi Lei Lai City Universi~ Lon UK
Since China ~ n ~ ~ ~ a ~ e ~ its first e c o n o ~ ~ c r e ~ o ~ s in jate 1978, e ~ e ~ ~ ~ c o ~ s u ~ ~ ~ ~ o ~ has oss don~e$~ic ~ r ~ d ~ c t e ~ e r ~ y c o ~ s ~ ~ ~ ~ ~ n prices have p ~ ~ y e ~ ears or so. Before thaf strict but e ~ f ~ c ~ ~ ~ ~
h e l ~ e ~ hold ~ n e ~ ~ y d e ~ ~ ~ d in check, and until r e ~ ~ t ~ y , e l e c ~ ~ i ~ s h o ~ ~ e s
~ e n ~ r ~ ~ planing has matured, economic forces are I rion. Now that the market larg~ly de te~ ines ~e~~ price
~ ~ ~ c e ~ with a ~ o ~ ~ i ~ i a ~ ~ o n o f grants and s u ~ s ~ d ~ s e from provincial and local utilities. In 1985, the
d to set tariffs to recover inve ed ~ o ~ s i ~ ~ ~ a ~ l ~ a c ~ s s ~ r o v ~ ~ c
e s ~ ~ ~ ~ ~ s h e ~ new policies to c r ~ ~ t e a
in the power sector d u ~ n g the late 1 ~ 9 ~ s . Power ~ ~ r c ~ a ~ ~ a ~ r e e ~ ~ ~ ~ s , w ~ i c ~ define how ~ u c ~ p
er plant, are not being ~ o ~ o u r e ~ . ~ ~ ~ c ~ c ~

cording to ~ a r g i n a ~ cost; that is, old plants usually sell the most power sin ady paid off their c ~ p ~ ~ ~ casts and need to cover only fuel,
ent of ~ h i ~ a ’ ~ electric power i n ~ u s ~ has gone t ~ o u g h a ~ e r y that is, the power i n d u s ~ is gradua~ly c et economy c h ~ a c ~ e ~ s t i c § and the
i s also ~ h a ~ ~ n ~ from the stle side as the r~~~~ of the electric power ~ n d u s ~ goes on, the de
ectriciy sector i s cha~ging a great ~ v ~ ~ o p ~ ~ n t of China’s electric
will have a great in~uence 01p the f u ~ r e
in effect and the e a v ~ o ~ ~ e ~ ~ ~ ~ costs of energy use are not yet even p ~ i a l l y d for. These factors must ricing s c ~ ~ m ~ ~ to promote the s~~$~a~nab le use of energy 13-61.
tran§pare~cy and legal r ~ ~ ~ u ~ e will e n s ~ e that c o ~ ~ a c ~ s are: h ~ n o ~ ~ ~ d , g is s ~ ~ a i ~ ~ s e d ~ and the de~i§~oa-mar~ing a u ~ o ~ ~ is clear.
e c o ~ o ~ i c cost of pollutio~ needs to be con§i~ered so that true ‘kast 60
made. China’s e c a n ~ ~ i c e f ~ ~ i e n c y and e~vironmental quality ~epend on ~ ~ ~ o ~ s .
The ~ l ~ c ~ c ~ o w ~ r ~ ~ d ~ ~ § t ~ in ~ h ~ n a has alread~ gone ~ h ~ ~ ~ g ~ a t a ~ y c past ~ e ~ ~ d e . At ~ r e ~ ~ t , its ~ a n s i t ~ o ~ under way. On 16th ~~~~ 19 s e m ~ ~ ~ u ~ ~ n ~ ~ ~ ~ ~ State ~ o ~ e ~ C
a p l a ~ ~ ~ ~ c o n o ~ y to n of Electric Power w e r e s ~ o n s ~ ~ ~ ~ i t i e s w search. ~ i K e grid man
reale a m ~ ~ e ~ %hat will
Power ~ o ~ o r a ~ ~ o n (SP) m ~ ~ e ~ the r ~ ~ ~ ~ ~ ~ ~ o ~ of e n ~ ~ e cred~tab~e service a
The ~ s t a b ~ ~ $ ~ ~ e n t of ard bgal r ~ ~ ~ t s of ~ n v e s t ~ ~ ~
er i n ~ u s ~ as it entered a new stage [7-161, Pilot bi ~ u n ~ c i p a l i ~ ~ ~ ~ e ~ i a n ~ ~ h a ~ d o n ~ ~ r o v ~ n c ~ s and, s in ~~~~, and thea ~ a ~ i o n ~ ~ e by 2005. An
and order1~ ~ e n e r a t ~ g m ~ ~ e t will be full ~ o ~ ~ e s h ~ d r o power plant will allow a wi
The reform of China’s e l e c ~ ~ ~ powe of r e f o ~ and a satooth
e ~ e c ~ c ~ Q W ~ ~ i ~ d u § ~ o economy presents problems that demand further exploration and confro~ta~ion; many
s ~ e ~ a ~ ~ to be sa~s~actorily reso~ved~ from basic theory to ~ o n ~ ~ ~ ~ e ~ r a c ~ i ~ a ~
This c h a ~ t ~ will ~ ~ ~ o d u c ~ the and ~ a ~ a g e m ~ t system of plan. The prob le~s and obstac of e l ~ c ~ c ~ ~ ~ ~ c ~ n g and
~ e v ~ r a ~ case $ t ~ ~ ~ e s

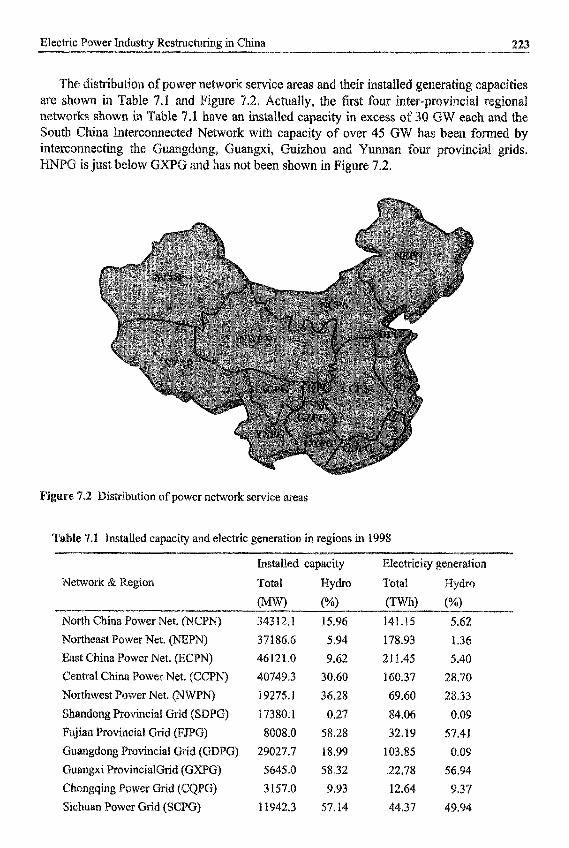
Electric Power Industry ~ e s ~ c ~ n n g in China
The ~ ~ s ~ i ~ u ~ o n of power network service areas and their installed g e ~ ~ r a ~ ~ e 7.2. A c ~ a ~ l y , the f i t four ~ ~ t e r ~ ~ ~ o ~ i n c are shown in Table 7.1 and
shown in Table 7.1 ina I n ~ e r c ~ n ~ e c ~ e ~ Nefwork with capacity of over 45 GW has be
an ins~a~led capacity in excess of 30 CW e
i n ~ e r c o ~ e c t ~ ~ the ~~~~~
HNPG is just below ~~~~ and has not been shown in Figure 7.2. uangxi, Gu~zhou and Y u ~ ~ n four
~is€ribution of power network sewice areas
Installed capacity Electricity ~ e n ~ r ~ ~ ~ o n
(m) 4"w (TWh) (%)
Network &c ~ e ~ i o n Total Hydro Total
North China Power Net. (NCPN) 34312.1 15.96 141.15 5.62
Northeast Power Net. ("JEPN) 37186.6 5.94 178.93 1.36 East China Power Net. (EC 46121.0 9.62 211.45 5.40 Central China Power Net. (CCPN) 40749.3 30.60 160.37 28.70
~ ~ ~ n d o n g Provincial Grid (SDPC) 17380.1 0.27 84.06 0.09
Northwest Power Net. (NWPN) 19275.1 36.28 69.60 28.33
Fujian Provincial Grid (PJPG) 8008.0 58.28 32.19 57.41 ~ ~ a n g d o n ~ Provincial G) 29027.7 18.99 103.85 0.09 Guangxi P r o ~ ~ n c i a i G ~ 5645.0 58.32 22.78 56.94
Chongqing Power Grid (CQPG) 315'7.0 9.93 12.64 9.37 S ~ ~ h u a n Power Grid (SCPG) 11942.3 57.14 44.37 49.94

2
Year Society Share o f ~ n d u s ~ (%) SIiare Share of Share of Share of tot& Of ~ ~ s ~ ~ r ~ ~ ~ ~ ~ c i p ~ ~ urban k;C, nual
~ ~ ~ ~ ~ 1 ” tation etc. c ~ ~ ~ r c e ~ ~ s ~ ~ ~ ~ ~ a ~
C%) ~~~) ~ h ~ l ~ Heavy Light ture @.$) <%I ~ o ~ s ~ ~ o ~ ~
I987 49Q,27 8f.Q 64.5 16.5 7.1 1.6 4.8 5.5 1988 535.87 80.3 64.1 16.2 7.0 1.6 5.1 6.0 1989 576.20 79.8 64.0 15.8 7.0 1.7 5.1 6.4 1990 6 ~ ~ . 6 0 78.7 62.6 16.1 6.8 I .7 5.3 7.5 1991 669.63 77.8 61.8 16.0 6 3 I .7 5.6 7.9 1992 745.54 77.1 61.2 15.9 6.8 1.8 5.8 8.5 1993 820.11 76.7 61.2 15.5 6.3 1.8 6.3 8.9 1994 904.65 75.4 60.3 15.1 6.3 1.9 6 3 9.7 1995 988.64 74.8 59.8 15.0 6.2 1.8 6.9 10.2 1996 i0~7.03 74.1 59.3 14.8 6.1 1.9 7.2 10.7 1997 1103.91 73.0 58.3 14.6 6 2 1.9 7.6 1 1 3 1993 1134.73 72.0 58.0 14.0 4.0 2.0 10.0 12.0

Municipal and Coinrnercial
10%
Chemical Products
\Heavy ~~u~~~ 58%
10% Coal Others

an ~ x ~ ~ ~ ~ ~ y large ~ ~ ~ e - o ~ r ~ e ~ e ~ ~ ~ ~ s e , has assets of x 8 . 2 ~ i ~ ~ ~ o n t role in the fbture ~ e v e l o p ~ e n ~ of ~hina’s ~ o w e r in
ng and ~ a ~ a g i n g its assets well or not. In two y e w 9 pract~ce md e SP has set its deveiopment objective o f creating a ~ r s ~ ~ ~ l a ~ s e ~ t e ~ r ~ s e in
the wor~d in terns of ho~d~ng stock and g r o ~ ~ rn agement, and this is a ~~~e~ de~elopment of the policy of ~ o ~ o ~ t i s e d r ~ s ~ c ~ ~ g ~ ~ ~ g a l i § ~ d ~~a~~~ Thus, the SP has made a strategic §~~~~ for fhe fiime d~velo~ment of ~ h i n a ~ s electric ~ o w e r in
(1) The Erst step, from January 1997 to ~~~~ 1998
~ s ~ ~ ~ ~ s ~ i n ~ the SP and the d i s ~ ~ n ~ l i n g the ini is^ of Ekctr transfer of government functions and p~ofessiona1 ~ a n a g e ~ e n t c o ~ ~ ~ r u c t i ~ g a new ~ e c i s ~ o ~ ~ ~ ~ a k ~ ~ g system ~ ~ ~ e w o ~ k in c o m ~ l ~ a n ~ with a ~ o c i a l ~ s ~ m ~ r ~ e t ~ c o ~ ~ ~ n ~ y ;
(2) The second step, from 1998 to ~ 0 0 0
Insisting on the policy of separating the gov etions and taking the ~~ov inces as entities
~ o ~ p l ~ ~ ~ n g the ~ e s ~ c ~ ~ n ~ in the SP system; the genera~o~¶ rn
) The fourth step, after 2010
Upon the es~~b~ishment of the SP, the ~ n c t i o n ~ of m i n g the s ~ ~ e ~ ~ ~ ise ~ a ~ a g e m e ~ t formerly ~ ~ d e ~ k e n by
SP. It ~ o $ s ~ s s e ~ no ~ o v e ~ ~ e n s u p e ~ ~ i ~ i o n from related gov
its ~ n a ~ c ~ ~ budget is a~located directly from n The ~ r g a n ~ ~ ~ t ~ o n is shorn in Figure 7.4 belo
, n a ~ e l y ~ o ~ h e a s ~ , North China a Power ~ ~ o u p and ~ o ~ h w ~ s t
Gs5up and Gezhouba ~ n ~ ~ n ~ e r i n ~ Group, as w d s u ~ s i ~ i ~ ~ e s o
~ ~ e ~ ~ c Power J u i n ~ - ~ e ~ ~ r ~ ~ o ~ o r a t i o ~ , w h ~ ~ h are all exclusive~y owned s ~ ~ s i d i a r i e ~

Electric Power Industry Restructuring in China 1
under the SPC. C o ~ s t ~ c t i o n Troops (also as Anneng Corp.), belong to the SP’s ~ ~ a g e m e n t . Other c o m p ~ i ~ ~ under the ~ i ~ ~ ~ s ~ of Electric Power are the SP’s wholly ow s~bsidiari~s, holding or jointly shared companies according to their property n s ~ c ~ r e s . These cQrporatiQns and ins~i~tions under the SP include the fol~Qwing:
ese state~owne~ assets, held by the Armed Police Hy
China ~uadian Power Plant En~~neering General Corp.
L Q n ~ ~ a n Electric Power Group Corp. ~ h o n ~ e n g Power Tech. ~evelopment Co. Ltd China Fllecbnc Power Trust & Investment Co. Ltd China ~ ~ e c ~ i c Power Technology Import & Export Corp. China Fulin Wind Energy ~ e v ~ l o p ~ e n t Corp. China Power Investment Co. Led China Power Investment Holding Corp.
National E1ectrh.i~ Power China Extra High Voltage Trans, & ~~bsta t ion Construction Corp.
lectric Power Fuel Corp. Other e n t e ~ ~ s ~ s under the m a n a g e ~ e ~ ~ of the SP.
8 China Anneng Construction Corp.
(I ~ h o n g ~ ~ n g Electric Power Industry ~evelopment Corp.
Engi~eer in~ Institute ing & Design General Institute
Natio~al Power Control Centre of China China Electric Power Information Centre Electric Power Research Institute Thermal Power Research Institute Najing Au~o~a t ion Research Institute Wuhan High Voltage Research Institute
* North China Electric Power University China Electric Power News China Electric Power Press

22 Power System ~ e ~ ~ ~ c t u r i f l ~ and ~ e ~ ~ ~ M l a t i o f l
The op~ra~iona~ and manager~al functions of the SPC niainly include:
~ u n n ~ n g the e x ~ l u s ~ v e ~ ~ owrted subsidia~ compan~es and Ehe h ~ l ~ i n ~ or j o ~ n t ~ ~ § h a ~ d ~ o ~ p a ~ i e ~ and the sia~~"owned stock r ~ ~ h ~ s in their a f~ l ia~ed units ~ ~ ~ s u a ~ ~ to state law, ~ ~ g u l a t ~ o n ~ policy and s ~ t ~ ~ y . ~a is ing funds within the financing scope approved by the state to finance and invest in power projects and related enterprises; the income from investment and assets property transfer will be used for capital reinvestment ~ u ~ u a n ~ to the regulation; taking charge of national power network int~~connect~ons. Running and managing the large power stations connected to regional i ~ e ~ o r k s or t r a n s ~ ~ t ~ ~ ~ g butk power across regions and the necess8~ peak~ng and f r ~ u ~ n ~ y r e ~ u ~ a ~ i n g power stations. plan^^^^^ and ~ ~ s p a t c ~ ~ € ~ ~ the ~ a ~ ~ ~ ~ a ~ power network supe~~s ing safe, stable, e~onom~c and h ~ g ~ ~ ~ u a i ~ t y o ~ e r a ~ ~ o n oft alf ~ o w ~ ~ ~ ~ ~ ~ r ~ s in the cormtry. ~ x e r c ~ ~ i n g power n e ~ o r ~ d~s~a tch~ng m~nagemen~ on the na~iona~ power network and the related generation, ~ a n s m ~ s s ~ o n and ~ i s t r i b u ~ o ~ e n ~ e ~ ~ ~ ~ s e s based on the ~egula~ion of Power System ~~spatc l~ ing .
The restructuring within the SP, separating generation from transmission and dis~ribution, promoting the na~ionwide power network interconnec~ion and speeding up rural power ~ns t~~ t iona l reform are the current focuses of electric power industry r e f o ~ and are listed as foflows:
(1) To ~ ~ o ~ a ~ ~ s ~ the r ~ ~ a ~ i ~ n ~ h ~ ~ ~~0~~ c ~ r n ~ a n ~ ~ s of d i ~ e r e ~ ~ ievels in the In ~ ~ c ~ ~ d 8 n ~ e with the r e ¶ u ~ ~ ~ e ~ ~ s of s e ~ ~ n g up a mode~ised e n ~ e ~ ~ s e ~ ~ s ~ ~ ~ , the 5P is
g a m u ~ ~ ~ - l ~ v e ~ e ~ ~ ~ ~ r i s ~ / ~ ~ ~ a ~ entity ~ a n a ~ e ~ e n ~ system. The r ~ ~ a t i o n ~ ~ ~ ~ and its s ~ b ~ i d ~ a ~ ~ is an equal. one in law among ~ n ~ ~ p e n d e n ~ persons, and it
is a capital link ~ e ~ a ~ ~ o n s h i p in property between the investor and the e~ i te~ r i se invested. The pilot project was ~ ~ i i ~ ~ a t e d by the Northeast Power Group Company WPGC). The NPGC was ~ e ~ r g a n ~ s e d 8s an af~li8ted entity of the SE", being an agency of the SP in Northeast China. The three provincial power c o ~ p 8 n ~ e s In Liao~ing, Jilm and Heilongjiang provinces, formerly affiliated to the NPGC were reorganised as companies with ~ n ~ e p e ~ d e n ~ legal qual~~cation, having c ~ ~ p ~ e ~ e ~ e ~ ~ ~ ~ n n i n ~ rights. The basic p ~ n c i ~ ~ e for r e o r ~ a ~ ~ ~ s i n ~ is to set up one p r o ~ c ~ a ~ power c o ~ p ~ n y for edc
its r ~ s p ~ n s j b i l i ~ i s to ~ ~ p l ~ r n e ~ t the ~~~~~~ and ~ ~ a ~ ~ ~ ~ n t o we^ ne two~~ . The a ~ m ~ n i § ~ ~ a t ~ v e ~ n c t ~ ~ n ~ ferred to the s m~~agement d e p a ~ e n ~ o f the local g o v e ~ ~ ~ ~ ~ .
(2) To promote s e ~ a r a ~ ~ ~ n of g ~ ~ ~ ~ a t i o n fiom ~ a n ~ ~ ~ § s i ~ n and d i s ~ ~ ~ ~ t i o n ~ ~ntroduce the compe~ition ~ e ~ ~ a n i ~ ~ and build a n o ~ a l i s ~ pow~r market. The launch on the ~ ~ i l d ~ n g power market was d ~ ~ e ~ ~ n ~ ~ in December 1997. For establishing a ~ o ~ ~ l i ~ ~ ower market, a step-by-step method was adopted. ~ c c o r d i n ~ to the policy, 'power plants can be run by multi~atera~s, power networks must be managed by the State'; the current objective is to separate genera~ion from ~ a n s m ~ $ s ~ o n and d ~ s ~ i b u ~ o ~ ~ and to build the &ene~ t~on-s i~e power market. It has been d e ~ e ~ ~ n e d to initiate pilot projects in five ~ r o ~ ~ n c ~ s and one city, Le, ~ h e j ~ a n ~ ~ ~ ~ e n d o ~ ~ , ~ ~ a o n ~ ~ ~ , Jifin, ~ e ~ ~ ~ n ~ ~ ~ a n ~ pro~inces and ~ h ~ g ~ a ~ . ~ecause of the ~ ~ ~ p ~ i ~ ~ t ~ d s ~ ~ ~ ~ i o n s and ~ ' ~ ~ ~ 1 ~
issues, the c o ~ c r ~ ~ e ap~ro~ches of these power companies are d ~ f f e ~ e ~ ~ . In a ~ ~ o ~ ~ ~ c e with the r e q u i ~ e ~ c n ~ § of the SP, the follow in^ ~rinciples should bc ~ o m p l ~ ~ d with:

Electric Power Industry ~ e s t ~ c ~ r ~ n ~ in China
equaI competition high ~ansparency
0 sharing benefit lowest cost
e opera~ion by laws and reg~la~ions subject to supe~ision.
The concre~e practice is to separate generation from t r~ns~~ iss ion first, reorganise several generation group companies, and adopt a hid price ~ e c h a n i s ~ in genera~ion for the generating companies, but a few power plants, such as peak regulating units rhsrmal units mainly used for supp~y in~ heat to the local area, are temporarily not included. For the sake of transition, the electricity genera~ion could be divided into two categories: one is the basic part o f electricity generation, the account of which is sertled according to the current electricity ~~nerat io i i price cons~dering the repayment of principal with interest far newly built power plants; and the other is the competitive part of electricity genera~io~~, which is detemiined by the bidding price. As time goes on, the bidding part should be increased gradually. Finally, the principle of ‘an equal electricity price for the same network and the same quality of electricity’ should be carried out.
( 3 ) To promote the implementation of the nationwide power network interconnection and realise the o p t i ~ a l disposition of resources. Owing to the distribution of energy ~ources and loads in ~ h i n a , implemen~ing the nationwide power network interconnec~~~n and realising the optimal disposition of resources is an inevitable option. The construction o f the e x ~ r e m ~ ~ y large Three Gorges hydro power station and its ~ a n s m ~ s ~ ~ ~ ~ system
motes the f o ~ a t ~ o n of the nat~~nwide power network interco~nection. It is p~aff~ed that inte~cannec~~on between the Northeast and North China power networks will be
acc~mpl is~ed in 2~00 , the in~erco~nec~ion between the Fujian provincial power network and the East China power n e ~ o r k will bc accompl~shed in 200 1 , and the inF~rconn~c~ion between the Shantong provincial power network and the North China power network will be accomp~i~hed in 2003, the ~ n ~ e r c o ~ e c ~ i o n between the Sichuan p r o v ~ n c ~ ~ ~ power network and the N o ~ h w ~ s t power network will be accomplished in 2004. Three cross- regional. interconnected power networks in northern, middls and southern China will be basically ~ Q ~ ~ d around 2010. The ~ ~ i ~ e d interconnec~ed power network of the whole c o u n ~ ~ will be achieved between 2010 arid 2020. The decisions for the above large engineer~ng projects are all made on the basis of detailed preliminary feasibility studies of the ~ei ie f i~s and effect~vene~s of ~n~ereonn~ction. The f o ~ n a ~ i o ~ i of the nat~onwi~e power network in~erconnec~~on will ~ ~ f i n ~ ~ e l y accelera~e &he future develo industry more e~Qnomica1 and effective way.
(4) To s~~~~ up mra r n a ~ a ~ ~ ~ ~ ~ t i ~ s t i ~ ~ ~ o n a l ~ ~ ~ Q ~ .
I ~ p i e ~ e n ~ i n ~ rural ~ a n a ~ ~ m e n t ~ n s t i ~ ~ i o n a l reform, technically r e n ~ v ~ ~ ~ n g rural power nc’nvorks and reali~ing a unified electricity price for urban and rural areas in the same power n e ~ o r k with the same q u a l i ~ of electricity arc the current objectives of rural power system deveiopmen~. It will take three to five years. The task o f this r e f o ~ i s mainly to s i m ~ ~ i f y the ~ ~ a n a g e n ~ e ~ ~ ~ structure and to solve the chaos in rural e l e c ~ ~ c i ~ pricing, targeted at realising unified maIiagement, unified a c ~ o u n t i n ~ ~ and a un i~ed electricity price for urban and rural power networks. Technical renovation of the rural power network aim to e the losses of lines and transformers. The estimated inves~men~ is 180 bill~on art. The line loss rate will be reduced to below IS % from

,
Q~~anisation ofthe SP

gy of power ~ d ~ s ~ de~e~oprnent, the SP will o ~ s ~ ~ e le d e v e l o p ~ ~ n ~ by relying on technical progress, mher deepen~n~
r ~ f o ~ and ~ d e n ~ n g open policy. In additio~ to focusin n ~ d ~ e n ~ l research and staff t r a i n ~ n ~ ~ the SP ha
echnology pilot projects, namely clean coal power g y coi is~~at ion and e ~ e c t ~ c ~ ~ saving, e
as well as a ~ o ~ ~ u ~ e ~ i s e d informati the $16” has focused on bath international omestic ~ n ~ c i n g sources.
’s power i n d u s ~ is still m ~ u o ~ s task. ~~e r n ~ t i g a t i ~ ~ in d ~ ~ ~ c ~ l t due to the increase in electri in 1997 in China was only 0.21 kW, e i e c ~ i c ~ ~ consu~ption a c c o ~ t e ~
world average. It i s planned that the nation’s total installed capaci W in 201 0, the na~ionwide power ne
ect being at the centre. In order to achieve the goals, SP will ~ u ~ ~ e 8
policy of
change that must take place is that the electric power sector ented to the market rnechanism. The
pr~vides 8 good o p p o ~ n ~ ~ for the power sector to make itself. These ~nclude:
should be worked out in accQ~d~nce wit course of economic deve~op~ent inste
e x ~ a n s i o ~ of s rna l~~s i~e c o ~ d ~ n s i n ~ ~ p ~ ~ h e ~ a i power plants. ~ ~ r ~ ~ g ~ h ~ n ~ n g the c o n ~ t ~ c ~ o n of the ~ e ~ o r ~ With the rapid dev ~1~~~~ the c o ~ ~ s ~ c t i o ~ of the ~ e ~ o r ~ , including the facilities from lines to rnediurn~ and l o w - v o l ~ a ~ ~ d i s ~ b u t i o ~ n e ~ o r ~ s ~ lags beh~nd

.4
o ~ e ~ ~ e ~ t o ~ is s ~ ~ ~ l ~ ~ ~ e u ~ s ~ ~ a e ~ ~ ~ o d i ~ and a %a where conflicts are enc~untered between on and d ~ r e ~ l ~ ~ o ~ ,
b e ~ ~ e n ~~~~~ value and controlled profit, and b e ~ e % n ~ o v e ~ ~ e n local and p~vate ~ ~ ~ t i a t i v ~ s . The o f ~ e i ~ ~ § a d ~anager§ at the vikpiaus levels U
necessity and i ~ ~ o ~ ~ e of transition to market ~ C Q ~ Q ~ Y , but they are not well i about the ~ e c ~ ~ ~ s ~ s and approache$ to realise the ~ ~ s ~ t ~ o ~ . 7%
cing reform lies at the heart of China’s response to

Electric Power Industry ~ ~ ~ ~ ~ c ~ r i n g in China 33
~ ~ w e v ~ r , none of these has been st~dardised as ~ ~ t i o n a ~ p o ~ ~ c ~ inev~tab~e~ however9 there is a gr~wing realisation that the establis p~ ic~ng ~ ~ c ~ e has become vital to the ~eve~opment of a s ~ ~ t a ~ a b ~ e ene Since Ehe mid ~ ~ ~ 0 s an ~ncreasin~ n u ~ b ~ r of enterprises, ~ ~ ~ c ~ l a r ~ y joint v a d o ~ t e ~ cost-pI~~$ ~ r ~ c i n ~ s ~ c ~ e s that base the price of e n e ~ ~ ~ product on ~ ~ d ~ c t i o n costs ( i ~ c l u d i ~ i ~ the recovery of con§ t~c t i~n capital and interest, ope~t ion costs and labour costs), tax aid to the government, and profit. This is a considerable j ~ p ~ v ~ ~ ~ n ~ over the a~in j$~rat ive ly fixed price, but it still results in several amb how to c a l c ~ ~ a ~ e costs in an e n v ~ ~ ~ n ~ ~ ~ t where ~ ~ ~ ~ t i o ~ is often ~ o ~ b l regulate the profits of enterprises.
pricing was i n ~ o d ~ c e d in 1987, along with $easo~a~ er is a mjar compo~ient of base load. H o w e ~ e ~ , the to d e c ~ ~ ~ ~ ~ o w ~ n ~ to the ~nabi~ity of rates to cover ri ~ c ~ e s to cap^^ pricing differences, i ~ v e s ~ e n t ~ ~ v ~ r s i o ~ to s m a ~ ~ ~ lm capacity~ and the inability to collect user fees.
ectldcity tariffs, which are jointly fixed by the state, inre of Power% The ~ ~ ~ ~ f § o f united p r ~ c ~ n ~ c ~ ~ ~ ~ s t of th
es which arc: managed by the ~ ~ i $ ~ o f Power
The regional and a ~ ~ i n ~ s ~ ~ ~ d by the grid prices and out- ~ r o v i ~ c ~ ~ respectively. The prices of mid- to small-size power plants man and counties are fixed by local ~ o v ~ ~ m e n t , checked and ra t i~ed by r e s ~ o n § i ~ ~ e for p ~ ~ ~ , as welf as the p~~~~ ~ u r e a ~ . Tbe w ~ o ~ e s a ~ e prices of ~~~
r p ~ ~ ~ $ which are priced by the state are checked and ~at~f ied d p r o v ~ c ~ a l power b ~ ~ a u x respec~~vely. The base price reflects
rice, md has no relationship to ~onsum~tion. The c ~ r c ~ ~ a t ~ n g price ~ ~ ~ o r s the v ~ ~ ~ ~ ~ e ~ r ~ ~ ~ c t i o n cost. The ~~~~c~~~ tariff s ~ c ~ ~ e is d i ~ ~ ~ ~ ~ into aix c a t e ~ o ~ ~ $ , b w d on uses and v o ~ ~ ~ g e s . The cate~or~es include:
electricity rates for ~ ~ g h ~ n g ;
e ~ e c ~ i c ~ t y rates for the larger ~ n d u $ ~ ; electricity rates for agriculture ~rQduc~~on;
md o r ~ ~ n ~ ~ n d ~ s ~ ~
rirnarily becaus~ nationalis~d and § ~ ~ d ~ d i s e d electricity pricing po~ic~es have not been $ ~ e n t e ~ , the c lass~~ca~ion of electricity tariffs does not reflect the ~ ~ a r a c ~ e ~ s ~ i c s t e ~ e ~ ~ ~ i t y ~ ~ ~ u ~ p t ~ o n ; for example, e ~ ~ c ~ c i ~ rates in s~~~ ~~e~ (e.g.
~ o ~ ~ e r c ~ ~ ~~~~~~s and ~ o t e ~ s ~ ~ontinue to be subsidised~ as are the pre f~ren t i~ ~ ~ ~ ~ c i ~ sent, tariffs fixed by the .e. electricity prices are b
be r a ~ i o ~ a l ~ ~ e d 9 and ~ner~ased power es have offset revenue s ~ e a ~ ~ froni the ~ m ~ ~ h
with s y s ~ e ~ - w i ~ e effects of the resulting ~ n a n c ~ a ~
~ s t a b ~ i ~ h i n g R ~ o w ~ r market in China will in~oduce a m ~ ~ e t - o ~ e ~ t e ~ e c o n ~ ~ y , promot~ng s ~ b s t ~ t i a ~ development in the power i n d u s ~ ~ Tt is ~ x p ~ c ~ ~ d to sollve the
1. Power resource location problem the s ~ ~ a t i o n o f an electric power shortage> the main issue the electric power
~ n d u s t ~ must face is to speed up c o n s ~ c t ~ o ~ of new power plants. Divversi ~ n v e ~ ~ e n ~ charnels md ownership of power p h t s will help to achieve the e ~ o a ~ s . At the same time, however, it will also bring ~ r o ~ l e ~ ~ such as the i n a p ~ we^ mix § ~ c ~ e ~ air ~ o ~ ~ u t ~ o n and no~ i~sync~rono~s c o ~ s ~ c t ~ o ~ o f the ~ ~ w e r n e ~ o r k s .
In tbc past, the above p ~ b ~ e ~ s were c o n ~ ~ a l ~ by the power s ~ o ~ g e s ~ ~ a t i o ~ . hen power supply exceeds d e m a n ~ ~ these p r o b ~ e ~ s b e c o ~ e the ~ a i n cons~d~~ation.
Afier establishing the power market, power projects are to be decided acco~ ing to ~~~e~ ema and, not adm~nis~ative order. Under re~ la t ion o f the ~~~e~ m e ~ h a n i s ~ p ~ w e r resources allocation will be more e f ~ c ~ e n ~ and stable.
2. Low a ~ i n i s ~ a t i o n efficiency ~ u ~ n g the past 20 years, r e f Q ~ of the Chinese economy has u ~ ~ ~ r g o ~ e a rapi de~e~opment. Supplies of c o ~ o d i t ~ e ~ have become
a ~ ~ n ~ s ~ a t i ~ ~ and ~ ~ o ~ o t e their s e ~ ~ ~ e i n d ~ s ~ does not face such p~ssure. lt still o p ~ a ~ e s accord~n~ to ~ l a ~ n ~ ~ ~ ~ ~ 0 ~ 0 ~ ~
~ o d u ~ e s and has a ~ ~ n o ~ ~ l y electric p ~ w ~ r in selling. The gene ratio^ cost has been ~ ~ c ~ e a s i ~ g year by year. The g ~ e r a ~ o n and
~ r ~ ~ ~ i s s i o n indices are very low: for ~ n s ~ n c ~ , the na~~onal net ~ o n s u ~ ~ ~ ~ o n rate is about 400 ~ W h (standard coal); the line loss rate is a b o ~ ~ 7%. These ~ n ~ i c e s are fw behin~ the world's average level.
a b ~ d ~ t ~ while prices de~~eased. To compete in the market, manu no effort to i
ever, Chi~a's
3. ~ c i ~ g p r ~ b ~ e m Under the ~ a d ~ t i o ~ ~ a ~ monopoli~s of the power i n ~ u s ~ ~ to gain more b e ~ e ~ t s , the o p e ~ ~ ~ o r s strived to ~ a i n t a j ~ a higher rate of e ~ e ~ ~ i c i ~ . At the same time, the cen ~ o v e ~ ~ e n t encourag~d ~ ~ v e ~ ~ ~ ~ t in the power plant by s ~ o ~ s i ~ ~ t ~ ~ goiices s u ~ h as 'anew p~~~~ l~m rate', 'QW p ~ ~ n t one rate'. "bus the e ~ e c ~ ~ ~ ~ ~ rate ~ o ~ ~ ~ n u ~ ~ l y i n ~ ~ ~ a s ~ d every year with new power plants pat into average rate in an areas was about 0.47 ~a~~~ 0.67 ~ ~ ~ ~ h . ~ o r n p ~ d with the average ~ncome of ~ h ~ n e s e peop other c o m ~ ~ d ~ t i e s , the price of electricity in China is
If the power shortage was an obstacle to develop the electricity rate gradually became a new barrier to the growth of China's ~ c Q ~ o ~ ~ , To maintain a sustainable development of the national economy thorough reform ofthe electric power i n d ~ s ~ is urgently needed.

To ~mp~emen~ing reform, the SP has set forth a ‘four~s~ep’ r e s ~ c ~ r i n ~ ~ a m e w ~ ~ ~ . The period from the establ is~ent o f the SP in 1997 to the t e ~ ~ ~ a ~ i o n of the Electric Power was the first step in ~ e a l ~ ~ ~ n ~ corporate r ~ s ~ c ~ i n ~ , From 19
the SP will con t~n~e to in tens i~~ ~ s ~ ~ ~ ~ n g , ~~~~~ w ~ c ~ period the v e ~ m e n t ~ n c t ~ o n s from those of e n t e ~ ~ s e s as f o ~ ~ o ~ s ~
1
2.
3.
4.
5 .
In to
ower plants, and a wel l - re~lat~d, t e c ~ i ~ a ~ ~ ~ wifl be open to all power plants. The SP and a111
r~tions will run the power n ~ ~ o r k r i s ~ / l e ~ ~ l person and econo~ie
after 2020, the f o ~ h step of the reform, the Chinese power indus will t~~~ a p p r ~ ~ i ~ a t ~ the ational a ~ v a n e e ~ level, ~ o ~ i n g
~ a t i ~ n a ~ top level.

7.4.3 ~bstacles ip2 ~ ~ t ~ b l i ~ h i ~ ~ the Power
ow to acceIe~te the pace of reform and smoothly make the ~ ~ s ~ t i o n fkom e~ is t~ng ~ o n d ~ t ~ ~ ~ s to a ~ ~ k e ~ - o ~ e ~ ~ e d ereetric power i n ~ u s ~ are the q u ~ s t ~ o ~ ~ of today. The ~ b s ~ a c ~ e ~ that must be r e ~ o v ~ d to achieve the ~~0~ goals are as foI~ows"
plants are not real comp~n~es. In fact, they me just s of their necessary powers held by other higher
e ~ o n g ~ g to the SP+ Thus many of the key ~ n c t ~ o ~ s w run dir~ct~y or ~ ~ ~ ~ e c t l y by the SP and its s ~ b s i d i ~ ~ e
t cannot be estab~~shed* b e c a ~ ~ ~ it ~ e ~ ~ ~ e ~ d ~ ~ ~ n g , j ~ § ~ c e and r ~ ~ o n a b l ~ n e ~ § .
Here we face two major problems. The first one is the rope^ right' issue i s based on the observable fact that un the en te~ r i§~s in the power i n a ~ s ~ must be ~ ~ v o ~ v a I l o c ~ t ~ o ~ and ~ ~ e ~ t i ~ n of their property. In fact, it is a p~oblem of how the ~n~~~~~~ will be able to manage and operate itself. The second one i s the ~ r Q b ~ e ~ of §eparatin
t and e n t e ~ ~ s e ~ ~ c ~ i o n ~ ~ Up to now, the t~~aitional a d ~ i n i s ~ ~ t ~ v e s basically u n c h ~ ~ e d , although the SP was establish wer was t e ~ ~ n a t e d . C ~ e ~ l y ~ with such
the s t ~ c ~ e of ~ ~ o p e ~ rights, ~ ~ t i m ~ o ~ ~ ~ ~ s a ~ ~ 1 also r e ~ ~ n unr~solv~d [I]. the ~ l e c ~ c i ~ price is quite c ~ n ~ s e
. ~ ~ c e e$onomic reform began in ~ ~ i ~ a , s has been ~plementea. But the e ~ e c ~ ~ ~ ~
a ~ ~ ~ c t the Ov~rall e c o ~ ~ ~ y and s t ~ d a ~ d of living. T h e ~ e ~ ~ r ~ ~ r e ~ o ~ a t i o n of the power market is rigorously l ~ ~ ~ ~ e a to the gene
e ~ o v e ~ ~ e n ~ b ~ c a ~ s e the electric i n ~ u s ~ i s consi
f a ~ v e r s i ~ i ~ ~ ~ n v e s ~ e n t , different hnts can be economically cla

4. Small hydro power or thermal power p ~ a n ~ s constructed by focal gove~ments~ They are usua~~y mn by local power ~ o m p ~ ~ e s and sell electricity acco~d i~~g to the price audite by local gove~ments.
a1 power p ~ a n ~ sold to f o r e ~ ~ n e ~ ~ e ~ r ~ s e ~ . Ta get furads to ~ o ~ § ~ c t n in solme regions, several t h e ~ a ~ power plant8 have been sold
5,
to the agreement of sale regional power companies tee that this kind o f ~ e ~ a l power plant will sell a certain amount of e i e c ~ ~ c ~ t y to the grid each year at a 6 e ~ i n price.
Prices for e ~ e c ~ ~ c power varied co~siderably across p r o v i ~ c ~ ~ and even withk $ ~ a ~ ~ chase agreements, which define how much e ~ e c ~ ~ ~ ~ that the m the power plant, are not being honoured. Old pXants ~ s u ~ ~ l y se1
most power since they need to cover only 5x1, operatio~ and m a ~ n ~ ~ n ~ ~ e costs and nee not pay their c a ~ ~ ~ a ~ cost,
From the above classification of power plants one can see that the price system 0x1
ge~ieration side is very omplica~ed and it i s very difficult to form a n o ~ a ~ i s e d com~et i~ve ower Law ap~rovcd by the People’s Cong~ess of ~ h j n ~ on 28 f date. It i s almost useless in r e s ~ c ~ n ~ ~ h ~ n a ’ ~ ~ J ~ ~ c power
l~shmen~ and i ~ ~ r o v e m e n ~ of the electric power m ~ k e t ~ u § t be ed by a complete legal f r a ~ ~ w o r ~ . There~ore, new ~ e ~ i s l a t ~ o ~ lmust dition €or the neces reformation of the electric power.
be dealt wilh are:
1. prop^^ owne~hip: This subject occupies a very important and critical pos i t~o~ in China’s electric power ~ n d ~ s ~ reform. Without a thorough ~ ~ a r ~ f i c a ~ ~ ~ and fi ~ e f i n ~ ~ ~ o ~ ~ o n c e ~ i n ~ the property right of regional, p r o v ~ c i ~ ~ power c i n ~ ~ ~ e ~ d e ~ ~ ~ o w ~ r ~~~~§~ the ~ a n s ~ ~ ~ s ~ o ~ to a true power m ~ ~ e t
l a ~ i ~ n s ~ In today’s SP lmanagement system, temp a d m ~ ~ ~ s ~ a t i v ~ orders are still the main measures used to manage ~ ~ ~ a ~ r ~ . This s ~ ~ a ~ ~ o ~ shows the ~ ~ n ~ e ~ ~ ~ ~ h ~ ~ ~ t ~ s ~ i ~ s of
~~~0~ must be d e f i n ~ ~ as the basic p ~ ~ c i p ~ ~
p r o ~ ~ c i ~ ~ power c o ~ o ~ a t i o n ~ and ind they often show more concern a ~ o u t their ing ~ i $ ~ b u t ~ o n of social ben^^^ is an i t of the ~ o ~ e r market.
In s ~ m ~ , China’s e l ~ ~ ~ c power industry is at its initial stage of r e f o ~ a ~ ~ o ~ . ~~~~ are many c h a l l ~ ~ e s to be over~ome to establish a fair and efficient power market.
The characte~~stics of ~ r n o ~ ~ ~ of g e ~ ~ ~ a t s u ~ t a ~ l e for ~ h ~ n a
ity ~ ~ 6 ~ x 1 g in China originated from the r e ~ u ~ r e m e ~ t o fa 1 g f ~ n ~ and ~ ~ v e s ~ e n t . The Ps used in the uf( are not
do~og~es have beea $~ggested to d e s ~ ~ ~~~c~~~~~ price

23 Power System R e § t ~ c ~ u ~ ~ ~ g and ~ e r e ~ l ~ ~ i o ~ i
~ § t e ~ s ~ ~ ~ c l u ~ ~ ~ ~ ~ a two-pm pr~c~ng s y s ~ e ~ " This section will discuss a one ~ ~ § ~ e ~ that cm cope with the above rob^^^.
~ o § t s of e l ~ c t r ~ c i ~ include o ~ e ~ ~ o n costs md inves ~ ~ ~ ~ n a ~ ~ ~ ~ of e ~ ~ ~ c i ~ costs involves ause operation optimisation is the basis of
r e ~ ~ a b ~ ~ i ~ ~ i s the basis of determining capacity iRves~ent p r o d ~ c ~ o n simulation of the power system becomes one o p r e ~ i e ~ e l e c ~ c i ~ cost "71.
In order to analyse e lec~ i~ i t y costs, we should mn a ~ r o b a b ~ l ~ s t ~ c ~ r Q d u c ~ ~ ~ ~ s i r n ~ ~ ~ ~ Q R y hour. Then we can obtain fuel costs F(d) and loss of load ~robabi l i t~ d;
(t = ~,2;.*,~760) - This data is the basis for cdculati Variable costs of electricity consist of fuel costs
be re~re§en~ed by
where e7ti., : ~ e ~ e r a ~ ~ ~ ~ e a ~ a c i i ~ for base load ofthe s y s ~ e ~
: ~ e n e ~ ~ i o n c a ~ a c ~ ~ for peak load of the s y s ~ e ~
K, : a n ~ ~ a ~ rate per-unit capacity for base load
K , : annual rate per-unit capacity for peak load
dicting generat~on costs for each hour, the annual rate of evenly d i s ~ ~ b u t ~ among 8760 h, while, the ~ u a ~ rate of
~ h o ~ ~ ~ be ~ ~ s ~ b u ~ ~ ~ c o ~ ~ i n ~ to ~ ~ ~ ~ ( ~ ) €or e&ch h o u ~ ~ h e r e f ~ ~ ~ ~ the G O S ~ of $ ~ ~ c ~ ~ ~ ~ ~ ~ for hour t is
where F(t ) : fuel cost ofthe power system in hour t
RA : the risk level in the investigated year
(t) : ~ ~ ~ ~ ( t ) , the risk level in lmur 8
8760
where P(2) is the system load at hour t. The ~ a ~ ~ ~ n a ~ cost p(t) of e ~ e c ~ c ~ ~ for hour t i s

Electric Power Industry ~ e s ~ c ~ ~ ~ ~ in China 39
~ u ~ s ~ ~ ~ t ~ n ~ ~ ~ u a t i o n (72) into the above equation, we have
in equation (7.5) can be found by running a probabilistic production s i ~ ~ l a ~ ~ o n , To ~ ( 0
find the second tern of equation (7.51, we can use the follow in^ two methQds.
I . ~ ~ i ~ t a i n g e ~ ~ e r a ~ ~ o n capaciv ky, u ~ ~ h a ~ g ~ , and increase I unit load for each hour,
~oba~ i~ is t i c prod~~t ion s~mulation in this situation, ~ ~ ~ ~ ~ t ~ ,
~ ~ c ~ ~ a s e peak load c a p a ~ i ~ kt/, . Because it is d i ~ ~ u l t to get the cost of loss load, the second way is ~ r e ~ e ~ e d . U
above ~ o n ~ ~ ~ o n e ~ u a ~ o n (7.5) can be r e ~ ~ a n g ~ as
5 can be ap
LDC in the ~~~~e is the load ~ u r ~ t ~ ~ ~ curve formed from ~ ~ ~ ) . After ~ n n ~ ~ a
The risk level o f ~ ~ e whole year, LOLPA, i s determined by tbe abscissa W, i- ~ ~ g ~ ~ e 7.5 is the load duration curve formed by P(t) -E- hp ; here AP is an inc
duration cuwe become C , With the same LOPA we can nd a point in ELDC, the abscissa of which is erefore, the section of line A r e ~ r e ~ e ~ t s the c a ~ ~ i ~ ~ ~ ~ ~ e i ~ e n t AW I Thus we can s ~ ~ s t ~ ~ t e the f ~ ~ I o ~ ~ g equa~~on
~ i ~ a t e l y found by the following ~ ~ o c e d ~ e as ~~~~ in Fi ~ ~ ( t )

a ~ ~ e r to ~ a ~ ~ ~ i n the n e c e s s ~ c ~ a c i ~ reserve an in[: ~ ~ ~ ~ a r i o n capaci~, we can draw up ~ ~ n ~ a c ~ s with
~ a p a ~ ~ t ~ of the system is not eno ; in ~e~~ these ~ o n s u ~ ~ ~ will s
af c o n ~ ~ r n e ~ s the, ~ e n e ~ a ~ ~ o ~ cost s ~ o ~ l ~ not inch cost b e ~ ~ ~ e ,
~ o ~ e i n ~ u s r ~ a l they do not GO
e q ~ ~ ~ ~ ~ (7.8) ~ ~ s ~ e a ~ o ~ ~ q ~ ~ ~ o n (7.6).
ises have their own power units and respective reserve, their electricity

Electric Power Industry Restructuring in China 11
I 0.9 1 *
0 1 2 3 4 5 6 7 B 9 10 11 12 13 14 15 16 I7 18 19 20 21 22 23 24 1
(a) September
Xn order to supervise the market price of electricity for the ~ o v e ~ m e n ~ easily, we can calculate several characteristic costs (or prices) for an interval o f a certain time, say one week, one month of: one year.
the f ~ ~ n ~ ~ ~ ~ to ~ e ~ ~ ~ i ~ e the c ~ ~ a ~ ~ e r ~ ~ ~ ~ c casts for aat i n t e ~ ~ ~ of one
is 27, and the set of s h o u ~ ~ e ~ load time i s T, . The n u ~ b e ~ of h ~ ~ r ~ are t , , t, an
r e ~ ~ e c t ~ ~ ~ ~ y , and
~ l ~ c ~ i ~ ~ ~ ~ o n s ~ ~ e ~ in the peak, s h o ~ l ~ ~ f : and valley load ~ ~ r i o ~ s are A,, A, an
r ~ s p e c ~ i ~ e ~ y , and are calculated as follows:
1, -t- I,, -t t , = 8760

Power System Restructuring and Deregulation ._. I ___- 242
I_-I--
If the cost of e ~ e c ~ i c i ~ genera~~on in the peak, s ~ o ~ i ~ d e ~ and valley load p e r i ~ ~ s is Cp , Cs
and C, , res~ect~vely, then they can be found from equation (7.2) as
(7.10) Mp id, tETV
ence we can d ~ t ~ ~ i n e the average cost of electricity for the peak, s h ~ u l ~ e r and valley load p e ~ ~ o ~ s as
The ~ v e ~ ~ ~ e cost of ~ l e ~ ~ c ~ ~ for the year is thus
(4.13)
ra and is,, are average marginal costs €or the p
costs u ~ ~ ~ e c ~ c i ~ for a real power system are s ~ ~ w n in Table 7.3. s respectively, and are c a l ~ ~ l a ~ ~ ~ from e q ~ a ~ ~ o n (7.6). The a ~ e ~ ~ e time used
Peak load Shoulder load Valley load 0.402 1 0,2014 0,1133
7.5.3 ~ ~ e c ~ ~ i ~ i ~ ~ ~ i ~ i ~ ~ ~ ~ ~ ~ ~ e r - ~ ~ ~ v ~ ~ ~ ~ ~ ~ ~~w~~ ~Q~~~~
7 the ~ ~ t i ~ ~ w ~ d e electric ~~~e~ shortage which last As a c ~ ~ s e q ~ ~ ~ c e , many power plants suffered a 1
first t h e . T h e ~ f ~ r e the income and ~ ~ n e ~ ~ of the plants were of m a ~ n ~ the p ~ v ~ n c ~ a l p o ~ e r c o ~ ~ r ~ ~ ~ o n $ s and ~ ~ i ~ e ~ dispat~h, ihe p ~ ~ e r flows alon
lly died off. Owing cap the emph
This operation obviously resource^. The cause of such a p e ~ o ~ ~ c e is due to the pr a m ~ ~ g ~ r Q v i ~ c ~ s .
Let us i ~ ~ u s ~ ~ t e this ~ r o b ~ e m by a real ex^^^^ of the ~ o ~ h ~ ~ s t p w e r s y s ~ e ~ ~ In ~ ~ ~ ~ w ~ s t China, four ~rov~ncial power s y § ~ e ~ s are ~n~erco~nected. These ~~ov inces

Electiic Power Industry ~ ~ s ~ ~ c ~ r ~ n ~ in China
i n ~ l u d ~ ~~n~~~ ~ ~ n s u , ~ i n ~ x i a and i n ~ ~ ~ i . The ~ i ~ j ~ a n g ~~~~~c ~ o ~ e r ~ y s ~ e m is an isolated system. The ~ o w ~ ~ source mix of the: n o ~ h w ~ ~ ~ power system iat the end of 19 shown in Table 7.4 and F i ~ ~ ~ e 7.7. We can see that in Shaanxi a d ~ i ~ ~ x ~ a ~ r ~ ~ ~ n c e s , electricity is mainly s~~~~~~~ by c o a ~ - ~ r e ~ power plants; in Gansu and ~ ~ n ~ h a i ~ r ~ v ~ n ~ ~ s , more than half the electricity is supplied by hydro power plants. Therefore9 u ~ ~ ~ e disp~~chiRg in the n ~ ~ w e ~ ~ power system can make a significant profit.
i I
I 40%
(a) ~ e r ~ a l power
(b) Hydro power
re 7.7 Weight of we^ ~ a ~ ~ ~ i ~ i n s ~ a ~ ~ ~ d in four provinces

la 7,% Power source mix in the northwest power system (~~~
Province Thermal power Hydro power Total
~ ~ a a ~ i 4025 44.6% 988 17.5% 5013 34.2%
Gansu 2668 29.7% 2285 40.4% 4953 33.7%
In@& 400 4.4% 2080 3 ~ * ~ % 2480 I&9%
~ ~ n ~ x ~ ~ 1924 21.3% 302 5.3% 2224 15.2%
Total 9017 100% 5455 100% 14671 100%
e 7.5 ~ o n ~ ~ i ~ benefits o f interco~ection~
Separate Operation Interconnected Operation
~ ~ 6 D O 8 ~ 4 5 ~ S ~ a a ~ ~ Exchange Energy 32 17890
Load ~~e~~ 63568 ~ 3 5 ~ 8
~~~~~~0~ cost 3,26887 4.34856
39318 Gamu ~ ~ ~ ~ i a n g ~ Energy 0 -24821
~ ~ e ~ ~ ~ ~ Q ~ @OSc 3 . 4 ~ ~ 7 ~ 1.78287 Fixed Cost 9.71239 ~ ~ ~ ~ 5 8 ~ Lmd E n e r ~ I8747 f 8747
~ e n ~ r a t i n ~ Energy x 8747 8 ~ 4 9
-
~ i ~ ~ ~ a ~ ~ x ~ ~ ~ ~ e Energy 0 -10078 ~ ~ e r ~ t ; o n Cost 1,04226 0.19944 Fixed Cost 3.37173 1,19632 Load Energy 30079 30079 G e ~ e ~ a t ~ ~ Energy 3095 I 47088
ia E x ~ h a ~ g e Energy 872 17009 ~ ~ e r ~ t ~ o ~ Cost I . ~ ~ ~ ~ 3 ~ ~ 6 D ~ ? ~ Fixed Cost 4.27124 ~ . ~ 9 8 ~ 4 Totat ~ ~ ~ ~ t i o n Cost 35,59297 33.294~4 ~ n ~ ~ ~ ~ o ~ e c ~ Benefits 0 2.29884- - Total

Electric Power Industry R e ~ t ~ c ~ ~ n ~ in China 2

Effects of prices on interconnecting benefit d i s ~ i b ~ ~ i ~ n
Gansu Qinghai ~ i n g x i a of change shaanx~ ~ ~ W h ~ 0.35 1.8229 1 -1.47891 -0.005 17 1.9600 1 0.34 1.6440 1 -1.23070 0.09561 1,78992 0.33 3.46511 -0.98249 0.19639 1.61983 Q.32 1,28621 -0.73428 0.297 17 1.44974 0.31 1.10731 -0.48607 0.39795 1.27965 0.30 0.92841 -0.23786 0.49873 1.10956 0.29 0.7495 1 0,01035 0.5995 1 0.93947 0.28 0.57061 0.25856 ~.70029 0.76938 0.27 0.39171 0.50677 0.80 107 0.59929 0 . 2 ~ 0.2 128 1 0.75498 0,90185 0.42~20 0.25 0.03391 1.00319 1.00263 0.2591 1 0. 1.25 140 0.08902 0. 1.4996 1 -0.08 107 0. -0.502~9 1.74782 1.30497 -0.25 1 16 0. -0.68169 1.99603 1.40575 -0.42125 0.20 -0.86059 2.24424 1.50653 -0.59134
Transmission of electricity is becoming a separate industry ayer. A viable ~ ~ s ~ i s ~ ~ ~ n bus~ness is critical to a s ~ ~ c c e s s ~ l compet~t~ve electric ~ ~ k e t ~ In the past, the i n a ~ p r o ~ ~ a ~ e ends of ‘~rnphasising generation, i ~ o ~ n ~ ~ansmissjon~ in the el power industry ~f China made adequacy ~ ~ s r n i s s ~ o ~ very oor. Since the basic business of the SP and its ~ubsidiaries is ~ansmission they hav a duty to prov~de ~ ~ o u g h ~ a n s ~ ~ s s i o n capacity to satisfy the requirernen~ of the power t ark et, This is a massive ~ n d e ~ ~ ~ ~ n g that will cost billions of yuans. Where will the money come from?
there is a g r o ~ ~ n g need to identify the costs of ~ans rn~ss iQ~ se~ ices , In such a one s h ~ ~ ~ d answer questions such as how much i s this ‘g~nerator or load’ making um of this ~ a n s ~ ~ s s ~ o n line? Or ‘what p~o~ort ion of the n ~ ~ o r ~ losses i s allocate^ to this gene~a~or (or load) ? olutions of these prob~ems are very i services provided by transmission systems, and hm a direct hfluen
This section presents a comprehensive inves~igation of load fl c o s ~ i ~ ~ . Two current d e ~ o ~ ~ o s i t i o n axioms are first i n ~ o ~ u c e d as the f ~ d a m ~ n ~ ~ s of load flow analysis in wheeling costing. Then rigorous math cal models of ihe dist~~bution faGtor problem and loss allocation p ~ o b l e ~ are es~b l i she~ . To solve these p r o ~ l e ~ s , we i ~ ~ o d u c e a series of theorems based on graph theory and a very simple and e f ~ c ~ e ~ ~ a l g o r i ~ ~ is developed. Finally, case studies are introduced to ~ ~ l u s ~ a t e the u § ~ ~ ~ l n e s s of the ~ r o ~ o s e ~ theory and algorithrn [ 181.
The r e f o ~ of the power industry brings ~ ~ s ~ i s s ~ o n pricing into a new

Electric Power industry Restructuring in China
7.6. I Current Decomposition Axioms
~ar~et -d r iven transactions have become the new independent decision variables de~ning the behaviour of the power system. Understanding the impact of bilateral transactions on system losses is important in order to aliocate a cor r~spon~ng loss co~ponent to each ~ndividua~ ~ ~ n ~ a c ~ i o ~ and improve econom~c efficiency. One essentia~ piece of ~ n f o ~ a t ~ o n that the biI~tera~ market needs in order to improve economic e ~ c i e n c ~ is k n o w ~ e ~ ~ e o f the ~ ~ n s m ~ s 5 ~ o n losses associated with each proposed b ~ ~ a ~ ~ ~ a l ~ ~ n s a c ~ i o ~ . This k ~ o w ~ e d ~ e pernits buyers and $ e ~ ~ ~ ~ s to ~ ~ c o r ~ o r ~ t e the level and cost of Iosses into their ne~o t ia i i o~~ , The essence of the pro~osed loss aI~ocati~n ~ e t h ~ ~ is that given a path, along which the ~ ~ a i ~ s a ~ € i o n s vary with time, it is po~sib~e to find for each ~ ~ ~ ~ ~ ~ e s ~ r n a l in~~ementa~ ~ r a n ~ ~ c ~ t ~ n an ~ s s o c ~ a ~ e ~ ~~~~~e and 5 e ~ a r a ~ ~ ~ foss ~ o ~ ~ ~ o ~ e ~ ~ . This lea to a loss ~ l l o c ~ ~ ~ o n c o ~ ~ o ~ ~ n ~ for each ~ ~ n s a c t i ~ ~ , A n ~ ~ b ~ r of c u ~ n ~ ~ r ~ ~ o 5 a ~ ~ for c ~ ~ c u i ~ ~ ~ ~ a s s ~ ~ ~ ~ t e d ~ o n t ~ ~ c ~ a ~ tosses haye been ~ ~ ~ ~ o § e d f 19-24]. ~~~n ~ o n s ~ ~ ~ ~ n ~ the ~ r o ~ I ~ r n ~ of w h e ~ I i n ~ cos< we need to identify the power (or c u ~ e n t ~ c o ~ ~ o n e n ~ of each branch and allocate the effects such as losses to its componen~s~ To solve this kind of pro^^^^ i t is not enough to use onIy Kirchhofl’s laws of electric circuits. ~he~efore , in this section, we introduce two axioms.
Assume the current of branch k, consists of L current compo~ents
1 ~ ~ ) , ( 1 = l ~ , . . .,L) supplied by L generators, L
/= I
(7.14)
where I(,) and I(,), are the effective or r.m.s. values of the currents, which can be either
‘active’ or ‘reactive’ components. Similarly, in the following description, the term ‘p~wer’ can also be replaced by either ‘active power’ or ‘reactive power’ @5].
The coiiipon~nts o f current in a branch are conservative. The axiom states that each co~ponent I{,)[ is the same at the initial and terminal node of a
branch,
(7.15)
~ ~ s ~ ~ u ~ i o n factors are the same at the two nodes of a ~ r ~ n c ~ . is obvious when we define fCk j f by cments as shown In ~~~a~~~~ ~ ~ , 2 ~
~ o w e ~ e r ~ in power s ~ s ~ e m a ~ a ~ y s ~ s we u~ua~Iy use power instead of c u ~ e ~ ~ ~ Thas we
~ s s u m e the vo l~ges at the initial and terminal nodes of branch k are U, and U , . Thus
because both I(,)! and IWt ~ a ~ n ~ a i ~ the same values at the two nodes o f ~ ~ ~ c h k ,
§ ~ i o ~ l ~ p ~ ~ v e this s ~ ~ ~ ~ ~ e n t is also true when we use power to defme d i s ~ i ~ u t i ~ n factors.
the r~s~ec t ive powers are
47-16) Tlie powers at the WO nodes supplied by source I are

8 Power System Reshucturing and Deregulation
This corrcludes our proof.
e ~ r ~ ~ c ~ ~ ~ e of toss ~ ~ i ~ ~ a ~ i o ~ on the basis o f ema an^ s q u a ~ ~ d was also sug 271, i.e. the loss a l ~ o c a t ~ ~ to component current I(,,, should be calculated a6cordi~g to
The current components in the outgoing lines of an i ~ J e ~ ~ ~ ~ cunene at ba node
~ s s u ~ ~ n ~ that total ~ u n e ~ ~ ~n~ected at nodei i s Ii , this a x ~ o ~ s ~ ~ e s that when the
in ~ ~ ~ ~ o ~ n g
are ~ ~ o ~ o ~ o n a ~ to the cu r r~n~s ofthe going ~~nes .
current ~ n ~ e c ~ ~ ~ by generator 1 at node i is IiZ its ~ o ~ ~ o ~ e ~ t c ~ ~ ~ n ~
h e k i s
where "xi#) is called a ~ l ~ ~ a ~ i # ~ faclor of line k,
Qi{k) = ~~k~~~~ ~ 7 . ~ 3 ~
The whole loss caused by t r a n s m ~ ~ i n ~ energy from ~enerators to a node is called loss ofthe node. We will denote the loss of node i by Pi
rs, the loss of node i, d!$ is equal to the total loss of these ~ncoming lines. To
the outgoing lines of node i we have the f o l ~ o w ~ ~ ~ corollary.
The factor of n o ~ e loss a ~ l Q c a t ~ ~ to an ou~going line is equal to its ~ ~ ~ o c a t ~ o n factor.
~ ~ n ~ ~ ~ ~ o r s ~ then the loss o f n ~ ~ e i i s
Assume that node i hasLi incoming lines all directly cQnnec~e~ w
L
i ~ g lines of node i are not all c ~ ~ ~ c t ~ ~ to the g e n e ~ t o ~ $ ~ e the r ~ ~ s i v e reaso~n
As ~ c n ~ ~ ~ n e ~ above, there are rkvo ~~ob lem$ re~ated to load flow a n ~ ~ y ~ ~ s , namely the ~ i s ~ i b ~ t ~ ~ n factor problem and the loss ~llocatio~ probl the ~ i s ~ ~ ~ ~ ~ i 5 n factor ~ ~ b l e ~ .
For a s p ~ ~ i ~ e ~ o ~ e ~ a ~ ~ g c o n ~ ~ Q n of a ~Qwer ~ y ~ ~ e ~ , one can o ~ t ~ ~ the Ihe or ~ ~ s ~ ~ ~ ~ ~ ) by a loa e d i s ~ ~ ~ ~ t i Q n factors of each g ~ ~ ~ r a t o r for e s N nodes, N , gene~at5rs and N, branc
ctars d e ~ n ~ d by e q ~ t i o ~ ~7.1$~, &E the ~ ~ c ~ ~ e ~ o~erat~ng ~ o n ~ i ~ ~ ~ ~ ~
~ ~ e ~ a ~ Q r 1 for ~ r ~ ~ c ~ k i s e ~ ~ ~ e n ~ c o ~ ~ o n e n ~ s in o~tgoing lines at their c ~ ~ ~ n ~ s , as shown in equa~~on (7.22).
vo~tage at node i yields
e n e r a ~ ~ ~ 1 can be c a l c ~ ~ ~ ~ e d ation (7.21). To do

Power System ~ e 5 ~ ~ ~ n ~ and Dere
where = [PiG, P? >. *. , P,G f '
is the vector of ~eneratQr powers and
(7.26)
= ES 9 Pz 9 *.*, P, I' is the vector o f total node injee elements of which are defined by
0 otherwise
(~.27)
r, (i) is the set of the outgoin
b r a ~ e ~ is ~ Q W ~ ; hence the eIeme~ts us i l l ~ ~ ~ a t e this with a simple p have the f Q l ~ Q w ~ g relationship:
(7.28) 1 ove ~ a t h e ~ a t ~ c a l model is ~ ~ o r Q u s , and does need not to ~ ~ v e the as
l~ssless branch as adopted in [25].
A circuit ~ ~ a g r a m for simple power systems
Electric Power Industry R ~ § ~ c ~ ~ n g in China
equation (7.26~ we can obtain the c o n ~ b ~ t i o n o f each generator to the total r at each node from the following equation:
Thus the con~ibution factors can be readily calculated by equation (7.25).
generator by the f o l l o w i ~ ~ equation according to equation (7.2 1):
( ~ . 2 ~ ) 5 -1 B", =
After getting f ( k ) i , we can further allocate the loss of the transmission network to each
(7.30) k=l
where ~ Q w e v e r ~ the loss allocation robleni can be an independent problem. ~ h ~ r e f ~
need a ~athematical model for problem to allocate loss to each load or each gen To allocate the loss to each load, the key step is to calculate the losses of
is the loss allocated to generator 2.
~ j ( j ~ 1 , 2 , . . . , N ) . consists of two parts, as follows:
Firstly, the sum o f loss APg in the incoming line i j E ( j ) , where r- ( j ) denotes the
set of the in~oming lines of node j . S~cond~y, the loss of @, allocated "CO line ij
which can be calculated according to equation (7.24). Note that k ($ i j E l?- (9) . Tbe loss balance equations are as follows:
(7.31)
where ai(k) is the al~ocation factor de~ned in equation (7.23). For cQnve~~ence we can use
the following form to determine :
Here E";:L is the load power at node i . Equation (7.3 1) is a linear equation system including N unknown variables oq, which
be solved by a conventiona~ a l g o ~ t ~ . After so equa%ion (7.31) for ( i = 1,2,... N) loss allocation to the load at node j is then
13 I.
(7.33~
We can use a similar approach to foimulate the problem of allocating the loss to generators. Based on the discussion above, we may conclude that to solve the di factor or loss allocation pro~lem, we should first build and solve the linear equation (7.26) or equation (7.3 1). However, this approach is not ef~cient and not flexible, We will develop a very simple and efficient algorithm by means o f graph theory in the next section.

25 Power System ~ e ~ ~ c ~ r i n ~ and ~ e r e ~ u l a t i o ~
graph is a directe graph. At this stage, the direction of each the direction of its ctive power flow. Each b r ~ c h has its initial while each node has its outgoing lines and ~ n c Q n ~ i n ~ lines. The
number of outgoing lines at node i is denoted by d+(i), the n
~~ent ioned above^ the set of outg~ing lines is den
lines by r- (i). A directed path is formed along the direction of
are identical, we d terminal node o f a directe
to denote the resistance, r ~ a ~ ~ a n c e ,
er flow of branch k, and
If the follow in^ reIationship holds for each branch alon T in a load flow ~~~h~
then there exists no directed circuit in the graph. e use the methodo~og
follo~ving relations reduction to absurdi~. If the~e exists a
dB(k, =0 ( 7 . ~ 4 ~ keC
where AB(,, i s the phase angle ~f ference b e ~ e e ~ the two nodes of bran~h k, and can be
i (~.35)
equation (7.35) take the values at the terminal node of branc
k ) , then b6,k) > 0, and
exist in this situation.
ns. In case there i ch is certainly negl
When a directed graph has no dir~cted circuit, there are at 1 tidy d+(i) = 0,and d- ( j ) = 0 respectively.
~ s s ~ ~ e d, (i) > 0 holds for all nodes, i.e. each no e has at least one out
out from any node q, we can travel to the n ~ x t n
from n2 we can travel further to n3 by similar reasonin Thus there are only two pQs~~ble outcomes: one is that we ~ a v e in ~ m p o s s i ~ ~ e for a finite graph; the other i s that there exist dire
the c ~ ~ d i t i o ~ of the ~eorem.

Electric Power Industry R e ~ t ~ c ~ ~ n g in China 3
larly, we can prove the other half of the t~eorem. ~ o m b ~ i n g
h, there exists at least one node without an outgoin and one node without an i n c o ~ ~ g line.
e i is a node with d-( i ) = 0 on a load flow gra~hs. The ~rocess of
d its out go in^ lines r+ ( i) is called the e l i ~ ~ ~ ~ a ~ i n ~ p ~ ~ ~ ~ . ~ ~ for no
ow graph, a111 branches can be eliminated t ~ o u ~ h a recu~sive
raph by Y, and the b r ~ ~ h at least exists one node i,
cted circuit. Hence, there exists at can carry out an el~mination proce
so on. Thus we can e ~ ~ m i ~ a t e all branches by a finite (less than elimination ~rocess.
~ a ~ ~ n ~ out an e l i ~ i n a t i n ~ process for node i l , we get $ubgraph El'(
lain the e~imination pr~cess by a simple example, as raph has no directed circuit, and d - (1) =
lines 1, 2 and 3. A ~ e ~ eliminatin 7.9b, in which d"-(2) = 0. The
e l im in~ t~ node 2 and its out
and its out go in^ line 5, and thus w the above e~iminat~on proc cessively e l ~ r n ~ ~ m e s s can also be carried out by $uc~ess~ve~y eiim~ating the node with d+(i) = 0
its ~ n c o ~ ~ ~ g lines e(i). The co~espon ing de~n i t ion~ and t h e o r ~ m ~ are s i m i ~ a ~ to the discussion above.
~ r o b ~ e ~ s of load Raw anaiysi below, we will use PDF and P
location problem respec~ively~

Power System ~ e s ~ c ~ i n g and ~ e r e ~ ~ ~ t i o ~
i by equation (7.25).
Do the follow^^ for all j , ij E r+ (i). LA: Calculate loss allocation to the load of node i by e ~ ~ a ~ ~ o n (7.33).
F: Transfer the power of each generator at node i to node j
bji is defined by equation (7.27).
the loss of node j , Pj, according to Equation (7.3 1).
indicating that the node has been eliminated. . Search for the next node without ~ c o m ~ ~ g lines, until all
are ~limina~ed.
can §imi l~ly in~oduce an a l g o ~ t ~ ~ based on e~i~ inat ing ~n~oming lines. In this case, cal~ulated results for PDF are the d is~ ibu t i~n factors of ~ r a n c ~ e s used by loads; for
losses are allocated to generators. no~hwest power n e ~ o r k is calcu~ated by the ~ r o p o ~ e ~ aigori cost. The data used in the case study is real exchange p
i provinces dated I6 January 1998 as shown in Figure 7.10 a, The n in T ~ ~ l e 7.7 and the wheeling cost paid by Cansu province as
Figure 7.10 b. The calculation results are the wheeling cost paid shown in Table 7.7 and Figure 7.10 b. In Table 7.7, sum of wheel
y’ in the table refers to the energy loss cost, ‘Capaci erator capacity to compensate power loss, while ‘Line9 refers to ~ a n s ~ i s s i o n , The average wheeling cost of the day is 0.0247 yuanlktlrh.
.7
This chapter has described the Chinese power market that is an embryo which the state retains ownership of the generator§ and some of i n f ~ s ~ c ~ ~ e , but is ~pening up the market to limited c ~ ~ p e t i t i ~ n . Ele transmission loss methods have been proposed and examples of a simplified Chinese power system have been used to demons~ate the advantages derived from such ~ethods.
s
§uppo~ed by the ey Project of ~ a t i o n a ~ ~cience ~oundation of China. The authors would also like to thank IEEE for granting permission to reproduce the ~ a t ~ r i a l § co~ta~ned in reference [ 181.

Electric Power ~ n d u s ~ structuring in China 2
%e 7.7 Wheeling cost for Shaanxi and Qinghai power exchange
Exchange Loss of Line Using m e l i n g Cost (pan I kWh) Hour Power Wheeling Cost
Energy Capacity Line Sum CMW) W W > (Pan>
1
2
3
4
5
6
7
8
9
10
11
12
13
14
15
16
17
18
19
20
21
22
23
24
273
339
279
33 1
325
335
268 101
“122
-226
-172
-260
-165
-189
-143
-197 -293
-305
- 30 0
-116
-210
0
154
10.29 4410
13.29 4510
7.68 2410
11.63 3630
11.83 4200
14.80 5640 7.52 2920
0.1 1 1080
3.37 2160
5.58 2170
5.25 1870
5.84 3760
1.71 2370
3.34 2660
2.15 2400
2.66 3280 7.46 4090
8.29 3130
0.83 420
0.00 0
1.88 I220
3.00 2700
0.00 0
0.75 1100
0.01 1
0.012
0.008
0.01 I
0.01 1
0.013
0.008 0.001
0.008
0.007
0.009
0.007
0.003
0.005
0.00s
0.004
0,008
0.008
0.008
0.000
0.005
0.004
0.000
0.001
0.006
0,005
0.004
0.004
0.005
0.006
0.004
0.001
0.004
0.003
0,004
0.003
0.002
0.003
0.001
0.002
0.003
0.004
0.004
0.000
0.002
0.002
0.000
0.001
0.016
0.013
0.009
0.011
0.013
0.0 I7 0.01 1
0.0 17
0.018
0.010
0.01 I 0.014
0.0 14
0.014
0.017
0.017 0.014
0.010
0.014
0.000
0.01 1
0.013
0.000
0.007
0.033
0.030
0,021
0.026
0.029
0.036 0.023
0,019
0.830
0.020
0.024
0.024
0.019
~ . ~ 2 2
0.023
0.023 0.025
0.022
0.026
0.000
0.018
0.019
0.000
0.009
[I]
[2] [3]
[4]
S.Q. Gao and P.L. Chi, Several Issws Arising During the Retracking of the Chinese Economy, Foreign Language Press, 1997, J.P. Sun, Electric Power Industry in China 1999, China Electric Power Information Center. W. Sweet and M. Hood, ‘Can China consume less coal?’, IEEE Spectrum, Vol.36, No.11, November 1999, pp.39-47. M Hood and W Sweet, ‘Energy policy and politics in China’, IEEE Spectrum, “J01.36, No. 1 1, November 1999, pp.34-38.

. .-
0.04
0.03
0.0
0.01
0 9 10 11 12 13 14 15 16 17 1 ~ - - - -..
~ e e l ~ n g cost for $ ~ a ~ x i and
the Electric P o w e ~ I ~ d ~ s t ~ , 1998, pp .~~6"141~ Shi Yubo, 'Take vigorous action to promote power industry's reform and ~ ~ v e ~ o p ~ ~ ~ ' , ~ ~ i ~ f f Power E ~ ~ e ~ ~ ~ s e ~ Q ~ Q g e ~ e ~ ~ ~ No.1, 1999, pp.7-8.
[ S ]
Electric Power I n d u s ~ ~ e $ ~ ~ c ~ r i n g in China 7
[ lO] Zhang Shaoxian, ‘Clear up reform i as and initiate a new chapter o f p~fess iona~ ~ ~ a g e m e n t ’ , China Power Enterprise ~ a n a g e ~ e n t , No. 1 1, 1998, pp.4-5.
[ l l ] Ciao Uan, ‘On the second step reform of the State Power Corporation o f China’, China Enferpp~~e ~ a n a ~ e ~ e n ~ , N0.2, 1998, pp.4-5.
[12] Lu Yanchan~, ‘A ~ e ~ ~ d e ~ t a n ~ n g about the simulated power market practice’, Chinina Ente~prise ~ a n a ~ e ~ e n ~ , No.4, 1998, pp.8-9.
[I31 Wang Yoii~ian, ‘Strive to accomplish two reform in thee years and basidly feaIize equal China Power Enterprise ~ inanag~~ent , No. 12, 1998, pp.16-18. books on energy pricing’, IEEE Spectrum, Vo1.36, N0.12, ~ ~ c ~ m b e r
sector decision making in China’, IEEE Winter Power ~ e ~ t ~ n ~ , 1999, pp.59-63.
rprise ~ ~ n a g e ~ z ~ ~ ~ , No. 1, 1999, pp. 16-1 8.
pp.~405-1413. [21] CXgiRE Task Force 38.04.03, ‘ ethods and tools for transmission costs’, Elech, No. 174,
~ctober 1997. n p r o ~ d ~ g in te rco~ecte~ opera~ions services by the end user Case tioopral Science ~ o u n ~ a t ~ o n Workshop, Nove~ber 1996.
aliana and Mark Phelan, ‘Al~oca~ion of transmission losses to in a ~mpetit ive enviro~ent’ , IEEE Transac~ions on Power stem^, Vol. 15, No. 1, ~ ~ b ~ a ~
Tomas G o ~ a l e z Garc~a, and er losses’, IEEE Xra~saction on
nd load distflb~tion factors for supple me^^ char~e a l l~at ion in ~ ~ s ~ i s s i o n open access’, IEEE ~ransa~t~ons on Power S y s t ~ ~ s , Vol. 12, No.3,
to
~ n ~ ~ r n a t i o n a ~ ,Iournal afElectric Power and Enerm Systems, Elsevier Science Ltd, Novem~er
2000, pp.143-150.
1997, pp.l189-1193.
~ompu~~tional efficient a lgo~~hms for ~a~smiss ion 10s s’,
L.L. Lai, J.T. Ma, N. ~ a j ~ ~ a ~ , A. ~ ~ d a , and

Prof. Vijay K. Sood
Canada
In recent years, major changes have been introduced into the s ~ c ~ r e of electric power utilities all over the world. The reason for this was to improve ef~ciency in the the power system by means of deregulating industry and opening it
e~t ion. This is a global trend and similar ctural changes have o c ~ u ~ e d el~ewhere in other industries, i.e. in the teleco~unications and air~ine ~ ~ s p o r t a ~ i o n indus~ies. The net effect of such changes will mean that the ~ansmissi5n~ generation and dis~ibution syst~ms must now adapt to a new set of rules dictated by open r n ~ ~ e ~ s . In t rans~~ssion sector of the power utility, this adaptation may require th ~ o d i ~ c a ~ i o n of interconnections between regions and countries. further more^ the
ptation to new generation patterns will also necessitate a ~ p ~ t i o n and require in~reased xibility and availability o f the transmission system. Addin to these problems has been
the growing env~ronmen~al concern and constraint upon he righ~s-of-way for new i n $ ~ l a t i ~ n § and facil~ties. Yet further d e m ~ d § are c o n t ~ u a l l ~ being made upon u t ~ ~ i ~ ~ e ~ t supply increased loads, improve reliability, delivery energy at with ~ ~ ~ ~ ~ v e d power quality. The power industry has respon the ~ e c ~ o l o ~ y of flexible AC ~ansmission systems or e n c o ~ ~ ~ s s e $ a whole family of ower electronic controll achieved maturity within the industry whilst some others are as yet in the design stage. FACTS have been de~ned by the IEEE [4] as:

Flexible AC Transmission Systems (FACTS)
A power efectroiiic based system and other static equipment that provide control of one or more ac transmission system parameters to enhance con~ol~abi~ity and increase power transfer capability.
For ma~~u fac~re rs of electrical equipment, this challenge provides an o p p o ~ n i t y to build equipment that is reliable, flexible and relocatable since planners now d e m ~ d r adaptation to chang~g syste
FACTS rely, to a large upon advances made in power electronics (PE) and microprocessors. The PE tec , well known in low-power industrial applications, has now migrate^ to hi~h~power utility applications because of the economical availability of reliable high-power switching devices (i.e. thyristors, GTOs and IGBTs). Note that developmen~s in other related areas such as communication systems (using fiber-o etc.), super conducting materials for energy storagc and metal oxides for surge arrestors will also play important roles in the continuing growth of FACTS applications. This tec~o logy will impact on all aspects ofpower system operations, for example, in:
generation systems (i.e. from hydro, thermal, wind or photovoltaic means), storage systems (Le, by conversion of energy from AC to DC, DC to AC, transmission systems (i.e. by the rapid control of system parameters such as voltage, current, imp~dance and phase angle), dist~bution systems (i.e. by the rapid circuit or current i ~ t e ~ p t i o n for purposes), and consumer systems (i.e. by the power conditioning of consumable energy).
F a ~ i c u l ~ l y for transmission systems, FACTS technology offers the fo~ lowin~ ~ossibilit~es:
e Greater control of power, so that it flows on the prescribed ~ ~ ~ s m i s s i o n routes. Secure loading (but not overloading) of transmission lines to levels nearer their thermal limits. Greater ability to ~ r ~ ~ f e r power between controlled areas, so that the reserve margin ~ typically 18% - may be reduced to 15% or less. Preve~t~on of cascading outages by limiting the ef3ects of faults and equip men^ f a i l ~ e . ampi in^ of power system oscillations.
6p
Static var compensators (SVC) is an example of a mature FACTS applica~io~. Other more novel ap~lications (i.e. STATCOM, UPFC) are being developed and tested to provid~ increased flexibility, enhance stability arid transmission capacity in the operation of power systems. The present environment of deregulation and constraints on building of more tra~smiss~on ~aci~ities provide compelling reasons to develop FACTS c o n t r o ~ ~ ~ ~ s ~ The ~provement of a deteriorating power quality will be an additional focus for FACTS controllers of the future,
8.1.1 Benefits of FACTS Technology
The two main objec~ves of FACTS controllers are:
* to i n c r e a ~ ~ the power transfer c a p a b ~ ~ ~ ~ of tr~smission networks, and

260 Power System Restmcturing and ~ ~ r ~ ~ l a ~ i o ~
ravide direct control of power flow over des~gnated ~ r ~ s m i s s ~ o n routes,
ible AC system owes its tighter transmiss~on control to its ability to m ated parameters that constrain today’s AC systems, ~~c lud ing s e, phase angle and the ~ c ~ ~ ~ n c e of osc~~~ations at various ~equenc~es below the
rated ~ e ~ u e n c y .
Power flow over a transmission system is limited by one or more o f the fo~lowin~ [4]:
system stability,
vol~age limits, loop flows,
1 limits of either lines or terminal equi hart circuit level limits.
itations on power transfer are primarily inter re~ated e ~ e c ~ c a ~ parameters including vo reactive and ~ t i v e power. ~igh-speed control of any one or more of these parame~ers with
liminary studies of several ~ y s t e ~ s have shown that FACTS controllers can provide economic sol~tions to some of these p ~ o ~ ~ e m $ . A discussion of each of the above-~entio~ed i imi~tions is provide^ next.
E controllers will enhance the value of AC transmission assets.
This requ~es the power system to retain a margin o ~ystem and still main~ain s ~ c ~ o n i s ~ . Sin nd are able to eontrol the
for avoiding the addition ofne traints [4] could be hrther spli
er system to ~ a i n t a i ~ s y n c ~ o ~ i s m for ion. A n u ~ b e r of e~ample§
lled series capacitors, high i ~ i t ~ a l few seconds after a major p rove the performance by the use of, s
exci~ation systems and the implementation t ~ m p i n ~ concerns the ability of a ns once initiated by a small disturb
include power system st
it describes the situation when the next i n ~ e ~ e ~ t of load causes a voltage collapse in the power system. This v o l ~ g e reduc~on is g
occu~ing over time periods ranging from many secands that are used to improve VSL, include operator action, a
~o~pensat ion, genera to^ or sync nous ~ondens~rs and
Flexible AC T~ansmission Systems (FACTS)
-sync~onous resonance (SSR) is due to interactions b e ~ e e n the series- compensat~d AG power ~ansmission system and torsion v ib~ t ion gene~tor units. This issue is dealt with by cons~ainin c o ~ ~ ~ n s a t ~ ~ ~ i p e ~ i ~ e d to safe limits; usually this level is that desired for
system security. Appro~hes that are used to improve SSR condi of series capacitors dur in~ unsafe operation^ passive series blo
tor exci~ation or SVC on the generator bus. Ge lied to c o ~ e ~ any une~p~cted contin~enci~s.
8.2.2 Loop Flows
ows occur as an unwanted result of the operation of the interconnected ~ a n s m ~ s s ~ o n are dictated by e lec~ ica~ circuit laws (i.e. Ohm’s and ~ r c h h o f ~ s laws). These
at steady state where the undesired loading affects the v n of thermal or stability limits, These effects are address or by series capacitors. The new FACTS con~o~ lers ver, since speed of opera~~on is not a major c o n c e ~ in this
problem, c o n ~ o ~ ~ e r s will be justified onIy if .frequent a d j u s ~ e n ~ s are require
V o ~ t a ~ e c o ~ ~ o ~ is accomplis~ed by a co~binat~on of genera~or reactive fixed or mechanica~ly s w ~ ~ c ~ e d reac~o~s~ca~acitors and m e c ~ a ~ ~ c a ~
ent,
~ a n s f ~ ~ e r s . ~~~t reactive equipment is used for coarse control while the ~ e n e ~ ~ ~ o r s prov~de v e ~ i e ~ con~ol.
On
Thermal limits are inherent in ~ansmission systems owing to both line c o ~ d u c ~ o ~ ~ series equipment (i.e. ~ a n s f o ~ e r s , reactors and series capacitors). Trans~ission lines ope~ated below these limits to provide s e c u ~ ~ in the event of a role of FACTS c o n ~ o ~ ~ e r s will be to use this inherent thermal capacity in a more e f ~ c ~ $ n t and secure manne~.
8.2.5 High ~ ~ o r t - ~ i ~ c ~ ~ t Level Limits
The p r o ~ ~ e m of exce$sive sho~-c i rcu~~ level can be quite difficult and expen§ive to c o ~ e c ~ dition is made to the ~ansmiss i~n system. This can result in
sho~-ci~cuit levefs c r ~ e ~ i n g up in sub-~ansmiss~on equipment.

262 Power System Restructuring and
Y The IEEE definition of a FACTS controller is:
A power electronic based system and other static equipment that provides control of one or more ac transmission system parameters.
The technology concerning FACTS is well known in the low-power industrial applications field, but is relatively less well known in the utility power field. This technology is intimately concerned with developments in the follow~ng two areas [S]:
Power electronic switching devices and pulse width modulated (PWM) converters. Control methods using digital signal processor (DSP) and ~icroprocessor technology.
Developments in both areas are advancing rapidly, and need to occur further before a~plications in the power utility field appear econo~cal ly attractive. App~ications of PE in the power utility field still need further research in the following areas:
active harmonic filtering and reactive/active power support, single-node or area-wide application, c~mpensation of non-linear loads, and transient performance of the controller.
8.3. I
Of the switching devices presently and potentially available within the near future (next >, the gate turn-off (GTO) thyristor and IGBT are the most promising. However,
in the longer future (10 years), competition for these switching devices will occur from ~ ~ S ” c o n ~ o 1 ~ e d thyristor WCT) devices. A ~ m p a ~ s o n of the various ~ower -sw~~h ing devices is presented in Table 8.1.
wever, owing to the higher switching losses in G devices, the ~ a x ~ u ~ ng frequency operation is limited to less than about 1 z. F u ~ e ~ o r e , owing to
the switching and drive characteristics of the device, it has been feasible to operate devices in parallel for high power applications. Some limited success in the series op~ration of devices has been reported, but again this remains a l~mitation~
Power Switching Devices and P WM Inverter
r increasing the rating capability of a FACTS converter on appears to be the use of several converters op hing frequency presente~ to the total filter can als
shifting the switching functions of individual inverters, and by converter ~ a n s f o ~ e r s , A new possibility exists with the use of ~ulti-level converters.

Flexible AC Transmission Systems (FACTS) 3
T h ~ ~ ~ s t ~ r ThyristQ~
Max. voltage 8000 6000 1700 2500 3000 1000 rating (V) Max. current 4000 6000 800 800 400 100 rating (A) Voltage Sym./ Sym./ Asym. Asym. Sym./ Asym.
blocking Asym. Asym. Asym. Gating pulse Current Voltage Current Voltage V o ~ ~ g e
Conduction 1.2 2.5 3 4 1 .a Resistive drop 0') Switching 1 5 20 20 20 100 frequency ( k w ~evelopment 10000 10000 3500 5000 5000 2000 target max. voltage rating (V) Development 8000 8000 2000 2000 2000 200 target max. current rating
4 GTO : Gate Turn-off thyristor
IGBT SI : Static Induction thyristor MCT : MOS-controlled Transistor MOSFET : MQS Field-effect Transistor.
: Insulated Gale Bipolar Transistor
Two versions of switching converters are feasible depend storage device utilised is an inductor or a capacitor. When the storage device is an inductor, the converter is called 8 current source converter (CSC); when the storage device is a capacitor then the conve~er i s called a voltage source conve~er (VSC). A n~ticeable change in converter topology usage will be the increasing use of VSCs instead of CSCs used in traditional HVDC transmission. The VSC will find applications in advanced static var co~pensators (ASVCs), active filters, S T A T C Q ~ ~ , etc. The main reasons for this change are that VSCs are smaller and less expensive than CSCs; ~ ~ h e ~ o r e , VSGs are expandable in parallel for increased rating. A brief comparison between VSCs and CSGs is given in Table 8.2.

264 Power System Restructuring and Deregulation
le 8.2 Comparison of current source versus voltage source converters
Voltage source converters Current source converters
Use inductor L for DC-side energy storage Use capacitor C for DC-side energy storage
Cons~ant current
Fast accurate control
Higher losses
Larger and more expensive
More fault tolerant and more reliable
Simpler controls
Not easily expandable in series
Constant voltage
Slower control
More efftcient
Smaller and less expensive
Less fault tolerant and less reliable
Complexity of control system is increased
Easily expanded in parallel for increased rating
T r a ~ ~ ~ ~ o n a l power converters used line-commuta~ed thyristors as their active switch~ng elements, but next-generation converters will exploit self-commutated CTO thyristors in the near-term future, and will probably exploit lGBT and/or MCT devices in the long- re^ future. The basic PE building blocks will comprise either the:
anti-paraIIe1 thyristors which will be used to control irtduclivelcapacitive i~pedan~es , or six-pulse CSC or VSC unit, employing multi-level operation (with or without multi- hase ~ ~ s ~ ~ ~ e r s ) to increase the pulse number (up to 48 pulses), to reduce ~ a ~ o n i c
~eneration. The basic switching elements will be the anti-parallel G ~ ~ ~ ~ i o d e or IGBT-diode unit,
e
Control ~ e ~ h o ~ ~ and D ~ P / ~ i c r ~ ~ r ~ c e s s o r Technology
Control eth hods based on either the time or freque~cy domain are feasible. These ~ e q ~ i $ e i n s ~ n ~ n e o u s monitoring techniques and complex computation of switching ~nc t ions for the firing of the converter switches. A comparison of the control methods in the two d o ~ a i n ~ is made in Table 8-3.
Comparison of time domain versus frequency domain comp~nsation
~ r e q u e ~ c y d~ma in
Complex measu~ements and analysis
Computational burden is high
Depends on periodic characteristics of d i5~0~ ion
Fast response Slower response
Easy to implement
Computa~ional burden is low
Ignores past periodic characteristics
wing to the complex switching functions required and the c o ~ ~ ~ ~ ~ t i o n a l burden necessa~, exten~ive use of DSPs and microprocessor technology will be required in a power system environment. Utilities have some experience with HVDC ~ e c ~ o l o g ~ , SVCs
rotection relays which use microprocessor-based controls. However, the application of FACTS devices is likely to be at a greater level of complexity than anything
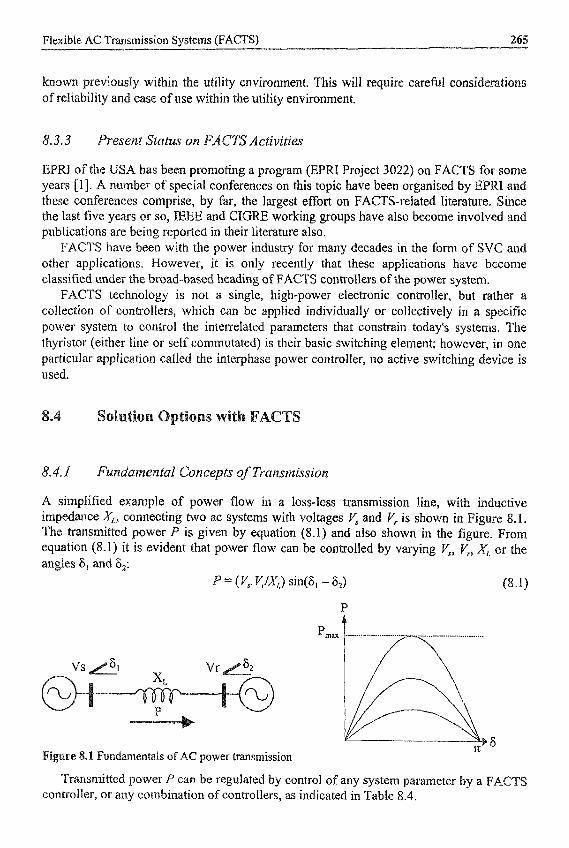
Flexible AC ~ r a ~ ~ ~ i s s i o n Systems (FACTS)
known previously within the utility environment. This will require careful considera~ions of re l~ab i l i ~ and ease of use within the utility environment.
8.3.3 F ~ e s e ~ ~ ~ t ~ ~ u ~ on ACT^ Activities
EPRI of the USA has been promoting a program (EPH Project 3022) on FACTS for some years [ 11. A number of special conferences on this topic have been o r g ~ i ~ e d by E these conferences comprise, by far, the largest effort on FACTS-related literature. Since the last five years or so, IEEE and CIGRE working groups have also become involved and pub~~cations are being reported in their literature also.
FACTS have been with the power industry for many decades in the form of SVC and other applications. However, it is only recently that these applications have become classified under the b ~ ~ a d - b a s ~ ~ heading of FACTS controllers of the power system.
FACTS technology is not a single, high-power electronic controller, but rather a collection of controllers, which can be applied individually or collectively in a specific power system to control the intenelated parameters that constrain today's systems. The thyristor (either line or sclf commutated) is their basic switching element; however, in one particular application called the interphase power controller, no active switching device is used.
8.4. P
A simplified example of power flow in a loss-less transmission line, with inductive impedance X,, c o ~ n e ~ ~ i n g two ac systems with voltages V , and V, is shown in Fig~re 8.1. The transmi~ed power P is given by equation (8.1) and also shown in the figure. From equation (8.1) it is evident that power flow can be controlled by varying 5, Y,, X, or the angles 6, and 6,:
~ ~ n ~ a ~ e ~ ~ ~ ~ Concepts of ~~ansmission
P = (V,. VJX,) sin(&, - 6,) (8.1)
n .1 F u ~ ~ d ~ r n e n ~ l s of AC power transmission
Transmitted power P can be regulated by control of any system parameter by a FACTS controller, or any combination of controllers, as indicated in Table 8.4.

66 Power System Restructuring and Deregulatbn
.4 Control of system parameters by FACTS controllers
Voltages V, and V, Shunt SVC, STATCOM
~mpedanc~ X, Series TCSC, IPC
Angles 6 , and 6, Phase angle regulator TCPAR
The FACTS app~ica~ion§ have been split into the fo~~owing categories d their mode of operation:
Control~ers which act in shunt to the ~ a n s ~ s s i o n system. Controllers which act in series to the tra~smiss~on system. Controllers which act in a se~e§/s~unt combination. Controllers which alter the phase angle between voltage an A special category which encompasses HVDC controllers and any remaining controllers .
Details of these various c a ~ g g o ~ ~ s are provided in the following sections.
8.4.2 Shunt Controllers
reactive power com~ensation since the mid t for arc furnace flicker compensation and then in power ~ansmission systems first 40 MVAr SVCs was installed at the Shannon Substation of the ~ inne§ot
ystem in 1978. At present some 300 SVGs with an installed capacity of 4~,000 s are in service all over the world. The SVC results in the ~ o ~ ~ o w i n ~ b e n e ~ t ~ [S]:
voltage support, transient s ~ b ~ l ~ t y im~rovement, and power system oscillation damping.
A l~~ough many versions of SVCs exist [9] (i.e. variants are TSR, TG common one (Figure 8.2a) usually employs (either thyristor or mec~a~ically) switch capacitors and ~ ~ ~ s t o r - c o n ~ o l ~ e ~ reactors (TCRs). With an appro the capacitor switching and reactor control (Figure 8.2b), the var cont inuo~sl~ and rapidly ~ e ~ ~ e n ~apacitive/inductive values. It maintains the steady state and dynamic voltage at a bus within bounds, and has some ability to control stabi l i~, but not much to control active power flow.
Flexible AC Transmission Systems (FACTS) 267
%“=Capacitive Ratlng Conanuous Inductive R%ng
(a) (b)
fig^^^ 8.2 (a) The SVC and (b) its V-I characteristic
S ~ a t ~ c ~ Q n ~ ~ e ~ s ~ t o ~ (ST The S T A ~ C ~ ~ ~ a solid-state voltage source inverter coupled with a transformer, is tied to a transmission line. A STATCOM injects an almost sinusoidal current, of variable ma~i tude, at the point of connection. This injected current is almost in quadrarure with the line voltage, thereby e ~ u l a t i ~ g an inductive or a capacitive reactance at the point of connection with the transmission line. The hnctionality of the S ~ A T C O ~ model is verified by regulating the reactive current flow through it. This is useh1 for r e g u l a ~ ~ n ~ the fine voltage.
An advanced static var compensator (ASVC) [ 101 using a voltage source inverter (VST) is shown in Figure 8.3a and its V-i characteristic is shown in Fi 8.3b. The VSI is
storage capacitor to generate an output AC voltage V,. When V, equals AC bus, the VSX draws no current; when Vo > V, the current drawn by
the leakage impedance of the transformer i s purely capacitive. On the other hand, when V, < V then the c ~ e n t drawn is purely inductive. The ~ n c t ~ o n a l p e ~ o ~ a n c e of the A superior to the t r~d~t iona~ SVC.
Tran smmion 1 ine
Couptiiig *amformer
DC storage capacitor
(a)
pu Voltage Tram ive Rating
Figure 8.3 (a) STATCOM application and (b) its I/-I characteristic

2 Power System ~ e 5 ~ c ~ n ~ and ~ e r ~ ~ l a ~ i o n
The ~ ~ V C is also superior to the conventional SVC for the fo~lowing reasons:
eduction in outdoor area requirement, since it replaces the ~ o l u r n ~ ~ o ~ i s
roved dynamic p e r ~ o ~ ~ c e and enha~ced s ~ b ~ l i ~ due to its a ~ ~ i i ~ to ~ n ~ r e a s ~ siently tbe var generation. roved per fo~ance at low operating vo~~ages down to
capacitor/reactor banks associated with a conventio~al SVC.
by t r ~ $ f o ~ e r leakage). Reduced need for AC filters.
ve r e f ~ e d to the ~ ~ O - ~ a s ~ d system as functional operation of this device is, howe ous condenser, but without the slow response t
ent practice is to refer to these as STATC generates a three-phase volt a reactance. When the AC
i ne~ ia and so it was briefly own as the ‘Static Sync
(lower) than the bus voltage, the current flow is cause eS how ~ u c h ~ u ~ e n ~ flows. This allows the control of
on and to prod~ce pra~tically sinus0 is s h o ~ ~ ~ ~ i ~ ~ 8.3b.Tlie STATC
re effective than the SVC in providing voltage support

FIexibIe AC ~ ~ s m i s s i o n Systems (FACTS) 269
Acts as a voltage source behind a reactance
Insensitive to transmission system harmonic resonance
Was a larger dynamic range
Lower generation of harmonics
Faster response (within ms) and better performance during transients
Both inductive and capacitive regions of operation possible
Can maintain a stable voltage even with a very weak AC system
Can be used for small amounts of energy storage
Temporary overload capability translates into i m u ~ o ~ e d voltaae stabilih,
Acts as a variable susceptance
Sensitive to transmission system harmonic resonance
Was a smaller dynamic range
Higher generation of harmonics
Somewhat slower response
Mostly capacitive region of operation
Has difficulty operating with a very weak AC system
, based on IGBT switches, and capable of operating at swi~c~ing been developed. The core parts o f the plant, compris~n
s, control system and the valve cooling system, are fitted into a container with a of 10x20 rn. The outdoor equipment i s limited to heat exchangers, air-c utation reactors and the power transformer. A rating of rl: 100 Mvar per converter i s availab~e~ in case of increased rating, multiple units can be operated in parallel. The modular design makes it easily relocatable to another site when desired to meet hanging s y s t e ~ ~ needs. The response time of this unit i s very fast (about o n e - ~ u ~ e r cycle). As a result of its high switching frequency, the plant can operate without h a ~ o n ~ c filters, or may only require a small high-pass filter. The risk for resonant condit~ons is heref fore negligible. ~ u r t h e ~ o r e , the possibility of active filtering of h a ~ o n i c s already p~esei~t on the network makes this an attractive choice.
mat~hing the ~ ~ r ~ i ~ ~ e mechanical power and the generator electrical power during system faults. This can be done by i n t r o d u c ~ ~ ~ either a series or shunt braking resistor. Shunt resistors are p r ~ ~ e r a b ~ e because they are less expensiv~ and easier to coordinate in a system with any and lines. Moreover, a §hun~-connecte~ thyristor-controlled resistor with a radial transm~ssion line can be used ef fec~~ve~y to damp power swing oscillations [13] in a transmission system.
esigned to provide post-fault AC system speed control by compensatin~ for fault accelerating power by dissipation in a shunt resistor. A pair ofback- to-back ~ y ~ ~ s ~ o ~ (Figure 8.4) does the application of the shunt resistor, The application of braking resistors should take place as soon as possible after fault detection and they should not be switched out until the derivative of the swing curve becomes negative. The ~ating of
These systems are

70 Power System R ~ s ~ ~ c ~ n ~ and D ~ ~ l a t i o n
the resistor should be such that the kinetic energy injected by the fault sho~ld be before the generators slip the first pole.
-& .4 Dynamic brake application
The ~eliability and effectiveness of braking resistors have been demons different projects:
PA's Chief Joseph substation, 1400 MW, 3 seconds, 230 kV system; C Hydro's G.M. Shrum substation, 600 MW, 20 seconds, 138 kV sys~em;
3. Argentina El Chocon Project.
asically LT changers regulate the output voltage when subjected to variations in the input voltage due to c h ~ g i n g system conditions. M e c h ~ i c a ~ versions were used widely in the i n d ~ s ~ for many years. These mechanically operated load-tap hanging transfo now have th~§~or-opera~ed switches (Figure 8.5) to do the same function faster [14]. This permits the improvement of system stability and damping of the power system osci~l~tions.
High speed static tap changer
use a super conducting coil acts as a b~f fer between the
power generation and load consum~tion and aids in the load levellin~ and matching (within a few cycles) of the two, enabling a greater control and flexibili power system [IS]. The benefits of energy storage systems are offset by the losses of s t o ~ n g energy. The round-trip efficiency of a SMES system is claimed to be
90%. The SMES coil is fed by a current source GTO inverter h m the AC n required, the SMES can supply transient active or reactive powe~ to the AC
supply to support it. The technology holds promise for improved en 9 d flexibility to meet peak utility system loads. A multi-temi P to act as a power flow control device also [6,7]. A fairly rec
Flexible AC Transmission Systems (FACTS) 71
suggested the use of a SMES system for SSR damping of turbine generator units. A SMES unit has been in com~ercial use on the BPA system.
I Superconducting Coil
~ i ~ M r e 8.6 SMES operating principles
imilar to a large uninte~pt ib le power s~pply. A VSC connects the DC battery to the AC system. Such applications provide load-levelling benefits and act as a spinning reserve on islanded networks. Modulation o f the 10 MW BESS at Chino has increased the transfer capability from Arizona to California by several hundred megawa~s.
Battery storage has been applied at a number of locations including:
an 85 ~ ~ / 3 0 minute system in ~ e ~ ~ i n in 1986, a 10 MW/4 hour station commissioned in Chino, S . California, in 1988 [17], and a 20 MWI4 hour station commissio~ed in Puerto Rico,
8.4.3 Series C o ~ t r ~ l l e ~ ~
g AC lines for increasing line loa~bi l i ty has been known for a long time. Adding a isto tor-controlled series capacitor ( however, is a more recent pheno and provides greater flexibility in ~ a n s ~ i s s i o n . A TCSC can vary the ission line impedance continuously below and up to the line’s natural to force power flow along a ‘contract path’. The advantages of the TCSC are:
ability to mitigate sub-sync~onous resonance (SSR), ability to balance three-p~~se power flow, ability to control power flow flexibly, ability to reduce short-circuit currents by rapidly controlling the capacitive to ~nductive impedance, and ability to damp power system oscillations.
The controlled series compensat~on installation will likely have two key componen~ (Figure 8.7). One element will be the mechanically switched portion, and the second will be the thyr~stor-con~rolled portion. The relative sizes of the fixed and con~o l~ed mode portions will vary with appl~cation. The TGSG portion i s made up of a number of small series-connected modules. Each module is either inserted (with the thyristors blocked) or b ~ ~ s e ~ (with the ~ y r i § t o ~ s fully conducting). In this manner, a stepwise ~ o n ~ o l is

27 Power System ~ e ~ t ~ ~ ~ r i n g and Deregulation
ach~eved with minimal losses and harmonics. There also exists the possibi~ity of op~ra~ing in a vernier mode where partial conduction of the lhyristor path during each-kalf-cycle is used to circulate inductive current through the capacitor and boost its effective ohmic value. One advantage of such small-signal ~ o d u ~ a ~ i o n is the control of S
Transmission line
5% sections
Breaker switched
.7 Thyristor-controlled series capacitor
A new control scheme with a TCSC [IS] indicates that a method of modula~ing the firing angle can be used to boost the series capacitor voltage and virtually eliminate the possibil~~y of SSR oscillations. A phase-locked loop (PLL) is used for synchron~s~ng the thyristor firing with the line current rather than capacitor voltage for a more stable operation.
~~~~~ ~ ~ n t r ~ ~ ~ e ~ (I IPC [19,20] does conlain any PE equipment, it is included here as a
FACTS device that can aid in the ma~agemcflt of power flow between two synchronous s y s ~ e ~ s . The basic IPG consists of a series-connected device c o ~ ~ r i s i t ~ g two susce~~nces , one inductive and the other capacitive, subjected to properly ~ h a s e - s h ~ ~ e d voltages. Thus, whatever the angle 6 at the TPC terminals, some of the cQmponents are always subjected to
voltage. By adju§ting the value of these compo~en~s, it is always ~ o s s i b l ~ to force t in each of the networks even if the an~ Ie at the t e ~ i n a ~ s is zero. When all
are energised, the ampI i~de and phase angle of the c u ~ e n t are set in one of s to wh~ch the IPC is coniiected. This current contro~ thus en
d reactive power through the device. any types of IPC are possible and each type can have d i f fe~~nt con~gurations~ In one
type cai~ed the IPC 120 (Figure 8.Q the voltage phase shifts are achieve^ with a cross- connection between phases using an inverting transformer to reduce the voltage ~ a g t ~ ~ ~ d e applied to the reactive compQnents. One practical appl~cat~on of such an ~ n s ~ l ~ a ~ i o n has appeared in ~ e ~ o n t ~ USA.
group of three-phase reactors and c a p ~ c i t o ~ ~ , eac ~ ~ s ~ l ~ e d in series between two AC systems. The IPC is different from other series corn nsation devices in the way the series elements are connected. For exa of the s ~ n ~ i ~ ~ end system i s connected to phases Thus, whatever the angle B a IPC t e ~ ~ ~ a I s , some of the ~ o ~ p o n e n t s are always subjected to a certain voltage. adjusting the value of these components, it is always po§s~b~e to force a current in ystem even if the angle is zero. ~ e n all co~ponen~s are. ener~ised the amplitude and phase angle of the current are set in one of two buses to which the IPG is connected. This current control thus enables the power carrie to be set, as well as the reactive power ~bsorbed or generated at one ofthe buses,

Flexible AG Transmission Systems (FACTS) 73
r
VCS
.8 Three-phase diagram of the IPC 120
The SSSC, a solid-state voltage source inverter [21,43,44], coupled with a transfornm, i s connected in series with a transmission line. An SSSC (Figure 8.9) injects an almost sinusoidal voltage, o f variable m a g n ~ ~ d e , in series with a transmission line. This injected voltage is almost in quadrature with the line current, thereby emulating an inductive or capacitive reactance in series with the transmission line. This emulated variable reactance, inserted by the injected voltage source, influences the electric power flow in the transmission line.
dc bus
.9 Static synchronous series compensator
er c o ~ ~ r o ~ l e r cu~ent ly in use is the ~ ~ ~ ~ S S ~ ampe~ [22] to ~ o ~ n t e r was first o b s ~ ~ e d at the $quare utte ~roject. SSR ins~bilities are at. times an side effect of us~ng mec~anical~y controIled series capacitors to a t r ~ n s m i s s ~ ~ The ~ e n e ~ ~ s of a ~ ~ i ~ g series ca~acitors are to lower the line’s i m p ~ ~ ~ c ~ , ~ ~ c r e a ~ ~ ~ o w ~ r
sists of baclc-to-~a~k thyristors connected in series with a ss the series capacitor (Figure 8.10). The operat~on of the
damper is based on two principles. ne is to fire the switch 8.33 ms after each zero crossover of the capacitor’s vol e, or half a cycle (or 180 degrees) at 60 13%. But if the voltage wave contains other frequencies9 some half-cycles will be longer than 8.33 ms. In this case, the valve firing at 8.33 ms causes some current to flow during the exten~ed part of the half-cycle and damps the oscillations. The second principle is to fire the switch somewhat earlier tlxan 8.33 ms or less than 180 degrees following the voltage zero
274 Power System Restructuring and Deregulation
crossover. Earlier firing causes the impedance of the combined circuit to be more negative than that with the capacitor alone, thus de-tuning the circuit. F u r t h e ~ o r e ~ b~modulation of the firing angle, the impedance can have a powerful damping effect at any unwanted frequency below the main frequency. Similar effects can be achieved with HVDC controls. A l ~ e ~ a t i v e l ~ , active filters can also be used.
Transm
- set t ime
resonance damper
S controller for using a TCSC to damp out SSR-related problems was presented in [ 1 87. The new method controls the amount of voltage boost of the TCSC that makes it exhibit a virtually inductive impedance in the frequencies from 15 to 45 Hz where SSR problems may exist. Basically, the TCSC firing angle is modulated to provide damping at SSR frequencies.
he team at the Kayenta ASC [24] showed similar results that the TCSC exhibits an inductive impedance at sub-synchronous frequencies~ and the danger from SSR problems was alleviated. However, the main SSR danger resulted from the unco~troiled portion of the series capacitance in the transmission tine.
PE switches (either thyristors or GTO thyistors) can be used to interrupt AC currents. The thyristor depends on current interruption at the natural zero crossover point of the fault current, whereas the GTO thyristor may intempt at a specified current setting (which is below its interruption capability). Such static switches have been applied mainly to distribution systems where the switch ratings are lower [25]. The static breaker can have two parts in it, one a static switch and another a current limiter (Figure 8.1 1). When a fault is experienced, the c~rrent-~imiting switch is firstly triggered to take over the fault current, and the main static switch is opened. This forces the fault cment into the current-limiting path owing to the series inductive element. The non-linear arrestor across the static switch is used to contain the overvoltages [26].
arrestor
F i ~ ~ r e 8.1 1 Solid-state breaker and current limiter
Flexible AC Transmission Systems (FACTS) 275
It is possible to consider the switching capability of thyristors to use as cu~en t limiters in the application of TSCS in the future [27]. The increasing interest in FAC in paI~icular seems to indicate that fault-current-limiting functions can be economically added onto TSCS units. Fur the~ore, these additional features lend themselves to be retrofitted to existing facilities.
8.4.4 Combined Series/Shunk Controllers
rh the transmitted real power and, in~e~ende~it iy, the reactive power flows at the sending and receiving ends of the transmission line. The UPFC consists of two GTO-based converters connected together by a DC link having a storage capacitor. This arrangement functions as an ideal AC to AC power converter in which real power can flow in either direction. Each converter can either generate or absorb reactive power at its own AC terminal.
Converter 2 of the UPFC (Figure 8.22a) injects an AC voltage Vm of variable magnitude and angle in series with the line voltage thereby allowing the control of the phase angle between the resultant voltage and the line current. This injected voltage can be considered as a synchronous AC voltage source. The line current flows through this voltage source exchanging real and reactive power between it and the AC system. The real power exchanged is inverted into DC power and is stored in the DC link. The reactive power exchanged is generated internally by the converter.
Converter 1 supplies or absorbs the real power required by converter 2 through the link. Inverter I can also generate or absorb reactive power as a shunt device from the line. Converter 1 can be operated independently of converter 2.
Parallel lransformer V’
P I V ’ I h
V’
.I2 Unified power flow controller (UPFC)
The operation of the UPFC can fulfil the multiple functions of reactive shunt com~ensation, series compensation and phase shifting by ~nject~ng a voltage Yw with appropriate ampiitude and phase angle (Figure 8.12b). Comparisons between the UPFC and TCSC, and between the UPFC and TCFAR, are made in (281. Results from transient network ana~yser (TNA) simu~ations and computer studies are also shown. An application of this technique is presently underway at WAPA, located at Mead, and is rated for I060 NIVA (series injection) and 475 MVA (shunt compensation) capabiIi~,
276 Power System ~ ~ s t ~ c ~ u ~ n ~ and Derenulation
concept (301 for the compensat~on power flow mana~ement of multi-line transmission systems. In its general form, the IPFC employs a number of converters with a common DC li each to ~rovide series
cause of the c o ~ m o ~ DC link, any inverter within the IPFC is able to transfer real power to my other and thereby faciiita~e real power transfer among the lines of the transmission system. Since each inve~er is also able to provide reactive compensation, the IPFC is able to cany out an overall real and reactive power compensation of the total ~ a n s m i s s ~ ~ n system. This ~ a p a b i l ~ ~ makes it possible to equalise both real and reactive power fl lines, ~ansfer power from overloaded to under loaded lines, com~~nsate
rops and the corresponding reactive line power, and to increase
~nsation for a selected line of the ~ransmiss~on system.
ng system against dynamic disturbances. In its simplest form, the IPFC
line I
.13 I ~ ~ ~ r ~ i ~ e power flow controller (IPFC)
fS
A scheni~t i~ ~ ~ a g r a m of a phase shifter 1311 is sho a ~ c o r n p l ~ ~ h ~ ~ by adding or subtracting a variable vol
o ~ e n ~ is o~tained fkom a
have voltages p r ~ p ~ ~ i o n a l to be included or e x ~ ~ u d e ~
and 9 - along with the plus or e range of -13 to +13, thus gi
'
var~able h i g h ~ ~ p e ~ ~ control of the p e ~ e ~ d i ~ u l a r voltage co~ponen~ .
Flexible AC Transmission Systems (FACTS) 77
4 - -
V'
VB
V'
V - Input voltage
i - Linecurrent
The principles of a pliase-shifting transformer (Figure 8.14a) with a thyristor tap- changer are discussed in [31]. Similar to a conventional phase~shifter with a mechai~~cal switch, a con~~nuo~sly variable, quadra~re voltage is injected in series with the transmiss~on line v o ~ ~ g e (F'I 1. It uses three ~ i~ fe ren t t rans fo~er wind~ng§ (in
3:9), with switch arrangements that can by-pass a winding or reverse its oduce a total of 27 steps using only 12 thyristors (of 3 different volta , There is no thyrisgor"con~o~1ed phase shifter in service
ifter does not have the ability either to gener~te or ~bsosb reactive c
a n s ~ o ~ ~ e r must be locatea close to a ~eneration to reactive power transfer. ~innesota Bower has deve~oped a novel and
P single core/single tank &bang-
wer it absorbs or supplies must be suppl~ed or absorbed
econom~c version o bang' %ype TCPAR which
An advance^ phase sh shown in Figure 8.12 in an earlier section. The converter 2 is used to inject v o ~ ~ ~ e V,, in series with the line. The phase relation~h~p of this voltage V, to the line vol a r b i ~ a ~ , as shown in the phasor d iagra~. Thus the injected voltage can be used fo
ompensating voltage injection. On the 0th must be provided by the AC sourc
ical and thyristor switches. ng voltage source inverters (VSIs) using 6
ulat~on or both. ~ u r t h e ~ o r e , the VSI can itself generate or a~sorb all
available). ~ w i t c h ~ n ~ converter 1 supp~~es to or abs dc link capacitor the real power involved in the overall compensation. Since CO
handles only real ower, and as i ts AC side is in shunt with the transmis largely i~nmune from the effects of surge currents during any line faults. Con~er~er 2, however, has to handle its total injection FA as well as any surge currents during faults. Consequen~iy, the rating of converter I is smaller than converter 2. The phase shi~ter of this type is econo~ical to a total angle variation of 120 degrees. Above this value, the rating of the injection converter becomes larger than the power transmitted through the line. In such a case, it might be economical to consider the approach of the HVDG back-to-

Power System Restructuring and Deregulation
back c o n f i ~ ~ t i o n considered in Section 8.4.6. The advanced phase s h i ~ e r has the ability to control all three parameters affecting power ~ansmission: phase angle, voltage and
edance. For this reason, it has also been called un i~ed power flow contro~ler ~ ~ P F C ) Il28l.
Strictly speaking, HVDC transmission does not fit in with the definition provided for ACTS controllers. However, HVDC systems have been a dominant player for such a long
time in the usage of PE controllers for transmission that their role in promoting high PE con~o~lers cannot be overlooked. With the latest developments in PE t e c ~ o l o ~ ~ H V ~ C sys~ems will play an even greater role embedded in AC systems. Trad~tiona~ly, HV ~r~smiss ion is used only for special situations and applications:
~ong-distance bulk power ~an§mission where it was cheaper than the AC a l ~ e ~ a t i v e ~ back~~o-back asynchronous interconnections, and in~~rconnect~ons using a submarine (or underground) cabie,
ace ~ a f i s ~ ~ ~ s i ~ ~ iona transmission, power is electronically controlled, and hence an
~~~C line can be used to its fill thermal c e converters are adequate~y rated. F u ~ h ~ ~ o r e , owing to its high-speed control, line can help a p ~ a l ~ e l AC line to maintain stability (as long as the E'NDC con not sustain ~ ~ u ~ a ~ o n failures). ~owever , owing to its expensive impleme C ~nsmiss ion is used only for special situations and appiications. An alternative a ~ ~ g e m e n ~ with a con~olled series capacitor in an owing transmission line may provide similar advantages at a lower cost. ~ o w e v e ~ , in i n t e ~ a ~ d AC-DC systems, it is now possible to have a DC link in parallel
Intertie, C h ~ d r ~ p u r - P ~ d ~ h e tie, etc.), h e DC link can be used to increase the power ~ a n s ~ i ~ e d over the AC system and provide additional d ~ p i n g when requ~red for stability
an ac link, Ln such systems, and there are a n ~ ~ b e r of such instances (i.e.
ith the availability of GTO/IGBT converters, it is feasible to conside inverters feeding into very weak and even dead AC systems [34], which have no s ~ c h r o n o ~ s machines at all. Some of the problems previous~y assoc~ated w terminal HVDC systems using conventional thyrigtors may now also be addressed with parallel taps using f o r c e ~ c o ~ u t a t e d converters. This means th consider mult i~term~al C systems more sympathetica~~y.
G systems can materialise, however, one additional device opmen~ will be the HVDC breaker; the ects for this are excellent.
The practical d ~ f ~ c u l ~ of impleme~t in~ ~ T ~ - ~ a s e d conve~ers for high a p p l ~ c ~ ~ ~ o n s has been the problem of operating GTQ devices in series. Some tec
een suggested to build up the high voltage required for DC t r ~ s m ~ s s i o n by using ~ ~ l t ~ - ~ n v e r t e r s in series [353, or the use of mul~~-level converters; in either case, capacitors are used to equalise the voltages across the ~ u ~ t i - c o n ~ e ~ e r s . The economic vi~bi$i~y of such t~chniques for high"vo~~ge app~ications is far from clear at present.

Flexible AC Transmission Systems (FACTS) 79
a c ~ - ~ o - ~ ~ ~ v ~ ~ e ~ s Up rill now both converters have been line-cominu~ted and therefore havs had control only over the direction of active power flow. With the use of self-commutated GTO converters (Figure 8.15), reactive and active power flow can now be controlted in any one of four ~uadrants, since there is no restriction &om the commutation voltage of the valves. Additionally, use of PWM techniques will assist in the minimisation of harmonics generated by the converters and lowering the overall cost of the terminal equipment. We can expect further applications of BB ties at Iower cost and improved performance.
I J AC system 2 AC systm1 I Active and reactive power can
flow in either direction
.I5 Force-commutafed BB link
In this respect, two recent deve~opi~ents that will have significant reper~uss~ons for
capacitor commu~ated converters (CCC) [36], and controlled series capacitor converters (CSCC) 1373.
future ties are:
Both these tec~ iques rely on utilising capacitors in series with the converter wit effect that the reactive power demande~ by the converter is effectively compensat the series capacitors. This i s a ~ u n d ~ e n t a l departure from the previous HVDC converter practice o f empIoying shunt capacitors for reactive power compensation. The beneficial impacts o f the series capacitor are as follows:
The capacitor voltage assists in the commutation voltage for the converter which allows operation with a very weak AC system. Since the reactive power flow through the converter t rans fo~er is reduc~d, the d~mension$ of the converter t rans fo~er can be reduced. The valve short circuit current is reduced to about 50% when ~ompared with a conv~n~onal converter. Since the AC filter is reduced in size, the load rejection overvolfages are much smaller.
Coupled with these trends, ~ a n u f a c ~ r e r s are now offering more efficient, cont~nuously tuned AC filters, active AC and DC filters, compact and modular outdoor valves and fully digital controls. These new concepts are going to reduce the cost of converters and improve reliability.
A new g e n ~ r a t ~ ~ n of DC cables is available based on polymeric i ~ s u ~ a t i n ~ mater~a~ instead of the classic paper-oil insulation. The mechanical strength, flexibility and low weight of the cables make them suitable for severe installation conditions. The cables use copper conductors for submarine usage and aluminium conductors for land usage. Land cables
be inst~lled under~ound by plough~ng tec iques or go overhea
elopment of IGBT valves c to new app~ications, Usin e new IGBT-based, VSCs are ~e1f"~omrnutated and can con~o l active and er flow. This reduces the size of co~ponents required a ~ p r ~ c i ers are c o n s ~ c ~ e d in a modular concept and are e n c l o s ~ ~ i
over distances of 0- 1 ith this concept:
the use of newly designed DC c es with switching f~equenc~es
ng range can vary from 7- 60 lications scenarios are envis
ulk power ~ ~ i s ~ i s s ~ o n . eacctive li er controller, coupled wiek an active dilteri
l-scale genera~ion from w i ~ d ,
ding of new r i ~ ~ ~ ~ o f - w ~ y may not be ava~labIe.
q u a i i ~ control by iso~a~ing dis~rbing Ioads such as smelters. of appl~cat~ons have a ~ r e a ~ y been ~ ~ p Q ~ ~ d with this c o ~ c e p ~ (T
future pr~spects are excellent.
2 Gotland 50 i 8 0
65 A s y n c ~ ~ ~ o u § ~ t e r c o ~ ~ 6 ~ i o n
active and reacti
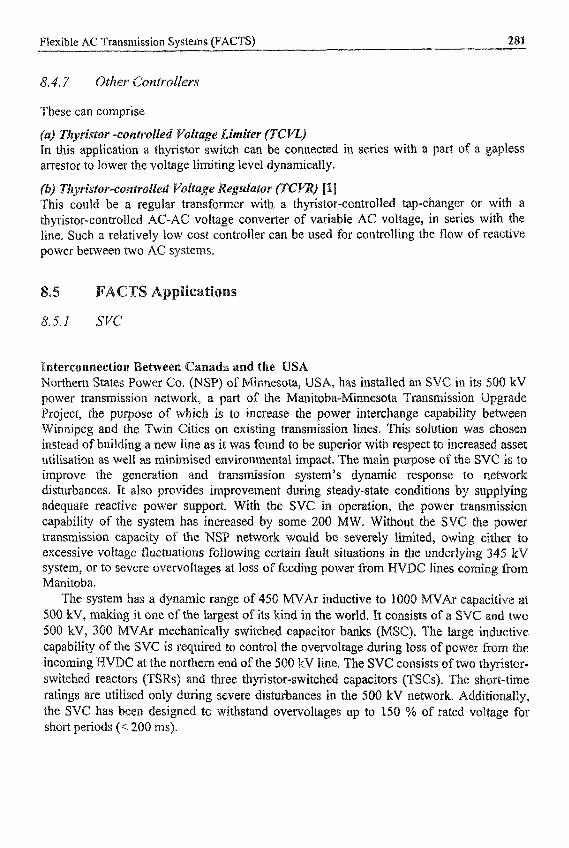
Flexible AC Transmission Systems (FACTS)
8.4.7 Other Controllers
These can comprise
(a) T~zyr~stor - c o ~ ~ r o In this application a arrestor to lower the voltage limiting level dyn~mically.
(h) ~ ~ i y r i s t ~ ~ - ~ ~ ~ t r o ~ i e This could be a regular t rans fo~er with a thy~s~or-controlled tap-cha~~er or with a thyristor-controlled AC-AG voltage converter of variable AC voltage, in series with the line. Such a reiatively low cost contro~ler can be used for controlling the flow o f reactive power between two AC systems.
ected in series with a part o f a
s
8.5.1 svc
Northern States Power Co. ( ~ S ~ ) of ~ i ~ n e s o t a ~ USA, has installed an SVC in i power tr~smission network, a part of the ~ani toba-~innesota Trans~issi Project, the purpose of which is to increase the power i~~erchan Wi~nipeg and the Twin Cities on existing transmis~~on lines. This solu~~on instead of build in^ a new line as it was found to be supeRor with respect to in utilisation as well as minimised e ~ v ~ ~ o n m e n t a ~ impact. The main
eneration and ~ a n s ~ i s s i o n system’s d y n a m ~ ~ response to ~ e ~ o r k also provides improv~ment during steady-s~ate conditio
the SVC in operation, the po y some 200 MW. W i ~ o ~ t th
adequate reactive power support. Wi capabiI i~ o f the § y s t e ~ has increase ~ansrn~ssion ~ a ~ a c i ~ of the ~S~ n e ~ o r k would be §evere~y 1 excessive voltage ~ u c ~ a t ~ o n s following certain fault situations system, or to severe overvoi~a~es at loss o f feeding power from ~ a ~ ~ i t o ~ a .
The system has a d y n ~ ~ i c range of 450 MVAr inductive to 1000 500 kV, r n a ~ i ~ g it one of the largest of its kind in the world. It consi
chan~cally switched capacitor banks required to control the ovewoltage
e n o ~ h e ~ end of the 500 kV line, The SVC consists of f x o th~r i~ tor - sw~t~hed reactors ( T ~ ~ s ) and three ~yr is~or-switch~d ca~acitors (TSCs). ratings are utilised only during severe d i s ~ r b a n c ~ ~ in the 500 kV networ the SVC has been d~signed to wi ths~nd overvoltages up to 150 % of rated vo~~age for short periods (< 200 ms).

Power System ~ ~ s ~ ~ ~ ~ n g and Deregulation
essee Valley Authority teamed up with ~ e s t i n ~ ~ o u s e to install a 100 at TVA’s Sullivan 500 kV s u b s ~ t ~ o n ~ l ~ , l ~ ] in ~ o ~ § o n City. This
trated in 1995. The selection of this site was made to:
Test the full range of reactive power of the STATCON. Aid in damping the oscil~ations in the TVA system fed in from the ne ighbo~ng AEP
bus voltage during the daily load bu~ld-up so that the 500/16 1 kV
bus at Sullivan during off-peak periods. mer bank can be used less often.
are c o ~ s i d e r ~ n ~ STATCON a p p ~ ~ c a ~ i o ~ on the C Q ~ O ~ W ~ d Electric Co. Some cost evaluations have been reported at
3 ~onference [ 121.
8.5.3 TCS
i~anufac~rers are resently being tested in North
In 6991, AEP of Columbus, Ohio, with the ~ ~ u f a c ~ ~ e ~ ~ r o t o ~ e switch of a single-~hase series capacitor b ~ k at er sub§~tion in W. Virginia. Fo~~owing s ~ c c e s s ~ ~ tests, a 788
A, 42 ohm series three-phase capacitor bank was installed. Each p consists of two p la t fo~s , one with both a 10% (7 the other with the remain in^ 30% (21 ohm) s e ~ ~ e
Power Author i~ ( e first t~ee-phase TCSC 230 kV, 33
in Arizona [40]. For the requirement of inc ~ a n s i ~ i s s ~ o n line b e ~ e e n Shiprock Subs~a~ion
and Siemens~okia jointly agreed t yenta substation. In addition to the benefit of adjastable i~pedance~ the ed reactor can provide high-speed pro~ection of the 15 ohm capacitor
section. ith n ~ a n u f a ~ ~ ~ r e r GB successfully managed the install ptember 1993 on a 500 kV line at Slatt subs~tion of the
TCSC consists of six series capacitor modules. Each modu~e has ohms at 60 Hz, in parallel with a ~~yr~sto~*control~ed inductor of 0. of the ~ o d ~ i e is achieved by firing angle control.

Flexible AC Transmission Systems (FACTS) Z $ ~
UPFC application was commissioned in mid 1998 at the Inez station of Kentucky for voltage support and power flow control.
regulates the substation 138 kV bus voltage by controlling six capacitor banks Ars to reduce daily and seasonal voltage fluc~ations to within acceptab~e limits.
The controllable rea~tive power range of the shunt converter is from -160 to t-160 ~ V A r s to Compensate for dynamic system disturbances.
The PFC is maintained at a level of 300 N W on the line between ig Sandy and Inez to minimise system losses. Under severe contingency conditions, the UPFC controlle~ line i s capable of ~ a n s f e ~ n ~ 950 MVA.
In order to increase the system reliability and provide flexibility changes, the UPFC installa~ion allows the operation of the shunt ~ d e ~ e n d e n t S T A T ~ ~ M and the series converter as an independent
ible to couple both converters together either in shunt or series over a double control
Each GTO converter is rated at I- 160MVA. The converter output is a t~ee-phas set of nearly sinu$oidal (48-pulse) quality. Each converter feeds an in transformer that is coupled to the transmission line via a conventional thr transformer. The rating of the i n t e ~ e ~ a t e transformer is 50 % of the main Iran
The converters are c o n s ~ c t e d from three-level poles, each co~posed of four valves. This a~angement assists in waveform construction to facilitate harmonic elimination. Each converter employs 48 valves in 12 three-level poles with a nominal dc voltage of + 12kV and -1 2 kV with respect to the mid point. The mid point voltage is maintained by ~ e a n ~ of a split capacitor and diode arrangement.
lation of the power i n d u s ~ [42], FACTS controllers will be r$~u~red by power systems to ana age power flow to utilise transmission lines nearer to their t limits. The ability to transmit at higher transfer limits will necessitate to balance reliability and economy of operation of the power sys adoption of FACTS controllers, the following concerns of the power industry ~ ~ e d to be addressed:
Transient ove~oltages. System restoration. Generator torsion behaviour. Power quality. Economic ~onsidera~ions and cost benefits.

ower System ~ e s t ~ c ~ n g and
e ~ o n c e ~ s , study tools are require^ to test. the FACTS con~o~lers as c o n c e p ~ ~ ~ prototypes or before the er c o ~ ~ e r ~ ~ a ~ service), The
on ~ l e c ~ o m a ~ e t i c transient pro ) and the red-time power ly available. Noweve these con~o l le rs are still
Owing to the capital costs involved, FACTS d e s ~ ~ e r s will seek to add featur FACT^ c o n ~ o ~ l e ~ more viable, such as the feature of fault c ~ ~ e n ~ l i m ~ t i n ~ with FOP the a p ~ ~ ~ c a t i o n ~ of S T A T ~ O N ~ , value may be % ~ d ~ d if f e a ~ r e s such ondition~ng (I.e. h a ~ i ~ n i c cancellation) can also be provided along with ower.
The author pays tribute to the many pioneers whose vision o f the FA led to the rapid evolution of the power industry. Although it i o f them i nd i v id~a l~y~ The author also than this ~ a ~ ~ s c r i ~ ~ .
c o n ~ ~ b ~ t i o n s of Drs N, ~ i n ~ o ~ ~ i s wife Vinay for her considerabIe
i, ‘FACTS - flexible ac ~ansmission systems’, IEE ~nferna~ i~na l Conference on wer Transmission, 1991, pp.1-7.
mgorani and L. Gyugyi, ~ n ~ e ~ s t a n ~ i n ~ FACTS - Concepts and Techno AG T r a n s m ~ s ~ o ~ Systems, IEEE Press, 2000 L.Gyugyi, ‘Solid-state control of electric power in AC ~ m i s s i o ~ systems’, Interiiational ~ ~ m p ~ s i u ~ on Electric Energy Converters in Power Systems, Invited Paper No. T-IP. 4, Capsi, Italy, 1989, PACTS Overview, XEEE PES Working Group Report and CIGRE ~ n f ~ r n a t i o n ~ Conference on Large High voltage Electric Systems, Chairmen: E.Lassen and T. Weaver, April 1995 T V.K. Sood, Position Paper on FACTS Tec l~o lo~y , Canadian Electrical A§§ociation~ C o n ~ c t CEA ST-460, March 1995. A. Erinmez, Ed, ‘Static Var Compensators’, Working Croup 38-01, Task Force No2 on SVC,
undamentals of thyristor controlled static var compensators in electric power system app~i~ations’, EEE Special pub~ication ~ 7 ~ 0 1 $ 7 - ~ - ~ ~ ~ , p ~ e ~ n ~ e d in 1987. A. ~ a ~ a d , ‘ A ~ l y s i ~ of power system s ~ a ~ i l ~ ~ e ~ ~ n c e m e n ~ by static var compen§a~o~s’~ IEEE Transactions on Power Systems, Vol.PwRs-1, No.4, November 1986.
. Machur, S u p p l e ~ ~ n t to a b ~ b l i o ~ a p h ~ for static VAR co~pensa~ors (SVC) and re~a~ed flexible ac transmission system (FACTS~ devices [ 1988- 19941. C.Schauder et al., ‘ ~ e ~ e l o p m ~ ~ t of a 100 MVAr static condenser for voltage control of ~ a n s ~ ~ s ~ i o n s ~ t e ~ s ’ , IEEE ~~ansactjons on Power Delivery, Vol. 10, No.3, July 1995, pp. 1486- 1496.
. Mehta, et al., ‘Static condenser for flexible ac transmission aystems’3 EPRi FACTS ~ ~ n ~ e ~ n c e 2: TR 101784, ~ e e t i n g in May 1992, Procee

Flexible AC Transmission Systems (FACTS) 5
1121 A. Ekstrom et al., ‘Studies of the performance of an advanced static Var compensator, STATCON, as compared with the conventional SVC - EPFU Project ~ - 3 0 2 3 ~ ’ ~ EPRI FACTS3 Confere~ce, Baltimore, ~ a ~ l a n d . October 1994.
ittlestadt, ‘Four methods of power system damping‘, B E E T r a n s ~ t ~ o ~ on Power Apparatus and Systems, Vol.PAS-89, NOS, May 1968.
[ 141 P. woo^, ‘Study of impro~ed Ioad-tap-changing for ~ r ~ ~ f o ~ e r s
damping improvement
[l4] C. Wu and U. Lee, ‘Applica~ion of simultaneous active and reactive power modula~ion of super~condiicting magnetic energy storage unit to damp turbine-gene~tor su~”sync~onous osci~lat~ons’, IEEE Transactions on Emrgy Conversion, Vo1.8, No. 1, March 1993,
ava and G. Dishaw, ‘A~plication of an energy source power system stabilizer on the battery energy storage system at Chino substation’, IEEE Trunsact~o~s on Power Vo1.13, No.1, February 1998
“ A new control method for thyristor controlled series capacitors’, E P ~ FA ore,
[ 191 M. Gavrilovic, 6. Robcrge, P. Pelletier, J-C. Soumagne, ‘Reactive and acti nl by means of variable reactances’, 11th Pan-Amerjean Congress (COP1 treal, Nove~ber 1987,
[ 181 L. Angquist, 6. Ingesbrorn, and H. Othman, ‘Synchronous voltage reversal
aryland. October 1994.
P, Pelletier, F. Beauregard and 6. MO&, ‘hterphase power controller r m ~ a g i n g power flow w~thin ac networks’, IEEE Transuc~ions on Power
[a I ] K.R. Sen, ‘ S T A T C ~ ~ - Static synchronous compensator: Theory, modeling aid applica~j~ns’, IEEE PES Winter Meeting, 1999, pp.1177-1183.
E221 N.G. ~ ~ n g o r ~ i , ‘A new scheme of sub-synchronous ~sonance damping of ~orsiona~ oscilla- tions and transient torque - Parts I and U’, IEEE Transmtions on PO $yst@ms, Vo~.PAS-~ 00, N0.4, April 1981, and IEEE PE$ Summer ~ e e t ~ n g
Vo1.9,N0.2, Apfil 1994, ~ ~ . 8 3 3 - ~ 4 1 .
/23] J.W. Ballance and S. Goldberg, ‘~ubsynchro~ous resonance in series c ~ m p ~ i s ~ ~ e d transmission lines’, IEEE Trunsu~tions on Power ~ p p a r a t ~ and Systems, Vol.
rolled series compensstion to avoid
[25] T. Ueda et al., ‘Solid state current limiter for power d i s ~ b u t ~ o n system’, l E E ~ ~ransactions an Power Delivery, Vol.$, No.4, 1993, pp.1994-1801
t261 . Saarkwzi, E.J. Stacey, J.J. Bank and N. dis~ribu~ion current limiter and circuit breaker: Application requiremen~s lE## Transactions on Power &divery, ”IIo1.8, No.3, July 1993, pp.1155-1
~ 7 3 ~ransa~~ ians on Pawer Delivery, Vol.6, No.3, July 1991, pp.103~-1037.
[28] L. Gyugyi et al., ‘The unified power flow control controller for i n ~ e p e n d e ~ ~ P and control in. transm~ssion systems’,
arady, ‘Co~cept of a ~ m b i ~ e d short circuit limiter and series c o ~ p e ~ s a t o ~ ’ , fEEE
FACTS3, Baltimore, M ~ l a n d , ~ctober 1994.

286 Power System Restructufing and Deregulation
.K. Sen and E. Stacey, ‘UPFC - Unified power flow controller: Theory, odel ling and applications’, IEEE Transactions on Power Delivery, Vol. 13, No.4, October 1998, pp.1453- 1460.
[30] L. Gyugyi, K. Sen and C. Schauder, ‘Thc interline power flow controller concept: A new approach to power flow management in transmission systems’, IEEE Transactions on Power Delivery, Vol.14, No.3, July 1999, pp.1115-1123
asati, ‘A thyristor controlled static phase shifter for ac power transmission’, EEI i Transactions on Power Apparatus and Systems, Vol.PAS-~OO, No.5, May 1981,
[32] R. Baker, 6. Guth, W. Egli and P. Elgin, ‘Control algorithm far a static phase shifting transformer to enhance transient and dynamic stability of large power systems’, IEEE Transactions on Power Apparatus and System, Vol.PAS-101, No.9, S e p ~ e ~ b e r 1982.
[33] J. Kappenman et al., ‘Thyristor controlled phase angle regulator applications and concepts for the Minneso~-Ontario Interconnections’, EPH FACTS3 Conference, Baltimore, M a r y ~ a n ~ Oct 1994.
ood, Position paper for Canadian Electrical Association on Artificially ~ o ~ u t a ~ e d Inverters, March 1989, Contract No. ST-174B. ng, J. Kuang, X. Wang and B. Ooi, force-commutated NNDC and SVC based on
phase-shifted multi-converter modules’, IEEE Transactions on Poww Delivery, Vo1.8, N0.2, April 1993, pp.712-718.
1361 T. Jonsson and P. Bjorklund, ‘Capacitor Commutated Converters for HVDC’, Paper SPT PE 02-03-0366, IEEE/KTH Stockholm Power Tech Conference, Stockholm, Sweden, June 1995.
[37] K. Sadek, M. Pereira, D. Brandt. A. Gole and A. Daneshpooy, ‘Capacitor c o ~ u ~ a t e d con- verter circuit c o n ~ ~ r a t i o n s for DC transmission’, IEEE Transactions on Power DeZivery, Vo1.13, No.4, October 1998, pp.1259-1264.
[38] J. Vithaya~hil, P. Bjorklund and W. Mittlestadt, ‘DC systems with t ~ n s f o ~ e r l e s s converters’, IEEE Transactions on Power Delivery, Vol.10, No.3, July 1995, p~.1499-15~4.
E391 A. Keri, A. Mehrbahn and P. Halvarsson, ‘AEP expenence with the 788 Mvas series capac- itors and the controlled thyristor switch’, EPRI FACTS3, ~ a I t i ~ o r e , ~ a ~ ~ a n d . October 1994.
[40] N. Christl, ct al., ‘Advanced series compensation with variable impedance’, EPRl Conferen~e I on FACTS, Cincinnati, Ohio, November 1990. Proc. March 1992, EPN TR-100504, Project 3022,
[41] J.Urbank et al., ‘Thyristor controlled series compensation prototype installation at the Slatt 500
enderson, ‘Operating issues for FACTS devices ~ An operations p l ~ i n g p e ~ ~ e c ~ i v e ’ , EPN FACTS3, Baltimore, Maryland. October 1994.
Sen, ‘SSSC ~ Static Synchronous Series Compensator: Theory, modeling and applications’, IEEE Transactions on Power Delivery, Vol. 13, No. 1, January 1998.
[44] L. Gyugyi, 6. Schauder and K. Sen, ‘Static synchronous series compensator: A solid state approach to the series compensation of transmission lines’, IEEE Transactions on Power Delivery, V01.12, No.1, July 1997, pp.406-417.
pp.2~50-265~.
substation’, IEEE Transactions on Power Deliwy, Vo1.8, No.3, July 1993, pp. 1460-1469.

Kevin Morton London Electricity Group UK
Cliff Walton London Electricity Group UK
Asset management has been one of the most debated topics over the past decade, yet ofien those words are used to label some very different processes. Asset management can range from the ma~ntenanc~ and renewal regime associated with a specific indiv~dual or group of assets to the management of a multi-billion-pound international portfolio of networks of assets spanning a range of industries. This introduction explores the drivers of the development of asset m ~ a g ~ m e n ~ from a UK electricity distribution ~erspective. The drivers for change have most often arisen from regulatory initiatives or from the ~nancial position of new owners, with asset management evolving to meet each new challenge.
Unders~ding the drivers gives an insight as to why asset manage men^ means ~~f ferent things to different players depending on where they are in the resmchtring of their business.
In the years i~mediately before privatisation, the electricity indushy 's finances and investments were very much Treasury driven to meet the public sector borrowing requirements. Compet~ng demands for government investment meant that most e l ~ c ~ i c i ~ companies were required to curtail capital investment and were given annual targets to return cash to the Treasury.
with time-based planned maintenance. However, the constraint on the capital expendi~re (Capex) investment meant that as little in the way of reinforcement or renewal was possible and this brought about a focus of improving asset utilisation. Unsat is fa~to~ assets were
At this stage of developm~n~ asset management was normally considered synon

2 lation
removed and wherev~r possib~e not replaced, whilst ~ d e ~ ~ i l i s e ~ p~ant was recov~re reloca~ed to meet load ~ o ~ h .
onal areas with local olicies a n ~ o r inte retation of policy rn su~ting in ~ i d e ~ y
Is, unit costs and performance of networks. en business o~erating units was used to drive lowe utilisation but the availa~ility of c rmance proved to be a limitation
a b ~ u ~ the ac~uracy of the statistics between rivals.
~ r i ~ a ~ i s ~ t i o n ~ i ~ a h ~ ~ s g o v e ~ ~ e n t § to realise the c o ~ s i d ~ a b ~ ~ cap at the same time free industries from the cons ~e¶uiremen~s. Prices in the UR were initially set vi rec~iving a ~o§~t ive x, ~ h e r ~ b y e n a b l ~ ~ the perceiv~d
nts to be hnded by the new investors.
fall, which in turn b ~ o u ~ ~ about ut the new sha~eholders brought about a strong ~ r o ~ t dr i~er for staff num
Asset ~ a m a ~ ~ r l s e ~ i c e provider business models beg^ to be a d o ~ ~ e but in a variety o f ~ o ~ s . Often in i t i~~ly with service level agree~en relatively small asset ~ ~ a g e ~ ~ n ~ group and i n ~ e ~ a l semi provider conb-actors, some
a ~ i ~ ~ s moved to adopt ~ o ~ a 1 c o n ~ a c ~ s b e ~ e e ~ the p ies and ou~ource non~core a c ~ ~ v i ~ i ~ s to e x t e ~ a ~ c~mpanies. bene~ts were seen to be:
g ~pera~ing ~ x p e n d i ~ r e ( rent ~ v e s ~ ~ t deci ecisions from the doing,
ed a d~~ferent skill set f ~ o m the ~xecut~on. changes in pract~ces an
g to be contracted out b the ~ ~ o $ t fied gets done (or

These chan~es meant that comp to acquire additional s ision making enabled a
i d expertise enabling Iarg
The asset manager/servi~e provider model has met with mixed su t e c ~ i c a l staff.
become ~onfron~ationa~ with those of the asset m
drivers of the service provider not neces 0th sides need experts, one to specify and o
d successive year-on-ye
e achievement of (c~mp~y- set^ per o f unspeci~ed pena~ties an
World class studies, bench~arking and b~siness process re-en~ineenng. Considera~ion of a whole life approach towards vestment. O r g ~ ~ i s a t i o ~ s moving towards a three-layer model as they begin to s e ~ a ~ ~ a ~ e r s h i p from o~erationa~ m ~ a g ~ m e n ~ :
a Strategy b Asset m~agement c Service provide^
A more accountable set of relat~onshi~s specifying what needs the doing to the a c c o u n ~ ~ ~ e unit. ~ ~ a t e g i c asset ~ a n a g e m ~ n t approacl~ to unders~ding where value is c r e ~ ~ e destroyed, s ~ ~ r n ~ s e d in the §cenario ~ a ~ y s ~ s to inves~ent strategies that are most i r ~ ~ u ~ a t o ~ and c x ~ ~ ~ a l
estion - ‘where best to invest the next poun~?’
The second half of the 1390s

Power System ~ e s ~ c ~ ~ n ~ and
Data mining, fault causation analysis and targeting of worst-s customers and most ve to operate n e ~ o r k s .
dition monitoring to inforni selective refurbishment or renewal. a b i ~ i ~ - c e n ~ e d design, engineer~ng and mainten~ce.
ing dormant and problem assets and imprQving asset y capital project management for smaller and smatle
~a lue-ba~ed procL~remen~. ovation in technology and processes.
for past i nves~en t an some 9 mont~s ahead
end of the five year review period. At the same time indications of future income caps and ~ e r f o ~ a n c e targets were published with 50% of the savings from mergers clawed back.
The im~ediate reaction by PESs to the regulator’s initial tho~ghts depen~ed upon the robustness of their asset management scenario planning and their long-term strategic intent. Some cQntinued much as before but overall the publication of the initial r~view results created a drama~~c fall in capital i nves~en t orders and in the asset replacement con~acts
h limited rewards for excellent per fo~ance and p ~ d ~ n t capital i n v e ~ ~ e n t , the switched fixed resources onto those targets they saw as ~ a v ~ n g a good ieving without additional investment, whilst ~ o ~ - p e ~ l ~ ~ n g on those
that require^ investment and additional resources.
prices cut by 20-35% per-unit from r 3% per-unit price reductions for 4
ency savings of 19%-29%. and aggregation costs ~ a n s f e ~ e d to supply.
PESs from April 2001
The role of dis~ibution redefined and almost all customer service costs transferred to
al~owed rate of return (good asset m ~ a ~ e m e ~ t can deliver more). A metering ~ ~ ~ p e t ~ t ~ o ~ from April 2000. Agreeme~t on a business separation comp~iance plan. P e r ~ o ~ a n c e targets set by the regu~ator. I n f ~ ~ a t i o n and incentives project to come.
It is a major cha$~enge to deliver the DPC ce savings whilst ~mproving customer service: with an uncertain incentive mechanis suggestion from the regulator is that companies will be placed within an incentive ~ ~ e w o r ~ intended to mimic a competitive

Asset ~ a n a g e ~ ~ n t 91
inarket with Gompanies that do least well in meeting their agreed targets financially rew~ding those com~anies that do best by an exchange of penalty payments.
The uncertainty posed by Ofgem’s Information and Incentives Project in terms of what will be incentivised, how per fo~ance will be defined and measured has for many companies effectively extended the moratorium in investment.
Companies need to consider how the required scale economies can be effected whilst at the same time d e ~ i v e ~ i ~ g improving p ~ r f o ~ ~ c e . Some companies may choose to ~ e f e ~ major new ~ n v e s ~ ~ e n t commitments and perhaps org~isational changes until there is greater clarity about the rules of the next round of the regulatory game, but this brin own risks of failure to deliver required improve~ents sufficiently quickly. The u n c e ~ ~ n ~ high~i~hts the need for a robust frameworks for modelling and valuing the impacts of the various organisational and investment opportunities against a range of scenarios.
The scope of asset management has developed with each previous sta res t r~c~r ing of the d~stributio~ business and is therefore set to do so again.
For companies already recognised by the regulator as being frontier efEcient or as leaders in effective asset management, but still being presented with a very s i in r~gula~ed income, a her radical change is essential to achieve the r change in results and still remain at the frontier.
~ o ~ b i n i n g the manage~ent of the two power distribution networks v e n ~ r e company (2~seven) is LE’S and TXU’s innovative response ~ e r f o ~ ~ ~ c e challenge. Creating an outsourcing a ~ a n g e ~ e n ~ with the tran vehicles and tools, etc., allows the shaxing of expensive ~esou~ces, S U G ~ as offices, IT, control, s~ategic ana~ys~s and research, applying best practice optimum solutions and delivering a range of services at best value for allowing each company to retain is ownership, distribution licence and to unique com~etitive arke et position should this be appropriate.
Such an approach creates the driver for the next evolutionary phase of asset m~agement and requires the separa~ing out and future comp~titive assignme~t of the responsibilit~es b e ~ e e n asset owner, asset governor, asset manager and operators.
The owner of major sets of utility assets, whether it be a gov~rnment, ~ u ~ t ~ n a t i Q n a ~ co~oration, publicly quoted c o m p ~ ~ or m ~ i c i p a l cooperative, will n o ~ a l l y have a relatively small set of strategic objectives it is seeking to achieve by its ownership, e.g.
ansion etc. It will not normally wish to concern itself with the detailed ~ ~ ~ c i a ~ , r ~ ~ u ~ ~ t o ~ or ~ e c ~ i c a ~ m a n a g ~ e n t of the assets but mere~y to s a ~ s ~ i at
iC objectives with Erontier ef~ciency and effectiveness. they are in the hands of an effective governor who can reliably deliver its
ASS nc
~ e p ~ a t i n g out the respons~bilities of governance from those of o ~ e r s h management and operations to an organ~$ation dedicated to the creation and release of value t ~ o u g h the effective m~agement and exploitation of the assets.

92 ower System ~ e § ~ ~ c ~ r i I i ~ and ~ e r ~ ~ l a t i o ~
The asset ~ o v e r n ~ c e concept provides for even a non~tec~ ica l organ~sat~on to from the ownership of a world class set of distribution assets and services with l~mi~ed
d with a minimal stafX s new to the e ~ e c ~ c ~ t y industry but s ~ m i l ~ oppo ities exist in other i ndus~es such as rail md a i ~ o ~ s where the own~rs see the need to a1 ef~ciency and returns s i g n ~ ~ c a n ~ y but have other major an ial o p p o ~ i t i e s to commit their ~ a ~ a g e m e n t time to.
~ ~ ~ ~ l a t o ~ compliance, supply business satisfaction, income ~ a ~ i ~ i s a t ~ o ~ and value e~eration re~uire a different skill set from the ~ a n a g e ~ e n t of ~ ~ d i v ~ d u ~ ~ s s ~ t s or sets of
se, ava i l~b i l i~ , capacity and income ge~eration from
g and actively managing the portfolio of risks. developing network assets to match new ~ a r k e t s for
sition with respect to frontier e ~ c i e n c ~ ~ r e ~ ~ a t o ~
es arising from the removal of geo ~ompeti~ive cons~aints.
allows economies of d maxim~s~ng the returns from
sibly unique arke et p~sition ent and operations to be ~ o n ~ a c t e ~ out to the mo r ~ c i ~ a l role of the asset governor is ~ e ~ e f o r e as an
e ~ ~ e ~ t i v e and efficient the g o v e ~ o r will require ntier u ~ d e r s t ~ ~ i n g of:
vol~mes of servic
lity of work done and the value add^^ s and s ~ n d a r ~ s neces
to evel lop and renew con~act
also discharge a ran of the owner that cann


2 Power System Reshucturina and D e r ~ ~ ~ a t i o n
As has been seen, asset manage men^ is given a wide variety of int industry and even within the electricity supply industry. Even with i n t e ~ r ~ t ~ ~ i o n may change with time - particularly as the com~any learn
~ypically, asset manage men^ has been seen as the core of the d being p~mari ly responsible for the strategy of the network and both are derived through teamwork and cooperation throughout main areas of focus are asset and network p e r f o ~ a n c e ~ policy and s t a n ~ ~ d s , i nves~en t and operating costs. The focus on the latter is t ~ o u g h work reduction and avo id~ce, with the operational groups focusing on productivity issues.
Data is the essential ~ ~ ~ e d i e n ~ to effective asset ma~agement. The asset man process adds value by converting this data into decisions, which reduce the o v ~ ~ a l ~
ycle cost of the network. n service ~ifecyc~e costs can be ~ r o k e ~ down into ~ r e e ~ ~ s t i n c t areas: ~nstallation,
operations & maintenance and deco~ iss ion ing~ However, one o f the major factors in d e ~ ~ i n i n g the overall lifecycle cost is the actual of the asset. ~ n s ~ l ~ a ~ ~ o ~ and deco~~ iss ion ing cost at the concep~al stage of a project, with operating p a ~ i c ~ ~ a r asset. Asset
ave adi it ion ally been evalu intenmce costs being considered over a fixed gers today are faced with d ~ i s i o ~ s on whe

invest, but also have a responsibility for the much wider issue of the exisli For all these existing assets, decisions must be taken which reduce the CO
asset in service and extending the period for which the ass& provides sati this i s the essence of asset m
The im~or~ant question Asset Managers must ask themselves is:
If the answer is yes then the task is s ~ a i g h t f o ~ a r d - we simply record the age of our assets and replace them at the correct time to prevent them becoming a safety hazard to staff, d i s ~ ~ ~ t i n ~ service to our customers, or becoming expensive to m a ~ n ~ a ~ ,
Life just isn’t that simple. Assets ‘age’ at different rates depend in^ on the nature of the duty imposed on them, the environment which they inhabit, the way they were well as a whole host of other c o n ~ b u t o ~ factors. Even if we are able to ‘no ageing process it is still necessary to be able to predict the life span for each we are to avoid replacing plant too early, or allowing our service level to deteri
Tools exist to enable us to d e t e ~ i n e the condition of some of our condition of the asset is far more i m p o ~ n t than its age. The present conditi of how well the asset has aged over time.
Co~~dition ~ o n i ~ r ~ g has come c o ~ o n p ~ a c e in a number of asset-inte It has the potential for e~mpl icate~ information systems to capture pre about ~ a ~ i c u l a r aspects of an asset’s per fo~anee and present them in a us to fac~l~tate decision m ~ i n g on maintenance regimes and replacement
on, a piece of equip men^ and report whether a n y ~ h i n ~ has change since the last visit. Taken to its other e x ~ r e ~ e , it could mean a fully auto~ated ~ o n i t ~ r i n g and r e ~ o ~ i n ~ system complete with e ~ ~ y - w ~ i n g a l m s for an indication of wear or %he need for ma~ntenance.
The degree of c can be ~ecovere~ b manage men^ of risk t rans fo~er on a re i ~ e x p e ~ ~ s ~ v e analysis wear or ~otential failure. If neither of these t e c ~ i ~ u e s enable accurate pred fai~ure, or reduc~ion in main~enance, then we must question their u s e ~ ~ n e s s in management process.
vides the opportunity for an operator to inspect visu
ity is a major factor in whether the cost of c ed m a ~ ~ t e n a n c ~ costs, higher utilisation, ex
here i s little point in just mo~itor~ng the r basis, via expensi~e analytical e ~ u i p
oil sample will provide a more reliable i
tage of condition~~ased monitoring is that it allows the as ree of con~dence in how the assets are p e r f o ~ i n g and le Eime-based preventative maintenance. In short, it provides the the cost of maintenance and extend the life of the asset. If re
2 Power System ~ e s ~ u c t ~ n g and
it or in^ is carried out and records collated, a ‘foo
This can be useful for predicting potential f a ~ l ~ ~ s
I’ for each item of established and trends monitored.
correct~ve m a i ~ ~ n ~ c e g a catas~ophic f a i l ~ e . Lace, which is normal~y less expensive than
ines for ~ n a c c ~ ~ t ~ b l e performance are unavai~able, collati pu~ation enables ‘Qut~iers’ to be identi~ed and exa~ ined ~egree of comp~exity of the rnonito
remain %he same - decide on the criteria for perfomm ind~cator of po&ential v~ iat ion from this s ~ ~ ~ d and
point in con~~nuousl or of wear is the time it take
ring equipmen% and techni~ues are ~ ~ e n t ~ y availab~e to the following sections detail a selection of some of those e
many aspects of a transformer which can be monitQ~ed. One simple but e f f ~ t ~ v e mon~tor i s the level of moisture in the insul vis~ialiy inspect~ng the colour of the silica r e f ~ g e ~ ~ e d b ~ e ~ ~ ~ e r s , which actively redu
form th is is ach~eved
s if the ~o is tu re level should rapidly increase. eing’ process can effectively be slowed ~o~
r. London Electricity has effectively employed level of mo~s t~ re within the tram
A more d e ~ i ~ e d ~ i c ~ r e of the condition out dissolved gas analysis (DGA) on a sampl
sent and what activity is likely to h ite equip~ent to provide a coarse i nd~ca~ i~n , by
carbon ~nono~ ide monitor. This provides a$so~iated with overheating, elec set levels. This provides the opp
lant arising and actual and moisture content tests can also of the cond~t io~ of %he p l ~ t ~ We can

Asset ~ ~ a g e m e n t 7
not simply the num duty of the contacts
continuously loaded profile in Outer ~ o ~ ~ o n .
trials are now in progress to s i ~ u ~ a t e many yews' w o ~ h o€ onths. ~ n s p ~ ~ o n of the oil and contacts at various i n t ~ ~ ~ ~ s enable us to c o ~ i ~ ~ our initial asse~ion and d e ~ ~ ~ ~ within these trials s
e t e ~ ~ n i n g ma~ntenance intervals for diffe~ently loaded ~ a n § f o ~ ~ r ~ "
9.13.3
Apart from the routine oil condition tests mentioned ~rev ious l~, circuit breaker t~mers e arnoun~ of wear on the o~era~ in mec~anism to be ~on~ to red . ~ ~ n d o n ~ ~ e c ~ i se of a simple and inex~ensive e ctronic timer when carrying out op
ry ins~ection (~ressure Vessel
9.13.
city makes ex t~s i ve use of infrared detectors and t h e ~ o v i s ~ o n c ts caused by loose co~ect ions or worn c lings on exposed b ~ s ~ a r s or
Ith check nion~tors are used to check for exce§sive vi~ration md h~nce
ic mon~tor ~echan~ca l ear on th ~ a n s f o ~ e r cooling s y s t e ~ s. The i ~ i ~ ~ ~ t o r is not a vibration truest sense since it is basi evice, w ~ i ~ h assi~iilates noise with wear.
in~er~ereiice detectors are tca monitor d ~ s c h a r ~ ~ activi
~ o ~ a b l ~ transient earth ~ o l ~ ~ e (TEV) of the d i s c ~ a r ~ ~ act iv i~ , or c o ~ ~ ~ ~ sirnil
ion. ~ o ~ ~ n u o u ~ ~moni to r i~~ is a1so availabl on it or 'leaky' ~ l a ~ t . This can

compile a foo~r in t for a particular substation. Where a high level of le monito~ng equipment with pre-set a1 vels and potential failure.
Understand~~g Long-term Asset Costs
If we are to ~nders~and the long-term costs of employing assets, then we must have a good ~ d ~ r s ~ d i n g of how they perform in service and what t e c ~ i ~ u e s can be e ~ p ~ o y e d to xtend asset life or reduce the level of main~enance required, to them in service. As
ind~cated in the previous section, purely ti~e-based mainten ent being ma~ntained too early or too late. In both case
u n n e c e s ~ a ~ e x ~ ~ n d i ~ r e , therefore need to develop a data model of the asset, which can a c c ~ ~ t e l y reflect Its n, m a i n ~ e n ~ c e requirements and life span. In many cases this can be
wealth of historical data, coupled with on-line indication of performance. ~ n f o ~ a t e l y this is not a~ways the case and we are left with the problem of developing a model based on
tions and very little feedback from the asset itself. toring of assets is not of the pop~ation, accessi sampling techniques to e
n based on tests performed on ~ I e c t ~ c i ~ is the ~ d e ~ g r o ~ d c
~ ~ d e ~ g r ~ ~ n d Cables
The s ~ ~ o n d a ~ network consists of 8500 cable. The e n v i r o ~ e n t in which it exists makes it difficult to mon~tor, ~ l n e r a b ~ e to ~hird-
ularly with the high level of excavation a c ~ v i ~ wit~ in Lon~on, and
V and 17500 km of LV under
network account for nearly two-th~ds of the inte s ~ a ~ e g i c a ~ ~ y i m p o ~ t to the com~any.
d cables, investment must be targete r e a c ~ n g the end of their useful life.
~ n d i v ~ ~ ~ a l circuits and even localised sections on a circuit has ~adi~ional ly been accepted e f ~ ~ c t ~ v ~ ~ y . The assumption has been that the per failures against asset life, or at least the middle this approach is owing when the particular asset has re fa i~~res , without the volume of these failures seriously need to consider the generic model of the ba focus on the bottom ~ o ~ o n of the curve.
their life span. The ideal situation would enable us to as the b e g i ~ ~ n g of a steep increase in the failure
It i s essential, therefore, that we are able to derive a mea§ure
Figure 9.2 d e m Q ~ s ~ t e s a series of curves with v a ~ i n g rates of fai~ure ntifj small increases dicted by the latter

~~d ica tes that the slope on many of the small va~ations is s ~ ~ i ~
10 ;13 3 40 50 txl How long?
ath tub curve p r e d ~ ~ t ~ v ~ failure mode
entify some other means of edicting ~ a ~ l ~ r e if we are to a v o i ~ in^ §tanda~ds of network
9.13.7 bles
lem is to analyse the fau~ts cable or joint being an to lead to similar failur s provides the crucial key d where they are most likely to occur.
o ~ r ~ m a ~ modes of failure:

3
t ~ge ted con~ition monitoring tec~ iques can i of failure, Some of the condition m o n i t o ~ ~ g techniques includ~:
tify i n~ i~ idua l circ~its with
Tan 8 and delta tan 6 Zero sequence impedance Pa~ ia l d i s c ~ ~ g e mapping time domain reflectrometry.
E: Cable failure from overloading itself is rare but most f a i i ~ e s c to thermal runaway in the insulation ~ o i d ~ in the insu~a~on. M a n u f a c ~ ~ n com~ara~ i~e ly rare in the UK. Condit
Partial discharge mapping ~ ~ ~ l e c t i c Loss angle (Tan 6)
ielectric Loss angle with voltage ( al imaging of t e ~ ~ a t i o n s onic aging and ~ i s c h a r ~ e detection uted ~ e m ~ e r a ~ r e sensing using fiber optics
series of tests have
pressure test as an indi
re ~ x ~ ~ n s i v e tests h e ~ e a s u r e ~ ~ n t . The Q ~ j e c ~ v e of these 0th p e ~ f o ~ a n c e of the re~ainder of the circuit,
contin~i~y.
9.13.

.3 Partial discharge map of 1 i kV circuit
es have been lo eloped at
the circuits in ~ o ~ ~ i s s ~ o n ~
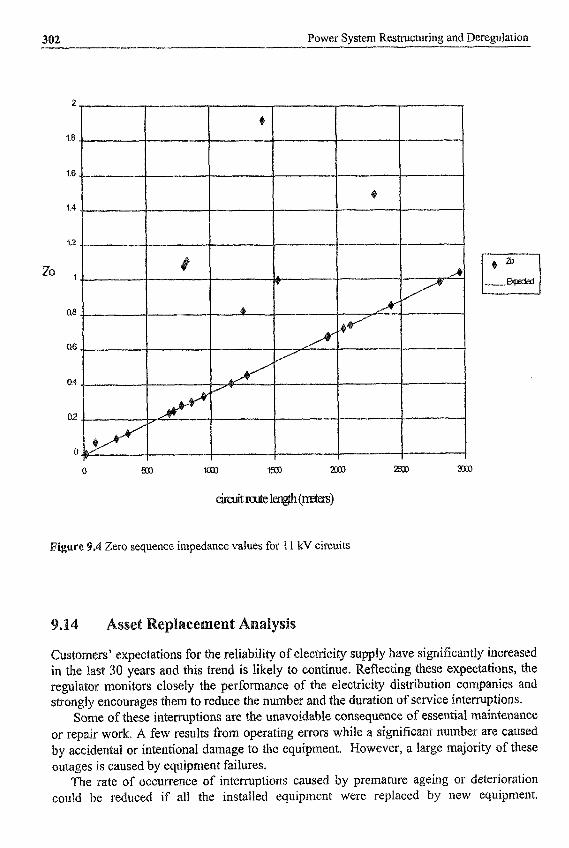
302 Power System Restructuring and ~ere~ulation
.4 Zero sequence impedance values for 1 1 kV circuits
S
ers’ expectations for the reliability of e ~ e c ~ c i ~ supply have signi~cantly increased in the last 30 years and this trend is likely to continue. Reflecti~g these expec~tions, the regulator monitors closely the performance of the electricity distribution companies and strongly encourages them to reduce the number and the duration o f service i n t e ~ p ~ i o ~ s .
Some of these i n ~ ~ ~ p t ~ o ~ s are the unavoi~ab~e consequence of essential m a i ~ ~ e ~ a n c e or repair work, A few results from operating errors while a significant number are caused by acciden~l or intentional damage to the equipment. However, a large majority of these outages is caused by ~quipinent failures.
The rate of occurrence of intemptions caused by premature ageing or deterioration could be reduced if ail the installed equipment were replaced by new equipment.

Asset ~ ~ a g e m ~ n t 303 -
~ o n s i d e ~ n g the enormous investment that such a replacement would represent and the in the demand for electricity, this re~rbishment must be
d of time, To optiinise this replacement pro~amme, it is in new equipment are likely to have the largest effect on the
reliability of service, i.e. to know which equipment is most likely to fail soon and ought to be replaced first,
If failures occurred on a purely random basis, rep~acing any piece of equipment would have the same effect on system reliability.
On the other hand, if it was possible to show that a single factor (e. insulation used for cables) has a much stronger negative influence on the any other factor, the replacement policy would be simple: all cables ~nsulation should be replaced first. A review of the existing literatu suggest§ that the actual situation is considerably more complex than either of these extremes,
a number of factors seem to contribute to their probability of failure. These factors include age of the cable, the method of installa~on, the type and e cable is buried, the instantaneous and historical loading
Faults are comparative~y rare given the asset base and have multip~e causes. As a resu~t,
For example, while it is clear that cable failures do not occur on a purely r ~ ~ o ~
of the circuit and the previous o c c ~ e n c e of faults in a particular cable section.
chance is the scourge of fault research. The same unsafe behaviour may in one shed yet in another result in a catastrophic fault. All sorts of external ce the outco~e: weather, co-workers, Ioading, mechanical failure,
prediction of large amounts of variance in fault likelihood extremely difficult. Future research, having demonstrated a relationship between an unsafe behav io~ and
faults, should then focus on the inves~~gation of factors that predict that unsafe behav~our. This change of focus has ready happened to some extent in relation to driving acci It is well established that driving above the posted speed limit is predictive of road traffic acc~dents in the long run. However, any attempt to demons~ate a direct link between
as measured in a single &udy and the occurrence of accidents within that study is to meet with success. Most speed in^ goes unpunished by negative consequences.
wever, that does not mean that speeding is not ~ p o ~ n t in accident causation, Therefore, much research is now dedicated to determining the characteristics that are associated with this dangerous driving behaviour. This approach could also be a~opted in fault causation analysis.
Cracking down on relatively small numbers of repetitive faults may have ted effectiveness in changing overall performance (though it i s vital in terms ing specific ~epet~tive failure targets). What i s required are co~termeasures direc~ed at the whole population. Weather-related faults would appear to be such a group where the fault
ot be located at the extremes of the normal distribution^ The problem of faults may require an approach which focuses on fault causa~ion more
broadly conceived, rather than maintaining a rather narrow interest in individual differences in fault liability. It is recommended that future research also consider this perspective
So far, researchers into fault liability have focused almost exclusively on those factors that predict inc~usion in the fault group, which in most populations is much smal~er than

the no"fau1t ~ r o u ~ and subject to a high chance factor. Perha~s future research will also
and ink shift the focus af ~ n t e ~ e ~ ~ o n s towards the ~si t ive benefits of av
evote a~ention to those networks which manage over a long perio e the factors that promote fault ~ v o ~ ~ a n ~ e , It would a i ~ ~ d at encoura~ing such factors. A n ~ t ~ e r §ensi~le
ative ~ f f e c ~ of'faults.
a m e s had been ~opular for a n
d as the unit cost of' a

Asset ~ a ~ a g e m e n t 30
~ r ~ d u c t i v i ~ Level
~~~~~e 9.5 ~ e n c ~ m a r k i n ~ performance matrix for subsration maint~nanc~
9.14.2 Asset Lijecycle
~ a n a g ~ ~ e n ~ of a large portfolio of assets also necessitates tbe ~ a f l a g ~ ~ ~ e ~ r of risk. ~ ~ i s ~ o ~ c a l ~ y , the growth in usage of electricity has not been linear and we should not be
9.6 details the a ~ ~ r o x i ~ a ~ e age profile of London Electricity’s major assets, i n d i ~ ~ ~ ~ ~ ~ peaks of i n v ~ s ~ ~ f l t ~ ~ r i ~ g the 1960s.
Pised to find that our asset base has not been cons~c ted at a cont~~uous rate.

30 Power System R e s ~ c ~ ~ n g and Deregulation
Age-related replacement of assets will clearly lead to similar peaks in invest men^ in the future. Asset management techniques, such as condition based monitoring ( C ~ ~ ) , can be used to extend the life of individual assets - assuming that they are in good condition. C can similarly warn of the need for early repIacement without the need for failure to occur. Another useful technique which is available to companies with dynamic networks is to use other work as a driver for replacement.
This is best illustrated by the following example. A ‘typical’ substat~on constructed in the peak i ~ v e s ~ e n t period of the 1960s would be a 4x 15 MVA transformer site with 16 1 1 kQ feeders. Its modem-day equivalent would be a 3x60 MVA double secondary transformer site with 36 feeders. Reinforcement of one substation in an area can normally enabfe a hrthex two similar substations to be removed, thus avoiding the need for replacement. Extensive use of this technique normally requires an element of load growth.
Even if we do opt for an age-related replacement programm~, we need to plan for R
more gradual replacement programme. The easy option is to replace assets before they reach the end of their useful life. Our task as asset managers is to manage the risks associated with pushing assets closer towards the end of their usef~l life by i n ~ o d ~ c i n g alternative options, or devising ways of closely monitoring their performance.
The actual life in service of assets may frequently be observed to be lower than the accoun~ing life of plant, as used for depreciation by compan~es, or the much higher assigned service life. This difference has normally been driven by reasons other than replacement needs such as: upgrade for load growth, faults, change of b~ i l d~ng occupancy, diversions, etc
Figures 9.7.and 9.8 show examples of actual life in service where this has been less than the assigned service life. The data represents all secondary transformers and secondary switchgear removed from the London network since 199 1.
Actual life in service - 5 e c ~ n d a ~ ~ransfor~er§
(average age at ~ecQrnis~iQ~ing - 36 years)
I
F ~ ~ ~ ~ e 9.7 Actual life in service - secondary transfomler

07
10.0%
8.0%
6.0%
40%
2.~94
0.0%
Actual life in service. secondary switchgear
(average age a t decomissioning . 34 years)
43 48 37 34 31 28 25 22 19 16 13 10 7
ure 9.8 Actual life in service - secondary switchgear
Condition monitoring and assessment provides a very useful guide to the s that need a ~ e n t i o ~ within the next review period but are less usefui at present i nves~en t p ~ a ~ i n g .
Several models have been used by London Electricity to assess possible asset rep~acement requiremeiits in the long term (e,g, beyond the next rice review period). These use a number of teclini¶ues for projecting the current profile of assets using d~fferent replacement regimes.
The most e l e ~ e n t a ~ replace~ent p ro~ le model is one that gets rep~aceme~~ o assets in the year they reach the end of the assigned service life. his will have the effect of recreating the same age profile curve as the present population
The models used by London E l e c ~ c i ~ apply a spread of replacement ages cen~~ed around the ~ s i ~ n e d service life. This is ~nte~ded to rep~esent a more r e a ~ ~ s t i ~ view of the range of ages at which assets will be replaced, caused by the impact of the widely v a ~ i n ~ drivers for rep~acement such as safety, obsolescence, eny~ronment an
The shape of the replac~ment profile can be selected to represent how wide the variation from the average service life is likely to be. take a flat profile, which replaces an equal proportion of the asset popula$~on over a given period of time. Figure 9.9 shows 7.5% of the population replaced each year over
eriod. The effect o f this is to create a new profile of assets which is smoothe has a wider spread by I5 years.
The most simplistic ap
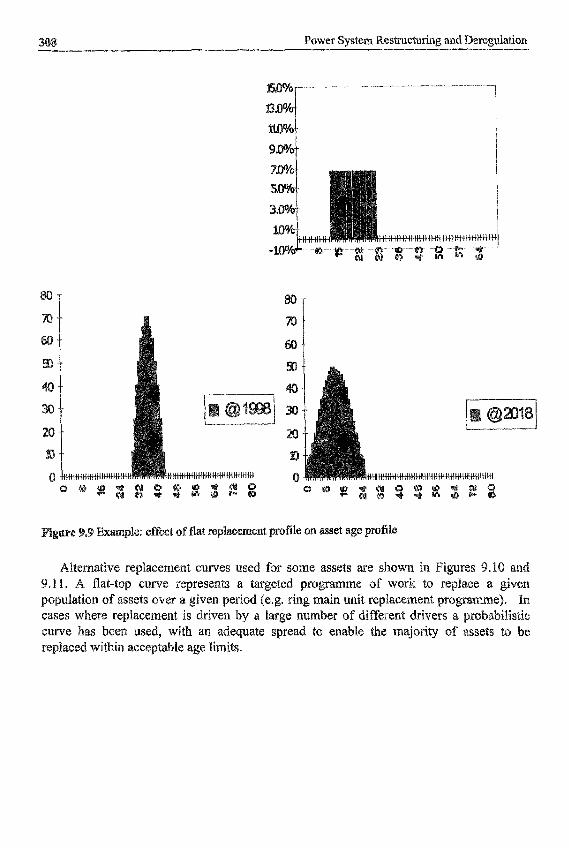
T T
Ex
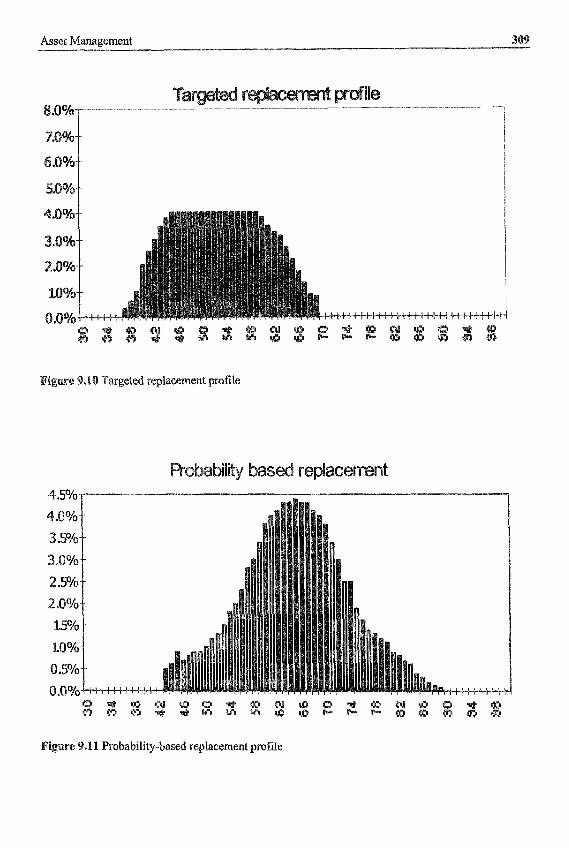

31 Power System ~ ~ s ~ ~ c ~ i n ~ and ~ e ~ e ~ l a t i o n
~aintenance is only one aspect of effective asset ~anagement. The ability to exten useful life o f an asset can be based on the amount and quality of the r n a ~ t e n ~ c e c out, but it can equa~~y be affected by the ability to b a ~ ~ c e b e n e ~ ~ s a g ~ n s ~ costs in the overall replace~ent and investment strategy. ~ o l e s a l e replace men^ of assets is m expensive business and we need to ensure that our investment is always t~ge ted at those areas which provide the most benefit.
London Electricity has been deriving a methodology for devel ers in the c o r n p ~ y and p invest in order to max i~ i s
s assigning values to n o n - ~ o n e t ~ ~ benefits as well as e s t i ~ t i n g ~otent ia~ cost
involves cons~ct ing a model of the project or ~nf luen~e diagram to ensure that all internal and external influence in eyaIuatin~ the benefits of a particular project and the way in which it is i~plemented.
.12 indica~es the ~ u ~ u ~ a t i v e c o s ~ ~ n e f i t ana~ysis of a Prom this we can judge which projects provide the
nt and allow us to prioritise within budget or caqh flow GO
"12 Cumulative c o s ~ e n e ~ t analysis of project portfolio
The steep slope at the beginning o f the curve indicates that the projects at this end efit to cost ratio, whilst those at the other end appear need to recognise the impoi~anc~ o f a less b ~ e ~ c ~ a l her, more beneficial, project upon it. This is illus
in the c m e .

Asset ~ a n a ~ e ~ e n t 11
Each of these individual projects can similarly be evaluated against a variety of such as: do more or ~ u ~ ~ k e r ’ do less or slower, do nothing, etc. This enables ev r e p ~ a c e ~ e n ~ r e of optimal rep1
ent QT maintenance always has a risk a ~ s o c ~ a t e ~ with it. The use of a f Q ~ a 1 methodotogy, which evaluates costs against bene~ts, useful risk management tool for all the staff associated with and affected by the ~ecisiQns taken.
The variabili~y of eleme~its within each project are also assessed for c r i t ~ ~ a ~ i ~ to eliminate statistical unce~ainty associated with those elements which do not sign~~cantly impact on the overall project. This allows us to concentrate on those elements where we need to be more accurate in a$sessing probabili~~es or variabilities.
a~tenance decis~ons to be calculated as well as the
Deferring rep~aceme~i~, refurbis
London Electricity has been developing a technology strategy to ensure that all pot~n~ial for the network are c o m p l e ~ e n t ~ to each 0th ogy strategy has been to ensure that state-of-tl~e-~ evaluated and potential operating cost savings are i d e ~ t ~ ~ e d .
The various s t r ~ d s of the tec~o logy strategy all need to build tow objective o f prov id~~g the degree of network per fo~ance requi can be evaluated on its own merits but, in general, those projects
eluded in the i nves~en t po~folio. of the remote t e ~ i n a l unit (RTU) ~ u ~ e n t ~ y he 1 1 kV network. ~dd i t iona~ features have
been built into these units to facilitate the transfer of data from the LV s y s t e ~ when s u ~ ~ b i e dev~ces have been ~ a n u f a c ~ r e d to obtain the required ~ n f o ~ a t i o n . This kin specification would nob be possible without such a cohesive strategy.
Much of the monitoring experirnen~l’ but it is already possible to install power outage d i s ~ ~ a n c e sensors ) in the premises of a customer who has s ~ f f e r e ~
will contact the control centre in the event of a s failure via a telephone line. Fault passage ind~cators installed at on the LV n e ~ o r k p r ~ v ~ d e more localised in fo~at ion about the positio which will eventually be relayed back to the office via the RTU. These RTUs also have the ability to ~rovide on-line loading and status information for the subs~tiQn, which can provide inva l~b le ~ n f o ~ a t ~ o n to the network planners and analysts.
Other work has c o n ~ e ~ t r a t e ~ on ensuring that many of the in~epende~t~y developed in fo~at ion systems, for con~ol , n e ~ o r k design and analysis, etc., are able to share i n ~ o ~ a t i o n via a ‘data hub’.
A ~ ~ o ~ h e r major task has been the development o fa more proactive version of the partial harge mapping ~ e c ~ i q u e mentioned previously. Continuous d isch~ge moni~orin and EHV f e e d e ~ i s economic and this, coupled with the ability to switch the
network remotely, could facilitate the isolation of potentially faulty sections without

' re' injection of gas an silicone fluid into the circul cables to remove mo core
w ~ e r e d~ect - la~d rep lace~~~n t cost. paper insulate^ with lead or c o ~ g a t e d a l ~ n i u m sheaths which are u ~ § ~ ~ ~ ~ ~ ~ for this tech~ iq~e . At prese~t here are no v~able r e ~ r b i s ~ e ~ t tec~ iques for cables but p r e ~ ~ ~ ~ n a ~ research work is under way to establish the
re and fill voids is esrablis les can be re~rbished for ~ i c a l ~ y less than a ently most HV cables in the UM have generally be
i sh~en t of oil and gas press~re c f these circuits where t h e ~ a l expansi
s and the ~ o v e m e n ~ of uce pressures and real yed. The presence of o s s ~ b i i i ~ of limite is extremely rare
conditions.
.16
~ ~ e n t will inclu assessment of the rel c relati~ns cQnse~uences to the who1 iate risk control n~easures.
For power s y s t ~ ~ s risk may be consi~e variables:
e its o w ~ mix of the co~ponents of ris
nt.
f ~ ~ 1 t S . ~ ~ e c t i v e asset m risks o
ts with higher that 1.1
witchgear reduces the risks o f failure. with timely r ~ ~ e ~ i a l action.

31 Power System Restructuring and
A u ~ o ~ a t e d securement and/or remote restorat~on of supplie§ with r e a l ~ t i ~ e telemetry, which can significantly reduce the poss ib i l ~~ of overloading and seconda~ failure which if sustained may cause far more exte~sive d a ~ a g ~ than the
erhaps simple, failure.
mising the number of customers affected through active risk m~agement desi systems and the use of appropriate protection zones,
owing the s t a ~ s of the network and keeping cust~mer§ advised. viding restorat~on in seconds or minutes, not hours.
g ~ e q ~ t e supplies of spares and skilled resources. hing con~~ngen~y plans and r e ~ l a r l y exerci~~ng them,
Laying off some of the financial risks, contract exclusions and i n s ~ ~ c e .
Some events that may ~nitially be cons~dered i ~ p r o ~ a b ~ e , such as the c o ~ n c i d e n ~ ~ loss of ~ u ~ t i p l e independen~ circuits or of substations, may neve~he~es§ be w respect to the physical, political and economic environment. Some
m their flight paths, failure of flood defence^, ea~h~uakes , te~orism, a1 disputes, computer viruses, etc., may
when combined with s~pplies to central business districts, CO
the n~edia9 security and transport services. Asset ~ a ~ a g e m e n t strategies for these si~at ions might
from outside the ~ n v i r o ~ e n ~ l zones, fall-back or manned generation or just a ~arge~ed set of cont~ngen~y them.
r ~ncid~nts are f o ~ n a t e l y comparative rare will account for around 10% of customer
incidents often seem to arise from a unique set of circ te types of events using large pop~~ations o
~nderlying p a ~ e ~ s trends. Such analysi proportion o f sue
s and that even these are most often as ~ n § ~ l l e d or ~ a ~ n ~ ~ n e d 9 or that a cerlai
for e ~ ~ ~ p l e , that perhaps a h
ons can result in 1 u~tomers ~ e i n g a~ec ted for # ~ ~ g e s for i ~ s ~ e c t ~ o n s an times w h i ~ ~ t repairs are e ~ e ~ ~ e d ,
lar e~uipmen~ can r romised for prolonged p e ~ o ~ s with a § i~n i~can t loss of r e s o ~ c e Erip testing i s a key per fo~ance ~ d ~ c a t o r that the ~reaker will
do so. With the increase in remote ~ ~ n ~ o l faeili ied out on both p ~ m ~ ~ d sec on^^ system^ from con^^^ ~ e n ~ e s and
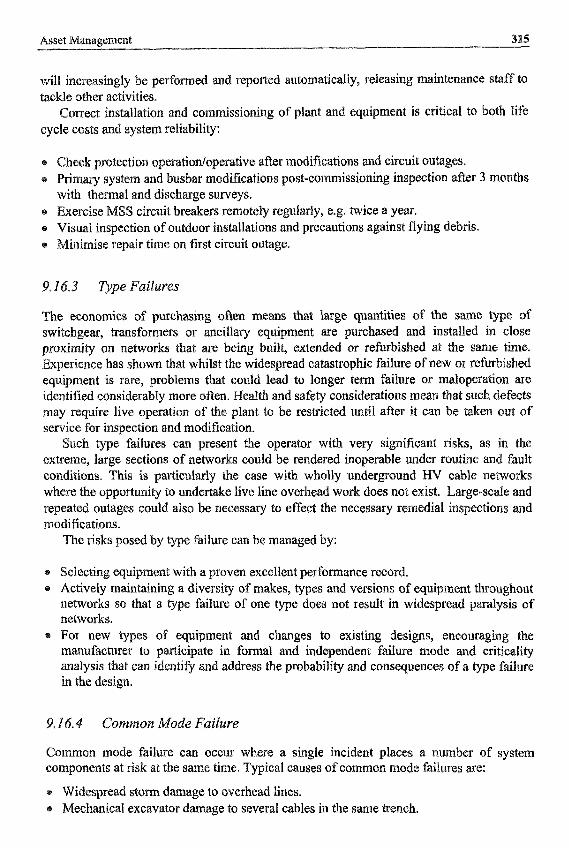
will inc~~asingly be performed an reported automatically, rdeasing maintenance staff to tackle other activities.
Correct ~nstallation and co~~ iss ion ing of lant and equip men^ is critical to both life cycle costs and system reliability:
ro~ec~iQn o ~ e r a t i o ~ o ~ e ~ t i v e after modi~cations and circuit out Primary system and bwbar ~ o d ~ ~ c a t i o n s post-commissioning ins with t h e ~ a ~ and discharg~ § ~ e y s . Exercise MSS circuit breakers remote1~ re larly, e.g. twice a year.
1 inspection of outdoor in§~l la t i~ns and precautions against flying debris. mise repair time on first circuit outage.
9.163 Type ~ ~ i ~ u ~ ~ s
The economics of purchasing often meam that large ~uantities of the Same ty sw~~chgear, ~ a n s f o ~ e ~ or a n c i ~ l a ~ equipment are p u r c h ~ e ~ and ~n§ ta~~ed in p r o x i m ~ ~ on networks hat are being built, e x ~ e n d e ~ or ref~rbished at the Experience has shown that whilst the widespread catastrophic failure o equipment is rare, problems that could lead to longer term failure identi~ed cons~derab~y more often. ~ e a ~ t h and safety consid~rations m
live operation o f the plant to be restricted until after it can
e failures can present the operator with very e sections of networks could be rendered hop
ection and modi~cation.
con~~tiQns. This is where the oppo~uni repeated outages CO
icularly the case with wholly ~ d e r ~ Q u n d u n d e ~ k e live line overhead work does not e Is0 be necessary to effect the necessary re
e failure can be managed by:
~ e l e c ~ n g e q u i ~ m ~ n t with Actively maintaining a d networks so that a type failure of one n e ~ o r k s . For new types of equipment and changes to existing desi m ~ u f a c ~ r e r to participate in formal and independent failure
can ~ d e n t i ~ and addre$s the probabil i~ and consequ
roven excellent per fo~ance record. sity of ~ a k e s ~ types and versions o f e q u i ~ ~ e n t t ~ o ~
e does not result in widesprea
Common mode failure can occur where a single incident places a n component§ at risk at the same time. Typical causes of common mode fai~~ires are:
age to overhead lines. echan~~al excavatQr damage to several cables in the same ~ench .

Power §ystem ~ e ~ t ~ c ~ n ~ and
e from frre in a $ w i t c ~ ~
tive regimes that are increas liver r ~ ~ u ~ r e d levels of se
loss arising from IOSS rcial tower block coul be found liable for the
Asset ~ ~ ~ o ~ a ~ ~ ~ ~ is the key to effective asset ~anagement~ howev~r data to c a ~ ~ r e , how often how to store it an then how to use it e f f ~ c ~ i ~ e
or w i ~ ~ o ~ t cost. too much data in
s y $ t e ~ r ~ s ~ o n s e to a st m a ~ ~ t ~ n ~ ~ ~ .
appropriate^^ large costs in
There is a real cost to col lect~~g and ~ i ~ ~ i n ~ ~
~ ~ m ~ t e d time, in order to r factors can be a simpl
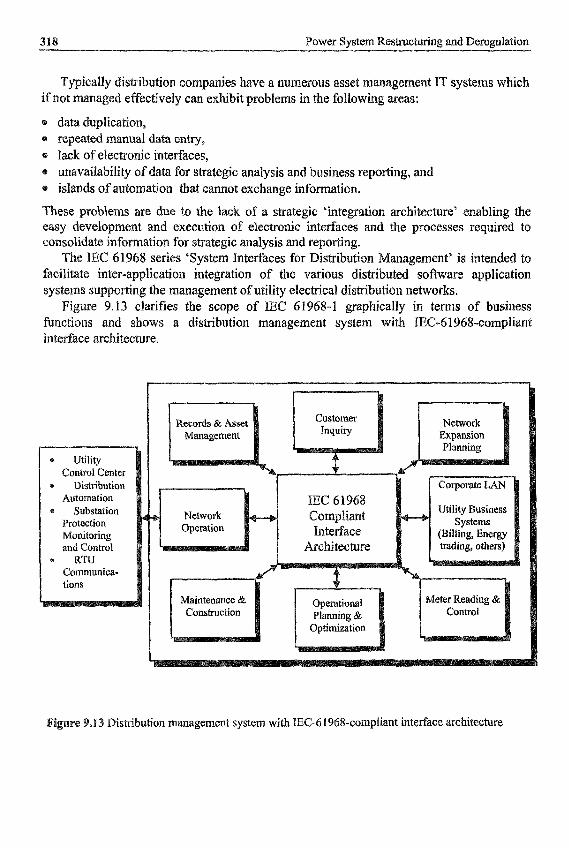
Power System ~ e s ~ c ~ m g and
cally dis~ibution c Q r n ~ ~ i e s have a nu~erous asset r n ~ a ~ e m e n t IT s y ~ t e ~ s w ~ ~ c h aged effectively can exhibit ~ r o b l e ~ s in the f o ~ ~ o w ~ n g areas:
unavai~ability of data for strategic analysis and business reporting, and ~ ~ l ~ d s of a ~ t o ~ a t i o n that cannot exchange information.
These ~ ~ Q b ~ e r n ~ we due to the lack of a strategic ‘integration architecture’ enabling the easy ~ e v ~ l o ~ m e n t and execution of electronic ~terfaces and the rocesses required to on solid ate ~ n f o ~ a t i ~ n for strategic analysis and
The IEC 61968 series ‘System Interfaces for on ~ a n a ~ ~ ~ e n t ’ is intended to fac~litate inter-application integration of the various d i s ~ i ~ u t e d software a ~ ~ l i c a ~ o n
orting the rn~agement of utility efectrical ~ s ~ b u t i ~ n n e ~ o r k s ~ Figure 9.13 clarifies the scope of IEC 61968-1 graphically In terms of business
~ n ~ t ~ o n s and shows a distribution manage~en~ system with IEC-6 1 9 6 8 - c ~ ~ p l i a n ~ ~ n t ~ ~ f a c e ~ c h i t e c ~ r e .
Distribution ~ a n a g ~ m ~ n t system with IEC-6 1968-com~liant im~erface a r c h i t ~ c ~ r ~

Asset ~ a n a g e ~ e n t
9.17. I Asset ~ ~ ~ a g ~ ~ e ~ t ~ y s t e ~ s
Asset management systems typically hold data, including ownership costs, on all the electrical assets, linking them together via parenuchild relationships. These s y s t e ~ s normally share a comprehensive power system model with other app~ications so that operational and planni tools and data can be employed as part of asset manag~men~. ~ n ~ e ~ r a t ~ d systems are mparatively new in many companies and scale of the data collection va~idation can be immense, SO many systems have not yet a chance to prove their full worth in monitoring lifecycle costs etc. Proven uses at th ment are as plant database and ma~n~enance schedulers tools. ~ar iab le ma~tenance ~ g g e r s c and defects recorded from mainten
duty they are required to perform and the environment in which they operate. An benefit of inte~ated in fo~at ion systems is the ability to download large secti for ‘off-line’ analysis and data mining to understand and exploit the re~ations~i per fo~ance, duty and environmen~.
Iising network analysis and continge~cy be set within the database and co~dition r inspection visits,
The per fo~ance and effective life of otherwise identical assets is largely driv
The data required by asset managers typically resides in several s which has to be desi pr~cesses.
which make up the dis~ibut~on network. The volume of the assets and the varie i n f o ~ a t i o ~ that i s a~ailable about each and every type are very jar are p a ~ c u l a r l ~ complex, ofcen requiring multiple spatial repre potential users of the data to access the in fo~at ion they need manufac~rer, speci~cation, age, insta~lation method, condition, loading, electrical parameters, etc. The recording of costs again
ard as cables are continuously being cut into n
atabase will typically desc
te databases each of opulated and mainta~ned by an ve set of busi~ess
The equipment database contains information about the items of plant and circuits
geo~ra~hical and circuit location of the faults which have t network over at least the last three years an customers.
of estimatin~ the number of custo~ers widely from company to company, Tigh~er r e e l arrangements will require consistency o f reporting be
ing of end use custom a solution to this issue
ase could be a major unde~akin c ~ n n e c t i v i ~ down to indiv~dual ckcuits and phases at LV with~n the d ~ s ~ i b u t i o ~ systems
ividual blocks of fiats and offices. The costs of such systems and their ma~~tenance not easily be j u s ~ ~ ~ e d when the consistent applica~on of simple e ~ t ~ ~ a t i o
could well suf~ce.

Power System ~ ~ ~ t ~ c ~ i ~ ~ and
at the most reliable data comes when it is c o i ~ ~ c ~ ~ ~ in the field by s of faiIure ~~d who and to the c o ~ ~ a ~ y .
e n ~ ~ l e near - re~~- t i~e
the data co~~ection s ce of accurate data collection a collection t e ~ ~ n a l s and radio te
data with insta~t q ~ ~ e ~ ~ ~ i ~ of v a ~ ~ e § or §e~uence~ of d a t ~ that
ime series data that is routinely requi t, s u ~ ~ as t rans€o~er and fee^^ ~ o a ~ ~ g , tern is no longer cost effective in a t i g ~ t ~ y regul
ngly seconda~ sub able to provid~ CO
once^^^^ the ~ ~ o ~ e ~ in, t h r o ~ ~ h or ov This will ~ s u a l ~ y inc
the ~ n v i ~ o n ~ e f l t ~u~ circuits and

21
~ u b t e ~ a i ~
uilt e n v ~ r o ~ e n ~
idity, water table, s ~ n ~ s w e l l po~e~t ia l , resistivity, stability
on, co~osion, vibration, tion, thermal s ~ ~ r c e s , da
y no ~ e a ~ s exhaustive.
ill also need to r n ~ ~ a ~ ~ the effect e, Pr the
material. patia~ i n f Q ~ a ~ i o n conce~ing c Q n s ~ a ~ ~ t s such as:
e areas of o ~ t ~ t ~ n d i ~ ~ natural beauty
is also es§~n~ial.
y people tend to include e~oneous or ~ncomplete rec
can also be subject to CO

Power System Restructuring and ~ ~ r e g u ~ a ~ i o ~
tier registration information, and yarticularIy information that wou~d f a c ~ ~ i ~ a ~ ~ cus to~er segmentation ana~ysis, ust tom er c o n s ~ p t ~ o n data, and particularly half-ho~ly load shapes. Advance information regarding the setting of future DUOS prices. ~ ~ f o ~ a t ~ ~ n about the c r e d ~ ~ - w o ~ h ~ e s s of suppliers.
Asset ~ a ~ a g e ~ s will need to ensure that only those having approp~a t~ rights and a ne ow can have access to, copy or export ~ f o ~ a t i o n that is to be regarde~ as ~on~dent ia l ,
As operating margins become smaller and further efficiencks becomes more difficult to ~ e ~ ~ ~ ~ $ , ~ ~ ~ r ~ a s ~ d q ~ a l i ~ of i n f o ~ a t ~ o n becomes ever more essential for the eff~ctive
For r e ~ l a t o ~ as well as asset m~agement purposes it is essentia~
~ o m p a r a b l ~ across companies
Collectable at reasonable cost. onsistent over time
ata c o l ~ e c ~ d will be used for asset r e g u ~ a t o ~ c regimes, there will be a need to be able to demon and timeliness of the data. One way of managing
cesses such as those QE the IS0 900 q u a ~ i ~ m a n a ~ e ~ e n t sequenc~s of data audits that run s ~ c ~ e d studies, ~ o ~ ~ a ~ n g results with those p~viously obt for ~nvestiga~ion, can also be used to s ~ ~ i ~ c a n t adv
None of the above examples indiv~dually can provide the solution to the problem o f how we ana age our assets. A combination of all, or at least so^^^ of th so l~ t i~n , which matches the point on the e v o ~ u t ~ o n a ~ c u ~ e which L
at this moment in time. The only ~~~~~g that is certain is that ' overall model will continue to change as more information bec
ome more es~b l~shed or more varied, or if p r ~ s s u r ~ other s~keholders pushes investment decisions in a new
is to eva~uate cQnt i~~al iy the bene~ts of in&
the principle of condition ~ o n i t o ~ n g and data collection, lest we forget to en~~al ly high cost associated with both the co~~ection and an
inst the cost of installation and operation. We
~eaTing in mind that the most effect~ve way of i ~ e n t i ~ i n g when of a ~ a ~ u a l l y ~ ~ ~ e n d e n ~ item of ~ ~ u ~ p m e n ~ , such as an isolator, requires m a i ~ t ~ n a n c ~ is to ask tbe last p~rson who o ~ e r a ~ e d it.

Asset Management 23
sis t
Large power t ransfo~ers are probabIy the most important equipment in an e ~ e c ~ c a l system. Correct diagnosis of their incipient faults is vital for the safety and ~ ~ I ~ a b ~ l i ~ of an c l e c ~ c a ~ netwo which can bre products. Qverheat~g, partial d iseh~ge and arcing are three primary causes of fault- related gases. There are many in te~ re~a~ ive methods based on DGA to diagnose the nature of transfomer detcnoration, such as the IEC ratio codes which were developed from
ions on gases generated from individual faults. has widely been used in the industry, in some cases, the conv~nt~onal
in-service ~ a n s f o ~ e r is subject to electrical and the n the insulating materials and release gaseous
osis incipient faults. This normally happens for those tran e 1ype of fault. Actually, the conventional d i a ~ o s ~ i c me es generated from a single fault or from ~ u l t ~ p ~ e faults based on the ratio
one of dominant nature in a transformer. When gases from more than one fault in a t r a ~ § f o ~ e r are collected, the relation between different gases becomes too comp~ieated and may not match the pre-de~ned codes. For instance, the IEC codes are d ~ ~ ~ e d from certain gas ratios. When the gas ratio increases across the defined limits (boun~aries), the code changes suddenly b e ~ e ~ n 0, 1 and 2. In fact, the gas ratio boundary may not be clear (i.e. fuzzy), especia~~y when more than one type of fault exists. there fore^ between different types of faults, the code should not change sharply across the boundaries, A new m e ~ ~ o d has been developed to employ fuzzy boundaries between differen~ IEC codes.
9.19.1 T h e ~ ~ C D
, the IEG codes have been used for several decades and eonsiderable ~ x p e ~ e n c ~ accu~uIa~ed throughout the world to diagnose incipient faults in t r a n s f o ~ e
used to determine each ratio and its assigned limits are shown i s are then allocated according to the value obtained for each ratio
corresponding fault characterised,
.19.2 The Fuzzy IEC Code - Key Gas Method
The fuzzy IEC code-key gas method (FIK) developed is a eomb~nation of diagnosis using IEC codes and key gases. This method produces nine fuzzy comp
onents are related to the fault types as d e ~ ~ i e d in T

IEC codes
Fault c la~s i~ca t io~ ~ c c o r ~ n ~ to the E C Gas
ischarges o f high energy
Thermal fault of low t ~ ~ p ~ ~ a ~ ~ r e
1 or2
2
1
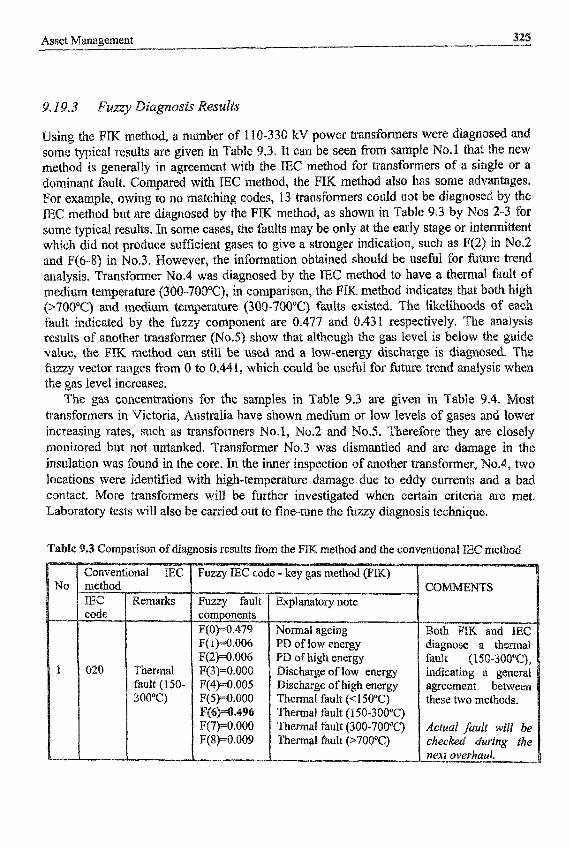
1 ~0-330 kV power ~ a n s f o ~ e r s were
with IEC me~hod, the FIK method also h es, 13 ~ a ~ s ~ o ~ e r s could not
method, as shown in Table 9.3 Its may be only at the early ive a s~onger indica~~on, s
nspectian of anothei re d ~ a ~ ~ due to e
charge of high energy
Thermal fault { 1~0-300"~) Thermal fault ~300-700'~) Thermal fault (>70QoC)
Actual fauIt will be checked during the next o v ~ r h ~ ~ ~ .
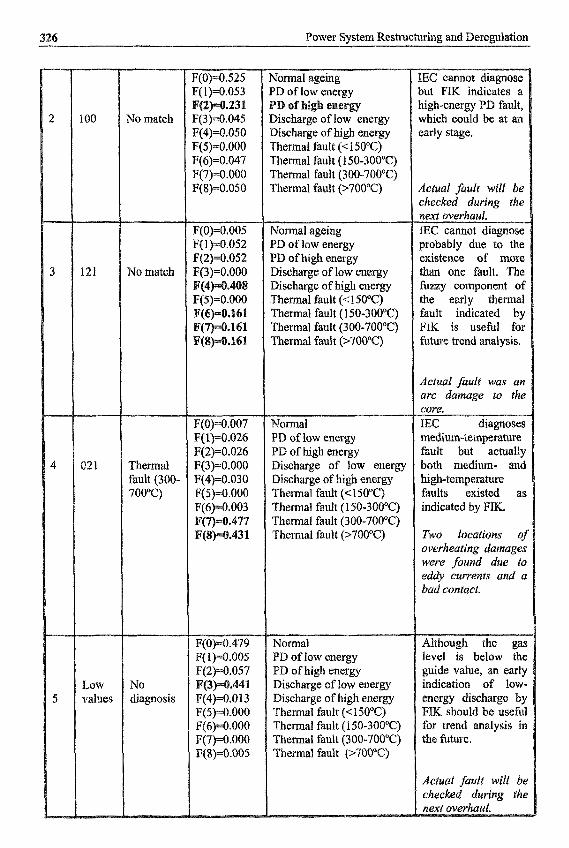
326 Power System Restructuring and Deremlation
I00
121
P
Low values
No match
No match
Thermal fault (300- 700'C)
No diagnosis
F(0)=0.525 F( 1)=0.053 F~2)=0.231 F(3)=0.045 F(4)=0.050 F(5)=0.000 F(6)=0.047 F(7)=0.000 F( S)=O .050
F(0)=0.005 F( 1)=0.052 F(2)=0.052 F(3)=0.000
F(7)=0.161
F(O)=0.007 F(1)=0.026 F(2)=0.026 F(3)=0.000 F(44)=0.030
.003 ,477 .431
F(s)=o.ooo
- F(0)=0.479 F( 1)=0.005
F(4)=0.0 13 F(5)=0.000
F(7)=0.000 F(S)=0.005
F(q=o.ooo
____ Normal ageing PD of low energy
Discharge of low energy Discharge of high energy Thermal fault (450°C) Thermal fault (150-300°C) Thermal fault (30O-70O0C) Thermal fault (>700"C)
Normal ageing PD of low energy PD of high energy Discharge of low energy Discharge of high energy Thermal fault (<150°C) Thermal fault (150-300'C) Thermal fault (300-700°C) Thermal fault (~700°C)
Normal PD of low energy PI3 of high energy Discharge of low energy
Thermal fault (cl 50'C) Thermal fault ( 150-3OOOC) Thermal fault (300-700°C) Thermal fault (>7OO0C)
Normal PD of low energy PD of high energy Discharge of low energy Discharge of high energy Thermal fault (450°C) Thermal fault (I 50-300°C) Thermal fault (300-700'C) Thermal fault (>700"C)
IEC cannot diagnose but FIK indicates a
which could be at an early stage.
Actual fault will be checked during the next overhaul. IEC cannot diagnose probably due to the e x ~ s ~ ~ n c e of more than one fault. The fuzzy compo~ent of the early thermal fault indicated by FIK i s useful for future trend analysis.
Actual fault was an arc damage to the core. IEC diagnoses ~ e ~ ~ ~ ~ ~ e ~ ~ ~ ~ r e fault but actually both medium- and h i ~ - t e m p e r a ~ r e faults existed as indicated by FIK.
Two locations o) overheating damages were Jound due lo eddy currents and a bad cantact.
Although the gas level is below the guide value, an early indication of low. energy discharge by FIK should be useful for trend analysis in the future.
Actual fault will bc checked during the next overhaul.

Asset Mana~ement 7
9.19.4
In FIK ~agnosis, a fault can be more accurately determiiied by its fuzzy component that indicates the likelihood or dominance of the fault. Deterioration of the fault may eref fore be closely monitored from trend analysis. This technique has been used for a that was tested over a 15-month period. ermal faults of medium- and high (300-700°C and >7OO"C) were diagnose y the FIK method and the fuzzy agaiiist the test time are plotted in Figure . The graph clearly shows the de each thermal fault in this t r ~ s f o ~ e r , It can be seen that at the begi monitoring period, the medium ~ e m p e ~ ~ r e thermal fault F(7) was the main p rob le~ of this ~ a n s f o ~ e r and the fi~zzy component of the high-tempera~re therm
mall, i.e. below 0.05. The high-tempera~re thermal fault F( 14 onwards and then become stable until Day 406 when the ssing, because the ~ ~ e ~ a l faults remained, the fuzzy compo
went up again from Day 453. It took a few weeks for the gases to be re1 in the oil to a sufficient level for accurate diagnosis. A small fluctuation of F(8) was recorded on Day 178, which might be due to the lighter load during the s p e c ~ ~ c time period.
mponent F(0) always gives a large value in th results for a hea~thy t r a n ~ f o ~ e r are (in ppm}
- 25, C,H, ~ 45 and C2H2 - 2. The fuzzy component of no-fault ~ ( 0 ) ~ . $ 4 3 at no fault exists in the ~ansformer. The IEC codes are 0, 0, 0, also i ~ d i c a ~ n g
no fault. From OUK experience^ when the value of F(0) is between 0.3 and 0.6, an inci fault may have occurred at earlier stage. When the fault is getting worse, F(0) will decrease to CO, 1.
~~e~~ ~ ~ u l y s i s qf I ~ d i v i d ~ ~ ~ ~ a u ~ ~ ~
It must be noted that if a transformer has no fault, th anga of 0.6-1. For example, - 95, N2 - 73000, 02 - 11000,

0.6
0.5 .+=.
0.4
0.3
0.2
0.1
0 1 114 147 178 191 218 406 413 453 469 471
a1 fault ~ 0 ~ ~ 7 0 0 degree C
The trend of tv.70 types of thermal fault in a 330 kV transformer determined by the FI methad
method developed has been succes ers in Au5~alia. It has been proved that, using the
costs of ~ ~ ~ f o ~ e ~ 5 . With the aid of ~ e ~ ~ ~ ~ ~ ~ § , such a5 the FIK method, the longer s c ~ ~ c e life could be achieved.

ario V.F. Pereira, Michael F. McCoy and Hyde BA. Merrilli, aging risk in the new power
123 Ceorge Anders, Robert Entriken and Puica Nib, Risk Assessment and Financial ~ a ~ a g e ~ e n ~ ,
131 Gorenstin, N.M. Cam~donico, J.P. Costa and M.V.F. Pereira, ‘Power systcm ~ l ~ i i ~ g
ofilo De la Torre, James W. Feltes, Tomas Gomez San Roman, Hydc M. M e ~ I ~ , i~atiza~ion, and com~etition: ~ansmission planning under ~ c e K ~ ~ ~ ~ ’ , ~ E ~ E
usiness’, IEEE Computer Applications in Power, Vol. 13, No.2, April 2000, pp. 18-24.
rial, IEEE Catalog Number 99TP137-0,1999.
under uncertainty’, IEEE Transactions on Power Systems, February 1993, pp. 129-136.
Transactions on Power Systems, May 1999, pp.469-465. [SJ J.C. Hull9 Options, Futures and Other Derivatives, Prentice Hall, New Jersey, 1998. [6] J. Schwager, A Complete Guide to the Futures: ~ ~ n d a ~ e n t a l Analysis, ~echnical Analysis~
Trading, Spreads, and Opt i~ l l~ , John Wiley & Sons, New York, 19%. [7] Price W~t~rhouse LLP, The Corporate Risk Management Handbook, Risk ~ublications* London,
1996,
[S] P. Jorion, Vdue at Risk: The New Benchmarkfor Controlling Market Bisk, Irwin Professional Pub., Chicago, 1997.
ouglas, A. A ~ ~ i a n , V. ~iemcyer, . Goldberg, and C. Claxk, ‘ ~ a ~ i g a t ~ n g the c ~ ~ ~ t s of risk‘, IEEE Power Engineering Review, March 1998, pp.6- 10,
[I01 D. Duffie and J. Pan, ‘An overview of value at risk’, Journal of De~vatives, ~ s ~ i ~ t i o n a ~
en & Co., The JP M ~ r g a n / ~ r ~ ~ u r Andersen Guide to cations, London, 1997.
[ 123 G.L. ~as~ ineau, ~ictionary of Financia~ Risk Management, Swiss Bank Corporation, New York,
[ I31 Eilron Capital
E141 R.L. Nersesim, Computer Simulation in Financial Risk Manugernemt: A Guide for Bwiness
[ 151 Q. Su, 6. Mi, L.L. Lai and P. Austin, ‘A fuzzy dissolved gas analysis method for the di
1992.
1995.
P l ~ n ~ ~ r s and Stra~~gists, Q u o ~ ~ Books, New York, 1991,
of multiple incipient faults in a transformer’, IEEE Transactions on Power Systems,
Trade Resources, an aging Energy Price Risk, Risk ~b l ica t ions~ Lon
2000, ~ ~ . 5 9 3 - 5 9 8 ,

Prof. JQS ~ ~ ~ l a g a University of Canterbury New ~ealand
University of Canterb New Zealand
to deregulation, electricity has been generally sold from one supplier to th ownership ~ h a n ~ i n g hands at only one piiysical point. In con~ast, after
it is expecte~ that the product will be exchanged at several points along th t~ansmi~s~on and distribution systems and there will be power quality (PQ) i
1 location where owner€hip is transferred. s, of course, an ~ b i ~ o u s term which in its b r o ~ ~ e s t sense is
quality including reliability of supply, waveform In a d e r e ~ ~ a t e d environme~t, only nationa~
and act on the in fo~at ion necessary to pro~ide system secu position, the grids can be unreasonably d ~ ~ a n d ~ n ~ in ation plant. In the long term, however, the expec~tio
will find s ~ ~ ~ g ~ r c o ~ p e t i t i o ~ from dis~ibuted generation, bo micro-hydro, wind and solar) and non-renewable energy ~ i c r Q ~ r b i n e s and fuel cells), the latter in the k i l o ~ a ~ rather
logy used in these energy sources involves power is now commercia~ly availa~le CO
links and FACTS ~ ~ e x ~ b ~ e AC power devices.
At the generation level, an increase in the connection of IPPs ( ~ n d e ~ ~ ~ d e n t ~ Q ~ u c e r s such as wind and gas"~e11ed ~ i c r o t ~ r ~ i n e s ) with p~Qrly c
Power Quality 1
sy~ic~onisation will make PQ more difEcult to control. The increase in embedded ~eneration will cause ~ r t h e r voltage ~ a g n i ~ d e variations as well as introduce additiona~ voltage m a ~ i ~ d e steps [2]. Wind power is known to lead to an increase i severity. Solar power and the more advanced ways of connecting wind power wi an increase in h a ~ o n i c d is to~on, At the ~ a n s ~ ~ i s s i o n level, the need for ~ y s t e ~ to transmit power according to contracts between the requested locations is a~celerat~ the d ~ ~ a n d for s ~ ~ ~ e s - c o ~ e c ~ e ~ FACTS controllers. c o ~ p ~ n s a ~ i o n and unified power flow controllers are expected to be used extensive~y once they are shown to offer better technical features at reasonable costs.
m planning under deregulation will be more difficult owing to u n c e ~ a i n ~ in the gene~tion and load locations, fast solutions will be needed to improve the o~erating conditions and FACTS controllers can offer such solutions with short delivery installa~ion times. The use of a s ~ c ~ o n o u s grid intercQ~ections, both national an i n t e ~ a t i o n ~ ~ is also likely to increase with dere~lation. The control1 asynchronous ~ ~ e r c o ~ e c t o r s is currently limited by the switching restricti silicon-controlle~ rectifier, which only permits two-quadrant converter direc~ional active power transfers, The ava~labi l i~ of gate turn-off permits four-quadr~t converter operation and considerable developan on to ~ m ~ r o v e the effic d power h~ndling capabil i~ of these d that w h e ~ e r in the of two~quadra~t or four -qu~~ant ;lijynchronous link is ~ l ~ n ~ n g and its i ~ ~ a c
Power elec~onic FACTS or custom power, have the poten~al to improve various aspects of e ~ ~ ~ o n ~ c control at d is~ ib~ t ion level may ~ i t iga te voltage v ~ a t ~ o n s ~ voltage sags. But the increased use of ower electronic controllers may introdwce new
erns like a ~ d ~ t i o n a ~ harmonic voltage distortion, especially in the form of higher order
n a co~pet i t~ve environ distribution sys~em,
In the
be an important player in modern ~ a n s m ~ s s ~ o n systems eeds to be carefuIly exa~ined, whether in the form of as~chronous interco~ec~ors,
t there will be reluctance to expand customer interaction,
or active coan~onents. Some of these changes tend to de
And, at the loads ~ h e m s e l ~ ~ § ~ i costs will create an emphasis on local co~pensati
loads of a cons~ant-power type. ltage drops causing additional vo use of Compensation equipment may even become
more c u ~ ~ n t wh
t of these prob~ems are not ex~~usive to dere~ulation. In fact, there is a c~~t inu ing s, such as adjustable speed drives, office equip~ent,
and ~gh-efficiency fluorescent lighting. At the same time, sensitive ~ n f o ~ a t ~ o n ment, such as PCs, continues to be dispersed into power locat~ons that
previously were res~icted to lights, motors and heaters. There is no reason to be~~eve this trend will reverse.
~ollowing deregulation, the power exchanges should be s~bjected to close s c ~ ~ i n y on a continuous basis, This requires dynamic evaluation of the and current waveforms, either by local ~ ~ a s ~ e ~ e n ~ s exclusively or by a combina~on of ~ e a s u r e i ~ e n ~ s and sys~em s i ~ u l a ~ i o ~ using h a ~ o n i c state est ima~io~ tec~iques. The

latter should provide more intelligent an economical solutions for the control of the di§to~ion p r Q b l e ~ on a system-wide basis. ~ e r e ~ ~ a t ~ o n
clear, for the most part, that the utilir the customer. After ~eregulat io~, however, who i s responsible for the
to con~sion, and po~sibly to an incr~as~ enerator? The e~ergy sup lier? The d i s ~ ~ ~ t o r ?
in d i ~ ~ t e s .
the quality ofpower has become e cts that help correct PQ problems
y local electric utilities have
une~pec~ed bene~ts from moiiitori ta with ~ndividual~ at those custo

In the con~ext o w a v e f o ~ caused
a d i$~bance i s a temporary deviation from the steady- Its of brief durat~on or by sudden changes in
dis~rbances con~idered by the ~ n ~ e ~ a t i o n a l ~ l e c ~ o t e c ~ i c a ~ C age dips (sags), brief i n ~ e ~ p ~ i o ~ s , voltage increases (swells),
osci l lato~ ~ a n s i ~ n ~ s . These are illus~ated in Figures 10.1 and 10.2.
Voltage d ~ s ~ r b a n ~ e s
.2 Voltage transients
supply ~ e ~ o r k . The main cau$e
xtinction of discharge 1 of control devices; speed variation or s ~ o p p i n ~ of motors; trippin CQntactorS; co~puter system crash; or c o ~ ~ u t a t i o ~ fail~re in line commutated inve~ers. The effect of a v o ~ ~ g e
Power System Restructuring and ~ ~ r e ~ ~ a t i o n
dip on equipment depends on both its magnitude and its duration; in about 40% of the cases observed to date, they are severe enough to exceed the tolerance standard ado~ted by
er manufac~rers. Brief interruptions can be considered as voltage sags with 100% de. The cause may be a blown h s e or breaker opening and the effect an expensive
s h u ~ d o ~ . For a given system design and fault location, a certain number of c u s t o ~ ~ r s wili be ~ ~ e c t e ~ and there i s no way to prevent this process without major system s ~ c ~ r a ~ changes.
I-lowever, i n t e ~ p t ~ o n s due to over~oad are somewhat more ~redictab~e. These include overload of the whole system (due to lack of generation) as well as ind~vidua~ lines and cables, Voltage collapse can also be view as an overload situation, but in this case load shedding can alleviate it. In the pre-dere~lation era, load shedding took place accord~ng to utility ides. ~ e r e ~ ~ a t i o n aIlows utilities to offer in te~upt i~ le and non-inte~ptible supply. During Limes of overload or overload risk, utilities may decide to increase the inc~ntive for customers to be i n ~ e ~ u p ~ e d [8,9]. At present, this action only covers a very s r n ~ i ~ fracti~n of the ~ n t e ~ p t i o n s but this will obviously change if the congestion in the system increases,
Voltage swells are brief increases in r.m,s. voltage that sometimes a c ~ o m p ~ y voltage sags. They appear on the unfaulted phases of a three-phase circuit that has developed a single-p~ase short circuit. They also occur following load rejection, Swells can upset electric controls and electric motor drives, pa~cular ly the adjus~b~e-speed drives, which can trip because of their built-in protective circuitry. Swells may also stress delicate computer components and shorten their life. Voltage disturbances swells are classified as transients arid are caused by su~den changes cw.
According to their duration, transient overvoltages can be di (du~ation in the range of ~~~i iseconds) , and ~mpuIse spikes microseconds), Surges are high-energy pulses d i s ~ r b ~ c e s , either directly or as a result o f resonating circ devices. They also occur during step load changes. In parti cause resonant oscillations leading to an o v e ~ o l ~ ~ e some three to four times the no~inal
, causing tripping or even damaging protective devices and equipment. ~ lec~onica l ly based controls for ~ n d u s ~ a ~ motors are pa~icularly suscep~ible to these ~ansients. Impulses result from direct or indirect lightning strikes, arcing, insulation b r e ~ ~ d o ~ , etc.
into sw~tching surges ion in the range o f
sing from power s y s t e ~ switchin ssociated with swit capacitor s w ~ ~ h i n
10. I . 3 Volta~e Sags
In Ehe present stage of deKegulation, no serious cons~deration is @ven to ~ a n s ~ i s s i o n and distribution levels and, therefore, there i s little incenti overall reduction in the f?equency of sags. Although there me indication will increase in the hture, some customers are likely to d e ~ ~ d a reduction in their n u ~ ~ e K .
One option is to introduce ‘power quality guarnntees’ whereby the customer receives ~o~pensat ion for each event exceeding a certain severity (in ~ a ~ i t u d e , duration or frequency). Such an additional service may be offered by the (monopo~ised) distri c o m p ~ ~ y , by the supplier, or by any other pfayer in the market (e.g. an insurmce c o ~ p ~ y ) , A ~ t e ~ a t ~ v e ~ y , a regulatory body may decide to enforce a basic compensation

Power Quality
scheme for all customers as part of the connection fee [ I 11. However, some customers may not be satisfied with any compensation scheme, safety being their main consideration. The option in this case is for the utility to offer high-quality power to a small customers. These customers will experience less voltage sags than similar customers elsewhere. This special service will require the installation of m~~gat ion equipment, which may be offered by the dis~but ion company, by the supplier, or by any other player in the market. Addit io~a~ regulations are needed to guarantee a minimum level of ~ o m p a t i b i l ~ ~ between equ~pment and supply:
Re~u i remen~ for equipment immunity must be produced by standard-se~ng organisations. The IEC is obviously the best platform for the development of such a s~andard. In the USA, the IEEE may take the lead. Standards for equipment test~ng, like IEC 6 1000-4- 1 1 [ 121, are also needed to obtain and verify equipment immunity. As a complement to equipment immunity requirements, voltage characteristics for the supply must be made available to the customers. The E u r o p e ~ s ~ d a r d EN 50160 should be extended with voltage characteristics for voltage sags and other events. Equivalent documents should be written for other parts of the world as well as local s t ~ d ~ d s for individ~dl countries [13].
latory bodies should pub~ish statistics on the PQ performance of uti~~ties. Such a e is already in place in the UK for long i n ~ e ~ p t i o n s [14].
Voltage sag ch~acterisat~on is an important basis for the above s ~ d ~ d regulations. At the time of writing, standardisation on this issue is under develo both in the IEC [4] and in the IEEE [lSJ. However, current activities concen sags experienced by sin~le~phase equipment.
A technique has been proposed for the characterisation of voltage sags [16] e x ~ e ~ e n c e d b three-phase equipment. It enables the characterisation through one complex vol wi~hout sign~ficant foss of information. The method is based on the decomposition o voltage phasors into symmetrical components. An additional characteristic is introduc en~ble the exact recons~ct ion of the three complex voltages. The m a ~ e ~ a t i c s behind the method and additional examples is described in references [2,17-20].
The ITIC (Information Technology Industry Council) curve [21] shown in Figure 10.3 can be used to evaluate the voltage quality of a power system with respect to voltage in te~pt ions, sags or unde~oltages and swells or overvoltage. This curve was ori
deline in the design of the power supply for computer and electronic in the 60 Hz, 120 V distribution voltage system. By noting the changes
of power supply voltage on the curve, it is ossible to assess if the supply is reliable for operating electronic equipment, which is generally the most susceptive equipment in the power system.
The curve shows the m a g ~ i ~ d e and duration of voltage var~ations on the power system. The region between the WO sides of the curve is the tolerance envelope within which electronic e~u ipmen~ is expected to operate reliably. Rather than noting a point on the plot for every measured d i s ~ b ~ c e , the plot can be divided into small regions with a certain range of magnitude and duration. The number of occurrences within each small region can be record~d to provide a reasonable indication of the quality of the system.

33 Power System ~ e s t ~ c ~ n g and
Percentage of nominal voltage (ms. of peak ~ q u i v ~ ~ e n t ~
110 90
0
Y Ims 3ms 2Oms 0.5s 1 OS State
Fi ETIG curve
elet ~ a n s f o ~ (WT) ides a fast way of an c u ~ ~ n t wav the ~~~~~r ~ r a ~ ~ f r ~ q u ~ n ~ y re
arly in the ~ r e s e n c ~ of a
(10.1)
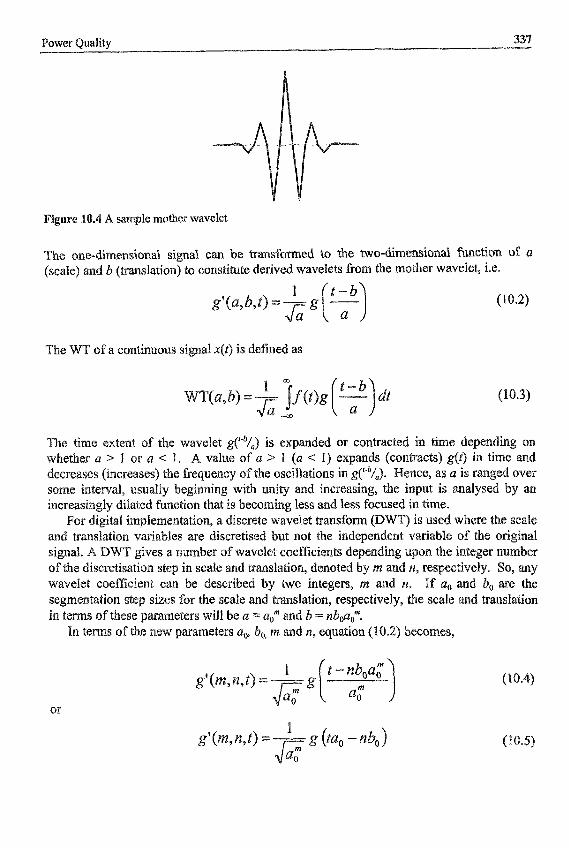
Power Quality 9
A sample mother wavelet
he WT of a ~ o n t ~ u Q ~ s si
(10.2)
time e~~~~~ of the w a v ~ ~ ~ t
are ~ i $ c r e t i ~ ~ d but not the i

Power System ~ e ~ ~ c ~ ~ n ~ and ~ e ~ ~ ~ l a t i o n
and the discrete wavelet coefficients are given by
(10.6)
Although the ~ a n s f o ~ a t i o n is over continuous time, the wavelets represen~tion is discrete and the discrete wavelet coefficients represent the co~e la~ ion between the original signal and wavelets for different combinations ofm and n.
The inverse DWT is given by:
= (A + B)/2, and A and B are the f i m e bounds (maximum values of a and b).
10.2.2 W a v ~ ~ ~ ~ Analysis
lysis is normally implemented using ~ult~-resolut~on s h- and low-pass equivalent filters, h and g respectively,
ana~ys~ng wavelet. The digital signal to be analysed is then decomposed (filtered) into smoothed and de~i ied versions at successive scales, as shown in ~ igu re 10.5 where (24) represe~~s a down sampling by half,
Scale 1 in Figure 10.5 contains i n f o ~ a t ~ o n from the Nyquis~ ~equeney (half the ains in fo~at ion frequency) to o n e - ~ u ~ e r the sampling frequency, scale
-quarter to one-eighth the sampliing frequency and so on. at any scale, with the final smoothed
s, i.e. scales 8,16,32, if it is is is one of the sirab able . The choice of mother wavelet has a nt effect on the results
obtained. The o ~ h o ~ o n a l i ~ of wavelets ensures that the signal can be recQns its ~ ~ s f Q ~ coeffic~ents [23]. Wavelets with s y ~ m e ~ ~ c filter c o e ~ c i e n ~ s genera^^ l~near phase shift.
A large wav~let family derived by Daubechies [2 ] covers the field of o ~ h o n o ~ a l wavelets. It includes embers ranging from highiy Daub6 wavelets ape the best choice for short and fa ~ a ~ s i e ~ t d i s ~ r b ~ c e ~ , Daub8 and Daub10 are the mo of a mother wavelet without knowledge of the types
de~ect~on and localisation for all types of d i s ~ ~ ~ c e s . simpler solution is the use of one type of mother wavelet in the wh

Power Quality
xi31 scale 2
scale
. I .
M u I ~ i ~ ~ ~ s o l u ~ o n signal d e ~ o m p o s i ~ ~ o ~ implementation of wavelet analysis
In doing SO, higher scale signal decomposi~ion is needed. At the lowest scale the mother wavelet is most localised in time and oscillates rapidly within a very short p e ~ o d of time. As the wavele oes to ~ ~ g h e r scales, the analysing wavelets becom~ less loc~lised in time and oscillate 1 owing to the dilation nature of the WT analysis. As a result of higher scale signal decomposition¶ fast and short transient d i s~bances are de~ected at lower scales, whereas slow and long transient d i s~bances will be detec~e scales.
10.2.3
Fig~re 10.6a shows a s ~ u e n c e of voltage dis~rbances. To remove the noise prese~t in the waveform, squared wavelet ~ a n s f o ~ coef~cients (SWTCs) are used at scales rn = I 2 3 and 4, ~ ~ s p e c t ~ v e ~ y ( s h o ~ in F wavelet. Figure 1 0.6a contains time 30 ms, and is ~o~lowed by a siow oscillation dis~rbance (low freque ms. The SWTCs at scales I, 2 and 3 catch these rapid oscillations, while scale 4 cat slow osci~lat in~ d i s ~ r b a n c ~ ~ which o c ~ u ~ e d after time 30 ms. Note that the h i ~ h persist at the same te~pora l location over scales 1,2 and 4.
waveform distortion (like no~ches and h a ~ o n ~ c s ) and other momen~ary inter~ptions, sags and surges. ~owever¶ rig must be developed for each au~omatic ~ ~ a s s i ~ c a ~ o n of P
10,6b, c, d and e; these are analysed U
rapid oscillation disturbance (high fre
It must be pointed out that the same technique can be used to det
stutbance for the WT to be accepted as
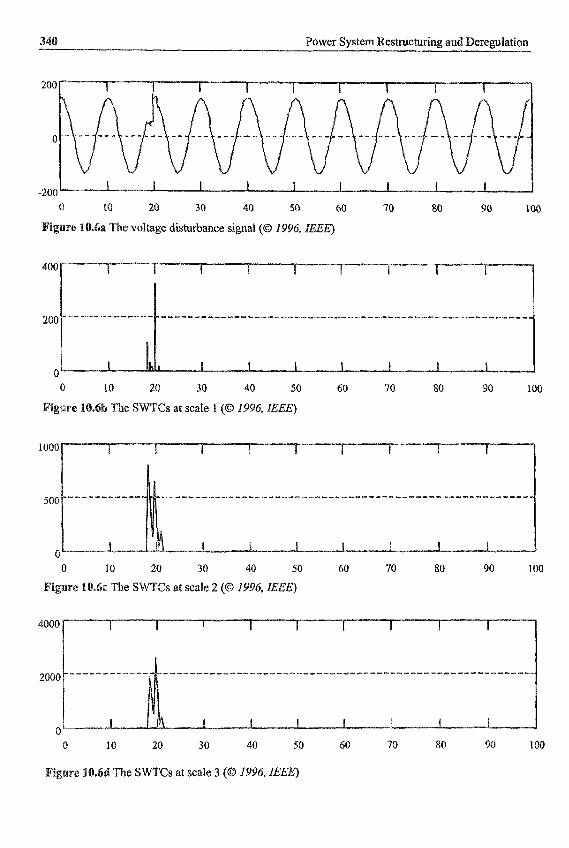
Power System ~ e s t ~ c t u ~ i n g and
200
0
0 10 20 30 40 50 60 70 80 90 100
e Voltage disturbance signal (0 1996, iEEQ
0 10 20 30 40 50 60 70 80 90 100
The SWTCs at scale I (0 1996, Z E ~ ~
0 10 20 30 40 50 60 70 80 90 100
The S~~~~ at scale 2 (0 19~6, IEEQ

0 10 20 30 40 50 40 70 80 90 100

42 Power System Restructuring and ~ e r e ~ ~ a t i o n
.3 istor
W a v e f o ~ d~sto~ion is generally disc~ssed in terms of h ~ o n i c s , which are s voltages or currents having frequencies that are w the supply system is d e s i ~ ~ to operate (e.g. 50 these voltages and currents are not an integer of
frequency at which the ~e¶uencies of they are termed
nic and interha~onic ~ s t o ~ i o n is generally caused by ~ u i p m e ~ t with non-linear voltage/c~ent characte~st~cs. In general, distorting equ harmonic currents which in turn cause harmonic voltage drops across the impedances of the network. Harmonic currents of the same frequency &om different sources add vec~orially. It is believed that, in general, harmonic levels tend to be i n ~ ~ e n c e d prima~ly by local and immediately adjacent conditions rather than wider zonal effects.
The main de~imenta~ effects of h a ~ o n i c s are [30]:
maloperation of control devices, mains signalling systems and protective r ~ ~ a ~ s , losses in capacitors, ~ ~ s f o r m e r s and rotating ~achines, ional noise from motors and other apparatus,
telephone interference, and e presence of power factor corr~ction c a p a c i ~ o ~ and cable capac~tance which can
cause shunt and series resonances in the network roducing voltage ~ p ~ i ~ c a t ~ o n even oint from the distorting load.
As well as the above, in te rha~on~cs can perturb ripple eantml sign& and at s h a ~ o ~ ~ c levels can cause flicker. To keep the harmonic voltage content within the recom~ended levels, the main solutions in c u ~ ~ n t use are:
the use of high pulse recti~cation (e.g. smelters and R passive filters, either tuned to i n d i v i d ~ ~ &e¶uencies active filters and conditioners.
I U, 3. I ~ a ~ ~ o n i c Sources
Lower order odd h ~ o n i c s are the most prol i~c among consumer e~ectronic $yste~s. I~owever, the third harmonic (of zero sequence) is usually p r~ve~ ted from en~erin high voltage system by the use of appropriate transformer connections. The fifth harmonic (in the UK) has been identified as the harmonic order exhibit in^ the highest peak levels of high v o ~ ~ g e systems, with values between 2.5% and 3.0% at some locations. The fifth also most ~ e ~ ~ e n t l y presents the highest mean harmonic levels, a characteristic which has been found to be consistent both geo~phica l ly and with time.
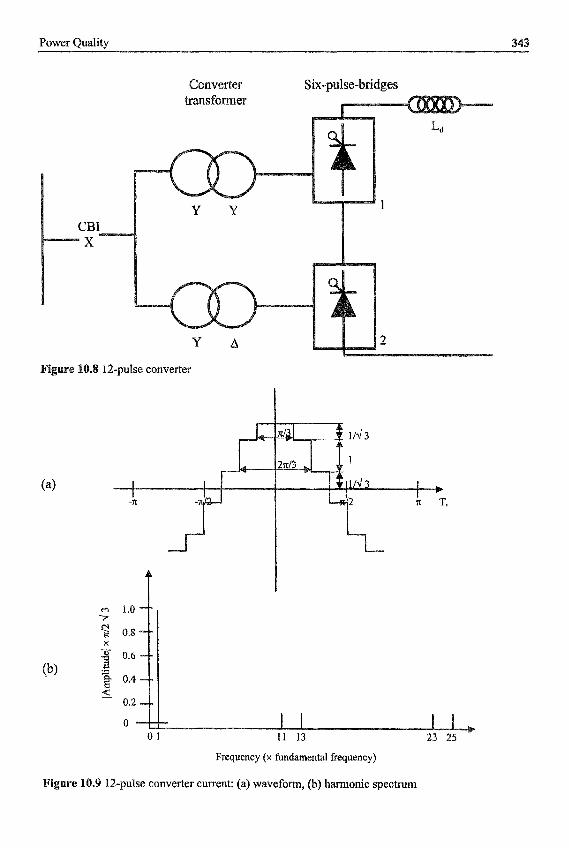
Power Quality 3
@)
-n
m 1.0
2 0.8
8 0.6 a
5.
-7 r4
X I
.- - g 0.4
0.2
0 1 11 13 23 25
Frequency (x fundamental frequency)
igure 10.9 12-pulse converter current: (a) waveform, (b) harmonic spectrum
‘The § t ~ d a r ~ c o ~ ~ g u r a t i o ~ for i ~ ~ u s ~ i a ~ a ations is the ~ 2 ~ ~ u l s e cQnve~er, shown in igure 10.8. The c~aracteristic
ation are o~orders 12k-t-1 (of positive s e q ~ e n c ~ ) and 1%- a ~ ~ l i ~ d e s are inv~r§~ly p r o ~ o ~ ~ o ~ a ~ to the ~ a ~ o ~ i c
s ~ e c ~ ~ m of Figure 10.9b which co~espond~ to the time wavvefo of course, ~ a ~ i r n ~ 1
e d ~ c e ~ AC s y s ~ e ~ 1s for ideal system conditions, a per~ectly flat direct c u ~ ~ n t (i.e. i ~ ~ n i t ~ s~ooth ing
erfectly s y m m e ~ ~ a l en the AC system is weak and the o ~ a r ~ o n ~ c s appear.
it is not e~onornica~ to reduce in that way the un ile t~~ c~aracteristic h ~ o n i c s
devic~s and are, there
~ o ~ h e ~ common ex amp^^ of unc~arac~

3
els with v ~ ~ o u s levels of c o ~ p l e x i ~ are app~aring 1 no~- l i ~ea r cQ~ponents, such as AC/DC converte
harmonic Norton equivalents. They involve iterative harmonic analy in~e~action b e ~ e ~ the conve~er and the linear system. Further work is
1 ~ ~ e Q u s l y the effect of multiple ~tercQnnected non-li The system s ~ a ~ y state is $ub~ta~tially, but not completely, desmib
ark. In many eases, it is a s s ~ e d that there the ~ n d a ~ ~ e n t a l frequenc~ and its ~armQnic$.
he
cedwe used to solve the non-li~ear equation set.
a set o f accurate non-linear e

6 Power System ~ e § ~ c ~ ~ n ~ and Dere
10.3.3 ~ ~ r ~ o n i c Flows (301
In its simples~ form the frequency domain provides a direct solution of the effect of d in~ividua~ h a ~ o ~ i c or ~ o n ~ h a ~ o n i c ~equency injec~~ons t~oughout a linear
system, without explicit consideration of the harmonic interaction between the network and the n o n ~ l i ~ e ~ comp~~en~(s) .
linear c~~ponen ts , can be current sources or Norton or Thevenin harmonic ~ ~ u ~ v a l e n t ~ , A c o ~ r n ~ n experience derived from harmonic field tests i s the asyrnme~ica1 n a ~ r e of the readin~s.
The sources of h ~ ~ o n i c injection, depending on the available info
, being the mle rather than tbe exc s. The basic compon~n~ of a the
justifies the need for three
~ ~ s m i s s ~ o n line, which can be accurate~y represented model, including mutual effects a n line m o d ~ ~ s are then combi~ed w
The system harmonic voltages are calculated by direct solution oflhe linear equation
as earth return, skin other n e ~ o r ~ passive
c o ~ p o n ~ n t s to obtain t~ee-phase equivalent h a ~ o n i c i
is a reduced system a d ~ ~ ~ a n c e rn x of order equal to ( n u ~ b e ~ of inject~on busbar§,
current waveforms often have an ape~iodic coinponent. The most c o ~ m o n iodicity in the ~ a v ~ f o ~ is and i n t e r ~ ~ o n j ~ con~ent~
also pro~uces voltage ~ ~ c ~ a t i o n ~ and l i ~ h t ~ ~ c ~ e r . ~ o ~ e c t i o ~ to the voltage level and the of series reactances
. The conve~tiona~ P account the ~per io~ ic co~ponents.
For example, the total h a ~ o n i c distortion ( onics to that in the ~ n d a ~ e
D) is basically a ratio of the en~rgy co~ponent~ It is possible to d e ~ n e a
r the aperiodic case by defining the power f r equ~~cy (and there I, component), and then using the ~emain in~ portion of the s
nu~erator of a ~ ~ - 1 i k e index [39]:

Power Quality
where the power ~equency is denoted as coo and E[.] denotes the calculation of the ener of a time signal. The prime on th D indicates that this is not quite con~entional THD ca~cu~atiQn. Of e, TMD degenerates to TIID for the pe~odic case. With re~erence to the flicker disturbance, the measurement and frequency windows in which flicker exists is de~ned ~ l e c ~ r o ~ e c ~ i c a ~ Commission fluctuations in the supply voltage.
should the flicker energy (i.e. sideband energy in the vicinity of measured in root mean square a m p ~ i ~ d e , or zero to peak?
inte~ational standards, mainly thro C). Generally, flicker i s limited to
A proble~atic f ~ ~ ~ r e of this index is how the flicker is to be m sured. As an examp~e, power frequency) be
m e a n i n ~ ~ l to integra~e the sideband energy over a latter appears to have less phys~ological implic
mathemat~cal properties. Also, the integration of energy physiologic~~ weigh~~ng factor as specified by the IEC stand tran§form, short-time Fourier transform, and Fourier linear combiner have been sugges~ed as possible solutions to the problem.
with the intent of s u m m a ~ s ~ rms of the active power loss
distortion, and the ~n~er~erence on telephone and data communication ei these indices have evolved from expe~ence with power systems, and from heuristics. However, with the advent of power electronics and 0th
m in~ i t i ve r ~ a s o n i n ~
tronic devices, there are prob~ema~jc cases in the general app~ication of indices. For examp~e~ consid e use of the power factor index to minimi
sys~em losses, with a ti load, such as a pulsating load on the s phase induction motor, become a source over part of the cyc stroke occurs fo~lowed by a re~e~erat ive period). Thus, the power ~nd~ct ion m a c ~ n e load may go ~ e a ~ n g and lagging. In this case, th correct the power factor to minimise loss in the distribution supply intuitive result. The power factor index should be applied with caution in cases o f time v ~ a t ~ o n , unbalance and presence of on-powe~ frequency signals,
tion of definition, the simple app~~ca t io~ of the indices (and the simplified of the ~ ~ c e s ) . However, in some cases, indices should not be used at all. Instead, it ~ ~ g h t be
ng
The main ~o t i va~ ion for using indices is the ease in calculation, th
the time waveshape of voltages and currents directly. ~ o m e definitions include sojourn time, wavelet spectrum, Liapunov
The in dust^ needs to est~blish ~ ~ i f o ~ and complete P that d~~ can be compared (over location, over time, etc.) and such as IEC 61000-~-7, which cov 77A Work~ng ~ r o u ~ 09 has made en
U ~ ~ l ~ ~ - o ~ e n ~ e d PQ s ~ ~ d a r d s are of s~ndards can be used to set a CO
and they should create a ~ i ~ m u ~ a c c e p ~ ~ ~ ~ level of PQ. The contains some we11"~e~ned margins for harmonic disto~ion ancl other variation^ WO&, ~ ~ w e ~ e r , still needs to be done to set acc and ~ ~ ~ ~ ~ p t i o n ~ . The voltage characteristic e q ~ ~ p ~ e n t i ~ ~ ~ i ~ re ~ r ~ ~ e n t s and a maxi needs to be decided on.
is far less expensive to inform m ~ u f a c ~ r e r s ~ ~ o ~ t the real level of t to improve the level of power quality. Some in sky , have already developed their own s ~ ~ n ~ ~ ~
ility s t ~ d ~ ~ will u ~ ~ i ~ t e l y ~ i n i ~ i $ ~ all P
ean s ~ a ~ d ~ d ~ ~ e a d y
le levels for events li themselves are not miss ib~~ umber of quip
More work i s needed on PQ standards that can be used by equip~ent m a n ~ ~ a c ~ r e r s . It
issues, i n c l u d ~ ~ t ~ o s e
us effort is needed from $ ~ ~ a r d " § e ~ i ~ g lish require~ents for equ


35 Power System R e s ~ c ~ r i n g and Dere~lation
[ 121 ‘Voltage dips, short intemptions and voltage variations immunity tests’, IEC Standard ~ocument 61 000-4- 1 1.
[ 131 ‘Basnivo fdr elkvalitet’, (Basic level for power quality, in Swedish), Gdtborg Energi Ndt AB, ~ot~enburg , Sweden, 1997.
port on distribution and transmission system perfo~ance’, pub~ished annually by Office of Electricity Regulation, Birmingham, UK.
[ 151 IEEE Project Group 1159.2: Power quality event characterization. llen, J. Svensson and L.D. Zhang, ‘Testing of ~d-connected power”e~ec~onics for the effects of short circuits in the European Power Electronics
. Bollen, ‘A method for characterizing unbalanced voltage dips (sags) onents’, IEEE Power Engineering Letters, July 1998.
[l8] L.D. Zhang and M.H.J. Bollen, ‘Characteristics of voltage dips (sags) in power systems’, I n t e ~ a ~ ~ o n u ~ Conference on Harmonics and Quality of Power, Athens, Greece, October 1998.
[19] M.H.J. Bollen, ‘Characterization of voltage sags experienced by three-phase adjustable-speed drives’, IEEE Transactions on Power Delivery, V01.12, No.4, 1997, pp.1666-1671.
[20] L.D. Zhang and M.H.J. Bollen, ‘A method for characterisation of three-phase unbalanced dips (sags) from recorded voltage waveshapes’, International Telecon~municu~ions EneW Conference ~ ~ T E ~ E C ) , Copenhagen, Denmark, June 1999.
221) ITIC ( ~ ~ ~ o r m a ~ o ~ Technology Industry Council, formerly known as the Co~puter & siness ss Equipment. Manufacturer’s Association), ITIC Curve Application Note, available at
acharjee, ‘Applicat~on of wavelets to d e ~ e ~ i n e motor drive performance during power system switching transients’, Power ~ ~ a l i t y
Confer~nce, Lausatme, Switzerland, 1999.
[221
1, A ~ ~ e r d ~ , 1994. An Introduction to Wavelets, Academic Press, 1992,6-18. L231
[24] 1. Baubechics, ‘Orthonormal bases of compactly supported wavelets’, ~~mrnun~ca~ions in Pure and A ~ ~ ~ ~ e d ~ u ~ h @ m a t i c s , Vo1.41, 1988, pp.909-996.
[as] S . Santoso, E.J. Bowers, W.M. Grady and P. H o f ~ ~ , ‘Power quality assessment via wavelet t ~ a ~ ~ f o ~ mlysis’ IEEE Transactions on Power elivery, Vol.11, No.2, 1996, ~ p . 9 2 4 - ~ ~ 0 .
egnevi~sky, ‘Automated disturbance recognition in power systems’, Power ~ n g ~ ~ e e r ~ n g Conference (AUPEC 98), Hobart, 1998, pp.593-
597. 1271 P.F. Ribeiro and P. Ceiio, ‘Advanced techniques for voltage quality analysis; ~ ~ ~ ~ e s s a ~
sophistication or indispensable tools’, Paper A-206, Power Quality assess men^, ~ ~ t e r d a i n , 1994.
[28] L. Zadeh, ‘Fuzzy sets’, Info~at~on and Control, Vol.8, No.3, 1965, pp.338-354. Introduction to Fuzzy Logic for ~ r a c t i c a ~ App~icati~ns, Sp~nger, 1997.
a, D. Bradky and P.S. Bodger, Power System ~ u r m o ~ ~ i c s , John Wiley & Sons,
ads and J. Arrillaga, ‘HVDC converter ~ a n s f o ~ e r core saturation instability: A frequency domain analysis’, IEE Proceedings - Generation, T r a n s ~ i s s ~ o ~ * Distribution,
. Ainsworth, ‘The p~ase-~ocked oscillator. A new control system for controlled static converters’, IEEE Transactions on Power Apparatus and Systerrts, Vol.PAS-87, 1968, pp.859- 865.
V01.143, Ea0.1, 1996, pp.75-81.
Power Quality 1
liaga, N.R. Watson, J.F. Eggleston and C.D. Callaghan, ‘Comparison of steady state and dynamic models for the calculation of a.c./d.c. system harmonics’, IEE Proceed~ngs, Vol. I 34C,
R. ~acamin i and J.C. Oliveira, ‘~armonics in multiple converter systems: a genera~~sed approach’, IEE Proceedings, 6. Carpinelli, et al., ‘Gener sed converter models for iterative harmonic analysis in power systems’, IEE Proceedings Generation, Transmission and Dis~ributi~n, Vol. 14 1, No.5, 1994,
C.D. Callaghan and J. Arrilla~a, ‘A double iterative algorithm for the analysis of power and ~ a ~ o ~ c flows at ac-dc converter terminals’, 115%: Proceedings, Vol.136, No.6, 1989,
No.1, 1987, pp.31-37.
V01.127, 1980, pp.96-106.
pp.445-45 1.
. Smith et al., ‘A Newton solution for the harmonic phasor analysis of ac-dc con~e~ers ‘ , IEEE PES S ~ m ~ e r Meeting ‘95, SM 379-8. C.D. Callaghan and J. Arrillaga, ‘Convergence criteria for iterative harmonic analysis and its application to static converters’, ICHPS IV, Budapest, 1990, pp.38-43. G.T. Heydt, ‘Problematic power quality indices’, Panel Session on ~ ~ ~ ~ n ~ c ~ tanda~ds, IEEE Winter Power Meeting, Singapore, 2000. R. Ott (Chairman), IEC 77A Low Frequency Phenomena, Working Group 9, ‘Power qua~ity measuremen~s’, Draft in progress, 1999. IEEE 141:1986, Recommended Br IEEE 1159: 1995, lEEE R e c o ~ e n d e d Practice on Monitoring Electric Power IEC 61000-2-5: 1995, E l e c ~ o m a ~ e ~ i c Compatibility (E~C), Part 2: E n v ~ o ~ e n t , $ection 5: Classifications o f Electromagnetic Environments. IEC 61000-2-1 : 1990, Electroma~etic Compatibili~ (EMC), Part 2: Env i ro~ent , Section 1: Desc~p~ion of the E n v ~ o ~ e n t - Electroma~etic Environment for Low-~requen~y Con~ucted Disturbances and Signalling in Public Power Supply Systems. IEC 61000-2-2: 1990, E l e c ~ m a ~ e t i c Compa~ibifity (EMC), Part 2: Env i ro~ent , Sect~on 2: Compa~~bility Levels for ~ow-~requency Conducted Disturbances md Si~a l I ing in Public Power Supply Systems. IEEE c62.41: 1991, IEEE R e c o ~ e n d e d Practice on Surge Voltages in Low-Vo~~age AC Power Circuits. IEG 816: 1984, Guide on Methods of Measurement of Short Duration Transients on Low
to Measurements of Voltage Dips and Short ~ n t e ~ p ~ i o n s Occurring in Industrial Installations. Federal ~ n f o ~ a ~ ~ o n Processing Standards Publication 94: Guideiin~ on E ~ e c ~ c a l Power for ADP ~n~tal lat ion~, National Technical Information Service, 1983. D.L. Brooh, R.C. Dngan, M. Waclawiak and S. Sundaram, ‘Indices for assessing utility
system R.M.S. varialion ~ e r f o ~ a n c ~ ’ , IEEE T r a n s a c ~ j o ~ Power Delivery, PE-
IEEE 519: 1992, IEEE Recommended Practices and Requirements for Harmonic Control in Electric Power Systems (ANSI). IEC 61000-4-7, 1991, E ~ e c t r o m a ~ e ~ i c Compatibility (EMC), Part 4: Limits, Section 7: General pi& on harmonics and inter-harmonics measurements and ~ ~ ~ ~ ~ u m e n ~ a ~ ~ o n , for power supply systems and equipment c o ~ e ~ t e d thereto.
ctric Power Distribution for Industrial Plants.

estructtaring and ~ e r e ~ l a ~ ~ Q n
irectives conce~ing the Protection of T ~ l e c o ~ m ~ i c a t i o ~ Lines against
Group, ~nter-ha~Qnics in Power Systems, January 1997. [571 Ec 868: 1986, F ~ ~ ~ k e ~ e t ~ T -Functional and design spe~i~cations. [58] IEC 868-0: 1992, Flickermeter - Evaluation of flicker severity,
4: Limits, Section 15:
ems and Equip~ent -
Relevant Standards. E631 lEEE 100:1992, IEEE Standard Dictionary ofEIecCrica1 and Electronics Te 1641 ET4 50160 1994, Voltage ~ h ~ a c t e ~ s t i c s of E l e c ~ i c i ~ supplied by Public
1651 IBC 61000-3-2: 1994, E for ~ ~ o n i c current em
[66] IEC ~ 1 0 0 0 - 3 ~ : 1994, E armonic current emission 6~000-~-3: 1994, Elect
Rated Current 1 16 A. ~ ~ i ~ t i o n of Voltage ~ l u c ~ t i o n s and Flicker in LQw-volta~e ~~~~1~ ~ y $ t e ~ for ~ ~ u i ~ ~ e n ~
C), Part 3: Limits, SectiQn 5: ~ ~ ~ i ~ a ~ i o ~ of Voltage Fluc~a~ions and Flicker in ~Qw~VoltagG $upp~y ystem for ~ q u i p m e ~ i ~
d Current gncata than 16
G analysis in real-time’,
r Loi Lei Lai Iowa State Univer§~ty University of' ~ e § t e ~ Australia City ~ n ~ v e ~ § i t y . ~ o n d ~ n USA A ~ § t ~ l i a UK

3 Power System ~ e ~ ~ c ~ ~ n ~ and D ~ r ~ ~ l a t i o n
S o ~ a r e agents have evolved from multi-agent ~ y s t e ~ s three broad areas which fall under distributed artificial being dis~ibuted problem solving (DPS) and parallel arti ~ e ~ c ~ , as with ~ulti-agent systems, they i ~ e r i t many potential benefits. For example, s o h a r e agents inherit modu~ar i~ , speed (due to parallelism) and reliability (due to redundancy). It also i ~ ~ r i t s those due to AI such as operation at the ~ o w ~ e d g e level, easier mainte~ance, reusab i~ i~ and p l a ~ f o ~ ~ independence. The concept of an agent can be traced back to the early days of research into DAI in the 1970s.
tudy of mu~t~ple collaborat~v~ agents includes intera~tion and c o ~ ~ n i c a t i o n be agents9 d~composition and dis~bution of ta coordina~ion and cooperation, conflict resolution via negotiation. These resulted in work such as I planning and game ~ht:Qr~es [17]. ‘ sma~ess ’ derives from the fact that the ‘value’ gained from ~nd~vidual stan agents c o o r ~ ~ n a ~ ~ n g their actions by working in coo~erution is greater than that gained from any individual agent. App~ i~a~ ion domains [ 1x1 in which agent solutions are being applied to or investigated include work~ow management, network management, a i r - ~ a f ~ c control, business process re-enginee~~ in fo~at ion re~eval/management, electronic commerce, educat~on, perso ~ s i s t ~ n t s as), e-mail, digital l ~ b r ~ i e s , c o r n r n ~ ~ and ~ontrol, ~ m a ~ s~heduIing/dia~ m a n a ~ e ~ e n t , etc.
c Q n ~ e ~ i n g them into real usable appiications would of wh~ch have been ant~cipated but, currently, many of this section is that agents are here to stay, not least because of thei r a n ~ e of a ~ ~ ~ i c a b i l i ~ and the broad spectrum of companies investing
It is important to note that most agent-based s are still ~ ~ m o n s ~ r ~ t ~ r s only: e even greater cliallenges, some
reseen. The essential ~ e s s ~ g e ity9 their wide
a component of software andfor hardware which i s capable of accomplish tasks on behalf of its user. here art: several
first^^, agents may be classified by their mobility, i.e. by their ability to move a ~ ~ ~ n d some n e ~ o r k . This yields the classes of static or bile a~ents.
~ e c o n ~ ~ y , they may be classed m either ~ e ~ i b e r a ~ ~ v e or reactive. derive from the deliberative thinking p~adigm: that is, the agents symbolic, reasoning model and they engage in p l a ~ i n g and neg~tiation in order to achie~e
with other agents. Work on reactive agents o r i~ in~ tes from research carrie oks [19]. These agents on the contrary do not
state of the env~onment in whi that intelligent behaviour can
odds of their environment, and they act using a stimulus
olic re~resenta~~ons of traditional AI [21].

Information Technolonv A ~ ~ ~ i c a ~ i o n 355
Thirdly, agents may be classified along several ideals and pfimary attributes that agents should exhibit. At cooperat~oi~, have been ~dent i~ed. ~ ~ ~ o ~ o ~ y refers to the princip~e that agents can operate on their own without the need for human guidance, even though this would sQmetime§ be invaluable. Hence agents have individual internal states and goals, and they act in such a manner as to meet their goals on behalf of their user. A key element of their autonomy is
activeness, i.e. their ability to ‘take the initiative’ rather than acting s to their environme~~ [22], Cooperation with other agents is paramoun~.
to cooperate, agents need to possess a social ability, i.e. the ability to interact agents and possibly humans via some communication language [22]. Having said this it is possible for agents to coordinate their actions without cooperation [23]. Lastly, fo systems to be truly ‘smart’, they would have to learn as they react and/or interact w external environment. Agents are (or should be) disembodied bits of ‘intelligenc these three minimal c~llaborative agents, collabo~ative leaming agents, interface agents and smart ~ ~ e ~ t ~ .
T Labs, three main attributes, namely autonomy, le
es, Figure I 1.1 was used to derive four types of agents, namely
smart \ / Collabo~at~ve
agent^ Agents
1.1 A part view of an agent typology
It must be emphasised that these distinctions are not definitive. For ~ x ~ p l e , with ative agents, there is more emphasis on cooperation and au~onomy ; hence, it is not i ~ p ~ i e d that collaborative agents never learn. Like
ere is more emphasis on autonomy and learning than o Ise which lies Qu~s~de the ‘~ntersecti~g areas’ is not con most expert syste~ns are largely ‘autonomous’ but,
may s ~ ~ e t i m e s be c l ~ s i ~ e d by their roles ~re ferab~y, odd Wide Web ( ~ ) i n ~ Q ~ a t i o n agents. Again, info
~ i ~ h l y , two or more age^^ ~hi loso~hies are combined in a ~ y ~ r i ~ agent. There are Qther a ~ b u ~ ~ s of agents, which we already m e n t i ~ ~ ~ ~ . For example, is an agen~ versatile (i.e. does it h
in a variety of tas Does an agent lie Can you trust the agent enough to (risk) delegate task in contrast to failing ast tic ally at the b o ~ ~ ~ e s ? Pe
Is an agent benevolent or non-help wingly or is it always ~ u t h f u ~ (&is

Power System ~ e s ~ c t u ~ n g and Dere
~esearc~ers are also a ~ b u t ~ n g e ~ o ~ i o n a l attitudes to agents - do ~~~y get ‘fed up’ to do the same thing time and time again?
c o n s ~ ~ c t i n ~ believab~e agents [NI? In essence, agen space. It is quite possible that agents may be in co~p~t i t ion with one another, or per
role does e ~ o t i o n have in in a truly ~ u l t i - d i ~ e ~ ~ i ~ n a i
stic towards each other. In agen~-ba involves high-level messages. The use of
lower ~ ~ r n ~ ~ c a ~ ~ o n costs, easy reimplementabi most i ~ p o ~ t ~ y , agent-based applicat~ons op
d ~ o n c u ~ e n c ~ . Lastly, and p ally at the ~ o w l e ~ g e level [
.l, collabo~tive agents emphasis^ autono~y and s) in order to p e r f o ~ tasks for their o ~ e ~ . They may le
rnphasis of their operation. In order to have a CO
ey may have to ne~otiate in order to reach
The ~ o t i v a ~ ~ ~ n for having co~~abora~~ve agent systems may include one or several of
to solve probI~ms that are too large for a cen~al~sed single agent to do owin resource l i~ i~at ions; to allow for the ~nterconnecting and interoperation of
so~utions to i~herent~y d is~buted e solu~ons which draw from
a ~ e e ~ e i i t s on some matters
the ~ o l l o w i n ~ ~
speed (due to p ~ a ~ ~ e ~ ~ s r n ) ,
~ h a r e a b i ~ ~ ~ of resources); to re~earch into other issues, e.g. understanding ~nteractions
asise autonomy and lea rn~~g in order to p e ~ o subtle emphasis and distinction between c o ~ ~ a b o r a ~ i ~
c o ~ ~ a b o r a t ~ n ~ with other agents, as is the case with c o ~ ~ a ~ o r a t ~ v ~ ~gents. ~ o ~ ~ a b o r a t i ~ g with ay not requir~ an explicit agent c o ~ m ~ i c a t i o n l a n ~ a g e as one re~uired when
ith other agents. Essentially, interface agents support and provide assis~nce system. The user’s agent erface, learns new ‘short-
acts as an assistant,
lar app~ication such as 1 itors the actions taken better ways of doing the task. Thus, the user’s
erates with the user in ac~o~pl ishing the task. As for Ily to assist their user better in the ~ ~ l ~ o w i n g four ways [26]:
o b s e ~ ~ n g and imitating the user (i.e. l e~n ing h receiv~n~ posit~ve and ~egative feedb
ctions from the ~ s e r
Information Technology A~~l icat ion 7
other agents for advice (i.e. learni~g from peers).
Their coo~er~t ion with other agents, if any, is limited ically to asking for a d ~ ~ c e , an ion deals with em, as is the case with co~~abora~ve agen~s. The
ically by m e m o ~ - b a s e ~ learning or other t e c ~ i ~ u e s such as h are being in~oduced.
An interface age^^ is a ~ u a s i - s m ~ ith one or or^ computer appbica where boring and laborious tasks could
e tedium of ~umans p e r f o ~ ~ ~ ~ operatio~s.
from a flight reservation to ~ ~ a ~ i n ~ a te le~o~mun~cat~ons s neither a necessary nor , ~ u ~ c i e ~ ~ ca~d~t ion for a ~ ~ ~ t ~ a a ~ .
wn to other agents.
~ a ~ e r [28] lists the ~ a j o ~ c~al le~ges. They ~ ~ c l u d e at least the ~ o l ~ o w i ~ ~ :
o ~ t ~ ~ ~ : how does an ~ ~ e ~ t move .From place to place? How does it move?

3 Power System Restructuring and ~ e ~ e ~ I a t i o n
Au~hentication: how does the user ensure the agent is who it says it is, and that it is represent~ng who it claims to be represent in^? various networks without being infected by a v Secrecy: how does the user ensure that the agents maintain privacy? How does the user ensure someone else has not read the personal agent and executed it for their own gains? How does the user ensure that the agent is not killed? Security: how does the user protect against viruses? How does the user prevent an i~coming agent from entering an endless loop and c o n s ~ n g all the CPU cycles? Cash: how will the agent pay for services? How does the user ensure that it does not run up an outrageous bill on the user’s behalf?
rmance issues: what would be the effect of having hundreds, thou$ands or millions
Inte~operabi~i~/com~unicat ion~roker i~~g services: how does the user provide e~ng/d i rec to ry ”~e services for locating engines andor s p e c i ~ ~ services? How the user publish QT subscribe to services, or support broadcasti~g necessary for
The ~ ~ ~ i v ~ ~ ~ ~ ~ for developing in fo~at io~ internet agents is simply a n e e ~ d e ~ ~ d for tools to manage such information explosion. Everyone on the WWW would benefit from
matter how ~ u c h
does the user know it has navi
f such agents on a WAN?
some other coordina~~on approaches?
~~e~ agents are going to search the Intern~t, becaus ernet may be organised, it cannot keep pace with the
has (or prom~ses) its own stre~gths and de~cienc~es, the e strengths and minimise the de~ciencies of the most rele rpose. Frequently, one way of doing this is to ad
together some of the s~engths of both the de hybrid agents refer to those whose cons~~tut~on i
or more agent p ~ i Z o s o ~ ~ ~ ~ s within a singular agent. These philoso p h ~ ~ o s o ~ h y , an ~ter face agent philosophy~ collaborative agent
The key ~ y p ~ ~ ~ e s i s for having h y b ~ ~ agents or ~ c ~ ~ t e c ~ applica~~ons, the benefits accrued from having the combination of ~ h ~ l o s o ~ ~ ~ e s within a
roved right; the ideal benefits
hies, In such a case the reactive component, which would take precede~ce over the del~bera~ive one, brings about the following ~ e n e ~ t s ~ robustness, faster response times and adaptabil~ty, The deliberative part of the agent would
term goa~-oriented issues. For ~ x ~ p l e , there is agent by comb in in^ the interface agent and MO
mobi~e agents to harness fea other co~b~nations.
etero~eneou~ agent sy fer to an ~ n ~ e g r a ~ ~ ~ setup of at least two or more which belong to two or more different agent classes.

I n ~ o ~ a ~ i o n Technology Application 35
also contain one or more hybrid agents. ~enesereth and Ketchpel 1291 a~iculate c ~ e ~ ~ y the ~otivat~ori for heterogeneous agent systems. The essential argument is that the wosl abounds with a rich divessity of s o ~ ~ a r e ~ r o ~ u c t s providing a wide range of services for a s i ~ ~ l a r ~ y wide range of do~ains. hough these psograms work in ~sola~ion, there i s an increasing demand to have them i n te~ope~~ te ~ hopefully, in such a manner that they provide ‘added value’ as an ensemble than they do individually. A new domain called a ~ ~ ~ t - b a ~ e ~ software e n g i n e ~ ~ i ~ g has been invented in order to facilitate t%ie interoperation of misce~~aneous software agents. A key re~u~ement for interope~ation
nts is having an agent ~ o ~ m ~ i c a t i o n language (ACL) via which the ‘agents’ can comm~icate with each other. The potential ~ e ~ ~ ~ ~ s for
S~andalone applications can be made to provide ‘value added’ services by enhancin~ them in order to pa~icipate and intero The legacy software problem may b costly s o ~ a r e rewrites as agents ~ntesopesate with other systems. At the very least, heterogeneous agent tec~o logy may lessen the effect of routine s o h a r e maintenance, upgrade OS rewrites. Agent-based software engine~sing provides a radical new approach to so i~plementation and mainte~ance in gener~l, and software i ~ ~ s o ~ e ~ b i ~ ~ ~ in p a ~ c ~ l a s .
having heterogeneous agent technology are several:
in cooperative hetesogeneo~s s orated because it could obv
‘new leases of life’ by
~ e n e s e r ~ t h and Ketchpei [29] ~ o ~ p a r e d to object-oriented pro ~es§age-ba§ed interface to its int
may differ from object to object (this is the ~rinciple of po s o ~ a r e enginee~ng, agents use a common language with They h~ghligh~ three ~ m p o ~ n t questions raised by the new agen~-osi~nted s o ~ w a e en~~neenng ~ a r a d i g ~ . They inciude:
e that agent-based sofeware engi ing in that an agent, like an Q
a structures and algorithms. H ey distinction: in object-oriented p r ~ g r a ~ i
priate agent co~mun~cation language? apable of c o ~ u n i c a t ~ n g in this c o n ~ ~ c t e d 1
at commun~cation a s c h ~ t e ~ ~ r e s are conducive to cooperation.
are availabl~, there a e two ssible ~ c ~ ~ e c ~ r e s to choose ents handle their own coord ation or another in which g
can rely on special s y s ~ e ~ programs to achieve coordina~on. The d i s a ~ v ~ ~ a g e of the former is that the c~mmun~cation overhead does not necessa~ requireme~t for the re of a g ~ n ~ s . As a consequence, the
various services. They also establish the connect~on across the e ~ v ~ ~ o ~ e ~ t s and ensure c ~ ~ e c t ‘co~versatio~’ amongst agents~

3 Power System R e s ~ c ~ r i n ~ and
Agent Agent
I I
1-2 A federated system (adapted from 1293)
General Issues and the Future of Agerzts
from t e c ~ i c a ~ issues, as mentioned earlier, there is also a ~ r o b l ~ m s ~ which are looming. They include the following:
rivacy: how does the user ensure that a g ~ n ~ s ~ a ~ n ~ i n much n e e ~ e ~ acting on the user’s behalt? Legal issues: ~magine an agent offers some bad advice to other peer a~ents r e s ~ ~ ~ ~ n g in ~~a~ i l i t ies to other people; who is r~sponsible? Ethical issues: agents must limit their searches to appropriate servers, share info with o ~ e r s and respect the authority placed on them by server o~erators.
suppliers, electric generators and distributors will have to

adds to our experien~e and helps us make the next market imp~ementat~on work a little better and more competit~vely. It is believed that to some degree, ~rn~len~~ntat ion, ~ ~ g i o n a ~ commodity exchanges will play a key r e le~ t r i c i~ .
13 1,321. ~ o m p ~ i ~ e s presently having both generat~on and d ~ s ~ i b u t ~ o n facilities would be d i v ~ ~ e d into separa~e profit and loss c ~ ~ ~ e s . Power is generated by generation co~panies
This section assumes a ~ ~ e w o r k which has been described in
ia tra~smission companies i s sold to energy service com
city ~ e l i a b ~ l i ~ Council (N antile associations (EMS) will emer~e in ill promote liquidity and as an i n t e ~ e ~ i a t e
r e l i a ~ i l i ~ and s e c u ~ ~ this co~petitive electri
er to all mul~ilatera~ trades, they will provide assurance to traders, that they nee onry about trading because a defaulting contract partner.
This framework allows for cash (consists of spot and forward markets), fbtures and p l a ~ ~ ~ ~ m~rkets. See ~ igure 11.3, The spot market allows for trading power e other d~~at ion , e.g. 30 minutes) in the next 30 days. Forward contracts traders to buy or sell firm e l e ~ ~ c i ~ contracts as specified in the contract from 1 to 18 months. The fittures ~ a r k e ~ allows trade^ to purchase a non-^^ electric^ given ~ o n t h in the future (e.g. 1 to 18 months). Futures contracts pro electricity traders to manage their risk. The planning market is a 10 develop capi~al for building large items like new plants and trans
time horizon (in months)
1.3 Interconnection between the markets
s (for both ~ t u r e s and physicals) for electric energy are ex comm~n and will be an ~ m p o ~ ~ t means of mitigating risk, An ho~der the r i ~ h t to buy or sell w i ~ h o ~ t the o~ligation to buy or sell. holder must pay an u ~ - ~ o n t remium. The a ~ o u n t of the premium shou
potential holders. The worth of an option may vary references, makeup f po~o l i os (collection of assets
is, how does one etemine the value of d in many markets to value options. Its usage assumes many a1 commodity that may not be true about electricity.
362 Power System Restructuring and ~ ~ r e ~ ~ a ~ i o ~
The approach taken in this research is to allow CO sed agents to d~velop their own valuation f o ~ u ~ a e as they p ~ i c i p a ~ e in a s i ~ u l a ~ e ~ option markets.
er options valuation should achieve higher profit than do s. The computerised agents evolve in a genetic algo
valuations are replaced with new agents that are based 011 the succe§s~l ideas of the better agents.
As mentioned previously, it is quite likely that regional c o ~ m o d i ~ exchanges in which buyers and sellers pa~icipate in a double auction will soon exist. Such e x c h ~ g e s are utilised in other markets and are essentially an extension of the electricity market operating in California, A centralised exchange allows many and varied traders easily to trade a c o ~ o n c o ~ m o ~ ~ and derivatives based on that CO
In the cash (spot and forward) market, indepen~ent contract a ~ i n i s ~ a t o r (TCA), who
that the energy transactions resulting from the matched bids do not overload or ren e l ~ ~ ~ i c a ~ transmission system insecure. The ICA monitors and res~onds to the s y ~ ~ e ~ limits and transmission capacities.
The spot market is what we are most familiar with in the electrical and a buyer agree (either bilaterally or through an exchange) upon a ~ u ~ b e r of ~ e g a w a t ~ s to be delivered sometime in the near p.m. to 4.00 p.m. tomorrow).
not the obliga~ion, to is someone ‘writing’ the contract who, in return for a premium, is
. CENCOs and ESCOs cooperate with the IC
ture (e.g. 10 MW from 1.00
An aptions contract is a form of ins~rance that gives the option (sell) a contract at a given price. For e
ce. See Figure 11.4. Both the options and the d e s i ~ e d to minimise risk. A~ tho~gh provisions for ~ e ~ i v e ~ exist, they are not (e.g. the delivery point is not located where you want it to be located). The
trader ~lt~mately cancels hisher position in the futures market with either a sicals are then p~chased on the spot market to meet d e ~ ~ ~ n d wi een locked-in via the hhlres contract.
‘Long’ ~enotes ownersh~~; to go long figure, long indicates that the trader has pu (call) or the right to sell but) the hture. A trader who write

Information Technology Ap~~cation 3
figure shows how the ‘put’ works. The long trader pays a premium to lock-in a maxi^^^ price (exercise price) that he/§he will have prem~~im in return for promising to sell the
. The short trader
1
9 T e r m i n a l P r i c e Pr ice
Using put and call options
value of the option has been the subject of some a e ~ a t ~ . A c and SchQie§ put together their formula which has been other commodity markets. Marshal1 [33] states tha
and constant.
r e ~ ~ i r e ~ that:
The ~ ~ Q ~ - t e ~ interest rate is
The u n d ~ ~ ~ y i n g asset is e ~ ~ c i ~ n t ~ y priced. The option is of the European type.
The una~rlying asset pays no as.
~ ~ c ~ i Q n costs (for bwying and selling). of u ~ d e r l y ~ g asset value can be borrowed. restrictions on, or penalties for short selling. holes e ~ u a t ~ o n for valuin ut option is as follows [34]:
p = [x . ePip(-r. (T-PI). N(- d2)- s * N(- d l ) where:
2’ = strike price
r = risk free rate ~ ( ~ ~ ) = cumula~ive normal a i s ~ b u ~ i o n T = ~ x p i r a ~ o n date t = c u ~ e n t time
344 Power System Restructuring and
11.3.2 A g e n ~ - ~ a s e ~ ~ ~ r n p ~ ~ ~ ~ ~ ~ n a l
arket p a ~ i c i ~ ~ t s ( s u ~ ~ ~ ~ e r s comp~ex, c h a n g i ~ ~ with time modify their behaviour as time goes along, ~ o s ~ ~ i o ~ . A~~hough some res mar~et res~onses using control theory, it is g
t ~ 5 ~ ~ s with usin
is relatively smooth s are another search

~ n f o ~ t i o n Technology Applica~on
iscrete po~nts in the search ace and selects those gro solve the ~ r o b l e ~ .
The basic genetic a1 nithm, as desc r i~~d by GoIdberg [35] , can be Written as follows
a population and set the generation counter to zero. 2. Until done or out of time, do the following:
fitness of each m e m ~ e ~ of the popula~ion.
c re~en t the generation cou~ter and go to step 2.
. Genetic a l g o r i ~ to evolve a population of trading agents
~pt ions with Agents
A simple electricity market with four generators that provide is modelled. ~ e n e r a ~ o ~ s are d~spatched to meet demand and a from the aggregate ~ ~ g i n a ~ c curves of the dispatc~ed gene~tors
and $34) are offered with valuatio data. ~A-based agents then buy and sell the o ~ ~ ~ o n s at
prices of $15, $20, les and the ~ a r ~ e t
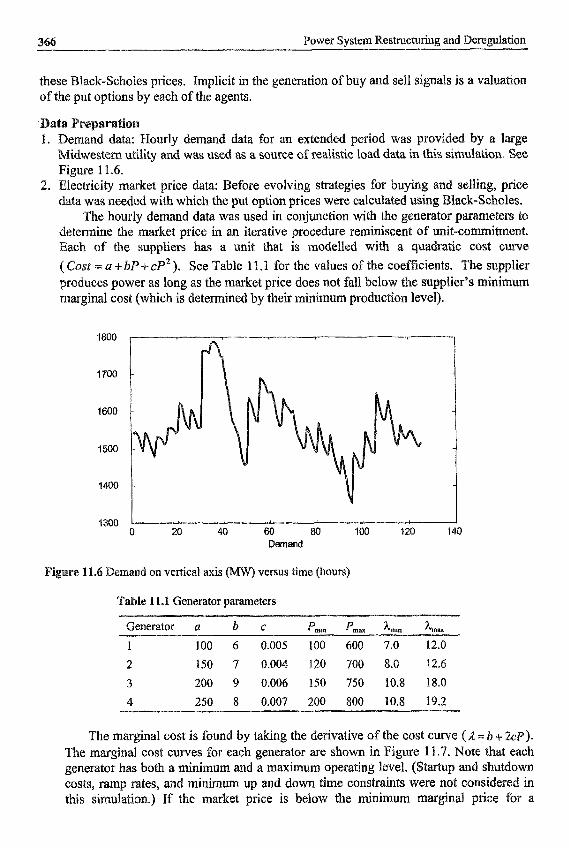
3 ~ 6 Power System ~ e 5 ~ ~ ~ n ~ and
lack-Scholes prices. Implicit in the ge~ieration of buy and sell signals is a valua~on of the put options by each of the agents.
Hourly demand data for an extended period was prov~ded by a large lity and was used as a source of realistic load data in this s i ~ u ~ a t ~ o n . See
arker price data: Before evolving strategies for ata was nee~ed with which the put option prices were calcul
hourly demand data was used in conjunction with the gen~rator p e the ~ ~ k e t price in an iterative procedure re~iini§cent of wit- the suppliers has a unit that is ~odel led with a q u a ~ ~ ~ t i
( Cost = a + bP + cP2 ). See Table 1 1.1 for the values of the CO
rod~ces power as long as the market price does not fall below cients. The supplier §upplier’s m ~ n i m ~
itial cost (which is determined by their minim^ product~on level).
1800
1700
1600
1500
1400
3350 0 20 40 60 Bo 100 120 140
Demand
ernand on vertical axis (MW) versus time (hours)
Generator parameters
Generator a b c pm pm, LU, hmex 1 100 6 0.005 100 600 7.0 12.0
2 150 7 0.004 120 700 8.0 12.6
3 200 9 0.006 150 750 10.8 18.0
250 8 0.007 200 800 10.8 19.2 4 jl___
The marginal cost is found by taking the derivative of the cost curve ( A = b + 2cp). The m a ~ ~ i n a $ cost curves for each generator are shown in ~ ~ g u r e 11 ‘7. Note that each genera to^ has both a minimum and a m ~ i m u ~ opera tin^ level. ( § t a ~ p and s h u ~ d o ~ costs, ramp rates, and minimum up and down time constraints were not G
this ~ i ~ ~ ~ a t i ~ n . ) If the market price is below the mini mu^ ~ ~ ~ i n a l
Information Technology Application 7
generator, that generator is removed from consideration and the market price recalculated. This process is repeated until demand is balanced by a set of genera~ors for whom it is p r o ~ ~ b ~ e to produce at the discovered price. If price d ~ 5 c o v ~ does not occur after 20 iterations, the market price from the 20th iteration is taken as the ~~~~t price. (Under this simple scheduling scheme, it is possible that a unit could be forced CO produce below its minimum marginal cost but a check showed that this never
A brief c~ari~cation at this point may be in order to prevent confusion in the use of the term ‘spot’. The market price is referred to here as the ~ ~ e p i ~ ~ with the terminology used in finance (i.e. options prices prices); this is not to imply that the hourly market here is the s market (i.e. the ‘spot’ e l e c ~ c i ~ market as the real-time ele price data for a typical week is shown in Figure 1 1.8.
3 . Standard deviation of spot price: The standard deviation (s used when calculating the B1 using a window of the last market price is shown in Fi
oles formula. For a given hour, sigma is ca~cula~ed period hours prices. The s~ndard dev~ation of the
ut options price data: There are four put options, which cm be bought and sold, aving strike prices of $15, $20, $25 and $30. The market valuation (price) of each of
these is calculated using the lack-Scholes formula for put options, as pres~nted earlier. Note that the risk-free rate is taken to be constant t~oughout the simulat~on and
that T-t is a constant 90 days. This was done to prevent having to ‘roll over’ the options position because the expiration date was reached.
~aluations for the put options are shown in Figure 1 1.10. ne can see that they go up and down with swings in the underlying spot price of electricity and that the put options with higher strike prices have higher market valuations, as would be expected.
PEP
Each agent in the population buys andor sells the four put options. These agents act according to i n t e ~ a l ~ y gene~ated buy and sell signals. These signals are ~enerated u s ~ g a GA to vary the coe~cients in a mQdified ~ ~ a c k - ~ c h o l e s calculation. ~p t ion§ could be traded only for peak periods on weekdays, i.e. Monday-Friday, 1 l.OOa.~.-4.0O~.m.
GA val~ation of options and buyhell signals: The GA is as a string of real number genes. The number of genes is determined by the c on being p e r f o ~ e d by the GA (described next). For these simulations each GA has eight genes, each of which is a real n ~ b e r ,
The equation currently used by the GA to generate a buy or sell signal is a modified ~~ac~-Scho les valuation. A signal to buy or sell an option will be generated if the GA valuation minus the market valuation is greater than some tbes dl and d2 in the lack-~choles formula are recalculated using a modifi a’ , where CT‘ = (Gene2). CT and where LT is the ‘standard’ calculation deviation of the spot price. A buy signal is genera~ed if [Gene 0 * X - exp( --r * (2‘ - t ) ) N(- d1)- (Gene 1). S N(- d2)] + (Gene 2 ) is greater than the Market Price. Similarly, if a new d l and d2 are calculate gene^).^ and the Market Price is rea ate^ [(Gene4)- x . e x ~ - r . ( T - t ) ) . N ( - d l ) - ( G e ~ e 5 ) . $ . N(-d2)f+(Gem7) then a sell is generated.

3 Power System Restructuring and ~ e r e ~ l a ~ o n
IQ
1.7 M a ~ ~ i ~ a l costs on vertical axes ( $ / ~ W ) vs.
__ 1
0 20 40 60 Bo 100 120 140 29
Spot price on vertical axis ($/MWh) versus time (hours)

~ n f o ~ a t i o n T e c ~ n o l o ~ Application
0. 20
Standard deviation of spot price on vertical axis versus time

37 Power System ~ e ~ ~ c ~ ~ ~ ~ and Deregulation
Valuation for Put 0 (strike=$l5) Valuation for Put 1 (strike=$aO) 6 10
$ $
4
5 2
0 0 0 28 40 60 80 100 0 20 40 60 80 100
V ~ l u a t i o ~ far Put 2 (strike=$25)
$ $
0 0 Hours
1.10 Market valuation for the put options ($ vs. hours)
rodu~tion: AAer fitness is calculated, the agen~s are sorted accord~ng to their ss. Reproduction is performed using single-point crossover of two parents selected
selection, One child is created and
Each child’s genes can be mutated in four different ways (bearing in mind that the
from the best half of the population using r ~ e ~ l a c e s an agent in the worst half of the popu
genes are real-valued):
1 , 2. . .
2% of the time the gene is re~~aced randomly. 5% of the time the gene is multiplied or d 10% of the time the gene is multiplied or 1% of the time the sign of the gene is ch
an do^ genes are generated according to the relation: NewGene = ~ e n e ~ i n + Random[O.. 11. (Gen
where GeneMin and GeneMm are the max and min values of that gene over the e~t i re ~opulation. (This was tried as a reasonable way of ge~erating new genes without disc~ding wh a coefficien~,
been replaced. (A variation on this theme is to replace the worst on with randomly generated agents, in an effort to introduce ne
has collectively learned about the ‘re~sonable’ ran because the space for real numbers is infinite.)
This process is repeated until every agent in the worst half of the popul~tion has
1 and prevent stagnation.)
Results: The GA was able to evolve a strategy that co~~istently made a profit buying ut options in this market. As shown in Fi

Infi3mation Technology Application
ent is positive and ~mpr~ves over the generations, ultimately reaching a value of per trade (with one trade allowed each hour).
Figure 1 I. 1 1 also shows the fitness of the worst agent and the average fitness for the whole population. One can See that at the start of the run most agents ac~a l ly lose money (make a negative profit) but by the end of the simulation the aver~ge fitness has risen to nearly zero. Figure 11.12 shows the best genes from 4 different runs.
2
1.5
1
0.5 0 20 40 60 80 100
Maximum Fitness
-15 .
-20 .
Minimum Fitness 3
5r----- ' 1
1 0 20 40 60 a0 100
Average Fitness
igure 11.11 Maximum, mini mu^ and average fitness over a typical run. The vertical axis m ~ a ~ r e s profit per generation; the horizontal axis counts generations.
na wer m
Solving the optimal power flow (0 associated with
m is ~ n d a ~ ~ n ~ ~ to the ~nbund l in~ of n open access and is of increasing
dereguiated environment of the electricity ension n o n - l i ~ ~ r optimisation
which is difficult to solve. The ~ o ~ p u t a ~ ~ o n a l difficulties in solving the OPF prob its use in power system ope~t~ons .

gene0 -2.7386 gene1 :-I 4.23 i gme2: 4 . ~ ~ 9 6
g~ne5: -6.441 1 gene& 2.6333 g e n ~ 7 ~ -6.97 17 Fitness = 1.7178
The best genes aner 100 generations from 4 ~ f f ~ r ~ n t runs
0~~~~ to ensure conv as a result, many local
app~ied to the IEEE 30-bus test system under different ~enera to~ resented.
11.4.1
The OPF problem seeks to optimise s t e ~ y - s ~ a t ~ power system p e r f o ~ ~ ~ e with re spec^ to an object~ve fwhile subject to numerous constraints. For optimal act dispatch, the objective ~nct ion, J is that of total g~neration cost.
ion of ~ansmission losses and voltage level optimi a§
subject to
minf(x, U) (1 1.1)
of control variables (these include generator active tap se~ ings)~ x is the vector of de~endent v a ~ a b l e ~ (1
) is the ob~~ct ive to be optimi are the ~ ~ i e q u a l i ~ c o n s ~ a ~ n ~ s on
generator reactive po
power ~ o n s ~ a i ~ t s ;
EP seeks the optimal solution by evolving a population of c a n ~ ~ ~ a t e s o ~ ~ ~ i o n s over a n ~ m ~ e r of gene~at~ons or i~era~ion f o ~ ~ e d from an existi~g po~ulation prod^^^^ a new solution by perturbing each component of an exis a~oun t . The degree of opt imal i~ of each of the c ~ d i d a t e so i~easured by t h e i ~ ~ t n ~ s s , which can be
ugh the use of a c o ~ p e t i t i o ~ scheme, the i~dividuals in each p h other. The winning i n d ~ v i ~ ~ a l s
the next generation. For opt im~sa~~o the more o p t ~ a ~ so~utions have a er chance of surviv
ive and the process is ~ e ~ i n a ~ e d by a stopp lation ~volves towards the global optimal point.
Rer a s ~ e c i ~ e d number o f iterations or no apprec~able change in the best so~ution for a certain n u ~ b e ~ of ge adopted in the present work. The main stages of the EP t ~ ~ ~ i ~ u ~ ~ n c l u ~ ~ n ~ ~ ~ i t i a ~ ~ ~ a t ~ o n , mutation and compe~~tion are shown in the ~ o w c h a ~ o f Figure. 11.13.

e s ~ c ~ ~ n g and D~re~lation
ased on the EP me~hodology, an a l g o r i t ~ for solving the PF ~roblem can be es~b l i s~ed . The basic f l o w c ~ ~ of the algo~thm is shown in ~ i ~ r ~ 11.13 with its components described below and in Sections 1 1.4.2 and 11.4.3.
s Q l ~ ~ o ~ : An individual in a pop~~ation re~resents a candidate ts o f that solution consist of the co~trollable and uncontrol
v ~ ~ a b ~ e ~ . S ~ e c ~ ~ c a ~ l ~ the c o ~ ~ o ~ ~ a b ~ e v a ~ a b ~ e s are ~ p e c i ~ e d power on at all g e ~ ~ r a t o r (PV) nodes other than the slack node, the specified voltage m at all PV nodes and tap positions for variable tap t r ~ s f o ~ e r s . Each candidate solution also stores depe~dent varia~les such as the most recent load flow solution for subsequent use in ~i t~a l is ing the load flow on the next iteratio~ to reduce c o ~ p u ~ t i o n time within the loadflow algorithm.
Zis~~iuon: Each o f the con~ollable va~ables of an i n ~ v ~ d ~ a ~ is i n i t ~ a ~ s e ~ r ~ n d o ~ ~ ~ . For example, for the using a uniform random number ~ ~ s ~ i b u ~ o n within its feasible
s p e c ~ ~ e ~ active power generation for a PV node i, with acti Pmw, we have
(1 1.2)
where U{Pm,, P,, 1 is a ~ i f o ~ ~ r ~ d o ~ numbe~ b e ~ e e n P,," and P,,. In additio~ to this, one cand~date soiution will have its specified active power generation for all PV nodes excluding the slack node set to the economic dispatc~ solu~ion for the system active power load as the aggregate active power load of all nodes plus 2% to appr ~ ~ s ~ ~ § s ~ o n losses. This economic dispatch solution is obtained using the
tioons: Each candidate s o ~ ~ t i o n is assigned a fitness to ~ e a s u r e its ect to the objective being optimised. In the case of active and reactive tness of individua~ i will be,
M f i =
J
K , ( v ~ - 1.0)~ if Vj > v,- or V, < V' otherwise
VP, =
otherwise
(11.3)

~ n ~ o ~ a ~ i o n Technology ~pplicat~oi~
I initialise Population I
Make a gradient step
Evaluate loadflow and assign fitness to altered candidates
~ ~ g u ~ ~ 11.13 Flowchart of EP-OPF
In tile above ~ ~ u a t ~ o n , is the ~ a x i ~ u m ossible cost of gener~ t io~ and C, is the
eneration cost of indiv~~ual i. The term V?, denotes a penalty term on PQ or swi
node j for v ~ o l a ~ ~ g preset voltage limits Y,~’”, Y’”. represents a penalty on
a reactive power limit. K, and Kq penalty weighting constants, It is
not necess~y to impose a enalty on slack node active power ~io~at ions as the at at ion stage helps to satisfy this constraint. The EP-OPF algorithm seeks the solution with the m a x i ~ u m fitness.
~ ~ u t ~ ~ ~ : A new population of OFF solutions is produced from the existing population through the mutation operator. A new indivi
calc~~~ated as from each ~ndividua~ p i , where thejth OPF variable in the new ind

where x:> denot~s the value of variable j in pIr. x,, is the value of variable j in the parent
~ ( O , ~ ~ , ) is a Gaussian random n u ~ ~ ~ b e r with a me^ of zero and a s
deviation of oJ, I The ex~ress io~ ~esigned for c,, i s
(1 I .5)
w ~ e r e Ji is the ~ ~ e s s of i ~ d i v ~ d u a ~ i; f,,, is the m ~ i m u m fitness wit hi^ the po~ulation; xY,x;ltn denote the er and lower limits of variable j ; a is a ~ o s i ~ ~ v ~
tly less than unity; and r is the iteration counter. The term a' ation of~set the rate of which depends on the value of a
(1 1.5) that a solution that has a much lower fitness than th value fora,,; hence it will be moved further by r n u ~ ~ i o n to a
loc
c o ~ § ~ a i ~ t s , all units other than the slack are assigned R loadi their dispatc~es i s then compared with the total generati
~~~~~~~: To help in the satisfaction of the slack node active
of that indiv~dua~. If the difference between them is with the slack unit, then the candi~ate is ~ c e p ~ e d . If not, the process five a~empts. If with~n these a~empts a feasible assignment is n cons~a in~d to force satisfaction by sharing the ~xcessive
r ~ ~ a i n ~ g generators as follows. ing the slack node active power in an i n d i v ~ d ~ l has e slack unit is unit 1, the total available capacity o f uni
N
i=2
- -
~xce$sive generation of the slack node is
2
(1 1.6)
(11.7)
i s the SUM of the active power demand an the tran~rnission loss the value of which is set to that found in the i ~ e d ~ a t e ~ y prev~ous load flow s~~u t ion of The loading of unit 2 is then modified according to
(11.8)
exceeds the maximum loading o f unit 2, it is cessive gener~tion of the slack node left to be sh

Information Technology Application 377
3
The above proceditre is repeated to modify the loadings of the units 3 to N. After all b: Ioadings of the units are ~ o d ~ ~ ~ d , the slack node active power will be on its
power limit is viola~~a. : In the corn~etition stage, a s e ~ e ~ ~ ~ o n on from the two I so~utions shoul~
~ ~ ~ h a n i s r n is use
selection* The selection t e ~ ~ n i q u ~ used is a ~ ~ ~ ~ n a r n ~ n t scheme their co~espondi
series of N, t o ~ ~ n ~ m ~ ~ p o n ~ ~ ~ § . Each j ~ d i v i d ~ a ~ i is a s s i ~ ~ e d a wore s, according to
j=1 ( I 3 * 10)
where J; is the fitness ofindi ual i. The opponent r, is c tes the ~reatest integer less th 1 [0,l]. The k highe
are t a ~ ~ ~ as the ~ ~ d i v i d ~ ~ ~ ~ in the next ~ e ~ ~ ~ r a t i o n .

Power System R ~ ~ ~ c ~ ~ n ~ and R e r ~ ~ u l a t i ~ n -
method o f switching which is applied within the load flow stage. When a PY node ha
result the algorith~ does not adjust the voltage ofa switched PVnode. node, it is no longer possible to control the voltage at that bus
11.4.5 ~ r ~ ~ i e n t Accelerat~o~
to the large dimens~onali~ of the OPF p r ~ ~ ~ e m , e v o ~ u ~ o n a ~ c ues such as EP can take an ~ a c c e p ~ l e number of iterations to c ~ n v e
e speed of convergence of the EP-BPF algorithm, acceleration t e c ~ ~ ~ ~ e s rovide an inte~ediate r e ~ m a ~ p i n ~ of candidates to a more optimal ~osition, led. To achieve this acceleration, a ~ r o p o ~ o n of the popu~ation is moved in
the dir~ct~on of the negative gradient. This is achi o ~ ~ h m of 1431. As the gradient step forms only choice of step size is not as critical as it is in a
to a constant sniall step size to enswe convergence. The sens~tivity o f the s o ~ u ~ o n to c h ~ g e s
solution is less sens~tive to changes in activ magnitudes and iransfo
ent variab~es varies than to ~ h ~ g e s in
ap settings. As a result of this, di has a large step size while r step sizes. These variable-
D is pr~viding a focused local op t~ i sa t~on , whil. ation. Reactive power penalty terms are not includ
SD fo~~u la t ion except for the slack node, which cannot be switch process. The effect of generator node sw~tchin d i s ~ r b ~ c e s in the solution rocess. These disturb metho~$ such as SD diverge or converge to local optima. However o p t ~ ~ i ~ a ~ i o n scheme ese ~ rob~ems are avoided.
o reflect any penalties in the fitness function ( not inc~uded within SD
will usual^^ incur gre
hrn p e r f o ~ s well on convex ~ r o b l e ~ s whe ver, If the solution surface is multi~modal th
in the load flow routine creates
will often discard solutions produced p~~aI t ies in (1 1.3).
become trapped in a local optimum. This i s the case wh odelled by non-convex curves such pie ents 139,461. These c u ~ e s present a pr
and discontinuities in fie gradient. As the step is bas this gradient, it is possible for the solution to cross the
discoRt i~u i~ where ent i ~ f o ~ a t i o n i s no longer v s beyond the local
such that if an active power loading of a unit crossed a disco that bounda~. These bound~ies, while
Iobal EIP ~ ~ e w o ~ ~ ~~~~h mutat

Information Technology Application
11.4.6 A ~ p l ~ c ~ t i o n Sfu
The EP-OPF a l g o ~ t ~ was applied to the IEEE 30-bus test system. Three sets of cost curves were used to illustrate the robustness of the technique. The fust case is where all curves are quadratic 1471; in cases (b) and (c) some of the cost
cewise quadratics or quadratics with sine components. Ther~fore in are many local optimal solutions for the dispatch p
thm cannot d e ~ ~ i n e the global o p t ~ m ~ solution^ e for va~~dating the developed algorithm.
lemented using the 6: ~ ~ g u ~ g e ~entiL~m Fro computer. The speci pro~ram was execu
a l g o ~ t h ~ and system data are s u ~ a ~ i s e d in the Append~x , In all cases, the standard IEEE 30-bus loading is used.
as^ In thi s ~ m a ~ s e d in Table 11.2. The program was run 100 times with the se A p ~ e n ~ i ~ . The average cost of solution obtained was $803.51 with the mi $802.62 and ~ a x ~ m u ~ $805.61. The average execution time was 51.4 s o ~ ~ t i o ~ details for the ~ in imum cost are provided in Table 11.2.
For this case, a solution of $802.40 was reported in [471. This was obtained using penalty functions for generator reactive power limits. The EP-OPF returned a solution with no PV nodes being switched. ~ o w e v ~ r , the solution from [47] violates the slack
are represented by quadratic functions from [
-limit s~ightly by approximately 1.7
le 11.2. Generator data and cost coeficients for base case (a)
Bus P,"'" r,mm ,"" K = - Cost Coe~icients No. MW MW MVAr MVA a b C
1 50 200 -20 250 0.00 2.00 0 . 0 0 ~ ~ ~
2 20 80 -20 100 0.00 11.75 0.01750
5 15 50 -I5 80 0.00 1.00 0.062~0
8 10 35 -15 60 0.00 3.25 0.00834
1 1 10 30 -10 50 0.00 3.00 0.02500
I3 12 40 -15 60 0.00 3.00 0.02500
Generation inpu?/output function c, = a, +b,e + C , e 2
6
In this s ~ ~ y , units cost curves were replaced by pie summarised in Table 1 R .3 to model different hels or valve-point
cise c o n ~ o ~ over units with d~scontinuities in cost curves, the ~ n ~ t with st capacity was selected to be the s bus. The average cost of solution
$649.67 with the m~n~rnum being d ~ a x i ~ u ~ $652.67. The ~ v e ~ a g ~ ~ x e c u ~ i o ~ for the m ~ n i ~ u m cost are ~ r o v ~ d e ~ in Table
blem, it failed to con was a ~ p r o x i ~ a t e ~ y

3 Power System R ~ s ~ c ~ ~ n g and ~ere~ulaEion
d ~ ~ o n s ~ a t e ~ that the D has d~~ficulties with n ~ n - c o n v ~ ~ s o l u t i ~ ~ surfaces. It is global o ~ t i ~ u ~ if the ~ o d i ~ c a ~ i ~ n s d e s c ~ b e ~
ever, the global op t i~um will ing intervals for units 1
entire solution space unlike The voltage profile at the solution is shown in
I -
- -
5 10 15 20 25 30 Node
Voltage Profile Solution in Case (b)
Generator cost coefficients in case (b)
Bus From To Cost Coefficients
No. MW R4w a b c
50 140 55.0 0.70 0.0050
140 200 82.5 1.05 0.0075
20 55 40.0 0.30 0.0100
80 80.0 0.60 0.0200 55
1
2
~~nerat ion input/output function C, = U, c b,e -I- c,?*
curves of the generators ~ ~ ~ n e c ~ e onent s u p ~ ~ ~ p o s e d loading effects [39,
are pro~ided in Table 11.5, To i l l ~ s ~ r a ~ ~ stics of the po~ulation over the 100 it can be seen that the El?-0

.15 Coizvergence ofthe EP-OPF algorithm in case (c)
thm i s applied to this case its abiIity dependent on the s
of nQ~-co~vex eost c ~ ~ e s , the a b i ~ i ~ of the sol~tiQn is great~y reduced. The ~ ~ a l l e l search mechan~sms of method for a dirccted local search, ~ ~ o w e v ~ ~ , perform well in these cases.
Generator cost coefficients in case (c)
ax Cost cQefficien~$
b C d e US No,
MW MW a
1 50 200 150.00 2.00 0.0016 50.00 ~.0630
2 20 80 25.00 2.50 0.0100 40.00 0.0980
Gen~ra~ion i n p u ~ o u ~ u t cost function C, = a, + b,c + C,
set to an almost pure^^ cost-ba~ed le, may have a less des~rable vol the objective ~ n c t i o n of
~ ~ ~ t i o n s ~ it is ~ o s ~ ~ b l e to de a flatter voltage profile.
Ideally all load nodes will have a voltage m a g n ~ ~ d e of I per unit. To ~ c ~ ~ ~ v e this the ~ ~ e s s ~ n c t i o n (I 1.3) was ~ o d ~ ~ e d to

Power System Restructuring and Dere
h4 f i E
(1 1.1 1)
/ k
KJ(vk -1.0)~ if V, $1.0, k a P
o t h e ~ i s e VFk =
The ~~r~ VF, denotes a penalty term on a load node k and K,is a constant penalty
v ~ o ~ ~ t ~ ~ n w ~ r e also 1 a ~ ~ ~ p t to m i n ~ ~ i s e
he ~ ~ ~ ~ ~ ~ i e s w i ~ ~ n the SD fo~u la t ion to the form of VFk above. With this penalty the
the cost o~generation while trying to ~ a i ~ t a ~ the load fl
The voltage profile achieved is shown in Pi To ~ e m ~ n s ~ t e the effect of this change, case (b)
ge level to load nodes 51.54, which is close to th
able 11.5. Of the 10 a b e ~ e r profile than that found in (b
~ i f ~ c u l ~ in ~ r o v ~ d i n ~ adequa~~ solutions.

ble 111.5 ~i~~~ solution found by EP-OPF ia case (c)
Case (a) Case (b) Case (c) Case (d)
P, 173.848
p2 9.998
Ps 21.386
P8 22.630
PI , 12.928
PI, 12.000
Vi 1.050
V2 1.034
V5 1.005
V8 1.016
V,, 1.069
V13 1.055
t , , 1.020
I,, 0.900
t55 0.950
t3h 0.940
140.000
55.000
24.165
35.000
18.773
17.53 I
1.019
1.048
1.038
1.055
1 .OS5
0.980
1.010
0.930
0.930
0.970
199.600
20.000
22.204
24.122
14.420
13.001
1.050
1.061
1.043
1.036
1.100
1.038
I .030
1 .MO
1.010
0.980
140.000
55.000
24.458
33.849
14.518
23.322
1.045
0.952
1.004
1.027
1.044
0.990
1.030
0.940
0.910
0.940
een widely used in the power in relaying s c ~ ~ r n e s ~ load forecasti

Power System Restructuring and ~ e r e ~ ~ a ~ i ~ ~
~rocess~ng power of the V Q ~ Neumann digital computer with the abili d e ~ ~ s ~ o n s and to y ord ina~ ex~erience. ANNs have widely b
For ener~y rnanage~ent, load flow and ~ However, most existing ANNs for electri
ions such as load
ill be shown in this
11 be s h o ~ that this new ‘ c ~ m ~ I e x ’
to e§t i~ate isba bar voltages in a load flow problem.
Figure 11,17 shows a nodes, rn number of hi
cal A” for real nodes and I nurn
e are n n~mber o tota~ling three lay All the x and the w in
rs within an i n ~ e ~ a l [O, I]. that w belong^. A set of
uts, dk, for b l , ..., 2, ~ o ~ ~ s p o n d i ~ ~ to a set of i n ~ ~ t s , xj, j=19 ..., a, is used as ia
is ~ e ~ o ~ k is freely extensib
erscript of each w
ard sigmoid function is e loyed and the ~ollowing e~uat~ons hol
1st 1st hidden node OULPUL node
7 A typical ANN for real numbers

=1, ... ) 1 1 -
k - ni
i = l
i = l , ..., rn 1 - i n
J = I
y f ~ n c t i ~ n ~ E, is being ~ i n i ~ i s e d
2
(1 1.12)
to obtain an o ~ t i ~ a l set of values o f w usin the ~ h ~ l l - c l i ~ b i n ~ ' a ~ ~ o ~ ~ t ~ so that at , the ~ o l ~ ~ w ~ n g holds:
ere 2 = step size = 1.
2
basic e i e ~ ~ n t s of the newly d e s ~ g ~ ~ d ic ~ n c t i ~ ~ ~ say z = w x, where x is

3 e s t ~ c ~ ~ n g and ~ e r e ~ l a t i o n
~ o ~ p l ~ x n ~ ~ b e r s ~ xi and x2, the opera~i~n is clearly show^ in the ~ o w ~ r 11.18.
where j =
Z
(1 1.15)
ask e l ~ ~ ~ of the newly designed 'complex'

Information Technology Appli~a~on
(11.116)
The new ANN for the complex number format
As this sigmoid function is highly non-linear and complicated, V E needs to numerically. The method is to perturb each w by a very small amount w values of w are kept constant. A new value E is then evaluated. The ratio of of the new E from the old E, due to the ~ e ~ b a t i o n , gives the colrespondi VE. E itself now becomes a complex number and the gradient hnctio
1/2, as defined by the following equation:
(11.17)

In order to test the p e r f o ~ ~ c e of the newly deve~Qped ‘co~plex’ co~ventiona~ ‘real’ equa t~o~ (1 1.18) is
versus the in handling complex numbers, a simple ~ n c t i o n shown in
les ape ~vailable and ~~0~
uring the training process, we ~o~t inuous~y keep track of the total s ~ u ~ e d t from the nine training sets.
A data set with nine ~~~~g ex
1 0 = x+- x
(11.18)
For the i ~ p ~ e m e n ~ a ~ o ~ on the conventional ‘real’ hidden nodes and ~ W Q output nodes. For the imp there are one input ~omplex node, three h~dden comp~~x nodes and one node. All values of w for both the mnve before ~aining, i.e. a fair initial guess, and h i s ~ o ~ of s ~ u ~ e d error of the nine training shQwn in ~ ~ g u r e 11 -20. It can be seen th ANN to arrive at a total squared error o f ~ c h ~ e v e a total square error of 3 . 8 ~ 1 0 - ~ after 23 000 i t ~ ~ ~ i o n s . After the two
there are ~ W O ~nput on on the new ‘comp
are set to one ~nitially itrarily set to 1.5. The
two ANNs d ~ n g ~ ~ ~ n ~ n ~ is ite~ations for the ‘ c~m~ lex ’
ile the ‘real’ ANN can only
) a value of x = 0 . 2 5 ~ ~ . 2 5 is should be 2.25-jJ.75. The ‘real
two networks while the c gwes an output of 1.85-jl.4, i.e.
error, while the ‘complex’ A” gives an output of 2.3-jl.75, i.e. 1.8 % error. From this illus~ative e x ~ p ~ e , it can be conclud~d that it is better to systems involving complex numbers instead of using a ‘real’
te 11.6 Sample values ofthe complex test function
0 x 5.1 - j4.9
2.1 - j3.8
1.1 -j2.7
4.2 ~ j1.9
2.7 - j2.3
I .74 - j Z
3.3 j0.9
2.61 - j1.34
1.97 -.j1.37
0.1 -+ j0.l
0.1 + j0.2
0.1 + j0.3
0.2 + j O . l
0.2 + j0.2
0.2 + j0.3
0.3 + j0.l
0.3 + j0.2
0.3 C j0.3

I n f o ~ a t ~ o n ~ ~ c ~ n o i o ~ App~icat~on 3
0 0
Error history of two ANNs under training
In order to make a fair comparison, the computer sim~lation has been carried out again by us in^ thee d~fferent network con~gurations. The same functi as shown in equation (1 1.18) and Table 11.6 have been used consists of two separa~e real NNs, each consisting of one real input node, node and one real o u ~ u t node, thus t e ~ e ~ ‘Two S e p a ~ ~ e W s ’ . The sec0
ut nodes, two real hidden nodes and two real The third c o n ~ g u ~ a t i o ~ consists of one complex hidden node and one ~omplex
bjective of this simulation is for detailed reduced by 10 times CO e
e came there is no cross-
Figure 1 1.21. It can be seen b e h a v i ~ ~ r of two separate NNs i n ~ Q ~ a t i o n b~tween the two real error a l~ough it takes more iter
ery poor, as expected
ce, it can be seen fmm both Fi
. However, the time duration of an that of the conventional real
, both NNs have more or less the same ction of this section, complex are
widely used in electric power systems and, thus, the ‘complex9 design shod ted

Power System R ~ s ~ c ~ ~ n ~ and ~ e r ~ ~ l a t i o n P
3 9 ~
whenever ANNs are applied to electric power systems. One typical example of a ~ p ~ y ~ g the 'complex' ANN to load flow analysis is shown in the following section.
0 35 ................................................................................................................................
7 \ .................... ...........................................................................................................
.....................................................................................................
..................................
~ i g ~ ~ ~ 11.21 Error history of three N s for comparison
11.5.4 App~ication of 'C'omplex" ANN to Load Flow Analysis
with one or more hidden layers is s u ~ i ~ i e n t in order to approximate any conti n-linear ~ n c ~ i o n arbi~arily well on a compact interval, provided sufficient hidden neurons are available [53]. The power load flow problem is by itself a non-linear problem and, hence, it can be ~ a I y s e d with the h of an ANN, A six-bus network, as shown in Figure 11.22, has been used to test performance of the newly developed 'complex' ANN. generat~r buses while bus- 1 is the swing bus.
us-1, bus-2 and bus-3 are
Bus-4, bus-5 and bus-6 are ordinary load buses where the P (active are to be specified. The training example is generated
using ~ e ~ o n - R a p h s o n algorithms. This is just an illus ng real application, the 'complex' ANN will continuou
time state of the network in terms of voltage, P and pa~~meters are shown in Tables 1 1.7(a) and 1 1.7(b) below:
. The details of the network

~ n f o ~ a t i o n Technology Applica~~on 391
bu
~ i g ~ ~ ~ 11.22 The six-bus network for load flow computation
.7(a) Busbar power for load flow study
Bus PI,, Qio, pgen Vsp,
bus-1 0 0 _-- 1.05
bus-2 0 0 0.5 1.05
bus-3 0 0 0.6 1.07 _-- ".._ bus-4 P4 Q4
bus-5 Ps Q5
bus-6 P6 Q6
-*- -__ --_ _--
Network parameters for load flow study
From To
bus- 1
bus- 1
bus- 1
bus-2
bus-2
bus-2
bus-%
bus-2
bus-4
bus-5
bus3
bus4
bus-5
b~s-6
R (P.U.) [email protected].) B (P.U.)
0.1 0.2 0.02
0.05 0.2 0.02 0.08 0.3 0.03
0.05 0.25 0.03
0.05 0.1 0.0 1
0.1 0.3 0.02
0.07 0.2 0.025
bus3 bus-5 0.12 0.26 0.025

Power §ys~em R e ~ ~ ~ ~ i n
b~s-3 bus-6 0.02 0.1 0.01
bus-4 bus-5 0.2 0.4 0.04
bus-5 bus4 0.1 0.3 0.03
14 training examples, shown in Table 11.8, have been generated by the sofhvare for l e ~ i n g by the two ANNs. In this case, the voltage at bus- e three gener~tors maintain constant voltages at the c o ~ e s ~ o n d i
3.8 Training examples for the neural networks
0.7ij0.7
0.9+j0.9
0.9+j0.7
0.7+j0.9
0.7t-j0.7
0.790.7
0.790.7
0.7Cj0.7
0.9-kj0.7
0.7+j0.9
0.9+j0.9
0.9+j0.9
0.9+j0.9
0.9+i0.9
0.7J-jO.7
0.9+j0.9
0.7-tj0.7
0.7+j0.7
0.9-tj0.7 0.7+j0.9
0.71-j0.7
0.71-j0.7
0.9+j0.9
0,9+j0,9
0.9Cj0.7
0.7+j0.9
0.9+j0.9
0.7+j0.7
0.9+j0.9
0.7+jO. 7
0.71-j0.7
0,7+j0.7 0.7+j0.7
0.9+j0.7
0.7-i-jO. 9
0.9+j0.9
0.9-tj0.9
0.9+j0.9
0.9+j0.9
0,9+j0.7
0.97$-j0.089
0.864-jO.137
0.969-jO.101
0.960-jO.088
Q.962-jO.l 15
~.944-j0.084
0.964-jO. 108
0.95 190.086
0.883-jQ.137
0.872-jO.125
0.903-jO.142
0.882-jO. 108
0.894-j0.~40
0.9+j0.9 0.7+j0.9 0.880-jO.116
here fore, inputs to each ‘real9 and three inputs to the ‘complex* two o u ~ u t nodes for the ‘real’ ANN and one the subscnp~ refers to the number o n e ~ o r ~ remain ~ n c h ~ ~ e d during the trial test.
B
load flow network is learned by the ‘real9 and ‘CO
~ o m b ~ n ~ t ~ o n s of P4, P,, P6, Q4
S
[O, I ] and it is not suitable for this applica~ion, the sigmoid ~ ~ ~ ~ t i o n was slight~y m o d ~ ~ e d to the fo~ lowin~ form:
and V5. The ‘real’ . The initial v a ~ ~ e s of all wei
fan ordinary sigmoid function for ‘real’
4

I n f o ~ ~ ~ i o n Technoiogy Application 3 9 ~
The limit of iterations for both ANNs is set to 230000 as in the case of Section 11.5.3. Figure 1 1.23 shows the variation of the total squared error of the two ANNs with r ~ ~ e c t to the number of iteration.
0.08
0.07
b
U
(B
2 0.05 ~
0.04 -
0.03 - C~nventional NN
0.02 - Gomplex PlN
0.01
0 1 21 41 61 81 101 121 141 161 181 201 221
2 3 Training errors of two AMds for power load Row
After the two ANNs have been trained, they are used to estimate V, under differen~ test i~g samples of PI and Q,, i = 4,5 and 6. There are two categories of testing samples, first set (Cases 1 to 7) being those P and Q randomly selected in between the limits of P and Q i nc~~ded in Table I 1.8. Another set (Cases 8 to 12) is randomly selected outside the limits to test the ability of ge~e~alisation of the two ANNs. The P, and QI under test are shown in Table 11.9 while the results are shown in Table 11.10.
TaMs 11.9 Test cases €or the neural networks
Case P4+jQ4 Ps+jQ5 P6+ jQ6
I 0.77i-j0.82 0.75+j0.79 0.84+j0.73
2 0.72+j0.76 0.88+jO.S1 0.77-tj0.80
3 0.83-tj0.87 0.72+j0.79 0.82+j0.89
4 0.75+j0.77 0.82-tj0.89 0.80+j0.76
5 0.841-jO.81 0.71+j0.77 0.79tj0.82
G 0.88+j0.81 0.83+j0.87 0.751-j0.82
7 0.80+j0.80 0.80ij0.80 0.80+j0.80 I

394 Power System Restructuring and Deregulation
8 0.61-1-j0.69 0.92+j0.95 0.781-jO.67
9 0.58-tj0.69 0.76+j0.94 0.97-tj0.8~
10 0.791-jO.87 0.61+j0.57 0.94+j0.68
I 1 0.60-tj0.60 0.6O+jQ.60 0.60ij0.60
12 l.OO+jl.OO l.OO+jl.OO l.OO+jl,OO
Comparison of the neural networks
Case V, /Correct V, Meal NN Ys /Complex NN
1 0.935-jO.109 0.920-jO.1 I I 0.932-jO.108 2 0.924-jO. 1 15 0.92 1-jO.108 0.922-jO. 1 16 3 0.912-jO.103 0.923-jO.115 0.919-jQ.102 4 0.91790.1 10 0.922-jO.109 0,919-jO.114 5 0.932-jO.101 0.923-jO.2 14 0.931-jO.101
6 0.907-jO.113 0.923-jO.118 0,910-jO.113 7 0.924-jO.112 0.92290.1 13 0.921-jO.112
8 0.923-jO.113 0.919-jO.101 ~.922~0.114
9 0.897-jO. 105 0.920-jO. 105 0.920-j0,120 10 0.974-jO.108 0.923-jO.112 0.970-jO.106 1 1 0.993-jO.064 0.914-jO.077 0.960-j0,062 12 0.785-jO.169 0.928-j0.141 0.889-jO.160
o Figure 11.23, although there are on that, initially, the total squared error of the ‘real’ ~eve~oped ~comp~ex9 ANN. Actually, after 500
WN has akeady attained a steady-state va the ‘complex’ ANN catches up with the ‘real’ improving. A ~ e r 23000 iterations, the error is
t r a ~ ~ n g examples, it can be seen is smaller than that of the newly s, the total squared error of the d 0.032. AAer 4300 iterations,
and the total s q u ~ e d e ctually, if we c o m p ~ e
e 11.20, one very interesting result can be noted, It seems that the ‘real’ get itself into a min i~um after a small number of can continuous~y improve itself during the le
time for training is about 90 s and 150 s for the real and comp PI1 300 PG is used under ~ i ~ d o w s 98, A l t h o u ~ the ~ c ~ a c y is $imi~ar. It is suspected that it is quite easy for
similar resu~ts. This is one merit of the newly developed ‘complex’ A m . Next, Tables 11.9 and 11.10 are referred to where we want to test the power of pred~ction of the two ANNs. The first seven testing samples have been randomly selected in be^^^ the limits of t0.7, 0.91 of both the P and Q. The ‘complex’ ANN behaves better in all cases. ~ o w ~ v e r , when five alternative testing samples, selected outside the limits, are tried, the
ex9 ANN behaves better except in case 9. Et appears that, in general, the ‘CO s more p r e f e ~ ~ l e for the present application.
er random initial guesses of weights have been trie

I n f o ~ a t i o ~ Technology Application 95
.4
Since the 1980s’ formation process in^ has exploded. Process every two years. Today, the Intel Pentium I11 runs at a clock spee Et is expected that by 2002, the chip could run at a clock speed of 3 t the technology could create, sto search and process vast amounts o ’have yet to advance the techno y further to access and interface easily. Tra~it~onal~y, interactio ith a comp~ter has involved mouse or joyst ic~~ackba evicc to input information and the us (VDU) to receive output m the system. With the development of virtual re syst~ms7 new intera~~ion ods have been developed that allow the user to computer- generate^, or virtual, environments (VEs). VR can be considered an ex t~s ion of ideas which have been around for some considerable time, such as flight s ~ ~ u l a t i o ~ and wide screen ~ inema~ Using such systems, the viewer i s presen~ed with a ~ c r e ~ ~ ~ which
power has doubled
on of the visual field giving a powerful s ite of technologies which permit human
resen~tions of i n fo~at ion held in c , a u d i t o ~ and tactile stimuli, eac cant extension to the way the users kte
shared unders~nding, lead to simulate inacc
allowing the user to extract the lessons to be learned without the inherent risk, This alltsws the user to i ~ ~ t ~ r a c t in rea~-~~me with a computer-generated e~vi~onment in a s i ~ p l ~ , ‘natural’ m ~ n e r 7 w ~ t ~ o u t the need for extensive mining. Pres
av~i~able budget and requires high levels of nts in low-cost desktop
e technology more of smaller ~ompanies. The strength of VEs i s in ion of the n a t u ~ ~ int~ractive skills of the human. As
esktop’ VEs systems, inte~rating novel display widely used. The po~ential
and a great deal of research is currently develop these technologies into effective useable eaply on a conventional desktop
large-screen display for mult~~user pa~icipation. A l ~ o ~ g h not always re~evant to use, i ~ e r s i v e represen~a~~ons can involve the use of head-mou~ted displays tactile gloves, and other devices to enhance the effect. Ap~lications range from simulations
cal items ~ ~ a n g ~ n g from buil~ings to mole~ular s ~ c ~ r e s ) to more abs~act such as the disp~ay of large amounts of t ~ ~ e - v ~ ~ n g data (e.g. analysis of world
lex databases) or i l lus~a~ing intan~ib~e concepts [54].
11.6.1’ Types of
Al~~ough it is dif~cult to catego~se all V systems, most con~guratio gory can be ranked by the sense sion or presence can be regard
3 Power stem ~ e ~ ~ c ~ i n ~ and Dere
the user is focused on the tas in hand. ~ ~ e ~ i o ~ presen~e i s to be the pr~duct of several param ity, s ter~scop~c vi field of regard and the of the display. For
VE will incr~ase the
in i s ~ ~ ~ ~ o n and the level of imersi factors ~ v o i v e ~ .

terns are not re
T systems (adapted from [SS])
Main ~ e ~ t u r e s
Scale LOW ~ e ~ i ~ i - H i g h High
Sense of ~ i ~ ~ t ~ o ~ ~ ~ Low ~ e ~ i ~ m High a w ~ c n ~ s s
Field of regard Low La Low
Medium High
Low
Sense of immersion ~ o n ~ L ~ w Mediu~-High
Vision i s the m a i ~ sense th d e ~ i ~ e r s have co~cen~ate ed such as 3-D graphics, vwi
shade, etc. V ~ s ~ ~ ~ i s very co~p lex and concen~ates on ~ n t e ~ r e t a t i o ~ of i n f Q ~ a t i ~ n t ~ a t is
ective (i.e. what is seen varies from per so^ to tter at sim~ating vision than non-imme~ive ' forcing concentration on the virtual I on-po~able. There are also three related
betow.
II.~.6 Cave
Gave is a small room where a computer"generated world is ro~ect~on is made on 0th the front and side walls. This soluti
collective VK experience because it allows different people to share the same ex~er i~nce at the same time. It seems that this t~c~o log ica l solution i s p ~ i c u I ~ l y appropriate for cockpit simu~a~ions as it allows views from differ~nt sides of an i ~ a ~ i n ~ vehicle.
~~lepre§ence systems immerse a viewer in a real world that is ~ a p ~ ~ ~ d by video cameras at a d ~ ~ ~ a n ~ location and allow for the remote m~ i~u la t i on o
~ ~ a ~ o r § . Telepresence is used for remote exp1orai;ionlmanipulation of hazardous e n ~ ~ r o ~ e n ~ s such as space and u n d e ~ ~ ~ ~ ~ e r .
logies of ' ~ u g ~ e n t e d reality' allow for the view of real environ~e~ts with s ~ p e ~ ~ ~ o s e d virtaaI objects. As a matter of fact the 's view of the world is sup~lemented with virtual objects and items whose mean in^ is aimed at e ~ c h i n ~ the
ation content of the real e n v ~ o ~ e n t .
has been used by the military and by space scienti p h ~ a c o l o ~ i s ~ s , ~ o l e c u 1 ~ biologists and theoretica~ ~hysicists into its domain. Simply speaking, the t e c ~ o l o ~ p r o v i ~ e ~ hei
ical attributes of scientific models. It is a too2 on of data to a new dimension, to the point at which the user, i teracts with, or is e n ~ l f ~ by the model that has been c r ~ ~ t e d .
to accelerate scientific ~nders~anding by enablj~g the
VR to v~sual~se and ~ r o t o ~ e imaginative p ~ o j e c ~ can s h o ~ ~ n the Iif~cyc~e of make them available much earlier than would otherwise be the case.
n ~ e ~ ~ t i v e media, where a wide variety of ~ x p e r i ~ c e s can be create exp~ore at their Q W ~ pace, choosing their own ~ a t h w a y ~ ~
As the technologies of VR evolve, the a ~ p l i c a ~ ~ n s of i s assumed that VR will reshape the interface b e ~ e e n p by ~ ~ f e ~ n g new ways for the c o ~ u n ~ c a t i o n of informat

Information Technology Application 399
and the creative expression of ideas. Note that a VE can represent any 3-D world that is either real or abstract. This ~ncludes real systems like buildings, landscapes, spacecra s c u ~ p ~ r e s ~ crime scene recons~ctions, solar systems, and so on. Of special jnteres~ are the visual and sensual representation of abstract systems like magnetic fields, turbulent flow s t r ~ ~ t ~ e s , molecular models, mathematical systems, auditorium acoustics, stock behaviour, population densities, and any other artistic and creative work of abstract nature. These virtual worlds can be animated, interactive, shared, and can expose behaviour and ~nctiQnality.
"hough still relatively new, VR has already been put to use in a number of different, iniiovative ways. In the world of industrial design, engineers are using CO
simula~ions of prQto~pes to speed up the time required to take a new product from the drawing board to the productioii line. In the world of science and medicine, doctors are
computer-simulated pathologies to determine the outcome of ~o~ential ly risky cedures before these procedures are actually p e ~ o ~ e d on il e ~ ~ i n e e ~ n g , architects and interior designers are using VR s
realistic, computer-genera~ed simulatjons of proposed environmen~. The can then be ~ o d i ~ e d in real-time based on client input, zoning ordinances, ~esthe~ic concerns and budgetary considerations.
In the world of weather fore casting^ VR is being used to predict weather p a ~ e ~ s and to create h ~ r i ~ a n e m o ~ ~ ~ s wh~ch can accu~ately d and when. In the world of higher education, galaxies and physiol students tour the innermost workings of the human body. A VR sim~lation of a CO pip~work la~out, for example, could allow access, main~nance and safety aspects to be examined at the design stage, more effectively than by mode~~ing. It imi~ediateIy permits the evaluati~n of routing and accessibi l i~~ thereby avoiding expensive, t~~e-consuming correction during or even after c o n s ~ c t i o n ~ Ther~ are many
romising de~~elopment areas. There is a constant improvement in marketing per of both quality of appl~cat~ve VR systems and receptiveness of potential customers, T h i s is due to
decrease of the cost of VR systems and devices, (2) the rmance re l i ab~ l i~ of the t e c h ~ o l o ~ , (3) the extKeme~y ed from VR use in its various forms and purposes such as
gh the tec~o logy i s mature enough to have d~fferent appl i~atio~s, there resolved for its use for practical app~ications.
The sensational press cov associated with some of these t e c ~ o l o ~ e s has led many ~oten~ ia l users to overe e the actual capabi~~ties of existing systems. Many of them must a~tually develop the t e c ~ o l o ~ significantly for their specific tasks. Unless their expertise includes ~ ~ o w l e ~ g e of the human-machine interface requi application^ their res~lting product will rarely get beyond a 'conceptual ~ractical applications. Current VR products employ proprietary hardw There is little doubt that incompatibility between different systems is restricting market growth at present. It is probable that as the market matures, certain s t ~ d a ~ d s will emerge.
The premise of VE seems to be to enhance the interaction between people and their systems. It thus becomes very important to understand how people perceive and inte events in their environments, both in and out of virtual represen~tion of reality,
where a storm will make 1 s astronomy students tour
portunities that have yet to be explored. In the ~ n ~ o ~ a t i o n age, VR has been identified as one of the

~ u n d ~ ~ ~ n t a l questions remain about how people interact wi the SYs~ems, b v hey may ce and aug~en t cognitive p ~ r f o ~ a n c e in such e n v ~ o n ~ p l o y ~ for ins~c t ion , ~ i n i n g and other ~ ~ o p l e - o ~ e

The t ~ e ~ a ~ system consists of an infrared camera, shown in Figure 1 1.24, a shown in Figure 1 1.25. The ~nfrared detectors inside the camera are cooled argon to and they sense d s p ~ c ~ m in the range betwee
while floppy disks and h ig~-s~eed proce~sing on a PC,
QISS are o ~ f e r ~ d to
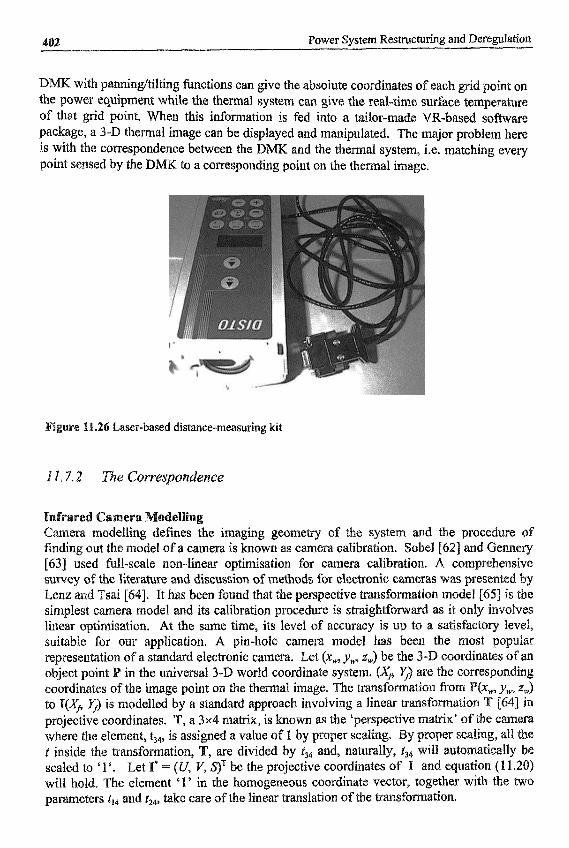
402 Power System RestruchJring and Deregulation
DMK with pannin~tilting hnctions can give the absolute c o o r d ~ ~ t e s of each grid point on the power e ~ u i p ~ e n ~ while the thermal system can give the rea~-time s u ~ a c e t e ~ p e r a ~ r e of that grid point. When this information is fed into a tailor-made ~ - b a s ~ d software
e, a 3-D thermal image can be displayed and manipulated. The major prob~em here is with the co~espQndence between the DMK and the thermal system, i.e. matching eve^ point sensed by the DMK lo a co~espondi~g point on the thermal image.
2 6 Laser-based ~ s t a n c e - m e a s ~ ~ ~ kit
of the system and the procedure of calibration. Sobel [62] and G e ~ e ~
ar o p t ~ s a t i o n for c a ~ e r a calibratio~. A comp~hens survey of the ~ ~ t e r a ~ r e and discussion of r n ~ ~ ~ o d s for e ~ e ~ r o n i c c ~ ~ ~ a § was p r ~ s ~ ~ t e d Lenz and Tsai [64]. It has been found that the s i ~ p l e s ~ c a ~ e r a model and its calibrat~on pro
ti~isation. At the same time, its level of for our application. A pin-hok camera
of a standard e~ec~on ic camera. Let in the ~ n ~ v e r s a ~ 3-D world coordin
coord~~ates of the image point on the thermal i to I(Xp 5) is modelled prQ~ect i~e coordinates. where the element, t34, i t inside the transfo scaled to ' 1 '. Let
a standard approach i a 3x4 matrix, is known
c ~ ~ ~ d i n a t e vector, together with the two ation of the ~ a ~ s ~ o ~ a t i o n .
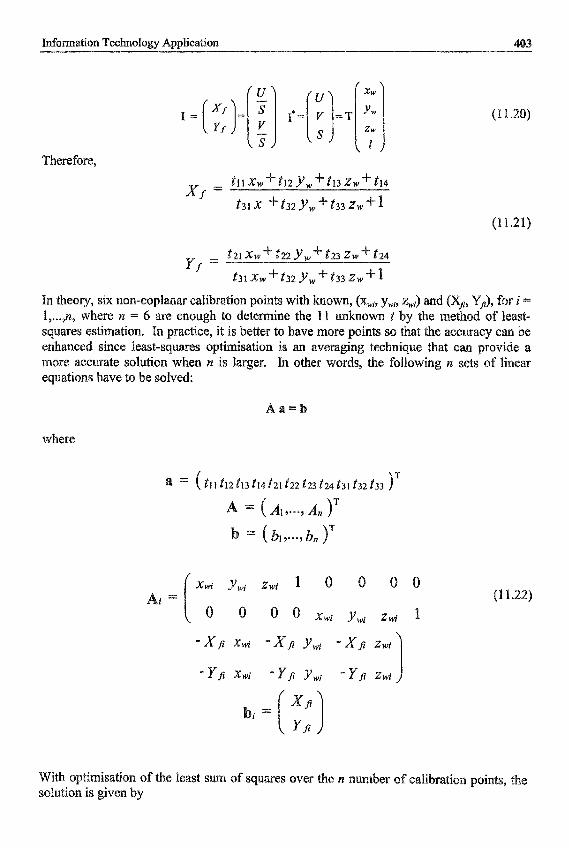
(1 1.28)
with known, (xwj9 ywi, ine the 11 u n ~ Q w n t to have more points so
an ~ v e r a g i n ~ techn n is larger. In other ~ ~ r d s , the fQllQwing n sets
n = 6 are e ~ o u ~ h to
where
( tl1 f 1 Z t13 814 121 822 t23 t 2 4 131 t 3 2 f 3 3 >'
f the least sum of squares over the n number o f ~ a ~ ~ b r a ~ ~ ~ poin

From ~ ~ ~ e r i ~ n ~ ~ , eight calibration points are
Y w j
X w j
( I 1.24)

Information T ~ c h ~ o ~ ~ g y A ~ ~ ~ ~ c a t i ~ n
xwj
Ywj
z wj
1
4 Power System R e s ~ c ~ ~ n ~ and D e r ~ ~ l a ~ i o ~
object has the same spatial resolution with respect to the original one. Inte~olation surface temperat~e is by means of a similar process.
The grid points are generated in appropriate sequence by the two ~ ~ - c o n ~ ~ ~ ~ e d stepper m o t o ~ , For each of the n number of 8, within the specified ran^^, there are m n ~ b e r s of 8, ~ i ~ h i n another specified range. Hence, the grid points can be viewed as elements of
es where n x m = M, each representing the x, y and z coordinates of ely. For the (ij) grid point where i = 1, ..., n-1, andj = 1, ..., rn-1,
ing ( i j ) , (i+lj) and (ij+l) and the other hav nts, namely (i+lj), (ij+l) and (i+lj+I)> are conside
(i+Xj+l). The equation of the first plane is given by the followin
(1 1.27)
ints are created on relevant planes. The surface te in equat~on (1 1.27) can be
oint from the three vertices are
(11.28) L I
The ~ e ~ p e r a ~ r e of any point on the three sides of the tri ~ n t e ~ ~ ~ ~ t ~ o n of the two vertices, i.e. the two end points
a ~ ~ ~ t i o n a l matrix ~ ~ n s i s t ~ n g of nine r must be s the e q ~ a t i o ~ ~ (1 1.29).
(1 1.29)

~ f o r m a ~ i o n Technology Application 7
11-7.4 I ~ p ~ e ~ e ~ ~ ~ t i o ~ ~ ~ a ~ p ~ e
The competitive electricity market: raises utility cost consciousness. n o ~ a i l y associated with equi~ment i n v e § ~ e n ~ and continuous niai system. Power trans~orm ~dent i f i~a~~on of any hot extended ~ ~ n s f o ~ e r Ii es, reduc~ion in risk of failures and i maintenance s ~ a t e ~ i e s , A t r ~ s f o ~ e r room, shown in Figure 1 1 2 8 , housing three 1500 kVA 11 kV/380 V ~ ~ s f o ~ e r s , was used for implement in^ the developed system.
are one of the most expensive elements in the s ~ s ~ e m . ots, i.e. potential faults, could provide benefits inclu
1.28 Three 1500 kVA ~ ~ n s ~ o t ~ e r in a typical t r ~ s f o ~ e r plant room
in the x direction, E200 m, rection, while the s u ~ a c e te
from 24.5s"C to 44.8"C with a resolution of 0.2"C. It takes about 3 seconds to record the and o ~ e n ~ t ~ o n of a the w ~ o ~ e p o ~ i ~ n by
, thus needing more than I ~o~~
There is not enough. inates and surface t e m p ~ r a ~ r e of each of 91. ustration while the full i s shown in Figures 11.31 and 1 1 X . The x, y and z coordinates measured in metres, are the abso~ut~ ~ o o ~ d ~ ~ a ~ e s of an image int with respect to the co~r~ ina te s ~ s ~ e ~ of the DMK. In the ~ e o m e ~ ~ a ~ mode, the 3 surface of the ~ a n s f o ~ e ~ i s as shown in Fi 1 1.3 1 without any information on temperature. It should be noted that the 3-Ea surface i s not totally identical to the real surface in this situation. The reason is that part of the
points belonging to a con

Power System ~ e s t ~ c ~ i n ~ and lation
9 T r a ~ ~ ~ o r m e ~ No. 3 under i ~ a g i ~ g

The c a ~ i e cover has a ower tempera~e, All these fe
rdinates versus surface temperature
4 m ) Y m z(m) T C ) 2.5 1.7 0.1 43.8
2.5 1.8 0.1 37.0
2.5 1.9 0.1 31.4 2.5 2.0 0.1 41.2 2.8 2.3 0.1 27.2
2.8 2.4 0.1 2-72
2.8 2.5 0.1 27.2 2.8 2.6 0.1 27.5
0
E -0.2 c_
cc N
-0.4
3.5
surface ~~~~e ~ a ~ ~ f ~ ~ e r in the geometrical mode
410 ower System Restructuring and ~ ~ ~ e ~ l a t i o n
~ u ~ h e r m o r e ~ the user can h e l y adjwt the viewing angle to concentrate on my p ~ ~ c u l a r part of the ~ v ~ ~ o n m e n ~ for ele ~ e ~ o ~ r a p h y c m s
mode. The 3-0 i n fo~at ion of all compon play. Ths designer can thus fly around improper placement of equipm
the 2-D draw~ngs conv~ntional~y suppli has been com~~ssioned, regular thermal
t spots in the equipment can i l ~ ~ a ~ ~ o ~ s of these hot spots can b A point to be noted is that a sk because any technically proficie d the 3-D t ~ e ~ o g r ~ s .
In this chapter, we have considered four hot topics in i n f o ~ a t i o ~ tech & p ~ ~ i ~ a ~ i o n s , na~e ly , ~nte~~igent agents, evo~ution ~rogra~ming, vi n ~ ~ r ~ ~ n e ~ ~ r k s ,
se of ~ e r i v a t ~ v ~ financial instrum I: and useful tool for manag~ng risk in
l ~ c a b i ~ ~ ~ to valuing e Scholes to set the market valuation of put options on e l e c ~ ~ ~ ~ .
en used to evolve a ~ e n ~ s whose fitness was ~ ~ a § u r e d by their
d has failed in the
s for ~a in t~nance, this e optical and thermal

Iiifomatioii Technology Appl~ca~~on
devised, resu~ting in a new gradient ~ c t i o n for back propagation. In order to demonstrate that the newly de simple app~ication power network consisting of six buses. It conc~uded that the ‘complex the conventional ‘real trapped in a locd min cases not fal~ing within the trainin
d ‘complex’ ANN is superior to the col~ventiona~ ‘real’ novel t ~ c ~ ~ q u e is carried out for load flow
in two aspects. Firstly, the ‘complex’ ~~ will not Secondly, it seems that there is an improved ability to
The authors would also like to thank IEE and IEEE for granting p e ~ i s s ~ o n to Eeproduce the materials contained in references [4,61] and [9,1 13 respectivley.
fa: The load Row data for the system is that of the s t ~ ~ a r d hes ll,lZ315 and 36 are in phase tap-ch
tap pin^ ranges of &lO% with a step size of 1%. The busses is 0.95 p.u, while the upper limit is 1.05 p.u. generation nodes have an upper limit of 1.10 p.u.
~pulation size is set at 20 and the The number of tournaments Nt was set at
tant M in the ~ ~ e s s function in (1 I ) is d e t e ~ ~ e d by the set o f . ?%“he value o f a in (11.5) was 0.9. limit c h ~ k i ~ g was started at Row when a previous solution w not used in the load flow in
iteration 1 when it was. For all cases the weightings within the r ~ ~ e v a ~ t to the case are K , = ~000, K q = 10,000 where QS,& is in
ing gradient acceleration is 50 % in all cases. d in EP and in comparison studies include penalties
identical to those described in [43] for voltage violations with weighting of 20. ~enalties e slack node of this e, the penalties for
for act~ve and reactive power limit violations ngs of 30 and 10 ~esp~ctively. For case (d)
voltag~ v io la t io~ are replaced by penalt~es of the form of Vt;;. in ( weighting K,. of 10. The SD step size for all cases (a)-(c) is 2.0 for active
0.001 for vo~tag~; for case (d) the step sizes are 0.00~ for active po er tap and 0.001 for voltage. Q-limit treatment for all nodes other
the slack node is ~ ~ d l e d by switching within the load Row routine.
[ I ] M.P. Wong, ‘ ~ ~ ~ ~ i a l int~lligence and neural network applications in power system^', Invited Paper, Proceedings of the International Conference on Advances in Power system Control, Operation & ~ ~ n a g e ~ e n ~ , IEE, 1943, pp.37-46.
41 Power System Restructiiriiig and Deregulation
[2] S.B. Lau and K.P. Wong, ‘An artificial neural network approach to transient stability assessment’, Australian Jourrral o f Intelligent Information Processing Systems, Vo1.3, No. 1, 1996, pp.75-85. R.P. Wong and S.U. Lau, ‘An artilicial neural network approach to modelling generator fuel cost characteristics’, Journal of Institution of engineer^, Singaporc, Vo1.36, No.6, November
W.L. Chan, A.T.P. So and L.L. Lai, ‘Initial applications of complex artificial neural networks to load-flow analysis’, IEE Proceedings - Chzerufron, Transmission arid Distribution, Vol.147, No.6, November 2000, pp.361-366. K.P. Wong arid E. Tsoi, ‘Genetic algorithms approach for the evaluation of trade-off between economic and environmental costs in power dispatch with multiple fuels and pollt~hnt~’, Proceeditzgs ofthe International (hference on Advances in Power System Control, Opemtron & Mmagement, IEE, 1995, pp.553-558. K.P. Wong and S Y .W Wong, ‘Combined genetic algoritl~mls~niulated annealing/fUzLy set approach to short-term generation scheduling with take-or-pay fuel contract’, IEEE Transactions on Power Sys%ms, Vol.1 I, No.1, 1996, pp.112-118. K.P. Wong and S.Y.W. Wong, ‘Hybrid genetic/simulatetl annealing approach to short-tcrm multiple-fuel-consta~ed gencration scheduling’, iEEE Trmsacfiom on Power Systems,
Vo1.12, No.2, 1997, pp.776- 784. L.L. Lai and J.T. Ma, ‘Genetic algorithms and UPFC for power flow control’, Interntrtional Journal on Engineering intelligent Syrlenw, vo1.4, No.4, CRL Publlshing Ltd, UK, December
[9] J. Yuiyevich and K.P. Wong, ‘Evolutionary programming based optimal power flow algonthni dispatch’, IEEE Transacfion,s on Power system.^, Vo1.14, No.4, 1999, pp.1245-1250.
[IO] K.P. Wong. A. Li and T.M.Y. Law, ‘Advanced constrained genetic algorithm load flow method’, IEE Proceedings - Generafron, Transmission and Distribution, Vol. 146, No.6, November 1999, pp.609-616
[ I 11 Derek W. Lane, Charles W. Richter, Jr. and Gerald B. Sheble, ‘Modcling and evaluating electncity options markets with intelligent agents’, Proceedings of the International Conference on Power Utiiity Deregulation, Restructuring and Power Techriologiec 2000, City University, London, IEEE, Apiil2000, pp.203-208.
[I21 L.L. La], H. Subasinghe, N. Rajkurnar, b. Vaseekar, B.J. Gwyn and V.K. Sood, ‘Object- oriented genetic algorithm based artificial neural network for load forecasting’, Lecture Notes in Computer Sciencc, LNCS, Springer-Verlag, Xin Yao et al. (Editors), May 1999.
1131 K.P. Wong and C.C. Fung, ‘Development of a fuzzy-logic-based control algoi-ithm for the commitment o€ energy sources in an integratcd energy system’, IEEE Conference Prvce~dings First Australian and New Zedand Crinference on Intelligent Information Sj)stetris (ANZIIS- 93), Decembcr 1993. pp.432-436.
1141 P.C.K. Luk, L.L. Lai, T.L. Tong, ‘GA optimisation of rule base in a fuz7,y logic conirol of a solar power plant’, Proceedings of the internufional Covference on Power Utility Deregzilatzun, Restructuring mid Power Technologies 2000, City University, London, EEE, April 2000,221-225.
[ lS l L.L. Lm, ‘An expert sysrem used in power system protection’, IFAC Symposici Ser~es, 1990, Mo.8, Pergamon Press, Oxford, pp.489-494.
[16] J Bradshaw, eci., Sojware agents, MIT Press, Cambndge, Mass., 1997.
[3]
1996, pp 7 1-77.
141
[ S ]
[6]
[71
181
1996, pp.239-242.
61

Information Techiiology Application I3
J,S. Rosenschein and C. Zlotkin, Rules of Encounter: Designing Conventions for Au~omated Negotiation among Computers, bridge: MIT Press, 1994. Barbara ~aye§-Roth, Robert van Cent, Rembert Reynold, M. V a u ~ a n Wescourt, ‘Agents application’, IEEE Intelligent Systems & their Applical
99, pp.23-27. A. Brooks, ‘A Robust Layered Control System for a Mobile Robot’, ~ E E E J a ~ r n ~ l of
Robotics and Automa~ion, V01.2, 1986, pp.14-23. J. Ferber, ‘Simulating with Reactive Agents’, in E. Nillebrand and J. §tender (Eds.), Many Agent ~ ~ ~ u ~ a t i o n and Artificial Lqe, ~ s t e r d a m : 10s Press, 1994, pp.8-28. R,A. Brooks, ‘Intelligence without representation’, Artscial Intelligence, Vo1.47, 1991,
M. Wooldridge and N. Jennings, ‘Intelligent agents: Theory and practice’, The ~ n o w ~ ~ d g e eering Review, Vol.10, 1995, pp.i 15-152. Nwana and M. Wool~idge, ‘Sohare agent technologies’, British Teleco~m~n~cat ions ology Journal, Vol.14, October 1996.
pp.139-159.
J. Bates, ‘The Role of Emotion in Believable Characters’, Com~i~njcations of the A V01.37, 1994, pp.122-125, A. Newell, A. (1982), The Knowledge Level’, A r t ~ c ~ a l Intelligence, Vol.18, 1982, pp.87- 127. P. Maes, (ed), Designing A ~ ~ o n ~ m o ~ Agents: Theory and Practice from ~ngineering and Back, MIT press, 1991 I
A. Chavez and P. Maes, ‘Kasbah: An agent marketplace for buying and selling goods’, ~roceedings of the First ~nternational Conference on the Practical A p p l i ~ a t ~ ~ n of t ~ ~ ~ i ~ i g e ~ t Agents and ~ u l t i ~ A g e n t Technology ~~~ 1996), London, April 1996, pp.75-90. P. Waynes, ‘Free Agents’, Byte, March 199.5, pp.105-114. M.R. Genesereth aid S.P. ~etchpel, ’ S o ~ w a r ~ agents’, Communications of the ACM, Vo1.37,
G. Wiederhold, ‘Mediators in the architecture of future information systems’, IEEE Computer,
C. ShebIC, energy in a fully evolved marketplace’, ~ o r t h American Power S)imyosium, te University, KS, 1994. C. SheblC, ‘ d operation in an auction market structure’, Paper p~es~nted at the 1996 IEEE~ES Winter Meeting. Baltimore, ND, 1996. J. Marshall, Futures and Option Contracting: Themy and Practice, South Western P u b l ~ ~ ~ n ~ , USA, 1989,
1994, pp.48-53.
V01.25, 1992, pp.38-49.
lives, Prentice Hall, USA, 1997. Genetic Algorithms in Search, ~ p ~ i m i z a t i o ~ & Machine Learning, A
ccessive linear p r o g r a ~ i n g based OFF solution’, O ~ t ~ m a ~ ~ e q u i r e ~ ~ n ~ s and Challenges, IEEE Power Engineering
nlinear p r o ~ a m m i n ~ al rithtns and d~coinposit~on strategies for OPF’, Optimal Power Flow: Solution Techniques, Requirements and C h ~ ~ l e n ~ e s , IEEE Power ~ n g ~ ~ ~ g Society, 1996, pp. 10-24.

Power System R e s ~ c ~ r i n g and Deregulation
[38] J.A. Momoh, S.X. GMO, E.C. Ogbuobiri and R. Adapa, ‘The quadratic interior point method solving power system optimisation problems’, IEEE Transact~ons on Power Systems, Vo1.9,
.P. Wong, and Y.W. Wong, ‘Genetic and genetic/simulated-~ealing approaches to economic dispatch’, IEE Proceedings - Generation, Transmission and Djstribution, Vol. 14 I ,
E401 IEEE Committee Report: ‘Present practices in the economic operation of power systems’, IEEE Transactions on Power Apparatus and Systems, VoLPAS-90, 1986, pp.1768-1775,
[4 11 D.B. Fogel. Evolutionary Computation; Toward a new Philosophy in Machine Intel~~gence, IEEE Press, 1995.
. Wong, and A. Li, ‘A technique for improving the convergence characteristic of genetic algorithms and its application to a genetic-based load flow algorithm’, Simulated Evolution and Learning, J.N. Kim, X. Yao, T. Furuhasi (Eds), Lecture Notes in Artificial ~nte~ l i~ence 1285, Spring$r-Verlag, 1997, pp. 167-176.
1431 H.W. D o m e 1 and W.F. Tinney, ‘Optimal power flow solutions’, IEEE Transactions on Power Apparatus and Systems, Vol. PAS-87, 1968, pp. 1866-1876.
P. Wong and J. Yuryevich, ‘Evo~ut ion~~pro~aming-based algorithm for vironmentally-constrained economic dispatch’, IEEE Transactions on Power Systems,
[45J K.P. Wong, A. Li and M.Y. Law, ~ ~ e v e l o p ~ ~ e n t of constrained genetic algorithm load flow method’, IEE Proceedings - Generation, Transmission and Distribution, Vol. 144, No.2, 1997, pp.91-99.
[46] D.C. Walter and G.B. Shebk, ‘Genetic algorithm solution of economic dispatch with valve point loading’, IEEE PES Summer Meeting, 1992, Paper No.92 SM 414-3 PWRS.
[47] 0. Alsac and B. Stott, ‘Optimal loadflow with steady state security’, IEEE T ~ u n ~ ~ c ~ ~ o n ~ on Power Apparatus and Systems, Vol.PAS-93,1974, pp.745-751.
[48] J.M. Zurada, Eds. Introduction to Artijkial Neural System, Info Access and Distribution Pte Ltd., Singapore, 1992, pp.1-3.
[49] L.L. Lai, ~n~elligent System Applications in Power Engineering - Evo lu t j o~a~ Pro~ra~ming and Neural Networks, John Wiley & Sons, Chichester, 1998.
[SO] T.T. Nguyen, ‘Neural network optimal-power-~ow’, Proceedings of the Fourth In#ernationa~ Conjerence on Advances in Power System Control, Operation cft ~anagement~ IEE, Pub No 450, November, 1997, pp.266-271.
[5 I ] T.T. Nguyen, ‘Neural network load-flow’, IEE Proceedings - Generation, Transm~ssion and ~ is~r ibu~ jon , Vo1.142, No.12, January 1995, pp.51-58.
[52] W.L. Chan and A.T.P. So, ‘Development of a new artificial neural network in complex space’, Proceedings of 2nd Biennial Australian Engineering ~ a t h e m a ~ ~ c s Confeuence, Sydney, July
1531 J.A.K. Suykens, J.P.L. Vandewalle and B.L.R De Moor, ArtiJicicaE Neural Networkr for ~ o d e l l ~ n g and Control of Non-linear Systems, Kluwer Academic Publishers, Boston, 1996.
[54] Virtual reality: personal, mobile and practical applications, IEE Cffl loquju~, Digest No.
in the design of an immersive system’, IEEE ~ o ~ p u ~ e r Graphics and Applications, Vol. 14, 1994, pp.55-59.
[56] S . Kalawsky, Exploiting Virtual Reality Techniques in Education and Training: Technological Issues, SIN4 Report Series, 1996.
AUSS~ 1994, pp.1327-1336.
No.5, 1994, pp.507-513.
V01.13, No.2, 1998, pp.301-306.
1996, pp.225-230.

Information Technology Applica~~on
[57] S.G. Bumay, ‘T.L. Wi~liams and C.H. Jones, E&, Ap~ljca~jon of therm^^ I~iagjng, Wilger, 1988.
[58] A.T.P. So, F.H.Y. Chan and A.W.C. Kung, ‘A real time system for the diseases using computer~zed thermo~aphy*, Biomedical Thennolop, pp.27-35.
[59] E.H.Y. Chan and A.T.P. So, ‘Application of thermography in advanced consumer elec~onics’, Frocee~ings of the Infe#arional Symposizdm on Consumer Electronics, Beijing, C E October 1992, pp.337-340.
[60] Niancang Wou, ‘The infrared t h e ~ o g ~ p h y diagnostic technique of high-voltage electrical equipments with internal faults’, Proceedings of P O ~ . ~ ~ ~ N 1998, IEEE, 1998, pp. 110-1 15.
1611 W.L. Chan, A.T.P. So and L.L, Lai, ‘Three-dimensional thermal imaging for power equipment monitor~ng’, I . . Proceedings - ~eneration, Transmission, and ~ i s € r i b ~ # ~ o n , Vol. 147, No.6, November 2000, pp.355-360.
[62] 1. Sobel, ‘On calibrating computer controlled cameras for perceiving 3D scenes’, Artificial Intelligence, Vo1.5, 1974, pp.185-198.
[63] D.B. Gennery, ‘Stereo-camera calibration’, Proceedings of Image Und~rs~and~ng ~ o r ~ h o ~ ,
[a] R.K. Lenz, and R.Y. Tsai, ‘Techniques for calibration o f the scale factor arid image center for high accuracy 3D machine metrology’, IEEE Bansactions on Pattern Analysis and ~ i a c ~ j n e Intelligence, Vol.10, NOS, 1988, pp.713-720.
E651 O.D. Faugers and 6. Toscani, ‘The calibration problem for stereo’, Proc. of ~ ~ P R ~ ~ ~ Miami,
E661 R.M. Taylor, W. Robinett, V.L. Chi, F.P. Brooks, W.V. Wright, R.S. Williams and E.J. Snyder, ‘The nano~anip~lator: a virtual reality interface for a sca ~ M e l l i n ~ microscope’, Computer Graphics, Vo1.27, 1993, pp.127-134.
[67] G.M. Herb and C.A. Shaffer, ‘A real-time robot arm collision avoidance system’, IBEE T r i a ~ a c ~ ~ o n ~ ~ Robotics and ~ u t # ~ a t i ~ n , Vo1.8, No.2, 1992, pp.149-160.
1979, pp. 101-108.
1986, pp.15-20.
City U n ~ v e r s i ~ ~ London UK
r Lsi Lei Lai
UK
Utility c o ~ p ~ n i e s ~~esented t h e ~ ~ e l v e ~ on the I ~ t e ~ e t b ~usi~csses ~ ~ w a ~ ~ s the ~ n ~ e ~ e t as ~ u i c k ~ y as possible. ~ e c ~ ~ l ~ ~ y available for Intenlet applications is difficult, bus~ness o ~ ~ o ~ n i ~ i e § towards the Internet will adva~ta~e. The u t i ~ i ~ i n d u s ~ has a~ways been w ~ t i n g so that they can be purchased easily. Waiting for the In could take a long time and c only result in loss of
12.2.1 at Is fhe I ~ t @ ~ n e ~ ?

A p ~ ~ ~ c a ~ ~ n ofthe Internet to Power ~ y s t e ~ onitoring and Tradi~g 7
catego~cs: c o n ~ e r c ~ a l and n o n - c o ~ e r c ~ a l . ~xamples of commercial use are p u b ~ ~ c roduct adve~ ise~ents and information. , financial data,
s are publication of papers, references, on-line ~ t o ~ a l s and . The ~ ~ ~ r n e t is not only able to d ~ s ~ i b u ~ static in
static in fo~at ion can also be dist~buted in the form of active We ~epending on information requested, or in pages such as search en
in response to ~ueries from the I n t e ~ e t user. gages are pages in which changing data is constantly received. Such pages can contain on- line music, radio stat~ons, video or real-time data updates.
The Internet allows compiiters to talk to each other via a cable or wireless CO
order to allow computers m i n g differearl operating systems to communic l a n ~ u a g ~ , or ~ a n s ~ ~ s s i o n protocol, is ~ e ~ u i r e ~ . The most comm on the I n t e ~ e ~ i s TCPIICP. The use of a protocol ensures that a user information on the Internet regardless of the computer, operating rryste
~ n f o ~ a t i o n on the Internet to be universa~~y accessibl vided in a f o ~ a t that can be displayed success~lly an
veloped to allow data to be received in a presen~bIe layout [2,3]. d o c ~ e n t s are plain text docu~ents CO
allow software to display the text in a ~ o r m a ~ e d layout. For active pages, languages such as J cript or Java allow software to be included in a added interactivi~. s o ~ a r e products used to display Web doc ~rowsers because they assist the user in browsing or surfing the I most common Internet browsers are Internet Explorer by M ~ a v i g a t o ~ by ~etscape.
12.2.3 mat Would thout the Internet?
met most comgu~ers would be s ~ d a l o n e network. These c o ~ p u t ~ would only be able to access in the local area network ( ~ A ~ ~ . This in fo~at ion would h themselves or ~ a n s f e ~ e d from a physical medium suc within the LAPS.
a com~uter. ~ ~ e n e v e r a s o ~ a r e c o m p o n ~ t on a comp It would not be possible to access the latest news or obtain up-to-date
ed sofhvare version would need to be available at its location. ical medium to be supplied to ional costs when compared
location of the co~puter woul providing i n f o ~ a ~ o n and s
over the Internet. es of e~ec~on ic i n f o ~ a t ~ ~ n ,
~amuals, maga~ i~es , ~ t o r ~ a ~ s , h s, f r eq~e~ t i y asked qu~s t~on on c o ~ ~ ~ t ~ g or progra~ming problems and many more which WO
ava~lablc.
The I n t ~ ~ e t pro~ides ~ u ~ t i p ~ e

Power System Restructurhg and ~ e r e ~ ~ a t i o n
i n d u s ~ has been utilised by the power ~ n d u s ~ for s ~ e ~ l i n ~ cing ~roductivity. The best power plants are not the plants with
their computers. The best power plants will be the ones w h ~ c ~ are using the right IT tools and using them appropriate^^.
There are many benefits to the power ~ n d u s ~ by accessing the largest resource of IT tools, the Internet and some of them are listed below:
e r e ~ l a ~ ~ o n of energy market formation on power privatisation available for customers
ice c ~ m p ~ i s o n for energy custome~ esentation of private e~ergy supply companies
-up to electricity suppli ised supply chain by t of remote e - p ~ e r s h i p s tomer relationship management d control for manag~ng peak demand energy ~ ~ c i n g
cing supply chain costs
power systems component monitoring an component control me expert advice for problems which have een expe~enced on other sites
n-line c o n s u l ~ c y (e-~ow~edge) improv~ng ~ n o w l e ~ g e ~ ~ a g e ~ e n t . automation for continuous energy supply oni it or in^ to
operation, e.g. in case of point f a i l ~ e
floors or NetMarkets for e l e c ~ c ~ ~ s~ppliers ce auctions and negotia~ions between energy
1 marketplace in the energy sector
d is~butor and supplier Ability of governmental regulators to monitor energy companies on-line
rchase o f ~ ~ h i n e ~ or spare parts from a wider range of s u p p ~ i ~ r ~ g of raw materials such as oil, coal or gas
-line ~ a r k e ~ ~ a c e s control ~nvento~es
for teleco~municat~ons ice provider (ISP) services
o f c o ~ o d i t i e s and equipment

~pp~ication of the Inte~et to Power System ~ o n i ~ o r i ~ g and Trading 19
w Can I in^ the I n f o r ~ ~ t ~ o n I Need?
In order to find the information required within millions of Web sites a search engine can be used. Most ISPs provides the Internet user with a simple search facility to search by cat ego^ or keyword. The number of Internet search engines is constantly Companies which are provid~ng a free Internet search facility are advertising as a source of income. Search engines are constantly combing amount of accessible Web pages trying to index the information they conta~n. This indexing job is done by a parr of the search engine called a Web crawler. If specific k e ~ o r d s are used for searching through the accessible Web sites, these k e ~ o ~ d s are matched against the index and lists of pages containing the keywords are ~splayed.
Generally, the Intemet can be used to gather or publish information on all t can be c a p ~ e d in electronic format. ut finding the right information with quality describes the problem of the usability of the Internet. One of the m with connecting to the Internet is slow technology. If Internet users have slo old computers or old software, the usability of the Internet is not high. Keeping technology updated requires i nves~en t in hardware and software upgrades. ~ o ~ e r c i a ~ usage of the Internet can only be effective if such investments are met. But there are more parameters which affect the usability of the Internet and which cannot be influenced by i nves~en t on the client side parameters like: which search engine to use, what keywords will give the best search results and which Web pages contain the information required? ~ ~ e ~ ~ r e , broken links, which are connections b e ~ e e n Web sites where the target site has been removed, f ra~entat ion and repetitive or duplicated contents will reduce the usabi~~ty.
Increasing Internet usability is the ultimate objective for many commercial users. Therefore, keeping a cooperative database of practical keywords, laces of interests and bookmarks on an internal Web page will increase productivity and reduce Internet ~ u ~ n g .
12.3. I
Originally, in addition to the US military effort, universities created the Intemet to share infQrmation on research p r o ~ a ~ e s . In other words, the I n t e ~ e ~ itself has been a research pro~amme between universities in the USA. With the Internet in place, research p~ojects can be continued where other research projects have stopped. This is p ~ i c u ~ ~ l y true for open governmen~l and ~ n i v ~ s i ~ projects, avoiding duplication of rese private research projects are executed behind closed doors for economic reasons although there are exceptions.
~ ~ i e n t ~ ~ c Use for ~eseur~hers
esearch software projects which are sponsored by universities or the public sector for evelopment on the frontier of technology are often open source and accessible to ch projects often benefit from the input of hundreds of con~ibuting p r o g r ~ e r s
from all over the world. One example of such a collective effort is the Linm operating system, It has been ~eve~oped by an countable number of c Q n ~ i b u t o ~ and ~ a ~ r ~ d into a very stable and reliable system. Most importantly, its source code is freely available on the I n ~ e ~ e ~ .
4120 Power System Restrur;turing and
The ~nternet is the ideal medium for publish~ng i n f o ~ a ~ i o n without h a ~ n g to pay high rates to commercial publishers. Everybody with I n t e ~ e t access and Web space c rese~ch resul~s or join newsgroups to exchange research ~ n f o ~ a t i o n . A ~ ~ a g i n a b ~ e topic is avai~able within the never-ending lists of newsgroups. ~ e w s g r o ~ p s allow researchers to publish and discuss their results with c o ~ p e ~ e n t audience. Whenever research problems accme
be found in the Internet news~oups. Sc query and collaborate with colleagues and access or share s o ~ a r e and in fo~~at ion made available on remote machines across the In te~et .
12.3.2 ~ ~ u c u t ~ ~ n a l Use
The Internet can be used to access information on schools, universities, scho~ars~ip9 fellows~ips9 and others. It is able to improve inte~ctions b e ~ e ~ n insti~tions by sharin in fo~at ion about events, projects, timetables, resources and act~vities, wh~ch may pro the usability of resources, such as sharing transportation or avoiding overcrowding in the local sw imm~g pool. The Internet can even help reduce the ~ ~ i n g costs of schools, e,
ent to be bought in bulk and shared by several institution§. als can be made available to students on-line, which saves on material
costs, cannot be lost or left at home and allow students to get pr~pared. F ~ h e ~ o r e , they allow p ~ t e ~ ~ a ~ students to gather more detailed in fo~at ion about a course up for it.
There are several on-line training courses avaiIable on the I n ~ e ~ e t . They allow people who live in ~ e m o ~ e locations to continue their education after leaving school. With the help of an on-line tutor, which monitors the progress of students remotely, queries can be sent and answer~d via e-mail within minutes, On-line exam~ations and o n - ~ i n ~ mu~tip~e-choice questions generally follow such studies, includ~ng the publishing of exam~nation res~lts.
12.3.3 Inte~net
Prior to ~ ~ i n g a decision on which product to purchase, extensive i n f o ~ a t i o fact sheets and general opinions can be analysed. The I n ~ e ~ e t ~ n a ~ l e s users t product or component performance by being able to access dir competing companies. Good starting points for obtaining lists of CO
sp~cial ise~ on-line magazines, virtual ~xhibitions or virtual shopping centxs.
usinesses can compete with on-line quotes for services and goods to a ~ c t pos~~b le cu~tomers. They can show detailed statistics on their busine5s per fo~ance to a ~ a c t pot~n~ial i n v ~ s ~ o r ~ and shareholders, ~usines€es can pu~lish i n f ~ ~ a t i o n and c o ~ ~ i c a t e via a secure Internet connection and firewalls to improve c o ~ u n ~ c a ~ o n between remote
Ap~l i~at ion of the Internet to Power System Monitoring and Trading
~ u l t i m ~ d i a means the simui~neous use of more than one medium. A single medium can be text, image, video and sound. ~ ~ i ~ t i m e d i a devices are able to play music, animated images, motion p i c~ res and videos. But multimedia technology is not just about playing multiple media, it also includes storing, transmitting and presenting information from multiple sources. Uses for such technology include e n t e ~ i ~ e n t , video conferencing, video on demand (VOD), close circuit television (CCTV) and distance learning.
These are many different formats in which multimedia contents can be stored. The most common ones found on the Internet are listed in Table 12.1.
2.1 Common multimedia types
Category Extension (MIME type)
Audio, Sound, Music
Movie, Video Images, Photos
AIF AV1 M3U MID MP3 SND WAV
AV1 DV DVD MIV MOV MP2 WE MPEG MPG BMP GIF P E G JPG TIF PGX WMF
This list s ~ a r ~ s e s only a fraction of available file types. There are many more file
If the Internet browser receives a multimedia file, it identifies its contents by the types for images, sound or movies and new ones emerge constantly.
type, which is related to the file extension. Once the content i s identified, the browser executes somVare to use the file as intended by the originator. In cases where the brow~er does not include software for opening a file type, e.g. MOV (Windows browser invokes a helper appl~cation, e.g. a movie player. For an unknown or a browser plug-in or an external helper application may be required.
and ability of the Internet to distribute multimedia content, c ed music and video occur. Without copy protection it is ve
convert music or video tracks into an Internet distributable format. But there are obvious advan~ges for selling music electronically over the Internet, e.g. no record c o ~ p ~ y ~ no i n t ~ ~ e d i a ~ e s , low cost, large audience and many more.
Internet on-line services such as Internet banking and account managing, s h o p p ~ ~ ~ in virtual hopp pin^ malls, live news and trading floors, just to name a few, have become very popular. On-line shop~ing has become very popular for light goods (sma~l pos~age cost)
music, videos and books. Several large supermarket chains are trying to push ping for food and groceries by introducing a fixed delivery fee and
delivery times. Such business is not time critical and can be accomplished continuous connection to the Internet.
the In~ernet in order to follow and react to market changes. They can only be succes the used IT infhstructure can handle real-time data transmissions and if cont~ngency are in place in case of technical failure.
Time-c~tical on-line services, such as trading floors, require a con~inuous connection to

2 Power System Restructuring and ~ e r e ~ ~ a ~ ~ n
Trading floors and on-line auctions are a very promising development on the Internet. They allow multiple sources and end users to meet in a c o ~ o n virtual business without verbal co~un ica t i on or travelling.
12.3.7 S~pport for Professionals
~e~erencing in fo~at ion plays an important part in many professions9 p a ~ i c u l ~ l y the legal, medical, scientific, financial and information technology professions, Internet was estabiished, these professions relied on an extensive amount of published papers, e.g. books, journals and reports. The production and dis~but ion of paper reports can be expensive and slow, resulting in i n fo~at ion being unavailab~e when it is required or only available to those who can afford it. Since the introduction of the Internet, such in fo~at ion is readily available to everybody. People who are ork king in a fast moving e n v i r o ~ e n t such as the IT sector require flequeni updates. The I n t e ~ ~ t provid~s a medium in which updates can be made available to everybody quickly,and cheaply; therefore, the latest technology and manuals can only be found on the Internet.
The Internet user can be hidher own doctor or lawyer. But there is a danger. Using the ~ ~ f o ~ a t i o n without the necessary experience can sometimes lead to wrong conclus~o~s. This is especially true for self-analysis of illnesses. Some ~ n f o ~ a t i o n on the Internet should only be used for the purpose of improving i n f o ~ t i o n for a specific group of professionals. It might be useful to know which illness matches the symptoms but a professiona~ shou~d compile the final conclusion.
~nternet~based business analysis solutions for the utility marke~lace provide utilities and e n ~ ~ ~ companies with large-scale sop~isticated analyses of their data and allow them to extend access to these analyses to a larger number of users. As a result, users will have
-click access to energy and power plant data to s u p p o ~ their energy ~ a d ~ g and t management and for improved business decision-making capabilit~es.
Internet forums have been successfully used as an ~ n f o ~ t i o n source for the power utility industry with regards to IT-related questions, such as the year 2000 (Y2K) issues.
There is a vast amount of power utility related data already available on the ~ n t e ~ e t but some of it is poorly organised and difficult to find. Energy in fo~at ion companies a d ~ e s s this shortfall because they specialise in the collection of information related to power utility research.
~ n ~ e ~ e ~ companies have created virtual conference room, where visitors can review case studies, survey results, white papers, reports and studies, meet with staff consul~nts, and pa~cipate in an on-line survey.
12.3.8 The Power Industry and the Infernet
Can the Internet really stand up to its promise to increase productivity and p r o ~ ~ ~ i l i t y and ost for the power industry?
is not much evidence to support this s ~ ~ m e n t 9 but with connection ownership, this will change in the near future,
to increase productivity by using the Internet to find the right ~ ~ ~ o ~ a t ~ o n easily and quickly and to attract ~otential clients to ~ommercia~ Web pages to in~rease ~ r o f i ~ b ~ l i ~ .

~pp~ieation of the Internet to Power System nitoring and Trading 23
~ f ~ c i e n t Web page desi should start from the need of the clients (the c o r n find the ~ f o ~ a t i o n or products they require ( i n~e~ed ia te content) and move to t
(e-commerce tool). Making money via e-commerce requires the real business on-line. ~ ~ c r e a s ~ n 1 barrier to purchase goods on-line, is one of the
than just i n d u s ~ news. It ices tailored specifically to the power in fo~at ion to the average I ~ t e ~ e t
professiona~~ to satisfy a need, or to solve a problem. For example, low optimis~ng the co~bust~on process or reducing shipment delivery tim shipload capac i~ using other Web sites.
increase the rate of rec erspec~ive. ~ o w e r in
r e s ~ ~ c e s for mmu
~ncrease~ ~a f f i c to ~ e b pages will increase its p o ~ u ~ a ~ ~ and th~efore its value. To t visitors, the Web page should contain added conte Web sites should provide easy access to e~ec~ ica l i ~ i s ~ b u t Q r s ~ con~ac~ors, engineers~ purcha$~n er electrical industry ~~ofess io~a ls . s the ~ n t e ~ e t can support the core co~pe t i
rgy-trading p l a ~ ~ o ~ can be designe~ to receive orga~~~sations and use these biddoffers to sched
resources locally, Ad~ i t io~a l ~nct ion§ provided to the ark et inch data, s e ~ l e ~ e n t , billing and p ~ b l i ~ h i ~ g of pricing and trading i ~ f o ~ ~ t i o n i ~ f o ~ ~ t ~ o n portal. Such a platform can be designed to give market ~ a r t i c i F ~ ~ t to access the m ~ k e t 24 hours a day, seven days a week.
Internet. In on-~ine s e ~ i c e for r ~ s ~ d e n t ~ a ~ and their ~ s w e r s Q
utility c ~ m p a n ~ ~ s and 1
offer a c ~ ~ n ~ c t o r s wiring.
~ t i l i ~ ies are developing e lec~on~c illing will reduce the utility CO
les, This will allow po s ~ ~ t e ~ ~ t c Q ~ e c t i
ing l n t e ~ e t techno~ogy adv iders (ASPS). The idea is to provide so
i s instalIed on a rem
and ~aintained or u p ~ a ~ e d ess to expensive and highly speci
ter with ~ n ~ e ~ e t access. This avoids the probl
the standby time and cost of , for ~a in ing ~ u ~ o s e s can be lea
I" of people a ~ e n ~ ~ g . This is one

12.3.9
Since the computer ~ a n u f a c ~ r i n g industry and the Internet are ~irectly related, faster and cheaper computers will constantly cause expansion of the Internet networ~. This, in itself, is a positive deve~opmen~ as long as the transpo~tion network is at least expa~ded at the same rate. Therefore, a constant improve men^ of the Infernet i n f r ~ s t ~ c ~ r e is necessa~ to ensure a continuous quality of service.
With more and more users using and publishing information on the Internet, more and more information becomes available. It is c e ~ a i n ~ y not the case that every Web site on the Internet on a specific topic contains valuable i n f o ~ a ~ i o n . §ometimes i n f o ~ a ~ i o n is dupl ica~e~ or even wrong. This makes it sometimes difficult to find quality contenf for serious researchers without wasting time visiting ~ i ~ e r e n t Web sites con~aining effec~ively similar information. ~~)nsequent ly~ the more i i i fo~at ion there is on the lnterner the more diluted the quality of content on a common topic and the more difficult it becomes to find quality content. But the Internet is constantly i~proving its search engine$, which are now using iiifomiafiorr-refining processes with artificial intelligence (AI).
The processing power of PCs has been doubling almost every two to three years and with the new generation of niultimedia extended processors (MMX), Web p include images, sound or video clips. This development has increased the Internet sur-fig, sometinies caused just by the graphicai design and ~ n c ~ i o n a ~ i ~ ( in~erac~ iv i~ ) and nOQ the content of a Web site. People visiting interactive ~ e b sites can interact with their contents for fun or for business ~ ~ ~ o s e s . The Int improved the appearance and i n t e r a c ~ ~ v i ~ of Web sites and has cre
Recent ~ ~ p r o v e m e n t ~ on the Internet
ortant issue su~ounding the Inte et. A system w h i c ~ is not us business. When the I ~ t e ~ e ~ WRS es~ab~ ishe~, s e ~ u r i ~ was
rs did not intend to use it fo esses started to emer~e on
need for securily arose. There are several reasons why h c o ~ p u t e ~ . Some o f the most common ones are clienl/se A simple securi~y-rel~ted bug in browsers can allow ~ n f o ~ a t i o n . With the latest 128 bit en rotocol, hackers will have at least
ion, i f i t is within their ab~~ity. the Int~rnet while on the move is one of th e ~ ~ r ~ . ~ o ~ a b l e hand-~eld d e v ~ ~ ~ s such as
w r i s ~ ~ ~ c ~ e s are c u ~ e n t ~ y available for accessing the ~ n t e ~ ~ ~ .
Currently, the PC is still the most common way to access the K ~ t ~ ~ e ~ . few years, Internet access will be drama~ically incre TV set-top boxes, game consoles or video teleph ~ n ~ ~ ~ e t browser en ling I n t e ~ e t access at any location.
WAP or ~ ~ ~ e r r i e t - e n ~ b l e ~ ~elephone$ are cu far, there is still a lot of convincing and iiii~roveme~~ts to be done until WAP phones will
ntly being pushed as a
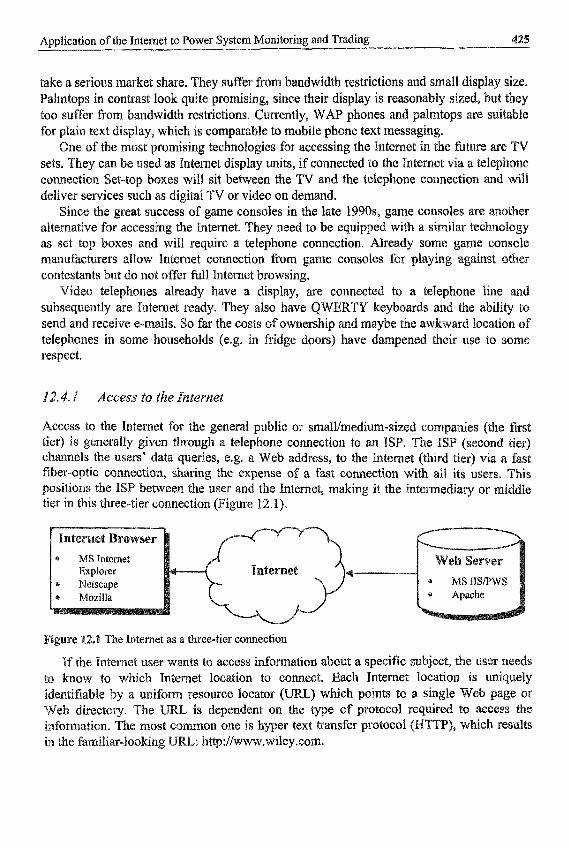
~ p ~ l i c ~ t i o n oE the Internet to Power System onitoring and Trading
take a s e ~ o ~ s mar~et share. They suffer from b~dw id th res~ictions and small dis Pal~tops in con~ast look quite promis~n~, since thek display is reasonabIy
idth restrictions. C ~ ~ e n t l y , ~ A P phones and palmto Ie to mobile phone text ~ e s s a g i n ~ ~
omising technologies for accessing the ~ n t e ~ e t in the ~~e are as Internet display units, if connected to the ~ n t e ~ e t via a teleph
c o ~ ~ c t i o ~ et-top b ~ ~ e ~ will sit b e ~ e e n the TV and e teiep~one co~ec t ion and will TV or video on demand. game consoles in the late 1990s, game consoles are a ~ o ~ ~ e r
eliver services s ~ c ~ as dig
e T~ternet. They need to be equipped with a s ~ ~ i l ~ tec require a telephone co~ect ion. Already some et connection from game consoles for
offer full Internet browsing. already have a display,
ady. They also have far the costs of o ~ e r s h ~ p arid m lds (e.g. in fridge doors) have
ted to a ~ e l e ~ ~ o ~ e line and keyboards and the abWy to
l o ~ a t ~ ~ n of se to some
respect.
12.4. I Access. to the ~ ~ t e r ~ e ~
Access to the ~ n ~ e ~ n ~ t or s~all/medi~m"size connection to an ISP. a ~ ~ e s s , to the ~ n t ~ ~ e f a fast connect~on with all i t s us ternet, making it the ~ ~ ~ ~ e d ~ a ~ or middle
Pi -8. The Internet as a three-tier connection
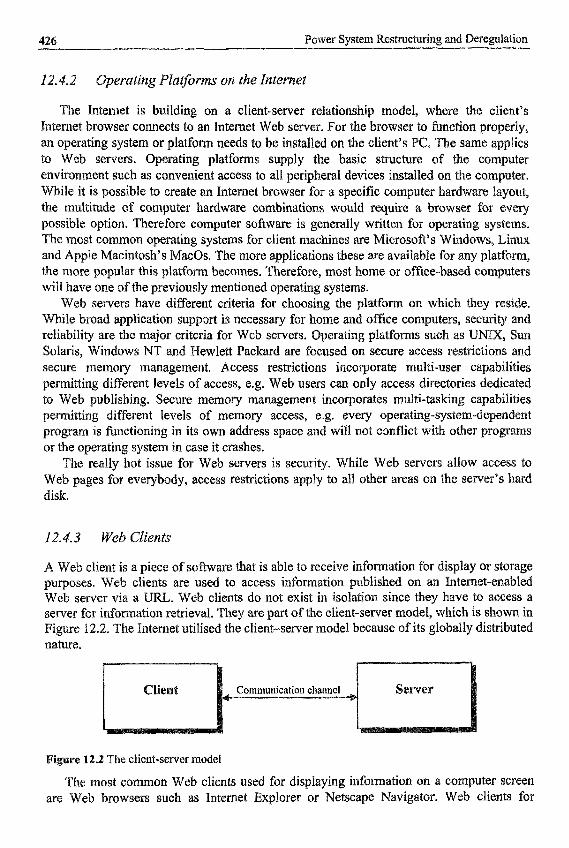
426 Power System ~ e ~ ~ ~ c ~ ~ ~ ~ ~ and ~ere~ la t i on
The Internet is building on a client-server rela~ionship model, where the client’s Internet browser connects to an Internet Web server. For the browser to an operating §ystem or platform needs to be ins~al~ed on the client’s PG. to Web servers. Operating platforms supply the basic structure of the computer environ~ent such as convenient access to all p e ~ p h e ~ l devices installed on the computer. mile it is possible to create an Internet browser for a specific computer hardware layout, the m ~ ~ ~ ~ d e of computer hardware combinations would require a browser for every possible option, Therefore computer software is generally written for operasing systems. The most comMo~ o~erating systems for client n iach~es are icrosoft’s Windows, Linux and Apple ~ac~n tosh ’s MacOs. The more applications these are available for any platform, the more popular this latform becomes, Therefore, most home or o ~ i c e - ~ a s e ~ computers will have one of the ~reviously mentioned operating systems.
servers have different criteria for choosing the ~ l ~ t f o ~ on which they reside. ad applica~~on support is necessary €or home and office CO
r e l ~ ~ b i l i ~ are the major criteria for Web servers. Oper~~ing plat Solaris, W indo~s NT and Wewlett Packavd are focused on secure access res~ct ion$ and secure ~ e m o ~ management. Access res~ct ions inco orate ~ ~ l ~ i - u s e r capabilities
nt levels of access, e.g. Web users cai only acces g. Secure memory management incorporates nt levels of memory access, e.g. every op ning in its own address space and will not conflict with other pro~rams
issue for Web servers is s e c u ~ i ~ , system in case it crashes.
ile ~ e b servers allow access ody, access res~ct ions apply to all other areas on the serv~r’s hard
disk.
12.4.3 Web Clients
client is a piece of software that is able to receive ~ f o ~ a t i o n for dis pu~oses , Web clients are used to access information pub~ished on an Internet-enabled Web server via a URL. Web clients do not exist in isolation since ey have to access a server for i ~ f o ~ a t i o ~ retrieval. They are part of the clie~t-server MO 1, ~ h i c h is s h ~ ~ in
12.2. The Internet utilised the clien~-server model because of nature.
are 12.2 The client-server model
The most common Web clients used for displaying i n ~ o ~ ~ a t i o n on a c browsers such as Internet Explorer or Netscape ~ ~ v i g a t o r , Web cl~ents for

Application ofthe Internet to Power System Monitoring and Trading 427
i n f o ~ a ~ ~ o n storage can be found in Internet search engines. A Web client must be able to understand the format of the remote in fo~at ion accessed for successful p r o c ~ i n g . If, for example, a Web site containing Chinese writing is accessed, the browser must have the reqLiired fonts installed. If rcal- me data should be displayed in a Web client, the client has to have the capabi l i~ to receive data updates and display changes ~~cord~ng ly . The mul t i~de of data types and constantly emerging new technologies and standards forces companies building such clients to release frequent updates. Users of Web clients should always try to update client s o f ~ a r e in order to access new Internet tecIino~ogies.
12.4.4 Web Sewers
Accessible UIpLs must be located on a dedicated Web server. Only Web servers which are enabled for ~nternet access are accessible by the Internet user. Basically, a Web server is a computer with Web server software such as Apache Web Server, Internet Information Server (IIS), Personal Web Server (PWS) or any other Web server software. This software allows other computers to connect to a specific port (normally port 80) and display the contents via a Web browser.
12.4.5 Web Protocols
Web servers are able to understand several protocols. A protocol is a method computers use to communicate with each other. There are several types of protocols. Different types of protocols are required for different tasks, e.g. Web page access or file transfer,
The most common protocol used over the Internet is a combined protocol called part is rcsponsible for the c o ~ u n i c a ~ i o n and the IP part is required for
identi~cation of computers. In order to address uniquely any Web semer on the Internet, a unique token is required. This has been realised with telephone numbers in mind. Therefore, a Web server can be addressed by a set of numbers, the TP number. It can be used in the browser as a hexadecimal, octal or decimal number. Its most common appearance is decimal and it looks like this: 123.456.789.012.
Since such numbers are difficuit to remember, a more friendly way has been d~~c loped, called a domain name. The domain name allows the use of friendly names such as h ~ : / / ~ . w i l e y . c o m instead of 199.171.20 1.14. Good domain names are limited and most of them have already been occupied. Some of them are available on the t ark et for bidding, which i s very similar to personalised car number plates. Recent court rulings have tried to discourage domain name hogging by forcing individuals to release branded and trademarked company domain names so that the companies can represent themselves on the Internet without paying millions of dollars.
12.4.6 E - ~ ~ i l
The Internet owes parts of its pop~~ari ty to the e-mail system. E-mail i s an electronic means of sending a message from one computer to another in an organised fashion. E-mail services are offered by an ISP. Mail accounts can be created from ISP e-mail providers such as CompuServe or AOL. E-mail is the fastest and cheapest way of sending messages

Power System Restructuring and ~eregulat io~
to any location in the world. There are specific protocols for sending and receiving e-mail messages. The protocol used to send e-mail messages across the ~ ~ t e ~ e t is ~ h e ’ ~ i m p ~ e
rotocol ( S ~ T ~ ) . The protocol used to receive e-mail messag~s is the Post Office versions of these protocols have been improved in robustness and P2 or POP3.
If e-mail con~ ins more than just text, e.g. a~~chments, another ~ r o ~ o c o ~ is requ~red. llows do~nloading or uploading of files on remote machines and is called rotocol (FTP). It is a~~omatically invoked if an ~ ~ a c h r n e n ~ i s copied to a
hard disk. If, for i~stanee~ the graphics adapter driver software requires upda~ing, i.t is more than likely that it is available on the Internet. Generally, there will be more than one location, called FTP site, for ~ownload~ng.
?TP. This protocol carries ~ n f o ~ ~ ~ ~ ~ n about the originator of the in fo~at ion and the information itself It is able to tell the bro~ser of which type (e.g. plain text or cQ~pressed) and f o ~ a t (e.g. ~ T ~ L ¶ JSP,
) the ~ n ~ o ~ a ~ ~ o n is so that the browser can play it correctly. Free ~I i te~e~-based e- mail sewices are available, e. g. from HotMail o
The most used protocof for Web browsing is the
62.4.7 Internet Security
I n t ~ ~ e t ~ e c ~ r i t y is necessa~ to protect cornpurer resources against the risks and threats that arise as a result of a connection to the Internet.
esign of the Znte~et originated from the idea of cQnnec~ing computers b e ~ e e n s etc. f i r com~unication and owle edge-shar~ng purposes. There was no reason
for a n ~ ~ o ~ y to consider s~botaging the connectio~~, since only a selection of trustwo people h sical access to the computers connected to the In te~e t¶ sharing se~isitive rese~ch ation. Tilerefore, security issues were not part of the in i t~a~ ~ ~ t e ~ ~ ~ design. Since more and more users have access to the Internet and its utilisation for business and ~ ~ ~ c ~ a i ~ansactions has grown, Internet security has become a r i m a ~ concern. The rcasons for ~xplQiting or sabotaging the Internet are man~fold.
text, allQwi~g easy access for third parties. This risk is mos One of the major security concerns is caused by the fact that data is: transported as
acceptable for non~§en nce the Z n ~ ~ ~ ~ t is a ss these lines if avo
st option for se~sitive d afford a ~ o n ~ ~ n u o u s cable
home workers to have access to sensitive eompany data from any location. These requi re~~~nts have persuaded many companies to open up their private Intranet to connect to the public Internet.
commun~catio~ to remote users can be achieved with a firewall. A firewail w r ~ ~ e n to combat unauthor is~ access to files or uiider~y~n o p e r ~ ~ ~ n g systems. on the company policies, only selected services are granted access to the outside world. Figure 12.3 shows how an Intranet can be protected with a firewall. Local computers are able to connect to each other and to the Internet, but remote coinputers with Internet access
Protec~~ng a private network and shielding it from h~ckers without restrictin


43 Power System R e s ~ ~ c ~ r i n g and ~ e r ~ ~ l a t i o n
recipient needs to receive the private key, which can be intercepted. Private key generators produce only one key (A) for encryp~ion and decryption of data.
! Trans~ission 1 across the I Internet
Data ~ n ~ ~ t ~ ~ ~ using a private key
The alternative is to use a private/public key pair. In this case, a message c e n ~ ~ t e d with the public key, but only d e c ~ t ~ d with the ~ ~ i v a t e key. This allows pu~ l ish in~ the public key to many people, who are able to send ~essages back to the
e the publisher of the public key is the hing the public key, the ~ e s s a g ~ s can b blic key, only the p~va te key can dec
lic key generators always pro public and private key where A i s used for encryption and B for
I Secret readable data
I
I ~rans~ iss ion I across the f Internet
I ~ecryp t~on with private key
.5 Data encryption using a public and private key pair

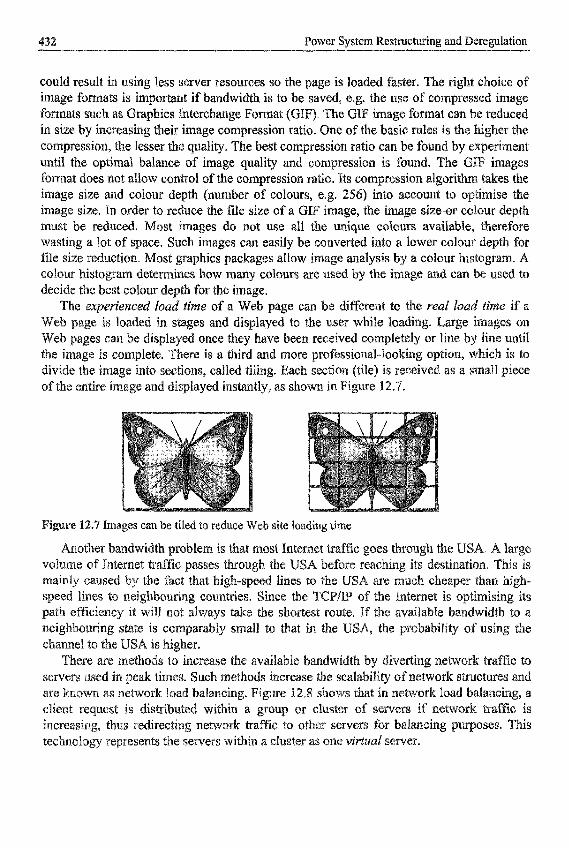
result irm using less server re sour^^$ so t age is l~aded faster. Th aved, e.g. the use of c
s ~ n t e r c h ~ g ~ Format (GIF). The GIB; ir image ~ompression ratio. One of th
o p ~ ~ ~ a ~ balanc~ of image quality a

Application of the Internet to Power System Monitoring md Trading 33
Server 1 Server 2 Server 3
Network load balancing with three servers
ua

software is ~mpo~ant . The answer is Java. Java has been develo~ed with the Internet in mind. It is not exactly i n~e~re ted or no~- in te~re ted~ but s o ~ e w h e r ~ in the m i d ~ l e ~ because the source program code is compiled into byte-code, process. Java byte-code is i n ~ e ~ r e ~ e d by a Java Virtual Machin p r o ~ e s s o r ~ s ~ e ~ i ~ c i n s ~ ~ ~ i o n s during run-time. This mechani
different platforms if an a p p r o p ~ ~ ~ e J g languages are enabling Web pages are i ~ p o ~ ~ for on-line and re
~ntgractive Web pages are required if feedback from the Web user is relevant.
12.5.3 at Is ~ a v a S c r ~ ~ ?
a p r o ~ ~ i n i n g ~ a n ~ a g e which is exe ages that provide a means of adding As shown in Figure 12.9, JavaScrip
in the Web ~rowser. It is one of
age from a Web server, the browser inte~rets the JavaSc~~pt code for page in te rac t~v~~. If, for
$elect~b~e list of products and ces, ~ava~cr ip t can keep track of the running of all selected from the list. Such interact~vi~ cannot be accomplis~ed with basic
cript ve~sa t i i i ~ allows Web pages to be created without JavaScript does not necessarily need to be emb
eb pages in JavaSc~ipt might defeat the ML pages by adding interactivity inste
Computer 1
nment for JavaScript applications
de in J a v a S c ~ ~ t is very similar to writ in^ code for a Java is how events for executing code sections are trigg
objects, e.g. a button, to trigger code, which might ~ ~ l ~ u l a t e a subtot d show the result in a ~op-up message window.
whenever unknown p r o ~ a m m ~ g code is executed ca~tion must be ta Internet browser executes the JavaScript code in an encapsulated env~ronmen~~ preventing access to system reso~rces, e.g. the hard disk. ~ h e o r e ~ ~ c a l ~ y it should be just as safe to
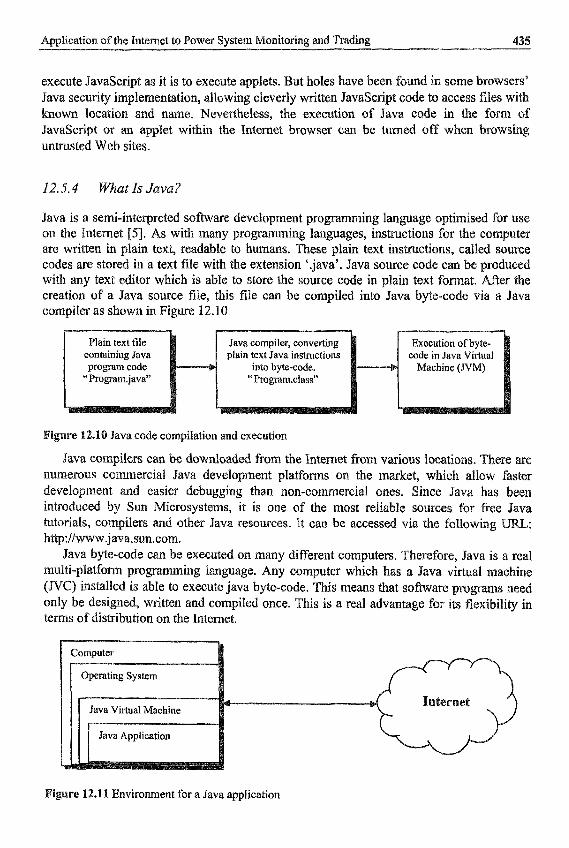
~ p ~ ~ i c a ~ i o n of the 1 ; i t ~ ~ e t to Power System onitoring and Trading
as it is to execute applets. ut holes have been f o ~ d in some browsers’ Java security ~ ~ p l e m e n ~ ~ i Q n s allowing cleverly written JavaScript code to access files with
JavaScript or an a ~ p ~ e t within the Internet browser can be turned off when brows in^ u n ~ s t e d Web sites.
own location and name. Nevertheless, the execution of Java code in
opment p r o ~ a m i ~ i n g 1
creation of a Java source file, this file can be compiled into Java b~e-code via a Java compiler as shown in Figure 12.10.
ptain text Java instructions
“Prograrn,class”
Execution of byte- code in Java Virtual
Machine (JVM)
2.10 Java code com~iiat~oii and execution
Java c Q ~ p i l e ~ can ~ o ~ l o a d e d from the n ~ ~ e t from vcarious 1 numero~s c ~ ~ e r c ~ a l Java develop~ent platforms on the m ~ k e t s which all ~ e v e l o ~ ~ e n t a er ~ e b u g ~ ~ n g than n o n - c ~ ~ ~ e r c i a l ones. Since Java in~oduced by icrosystems, it i s one of the most reliable sources for tutorials, ~ o ~ ~ p i l e r s and other Java resources. It can be accessed via the h ~ : / / ~ .j av a.sun. corn.
Java byte-code can be executed on any different computers. There ing ~ a n ~ a g ~ . Any co~puter which has a Java
le to execute java byte-code. This means that softwar ~ s i ~ n e d , written and compil~d once. This is a real advantage
terms of dis~ibution on the Internet.
Env i ro~en~ for a Java ~pplication
Power System ~ ~ s t ~ e ~ n g and
of which have a
, thus ~ a ~ i n g it safe to mn a p p ~ ~ ~ s can p e r f o ~ if it is live on the Ente
w h i ~ ~ it was ~ o ~ ~ ~ d .
~ n ~ ~ r ~ ~ ~ n t for a Java applet
shows the env i ro~n

Ap~l ica~~on of the Internet to Power System Monitoring and Trading 7
access to c o n ~ ~ e n t i a ~
be seen as a web if lines ~ep~ese ple who are §pending time on th
noth he^^ are browsing or surfing the Web.
438 Power System ~ e s ~ ~ ~ ~ i n g and
all parts are combined into a single H L page. The static part can include ~eneral ~ n ~ o ~ a ~ i o n and logos. The dynamic part can be a table where data is q u e ~ e a da~base, formatted and enclosed by ~~~L tags. Such dynam~c creation of WT can be achieved via a CGI or servlets. Therefore it is not unlikely that initially being d as a set of templates with the conten~s added via creation, ~ e n ~ r a t i o a dynamic Web page is illustrate
ases are the most used dat
ases are categorised s are hiera~chical, relat the data is stored and ~ e r e ~ o r e this e f f ~ ~ t s how the
~ n c ~ i o n s can access the data. Examples of a hi ata files as shown in Figure 12.14 [6,7].
~~t~ h i ~ ~ ~ c ~ i c a ~ ~ a t a ~ a ~ ~ ~ , data is stored in a tr data can be found near the root
~b j~c t -o~ ien ted (00) ~ ~ t a b a s e s combine t of in fo~at ion s ~ o r e ~ in the table. For ex
ction could be the calculation of moving averages.
‘ g l ~ n g u a g ~ Galled ~ ~ c ~ r e d ‘seque~’~. SQL is imple~ented s t a n ~ ~ d said to be the
~ ~ t a t i o ~ i s not always guaranteed ~ ~ a ~ ~ s to a ~ ~ o w for ~ ~ a ~ r e s spe

Application of the lnternet to o w a System Monitoring and Trading
.14 Most common database types
for execution. Database vendors have their own version and i rn~ le rne~~t ion of their database manager and query optimisers. Therefore, a common c r o s s - p l a ~ ~ o ~ database connectivity standard for Java has been introduced called Java database connectivity (JDBC). JDBC drivers have been developed from JDBC’s pred~ce§§or, ODBC, and are available for almost every database. JDBC comes in different levels of d a t ~ b ~ s e ac~essibi l i~. For examp~e, Level 1 JDBC drivers a C bridges for databases where only an ODBC driver exists and Level 4 can access a database directly and are generally written in pure Java.
When the database and the SQL application reside on the same computer, and no server exists, the database model is called a two-tier model with the first tier being the ap~lica~ion and the second tier the database as shown Figure 12.1 5 .
nce the SQL q ~ e r y has been defined and coded, it needs to be sent to the
JDBC driver via LAN
Two-tier JDBC driver connection

Power System R ~ ~ ~ ~ c ~ r i ~ g and Deregulation
If the database is located on a server the appiicat~on accesses the database via server software. Such server software can be accessed via an ordinary http request. IVcan be written in any CGI executable language, e.g. Per1 or C*, or as a pure Java application, e.g. servlets or EJBs).
~erver-s~de soflware generally contains parts of the business logic of the database. Business logic is, for example, pre-programmed SQL methods for accessing a database or invoking transaction scripts as shown in Figure 12.16.
In most Web applications the third tier is to be regarded as the connection to the database, since applications cannot be granted direct access to the database across the Intemet for reasons of security. Therefore, whenever a database is accessed across the Internet, an appropriate CGI, a servlet or EJBs must be coded. There are several software companies creating ‘off-the-shelf client-server software for data presentation for the client and database access on the server.
........ Client ............................ ~ ............................... f
SQL queries sent to servlet driver via WAN
..... /
I
Figure $2.16 Threetier JDBG driver connection
12.6.4 Web Pages with Functionaliiy
Web pages can include knctionality, e.g. collecting data typed in by users and its validation using JavaScript or VBScript. DHTLM is a collective description of mixing the ~nc~ional i ty of a scripting language with Web page interactivity.

~ p p l i ~ ~ t i o n of the Internet to Power System ~ o ~ ~ i t o r i n g md Trading 1
12.6.5 Web Pages with Integrated A ~ ~ ~ i ~ a ~ i ~ ~ ~
A new trend into leased ~p~lications on the Internet can be noted. Many small CO
which c m o t altlford to develop an application on ltaeir own, have used es for e ” ~ o ~ e r c e ~ for shopp~ng on the I n t e ~ e t and trad
.7
This section aims to give readers who are not Web developers a quick bac~~roun extended Markup Language (X wit atting i n f o ~ a ~ o n .
lacks e x ~ ~ s i b i l i ~ , since the tags which are used must be defined within the the race began b e ~ e e n major Web browser m a n u f a c ~ r e ~ , style defin ~ n ~ Q d u c ~ d as a matter of competitive advantage,
what the information is. XML can describe the stored in fo~at ion clearly,
). XML is primarily used to define
IS the most suppo~ed fo~a t t i ng l a n ~ a g e by browsers on
L weakness is that the tags are used for formatting and only little about
12.7.1
The s h o ~ c o m i ~ ~ ~ in H
the fo r rna~ i~g of the data. The forrnatt data elements, represent~g specific e document. By in~oduc~ng new data e
haw accelerated the introduction of X L. One ofthe major is that XML does not contain tags which relate to
OCUmentS is assign a constant format
if~erences b e ~ e e n TITML and X
entire ~ d u s ~ i e s are able to interchange in fo~at ion in a suitable format. Since ocuments contain the data elements, a new type of document is re ion about its repres~ntation. Such documents are called stylesbe
i n ~ o ~ a t ~ o n will be given later. Stylesheets can change the way X browser, If the ~ o ~ a t t i n ~ needs to be changed, only the stylesheet requires ~odificat~on, separat~ng the maintenance between data and f o~a t t i ng or content and layout.
12.7.2 Reasons for
document i s accessed, a plain text editor can be used to access the data, a d v a n ~ g ~ is that in years to come e v e ~ b ~ d y will be able to readlwrite the files. Plain files are pla~forrn and application independent. This means that it is not n ~ e s s a ~ to use
files have been created in order to read the ~ n f o ~ a t ~ o n . conversion can be saved if data creation s is
document file created in the 2980s word^^ or rd 2.0) 50 years later. This gives XML a truly universal and timeless data s cr~ss-platforrn data ~ c ~ i v i n g and com~at ib i~i~y problems,

42 Power System Restructuring and ~ ~ r e ~ u l a t i o ~
split by type of data and subsequen~ly displayed depending on meaning, This is because different parts of the data can be identified which enables different applications to utilise it in different ways, e.g. searching or summarising. A data element starts with a tag describing the meaning of the data, e.g. <NAME>, and ends with a terminating tag, e.g. 4NAME>. XML data smctured in such a way is referred to as being well farmed.
r ~ ~ ~ ~ ~ a ~ ~ ~ t a f Q ~ ~ a g : data is presented in a hierarchical format. Hierarchical formats have the advantage of
faster drill-down for more specialised information or move-up for more generalised information. One of the major disadvantages is that they suffer from data duplication.
~ ~ r i ~ i ~ ~ ~ ~ ~ ~ ~ ~
XML data can be formatted for display by using a stylesheet. Stylesheets define how a specific element is displayed, e.g. on a screen or printer. This enables the user to reuse the XML data for different views or presentations by applying different stylesheets. As well as displaying XML data, stylesheets can be used to convert XML data into different formats such as LaTeX or PDF.
Inline ~ ~ ~ ~ t Q n g s ~ XML allows the inclusion of other files containing XML. This results in manageable chunks of XML data. Files containing XML data chunks can then be included in one or more XML documents, reducing the amount o f data duplication.
s ~ i } ~ p i ~ ~ allows users to define a tag set of their own. Some rules with regards to its layout are
L requires one Iarge container element, which encapsulates sub-elements.
Iisted below:
All open tags must have a corresponding closing tag, e.g. <T-Il>GIHi>. All sub-elements within a hierarchy must be closed in reverse order. Outer elements containing sub-elements can only be closed if all sub-elements belong to the outer element are closed, e.g. <H IxW2><H3></H3~2></H1>. Attribute values for tags must be in quotes, e.g. <H1 colour="blue"></IT1>.
The same data can be formatted in different ways by introducing different ways of represen~ing elements. Once the data has been generated in we~i-forma~ed XML, it can be reused by different industries.
12.7.3 Separation of Content and Layout
Information contained in static Web pages may change form time to time, challenging Web page designers for fast and reliable update mechanisms. Ma in~ in~ng the fl~xibility of static Web pages is therefore one of the major design issues driving the in~oduction of new strategies and technologies. HTML pages contain content and layout within one document. Content is the information displayed on an HTML page; it can be in the form of pXain text, tables, charts, graphics or others. Layout is the presentation of the HTML page; it is embedded as HTML markup tags and is not explicitly displayed to the viewer since the browser translates the inarkup tags into positioning information.

Application of the Internet to Power System Monitoring and Trading 3
Classic HTML pages contain both content and layout in the same file, causing di f~cu~t ies since common layout needs to be replicated for all pages if changes are needed. For example, if % large company changes the layout of its Web pages a modification of each Web page is required if they were written in static HTML markup l a n ~ a ~ e * This problem can be avoided if content and layout are separated. The t e c ~ o l o ~ used for the separation could be achieved with XML for content and extended Stylesheet Lan (XSL) for layout. Figure 12.17 shows the relationship. Details on XSL will be given later.
By separating content from layout, Web design can be split among specialised teams such as graphical experts, script programmers and site managers. This allows each component to be reused and versioned, reducing maintenance complexity.
Content Repository
SQL query objects 3
SQL query objects
.I7 Rendering of XML data with an XSL stylesheet for NTML display
~ e p e n d ~ g on the XSL stylesheet ou ut formats such as WebTV, WAP, PDF or others could be c o n § ~ c t ~ d . Since XSL stylesheets are in principle XML documents, they can be converted by another XSL stylesheet into a new XSL stylesheet as shown in Figwe 12.18.
Change management system based on XSL stylesheets

44 Power System ~ e $ ~ ~ c t u r i n E and ~ e r ~ ~ l a t i ~ n
and XSL can be transfe~ed between mul~ple ~ l a ~ f o ~ s , ming languages. This protects the technology inves
stored in plain text and therefore always accessible. This m proof and allows new ~ e r g ~ n g t e c ~ ~ l Q g i e s to rely on a simple but co~prehens~ve data structure.
~ a y o ~ ~ Va l i~a t i o~ with DTD
e definition (DTD) file con ta~~s layout ru validate XML to avoid invalid or inc
XML files require to be well formed so d o c ~ e n t contains rules, with w ~ c h an
validation test. Such rvles con andatory or optional tags or data.
order to pass a DT parameter data types, u~ilisation can assist error analysis within an XML dQcument.
12.7.5 ~ ~ l e s h e e t ~
se of a stylesheet is to display X L data in a format specified by the stylesheet. allow the same XML data to be d isp la~ed in di€ferent ways. Since a data view
is d~pende~ t on which information about the data is requ~ed, s t y l ~ s h e e ~ offer an enormous flexibility not matched by RTML. If an HTML do in table format, and a transposed view is required, a new HTML creat~d and this will caus ation of data. If the data is documents need to be up using a set of s avoided. Regardless of which view is required by the us ocu~en t cQntaining the data. This ~angement offeps
since only one data source is involved. If the user nee n be used. One XML document can be f o ~ a ~ e ~ in many different ways just
s of stylesheets, which can be used with the most common browsers. The WO most frequently used are cascading stylesheets ((3s style 1ang~Iage (XSL). Stylesheets allow ~odification of thousand^ of concu~ently and consistently, and this makes the r e d e s i ~ of Web sites much simpl~r.
font styles to XML elements.
its a~ibutes, such as name, weight, sizes, fo regro~d colour, backg ~ ~ a g r a p h spacing, and many more. CSS stylesheets were introduc means o f extending the style properties of
L has a set of pre-defined eleme t contains the same element n
will result which might not result in the
headings. If a CS§

Application of the Internet to Power System nitoring and Trading
have any pre-de~ned eie ents in a browser, will not ex~er ienc~ these
SS gets its name from the fact, that the stylesheets can be cascaded. This m e ~ n ~ that more than one stylesheet can be applied to a data source.
d o ~ u ~ e n t and format it for the purpose of creating a static ~T~ document for publi~hing on the Inkernet.
links to another document. This is acco~plish define how individual parts of a docu~ent are h
, XSL or XLL documents. L hy~erlinks with the difference that ow a connection to entire documents
are more ~ e x ~ b ~ e . inks allow a more
the links allow running in more than one direction. They allow every element to become a link not just pre-defined elements.
re~erencing, footnotes, end notes, interlinked data, connections between parts of remote documen~ and other more complex document nav
d to link by reference rather than by exact location g a series of reiationsh~~s among information held in
allows ~iiipoin~ed links to other XML documents. XLL links c
ts, XLinks allow mu~ti-direct~ona~ 1
~ P o ~ t e r s allow links to arbitrary positions in an XML document, a
L since they allow for one-to"many, giving user more choice.
The increasing complexity of large electric power systems has resulted in a greater need for ~ ~ ~ n t e n ~ c e to ensure a reliable supply of power. ~ondi t~o~-based main ten^ d ~ § ~ b u t e d on-line HV condition ~ o n ~ ~ o ~ n g have been the current trend. In Non with the construction of m internaeional irport, new power substations have been built to meet the huge energy d e m a n ~ ~ The capacity of the existing distributed mon~tor~ng system, which is based on one-to-one ~ o ~ u n i c a ~ i o ~ , was considered i n a ~ e ~ u ~ t e and t~erefore a completely new design concept was tried. The schematic block diagram of the new~y developed system is shown in Figure 12.19.

446 Power System Restructuring and Deregulation
12.8. I
An international airport, currently the largest in Southeast Asia, was constructed and was opened in 1998, A number of electric power substations for the new terminal building and associated i n ~ a s t ~ c ~ r e have been constructed. A detailed study into one of the numerous substations revealed the shortfalls of the existing distributed on-line monitoring system because the substation there had been too remote from the maintenance centres. The engineers in charge of the transmission network in China Light & Power Company Ltd (CLP) very often need to know not only the real-time status of power equipment but also the security and fire safety of the substation. Furthermore, in consideration of a more efficient operation of the system in the future, personnel in other organisations, such as the Airport Authority, Fire Services Department and other operation and maintenance departments within CLP, may need to gain access simultaneously to the important information within the substation.
The original information system needed to be enhanced and extended to tackle the fire safety and security requirements. Therefore, the idea of remote vision for substation monitoring has been employed. This enabled engineers and relevant staff to sec on their remote display monitors the real-time scene of the indoor environment of the substation at different office locations or at home during standby duty. Intruders and fire outbreak in terms of smoke emissions can be detected immediately. To allow simultaneous access to information by all parties concerned, the old method of using modem-based peer-to-peer communication has been abolished and replaced with an In~e~et-based client-server concept.
R ~ q u ~ r e m ~ n ~ s of Airport Stibstation
I
MC - Micro Controller PC - Personal Computer Cap. - Capacitor
I
FigMr@ 12.19 The whole Internet-based monitoring system

Application of the Internet to Power System ~ o n i ~ o ~ n g and Trading
The substations, though having great impact on the integrity and normal whole airport, are normally unmanned. Existing substations are equipped panels that retrieve signals from smoke and heat detectors. False alarms are fr~quently encountered and this leads to wasting resources as the fire services are only able to discriminate them when they arrive at the remote sites, Illegal intruders must be and prohibited from entering such substations at any time. To accomplish mentioned above, a remote vision system was developed.
te V i $ ~ ~ n off-the-sh V cameras are installed at different locations in e
Figure 12.20 shows the structural schematic diagram of the remote vision sys is to cover all internal areas as completely as possible. For example, the eight locations of the airport substations being monitored are the fire panel, control roam, 11 kV switchgear room, 132 kV switchgear room, substation entrance, 132/11 kV transformer bay, cable basement 1 and cable basement 2. Each camera is equipped with the functions of zooming and tilting. The video signal from each camera is wired back to a tai ‘remote control and multiplexing box’. The on-site PC controls each box via the prhter port. Through this box, the lighting contactors of the eight locations can be e de-energised based on commands from a remote server. This is to ensure ~ l l ~ i n a t ~ o n level €or each camera to grab a satisfactory real-time image of each location. Via this box, the video signal of any one camera can be selected by an image ~ a b b e r card on a time-~ultiplex~ng basis. F u ~ e ~ o r e , the PC is c a ~ u n i c a t i ~ g with all o microcontrollers in the existing distributed monitoring system. In addition, control si for p a ~ i n g and tilting each camera can be output from the box. C o ~ u n i c a ~ i o n between the PC and the CLP m a i ~ t e ~ ~ c e centre is accomplished by a modem.
On the sofhvare side, the on-site PC has two modes of operation, namely the re mode and the real-time mode. The regular mode i s active during normal operation. The on- site PG s e q ~ ~ e n ~ i a ~ ~ y grabs images from the eight cameras at a ~ ~ e ~ u e n c y o€ 5 seconds per frame.
of the site and the lighting system of the site can be switched on and off acc~rding~y. The average grey level of this updated image is further compared with that of the previous image, which was grabbed and saved onto the hard disk 40 seconds ago. If t ~ e ~ e i s a significant change in the average grey level, the two images cannot be compared d~ect ly and the system will regard it as an error and wait €or another 40 seconds. ~ ~ e ~ ~ s e ~ the updated image is subtracted from the previous image so that any significant chan
The value of the average grey level can be used to assess the overall ~lluminat~o
nsidered significant, the on-site PC will first of a11 save the two relevant images onto the hard disk for later reference and then inform the ma~ntenance centre by producing an alarm at the server. On top of analysing the images, the on-site PC saves the real-time images onto the hard disk at a frequency o f two sets per how.
There are two levels of operatian being selected by the server, namely the coarse level and the fine level. Under the coarse level, images of size 320 pixels x 200 pixels are transmitted, resulting in a transmission cycle of only 48 seconds for the eight images from the eight respective cam er^. If the user finds anything unusual, the fine level can be

Power System Restructuring and
switched in, resulting in a transmission rate of around 35 seconds for each image of size 640 pixels x 400 pixels. The user is able to fix any camera ‘on-line’ and p a ~ ~ i l ~ z o o m that pa~~cu la r c ~ e r a . The compression algorithm for these images is ‘ s ~ d ~ d with the quality factor set at 15 o/o so that the file size of coarse-level
~ a n s m i ~ s ~ o n rate, namely the quality factor and the speed o quality factor is the optimal value based on experime improvement is limited. If an ISDN link is provided from the s su~$~ation, the ~ansrnission rate wilf be su~stan~ia~ly improved.
can be used to prevent theft as well, General ins~ection of the s such as c ~ e c k i n ~ cleanliness and quality of ~aintenance work.
Is can be grabbed as images so that the user at ce centre can confirm. whether the
re~evan~ camera to see the existence of smoke remote vision system can be used to monitor external contrac
e-level images is around 30 kb. There are two f a c t o ~
This remote vision system requires neither spare contacts nor add~t~ona~ ~ s d u c e r s . It
are false or genuin~ in the aetivat~$ zone.
necessary in the substation. ~ q u i p ~ e n t in ha~rdous areas or areas withou~ ce, such as confined spaces or equipment rooms with live conductor^, can
be monitored by this system. During major overhauling or fault h a n ~ l i n ~ , the ~ a i n t e ~ ~ c e ~anager is able to visualise the equipment status through the ~ i s ~ ~ a y mon ins~c t ions to the site engineers, Site problems encountered can be effici
eration of the site staff and central management personnel.
Remote vision system

App~i~a~ion ofthe lnternet to Power System ~ o ~ i t o ~ n g and Trading
smission of energy requires constant monitor ~ e ~ a n e n t power supply. ~ o n i t o r ~ n g of such
occasions in which vital changes of important paramete used to predict a po~ential problem with the equipment. Such monito sudden loss of sub-sta~ion equipment leading to unexpected power cuts. uncharacteristic behaviour of one element in the supply chain can i per fo~ance of other equipment or might even cause d ~ a g e . This is even worse if sporadic m a l ~ c t ~ o n of one device leads to damage in another device. Such sporad~c ma l~nc t~on of devices can only be detected if continuous monitoring is practised.
reduce maintenance costs because devices can be replaced before they cause damage.
tice, it is imposs~b~e to monitor every unit since they are geograph~cal~~ $is ~ u r t h e ~ o r e , it would be too expensive to keep qualified personnel in remote locations for 24 hours a day, 7 days a week. Therefore, remote monitoring of e q u ~ ~ ~ e n t with the help of c o ~ ~ u t e r s has been practised for some time. Com~uter$ are the perfect a l~e~a t i ve to monitoring personnel since they are able to monitor constantly and accurately, detecting even the smallest changes in critical parameters.
~omputers can be placed at important points of a substation. The price of computer hardware has been failing continuously for a number of years, making remote monitoring with computers effective and economical viable. Most of the hardware r e ~ ~ i r e d for real-time data collect are well established and robust. Once the connected and con~gured~ device ers for each hardware component make i access and control its ~ n c t ~ o n a l i ~ on an abstract level. Device drivers for disp
ling cards or other hardware, for example, are genera~ly written in a low-level programming language such as assemble^^ C or C3-i- to increase processing speed. Using
ing l a n ~ a g e s will increase processing speed, since the ked for a specific type of processor and operat~~g system.
dency plays an important role when it comes to deciding which compoiients to buy. Not all companies can afford to update their device drivers in good time if 8 new or changed processor or operating system is in~oduced. Exp compon~nts such as U 0 sampling cards can be rendered useless if devic
atible with the latest processors and operating systems. Therefore if h~dware i s purchased in large numbers from a manufac~rer
heref fore constant monitoring of equipment will improve power system reliabil
record of a continuous supply of device drivers. Once the ~onitoring co~puters collect data, access to the data by users ~ u s t be
gra~ted. Compu~ers can dis~ibute data in many different ways. ~ a s i c a ~ l ~ , there are two distinct network conste~la~ons. LANs, where local computers are connected via a local
where remote ~omputer~ are connected by means of long-d is~ce g access to substation data via the I n t e ~ e t requires an I n t e ~ e t
uters act as data collection points for a remote power devices i s accomplished by sequen~ia~ly
640 s. The
connection.
converting their analogue signals into digital ~ n f o ~ a t i o n via conve~ers. Such AIL) converters can be found on standard PC I/

50 Power System ~ ~ s ~ ~ ~ n ~ and ~ ~ r ~ ~ u l a t ~ o n
typical range of an A/D converter can be dJ2V or ASV, which requires app~op~ate conversion of the analogue signal to match the A/D converter’s input range.
The AfD conversion sample frequency depends on how many data sources are conv~rted and on the required data accuracy. It can be quite low (4 data t r ~ s f o ~ a t i o n s are planned. If, for example, spectral analysis or other data-intensive ~nsformations are part of the overall monito~ng process, the s ~ p l i n g frequency must satisfjr the mathematical constraints of the ~ a n s f o ~ a t i o n s used.
In order to avoid loss of accuracy or injections of harmonics into the analogue signals, NI) c o ~ v e ~ e ~ should be placed as close as ~ o s s i b ~ e to the source. Once the ~ n a ~ o ~ e signals are converted into digital info~at ion, ~ansmiss~on will not cause loss of accuracy. Figure 12.2 1 shows how substation components exchange data via a LAN.
re 12.21 Collection of data in a local PC
The raw data received via the LAN from the ~ i c r o c o n ~ o ~ ~ e r s needs to be converted in such a way that it can be sent to the ~ a i n t e n ~ c e centre. It requires a f o ~ a t that is e extendable, in case new components are added to the monitoring requiremen~s, received from different sources needs to carry add~~ional information such as the name of the source, Its location, date and time, scaling factors, units and many more. There are different possibilities on how to encode this addi~ional information. The most configurable and extendable formatting standard, which is widely accepted, is XML. It is compatible with all opera tin^ platforms since it is contained in a plain text file, for e x ~ p i e :
<TRFWSFORMER> <Temperature Unit = Centigrade3 60 </Temperaturea cPowerAngle Unit = Degree> 20 c/PowerAngle> CPowerRating Unit = kVAr 200 c/PowerRating>
ADD~ication ofrhe Internet to Power System onitoring and Trading
$a tation data has been collected and stored in local PCs, it needs to be published. se of the case study is to grant access to the substation data for all responsible
parties. Such parties may be the p e ~ o ~ e l of the electricity and security CO
brigade or other remote experts and advisers. In order to publish in fo~at ion over the a Web server connected to the Internet is mandatory. is study, there are several different ways of d i s ~ i b u ~ i n ~ i n f ~ ~ a t i o ~ on the
Internet, such as:
Static Web ~ a ~ e s with a dynamic applet and data polling. Static Web pages with a d ~ a m i c applet and data streaming.
s ~ent ioned previous~y in brief, static Web pages are not really suitab~e for cons~ntly require the data to be embedded within the document. If the , the docu~ent needs to be changed r n ~ u a ~ ~ y . erefo fore, fast data ented by static Web documents.
D ~ a ~ i c Web pages we one way of publishing changing data over the a new static Web page is generated and ~ran§mi~ed to takes place, Such g e ~ e ~ t i o n of Web pages can be do (CGI) and an executable program located in the Web k of the CGI inte~face is to instan~iate the C y the user. A p r ~ g r ~ used for the CGI c
programming language ut must be compiled or i n t e ~ r e ~ ~ l e by the server. updatin~ ~ n f o ~ a ~ i o n o the ~~~e~ i s s u i ~ b ~ ~ for slow-chang~g data suc weekly events.
eb page
~ ~ n e r ~ ~ e d on request by the CGI clfthe server.
~ ~ c ~ l i y created Web page via server CGI
pages me not limited to the CGI. They can be S e ~ l e t s are wr i~en in Java and executed on the Web server. They fbnct way to ~ ~ I ~ ~ a ~ e d pro ams but are e ore flexible and re~iab~e in terms of robus~es security.
If a Web page is generated dyn~ ica l l y on a server with ~equent data chan every 10 m ~ u ~ e ~ , it is likely that the client browser might display obsolete info The ~ r ~ ~ l e r n with server-side- enerated Web pages is that the browser
beco~es ava~~able on the server. ~rowsers have no

452 Powcr System Restructuring and Deregulation
if new data has become available on the server. ~ h e r e ~ ~ r e , the user is re~u i~ed to ~ ~ l o a ~ the con~inuously by selecting the refresh or reload option in the are even more options to generate dynamic Web pages. Internet ~ r o g ~ a ~ i n g
l ~ g u a g ~ s such as active server pages (ASP), s ~ r v e ~ side i n c ~ ~ d e ( ~ S ~ ) or J a v a ~ c ~ p t and
rowser.
tic Web pages can contain a
e a ~ " ~ ~ ~ e data update request via repea~~d r e ~ u e s ~ ~ to the server ~ d d ~

Application of the Intemet to Power System Monitoring and Trading §3
~ ~ M ~ c 12.24 Real-time data updates via continuous connection to the server (data s~reaming~
The ~aintenance office is connected to the remote power substations using a standard t~~~communication connection, as shown in Figure 12.25. ~epending on which ~arameters are ~ o n i t o r ~ d in the maintenance office, different data update ~e~hnologies need to be considered. In the case when all measurements taken from the appliances within the substations are within their set tolerances, transmission of averaged n ieasu re~~~ i t s might be suf~icien~. In case a fault QCCWS, all measured and locally stored data from a defined point could be transmitted. In order to receive continuous data transmission, data streaming is requi~ed for fast real-time data updates.
~ u b s ~ ~ i o n 1 Substation 2
2.25 Connection between power substations and the maintenance office
If remote expert advice or an on-line reporting is required, data transmis§ions of real measurements can be transmitted across the Intemet. There are several ways of displaying r e a ~ - t i ~ e data, e.g. as numerical values in an analogue or digital display or time series graph, as shown in Fibare 12.26. At present, browsers do not have a built in ~ n c ~ ~ o n a l i ~ for supporting graphical representations of data. Therefore software extending the browser's display capabilities must be used. Applets could use the browser's client area for

454 Power System R e s t ~ ~ ~ r i n ~ and ~ ~ r e ~ i a t i o n
drawing lines, shapes or colours. Such shapes offer the basic ~ n c t i o n a l i ~ r e ~ u i r e ~ for controls capable for displaying real-time data.
igital Display Analogue Display Time Series
.26 Different controls to display real-time data
other impo~ant aspect of working with applets is that they are able to connect back to the server from which they were loaded to retrieve new data updates, regardless of whether data polling or data streaming is used.
Dispiay~g real-time data in an applet is roughly a two-step process, as shown in Fi The first step is to transmit the applet from the Web sewer to the browser. step is to transmit data to the applet,
12.8.3 ~ o n ~ ~ ~ ~ i n ~
A few examples will be given on the mo~~toring of power station equip men^ such as circuit breakers for the prevention of major faults and supply i n t e ~ ~ t i Q ~ s .
The SF, gas pressure measurement history over J a n ~ ~ 1996, was ~~esented for a circuit breaker (C 12.28. It can be seen that there has been a very serious SF, gas leakage problem with the CB and the system was successful in giving a warning to the ~aintenance team on 17 December 1995. The gas topping exercise was compie~ed on 18 December 1995 to avoid a major failure ofthe CB.
A method was develope~ to measure the travelling of s based on looking at the c ~ e ~ t waveforms. Figures 12.29 and 12.30 show the me X 32 kV CB which is used to switch a 132 kV, 80 reactor. From the figures, it can be seen that the closing time for the CB is 125 rns while the ~ipping time is 50 ms.

Application of the Internet to Power System ~on i to r i~g and Trading
c4” U, 3.7.
3.6.
3.5
3.4 IS
Time Is
re 12.29 Current waveform for closing of reactor CB
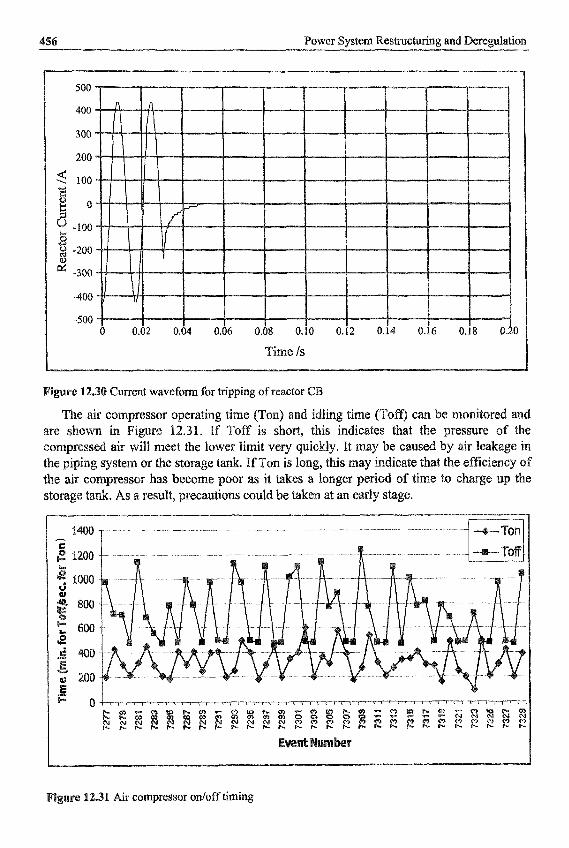
Power ~ystem ~ e s ~ c ~ n ~ and ~ e r ~ ~ ~ a t i o n
Time is
C u ~ e n t waveform for tripping ofreactor C
be air c o ~ ~ r e s ~ o ~ o ~ e r a ~ i n ~ time (Ton) and idlin are sbown in ~ i ~ r ~ 12.31. If Toff is short, this ~ o r n ~ ~ ~ ~ ~ e ~ air will meet the lower limit very quickly
storage tank. As a result, prec
Air compressor odoff timing

57 ~
Application of the Internet to Power System ~onitoring and Trading
St er
Electricity deregulation is creating a free electricity market which is differen~ from count^ to country. For each ~ e s t ~ c t u r e ~ utility, the market operator provides the essential service
nction. Electricity ~rading in Europe will change ~ a m a ~ i c a ~ l y as the wholesale and retail markets open up to competition. Competition between utility suppl~ers will bring bene~ts to end users only if each competitor has the same access to ~nfo~nation regard~ng power pricing and distribu~ion, To keep the energy marke~lace c o ~ p e ~ i t i ~ e , it
d i s c r i ~ ~ n a ~ o ~ , transparent and easily accessible for each compet~tor. ng is not confined within a country’s borders. Many countries are to ne~ghb~uring countries so that a ~entralised operated
can have a key role [9]. That kind of power exchange will have to offer a re~iable and efficient exchange information between the market participants by operating a r ~ ~ ~ a b l e , highly d~s~ributed and low-cost informa~ion network.
If the open energy market is to succeed, all participants must be wired into a s~andard data exchange Infrastructure that must be platforni and language ~ndepen~ent. Tl-tesefore the Internet, with its ~ l a t ~ o ~ and language independence, is the choice for h o s ~ ~ g on-line
wer traders require fast reaction to market changes. They nee to control their trades across all current bids, offers and iiegotiations by means of a mouse-c~i~k and r ~ ~ u i r e real- time ~ a r ~ e t in fo~at ion, including market depth as well as vital news i n f o ~ ~ a ~ i o n . Furtherxiore, anonymity during negotiations and tools for t analysis of marke~ ~ o n d i t i ~
The complexity of the predi~~ion of market trends
re the relevant ~e~uircments. er exchange with its large nuinbers of v ~ ~ a b l e s rn
rediet. Therefore, pa~ic ipan~s must be awa eters to s u p p o ~ decision making in the daily offer~ng pro
xchange can s c h e d ~ ~ e enough capacity to meet all requi~ ibe different kinds of auctions
natory and unifoK~ auction system [lO]. An ideal power exchange r e ~ u l a ~ ~ o n and reserve in ~ a ~ a l l e ~ based on auctions. The dispa~ched
regula~i~n is the capacity to maintain real-time g r e s e ~ e i s the prov~sion that can res
the market situation and follows t pa~~cipants have to ensure high p r o ~ t a b i l i ~ nd a clear re~at~onship between the value of a
re, pa~icipants can use an ageni with a specific be
and trading systems coal services and new tools and technologies for controlling, ~cheduling~ ~ l e c ~ i c i ~ ~ ~ ~ ~ ~ e f 5 r e , in~e~~igent agent tech~ology has been develo~ power arke et as described in Chapter 11. Complex distributed system
enefit the ~~ i te rac~~on between intelligent s ng of electricity. ln~eiligent agents per
s in an on-line auction [ 131. As mentioned previously, agents for buying or selling electric^^
re~re5ent~~g either generators or consumers. In order to use agents to

458 Power System R e s ~ c ~ ~ n ~ and D e r ~ ~ l a t i o n
advantage, each agent needs to present a unique economic and strategic behaviour model. These mode~s are based on human behaviour with respect to different tra env~onments, For example, agents can show an ;anxious buying and selling behaviour, greedy behaviour or relaxed behaviour to emulate market p~ic ipants.
There are several ~nte~et-based simulation environments for exp various power exchange mechanisms avaiIabIe on the Internet [ 141. allow pa~icipants from different locations to compete in the open market.
This is advan~geous for the training of personnel, who are able to try different buying and selling strategies under changing market conditions without causing interfkrence on a real trading floor. With the help o f more advanced trading platform models, differen~ auction types, e.g. uniform price, single and doub~e-sided auctions, and di~erent c o n s t r ~ i ~ ~ ~ , e.g. transmission losses, line capacity and stability limits and congestion s i ~ ~ t i o ~ s , can be explored. The ultimate objective for each si~ulatjon will always maximi~e profits from trading energy.
The first step in building a trading platform over the I n t e ~ e t is to gain quality ~nternet access with enough i and width to serve all clients at a ~easonable spe Internet access cannot be achieved by telephone. It is necessary to rent or buy a dedicated
r with a reliable ISP, which offers a 24-hour, '?-day customer service. nce a reliable Internet ~ ~ ~ t i o ~ ~ is es~blished, server s o ~ a r e must be pure
ing Web services, Currently, the most common Web servers are IIS ~ i ~ r o s o f t , Apache Web Server from Apache and Web Logic. There are many so~tware co~panies o f f e ~ g competitive Web server so~utions, which can also integrate e- commerce packages.
ing a reliable trading platform across the Internet i not trivial. A ~ ~ r n a ~ must be to ensure data security and data ~ t c ~ t y . ata security across the
Internet has constantly been improved by the int~oduction of better and faster s e c ~ t y algo~thrns. The most used and trusted method is secure sockets layer (SSL). rela~ive~y simple to i Data integrity can be achieved by buying a database fiom a major vendor. Such may include startup consultancy and customer support. It is i m p o ~ ~ t to de database in such a manner that the database § ~ c ~ r e will deliver optima^ performance.
lement and does not require changes to any existix~
are sent to clients in XML format, conversions fkom table ~ o ~ a t abase response times. eref fore, the choice of database layout
should match the d i s ~ b u ~ e d data format if possible [ 151.
between clients connected to a trading platform. On connection to the L page conta~ning all the required fields to
Figure 12.32 shows a simplified block diagram of a
n submission of a transaction, the Web s t r~sact ion details, which should be validated for c o ~ e c ~ e s ~
ase. If invalid data is contained in the ~ s a c t i o changes will be rolled back to restore the da suction servers can be purchased for keeping

Application of the Internet to Power System Monitoring and Trading
As with many real-time auction and trading platforms, data update§ are sent to the ceivd data updates via XML allow faster data updates, since
n to the browser cIient area to avoid the generation of pages. ~ u ~ e ~ o r e , more clients can be sync~onous~y ~ p d a ~ e d because
small portions of XML data are sent across the Internet, saving precious b ~ d w ~ ~ t h .
to finish. There are several s o ~ ~ e compa~ies offering complete solution pac cornrn~rce and on-line auctions. I n t e ~ e t applications have different r e q ~ i r e m c ~ ~ ~ unknown to desktop a~pficatians. ~ e q u ~ e m e ~ t s such as sc c o n t i n u ~ ~ are of great i r n ~ o ~ ~ c e for ~ e b applica~ions. ~ e b - b a s e ~ s o ~ a r e for highly scalable products require a great knowledge of r n ~ ~ t ~ - t ~ e a d e d envir~nrnenzs and
It will take an entire p r o g r a ~ i n g team to create a real-time auction platform from s
parallel process~ng architec~res.
Client Computer I
time data via an
~ommunications aechitectuee
application of ~ ~ t e ~ e t ysaem ~onitoring and is a very e area, e examples have been the benefits derived fr e obvious. er, it
can be seen that much work remains to be done. One area is system security in the open- access e ~ v i r ~ n ~ e n t .
structuring and ~ e r e ~ l a t ~ ~ n
also like to thank E E E for ission to rep ro~~c
ymond ~ r e e i i l ~ ~ ~ rn t ro~~c~ ion to the I i i t @ ~ e ~ for Eng~neer~, 1998.
Dynamics ~ T ~ L ~ O’Reilly s Teach Y o u ~ s e ~ ~ T ~ L 4 in
1899, ~ e a c ~ p i ~ Press.
Chan, A.T.P. So and L.L T r a ~ a c t i # ~ s on Power Sys
~ o ~ e e ~ i n ~ ~ (If the K ~ ~ ~ r n Q t i o n ~ l ~ # w @ r Techn~~og~es 2000, IEEE, April 2000, pp.47 1-475.
er Academic ishers hers^ 1999. Sheblh, ~ h a ~ ~ e ~ 6: Agent based Econo~ics, in
Power ~ y s ~ e ~ s ~ ~ s t ~ c ~ r i n g and Economics f l2] ~ ~ ~ n ~ C ~ ~ Liu, Naili Song, Sacques Law n, ‘New ~ e t h o ~ ~ for

access fees, 162, 165, 167 active reserves, 25
198,199,218
autononiy, 355,356,359 a u ~ ~ " r ~ ~ l o s ~ ~ s , 127, 128
back-to-back thyristors, 269,273 ba~ancin~ ~ ~ k e t , G8,78,85, 113
battery charging, 28 bench~ark, 116,125,128,X57,163 bid prices, 23,98, 176 bilateral con~acts, 24,G 1,
5, 158, lG7, 168, 1
bilateral model, 96
black-start capabiIi~, 93, 19
~ e n ~ a ~ control s y s ~ e ~ s , 12 central utility model 52
148,259 c o ~ p ~ ~ i t i o n , xii, 1,2,4,5,8,9, 11, 15,
62 Index
304,329,330,332,334,347,356, 360,373,377,420,457
competitive ~idding, 1,65 competitive framework, xi, 110,353 co~petitive ~eneration, 2,3,4, 107 competitive metering, 114 competitive trading, 24 compu~tional intelli~ence, xxi, 353 condition mQnitoring, 129, 132,295,
300,304,312,313,320,322,328, 445
congestion manage men^, xiii, xxi, 58, 69,70,71,75,78,79,86,88,89,90,
94,95,97,99, 104, 178, 180, 5, 198,200,209,215,216,
co~~est ion ~ ~ a n a g e ~ e n t markets, 93,94 contract market, ]I 0,6 I , 68, 179 contract path allocation, 57
damper, 273,274 data pol~ing, 45 1 , 452,454 data security, 458 data s ~ e ~ i n g , 451,452,453,454 database, 136, 137,319,321,408,419,
420,437,438,439,440, 458 d a y - a ~ ~ ~ d , 61,69,79,86 day-ahead market, 71,78,90, 176, 178,
191 delivery time, 86,421,423 demand d e ~ a n d ment, 1 IS demand-side bidding, 68 deregulatiQn, xii, xi& xiv, xviii, xix, 1,2,
5,6,7,9, 10, 15, 19,45,48,50,52, 52,55,57,58,64,70, 71,73, 108, 111, 116, 119, 133, 140, 153, 161, 167, 171, 173, 175,202,217,218,
dere~latiom of energy market, 4 18 desalination plant, 38,49 discrete wavelet ~ a n s f Q ~ , 338
dissolved gas analysis, 296,323,329 distrib~ted gen~ration, 13, 16, 17,20,21,
22,23,25,26,46,48,99, 108, 144, I64
d i s ~ b ~ t e d gene~ation tec~ologies, 13 distribution auto~atiQn, 127, 128, 147,
148,151,418 distrib~tiQn co~panies, 4,63,64, 1 10,
111, 113, 115, 116, 117, 119, 154, 175,302,316,318,353,361
distribution loss, 63 district heating, 21 d i s ~ r b ~ c e reco~nition, 341,350
economic dispatch, 53,77,78,82, 109, 121,133,374,414
eddy currents, 325,326 elasticity, 59, 192, 195, 196,209, 215,
electrical d ~ s c h ~ g e , 296,300 electricity and gas networks, 1 1 1 electricity dis~jbution industry, 1 11 electronic auction ~ a r k ~ t s , 10 e-mail, 354,420,425,427,428,429 embeddedcost, 57,58,186,187,189,
embedded generators, 112 embedded systems, 128 emissions-free e l e c ~ c i ~ , 19 energy function, 206,385 energy mix, 6 energy policy, 16,48 energy purchase cost, 1 13 energy storage, 5, 13,259,2
220
190,194
270,285 nzglish auction, 55,56
equilibriu~ point, 68,69,84,97,206,
ethernet, 348 evo lu t~ona~ comp~tin
~ ~ Q l u t i o n ~ ~ pro ex ante market, 61 ex post market, 6 1 , 73 excitation capacitance, 27,223, 32, 35 expert syste~s, 353,355
207

Index 63
faci~i~tors, 359 fiber optic communication, 147 fiber-based ~ansmission, 142 file types, 42 1 financial markets, 78,88,94,97, 171 financial ~ ~ s m i s s i o n rights, 95 first rejected o~fer, 55 flexible AC transmission system, 162 flicker, 266,33 1 , 342,346,347,352 f o r c e - c o ~ u ~ t e d converters, 278 forward markets, 71,86,95, 106, 178,
fossil fuel, 3,4, 6,45,53 Fourier transform, 336,347 free space lasers, 141 ~equency m~dulat io~, 144 fuel cells, 10, 12, 13,20,2li, 26,99,330 hll graphics in~er~ace, 134 ~ ~ r e s market, 8,68,74, I0
fuzzy diagnosis, 323,325, 328 fuzzy logic, 38,49,341,412
361
362,364
g a ~ i n g , 50,78, 83,88,91,92,95,98,
gas industry, 165 gas turbine technolog~, 173 generation companie§, 22,67,72,73,
99,107
175,361 eneration mix, 11
156,180,412 genetic algorithm, xix, 49, 360, 362,
364,365,367,370,410,412,414 GIF image, 421 g a v e ~ e n t ~nte~ent ion, 16,45 graph theory, 246,25 1 green c ~ ~ i ~ c a t e s , 17 green energy, 20
278,279,280,283
harmonic distortion, I3,26,331,346,
harmonic instabilities, 34 head-rnounted displays, 3 hedging, 65,95,360 hedging contracts, 65 hidden nodes, 384,386,388,3 hot spats, 297,400,407,410 hour-ahead market, 158, 176, 178 HVDC, xvii, 73,260,263,264,266,
274,277,278,279,280,281,286 hybrid agent, 355,358,359 hydro, 3,5,6, 12, 13,20,68,72,73,
348
105,174,229,259,280,330
IGBT, 262,263,264,269,278,280 immersion, 395,396,397,400,405 incipient faults, 29(j9 323,329 incremental cost, 53,57,83,84,85, 88,
incremental cost allocation, 57 Independent Power Pro~ucers, independent system operator, 2
104,121, 175,217 inelastic load, 65,92 inequality cons~aints, 198,21 I , 212,
i n fo~at ion t e c ~ o l o ~ . ~ 2,54,59 infrared detectors, 297,401 infrared irnager, 400 i n ~ s ~ e ~ r e ~ l ~ n i n g , 1 installed capacity, 22,25
intelligent electronic devices, 139 interface agents, 355,356,357,358
inte~ational f i n ~ c i n g a~encies, 124 In te~et , xiv, xvii, xix, 1 14, 1 18, 140,
90,91,92,99, 196
373
223,23 1 266
141, 143, 144, 145,358,416,
458,459,460 auction, 55,56,60,61,65,67, 82,84,
90,91,95,96,98, 105, 108, 109,

46 Index
193,194, 195,362,413,457,
baiidwid~¶ 43 1 ~ d u ~ a ~ ~ o n , 143,354,399,420
in~er-zana~ ~ o n g ~ s ~ i o n , 88 inves 9 307
159, 160, 162 ~ a ~ g i n a ~ costs, 3, 53, 58,210,240,242
ricing, 23, 57, 99, I
~ ~ ~ k ~ t clearing, 65,71,85, 87, 89,90, 187
91,96,177
219,231,234,236
~ a r k e ~ ~anspar~ncy,
~ e g a w a ~ mile al~ocation, 57
335
mother wavelet, 337,338,
mutation, 40,41,372, 373, 375, 3’76, 377,378
nodal p r i ~ i ~ ~ , 59,73,88, 166, 167, 187, 188

Index -.-
~~o~-d isc r im ina to~ auction, 55 n o n ~ ~ ~ ~ e r s ~ ~ e s y s t ~ ~ s , 397
154,231
150
power pool, 4,22,82,86,87,%3, 100, 109,159,176,179,182,183,18 185,292
power quality, xiv, 21,25, 21”79 127,
ly, 116,117, 119,1

(I Index
real~t~me markets, 78, 86 r e ~ e s s ~ ~ n anafysis, 116
latory body, 110,33 r ~ ~ l a t o ~ incentives, 293 re l i ab i~ i~ benefit, 189, 190
units, 127, 129, 132
sment, xiii, 115, 117, 125,316
rew wall, 428,429 ~ ~ s w o r ~ , 429
sation, 260,261,271,272, 275,276,282,285,28
163, 164,170,288,289
423
service ~rovider, xiii, 1 1 1, 156, 162,
se~ement, 55,63,69,71,79, 177,
shadow prices, 96
s i m ~ ~ ~ e o ~ s electricity market, 87 single-p~ase loads, 27,46 smart agents, 355 smart m e t e ~ ~ g , 61 social welfare, 54,8
42,46,49,330,399, solar collectors, 38
§ y s t e ~ ~ y n a ~ ~ c s , xxi, 80, 101
Index
system marginal price, 23, system opera to^, xiv, 51,53,56,59,60,
61,65,69,73, 103, 115, 120, 121, 139, 154, 157, 158, 166, 168, 177, I78,192,X93,194,195,210,331
system-wide blacko~ts, 155
t~e-or-pay, 412 tap-chang~, 261,277 telecommunicat~on ~ n d u s ~ , 153, 154 telephone n e ~ o r k , 1 14 thermal heating t e c ~ o l o ~ , 37 thermal limit, 58,59,66,259, 283 ~ h e ~ o g ~ p h ~ , 400,410,415 therrnovision cameras, 297 thyristor cQn~olled reactors, 266 t h ~ s ~ r controlled series capacitor, 271,
tier supplier, 1 12 time of use, 135,190 tournament scheme, 377 t r~s ien t energy margin, 206 t r~s ien t s tab i~ i~ , xvii, xx, 139,206,
219,285,412 ~~nsmiss ion access, xvii, 5 1 , 175, 184,
191, 197,200,216 transmission channels, 1 ~ ~ s ~ s s i o n charge, 58,90,95, 165,
168,199,211 transmission loss, xiii, 57,60,65,72,
105, 120, 165, 186, 191, 192, 196, 197, 198,204,214,247,257,373, 374,376,458
285
tr~nsmission model, 8 tr~smission open access, xiii, 2 16,37 P transmission pricing, xxi, 58, 105, 168,
169,187, 191,218,221,246 ~ ~ s r n i s s i o n protocol, 417,427
FTP 428
mission revenue, 162, 16 transmission system expansion, 162,
163,170
two-tier system, 120
UHFradio, 144, 149, 150 ~ b u n ~ ~ i n g , xii, 50, 52,53,73, 1 uncons~ined schedule, 65 unified power flow controller, 275,33 1
103,104,108,109,1177,180 UNIX, 136,426 uplift charge, 55 usage charges, 162,16 use of system charges, 27, 72, f 11 , li 15
valley load time, 241 vertically integrated, 8, 50,58,64,72,
77,153,155,156,157,163,16 178,210,360
vertically integrated utilities, 77, 153 virtual e n v i r o ~ e n ~ , 395 visual display unit, 395 voice activated messages, 1 I voltage collapse, 140,260 voltage control, X4,26,80,93,1
voltage dip, 117,333,350 voltage sags, 13,33 1 , 332,334,335,
voltage source converter, 280 v o l u n t ~ system operator model, 158,
194,284
348,349,350
160,161,162,163
WAN, 134,139,358,431, wavelet transform, 336,337,339,350
45 8
static, 417,433,437, Web server, 426,427,4
451,454,458 web space, 420,437 website, 75, 114
8 Index
LPE ca~ies, 3 13 ay, 59, 178, 198, 199,
3, 14, 17,20,21,22,26, zonal price, 71, 166, 167, i!
ricing, 90, 166, 167, 18 45,49,53, 147,259,280,330,349