
POWER SUPPLY PROCUREMENT PLAN · 2019-03-15 · Marilou C. Gapuz, BOD Secretary Max C. Ordoño, BOD...
21
LA UNION ELECTRIC COOPERATIVE, INC. Sta. Rita East, Aringay, La Union 2503 POWER SUPPLY PROCUREMENT PLAN Prepared by: Engr. JOVENCIO B. PATAUEG, PEE Engineering Services Department Manager Engr. DARRYL D. GANTONG Head, System Planning Design & Asset Management Section Insights: Ramon C. Posadas, Ph.D, General Manager John Paolo F. Casuga, BOD President Rolando L. Acosta, BOD Vice President Marilou C. Gapuz, BOD Secretary Max C. Ordoño, BOD Auditor Benjamin N. Dy, BOD Treasurer
Transcript of POWER SUPPLY PROCUREMENT PLAN · 2019-03-15 · Marilou C. Gapuz, BOD Secretary Max C. Ordoño, BOD...

LA UNION ELECTRIC COOPERATIVE, INC. Sta. Rita East, Aringay, La Union 2503
POWER SUPPLY PROCUREMENT PLAN
Prepared by:
Engr. JOVENCIO B. PATAUEG, PEE Engineering Services Department Manager
Engr. DARRYL D. GANTONG Head, System Planning Design & Asset Management Section
Insights:
Ramon C. Posadas, Ph.D, General Manager
John Paolo F. Casuga, BOD President
Rolando L. Acosta, BOD Vice President
Marilou C. Gapuz, BOD Secretary Max C. Ordoño, BOD Auditor
Benjamin N. Dy, BOD Treasurer

POWER SUPPLY PROCUREMENT PLAN
LA UNION ELECTRIC COOPERATIVE
POWER SUPPLY PROCUREMENT PLAN
For inquiries, please contact us through:
DOE: [email protected], telephone numbers (02) 840-2173 and (02) 479-2900 local 202
NEA: [email protected], telephone numbers (02) 929-1909 local 180
In compliance with the Department of Energy’s (DOE) Department Circular No. DC 2018-02-0003,
“Adopting and Prescribing the Policy for the Competitive Selection Process in the Procurement by the
Distribution Utilities of Power Supply Agreement for the Captive Market” or the Competitive Selection
process (CSP) Policy, the Power Supply Procurement Plan (PSPP) Report is hereby created, pursuant to
the Section 4 of the said Circular.
The PSPP refers to the DUs’ plan for the acquisition of a variety of demand-side and supply-side
resources to cost-effectively meet the electricity needs of its customers. The PSPP is an integral part of
the Distribution Utilities’ Distribution Development Plan (DDP) and must be submitted to the
Department of Energy with supported Board Resolution and/or notarized Secretary’s Certificate.
The Third-Party Bids and Awards Committee (TPBAC), Joint TPBAC or Third Party Auctioneer (TPA) shall
submit to the DOE and in the case of Electric Cooperatives (ECs), through the National Electrification
Administration (NEA) the following:
a. Power Supply Procurement Plan;
b. Distribution Impact Study/ Load Flow Analysis conducted that served as the basis of the Terms of
Reference; and
c. Due diligence report of the existing generation plant
All Distribution Utilities’ shall follow and submit the attached report to the Department of Energy for
posting on the DOE CSP Portal. For ECs such reports shall be submitted to DOE and NEA. The NEA shall
review the submitted report within ten (10) working days upon receipt prior to its submission to DOE
for posting at the DOE CSP Portal.
The content of the PSSP shall be consistent with the DDP. The tables and graph format to be use on
the PSPP report is provided on the following sheets. Further, the PSPP shall contain the following
sections:
I. Table of Contents
II. Introduction
III. Energy and Demand Forecast (10 year historical and forecast)
IV. Energy Sales and Purchase
V. Daily Load Profile and Load Duration Curve
VI. Existing Contracts & Existing GenCos due diligence report
VII. Committed Energy and Demand for CSP
VIII. Currently approved SAGR for Off-Grid ECs to be passed-on to consumers;
IX. DU’s Current Supply and Demand
X. Distribution Impact Study
XI. Schedule of Power Supply Procurement
XII. Timeline of the CSP

POWER SUPPLY PROCUREMENT PLAN
Page
I. Introduction 3
II. Energy Sales and Purchase 5
III. Demand 7
IV. LOAD PROFILE AND LOAD DURATION CURVE 9
V. MIXSUPPLY VS DEMAND AND THE OPTIMAL SUPPLY 11
VI. Existing PowerSupplyContracts 12
VII. DISTRIBUTION IMPACT STUDY 13
VIII. SCHEDULE OF COMPETITIVE SELECTION PROCESS (CSP) 14
ANNEX A:10 YEAR MONTHLY FORECASTED DATA 15
ANNEX B:10 YEAR MONTHLY HISTORICAL DATA 18
TABLE OF CONTENTS

POWER SUPPLY PROCUREMENT PLAN
DISTRIBUTION UTILITIES PROFILE
INTRODUCTION
The province of La Union is supplied with
power by the La Union Electric Cooperative,
Inc. (LUELCO) and the La Union Electric
Company, a private electric franchise. Before
LUELCO came into existence, power has
already been supplied to few towns of La
Union by Private Electric Franchises like Milo
Electric System in Aringay, the AELAPs in Agoo
and several others.
LUELCO, which was founded in August 7,
1971, now under GM Ramon C. Posadas,
Ph.D., has a total potential household
connections of One Hundred Forty Six
Thousand Nine Hundred (146,900) and an
actual household connection of One Hundred
Forty Six Thousand Five Hundred Eight
(146,508) as of December 31, 2017. These
members come from the 23 Municipalities and
1 City (19 municipalities and 1 city in La Union
and 4 municipalities in Pangasinan) served by
LUELCO.
The customer profile as of December 31, 2017 shows that residential customers are
dominant in LUELCO at 128,870 (94.28%) of the total customer population followed by
commercial customers at 4,762 (3.48%). In terms of energy share per customer, still
residential customers have the biggest piece of the total energy at 130,403 MWh
(65.74%). LUELCO’s system coincident peak demand registered a high 41.34 MW in 2017
compared to 40.28 MW in 2016.
There are six (6) Substations which supply the power requirement of the coverage area
which are strategically located in Naguilian (10 MVA S/S), Damortis (10 MVA S/S),
Balaoan (15 MVA S/S), Aringay (15 MVA S/S), Bacnotan (10 MVA), and in San Fabian,
Pangasinan (5 MVA S/S). All these are manned/operated/maintained by the coop’s 304
employees.
LUELCO, at present, has 6 Area Offices located at Aringay, Agoo, Rosario, Naguilian,
Bacnotan and Bangar and 5 Collection Offices situated at the Municipalities of Luna,
Balaoan, San Juan-San Gabriel, Tubao, Sto. Tomas, La Union and at Sison, Pangasinan.

POWER SUPPLY PROCUREMENT PLAN
ACTUAL
2017 2018 2019 2020 2021 2022 2023 2024 2025 2026 2027
Residential 128870 136694 145755 155814 166763 178515 191004 204179 218004 232455 247517
Commercial 4762 4811 4937 5073 5217 5367 5521 5678 5838 5999 6162
Industrial 100 105 113 121 130 138 147 156 165 174 183
Others 2577 2705 2835 2972 3116 3265 3418 3574 3734 3895 4058
Contestable
Customers
served by RES
1 2 2 2 2 2 2 2 2 2 2
Total (Captive
Customers)136309 144315 153639 163980 175226 187285 200090 213588 227741 242523 257919
The GN Power Mariveles Coal Plant (GMCP), Ltd. Supplies the baseload requirements of
LUELCO for 15 years which started on Dec. 26, 2012 and it will end Dec. 25, 2027.
LUELCO contracted a baseload of 27,000 kW with a monthly average of 6,527,250 kWh
equivalents. The remaining requirements both for kW Demand & Energy Demand will be
sourced from the Renewable Energy Sources, e.g Tubao Mini-Hydro Plant (1.2 MW) and
SurePep Biomass Plant (350 kW) and from Solar PV proponents (i.e. Solar Pacific, Sol-
Tierra, AirEnergy, etc.) and from the Spot Market (WESM). LUELCO contracted another
8,000 kW from AES, Phils. (MPPCL) for 15 years starting December 26, 2018. The
Number of Customers will have an average annual growth rate (AAGR) of 6.6% for the
next ten (10) years, 2018 - 2027.
Number of
Customer
FORECAST
2017 No. of Customers
Residential
Commercial
Industrial
Others

POWER SUPPLY PROCUREMENT PLAN
2008 2009 2010 2011 2012 2013 2014 2015 2016 2017
Energy Sales (MWh) 112242.54 121723.41 134181.55 135169.95 143050.28 153718.13 154886.55 165784.68 183161.31 198370.76
Energy Purchase (MWh) 130051.25 140286.92 153816.46 154088.27 163402 171027.74 175176.9 186123.64 207444.13 222514.13
System Loss (MWh) 17100.058 17732.552 19616.819 19031.575 19161.232 17309.387 20290.582 20338.824 24282.949 24143.779
2018 2019 2020 2021 2022 2023 2024 2025 2026 2027
Energy Sales (MWh) 214403.3 228917.1 244102.8 255561.5 267591.2 278947.6 289901.9 300199.6 310053.1 319330.5
Energy Purchase (MWh) 239770.7 255717 272254.9 284938 297819 309942.6 321398.9 332263.3 342599.5 352461.5
System Loss (MWh) 25367 26799 28152 29377 30228 30995 31497 32064 32547 33131
ENERGY SALES AND PURCHASE
ENERGY SALES AND
PURCHASE
HISTORICAL
ENERGY SALES AND
PURCHASE
FORECAST
2018 2019 2020 2021 2022 2023 2024 2025 2026 2027
FORECAST
En
erg
y,
MW
H
YEARS
Energy Purchase vs Energy Sales
Energy Sales (MWh) Energy Purchase (MWh) System Loss (MWh)

POWER SUPPLY PROCUREMENT PLAN
The Gn Power Mariveles Coal Plant (GMCP), Ltd. Supplies the baseload requirements of LUELCO for 15
years which started on Dec. 26, 2012 and it will end Dec. 25, 2027. LUELCO contracted a baseload of
27,000 kW with a monthly average of 6,527,250 kWh equivalent. The remaining requirements both for
kW Demand & Energy Demand will be sourced from the Renewable Energy Sources, e.g Tubao Mini-
Hydro Plant (1.2 MW) and Surepep Biomass Plant (350 kW) and from the Spot Market (WESM).
LUELCO contracted another 8,000 kW from AES, Phils. (MPPCL) for 15 years starting April 2019. The
kWh Sales and kWh Purchased will have an average annual growth rate (AAGR) of 4.9% and 4.3%,
respectively. The forecasting model used for the MWh Sales and Purchased is Y = at3 + bt
2 + c, it is a
Cubic Trend with 2 Variables.
POWER SUPPLY PROCUREMENT PLAN
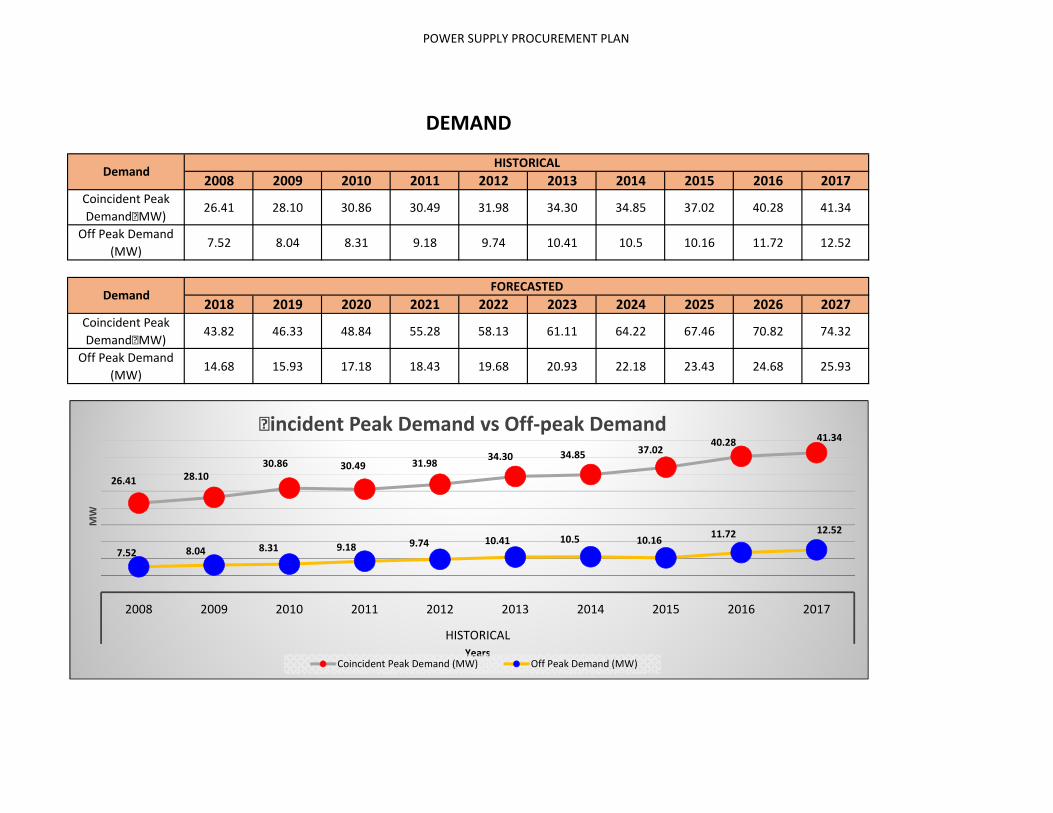
2008 2009 2010 2011 2012 2013 2014 2015 2016 2017
Coincident Peak
Demand (MW)26.41 28.10 30.86 30.49 31.98 34.30 34.85 37.02 40.28 41.34
Off Peak Demand
(MW)7.52 8.04 8.31 9.18 9.74 10.41 10.5 10.16 11.72 12.52
2018 2019 2020 2021 2022 2023 2024 2025 2026 2027
Coincident Peak
Demand (MW)43.82 46.33 48.84 55.28 58.13 61.11 64.22 67.46 70.82 74.32
Off Peak Demand
(MW)14.68 15.93 17.18 18.43 19.68 20.93 22.18 23.43 24.68 25.93
DEMAND
DemandHISTORICAL
DemandFORECASTED
26.41 28.10
30.86 30.49 31.9834.30 34.85 37.02
40.28 41.34
7.52 8.04 8.31 9.18 9.74 10.41 10.5 10.1611.72 12.52
2008 2009 2010 2011 2012 2013 2014 2015 2016 2017
HISTORICAL
MW
Years
Coincident Peak Demand vs Off-peak Demand
Coincident Peak Demand (MW) Off Peak Demand (MW)

POWER SUPPLY PROCUREMENT PLAN
The coincident peak demand for the year 2008 is 26.41 MW and in year 2017 is 41.34 MW which means
an increase of 14.93 MW in ten years with an Average Annual Growth Rate (AAGR) of 5.4%. The
forecasting model used for the Peak Demand for 2018 to 2027 is Y = alnt2 + blnt + ct
-1 + d, it is a
Quadratic & Logarithmic Trend with Smoothing & Horizon.

POWER SUPPLY PROCUREMENT PLAN
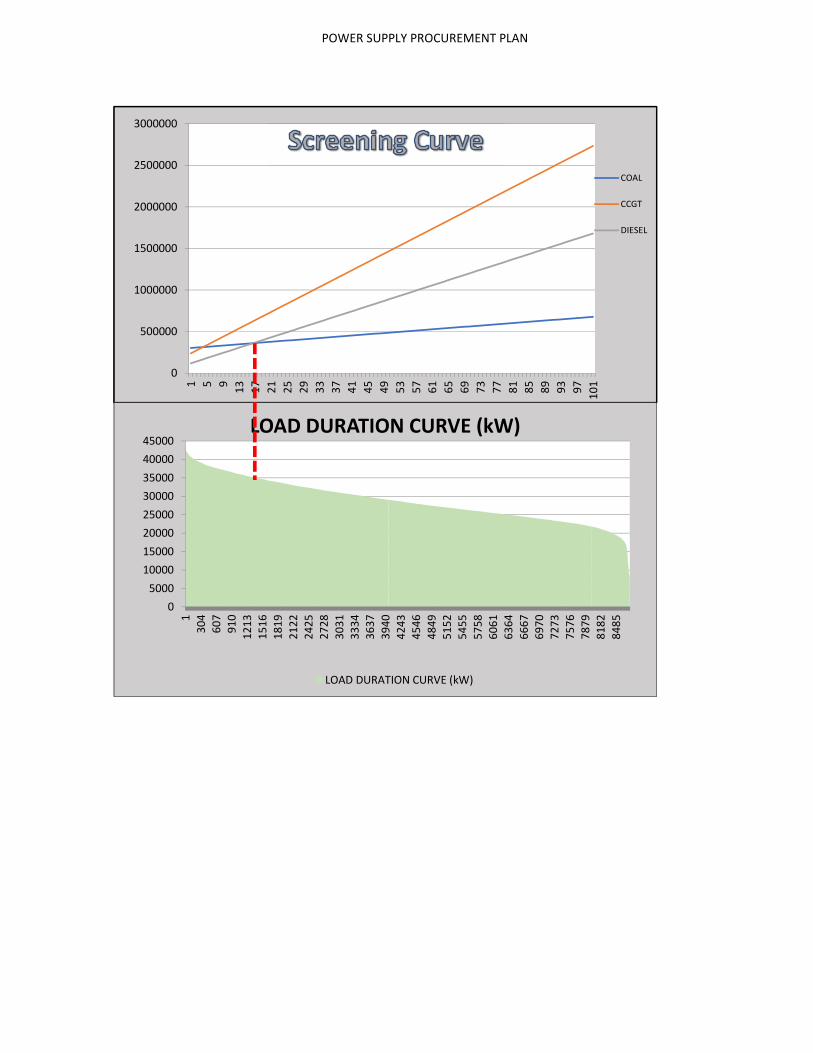
LOAD PROFILE AND LOAD DURATION CURVE
Based on the load duration curve the Base Load of LUELCO is 79.93% which is equal
to 35 MW and a Peaking of 20.07% equal to 8.79 MW. LUELCO also has an
uncontracted base capacity of 8 MW because of its contracted base capacity of 27
MW. The percent capacity factor is equal to 15.47% which is the intersection between
coal and diesel based on their annual levelized cost.
GRAPH PROVIDED HERE IS SAMPLE ONLY
0
5000
10000
15000
20000
25000
30000
35000
40000
45000
1
28
4
56
7
85
0
11
33
14
16
16
99
19
82
22
65
25
48
28
31
31
14
33
97
36
80
39
63
42
46
45
29
48
12
50
95
53
78
56
61
59
44
62
27
65
10
67
93
70
76
73
59
76
42
79
25
82
08
84
91
2017 Hourly Load Profile
Hourly kW
kW
0
5000
10000
15000
20000
25000
30000
35000
40000
45000
1
29
3
58
5
87
7
11
69
14
61
17
53
20
45
23
37
26
29
29
21
32
13
35
05
37
97
40
89
43
81
46
73
49
65
52
57
55
49
58
41
61
33
64
25
67
17
70
09
73
01
75
93
78
85
81
77
84
69
2017 LUELCO Load Curve (kW)
KW
POWER SUPPLY PROCUREMENT PLAN
0
500000
1000000
1500000
2000000
2500000
3000000
1 5 9
13
17
21
25
29
33
37
41
45
49
53
57
61
65
69
73
77
81
85
89
93
97
10
1
COAL
CCGT
DIESEL
0
5000
10000
15000
20000
25000
30000
35000
40000
45000
1
30
4
60
7
91
0
12
13
15
16
18
19
21
22
24
25
27
28
30
31
33
34
36
37
39
40
42
43
45
46
48
49
51
52
54
55
57
58
60
61
63
64
66
67
69
70
72
73
75
76
78
79
81
82
84
85
LOAD DURATION CURVE (kW)
LOAD DURATION CURVE (kW)

POWER SUPPLY PROCUREMENT PLAN
ACTUAL
2017 2018 2019 2020 2021 2022 2023 2024 2025 2026 2027
41.341 43.82406 46.33393 48.84496 55.277703 58.12812 61.10769 64.216902 67.45547 70.82395 74.32322
27 28 28 28.2 28.5 28.5 28.5 28.5 28.5 28.5 28.5
27 27 27 27 27 27 27 27 27 27 27
1 1 1.2 1.5 1.5 1.5 1.5 1.5 1.5 1.5
0 8.35 8.35 13.35 13.35 13.35 13.35 13.35 13.35 13.35 13.35
5 5 5 5 5 5 5 5
8 8 8 8 8 8 8 8 8 8
0.35 0.35 0.35 0.35 0.35 0.35 0.35 0.35 0.35 0.35
14.341 7.474063 9.98393 7.294963 13.427703 16.27812 19.25769 22.366902 25.60547 28.97395 32.47322
MIXSUPPLY VS DEMAND AND THE OPTIMAL SUPPLY
FORECASTSupply Demand
Peak Demand, MW
Supply Contracted, MW
SUREPEP
Uncontracted Demand, MW
GN Power Mariveles, Ltd.
TUBAO MINI-HYDRO (TMHEC)
Supply for PSA Approval, MW
GN Power Dinginin Ltd. Co.
AES, Phils. (MPPCL)
0
10
20
30
40
50
60
70
80
2017 2018 2019 2020 2021 2022 2023 2024 2025 2026 2027
ACTUAL FORECAST
MW
YEARS
Supply vs Demand
Supply Contracted, MW Supply for PSA Approval, MW Uncontracted Demand, MW Peak Demand, MW

POWER SUPPLY PROCUREMENT PLAN
List of Existing Contracts and Details
Supply
Contracte
d
Plant
Owner/
Operator
Capacity
Factor
PSA
Effectivity
(MM/YR)
PSA
Expiration
(MM/YR)
Contracted
Capacity,
MW
Contracted
Energy,
MWH
Base / Mid-
merit /
Peaking
Embedded/
Grid
Connected
Utility-
owned/
NPC/ IPP/
NPC-IPP
Status Fuel Type
Installed
Capacity
(MW)
Net
Dependable
Capacity
(MW)
GN
Mariveles
Coal
Power
Plant
(GMCP)
GNPower;
Ltd. Co.12/2012 12/2027 27 236520 Baseload
Grid
Connecte
d
IPP Running Coal 600
Tubao
Mini-
Hyrdo
Electric
Plant
TMHEC,
Inc.12/2016 12/2036 1.5 10512
Baseload /
Mid merit
Embedde
dIPP
On-going
Constructio
n
Mini
Hydro1.5
The demand for 2017 is equal to 41.34 MW with an uncontracted demand of 14.34 MW which is purchased from the
WESM or Spot Market. Then if the PSA of AES Phils. and SUREPEP will be approved with an equivalent demand of 8.35
MW, the supply contracted for LUELCO will be 36.35 MW for 2018 which will bring a deficit of 7.47 MW. By year 2020 an
additional 5 MW will be contracted with the GN Power Dinginin which will bring LUELCO's supply contract to 41.55 MW
with a deficiency of 7.29 MW as per forecasted demand. LUELCO will start to bid/look for an additional PSA under the
CSP because their will be a high defict or uncontracted demand for year 2021 to 2027.

POWER SUPPLY PROCUREMENT PLAN
All relevant data from the Distribution System Loss (DSL) – ERC template was modelled and then load
flow is prepared for each feeder. The load flow provided information such as percent conductor
loading to its capacity, calculated distribution losses, injected current to transformers, line currents,
voltage profile and voltage unbalances. Recommendation and project ideas were then made and
based on these results. Load flow analysis is conducted monthly per feeder on the base year and
conducted the analysis only on the peak month of the forecast year and then allocated the results
monthly based on the base year results.
The voltage variation in the distribution system should not exceed +10% of the nominal voltage or
equivalent to not less than 0.9 per unit and not more than 1.1 per unit of the nominal value.
For voltage unbalance, it should not exceed 2.5% during normal operation which is computed by
dividing the maximum deviation from the average of the three-phase voltages to the average of the
three phase voltages.
The Substation capacity loading criteria is compared based on the 100% of ONAN (Natural Oil and
Natural Air) rated capacity (MVA) of the power transformer to the forecasted demand (MW) at a
power factor of 90% - 98%.
Maximum Short circuit current is computed at fault impedance equivalent to zero and for minimum
short circuit current 30 ohms fault impedance is used. The bolted fault current or fault current at zero
impedance is used in determining the margin of safety of the equipment with its rated interrupting
capacity, a 10% or above margin if safety is acceptable and 10% below is considered unsafe. The
minimum fault current is used to compare the setting of the protective devices in the system. If the
minimum short circuit currents are below the settings of the upstream protective devices it is
considered unsafe.
For system reliability, the criteria is based on the Distribution Code with the System Average
Interruption Frequency Index (SAIFI) should not be more 20 hours-interruptions per customer per year
and the System Average Interruption Duration Index (SAIDI) should not exceed 45 hours-interruptions
per customer per year.
DISTRIBUTION IMPACT STUDY

POWER SUPPLY PROCUREMENT PLAN
Demand
(MW)
Energy
(MWh)
Start Month
and Year
End Month
and Year
Publication
of
Invitation
to Bid
Pre-bid
Conference
Submission
and
Opening of
Bids
Bid
EvaluationAwarding PSA Signing
Joint
Application
to ERC
SCHEDULE OF CSP
NO SCHEDULED CSP AS OF 2018
Base /
mid-
merit /
peaking
For CSP Proposed contract Proposed schedule (MM/YYYY)
Capaci
ty
Factor
POWER SUPPLY PROCUREMENT PLAN ANNEX A
Coincident
Peak
Demand
(MW)
Off Peak
Demand
(MW)
Energy
Requirement
(MWh)
Demand
(MW)
Energy
(MWh)
Uncontrac
ted
Demand
(MW)
Uncontract
ed Energy
(MWh)
Demand
(MW)
Energy
(MWh)
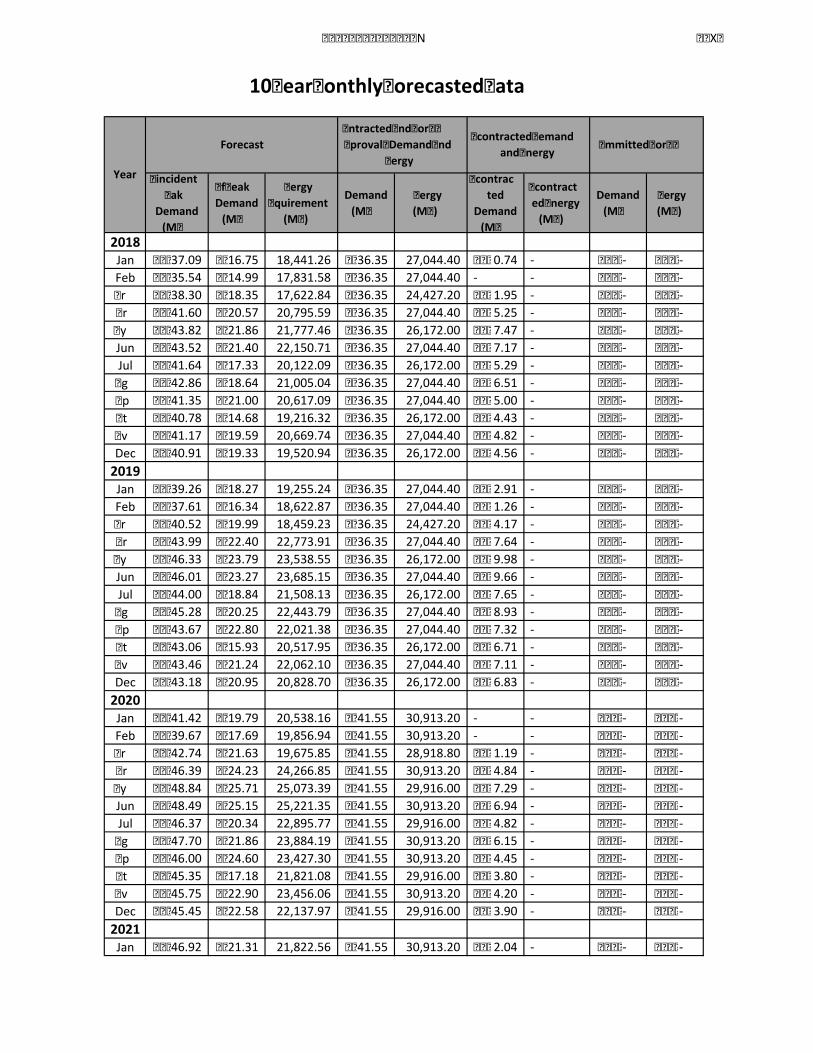
2018
Jan 37.09 16.75 18,441.26 36.35 27,044.40 0.74 - - -
Feb 35.54 14.99 17,831.58 36.35 27,044.40 - - - -
Mar 38.30 18.35 17,622.84 36.35 24,427.20 1.95 - - -
Apr 41.60 20.57 20,795.59 36.35 27,044.40 5.25 - - -
May 43.82 21.86 21,777.46 36.35 26,172.00 7.47 - - -
Jun 43.52 21.40 22,150.71 36.35 27,044.40 7.17 - - -
Jul 41.64 17.33 20,122.09 36.35 26,172.00 5.29 - - -
Aug 42.86 18.64 21,005.04 36.35 27,044.40 6.51 - - -
Sep 41.35 21.00 20,617.09 36.35 27,044.40 5.00 - - -
Oct 40.78 14.68 19,216.32 36.35 26,172.00 4.43 - - -
Nov 41.17 19.59 20,669.74 36.35 27,044.40 4.82 - - -
Dec 40.91 19.33 19,520.94 36.35 26,172.00 4.56 - - -
2019
Jan 39.26 18.27 19,255.24 36.35 27,044.40 2.91 - - -
Feb 37.61 16.34 18,622.87 36.35 27,044.40 1.26 - - -
Mar 40.52 19.99 18,459.23 36.35 24,427.20 4.17 - - -
Apr 43.99 22.40 22,773.91 36.35 27,044.40 7.64 - - -
May 46.33 23.79 23,538.55 36.35 26,172.00 9.98 - - -
Jun 46.01 23.27 23,685.15 36.35 27,044.40 9.66 - - -
Jul 44.00 18.84 21,508.13 36.35 26,172.00 7.65 - - -
Aug 45.28 20.25 22,443.79 36.35 27,044.40 8.93 - - -
Sep 43.67 22.80 22,021.38 36.35 27,044.40 7.32 - - -
Oct 43.06 15.93 20,517.95 36.35 26,172.00 6.71 - - -
Nov 43.46 21.24 22,062.10 36.35 27,044.40 7.11 - - -
Dec 43.18 20.95 20,828.70 36.35 26,172.00 6.83 - - -
2020
Jan 41.42 19.79 20,538.16 41.55 30,913.20 - - - -
Feb 39.67 17.69 19,856.94 41.55 30,913.20 - - - -
Mar 42.74 21.63 19,675.85 41.55 28,918.80 1.19 - - -
Apr 46.39 24.23 24,266.85 41.55 30,913.20 4.84 - - -
May 48.84 25.71 25,073.39 41.55 29,916.00 7.29 - - -
Jun 48.49 25.15 25,221.35 41.55 30,913.20 6.94 - - -
Jul 46.37 20.34 22,895.77 41.55 29,916.00 4.82 - - -
Aug 47.70 21.86 23,884.19 41.55 30,913.20 6.15 - - -
Sep 46.00 24.60 23,427.30 41.55 30,913.20 4.45 - - -
Oct 45.35 17.18 21,821.08 41.55 29,916.00 3.80 - - -
Nov 45.75 22.90 23,456.06 41.55 30,913.20 4.20 - - -
Dec 45.45 22.58 22,137.97 41.55 29,916.00 3.90 - - -
2021
Jan 46.92 21.31 21,822.56 41.55 30,913.20 2.04 - - -
10 Year Monthly Forecasted Data
Year
Forecast
Contracted and For PSA
Approval Demand and
Energy
Uncontracted Demand
and EnergyCommitted for CSP

POWER SUPPLY PROCUREMENT PLAN ANNEX A
Feb 44.93 19.04 21,092.42 41.55 30,913.20 0.19 - - -
Mar 48.38 23.28 20,893.87 41.55 27,921.60 3.40 - - -
Apr 52.51 26.06 25,761.51 41.55 30,913.20 7.23 - - -
May 55.28 27.64 26,609.99 41.55 29,916.00 9.81 - - -
Jun 54.86 27.02 26,759.32 41.55 30,913.20 9.42 - - -
Jul 52.45 21.85 24,285.01 41.55 29,916.00 7.18 - - -
Aug 53.95 23.47 25,326.25 41.55 30,913.20 8.58 - - -
Sep 52.01 26.40 24,834.83 41.55 30,913.20 6.77 - - -
Oct 51.27 18.43 23,125.71 41.55 29,916.00 6.08 - - -
Nov 51.71 24.55 24,851.62 41.55 30,913.20 6.49 - - -
Dec 51.36 24.20 23,448.74 41.55 29,916.00 6.16 - - -
2022
Jan 49.38 22.83 23,108.45 41.55 30,913.20 4.20 - - -
Feb 44.95 20.39 22,329.33 41.55 30,913.20 2.26 - - -
Mar 48.40 24.92 22,113.30 41.55 27,921.60 5.62 - - -
Apr 52.52 27.88 27,257.90 41.55 30,913.20 9.62 - - -
May 55.28 29.57 28,148.37 41.55 29,916.00 12.32 - - -
Jun 54.85 28.90 28,299.06 41.55 30,913.20 11.90 - - -
Jul 52.43 23.35 25,675.85 41.55 29,916.00 9.54 - - -
Aug 53.92 25.08 26,769.98 41.55 30,913.20 11.00 - - -
Sep 51.98 28.20 26,243.99 41.55 30,913.20 9.10 - - -
Oct 51.22 19.68 24,431.84 41.55 29,916.00 8.36 - - -
Nov 51.66 26.21 26,248.79 41.55 30,913.20 8.79 - - -
Dec 51.29 25.82 24,761.03 41.55 29,916.00 8.43 - - -
2023
Jan 51.94 24.35 24,395.81 41.55 30,913.20 6.37 - - -
Feb 49.72 21.74 23,567.66 41.55 30,913.20 4.32 - - -
Mar 53.53 26.56 23,334.12 41.55 27,921.60 7.83 - - -
Apr 58.06 29.71 28,756.00 41.55 30,913.20 12.02 - - -
May 61.11 31.50 29,688.51 41.55 29,916.00 14.83 - - -
Jun 60.63 30.77 29,840.57 41.55 30,913.20 14.38 - - -
Jul 57.94 24.86 27,068.28 41.55 29,916.00 11.91 - - -
Aug 59.58 26.69 28,215.36 41.55 30,913.20 13.42 - - -
Sep 57.42 30.00 27,654.76 41.55 30,913.20 11.42 - - -
Oct 56.57 20.93 25,739.47 41.55 29,916.00 10.64 - - -
Nov 57.05 27.86 27,647.57 41.55 30,913.20 11.08 - - -
Dec 56.63 27.44 26,074.82 41.55 29,916.00 10.70 - - -
2024
Jan 54.62 25.88 25,684.65 41.55 30,913.20 8.54 - - -
Feb 52.27 23.09 24,807.41 41.55 30,913.20 6.39 - - -
Mar 56.27 28.20 24,556.35 41.55 28,918.80 10.05 - - -
Apr 61.03 31.54 30,255.83 41.55 30,913.20 14.41 - - -
May 64.22 33.43 31,230.42 41.55 29,916.00 17.34 1,314.42 - -
Jun 63.70 32.64 31,383.86 41.55 30,913.20 16.86 470.66 - -
Jul 60.87 26.37 28,462.32 41.55 29,916.00 14.27 - - -
Aug 62.58 28.30 29,662.40 41.55 30,913.20 15.84 - - -
Sep 60.30 31.80 29,067.16 41.55 30,913.20 13.75 - - -
Oct 59.40 22.18 27,048.60 41.55 29,916.00 12.92 - - -
Nov 59.89 29.52 29,047.95 41.55 30,913.20 13.37 - - -
Dec 59.45 29.06 27,390.11 41.55 29,916.00 12.97 - - -
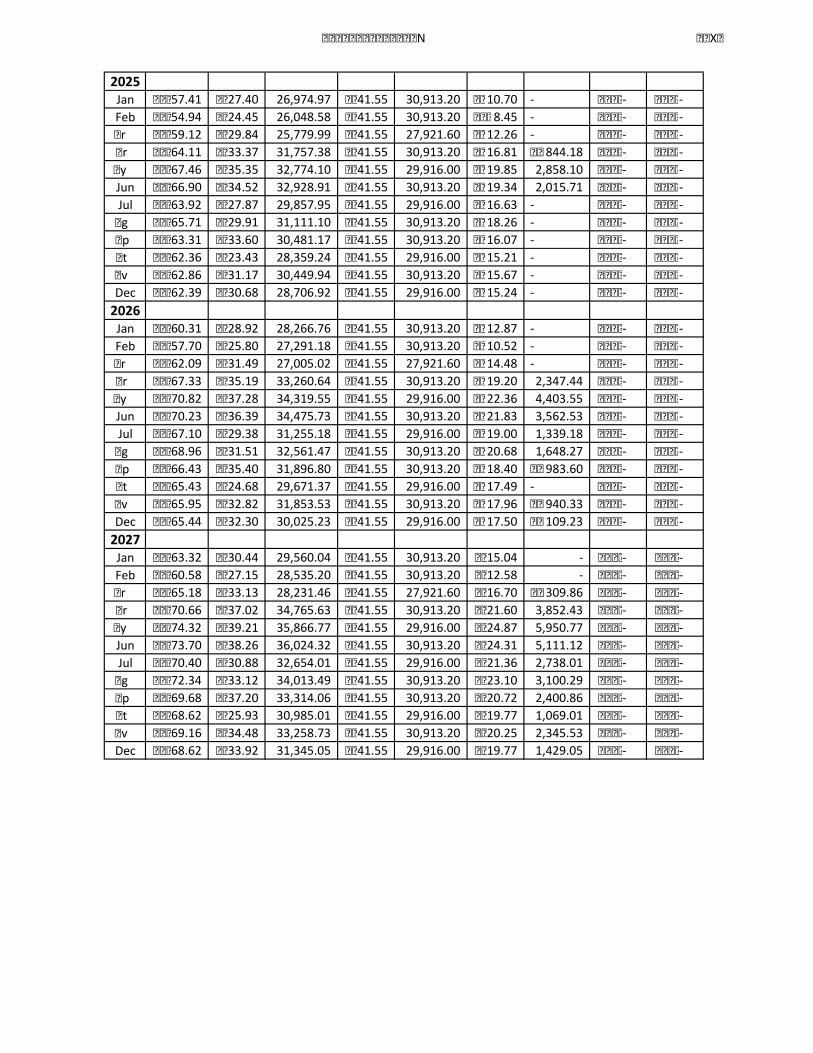
POWER SUPPLY PROCUREMENT PLAN ANNEX A
2025
Jan 57.41 27.40 26,974.97 41.55 30,913.20 10.70 - - -
Feb 54.94 24.45 26,048.58 41.55 30,913.20 8.45 - - -
Mar 59.12 29.84 25,779.99 41.55 27,921.60 12.26 - - -
Apr 64.11 33.37 31,757.38 41.55 30,913.20 16.81 844.18 - -
May 67.46 35.35 32,774.10 41.55 29,916.00 19.85 2,858.10 - -
Jun 66.90 34.52 32,928.91 41.55 30,913.20 19.34 2,015.71 - -
Jul 63.92 27.87 29,857.95 41.55 29,916.00 16.63 - - -
Aug 65.71 29.91 31,111.10 41.55 30,913.20 18.26 - - -
Sep 63.31 33.60 30,481.17 41.55 30,913.20 16.07 - - -
Oct 62.36 23.43 28,359.24 41.55 29,916.00 15.21 - - -
Nov 62.86 31.17 30,449.94 41.55 30,913.20 15.67 - - -
Dec 62.39 30.68 28,706.92 41.55 29,916.00 15.24 - - -
2026
Jan 60.31 28.92 28,266.76 41.55 30,913.20 12.87 - - -
Feb 57.70 25.80 27,291.18 41.55 30,913.20 10.52 - - -
Mar 62.09 31.49 27,005.02 41.55 27,921.60 14.48 - - -
Apr 67.33 35.19 33,260.64 41.55 30,913.20 19.20 2,347.44 - -
May 70.82 37.28 34,319.55 41.55 29,916.00 22.36 4,403.55 - -
Jun 70.23 36.39 34,475.73 41.55 30,913.20 21.83 3,562.53 - -
Jul 67.10 29.38 31,255.18 41.55 29,916.00 19.00 1,339.18 - -
Aug 68.96 31.51 32,561.47 41.55 30,913.20 20.68 1,648.27 - -
Sep 66.43 35.40 31,896.80 41.55 30,913.20 18.40 983.60 - -
Oct 65.43 24.68 29,671.37 41.55 29,916.00 17.49 - - -
Nov 65.95 32.82 31,853.53 41.55 30,913.20 17.96 940.33 - -
Dec 65.44 32.30 30,025.23 41.55 29,916.00 17.50 109.23 - -
2027
Jan 63.32 30.44 29,560.04 41.55 30,913.20 15.04 - - -
Feb 60.58 27.15 28,535.20 41.55 30,913.20 12.58 - - -
Mar 65.18 33.13 28,231.46 41.55 27,921.60 16.70 309.86 - -
Apr 70.66 37.02 34,765.63 41.55 30,913.20 21.60 3,852.43 - -
May 74.32 39.21 35,866.77 41.55 29,916.00 24.87 5,950.77 - -
Jun 73.70 38.26 36,024.32 41.55 30,913.20 24.31 5,111.12 - -
Jul 70.40 30.88 32,654.01 41.55 29,916.00 21.36 2,738.01 - -
Aug 72.34 33.12 34,013.49 41.55 30,913.20 23.10 3,100.29 - -
Sep 69.68 37.20 33,314.06 41.55 30,913.20 20.72 2,400.86 - -
Oct 68.62 25.93 30,985.01 41.55 29,916.00 19.77 1,069.01 - -
Nov 69.16 34.48 33,258.73 41.55 30,913.20 20.25 2,345.53 - -
Dec 68.62 33.92 31,345.05 41.55 29,916.00 19.77 1,429.05 - -

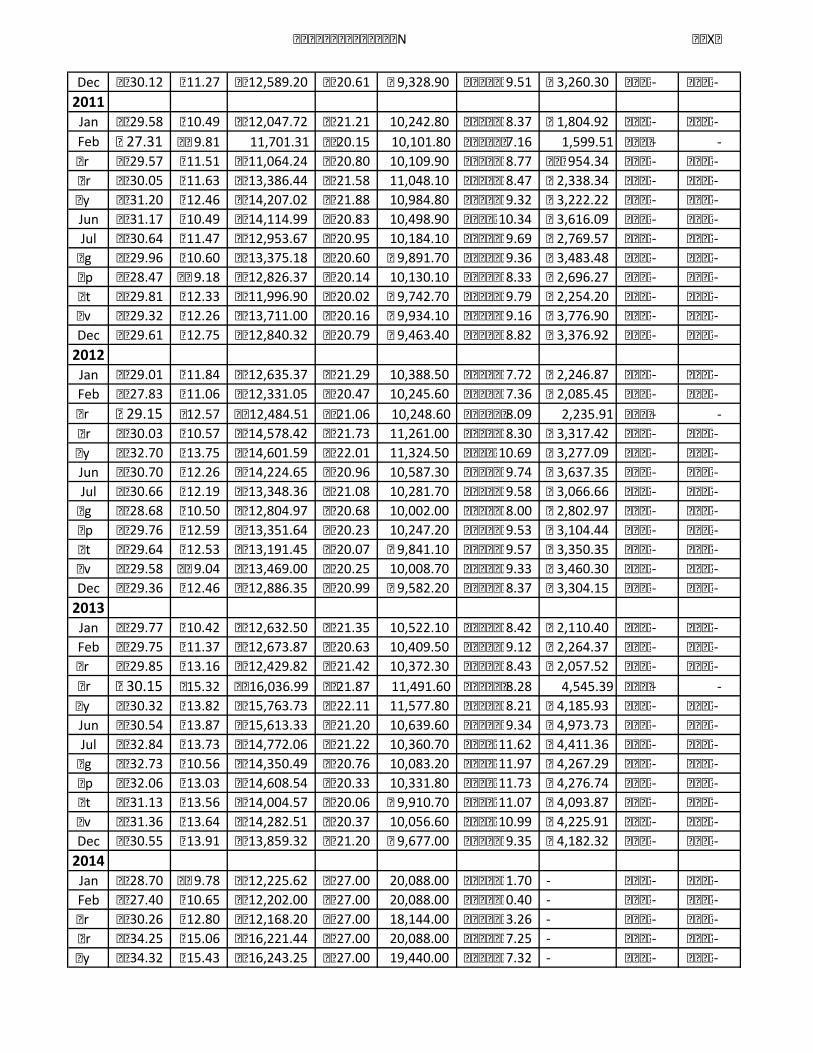
POWER SUPPLY PROCUREMENT PLAN ANNEX B
Coincident
Peak
Demand
(MW)
Off Peak
Demand
(MW)
Energy
Requirement
(MWh)
Demand
(MW)
Energy
(MWh)
Uncontracted
Demand (MW)
Uncontracted
Energy (MWh)
Demand
(MW)
Energy
(MWh)
2008
Jan 26.36 10,427.05
Feb 24.60 10,116.46
Mar 26.19 9,949.44
Apr 27.01 11,963.15
May 27.44 10,234.12
Jun 26.28 10,945.48
Jul 27.06 11,234.21
Aug 25.89 10,463.84
Sep 26.55 11,586.84
Oct 26.76 11,063.28
Nov 25.81 11,459.45
Dec 26.17 10,607.93
2009
Jan 26.70 10,241.80
Feb 25.38 11,028.68
Mar 26.75 11,070.99
Apr 28.91 12,786.57
May 28.97 11,587.22
Jun 28.29 12,448.71
Jul 28.84 12,422.80
Aug 28.88 12,671.38
Sep 28.76 12,792.36
Oct 27.95 10,264.48
Nov 28.10 12,037.37
Dec 27.86 10,934.55
2010
Jan 27.28 10.18 11,055.11 21.14 10,157.20 6.14 897.91 - -
Feb 26.12 11.50 11,648.17 19.76 9,995.20 6.36 1,652.97 - -
Mar 27.95 11.94 11,519.33 20.51 9,870.80 7.44 1,648.53 - -
Apr 30.67 12.24 13,909.39 21.44 10,886.50 9.23 3,022.89 - -
May 31.58 12.89 14,965.23 21.73 10,840.20 9.85 4,125.03 - -
Jun 31.57 12.56 14,487.05 20.72 10,386.50 10.85 4,100.55 - -
Jul 30.02 12.05 13,186.36 20.88 10,060.90 9.14 3,125.46 - -
Aug 28.95 12.03 13,185.93 20.55 9,809.70 8.40 3,376.23 - -
Sep 29.49 11.48 13,065.98 20.12 10,044.60 9.37 3,021.38 - -
Oct 30.30 10.02 12,116.17 20.02 9,672.40 10.28 2,443.77 - -
Nov 29.08 11.98 13,273.57 20.10 9,886.80 8.98 3,386.77 - -
UNDER NAPOCOR (NPC)
UNDER NAPOCOR (NPC)
UNDER NAPOCOR (NPC)
UNDER NAPOCOR (NPC)
UNDER NAPOCOR (NPC)
UNDER NAPOCOR (NPC)
UNDER NAPOCOR (NPC)
UNDER NAPOCOR (NPC)
UNDER NAPOCOR (NPC)
UNDER NAPOCOR (NPC)
UNDER NAPOCOR (NPC)
UNDER NAPOCOR (NPC)
UNDER NAPOCOR (NPC)
UNDER NAPOCOR (NPC)
UNDER NAPOCOR (NPC)
UNDER NAPOCOR (NPC)
UNDER NAPOCOR (NPC)
10 Year Monthly Historical Data
Year
Historical
Contracted and For PSA
Approval Demand and
Energy
Uncontracted Demand and
EnergyCommitted for CSP
UNDER NAPOCOR (NPC)
UNDER NAPOCOR (NPC)
UNDER NAPOCOR (NPC)
UNDER NAPOCOR (NPC)
UNDER NAPOCOR (NPC)
UNDER NAPOCOR (NPC)
UNDER NAPOCOR (NPC)
POWER SUPPLY PROCUREMENT PLAN ANNEX B
Dec 30.12 11.27 12,589.20 20.61 9,328.90 9.51 3,260.30 - -
2011
Jan 29.58 10.49 12,047.72 21.21 10,242.80 8.37 1,804.92 - -
Feb 27.31 9.81 11,701.31 20.15 10,101.80 7.16 1,599.51 - -
Mar 29.57 11.51 11,064.24 20.80 10,109.90 8.77 954.34 - -
Apr 30.05 11.63 13,386.44 21.58 11,048.10 8.47 2,338.34 - -
May 31.20 12.46 14,207.02 21.88 10,984.80 9.32 3,222.22 - -
Jun 31.17 10.49 14,114.99 20.83 10,498.90 10.34 3,616.09 - -
Jul 30.64 11.47 12,953.67 20.95 10,184.10 9.69 2,769.57 - -
Aug 29.96 10.60 13,375.18 20.60 9,891.70 9.36 3,483.48 - -
Sep 28.47 9.18 12,826.37 20.14 10,130.10 8.33 2,696.27 - -
Oct 29.81 12.33 11,996.90 20.02 9,742.70 9.79 2,254.20 - -
Nov 29.32 12.26 13,711.00 20.16 9,934.10 9.16 3,776.90 - -
Dec 29.61 12.75 12,840.32 20.79 9,463.40 8.82 3,376.92 - -
2012
Jan 29.01 11.84 12,635.37 21.29 10,388.50 7.72 2,246.87 - -
Feb 27.83 11.06 12,331.05 20.47 10,245.60 7.36 2,085.45 - -
Mar 29.15 12.57 12,484.51 21.06 10,248.60 8.09 2,235.91 - -
Apr 30.03 10.57 14,578.42 21.73 11,261.00 8.30 3,317.42 - -
May 32.70 13.75 14,601.59 22.01 11,324.50 10.69 3,277.09 - -
Jun 30.70 12.26 14,224.65 20.96 10,587.30 9.74 3,637.35 - -
Jul 30.66 12.19 13,348.36 21.08 10,281.70 9.58 3,066.66 - -
Aug 28.68 10.50 12,804.97 20.68 10,002.00 8.00 2,802.97 - -
Sep 29.76 12.59 13,351.64 20.23 10,247.20 9.53 3,104.44 - -
Oct 29.64 12.53 13,191.45 20.07 9,841.10 9.57 3,350.35 - -
Nov 29.58 9.04 13,469.00 20.25 10,008.70 9.33 3,460.30 - -
Dec 29.36 12.46 12,886.35 20.99 9,582.20 8.37 3,304.15 - -
2013
Jan 29.77 10.42 12,632.50 21.35 10,522.10 8.42 2,110.40 - -
Feb 29.75 11.37 12,673.87 20.63 10,409.50 9.12 2,264.37 - -
Mar 29.85 13.16 12,429.82 21.42 10,372.30 8.43 2,057.52 - -
Apr 30.15 15.32 16,036.99 21.87 11,491.60 8.28 4,545.39 - -
May 30.32 13.82 15,763.73 22.11 11,577.80 8.21 4,185.93 - -
Jun 30.54 13.87 15,613.33 21.20 10,639.60 9.34 4,973.73 - -
Jul 32.84 13.73 14,772.06 21.22 10,360.70 11.62 4,411.36 - -
Aug 32.73 10.56 14,350.49 20.76 10,083.20 11.97 4,267.29 - -
Sep 32.06 13.03 14,608.54 20.33 10,331.80 11.73 4,276.74 - -
Oct 31.13 13.56 14,004.57 20.06 9,910.70 11.07 4,093.87 - -
Nov 31.36 13.64 14,282.51 20.37 10,056.60 10.99 4,225.91 - -
Dec 30.55 13.91 13,859.32 21.20 9,677.00 9.35 4,182.32 - -
2014
Jan 28.70 9.78 12,225.62 27.00 20,088.00 1.70 - - -
Feb 27.40 10.65 12,202.00 27.00 20,088.00 0.40 - - -
Mar 30.26 12.80 12,168.20 27.00 18,144.00 3.26 - - -
Apr 34.25 15.06 16,221.44 27.00 20,088.00 7.25 - - -
May 34.32 15.43 16,243.25 27.00 19,440.00 7.32 - - -

POWER SUPPLY PROCUREMENT PLAN ANNEX B
Jun 35.56 13.77 16,098.04 27.00 20,088.00 8.56 - - -
Jul 34.27 15.43 15,206.40 27.00 19,440.00 7.27 - - -
Aug 33.08 14.50 15,342.21 27.00 20,088.00 6.08 - - -
Sep 33.38 10.39 14,553.04 27.00 20,088.00 6.38 - - -
Oct 32.23 13.06 15,211.23 27.00 19,440.00 5.23 - - -
Nov 32.67 14.66 15,404.92 27.00 20,088.00 5.67 - - -
Dec 31.09 13.43 14,300.57 27.00 19,440.00 4.09 - - -
2015
Jan 30.91 10.98 13,466.96 27.00 20,088.00 3.91 - - -
Feb 29.60 10.71 13,145.87 27.00 20,088.00 2.60 - - -
Mar 31.14 12.82 13,021.03 27.00 18,144.00 4.14 - - -
Apr 33.39 15.50 16,322.81 27.00 20,088.00 6.39 - - -
May 36.44 16.74 17,414.44 27.00 19,440.00 9.44 - - -
Jun 37.75 14.90 17,619.46 27.00 20,088.00 10.75 - - -
Jul 34.84 10.16 14,868.97 27.00 19,440.00 7.84 - - -
Aug 36.73 12.90 17,177.59 27.00 20,088.00 9.73 - - -
Sep 35.14 17.03 17,138.16 27.00 20,088.00 8.14 - - -
Oct 35.13 11.32 14,124.14 27.00 19,440.00 8.13 - - -
Nov 34.74 14.90 16,443.01 27.00 20,088.00 7.74 - - -
Dec 33.63 14.15 15,381.20 27.00 19,440.00 6.63 - - -
2016 -
Jan 32.74 14.43 15,423.24 27.00 20,880.00 5.74 - - -
Feb 31.77 13.72 15,014.84 27.00 20,088.00 4.77 - - -
Mar 34.89 14.87 15,258.37 27.00 18,792.00 7.89 - - -
Apr 38.50 16.39 18,737.83 27.00 20,088.00 11.50 - - -
May 40.28 18.71 19,662.28 27.00 19,440.00 13.28 222.28 - -
Jun 38.90 18.19 19,170.16 27.00 20,088.00 11.90 - - -
Jul 38.09 16.80 17,417.19 27.00 19,440.00 11.09 - - -
Aug 38.88 15.92 17,605.10 27.00 20,088.00 11.88 - - -
Sep 36.36 16.45 17,100.59 27.00 20,088.00 9.36 - - -
Oct 36.97 11.72 16,408.90 27.00 19,440.00 9.97 - - -
Nov 36.70 17.48 18,189.71 27.00 20,088.00 9.70 - - -
Dec 37.50 17.58 17,455.93 27.00 19,440.00 10.50 - - -
2017
Jan 36.59 15.53 17,253.07 27.00 20,088.00 9.59 - - -
Feb 34.80 12.52 16,286.21 27.00 20,088.00 7.80 - - -
Mar 37.55 17.38 15,881.07 27.00 18,144.00 10.55 - - -
Apr 40.56 18.89 19,651.61 27.00 20,088.00 13.56 - - -
May 41.19 18.76 19,780.61 27.00 19,440.00 14.19 340.61 - -
Jun 41.34 19.76 20,421.77 27.00 20,088.00 14.34 333.77 - -
Jul 40.06 15.72 19,128.63 27.00 19,440.00 13.06 - - -
Aug 40.71 17.33 19,576.49 27.00 20,088.00 13.71 - - -
Sep 40.71 18.91 19,614.35 27.00 20,088.00 13.71 - - -
Oct 38.87 13.54 18,201.66 27.00 19,440.00 11.87 - - -
Nov 38.63 16.63 18,817.21 27.00 20,088.00 11.63 - - -
Dec 38.51 16.62 17,901.46 27.00 19,440.00 11.51 - - -


