POWER SECTOR OPERATIONS AND IMPACT ON …html_en_files\fincom14/others... · POWER SECTOR...
584
POWER SECTOR OPERATIONS AND IMPACT ON STATE FINANCES VOLUME I : ALL INDIA SUMMARY OF KEY ASPECTS OF POWER SECTOR PREPARED FOR: THE FOURTEENTH FINANCE COMMISSION PREPARED BY: AF-MERCADOS ENERGY MARKETS INDIA PVT. LTD. (AF- MERCADOS EMI) August, 2014
Transcript of POWER SECTOR OPERATIONS AND IMPACT ON …html_en_files\fincom14/others... · POWER SECTOR...

POWER SECTOR OPERATIONS AND IMPACT ON STATE
FINANCES
VOLUME I : ALL INDIA SUMMARY OF KEY ASPECTS OF
POWER SECTOR
PREPARED FOR:
THE FOURTEENTH FINANCE COMMISSION
PREPARED BY:
AF-MERCADOS ENERGY MARKETS INDIA PVT. LTD. (AF-
MERCADOS EMI)
August, 2014

AF-MERCADOS EMI
POWER SECTOR OPERATIONS AND IMPACT ON STATE FINANCES 2
TABLE OF CONTENTS
I EXECUTIVE SUMMARY ............................................................................................. 7
II ASSIGNMENT CONTEXT ........................................................................................ 18
1. BACKGROUND ......................................................................................... 18
2. STRUCTURE OF THE REPORT ..................................................................... 20
III ASSESSMENT OF OPERATIONAL AND FINANCIAL PERFORMANCE OF THE POWER
SECTOR ............................................................................................................ 21
1. PERFORMANCE OF POWER UTILITIES IN THE CONTEXT OF A DECADE OF SECTOR
REFORMS ..................................................................................................... 21
2. DISTRIBUTION UTILITY PERFORMANCE ...................................................... 24
IV STATE EXPOSURE TO POWER SECTOR ................................................................... 47
1. STATE INCOME AND EXPENDITURE ON POWER SECTOR ................................ 47
1.1. EXPENDITURE ON POWER SECTOR ..................................................... 47
1.2. INCOME FROM POWER SECTOR .......................................................... 50
2. POWER SECTOR SUFFICIENCY ................................................................... 52
3. GUARANTEES TO THE POWER SECTOR ........................................................ 54
4. FINANCIAL BAGGAGE ............................................................................... 57
5. FINANCING REQUIREMENT ....................................................................... 58
V FINANCIAL RESTRUCTURING PLAN ......................................................................... 64
1. INTRODUCTION ....................................................................................... 64
2. TRANSITIONAL FINANCE MECHANISM AND MANDATORY CONDITIONS ........... 64
3. CURRENT STATUS OF FRP IN STATES.......................................................... 66
4. FRP OUTLOOK ......................................................................................... 68
VI ASSESSMENT OF REGULATORY EFFECTIVNESS ....................................................... 82
1. FINANCIAL INDEPENDENCE/AUTONOMY ..................................................... 82
2. STAFFING ............................................................................................... 87
3. ACCOUNTABILITY: PERFORMANCE MONITORING AND PUBLIC DISCLOSURES .. 90
4. FREQUENCY AND ADEQUACY OF TARIFF REVISIONS ..................................... 93
5. EFFECTIVE INFORMATION AVAILABILITY WITH THE REGULATORS TO ENABLE
DECISIONS ON PRICING .......................................................................... 99
6. RECOURSE TO CONSUMERS: CONSUMER PROTECTION ................................ 105
7. CONCLUSION ......................................................................................... 110
VII OPEN ACCESS .................................................................................................. 111
1. OPEN ACCESS AND ITS RATIONALE ........................................................... 111
2. LEGAL AND REGULATORY FRAMEWORK BEHIND OPEN ACCESS ..................... 111
3. STATE LEVEL OPEN ACCESS REGULATIONS ................................................ 113
4. IMPEDIMENTS TO OPEN ACCESS ............................................................... 115
5. RECENT POLICY THRUST IN GRANT OF OPEN ACCESS .................................. 117

AF-MERCADOS EMI
POWER SECTOR OPERATIONS AND IMPACT ON STATE FINANCES 3
VIII REVIEW OF APPROCHES ADOPTED FOR MEASURING AGRICULTURAL CONSUMPTION
........................................................................................................................... 120
IX REVIEW OF GOOD PRACTICES IN POWER DISTRIBUTION WITHIN THE COUNTRY ...... 125
X RECOMMENDATIONS FOR THE FOURTEENTH FINANCE COMMISSION ........................ 132
XI ANNEXURE – I ................................................................................................... 134

AF-MERCADOS EMI
POWER SECTOR OPERATIONS AND IMPACT ON STATE FINANCES 4
ABBREVIATIONS
ACS Average Cost of Supply
AER Australian Energy Regulator
AMI Advanced Metering Infrastructure
AMR Automatic Metering
APDRP Accelerated Power Development and Reform Program
APTEL Appellate Tribunal
ARR Average Revenue Realized
AT&C Aggregate Technical and Commercial losses
BSEB Bihar State Electricity Board
CAG Comptroller and Auditor General
CAGR Compound Annual Growth Rate
CAT Consumers Analysis Tool
CEA Central Electricity Authority
CERC Central Electricity Regulatory Commission
CGRF Consumer Grievance Redressal Forum
COAG Council of Australian Governments
CPDCL Central Power Distribution Company Limited
CPUC California Public Utilities Commissions
Discom Distribution Company
DTR Digital Transformer Ratio meter
EA 2003 Electricity Act 2003
EPDCL Eastern Power Distribution Company Limited
ERC Energy Regulatory Commission
FERC Federal Energy Regulatory Commission
FFC Fourteenth Finance Commission
FRP Financial Restructuring Plan
FSA Fuel Supply Agreement
GIS Geographic Information System
GOI Government of India
GSDP Gross State Domestic Product
HERC Haryana Electricity Regulatory Commission
HR Human Resource
IP Irrigation Pump

AF-MERCADOS EMI
POWER SECTOR OPERATIONS AND IMPACT ON STATE FINANCES 5
IT Information Technology
JSEB Jharkhand State Electricity Board
Kcal Kilocalorie
KPI Key Performance Indicators
KWh Kilowatt Hour
MERC Maharashtra Electricity Regulatory Commission
MoP Ministry of Power
MPSC Maryland Public Service Commissions
MRI Meter Reading Instrument
MSEDCL Maharashtra State Electricity Distribution Company
MU Million Units
MW Megawatts
MYT Multi Year Tariff
NEP National Electricity Policy
NPDCL Northern Power Distribution Company Limited
Ofgem Office of Gas and Electricity Markets
OMS Outage Management System
P&L A/c Profit and Loss Account
PAA Private Accounting Agencies
PLF Plant Load Factor
PPA Power Purchase Agreement
R-APDRP Restructured - Accelerated Power Development and Reform
Program
RGGVY Rajiv Gandhi Grameen Vidyutikaran Yojana
RIMS Regulatory Information Management System
SCER Standing Council on Energy and Resources
SEBs State Electricity Boards
SERC State Electricity Regulatory Commission
SHR Station Heat Rate
SLDC State Load Dispatch Centre
SoP Standard of Performance
SPDCL Southern Power Distribution Company Limited
STL Short Term Liabilities
STU State Transmission Company
T&D Transmission and Distribution

AF-MERCADOS EMI
POWER SECTOR OPERATIONS AND IMPACT ON STATE FINANCES 6
TANGEDCO Tamil Nadu Generation and Distribution Corporation Limited
TANTRANSCO Tamil Nadu Transmission Corporation Limited
TISM Transformer Information Management system
UI Unscheduled Interchange

AF-MERCADOS EMI
POWER SECTOR OPERATIONS AND IMPACT ON STATE FINANCES 7
I EXECUTIVE SUMMARY
INTRODUCTION
The power sector operations in India have undergone a dynamic change after the
enactment of the Electricity Act, 2003. With the enactment of the Electricity Act, the sector
has shifted from regulated business to competitive business. This is mostly true for
generation and increasingly for transmission. However, competition in the power
distribution segment is still not prevalent. Power distribution segment has been the weakest
link in the entire value chain. The distribution segment, has also long faced questions of
financial sustainability on account of below-cost tariffs to different consumer groups; supply
of un-metered, free electricity to agriculture; and high Aggregate Technical and Commercial
(AT&C) losses. These factors have weakened the finances of state utilities, lowering the
ability to attract private investment in the sector and resulting in heavy reliance upon
government support for both investment and working capital. The aggregate losses
(without accounting for subsidy) for all the utilities increased by from Rs. 64,463 Crore in
the year 2009-10 to Rs.74,291 Crore in 2010-11 and to Rs. 92,845 Crore in 2011-12.
The State governments being the sole owners of an overwhelming majority of the
distribution utilities, the impact of the utility finance directly and indirectly
devolves on the respective states. From the perspective of the Fourteenth Finance
Commission (FFC), it was essential to evaluate the impact of all these factors in aggregate
on the State Finances and in disaggregate form to understand the root causes of weak
performance. It was also important to identify the areas of concern on the future operations
of the distribution utilities and the sector as a whole, and the potential implications of the
same on state finances. This is particularly relevant in the context of the Financial
Restructuring Plan (FRP) supported by GoI that is currently underway. Default by the
utilities on the FRP measures and targets would effectively devolve on the respective state
governments.
OBJECTIVE
With the above in view, the objective of this study was to review and assess the power
sector operations and its impact on state finances.
ALL-INDIA FINANCIAL PERFORMANCE OF DISTRIBUTION
COMPANIES IN INDIA
The figure below presents the trend of Average Cost of Supply (ACS), Average Revenue
Realized (ARR), and Gap on a per-unit basis at an All-India level.

AF-MERCADOS EMI
POWER SECTOR OPERATIONS AND IMPACT ON STATE FINANCES 8
Figure I-1: Financial Gap at All India level
Source: PFC report on utility finances 2007-08 to 2011-12
It can be observed that the Financial Gap has consistently increased over the last few
years primarily due to the increase in ACS without commensurate increase in tariff. Even
on subsidy received basis, the financial gap in 2011-12 reduces from Rs.1.12/KWh to Rs.
0.76/kWh.
The Financial gap can be segregated into two parts: one related to inadequate tariff
increases and other related to inefficiencies on part of the distribution utilities i.e. collection
inefficiency and technical losses.
Assuming 15% transmission and distribution losses as unavoidable, difference between
ACS (with 15% T&D losses) and ARR (with collection efficiency of 100%) reflects the tariff
inadequacies in the states.
It can be observed that inefficiencies accounts for 52.5% of the total financial gap on all
India basis. Gap reduces by Rs. 0.59/kWh if one considers improvement in efficiencies. The
financial gap reduces from Rs.1.12/kWh to Rs.0.54/kWh after improvement of efficiencies
with gap of Rs. 0.54/kWh due to inadequate increase in tariff. The following table presents
the breakup of ACS-ARR Gap as a result of inefficiency and tariff inadequacy for 2011-12.
Table I-1: Break-up of ACS-ARR Gap per unit at all India Level – 2011-12
Units ARR ACS Gap
Actuals Rs./kWh 3.54 4.66 1.12
With efficiency Improvement (ARR-100% Collection efficiency; ACS- 10% T&D losses) Rs./kWh 3.95 4.49 0.54
Source: PFC and AF-Mercados EMI Analysis
In light of the above, the Ministry of Power (MoP) requested the Appellate Tribunal to take
appropriate action by issuing necessary directions to all the State Commissions to revise
the tariff periodically, if required by suo moto action, in the interest of improving the long
term viability of the electricity sector in general and distribution utilities in particular. The
Appellate Tribunal for Energy Judgement on OP1 of 2011 played a significant role in driving
SERC’s to undertake periodic tariff revisions thereby enabling financial discipline in the
AF-MERCADOS EMI
POWER SECTOR OPERATIONS AND IMPACT ON STATE FINANCES 9
sector. In line with the directions of the APTEL, more than 20 states revised their tariffs in
2012-13 and 2013-14.
STATE-LEVEL FINANCIAL PERFORMANCE
This section presents state-level financial performance of the distribution sector for all the
states. The Financial Gap per unit for all states (without subsidy) in 2011-12 is shown in
the figure below.
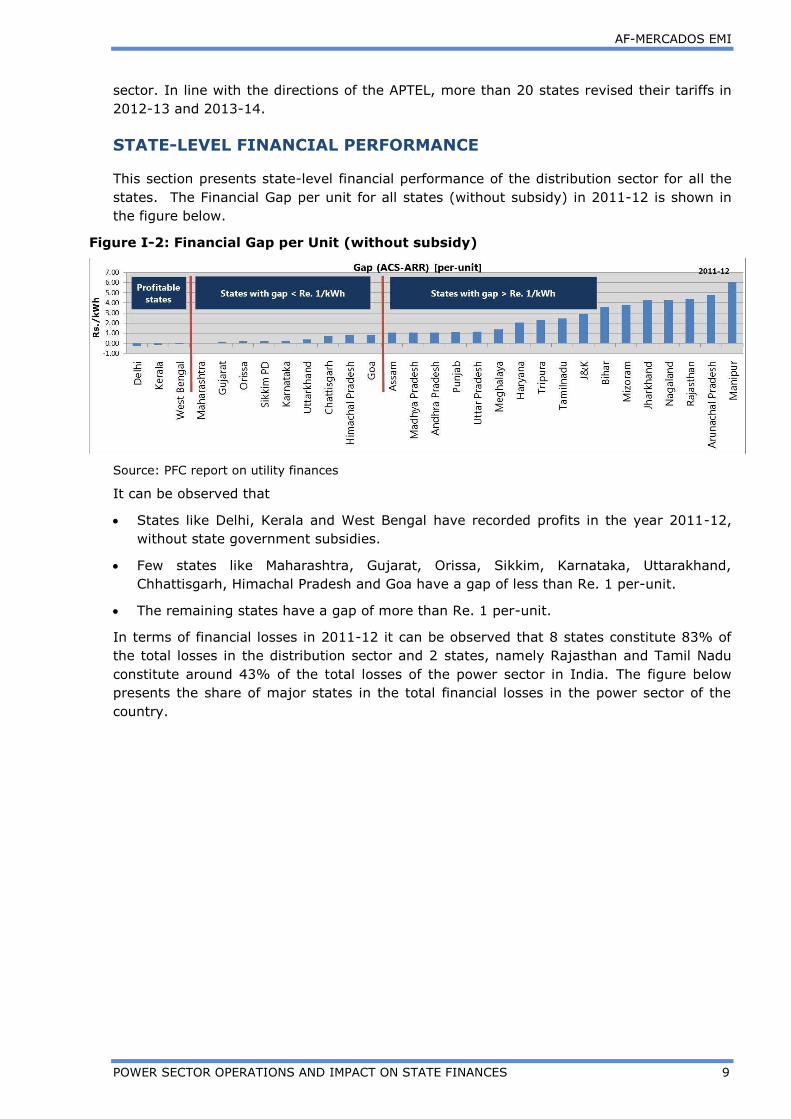
Figure I-2: Financial Gap per Unit (without subsidy)
Source: PFC report on utility finances
It can be observed that
States like Delhi, Kerala and West Bengal have recorded profits in the year 2011-12,
without state government subsidies.
Few states like Maharashtra, Gujarat, Orissa, Sikkim, Karnataka, Uttarakhand,
Chhattisgarh, Himachal Pradesh and Goa have a gap of less than Re. 1 per-unit.
The remaining states have a gap of more than Re. 1 per-unit.
In terms of financial losses in 2011-12 it can be observed that 8 states constitute 83% of
the total losses in the distribution sector and 2 states, namely Rajasthan and Tamil Nadu
constitute around 43% of the total losses of the power sector in India. The figure below
presents the share of major states in the total financial losses in the power sector of the
country.

AF-MERCADOS EMI
POWER SECTOR OPERATIONS AND IMPACT ON STATE FINANCES 10
Figure I-3: Share in the total financial losses without subsidy in 2011-12
Source: PFC report on utility finances, 2011-12
In order to understand the constituents of financial gap in 2011-12, gap related to
inadequate tariff increases and gap related to inefficiencies on part of the distribution
utilities have been segregated. The figure below presents the Financial Gap in 2011-12 with
efficiency improvements.
Figure I-4: ACS-ARR Gap with efficiency improvement per unit – 2011-12
Source: PFC and AF-Mercados EMI Analysis
Following can be observed from the above:
In 2011-12, a large number of states would turn profitable by improving efficiency. For
example, in large power consuming states such as Uttar Pradesh and Madhya Pradesh,
the entire Gap can be removed by efficiency improvement.
The states which are already profitable can optimize their operations and further
improve their financial position. For example, in West Bengal, the level of available
efficiency improvement is close to Re. 1 per unit.
In actual scenario, only three states, namely, Delhi, Kerala and West Bengal have
recorded profit without subsidies in 2011-12. While in efficiency improvement scenario,
this number would increase to 14 states.
In other states, it can be observed that even after improving efficiency levels to the
extent possible, financial gap would remain reflecting the inadequacies in tariff levels in
those states.
Total Loss: Rs. 88,053 crs.

AF-MERCADOS EMI
POWER SECTOR OPERATIONS AND IMPACT ON STATE FINANCES 11
The figure below presents the break-up of financial gap into the inefficiency gap and tariff
inadequacy gap.
Figure I-5: Break-up of Financial Gap per unit into the inefficiency gap and tariff
inadequacy gap – 2011-12
Source: PFC and AF-Mercados EMI Analysis
Following can be observed from the above:
In few states such as Bihar, J&K, Assam, Tripura and Jharkhand, apart from tariff
inadequacy, a large part of the gap is a result of inefficiency. For example, Bihar can
reduce its financial gap by close to Rs 3 per-unit through efficiency improvement.
However, the remaining gap of around Re 1 per-unit need to be eliminated through
tariff hikes.
In other states like Rajasthan, Haryana, Andhra Pradesh, Mizoram and Manipur, more
than inefficiency, tariff revisions have been inadequate and constitute a large part of the
gap.
ROOT-CAUSE ANALYSIS FOR POOR PERFORMANCE OF STATE
DISCOMS
The key root-causes for the poor performance of the state Discoms are as follows:
Lack of efficiency improvement: In 2011-12, AT&C losses at an All-India level were
around 27%. The figure below presents that average (5 year) AT&C losses for different
states. As observed in the figure below, states with high unmetered agricultural
consumption, including Andhra Pradesh, Tamil Nadu, and Punjab have low AT&C losses.
On the other hand, states with a low agricultural share in total consumption have high
ATC losses.

AF-MERCADOS EMI
POWER SECTOR OPERATIONS AND IMPACT ON STATE FINANCES 12
0%
10%
20%
30%
40%
50%
60%
70%
80%
Go
a
HP
AP
Kera
la
Tam
iln
adu
Pu
nja
b
Gu
jrat
Delh
i
Karn
ata
ka
Mah
ara
shtr
a
West
Ben
gal
Raja
sth
an
Hary
an
a
Tri
pu
ra
Ch
att
isg
arh
Utt
ark
han
d
Miz
ora
m
Ass
am UP
MP
Jhark
han
d
Ori
ssa
Man
ipur
Meg
hala
ya
Nag
ala
nd
Bih
ar
Sik
kim
PD
Aru
nach
al …
J&K
Perc
en
tag
e5 year Average AT&C Losses
State Average All-India Average
10 States with
AT&C< 27%
9 States with
AT&C 27%-40%
10 States with
AT&C>40%
Figure I-6: State-level AT&C Losses – 5 year Average
Source: PFC report on utility finances – 2007-08 to 2011-12
Bihar, Jharkhand, Uttar Pradesh, Rajasthan, J&K, and north-eastern states have high
AT&C losses due to power thefts. Also, big power consuming states such as Uttar
Pradesh, Rajasthan, Madhya Pradesh etc. have AT&C losses higher than the All India
average.
Further, it can be observed the AT&C losses in few states have been continuously high,
despite high level of annual capital expenditures. For example, the cumulative capital
expenditure from 2008-09 till 2011-12 of Discoms in Uttar Pradesh and Rajasthan was
Rs. 7361 Cr. and Rs. 10117 Cr. respectively. Yet, the level of AT&C losses has been
more or less constant during the same period. Similarly, cumulative capital expenditure
of Bihar (BSEB) utilities was Rs.3456 Cr. with AT&C losses averaging around 45%
during the same period. Increase in capital expenditure has not led to a corresponding
reduction in AT&C losses highlighting infructuous capital investments and resultant
financial gap.
Metering levels: Even after 10 years of the enactment of the Electricity Act 100%
metering in most of the states is still not achieved. Only few of the states such as
Assam, Himachal Pradesh, Kerala, Orissa, Delhi, Goa, Tripura, Uttarakhand have been
able to achieve almost 100% metering. None of the states have been able to meter
100% of the agricultural consumers in the country. Agricultural states such as Punjab
and Tamil Nadu are completely unmetered.
Inadequate and infrequent tariff hikes: The cost of power purchase has increased
over the years but the tariff increase has not been commensurate with the increase in
cost of supply. Most of the states which have a positive financial gap have not increased
tariffs for several years. Further, states such as Andhra Pradesh, Tamil Nadu, Rajasthan
and Haryana where the tariffs were not revised for 7, 7, 6 and 8 years respectively.
Lack of Power Purchase Optimization by states: Since power purchase costs
constitute around 75-80% of the total cost of distribution utilities, escalating power
procurement rates is a matter of serious concern for the utilities. Either the load
forecasting (demand and supply) capabilities are inefficient or they do not exist at all in
most of the states. In some cases, this has led to an over-reliance on the spot market
which has increased the costs. Without superior optimization practices on part of the
utilities, identification of shortages and surpluses has been difficult for the utilities.
Hence, there is need for states to invest in forecasting capabilities.
As highlighted earlier, Energy Judgement on OP1 of 2011 by APTEL has been a
landmark judgement with over 20 states revised tariffs in 2012-13 and 2013-

AF-MERCADOS EMI
POWER SECTOR OPERATIONS AND IMPACT ON STATE FINANCES 13
14. Significant tariff hikes have been undertaken in the last few years in states
such as Tamil Nadu, Rajasthan, Bihar, Haryana etc.
Table I-2: Tariff hikes in different states in last few years
States 2011-12 2012-13 2013-14
Goa 0% 10% 2%
Kerala 0% 28% 2%
Maharashtra 3% 18% 0%
Orissa 20% 36% 9%
Karnataka 7% 3% 0%
Uttarakhand 6% 6% 0%
Andhra Pradesh 24% - 29%
Madhya Pradesh 6% 7% 1%
Punjab 9% 12% 9%
Uttar Pradesh - 9% 16%
Haryana 0% 19% 13%
Tamil Nadu 9% 37% 4%
Bihar 21% 11% 6%
Rajasthan 24% 19% 14%
Also, tariff hikes have been across consumer categories including agriculture. Majority of
the states have revised tariffs for the agriculture category, reflecting the need to improve
realization from agriculture.
In 2011-12, Tamil Nadu increased tariff for agriculture from Rs.250/HP/annum to
Rs.2500/HP/annum
In 2013-14, Rajasthan increased agriculture tariffs (general category) from Rs
2.25/kWh to Rs 3.93/kWh. Also, tariffs for unmetered agri. consumers were hiked
by an even higher percentage, in order to incentivize shift to metered category
In Andhra Pradesh, tariffs for agriculture have been hiked in the last 2 years
Significant tariff hikes in the last few years now provides limited opportunity
for further tariff revisions unless coupled with efficiency improvements. As
discussed earlier, it is important to improve efficiency and optimize costs of
the utilities. Cost reflective tariffs can only be achieved if costs are optimum
going forward.
FINANCIAL RESTRUCTURING PLAN
To ensure improved financial performance, while simultaneously providing incentives to
improve efficiency, GoI approved the Financial Restructuring Plan in order to restructure Rs.
1.9 lakh Crore debt of Discoms. The plan is now under implementation in seven of the
poorly performing states namely Andhra Pradesh, Tamil Nadu, Rajasthan, Haryana, Bihar,
Jharkhand and Uttar Pradesh. The re-schedulement of loans is to be accompanied by
measurable actions to improve the operational performance of the distribution utilities. It
focuses on tariff rate revisions, supplemented with earning through reduced losses.
With schemes in the FRP such as capital incentives for 50% short term liability (STL) to be
taken over by state government by issuance of special securities to lenders, along with

AF-MERCADOS EMI
POWER SECTOR OPERATIONS AND IMPACT ON STATE FINANCES 14
other finance mechanisms, the liquidity position of Discoms is expected to witness an
immediate improvement. However, the restructuring plan is a short term measure of
improving the financial health of utilities and hence, it would be difficult to ascertain if this
would also lead to a structural change in the financial health of Discoms in a sustainable
manner over the coming years. As a result, efficiency becomes the key point of importance
for long term sustenance which would largely depend upon the commitment of utilities and
regulators to the performance linked measures. The short-term, which in turn will benefit
other participants in the power supply value chain. Also, several critical parameters under
the FRP are stated to be ‘under-progress’ in most of the states availing the scheme. To
achieve long term financial viability of Discoms, achieving respective targets for these
parameters becomes very critical. If these key parameters are neglected, the very goals of
the scheme will be at risk. For example, privatization initiatives are very tepid at this time.
For most participant states, the road-map for implementation is either being finalized or
being discussed with the state government. Two of the states, Uttar Pradesh (in Agra and
Noida) and Jharkhand (Ranchi and Jamshedpur) have started the process.
STATE EXPOSURE TO POWER SECTOR
Even today, State Governments are the sole owners of a majority of the distribution
utilities, and as such, the impact of utility finance directly or indirectly devolves on the
respective states.
In 2001, to clear outstanding overdues of state electricity boards to the central public
sector undertakings (CPSUs), Power Bonds aggregating Rs 31,581 Cr. were issued by the
state governments to clear dues of CPSU’s. As of 2011-12, Power Bonds aggregating to Rs.
11540 Cr. were outstanding. Existing Power Bonds will be redeemed completely by 2016-
17. However, the overall repayment pressure for the states participating in FRP is expected
to be aggravated from 2018-19.
As per the FRP, the state governments will take over a total of approx. Rs. 60,000 Cr.
(50% of Discoms’ STL) in 2-5 years. The governments will redeem these from 2018-19
onwards in annual instalments in next 10 years.
The all India expenditure on power sector, including capital and revenue expenditure for
the year 2011-12 has been Rs 64,437 Cr. The following graph represents the state wise
expenditure on power sector for 2011-12.
Figure I-7: State Expenditure on Power Sector 2011-12
Source: State Government annual accounts from CAG 2011-12
0%
4%
8%
12%
16%
0
2,000
4,000
6,000
8,000
10,000
J n
K
Hary
an
a
Pu
nja
b
Raja
sth
an
Aru
nach
al
Miz
ora
m
Karn
ata
ka
Man
ipur
Nag
ala
nd
Tam
il N
ad
u
Gu
jara
t
Utt
ar Pra
desh
Mah
ara
shtr
a
Mad
hya P
rad
esh
Ch
hatt
isg
arh
An
dh
ra P
rad
esh
Bih
ar
Jhark
han
d
Sik
kim
Meg
hala
ya
Him
ach
al Pra
desh
Tri
pu
ra
Assam
Ori
ssa
West B
en
gal
Utt
ara
kh
an
d
Kera
la
Po
wer
Secto
r co
ntr
ibu
tio
n i
n S
tate
Exp
en
dit
ure
(%
)
Exp
en
dit
ure
(R
s C
r)
Expenditure on Power sector – 2011-12
Revenue Expenditure Capital Expenditure Power Sector Expenditure/ Total Expenditure (%)

AF-MERCADOS EMI
POWER SECTOR OPERATIONS AND IMPACT ON STATE FINANCES 15
It can be observed that:
Around 78% of the total expenditure on power sector in 2011-12 is towards 9
states, namely Uttar Pradesh, Maharashtra, Karnataka, Tamil Nadu, Rajasthan,
Haryana, Jammu and Kashmir, Gujarat and Andhra Pradesh
The power sector expenditure as a percentage of total state expenditure has been highest
for states like J&K and Haryana with 15% and 12% respectively and lowest for Uttarakhand
and Kerala with 0.08% and 0.15% respectively.
The respective government also generates revenue from power sector through tax in form
of state electricity duty and non-tax sources like dividends, share of free power etc. The
following figure presents the revenue from power sector for 2011-12:
Figure I-8: State Revenue from Power Sector 2011-12
Source: State Government annual accounts from CAG 2011-12
It can be observed that:
Tax Revenue (Power Sector) is the highest in Gujarat and Maharashtra. The major
source of Non – Tax Revenue is free Hydropower sale, Rural Electrification etc. In
Himachal Pradesh and Maharashtra, ~100% of the Non- Tax Revenue from Power
Sector came from Hydel-Generation.
The states which make a net contribution from the power sector, i.e., states in
which revenue generation from power sector is higher than the revenue expenditure
are Maharashtra, Madhya Pradesh, Gujarat, Chhattisgarh, West Bengal, Himachal
Pradesh, Orissa and Uttarakhand.
The states with lowest revenue generating ability calling for external assistance are
Uttar Pradesh, Tamil Nadu, Rajasthan, Bihar, Haryana and Andhra Pradesh. In these
states, the amount of expenditure far exceeds the revenue.
STATE GOVERNMENT GUARANTEES TO THE POWER SECTOR
In 2011-12, the guarantee provided to the utilities was highest in Rajasthan. The guarantee
provided to the utilities relative to revenue receipts of the states was the highest in
Rajasthan followed by Meghalaya and Punjab. In majority of states, the guarantee
provision to the state utilities was relatively low, both in quantum and as a percentage of
revenue, as presented below.

AF-MERCADOS EMI
POWER SECTOR OPERATIONS AND IMPACT ON STATE FINANCES 16
Figure I-9: Guarantees to Power Sector 2011-12
Source: State Government annual accounts from CAG (2011-12)
GOVERNANCE
Apart from the need to make efficiency improvements by state utilities, Regulatory
Governance also has a very important role in achieving efficiency in service delivery and
overall financial sustenance of the distribution segment. The effectiveness of regulatory
practices can be observed on following parameters.
- Financial Independence – Many of the SERCs are still dependent upon the state
governments for meeting their expenditures. Most states governments have not
established SERC funds, limiting the financial autonomy of regulators.
- Staffing – Inadequacy in technical staff and vacant positions has led to weak
institutional memory and internal capabilities
- Performance Monitoring and Public Disclosure – There is a need to strengthen
the accountability framework. Performance monitoring is an important aspect in this
regard. Although performance monitoring is undertaken for different state utilities
but no such mechanism exists for the SERC’s.
- Frequency and adequacy of tariff revisions - Limited tariff hikes were observed
during 2005-2011 while the revenue gap significantly increased. In line with the
directions of the APTEL in OP1 of 2011, more than 20 states revised their tariffs in
2012-13 and 2013-14. In principle, tariffs should reflect the cost of supply and thus
it is important that studies related to cost of supply for different consumer
categories to be undertaken by SERC’s. In addition to studies related to cost of
supply it is equally important that optimum cost should be determined by the
SERC’s as consumers should not be made liable to pay for the inefficiency of the
power utilities. As discussed earlier, it can be observed that in most of the states if
efficiency of Discoms is improved, there would be minimal requirement for tariff
increase. Study of aspects related to distribution impact of tariff on various
consumer categories also needs to be carefully understood while undertaking tariff
revisions.
0%
20%
40%
60%
80%
100%
120%
140%
0
10000
20000
30000
40000
50000
60000
Shar
e in
Sta
te r
eve
nu
e (
%0
Gu
aran
tess
(R
s C
r)Guarantees to Power Sector 2011-12
Guarantees Guarantees to the Sector/ Total Revenue Receipts(%)
AF-MERCADOS EMI
POWER SECTOR OPERATIONS AND IMPACT ON STATE FINANCES 17
- Consumer Protection - Public participation in the regulatory process (discussion
papers/ public hearings) has been limited. Bulk of the consumers especially rural
and domestic consumers are not even aware of such options. Even after 10 years of
the Electricity Act 2003, Quality of supply has not much improved and is not
adequately monitored by the utilities. To ensure good quality of supply to
consumers, it is important that quality of supply being linked with tariffs and tariffs
be revised in accordance with the improvement in quality.
Lack of proper governance and accountability has also been acknowledged in the High Level
Panel report on “financial position of Distribution Utilities – 2011”, chaired by Shri V.K.
Shunglu.
As for the utilities, most of them comply with the basic requirements of the Companies Act.
However, there is a definite need to follow certain corporate governance requirements,
some of which may not necessarily apply to the utilities. Following good practices pertaining
to Board composition, Board functioning, Audit Committee, Government-board relationship
and disclosure, etc. has shown to directly correlate with better financial performance over
the long run. Currently, only a few utilities are following these good practices.
RECOMMENDATIONS
The following are the key recommendations for improving power sector operations and
state finances.
Structural
- Unbundling of utilities should not be deferred any further. Unbundling of the
distribution segment further into wires and retail business is equally important.
- Rural Franchisees should be promoted to ensure payment security/better
management in rural areas
- Distribution franchising in high load – high loss areas
- Encouragement of Open Access
- Independent reporting of Discoms to Regulators
Regulatory
- Optimum cost reflective tariffs to bridge the Revenue Gap.
- Estimation of agricultural consumption and real loss reduction
- Improved information measurement/monitoring systems such as forecasting tools,
procurement planning/portfolio optimization, reliability of power supply, etc.
System/Process
- Business Process Re-engineering to improve efficiency and bring best practices
(material procurement, inventory management, energy accounting, etc.)
- Power purchase cost optimization through better load forecasting, managing
generation from own sources, banking arrangements, etc.
- Improved customer focus through better service levels and IT linked tracking and
redressal mechanism
- Initiation of metering at different levels of the power system for proper performance
measurement on various parameters
Human Resource
- Strengthening the role of HR function in power utilities and regulatory bodies
- Introduction of Power Management Systems to improve productivity at all levels
- Regular and targeted recruitments
- Capacity and skill development of staff of utilities

AF-MERCADOS EMI
POWER SECTOR OPERATIONS AND IMPACT ON STATE FINANCES 18
II ASSIGNMENT CONTEXT
1. BACKGROUND
The power sector is a prime mover and an effective engine of economic growth. It has also
been a significant and persistent source of concern for the policy makers on account of the
large scale inefficiencies and financial losses. The sector - and particularly the distribution
segment that is the greatest source of concern - is dominated by state owned enterprises.
Thus the respective governments ultimately bear the responsibility and the consequences
of such performance.
India’s power sector dynamics has significantly changed over a decade, after the enactment
of the Electricity Act, 2003. On several aspects, the sector from being regulated regime has
shifted towards competitive regime. This is true for generation and increasingly for
transmission. Further establishment of power markets have led to transparent operations
and price signals. Simultaneously, efforts have been made at institutional reforms in the
sector. Utility unbundling has been mandated in the Electricity Act, 2003 along with
independent regulation of licensees and generating companies selling to licensees.
Competition has been promoted through legislative and policy interventions. Competitive
power markets have been evolving at a fast pace, signalling new capacity additions by
developers.
Given the existing and projected power shortages and the importance of power to the
country’s growth agenda, significant new investment is required in all segments of the
sector. While the sector has witnessed a few success stories in the last 8-10 years, there
are various challenges that needs to be addressed which result from the gaps that exist
between what is planned versus what the power sector has been able to deliver.
The sector, and particularly the distribution segment, has also long faced
questions of financial sustainability on account of below-cost tariffs to different
consumer groups; supply of un-metered, free electricity to agriculture; and high
Aggregate Technical and Commercial (AT&C) losses. These factors have
weakened the finances of state utilities, lowering the ability to attract private
investment in the sector and resulting in heavy reliance upon government support
for both investment and working capital.
The aggregate losses (without accounting for subsidy) for all the utilities increased by from
Rs. 64,463 Crs. in the year 2009-10 to Rs.74,291 Crs. in 2010-11and to Rs. 92,845 Crs in
2011-12.
AF-MERCADOS EMI
POWER SECTOR OPERATIONS AND IMPACT ON STATE FINANCES 19
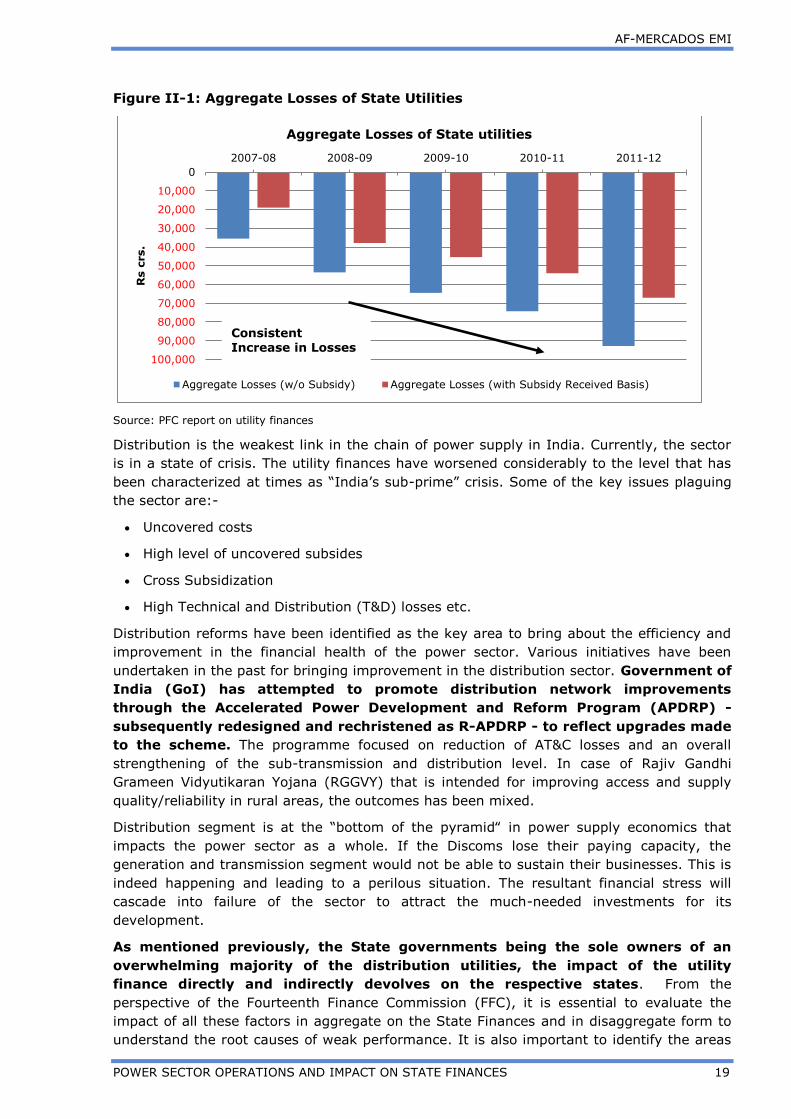
Figure II-1: Aggregate Losses of State Utilities
Source: PFC report on utility finances
Distribution is the weakest link in the chain of power supply in India. Currently, the sector
is in a state of crisis. The utility finances have worsened considerably to the level that has
been characterized at times as “India’s sub-prime” crisis. Some of the key issues plaguing
the sector are:-
Uncovered costs
High level of uncovered subsides
Cross Subsidization
High Technical and Distribution (T&D) losses etc.
Distribution reforms have been identified as the key area to bring about the efficiency and
improvement in the financial health of the power sector. Various initiatives have been
undertaken in the past for bringing improvement in the distribution sector. Government of
India (GoI) has attempted to promote distribution network improvements
through the Accelerated Power Development and Reform Program (APDRP) -
subsequently redesigned and rechristened as R-APDRP - to reflect upgrades made
to the scheme. The programme focused on reduction of AT&C losses and an overall
strengthening of the sub-transmission and distribution level. In case of Rajiv Gandhi
Grameen Vidyutikaran Yojana (RGGVY) that is intended for improving access and supply
quality/reliability in rural areas, the outcomes has been mixed.
Distribution segment is at the “bottom of the pyramid‟ in power supply economics that
impacts the power sector as a whole. If the Discoms lose their paying capacity, the
generation and transmission segment would not be able to sustain their businesses. This is
indeed happening and leading to a perilous situation. The resultant financial stress will
cascade into failure of the sector to attract the much-needed investments for its
development.
As mentioned previously, the State governments being the sole owners of an
overwhelming majority of the distribution utilities, the impact of the utility
finance directly and indirectly devolves on the respective states. From the
perspective of the Fourteenth Finance Commission (FFC), it is essential to evaluate the
impact of all these factors in aggregate on the State Finances and in disaggregate form to
understand the root causes of weak performance. It is also important to identify the areas
100,000
90,000
80,000
70,000
60,000
50,000
40,000
30,000
20,000
10,000
0
2007-08 2008-09 2009-10 2010-11 2011-12
Rs c
rs.
Aggregate Losses of State utilities
Aggregate Losses (w/o Subsidy) Aggregate Losses (with Subsidy Received Basis)
Consistent Increase in Losses

AF-MERCADOS EMI
POWER SECTOR OPERATIONS AND IMPACT ON STATE FINANCES 20
of concern on the future operations of the utilities and the sector as a whole, and the
potential implications of the same on state finances. This is particularly relevant in the
context of the Financial Restructuring Plan (FRP) supported by GoI that is currently
underway. Default by the utilities on the FRP measures and targets would effectively
devolve on the respective state governments. The report specifically focuses on these
aspects.
2. STRUCTURE OF THE REPORT
In view of the overall objectives of the assignment, the main purpose of this report is to
present a detailed analysis on the performance of states across various key parameters
pertaining to power companies and also the respective state governments.
The report has been divided into two volumes.
Volume I provides the All-India summary of the key aspects of power sector in India;
Volume II presents the state-wise details of the utility operations and finances.
The Scope of Work has been covered across chapters in Volume I as follows1.
Chapter II outlines the performance of the distribution business in India over the last five
years, along with the primary reasons behind the performance
Chapter III focuses on the state government’s exposure to the power sector.
Chapter IV presents the details of the recent Financial Restructuring Plan introduced by
the GoI. This chapter also presents FRP outlook for different states’ distribution utilities.
Chapter V provides the analysis of the regulatory effectiveness of state regulators in the
country
Chapter VI presents open access details and state-wise status of the same
Chapter VII presents the different approaches adopted by states to measure agricultural
consumption
Chapter VIII focuses on the best practices in the distribution sector in India
Chapter IX lists out recommendations for consideration of the Fourteenth Finance
Commission.
1 The terms of reference for the assignment along with the coverage of the report have been provided
in Annexure I

AF-MERCADOS EMI
POWER SECTOR OPERATIONS AND IMPACT ON STATE FINANCES 21
III ASSESSMENT OF OPERATIONAL AND FINANCIAL PERFORMANCE OF THE POWER SECTOR
1. PERFORMANCE OF POWER UTILITIES IN THE CONTEXT OF A
DECADE OF SECTOR REFORMS
Utility performance analysis over the past decade presents a mixed bag of results.
Generation capacity in the country has been strong in the past decade, largely driven by
the Electricity Act 2003 that significantly improved investor perception on the investment
climate in the business. While the Act made generation a de-licensed activity, the
introduction of competitive bidding framework made the criterion of selection of projects
more transparent and efficient. Even in regulated projects (i.e., those whose tariffs are
determined by regulation and not through competitive bidding) the operational norms for
thermal based power plants have improved over the years. CERC has been consistently
tightening the operational norms in the generation sector. The tables below present some
of the key operational norms including SHR, Auxiliary Consumption, and PLF for different
control periods.
Table III-1: Operational Norms for Coal Based Power Plants
Source: CERC regulations for different control periods
Operational Norms for Coal Based Power Plants
Tariff Policy
Normative SHR
(Kcal/kWh)
Existing Plants
Normative
SHR
(Kcal/kWh)
Future Plants
Auxiliary
Consumption Normative PLF
2004-09 2500 to 2450 NA 7% to 8.5% 80%
2009-14 2500 to 2425
1.065 X
Design Heat
Rate,
6% to 8.5% 85%
2014-19 2450 to 2375
1.045 X
Design Heat
Rate,
5.25% to 8.5% 85%

AF-MERCADOS EMI
POWER SECTOR OPERATIONS AND IMPACT ON STATE FINANCES 22
Table III-2: Operational Norms – Gas Plants
Operational Norms for Gas Based Power Plants
Tariff Policy
Normative SHR
(Kcal/kWh) Open
Cycle
Normative
SHR
(Kcal/kWh)
Combined
Cycle
Auxiliary
Consumption Normative PLF
2004-09 2685 -2830 1850-1950 3% to 1% 80%
2009-14 Plant Specific 1.05 X Design
Heat Rate, 3% to 1% 85%
2014-19 Plant Specific 1.05 X Design
Heat Rate, 2.5% to 1% 85%
Source: CERC regulations for different control periods
Further, there have been significant increases in the share of private sector in power
generation in the country. The private sector installed capacity has increased from 17112
MW in 2007 to 82715 MW as of 2014. As a result of these changes over the years, the
deficits between demand and supply have fallen significantly in recent periods2, as is shown
in the chart below.
Figure III-1: Energy Gap and Demand Gap (Jan’ 12 to Sept ’13)
Source: CEA
While the transmission segment of the sector continues to be largely under the public
sector monopoly structure, several developments have resulted in increased investments
and better efficiencies in this segment. GoI guidelines for tariff-based competitive bidding
for transmission services have encouraged private investments. The rapid increase in inter-
regional capacity has caused a change in the nature of inter-state transmission system
2 The lowering of the gap has also been significantly aided by the low demand growth in the past few years due to
a combination of reduced economic growth and also the price signaling by the power markets that has aided more efficient consumption.

AF-MERCADOS EMI
POWER SECTOR OPERATIONS AND IMPACT ON STATE FINANCES 23
(ISTS) in a short span of time. The integrated national system is expected to harness
natural resources optimally, evolve deep competitive markets, and also to add robustness
to the power system. In addition, the Electricity Act has provided for better monitoring,
scheduling, and dispatch of power in the form of Load Dispatch Centres, besides setting up
standards for grid operation in the form of the Grid Code. These have been followed up by
regulations by CERC where more efficient development and pricing mechanisms for
transmission have been instituted. However the momentum has not carried over to state
level policies and regulations on transmission and in particular the inconsistencies in open
access to state level networks remain a serious concern
The Distribution segment of the electricity sector remains the only segment that is yet to
see radical improvements in efficiency. Despite several efforts, it is still mired in problems
and the overall performance of this segment remains inadequate. While the network losses
have reduced in the past decade, they remain much above acceptable norms.
Figure III-2: Category-wise Sales and Total Losses
Source: PFC report
The level of access has also improved, but remains inadequate. Most importantly, supply
quality remains very erratic and inconsistent across the state owned distribution
companies, and no state owned distribution utility attempts to meet the service standards
and the obligations cast on them to serve load.
Table III-3: Access Levels
Category Access Levels
Urban HH 93%
Rural HH 55%
Average 67%
Source: Statistical Handbook, GoI, 2014
As discussed above, it can be observed that the generation and transmission segments
have become more competitive and efficient; it is the distribution sector which needs to be
improved. This has negated most of the structural and market reforms in the country, and
has seriously brought into question the efficacy of the present framework of ownership and

AF-MERCADOS EMI
POWER SECTOR OPERATIONS AND IMPACT ON STATE FINANCES 24
operations in the distribution sector. Therefore, this report attempts to look at this segment
in detail, both on the operational and financial fronts.
2. DISTRIBUTION UTILITY PERFORMANCE
The distribution sector continues to be characterised with poor financial and operating
efficiencies primarily due to unmetered supply to consumers, high T&D/AT&C losses, free
electricity to agriculture consumers, inadequate tariff hikes and low realization of subsidies
from state government. These factors have resulted in deteriorating the financial
performance of state utilities and reduced their ability to attract private investment attract
private investment. This has resulted in heavy reliance upon government support for both
investment and working capital requirements.
This section first presents the overall assessment of key performance parameters of
distribution utilities in India and then presents an overall state wise break-up of the key
performance parameters along with reasons for such performance.
i. All-India Financial Performance of Distribution Companies in India
In order to assess the financial performance of the country, the figure below presents the
trend of ACS, ARR, and revenue Gap on a per-unit basis at an All-India level.
Figure III-3: Financial Gap at All India level*
Source: PFC report on utility finances 2007-08 to 2011-12
* ACS – Average Cost of Supply, ARR – Average Revenue Realized
The steep increase in ACS over the last few years has been primarily due to increase in
power purchase costs, which form close to 80% of the total cost of Discoms. Power
purchase costs increased by over 16% in 2008-09, the year in which international coal
prices went up significantly, and thereafter have remained high as compared to the price
levels of 2007-08 (Refer to the figure below).

AF-MERCADOS EMI
POWER SECTOR OPERATIONS AND IMPACT ON STATE FINANCES 25
Figure III-4: International Coal Prices
Source: Coal spot.com
On the revenue front, the tariff increase has not been commensurate with the increase in
ACS. While the ARR has been increasing in the last 2 years (FY10 and FY11), the tariffs
were not revised in many of the states for number of years. The lack of cost coverage has
forced the Discoms to borrow heavily from banks and FIs, which has increased their
interest burden over the years.
Thus, Financial Gap has consistently increased over the last few years and has reached
unsustainable levels at present. As of 2011-12, over one rupee is lost on every unit of
power purchased and sold by the distribution companies in India. In absolute terms, the
aggregate losses (without accounting for subsidy) in 2011-12 were Rs. 88,053 Crs.
The total subsidy booked by distribution companies in 2011-12 was Rs. 30,242 Crs.
However, not this entire subsidy is actually received by the Discoms. As a result, the book
losses underestimate the actual loss levels and do not provide a clear picture of the
financial health of Discoms. The table below shows the impact of subsidies (booked and
received) on the aggregate losses of Discoms.
Table III-4: Aggregate losses of all utilities
(In Rs. Cr) 2009-10 2010-11 2011-12
Aggregate Book losses (subsidy booked basis) 28,548 49,235 57,811
Aggregate losses (subsidy received basis) 43,488 51,606 62,221
Aggregate losses (w/o subsidy) 62,563 71,901 88,053
Source: PFC report on utility finances
After including the subsidy received by utilities in their total revenue, the financial gap goes
down by over 25 paise per unit in each of the years under review. (Refer figure below)
Rise in demand of imported coal from
Asian economies led to increase in spot price from $50 /Mt in 2006 to $190/MT in 2009

AF-MERCADOS EMI
POWER SECTOR OPERATIONS AND IMPACT ON STATE FINANCES 26
Figure III-5: Financial Gap at All India level
Source: PFC report on utility finances
Even after including the actual cash subsidies received, the graph indicates that the All-
India financial gap is considerable. In 2011-12, the financial gap was Rs. 0.76/kWh.
As highlighted before, inadequate tariff hikes was one of the factors behind the continuous
increase in revenue gap over the years. In light of the deteriorating financial health of
utilities, the Ministry of Power (MoP) requested the Appellate Tribunal to take appropriate
action by issuing necessary directions to all the State Commissions to revise the tariff
periodically, if required by suo moto action, in the interest of improving the long term
viability of the electricity sector in general and distribution utilities in particular. The
Appellate Tribunal for Energy Judgement on OP1 of 2011 played a significant role in driving
SERC’s to undertake periodic tariff revisions thereby enabling financial discipline in the
sector. In line with the directions of the APTEL, more than 20 states revised their tariffs in
2012-13 and 2013-14.
The summary of Appellate Tribunal for Energy Judgement on OP1 of 2011 is given in Box
below:
Box III-1: Summary of Appellate Tribunal for Energy Judgement on OP1 of 2011
The full bench of the Tribunal, after necessary proceedings directed State Commissions
that:
1. Every State Commission has to ensure that Annual Performance Review, true-up of
past expenses and Annual Revenue Requirement and tariff determination is conducted
year to year basis as per the time schedule specified in the Regulations.
2. It should be the endeavor of every State Commission to ensure that the tariff for the
financial year is decided before 1st April of the tariff year.
3. In the event of delay in filing of the ARR, truing-up and Annual Performance Review,
one month beyond the scheduled date of submission of the petition, the State
Commission must initiate suo-moto proceedings for tariff determination in accordance
with Section 64 of the Act read with clause 8.1 (7) of the Tariff Policy.
4. In determination of ARR/tariff, the revenue gaps ought not to be left and Regulatory
Asset should not be created as a matter of course except where it is justifiable, in
accordance with the Tariff Policy and the Regulations. The recovery of the Regulatory
Asset should be time bound and within a period not exceeding three years at the most

AF-MERCADOS EMI
POWER SECTOR OPERATIONS AND IMPACT ON STATE FINANCES 27
and preferably within Control Period. Carrying cost of the Regulatory Asset should be
allowed to the utilities in the ARR of the year in which the Regulatory Assets are
created to avoid problem of cash flow to the distribution licensee.
5. Truing up should be carried out regularly and preferably every year. For example,
truing up for the financial year 2009-10 should be carried out along with the ARR and
tariff determination for the financial year 2011-12.
6. Fuel and Power Purchase cost is a major expense of the distribution company which
is uncontrollable. Every State Commission must have in place a mechanism for Fuel
and Power Purchase cost in terms of Section 62 (4) of the Act. Any State Commission
which does not already have such formula/mechanism in place must within 6 months
of the date of this order must put in place such formula/ mechanism.
The Tribunal directed all the State Commissions to follow these directions scrupulously,
and send the periodical reports by 1st June of the relevant financial year about the
compliance of these directions to the Secretary, Forum of Regulators, who in turn will send
the status report to this Tribunal and also place it on its website.
ii. State-level Financial Performance
This section presents state-level financial performance of the distribution sector for all the
states.
a. Financial Performance till 2011-12
The figure below presents the 5-year average (ACS-ARR) gap percentage (without subsidy)
for all the Discoms. The performance of different Discoms can be categorized into three
groups.
i. States having financial gap less than 15%
ii. States having financial gap in the range of 15-40%
iii. States having financial gap greater than 40%
Figure III-6: Financial Gap Percentage (without subsidy basis) – 5 year Average3
3 Trend analysis for each state is provided in the individual state reports.

AF-MERCADOS EMI
POWER SECTOR OPERATIONS AND IMPACT ON STATE FINANCES 28
Source: PFC report on utility finances – 2007-08 to 2011-12
It can be observed that 14 states have an average Financial Gap below 15%. This includes
big power consuming states such as Maharashtra and Gujarat. Also, four states i.e. Goa,
Delhi, West Bengal, Kerala have a negative gap implying profits for the utility. States such
as Andhra Pradesh, Tamil Nadu, Uttar Pradesh etc. lie in the second category. This is the
most significant category as most of the big power consuming states are part of this
category. States such as Jharkhand, Bihar, Rajasthan, J&K, and some of the north-eastern
states are part of the third group.
The figure below presents the share of major states in the total financial losses in the
power sector of the country. It can be observed that 8 states constitute 83% of the total
losses in the distribution sector and 2 states, namely Rajasthan and Tamil Nadu constitute
around 43% of the total losses of the power sector in India.
Figure III-7: Share in the total financial losses without subsidy in 2011-12
Source: PFC report on utility finances, 2011-12
As mentioned earlier, subsidies have a significant impact on the revenue and the financial
gap. A large number of state owned distribution utilities in India are partly dependent on
annual subsidies from the respective state governments. The figure below presents the
quantum of subsidies booked and their share in total revenues in 2011-12 for all the states
in the country.
Total Loss: Rs. 88,053 crs.

AF-MERCADOS EMI
POWER SECTOR OPERATIONS AND IMPACT ON STATE FINANCES 29
Figure III-8: State-level Subsidy Booked in 2011-12
Source: PFC report on utility finances, 2011-12
It can be observed that the financially well performing states with a Gap<15% have zero or
low level of subsidies i.e. Kerala, West Bengal, Maharashtra, Gujarat etc. Loss making
states such as Andhra Pradesh, Uttar Pradesh, Rajasthan, and Tamil Nadu are heavily
dependent on state-level subsidies. In terms of subsidies booked as a percentage of
revenue, it can be observed that the subsidies account for over 40% of the total revenue in
the state of Bihar. In Punjab and Haryana, subsidies as a percentage of revenue are 25%
and 22% respectively.
The figure below presents that around 90% of the total subsidies were booked in 8 states in
2011-12.
Figure III-9: Share in Total Subsidy Booked in 2011-12
Source: PFC report on utility finances
It can be observed that Andhra Pradesh accounts for over one-fourth of the total subsidies
followed by Punjab, Uttar Pradesh, and Haryana.
Total Subsidy: Rs. 30,242 crs.

AF-MERCADOS EMI
POWER SECTOR OPERATIONS AND IMPACT ON STATE FINANCES 30
After considering the booked subsidies by the state Discoms, financial gap for certain
utilities decreases significantly. The performance of the utilities in the 3 categories is now
as follows.
i. States with Financial Gap <15% - It can be observed that 18 states now have an
average Financial Gap below 15%. On subsidy booked basis, Andhra Pradesh has
zero losses and Chhattisgarh has become profitable. Haryana and Punjab both move
from the second category to the first, when subsidies are included.
ii. States with Financial Gap in the range of 15-40% - Jharkhand, Tamil Nadu,
Bihar, Uttar Pradesh etc., all lie in the second category.
iii. States with Financial Gap > 40% - There are now 5 states in this group,
comprising of J&K along with some north-east states.
The financial gap percentage with subsidy booked is given in the figure below.
Figure III-10: Financial Gap Percentage (with subsidy booked) – 5 year Average
Source: PFC report on utility finances – 2007-08 to 2011-12
Most of the states discussed above have a subsidies received-to-booked ratio of 95%-100%
during the last five years, i.e. a majority of the subsidies booked have been realized. Only
three states have a lower ratio across the last few years – Andhra Pradesh, Karnataka, and
Rajasthan. The ratios for these three states have been presented in the figure below.

AF-MERCADOS EMI
POWER SECTOR OPERATIONS AND IMPACT ON STATE FINANCES 31
Figure III-11: Subsidy Received Percentage – Select States
Source: PFC report on utility finances – 2007-08 to 2011-12
Rajasthan has booked massive amount of subsidy on its P&L account relative to the amount
actually disbursed by the government during those years. This hides the actual financial
loss levels in the P&L statement, building up a huge subsidy receivable amount in the
balance sheet. However, in the last two years, the state Discoms in Rajasthan have booked
lower amounts (almost one-tenth of the amount booked in 2009-10), all of which has been
received. The past years’ unpaid subsidy amount has been recognized as bed debt in the
P&L in 2010-11. This has led to a huge increase in financial losses of Rajasthan. In Andhra
Pradesh, wherein the subsidies booked cover the entire financial gap, the realized subsidy
is only about 60% at present. On a subsidy realized basis, the financial gap in the State is
12% in 2011-12. This is in sharp contrast to a decade ago where after the initial round of
reforms the State had managed to turn a sector around and the Discoms in aggregate
returned a profit. In the intervening ten years the state made agricultural supply free and
tariff revisions were inadequate and inconsistent.
b. Root-cause analysis for poor performance of State Discoms
This section identifies the key root-causes for the poor performance of the state Discoms.
The key reasons are as follows:
i. Inadequate and infrequent tariff hikes
As discussed earlier, the cost of power purchase has increased over the years but the tariff
increase has not been commensurate with the increase in cost of supply.
Most of the states which have a positive financial gap have not increased tariffs for several
years. Further, states such as Andhra Pradesh, Tamil Nadu, Rajasthan and Haryana where
the tariffs were not revised for 7, 7, 6 and 8 years respectively.
A snapshot of tariff hikes for different states as per the financial gap categories is presented
in the table below.

AF-MERCADOS EMI
POWER SECTOR OPERATIONS AND IMPACT ON STATE FINANCES 32
Table III-5: Tariff Hikes
States 2008-09 2009-10 2010-11 2011-12 2012-13 2013-14
STATES WITH FINANCIAL GAP <15%
GOA 0% 0% 0% 0% 10% 2%
KERALA 0% 0% 0% 0% 28% 2%
DELHI 0% 0% 0% 12% 0% 2%
MAHARASHTRA 2% 0% 1% 3% 18% 0%
ORISSA -3% 0.3% 22% 20% 36% 9%
GUJARAT4 - - 2% - - -
KARNATAKA 0% 0% 4% 7% 3% 0%
UTTARAKHAND 14% 17% 0% 6% 6% 0%
ASSAM5 0% 5% - - 10% -
Since the financial gap in the states above has been below 15%, the tariffs hikes have not been frequent. The financial loss levels have gone down consistently over the last 5 years in most of these states. However, tariff hikes will be required in the near future for states in which losses are beginning to increase. For example, in Assam, the financial gap has gone up from 4% in 2007-08 to
20% in 2011-12.
STATES WITH FINANCIAL GAP B/W 15% AND 35%
ANDHRA PRADESH
0% 0% 13% 24% - 29%
MADHYA
PRADESH
0% 4% 11% 6% 7% 1%
PUNJAB 2% 11% 7% 9% 12% 9%
UTTAR PRADESH 20% 19% - - 9% 16%
HARYANA 0% 0% 19% 0% 19% 13%
In the above category, none of the states have shown a noticeable improvement in its financial position over the last five years. Lack of revision in tariffs for past several years led to further deterioration in the financial position of these states. Some of these states have also adopted the GoI’s Financial Restructuring Plan.
STATES WITH FINANCIAL GAP >35%
TAMIL NADU 0% 0% 9% 9% 37% 4%
JHARKHAND - - - Yes - -
BIHAR 3% - 0% 21% 11% 6%
4 Gujarat adopted MYT framework for FY 09 to FY 11 and FY 12 to FY 16.
5 The revenue estimation is as per the MYT order for FY 11 to FY 13.

AF-MERCADOS EMI
POWER SECTOR OPERATIONS AND IMPACT ON STATE FINANCES 33
States 2008-09 2009-10 2010-11 2011-12 2012-13 2013-14
RAJASTHAN 0% 0% 0% 24% 19% 14%
After a period of no tariff hikes, the states in this group have increased tariffs by significant levels in
the last 2-3 years. In Tamil Nadu and Rajasthan, the tariffs were not hiked for a continuous period of over 7 and 5 years respectively. These states are also part of the GoI’s Financial Restructuring Plan wherein consistent tariff hike is required to bridge the financial gap.
Source: ARR Orders
ii. Poor Operational Efficiency - High AT&C Losses
The efficiency in the distribution system is measured by the extent of aggregate technical
and commercial (AT&C) losses. These losses capture technical as well as commercial losses
in the network. In 2011-12, AT&C losses at an All-India level were close to about 27%.
Before looking at states’ AT&C loss figures, the commercial component of these losses is
presented in the figure below. The All-India average collection efficiency level is close to
90%.
Figure III-12: State-level Collection Efficiency –5 year Average
Source: PFC report on utility finances
It can be observed that the collection efficiency for most of the states is above 90%, which
is surely a positive sign. State like Uttarakhand, Madhya Pradesh, and Jharkhand have low
collection efficiency (below 80%).
The technical component of total losses in India is much more than acceptable international
standards. The main reason behind the high rate of T&D losses is the lack of sufficient
investment made in the T&D sector, especially in the sub-transmission and distribution.
Additionally, power thefts continue to plague the distribution system in states. Further,
improper load management and poor quality of distribution transformers used are also
responsible for high technical losses. The figure below presents that average (5 year) AT&C
losses for different states. As observed in the figure below, states with high unmetered
agricultural consumption, including Andhra Pradesh, Tamil Nadu, and Punjab have low
AT&C losses. On the other hand, states with a low agricultural share in total consumption
have high ATC losses.6
6 State-wise Methodology to calculate sales towards unmetered categories is given in annexure II.

AF-MERCADOS EMI
POWER SECTOR OPERATIONS AND IMPACT ON STATE FINANCES 34
AT
&C
Lo
ss R
ed
ucti
on
Hig
h (
>50%
of base
year
valu
e)
Delhi
Nagaland
Modera
te (
20-5
0%
of
base y
ear
valu
e)
Kerala, Himachal Pradesh,
Maharashtra, Karnataka,
Uttarakhand
Jharkhand, Rajasthan,
Manipur
Low
(<
20%
of base
year
valu
e)
Goa, West Bengal, Gujarat,
Orissa, Meghalaya, Sikkim,
Chhattisgarh, Assam
Tripura, Andhra Pradesh,
Madhya Pradesh, Punjab,
Uttar Pradesh, Haryana
Tamil Nadu, Bihar,
Arunachal Pradesh, J&K,
Mizoram
Low (<15%) Moderate (15-35%) High (>35%)
Average Financial Gap
Figure III-13: State-level AT&C Losses – 5 year Average
Source: PFC report on utility finances – 2007-08 to 2011-12
Bihar, Jharkhand, Uttar Pradesh, Rajasthan, J&K, and north-eastern states have high AT&C
losses due to power thefts. The high loss average in Orissa is due to inaccurate reporting of
baseline commercial loss levels. However, it is important to note that in spite of the high
AT&C losses, the financial loss in Orissa is still low due to the regular tariff hikes approved
by the regulator in the last few years. Given below is a matrix presenting the AT&C loss
reduction by different states categorized under average financial gap during the last five
years.
Figure III-14: Reported Performance Changes in last 5 years
Source: PFC
report on
utility finances

AF-MERCADOS EMI
POWER SECTOR OPERATIONS AND IMPACT ON STATE FINANCES 35
As seen in the table above, a majority of the states have improved their AT&C losses by
below 20% during the last 5 years. Amongst the states with average financial gap below
15%, states including Maharashtra, Karnataka, and Kerala have reduced their AT&C losses
in the range of 20-50%. Out of the poorly performing states, Rajasthan and Jharkhand
have reduced AT&C losses considerably during the period under review. Only Delhi and
Nagaland have reduced AT&C losses by over 50%.
The Financial gap can be segregated into two parts: one related to inadequate tariff
increases and other related to inefficiencies on part of the distribution utilities i.e. collection
inefficiency and technical losses.
Assuming 15% transmission and distribution losses as unavoidable, difference between
ACS (with 15% T&D losses) and ARR (with collection efficiency of 100%) reflects the tariff
inadequacies in the states.
It can be observed that inefficiencies accounts for 52.5% of the total financial gap on all
India basis. Gap reduces by Rs. 0.58/kWh if one considers improvement in efficiencies. The
financial gap reduces from Rs.1.12/kWh to Rs.0.54/kWh after improvement of efficiencies
with gap of Rs. 0.54/kWh due to inadequate increase in tariff. The following table presents
the breakup of ACS-ARR Gap as a result of inefficiency and tariff inadequacy for 2011-12.
Table III-6: Break-up of ACS-ARR Gap per unit at all India Level – 2011-12
Units ARR ACS Gap
Actuals Rs./kWh 3.54 4.66 1.12
With efficiency Improvement (ARR-100% Collection efficiency; ACS- 10% T&D losses) Rs./kWh 3.95 4.49 0.54
Source: PFC and AF-Mercados EMI Analysis
The Financial Gap per unit for all states (without subsidy) in 2011-12 is shown in the figure
below.
Figure III-15: Financial Gap per Unit (without subsidy)
Source: PFC report on utility finances
It can be observed that
States like Delhi, Kerala and West Bengal have recorded profits in the year 2011-12,
without state government subsidies.
Few states like Maharashtra, Gujarat, Orissa, Sikkim, Karnataka, Uttarakhand,
Chhattisgarh, Himachal Pradesh and Goa have a gap of less than Re. 1 per-unit.
The remaining states have a gap of more than Re. 1 per-unit.

AF-MERCADOS EMI
POWER SECTOR OPERATIONS AND IMPACT ON STATE FINANCES 36
In order to understand the constituents of financial gap in 2011-12, gap related to
inadequate tariff increases and gap related to inefficiencies on part of the distribution
utilities have been segregated. The figure below presents the Financial Gap in 2011-12 with
efficiency improvements.
Figure III-16: ACS-ARR Gap with efficiency improvement per unit – 2011-12
Source: PFC and AF-Mercados EMI Analysis
Following can be observed from the above:
In 2011-12, a large number of states would turn profitable by improving efficiency. For
example, in large power consuming states such as Uttar Pradesh and Madhya Pradesh,
the entire Gap can be removed by efficiency improvement.
The states which are already profitable can optimize their operations and further
improve their financial position. For example, in West Bengal, the level of available
efficiency improvement is close to Re. 1 per unit.
In actual scenario, only three states, namely, Delhi, Kerala and West Bengal have
recorded profit without subsidies in 2011-12. While in efficiency improvement scenario,
this number would increase to 14 states.
In other states, it can be observed that even after improving efficiency levels to the
extent possible, financial gap would remain reflecting the inadequacies in tariff levels in
those states.
The figure below presents the break-up of financial gap into the inefficiency gap and tariff
inadequacy gap.
Figure III-17: Break-up of Financial Gap per unit into the inefficiency gap and
tariff inadequacy gap – 2011-12
Source: PFC and AF-Mercados EMI Analysis

AF-MERCADOS EMI
POWER SECTOR OPERATIONS AND IMPACT ON STATE FINANCES 37
Following can be observed from the above:
In few states such as Bihar, J&K, Assam, Tripura and Jharkhand, apart from tariff
inadequacy, a large part of the gap is a result of inefficiency. For example, Bihar can
reduce its financial gap by close to Rs 3 per-unit through efficiency improvement.
However, the remaining gap of around Re 1 per-unit need to be eliminated through
tariff hikes.
In other states like Rajasthan, Haryana, Andhra Pradesh, Mizoram and Manipur, more
than inefficiency, tariff revisions have been inadequate and constitute a large part of the
gap.
iii. Low revenue realization from Agriculture Consumers
In addition to infrequent and inadequate tariff hikes, low revenue realization from
agriculture is also one of the major reasons for poor performance of some of the large
agricultural states. Discoms that have not been able to increase tariffs for agricultural
consumers are observed to have poor financials.
This is important as going forward as cross-subsidy levels needs to be reduced. Section
61(g) of the 2003 Act stipulates that the tariff should progressively reflect the cost of
supply and cross subsidies should be reduced within the time period specified by the State
Commission. The Tariff Policy stipulates the target for achieving this objective latest by the
end of year 2010-11, such that the tariffs are within ± 20% of the average cost of supply.
The table below presents the key operational and financial parameters of agriculture
dominated states in India. These 9 states together comprise 92% of the total agricultural
sales in India in 2011-12.

AF-MERCADOS EMI
POWER SECTOR OPERATIONS AND IMPACT ON STATE FINANCES 38
Table III-7: States with significant Agriculture Consumption – 2011-12
States Agri.
Sale
s
(MU
)
Shar
e in
All-
Indi
a
Agri.
Sale
s
(%)
Agri.
Shar
e in
Tota
l
Stat
e
Sale
s
(%)
Share
in
Total
State
Sales
Reven
ue (%)
ARR
from
Agri.
(Rs./kW
h)
AT&C
Losse
s
(%)
Meteri
ng
Level
in Agri.
Subsidy
Quantu
m
(Rs. Cr)
Subsidy
Realizati
on
(%)
Tamil
Nadu
1012
4 7% 19% 0% 0 20% 0% 2084 100%
Andhra
Pradesh
2019
1 15% 28% 1% 0.11 15%
High
Level of
Un-
metered
Sales
6515 62%
Rajasthan 1535
2 11% 40% 18% 1.24 25% 50% 1760 100%
Gujarat 1394
8 10% 25% 13% 2.07 19% 43% 1100 100%
Madhya
Pradesh 9451 7% 33% 14% 1.65 38%
High
Level of
Un-
metered
Sales
1538 100%
Karnataka 1581
6 12% 37% 21% 2.42 25% 24% 1352 88%
Haryana 9044 7% 31% 3% 0.33 28% 56% 3429 99%
Punjab 1024
9 7% 29% 0% 0 21% 0% 4182 100%
Maharasht
ra
2161
2 16% 27% 12% 2.15 22% - 0 -
Source: PFC report on utility finances
Color Key:
Financial Gap>35%
Financial Gap b/w 15-35%
Financial Gap<15%
It can be observed that the revenue realization from agricultural consumers in Gujarat,
Maharashtra, and Karnataka is much higher than that of the other states. This means more

AF-MERCADOS EMI
POWER SECTOR OPERATIONS AND IMPACT ON STATE FINANCES 39
sales revenues despite the fact that share of un-metered agriculture sales are high in these
states. Also the quantum of subsidies given to these states is among the lowest compared
to other states.
States including Andhra Pradesh, Haryana, Punjab and Tamil Nadu have very low revenue
realization from the agricultural sector. In fact, Tamil Nadu and Punjab have no revenue
realisation from agricultural consumers. These states have a significant financial gap that is
between 15% and 35%.
Madhya Pradesh has an average revenue realisation of Rs 1.65/kWh from agriculture.
However, its AT&C losses are as high as 38% which is one of the reasons for its poor
financial performance. Add to that, there are no subsidies have been given in the state
which has further aggravated the condition. Rajasthan has very low revenue realisation
from agriculture compared to other states. Also, the state government subsidy provided to
bridge the cost-revenue gap of the agriculture segment is less when compared to other
states.
iv. Low revenue realization from Domestic Consumers
Low revenue realization from domestic consumers coupled with high AT&C losses is another
important reason for poor performance of some of the states.
The table below presents the key operational and financial parameters of domestic
consumption dominated states in India. These 8 states together comprise 47% of the total
agricultural sales in India in 2011-12.
Table III-8: States with significant Domestic Consumption – 2011-12
States Dom.
Sales
(MU)
Share in
Total
State
Sales
(%)
Share in
All-India
Dom. Sales
(%)
ARR
from
Dom.
(Rs./kW
h)
AT&C Losses
(%)
Bihar 2368 35% 2% 3.19 65%
Jharkhand 2483 38% 2% 1.21 43%
Punjab 8636 25% 6% 3.85 21%
Uttar
Pradesh 14231 36% 10%
3.28 45%
Kerala 7706 48% 5% 1.99 12%
Haryana 5569 19% 4% 3.40 28%
Tamil Nadu 18114 33% 13% 1.67 20%
Karnataka 8743 21% 6% 3.86 25%
Source: PFC report on utility finances

AF-MERCADOS EMI
POWER SECTOR OPERATIONS AND IMPACT ON STATE FINANCES 40
Karnataka has the highest revenue realized from the domestic segment and Kerala, though
low on revenue realised has the lowest AT&C losses. This is one of the reasons for these
two states are having a low financial gap.
In case of Bihar and Uttar Pradesh, AT&C losses are observed to be high despite high
revenue realization. Jharkhand has the lowest revenue realised and high level of AT&C
losses. This is one of the reasons for poor performance of these two states.
v. Lack of Power Purchase Optimization by states
Since power purchase costs constitute around 75-80% of the total cost of distribution
utilities, escalating power procurement rates is a matter of serious concern for the utilities.
Either the load forecasting (demand and supply) capabilities are inefficient or they do not
exist at all in most of the states. In some cases, this has led to an over-reliance on the spot
market which has increased the costs. Without superior optimization practices on part of
the utilities, identification of shortages and surpluses has been difficult for the utilities.
Hence, there is need for states to invest in forecasting capabilities.
Given below is the total energy procurement by a few states along with their procurement
in the short term. In percentage terms, Bihar and Punjab have the highest short term
procurement (20% and 18% respectively).
Table III-9: State Energy Procurement – 2012-13
State
Total Energy
Consumed in
2012-13
Procured
from
Bilateral
and Px
(MU)
UI based net
procurement
(MU)
Rajasthan 53868 7417 1096
Uttar Pradesh 76446 6341 2751
Maharashtra 119972 6386 6
Punjab 46119 9111 888
Andhra
Pradesh 82171 7012 261
Haryana 38209 4617 953
Bihar 12835 2207 -398
Karnataka 57044 53 -152
Tamil Nadu 76161 3853 54
Source: CEA Monthly Power Supply Position
To sum up, it can be observed that while many of the states have performed well over the
last few years, a few of them have performed poorly. States such as Rajasthan, Tamil
Nadu, Bihar, Uttar Pradesh, Andhra Pradesh, Jharkhand, Haryana, etc. account for a
majority of the financial losses of Discoms.
In order to alleviate the poor state of finances of the utilities while simultaneously providing
incentives to improve efficiency, GoI approved a Financial Restructuring Plan in 2012 to
restructure Rs 1.9 lakh crore debt of Discoms. The plan is now under implementation in
some of the poorly performing states.
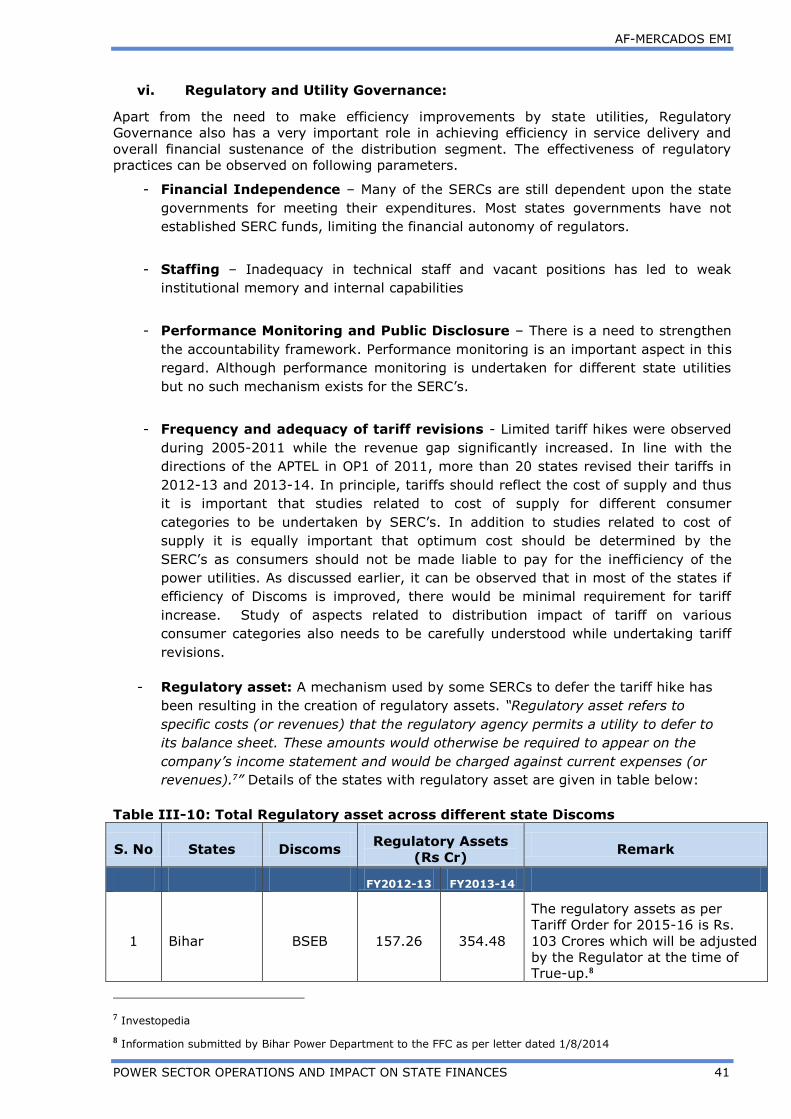
AF-MERCADOS EMI
POWER SECTOR OPERATIONS AND IMPACT ON STATE FINANCES 41
vi. Regulatory and Utility Governance:
Apart from the need to make efficiency improvements by state utilities, Regulatory
Governance also has a very important role in achieving efficiency in service delivery and
overall financial sustenance of the distribution segment. The effectiveness of regulatory
practices can be observed on following parameters.
- Financial Independence – Many of the SERCs are still dependent upon the state
governments for meeting their expenditures. Most states governments have not
established SERC funds, limiting the financial autonomy of regulators.
- Staffing – Inadequacy in technical staff and vacant positions has led to weak
institutional memory and internal capabilities
- Performance Monitoring and Public Disclosure – There is a need to strengthen
the accountability framework. Performance monitoring is an important aspect in this
regard. Although performance monitoring is undertaken for different state utilities
but no such mechanism exists for the SERC’s.
- Frequency and adequacy of tariff revisions - Limited tariff hikes were observed
during 2005-2011 while the revenue gap significantly increased. In line with the
directions of the APTEL in OP1 of 2011, more than 20 states revised their tariffs in
2012-13 and 2013-14. In principle, tariffs should reflect the cost of supply and thus
it is important that studies related to cost of supply for different consumer
categories to be undertaken by SERC’s. In addition to studies related to cost of
supply it is equally important that optimum cost should be determined by the
SERC’s as consumers should not be made liable to pay for the inefficiency of the
power utilities. As discussed earlier, it can be observed that in most of the states if
efficiency of Discoms is improved, there would be minimal requirement for tariff
increase. Study of aspects related to distribution impact of tariff on various
consumer categories also needs to be carefully understood while undertaking tariff
revisions.
- Regulatory asset: A mechanism used by some SERCs to defer the tariff hike has
been resulting in the creation of regulatory assets. “Regulatory asset refers to
specific costs (or revenues) that the regulatory agency permits a utility to defer to
its balance sheet. These amounts would otherwise be required to appear on the
company’s income statement and would be charged against current expenses (or
revenues).7” Details of the states with regulatory asset are given in table below:
Table III-10: Total Regulatory asset across different state Discoms
S. No States Discoms Regulatory Assets
(Rs Cr) Remark
FY2012-13 FY2013-14
1 Bihar BSEB 157.26 354.48
The regulatory assets as per
Tariff Order for 2015-16 is Rs.
103 Crores which will be adjusted
by the Regulator at the time of True-up.8
7 Investopedia
8 Information submitted by Bihar Power Department to the FFC as per letter dated 1/8/2014

AF-MERCADOS EMI
POWER SECTOR OPERATIONS AND IMPACT ON STATE FINANCES 42
S. No States Discoms Regulatory Assets
(Rs Cr) Remark
FY2012-13 FY2013-14
2 West Bengal WBSEDCL 2174.82 -
3
Delhi
BSES
Rajdhani 5205.52
Net Revenue Gap after adjusting
outstanding dues for all the 3
DISCOMs was Rs. 11431.12
Crore as of FY 2013-14
4 BSES
Yamuna 2855.03
5 NDPL 3,370.56
6
Haryana
DHBVNL 316.39 HERC has allowed recovery of
45% of regulatory asset
implemented through tariff order
2013-14. Regulatory Asset to be
recovered within a period of 3 years.9
7 UHBVNL 2,027.16
8 Chhattisgarh CSPDCL 828
9 Tamil Nadu TANGEDCO 24,611
Accumulated revenue gap from
2010-11 to 2013-14 accounted
for Rs. 22,407 Cr. Regulatory
assets of Rs. 24611 Cr. was
approved after considering the
amortized Rs 1033 Cr in FY2013-
14.
Source: Tariff Orders
In addition to the above table:
o Uttar Pradesh Electricity Regulatory Commission has accepted the
regulatory assets of Rs. 2488 Crores against the true-up petitions for
the period from 2000-01 to 2007-08. Regulatory surcharges at the
rate of 3.71% was approved in the Tariff Order 2013-14 and 2.84%
has been allowed for the FY 2014-15 and 2015-16. This surcharge will
continue until the full recovery of Regulatory asset is made. For
remaining years, the true-up petitions have been filed with the
regulatory commission and necessary orders are expected with the
Tariff Order of 2014-15.10
o Rajasthan Electricity Regulatory Commission, in its tariff order FY14
has approved unfunded gap of Rs 16,033 Cr as regulatory asset for
the period 2009-10 to 2012-13 However, the Regulatory Commission
did not consider amortization of this gap in the above mentioned
order, instead allowed carrying cost on the entire un-funded gap while
approving revenue requirement for FY 2013-14. The Commission
opined that considering the present level of Regulatory Asset,
amortizing the regulatory asset in three years will result in a tariff
shock. Accordingly, Discoms plan to liquidate the regulatory assets
9 Information submitted by Government of Haryana to the FFC as per letter dated 18/7/2014
10 Information submitted by Govt. of Uttar Pradesh to the FFC as per letter dated 21/7/2014

AF-MERCADOS EMI
POWER SECTOR OPERATIONS AND IMPACT ON STATE FINANCES 43
including approved unfunded gap after FY 2016-17, when the
Rajasthan Discoms are expected to achieve turnaround.11
- Consumer Protection - Public participation in the regulatory process (discussion
papers/ public hearings) has been limited. Bulk of the consumers especially rural
and domestic consumers are not even aware of such options. Even after 10 years of
the Electricity Act 2003, Quality of supply has not much improved and is not
adequately monitored by the utilities. To ensure good quality of supply to
consumers, it is important that quality of supply being linked with tariffs and tariffs
be revised in accordance with the improvement in quality.
Lack of proper governance and accountability has also been acknowledged in the High Level
Panel report on “financial position of Distribution Utilities – 2011”, chaired by Shri V.K.
Shunglu
As for the utilities, most of them comply with the basic requirements of the Companies Act.
However, there is a definite need to follow certain corporate governance requirements,
some of which may not necessarily apply to the utilities. Following good practices pertaining
to Board composition, Board functioning, Audit Committee, Government-board relationship
and disclosure, etc. has shown to directly correlate with better financial performance over
the long run. Currently, only a few utilities are following these good practices.
c. Utility Performance in 2012-13
This section presents the performance of state utilities in 2012-13. However, it is important
to mention that in order to undertake analysis for 2012-13 data provided by the
states to FFC has been used. Since data source for 2012-13 is different with respect
to previous years, wherein PFC data was used, the results may be inconsistent.
Further, due to the paucity of data only key financial parameters are being analysed under this
section.
This includes state level comparison of the financial gap (ACS-ARR) with and without subsidies
for 2012-13 vis-a-vis 2011-12.
11 Information submitted by Govt. of Rajasthan to FFC as per letter dated 22nd July,2014.

AF-MERCADOS EMI
POWER SECTOR OPERATIONS AND IMPACT ON STATE FINANCES 44
Figure III-18: ACS-ARR Gap per unit without subsidy – 2012-13
Source: Data provided by states to the FFC
Figure III-19: ACS-ARR Gap per unit with subsidy– 2012-13
Source: Data provided by states to the FFC
In 2012-13, the following changes have been observed in the gap per unit without
subsidies vis-a-vis 2011-12:
Increase in gap: Orissa by Rs. 2 per unit and Uttar Pradesh by Rs. 0.90 per unit
approximately.
Decrease in gap: Manipur and Tripura by Re, 1 per unit, Jharkhand by Rs. 3.4 per
unit, Bihar by Rs. 1.2 per unit and Rajasthan by Rs. 2 per unit approximately.
This increase/decrease in ACS-ARR gap is due to efficiency improvement and increase in
tariff. For example, the decrease in gap for Bihar is related to the decrease in its AT&C loss
(%) level from 64.5% in 2011-12 to 45% in 2012-13. Similarly, AT&C losses in Rajasthan
decreased from 25% to 20%. Also, tariff increase in 2011-12 for Bihar and Rajasthan were
to the tune of 21% and 24% respectively.
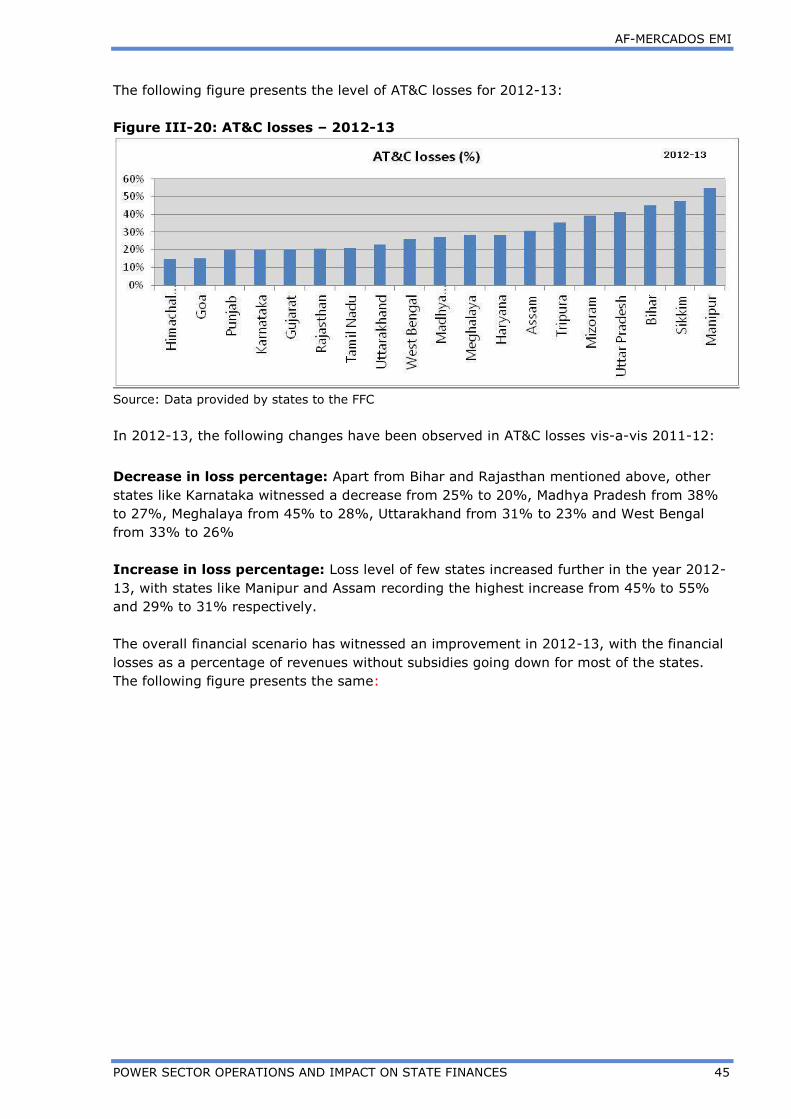
AF-MERCADOS EMI
POWER SECTOR OPERATIONS AND IMPACT ON STATE FINANCES 45
The following figure presents the level of AT&C losses for 2012-13:
Figure III-20: AT&C losses – 2012-13
Source: Data provided by states to the FFC
In 2012-13, the following changes have been observed in AT&C losses vis-a-vis 2011-12:
Decrease in loss percentage: Apart from Bihar and Rajasthan mentioned above, other
states like Karnataka witnessed a decrease from 25% to 20%, Madhya Pradesh from 38%
to 27%, Meghalaya from 45% to 28%, Uttarakhand from 31% to 23% and West Bengal
from 33% to 26%
Increase in loss percentage: Loss level of few states increased further in the year 2012-
13, with states like Manipur and Assam recording the highest increase from 45% to 55%
and 29% to 31% respectively.
The overall financial scenario has witnessed an improvement in 2012-13, with the financial
losses as a percentage of revenues without subsidies going down for most of the states.
The following figure presents the same:
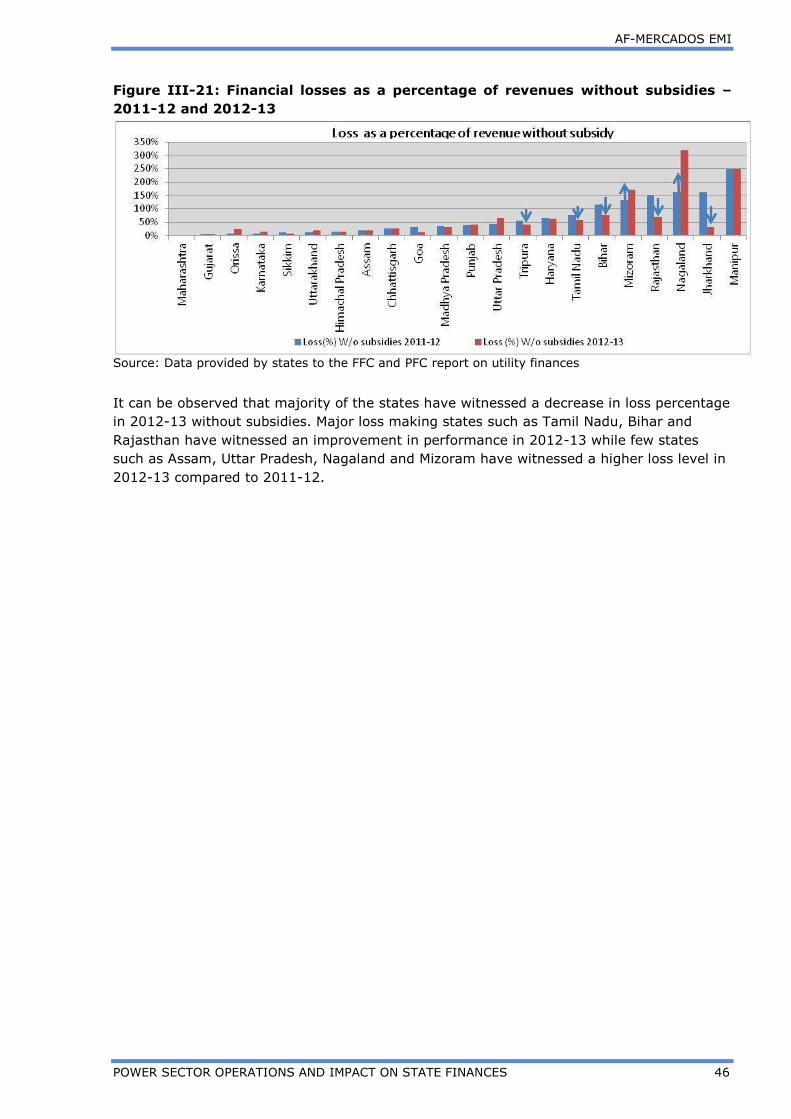
AF-MERCADOS EMI
POWER SECTOR OPERATIONS AND IMPACT ON STATE FINANCES 46
Figure III-21: Financial losses as a percentage of revenues without subsidies –
2011-12 and 2012-13
Source: Data provided by states to the FFC and PFC report on utility finances
It can be observed that majority of the states have witnessed a decrease in loss percentage
in 2012-13 without subsidies. Major loss making states such as Tamil Nadu, Bihar and
Rajasthan have witnessed an improvement in performance in 2012-13 while few states
such as Assam, Uttar Pradesh, Nagaland and Mizoram have witnessed a higher loss level in
2012-13 compared to 2011-12.

AF-MERCADOS EMI
POWER SECTOR OPERATIONS AND IMPACT ON STATE FINANCES 47
IV STATE EXPOSURE TO POWER SECTOR
1. STATE INCOME AND EXPENDITURE ON POWER SECTOR
State governments being the sole owners of an overwhelming majority of the distribution
utilities, the impact of the utility finance directly and indirectly devolves on the respective
states. Therefore, to understand the impact of power sector operations on the state
finances, it is important to first understand the expenditure and liabilities of the state with
respect to the power sector such as provision of direct subsidy, liabilities on account of
guarantees against loans, emergency financial assistance etc.
Similar to the expenditure commitments of the states, the state also receives revenues
from the power sector in the form of Electricity Duty, Interest on State government loans,
dividend payouts by the state utilities and Sale of surplus power in the state etc.
1.1. EXPENDITURE ON POWER SECTOR
Assessment of Capital and Revenue Expenditure on Power Sector
i. Capital Expenditure
States provide investment assistance to state utilities through provision of equity and debt
to create the necessary infrastructure related to generation, transmission and distribution.
It is expected that higher the investment assistance, higher will be the earning capacity of
the utilities in future. Therefore, it is important to examine the state investments in the
power sector over the years.
ii. Revenue Expenditure
State government assists certain categories of consumers such as agriculture and domestic
to meet its social obligations. In this regard, it is important to assess the level of subsidy,
grants in aid etc., which forms the revenue expenditure towards the sector, provided by the
state.
Given below is the capital and revenue expenditure of all the states.
Table IV-1: Total Expenditure on Power Sector -2011-1212
State Capital
Expenditure
Revenue
Expenditure
Total
Expenditure
on Power
Sector
Total State
Expenditure
Power Sector
Expenditure/
Total
Expenditure
(%)
In Rs Cr.
Jammu &
Kashmir 534 3,768 4,302 28,579 15%
Haryana 802 3,591 4,393 37,387 12%
Punjab 0 3,201 3,201 34,643 9%
Rajasthan 2,459 3,006 5,465 60,773 9%
12 2011-12 annual accounts are not available for West Bengal, hence for the entire section 2010-11 data has been
taken for the state.
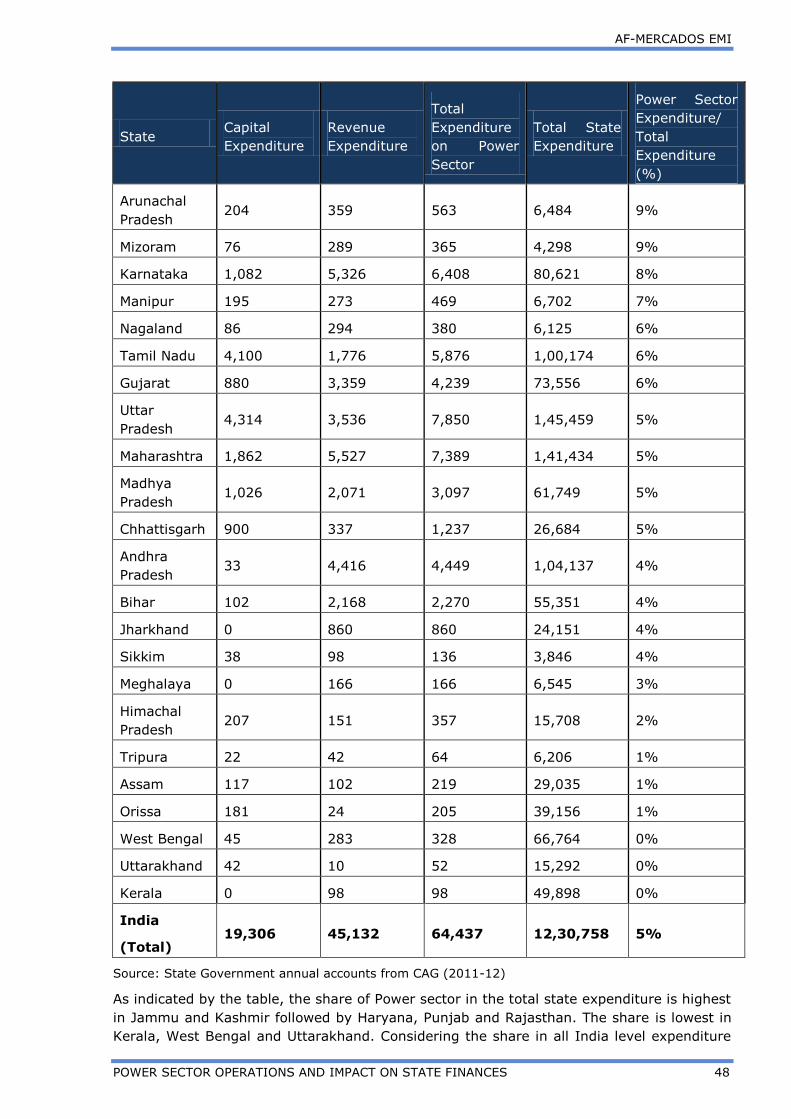
AF-MERCADOS EMI
POWER SECTOR OPERATIONS AND IMPACT ON STATE FINANCES 48
State Capital
Expenditure
Revenue
Expenditure
Total
Expenditure
on Power
Sector
Total State
Expenditure
Power Sector
Expenditure/
Total
Expenditure
(%)
Arunachal
Pradesh 204 359 563 6,484 9%
Mizoram 76 289 365 4,298 9%
Karnataka 1,082 5,326 6,408 80,621 8%
Manipur 195 273 469 6,702 7%
Nagaland 86 294 380 6,125 6%
Tamil Nadu 4,100 1,776 5,876 1,00,174 6%
Gujarat 880 3,359 4,239 73,556 6%
Uttar
Pradesh 4,314 3,536 7,850 1,45,459 5%
Maharashtra 1,862 5,527 7,389 1,41,434 5%
Madhya
Pradesh 1,026 2,071 3,097 61,749 5%
Chhattisgarh 900 337 1,237 26,684 5%
Andhra
Pradesh 33 4,416 4,449 1,04,137 4%
Bihar 102 2,168 2,270 55,351 4%
Jharkhand 0 860 860 24,151 4%
Sikkim 38 98 136 3,846 4%
Meghalaya 0 166 166 6,545 3%
Himachal
Pradesh 207 151 357 15,708 2%
Tripura 22 42 64 6,206 1%
Assam 117 102 219 29,035 1%
Orissa 181 24 205 39,156 1%
West Bengal 45 283 328 66,764 0%
Uttarakhand 42 10 52 15,292 0%
Kerala 0 98 98 49,898 0%
India
(Total) 19,306 45,132 64,437 12,30,758 5%
Source: State Government annual accounts from CAG (2011-12)
As indicated by the table, the share of Power sector in the total state expenditure is highest
in Jammu and Kashmir followed by Haryana, Punjab and Rajasthan. The share is lowest in
Kerala, West Bengal and Uttarakhand. Considering the share in all India level expenditure

AF-MERCADOS EMI
POWER SECTOR OPERATIONS AND IMPACT ON STATE FINANCES 49
on Power Sector, the major share goes to states of Uttar Pradesh, Maharashtra, Karnataka,
Tamil Nadu and Rajasthan. 78% of the total expenditure on power sector is towards 9
states, namely Uttar Pradesh, Maharashtra, Karnataka, Tamil Nadu, Rajasthan, Haryana,
Jammu and Kashmir, Gujarat and Andhra Pradesh.
At the all India level, Revenue expenditure far exceeds the Capital Expenditure. The
consolidated revenue expenditure is Rs 45132 Cr, i.e. ~70% of total consolidated
expenditure of sector, whereas the capital expenditure is Rs 19306 Cr. (30% of the total
amount). Hence, a significant amount is driven towards assistance to sector in the form of
grants or subsidy in most of the states in India.
The states with higher capital expenditure on power sector than revenue expenditure are
Tamil Nadu, Uttar Pradesh, Chhattisgarh, Maharashtra, Himachal Pradesh, Assam
Uttarakhand, and Orissa. This implies that a significant portion of expenditure in these
states is made towards investments in building and strengthening the power sector
infrastructure.
The above data is presented in the figure below.
Figure IV-1: Total Expenditure on Power Sector -2011-12
Source: State Government annual accounts from CAG (2011-12)
As per the state government annual accounts,
The entire capital expenditure in Tamil Nadu is Investment in State Electricity Board.
In Uttar Pradesh, the major portion capital expenditure is made towards
Transmission and Distribution.
In Rajasthan, major portion of Capital and Revenue Expenditure is made towards
Distribution Sector.

AF-MERCADOS EMI
POWER SECTOR OPERATIONS AND IMPACT ON STATE FINANCES 50
1.2. INCOME FROM POWER SECTOR
Assessment of Tax and Non-Tax Revenue from power sector in the state
i. Tax Revenue
The tax system in India is mainly a three tier system which is based between the Central,
State Governments and the local government organizations. In most cases, these local
bodies include the local councils and the municipalities.
The taxes and duties imposed on Power Sector comprises of following:
Taxes on consumption and sale of Electricity
Fees Under The Indian Electricity Rules
Fees For The Electrical Inspection of Cinemas
Other Receipts
ii. Non-Tax Revenue
With majority of the utilities being owned by the state governments, any profit earned and
distributed in form of dividend forms part of the revenue of the state government. Since
most of these utilities are in losses, the income from dividend is negligible. Further, state
government also earns revenue from interest on loans provided to state utilities and also
from sale of its share of free power. The non-tax revenue from power sector also comes
through Royalty/CESS on water for power generation, free hydro power sale, T&D, Rural
Electrification etc.
The table below lists the Tax and Non tax Income from power sector their contribution in
the Total Revenue in 2011-12.
Table IV-2: Tax and Non Tax Revenue from Power Sector
State Tax Revenue Non Tax
Revenue
Revenues
from Power
Sector
Total
Revenue
Revenue
from power
sector/
Total
Revenue
In Rs Cr.
Himachal
Pradesh 185 1,146 1,331 8,021 17%
J&K 179 1,007 1,186 10,242 12%
Mizoram 0 110 110 1,174 9%
Nagaland 0 94 94 1,340 7%
Gujarat 3,655 106 3,760 57,309 7%
Manipur 0 107 107 1,834 6%
Maharashtra 4,831 725 5,557 1,09,120 5%
Madhya Pradesh 1,773 456 2,229 52,675 4%
Sikkim 0 80 80 1,950 4%
Punjab 928 0 928 23,794 4%

AF-MERCADOS EMI
POWER SECTOR OPERATIONS AND IMPACT ON STATE FINANCES 51
State Tax Revenue Non Tax
Revenue
Revenues
from Power
Sector
Total
Revenue
Revenue
from power
sector/
Total
Revenue
Chhattisgarh 638 0 638 21,091 3%
Uttarakhand 229 41 270 9,618 3%
Arunachal 0 145 145 5,215 3%
Rajasthan 1,094 4 1,099 49,529 2%
West Bengal 769 0 769 39,464 2%
Orissa 552 3 555 32,115 2%
Tamil Nadu 1,040 0 1,040 77,916 1%
Karnataka 654 5 660 61,638 1%
Haryana 166 3 170 27,803 1%
Uttar Pradesh 458 77 535 1,13,110 0%
Jharkhand 73 0 73 17,162 0%
Andhra Pradesh 305 38 343 82,729 0%
Assam 37 0 37 19,789 0%
Bihar 55 0 55 41,437 0%
Kerala 21 0 21 34,301 0%
Meghalaya 1 0 1 2,110 0%
Tripura 0 0 0 2,380 0%
India
(Total) 17,645 4,148 21,793 9,04,866 0%
Source: State Government annual accounts from CAG (2011-12)
As indicated by the table above,
The share of revenue from power sector is highest in Himachal Pradesh followed by
Jammu and Kashmir, Mizoram etc. The share is lowest in states of Tripura and
Meghalaya.
Utilities in Rajasthan and Tamil Nadu generated ~2% of the state revenue, whereas
in states such as Bihar, Jharkhand and Uttar Pradesh, the utilities contributed a
relatively smaller amount.
The states that contribute the most towards All-India power sector revenues are
Maharashtra, Madhya Pradesh and Gujarat (53% of the revenues). 77% of the total
power sector revenues come from eight states namely Maharashtra, Madhya
Pradesh, Gujarat, Himachal, Jammu and Kashmir, Rajasthan, Punjab and West
Bengal.
In most of the states, the major revenue source for the sector is tax revenue. At the
all India level, tax revenue from the sector accounts for 81% of the total revenue
and remaining is derived from non-tax revenue.

AF-MERCADOS EMI
POWER SECTOR OPERATIONS AND IMPACT ON STATE FINANCES 52
States with the major revenue source of the sector as non-tax income are Himachal
Pradesh, Jammu and Kashmir, Mizoram, Nagaland, Manipur, Sikkim and Arunachal
Pradesh. The significant amount of non-tax revenue in these states is primarily due
to the prevalence of Hydel-Generation and rural electrification, apart from T&D.
The data table above is presented in the chart below:
Figure IV-2: Tax and Non Tax Revenue from Power Sector – (2011-12)
Source: State Government annual accounts from CAG (2011-12)
The major source of Tax Revenue (Power Sector) is Taxes on consumption and sale of
electricity. As evident, it is the highest in Gujarat and Maharashtra. The major source of
Non – Tax Revenue is free Hydropower sale, Rural Electrification etc. In Himachal Pradesh
and Maharashtra, ~100% of the Non- Tax Revenue from Power Sector came from Hydel-
Generation. In Uttar Pradesh and Jammu and Kashmir, a significant proportion of the Non-
Tax Revenue from Power Sector, is accounted for by Rural Electrification
2. POWER SECTOR SUFFICIENCY
The table below lists the Total Revenue and Expenditure of Power Sector, Difference
between Total revenue from the sector and revenue expenditure, Difference between total
revenue from the sector and total expenditure in 2011-12.
Difference of Power sector total revenue and total expenditure: It is estimated as
the difference between Revenue generated from the sector and Total expenditure made on
the sector. It suggests the extent of sector’s ability to finance the investments and other
assistance.
Difference of Power Sector total revenue and revenue expenditure: It is estimated
as the difference between Revenue generated from the sector and revenue expenditure
made on the sector. It suggests the ability of the sector to meet the expenses with no
assistance from the state.
0%
2%
4%
6%
8%
10%
12%
14%
16%
18%
0
1000
2000
3000
4000
5000
6000
Po
we
r se
cto
r co
ntr
ibu
tio
n in
Sta
te r
eve
nu
e (
%)
Re
ven
ue
fro
m P
ow
er
Sect
or
(Rs
Cr)
Revenue From Power Sector (2011-12)
Non Tax Revenue Tax Revenue Revenue from power sector/ Total Revenue

AF-MERCADOS EMI
POWER SECTOR OPERATIONS AND IMPACT ON STATE FINANCES 53
Table IV-3: Total Revenue and Expenditure on Power Sector, Difference of Power sector
total revenue and total expenditure, Difference of Power Sector total revenue and revenue
expenditure, 2011-12.
State Total
Revenue
Capital
Expenditure
Revenue
Expenditure
Total
revenue –
Revenue
Expenditure
Total
Revenue –
Total
Expenditure
In Rs Cr
Tripura 0 22 42 -42 -64
Meghalaya 1 0 166 -165 -165
Bihar 55 102 2,168 -2,113 -2,216
Haryana 170 802 3,591 -3,422 -4,223
Andhra
Pradesh 343 33 4,416 -4,072 -4,105
Jharkhand 73 0 860 -787 -787
Karnataka 660 1,082 5,326 -4,667 -5,748
Uttar
Pradesh 535 4,314 3,536 -3,000 -7,315
Kerala 21 0 98 -77 -77
Punjab 928 0 3,201 -2,273 -2,273
J&K 1,186 534 3,768 -2,582 -3,116
Nagaland 94 86 294 -200 -286
Assam 37 117 102 -65 -182
Rajasthan 1,099 2,459 3,006 -1,907 -4,366
Mizoram 110 76 289 -180 -256
Manipur 107 195 273 -166 -362
Arunachal 145 204 359 -214 -418
Tamil Nadu 1,040 4,100 1,776 -736 -4,836
Sikkim 80 38 98 -18 -56
Maharashtra 5,557 1,862 5,527 30 -1,832
Madhya
Pradesh 2,229 1,026 2,071 158 -867
Gujarat 3,760 880 3,359 402 -479
Chhattisgarh 638 900 337 301 -599
West Bengal 769 45 283 486 441
Himachal
Pradesh 1,331 207 151 1,180 974
Orissa 555 181 24 531 350

AF-MERCADOS EMI
POWER SECTOR OPERATIONS AND IMPACT ON STATE FINANCES 54
State Total
Revenue
Capital
Expenditure
Revenue
Expenditure
Total
revenue –
Revenue
Expenditure
Total
Revenue –
Total
Expenditure
Uttarakhand 270 42 10 260 219
India
(Total)
21,793 19,306 45,132 -23,339 -42,645
Source: State Government annual accounts from CAG (2011-12)
As indicated by the table above,
The states in which revenue generation from power sector is higher than the
revenue expenditure are Maharashtra, Madhya Pradesh, Gujarat, Chhattisgarh, West
Bengal, Himachal Pradesh, Orissa and Uttarakhand. This suggests that the revenue
generated from the sector is significant to meet the present assistance requirement.
Maharashtra is the state with second highest expenditure along with highest
revenue generation from the sector. In Maharashtra, Gujarat and Madhya Pradesh
the major expenditure is in the form of state assistance. Taking into account the
efficiency in revenue generation, investments in capacity creation will help enable
high productivity level in the state.
Considering the total expenditure on the sector, the revenue generated is sufficient
to meet both the present requirement of assistance and investments in the sector
only in the states of West Bengal, Himachal Pradesh, and Orissa.
However, in West Bengal, Orissa and Chhattisgarh the overall magnitude of
revenues generation and state expenditure on the sector is comparatively low.
In other states like Kerala, Jharkhand, Meghalaya, Sikkim, Tripura, and Assam etc,
both revenue generated and state expenditure are relatively low with total
expenditure exceeding the revenues. Thus the challenge for these states (except
Kerala, due to positive financial gap) is to fund the sectors’ revenue expenses, build
infrastructure and also take steps to enhance the productivity of the sector.
Given the revenue generating ability, the degree of external assistance requirement
is relatively high in states like Uttar Pradesh, Tamil Nadu, Rajasthan, Bihar,
Haryana, Andhra Pradesh, etc. where the amount of expenditure far exceeds the
revenue. The severity of dependence on state finances, based on the nature of state
financing, is higher in case of Andhra Pradesh, Bihar, Jharkhand, Karnataka
considering the fact that the substantial expenditure on sector is majorly in the form
of assistance and not investments. Similarly based on the magnitude of dependence,
the severity of dependence is relatively high for the states like Uttar Pradesh, Tamil
Nadu and Rajasthan.
3. GUARANTEES TO THE POWER SECTOR
In several states a significant part of the loans taken by the power sector utilities of the
states have been provided with guarantees by the state governments. In the event that
utilities are not able to meet their commitments, servicing of these loans can potentially
devolve on the state governments.

AF-MERCADOS EMI
POWER SECTOR OPERATIONS AND IMPACT ON STATE FINANCES 55
In this context it is important to assess the size of guarantees in relation to the state
budget (even if the guarantees are high in absolute terms, if this is a relatively smaller
proportion of the revenue receipts, then the ability of the states to withstand such
devolvement will be higher).
The table given below lists the states’ Guarantees towards the sector in 2011-12
Table IV-4: Guarantees to the Power Sector – 2011-12
State Guarantees
Guarantees to the Sector/
Total Revenue Receipts
(%)
In Rs Cr
Rajasthan 57,081 115%
Meghalaya 1,292 61%
Punjab 8,736 37%
J&K 1,956 19%
Uttar Pradesh 17,608 16%
Himachal Pradesh 1060 13%
Uttarakhand 1,187 12%
Tamil Nadu 9,024 12%
Andhra Pradesh 8,723 11%
Haryana 2,077 8%
Orissa 2,442 8%
Madhya Pradesh 3,302 6%
West Bengal 1,534 4%
Chhattisgarh 429 2%
Tripura 47 2%
Maharashtra 1,921 2%
Gujarat 576 1%
Bihar 195 0%
Karnataka 260 0%
Kerala 120 0%
Assam 8 0%
Jharkhand 0 0%
Sikkim 0 0%
Arunachal 0 0%
Manipur 0 0%
Mizoram 0 0%
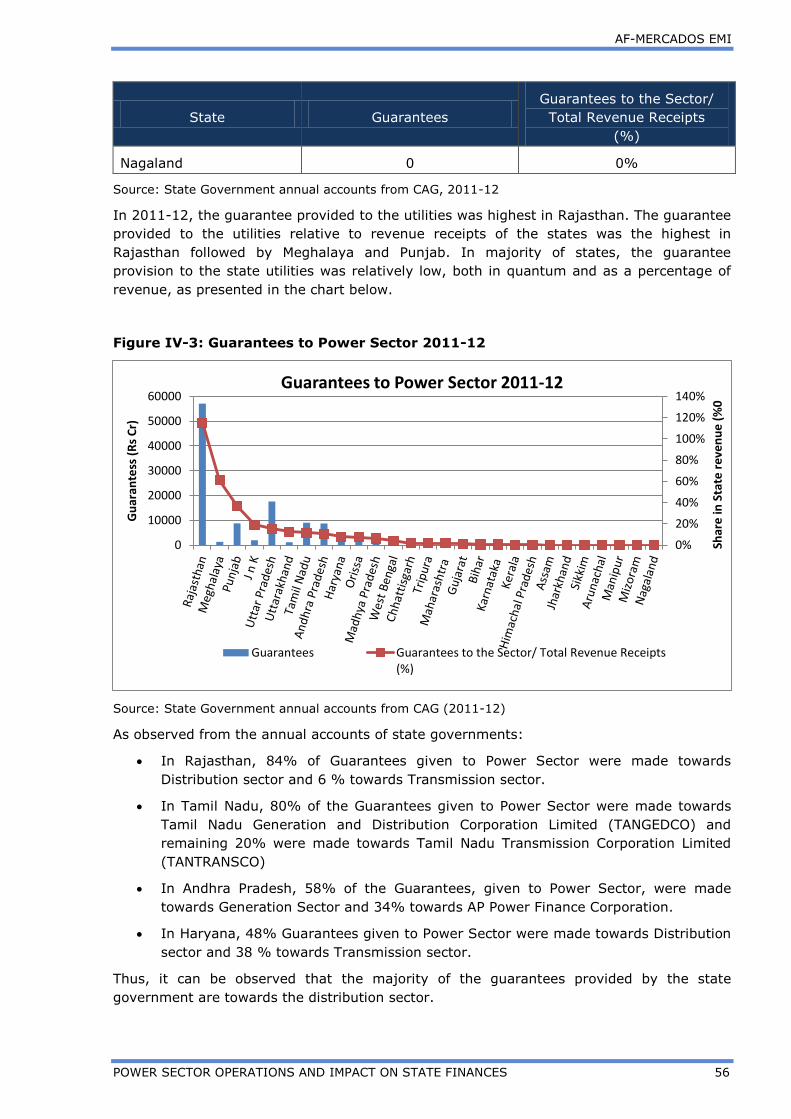
AF-MERCADOS EMI
POWER SECTOR OPERATIONS AND IMPACT ON STATE FINANCES 56
State Guarantees
Guarantees to the Sector/
Total Revenue Receipts
(%)
Nagaland 0 0%
Source: State Government annual accounts from CAG, 2011-12
In 2011-12, the guarantee provided to the utilities was highest in Rajasthan. The guarantee
provided to the utilities relative to revenue receipts of the states was the highest in
Rajasthan followed by Meghalaya and Punjab. In majority of states, the guarantee
provision to the state utilities was relatively low, both in quantum and as a percentage of
revenue, as presented in the chart below.
Figure IV-3: Guarantees to Power Sector 2011-12
Source: State Government annual accounts from CAG (2011-12)
As observed from the annual accounts of state governments:
In Rajasthan, 84% of Guarantees given to Power Sector were made towards
Distribution sector and 6 % towards Transmission sector.
In Tamil Nadu, 80% of the Guarantees given to Power Sector were made towards
Tamil Nadu Generation and Distribution Corporation Limited (TANGEDCO) and
remaining 20% were made towards Tamil Nadu Transmission Corporation Limited
(TANTRANSCO)
In Andhra Pradesh, 58% of the Guarantees, given to Power Sector, were made
towards Generation Sector and 34% towards AP Power Finance Corporation.
In Haryana, 48% Guarantees given to Power Sector were made towards Distribution
sector and 38 % towards Transmission sector.
Thus, it can be observed that the majority of the guarantees provided by the state
government are towards the distribution sector.
0%
20%
40%
60%
80%
100%
120%
140%
0
10000
20000
30000
40000
50000
60000
Shar
e in
Sta
te r
eve
nu
e (
%0
Gu
aran
tess
(R
s C
r)
Guarantees to Power Sector 2011-12
Guarantees Guarantees to the Sector/ Total Revenue Receipts(%)

AF-MERCADOS EMI
POWER SECTOR OPERATIONS AND IMPACT ON STATE FINANCES 57
4. FINANCIAL BAGGAGE
An expert Group under the Chairmanship of Shri Montek Singh Ahluwalia, the then Member
(Energy), Planning Commission recommended a scheme for one-time settlement of dues
payable by State Electricity Boards (SEBs) to Central Public Sector Undertakings (CPSUs)
and the Railways. The recommendations were accepted by the Government of India. All the
28 State Governments signed the Tripartite Agreement envisaged under the scheme which
is between the State Government, Reserve Bank of India and the Government of India.
Bonds amounting to Rs. 31581.2676 crore were issued by 27 States. Goa had no
outstanding dues. Government of National Capital Territory of Delhi securitized its
outstanding dues by converting the dues into long-term advances of Rs. 3376.6960 crore
payable to the CPSUs concerned under Bi-partite Agreement as they do not have power to
issue Bonds.13
The table below provides the value of power bonds issued in 2004-05 and outstanding
liability of the state as of 2013-14
Table IV-5: Value of Power Bonds issued in 2004-05 and outstanding liability of
the state as of 2013-14
States Value of Power Bonds Issued by
the States
Value of Bonds as on March 31st
2012
Value of Bonds as on March 31st
2013
Value of Bonds as on March
31st 2014
Rs Crore
Andhra Pradesh 2436.098 970 730 490
Bihar 2075.61 830 620 420
Chhattisgarh 483.22 190 140 100
Goa 0 0 0 0
Gujarat 1628.712 650 490 330
Haryana 2022.29 810 610 400
Jharkhand 2115.3236 850 630 420
Karnataka 550.954 0 0 0
Kerala 1158.252 460 350 230
MP 2663.89 1070 800 530
Maharashtra 1018.594 410 310 200
Orissa 1102.874 440 330 220
Punjab 637.346 250 190 130
Rajasthan 368.782 60 60 60
Tamil Nadu 1962.14 0 0 0
Uttar Pradesh 5871.86 2350 1760 1170
West Bengal 1963.776 790 590 390
Arunachal Pradesh 24.072 10 10 0
Assam 857.534 340 260 170
Himachal Pradesh 70.248 30 20 10
J&K 1590.812 640 480 320
13 Ministry of Power Annual Report 2005-06

AF-MERCADOS EMI
POWER SECTOR OPERATIONS AND IMPACT ON STATE FINANCES 58
States Value of Power
Bonds Issued by the States
Value of Bonds as on
March 31st 2012
Value of Bonds as on
March 31st 2013
Value of Bonds
as on March 31st 2014
Manipur 157.094 60 50 30
Meghalaya 13.99 10 0 0
Mizoram 45.566 20 10 10
Nagaland 78.92 30 20 20
Sikkim 47.802 20 10 10
Tripura 63.508 30 20 10
Uttarakhand 572 230 170 110
Total 31581.2676 11550 8660 5780
Source: Ministry of Power Annual Report 2005-06 and State Finances: A Study of Budgets of 2013-14,
Reserve Bank of India, January 2014
Existing Power Bonds will be redeemed completely by 2016-17. However, as per the FRP,
the State Governments will take over a total of approx. Rs. 60,000 Cr. (50% of
Discoms’ STL) in 2-5 years. The State Governments will redeem these from 2018-19
onwards in annual installments in next 10 years. Repayment pressure is expected to
increase from 2018-19 for states participating in FRP.
5. FINANCING REQUIREMENT
Based on the assessment of state expenditure and income from the power sector, the
overall impact of the power sector on state finances has been assessed in this section. This
analysis includes the following:
The Discom losses and Financing Requirement as percentage of Gross State
Domestic Product
The Accumulated Discom losses and Financing Requirement as percentage of Gross
State Domestic Product
The sector financing requirement (which includes financing for Generation, Transmission
and Distribution) is calculated by taking the total expenditure of the state on sector which
includes Capital and Revenue expenditure, Loans and Advances (Net of Receipts) and Public
Debt (Net of Receipts).
1. Financing Requirement with Discom Losses (with Subsidy realized)
The table below presents the financing requirement (including Discom losses in 2011-12)
as a percentage of GSDP.
Table IV-6: Expenditure on Power Sector, Discom Losses, Sector financing requirement
with Discom Losses, GSDP, and Sector Financing Requirement /GSDP 2011-12.

AF-MERCADOS EMI
POWER SECTOR OPERATIONS AND IMPACT ON STATE FINANCES 59
State
Total
Expendi
ture
Loans
and
Advance
s
(Net of
Recoveri
es)
Interna
l Debt
(Net of
Receipt
s)
Central
Govern
ment
loan
(Net of
Receipts
)
Disco
m
Losse
s
Sector
Financin
g
Require
ment
Gross
State
Domesti
c
Product
Sector
Financin
g
Require
ment
/GSDP
In Rs Cr
Kerala 98 0 116 0 241 -27 2,10,10
7 0%
West
Bengal 328 (271) 242 0 95 204
3,18,87
1 0%
Orissa 205 208 110 7 (423) 953 1,30,66
9 1%
Assam 219 64 0 0 (407) 690 58,561 1%
Uttarakh
and 52 44 57 0 (417) 570
8,05,03
1 1%
Maharas
htra 7,389 4 0 0 (808) 8,201
3,98,88
4 1%
Gujarat 4,239 17 0 5 134 4,127 80,172 1%
Tripura 64 10 6 0 (156) 236 15,645 2%
Karnata
ka 6,408 21 0 2 (103) 6,534
2,86,41
0 2%
Punjab 3,201 0 64 0 (451) 3,716 1,56,45
4 2%
Andhra
Pradesh 4,449 1,440 634 0
(4,02
2) 10,545
4,05,04
6 3%
Uttar
Pradesh 7,850 0 41 0
(4,33
2) 12,223
4,23,26
1 3%
Chhattis
garh 1,237 -98 0 0
(1,31
0) 2449 84,674 3%
Sikkim 136 0 5 0 (9) 149 5,148 3%
Himacha
l
Pradesh
357 472 0 0 (513) 1,343 41,939 3%
Meghala
ya 166 29 1 0 (195) 392 11,085 4%
Bihar 2,270 926 208 0 (1,80
8) 5,211
1,44,27
8 4%
Haryana 4,393 127 202 0 (3,67
4) 8,396
1,79,09
7 5%
Jharkha 860 165 212 0 (3,21 4,447 91,421 5%
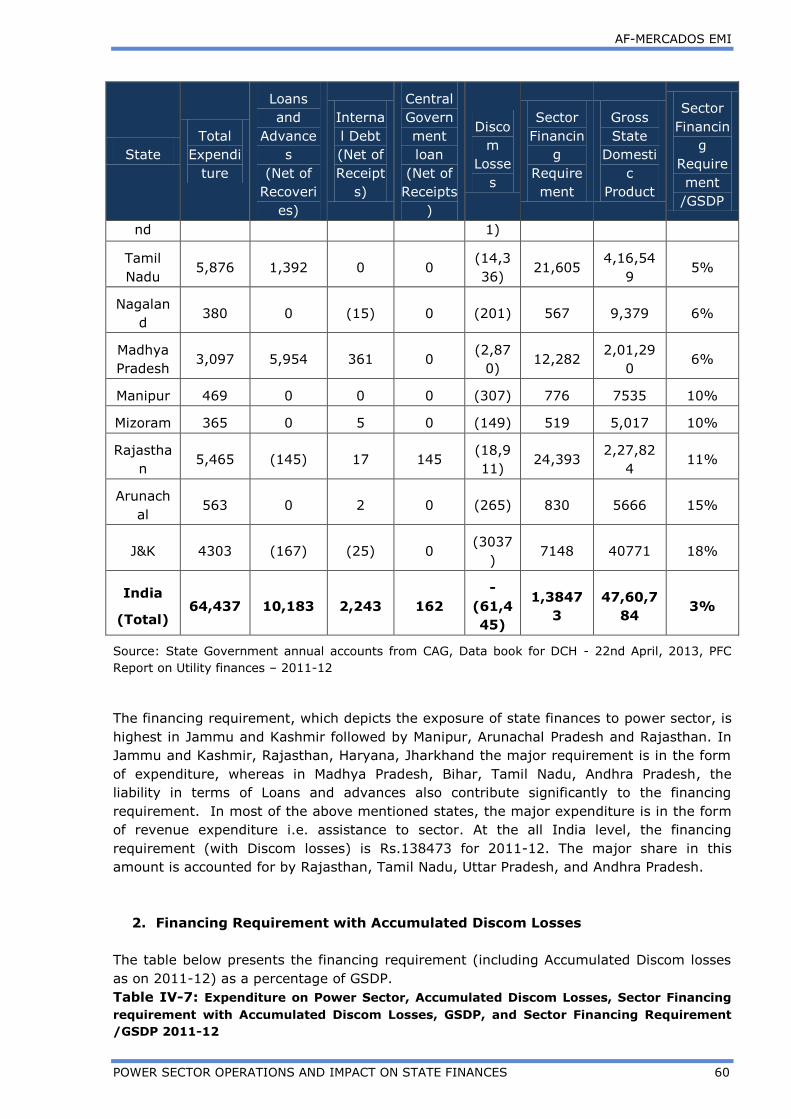
AF-MERCADOS EMI
POWER SECTOR OPERATIONS AND IMPACT ON STATE FINANCES 60
State
Total
Expendi
ture
Loans
and
Advance
s
(Net of
Recoveri
es)
Interna
l Debt
(Net of
Receipt
s)
Central
Govern
ment
loan
(Net of
Receipts
)
Disco
m
Losse
s
Sector
Financin
g
Require
ment
Gross
State
Domesti
c
Product
Sector
Financin
g
Require
ment
/GSDP
nd 1)
Tamil
Nadu 5,876 1,392 0 0
(14,3
36) 21,605
4,16,54
9 5%
Nagalan
d 380 0 (15) 0 (201) 567 9,379 6%
Madhya
Pradesh 3,097 5,954 361 0
(2,87
0) 12,282
2,01,29
0 6%
Manipur 469 0 0 0 (307) 776 7535 10%
Mizoram 365 0 5 0 (149) 519 5,017 10%
Rajastha
n 5,465 (145) 17 145
(18,9
11) 24,393
2,27,82
4 11%
Arunach
al 563 0 2 0 (265) 830 5666 15%
J&K 4303 (167) (25) 0 (3037
) 7148 40771 18%
India
(Total) 64,437 10,183 2,243 162
-
(61,4
45)
1,3847
3
47,60,7
84 3%
Source: State Government annual accounts from CAG, Data book for DCH - 22nd April, 2013, PFC
Report on Utility finances – 2011-12
The financing requirement, which depicts the exposure of state finances to power sector, is
highest in Jammu and Kashmir followed by Manipur, Arunachal Pradesh and Rajasthan. In
Jammu and Kashmir, Rajasthan, Haryana, Jharkhand the major requirement is in the form
of expenditure, whereas in Madhya Pradesh, Bihar, Tamil Nadu, Andhra Pradesh, the
liability in terms of Loans and advances also contribute significantly to the financing
requirement. In most of the above mentioned states, the major expenditure is in the form
of revenue expenditure i.e. assistance to sector. At the all India level, the financing
requirement (with Discom losses) is Rs.138473 for 2011-12. The major share in this
amount is accounted for by Rajasthan, Tamil Nadu, Uttar Pradesh, and Andhra Pradesh.
2. Financing Requirement with Accumulated Discom Losses
The table below presents the financing requirement (including Accumulated Discom losses
as on 2011-12) as a percentage of GSDP.
Table IV-7: Expenditure on Power Sector, Accumulated Discom Losses, Sector Financing
requirement with Accumulated Discom Losses, GSDP, and Sector Financing Requirement
/GSDP 2011-12

AF-MERCADOS EMI
POWER SECTOR OPERATIONS AND IMPACT ON STATE FINANCES 61
State
Total
Expend
iture
Loans
and
Advanc
es
(Net of
Recove
ries)
Interna
l Debt
(Net of
Receipt
s)
Centra
l
Gover
nment
loan
(Net
of
Receip
ts)
Accumula
ted
Discom
Profit/Los
ses
Sector
Financin
g
Require
ment
Gross
State
Domesti
c
Product
Sector
Financin
g
Require
ment
/GSDP
In Rs. Cr
Kerala 98 0 116 0 1,968 (1,754) 2,10,10
7 -1%
West
Bengal 328 (271) 242 0 (216) 515
3,18,87
1 0%
Gujarat 4,239 17 0 5 413 3,848 3,98,88
4 1%
Maharash
tra 7,389 4 0 0 (4,649) 12,042
8,05,03
1 1%
Andhra
Pradesh 4,449 1,440 634 0 145 6,378
4,05,04
6 2%
Karnatak
a 6,408 21 0 2 (1,452) 7,883
2,86,41
0 3%
Orissa 205 208 110 7 (3,716) 4,246 1,30,66
9 3%
Tripura 64 10 6 0 (517) 597 15,645 4%
Chhattisg
arh 1,237 (98) 0 0 (2,187) 3,326 84,674 4%
Uttarakha
nd 52 44 57 0 (2,365) 2,518 58,561 4%
Himachal
Pradesh 357 472 0 0 (1,407) 2,237 41,939 5%
Bihar 2,270 926 208 0 (7,675) 11,078 1,44,27
8 8%
Haryana 4,393 127 202 0 (10,138) 14,860 1,79,09
7 8%
Meghalay
a 166 29 1 0 (736) 933 11,085 8%
Tamil
Nadu 5,876 1,392 0 0 (27,786) 35,055
4,16,54
9 8%
Uttar
Pradesh 7,850 0 41 0 (30,182) 38,073
4,23,26
1 9%
Jharkhan 860 165 212 0 (9,290) 10,526 91,421 12%

AF-MERCADOS EMI
POWER SECTOR OPERATIONS AND IMPACT ON STATE FINANCES 62
State
Total
Expend
iture
Loans
and
Advanc
es
(Net of
Recove
ries)
Interna
l Debt
(Net of
Receipt
s)
Centra
l
Gover
nment
loan
(Net
of
Receip
ts)
Accumula
ted
Discom
Profit/Los
ses
Sector
Financin
g
Require
ment
Gross
State
Domesti
c
Product
Sector
Financin
g
Require
ment
/GSDP
d
Madhya
Pradesh 3,097 5,954 361 0 (14,411) 23,823
2,01,29
0 12%
J n K 4,302 (167) (25) 0 (1,677) 5,787 40,771 14%
Nagaland 380 0 (15) 0 (1,131) 1,497 9,379 16%
Rajasthan 5,465 (145) 17 145 (40,941) 46,423 2,27,82
4 20%
Arunachal
Pradesh 563 0 2 0 (1,344) 1,909 5,666 34%
Manipur 469 0 361 0 (1,760) 2,590 7,535 34%
Assam 219 64 0 0 0 0 80,172 0%
Mizoram 365 0 5 0 0 0 5,017 0%
Punjab 3,201 0 64 0 0 0 1,56,45
4 0%
Sikkim 136 0 5 0 0 0 5,148 0%
India
(Total)
64,43
7
10,19
3 2,603 145
-
1,61,054
2,3808
2
47,60,
784 5%
Source: State Government annual accounts from CAG, Data book for DCH - 22nd April, 2013, PFC
Report on Utility finances – 2011-12
Considering accumulated Discom losses, some of the states with relatively high financing
requirement are Rajasthan, Jammu and Kashmir, Madhya Pradesh, Jharkhand, Tamil Nadu.
In comparison to the financing requirement with Discom Losses, the burden on state
finances in states like Jharkhand, Uttar Pradesh, Uttarakhand etc. has worsened. In case of
Kerala and Punjab, when considering the accumulated losses, the states have a lower
financing requirement. The total all India level of financing requirement (with accumulated
losses) of Power sector is Rs 238082 Cr for 2011-12. The states that significantly contribute
to this amount are namely Rajasthan, Uttar Pradesh, Tamil Nadu and Madhya Pradesh.
Conclusion
Considering the overall scenario, the exposure of state finances to power sector is highest
for the states like Rajasthan, Tamil Nadu, Uttar Pradesh, Madhya Pradesh, Andhra Pradesh,
Haryana, Karnataka, and Bihar.
The financing requirement (inclusive of Discom Losses) for the power sector is
highest in Rajasthan followed by Tamil Nadu, Uttar Pradesh and Madhya Pradesh.

AF-MERCADOS EMI
POWER SECTOR OPERATIONS AND IMPACT ON STATE FINANCES 63
The four states constitute for 52% of the all India level financing requirement of the
state. These states have very high Discom Losses for 2011-12 and accumulated
Discom Losses as well. In Rajasthan, the state guarantees towards power sector are
as high as 120% of the total state revenue. In Madhya Pradesh, a major financing
requirement is in the form of loans and advances. The liability of redeeming the
Power bonds is quite substantial in Madhya Pradesh.
In Andhra Pradesh, Karnataka, Haryana Jharkhand, Punjab, Jammu & Kashmir and
Bihar, the financing requirement (inclusive of Discom Losses) for the power sector,
constitute more than 30% of the all India level power sector financing requirement.
The major components of financing requirement for Andhra Pradesh, J & K,
Jharkhand and Haryana are significant state expenditure and Discom losses, for
Bihar it is the same along with substantial Loans and advances and for Karnataka
and Punjab it is mainly the state expenditure. The liability of redeeming the Power
bonds is quite substantial in Haryana, Bihar and Jharkhand.
The exposure of state finances to power sector is considerably low in states like
Maharashtra, Gujarat, Kerala, Himachal Pradesh, West Bengal and Orissa.
The Discom losses, in the above mentioned states are very low. In fact, for Kerala,
West Bengal and Gujarat, the Discoms Accounted for Profits (with subsidy realised)
Considering the Accumulated Discom losses, Gujarat and Kerala have accounted for
profits and in West Bengal and Himachal Pradesh the amount is relatively low.
The contribution towards all India level revenue from Power sector is highest from
Maharashtra followed by Gujarat. The two states contribute 43% in the all India
level revenues from the sector.

AF-MERCADOS EMI
POWER SECTOR OPERATIONS AND IMPACT ON STATE FINANCES 64
Discoms
The Estimated Loss for the current year
State Government LoansGrants and Reimbursement support by Central Government
Short Term Liabilities* (Short term loans, working capital loans, payables to suppliers)
*Discoms would initially issue bonds to participating lenders with the State government’s guarantee. Gradually, in five years, the govt. will issue special securities to take over this liability. Till that time, the state govt. will provide full support for principal repayment and interest.
Amount as of March 31, 2012 -50% to be absorbed by the state govt.* (3-5 yr. moratorium on principal repayment) and 50% rescheduled with a 3 yr. moratorium on principal payment (repayment of principal and interest to be fully secured by state govt. guarantee).
State Govt. loans will be converted to equity to defer interest and repayments till Banks and FI’s are paid out.
Banks will fund 70% and the State Govt. will meet the remaining 30% with subsidy.
Grants equal to the value of energy saved by accelerated AT&C loss reduction beyond the RAPDRP targets (AT&C>30% - 3%/year, AT&C<30% - 1.5%/year)
will be given to the Discom. Also, reimbursement of 25% of principal repayment of bonds issued by Discoms.
Loans by Banks/FIs
Banks will not be allowed to fund cash losses of Discoms. A
special arrangement for financing of operational losses and interest in first 3 years will be worked out.
V FINANCIAL RESTRUCTURING PLAN
1. INTRODUCTION
In 2012, to alleviate the poor state of finances of the utilities while simultaneously
providing incentives to improve efficiency, GoI approved a Financial Restructuring Plan to
restructure Rs 1.9 lakh crore debt of Discoms. The plan is now under implementation in
some of the poorly performing states. Along with the debt restructuring, the government
has proposed tough measures to ensure that it does not meet the same fate as the one
time settlement scheme of year 2001. The re-schedulement of loans is to be accompanied
by measurable actions to improve the operational performance of the distribution utilities.
It focuses on tariff rate revisions, supplemented with earning through reduced losses. For
monitoring the progress of turnaround plan, two committees at state and central levels are
to be formed.
The schematic description of the plan is provided below:
Figure V-1: Financial Restructuring Plan (FRP) of GoI
2. TRANSITIONAL FINANCE MECHANISM AND MANDATORY
CONDITIONS
Support from the Central Government under the Transitional Finance Mechanism (TFM)
is available to all Discoms participating in the FRP. The grants support will be provided
mainly on two accounts:
TFM

AF-MERCADOS EMI
POWER SECTOR OPERATIONS AND IMPACT ON STATE FINANCES 65
a. Reducing the AT&C losses beyond the RAPDRP trajectory
The central government will provide support by way of grant equal to value of additional
energy saved as a result of AT&C loss reduction for the next 3 financial years, starting April
1, 2012. The AT&C losses in 2010-11 will be taken as the reference (starting) point. The
eligibility of this grant would depend upon the ACS-ARR gap, which is required to be
reduced by 25% each year from the 2010-11 levels. The loss reduction targets are
mentioned below -
i. Discoms with AT&C losses>30% - Reduction by 3% per year
ii. Discoms with AT&C losses<30% - Reduction by 1.5% per year
To illustrate, say the AT&C losses for a state are 35% in 2010-11. If the state reduces
these losses to 31% in 2012-13, the reduction of 4% (which is 1% more than the 3%
target), will make the state eligible for a grant equal to 1% of the total energy sale in
2012-13. However, the state will be eligible for this grant only if the ACS-ARR Gap is
reduced by 25% of the Gap level in 2010-11.
b. Capital incentives for 50% short term liability (STL) to be taken over by
state government by issuance of special securities to lenders.
A reimbursement support of 25% of principal repayment of bonds/special securities issued
by state government will be provided by central government; however, this will be provided
only if the state government takes over the entire 50% of STL corresponding to the
accumulated losses outstanding on 31.3.2012.
It is important to note that both the forms of support mentioned above are also subject to
fulfillment of all mandatory conditions stipulated in the FRP scheme. The key mandatory
conditions are mentioned below.
a. Discoms should eliminate the Gap between ACS and ARR within the moratorium
period.
b. State government and Discoms not to resort to short term loans from Banks/FIs to
fund operational losses.
c. Preparation of road-map to increase private sector participation in distribution
through franchisees to be prepared by Discoms within a year and submitted to CEA
for approval.
d. Latest tariff order to be filed for 2012-13 before FRP is approved, and for following
years it should be notified by April 30 every year.
e. Fuel Cost adjustment to be allowed as directed by APTEL to off-set increase in power
purchase cost.
f. APTEL to be approached for recovery of expenditure disallowed by SERC which in
the opinion of Discoms should be allowed.
g. Time bound plan for liquidation of regulatory assets to be submitted and the same
to be incorporated in their ARR petitions.
h. Monitoring Committee at state level to be setup for effective implementation of
scheme.
i. FRP to include targets for progressive reduction in ST power purchase ranging
between 5-10%, 2013-14 onwards as against the benchmark of 2010-11.
j. Release of agriculture subsidy should be based on feeder/distribution transformer
meter data.

AF-MERCADOS EMI
POWER SECTOR OPERATIONS AND IMPACT ON STATE FINANCES 66
k. Prepaid meters to be installed by 31.3.2013 for all government consumers and large
consumers (>1 MW) where defaults have occurred.
l. A time bound plan for metering of all categories of consumers to be put in place and
submitted to Central Level Monitoring Committee and State Level Monitoring
Committee.
m. Audited accounts for and up to 2010-11 must be finalized
Considering the above, it can be observed that FRP announced by GoI can potentially have
a significant impact on the state finances and improve the financial health of the utilities.
Given this context, it is important to look at the following:
Current status of FRP implementation in states
FRP Outlook of States
3. CURRENT STATUS OF FRP IN STATES14
Given below is the state level current status of FRP approval and implementation as of
June, 2014.
Table V-1: Status of FRP in states as of June 2014 (Figures in Rs. Crore)
States
Accumulat
ed Losses
as on
31.3.2012
STL
(eligible
under
the
scheme)
Bonds
issued by
Discoms to
participatin
g lenders
Operation
al losses
to be
funded
(2013-14)
Liquidation of
Regulatory
Assets
Tamil
Nadu 53696 12,765 6353 2887
Commission has
arrived at RA of
Rs 25,644 Cr. for
2013-14
Rajasthan 40942 36,038 17961 9016
Will start after
2016-17
Haryana 19707 14,764 7366 3209
HERC has allowed
recovery of 45%
of regulatory asset
implemented
through tariff
order 2013-14.
Regulatory Asset
to be recovered
within a period of
3 years.
Andhra
Pradesh 6353 7438 4046
Operational
losses are
not funded
No Regulatory
assets
14 Himachal Pradesh has also opted for the FRP scheme. However, it has been excluded from our study on FRP
states due to lack of data availability

AF-MERCADOS EMI
POWER SECTOR OPERATIONS AND IMPACT ON STATE FINANCES 67
States
Accumulat
ed Losses
as on
31.3.2012
STL
(eligible
under
the
scheme)
Bonds
issued by
Discoms to
participatin
g lenders
Operation
al losses
to be
funded
(2013-14)
Liquidation of
Regulatory
Assets
Telangana 11314 9231 4553
Operational
losses are
not funded
No Regulatory
assets
Uttar
Pradesh 33600 31680 15810 5070
Regulatory
surcharges at the
rate of 3.71% was
approved in the
Tariff Order 2013-
14 and 2.84% has
been allowed for
the FY 2014-15
and 2015-16.
Bihar 9629* 1782 818
State Govt.
has been
funding for
the resource
gap
The regulatory
assets as per
Tariff Order for
2015-16 is Rs.
103 Crores which
will be adjusted by
the Regulator at
the time of True-
up.
Jharkhand 11957 5710
It is proposed
that the entire
amount of STL
will be
serviced
through debt,
which is in
deviation from
the FRP
scheme. The
matter is
pending with
the Ministry of
Power for
approval.
Discoms
decided not
to avail
operational
loss funding.
No regulatory
asset
Source: Ministry of Power along with the updated data based on the latest submissions by the States
to the FFC
*Accumulated losses for Bihar is as on 31/10/2012
As shown in the table above, the amount of liabilities that are expected to be restructured
through the FRP scheme is extremely significant. This is certain to have a considerable
impact on the Discoms’ finances in the near term. The liquidity position of the Discoms is
bound to improve in the short-term, which in turn will benefit other participants in the
power supply value chain. However, several critical parameters under the FRP are stated to
be ‘under-progress’ in most of the states availing the scheme. To achieve long term

AF-MERCADOS EMI
POWER SECTOR OPERATIONS AND IMPACT ON STATE FINANCES 68
financial viability of Discoms, achieving respective targets for these parameters becomes
very critical. If these key parameters are neglected, the very goals of the scheme will be at
risk. For example, privatization initiatives are very tepid at this time. For most participant
states, the road-map for implementation is either being finalized or being discussed with
the state government. Two of the states, Uttar Pradesh (in Agra and Noida) and Jharkhand
(Ranchi and Jamshedpur) have started the process.
4. FRP OUTLOOK
Based on the above discussion, it is important to analyze the historical trends in key
parameters on a state-level in order to comment upon the the likeliness of the state to
meet certain eligibility conditions set forth by the FRP and extract long-term financial
benefit from the scheme.
The color scheme used in the tables for each state in this section, refer to the color key
provided here:
Area of concern
Can be better
Good
4.1 Tamil Nadu
TANGEDCO reported a financial loss (without subsidy) of Rs.16,420 Cr. in 2011-12,
translating into a financial gap of Rs.2.47/kWh. The financial gap has stayed at over Rs.
1.5/kWh for the last four years. In order to rescue TANGEDCO from the existing financial
crisis, the Government of Tamil Nadu approved the above mentioned FRP scheme. As per
this scheme, the state government would take over Rs.6353 cr. (50% of STL) by issue of
bonds by TANGEDCO to participating lenders. The interest burden for the State
Government on the bonds would be Rs. 559 Cr. per annum till redemption (5 years). The
scheme would also permit TANGEDCO to restructure the remaining 50% of STL backed by
government guarantee, with a repayment of principal in 7 years period after moratorium of
3 years. The operational losses of TANGEDCO during the interim period would be funded
under the FRP scheme as per the following terms:
Table V-2: Operating losses funding Schedule – TANGEDCO
Particulars
Years
2012-13 2013-14 2014-15
Cash loss/Operating
loss (Rs.Cr.) 8183 3849 2060
Funding by banks 100% 75% 50%
Funding by GoTN - 25% 50%
Source: Data submitted by the state to the FFC

AF-MERCADOS EMI
POWER SECTOR OPERATIONS AND IMPACT ON STATE FINANCES 69
Some of the key parameters relevant to successful FRP implementation at the state level
have been presented for Tamil Nadu in the table below.
Table V-3: Historical Parameters – Tamil Nadu
Key Parameters 2005-06
2006-
07
2007-
08
2008-
09
2009-
10
2010-
11
2011-
12
2012-
13
2013-
14
AT&C losses 17% 16% 16% 14% 19% 19% 20% n.a n.a
Tariff Hikes 0% 0% 0% 0% 0% 9% 9% 37% 4%
Subsidy
Received/Booked 100% 100% 100% 86% 100% 100% 100% n.a n.a
Interest Cost/Total
Cost 6% 6% 7% 8% 10% 11% 10% n.a n.a
ACS-ARR Gap w/o
subsidy – Rs./kWh 0.49 0.44 0.81 1.55 1.77 2.00 2.47 n.a n.a
Source: PFC report on utility finances and Discom ARRs
Some of the key observations from the above table, along with relevant state-level aspects
are listed below.
- The AT&C losses in Tamil Nadu have ranged from 15-20% during the period under
review. A >1.5% annual reduction in AT&C losses, in order to benefit from the
central grants support scheme, will require persistent efforts on part of the Discom.
However, it is important to note here that AT&C losses are based on the estimated
consumption in the agricultural sector. Agriculture and hut service connections are
provided free supply of power and they are entirely unmetered in Tamil Nadu.
Hence, it might not be totally appropriate to take the AT&C loss benchmark point of
2010-11 as given in the table above.
- The regulatory commission in Tamil Nadu revised tariffs in 2010-11, after a period
of 7 years. In the last 3 financial years, the tariffs have been revised regularly (as
much as 37% in 2012-13). In 2011-12, the state revised tariff for agriculture from
Rs. 250/HP/annum to Rs. 2500/HP/annum. As part of the FRP, it is critical for the
regulator to increase tariffs on a consistent basis in order to eliminate the revenue
gap in next 4 years.
- Transparency in disbursement levels, a requirement of the FRP, can be judged on
two accounts. The subsidy received-booked ratio has consistently been at 100%,
indicating that the Discom, regulator, and the state government have been in sync
with respect to the amount booked and actually disbursed. It is however important
to note that since the FRP requires the state government to release agricultural
subsidy based purely on accurate feeder metering data levels, it might limit subsidy
levels considering the complete lack of agricultural metering in the state.
- The share of interest expenses is considerably high in the state. The moratorium on
principal repayment of balance loans outstanding will possibly free up funds in the
near term that can aid working capital requirements of TANGEDCO.

AF-MERCADOS EMI
POWER SECTOR OPERATIONS AND IMPACT ON STATE FINANCES 70
- The ACS-ARR Gap needs to be reduced by 25% every year (from the 2010-11
benchmark of Rs. 2/kWh) in the moratorium period to be eligible for the central
grants incentive. The Discom has brought down the revenue gap to zero15 in 2012-
13, making it eligible for the grants benefit. This is largely due to the significant
tariff revision in the same year.
In conclusion, TANGEDCO has revised tariffs and managed to bring down its revenue gap to
zero. Lack of agricultural metering is a cause of concern on the revenue front since
subsidies will be dependent on that parameter and also on accurate estimation of AT&C
Losses. Along with revenue realization, however, power procurement cost optimization will
be crucial for the state to keep the power purchase costs under control and achieve its
financial gap targets.
4.2 Uttar Pradesh
The five Discoms in Uttar Pradesh reported a combined financial loss (without subsidy) of
Rs.7,928 Cr. in 2011-12, translating into a financial gap of Rs.1.13/kWh. The financial gap
has stayed at over Rs. 1/kWh for the last five years. The financial health of the Discoms is
even worse when its short-term liabilities are considered. Due to the existing financial
crisis, the Government of Uttar Pradesh has approved the FRP scheme.
As per the scheme, the state government would take over Rs.15,810 cr. (50% of STL) by
issue of bonds by the Discoms backed by Government guarantee to participating lenders.
The scheme would permit the Discoms to restructure the remaining 50% of STL backed by
government guarantee, with a negotiated moratorium period. The Discoms had issued
bonds for Rs. 15840 Crores, however, the bonds were not fully subscribed by the banks
leaving a shortfall of Rs. 29.62 Crores. This liability remains unfunded and shall be
discharged by the Discoms from their current revenues.
The bonds will be converted into special securities of the Government in three year time
frame starting from 2014-15 till 2016-17 with Rs. 5270.13 Crores converted each year.
The following table highlights the bond repayment schedule and State Government fiscal
impact under FRP.
Table V-4: Bond Repayment Schedule and State Government fiscal impact – Uttar Pradesh
(Rs. Crores)
Particulars
Years
2012-13
2013-14
2014-15
2015-16
2016-17
2017-18
2018-19
2019-20
Total
Interest @ 9.68% - - 1530 1530 1530 1530 1530 1379 9029
Redemption of bonds
- - - - - - 1581 1581 3162
Additional subsidy burden
375 461 917 1413 3500 4000 500 0.00 11166
Total 375 461 2447 2943 5030 5530 3611 2960 73319
Source: Data submitted by the state to the FFC
Some of the key parameters relevant to FRP implementation have been shown in the table
below for Uttar Pradesh.
15 As per ‘Status of compliance of APTEL order OP No. 1 of 2011: For financial year 2012-13’

AF-MERCADOS EMI
POWER SECTOR OPERATIONS AND IMPACT ON STATE FINANCES 71
Table V-5: Historical Parameters – Uttar Pradesh
Key Parameters 2005-06
2006-
07
2007-
08
2008-
09
2009-
10
2010-
11
2011-
12
2012-
13
2013-
14
AT&C losses 44% 44% 35% 35% 34% 40% 45% n.a n.a
Tariff Hikes 0% 0% 0% 20% 19% n.a n.a 9% 16%
Subsidy
Received/Booked 100% 100% 100% 100% 100% 100% 100% n.a n.a
Interest Cost/Total
Cost 4% 4% 4% 4% 6% 3% 2% n.a n.a
ACS-ARR Gap w/o
subsidy – Rs./kWh 1.10 1.02 1.14 1.17 1.27 0.82 1.13 n.a n.a
Source: PFC report on utility finances and Discom ARRs
Some of the key observations from the above table, along with relevant state-level aspects
are listed below.
- The Aggregated Technical & Commercial losses (AT&C) for Uttar Pradesh distribution
utilities have historically remained high (averaging at 40%) on account of ageing
transmission and sub-transmission network. Uttar Pradesh will require a >3%
annual reduction in AT&C losses in order to benefit from the central grants scheme.
The higher the reduction (over 3%), greater is the potential for receiving the grants
from the central government.
- While the state has revised tariffs in last 2 years, the regulator will need to hike
tariffs frequently and substantially. In the past, there have been periods of 2-3
years with no tariff revisions at a stretch.
- The subsidies received-booked ratio has continued to be 100% for last 6-7 years. It
is however important to note that since the FRP requires the state government to
release agricultural subsidy based purely on accurate feeder metering data levels, it
might limit subsidy levels considering the existing low level of agricultural metering
(9%).
- The share of interest expenses is not very high in Uttar Pradesh. The total debt
taken by the Discoms was Rs. 4952 crores and the debt-equity ratio stood at 0.4 in
2011-12. While those figures sound relatively moderate for the loss making Uttar
Pradesh Discoms, the payables to suppliers on the Discoms’ balance sheet stood at
Rs. 39,716 crores in the same year. Clearly, the Discoms have not regularly paid the
suppliers. Lack of timely payments will force the suppliers to cut supply, increasing
the Discoms’ reliance on short term power further.
- The ACS-ARR Gap needs to be reduced annually by 25% from the 2010-11
benchmark value to be eligible for the central grants incentive. The gap will need to
be reduced by around 20 paise per year in the next 3-4 years. Assuming the AT&C
losses are reduced by 3%, the financial gap will come down by around 15 paise/unit
in terms of the cost reduction achieved by purchasing fewer units to supply the
same amount of power as in 2011-12. This implies that the technical losses will

AF-MERCADOS EMI
POWER SECTOR OPERATIONS AND IMPACT ON STATE FINANCES 72
need to be brought down by a considerable amount, unless the tariffs are revised to
increase the revenue realization.
In conclusion, the huge short term payables in Uttar Pradesh are a matter of concern and
the FRP is expected to improve its short term liquidity position. The AT&C losses are
significantly high and considerable improvement is required on that front. In order to bring
down the ACS-ARR gap, the Discoms will need to revise tariffs adequately and bring down
technical/commercial losses.
4.3 Rajasthan
The three Discoms in Rajasthan reported a combined financial loss (without subsidy) of
Rs.20,671 Cr. in 2011-12, translating into a financial gap of Rs.4.38/kWh. The financial gap
in 2010-11 was Rs 2.4/kWh. The sudden increase in the gap is due to a huge figure of
subsidy receivables being expensed as bad debt in 2011-12.
As per the FRP scheme, the Rajasthan government would take over Rs.17,961 cr. (50% of
STL) by issue of bonds by the Discoms backed by Government guarantee to participating
lenders. The scheme would permit the Discoms to restructure the remaining 50% of STL
backed by government guarantee, with a negotiated moratorium period. The following table
highlights the bond repayment schedule and State Government fiscal impact under FRP.
Table V-6: Bonds re-payment Schedule by the State Government and State fiscal impact –
Rajasthan (Rs. Crore)
Particulars Years
FY14 FY15 FY16 FY17 FY18 FY19 FY20
Bonds taken over schedule
3340 4500 5700 4421 - - -
Interest liability (A) - - 1787 1787 1787 1698 1519
Cash support from State Govt. (B)*
- - 3272 3499 3753 4027 4335
Net Repayment liability on bonds taken over by State Govt (C)
- - - - - 1347 1347
Total (A+B+C) 5059 5286 5540 7072 7201
Source: Data submitted by the state to the FFC
* Cash support includes interest-free loans from State Govt., Cash support from State Govt.,
reimbursement of losses, electricity duty retention and interest subsidy on IBRD loan.
Total fiscal impact of the FRP on the State Government finances by the end of FY28
includes net repayment of bonds/special securities of Rs. 13471 (i.e., gross repayment of
bonds of Rs. 17961 Cr. less capital reimbursement support from Central Government of
25% of bonds amounting to Rs. 4490 Cr.) and the interest on bonds/special securities
amounting to Rs. 16,892 Cr.
Some of the key parameters relevant to FRP implementation have been shown in the table
below for Rajasthan.
Table V-7: Historical Parameters - Rajasthan
Key Parameters 2005-06 2006-
07
2007-
08
2008-
09
2009-
10
2010-
11
2011-
12
2012-
13
2013-
14

AF-MERCADOS EMI
POWER SECTOR OPERATIONS AND IMPACT ON STATE FINANCES 73
AT&C losses 42% 36% 33% 30% 30% 25% 25% n.a n.a
Tariff Hikes 0% 0% 0% 0% 0% 0% 24% 19% 14%
Subsidy
Received/Booked 62% 66% 38% 13% 7% 11% 100% n.a n.a
Interest Cost/Total
Cost 7% 8% 8% 9% 12% 18% 16% n.a n.a
ACS-ARR Gap w/o
subsidy – Rs./kWh 0.54 0.57 1.10 2.17 2.86 2.40 4.38 n.a n.a
Source: PFC report on utility finances and Discom ARRs
Some of the key observations from the above table, along with relevant state-level aspects
are listed below.
- The AT&C losses have decreased to 25% in 2011-12. A >1.5% annual reduction in
AT&C losses will be required in order to benefit from the central grants support
scheme. If the Discoms continue to reduce AT&C losses at the rate they have
decreased in the past, the potential grants from the central government will be
significant. However, it is important to note that these losses are calculated on the
basis of metered agricultural consumers. Agricultural metering is currently at 50% in
Rajasthan. Hence, it might not be totally appropriate to consider the 25% loss level
in 2010-11 as the benchmark for the state.
- Tariffs were not revised for a continuous period of 5 years in Rajasthan. In the last
three years, tariffs have been revised substantially. In 2013-14, Rajasthan increased
agriculture tariffs (general category) from Rs 2.25/kWh to Rs 3.93/kWh. Also, tariffs
for unmetered agriculture consumers were hiked by an even higher percentage, in
order to incentivize them to shift to metered category. With limits on subsidy levels,
the regulator will need to revise tariff hikes on a frequent basis in order to bring
down the financial gap, which is currently very high.
- Barring 2011-12, the subsidy received-booked ratio has been quite low in
Rajasthan. Transparency in subsidy sanction and disbursement is a required
condition in the FRP and can possibly be an area of concern.
- The share of Interest expenses has been very high. With 50% of STL being taken
over by the state government and a moratorium on principal payments for the
remaining 50%, the Discoms’ short-term loans, the liquidity position will significantly
improve and aid its working capital requirements.
- The ACS-ARR Gap needs to be reduced yearly by 25% of the 2010-11 benchmark
level in the moratorium period to be eligible for the central grants incentive. By
2014-15, the financial gap will need to be brought down to around 60 paise/kWh.
Assuming the AT&C losses are reduced by 3%, the financial gap will come down by
around 18 paise/unit in terms of the cost reduction achieved by purchasing fewer
units to supply the same power as in 2010-1116. This implies that the technical
16 In order to estimate gap reduction, 2010-11 data has been taken for Rajasthan because the ACS in 2011-12 is
very high due to the bad debt (subsidy receivables) expensed in that year.

AF-MERCADOS EMI
POWER SECTOR OPERATIONS AND IMPACT ON STATE FINANCES 74
losses will need to be brought down by a considerable percentage, unless the tariffs
are revised to increase the revenue realization.
In the state of Rajasthan, lack of tariff hikes and inadequate disbursement of subsidies
have contributed to the deterioration of financial health of Discoms. The reduction in AT&C
loss levels has been significant and similar reduction in the future will allow the state to
benefit from central government grants. While the FRP is expected to significantly improve
the working capital condition of the state in the short-term, it is important to note that the
accumulated financial losses of the Discoms have gone up to Rs 70,000 Cr. even before the
scheme has been implemented. This will have severe cash flow implications in spite of the
respite provided by the moratorium period on repayment of past loans under FRP.
4.4 Haryana
UHBVNL and DHBVNL reported a combined financial loss (without subsidy) of Rs.7060 Cr.
in 2011-12, translating into a financial gap of Rs.2.04/kWh.
As per the FRP scheme, the Haryana government would take over Rs.7382 cr. (50% of
STL) by issue of bonds by the Discoms backed by Government guarantee to participating
lenders. Bonds of Rs. 7367 Cr has been issued by the Discoms as per the sanctions
received from the banks. The State government has also provided a budget of Rs. 721.93
Cr. on account of reimbursement of interest to the Discoms for FY 2014-15 on the bonds
issued. The scheme would also permit the Discoms to restructure the remaining 50% of
STL backed by government guarantee, with a negotiated moratorium period.
The following table highlight the Financial Implication on account of payment of Principal
amount and Interest payment on account of FRP for the period 2015-16 to 2019-20.
Table V-8: Financial Implication on account of payment of Principal amount and
Interest payment – Haryana (Rs. Crores)
Year 2014-15 2015-16 2016-17 2017-18 2018-19 2019-20
Principal - - - 737 737
Interest 722 722 722 722 722 650
Total 722 722 722 722 1459 1387
Source: Data submitted by the state to the FFC
Total fiscal impact of FRP on state resources by the end of FY29 will be Rs.14217 Cr. (Rs
7367 Cr as principal and Rs. 6858 Cr as interest)
Some of the key parameters relevant to FRP implementation have been shown in the table
below for Haryana
Table V-9: Historical Parameters - Haryana
Key Parameters 2005-
06
2006-
07
2007-
08
2008-
09
2009-
10
2010-
11
2011-
12
2012-
13
2013-
14
AT&C losses 43% 26% 32% 33% 29% 28% 28% n.a n.a
Tariff Hikes 0% 0% 0% 0% 0% 19% 0% 19% 13%

AF-MERCADOS EMI
POWER SECTOR OPERATIONS AND IMPACT ON STATE FINANCES 75
Key Parameters 2005-
06
2006-
07
2007-
08
2008-
09
2009-
10
2010-
11
2011-
12
2012-
13
2013-
14
Subsidy
Received/Booked 100% 100% 100% 100% 100% 95% 99% n.a n.a
Interest Cost/Total
Cost 2% 2% 3% 5% 6% 8% 9% n.a n.a
ACS-ARR Gap w/o
subsidy – Rs./kWh 0.73 0.80 1.20 1.58 1.54 1.14 2.04 n.a n.a
Source: PFC report on utility finances and Discom ARRs
Some of the key observations from the above table, along with relevant state-level aspects
are listed below.
- The AT&C losses have come down considerably in the last few years – from over
40% in 2005-06 to 28% in 2011-12. This is in line with reducing agricultural sales. A
>1.5% annual reduction in AT&C losses is required in order to benefit from the
central grants scheme. If the discoms continue to reduce AT&C losses at the rate
they have decreased in the past, the potential grants from the central government
will be significant.
- The tariffs were not revised for a period of 8 years. While the tariffs have been
revised in the last 2-3 years, the frequency of these hikes will play a key role in
determining the financial gap in the future.
- The subsidy received-booked ratio has consistently been close to 100%, indicating
that the Discom, regulator, and the state government have been in sync with
respect to the amount booked and actually disbursed. It is however important to
note that since the FRP requires the state government to release agricultural subsidy
based purely on accurate feeder metering data levels, it might limit subsidy levels
considering the lack of complete agricultural metering in the state. At present, the
agricultural metering is 44%.
- The share of Interest expenses is increasing significantly YoY. With the moratorium
on principal repayments on 50% STL and the remaining being taken over by the
government, the interest burden will reduce to some extent in the short term.
- The ACS-ARR Gap needs to be reduced annually by 25% of the 2010-11 benchmark
level in the moratorium period, in order to be eligible for the central grants
incentive. By 2014-15, the Gap will need to be reduced to 28 paise/unit. To reduce
the financial gap by that extent, tariff revisions will need to be frequent and
substantial.
In Haryana, AT&C losses have improved significantly over the years. However, tariff
revisions have not been frequent. Regular tariff revisions in the last 2-3 years point towards
the utilities’ intent to improve its financial health and meet the requirements set forth by
the FRP.

AF-MERCADOS EMI
POWER SECTOR OPERATIONS AND IMPACT ON STATE FINANCES 76
4.5 Andhra Pradesh and Telangana
As per the FRP scheme, the Andhra Pradesh government would take 50% of STL by issue of
bonds by the Discoms backed by Government guarantee to participating lenders. The
scheme would permit the Discoms to restructure the remaining 50% of STL backed by
government guarantee, with a negotiated moratorium period.
Some of the key parameters relevant to FRP implementation have been shown in the table
below for Andhra Pradesh.
Table V-10: Historical Parameters – Andhra Pradesh
Key Parameters 2005-06 2006-
07
2007-
08
2008-
09
2009-
10
2010-
11
2011-
12
2012-
13
2013-
14
AT&C losses 17% 18% 16% 13% 16% 18% 15% n.a n.a
Tariff Hikes -3% 0% 0% 0% 0% 13% 24% - 29%
Subsidy
Received/Booked 63% 69% 64% 21% 42% 62% 50% n.a n.a
Interest Cost/Total
Cost 5% 4% 3% 3% 5% 5% 6% n.a n.a
ACS-ARR Gap w/o
subsidy - in Rs./kWh 0.26 0.33 0.44 1.10 0.89 0.77 1.08 n.a n.a
Source: PFC report on utility finances and Discom ARRs
Some of the key observations from the above table, along with relevant state-level aspects
are listed below.
- The AT&C losses for Andhra Pradesh distribution utilities have historically remained
on a lower side compared to the national average. This, however, is based on the
estimated consumption in the agricultural sector (in absence of complete agriculture
metering in the state). A >1.5% annual reduction in AT&C losses from 18%
reference point in 2010-11, in order to receive central grants support, will require
persistent efforts on part of the utilities. However, it is important to note here that
AT&C losses are a derived figure in Andhra Pradesh due to lack of metering. Hence,
it might not be completely appropriate to take the AT&C loss reference point as
given in the table above.
- After a period of no tariff revisions for 4 years, tariffs were hiked in 2010-11 and
2011-12 and then again in 2013-14. Tariffs for agriculture have been hiked in the
last 2 years. While the tariff hike has been considerable, frequency of revisions will
be crucial in the future.
- Transparency in disbursement levels, a requirement in FRP, can pose an issue for
Andhra Pradesh. Only about half of the subsidies booked by the utilities have been
actually received in the last 3 years. Also, lack of complete agricultural metering will
limit subsidy support levels under the FRP.
- The share of Interest expenses is not very high in the state. The moratorium on
principal repayments will further reduce bring down this burden in the coming years.

AF-MERCADOS EMI
POWER SECTOR OPERATIONS AND IMPACT ON STATE FINANCES 77
- The ACS-ARR Gap needs to be reduced by 25% of Rs 0.77/kWh every year in the
moratorium period in order to be eligible for the central grants incentive based on
the AT&C losses. This will be possible with more frequent tariff hikes, as the state
has not received the required subsidies in the past. Also, subsidy support might now
be limited due to lack of metering.
In Andhra Pradesh, AT&C losses are already at low levels. Since subsidy support has been
limited in the past, the regulator will have to ensure that tariffs are hiked frequently and
the ACS-ARR Gap is reduced.
However, post Telangana Bill, there will be changes in implementation of Financial
Restructuring Plan for the state of Andhra Pradesh and Telangana. The Andhra Pradesh
reorganization bill 2013 states the following:
1. The present DISCOMS would be divided among the successor states on the following
basis:
NPDCL and CPDCL would be responsible for power distribution in the state of
Telangana, with two districts of CPDCL, namely Kurnool and Anantapur
shifting to the state of Andhra Pradesh
SPDCL and EPDCL would be responsible for power distribution in the state of
Andhra Pradesh, with the two districts being reassigned to fall under the
coverage area of SPDCL
2. Units of APGENCO shall be divided based on geographical location of power plants.
3. The ratio of power distribution of the Central Generating Stations to the State of
Telangana and Semandhara would be based on the actual energy consumption
during the last 5 years by the DISCOMS in the respective Successor State.
4. The existing Andhra Pradesh Electricity Regulatory Commission (APERC) shall
function as a joint regulatory body for a period not exceeding six months within
which time separate SERCs will be formed in the successor States.
5. Existing Power Purchase Agreements (PPAs) with respective DISCOMS shall continue
for both on-going projects and projects under construction
FRP implications of the State Division:
Andhra Pradesh:
FRP details with respect to Andhra Pradesh are given below:
Table V-11 : FRP scheme state details – Andhra Pradesh
Particulars Amount (Rs. Cr).
Accumulated losses as on 31/03/2012 6353
STL eligible under the scheme as on
31/03/2012 7438
Bonds issued by the Government 4046
Source: Data submitted by the state to the FFC

AF-MERCADOS EMI
POWER SECTOR OPERATIONS AND IMPACT ON STATE FINANCES 78
Table V-12: Interest repayment on bonds by the State Government per year – Andhra
Pradesh
Company Bonds Issued (Rs. Cr.) Interest @ 10%(Rs. Cr.)
EPDCL 1806 181
SPDCL 2240 224
Total 4046 404
Source: Data submitted by the state to the FFC
Telangana:
FRP details for Telangana are given below:
Table V-13 : FRP scheme state details – Telangana
Particulars Amount (Rs. Cr).
Accumulated losses as on 31/03/2012 11315
STL eligible under the scheme as on
31/03/2012 9232
Bonds issued by the Government 4554
Source: Data submitted by the state to the FFC
Table V-14: Interest repayment on bonds by the State Government per year – Telangana
Company Bonds Issued (Rs. Cr.) Interest @ 10%(Rs. Cr.)
CPDCL 2810 281
NPDCL 1744 174
Total 4554 455
Source: Data submitted by the state to the FFC
4.6 Jharkhand
Jharkhand has recently unbundled its operations in March, 2014. The erstwhile JSEB
reported a financial loss (without subsidy) of Rs.3211 Cr. in 2011-12, translating into a
financial gap of Rs.4.28/kWh.
With reference to the letter number 1544, dated 21st July 2014, submitted by the
Department of Energy, Government of Jharkhand, to Ministry of Power, the DISCOM has
requested for the entire amount of STL of Rs. 5710 Cr to be financed by debt, with Rs.
3000 Cr to be financed by Power Finance Corporation and Rs 2710 by Bank of India in
consortium with other banks.
As per the notified scheme, the bonds to be issued by Discoms were to be taken over by
the respective State Government. However, in the current scenario, it is proposed that the
entire amount will be serviced through debt only, which is in deviation from the FRP
scheme. The matter is pending with the Ministry of Power.
Some of the key parameters relevant to FRP implementation have been shown in the table
below for Jharkhand

AF-MERCADOS EMI
POWER SECTOR OPERATIONS AND IMPACT ON STATE FINANCES 79
Table V-15: Historical Parameters – Jharkhand
Key Parameters 2005-06 2006-
07
2007-
08
2008-
09
2009-
10
2010-
11
2011-
12
2012-
13
2013-
14
AT&C losses 52% 54% 58% 54% 10% 47% 43% n.a n.a
Tariff Hikes - - - - - - Yes - n.a
Subsidy
Received/Booked 100% 100% 100% 100% 100% 100% 100% n.a n.a
Interest Cost/Total
Cost 14% 20% 17% 19% 21% 12% 8% n.a n.a
ACS-ARR Gap w/o
subsidy – Rs./kWh 0.99 1.06 1.82 1.38 1.14 1.30 4.28 n.a n.a
Source: PFC report on utility finances and Discom ARRs
Some of the key observations from the above table, along with relevant state-level aspects
are listed below.
- The AT&C losses have remained very high over the years due to persisting power
thefts, weak distribution infrastructure, and high level of unmetered consumers in
the state. A >3% annual reduction in AT&C losses from 47% (2010-11 benchmark
value) is required for the utility to benefit from the central grants incentive.
- Before being revised once in 2011-12, tariffs were not revised for a period of more
than 8 years. This is one of the biggest areas of concern for JSEB. Without frequent
and substantial tariff revisions, the Discom would not be able to benefit from any of
the financial incentives that are part of the FRP.
- The subsidy received-booked ratio has been high, indicating that the Discom,
regulator, and the state government have been in sync with respect to the amount
booked and actually disbursed.
- The share of Interest expenses has been significant. The moratorium on principal
repayments of 50% STL will help reduce the interest burden to some extent in the
short term.
- The ACS-ARR Gap needs to be reduced to by 25% annually from the Rs. 1.30/kWh
2010-11 in order to be eligible for the central grants incentive. In order to achieve
this reduction, both tariff revisions and operational efficiency improvements are
essential in Jharkhand. Assuming the AT&C losses are reduced by 3% in a year, the
financial gap will come down by around 16 paise/unit in terms of the cost reduction
achieved by purchasing fewer units to supply the same power as in 2010-1117
Unlike in the past few years, frequent and substantial tariff revisions coupled with
consistent reduction in AT&C losses is the only way that Jharkhand can benefit from the
FRP scheme and improve its financial health in the long term.
17 In order to estimate gap reduction, 2010-11 data has been taken for Jharkhand because the ACS in 2011-12 is
very high due to a huge increase in ‘other cost’ component.

AF-MERCADOS EMI
POWER SECTOR OPERATIONS AND IMPACT ON STATE FINANCES 80
4.7 Bihar
BSEB reported a financial loss (without subsidy) of Rs.3928 Cr. in 2011-12, translating into
a financial gap of Rs.3.64/kWh.
As per the FRP scheme, the Bihar government would take over Rs. 818 cr. (50% of STL) by
issue of bonds by the Discoms backed by Government guarantee to participating lenders.
The scheme would permit the Discoms to restructure the remaining 50% of STL backed by
government guarantee, with a negotiated moratorium period. The bonds worth Rs 818 Cr.
would be repaid with an interest rate of 10.2% per annum payable semi-annually. The first
interest payment is due on 13th Sept. 2014, which is after 6 months of the allocation.
While, the principle repayment will be due after the moratorium period of three years.
Some of the key parameters relevant to FRP implementation have been shown in the table
below for Bihar.
Table V-16: Historical Parameters - Bihar
Key Parameters 2005-
06
2006-
07
2007-
08
2008-
09
2009-
10
2010-
11
2011-
12
2012-
13
2013-
14
AT&C losses 84% 44% 47% 34% 44% 47% 65% n.a n.a
Tariff Hikes 0% 10% - 3% - 0% 21% 11% 6%
Subsidy
Received/Booked 42% 100% 100% 100% 100% 100% 100% n.a n.a
Interest Cost/Total
Cost 22% 27% 26% 25% 23% 23% 20% n.a n.a
ACS-ARR Gap w/o
subsidy – Rs./kWh 1.34 1.92 2.09 2.21 2.52 2.81 3.64 n.a n.a
Source: PFC report on utility finances and Discom ARRs
Some of the key observations from the above table, along with relevant state-level aspects
are listed below.
- In the state of Bihar, the past record in AT&C losses has been one of the poorest in
the country. While the technical and commercial losses have actually gone up in the
past due to ageing transmission infrastructure and power thefts, a 3% annual
reduction will now be required for Bihar to benefit from central grants support
scheme.
- Even on the revenue front, Bihar has performed poorly. The tariff hikes have been
insufficient and irregular over the last few years. On the other hand, subsidy
received-booked ratios have continued to stay at 100%, which is a positive sign.
- The share of Interest expenses has been over 20% for the last few years. With the
moratorium on principal repayments on 50% STL, the liquidity situation is expected
to improve in the near term, which is especially important considering the working
capital stress in the system.
- The ACS-ARR Gap needs to be reduced by 25% of the 2010-11 benchmark level
(Rs. 2.81/kWh) every year in order to avail the central grants incentive scheme. The

AF-MERCADOS EMI
POWER SECTOR OPERATIONS AND IMPACT ON STATE FINANCES 81
Gap will need to be reduced to 54 paise/unit by 2014-15. This will be possible only
with even higher tariff hikes as subsidy transparency requirements will limit subsidy
support levels. This is an area of concern, especially when the Gap has actually
increased considerably in 2011-12.
Like Jharkhand, frequent and substantial tariff revisions coupled with consistent reduction
in AT&C losses is possibly the only way for Bihar to benefit from the FRP scheme and
improve its financial health, both in short and long term.
4.8 Conclusion
To sum up, the restructuring scheme would bring about an immediate improvement in the
liquidity position of the participant Discoms. At this stage, however, it would be difficult to
ascertain if this will lead to a structural change in the financial health of Discoms. That
would be contingent upon the commitment of utilities and regulators to the performance
linked measures. Apart from this, timely receipt of subsidies from the state governments
along with timely cash collections from government departments will also determine
whether the scheme will achieve its goals in the true sense. Also, the ability of the GoI and
Lenders to ensure consistent compliance with the restructuring scheme, especially after it
has been fully implemented and the funding to the SEBs is resumed, may be restricted
given the socio-political scenario at the state level.
Based on the above analysis pertaining to participant states, it can be observed that state
utilities are definitely showing intent towards improving their financial position. In the last
couple of years, most of the states have undertaken tariff revisions. . However, since tariffs
have been revised in most states, the ability for further revisions will be limited, unless
coupled with efficiency improvements. Also, the technical/commercial loss reduction targets
are stiff and looking at past trajectories, utilities will need to take adequate measures to
make improvements. On the subsidy front, most states have maintained a 100% received-
booked ratio. However, low metering levels is a potential area of concern on that front. It is
important to note that the financial gap and technical/commercial losses have continued to
be at significantly high levels in some of the FRP participant states. In order to benefit from
the transitional finance mechanism under the FRP by taking advantage of the central grants
and reimbursement scheme, it would be critical for these utilities to show considerable
improvement on these parameters.

AF-MERCADOS EMI
POWER SECTOR OPERATIONS AND IMPACT ON STATE FINANCES 82
VI ASSESSMENT OF REGULATORY EFFECTIVNESS
Regulatory Governance has a very important role in achieving efficiency in service delivery
and overall financial sustenance of the sector. The Electricity Act 2003 envisaged
Regulatory Institutions to be independent institutions responsible for balancing the interest
of various stakeholders such as consumers, electricity utilities and society at large and at
the same time limiting the interference of the state government in the operations of power
sector in the state/country.
However, ten years from the enactment of Electricity Act 2003, it has been observed that
the state regulators have not yet been able to achieve true autonomy from the state
government defeating the prime objective of regulatory independence as envisaged in
Electricity Act 2003. Also, many SERCs appear to lack adequate resources required to
completely perform all functions or mandates provided in the Electricity Act 2003. Further,
lack of clear accountability mechanism to govern SERCs is also one of the reasons for
limited effectiveness of regulatory institutions.
The effectiveness of regulatory practices, has been assessed around the following themes:
Financial Independence
Staffing
Performance Monitoring and Public Disclosures
Effective Information Availability with the regulators to enable decisions on pricing
Frequency and adequacy of tariff revisions
All the above aspects are discussed in detail below.
1. FINANCIAL INDEPENDENCE/AUTONOMY
The primary source of income for the SERC’s include grant from the state government and
their own revenue generated through fees for annual license, fees for fling application etc.
The budgetary independence of SERCs provides a reasonable proxy of independence in
regulatory decision making.
The table below provides the share of State Government funding as percentage of SERC’s
income for the states.
Table VI-1: State Government funding as a percentage of income of SERC’s for
various states
S. No. States State Government funding as a
percentage of income of SERC’s
1 Haryana 100%
2 Meghalaya 80%
3 Karnataka 72%
4 Manipur and Mizoram 71%
5 Jharkhand 58%
6 Goa and union territories 52%
7 Tripura 42%
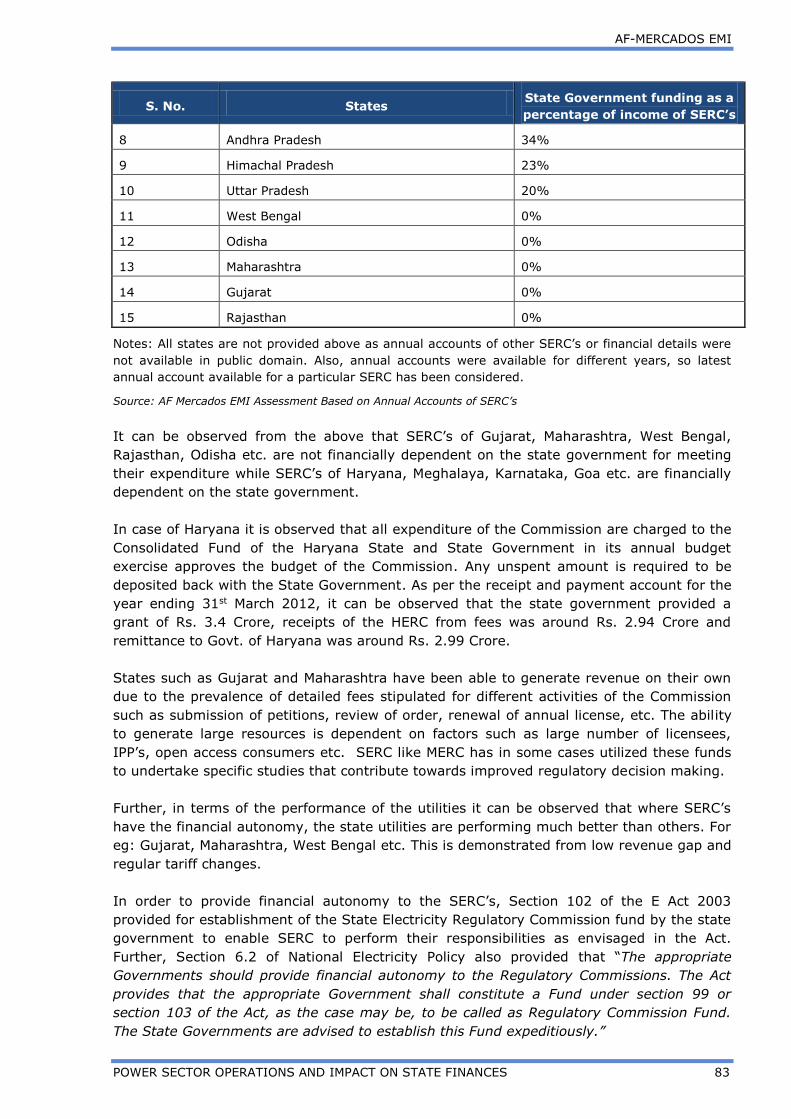
AF-MERCADOS EMI
POWER SECTOR OPERATIONS AND IMPACT ON STATE FINANCES 83
S. No. States State Government funding as a
percentage of income of SERC’s
8 Andhra Pradesh 34%
9 Himachal Pradesh 23%
10 Uttar Pradesh 20%
11 West Bengal 0%
12 Odisha 0%
13 Maharashtra 0%
14 Gujarat 0%
15 Rajasthan 0%
Notes: All states are not provided above as annual accounts of other SERC’s or financial details were
not available in public domain. Also, annual accounts were available for different years, so latest
annual account available for a particular SERC has been considered.
Source: AF Mercados EMI Assessment Based on Annual Accounts of SERC’s
It can be observed from the above that SERC’s of Gujarat, Maharashtra, West Bengal,
Rajasthan, Odisha etc. are not financially dependent on the state government for meeting
their expenditure while SERC’s of Haryana, Meghalaya, Karnataka, Goa etc. are financially
dependent on the state government.
In case of Haryana it is observed that all expenditure of the Commission are charged to the
Consolidated Fund of the Haryana State and State Government in its annual budget
exercise approves the budget of the Commission. Any unspent amount is required to be
deposited back with the State Government. As per the receipt and payment account for the
year ending 31st March 2012, it can be observed that the state government provided a
grant of Rs. 3.4 Crore, receipts of the HERC from fees was around Rs. 2.94 Crore and
remittance to Govt. of Haryana was around Rs. 2.99 Crore.
States such as Gujarat and Maharashtra have been able to generate revenue on their own
due to the prevalence of detailed fees stipulated for different activities of the Commission
such as submission of petitions, review of order, renewal of annual license, etc. The ability
to generate large resources is dependent on factors such as large number of licensees,
IPP’s, open access consumers etc. SERC like MERC has in some cases utilized these funds
to undertake specific studies that contribute towards improved regulatory decision making.
Further, in terms of the performance of the utilities it can be observed that where SERC’s
have the financial autonomy, the state utilities are performing much better than others. For
eg: Gujarat, Maharashtra, West Bengal etc. This is demonstrated from low revenue gap and
regular tariff changes.
In order to provide financial autonomy to the SERC’s, Section 102 of the E Act 2003
provided for establishment of the State Electricity Regulatory Commission fund by the state
government to enable SERC to perform their responsibilities as envisaged in the Act.
Further, Section 6.2 of National Electricity Policy also provided that “The appropriate
Governments should provide financial autonomy to the Regulatory Commissions. The Act
provides that the appropriate Government shall constitute a Fund under section 99 or
section 103 of the Act, as the case may be, to be called as Regulatory Commission Fund.
The State Governments are advised to establish this Fund expeditiously.”

AF-MERCADOS EMI
POWER SECTOR OPERATIONS AND IMPACT ON STATE FINANCES 84
Table VI-2: Status of Electricity Regulatory Fund
S.no. Name of State
Establishment of
Electricity Regulatory
Commission Fund
Remarks
1 Andhra Pradesh No -
2 Arunachal Pradesh No In process
3 Assam Yes Rules notified in August, 2005
4 Chhattisgarh Yes
Chhattisgarh State Electricity Regulatory
commission has established their own
funds with the help of state Govt.
budgetary provisions & other sources.
5 Goa No Not applicable to state Government as
there is JERC and SERC.
6 Haryana No In process
7 Himachal Pradesh Yes Notified
8 Jammu and Kashmir No -
9 Jharkhand Yes Fund rules notified by Govt.
10 Karnataka No Under process
11 Kerala No -
12 Madhya Pradesh Yes Established
13 Nagaland Yes W.e.f. 16.9.2009
14 Odisha Yes W.e.f. 1.8.1996
15 Sikkim No -
16 Tripura No -
17 Uttarakhand Yes -
Source: CEA
It can be observed that as on 31st December 2013, most of the State governments have
not established such fund and thus further resulting in lower financial autonomy.
Global experience on the financial independence of the regulatory institutions indicates that
in many cases regulators are not dependent on the government budgetary support for
discharge of their duties envisaged as per the relevant statues/acts. Source of income is
generally through fees and charges levied by the regulatory institutions.
Table below provides a brief description on the international regulatory institutions with
respect to their respective areas of regulation, staff strength and sources of
income/funding.

AF-MERCADOS EMI
POWER SECTOR OPERATIONS AND IMPACT ON STATE FINANCES 85
Table VI-3: International experience of different Regulatory Institutions with respect to staff strength and source of income
S.No. Name of
country
Name of
Regulatory
commission
Year of
establish
ment
Rule/Act of
establishment Areas of Regulation
Populatio
n (In
Millions)
Number of
staff
Source of
income
Performance
Metrics
1
United
States of
America
Federal
Energy
Regulatory
Commission
(FERC)18
1977
Department of
Energy Organization
Act
Wholesale electric, natural gas,
hydroelectric, and oil pipeline
industries
317
Staff
Strength of
1500
Annual charges
and filing fees
assessed on the
industries it
regulates
Yes
2 USA:
California
California
Public
Utilities
Commissions
(CPUC)19
1912 Public Utilities Act
Regulates privately owned electric,
natural gas, telecommunications,
water, railroad, rail transit, and
passenger transportation companies,
in addition to authorizing video
franchises
38
Staff
strength of
940
3 USA:
Maryland
Maryland
Public
Service
Commission20
1910
Public Utility
Companies Article,
Annotated Code of
Maryland
Gas, electricity, telecommunication,
transportation 5.9
Staff
strength of
135
Fees and
Charges. Not
dependent on
Govt. funding
4 Australia
Australian
Energy
Regulator21
2005 Competition and
Consumer Act 2010
Wholesale energy market regulation,
Energy networks regulation, Retail
energy market regulation
23
Staff
strength of
126
Yes
5 United
Kingdom
Office of Gas
and
Electricity
Markets
(Ofgem)22
-
Gas Act 1986, the
Electricity Act 1989,
the Competition Act
1998, the Utilities
Act 2000 and the
Energy Acts 2004,
2008, 2010 and
2011, and other
Electricity & Gas 63.7
Staff
Strength of
729
Fees and
Charges. Not
dependent on
Govt. funding
Yes
18 Official website: http://www.ferc.gov/; Performance and accountability report, fiscal year 2013: http://www.ferc.gov/about/strat-docs/2013-audit.pdf
19 Official website: http://www.cpuc.ca.gov; CPUC annual report 2012: http://www.cpuc.ca.gov/NR/rdonlyres/E47E6D16-C37F-446B-B606-924378794A14/0/CPUC2012AnnualReport.pdf 20 Official website: http://webapp.psc.state.md.us/Intranet/home.cfm; Maryland PSC annual report 2012: http://webapp.psc.state.md.us/intranet/SiteSearch/Annual%20Reports/2012/2012%20MD%20PSC%20Annual%20Report.pdf
21 Official website: http://www.aer.gov.au/; AER annual report 2012-13: http://www.aer.gov.au/node/21752
22 Official website: https://www.ofgem.gov.uk/, Energy commission annual report 2013: https://www.ofgem.gov.uk/about-us/corporate-policy-planning-and-reporting/annual-report-and-
accounts

AF-MERCADOS EMI
POWER SECTOR OPERATIONS AND IMPACT ON STATE FINANCES 86
S.No. Name of
country
Name of
Regulatory
commission
Year of
establish
ment
Rule/Act of
establishment Areas of Regulation
Populatio
n (In
Millions)
Number of
staff
Source of
income
Performance
Metrics
statutes.
6 Philippines
Energy
Regulatory
Commission
(ERC)23
2001 Section 38 of EPIRA
Electricity. ERC is tasked to promote
competition, encourage market
development, ensure customer
choice and penalize abuse of market
power in the electricity industry.
99
Staff
Strength of
220
Source: AF Mercados Analysis based on the data from official websites and Annual Reports
From the above, it is clear that the financial autonomy is necessary for regulators to exercise independent decision making. The Act and the policy
provide for stipulations for this to happen, however implementation of these provisions has been weak in many cases.
23 Official website: http://www.erc.gov.ph/ ; Statement of allotment, obligation and balances, 2012: http://www.erc.gov.ph/Pages/Annual-Report-Budget-and-Targets

AF-MERCADOS EMI
POWER SECTOR OPERATIONS AND IMPACT ON STATE FINANCES 87
2. STAFFING
The staffing at SERC’s can be broadly classified into two categories i.e. technical or
professional staff and non-technical/support staff relates to services such as peon, security,
driver, data entry operator, stenographer etc.
The number of positions sanctioned/current strength, details of technical and non-technical
positions, vacant positions etc. for some of the states is given below:
Table VI-4: Staffing pattern in different SERC’s
S. No. Name of State Total Number of
Posts(Working
or Sanctioned)
Technical
Posts
Total non-
technical
posts
Percentage
of
technical
posts
1 West Bengal 58 42 16 72%
2 Himachal Pradesh 30 19 11 63%
3 Maharashtra 63 39 24 62%
4 Rajasthan 55 32 23 58%
5 Karnataka 50 29 21 58%
6 Odisha 42 18 24 43%
7 Uttar Pradesh 55 21 34 38%
8 Tripura 23 8 15 35%
9 Chhattisgarh 66 23 43 35%
10 Gujarat 50 17 33 34%
11 Kerala 13 4 9 31%
12 Punjab 93 28 65 30%
13 Meghalaya 12 2 10 17%
Notes: All states are not provided above as annual accounts of other SERC’s were not available in public domain.
Also, annual accounts were available for different years, so latest annual account available for a particular SERC
has been considered.
Source: AF Mercados Analysis based on data from Annual Accounts of SERC’s
Following can be observed from the above:
Inadequate Technical Staff
It can be observed that positions of specialized technical professionals are limited in several
SERC’s. Also the percentage of technical posts to total number of staff strength is low.
Further, in many SERC’s even the total number of working employees/sanctioned
employees is observed to be low.
Vacant Posts
Even within the sanctioned posts, there are several positions vacant due to one or the other
reason. Vacant posts for few of the SERC’s are given below:
Table: Vacant Posts in SERCs

AF-MERCADOS EMI
POWER SECTOR OPERATIONS AND IMPACT ON STATE FINANCES 88
Table VI-5: States with vacant posts in SERCs
S.
No.
Name of State Total Number
of
Posts(Working
or Sanctioned)
Technical
Post
Vacant
posts
Technical
posts
amongst
those
vacant
posts
1 Maharashtra 63 39 18 7
2 Rajasthan 55 32 12 6
3 Uttar Pradesh 55 21 11 9
4 Tripura 23 8 13 4
5 Gujarat 50 17 22 9
Source: AF Mercados Analysis based on data from Annual Accounts of SERC’s
Staff on Deputation or contract basis
Another important aspect that needs to be considered with respect to staffing in SERC’s is
the fact that some of the staff especially the technical staff is on deputation or contract
basis.
Also, most of the SERC’s are dependent upon the consultants for complying with their
mandates. This limits the institutional memory and internal capacity building of the
regulatory commissions.
From the Table on international experience on regulatory institutions it can be
observed that all the international regulatory institutions are adequately staffed.
Even on the basis of population served per staff of the Commission on an overall
level indicates Indian SERC’s serves to a larger population per staff highlighting
that Indian SERC’s are not adequately staffed.

AF-MERCADOS EMI
POWER SECTOR OPERATIONS AND IMPACT ON STATE FINANCES 89
Table VI-6: Population served per staff of Regulatory Commission in different
countries
S.No. Name of country Name of Regulatory
commission
Population served per
staff (in lakhs)24
1 United States of
America
Federal Energy Regulatory Commission
(FERC) 2.11
2 USA: California California Public Utilities Commissions
(CPUC) 0.40
3 USA: Maryland Maryland Public Service Commission
(PSC) 0.44
4 Australia Australian Energy Regulator (AER) 1.83
5 United Kingdom Office of Gas and Electricity Markets
(Ofgem) 0.87
6 Philippines Energy Regulatory Commission (ERC) 4.50
Source: AF Mercados Analysis based on the data from Annual Reports of respective Commissions.
A comparison with Indian conditions is given below:-
Table VI-7: Population served per staff of Regulatory Commission in different
states in India
S. No Name of State Population
Population served per
staff (total) (in
lakhs)25
1 West Bengal 91,347,736 15.75
2 Himachal Pradesh 6,856,509 2.29
3 Maharashtra 112,372,972 17.84
4 Rajasthan 68,621,012 12.48
5 Karnataka 61,130,704 12.23
6 Odisha 41,947,358 9.99
7 Uttar Pradesh 199,581,477 36.29
8 Tripura 3,671,032 1.60
9 Chhattisgarh 25,540,196 3.87
10 Gujarat 60,383,628 12.08
11 Kerala 33,387,677 25.68
12 Punjab 27,704,236 2.98
13 Meghalaya 2,964,007 2.47
Source: AF Mercados EMI Analysis
Further it must be noted that if one compares the population served per technical staff as
compared to total staff, this ratio increases significantly considering large percentage of
24 Reference:
http://quickfacts.census.gov/qfd/states/06000.html http://quickfacts.census.gov/qfd/states/06000.html http://quickfacts.census.gov/qfd/states/24000.html http://www.abs.gov.au/AUSSTATS/[email protected]/mf/3101.0 http://www.ons.gov.uk/ons/dcp171778_320900.pdf http://www.census.gov.ph/content/2010-census-population-and-housing-reveals-philippine-population-9234-million 25 http://www.censusindia.gov.in/2011-prov-results/data_files/andhra_pradesh/DCOAP-PAPER-1-BROCHURE.pdf

AF-MERCADOS EMI
POWER SECTOR OPERATIONS AND IMPACT ON STATE FINANCES 90
non-technical staff in total staff in India. Even, if we rationalize the ratio due to high
population density in India, the number of staff still is inadequate.
Thus, to ensure independent regulatory institution it becomes important to
technically strengthen the State Commission’s through adequate staffing and in
house development/acquisition of technical skills in SERC’s. The staff to be
recruited should be allocated to various disciplines with clear role definition and
accountability.
3. ACCOUNTABILITY: PERFORMANCE MONITORING AND
PUBLIC DISCLOSURES
With the establishment of SERC’s, public participation in regulatory process through holding
of public hearing, invitation of comments from public on the petitions filed and draft
regulations, issue of discussion papers etc has become an integral part of the working of
the Commission. Also, SERC’s regularly publishes its annual reports and accounts on its
website highlighting/summarizing the work undertaken by the regulatory commission
during the year along with the details of their income and expenditure during the year.
The aforementioned measures have increased transparency and accountability of SERC’s
towards public, however considering the financial performance of the sector and limited
consumer participation in the entire regulatory process, there is a need to strengthen the
accountability framework. When the regulatory institutions become truly accountable to
public, they are expected to function more effectively in discharging of their mandates
under the Electricity Act 2003.
Performance monitoring is an important aspect in this regard. Although performance
monitoring is undertaken for different state utilities but no such mechanism exists for the
SERC’s.
However, it is observed internationally, many regulatory institutions have prepared
performance metrics to evaluate their own performance with regard to those parameters.
At the beginning of the year, goals are being set such as conduct of market reviews, new
regulations, target for issuing license during the set time period etc. and this goal setting
process is complemented by self-critical review at the end of each year. This review enables
faster realization of goals year on year basis and also tracks performance of the regulators
over the year. The results of the self-assessment are also published in their respective
annual reports. For example Australian Energy Regulator (AER), has published performance
indicators which cover different aspects of their work for the year 2012-13 and their
observations with regard to the performance in their annual report. This includes both
objective and subjective indicators. Table below lists few of the indicators and
corresponding results as provided in the AER’s Annual Report.
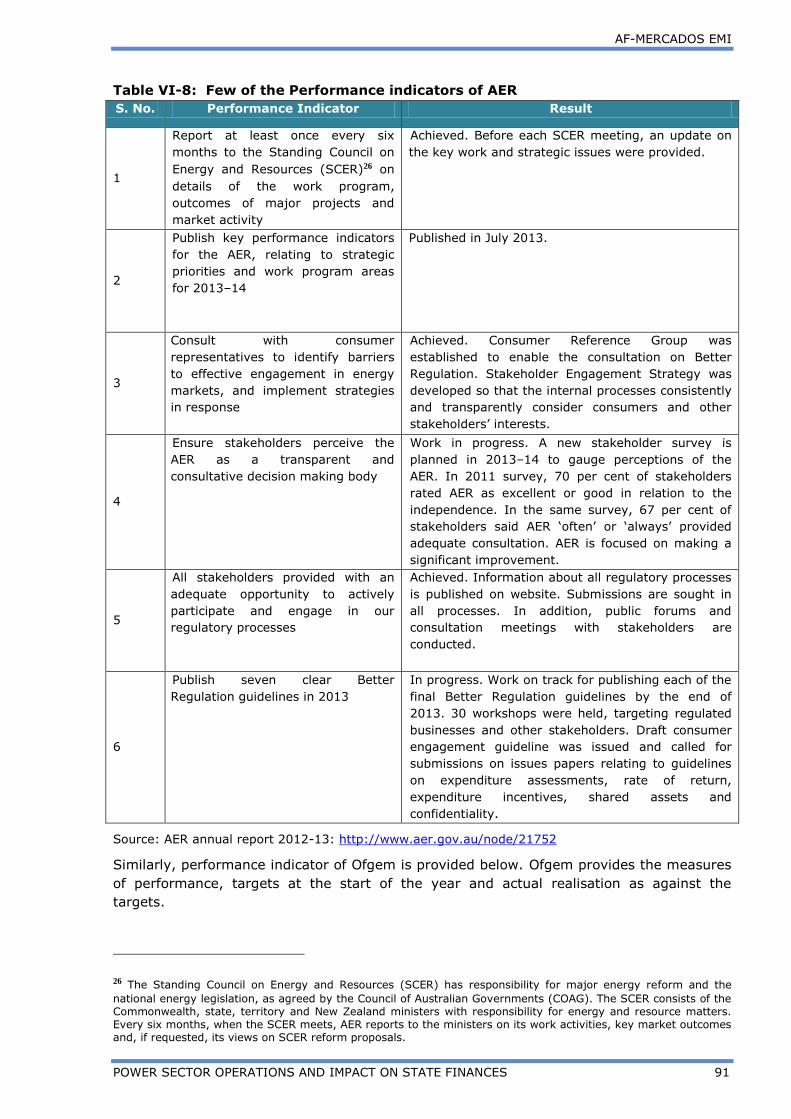
AF-MERCADOS EMI
POWER SECTOR OPERATIONS AND IMPACT ON STATE FINANCES 91
Table VI-8: Few of the Performance indicators of AER
S. No. Performance Indicator Result
1
Report at least once every six
months to the Standing Council on
Energy and Resources (SCER)26 on
details of the work program,
outcomes of major projects and
market activity
Achieved. Before each SCER meeting, an update on
the key work and strategic issues were provided.
2
Publish key performance indicators
for the AER, relating to strategic
priorities and work program areas
for 2013–14
Published in July 2013.
3
Consult with consumer
representatives to identify barriers
to effective engagement in energy
markets, and implement strategies
in response
Achieved. Consumer Reference Group was
established to enable the consultation on Better
Regulation. Stakeholder Engagement Strategy was
developed so that the internal processes consistently
and transparently consider consumers and other
stakeholders’ interests.
4
Ensure stakeholders perceive the
AER as a transparent and
consultative decision making body
Work in progress. A new stakeholder survey is
planned in 2013–14 to gauge perceptions of the
AER. In 2011 survey, 70 per cent of stakeholders
rated AER as excellent or good in relation to the
independence. In the same survey, 67 per cent of
stakeholders said AER ‘often’ or ‘always’ provided
adequate consultation. AER is focused on making a
significant improvement.
5
All stakeholders provided with an
adequate opportunity to actively
participate and engage in our
regulatory processes
Achieved. Information about all regulatory processes
is published on website. Submissions are sought in
all processes. In addition, public forums and
consultation meetings with stakeholders are
conducted.
6
Publish seven clear Better
Regulation guidelines in 2013
In progress. Work on track for publishing each of the
final Better Regulation guidelines by the end of
2013. 30 workshops were held, targeting regulated
businesses and other stakeholders. Draft consumer
engagement guideline was issued and called for
submissions on issues papers relating to guidelines
on expenditure assessments, rate of return,
expenditure incentives, shared assets and
confidentiality.
Source: AER annual report 2012-13: http://www.aer.gov.au/node/21752
Similarly, performance indicator of Ofgem is provided below. Ofgem provides the measures
of performance, targets at the start of the year and actual realisation as against the
targets.
26 The Standing Council on Energy and Resources (SCER) has responsibility for major energy reform and the
national energy legislation, as agreed by the Council of Australian Governments (COAG). The SCER consists of the Commonwealth, state, territory and New Zealand ministers with responsibility for energy and resource matters. Every six months, when the SCER meets, AER reports to the ministers on its work activities, key market outcomes and, if requested, its views on SCER reform proposals.

AF-MERCADOS EMI
POWER SECTOR OPERATIONS AND IMPACT ON STATE FINANCES 92
Table
VI Division Measure Target Actual
1
Markets Consult on and carry out consultations
regarding any applications made for
exemption from Third Party Access
arrangements under Article 22 by
prospective storage and interconnector
operators
100% 100%
2
Markets Send decisions on Article 22 exemptions to
the European Commission within
prescribed timescales if adequate data has
been provided
100% 100%
3
Markets Assess and make decisions about any
Income Adjusting Event within three
months of it being raised if adequate
information has been provided
100% None
Received
4
Smarter Grids
and Governance
–
Distribution
Make code modification decisions within 25
working days1 of receiving the Final
Modification Report (or, where applicable,
final responses to a Final Impact
Assessment or other Ofgem consultation)
90% 98%
5
Smarter Grids
and Governance
–
Distribution
Publish code modification Impact
Assessments and/or other Ofgem
consultations where applicable within 3
months of receiving the Final Modification
Report
90% 83%
6
Smarter Grids
and Governance
–
Distribution
Grant competitive licence applications
within 45 days of receipt of a duly made
application
100% 100%
7 Sustainable
Development
Protect consumers by responding
substantively to customer contacts
93% 94%
8
Sustainable
Development
Respond to complaints on enforcement
matters confirming whether we will
investigate
90% 97%
9
Finance and Risk
Management
Pay undisputed bills 90% in 10
working
days
92%
10
Research and
Information
Centre
Respond to inquiries under the Freedom of
Information Act
90% in 20
days from
receipt
91%
Source: UK Ofgem, Energy commission annual report 2012-2013: https://www.ofgem.gov.uk/about-
us/corporate-policy-planning-and-reporting/annual-report-and-accounts
In light of the above, it is important that SERC’s in India should also prepare such
performance metrices and measure their performance against the set parameters. In this

AF-MERCADOS EMI
POWER SECTOR OPERATIONS AND IMPACT ON STATE FINANCES 93
regard, central agency i.e. CEA or MoP may initiate an annual performance evaluation and
benchmarking exercise for the work undertaken by the Regulatory Commission. This would
increase public accountability of the SERC’s and would ensure their independence.
4. FREQUENCY AND ADEQUACY OF TARIFF REVISIONS
The independence in functioning of regulatory institutions can be analysed through
frequency and adequacy of tariff revisions in different states of the country. As highlighted
in earlier sections, no or limited tariff hikes were observed during 2005-2011 while the
revenue gap significantly increased over these years. The financial position of the utilities
deteriorated considerably and in the year 2011-12, the utilities incurred combined losses of
Rs. 88,053 crores (without accounting for subsidy).
In light of the above, the Ministry of Power (MoP) requested the APTEL to take appropriate
action by issuing necessary directions to all the State Commissions to revise the tariff
periodically, if required by suo moto action, in the interest of improving the financial health
and long-term viability of the electricity sector in general and distribution utilities in
particular.
In line with the directions of the APTEL, more than 20 states have revised their
tariffs in the last two years.
Table below presents the compliance with OP1 Order of different states for FY 2012-13 on
the following parameters:
Whether Annual Performance review (APR) petition is filed by the utilities as per the
regulations
Whether APR order is being issued as per the regulations.
Whether Annual Revenue Requirement (ARR) petition is filed by the utilities as per
the regulations
Whether ARR order is being issued as per the regulations
Whether Tariff is applicable till the end of the FY
In case petition is not being filed by the utilities whether SERC’s have initiated Suo
Motu action.
It can be observed that most of the states have complied with the directions of the APTEL
especially with respect to the filing of ARR petitions and issuance of ARR order. In case of
Gujarat and Sikkim suo motu proceedings were undertaken due to the delay in filing of ARR
petitions by the utilities. Assam ERC extended the time period for the utilities but didn’t
undertake suo motu action till the latest available details.
In case of filing of APR petition with the SERC’s it has been observed that few of the state
utilities have not complied with the same.
Table VI-9: Status of compliance of APTEL order OP No. 1 of 2011 with respect to
APR and ARR: For financial year 2012-13 as on 30th January 2013

AF-MERCADOS EMI
POWER SECTOR OPERATIONS AND IMPACT ON STATE FINANCES 94
S.N
o. SERC’s
APR
petition
filed
as per the
regulations
APR order
being
issued as
per the
regulations
ARR
petitions to
be
filed as per
the
regulations
Issuance of
tariff
orders as
per the
regulations
Tariff
applicability
only till
the end of the
FY
Initiation
of Suo
Motu
action for
delays in
filing
1 Andhra
Pradesh Complied Complied Complied Complied Complied
2 Arunachal
Pradesh
Arunachal Pradesh ERC came into workable stage only in July 2011. The Utilities, which are
Government Departments, have already been requested to file the Tariff Petitions and that
they are in the final stages of filing their respective Tariff Petitions for the first time. The
Commission has so far not taken any Suo Motu action due to delay on this account as the
Departments are new to this exercise and doing it for the first time.
3 Assam
Commission directed the licensees (APGCL, AEGCL and APDCL) to comply with the order
and file petition for APR of 2011-12, True Up for 2009-10 and 2010-11 and determination
of ARR for 2012-13. Subsequently, APGCL filed the petition on 28.09.2012 while the
Transco and Discom were granted time till 15.11.2012 failing which Suo Motu action was to
be initiated.
4 Bihar Complied Complied Complied Complied Complied
5 Chhattisgarh Complied Complied Complied Complied Complied
6 Delhi Complied Not
Complied
Not
Complied Not Complied
7 Gujarat Not
Complied
Not
Complied
Not
Complied
Not
Complied Not Complied Yes
8 Himachal
Pradesh
Not
Complied
Not
Complied
Not
Complied Complied Complied
9 Haryana Complied Complied Complied
10 Jammu &
Kashmir
Not
Complied
Not
Complied
Not
Complied
Not
Complied Complied
11 Jharkhand
12
Joint ERC
(Goa and
Uts)
Complied Not
Complied
Not
Complied Complied
13
Joint ERC
(Mizoram
and
Manipur)
Not
Complied
Not
Complied
Not
Complied
Not
Complied Not Complied
14 Karnataka Complied Complied Complied Complied Not Complied
15 Kerala Not
Complied Complied
16 Madhya
Pradesh
Not
Complied
Not
Complied Complied Complied Complied
17 Maharashtra Complied Complied Not Complied
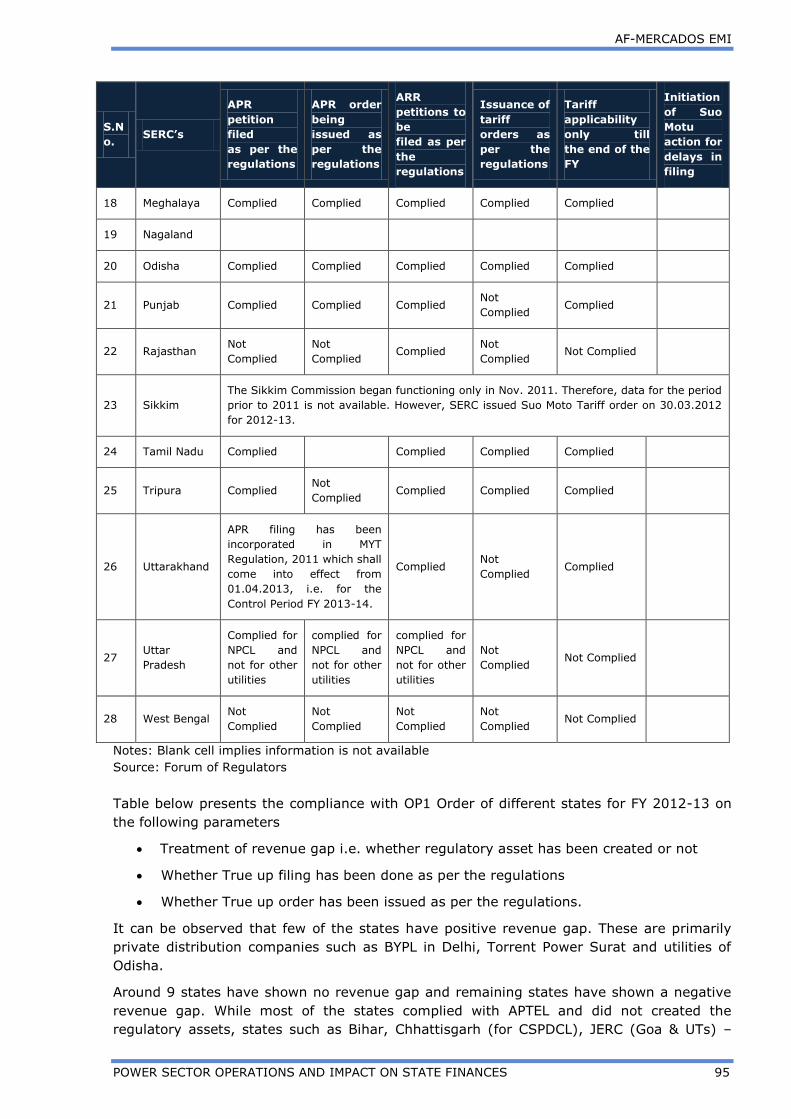
AF-MERCADOS EMI
POWER SECTOR OPERATIONS AND IMPACT ON STATE FINANCES 95
S.N
o. SERC’s
APR
petition
filed
as per the
regulations
APR order
being
issued as
per the
regulations
ARR
petitions to
be
filed as per
the
regulations
Issuance of
tariff
orders as
per the
regulations
Tariff
applicability
only till
the end of the
FY
Initiation
of Suo
Motu
action for
delays in
filing
18 Meghalaya Complied Complied Complied Complied Complied
19 Nagaland
20 Odisha Complied Complied Complied Complied Complied
21 Punjab Complied Complied Complied Not
Complied Complied
22 Rajasthan Not
Complied
Not
Complied Complied
Not
Complied Not Complied
23 Sikkim
The Sikkim Commission began functioning only in Nov. 2011. Therefore, data for the period
prior to 2011 is not available. However, SERC issued Suo Moto Tariff order on 30.03.2012
for 2012-13.
24 Tamil Nadu Complied Complied Complied Complied
25 Tripura Complied Not
Complied Complied Complied Complied
26 Uttarakhand
APR filing has been
incorporated in MYT
Regulation, 2011 which shall
come into effect from
01.04.2013, i.e. for the
Control Period FY 2013-14.
Complied Not
Complied Complied
27 Uttar
Pradesh
Complied for
NPCL and
not for other
utilities
complied for
NPCL and
not for other
utilities
complied for
NPCL and
not for other
utilities
Not
Complied Not Complied
28 West Bengal Not
Complied
Not
Complied
Not
Complied
Not
Complied Not Complied
Notes: Blank cell implies information is not available
Source: Forum of Regulators
Table below presents the compliance with OP1 Order of different states for FY 2012-13 on
the following parameters
Treatment of revenue gap i.e. whether regulatory asset has been created or not
Whether True up filing has been done as per the regulations
Whether True up order has been issued as per the regulations.
It can be observed that few of the states have positive revenue gap. These are primarily
private distribution companies such as BYPL in Delhi, Torrent Power Surat and utilities of
Odisha.
Around 9 states have shown no revenue gap and remaining states have shown a negative
revenue gap. While most of the states complied with APTEL and did not created the
regulatory assets, states such as Bihar, Chhattisgarh (for CSPDCL), JERC (Goa & UTs) –

AF-MERCADOS EMI
POWER SECTOR OPERATIONS AND IMPACT ON STATE FINANCES 96
Puducherry, Rajasthan, Tamil Nadu, Uttar Pradesh (for NPCL) and West Bengal (WBSEDCL)
created regulatory assets.
Further, it can be observed that most of the states have complied with the True up
parameter.
Table VI-10: Status of compliance of APTEL order OP No. 1 of 2011 (Contd.) with
respect to revenue gap and true up: For financial year 2012-13 as on 30th January
2013
S.No SERC’s
Revenue gap
between ARR
and
ACS per unit
Treatment of revenue
gap (Allowed/Not Allowed
creation of Regulatory
Asset)
True up
filing as per
the
regulations
True up order as per
the regulations
1 Andhra
Pradesh Nil Not Allowed Complied Complied
2 Arunachal
Pradesh
3 Assam
4 Bihar Revenue Gap
Allowed but did not allow the
carrying cost of these
regulatory assets
Complied Complied
5 Chhattisgarh Revenue Gap
Not Allowed for BSP/Allowed
for CSPDCL. carrying cost shall
be/ have been
allowed
Complied Complied
6 Delhi
Positive gap for NDMC and BYPL and Revenue Gap
for BRPL and TPDDL. For meeting the revenue gap
till FY 2010-11 and liquidation of revenue gap, the
Commission has decided to introduce a surcharge of
8% over the revised tariff in FY 2012-13.
Not Complied Not Complied
7 Gujarat
Positive gap for TPL
Surat and Revenue
gap for other utilities
Not Allowed
8 Himachal
Pradesh Nil Not Allowed Complied
9 Haryana Positive Gap Complied
10 Jammu &
Kashmir Revenue Gap Not Allowed
11 Jharkhand
12
Joint ERC
(Goa and
Uts)
Revenue Gap
Puducherry,
Andaman & Nicobar,
Goa)
Not Allowed for Chandigarh
and Allowed for Puducherry.
Also, did not allow the
carrying cost of these
regulatory assets
13
Joint ERC
(Mizoram
and
Manipur)
Revenue Gap Not Allowed Not Complied
14 Karnataka Nil
Not Allowed. has carried
forward the gap to the next
year.
15 Kerala Revenue Gap Not Allowed
16 Madhya
Pradesh Nil Not Allowed Complied Complied
17 Maharashtra Nil Not Allowed Complied Complied
18 Meghalaya Nil
19 Nagaland
20 Odisha Positive Gap Not Allowed Complied Complied
21 Punjab Not Allowed Complied Not Complied. The
True-up for 2010-11

AF-MERCADOS EMI
POWER SECTOR OPERATIONS AND IMPACT ON STATE FINANCES 97
S.No SERC’s
Revenue gap
between ARR
and
ACS per unit
Treatment of revenue
gap (Allowed/Not Allowed
creation of Regulatory
Asset)
True up
filing as per
the
regulations
True up order as per
the regulations
could not be
undertaken, as PSPCL
did not submit Audited
Accounts due to non-
finalization of Transfer
Scheme by the Govt. of
Punjab.
22 Rajasthan Revenue Gap Allowed Not Complied Not Complied
23 Sikkim Revenue Gap Not Allowed
24 Tamil Nadu Nil Allowed. Carrying cost has
been allowed Complied Complied
25 Tripura Revenue Gap Not Allowed
26 Uttarakhand Nil Not Allowed
27 Uttar
Pradesh
Revenue Gap.
Carrying cost has
been allowed. For
NPCL the revenue
gap is being met by
way of regulatory
surcharge of 8%.
Not Allowed for others and
Allowed for NPCL. Not Complied Not Complied
28 West Bengal Nil
Allowed. Part of the
Regulatory Assets created
have been adjusted out in
APR/ Truing up for 2008-09,
2009-10 and 2010-11
Notes: Blank cell implies information is not available
Source: Forum of Regulators
Table below presents the compliance with OP1 Order of different states for FY 2012-13 with
respect to Fuel Surcharge Adjustment.
It can be observed that while most of the state regulations provides for fuel surcharge
adjustment formula, the rest have assured to provide the same in the near future.
Table VI-11: Status of compliance of APTEL order OP No. 1 of 2011 (Contd.) with
respect to fuel surcharge adjustment: For financial year 2012-13 as on 30th
January 2013
S.No. SERC’s
Fuel surcharge
adjustment formula/
mechanism in the
regulations
Frequency of
adjustment
Fuel Surcharge
adjustment being
done as per the
Regulations
1 Andhra
Pradesh Complied Quarterly Complied
2 Arunachal
Pradesh
3 Assam Complied Quarterly Complied
4 Bihar Not Complied Monthly Complied
5 Chhattisgarh Complied
Quarterly for
CSPDCL/Monthly for
JSPL
Complied
6 Delhi Complied Quarterly Complied
7 Gujarat Complied Quarterly Complied
8 Himachal
Pradesh
Complied. Have not provided FSA
mechanism in the regulations as
there are no thermal generating
stations in the State
Quarterly Complied
9 Haryana Complied Quarterly Complied
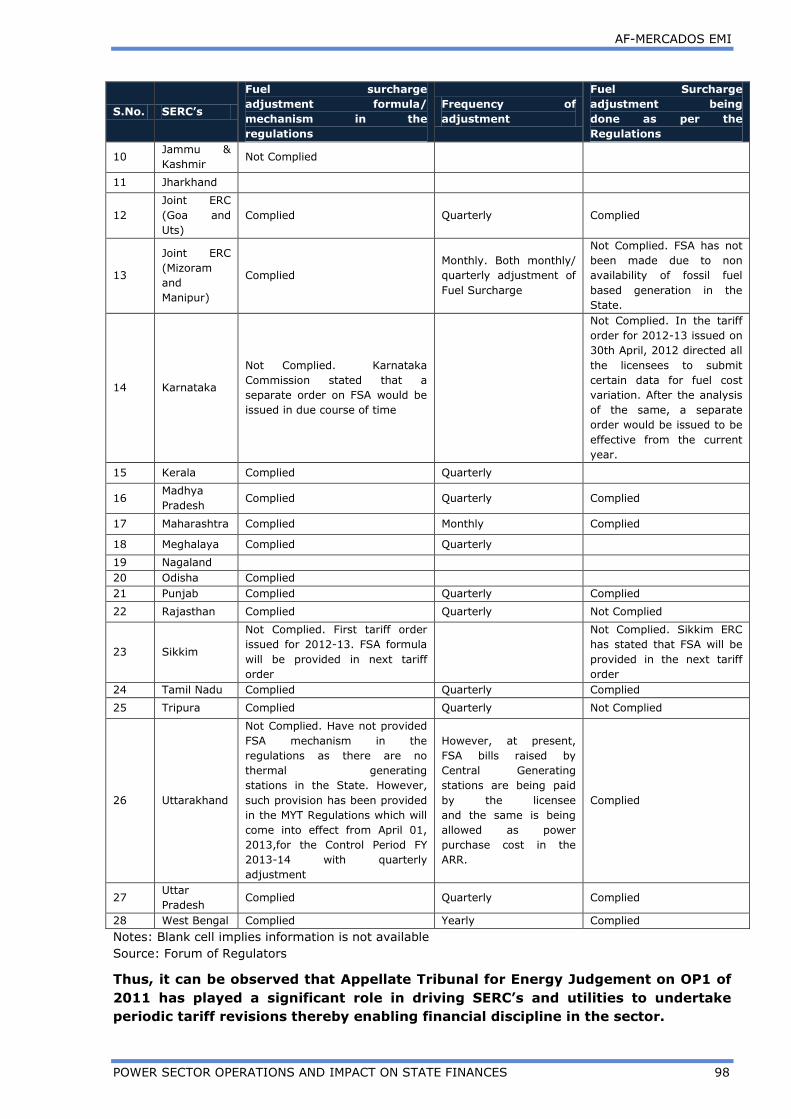
AF-MERCADOS EMI
POWER SECTOR OPERATIONS AND IMPACT ON STATE FINANCES 98
S.No. SERC’s
Fuel surcharge
adjustment formula/
mechanism in the
regulations
Frequency of
adjustment
Fuel Surcharge
adjustment being
done as per the
Regulations
10 Jammu &
Kashmir Not Complied
11 Jharkhand
12
Joint ERC
(Goa and
Uts)
Complied Quarterly Complied
13
Joint ERC
(Mizoram
and
Manipur)
Complied
Monthly. Both monthly/
quarterly adjustment of
Fuel Surcharge
Not Complied. FSA has not
been made due to non
availability of fossil fuel
based generation in the
State.
14 Karnataka
Not Complied. Karnataka
Commission stated that a
separate order on FSA would be
issued in due course of time
Not Complied. In the tariff
order for 2012-13 issued on
30th April, 2012 directed all
the licensees to submit
certain data for fuel cost
variation. After the analysis
of the same, a separate
order would be issued to be
effective from the current
year.
15 Kerala Complied Quarterly
16 Madhya
Pradesh Complied Quarterly Complied
17 Maharashtra Complied Monthly Complied
18 Meghalaya Complied Quarterly
19 Nagaland
20 Odisha Complied
21 Punjab Complied Quarterly Complied
22 Rajasthan Complied Quarterly Not Complied
23 Sikkim
Not Complied. First tariff order
issued for 2012-13. FSA formula
will be provided in next tariff
order
Not Complied. Sikkim ERC
has stated that FSA will be
provided in the next tariff
order
24 Tamil Nadu Complied Quarterly Complied
25 Tripura Complied Quarterly Not Complied
26 Uttarakhand
Not Complied. Have not provided
FSA mechanism in the
regulations as there are no
thermal generating
stations in the State. However,
such provision has been provided
in the MYT Regulations which will
come into effect from April 01,
2013,for the Control Period FY
2013-14 with quarterly
adjustment
However, at present,
FSA bills raised by
Central Generating
stations are being paid
by the licensee
and the same is being
allowed as power
purchase cost in the
ARR.
Complied
27 Uttar
Pradesh Complied Quarterly Complied
28 West Bengal Complied Yearly Complied
Notes: Blank cell implies information is not available
Source: Forum of Regulators
Thus, it can be observed that Appellate Tribunal for Energy Judgement on OP1 of
2011 has played a significant role in driving SERC’s and utilities to undertake
periodic tariff revisions thereby enabling financial discipline in the sector.
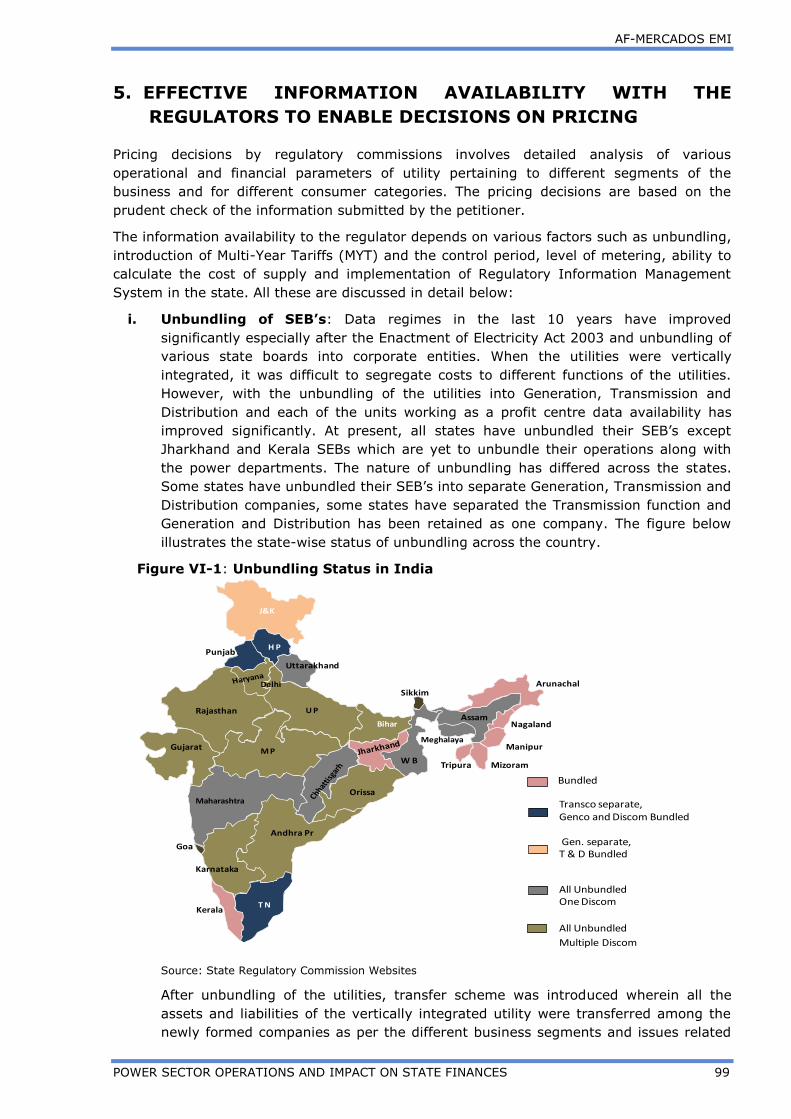
AF-MERCADOS EMI
POWER SECTOR OPERATIONS AND IMPACT ON STATE FINANCES 99
5. EFFECTIVE INFORMATION AVAILABILITY WITH THE
REGULATORS TO ENABLE DECISIONS ON PRICING
Pricing decisions by regulatory commissions involves detailed analysis of various
operational and financial parameters of utility pertaining to different segments of the
business and for different consumer categories. The pricing decisions are based on the
prudent check of the information submitted by the petitioner.
The information availability to the regulator depends on various factors such as unbundling,
introduction of Multi-Year Tariffs (MYT) and the control period, level of metering, ability to
calculate the cost of supply and implementation of Regulatory Information Management
System in the state. All these are discussed in detail below:
i. Unbundling of SEB’s: Data regimes in the last 10 years have improved
significantly especially after the Enactment of Electricity Act 2003 and unbundling of
various state boards into corporate entities. When the utilities were vertically
integrated, it was difficult to segregate costs to different functions of the utilities.
However, with the unbundling of the utilities into Generation, Transmission and
Distribution and each of the units working as a profit centre data availability has
improved significantly. At present, all states have unbundled their SEB’s except
Jharkhand and Kerala SEBs which are yet to unbundle their operations along with
the power departments. The nature of unbundling has differed across the states.
Some states have unbundled their SEB’s into separate Generation, Transmission and
Distribution companies, some states have separated the Transmission function and
Generation and Distribution has been retained as one company. The figure below
illustrates the state-wise status of unbundling across the country.
Figure VI-1: Unbundling Status in India
Source: State Regulatory Commission Websites
After unbundling of the utilities, transfer scheme was introduced wherein all the
assets and liabilities of the vertically integrated utility were transferred among the
newly formed companies as per the different business segments and issues related
Manipur
Rajasthan U P
M PGujarat
Maharashtra
Andhra Pr
T NKerala
Goa
Karnataka
Orissa
Bihar
W B
Sikkim
Uttarakhand
H PPunjab
Arunachal
Assam
Meghalaya
Tripura Mizoram
Nagaland
J&K
Delhi
Bundled
Transco separate, Genco and Discom Bundled
Gen. separate, T & D Bundled
All UnbundledOne Discom
All Unbundled
Multiple Discom

AF-MERCADOS EMI
POWER SECTOR OPERATIONS AND IMPACT ON STATE FINANCES 100
to common infrastructure were addressed. Also, holding company for the unbundled
utilities was also created as part of the process.
SEB unbundling has led to separate reporting of all the sub-segments i.e.
generation, transmission and distribution. Consequently, the operational and
financial parameters for these sub-segments are reported and monitored separately.
Thus, data regimes have improved over the years depending on when the states
have been unbundled.
ii. Multi-Year Tariff (MYT) framework: Second level of reforms in terms of
introduction of Multi-Year Tariff (MYT) regulations were undertaken by the state
electricity regulatory commissions. MYT regulation provides an element of certainty
on costs to all the stakeholders, for which the utilities can legitimately be held
accountable. MYT regulation also seeks to reduce the cost of regulation and
regulatory intervention in routine utility matters.
Status of MYT regulation
MYT framework has been successfully implemented in most of the states, with many
state utilities being in the stage of MYT for the second control period. Many of the
state utilities opted for a relative shorter initial control period (three years), in order
to gain experience and improve the infrastructure related to information gathering.
The states, which have efficiently been be to implement the strategies envisaged in
the initial control period, have opted for a comparatively longer subsequent control
periods (five years).
The table below provides a state wise snapshot of the control period(s) ascertained
by the utilities to implement the business plan.
Table VI-12: MYT framework Control Period duration across states
States Control Period Control
Period No.1
Control
Period No.2
Control
Period No.3
Andhra
Pradesh
First control period = 3 years and
subsequent control periods = 5 years
FY 2006-07 to
FY 2008-09
FY 2009-10 to
FY 2013-14
FY 2014-15 to
FY 2018-19
(filed for
approval)
Assam
Generation = First control period, 5 years
from 1st April 2006;
Transmission = First control period, 3 years
from 1st April 2006; Distribution = First
control period, 3 years
FY 2013-14 to
FY 2015-16
Bihar First control period = 3 years FY 2012-13 to
FY 2014-15
Chhattisgarh First control period = 3 years FY 2012-13 to
FY 2014-15
Delhi
First control period = 4 years; extended to 5
years and subsequent control period = 3
years
FY 2007-08 to
FY 2010-11;
extended till
FY 2011-12
FY 2012-13 to
FY 2014-15
Gujarat First control period = 3 years and
subsequent control period = 5 years
FY 2008-09 to
FY 2010-11
FY 2011-12 to
FY 2015-16

AF-MERCADOS EMI
POWER SECTOR OPERATIONS AND IMPACT ON STATE FINANCES 101
States Control Period Control
Period No.1
Control
Period No.2
Control
Period No.3
Himachal
Pradesh
First control period = 3 years and
subsequent control period = 3 years
FY 2008-09 to
FY 2010-11
FY 2011-12 to
FY 2013-14
Haryana
First control period = 3 years; for
Generation, Transmission, Wheeling and
Distribution
FY 2014-15 to
FY 2016-17
Jammu &
Kashmir First control period = 3 years
FY 2013-14 to
FY 2015-16
Jharkhand
Generation = First control period, 4 years;
Distribution = First control period, 4years;
Distribution = First control period, 4years.
Submitted on 02.08.2012 for approval.
FY 2012-13 to
FY 2015-16
Karnataka First control period = 3 years and
subsequent control period = 3 years
FY 2007-08 to
FY 2009-10
FY 2010-11 to
FY 2012-13
Madhya
Pradesh
First control period = 3 years; for
Generation, Transmission and Distribution
FY 2013-14 to
FY 2015-16
Maharashtra First control period = 3 years and
subsequent control period = 5 years
FY 2007-08 to
FY 2009-10
FY 2011-12 to
FY 2015-16
Orissa
First control period = 5 years; second
control period = 5 years; and third control
period = 5 years
FY 2003-04 to
FY 2007-08
FY 2008-09 to
FY 2012-13
FY 2013-14 to
FY 2017-18
Rajasthan First control period = 5 years; second
control period = 5 years
FY 2009-10 to
FY 2013-14
FY 2014-15 to
FY 2018-19
(filed for
approval)
Tamil Nadu First control period = 3 years; second
control period = 3 years
FY 2010-11 to
FY 2012-13
FY 2013-14 to
FY 2015-16
Uttar Pradesh Generation - First Control Period, 5 years;
Distribution - None
FY 2009-10 to
FY 2013-14
Uttarakhand First control period = 3 years FY 2013-14 to
FY 2015-16
West Bengal
First control period = 1 year; Second control
period = 3 years; Subsequent control
periods = 3 years
FY 2007-08 FY 2009 to FY
2011
FY 2011-12 to
FY 2013-14
Source: Respective ERCs in the state and Forum of Regulators
Hence, states that are in the 2nd or 3rd control period have significantly improved the data
regimes as compared to states that are in the first control period.
iii. RIMS
Regulators are faced with two kinds of problems with regard to the information– first
incomplete information which implies absence of information with the involved entities and
second asymmetric information which implies imbalance of information between the

AF-MERCADOS EMI
POWER SECTOR OPERATIONS AND IMPACT ON STATE FINANCES 102
involved entities. This imbalance is created by presence of better and more accurate
information with the utility which is not voluntarily shared with the regulators.
One way that regulators attempt to compensate for the inherent information asymmetries
is by requesting even more detailed and voluminous information from companies, which of
course make the regulatory process even more information-intensive and cumbersome.
Regulatory Information Management System (RIMS) seeks to provide a framework for the
interface between the regulator and the regulated entities, and hence improve the quality
of regulatory decision making. It specifies formats in which the utilities are expected to
submit/upload information with the Commission. Licensees are able to submit this
information online and have the flexibility to upload revised drafts of the same document to
incorporate the most updated information.
Key benefits of RIMS are:
Simplifies process of collection and submission of information by regulators and utilities
respectively
Facilitates the process of tariff determination by providing access to accurate and
updated information in an easily retrievable database
Provides a facilitative platform for generation of reports for observing trends and
patterns in Key Performance Indicators (KPI) and hence assists in decision making
Online process reduces the time taken at each decision making step and introduces
transparency in the system
Uniform implementation of RIMS across the states provides uniform information across
state utilities and assist in monitoring the operational and financial performance of KPI
across state utilities
Orissa was the first Commission to develop and implement RIMS. Andhra Pradesh,
Maharashtra, Gujarat, Tamil Nadu, Uttar Pradesh and Delhi are some of the other states
that have introduced RIMS to improve their information collection processes and databases.
In the light of the above, Forum of Regulators has prepared data templates for RIMS
related to Generation, Transmission, Distribution, Renewable and Rural Electrification.
However, it is required to implement the above in all SERC’s and to continually update the
information in the prescribed formats and the defined KPI’s to be regularly monitored.
iv. Metering
The level of metering impacts the availability of true consumption details for different
consumer categories, also on determination of actual AT&C losses. However, in certain
cases the loss levels are determined based on the estimated consumption of the unmetered
category (especially agriculture).
Section 55(1) of the E Act 2003, provided that “No licensee shall supply electricity, after
the expiry of two years from the appointed date, except through installation of a correct
meter in accordance with regulations to be made in this behalf by the Authority”
Further, clause 5.4.9 of the National Electricity Policy provided the following:
“The Act requires all consumers to be metered within two years. The SERCs may obtain
from the Distribution Licensees their metering plans, approve these, and monitor the
same.”

AF-MERCADOS EMI
POWER SECTOR OPERATIONS AND IMPACT ON STATE FINANCES 103
Even after 10 years of the enactment of the Electricity Act 100% metering in most of the
states is still not achieved. The state wise status of the same is given below
Table VI-13: Status of Metering in different states in India
S.no. Name of State
Status of Metering for
individual consumers
by June-05
Remarks
1 Andhra Pradesh Partial 100%, except Agriculture
2 Assam Yes 100%
3 Bihar Partial 64.21%
4 Chhattisgarh 100% (2009-10.) including pump
&BPL connection.
5 Delhi Yes Almost 100%
6 Goa Yes
7 Gujarat Partial 100%, except agriculture consumers
8 Haryana Partial
All consumers have been metered
except flat rate agriculture consumers.
No new connection is given to
agriculture consumers without meter.
9 Himachal Pradesh Yes 100%
10 Jammu and
Kashmir Partial Over 50% metered
11 Jharkhand No
12 Karnataka Partial
Metering done to all installations other
than agriculture Pumpsets and few
BJ/KJ consumers
13 Kerala Yes Completed
14 Madhya Pradesh Partial 72.76% individual Consumers metered
15 Nagaland No
16 Odisha Yes Over 98%
17 Punjab Partial Metering of all consumers except AP
consumers is being done in PSPCL.
18 Rajasthan Partial Except agriculture consumers.
19 Sikkim No Directions issued
20 Tamil Nadu Partial 85% except agriculture and hut
21 Tripura Yes 95%
22 Uttar Pradesh Partial Except for rural and agriculture
23 Uttarakhand Yes Over 98%
24 West Bengal Partial 100% except agriculture
Source: CEA
It can be observed from the above table that only few of the states such as Assam,
Himachal Pradesh, Kerala, Orissa, Delhi, Goa, Tripura, Uttarakhand have been able to
achieve almost 100% metering, However, it must be noted that these states are dominated
by domestic consumers with no or small share of agriculture consumers. None of the states
have been able to meter 100% of the agricultural consumers in the country.
Besides agriculture consumer’s parts of domestic, commercial, street lighting, public water
works category etc. are also observed to be unmetered in some of the states
The table provides a snapshot of the state wise un-metered (partially or fully) consumer
categories for some of the states.

AF-MERCADOS EMI
POWER SECTOR OPERATIONS AND IMPACT ON STATE FINANCES 104
Table VI-14: State-wise un-metered consumer categories
States Agriculture Domestic Non-
Domestic
Street
Lighting
Public
Water
Works
Industrial
Andhra Pradesh
Arunachal Pradesh
Assam
Bihar
Delhi
Goa
Gujarat
Haryana
Jammu & Kashmir
Jharkhand
Karnataka
Madhya Pradesh
Maharashtra
Manipur
Meghalaya
Mizoram
Orissa
Puducherry
Punjab
Rajasthan
Tamil Nadu
Tripura
Uttar Pradesh
Uttarakhand
West Bengal
Source: CEA
Legend:
- Indicates partial/fully unmetered sales
It can be observed that significant portion of agriculture and rural domestic connections are
unmetered and across different states and there is a need to initiate timely metering plan
for such connections.
Further, to correctly assess the technical losses in the network energy audit, load flow
study and system level studies needs to be carried out.
AF-MERCADOS EMI
POWER SECTOR OPERATIONS AND IMPACT ON STATE FINANCES 105
6. Recourse to Consumers: Consumer Protection
The Electricity Act, 2003 envisages a framework where consumer is an important
stakeholder and the frameworks aims at ensuring that the efficiency gains
achieved through competition get translated into benefits for consumers. Apart
from the framework of competition, the Act also makes specific provisions seeking to
safeguard the interests of Consumers. The intent of the Act in terms of safeguarding
consumers’ interests gets reiterated right in the preamble of the Act, which reads as
follows:
“An Act to consolidate the laws relating to generation, transmission, distribution, trading
and use of electricity and generally for taking measures conducive to development of
electricity industry, promoting competition therein, protecting interest of consumers
and supply of electricity to all areas, rationalization of electricity tariff...”
Box VI-1: CONSUMER PROTECTION: KEY PROVISIONS IN THE ELECTRICITY ACT,
2003, National Electricity Policy and National Tariff Policy
Electricity Act 2003
Some of the major provisions pertaining to protection of consumer interests in the Act are:
Section 42 of the Electricity Act, 2003 provides, inter alia, for the establishment of a
CGRF for settling the grievances of consumers. It also provides for a channel of
appeal in the form of ombudsman for settling non-redressal of grievances at the
stage of CGRF
Section 57 of the Act requires the appropriate Commission to frame regulations on
standards of performance which a licensee is required to follow failing which
Protection of Consumer Interest Legal Provisions Regarding Consumers’ Interest he
is liable to pay penalty.
Section 59 of the Act provides for monitoring all such performance standards
through periodic reports to be submitted before the Regulatory Commissions
Section 61 regarding the factors which are to be kept in view in tariff determination.
Sub-section (c) thereof refers to encouragement of competition, efficiency,
economical use of resources, good performance and optimum investments.
Section 64(3) which refers to the procedure for making tariff order after considering
all suggestions and objections received from the public.
National Electricity Policy
Para 5.13 provides for Protection of consumers’ interests and quality standards. Key
aspects include the following:
It provides that Appropriate Commission should specify expected standards of
performance.
State Commissions should formulate the guidelines regarding setting up of
grievance redressal forum by the licensees as also the regulations regarding the
ombudsman and also appoint/designate the ombudsman.
The Central Government, the State Governments and Electricity Regulatory
Commissions should facilitate capacity building of consumer groups and their
effective representation before the Regulatory Commissions. This will enhance the
efficacy of regulatory process.

AF-MERCADOS EMI
POWER SECTOR OPERATIONS AND IMPACT ON STATE FINANCES 106
National Tariff Policy
Para 8.0 provides that the State Commission should determine and notify the standards of
performance of licensees with respect to quality, continuity and reliability of service for all
consumers
Under the Act, most of the regulatory commissions have brought out regulations pertaining
to quality of supply and services. Further, consumer forums and ombudsman have also
been created to take care of consumer’s grievances.
Despite of the enabling provisions of the Act and various regulations of SERC’s public
participation in the regulatory process has been limited. There is no systematic method of
capturing satisfaction and expectations of the consumers other than the opportunity
provided to them through discussion papers/public hearings, in which their participation is
again very limited. Bulk of the consumers especially rural and domestic consumers are not
even aware of such options. In few states, such surveys have been undertaken on the
instructions of commission but there is no definite periodicity. Hence, it becomes important
to assess the quality and impact of public participation in the process of electricity sector
regulation.
Box VI-2: Summary of Appellate Tribunal Judgement in Review Petition No. 5 of
2009, In Appeal No. 181 of 2008
Tribunal in the Review Petition No. 5 of 2009, In Appeal No. 181 of 2008 noted that
that two-tier mechanism for grievance redressal has not been made functional in
several States. It appears that even after the period of 6 years after the Electricity
Act, 2003 came into force, only some of the States have implemented the scheme
relating to the establishment of the grievance redressal mechanism under Section
42(5), (6) & (7) of the Electricity Act, 2003 and also in respect of the compliance of
the various provisions of the scheme of the Supply code under Sections 50, 57 and 59
of the Act. It is also brought to our notice that in some States, the scheme has either
been implemented partially or not at all. Thus, tribunal gave the following directions.
All the State Commissions/Joint Commissions are hereby directed to secure and
ensure the effective implementation of Sections 42(5) to (7), 50, 57 and 59 of the
Electricity Act, 2003 by taking the following actions:
Constitute, appoint and make functional the Consumer Grievance Redressal Forum
(CGRF) for each distribution licensee under the regulatory supervision of the
respective State Commission/Joint Commission. In case the CGRF has already
been
Constituted but vacancy has arisen, fill up the vacancy in the CGRF.
Constitute, appoint and make functional the Ombudsman for the State.
Specify and publicise guidelines governing the functioning of the CGRF and of the
Ombudsman as also the grievance redressal mechanism of the consumers of
electricity within the State
Notify and publicise appropriate standards of performance applicable to
distribution licensees functioning under the regulatory supervision of the State
Commission/Joint Commission.

AF-MERCADOS EMI
POWER SECTOR OPERATIONS AND IMPACT ON STATE FINANCES 107
In line with the above order of tribunal, all states except Arunachal Pradesh and Nagaland
have constituted CGRF. All states except Nagaland have appointed Ombudsman.
The table below presents the status of CGRF and Ombudsman Mechanism in
different States
Table VI-15: Status of CGRF and Ombudsman Mechanism in different States
S.
No
.
State No.
of
CGRF
No. of
Grievanc
es
received
by CGRF
during
the
quarter
ending
Decembe
r, 2013
No. of
Grievances
pending by
CGRF
during the
quarter
ending
December,
2013
No. of
Grievan
ces
pending
which
are
older
than 2
months
No. of
Ombu
dsman
No. of
Grievanc
es
received
by
Ombuds
man
during
the
quarter
ending
Decembe
r, 2013
No. of
Grievan
ces
pending
by
Ombuds
man
during
the
quarter
ending
Decemb
er,
2013
No. of
Grievan
ces
pending
with
Ombuds
man
which
are
older
than 2
months
1 Andhra
Pradesh
5 1
2 Arunachal
Pradesh
Nil Post not yet appointed by
Department of Power, GoAP
1 Nil Nil Nil
3 Assam 1 Nil Nil Nil 1 Nil 1 1
4 Bihar 3 118 299 201 1 2 20 20
5 Chhattisgarh 4 74 34 6 1 4 3 0
6 Delhi 4 279 411 NA 1 8 9 NA
7 Gujarat 8 408 127 4 1 37 14 1
8 Himachal
Pradesh
1 11 9 3 1
9 Haryana 2 113 85 7 1 14 5 0
10 Jammu &
Kashmir
11 Jharkhand 9 10 36 29 1 2 4 3
12 Joint ERC
(Goa and
UTs)
7 97 35 4
13 Joint ERC
(Mizoram
and
Manipur)
1 NA NA NA 1 Nil Nil Nil
14 Karnataka 5 53 147 116 1 0 6 NA
15 Kerala 6 175 189 49 1 28 89 61

AF-MERCADOS EMI
POWER SECTOR OPERATIONS AND IMPACT ON STATE FINANCES 108
S.
No
.
State No.
of
CGRF
No. of
Grievanc
es
received
by CGRF
during
the
quarter
ending
Decembe
r, 2013
No. of
Grievances
pending by
CGRF
during the
quarter
ending
December,
2013
No. of
Grievan
ces
pending
which
are
older
than 2
months
No. of
Ombu
dsman
No. of
Grievanc
es
received
by
Ombuds
man
during
the
quarter
ending
Decembe
r, 2013
No. of
Grievan
ces
pending
by
Ombuds
man
during
the
quarter
ending
Decemb
er,
2013
No. of
Grievan
ces
pending
with
Ombuds
man
which
are
older
than 2
months
16 Madhya
Pradesh
4 134 34 5 1 2 13 1
17 Maharashtra 14 1
18 Meghalaya 1 Nil Nil Nil 1 Nil Nil Nil
19 Nagaland NA 1 The post of Ombudsman not yet
created in Nagaland
20 Odisha 12 1268 495 91 2 32 24 4
21 Punjab 1 34 18 4 1 10 7 Nil
22 Rajasthan 3 NA
23 Sikkim 1
24 Tamil Nadu 42 180 98 3 1 21 30 7
25 Tripura 1 1 Nil Nil Nil
26 Uttarakhand 2 83 40 5 1 20 26 0
27 Uttar
Pradesh
20 406 532 241 2 78 239 181
28 West Bengal 22 1
Source: Forum of Regulators
Blank cell implies information is not available
States which are bigger in terms of geographical coverage like Uttar Pradesh, West Bengal,
Tamil Nadu, Gujarat, Odisha and Maharashtra have more numbers of CGRF ranging from 8
in Gujarat to 42 in Tamil Nadu.
The number of grievances received, is highest in Odisha followed by Gujarat, Uttar Pradesh
and Delhi. This clearly brings out that the states which have more number of CGRS has
highest number of grievances received. However, there are few exceptions like Delhi and
Tamil Nadu.
Delhi only have four (4) CGRF however, the grievances received is among the highest,
which is due to better consumer awareness in the State.

AF-MERCADOS EMI
POWER SECTOR OPERATIONS AND IMPACT ON STATE FINANCES 109
Tamil Nadu, which has highest number of CGRF has only 180 grievance received, hence
brings out that the consumer awareness and reachability of far villages to CGRF is low.
Similar, to this other states in India, either have inadequate number of CGRF or low
consumer awareness.
Realising these inadequacies, the Commission has given instructions to utilities to print
information about CGRF and Ombudsman on the consumer bill to generate awareness
among consumers about the redressal process. The initiative taken by the Commission is
noteworthy; however, it still needs to do much more to create awareness about the
regulatory process and ensure effective consumer participation.
The above also reflects that the Office of the Ombudsman is disposing of appeals received
judiciously and consumers are largely satisfied with orders. However, the small number of
consumers approaching the Ombudsman reflects that a very large number of consumers
are still not aware of the presence of this institution. Thus, there is a need to create
awareness about the redressal mechanism, especially in rural areas.
In order to ensure the quality and reliability of services by the distribution utilities,
Electricity Act 03, Sec 57-59 enables the SERCs to specify standard of performance (SoP)
for the utility.
It also states that if a licensee fails to meet the standards specified under Sub-section 57
(1), without prejudice to any penalty which may be imposed or prosecution be initiated,
shall be liable to pay such compensation to the person affected as may be determined by
the appropriate commission.
The Table below provides the status of compensation provided under SoP.
Table VI-16: Status of Compensation provided under SOP
Sr.No. State The number of cases in which
compensation was made and compensation made
1 Delhi
27 cases of BSES Raj and BYPL
6 CGRF and 1 Omb of NDPL
Penalty amount - Rs 27900
2 Gujarat Compensation paid to the consumers / complainants for not
meeting with the SOP is NIL for the Qr.III of 2012-13.
3 Haryana
Owing to timely resolution of the consumer grievances and
effective operational performance no such compensation was
released by the Nigam.
4 Karnataka
The quarterly returns furnished to the KERC for the period
1.4.2012 to 30.6.2012 is furnished.
During the year 2011-12 :
No. of Applications - 21729400
Disposed within due dated - 21441639
Disposed with delay - 150263
5 Madhya Pradesh MPPKVDCL-No compensation paid so far.
6 Sikkim 100%
NIL compensation.
7 Tripura
No pending order of Hon'ble Commission in regards to
performance level benchmark as well as payment of
compensation is laying pending with the corporation.

AF-MERCADOS EMI
POWER SECTOR OPERATIONS AND IMPACT ON STATE FINANCES 110
Sr.No. State The number of cases in which
compensation was made and compensation made
8 West Bengal
WBSEDCL: Information for 2010-11 is under scrutiny for
publication. CESC Ltd.: (Jan. - March'11) Compensation paid in
only one case.
Source: CEA
Standard of Performance (SoP) regulations have been notified by most of the
states, however, monitoring of these SOPs is weak and the penalties associated
and compensation paid to consumer is observed to be low.
7. Conclusion
In conclusion the following points can be made:
Financial independence provides a reasonable proxy of independence in regulatory
decision making except a few SERC. Large no. of SERC’s in India are dependent on
state govt. funding. In addition the requirements of E Act and NEP have not been
completely complied with. Globally the regulators have been functioning
independently through their own sources of income.
Inadequacy in technical staff and vacant positions has led to weak institutional
memory and internal capabilities. Globally the regulators are found to be well staffed
with strong technical teams supporting the process of regulatory assessments.
Improvement in Staffing through a well-structured program that also ensures
accountability of the recruited staff is much needed.
Culture of public disclosures of information has been improving over the years with
several SERC’s regularly reporting their annual reports including description of
initiatives and key decisions. However, this needs to be taken to the next level
which involves performance monitoring of SERC’s on specific indicators.
Frequency and Adequacy of Tariff revisions historically have been one of the key aspects
affecting the utility finances. However, ever since the OP1 Judgement in 2011, this has
been improving. OP1 has also led to regular monitoring of compliance of SERC’s on certain
critical parameters.
Unbundling, implementation of MYT framework, introduction of IT systems like RIMS and
100% metering are key priorities that have proved to improve data regimes across various
SERC’s. These hence need to percolate to all SERC’s so that such benefits can be realised
by all.
AF-MERCADOS EMI
POWER SECTOR OPERATIONS AND IMPACT ON STATE FINANCES 111
VII OPEN ACCESS
1. OPEN ACCESS AND ITS RATIONALE
Open Access is a fundamental building block of the competitive market framework ushered
through the Electricity Act 2003. Conceptually, Open Access in infrastructure services is
characterized by separation of 'carriage' from 'content'. Upon separation, carriage is
typically subjected to non-discriminatory Open Access for enabling competition in the
content segment. This freedom to content segment (flow of energy in this case) cutting
down monopolistic practices, increasing competition and thereby giving users greater
opportunity to improve efficiency forms the basis of the very concept of Open Access.
Open Access operates at two levels – at the wholesale market level, where all generators
(including existing generators operating through long term contracts) are accorded Open
Access that varies by the term of the access and at the retail level, where eligible
customers are permitted to source their supply from suppliers of choice through Open
Access.
Open Access in India also operates by network hierarchy. At the inter-state level it is
regulated by the Central Electricity Regulatory Commission (CERC). State level Open
Access is regulated by the respective State Electricity Regulatory Commissions. Further, at
a state level, transmission and distribution Open Access is differentiated.
The section below details out various aspects of Open Access in India and explains the
rationale behind the policy and legal framework driving Open Access.
2. LEGAL AND REGULATORY FRAMEWORK BEHIND OPEN
ACCESS
The regulatory framework for the introduction of Open Access in Indian Power sector was
structured and set to motion with the enactment of Electricity Act 2003. The Electricity Act
2003 was indeed a remarkable legislation which opened up the power sector to different
provisions of competition and power markets. Open Access was central to these
developments and enabled limited state-level arrangements to be formalized on a national
scale.
Table VII-1: Provisions of Electricity Act, 2003 in the context of Open Access
Section Provisions
9 (2) Every person, who has constructed a captive generating plant and
maintains and operates such plant, shall have the right to Open Access
for the purposes of carrying electricity from his captive generating plant
to the destination of his use.
38 (2) It is the responsibility of the Central Transmission Utility to provide non-
discriminatory Open Access to its transmission system for use by -
(i) any licensee or generating company on payment of the transmission
charges; or
(ii)any consumer as and when such Open Access is provided by the
State Commission under sub-section (2) of section 42, on payment
of the transmission charges and a surcharge thereon, as may be

AF-MERCADOS EMI
POWER SECTOR OPERATIONS AND IMPACT ON STATE FINANCES 112
Section Provisions
specified by the Central Commission.
Provided that such surcharge shall be utilised for the purpose of meeting
the requirement of current level cross-subsidy:
Provided further that such surcharge and cross subsidies shall be
progressively reduced and eliminated in the manner as may be specified
by the State Commission:
Provided also that such surcharge may be levied till such time the cross
subsidies are not eliminated:
Provided also that the manner of payment and utilisation of the surcharge
shall be specified by the State Commission.
Provided also that such surcharge shall not be leviable in case open
access is provided to a person who has established a captive generating
plant for carrying the electricity to the destination of his own use.
39 (2) It is the responsibility of the State Transmission Utility to provide non-
discriminatory Open Access to its transmission system for use by
(i) any licensee or generating company on payment of the transmission
charges; or
(ii) any consumer as and when such Open Access is provided by the State
Commission under sub-section (2) of section 42, on payment of the
transmission charges and a surcharge thereon, as may be specified by
the State Commission.
Provided that such surcharge shall be utilised for the purpose of meeting
the requirement of current level cross-subsidy:
Provided further that such surcharge and cross subsidies shall be
progressively reduced and eliminated in the manner as may be specified
by the State Commission:
Provided also that such surcharge may be levied till such time the cross
subsidies are not eliminated:
Provided also that the manner of payment and utilisation of the surcharge
shall be specified by the State Commission.

AF-MERCADOS EMI
POWER SECTOR OPERATIONS AND IMPACT ON STATE FINANCES 113
Section Provisions
Provided also that such surcharge shall not be leviable in case open
access is provided to a person who has established a captive generating
plant for carrying the electricity to the destination of his own use.
42 (2) The State commission shall introduce Open Access in such phases and
subject to such conditions, (including the cross subsidies, and other
operational constraints) as may be specified within one year of the
appointed date by it and in specifying the extent of Open Access in
successive phases.
Provided further that such surcharge shall be utilised to meet the
requirements of current level of cross subsidy within the area of supply of
the distribution licensee:
42 (4) Where the State Commission permits a consumer or class of consumers
to receive supply of electricity from a person other than the distribution
licensee of his area of supply, such consumer shall be liable to pay an
additional surcharge on the charges of wheeling, as may be specified by
the State Commission, to meet the fixed cost of such distribution licensee
arising out of his obligation to supply.
49 Where the Appropriate Commission has allowed Open Access to certain
consumers under section 42, such consumers notwithstanding the
provisions contained in clause (d) of sub-section (1) of section 62, may
enter into an agreement with any person for supply or purchase of
electricity on such terms and conditions (including tariff) as may be
agreed upon by them.
Source: Electricity Act 2003
3. STATE LEVEL OPEN ACCESS REGULATIONS
Consequent to the formulation of the Inter-state Open Access Regulations, the National Electricity
Policy, 2005 and the Tariff Policy, 2006, in year 2010, the Forum of Regulators formulated a model
Open Access regulation for SERCs to adopt in the respective states. In many cases these regulations
have however varied from the model regulations of the Forum of Regulators and the provisions of the
policies. The status of the regulations for various states is provided below:-

AF-MERCADOS EMI
POWER SECTOR OPERATIONS AND IMPACT ON STATE FINANCES 114
Table VII-2: State-wise Open Access Regulations
S.NO.
SERC STATE
Notification of
Open Access
Regulations
Determination
of Surcharge
Determination
of Wheeling
Charges
1 APERC A.P Yes Yes Yes
2 AERC Assam Yes Yes Yes
3 BERC Bihar Yes Yes Yes
4 CSERC Chhattisgarh Yes Yes Yes
5 DERC Delhi Yes Yes Yes
6 GERC Gujarat Yes Yes Yes
7 HERC Haryana Yes Yes Yes
8 HPERC Himachal Yes Yes Yes
9 J&KSERC J&K Yes Yes No
10 JSERC Jharkhand Yes Yes Yes
11 KERC Karnataka Yes Yes Yes
12 KSERC Kerala Yes Yes Yes
13 MPERC M.P Yes Yes Yes
14 MERC M.H Yes Yes Yes
15 MsERC Meghalaya Yes No No
16 OERC Orissa Yes Yes Yes
17 PSERC Punjab Yes Yes Yes
18 RERC Rajasthan Yes Yes Yes
19 TNERC T.N Yes Yes Yes
20 TERC Tripura Yes No No
21 UPERC U.P Yes Yes Yes
22
UERC Uttrakhand Yes Yes Case to Case
Basis
23 WBERC W.B Yes Yes Yes
24 JERC-
M&M
Mizoram,
Manipur Yes No No
TOTAL
ISSUED
25 22 18
Source: Tariff Orders and Open Access Regulations of respective states.
The open access regulations in India have been notified by 25 states and cross subsidy out
of these have been determined by 22 states. The figure below presents the number of open
access consumers in major states.
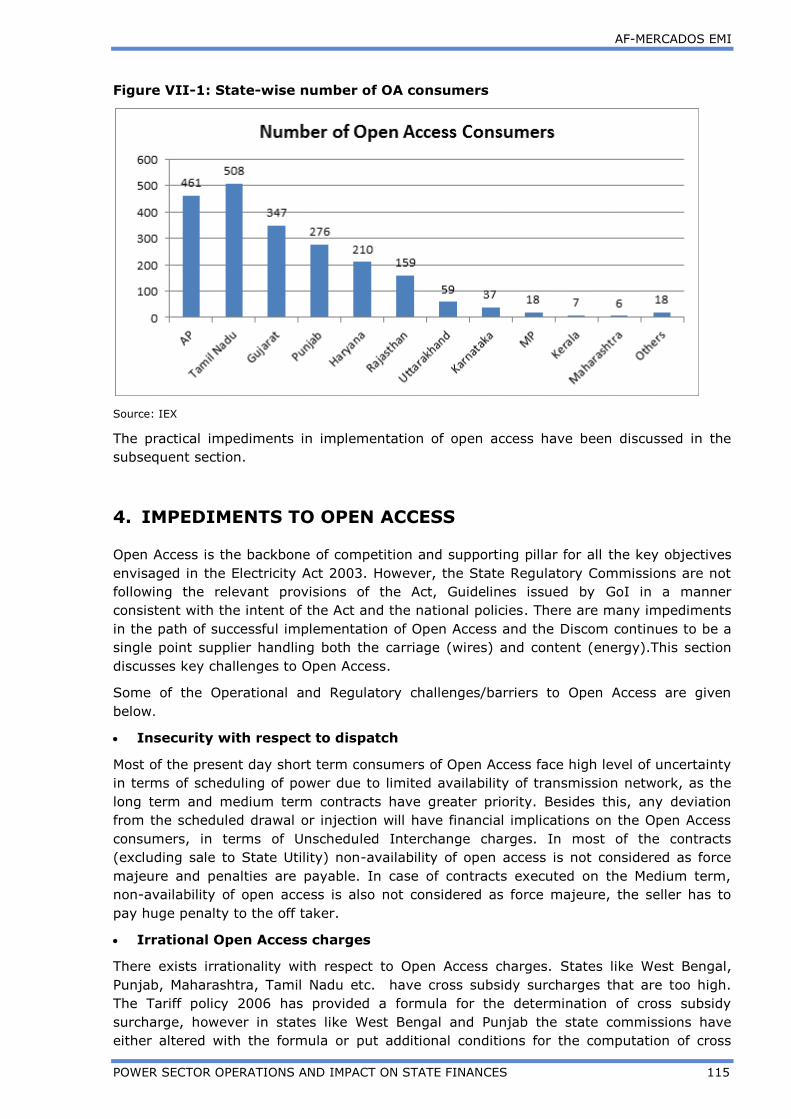
AF-MERCADOS EMI
POWER SECTOR OPERATIONS AND IMPACT ON STATE FINANCES 115
Figure VII-1: State-wise number of OA consumers
Source: IEX
The practical impediments in implementation of open access have been discussed in the
subsequent section.
4. IMPEDIMENTS TO OPEN ACCESS
Open Access is the backbone of competition and supporting pillar for all the key objectives
envisaged in the Electricity Act 2003. However, the State Regulatory Commissions are not
following the relevant provisions of the Act, Guidelines issued by GoI in a manner
consistent with the intent of the Act and the national policies. There are many impediments
in the path of successful implementation of Open Access and the Discom continues to be a
single point supplier handling both the carriage (wires) and content (energy).This section
discusses key challenges to Open Access.
Some of the Operational and Regulatory challenges/barriers to Open Access are given
below.
Insecurity with respect to dispatch
Most of the present day short term consumers of Open Access face high level of uncertainty
in terms of scheduling of power due to limited availability of transmission network, as the
long term and medium term contracts have greater priority. Besides this, any deviation
from the scheduled drawal or injection will have financial implications on the Open Access
consumers, in terms of Unscheduled Interchange charges. In most of the contracts
(excluding sale to State Utility) non-availability of open access is not considered as force
majeure and penalties are payable. In case of contracts executed on the Medium term,
non-availability of open access is also not considered as force majeure, the seller has to
pay huge penalty to the off taker.
Irrational Open Access charges
There exists irrationality with respect to Open Access charges. States like West Bengal,
Punjab, Maharashtra, Tamil Nadu etc. have cross subsidy surcharges that are too high.
The Tariff policy 2006 has provided a formula for the determination of cross subsidy
surcharge, however in states like West Bengal and Punjab the state commissions have
either altered with the formula or put additional conditions for the computation of cross

AF-MERCADOS EMI
POWER SECTOR OPERATIONS AND IMPACT ON STATE FINANCES 116
subsidy surcharge. Besides that there is no predictability about the level of future Open
Access charges making consumers reluctant to avail this service. The Act calls for
gradual reduction of cross subsidy surcharge, but no such reduction trajectory is
found in any of the states.
Table VII-3: Cross-Subsidy Surcharge in major states
States CSS (Rs./kWh)
Punjab 1.07
Haryana 0.53
Rajasthan 0.13
Uttarakhand 0.4
A.P 0
Kerala 0.52
Tamil Nadu 0
Karnataka 0.64
Maharashtra 2.3 (Express)
Madhya Pradesh 0.81
Chattisgarh 1.14
Gujarat 0.45
Source: IEX
Absence of dedicated feeders
In majority of states, Open Access can be assured only in case of separate feeder lines.
However, most of the present day network is meshed in nature along with embedded
consumers (non-Open Access consumers). In the event of load shedding by distribution
licensee for a feeder where both Open Access consumers and embedded consumers (non-
Open Access consumers) are connected, Open Access rendered becomes infructuous.
Resistance of licensee
The distribution licensee normally hesitates to implement the Open Access for fear of losing
high paying industrial consumers who cross subsidise the agriculture and domestic
consumers. The other reason cited by the distribution companies is that their demand and
supply projections would go haywire if industrial consumers who constitute almost 30% of
the consumption migrate, it will lead to chaos both in terms of demand projections and way
to handle the long term capacity contracted to meet their need.
Biased role of SLDC
Most of the States do not have Independent SLDC (State Load Dispatch Centre); they
operate as a department under State Transmission Company (STU). Conflict of interest
may arise between State Discom and SLDC or between SLDC and the Open Access
consumer. SLDC usually act as a barrier to Open Access sitting on applications, denying
generators the right to sell power to a third party as on date.
Regulatory gaps
The Open Access regulations have significant gaps and lacks clarity thus creating doubts.
Some of them are:

AF-MERCADOS EMI
POWER SECTOR OPERATIONS AND IMPACT ON STATE FINANCES 117
o The current regulations are silent about billing and monitoring of any Open Access
transaction at the state level.
o There is no mechanism specified in the regulations for undertaking and monitoring the
day ahead scheduling, real time dispatch, carrying of weekly MRI (Meter Reading
Instrument), preparation of UI (Unscheduled Interchanges) account and monthly
account etc.
o There is no formula mentioned in the regulations regarding calculation of additional
surcharge.
o The regulations do not specify any mechanism for computation of stand by charges
Further certain States like Tamil Nadu and Karnataka have invoked Section 1127 thereby
restricting export of power outside the State. As SLDC is operated by the State Utility, the
Open Access consumers located outside the State gets affected.
5. RECENT POLICY THRUST IN GRANT OF OPEN ACCESS
GoI has hence set up a group that is working on ways to implement the plan which will
require a separation of the distribution (‘carriage’) and the retail supply (‘content’)
businesses, with separate licenses for each, the implementation of the plan would require
changes in the Electricity Act of 2003. The Electricity Act of 2003 in the present format
allows open access which means providing access to use the wire by paying a transmission
or wheeling charge to the owner of the network. Network business being a natural
monopoly, the regulator must ensure that there is non-discriminatory open access, that is,
if the network has capacity, the utility cannot decline the use of it by anyone, all this is
available in the existing Act. The plan being considered now is different because it allows
retail competition wherein the consumers will be able to choose their supplier from the
multiple retail supply licenses that would be available for each area including the incumbent
supplier. Retail competition also means a new entrant can poach from the original licensee.
India has been placing fundamental reliance on Open Access as a means for power sector
development, creation of capacity, operation of the power markets and provision of service
to consumers. With the policy makers putting increasing thrust on distribution sector
reforms and the Ministry of Power advocating for separation of power supply business and
network ownership, Open Access Consumers takes the centre stage.
Based on this review, the key learning are listed below.
a. Legal Provisions Separating Carriage from Content
The distinction between carriage and content in the electricity supply business is very
important and law needs to differentiate and recognize such separation. Such
separation can have significant impact on the behavioural pattern of the licensee,
Open Access customers as well as the sector in general.
27 Electricity Act 2003, Section 11-“ The Appropriate Government may specify that a generating
company shall, in extraordinary circumstances operate and maintain any generating station in
accordance with the directions of that Government”. For the purposes of this section, the expression “ extraordinary circumstances” means circumstances arising out of threat to security of the State, public order or a natural calamity or such other circumstances arising in the public interest.
AF-MERCADOS EMI
POWER SECTOR OPERATIONS AND IMPACT ON STATE FINANCES 118
b. Implementation of Obligation to Connect
Section 43, Electricity Act 2003 reads “licensee, shall, on an application by the owner
or occupier of any premises, give supply of electricity to such premises, within one
month after receipt of the application requiring such supply”. Further it states “It
shall be the duty of every distribution licensee to provide, if required, electric plant or
electric line for giving electric supply to the premises”.
Thus a licensee is bound to provide adequate infrastructural facilities. This does not
discriminate between a consumer who has availed power through Open Access and a
Discom’s own consumer. But the practical difficulties in many States are that the
consumers have been denied Open Access on grounds of inadequate infrastructure
and applications are delayed. This is a violation of the law and against the spirit of the
Act. The policy makers must ensure that violation of any law in this regard is dealt
with firmly.
c. Standardization of Regulations Across Various States within the Country
India has 28 States (now 29), as power is concurrent subject each State Regulator
issues its own set of Regulations. Because of this it is a tremendous challenge for an
Open Access consumer to find the most optimal source to procure power. This has
been the major issue in the subject. Gaps and lack of clarity in some of the sections of
Open Access regulations has made it extremely difficult to implement the concept on
the ground.
In an era of Open Access the terms, nomenclature, drafting of the documents,
definitions should be standardised. The Regulations should be clear and uploaded on
the Regulators website. All the charges and terms and conditions (latest) that are
applicable for a transaction should be available on the State Regulators website. The
regulations should clearly specify guidelines regarding billing, monitoring, standby
charges and most important the calculation of various charges applicable to an Open
Access consumer. For further clarity an illustration to listing out the charges applicable
should also be provided.
d. Universal Service Obligation of the Discoms
The issue was under deliberation for the last few months and involved highest level of
decision makers in the country. Ministry of Power has taken a stand that in case the
Open Access consumer procures power from other than the local discom then it is
logical that DISCOMS do not have an obligation to compulsorily supply power to such
consumers. And if the consumer intends to use the network of DISCOMS, he has to
give notice upon which the DISCOM is duty bound to provide non-discriminatory open
access on its network.
In a power deficit country with poor transmission network there is a need for
redundancy in the supply of power. But only a few States have standby supply options
most of the other States charge the highest rates (almost double the HT Charge rate)
making it one of the biggest obstacles to avail Open Access. The regulators should
ensure that the guidelines and orders issued by them are not too stringent and biased
towards one party. For Open Access to be implemented in sound manner it is
important that interest of both the Discoms and the consumers is taken care of. An
Open Access consumer should get assured standby supply of power from the discom
and proper measures and mechanism should be adopted to ensure that the
commercial interest of the discom is not put at stake.
AF-MERCADOS EMI
POWER SECTOR OPERATIONS AND IMPACT ON STATE FINANCES 119
e. Provisions Related to Supply from (Independent and Non-Independent)
Network
It has been observed that most of the Open Access consumers draw power from a
meshed network. If the licensee imposes load shedding, the Open Access consumer is
also affected. This poses a serious risk to an Open Access consumer as contractually
the consumer would have to pay penalty to the generator for not drawing power. The
FOR Regulations on Open Access allow for scheduling on both dedicated as well as
common feeder but the conditions imposed are restrictive in nature.
f. Independence of System Operators
Independence of system operators has a key influence on the operationalisation of
Open Access. State Load Dispatch Centres (SLDC’s) which operate the entire system
within a State, have been found acting as a barrier to Open Access, sitting on
applications, denying generators the right to sell power to a third party. This is
because most of the States do not have an independent system operator. These
SLDC’s operate as a department under State Transmission Company (STU) resulting
in conflict of interest between the State Discom and the SLDC. Thus it is very crucial
to have an independent system operator who is unbiased and is responsible for
scheduling, dispatch, monitoring and accounting of various transactions.
Open Access, if implemented in right spirit is likely to bring positive results. But the manner
in which the implementation is progressing in the midst of issues and bottlenecks, Open
Access is not going to be an easy feat to achieve and would need effective policies and
transparent execution.
On an incremental basis the commercial risks of a Discom buying electricity from the power
markets and the cost of electricity paid by the Open Access customer is no different. The
conventional wisdom is that the migration of large customers would impoverish the utilities.
This is at best a partial truth. Incrementally, it often costs more to serve the industrial
customers than not to serve them28. Hence, an orderly migration of such customers is not
inimical to utility interest, which can have a net benefit from reasonable cross-subsidy
charges and also recover the network costs through reasonable wheeling charges. This is
however very poorly understood. It is noteworthy that holding on to higher value
consumers has not allowed Discoms to become financially healthy.
At an overall level, Open Access is going to be an important part of power sector
development in India. Recent developments on the subject have created interest among
the shareholders and policy makers. Though the atmosphere of uncertainty and confusion
will take time to fade away, Open Access provides a significant opportunity for new capacity
development and an efficient way to serve consumer needs.
28 Assuming a power purchase cost of Rs. 5.00 at generation bus bar (which is normal for imported coal or non-
pithead domestic coal projects) the average cost to serve HT consumer is in the range of Rs. 7.3 per kWh after considering normative transmission costs and losses and the HT distribution costs and losses. Hence, if the average HT industrial tariff is less than Rs. 7.3 per kWh, as is often the case, serving such consumers can be a losing proposition for the utility, on the margin.

AF-MERCADOS EMI
POWER SECTOR OPERATIONS AND IMPACT ON STATE FINANCES 120
VIII REVIEW OF APPROCHES ADOPTED FOR MEASURING
AGRICULTURAL CONSUMPTION
An efficient management of power supply to the agriculture consumers constitute an
integral part of any programme of the power sector. However, most of the states still have
not achieved 100% metering for agricultural consumers, hence determination of unmetered
agricultural consumers becomes critical.
Hence, this section compares the methodology adopted by various State ERCs with major
agricultural consumer base to estimate the sales to agriculture segment.
1. Andhra Pradesh
In 2011-12, agricultural sales in Andhra Pradesh contributed ~ 28% of the overall sales
mix in the state. The total agriculture connections in FY 2012-13 accounted for 29.90 lakh.
As per the GoAP policy, agricultural sector is provided seven hours of electricity supply.
The state distribution utilities in Andhra Pradesh has been estimating unmetered agriculture
consumption based on information available from meters fixed on LV side of Distribution
Transformers primarily catering to the agricultural pump sets for working out a
consumption norm. This consumption norm is further utilized for a more realistic
estimation of unmetered agricultural consumption. The specific consumption per HP/month
is arrived and is made applicable to all un-metered services by multiplying specific
consumption and connected load in HP to arrive at total agriculture consumption.
However, there is lot of difference between the approved and actual sales, same has been
provided below:-
Table Table VIII-1: Comparison of Agricultural Sales Approved against Actual
2013-14 2012-13 2011-12 2010-11
Approved Sales by SERC – in
MUs 19305 19305 17569 16262
Filled Sales by Utilities – in MUs 23743 22458 20840 19722
Actual Sales – in MUs - 22013 20191 17126
Source: AF Mercados Analysis based on the data from Tariff orders and PFC
Hence, this clearly brings out that there is no alternative to 100% metering as observed
from the table that the agricultural sales approved are less than the actual sales.
The commission has approved a new ISI methodology to estimate the agricultural sales;
however, implementation of the methodology requires updating of agricultural DTR data
which currently is not updated, given the expansion of High Voltage systems for agricultural
consumers. Hence, the utilities have continued to follow the old approach of estimating
agricultural sales.
2. Gujarat
In 2011-12, agriculture sales contributed ~25% of the overall consumer sales mix in the
state, with ~57% of the agriculture consumers or ~81% of the agriculture sales
unmetered. The methodology adopted by the state commission for demand estimation is as
follows:
The energy consumed by the unmetered agriculture consumers is assessed based
on 1700 units/HP/Annum.
AF-MERCADOS EMI
POWER SECTOR OPERATIONS AND IMPACT ON STATE FINANCES 121
Minimum 8 hours of supply is provided to the agriculture consumers, with excess
hours of supply being provided during cropping season. Further, in a critical case
when the power supply is reduced to 5 hours, the shortage of supply is
compensated during subsequent period when power position improved.
Historical, weighted average consumption of metered consumers is considered to
assess the consumption for the existing and new metered consumer connections
being added.
The table below provides a snapshot weighted average consumption norms for metered
agriculture consumers, as approved by the state commission for different utility.
Table VIII-2: Agricultural Consumption Norms in Distribution Utilities of Gujarat
DISCOM Control Period Weighted Average Consumption Norm
UGVCL FY 2011-12 to FY 2015-16 970 kWh/HP/annum
MGVCL FY 2011-12 to FY 2015-16 1011 kWh/HP/annum
DGVCL FY 2011-12 to FY 2015-16 524 kWh/HP/annum
PGVCL FY 2011-12 to FY 2015-16 529 kWh/HP/annum
Source: Approved Multi Year Tariff Order, FY 2012-16
Further, initiatives like the Jyotigram Yojna, aimed at segregation of sale to agriculture
users from other users in rural areas, have resulted in provision of reliable power to the
agriculture consumers.
3. Haryana
In 2011-12, agricultural sales in Haryana contributed to ~31% of total sales. As per the
approved tariff order for 2013-14, unmetered agricultural sales approved by Commission
are 44% of total agricultural sales.
The Commission in Haryana estimated consumption of Agricultural Pump (AP) consumers
on the basis of the actual consumptions recorded by the energy meters installed on 11 KV
segregated AP feeders at the grid substations and a small percentage of consumption of AP
consumers connected on feeders other than the segregated AP feeders. The Commission
has retained the same methodology for projecting AP Sales from past five years.
The tariff applicable for agriculture pump (AP) supply consumers in Haryana is currently
under two categories i.e. AP metered consumers billed on energy consumption basis and AP
un – metered consumers who are currently paying a flat rate per BHP per month. As per
CoS estimates of the Commission the AP consumers are paying just about 6% of the CoS.
However, as per the Commission order that the entire revenue gap in the AP consumer
category is bridged by way of AP Subsidy from the State Government and no consumer
category is cross – subsidizing the AP consumers.
4. Karnataka
In 2011-12, agriculture sales contributed ~37% of the overall consumer sales mix in the
state, with more ~ 76% of the agriculture connections in the state unmetered. The
methodology adopted by the state commission for demand estimation is as follows:
The unmetered irrigation pump (IP) sets are charged based on the consumption
norms, derived by the actual consumption per IP set as indicated in the monthly
reports furnished by state distribution utilities up to December of the financial year.
The consumption has been projected for 6 hours, three phase supply to the
irrigation pump sets

AF-MERCADOS EMI
POWER SECTOR OPERATIONS AND IMPACT ON STATE FINANCES 122
The table below provides a snapshot weighted average consumption norms for metered
agriculture consumers, as approved by the state commission for different utility.
Table VIII-3: Agricultural Consumption Norms in Distribution Utilities of
Karnataka
DISCOM Weighted Average Consumption Norm
BESCOM 7534 units/installation/year
CESC 8613 units/installation/year
GESCOM 9708 units/installation/year
HESCOM 8210 units/installation/year
MESCOM 3916 units/installation/year
Source: Approved Tariff Order 2012-13 for the respective DISCOMs
Further, initiatives undertaken by the state commission to implement a robust Demand
Side Management, has mandated bifurcation of agricultural loads from 11KV feeders and
adoption of HVDS for agriculture loads, in order to implement efficient rationing of power to
agriculture consumers.
5. Madhya Pradesh
In 2011-12, agricultural sales in Madhya Pradesh accounted for 33% of total sales. The
approach followed for determination of agriculture sales is the Compound Annual Growth
Rates (CAGRs) CAGR (for small, medium and long term) approach along with correction
factor to account for any State/ Central Govt schemes, pending connections.
The analysis of the data, appropriate/reasonable growth rates are assumed for future
consumer/ sale forecasts from the past CAGRs of the Category/Sub-category. The forecast
also considers the impact of schemes/ plans of licensees such as RGGVY as stated above.
The Commission has emphasized the importance of energy accounting and meterisation
and hence, Discoms are directed to prepare and implement appropriate loss reduction
strategies and schemes. Meterisation at various levels of the distribution network such as
feeder/ DTR metering and consumer metering is of prime importance. The Commission, has
however, noted with deep concern that not much headway has been made in this direction
by the distribution licensees during the past years. While there appears to be some
progress with regard to feeder meterisation, meterisation of agricultural DTRs and
individual un-metered domestic connections remains neglected.
Hence, only 14% of Agriculture DTR has been metered as per the tariff order of FY 2013-
14.
6. Maharashtra
In Maharashtra, MERC has been approving agricultural consumption based on the recorded
consumption of sample metered consumers after filtering for abnormal records, viz., zero
connected load, average billing, negative consumption, high connected load, etc., for all the
zones. Further, the data was analyzed to work out a zone-wise consumption norm in
hrs/hp/annum which was subsequently utilized for projecting zone wise metered and
unmetered agricultural consumption. The exercise of sample study was undertaken by the
utility as per the direction of MERC.

AF-MERCADOS EMI
POWER SECTOR OPERATIONS AND IMPACT ON STATE FINANCES 123
7. Punjab
In 2011-12, agriculture sales contributed ~29% of the overall consumer sales mix in the
state. The energy sales to agriculture pumps are fully unmetered, and consumption based
on demand estimates. The methodology adopted by the state commission for demand
estimation is as follows:
The consumption (in BHP) of agriculture pumps is calculated through installation of
about 10% sample meters and recording of energy pumped through AMR meters
installed at various substations. The impact of level of rainfall in the monsoon
season is also factored to calculate the consumption norm
The consumption is projected for six or eight hours of power supply to the
agriculture pump sets
The state distribution utility has stated difficulty in complete installation of meters to the
tube-well consumers and recording the consumption of all agriculture pump consumers due
to financial aspect, staff shortage aspect and other administrative reasons.
Further, for approval of agriculture sales, the commission allows a 5% growth over the
demand submitted in the review order by the state utility.
8. Rajasthan
In Rajasthan, Commission normally considers Compounded Annual Growth Rate (CAGR) of
3 or 5 previous years, as the case may be, in assessing energy requirement in a year.
However, in case of Agriculture, connected load and specific consumption have been used
for calculating sales as adopted in tariff order of FY 2012-13. This methodology is more
appropriate rather than using CAGR of sales, as agricultural consumption varies
considerably on year to year basis due to erratic nature of rainfall in the State. In addition,
supply hours for agriculture in the past have varied considerably due to various reasons,
which also lead to significant changes in consumption of power in agriculture. This
methodology has been used in the order for estimating the energy sales of Agriculture
consumers (both metered and flat rate).
The Commission, however, has approved the sales for FY 2013-14 using the following
assumptions.
1. For metered category, the no. of consumers, specific consumption (kWh/KW/Year) and
connected load (KW) for all Discoms have been taken as per tariff petitions after the
reduction of no. of consumers and connected load of Farm Houses.
2. The Commission has considered that new and converted consumers on the average
could be taken to be in the metered category for 6 months. Accordingly, connected load
and specific consumption as applicable for metered category have been considered for 6
months in case of new consumers and those converted from flat rate for working out their
sales.
9. Tamil Nadu
The agricultural consumption is calculated every month based on the sample meter reading
furnished by the field in the absence of 100 % metering. The sample meters to a value of 5
% are provided/ available in each area/circle in which readings are taken every month by
the field staff. As sample meter readings are available in each area/circle wise on monthly
basis, the area wise geographical condition and seasonal condition are taken care for
arriving at computed consumption.
This calculated agricultural consumption in each area/circles are combined /added to arrive
at the total agricultural consumption in the State. Since 5 % sample meters are available in
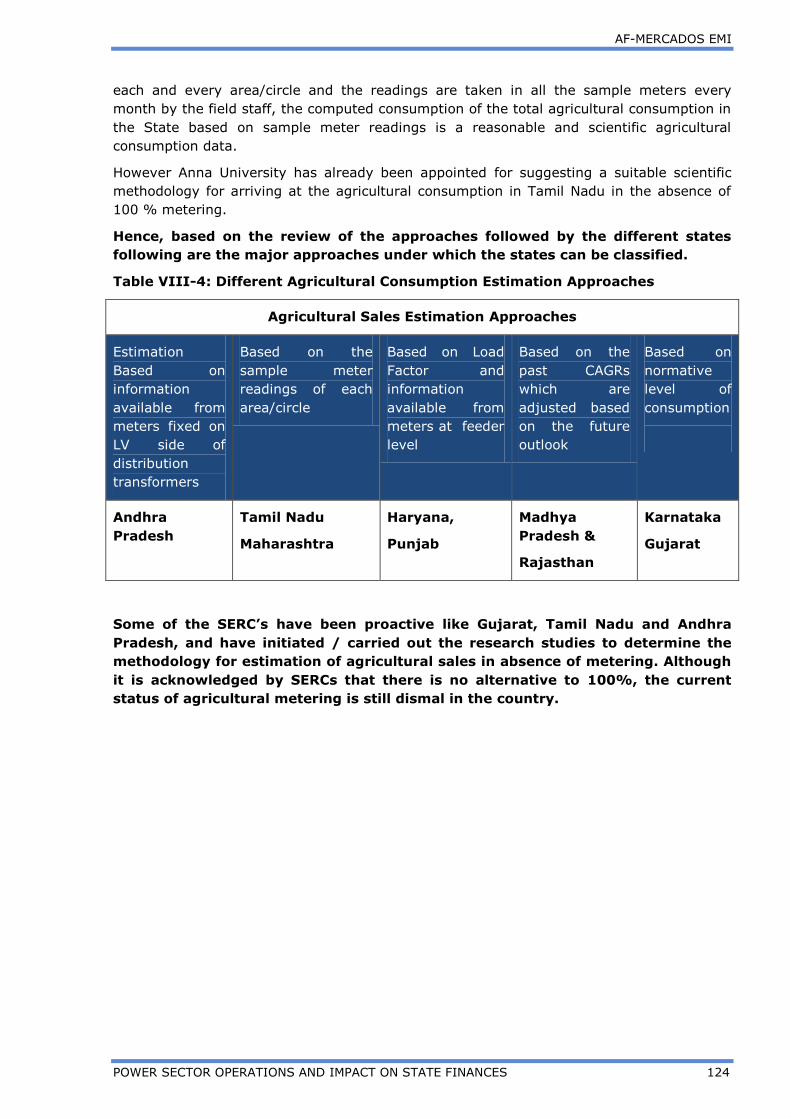
AF-MERCADOS EMI
POWER SECTOR OPERATIONS AND IMPACT ON STATE FINANCES 124
each and every area/circle and the readings are taken in all the sample meters every
month by the field staff, the computed consumption of the total agricultural consumption in
the State based on sample meter readings is a reasonable and scientific agricultural
consumption data.
However Anna University has already been appointed for suggesting a suitable scientific
methodology for arriving at the agricultural consumption in Tamil Nadu in the absence of
100 % metering.
Hence, based on the review of the approaches followed by the different states
following are the major approaches under which the states can be classified.
Table VIII-4: Different Agricultural Consumption Estimation Approaches
Agricultural Sales Estimation Approaches
Estimation
Based on
information
available from
meters fixed on
LV side of
distribution
transformers
Based on the
sample meter
readings of each
area/circle
Based on Load
Factor and
information
available from
meters at feeder
level
Based on the
past CAGRs
which are
adjusted based
on the future
outlook
Based on
normative
level of
consumption
Andhra
Pradesh
Tamil Nadu
Maharashtra
Haryana,
Punjab
Madhya
Pradesh &
Rajasthan
Karnataka
Gujarat
Some of the SERC’s have been proactive like Gujarat, Tamil Nadu and Andhra
Pradesh, and have initiated / carried out the research studies to determine the
methodology for estimation of agricultural sales in absence of metering. Although
it is acknowledged by SERCs that there is no alternative to 100%, the current
status of agricultural metering is still dismal in the country.

AF-MERCADOS EMI
POWER SECTOR OPERATIONS AND IMPACT ON STATE FINANCES 125
IX REVIEW OF GOOD PRACTICES IN POWER
DISTRIBUTION WITHIN THE COUNTRY
Review of good practices undertaken as part of this study is based on the Structure-
Conduct-Performance framework, commonly used in industrial economics, offering a causal
explanation to performance of the system under analysis. The framework is based on the
premise that structure of the market determines the conduct of its participants and this
conduct drives market performance.
The figure below maps the overall electricity sector (focussing on power distribution), its
conduct and performance of the players. The key attributes under the SCP Framework are
provided below based on which observations have been drawn.
Figure IX-1: Structure Conduction Performance Framework applied on Electricity
Distribution Sector in India
The key points that emerge from the above are as follows:
Ownership plays a key role in determining utility behaviour. In India, discoms
are largely state owned that provides limited incentives for the utilities to meet their
obligations. As a result, these are inefficient and often unresponsive to quality and
service obligations. A number of policies since the reforms have been initiated have
talked about introduction of private participation in the sector however these remain
unimplemented. As per revised Mega Power Policy, to avail the benefits under policy, a
pre-condition for the beneficiary States should have constituted their Regulatory
Commissions with full powers to fix tariffs as envisaged in the Central Act. They would
also have to privatise distribution in the cities having a population of more than one
million. Clause 5.4.4 of the National Electricity Policy also provided for need to
encourage Private sector participation in distribution for achieving the requisite
reduction in transmission and distribution losses and improving the quality of service to
the consumers. Even as part of the FRP of GoI, states have to submit the Road-Map for
Structure Conduct Performance
• Vertically integrated and
then disaggregated
(partly)
• Federal/State Control
Discoms
• Government/ Common
Ownership
• Command and Control
(Partly Market Based)
• Government Regulated to
Independent regulation
• Monopolistic
• Politically Riven
• Low Accountability
• Market participation
(when no conflict)
• Market Denial when
conflict
• Ineffective Regulators
• Policy, Politics, Ownership
indistinguishable
• Poor Performance
Measurement
• Poor efficiency
• Poor customer service
• Poor financial
performance
• Poor planning and
operations
• Distorted Tariffs
• Poor access/supply
continues
• Load not met
• Looming Bankruptcy in
Generation/ Banking
• Risks devolving to states

AF-MERCADOS EMI
POWER SECTOR OPERATIONS AND IMPACT ON STATE FINANCES 126
private participation in distribution. As stated above, private participation needs to be
ushered in to bring about rapid efficiency improvement.
Level of efficiency and the pace at which such efficiency can be achieved under state
ownership has reached a plateau in the recent past. Private sector involvement has
resulted in benefits wherever these have been introduced. e.g. Delhi, Mumbai, Noida,
Ahmedabad, Surat, Kolkata, Saraikela. Generation and Transmission segments are
other examples that have been opened much more widely.
Thus, initiatives aimed at introduction of private participation need to be backed with
strong implementation wherewithal to ensure execution in a timely manner. Examples
of economies transitioning to private participation in distribution include US, Turkey,
UK, Australia etc. Many of these countries have taken this up in a structured manner by
segregating wires and retail business (discussed later).
Distribution Franchisee model was introduced with reasonable success,
however adoption by other states has been slow and derided with problems-
The Franchisee model has achieved some success wherein the franchisees have been
able to reduce the losses for the distribution utility. This includes Bhiwandi region in
MSEDCL (Maharashtra) area of operation wherein the franchisee reduced the AT&C
losses to 19% from 58%. Similarly, in Agra region in DVVNL (Uttar Pradesh) area of
operation wherein the franchisee reduced the T&D losses to 46% in 2011 as compared
to 67% in 2010. Despite of the successes, many franchisee initiatives have either been
cancelled or deferred after initial interest due to host of challenges related to state
employee’s resistance, disagreement over contractual terms, inaccurate base line data
of T&D losses, collection efficiency, asset details and customer database etc.
Unbundling has only been partially implemented - Power sector in India was
characterised by vertically integrated utilities with generation, transmission and
distribution functions being served by a single entity. Gradually, competition was
introduced, wherein these vertically integrated utility were segregated based on the
functional lines i.e. generation, transmission and distribution. However, distribution and
retail supply are still bundled and no distinction is being made between carriage and
content. Experience of several countries worldwide indicates that competition and
efficiencies at the retail levels can be best achieved through separation of carriage and
content. In such cases, multiple suppliers are allowed to supply through a common
network. Implementation of this requires changes in the law, which have been in
discussion since long, however this has been pending since long. Successful examples
of this include US, UK, Australia etc.
Policy, Politics and Ownership have been indistinguishable- Electricity has been
an important part of the politics of the country and despite of the reforms undertaken
over the decade, policy, politics and ownership have remained indistinguishable. Most of
the states have not been able to achieve 100% metering as envisaged in the E Act
2003. Agricultural tariffs and metering have remained low across all major agricultural
states. Subsidy levels have increased over the years and in certain cases subsidy
received by the utilities have been less than the subsidy booked by the Discoms clearly
in violation of the provisions of the Act.
Monopolistic nature of the utilities results in limited accountability especially
on obligation to serve- Due to the monopolistic nature of the utilities (largely a
resultant of market structure and ownership), accountability of the utilities to the

AF-MERCADOS EMI
POWER SECTOR OPERATIONS AND IMPACT ON STATE FINANCES 127
consumers has been low. The service levels by the utilities have been poor. There exists
large no. of households which are still to be electrified. Non-obligation on the part of
utilities to serve load have led to creation of stranded capacity and have put the entire
generation sector at the risk of bankruptcy. This has also impacted the effective
functioning of the market wherein the players are increasingly unwilling to take market
risk and intends to move towards long term contracts. In case of Brazil, to promote
investments into the sector, distribution companies were required to contract for 100%
of their forecast demand over a five year time period through auctions as a necessary
requirement (with built in incentive penalty mechanism for under and over contracting).
If after a 12-month period the distribution company is short of electricity, it will have to
buy energy through short-term contracts at spot market prices. However, these prices
may not be passed through to final consumers above the limit of 103% of the tariff. As
a result, when a distribution company is over contracted, difference settlement will
produce revenue gains or losses. Allocation of these gain and losses must obey the
following rules: (a) over contracting up to 3% of the market, gain will be appropriated
by the utility and losses will be passed through to consumers next year; (b) over
contracting above 3% of the market: gains and losses are absorbed by the distribution
company.29
Interference in Market functioning - Government interference in the market has
also impacted effective functioning and reliability of the market players and
performance. At various points of time interventions by the state government has
impacted the market. This includes cases wherein Section 1130 of the Electricity Act has
been invoked by the State Governments. States like Tamil Nadu and Karnataka have
invoked Section 11 thereby restricting export of power outside the State. As SLDC is
operated by the State Utility, the Open Access consumers located outside the State gets
affected. Further, states such as Gujarat has recently banned state industry from
sourcing electricity from other states, which has compelled the industry to buy costlier
power from government-run utilities instead of purchasing power from other states
through trade on electricity exchanges. Efficient market functioning not only improves
performance but also provides signals that lead to long-term generation planning and
load forecasting.
Command and Control mechanism of regulation needs to be fully replaced with
incentive regulation -Traditionally, most common type of control mechanism used has
been the “Command and Control Method”. There has been documented evidence in
international literature that regulation through this method can produce unintended
effects or even reverse effects through functional disruption of the system being
regulated. There have also been evidences of Indian utilities where in targets set under
such a regulatory regime have not been met by the utilities (primarily public) at large.
29 https://www.essex.ac.uk/ebs/research/BAAALDEE/paper%204.doc. Privatisation and Electricity Sector Reforms in Brazil: Accounting Perspective, Cláudio de Araújo Wanderley, University of Sheffield, UK And John Cullen, University of Sheffield, UK, And, Mathew Tsamenyi, University of Birmingham, UK
30 Electricity Act 2003, Section 11-“ The Appropriate Government may specify that a generating
company shall, in extraordinary circumstances operate and maintain any generating station in
accordance with the directions of that Government”. For the purposes of this section, the expression “ extraordinary circumstances” means circumstances arising out of threat to security of the State, public order or a natural calamity or such other circumstances arising in the public interest.

AF-MERCADOS EMI
POWER SECTOR OPERATIONS AND IMPACT ON STATE FINANCES 128
In order to ensure that the desired norms are met there is need to combine this with a
robust and clear incentive and disincentive framework both at the utility level and also
at the employee level in the utility. Benefits of introducing MYT regulations have slowly
started to come in terms of improved data regimes and better performance, however
these need to be translated to operational level in the utilities for improving the
performance. Examples of successful implementation of incentive regulation include UK,
US etc.
Independent Regulation is still work in progress - Electricity Act provided for
creation of independent regulatory institutions with pricing functions being provided to
the regulatory institutions to ensure competition, efficiency and financial discipline in
the sector. Creation of regulatory institutions has led to increased participation of the
consumers in the regulatory decision making process thereby increasing overall
transparency in the sector. However, tariff revisions have been inadequate and
infrequent. Only after the intervention of APTEL through its judgement in OP1 of 2011
order, various states have revised tariffs and have complied with the directions of the
order. Hence, true independence of the state regulators is still to be achieved as
envisaged in the Act. This is unlike the practices in many other countries including USA,
UK, and Australia where regulators have much better enforcement powers and are
much more autonomous. Weak enforcement has also affected Discom performance.
Poor Performance Measurement and Customer services: The distribution utilities
are characterised with AT&C high losses primarily due to theft, pilferage and technical
losses in the network. Due to lack of metering at the consumer level, DT and feeder
level, accurate estimation of losses becomes difficult. Also, it is observed that no
scientific study is generally being carried out to realistically assess the level of losses
and the break-up of this in terms of technical and non-technical components. Further,
Standards of Performance (SOP) which provides power to consumers and penalise utility
for poor performance become weak due to the lack of proper measurement of the
defined parameters. Reliability of power, customer services and accountability to
consumers has been poor across utilities. It is important to deploy adequate
measurement tools and systems for proper energy accounting and management and
also to provide adequate customer services. In this regard adoption of IT and Smart
Grid initiatives assumes significant importance. Some of the practices in this regard are
highlighted below
o Data Measurement and Management: The growth of IT enabled enterprise
systems within utilities has led to an increase in data collection, transportation,
storage and analysis. It is important that the data generated and collected by
these systems is managed efficiently; provide adequate access to real time (or
near real time) data and security of data is ensured. Data processing cycle
includes generation of data through sensors, meters etc. before being
transported for storage and processing by various applications which is then
transformed into actionable operations for analytics and visualization. Finally it is
integrated with enterprise data for driving strategic decisions. Data analytics
hence assumes immense importance. Eg: The reliability problems in the Indian
Power Systems were exposed by the grid failure in 2012 and introduction of
WAMS will help to provide insight into grid stability allowing system operators to
take preventative action. It will support advanced automatic corrective measures
like adaptive islanding, blocking or deblocking of distance relay zones under
power swings etc.

AF-MERCADOS EMI
POWER SECTOR OPERATIONS AND IMPACT ON STATE FINANCES 129
o Adoption of new technologies for instance Feeder automation and auto
reclosers enables automation of utility operations. Feeder Automation improves
the information capability of the utility in terms of digital fault records, power
quality monitoring, sequence of events and events data etc. Similarly, Substation
with Auto reclosers have several advantages over conventional substation such
as 30% space saving, low maintenance costs, no separate battery bank, circuit
breakers which trips and close automatically on temporary faults etc. Feeder
automation system was successfully implemented in Puttur division’s urban and
rural feeder under MESCOM (Mangalore Electricity Supply Company Limited).
Feeder Automation led to reduction in T&D losses by 16.8% and 9.5% in urban
and rural feeder respectively. In terms of revenue improvement, 4.5% and 3%
improvement was observed in urban and rural feeders respectively. Several
similar initiatives are being taken up to bring about smart management
practises.
o Overall IT enablement: In order to improve overall performance and also to
automate various functions across the utility, Andhra Pradesh discoms have
adopted various IT initiatives mentioned below. Some of these have been
implemented as part of R-APDRP program as well.
CAT (Consumers Analysis Tool) – software to integrate Billing and
Collection Data from Private Accounting Agencies (PAA) and consumers –
Reveals exception, followed up by field officers. Generates reports in
meter irregularities, collection irregularities and First Information Reports
of theft cases
Consumer Billing Software – to ensure the PAA are on common platform
– generates un-inform data for superior quality maintenance
Transformer Information Management system (TISM) – manages
transformer information and tracks transformer life-cycle Assists Vendor
analysis on transformer performance
Customer Service Centres, Call Centres Computerised Collection Centre,
Spot Billing and E-Seva
Automatic Metering (AMR) on Distribution Transformers and feeders, GIS
and Consumer Indexing, Establishing of data centers etc.
o Advanced Metering Infrastructure (AMI) Deployment- Ministry of Power
(MoP) has initiated implementation of the 14 Smart Grid Pilot projects across
various distribution utilities in India. Smart grids have matured to a level that
can now provide strong decision support system to utilities for improving their
performance. In this regard, AMI installations have been a key functionality
selected under the pilot projects. Even if the results of these pilots have not
been out, the need and usefulness is well established.
o Outage Management System (OMS) has been implemented by Tata Power
Delhi Distribution Limited (TPDDL) for faster and more accurate location and
restoration of faults in LT network, thereby reducing downtime.
Power Purchase Optimisation for better cost management- Monopoly by its very
nature does not provide the most efficient outcomes for the society. Lack of competition
does not sufficiently drive the utilities to optimise costs and performance to the best
possible scenario. Lack of load forecasting and power purchase planning has led to over
reliance on the spot markets thereby increasing the costs of the utilities. There is a

AF-MERCADOS EMI
POWER SECTOR OPERATIONS AND IMPACT ON STATE FINANCES 130
need to handle power procurement, its sale, manage generation from own sources and
allocated capacities from other sources, manage banking arrangements etc. so as to
have the most beneficial matrix mix for utility of Long/short/medium term purchase of
power, merit order dispatch, UI, Co-ordination of generation, transmission and System
Operation facilities for smooth operation of Generation/Transmission and Distribution
network and maintaining balance between demand and supply. Focus on cost
minimisation to reduce the revenue gap has been limited across utilities. States such as
Punjab, J&K, Delhi and Rajasthan have now realised the importance of optimisation of
power purchase costs have initiated development of such model and skills to optimise
such costs.
o Limited focus on Demand Side Management for managing demand-
Besides the supply side options, implementation of effective demand side options
is another cost effective option to serve demand. However, demand side options
have been an underutilised strategy by the utilities. Notification of DSM
regulations and implementation of the same has been limited across the utilities.
Utilities of Maharashtra and Delhi have taken a lead in implementation of DSM
schemes. This includes implementation of DSM campaign by Tata Power, Mumbai
“My Mumbai, Green Mumbai” wherein exchange programme for ceiling fans
targeted towards residential sector and ACs targeted towards LT industrial
consumers through bulk discounts was launched. Tata Power Delhi Distribution
Limited (TPDDL) also launched scheme related to replacement of ACs and
refrigerators in their areas of operation.
o Load Management through implementation of Demand response is
another option for the utilities. Demand Response is consumer’s ability to reduce
electricity consumption at their location when wholesale prices are high or the
reliability of the electric grid is threatened. Tata Power, Mumbai was the first
utility in India to launch a DR scheme. It has enrolled a capacity of 10 MW load
under this program and has carried out several load curtailment events in 2012.
Tata Power incentivizes such customers by paying them an amount of about Rs.
2 per unit saved. Similarly, TPDDL is undertaking Automated Demand Response
program with Smart Meters in Delhi. The project’s components include ADR
infrastructure, smart meters, RF mesh-based communication, meter data
management system and integration with other operational technology and IT
systems like OMS, SAP, etc. A total of around 250 consumers are participating in
this project.
Limited implementation of Open Access: Open Access can bring about several
benefits such as optimum utilization of the network, improvement in the availability and
reliability of supply through sale of surplus captive capacity to third parties, provide
distribution licensees/HT Consumers the freedom to source power from alternative
sources in a competitive manner and the generating entity to choose its own buyer etc.
However, the State Regulatory Commissions are not following the relevant provisions of
the Act, Guidelines issued by GoI in a manner consistent with the intent of the Act and
the national policies. There are many impediments in the path of successful
implementation of Open Access as the Discom continues to be a single point supplier
handling both the carriage (wires) and content (energy). For introducing true
competition in the market open access is a pre-requisite. Successful examples of this
include countries such as UK, US, Australia, New Zealand, Peru etc.

AF-MERCADOS EMI
POWER SECTOR OPERATIONS AND IMPACT ON STATE FINANCES 131
Innovations at the Central level have had limited percolation at the state level
- Electricity is in the Concurrent List in the Constitution and the primary responsibility
for the same lies with the state government. Several developments have been done at
the central level that needs to percolate at the state level. This includes Point of
Connection (PoC) transmission pricing mechanism at inter- state level and other
innovations led by CERC that have resulted in better grid management.
Development of Ancillary Service Market- Managing variability by SLDC has been
a challenge. The generation stations are obligated to operate as per their finalized
schedules and while the grid codes allow SLDC to exercise supervisory control, frequent
and rapid schedule changes by the SLDC are abhorred by the generators, particularly
when such changes result in significant heat rate and maintenance penalties. In many
cases the generation is not flexible enough to respond to such changes and the only
option available with the SLDC is to cut off load. Shedding of ‘load’ should be a last
resort and not the only means of restoring system stability. This results in extremely
poor service levels and practices that are inimical to consumer interests, unmatched on
this scale anywhere in the world. It is therefore important to develop ancillary service
market in the country. European countries, such as Spain, Germany, and Great Britain
(amongst others) and several states/Regions in the USA have created market for
Ancillary services.
Rural electrification has been a challenge faced by many distribution utilities in
the country as expansion of network in remote areas is not economically viable for the
utilities. However, promotion/deployment of decentralised grids and micro grids by the
utilities to serve consumers in their area of supply and meet their universal service
obligation has been limited. One of the examples in deployment of micro grids in India
includes that of Gram Power which has established India’s first Smart Microgrid in
Rajasthan. This provides one of the cost effective model for rural electrification. A
village cooperative model is being followed wherein the connection holders are the
members of this cooperative and government subsidy and bank loan being arranged by
Gram Power for this cooperative to fund the microgrid. Similarly, PPP models on
servicing rural loads through decentralised micro-grids need to be encouraged. Several
useful examples include DESI Power, India, Husk Power Systems, India, Green
Empowerment/Tonibung/PACOS (GE/T/P), Malaysia, Electricité d’Haiti (EDH), Haiti etc.

AF-MERCADOS EMI
POWER SECTOR OPERATIONS AND IMPACT ON STATE FINANCES 132
X RECOMMENDATIONS FOR THE FOURTEENTH FINANCE
COMMISSION
Based on the assessment undertaken, the following key points emerge for improving the
power sector operations and state finances from the power sector are listed below.
Level of efficiencies and the pace at which such efficiencies can be achieved under
state ownership has reached a plateau in the recent past. States with weak
performance and high financial losses i.e. Rajasthan, Andhra Pradesh, Tamil Nadu,
Uttar Pradesh, Bihar, Jharkhand, Haryana, Madhya Pradesh should be the first
candidate states to introduce privatization or private participation in distribution
business31. Even the FRP conditions have emphasized on the private participation in
distribution. In addition, introduction of private participation needs to be backed
with strong implementation wherewithal to ensure execution in a time bound
manner.
Unbundling of utilities should not be deferred any further. This is a statutory
requirement and violation should not be condoned. Also any difference between
subsidy committed by the state government and subsidy received by the distribution
utilities should not be allowed as this is in violation of Electricity Act 2003. In
addition to the above, unbundling of the distribution segment further into wires and
retail business is even more important. Global experience has suggested that
efficiencies at the retail level can best be achieved through separation of carriage
and content. Changes in this regard though initiated have taken a long to be
implemented.
Power purchase costs constitutes majority of cost of the distribution utilities. Power
purchase optimization through better load forecasting is necessary to optimize costs
and minimize the revenue gap. Hence, identification of shortage or surplus at an
intra-day/day ahead level becomes difficult. There is need to handle power
procurement, its sale, manage generation from own sources and allocated capacities
from other sources, manage banking arrangements etc. so as to have the optimal
mix for utility of Long/short/medium term purchase of power. This is one measure
that can have significant impact on the distribution finances.
The financial restructuring package of GoI is a welcome step, but poses attendant
risks with it. It will be important to give the proposals proper implementation
support on operational efficiency improvement, which is at the core of the
performance issues. We have suggested the formation of a specialist TASK FORCE
at the national level that will have the mandate and operational wherewithal to
support the states in efficiency improvement.
To ensure regulatory independence it is important to provide financial autonomy to
regulators. State governments should establish the State Electricity Regulatory
Commission fund as provided earlier. Improvement in staffing through a well-
structured program that also ensures accountability of the recruited staff is much
needed. Further, the schedule of fees and charges should be clearly notified by all
SERCs and the revenue so accrued should remain with SERCs to be utilized for its
31 While in some cases such as Madhya Pradesh, Bihar etc private participation was introduced through distribution franchisee, the
actual progress on ground has been slow.

AF-MERCADOS EMI
POWER SECTOR OPERATIONS AND IMPACT ON STATE FINANCES 133
own functioning. Delinking the SERCs fund with Government budgetary allocations is
critical for independent functioning.
Culture of public disclosures of information has been improving over the years with
several SERC’s regularly reporting their annual reports including description of
initiatives and key decisions. However, this needs to be taken to the next level
which involves performance monitoring of SERC’s also, on specific indicators.
Appellate Tribunal for Electricity through the OP1 judgment has partly initiated this
exercise on some parameters; however this can further be enhanced to include a
range of performance metrics on which performance of SERCs can be evaluated.
Frequency and Adequacy of Tariff revisions historically have been one of the key
aspects affecting the utility finances. However, ever since the OP1 Judgment in
2011, this has been improving. SERC’s should ensure timely revision in tariffs to
reflect cost of the utilities.
Implementation of MYT framework, introduction of IT systems like RIMS and 100%
metering are key priorities that have proved to improve data regimes across various
SERC’s. These hence need to be implemented by all SERCs through strong directives
and regular compliance of these directives.
Adoption of IT (information technology) is very important not only to improve
quality and reliability of supply but also to improve the overall efficiency in delivery
of electricity to the consumers. It is important to initiate metering at different level
of power system i.e. individual customers, DT and feeder level for proper
performance measurement of the utilities on various parameters such as AT&C
losses, standards of performance etc.
Promotion of Open Access is important for the power sector development, creation
of capacity, operation of the power markets etc. Independence of system operators
is important in this regard. Independence of system operators has a key influence
on the operationalization of Open Access. State Load Dispatch Centres (SLDC’s)
which operate the entire system within a State, have been found acting as a barrier
to Open Access, sitting on applications, denying generators the right to sell power to
a third party. This is because most of the States do not have an independent system
operator. These SLDC’s operate as a department under State Transmission
Company (STU) resulting in conflict of interest between the State Discom and the
SLDC. Thus it is very crucial to have an independent system operator who is
unbiased and is responsible for scheduling, dispatch, monitoring and accounting of
various transactions. The regulations governing open access also needs to be
standardized across the states to promote open access in the country.
Benefits of introducing MYT regulations have slowly started to come in terms of
improved data regimes and better performance, however these need to be
translated to operational level in the utilities for improving the performance by
creating right kind of incentives and disincentives.

AF-MERCADOS EMI
POWER SECTOR OPERATIONS AND IMPACT ON STATE FINANCES 134
XI ANNEXURE – I
TERMS OF REFERENCE (TOR) FOR THE STUDY ON “POWER SECTOR
OPERATIONS AND IMPACT ON STATE FINANCES”
S no. Scope of Work Coverage in the report
Assessment of Impact of Policy Reforms
1 1. Assessment of the status of implementation of the
provision of National Electricity Policy with regard to the
tariff vis- a-vis tariff revision implemented by each of the
State Governments keeping in view the gap between
average cost of supply and average cost of purchase.
Section III
2 1. The National Electricity Policy (Section 5.5.4) provides that
the State Governments may provide advance subsidy to
the extent they consider appropriate in terms of section 65
of the (National Electricity) Act in which case necessary
budget provision would be required to be made in advance
so that the utility does not suffer financial problems that
may affect its operations. In practice however, there have
been vast deviations from this policy across the States.
Review and examine the total levels of subsidy announced
and paid by various Governments to their utilities and the
main causes for the burgeoning uncovered subsidies.
Section III
Assessment Utility Operations and Impact on State Finances
3 1. Undertake assessment of reasons for failure of the power
sector reforms of 2003. Assessments of liabilities were
brought over to state's accounts then and the extent to
which these have been settled?
Section III, IV
4 1. Assess the general efficiency and functioning of DISCOMs
through a cross-States comparison and the likely prospects
of DISCOMs in the next 5 years. Review of some good
power distribution practices within the country.
Section III, IX
5 1. Undertake inter-State comparison of free power/cross-
sector power subsidization and performance on AT&C
losses. The study may also assess the impact of the Central
and State taxes and levies on the Power sector, and the
feasibility of bringing about parity and uniformity across the
States.
Section III, IV
6 1. The State Governments have extended large amounts of
guarantees to the state utilities having a strong bearing on
the fiscal profile of the States. Review and assess impact of
excessive issue of bonds/guarantees to the DISCOMs and
the likelihood of the devolving of the guarantees
thereupon; assessment of the overall fiscal situation
(i.e., fiscal deficit and debt) of individual states if we
include the power sector finances into the state
government accounts.
Section IV
7 1. Examine the design of the new power re-structuring Section V
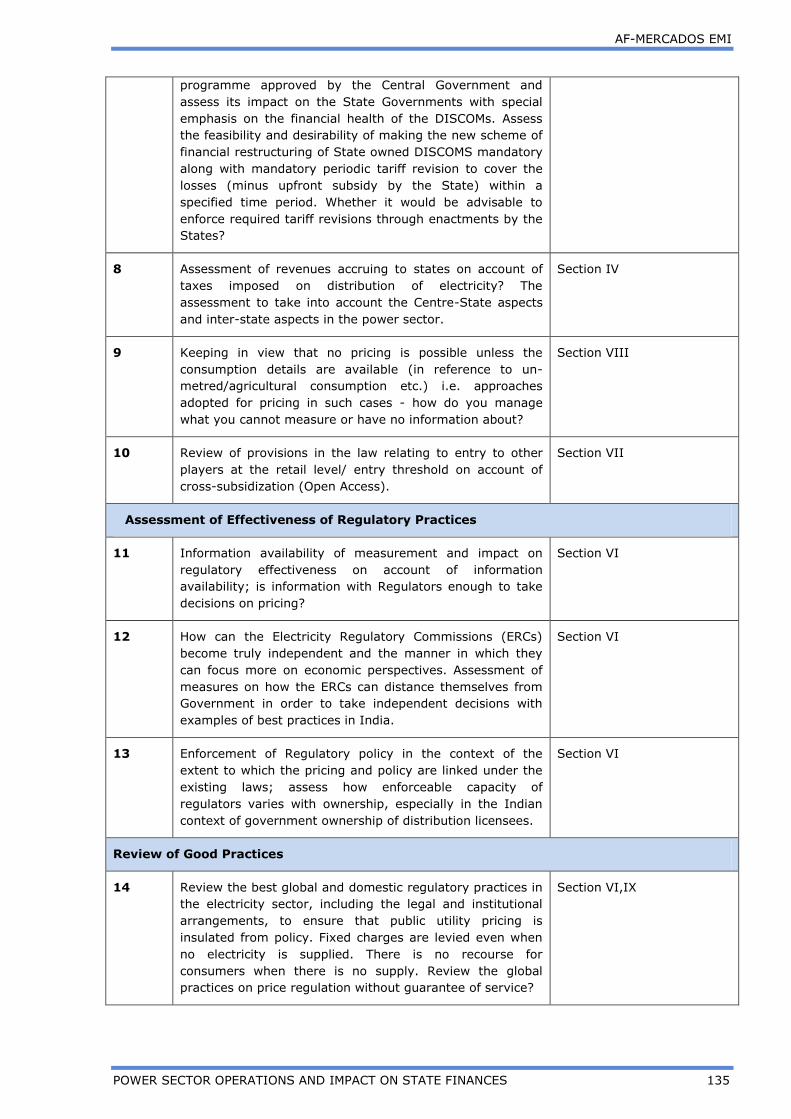
AF-MERCADOS EMI
POWER SECTOR OPERATIONS AND IMPACT ON STATE FINANCES 135
programme approved by the Central Government and
assess its impact on the State Governments with special
emphasis on the financial health of the DISCOMs. Assess
the feasibility and desirability of making the new scheme of
financial restructuring of State owned DISCOMS mandatory
along with mandatory periodic tariff revision to cover the
losses (minus upfront subsidy by the State) within a
specified time period. Whether it would be advisable to
enforce required tariff revisions through enactments by the
States?
8 1. Assessment of revenues accruing to states on account of
taxes imposed on distribution of electricity? The
assessment to take into account the Centre-State aspects
and inter-state aspects in the power sector.
Section IV
9 1. Keeping in view that no pricing is possible unless the
consumption details are available (in reference to un-
metred/agricultural consumption etc.) i.e. approaches
adopted for pricing in such cases - how do you manage
what you cannot measure or have no information about?
Section VIII
10 1. Review of provisions in the law relating to entry to other
players at the retail level/ entry threshold on account of
cross-subsidization (Open Access).
Section VII
Assessment of Effectiveness of Regulatory Practices
11 1. Information availability of measurement and impact on
regulatory effectiveness on account of information
availability; is information with Regulators enough to take
decisions on pricing?
Section VI
12 1. How can the Electricity Regulatory Commissions (ERCs)
become truly independent and the manner in which they
can focus more on economic perspectives. Assessment of
measures on how the ERCs can distance themselves from
Government in order to take independent decisions with
examples of best practices in India.
Section VI
13 1. Enforcement of Regulatory policy in the context of the
extent to which the pricing and policy are linked under the
existing laws; assess how enforceable capacity of
regulators varies with ownership, especially in the Indian
context of government ownership of distribution licensees.
Section VI
Review of Good Practices
14 1. Review the best global and domestic regulatory practices in
the electricity sector, including the legal and institutional
arrangements, to ensure that public utility pricing is
insulated from policy. Fixed charges are levied even when
no electricity is supplied. There is no recourse for
consumers when there is no supply. Review the global
practices on price regulation without guarantee of service?
Section VI,IX

POWER SECTOR OPERATIONS AND IMPACT ON STATE
FINANCES
VOLUME II: STATE REPORTS
PREPARED FOR:
THE FOURTEENTH FINANCE COMMISSION
PREPARED BY:
AF-MERCADOS ENERGY MARKETS INDIA PVT. LTD. (AF-
MERCADOS EMI)
August 2014

AF-MERCADOS EMI
Power Sector Operations and Impact on State Finances – Volume II 2
TABLE OF CONTENTS
I ANDHRA PRADESH ........................................................................................ 7
II ARUNACHAL PRADESH ................................................................................ 27
III ASSAM ........................................................................................................ 38
IV BIHAR ......................................................................................................... 51
V CHHATTISGARH .......................................................................................... 69
VI DELHI ......................................................................................................... 81
VII GOA ............................................................................................................ 93
VIII GUJARAT ................................................................................................... 102
IX HARYANA .................................................................................................. 119
X HIMACHAL PRADESH ................................................................................ 138
XI JAMMU & KASHMIR ................................................................................... 153
XII JHARKHAND .............................................................................................. 169
XIII KARNATAKA .............................................................................................. 186
XIV KERALA ..................................................................................................... 203
XV MADHYA PRADESH .................................................................................... 216
XVI MAHARASHTRA ......................................................................................... 232
XVII MANIPUR .................................................................................................. 249
XVIII MEGHALAYA .............................................................................................. 261
XIX MIZORAM .................................................................................................. 274
XX NAGALAND ................................................................................................ 286
XXI ORISSA ..................................................................................................... 297
XXII PUNJAB ..................................................................................................... 313
XXIII RAJASTHAN .............................................................................................. 331
XXIV SIKKIM ..................................................................................................... 353
XXV TAMIL NADU ............................................................................................. 365
XXVI TRIPURA ................................................................................................... 385
XXVII UTTAR PRADESH ....................................................................................... 399
XXVIII UTTARAKHAND ......................................................................................... 419
XXIX WEST BENGAL ........................................................................................... 434

AF-MERCADOS EMI
Power Sector Operations and Impact on State Finances – Volume II 3
ABBREVIATIONS
ACS Average Cost Of Supply
AES American Electricity Supply Corporation
AP Agriculture Pump
APCPDCL Central Power Distribution Company Ltd
APEPDCL Eastern Power Distribution Company Ltd
APERC Andhra Pradesh Electricity Regulatory Commission
APGENCO Andhra Pradesh Power Generation Corporation
APNPDCL Northern Power Distribution Company Ltd
APSEB Andhra Pradesh State Electricity Board
APSPDCL, Southern Power Distribution Company Ltd
APTEL Appellate Tribunal For Electricity
APTRANSCO Transmission Corporation of AP Ltd
ARR Average Revenue Realized
AT&C Aggregated Technical & Commercial
AVVNL Ajmer Vidyut Vitran Nigam Ltd
BBMB Bhakra Beas Management Board
BESCOM Bangalore Electricity Supply Company
BEST Brihan-Mumbai Electricity Supply and Transport Undertaking
BPL Below Poverty Line
BRPL BSES Rajdhani Power Ltd
BSES Bombay Suburban Electric Supply
BYPL BSES Yamuna Power Ltd
CAG Comptroller and Auditor General
CAGR Compound Annual Growth Rate
CERC Central Electricity Regulatory Commission
CESC Calcutta Electric Supply Corporation
CESU Central Electricity Supply Utility
CGS Central Generating Stations
CHD Customer Help Desks
CoS Cost of Supply
DESU Delhi Electricity Supply Undertaking
DGVCL Dakshin Gujarat Vij Company Ltd
DHBVNL Dakshin Haryana Bijli Vitran Nigam Ltd
Discom Distribution Company

AF-MERCADOS EMI
Power Sector Operations and Impact on State Finances – Volume II 4
DSM Demand Side Management
DTRs Distribution Transformer
DVB Delhi Vidyut Board
EHT Extra High Tension
EHV Extra High Voltage
ERC Energy Regulatory Commission
FRP Financial Restructuring Plan
GEB Gujarat Electricity Board
Genco Generation Company
GERC Gujarat Electricity Regulatory Commission
GESCOM Gulbarga Electricity Supply Company
GoAP Government of Andhra Pradesh
GoH Government of Haryana
GoR Government of Rajasthan
GSDP Gross State Domestic Product
GSECL Gujarat State Electricity Corporation Ltd
GUVNL Gujarat Urja Vikas Nigam Ltd
HERC Haryana Electricity Regulatory Commission
HESCOM Hubli Electricity Supply Company
HT High Tension
HPGCL Haryana Power Generation Corporation Limited
HSEB Haryana State Electricity Board
HVDS High Voltage Distribution System
HVPNL Haryana Vidyut Prasaran Nigam Limited
IPP Independent Power Producer
JdVVNL Jodhpur Vidyut Vitran Nigam Ltd
JSEB Jharkhand State Electricity Board
JSERC Jharkhand State Electricity regulatory Commission
JVVNL Jaipur Vidyut Vitran Nigam Ltd
KEB Karnataka Electricity Board
KERC Karnataka Electricity Regulatory Commission
KESCO Kanpur Electric Supply Company
KJ Kutir Jyoti
KPTCL Karnataka Power Transmission Corporation Limited
LIP Large Industrial Power
LT Low Tension

AF-MERCADOS EMI
Power Sector Operations and Impact on State Finances – Volume II 5
MCL Mahanadi Coalfields Limited
MES Military Engineering Services
MESCOM Mangalore Electricity Supply Company
MGVCL Madhya Gujarat Vij Company Limited
MP Madhya Pradesh
MPECS Mula- Pravara Electric Co-operative Society
MPERC Madhya Pradesh Electricity Regulatory Commission
MPMKVVCL Madhya Pradesh Madhya Kshetra Vidyut Vitran Company Limited
MPPGCL Madhya Pradesh Power Generating Company Limited
MPPKVVCL Madhya Pradesh Poorv Ksherta Vidyut Vitran Company Limited
MPPKVVCL Madhya Pradesh Paschim Vidyut Vitran Company Limited
MPPTCL Madhya Pradesh Power Transmission Company Limited
MSEB Maharashtra State Electricity Board
MSEDCL Maharashtra State Electricity Distribution Co. Ltd
MSEDCL Maharashtra State Electricity Distribution Company
MSETCL Maharashtra State Electricity Transmission Company
MSPGCL Maharashtra State Electricity Generation Company
MYT Multi Year Tariff
NDMC Delhi Municipal Corporation
NDPL North Delhi Power Ltd
NEP National Electricity Policy
NESCO North Eastern Electricity Supply Company of Orissa Ltd
NEW North Eastern Western
NTP National Tariff Policy
O & M Operations & Maintenance
OA Open Access
OERC Orissa Electricity Regulatory Commission
OHPC Odisha Hydro Power Corporation Ltd
OPTCL Odisha Power Transmission Corporation Limited
OSEB Orissa State Electricity Board
PFC Power Finance Corporation
PGVCL Paschim Gujarat Vij Company Limited
POWERCOM Punjab State Power Corporation Ltd
PSEB Punjab State Electricity Board
PSERC Punjab State Electricity Regulatory Commission
RE Renewable Energy

AF-MERCADOS EMI
Power Sector Operations and Impact on State Finances – Volume II 6
REL Reliance Energy Ltd
RERC Rajasthan Electricity Regulatory Commission
RGGVY Rajiv Gandhi Grameen Vidyutikaran Yojana
RGPPL Ratnagiri Gas and Power Private Limited
RoE Return on Equity
RRVPNL Rajasthan Rajya Vidyut Prasaran Nigam Ltd
RRVUNL Rajasthan Rajya Vidyut Utpadan Nigam Ltd
RSEB Rajasthan State Electricity Board
RSEB Rajasthan State Electricity Board
RVPN Rajasthan Rajya Vidyut Prasaran Nigam Ltd
RVUN Rajasthan Rajya Vidyut Utpadan Nigam Ltd
SEB State Electricity Board
SERC State Electricity Regulatory Commission
SLDC State Load Dispatch Centre
SOUTHCO Southern Electricity Supply Company of Orissa Ltd
STU State Transmission Utility
T&D Transmission and Distribution
TANGEDCO Tamil Nadu Generation and Distribution Corporation Ltd
TANTRANSCO Tamil Nadu Transmission Corporation
TNEB Tamil Nadu Electricity Board
TNERC Tamil Nadu Electricity Regulatory Commission
TPC Tata Power Company Ltd
Transco Transmission Company
UGVCL Uttar Gujarat Vij Company Ltd
UHBVNL Uttar Haryana Bijli Vitran Nigam Ltd
UPERC Uttar Pradesh Electricity Regulatory Commission
UPJVNL Uttar Pradesh Jal Vidyut Nigam Limited
UPPCL Uttar Pradesh Power Corporation Limited
UPRVUNL Uttar Pradesh Rajya Vidyut Utpadan Nigam Limited
VVNL Vishweshwaraiah Vidyut Nigam Limited
WBSEB West Bengal State Electricity Board
WBSEDCL West Bengal State Electricity Distribution Company
WBSETCL West Bengal State Electricity Transmission Company
WESCO Western Electricity Supply Company of Orissa Ltd
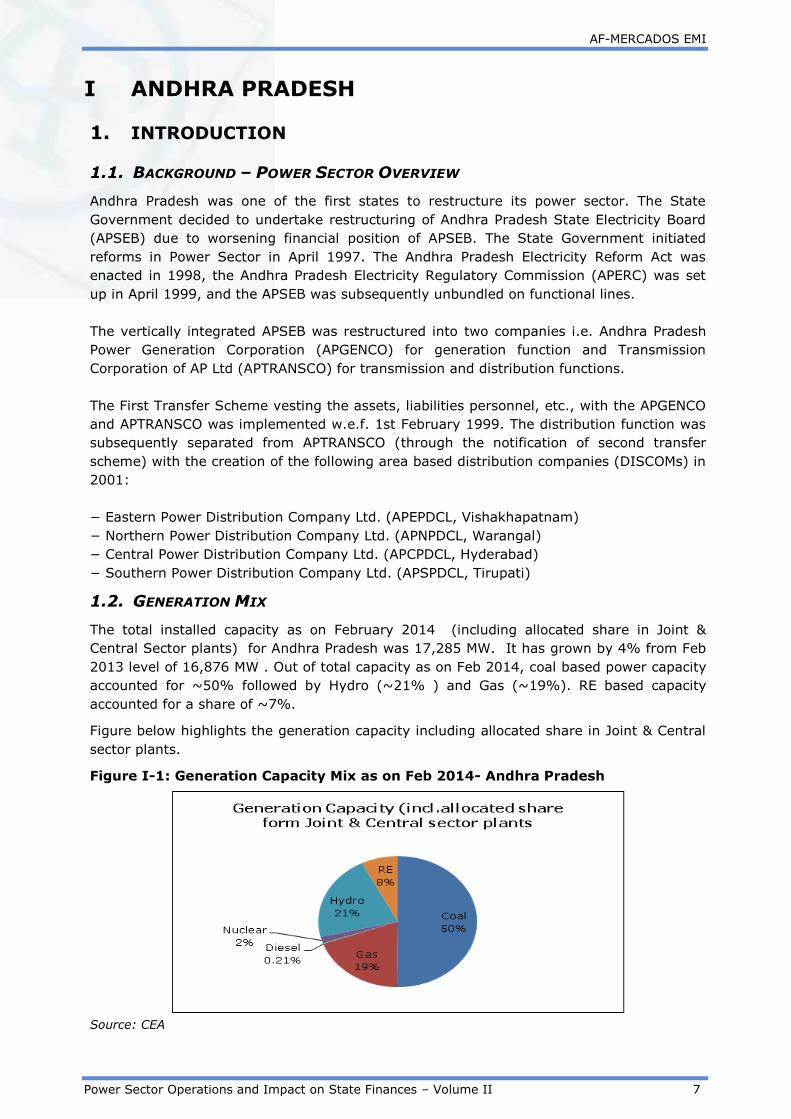
AF-MERCADOS EMI
Power Sector Operations and Impact on State Finances – Volume II 7
I ANDHRA PRADESH
1. INTRODUCTION
1.1. BACKGROUND – POWER SECTOR OVERVIEW
Andhra Pradesh was one of the first states to restructure its power sector. The State
Government decided to undertake restructuring of Andhra Pradesh State Electricity Board
(APSEB) due to worsening financial position of APSEB. The State Government initiated
reforms in Power Sector in April 1997. The Andhra Pradesh Electricity Reform Act was
enacted in 1998, the Andhra Pradesh Electricity Regulatory Commission (APERC) was set
up in April 1999, and the APSEB was subsequently unbundled on functional lines.
The vertically integrated APSEB was restructured into two companies i.e. Andhra Pradesh
Power Generation Corporation (APGENCO) for generation function and Transmission
Corporation of AP Ltd (APTRANSCO) for transmission and distribution functions.
The First Transfer Scheme vesting the assets, liabilities personnel, etc., with the APGENCO
and APTRANSCO was implemented w.e.f. 1st February 1999. The distribution function was
subsequently separated from APTRANSCO (through the notification of second transfer
scheme) with the creation of the following area based distribution companies (DISCOMs) in
2001:
− Eastern Power Distribution Company Ltd. (APEPDCL, Vishakhapatnam)
− Northern Power Distribution Company Ltd. (APNPDCL, Warangal)
− Central Power Distribution Company Ltd. (APCPDCL, Hyderabad)
− Southern Power Distribution Company Ltd. (APSPDCL, Tirupati)
1.2. GENERATION MIX
The total installed capacity as on February 2014 (including allocated share in Joint &
Central Sector plants) for Andhra Pradesh was 17,285 MW. It has grown by 4% from Feb
2013 level of 16,876 MW . Out of total capacity as on Feb 2014, coal based power capacity
accounted for ~50% followed by Hydro (~21% ) and Gas (~19%). RE based capacity
accounted for a share of ~7%.
Figure below highlights the generation capacity including allocated share in Joint & Central
sector plants.
Figure I-1: Generation Capacity Mix as on Feb 2014- Andhra Pradesh
Source: CEA

AF-MERCADOS EMI
Power Sector Operations and Impact on State Finances – Volume II 8
1.3. POWER SUPPLY POSITION
Andhra Pradesh has been witnessing consistent power supply shortage. The energy deficit
has increased from 1% in FY 2005-06 to 18% in FY 2012-13. The peak deficit has
increased from 5% in FY 2005-06 to 20% in FY 2012-13. The peak deficit increased
substantially in FY 2011-12 to 15% and 20% in FY 2012-13 as compared to 6% in FY
2010-11. The increasing energy and peak deficit in the state is due to slow rate of capacity
addition and limited transmission corridor available between NEW (North Eastern Western)
and South grid. Further, low Plant Load Factor (PLF) of hydro power plants caused by
poor/weak monsoons and declining availability of natural gas from KG D6 basin leading to
low PLF for the gas based power plants has contributed to energy and peak deficit in the
state.
However, with the integration of Southern Grid with the National Grid in January 2014,
energy and peak deficit is expected to decrease. Energy deficit and peak deficit in FY
2013-14 was 6.9% and 6.5% respectively, due to very good hydro inflows.
However, going forward the hydro power generation could further be impacted to due to
effect from EL Nino. India Meteorological Department (IMD) officials said the monsoon is
expected to be below normal because of the El-Nino effect, which is generally associated
with the warming of ocean water.
The trend of energy and peak deficit observed in Andhra Pradesh over the years is
highlighted in the figure below:
Figure I-2: Energy Deficit - Andhra Pradesh
Source: CEA
Figure I-3: Peak Deficit - Andhra Pradesh
Source: CEA

AF-MERCADOS EMI
Power Sector Operations and Impact on State Finances – Volume II 9
2. ASSESSMENT OF OPERATIONAL PERFORMANCE OF
DISTRIBUTION UTILITIES
2.1. CONSUMER SALES MIX OF ANDHRA PRADESH
APCPDCL which is the largest utility in Andhra Pradesh supply electricity in seven districts
viz. Hyderabad, Ranga Reddy, Anantpur, Kurnool, Mahaboobnagar, Nalgonda and Medak;
followed by APEPDCL which is a second largerst utility supplies electricity in five districts
in the southern state of Andhra Pradesh.
The other two utilites which are smaller in size are APNPDCL which caters to districts of
Warangal, Karimnagar, Khammam, Nizamabad and Adilabad and ASPDCL serves the
regions of Krishna, Guntur, Prakasam, Nellore, Chittoor and Kadapa districts.
The share of agricultural sales have reduced over the years while the share of industrial
sales have increased over the years. The share of agricultural sales have reduced from
38% in 2004-05 to 28% in 2011-12 and the industrial sales have increased from 29% in
2004-05 to 34% in 2011-12.
The historical trend of consumer sales mix for the state is given in figure below:-
Figure I-4: Historical Trend in Consumer Sales Mix - Andhra Pradesh
Source: PFC
The overall sales have registered a CAGR of 9% over the span of seven years wherein the
sales of commercial category have registered a higher CAGR of 17.8% followed by the
industrial category with a CAGR of 12%.
In terms of revenue contribution, industries contributed more than 45% of revenue,
followed by domestic and commercial categories with a share of 23% and 15%,
respectively, while agriculture contributed a meagre 1% of the revenue (Refer Figure I-5
below). This clearly indicates that domestic and agriculture categories are heavily cross
subsidized by the industrial and commercial categories.
The figure below compares the sales mix of FY 2011-12 and the revenue realized from the
different category of consumers.

AF-MERCADOS EMI
Power Sector Operations and Impact on State Finances – Volume II 10
Figure I-5: Comparative Analysis of Consumer Sales and Revenue Mix 2011-12 -
Andhra Pradesh
Source: PFC
2.2. TRENDS IN COMMERCIAL & TECHNICAL LOSSES
The Aggregated Technical & Commercial losses (AT&C) for Andhra Pradesh distribution
utilities have historically remained on a lower side compared to the national average.
The loss level reported by the distribution utilities of Andhra Pradesh is in the range of 15%
- 18% since FY 2006. This, however, is based on the estimated consumption in the
agricultural sector (in absence of agriculture metering in the state). The trend observed
over the years in collection efficiency has been on a higher side.
Table I-1: Year on Year Trend in AT&C losses and Collection Efficiency - Andhra
Pradesh
Year FY
05 FY 06 FY 07 FY 08 FY 09 FY 10 FY 11 FY 12
AT&C Losses
(%) 21% 16.7% 17.9% 16.2% 13% 16.4% 17.5% 15.3%
Collection
Efficiency 96% 100% 97% 98% 98% 98% 95% 97%
Source: PFC
The agricultural sales have reduced over time and hence reduction in losses is in line with
the reducing agricultural sales. The figure below highlights the historical trend of
agriculture sales in Andhra Pradesh.
The graph below highlights the historical trend of agriculture sales
Figure I-6: Historical Trend in Agricultural Sales – Andhra Pradesh
Source: PFC

AF-MERCADOS EMI
Power Sector Operations and Impact on State Finances – Volume II 11
Further, losses have also reduced due to the investment undertaken in the development of
HT lines over the years. HT/LT ratio has improved over the years, HT/LT ratio improved
from 0.55 in 2005-06 to 0.61 in 2009-10. The HT LT ratio has improved in the state with
support from various funding agencies. The same has been provided in the Box Below.
Box I: Improving HVDS system to reduce losses
.
2.3. TRENDS IN DISTRIBUTION COST
The power purchase cost accounts for ~80% of the total distribution cost (Refer table
below).
The per unit cost break-up for different cost components for the state of Andhra Pradesh is
provided in the table below:-
Table I-2: Year on Year Trend Distribution Cost Breakup - Andhra Pradesh
Cost Component
(Rs. per kWh) FY 05 FY 06 FY 07 FY 08 FY 09 FY 10 FY 11 FY 12
Power Purchase
Cost 1.95 1.86 1.96 2.08 2.66 2.69 2.98 3.72
O&M (R&M +
A&G + EC) 0.54 0.18 0.21 0.23 0.22 0.22 0.36 0.37
Interest 0.14 0.11 0.10 0.08 0.11 0.16 0.19 0.28
Depreciation 0.11 0.10 0.11 0.10 0.11 0.12 0.14 0.15
Other cost -0.02 0.02 -0.03 0.13 0.08 0.03 0.02 0.00
Source: PFC
It can be observed that power purchase cost per unit has increased over the years
especially in FY12. Power purchase cost increased significantly in FY12 due to decreased
power availability from hydro and gas based plants and increased purchase of costly power
from the short term market by the utility.
The short term prices prevailing in the IEX power exchange for area S1 in FY 2012 is given
below:
APSPDCL High Voltage Distribution System (HVDS) with the objectives to improve
voltages at consumer end, reducing line losses, avoid theft of energy, and minimize the
power supply interruptions for agricultural consumers are being constructed. HVDS
works were completed in first phase in 2005-06 under 88 Nos. of 33/11 KV Sub-Stations
under Rural Electrification Corporation (REC) funding. In phase-II HVDS works were
carried out in 2007-08, 2008-09 & 2009-10 under 71 Nos. 33/11KV Sub-Stations in
Chittoor District and 70 Nos. 33/11KV Sub-Stations in Kadapa District under Kfw funding.
For balance Sub-Stations in Chittoor and Kadapa Districts & other Districts Krishna,
Guntur, Prakasam, Nellore the HVDS works is under progress under REC funding. For the
balance HVDS works in Krishna, Guntur, Prakasam, Chittoor & Kadapa Districts the
scheme proposals were sanctioned under JICA funding

AF-MERCADOS EMI
Power Sector Operations and Impact on State Finances – Volume II 12
Figure I-7: Exchange Prices for S1 Area for FY 2011-12 - Andhra Pradesh
0
2
4
6
8
10
12
14
16
18
01-0
4-20
11
17-0
4-20
11
03-0
5-20
11
19-0
5-20
11
04-0
6-20
11
20-0
6-20
11
06-0
7-20
11
22-0
7-20
11
07-0
8-20
11
23-0
8-20
11
08-0
9-20
11
24-0
9-20
11
10-1
0-20
11
26-1
0-20
11
11-1
1-20
11
27-1
1-20
11
13-1
2-20
11
29-1
2-20
11
14-0
1-20
12
30-0
1-20
12
15-0
2-20
12
02-0
3-20
12
18-0
3-20
12
Rs./
kWh
Average Daily Short Term Prices - S1 (2011-12)
Maximum Price - Rs.16.63 per kWh
Average Price - Rs. 5.13 per kWh
Minimum Price - Rs. 2.05 per kWh
Source: Indian Energy Exchange
This drastic reduction in availability of hydel power, as a result of inadequate rainfall and
resultant shortage of water in the reservoirs in the State, the average fixed cost per unit of
hydel power is increasing. As a result, the tariff to be paid to AP Genco for hydel power is
increasing from Rs 1.79 per unit in 2011-12 to Rs 3.34 in 2012-13 and to Rs 3.46 per unit
in 2013-14. However, this is further going to worse, due to expected lower than average
monsoons due to EL-Nino. Hence, the fixed cost would further increase coupled with
dependence on the short term power would be a major concern for the state.
2.4. REVENUE REALIZATION
Tariff realization from different consumer category has not increased commensurate to
increasing power purchase cost. No tariff hikes were observed for several years and tariffs
were increased in FY 11 and FY 12 wherein tariffs were hiked by 13% and 24%
respectively.
The table below shows the revenue realization (without subsidy) from different consumer
categories over the years.
Table I-3: Historical Trend Consumer Category Wise Revenue Realization - Andhra
Pradesh
Category FY 05 FY 06 FY 07 FY 08 FY 09 FY 10 FY 11 FY 12
Domestic 2.29 2.26 2.36 2.42 2.47 2.83 3.09 3.34
Agriculture 0.35 0.15 0.07 0.08 0.08 0.21 0.11 0.11
Commercial 5.78 5.57 5.56 7.86 7.77 5.99 5.97 5.98
Industrial HT 3.82 3.70 3.60 3.33 3.26 3.64 4.28 4.52
Industrial LT 3.96 3.83 4.08 4.15 4.07 4.64 6.18 6.26
Others 3.15 4.94 4.31 5.01 4.92 3.86 4.73 7.30
Source: PFC
The state government is heavily subsidizing agricultural sector and the share of the state
government subsidies accounts for ~ 24% of the total revenues in FY 2011-12. Increase in
power purchase cost, no major tariff hikes over the years and low subsidy payout has
resulted in deterioration of the financial position of the distribution utilities of the state.
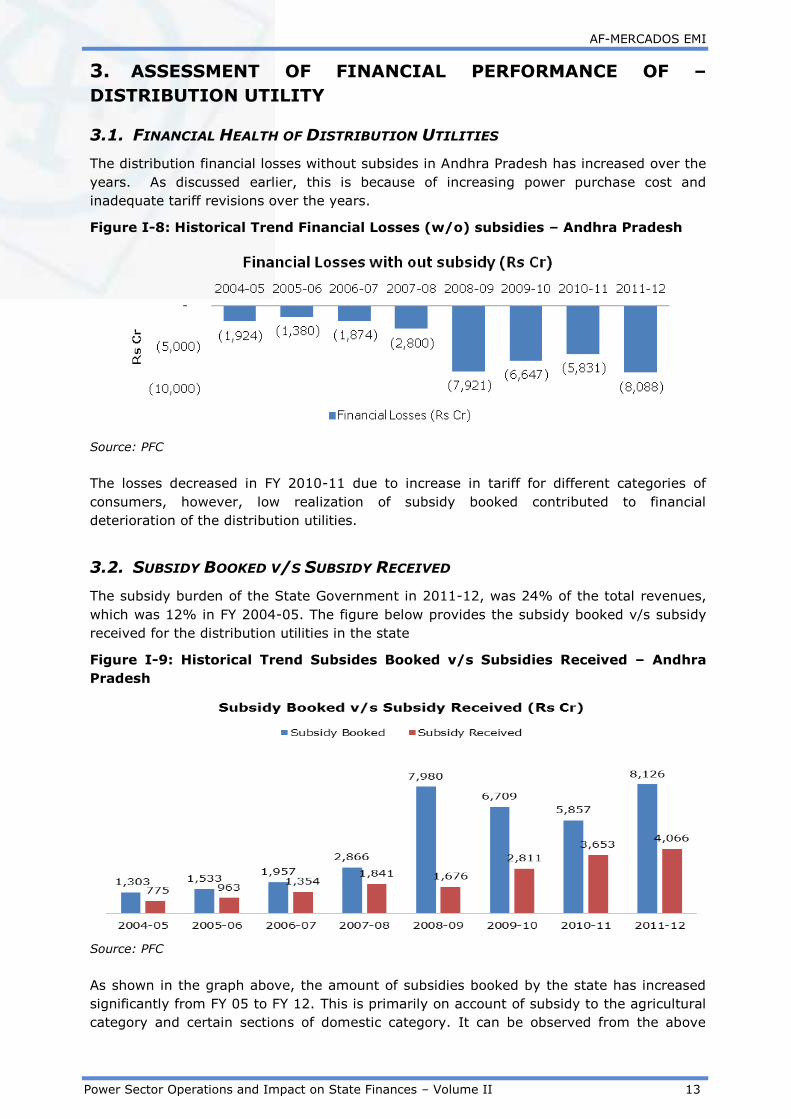
AF-MERCADOS EMI
Power Sector Operations and Impact on State Finances – Volume II 13
3. ASSESSMENT OF FINANCIAL PERFORMANCE OF –
DISTRIBUTION UTILITY
3.1. FINANCIAL HEALTH OF DISTRIBUTION UTILITIES
The distribution financial losses without subsides in Andhra Pradesh has increased over the
years. As discussed earlier, this is because of increasing power purchase cost and
inadequate tariff revisions over the years.
Figure I-8: Historical Trend Financial Losses (w/o) subsidies – Andhra Pradesh
Source: PFC
The losses decreased in FY 2010-11 due to increase in tariff for different categories of
consumers, however, low realization of subsidy booked contributed to financial
deterioration of the distribution utilities.
3.2. SUBSIDY BOOKED V/S SUBSIDY RECEIVED
The subsidy burden of the State Government in 2011-12, was 24% of the total revenues,
which was 12% in FY 2004-05. The figure below provides the subsidy booked v/s subsidy
received for the distribution utilities in the state
Figure I-9: Historical Trend Subsides Booked v/s Subsidies Received – Andhra
Pradesh
Source: PFC
As shown in the graph above, the amount of subsidies booked by the state has increased
significantly from FY 05 to FY 12. This is primarily on account of subsidy to the agricultural
category and certain sections of domestic category. It can be observed from the above

AF-MERCADOS EMI
Power Sector Operations and Impact on State Finances – Volume II 14
figure, that in all the years, amount of subsidy realised was less than the amount of
subsidy booked leading to financial losses to the state utilities.
The subsidy received being so much lower than the subsidy booked is a flagrant violation of
the law as per Section 65 of the EA states that "If the State Government requires the
grant of any subsidy to any consumer or class of consumers in the tariff determined by the
State Commission under section 62, the State Government shall, notwithstanding any
direction which may be given under section 108, pay, within in advance in the manner
as may be specified , by the State Commission the amount to compensate the person
affected by the grant of subsidy in the manner the State Commission may direct, as a
condition for the licence or any other person concerned to implement the subsidy provided
for by the State Government".
The subsides which were booked by the State Government are based on the estimated
sales by SERC for that particular year. For example, subsides year marked for FY 2010-11,
were 4500 Cr based on the SERC estimated sales. However, as actual sales are higher
then what was estimated and hence the utilities book the subsidies based on these extra
sales also. The subsides booked in FY 2010-11 as per PFC is Rs 5857 Cr, however the
realized subsides are still less than year marked subsides. The year wise details have been
provided below :-
Table I-4: Trends of Subsidy booked v/s Approves Sales - Andhra Pradesh
Particulars 2013-14 2012-13 2011-12 2010-11
Approved Sales in MU 19305 19305 17569 16262
Filled Sales by Discoms in MU 23743 22458 20840 19722
Actual Sales in MU - 22013 20191 17126
Subsidy Year Marked - as per approved sales in
Rs Cr 5480 5358 4145 4500
Subsidy Booked in Rs Cr - - 8126 5857
Subsidy Realized in Rs Cr - - 4066 3653
Source: Tariff orders and PFC
3.3. ACS V/S ARR
The gap (with subsidy) between average cost of supply and average revenue realized (with
subsidy) has remained marginal over the years. This is primarily due to the full cost
recovery tariff approach being followed by the Commission.
Figure I-10: Historical Trend ACS v/s ARR (with subsidy) – Andhra Pradesh
Source: PFC
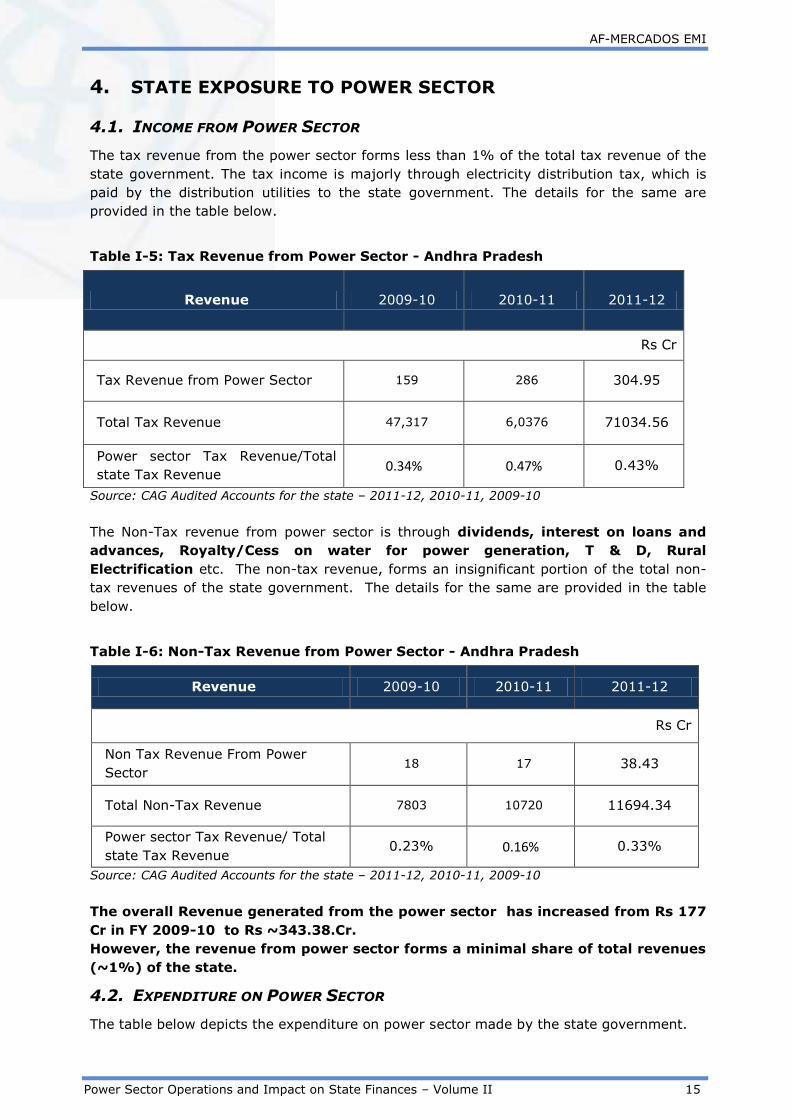
AF-MERCADOS EMI
Power Sector Operations and Impact on State Finances – Volume II 15
4. STATE EXPOSURE TO POWER SECTOR
4.1. INCOME FROM POWER SECTOR
The tax revenue from the power sector forms less than 1% of the total tax revenue of the
state government. The tax income is majorly through electricity distribution tax, which is
paid by the distribution utilities to the state government. The details for the same are
provided in the table below.
Table I-5: Tax Revenue from Power Sector - Andhra Pradesh
Revenue 2009-10 2010-11 2011-12
Rs Cr
Tax Revenue from Power Sector 159 286 304.95
Total Tax Revenue 47,317 6,0376 71034.56
Power sector Tax Revenue/Total
state Tax Revenue 0.34% 0.47% 0.43%
Source: CAG Audited Accounts for the state – 2011-12, 2010-11, 2009-10
The Non-Tax revenue from power sector is through dividends, interest on loans and
advances, Royalty/Cess on water for power generation, T & D, Rural
Electrification etc. The non-tax revenue, forms an insignificant portion of the total non-
tax revenues of the state government. The details for the same are provided in the table
below.
Table I-6: Non-Tax Revenue from Power Sector - Andhra Pradesh
Revenue 2009-10 2010-11 2011-12
Rs Cr
Non Tax Revenue From Power
Sector 18 17 38.43
Total Non-Tax Revenue 7803 10720 11694.34
Power sector Tax Revenue/ Total
state Tax Revenue 0.23% 0.16% 0.33%
Source: CAG Audited Accounts for the state – 2011-12, 2010-11, 2009-10
The overall Revenue generated from the power sector has increased from Rs 177
Cr in FY 2009-10 to Rs ~343.38.Cr.
However, the revenue from power sector forms a minimal share of total revenues
(~1%) of the state.
4.2. EXPENDITURE ON POWER SECTOR
The table below depicts the expenditure on power sector made by the state government.

AF-MERCADOS EMI
Power Sector Operations and Impact on State Finances – Volume II 16
Table I-7: Expenditure on Power Sector - Andhra Pradesh
Categories 2009-10 2010-11 2011-12
Rs Cr
Capital expenditure 10 22 33.02
Revenue Expenditure 3,258 3,756 4,415.8
Total Power Sector Expenditure 3,268 3,778 4,448.9
Source: CAG Audited Accounts for the state – 2011-12, 2010-11, 2009-10
The Capital and Revenue expenditure incurred on the Power sector has increased
over the period of three years since FY10 primarily on account of increased
expenditure on Hydel and Thermal Generation.
The expenditure on Power Sector has exceeded the Revenue generated from
Power Sector over the years.
4.3. POWER BONDS
The state had issued power bonds the detail of outstanding balance is provided
below:
As per RBI ‘State Finance Report’ 2014, the outstanding balance of Power Bond as on 31st
March 2014 was Rs 490 Cr.
4.4. ANALYSIS ON STATE GUARANTEES AND SUBSIDIES
The table below depicts the guarantees given to power sector relative to the total revenues
of the state
Table I-8: Guarantees as a Percentage of Total Revenues - Andhra Pradesh
Particulars 2009-10 2010-11 2011-12
Rs Cr
Guarantees given by State Govt. 7,272 7,445 8,723
Total Revenues of the State 55,121 71,096 82,729
Guarantees as a %age of Total
Revenues of State 13% 10.47% 10.54%
Source: CAG Audited Accounts for the state – 2011-12, 2010-11, 2009-10
As shown above, there has been an increase in the Guarantees given by the government to
Power sector. However, the guarantees given to Power Sector relative to the state revenue
have decreased from 13% in FY10 to 10.5% in FY12.

AF-MERCADOS EMI
Power Sector Operations and Impact on State Finances – Volume II 17
The table below depicts the three year average share of different utilities in sector
guarantees
Table I-9: Utility wise Breakup of Guarantees - Andhra Pradesh
Utilities 2009-10 2010-11 2011-12
Average
Share in
Sector
Guarantees
(%)
Rs Cr
AP TRANSCO 1,023
1,869 704.37 15%
AP GENCO 6,250 5,577 5,023.39 72%
AP Power Finance
Corporation Ltd1
0 2,995.19 13%
Source: CAG Audited Accounts for the state – 2011-12, 2010-11, 2009-10
As evident from the table, majority of the guarantees given by the state government has
been towards the generation sector. The Guarantees to the power sector has primarily
risen on account of guarantees given to AP Power Finance Corporation.
Subsidy
In 2011-12, subsidy to AP Transmission Company for agriculture and allied subsidy of Rs
4300 Cr was extended
4.5. POWER SECTOR FINANCING REQUIREMENT RELATIVE TO STATE ECONOMY
In this section, the expenditure (under all possible heads) on the power sector by the state
government has been listed to determine the state Power sector financing requirement
which is then compared to state finances.
The sector financing requirement is calculated by a summation of the total Expenditure of
the state government on the sector including Capital and Revenue expenditure, Loans and
Advances (Net Of Recoveries) and Public Debt repaid(Net of Receipts) by the State
Government.
Table I-10: Financing Requirement of Power Sector (2011-12) - Andhra Pradesh
Particulars 2011-12
Rs. Cr.
Power Sector Expenditure (Capital and Revenue) 4,448.9
Loans And Advances made by the State Government (Net of
Recoveries) 1,439.81
8.5% Tax Free Special Bonds of the State Government (Power
Bonds) disbursed during the year (Net of Receipts) 633.98
1 Andhra Pradesh Power Finance Corporation is a 100% AP Government owned company that supports/augments
the resources for financing the power sector reforms in AP
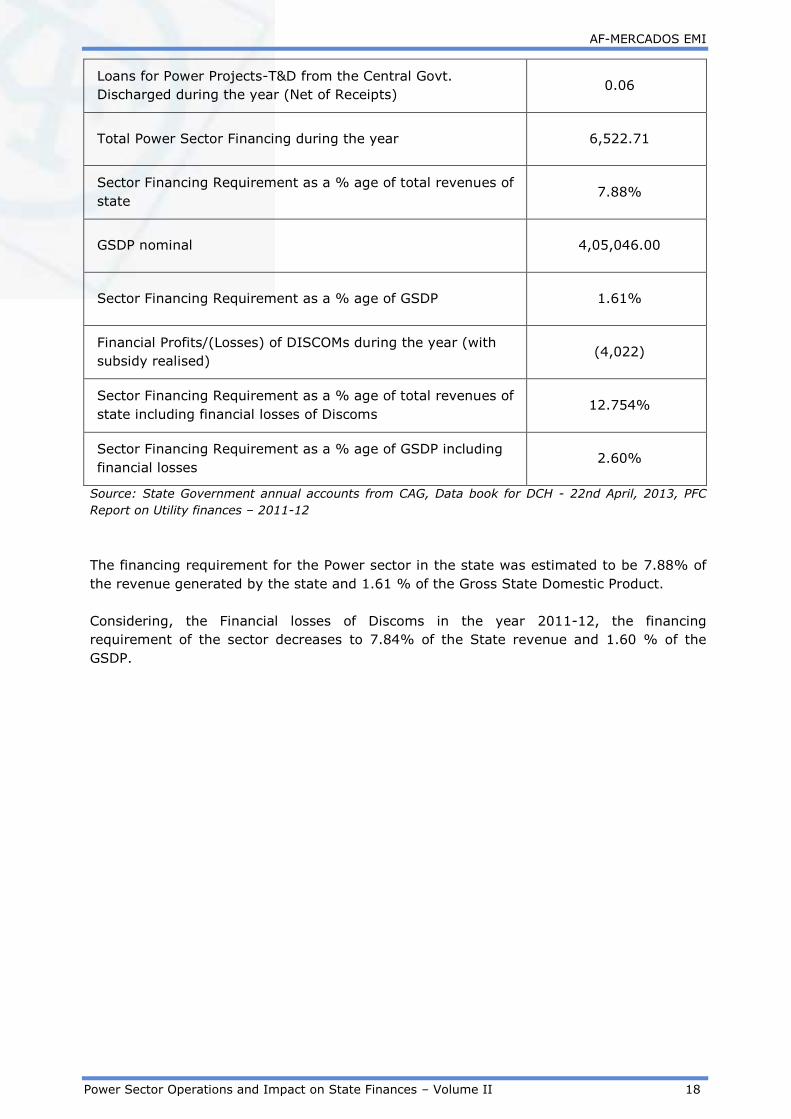
AF-MERCADOS EMI
Power Sector Operations and Impact on State Finances – Volume II 18
Loans for Power Projects-T&D from the Central Govt.
Discharged during the year (Net of Receipts) 0.06
Total Power Sector Financing during the year 6,522.71
Sector Financing Requirement as a % age of total revenues of
state 7.88%
GSDP nominal 4,05,046.00
Sector Financing Requirement as a % age of GSDP 1.61%
Financial Profits/(Losses) of DISCOMs during the year (with
subsidy realised) (4,022)
Sector Financing Requirement as a % age of total revenues of
state including financial losses of Discoms 12.754%
Sector Financing Requirement as a % age of GSDP including
financial losses 2.60%
Source: State Government annual accounts from CAG, Data book for DCH - 22nd April, 2013, PFC
Report on Utility finances – 2011-12
The financing requirement for the Power sector in the state was estimated to be 7.88% of
the revenue generated by the state and 1.61 % of the Gross State Domestic Product.
Considering, the Financial losses of Discoms in the year 2011-12, the financing
requirement of the sector decreases to 7.84% of the State revenue and 1.60 % of the
GSDP.

AF-MERCADOS EMI
Power Sector Operations and Impact on State Finances – Volume II 19
5. FINANCIAL RESTRUCTURING PLAN
Increase in power purchase costs, inadequate tariff hikes, almost free supply of electricity
to the agricultural sector and low subsidy realization from the state government has
deteriorated the financial position of the utilities in the state. In this context, distribution
utilities of Andhra Pradesh adopted the FRP of the central government. The current status
and likely outlook of FRP in the state is discussed in the section below.
5.1. STATUS OF FINANCIAL RESTRUCTURING PLAN
As per the FRP scheme, the Andhra Pradesh government would take 50% of STL by issue of
bonds by the Discoms backed by Government guarantee to participating lenders. The
scheme would permit the Discoms to restructure the remaining 50% of STL backed by
government guarantee, with a negotiated moratorium period.
5.2. FRP OUTLOOK
In this section, key parameters for the state have been looked at in order to comment on
the likeliness of the state to meet the mandatory conditions set forth by the FRP and be
eligible for the central grants incentive scheme.
The color scheme used in the table depicting state parameters refers to the color key
provided here -
Area of concern
Can be better
Good
Some of the key parameters relevant to FRP implementation have been shown in the table
below for Andhra Pradesh.
Table I-11: Historical Parameters – Andhra Pradesh
Key Parameters
2005-
06
2006-
07 2007-08 2008-09 2009-10 2010-11 2011-12 2012-13 2013-14
AT&C losses 17% 18% 16% 13% 16% 18% 15% n.a n.a
Tariff Hikes -3% 0% 0% 0% 0% 13% 24% n.a n.a
Subsidy
Received/Booked 63% 69% 64% 21% 42% 62% 50% n.a n.a
Interest Cost/Total
Cost 5% 4% 3% 3% 5% 5% 6% n.a n.a
ACS-ARR Gap w/o
subsidy - in Rs./kWh 0.26 0.33 0.44 1.10 0.89 0.77 1.08 n.a n.a
Source: AF- Mercados Analysis based on data from PFC report on utility finances and Discom ARRs

AF-MERCADOS EMI
Power Sector Operations and Impact on State Finances – Volume II 20
Some of the key observations from the above table, along with relevant state-level aspects
are listed below.
The AT&C losses for Andhra Pradesh distribution utilities have historically remained on a
lower side compared to the national average. This, however, is based on the estimated
consumption in the agricultural sector (in absence of complete agriculture metering in
the state). A >1.5% annual reduction in AT&C losses from 18% reference point in
2010-11, in order to receive central grants support, will require persistent efforts on
part of the utilities. However, it is important to note here that AT&C losses are a
derived figure in AP due to lack of metering. Hence, it might not be completely
appropriate to take the AT&C loss reference point as given in the table above.
After a period of no tariff revisions for 4 years, tariffs were hiked in 2010-11 and 2011-
12. While the tariff hike has been considerable, frequency of revisions will be crucial in
the future.
Transparency in disbursement levels, a requirement in FRP, can pose an issue for
Andhra Pradesh. Only about half of the subsidies booked by the utilities have been
actually received in the last 3 years. In addition, lack of complete agricultural metering
will limit subsidy support levels under the FRP.
The share of Interest expenses is not very high in the state. The moratorium on
principal repayments will further reduce bring down this burden in the coming years.
The ACS-ARR Gap needs to be reduced by 25% of Rs 0.77/kWh every year in the
moratorium period in order to be eligible for the central grants incentive based on the
AT&C losses. This will be possible with more frequent tariff hikes, as the state has not
received the required subsidies in the past. In addition, subsidy support might now be
limited due to lack of metering.
In Andhra Pradesh, AT&C losses are already at low levels. Since subsidy support has been
limited in the past, the regulator will have to ensure that tariffs are hiked frequently and
the ACS-ARR Gap is reduced.
However, post Telangana Bill, there will be changes in implementation of Financial
Restructuring Plan for the state of Andhra Pradesh and Telangana. The Andhra Pradesh
reorganization bill 2013 states the following:
1. The present DISCOMS would be divided among the successor states on the following
basis:
NPDCL and CPDCL would be responsible for power distribution in the state of
Telangana, with two districts of CPDCL, namely Kurnool and Anantapur would
shift to the state of Andhra Pradesh and accordingly handed over to the
respective DISCOM
SPDCL and EPDCL would be responsible for power distribution in the state of
Andhra Pradesh, while the two districts reassigned would now be under
SPDCL
2. Units of APGENCO shall be divided based on geographical location of power plants.
3. The ratio of power distribution of the Central Generating Stations to the State of
Telangana and Semandhara would be based on the actual energy consumption
during the last 5 years by the DISCOMS in the respective Successor State.

AF-MERCADOS EMI
Power Sector Operations and Impact on State Finances – Volume II 21
4. The existing Andhra Pradesh Electricity Regulatory Commission (APERC) shall
function as a joint regulatory body for a period not exceeding six months within
which time separate SERCs will be formed in the successor States.
5. Existing Power Purchase Agreements (PPAs) with respective DISCOMS shall continue
for both on-going projects and projects under construction
FRP implications of the State Division:
Andhra Pradesh:
FRP details with respect to Andhra Pradesh are given below:
Table I-12 : FRP scheme state details – Andhra Pradesh
Particulars Amount (Rs. Cr).
Accumulated losses as on 31/03/2012 6353
STL eligible under the scheme as on
31/03/2012 7438
Bonds issued by the Government 4046
Source: Data submitted by the state to the FFC
Table I-13: Interest repayment on bonds by the State Government per year – Andhra
Pradesh
Company Bonds Issued (Rs. Cr.) Interest @ 10%(Rs. Cr.)
EPDCL 1806 181
SPDCL 2240 224
Total 4046 404
Source: Data submitted by the state to the FFC
Telangana:
FRP details for Telangana are given below:
Table I-14 : FRP scheme state details – Telangana
Particulars Amount (Rs. Cr).
Accumulated losses as on 31/03/2012 11315
STL eligible under the scheme as on
31/03/2012 9232
Bonds issued by the Government 4554
Source: Data submitted by the state to the FFC

AF-MERCADOS EMI
Power Sector Operations and Impact on State Finances – Volume II 22
Table I-15: Interest repayment on bonds by the State Government per year – Telangana
Company Bonds Issued (Rs. Cr.) Interest @ 10%(Rs. Cr.)
CPDCL 2810 281
NPDCL 1744 174
Total 4554 455
Source: Data submitted by the state to the FFC
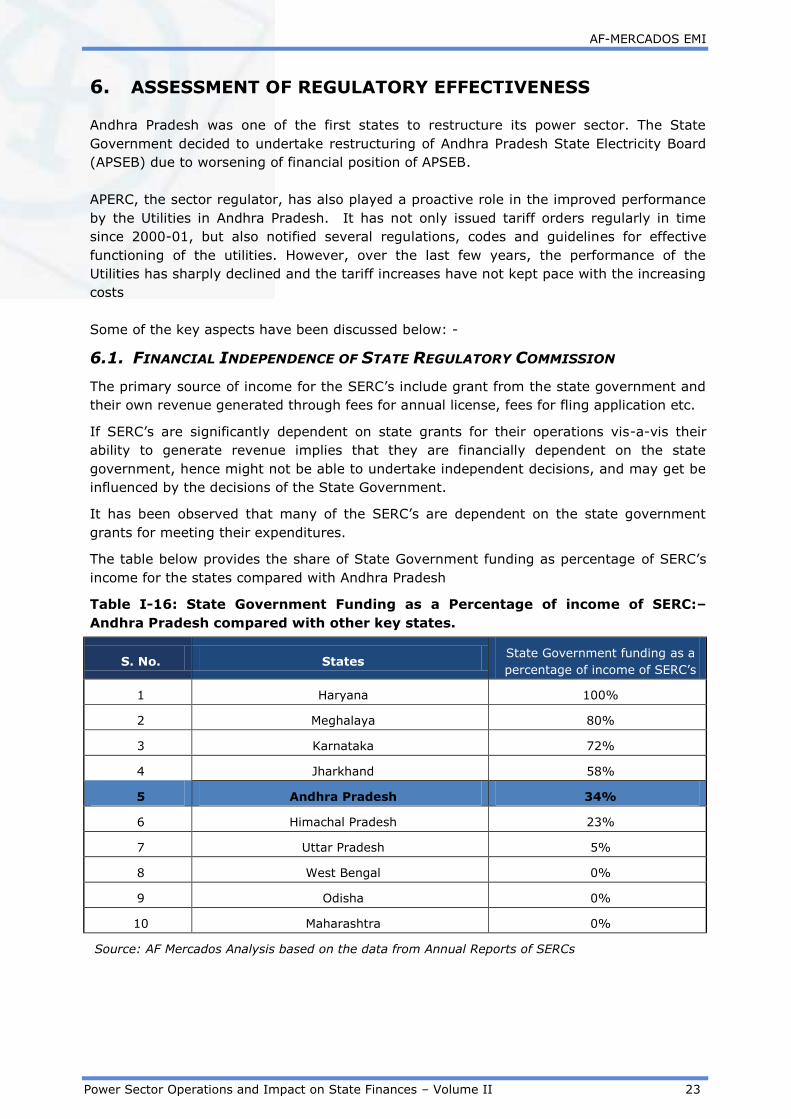
AF-MERCADOS EMI
Power Sector Operations and Impact on State Finances – Volume II 23
6. ASSESSMENT OF REGULATORY EFFECTIVENESS
Andhra Pradesh was one of the first states to restructure its power sector. The State
Government decided to undertake restructuring of Andhra Pradesh State Electricity Board
(APSEB) due to worsening of financial position of APSEB.
APERC, the sector regulator, has also played a proactive role in the improved performance
by the Utilities in Andhra Pradesh. It has not only issued tariff orders regularly in time
since 2000-01, but also notified several regulations, codes and guidelines for effective
functioning of the utilities. However, over the last few years, the performance of the
Utilities has sharply declined and the tariff increases have not kept pace with the increasing
costs
Some of the key aspects have been discussed below: -
6.1. FINANCIAL INDEPENDENCE OF STATE REGULATORY COMMISSION
The primary source of income for the SERC’s include grant from the state government and
their own revenue generated through fees for annual license, fees for fling application etc.
If SERC’s are significantly dependent on state grants for their operations vis-a-vis their
ability to generate revenue implies that they are financially dependent on the state
government, hence might not be able to undertake independent decisions, and may get be
influenced by the decisions of the State Government.
It has been observed that many of the SERC’s are dependent on the state government
grants for meeting their expenditures.
The table below provides the share of State Government funding as percentage of SERC’s
income for the states compared with Andhra Pradesh
Table I-16: State Government Funding as a Percentage of income of SERC:–
Andhra Pradesh compared with other key states.
S. No. States State Government funding as a
percentage of income of SERC’s
1 Haryana 100%
2 Meghalaya 80%
3 Karnataka 72%
4 Jharkhand 58%
5 Andhra Pradesh 34%
6 Himachal Pradesh 23%
7 Uttar Pradesh 5%
8 West Bengal 0%
9 Odisha 0%
10 Maharashtra 0%
Source: AF Mercados Analysis based on the data from Annual Reports of SERCs

AF-MERCADOS EMI
Power Sector Operations and Impact on State Finances – Volume II 24
6.2. STATUS OF IMPORTANT REGULATIONS
The regulator has notified Open Access regulation which was issued in 2005. APERC has
introduced Multi-Year-Tariff framework and notified Regulation 4 of 2005 (Terms and
Conditions for Determination of Tariff for Wheeling and Retail Sale of Electricity) on 14th
November 2005 and MYT’s first control period is effective from FY 2006-07 onwards.
APERC has been issuing MYT regulations and have notified draft MYT for its 3rd control
period from 2014-15 to 2018-19.
6.3. STATUS OF OPEN ACCESS IMPLEMENTATION
As on March 2013, Andhra Pradesh has 445 number of open access consumers which is
second highest in India after Tamil Nadu. Cross subsidy surcharge in AP is nil as compared
to other states Cross Subsidy Surcharge in Haryana (Rs. 0.53/kWh) is comparable to
Gujarat (Rs. 0.45/kWh), Bihar (Rs. 0.50/kWh) and is less than in Maharashtra (~Rs.
2.30/kWh) Punjab (Rs. 1.07/kWh) and West Bengal (Rs. 2.21/kWh)
6.4. FREQUENCY OF TARIFF REVISIONS
The tariff revisions were done in FY 2010-11 after a gap of 8 years wherein tariffs were
hiked substantially i.e. 13%. Thereafter commission has approved a tariff hike in FY 2012
by 24%. The table below provides the details of tariff revision in the state.
Table I-17: Historical Trend in Tariff Revisions – Andhra Pradesh
FY
05
FY 06 FY 07 FY
08
FY
09
FY
10
FY 11 FY
12
FY
13
FY 14
Average
Tariff
Revisions
0% 0% 0% 0% 0% 0% 13% 24% NA NA
Source: Approved Tariff Orders of DISCOM for that year
6.5. REVIEW OF APPROACHES ADOPTED FOR MEASURING AGRICULTURAL
CONSUMPTION
In 2011-12, agricultural sales in Andhra Pradesh contributed ~ 28% of the overall sales
mix in the state. The total agriculture connections in FY 2012-13 accounted for 29.90 lakh.
As per the GoAP policy, agricultural sector is given seven hours of electricity supply.
All the four Discoms are implementing HVDS to agriculture consumers to give better quality
power by reducing the length of conventional LT Lines. Already HVDS is implemented in 7
districts.
The state distribution utilities in Andhra Pradesh has been estimating unmetered
agriculture consumption based on information available from meters fixed on LV side of
Distribution Transformers primarily catering to the agricultural pump sets for working out a
consumption norm. This consumption norm is further utilized for a more realistic estimation
of unmetered agricultural consumption. The specific consumption per HP/month is arrived
and is made applicable to all un-metered services by multiplying specific consumption and
connected load in HP to arrive at total agriculture consumption.

AF-MERCADOS EMI
Power Sector Operations and Impact on State Finances – Volume II 25
However, the commission has approved a new ISI methodology to estimate the agricultural
sales; however, implementation of the methodology requires updating of agricultural DTR
data which currently is not updated. Hence, the utilities have continued to follow the old
approach of estimating agricultural sales.
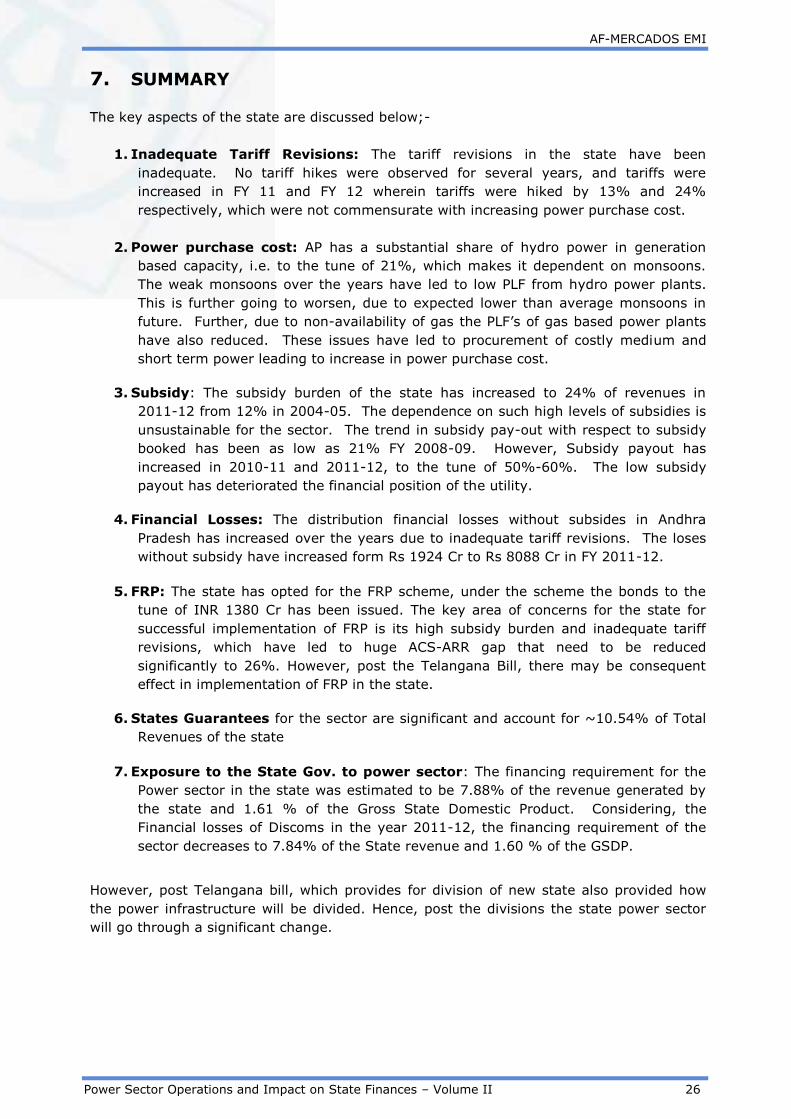
AF-MERCADOS EMI
Power Sector Operations and Impact on State Finances – Volume II 26
7. SUMMARY
The key aspects of the state are discussed below;-
1. Inadequate Tariff Revisions: The tariff revisions in the state have been
inadequate. No tariff hikes were observed for several years, and tariffs were
increased in FY 11 and FY 12 wherein tariffs were hiked by 13% and 24%
respectively, which were not commensurate with increasing power purchase cost.
2. Power purchase cost: AP has a substantial share of hydro power in generation
based capacity, i.e. to the tune of 21%, which makes it dependent on monsoons.
The weak monsoons over the years have led to low PLF from hydro power plants.
This is further going to worsen, due to expected lower than average monsoons in
future. Further, due to non-availability of gas the PLF’s of gas based power plants
have also reduced. These issues have led to procurement of costly medium and
short term power leading to increase in power purchase cost.
3. Subsidy: The subsidy burden of the state has increased to 24% of revenues in
2011-12 from 12% in 2004-05. The dependence on such high levels of subsidies is
unsustainable for the sector. The trend in subsidy pay-out with respect to subsidy
booked has been as low as 21% FY 2008-09. However, Subsidy payout has
increased in 2010-11 and 2011-12, to the tune of 50%-60%. The low subsidy
payout has deteriorated the financial position of the utility.
4. Financial Losses: The distribution financial losses without subsides in Andhra
Pradesh has increased over the years due to inadequate tariff revisions. The loses
without subsidy have increased form Rs 1924 Cr to Rs 8088 Cr in FY 2011-12.
5. FRP: The state has opted for the FRP scheme, under the scheme the bonds to the
tune of INR 1380 Cr has been issued. The key area of concerns for the state for
successful implementation of FRP is its high subsidy burden and inadequate tariff
revisions, which have led to huge ACS-ARR gap that need to be reduced
significantly to 26%. However, post the Telangana Bill, there may be consequent
effect in implementation of FRP in the state.
6. States Guarantees for the sector are significant and account for ~10.54% of Total
Revenues of the state
7. Exposure to the State Gov. to power sector: The financing requirement for the
Power sector in the state was estimated to be 7.88% of the revenue generated by
the state and 1.61 % of the Gross State Domestic Product. Considering, the
Financial losses of Discoms in the year 2011-12, the financing requirement of the
sector decreases to 7.84% of the State revenue and 1.60 % of the GSDP.
However, post Telangana bill, which provides for division of new state also provided how
the power infrastructure will be divided. Hence, post the divisions the state power sector
will go through a significant change.

AF-MERCADOS EMI
Power Sector Operations and Impact on State Finances – Volume II 27
II ARUNACHAL PRADESH
1. INTRODUCTION
1.1. BACKGROUND – POWER SECTOR OVERVIEW
The government of Arunachal Pradesh constituted the Electricity Regulatory Commission
for the state on 7th May 2010 to bring in efficiency and transparency in tariff determination
and maintenance of accounts. The Power Department of the State Government is
responsible for carrying out the business of Power transmission and distribution in the
state. Arunachal Pradesh majorly meets its power requirements through procurement from
central sector power generating stations. A small amount is met through Arunachal
Pradesh Department of hydro power development.
1.2. GENERATION MIX
The total installed capacity as on February 2014 (including allocated share in Joint &
Central Sector plants) for Arunachal Pradesh was 249.41 MW. Out of total capacity as on
Feb 2014, RE power capacity accounted for ~42% followed by large Hydro (~39% ) and
Gas (~13%).
Figure below highlights the generation capacity including allocated share in Joint & Central
sector plants.
Figure II-1: Generation Capacity Mix as on Feb 2014 – Arunachal Pradesh
Source: CEA
1.3. POWER SUPPLY POSITION
With efficient guidelines laid down by the commission towards the Electricity Department,
there have been visible improvements in the power supply position in the state. The energy
deficit has decreased from 15% in FY 2010-11 to 7% in FY 2013-14 and the peak deficit
has significantly decreased from 16% in FY 2010-11 to 1% in FY 2013-14. The state meets
most of its power requirements through procurement from central power stations and
power allocations from state hydro plants. The state also procures power from the short
term market, especially during peak hour deficits. The state has firm power allocations
from central generating stations and any additional demand beyond the said allocation is
met through external sources. Till date, the state has been meeting such shortages
through Unscheduled Interchange (UI).
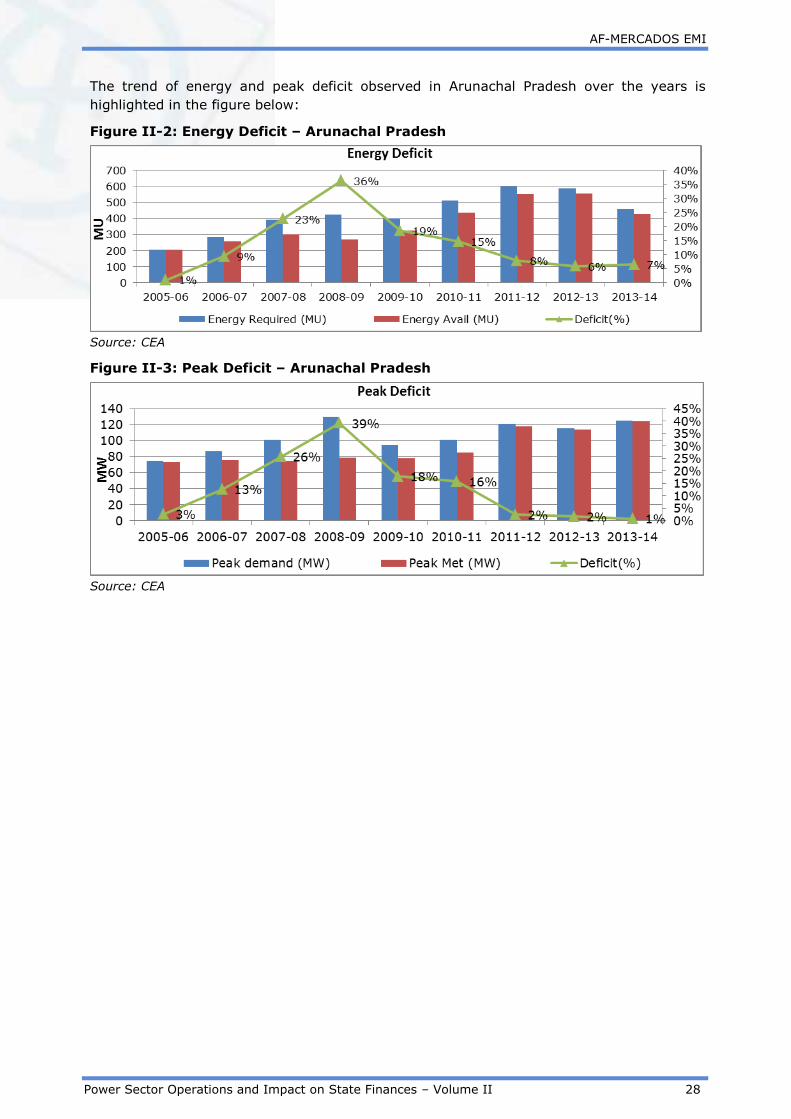
AF-MERCADOS EMI
Power Sector Operations and Impact on State Finances – Volume II 28
The trend of energy and peak deficit observed in Arunachal Pradesh over the years is
highlighted in the figure below:
Figure II-2: Energy Deficit – Arunachal Pradesh
Source: CEA
Figure II-3: Peak Deficit – Arunachal Pradesh
Source: CEA

AF-MERCADOS EMI
Power Sector Operations and Impact on State Finances – Volume II 29
2. ASSESSMENT OF OPERATIONAL PERFORMANCE OF
DISTRIBUTION UTILITIES
2.1. CONSUMER SALES MIX OF ARUNACHAL PRADESH
The Arunachal Pradesh Department of Power (APDOP) is the sole unit taking care of the
power supply in the state across different consumer categories.
In FY 2011-12, domestic sector dominated the sales mix with a share of 37%, followed by
Industrial HT category (29%). The share of domestic category has increased from 11.7% in
2005-06 to 36.8% in 2011-12.
The historical trend of consumer sales mix for the state is given in figure below:-
Figure II-4: Historical Trend in Consumer Sales Mix – Arunachal Pradesh
Source: PFC
The overall sales have registered a CAGR of 2.16% over the span of seven years wherein
the sales of HT Industrial category have registered a higher CAGR of 28% within five years
followed by the Domestic category with a CAGR of 25%.
In terms of revenue contribution, domestic category contributed for about 38% of revenue,
followed by HT Industrial category and commercial category with a share of 27% and 8%,
respectively (Refer Figure I-5 below).
The figure below compares the sales mix of FY 2011-12 and the revenue realized from the
different category of consumers.

AF-MERCADOS EMI
Power Sector Operations and Impact on State Finances – Volume II 30
Figure II-5: Comparative Analysis of Consumer Sales and Revenue Mix 2011-12 –
Arunachal Pradesh
Source: PFC
2.2. TRENDS IN COMMERCIAL & TECHNICAL LOSSES
The losses for APDOP have been high because maximum sale is in the domestic segment
with low individual consumption, which is spread over a wide geographical area, leading to
increasing low voltage lines and T&D losses.
Table II-1: Year on Year Trend in AT&C losses and Collection Efficiency -
Arunachal Pradesh
Year FY 05 FY 06 FY 07 FY 08 FY 09 FY 10 FY 11 FY 12
AT&C Losses
(%) 69.0% 58.0% 61.6% 60.2% 58.8% 61.5% 65.6% 69.0%
Collection
Efficiency 29% 104% 91% 109% 94% 96% 69% 29%
Source: PFC
The prevailing transmission networks in the state are not efficient. There haven’t been
adequate investments in T&D networks, particularly in sub transmission and distribution.
Further, defective metering, unmetered supply and pilferage have increased the losses.
The collection efficiency has also been on the lower side because of unmetered supply.
Until 2010, less than 50% of consumers were metered (Source: Planning commission
report on state performance). Moreover, a large portion of the meters at the consumer end
is found to be obsolete/defective.
2.3. TRENDS IN DISTRIBUTION COST
Power purchase cost accounts for majority of distribution cost. Power purchase cost has
accounted for an average of ~50% of the total distribution cost over the years (Refer table
below).
The per unit cost break-up for different cost components for the state of Arunachal Pradesh
is provided in the table below:-

AF-MERCADOS EMI
Power Sector Operations and Impact on State Finances – Volume II 31
Table II-2: Year on Year Trend Distribution Cost Breakup - Arunachal Pradesh
Cost Component
(Rs. per kWh) FY 05 FY 06 FY 07 FY 08 FY 09 FY 10 FY 11 FY 12
Power Purchase
Cost - 2.43 2.47 2.42 1.29 2.44 2.49 3.84
O&M (R&M +
A&G + EC) - 1.48 1.89 1.55 1.05 2.33 3.19 2.51
Interest - 0.47 0.60 0.43 0.23 0.45 0.37 0.20
Depreciation - 0.00 0.00 0.00 0.00 0.00 0.00 0.00
Other cost - 0.20 0.27 0.19 0.04 0.08 0.07 0.07
Source: PFC
It can be observed that power purchase cost per unit has increased over the last four
financial years. There are few reasons behind that:
The demand for power has increased in the state with increasing domestic share and
urbanization, while the level of capacity addition has been poor.
The state has been procuring emergency requirements through Unscheduled
Interchange (UI).
Since, most of the state power requirements are met through allocated power from
central generating stations, the transmission charges payable to PGCIL has also
been increasing.
2.4. REVENUE REALIZATION
Tariff realization from different consumer category has not increased with respect to the
increasing power purchase cost.
The table below shows the revenue realization (without subsidy) from different consumer
categories of consumers over the years.
Table II-3: Historical Trend Consumer Category Wise Revenue Realization -
Arunachal Pradesh
Category FY 05 FY 06 FY 07 FY 08 FY 09 FY 10 FY 11 FY 12
Domestic 1.86 2.08 2.71 2.84 3.00 3.17 3.33 1.86
Agriculture - - - - - - - -
Commercial 1.76 2.22 9.00 3.33 3.85 4.00 4.21 1.76
Industrial HT - - 2.36 2.47 3.00 3.21 3.03 -
Industrial LT 1.82 2.50 3.18 3.40 5.00 3.33 3.33 1.82
Others 2.05 2.16 2.80 2.46 3.41 2.80 2.93 2.05
Source: PFC
Tariff revision in the state as per the commission tariff order (FY 13-14) has only been for
Industrial LT and HT categories of up to 5.24%

AF-MERCADOS EMI
Power Sector Operations and Impact on State Finances – Volume II 32
3. ASSESSMENT OF FINANCIAL PERFORMANCE OF –
DISTRIBUTION UTILITY
3.1. FINANCIAL HEALTH OF DISTRIBUTION UTILITIES
The distribution financial losses without subsides in Arunachal Pradesh has increased over
the years. As discussed earlier, this is because of increasing power purchase cost and
inadequate tariff revisions over the years.
Figure II-6: Historical Trend Financial Losses (w/o) subsidies – Arunachal
Pradesh
Source: PFC
Due to lack of intra state grid infrastructure, the state needs to export domestically
generated power which otherwise could have been utilized locally. As a result, the power
purchase cost has subsequently increased over the years with increasing procurement from
short term market.
3.2. SUBSIDY BOOKED V/S SUBSIDY RECEIVED
There has been no subsidy booked or received over the years.
3.3. ACS V/S ARR
The gap (with subsidy) between average cost of supply and average revenue realized (with
subsidy) has been high in the initial years. There has been a decrease from 2007 onwards
and a rise again from 2009. The rise is observed is a result of increasing power purchase
cost and inadequate tariff revisions as discussed above.
Figure II-7: Historical Trend ACS v/s ARR (with subsidy) – Arunachal Pradesh
Source: PFC

AF-MERCADOS EMI
Power Sector Operations and Impact on State Finances – Volume II 33
4. STATE INCOME AND EXPENDITURE ON POWER SECTOR
4.1. INCOME FROM POWER SECTOR
The tax revenue from the power sector forms a negligible part of the total tax revenue over
the years. The tax income is majorly through electricity distribution tax, which is paid by
the distribution utilities to the state government. The details for the same are provided in
the table below.
Table II-4: Tax Revenue from Power Sector – Arunachal Pradesh
Revenue
2009-10 2010-11 2011-12
Rs Cr
Tax Revenue from Power Sector 0 0 0.0003
Total Tax Revenue 649 935 1,157
Power sector Tax Revenue / Total
state Tax Revenue 0% 0% 0%
Source: C&AG Audited Accounts for the state – 2011-12, 2010-11, 2009-10
The non-tax revenue from power sector is through royalty/cess on water for power
generation. The Non Tax revenue from power sector forms a substantial portion of the
total non-tax revenue of state over the years. There has been a decrease in the revenue
from Power Sector along with the total state Non –Tax Revenue. The decrease in power
sector Non –tax revenue has been on account of decrease in receipts from Hydel
Generation.
The details for the same are provided in the table below.
Table II-5: Non-Tax Revenue from Power Sector - Arunachal Pradesh
Revenue 2009-10 2010-11 2011-12
Rs Cr
Non Tax Revenue From Power
Sector 329 282 145
Total Non-Tax Revenue 511 530 360
Power sector Non - Tax
Revenue /Total state
Non-Tax Revenue 64% 53% 40%
Source: C&AG Audited Accounts for the state – 2011-12, 2010-11, 2009-10
The overall income generated from the power sector has decreased from Rs 329 Cr in FY
2010 to Rs 145 Cr in FY2012 along with the share in total state receipts.
4.2. EXPENDITURE ON POWER SECTOR
The table below depicts the expenditure on power sector made by the state government.
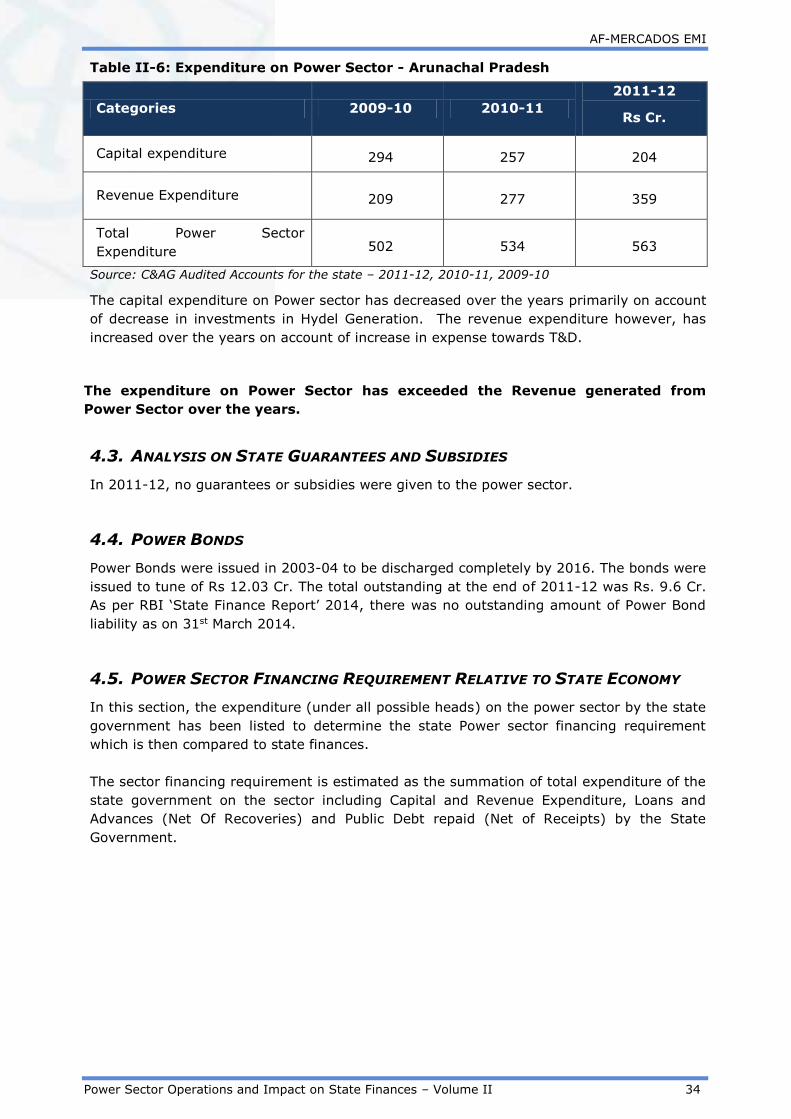
AF-MERCADOS EMI
Power Sector Operations and Impact on State Finances – Volume II 34
Table II-6: Expenditure on Power Sector - Arunachal Pradesh
Categories 2009-10 2010-11
2011-12
Rs Cr.
Capital expenditure 294 257 204
Revenue Expenditure 209 277 359
Total Power Sector
Expenditure 502 534 563
Source: C&AG Audited Accounts for the state – 2011-12, 2010-11, 2009-10
The capital expenditure on Power sector has decreased over the years primarily on account
of decrease in investments in Hydel Generation. The revenue expenditure however, has
increased over the years on account of increase in expense towards T&D.
The expenditure on Power Sector has exceeded the Revenue generated from
Power Sector over the years.
4.3. ANALYSIS ON STATE GUARANTEES AND SUBSIDIES
In 2011-12, no guarantees or subsidies were given to the power sector.
4.4. POWER BONDS
Power Bonds were issued in 2003-04 to be discharged completely by 2016. The bonds were
issued to tune of Rs 12.03 Cr. The total outstanding at the end of 2011-12 was Rs. 9.6 Cr.
As per RBI ‘State Finance Report’ 2014, there was no outstanding amount of Power Bond
liability as on 31st March 2014.
4.5. POWER SECTOR FINANCING REQUIREMENT RELATIVE TO STATE ECONOMY
In this section, the expenditure (under all possible heads) on the power sector by the state
government has been listed to determine the state Power sector financing requirement
which is then compared to state finances.
The sector financing requirement is estimated as the summation of total expenditure of the
state government on the sector including Capital and Revenue Expenditure, Loans and
Advances (Net Of Recoveries) and Public Debt repaid (Net of Receipts) by the State
Government.
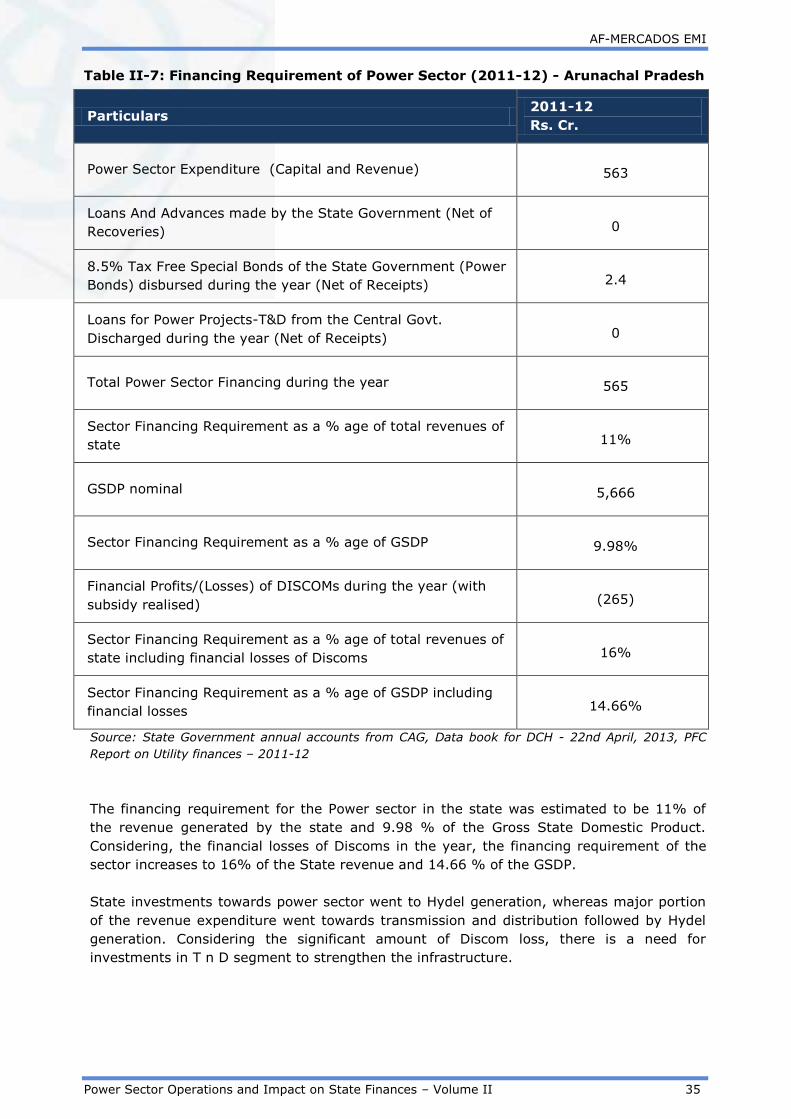
AF-MERCADOS EMI
Power Sector Operations and Impact on State Finances – Volume II 35
Table II-7: Financing Requirement of Power Sector (2011-12) - Arunachal Pradesh
Particulars 2011-12
Rs. Cr.
Power Sector Expenditure (Capital and Revenue) 563
Loans And Advances made by the State Government (Net of
Recoveries) 0
8.5% Tax Free Special Bonds of the State Government (Power
Bonds) disbursed during the year (Net of Receipts) 2.4
Loans for Power Projects-T&D from the Central Govt.
Discharged during the year (Net of Receipts) 0
Total Power Sector Financing during the year 565
Sector Financing Requirement as a % age of total revenues of
state 11%
GSDP nominal 5,666
Sector Financing Requirement as a % age of GSDP 9.98%
Financial Profits/(Losses) of DISCOMs during the year (with
subsidy realised) (265)
Sector Financing Requirement as a % age of total revenues of
state including financial losses of Discoms 16%
Sector Financing Requirement as a % age of GSDP including
financial losses 14.66%
Source: State Government annual accounts from CAG, Data book for DCH - 22nd April, 2013, PFC
Report on Utility finances – 2011-12
The financing requirement for the Power sector in the state was estimated to be 11% of
the revenue generated by the state and 9.98 % of the Gross State Domestic Product.
Considering, the financial losses of Discoms in the year, the financing requirement of the
sector increases to 16% of the State revenue and 14.66 % of the GSDP.
State investments towards power sector went to Hydel generation, whereas major portion
of the revenue expenditure went towards transmission and distribution followed by Hydel
generation. Considering the significant amount of Discom loss, there is a need for
investments in T n D segment to strengthen the infrastructure.
AF-MERCADOS EMI
Power Sector Operations and Impact on State Finances – Volume II 36
5. ASSESSMENT OF REGULATORY EFFECTIVENESS
The Government of Arunachal Pradesh constituted the Arunachal Pradesh State Electricity
Regulatory Commission (APSERC) on 7th May, 2010 and it started its operations from 2nd
March, 2011. The regulator is fairly new in the state with its first tariff order on 2013. The
Commission has issued recent notifications of Open Access Regulations, 2012 and MYT
regulations, 2013.
The key aspects of regulatory effectiveness have been discussed below -
5.1. STATUS OF MYT REGULATIONS
The Commission has notified MYT Regulations in FY 2013. However, its implementation is
not carried forward by the commission because of lack of requisite and reliable data.
5.2. STATUS OF OPEN ACCESS IMPLEMENTATION
The Commission notified the Open Access Regulations on 19th Nov, 2012. According to the
regulation:
Consumers requiring 5MW or more and a generating station of 5MW and more shall
be eligible for intra-state transmission system
Similarly, a consumer having load of 1MW and less than 5MW, and a generating
station within the same band would be eligible for distribution system connectivity
The regulation further provides guidelines on open access transmission charges,
wheeling charges, cross subsidy surcharge and additional surcharges.
5.3. FREQUENCY OF TARIFF REVISIONS
The tariff revisions in the state have not been frequent. The latest major tariff revision
which took place was in 30th May 13, to the tune of 5.24% for Industrial IT and HT
consumers for FY13-14.

AF-MERCADOS EMI
Power Sector Operations and Impact on State Finances – Volume II 37
6. SUMMARY
The energy deficits in the state have decreased over the years while at the same time the
power purchase cost has subsequently increased because of lower capacity addition in the
state generation capacity and lack of intra state grid infrastructure. All this have led to
procurement of costly short term power. The metering level has been equally poor. All
these factors, put together have lead to poor financial position of the state power sector.
The key parameters of the states are discussed below-
1. Unmetered sales: There has been low level of metering both at the feeder and
consumer end. Until 2010, less than 50% of the consumers were metered. This
shows that there is an urgent need of improvement with this regard.
2. Inadequate Tariff Revisions: The tariff revisions in the state have been
inadequate. No tariff hikes were observed for several years. The commission has
only issued its first tariff order in which it approves a tariff hike of 5.24% for
Industrial HT and LT consumers for FY 13-14. There hasn’t been appropriate tariff
hikes against the increasing power purchase cost
3. Power purchase cost: The power purchase cost have increased over the years
primarily because of low capacity addition and lack of intra-state grid infrastructure.
4. Financial Losses: The distribution financial losses without subsides in Arunachal
Pradesh has increased over the years due to inadequate tariff revisions and poor
metering level. The loses without subsidy have increased form Rs 47 Cr in FY 2008-
09 to Rs 265 Cr in FY 2011-12.
5. Regulatory: Not many reforms have been observed in the state w.r.t., the power
sector. The regulatory commission was established in 2010, with its first tariff order
in 2013. The process of unbundling is still not undertaken and till date the Electricity
Department of the state government is responsible for generation, transmission and
distribution of electricity. Even after a decade past the electricity act, the state has
been poor in terms of reforms implementation.
6. Exposure to the State Gov. to power sector: The financing requirement for the
Power sector in the state was estimated to be 11% of the revenue generated by the
state and 9.88% of the Gross State Domestic Product. Considering, the Financial
losses of Discoms in the year 2011-12, the financing requirement of the sector
increases to 16% of the State revenue and 14.66% of the GSDP.

AF-MERCADOS EMI
Power Sector Operations and Impact on State Finances – Volume II 38
III ASSAM
1. INTRODUCTION
1.1. BACKGROUND – POWER SECTOR OVERVIEW
The power sector reforms in the state of Assam underwent with the unbundling of Assam
State Electricity Board (ASEB) on the functional line with one generation company, a
transmission company and three distribution companies were formed out of ASEB.
Lower Assam Electricity Distribution Company – Distribution Company
Upper Assam Electricity Distribution Company - Distribution Company
Central Assam Electricity Distribution Company - Distribution Company
Assam Power Generation Company Limited – Generation Company
Assam Electricity Grid Corporation Limited - Transmission Company
Government of Assam transferred, the functions, properties, interests, rights, obligations
and liabilities of UAEDCL and CAEDCL along with to LAEDCL with effect from 1st April 2009.
The name Lower Assam Electricity Distribution Company Ltd. Was changed to Assam Power
Distribution Company Ltd.
1.2. GENERATION MIX
The total installed capacity as on February 2014 (including allocated share in Joint &
Central Sector plants), for Assam was 1,140.04MW, out of which gas-based capacity
accounted for ~52% of the total installed capacity; followed by hydro (~38%) and coal
(~5%). Renewable based capacity accounted for ~3% of the overall capacity mix in the
state.
Figure below presents the generation capacity mix in the state of Assam.
Figure III-1: Generation Capacity Mix - Assam
5%
52%
2%
38%
3%
Generation Capacity (incl of allocated share from Joint & Central Sector Plants)
Coal Gas Diesel Hydro Renewable
Source: CEA
1.3. POWER SUPPLY POSITION
The energy deficit levels in the state of Assam have been steady in the range of 7% to
11%, due to slow growth in energy and peak demand from FY 06 to FY 14. Further, the

AF-MERCADOS EMI
Power Sector Operations and Impact on State Finances – Volume II 39
peak deficit in the state has been in the range of 8% to 17% from FY 06 to FY 14. The
peak deficit increased in FY 09, due to sharp increase in peak demand in that year.
The trend of energy deficit observed in Assam over the years is presented in the figure
below:
Figure III-2: Historical Trend in Energy Deficit – Assam
7%7%
8%
11%
8%
6%6%
7%6%
0%
2%
4%
6%
8%
10%
12%
0
1000
2000
3000
4000
5000
6000
7000
8000
MU
Energy Deficit
Energy Required (MU) Energy Available (MU) Energy Deficit
Source: CEA
The trend of peak deficit observed in Assam over the years is presented in the figure
below:
Figure III-3: Historical Trend in Peak Deficit – Assam
8%
11%10%
17%16%
13%
9%8% 8%
0%
2%
4%
6%
8%
10%
12%
14%
16%
18%
0
200
400
600
800
1000
1200
1400
MW
Peak Deficit
Peak Demand (MW) Peak Met (MW) Peak Deficit
Source: CEA

AF-MERCADOS EMI
Power Sector Operations and Impact on State Finances – Volume II 40
2. ASSESSMENT OF OPERATIONAL PARAMETERS OF
DISTRIBUTION UTILITIES
2.1. CONSUMER SALES MIX OF ASSAM
The distribution activities in the state of Assam is carried out by the re-bundled APDCL that
caters to more than 3 million consumers in the state, with ~93% domestic consumers in
the state.
In 2011-12, domestic consumer sales dominated the sales mix with a share of 36%,
followed by industries (19%) and commercial (15%) segments. Further, agriculture had a
marginal 1% share in the overall sales mix in the state.
The share of domestic sales have reduced over the years while the share of industrial sales
have increased. The share of domestic sales have reduced from 41% in 2005-06 to 36% in
2011-12 and the industrial sales have increased marginally from 16% in 2005-06 to 19%
in 2011-12. It must be noted that the decline in industries in overall sales mix in 2011-12
compared to 2010-11 was due to representation of tea and rubber industries to Other
consumer segments.
The figure below illustrates the year on year trend in the consumer mix for the state of
Assam.
Figure III-4: Historical Trend Consumer Sales Mix – Assam
0%
20%
40%
60%
80%
100%
2005-06 2006-07 2007-08 2008-09 2009-10 2010-11 2011-12
Pe
rce
nta
ge
Years
Domestic Commercial Agriculture
Industrial - HT Industrial - LT others
Source: PFC
The overall sales has registered a CAGR of ~11% from FY 05 to FY 12; wherein sales to
commercial and industrial consumers have registered a comparatively higher CAGR of
~16% and 13% in the same period.
In terms of revenue contribution, domestic category contributed ~31% of the revenue,
followed by industrial (excluding rubber and tea) and commercial categories with a share of
19% and 18% respectively.

AF-MERCADOS EMI
Power Sector Operations and Impact on State Finances – Volume II 41
Figure III-5: Comparative Analysis Consumer Sales and Revenue Mix (w/o
subsidy) in 2011-12 – Assam
Domestic 31%
Commercial
18%
Agriculture
1%
Industrial -
HT
19%
Industrial - LT
1%
others
30%
Category wise Revenue - 2011-12
Domestic 36%
Commercial
15%
Agriculture
1%
Industrial -
HT
19%
Industrial - LT
2%
others
27%
Category wise Sales - 2011-12
Source: PFC
2.2. TRENDS IN COMMERCIAL AND TECHNICAL LOSSES
The AT&C losses of the distribution utility have historically been high when compared to the
national average. The AT&C losses increased substantially in FY 10, on account of poor
collection efficiency in that year.
The table below illustrates the year on year trend on commercial losses and collection
efficiency of the distribution utility.
Table III-1: Historical Trend AT&C losses and Collection Efficiency - Assam
Year FY 06 FY 07 FY 08 FY 09 FY 10 FY 11 FY 12
AT&C Losses (%) 35.2% 36.6% 34% 33% 56% 29% 29%
Collection Efficiency (%) 94% 94% 98% 96% 59% 96% 93%
Source: PFC
2.3. TRENDS IN DISTRIBUTION COSTS
Power purchase cost accounts for majority of distribution cost, accounting for ~81% of the
overall distribution costs. The per unit cost break-up for different cost components for the
state of Assam is provided in the table below:-
Table III-2: Historical Trend in Distribution Cost Breakup - Assam
Cost Component
(Rs per kWh) FY 06 FY 07 FY 08 FY 09 FY 10 FY 11 FY 12
Power Purchase Cost 2.14 2.34 3.18 3.21 3.01 3.95 4.27
O&M (R&M + A&G + EC) 0.79 0.77 0.88 0.93 0.93 0.94 0.99
Interest 0.11 0.10 0.15 0.17 0.16 0.16 0.17
Depreciation 0.09 0.08 0.11 0.14 0.14 0.16 0.11
Other cost 0.10 -0.01 0.05 0.04 0.03 0.01 -0.27
Source: PFC

AF-MERCADOS EMI
Power Sector Operations and Impact on State Finances – Volume II 42
As discussed, the generation capacity in the state of Assam is dominated by gas based
generation. The increase in power purchase price in FY 11, on account of increase in gas
price (APM gas) from $1.9 per MMBTU to $4.2 per MMBTU in the same year, significantly
increased the power purchase cost. Further, with the enactment of Rangarajan’s committee
report on the domestic gas pricing, would further increase the APM gas price to $8.40 per
MMBTU.
The per unit employee cost (constitutes ~89% of the overall O&M costs) continues to
remain high, on account of inefficient utilization of the existing manpower by the state
distribution utility.
2.4. REVENUE REALIZATION
Tariff realization from different consumer category has increased commensurate to
increasing power purchase cost (from FY 06 to FY 10). However, with increase in APM gas
price in FY 11, the increase in revenue realization has not reflected the increase in power
purchase costs.
The table below shows the revenue realization (without subsidy) from different consumer
categories over the years.
Table III-3: Historical Trend in Consumer wise Average Revenue Realization (w/o
subsidy) - Assam
Years 2005-06 2006-07 2007-08 2008-09 2009-10 2010-11 2011-12
Domestic 3.06 3.30 3.39 3.24 3.60 3.34 4.22
Agriculture 6.06 5.46 5.80 5.58 5.31 5.59 6.06
Commercial 4.12 4.44 5.71 3.81 3.45 3.55 4.06
Industrial HT 6.42 4.71 4.91 4.53 2.33 2.59 4.97
Industrial LT 1.25 3.80 6.84 3.05 3.00 3.06 3.82
Source: PFC
As shown in the table above, the average revenue realization declined in FY 10 due to
increased commercial losses reported in that year.

AF-MERCADOS EMI
Power Sector Operations and Impact on State Finances – Volume II 43
3. ASSESSMENT OF FINANCIAL PERFORMANCE OF –
DISTRIBUTION UTILITY
3.1. FINANCIAL HEALTH OF DISTRIBUTION UTILITIES
The distribution financial losses without subsides in Assam has increased substantially from
FY 10 to FY 12. The figure below depicts the year on year trend in the profit/ (loss) booked
by the state DISCOM
Figure III-6: Historical Trend in Financial Losses (w/o subsidy) - Assam
(79) (39) (64) (91)
(322)(446) (407)
(2,000)
(1,800)
(1,600)
(1,400)
(1,200)
(1,000)
(800)
(600)
(400)
(200)
-
2005
-06
2006
-07
2007
-08
2008
-09
2009
-10
2010
-11
2011
-12
Rs. C
r
Source: PFC
The loss levels increased significantly in FY 10, on account of increased AT&C losses
reported in that year. In addition, with the sharp increase in gas prices and inadequate
increase in consumer tariffs have resulted in increase in reported financial losses of the
distribution utility.
3.2. SUBSIDY BOOKED V/S SUBSIDY RECEIVED
In 2011-12, the subsidy contributed ~6% of the total revenues of the state distribution
utility. The distribution company booked subsidy for the first time in 2010-11, due to
increased power purchase costs. The figure below presents the year on year trend in
subsidies booked and received by the state DISCOM.
Figure III-7: Historical Trend in Subsidy Booked v/s Subsidy Received - Assam
252
150
50
150
250
350
450
2005
-06
2006
-07
2007
-08
2008
-09
2009
-10
2010
-11
2011
-12
Rs.
Cr
Years
Subsidy Booked Subsidy Received
0
Source: PFC
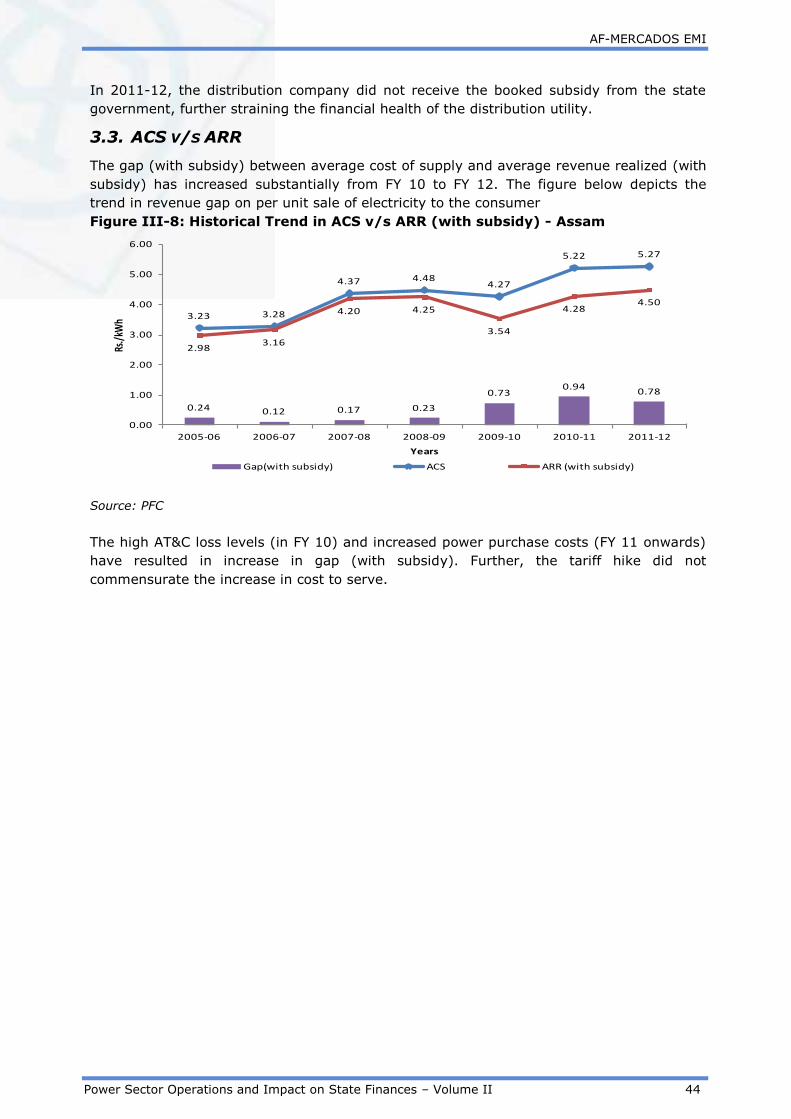
AF-MERCADOS EMI
Power Sector Operations and Impact on State Finances – Volume II 44
In 2011-12, the distribution company did not receive the booked subsidy from the state
government, further straining the financial health of the distribution utility.
3.3. ACS V/S ARR
The gap (with subsidy) between average cost of supply and average revenue realized (with
subsidy) has increased substantially from FY 10 to FY 12. The figure below depicts the
trend in revenue gap on per unit sale of electricity to the consumer
Figure III-8: Historical Trend in ACS v/s ARR (with subsidy) - Assam
0.24 0.12 0.17 0.23
0.730.94
0.78
3.23 3.28
4.37 4.484.27
5.22 5.27
2.983.16
4.20 4.25
3.54
4.284.50
0.00
1.00
2.00
3.00
4.00
5.00
6.00
2005-06 2006-07 2007-08 2008-09 2009-10 2010-11 2011-12
Rs./
kWh
Years
Gap(with subsidy) ACS ARR (with subsidy)
Source: PFC
The high AT&C loss levels (in FY 10) and increased power purchase costs (FY 11 onwards)
have resulted in increase in gap (with subsidy). Further, the tariff hike did not
commensurate the increase in cost to serve.

AF-MERCADOS EMI
Power Sector Operations and Impact on State Finances – Volume II 45
4. STATE EXPOSURE TO POWER SECTOR
4.1. INCOME FROM POWER SECTOR
The source of tax revenue is the electricity distribution tax, paid to the state government
by the distribution utilities. The tax revenue from the power sector formed ~0.3% of the
total tax revenue in the state. The details for the same are provided in the table below:
Table III-4: Tax Revenue from Power Sector - Assam
Revenue 2009-10 2010-11 2011-12
Rs Cr
Tax Revenue From Power Sector 27 42 37
Total Tax Revenue 10,326 13,898 16,922
Power sector Tax Revenue / Total
state Tax Revenue 0.26% 0.3% 0.22%
Source: Audited C&AG Accounts for the state 2011-12, 2010-11, 2009-10
The power sector has not generated any Non Tax Revenue since FY 10. The table below
highlights the same:
Table III-5: Non-Tax Revenue from Power Sector - Assam
Revenue 2009-10 2010-11 2011-12
Rs Cr
Non-Tax Revenue From Power
Sector 0 0 0
Total Non-Tax Revenue 2,753 2,373 2,867
Power sector Non-Tax Revenue
/Total state Non-Tax Revenue 0 0% 0.0%
Source: Audited C&AG Accounts for the state 2011-12, 2010-11, 2009-10
The overall income generated from the Power Sector has increased marginally over the
years. However, the contribution of Power Sector in overall State Revenues has been
approximately the same (~0.3%).
4.2. EXPENDITURE ON POWER SECTOR
The details of the expenditure made on the power sector by the state are provided in the
table below:

AF-MERCADOS EMI
Power Sector Operations and Impact on State Finances – Volume II 46
Table III-6: Expenditure on Power Sector- Assam
Categories 2009-10 2010-11 2011-12
Rs Cr
Capital Expenditure 181 174 117
Revenue Expenditure 12 29 102
Total Expenditure 192 202 219
Source: Audited C&AG Accounts for the state 2011-12, 2010-11, 2009-10
The capital expenditure has decreased in FY2011-12, primarily on account of decrease in
investments towards T&D whereas the revenue expenditure has substantially increased on
account of fresh expenditure against ASEB for debt services under RGGVY assistance of
REC and assistance to Assam Electricity Regulatory Commission. .
The expenditure on Power sector has been more than the Revenue generated from the
power sector over the years.
4.3. ANALYSIS ON STATE GUARANTEES AND SUBSIDIES
The table below depicts the guarantees given to power sector relative to the total revenues
of the state
Table III-7: Guarantees as a Percentage of Total Revenues - Assam
Parameter 2009-10 2010-11 2011-12
Rs Cr
Guarantees given by State Govt. 2 1 8
Total Revenues of the State 13,079 16,272 19,789
Guarantees as a %age of Total
Revenues of State 0.01% 0.01% 0.04%
Source: Audited C&AG Accounts for the state 2011-12, 2010-11, 2009-10
The state government guarantees towards power sector constituted a marginal share
(~0.01%) of the overall state revenues.
The sector did not receive any subsidy from state government.
4.4. POWER BONDS
8.5% Power Bonds of Assam were issued by State Government to be redeemed by 2016.
The outstanding balance as on 1st April 2007 was Rs 771.78 Cr. The total outstanding
balance at the end of 2011-12 was Rs 343.01 Cr. Rs (–) 85.75 Cr has been added every
year to the outstanding amount. The minus figure is due to transfer of amounts from
Market Loan bearing interest to not bearing interest on their maturity for repayment.
As per RBI ‘State Finance Report’ 2014, the outstanding liability of Power Bond as on 31st
March 2014 was Rs 170 Cr.

AF-MERCADOS EMI
Power Sector Operations and Impact on State Finances – Volume II 47
4.5. POWER SECTOR FINANCING REQUIREMENT RELATIVE TO STATE’S ECONOMY
In this section, the expenditure (under all possible heads) on the power sector by the state
government has been listed to determine the state Power sector financing requirement
which is then compared to state finances.
The sector financing requirement is estimated as the summation of total expenditure of the
state government on the sector including Capital and Revenue Expenditure, Loans and
Advances (Net Of Recoveries) and Public Debt repaid (Net of Receipts) by the State
Government.
Table III-8: Power Sector Financing (2011-12) - Assam
Particulars
2011-12
Rs. Cr
Power Sector Expenditure (Capital and Revenue) 219
Loans And Advances made by the State Government (Net of
Recoveries) 64
8.5% Tax Free Special Bonds of the State Government (Power
Bonds) disbursed during the year (Net of Receipts)* 0
Loans for Power Projects-T&D from the Central Govt. Discharged
during the year (Net of Receipts) 0
Total Power Sector Financing during the year 283
Sector Financing Requirement as a % age of total revenues of state 1.43%
GSDP nominal 80172
Sector Financing Requirement as a % age of GSDP 0.35%
Financial Profit/ (Losses) of DISCOM during the year (With Subsidy
realised) (557)
Sector Financing Requirement (including financial losses of DISCOM )
as a % age of total revenues of state 4%
Sector Financing Requirement (including financial losses of DISCOM )
as a % age of GSDP 1.05%
Source: State Government annual accounts from CAG, Data book for DCH - 22nd April, 2013, PFC Report on
Utility finances – 2011-12
The financing requirement for the Power sector in the state was estimated to be ~2% of
the revenue generated by the state and 0.48 % of the Gross State Domestic Product.
Considering, the financial losses of DISCOM in the year, the financing requirement of the
sector increases to 4% of the State revenue and 0.99% of the GSDP.

AF-MERCADOS EMI
Power Sector Operations and Impact on State Finances – Volume II 48
5. REGULATORY EFFECTIVENESS
Assam Electricity Regulatory Commission was established as a single member commission
on February, 2001 as per provisions of Electricity Regulatory Commission Act 1998.
The major functionality of the regulator were as follows:
To determine the Tariff for Electricity whole sale, Bulk, Grid or retail as the case may
be in the manner prescribed in the Act.
To determine the tariff payable for the use of the transmission facilities in the
manner prescribed in the Act.
To regulate power purchase and procurement process of the transmission utilities
including the prices at which power shall be procured from the generating
companies ,generating stations, or from other sources for transmission sale
distribution and supply in the state .
To promote competition efficiency and economy in the activities of electricity
industries to achieve the objects and purposes of the Act.
5.1. BUDGETING
The status of budgeting information is not available in public domain.
5.2. STAFFING
The status of staffing information is not available in public domain.
5.3. MYT REGULATION
The MYT has been implemented for the second control period (FY 14 to FY 16). The
commission had selected a first control period (three years). The Multi Year Tariff (MYT)
regime is benefit to consumers as well to the utilities, enabling them to plan for the long
term, without any apprehension of regulatory uncertainty.
5.4. TARIFF REVISION
The tariff revisions in the state have been regular, except in FY 09. The state commission
has not approved a sharp increase in tariff from FY 07 to FY 13. However, the tariff
increased by ~10% in FY 13.
The ineffective tariff revision in the state is one of the primary reasons for high level of gap
between cost of supply and revenue realization. The table below depicts the historical trend
in historical revision in the state.
Table III-9: Historical Trend in Tariff Revisions - Assam
FY 07 FY 08 FY 09 FY 10 FY 11 FY 12 FY 13
Average Tariff Revisions 3.30% 1.11% 0.00% 4.61% 2.71% 3.09% 10.13%
Source: Approved Tariff Orders of DISCOM for that year
5.5. LEVEL OF METERING
The state distribution utility has been able to attain 100% metering across the consumer
segments. Although, it is not known whether all the meters are effectively functioning and
recording the energy consumed. The commission has noted that the commercial losses
recorded in the state are mostly due to pilferage/electricity theft.

AF-MERCADOS EMI
Power Sector Operations and Impact on State Finances – Volume II 49
5.6. OPEN ACCESS
The State Load Dispatch Centre (SLDC) of Assam which was established in the year 1983.
SLDC, Assam is presently being operated by the state transmission utility of Assam i.e.
Assam Electricity Grid Corporation Ltd. (AEGCL). The SLDC is responsible to keep account
of the quantity of electricity transmitted through the state grid including the energy
exchanged through Power Exchange entities, and bi-lateral trading through Open Access
system. Open access regulations were issued by AERC on August 1 2005 as ‘Open Access
Regulations, 2005’. The present application status of open access consumers is not
available.
The regulator has had a positive impact on the operations of the distribution utilities, with
important provision of the Electricity Act, 2003 and National Tariff Policy enacted by the
state distribution utility like the MYT framework, 100% metering, regular tariff revision.
However, the impact of the above mentioned provisions were negated by sharp increase in
gas prices that has further increased the financial loss levels in the state. The state
distribution utility needs support from government subsidies to balance further increase in
power procurement costs.

AF-MERCADOS EMI
Power Sector Operations and Impact on State Finances – Volume II 50
6. SUMMARY
1. Re-bundling: The state distribution utility in the state were unbundled in 2004 into
three independent distribution utilities. However, lack of inter-utility coordination,
increased costs resulted in horizontal re-bundling of the distribution utility into
APDCL in 2009.
2. Increased Power Purchase Costs: The gas based install capacity contributes
maximum to the capacity addition in the state of Assam. The financial health of the
distribution utility was adversely affected with the increase in APM gas price in FY
2010-11. The power purchase costs are further going to increase with the
implementation of Rangarajan’s Committee report on domestic gas pricing.
3. Level of Metering: The state distribution utility has been able to implement 100%
metering across consumer categories. Although, the pilferage/electricity theft due to
defective meters is a cause for concern.
4. Financial Losses: The financial losses in the state has increased from FY 10, on
account of high AT&C losses and increased power purchase costs. The distribution
utility has not received subsidies from the state government to cover the financial,
further increasing the losses by the state distribution utility.
The current financial position of the power sector poses a moderate risk on the
state finances. However, with the proposed increase in domestic gas price along
with lack of subsidy realization from the state government can increase the risk
of power sector on the state finances.

AF-MERCADOS EMI
Power Sector Operations and Impact on State Finances 51
IV BIHAR
1. INTRODUCTION
1.1. BACKGROUND – POWER SECTOR OVERVIEW
Bihar is the 12th largest state in terms of geographical size at 94,163 km² (2.86 percent of
the India’s total area) and third largest by population (population density of Bihar is 1102
per sq. km, population of Bihar accounts for 8.58 percent of the total population of India).
Close to 85 percent of the population lives in villages2.
The economy of Bihar has been showing a steady growth trend. In recent years, not only
the pace of growth has been accelerated, it has become more inclusive in nature. With the
bifurcation of state in November 2000, newly created Jharkhand state took away the
mineral rich part of the state and the present Bihar was left with its agro-based economy.
Bihar GDP has grown at a CAGR of 18.8% in last nine years i.e. FY 2004-05 to FY 2012-13.
With the increasing growth in Bihar the energy demand has also increased at a CAGR of
10% for the same period. In 2012-13, out of the total investments in Bihar, 70% were in
power sector.
The power sector in Bihar was controlled by the Energy Department, Government of Bihar.
The Bihar State Electricity Board (BSEB) was constituted under section 5 of Electricity
(Supply) Act, 1948 on 1st April, 1958. It was deemed licensee in terms of Section 14 of
the Electricity Act, 2003. Bihar State Electricity Board was engaged in the business of
generation, transmission and distribution of electricity in the State of Bihar. However, BSEB
was restructured on functional basis with effect from 1st November, 2012 into five
successor companies under Bihar State Electricity Reforms Transfer Scheme 2012 issued
by Energy Department, Government of Bihar, namely,
Bihar State Power Holding Company Limited (BSPHCL)
Bihar State Power Generation Company Limited (BSPGCL)
Bihar State Power Transmission Company Limited (BSPTCL)
North Bihar Power Distribution Company Limited (NBPDCL) and
South Bihar Power Distribution Company Limited (SBPDCL)
Bihar State Electricity Regulatory Commission (BERC) was constituted in May 2005 and the
first tariff order was issued in FY 2006-07. The state’s financial performance of power
sector is dismal.
1.2. GENERATION MIX
The total installed capacity as on February 2014 (including allocated share in Joint &
Central Sector plants) for Bihar was 2198 MW. It has grown by 19% from Feb 2013
level of 1,849 MW . Out of total capacity as on Feb 2014, coal based power capacity
accounted for ~89% followed by Hydro (~6% ) and Renewable (~5%).
Figure below presents the generation capacity including allocated share in Joint & Central
sector plants.
2 IBEF

AF-MERCADOS EMI
Power Sector Operations and Impact on State Finances 52
Figure IV-1: Generation Capacity Mix as on Feb 2014- Bihar
Source: CEA
1.3. POWER SUPPLY POSITION
Bihar has been facing significant peak and energy deficit over past several years. The
energy deficit has remained in the range of 9% - 22%, given the increase in load growth
and inadequate capacity addition. However, in FY 2013-14 the energy deficit has reduced
to 4%, due to increase in generation capacity by 19%.
The peak deficit in Bihar have remained in the range of 17% -34% till FY 2012-13, and
peak deficit in FY 2013-14 has reduced to 6%.
The trend of energy and peak deficit observed in Bihar over the years is presented in the
figure below:
Figure IV-2: Energy Deficit – Bihar
Source: CEA

AF-MERCADOS EMI
Power Sector Operations and Impact on State Finances 53
Figure IV-3: Peak Deficit – Bihar
Source: CEA
Large area of the State is still un-electrified and there is no access. As the rural
electrification program is underway, these groups of consumers will be added to the
network and are expected to increase the energy demand.
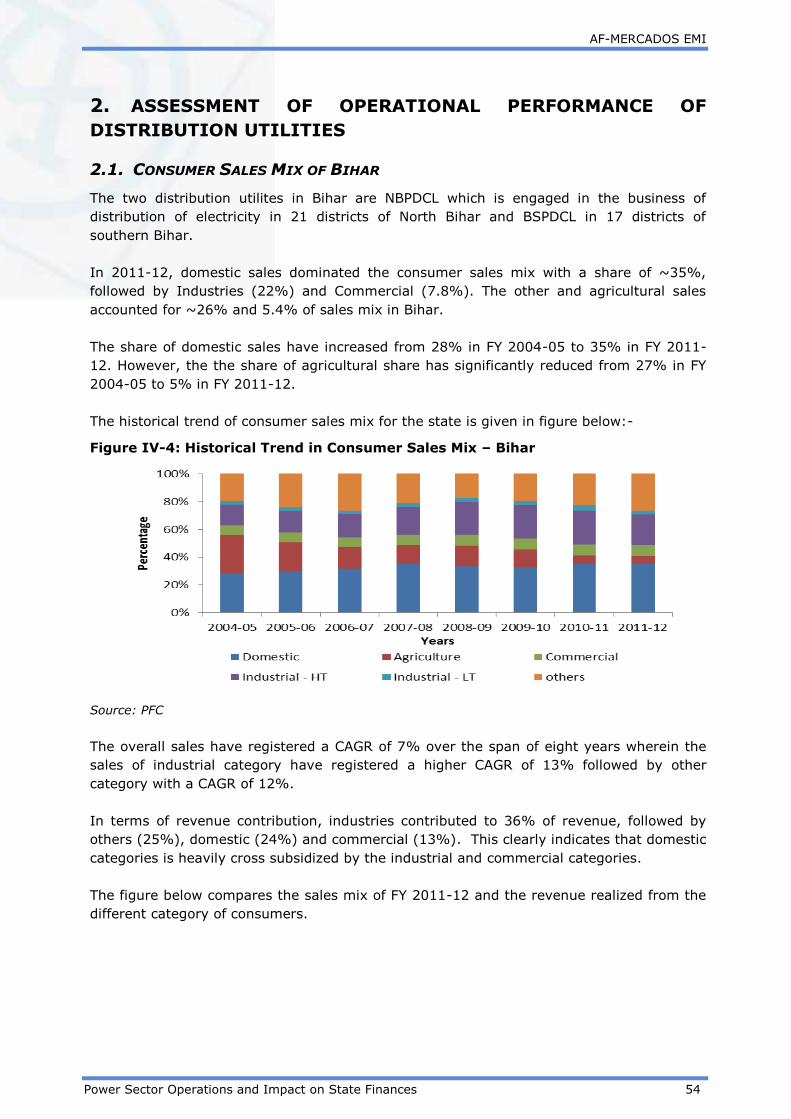
AF-MERCADOS EMI
Power Sector Operations and Impact on State Finances 54
2. ASSESSMENT OF OPERATIONAL PERFORMANCE OF
DISTRIBUTION UTILITIES
2.1. CONSUMER SALES MIX OF BIHAR
The two distribution utilites in Bihar are NBPDCL which is engaged in the business of
distribution of electricity in 21 districts of North Bihar and BSPDCL in 17 districts of
southern Bihar.
In 2011-12, domestic sales dominated the consumer sales mix with a share of ~35%,
followed by Industries (22%) and Commercial (7.8%). The other and agricultural sales
accounted for ~26% and 5.4% of sales mix in Bihar.
The share of domestic sales have increased from 28% in FY 2004-05 to 35% in FY 2011-
12. However, the the share of agricultural share has significantly reduced from 27% in FY
2004-05 to 5% in FY 2011-12.
The historical trend of consumer sales mix for the state is given in figure below:-
Figure IV-4: Historical Trend in Consumer Sales Mix – Bihar
Source: PFC
The overall sales have registered a CAGR of 7% over the span of eight years wherein the
sales of industrial category have registered a higher CAGR of 13% followed by other
category with a CAGR of 12%.
In terms of revenue contribution, industries contributed to 36% of revenue, followed by
others (25%), domestic (24%) and commercial (13%). This clearly indicates that domestic
categories is heavily cross subsidized by the industrial and commercial categories.
The figure below compares the sales mix of FY 2011-12 and the revenue realized from the
different category of consumers.

AF-MERCADOS EMI
Power Sector Operations and Impact on State Finances 55
Figure IV-5: Comparative Analysis of Consumer Sales and Revenue Mix 2011-12 -
Bihar
Source: PFC
2.2. TRENDS IN COMMERCIAL & TECHNICAL LOSSES
The Aggregated Technical & Commercial (AT&C) losses for Bihar distribution utilities are
among the highest in India i.e. ~64% in FY 12. The AT&C losses in Bihar have remained
high over the years, it accounted for 83% in FY 05. In FY 09, the losses reported were
lowest, due to the realization of past arrears, which led to increase in collection efficiency.
The trends of collection efficiency in the state have remained dismal over the years.
Table IV-1: Year on Year Trend in AT&C losses and Collection Efficiency – Bihar
Year FY
05 FY 06 FY 07 FY 08 FY 09 FY 10 FY 11 FY 12
AT&C Losses
(%) 83% 83.7% 44.0% 44.5% 34.4% 43.9% 47.4% 64.5%
Collection
Efficiency 28% 29% 104% 91% 109% 94% 96% 69%
Source: PFC
The high AT&C losses in the state are due to high unmetered domestic consumers,
primarily by Kutir Jyoti and Below Poverty Line consumers. Apart from this categories,
which accounts for unmetered sales are irrigation, street lighting, and agriculture. The loss
reduction activities are capital intensive as the network of the state is in dilapidated
condition, which is one of the reasons of high AT&C losses in the state. In addition, various
consumer center activities like improvement in metering, billing, collection, and vigilance
needs improvement to reduce commercial losses.
However, going forward, the State Electricity Regulatory Commission has set the reduction
targets for Transmission and Distribution (T&D) losses, which is 28.5% in FY 2015-16. To
achieve, this distribution utilities have planned to invest close to Rs 20,000 crore in
distribution assets by 2015-16 to achieve the loss trajectory. Post unbundling the
status of metering has improved. In SBPDCL, 94% of the consumers are metered
and 77% in NBPDCL. Considering lack of manpower and investment constraints, task of
meter reading, billing and collection has been outsourced to private agencies. Outsourcing
has been undertaken up-to section level with adequate empowerment so that efficiency
can be improved through quick decision making.

AF-MERCADOS EMI
Power Sector Operations and Impact on State Finances 56
2.3. TRENDS IN DISTRIBUTION COST
The power purchase cost in Bihar accounts for ~60% of the total distribution cost.
However, the interest cost in the state is quite high and accounts for about ~20 - 25% of
the total distribution cost. This is due to the increasing large scale capital investments,
which is necessary to sustain the network and to supply power and also due to huge
financial losses of the distribution utility.
The per unit cost, break-up for different cost components for the state of Bihar is provided
in the table below:-
Table IV-2: Year on Year Trend Distribution Cost Breakup – Bihar
Cost Component
(Rs. per kWh) FY 05 FY 06 FY 07 FY 08 FY 09 FY 10 FY 11 FY 12
Power Purchase
Cost 1.75 1.79 1.82 2.17 2.33 2.72 3.38 4.03
O&M (R&M + A&G +
EC) 0.55 0.51 0.73 0.81 0.85 0.70 0.70 0.97
Interest 0.80 0.83 0.99 1.10 1.08 1.06 1.20 1.33
Depreciation 0.18 0.16 0.07 0.07 0.07 0.06 0.09 0.11
Other cost 0.52 0.50 0.01 0.05 0.03 0.08 0.07 0.26
Source: PFC
The power purchase cost in the last three years of assessment i.e. from FY 10 - to FY 12
has increased substantially; one of the reasons is high T&D losses in the state and hence,
state has to purchase more quantum of power. In 2011-12, the increase in the power
purchase cost was because of one time charges (arrears) charged by the Central
Generating Stations.
Given the huge capital investment in the future to improve the T&D system in the state,
the interest cost would further increase, however, the state has also opt for the financial
restricting plan (FRP) of central government and may improve the interest burden of the
state. The same has been discussed in the FRP chapter.
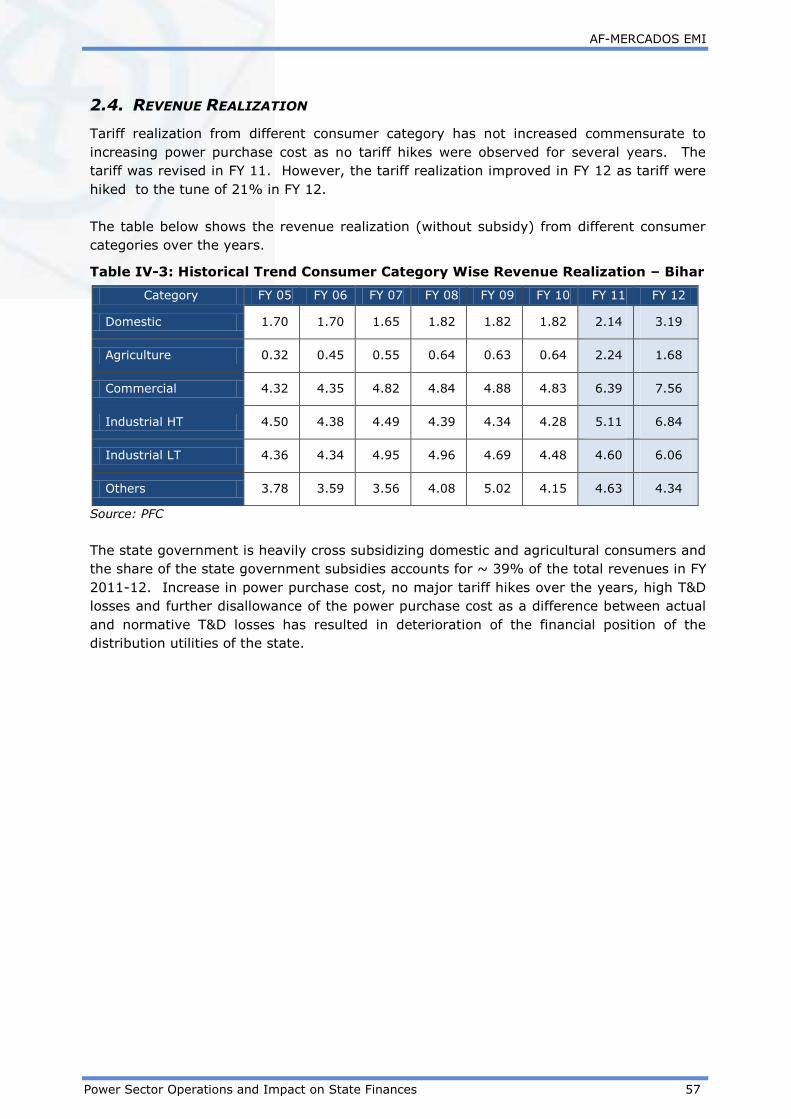
AF-MERCADOS EMI
Power Sector Operations and Impact on State Finances 57
2.4. REVENUE REALIZATION
Tariff realization from different consumer category has not increased commensurate to
increasing power purchase cost as no tariff hikes were observed for several years. The
tariff was revised in FY 11. However, the tariff realization improved in FY 12 as tariff were
hiked to the tune of 21% in FY 12.
The table below shows the revenue realization (without subsidy) from different consumer
categories over the years.
Table IV-3: Historical Trend Consumer Category Wise Revenue Realization – Bihar
Category FY 05 FY 06 FY 07 FY 08 FY 09 FY 10 FY 11 FY 12
Domestic 1.70 1.70 1.65 1.82 1.82 1.82 2.14 3.19
Agriculture 0.32 0.45 0.55 0.64 0.63 0.64 2.24 1.68
Commercial 4.32 4.35 4.82 4.84 4.88 4.83 6.39 7.56
Industrial HT 4.50 4.38 4.49 4.39 4.34 4.28 5.11 6.84
Industrial LT 4.36 4.34 4.95 4.96 4.69 4.48 4.60 6.06
Others 3.78 3.59 3.56 4.08 5.02 4.15 4.63 4.34
Source: PFC
The state government is heavily cross subsidizing domestic and agricultural consumers and
the share of the state government subsidies accounts for ~ 39% of the total revenues in FY
2011-12. Increase in power purchase cost, no major tariff hikes over the years, high T&D
losses and further disallowance of the power purchase cost as a difference between actual
and normative T&D losses has resulted in deterioration of the financial position of the
distribution utilities of the state.

AF-MERCADOS EMI
Power Sector Operations and Impact on State Finances 58
3. ASSESSMENT OF FINANCIAL PERFORMANCE OF –
DISTRIBUTION UTILITY
3.1. FINANCIAL HEALTH OF DISTRIBUTION UTILITIES
The distribution financial losses without subsides in Bihar has been increasing over the
years. The reasons for the same is disallowance of power purchase cost due to difference
in actual T&D and normative T&D losses; increasing power purchase cost; and inadequate
tariff revisions over the years.
Figure IV-8: Historical Trend Financial Losses (w/o) subsidies – Bihar
Source: PFC
3.2. SUBSIDY BOOKED V/S SUBSIDY RECEIVED
The subsidy burden of the State Government in 2011-12, was 39% of the total revenues,
and was 33% in FY 2004-05. The subsidy burden of the state has remained high over the
span of eight years. The figure below provides the subsidy booked v/s subsidy received for
the distribution utilities in the state
Figure IV-9: Historical Trend Subsides Booked v/s Subsidies Received – Bihar
Source: PFC
As shown in the graph above, the amount of subsidies booked by the state has increased
significantly from FY 05 to FY 12. The subsidy in Bihar is provided for subsidizing the tariff
for domestic category and BPL consumers and also towards cost of capital assets, loss due
to floods and cyclones which are frequent in the state.
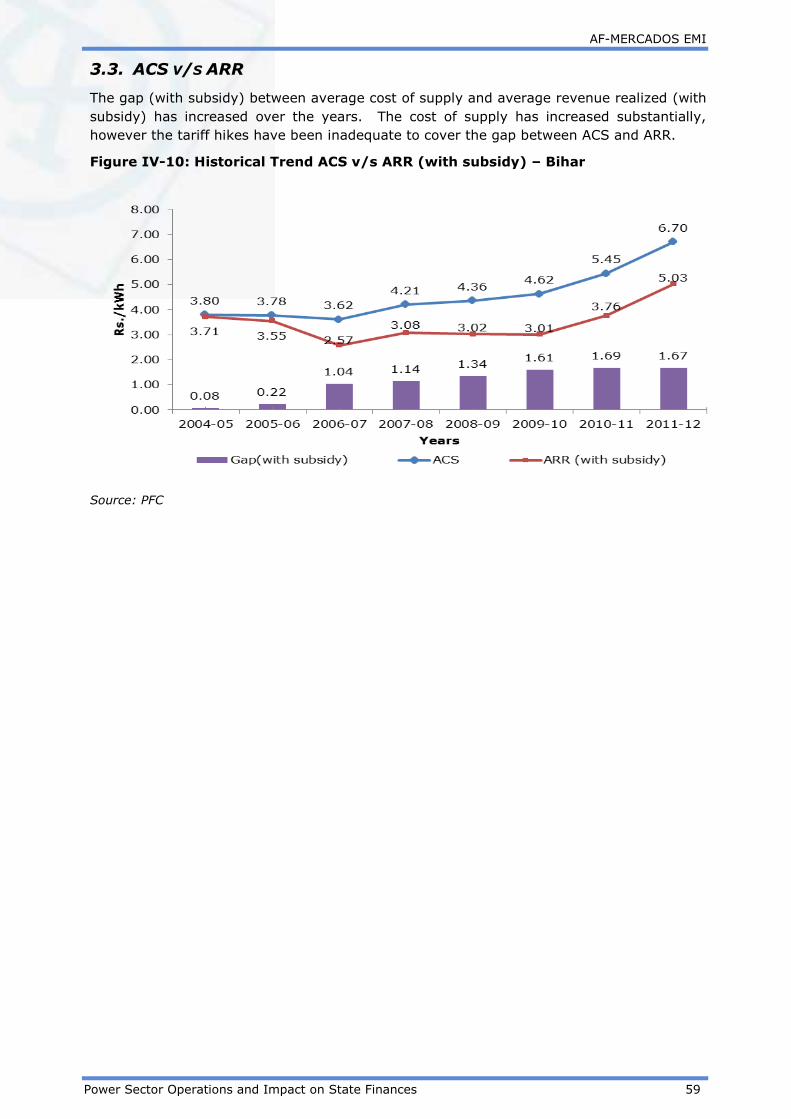
AF-MERCADOS EMI
Power Sector Operations and Impact on State Finances 59
3.3. ACS V/S ARR
The gap (with subsidy) between average cost of supply and average revenue realized (with
subsidy) has increased over the years. The cost of supply has increased substantially,
however the tariff hikes have been inadequate to cover the gap between ACS and ARR.
Figure IV-10: Historical Trend ACS v/s ARR (with subsidy) – Bihar
Source: PFC

AF-MERCADOS EMI
Power Sector Operations and Impact on State Finances 60
4. STATE EXPOSURE TO POWER SECTOR
4.1. INCOME FROM POWER SECTOR
The tax revenue from the power sector forms less than 1% of the total tax revenue of the
state government. The tax income is majorly through electricity distribution tax, which is
paid by the distribution utilities to the state government. The details for the same are
provided in the table below.
Table IV-4: Tax Revenue from Power Sector– Bihar
Revenue 2009-10 2010-11 2011-12
Rs Cr
Tax Revenue from Power Sector 67 65 55
Total Tax Revenue 26,292 33,848 40,547
Power sector Tax Revenue / Total
state Tax Revenue 0.25% 0.19% 0.13%
Source: CAG Audited Accounts for the state – 2011-12, 2010-11, 2009-10
The power sector has not generated any Non Tax Revenue over the years.
As evident, the overall revenue from power sector in the state has decreased has
decreased marginally over the years.
4.2. EXPENDITURE ON POWER SECTOR
The table below depicts the expenditure on power sector made by the state government.
Table IV-5: Expenditure on Power Sector– Bihar
Categories 2009-10 2010-11 2011-12
Rs Cr
Capital expenditure 376 1,007 102
Revenue Expenditure 868 1,216 2,168
Total Power Sector Expenditure 1,244 2,223 2,270
Source: CAG Audited Accounts for the state – 2011-12, 2010-11, 2009-10
The overall expenditure on power sector has increased over the years. The capital
expenditure on Power Sector is towards Rashtriya Sam Vikas Yojna and the
variation is subject to the annual expenditure outlay planned under the scheme.
The Revenue expenditure has increased primarily on account of assistance to
public sector and other undertakings.
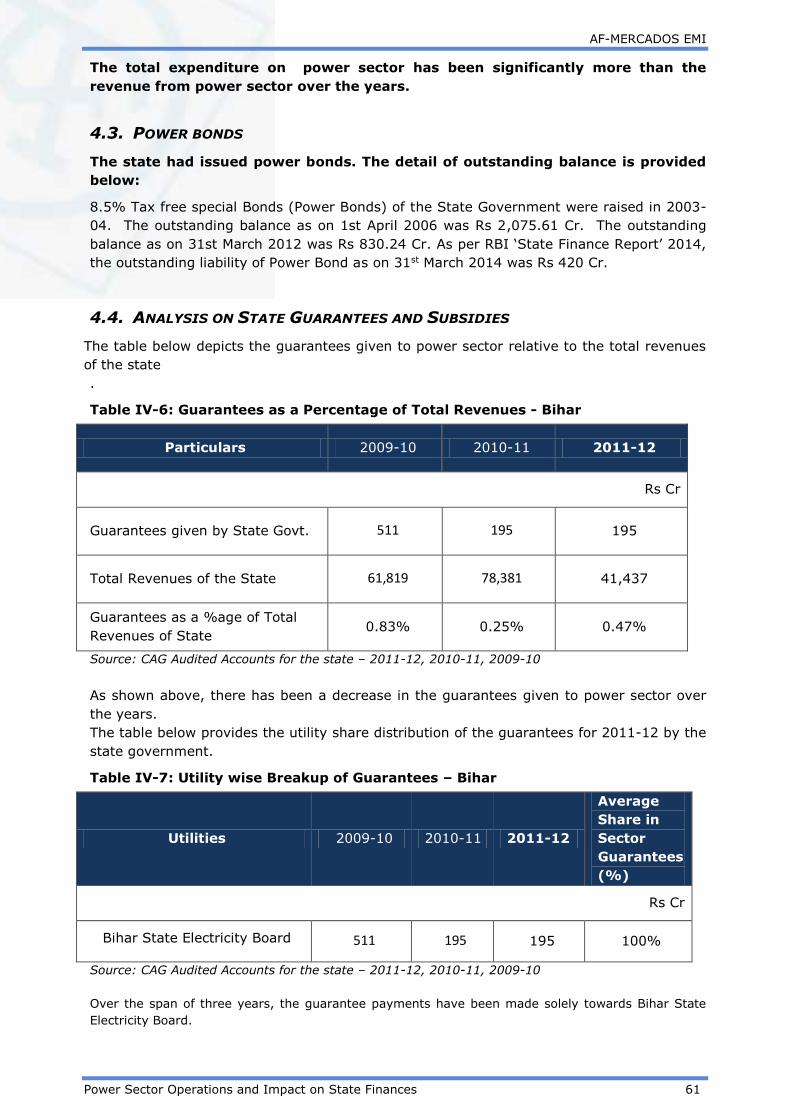
AF-MERCADOS EMI
Power Sector Operations and Impact on State Finances 61
The total expenditure on power sector has been significantly more than the
revenue from power sector over the years.
4.3. POWER BONDS
The state had issued power bonds. The detail of outstanding balance is provided
below:
8.5% Tax free special Bonds (Power Bonds) of the State Government were raised in 2003-
04. The outstanding balance as on 1st April 2006 was Rs 2,075.61 Cr. The outstanding
balance as on 31st March 2012 was Rs 830.24 Cr. As per RBI ‘State Finance Report’ 2014,
the outstanding liability of Power Bond as on 31st March 2014 was Rs 420 Cr.
4.4. ANALYSIS ON STATE GUARANTEES AND SUBSIDIES
The table below depicts the guarantees given to power sector relative to the total revenues
of the state
.
Table IV-6: Guarantees as a Percentage of Total Revenues - Bihar
Particulars 2009-10 2010-11 2011-12
Rs Cr
Guarantees given by State Govt. 511 195 195
Total Revenues of the State 61,819 78,381 41,437
Guarantees as a %age of Total
Revenues of State 0.83% 0.25% 0.47%
Source: CAG Audited Accounts for the state – 2011-12, 2010-11, 2009-10
As shown above, there has been a decrease in the guarantees given to power sector over
the years.
The table below provides the utility share distribution of the guarantees for 2011-12 by the
state government.
Table IV-7: Utility wise Breakup of Guarantees – Bihar
Utilities 2009-10 2010-11 2011-12
Average
Share in
Sector
Guarantees
(%)
Rs Cr
Bihar State Electricity Board 511 195 195 100%
Source: CAG Audited Accounts for the state – 2011-12, 2010-11, 2009-10
Over the span of three years, the guarantee payments have been made solely towards Bihar State
Electricity Board.

AF-MERCADOS EMI
Power Sector Operations and Impact on State Finances 62
Subsidy
The table below depicts the share of utilities in subsidies given to Power sector and share of
sector in total state subsidy.
Table IV-8: Utility wise Breakup of Guarantees – Bihar
Particulars 2009-10 2010-11 2011-12
Average Share
in Sector
Subsidy %
Rs Cr
Resource Gap of State
Electricity Board 840 1,080 2,133 100%
Power Sector subsidy
(% of total subsidy) 840 1,080 2,133 82%
Source: CAG Audited Accounts for the state – 2011-12, 2010-11, 2009-10
The increasing Subsidy payments given to Power Sector have been towards resource gap
of State Electricity Board. The three year aggregate proportion of subsidy payments made
towards Power Sector forms a significant 82%the Total Subsidy payments in the state.
4.5. POWER SECTOR FINANCING REQUIREMENT RELATIVE TO STATE ECONOMY
In this section, the expenditure (under all possible heads) on the power sector by the state
government has been listed to determine the state Power sector financing requirement
which is then compared to state finances.
The sector financing requirement is calculated by a summation of the total Expenditure of
the state government on the sector including Capital and Revenue expenditure, Loans and
Advances (Net Of Recoveries) and Public Debt repaid(Net of Receipts) by the State
Government.
Table IV-9: Financing Requirement of Power Sector (2011-12) – Bihar
Particulars 2011-12
Rs. Cr.
Power Sector Expenditure (Capital and Revenue) 2,270
Loans And Advances made by the State Government (Net of
Recoveries)
926
8.5% Tax Free Special Bonds of the State Government (Power
Bonds) disbursed during the year (Net of Receipts)
208
Loans for Power Projects-T&D from the Central Govt.
Discharged during the year (Net of Receipts)
0.004
Total Power Sector Financing during the year 3,404
Sector Financing Requirement as a % age of total revenues of
state
8%
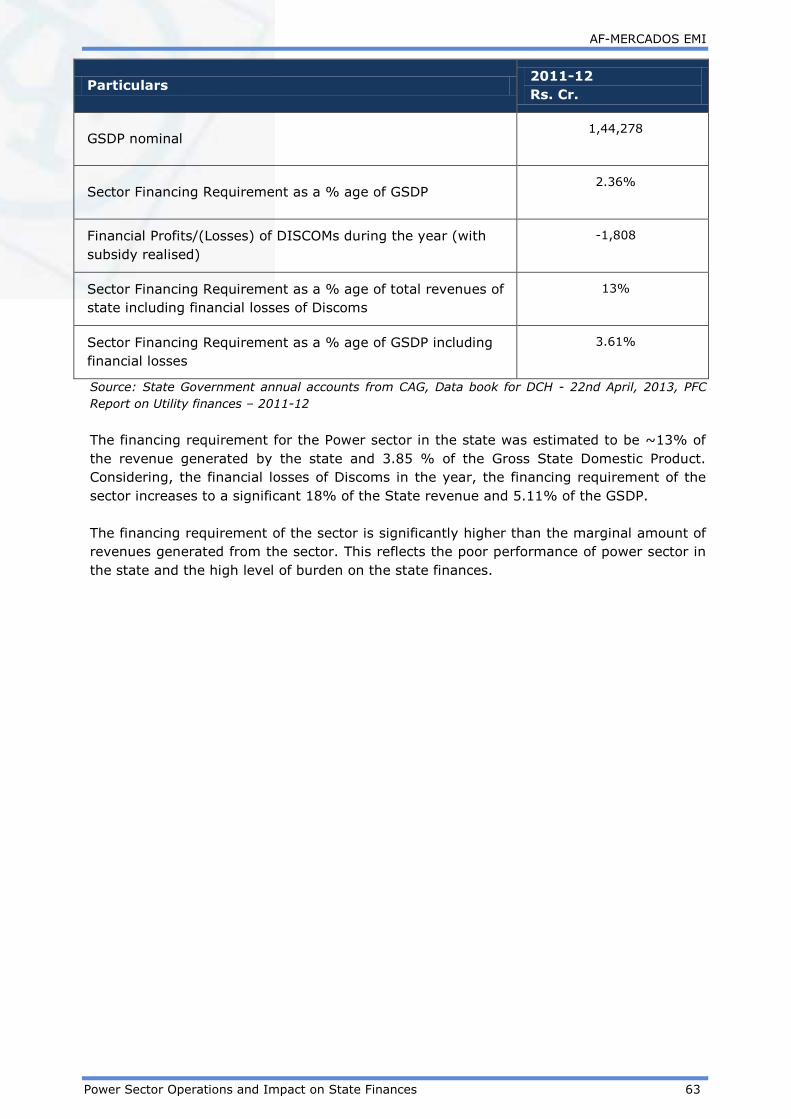
AF-MERCADOS EMI
Power Sector Operations and Impact on State Finances 63
Particulars 2011-12
Rs. Cr.
GSDP nominal 1,44,278
Sector Financing Requirement as a % age of GSDP 2.36%
Financial Profits/(Losses) of DISCOMs during the year (with
subsidy realised)
-1,808
Sector Financing Requirement as a % age of total revenues of
state including financial losses of Discoms
13%
Sector Financing Requirement as a % age of GSDP including
financial losses
3.61%
Source: State Government annual accounts from CAG, Data book for DCH - 22nd April, 2013, PFC
Report on Utility finances – 2011-12
The financing requirement for the Power sector in the state was estimated to be ~13% of
the revenue generated by the state and 3.85 % of the Gross State Domestic Product.
Considering, the financial losses of Discoms in the year, the financing requirement of the
sector increases to a significant 18% of the State revenue and 5.11% of the GSDP.
The financing requirement of the sector is significantly higher than the marginal amount of
revenues generated from the sector. This reflects the poor performance of power sector in
the state and the high level of burden on the state finances.

AF-MERCADOS EMI
Power Sector Operations and Impact on State Finances 64
5. FINANCIAL RESTRUCTURING PLAN
Increase in power purchase costs, inadequate tariff hikes, almost free supply of electricity
to the agricultural sector and low subsidy realization from the state government has
deteriorated the financial position of the utilities in the state. In this context, distribution
utilities of Bihar adopted the FRP of the central government. The status and likely outlook
of FRP in the state is discussed in the section below.
5.1. STATUS OF FINANCIAL RESTRUCTURING PLAN
Given below is the status of the implementation of financial restructuring plan (FRP) in the
state.
Table IV-10: Status of FRP in Bihar
Particulars Bihar
Accumulated Losses as on
31.3.2012
-
STL (eligible under the scheme) 1782 Cr
Bonds issued by Discoms to
participating lenders
817 Cr - issued
Tariff petition for 2014-15 ARR filed
Operational losses to be funded
(2013-14)
2630 Cr
Road-Map for private
participation in distribution
Started in some districts
Status of liquidation of regulatory
assets
Being examined
Status of preparation of time
bound plan for metering of all
category of consumers
Being Prepared
Status of enactment of State
Electricity Distribution
Responsibility Bill
Under Progress
Source: Ministry of Power

AF-MERCADOS EMI
Power Sector Operations and Impact on State Finances 65
5.2. FRP OUTLOOK
In this section, key parameters for the state have been looked at in order to comment on
the likeliness of the state to meet the mandatory conditions set forth by the FRP and be
eligible for the central grants incentive scheme.
The color scheme used in the table depicting state parameters refers to the color key
provided here -
Area of concern
Can be better
Good
BSEB reported a financial loss (without subsidy) of Rs.3928 Cr. in 2011-12, translating into
a financial gap of Rs.3.64/kWh.
As per the FRP scheme, the Bihar government would take over Rs. 818 cr. (50% of STL) by
issue of bonds by the Discoms backed by Government guarantee to participating lenders.
The scheme would permit the Discoms to restructure the remaining 50% of STL backed by
government guarantee, with a negotiated moratorium period. The bonds worth Rs 818 Cr.
would be repaid with an interest rate of 10.2% per annum payable semi-annually. The first
interest payment is due on 13th Sept. 2014, which is after 6 months of the allocation. While,
the principle repayment will be due after the moratorium period of three years.
Some of the key parameters relevant to FRP implementation have been shown in the table
below for Bihar.
Table IV-11: Historical Parameters - Bihar
Key Parameters 2005-
06
2006-
07
2007-
08
2008-
09
2009-
10
2010-
11
2011-
12
2012-
13
2013-
14
AT&C losses 84% 44% 47% 34% 44% 47% 65% n.a n.a
Tariff Hikes 0% 10% - 3% - 0% 21% 11% 6%
Subsidy
Received/Booked 42% 100% 100% 100% 100% 100% 100% n.a n.a
Interest Cost/Total
Cost 22% 27% 26% 25% 23% 23% 20% n.a n.a
ACS-ARR Gap w/o
subsidy – Rs./kWh 1.34 1.92 2.09 2.21 2.52 2.81 3.64 n.a n.a
Source: PFC report on utility finances and Discom ARRs
Some of the key observations from the above table, along with relevant state-level aspects
are listed below.
- In the state of Bihar, the past record in AT&C losses has been one of the poorest in
the country. While the technical and commercial losses have actually gone up in the
past due to ageing transmission infrastructure and power thefts, a 3% annual
reduction will now be required for Bihar to benefit from central grants support
scheme.

AF-MERCADOS EMI
Power Sector Operations and Impact on State Finances 66
- Even on the revenue front, Bihar has performed poorly. The tariff hikes have been
insufficient and irregular over the last few years. On the other hand, subsidy
received-booked ratios have continued to stay at 100%, which is a positive sign.
- The share of Interest expenses has been over 20% for the last few years. With the
moratorium on principal repayments on 50% STL, the liquidity situation is expected
to improve in the near term, which is especially important considering the working
capital stress in the system.
- The ACS-ARR Gap needs to be reduced by 25% of the 2010-11 benchmark level (Rs.
2.81/kWh) every year in order to avail the central grants incentive scheme. The Gap
will need to be reduced to 54 paise/unit by 2014-15. This will be possible only with
even higher tariff hikes as subsidy transparency requirements will limit subsidy
support levels. This is an area of concern, especially when the Gap has actually
increased considerably in 2011-12.
Like Jharkhand, frequent and substantial tariff revisions coupled with consistent reduction in
AT&C losses is possibly the only way for Bihar to benefit from the FRP scheme and improve
its financial health, both in short and long term.

AF-MERCADOS EMI
Power Sector Operations and Impact on State Finances 67
6. ASSESSMENT OF REGULATORY EFFECTIVENESS
Bihar State Electricity Regulatory Commission (BERC) was constituted by the Government
of Bihar under Section17 of the Electricity Regulatory Commission Act, 1998 vide
Government of Bihar notification No.1284 dated 15th April 2002. The BERC was constituted
in May 2005. The first tariff order issued by BERC was for the FY 2006-07.
Some of the key aspects have been discussed below: -
6.1. STATUS OF IMPORTANT REGULATIONS
The regulator has notified Open Access regulation which was issued in 2006. BSERC has
introduced Multi-Year-Tariff framework and have notified Terms and Conditions for
Determination of Tariff in 2010. BSERC have also notified the MYT regulations in March
2013 and the first control period is effective from FY 2012-13 to FY 2014-15.
6.2. FREQUENCY OF TARIFF REVISIONS
The tariff revisions were done in FY 2010-11 after several years wherein tariffs were hiked
substantially i.e. 21% in FY 12. Thereafter commission has approved a tariff hike in FY
2013 by 11%. The table below provides the details of tariff revision in the state.
Table IV-12: Historical Trend in Tariff Revisions – Bihar
FY
05
FY 06 FY 07 FY
08
FY
09
FY
10
FY 11 FY
12
FY
13
FY 14
Average
Tariff
Revisions
0% 0% 0% 0% 0% 0% Yes 21% 11% 6%
The commissions to avoid sudden tariff shocks for the consumers have been approving
revenue gap of the utilities as a regulatory assets. IN 2013-14, the commission approved
regulatory asset of Rs 494 Cr.

AF-MERCADOS EMI
Power Sector Operations and Impact on State Finances 68
7. SUMMARY
The key aspects of the state are discussed below;-
1. Inadequate Tariff Revisions: The tariff revisions in the state have been
inadequate. No tariff hikes were observed for several years, and tariffs were
increased post FY 11, wherein the tariffs were hiked by 21% in FY 12 and 11% in FY
13, which were not commensurate with increasing power purchase cost.
2. Subsidy: The subsidy burden of the state has remained high to the tune of 39% of
total revenues in 2011-12 and this was 33% in 2004-05. The dependence on such
high levels of subsidies is unsustainable for the sector. The trend in subsidy pay-
out with respect to subsidy booked has been 100% post FY 2006.
3. High Technical and Commercial Losses : The Aggregated Technical & Commercial
losses (AT&C) for Bihar distribution utilities are among the highest in India i.e.
~64% in FY 12. However, going forward, the State Electricity Regulatory
Commission has set the reduction targets for Transmission and Distribution (T&D)
losses, which is 28.5% in FY 2015-16. To achieve, this distribution utilities have
planned to invest close to Rs 20,000 crore in distribution assets by 2015-16 to
achieve the loss trajectory.
4. Financial Losses: The distribution financial losses without subsides in Bihar has
increased over the years due to inadequate tariff revisions and high T&D losses.
The regulator has disallowed difference in power purchase cost due to difference is
actual and normative T&D losses and thus this has resulted in disadvantageous for
distribution utilities.
5. FRP: The state has opted for the FRP scheme, under the scheme the bonds to the
tune of INR 817 Cr has been issued. The key area of concerns for the state for
successful implementation of FRP is its high subsidy burden and inadequate tariff
revisions, which have led to huge ACS-ARR gap that need to be reduced
significantly to 25%.
6. Exposure to the State Gov. to power sector: The financing requirement for the
Power sector in the state was estimated to be ~13% of the revenue generated by
the state and 3.85 % of the Gross State Domestic Product. Considering, the
financial losses of Discoms in the year, the financing requirement of the sector
increases to a significant 18% of the State revenue and 5.11% of the GSDP.

AF-MERCADOS EMI
Power Sector Operations and Impact on State Finances 69
V CHHATTISGARH
1. INTRODUCTION
1.1. BACKGROUND – POWER SECTOR OVERVIEW
Chhattisgarh as a state was carved out of Madhya Pradesh on 1st November 2000.
Chhattisgarh State Electricity Board (CSEB) was formed in 2000 in accordance with the
Section 5 of the Electricity Supply Act 1948. The Chhattisgarh State Load Dispatch Centre
(CSLDC) was also established in the same year. Chhattisgarh State Electricity Board was
unbundled to form five companies in accordance with the provisions of Electricity Act 2003
by the Govt. of Chhattisgarh on 19.12.2008 with the issuance of the CSEB Transfer Scheme
Rules, 2008. The companies came in existence w.e.f. 01.01.2009. The five companies
recognized out of CSEB were:
Chhattisgarh State Power Holding Company Limited (CSPHCL)
Chhattisgarh State Power Generation Company Limited (CSPGCL)
Chhattisgarh State Power Transmission Company Limited (CSPTCL)
Chhattisgarh State Power Distribution Company Limited (CSPDCL)
Chhattisgarh State Power Trading Company Limited
1.2. GENERATION MIX
The total installed capacity as on February 2014 (including allocated share in Joint &
Central Sector plants) for Chhattisgarh was 7494.91 MW. There was a 15% increase in the
generation capacity from February 2013. Out of total capacity as on Feb 2014, coal based
power capacity accounted for ~94% followed by RES (~4%).
Figure below highlights the generation capacity including allocated share in Joint & Central
sector plants.
Figure V-1: Generation Capacity Mix as on Feb 2014- Chhattisgarh
Source: CEA
1.3. POWER SUPPLY POSITION
The energy and peak deficit in the state of Chhattisgarh has been reduced significantly in FY
14. The energy deficit reduced from ~6% in FY 07 to ~1 % in FY 14. Simultaneously, the
peak deficit reduced from ~28% in FY 07 to ~1% in FY 14.

AF-MERCADOS EMI
Power Sector Operations and Impact on State Finances 70
The state has been investing in augmentation of the generation capacity. Apart from the
sourcing power from CSPGCL, the state also purchases from Central Generating Stations
and Renewable sources.
The trend of energy and peak deficit observed in Chhattisgarh over the years is highlighted
in the figure below:
Figure V-2: Historical Trend in Energy Deficit – Chhattisgarh
Source: CEA
Figure V-3: Historical Trend in Peak Deficit – Chhattisgarh
Source: CEA

AF-MERCADOS EMI
Power Sector Operations and Impact on State Finances 71
2. ASSESSMENT OF OPERATIONAL PERFORMANCE OF
DISTRIBUTION UTILITIES
2.1. CONSUMER SALES MIX OF CHHATTISGARH
In FY 2011-12, industries dominated the sales mix with a share of 39%, followed by
domestic and agricultural sales with share of 24% and ~16% respectively. However, share
of Industrial sales in total sales have fallen from 2004-05 levels of 53% to 39% in FY 2011-
12, on the other hand domestic sales as as a percentage of total sales have grown from
17% in 2004-05 to 24% in FY 2011-12.
Figure V-4: Historical Trend in Consumer Sales Mix - Chhattisgarh
Source: PFC
The overall sales have increased at a CAGR of ~10% over a span of seven years wherein
the sales of commercial category have registered a higher CAGR of 23% along with the
sales of Domestic category with a CAGR of 36%.
In terms of revenue contribution, Industrial category contributed to ~40% of total revenue
followed by Commercial and Domestic category which contributed to ~24% and ~11% of
the total revenue respectively. Domestic and agriculture consumer categories are subsidised
by state government and also cross subsidised by other categories. Sale of surplus energy
available through bilateral sale, open access, power exchanges or UI has been approved by
the commission.
The figure below compares the sales mix of FY 2011-12 and the revenue realized from
different category of consumers.
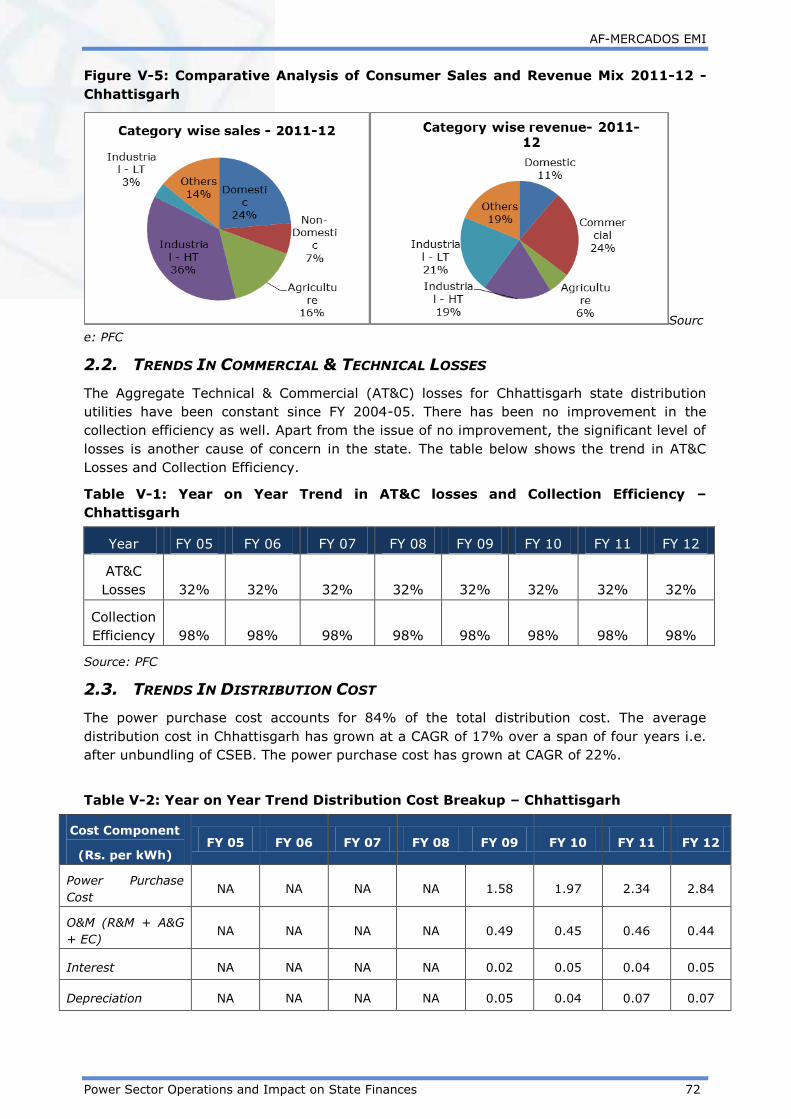
AF-MERCADOS EMI
Power Sector Operations and Impact on State Finances 72
Figure V-5: Comparative Analysis of Consumer Sales and Revenue Mix 2011-12 -
Chhattisgarh
Sourc
e: PFC
2.2. TRENDS IN COMMERCIAL & TECHNICAL LOSSES
The Aggregate Technical & Commercial (AT&C) losses for Chhattisgarh state distribution
utilities have been constant since FY 2004-05. There has been no improvement in the
collection efficiency as well. Apart from the issue of no improvement, the significant level of
losses is another cause of concern in the state. The table below shows the trend in AT&C
Losses and Collection Efficiency.
Table V-1: Year on Year Trend in AT&C losses and Collection Efficiency –
Chhattisgarh
Year FY 05 FY 06 FY 07 FY 08 FY 09 FY 10 FY 11 FY 12
AT&C
Losses 32% 32% 32% 32% 32% 32% 32% 32%
Collection
Efficiency 98% 98% 98% 98% 98% 98% 98% 98%
Source: PFC
2.3. TRENDS IN DISTRIBUTION COST
The power purchase cost accounts for 84% of the total distribution cost. The average
distribution cost in Chhattisgarh has grown at a CAGR of 17% over a span of four years i.e.
after unbundling of CSEB. The power purchase cost has grown at CAGR of 22%.
Table V-2: Year on Year Trend Distribution Cost Breakup – Chhattisgarh
Cost Component
(Rs. per kWh) FY 05 FY 06 FY 07 FY 08 FY 09 FY 10 FY 11 FY 12
Power Purchase
Cost NA NA NA NA 1.58 1.97 2.34 2.84
O&M (R&M + A&G
+ EC) NA NA NA NA 0.49 0.45 0.46 0.44
Interest NA NA NA NA 0.02 0.05 0.04 0.05
Depreciation NA NA NA NA 0.05 0.04 0.07 0.07

AF-MERCADOS EMI
Power Sector Operations and Impact on State Finances 73
Cost Component
(Rs. per kWh) FY 05 FY 06 FY 07 FY 08 FY 09 FY 10 FY 11 FY 12
Other cost NA NA NA NA 0.00 0.00 0.03 0.00
Source: PFC
Considering the power purchase cost, it is relatively lower than other states owing to
proximity to coal belts in the state and hence lower transport charges. However, the
increase in cost is due to the increase in coal prices, other fixed and variable charges and
inflationary pressure.
2.4. REVENUE REALIZATION
The tariff realization has increased for all categories of consumers over the years.
Considering the frequent increase in tariffs there has been per year increase in
realizations for almost all the years except in FY 2009-10.
The table below shows the revenue realization (without subsidies) from different consumer
categories over the years.
Table V-3: Historical Trend Consumer Category Wise Revenue Realization -
Chhattisgarh
Years FY 05 FY 06 FY 07 FY 08 FY 09 FY 10 FY 11 FY 12
Domestic 1.60 1.86 2.38 2.17 2.15 1.89 1.97 2.40
Agriculture 0.32 0.58 0.50 0.30 0.28 0.44 1.03 1.30
Commercial 4.83 3.20 4.17 1.70 3.09 2.49 4.45 5.13
Industrial
HT 4.06 4.52 3.78 4.10 4.22 5.18 2.26 4.04
Industrial LT 3.99 3.95 3.65 3.23 2.73 3.17 3.94 4.50
Others 2.31 3.31 4.08 4.26 6.55 2.81 6.36 4.03
Source: PFC
Revenue from sale of surplus power is also a stream of income in the state.

AF-MERCADOS EMI
Power Sector Operations and Impact on State Finances 74
3. ASSESSMENT OF FINANCIAL PERFORMANCE OF –
DISTRIBUTION UTILITY
3.1. FINANCIAL HEALTH OF DISTRIBUTION UTILITIES
The CSEB had been a profitable entity up to its unbundling in FY 09. Since then the
Chhattisgarh State Distribution Utility has shown increasing level of losses. The segregation
of Generation and Transmission from the estimation of Discoms financial earning brought
forward the condition of weak financial health of the Discoms in the state.
Figure V-6: Historical Trend Financial Losses (w/o) subsidies – Chhattisgarh
Source: PFC
3.2. ACS V/S ARR
The gap between average cost of supply and average revenue realized has increased in FY
09. This suggests tariff hikes has not been commensurate to the increase in cost. Also the
high level of AT&C losses have contributed to the low revenue realization.
The figure below depicts the trend in revenue gap on per unit sale of electricity to the
consumer
Figure V-7: Historical Trend in ACS v/s ARR – Chhattisgarh
Source: PFC

AF-MERCADOS EMI
Power Sector Operations and Impact on State Finances 75
4. STATE EXPOSURE TO POWER SECTOR
4.1. INCOME FROM POWER SECTOR
Tax Revenue
The tax revenue from the power sector forms a marginal share of ~4% of the total tax
revenue. The tax income is majorly through electricity distribution tax, which is paid by the
distribution utilities to the state government.
Table V-4: Tax Revenue from Power Sector - Chhattisgarh
Particulars 2009-10 2010-11 2011-12
Rs Cr
Tax Revenue from Power Sector 417 503 638
Total Tax Revenue 11,504 14,430 17,033
Power sector Tax Revenue / Total
state Tax Revenue 4% 3% 4%
Source: State Government annual accounts from CAG 2011-12, 2010-11, 2009-10
Non Tax Revenue
The non-tax revenue from power sector is through dividends, interest on loans and
advances, royalty/cess on water for power generation, Rural Electrification, T & D
etc. The details for the same are provided in the table below.
In FY10, the Power sector generated Rs 100 Cr as the Non Tax Revenue contributing a
marginal share of ~3% in the total state Non Tax Revenue. In FY11 and FY12, power sector
did not generate any Non-tax revenue. The overall income generated from the power
sector has increased from Rs 517 Cr in FY10 to Rs 638 Cr in FY12.
4.2. EXPENDITURE ON POWER SECTOR
The table below depicts the expenditure towards power sector in the state of Chhattisgarh.
Table V-5: Expenditure on Power Sector - Chhattisgarh
Categories 2009-10 2010-11 2011-12
Rs Cr
Capital expenditure 0 0 900
Revenue
expenditure 213 298 337
Total expenditure 213 298 1237
Source: State Government annual accounts from CAG 2011-12, 2010-11, 2009-10

AF-MERCADOS EMI
Power Sector Operations and Impact on State Finances 76
In FY12, there has been a substantial rise in the overall expenditure primarily on account of
state investments towards T&D.
The quantum of expenditure exceeds the quantum of revenue generated from the
power sector over the years.
4.3. ANALYSIS ON STATE GUARANTEES AND SUBSIDIES
Guarantees
The table below depicts the guarantees given to power sector relative to the total revenue
of the state
Table V-6: Guarantees as a Percentage of Total Revenues - Chhattisgarh
Parameter 2009-10 2010-11 2011-12
Rs Cr
Guarantees given by State Govt 429 429 429
Total Revenues of the State 14,547 18,266 21,091
Guarantees as a %age of Total
Revenues of State 2.95% 2.35% 2.04%
Source: State Government annual accounts from CAG 2011-12, 2010-11, 2009-10
The guarantees given to power sector constituted for a marginal share (less than 3%) of
total revenues of the state.
The table below depicts the three year average share of different utilities in sector
guarantees:
Table V-7: Guarantees Utility wise Breakup - Chhattisgarh
Particulars 2009-10 2010-11 2011-12
Average
Share in
Sector
Guarantees
(%)
Rs Cr
Chhattisgarh State Power
Holding Company 429 429 429
Source: State Government annual accounts from CAG 2011-12, 2010-11, 2009-10
he guarantee payments of Power Sector has been solely towards Chhattisgarh State Power
Holding Company
Subsidy
The table below depicts the aggregate share of utilities in subsidies given to Power sector
and the aggregate share of sector in total state subsidy over three years.

AF-MERCADOS EMI
Power Sector Operations and Impact on State Finances 77
Table V-8: Power Sector Subsidy as a Percentage of State Subsidy - Chhattisgarh
Particulars 2009-10 2010-11 2011-12
Average
Share in
Sector
Subsidy %
Rs Cr
Grant for Single bulb collection 134 134 134 67.82%
Electrification of Government
schools and hospitals 10 10 10
5.07%
Grant for free supply of
electricity to agriculture Pumps 177 177 177
89.81%
Power Sector subsidy (% of
total subsidy) 140 202 321
11.88%
Source: State Government annual accounts from CAG 2011-12, 2010-11, 2009-10
The major proportion of Subsidy has been towards grant for free supply of electricity to
agriculture Pumps.
Over the span of three years, the subsidy granted to the power sector accounted for a
significant proportion (~12%) of the total state subsidy.
4.4. POWER BONDS
As per RBI ‘State Finance Report’ 2014, the outstanding liability of Power Bond as on 31st
March 2014 was Rs 100 Cr.
4.5. POWER SECTOR FINANCING REQUIREMENT RELATIVE TO STATE’S ECONOMY
In this section, the expenditure (under all possible heads) on the power sector by the state
government has been listed to determine the state Power sector financing requirement
which is then compared to state finances.
The sector financing requirement is estimated as the summation of total expenditure of the
state government on the sector including Capital and Revenue Expenditure, Loans and
Advances (Net Of Recoveries) and Public Debt repaid (Net of Receipts) by the State
Government.
Table V-9: Power Sector Financing Requirement (2011-12) – Chhattisgarh
Particulars 2011-12
Rs Cr
Power Sector Expenditure (Capital and Revenue) 1,237
Loans And Advances made by the State Government (Net of
Recoveries) (98)
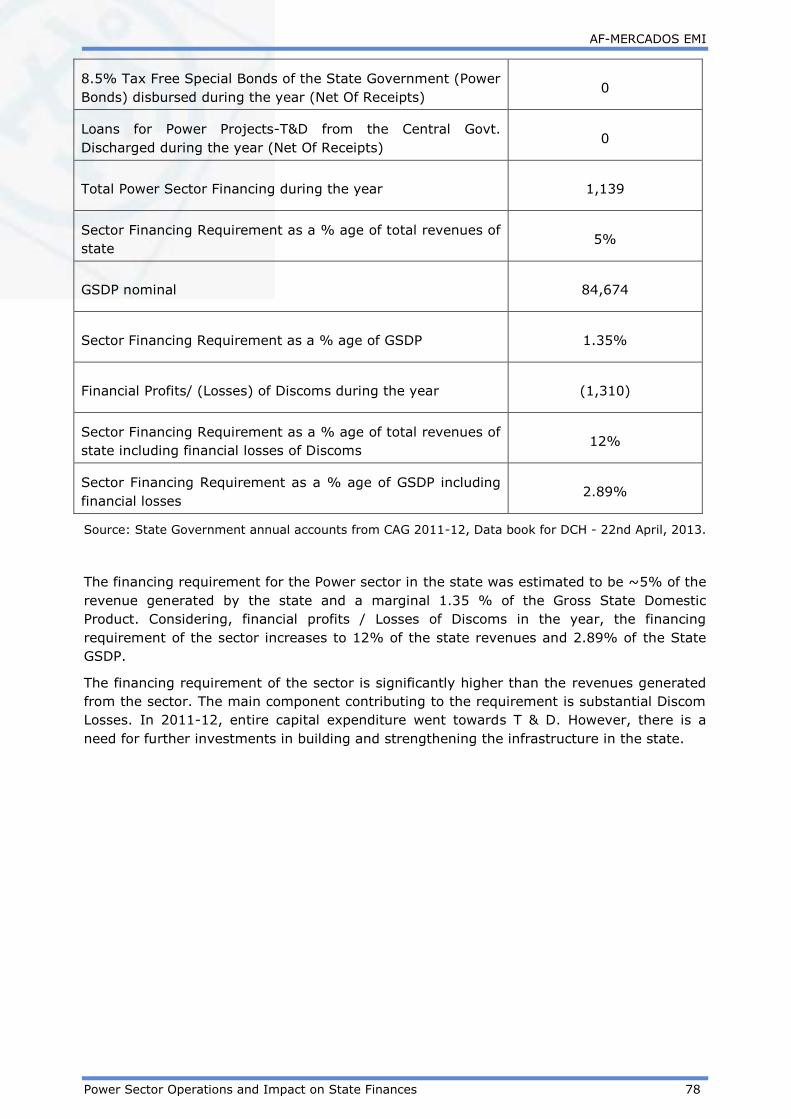
AF-MERCADOS EMI
Power Sector Operations and Impact on State Finances 78
8.5% Tax Free Special Bonds of the State Government (Power
Bonds) disbursed during the year (Net Of Receipts) 0
Loans for Power Projects-T&D from the Central Govt.
Discharged during the year (Net Of Receipts) 0
Total Power Sector Financing during the year 1,139
Sector Financing Requirement as a % age of total revenues of
state 5%
GSDP nominal 84,674
Sector Financing Requirement as a % age of GSDP 1.35%
Financial Profits/ (Losses) of Discoms during the year (1,310)
Sector Financing Requirement as a % age of total revenues of
state including financial losses of Discoms 12%
Sector Financing Requirement as a % age of GSDP including
financial losses 2.89%
Source: State Government annual accounts from CAG 2011-12, Data book for DCH - 22nd April, 2013.
The financing requirement for the Power sector in the state was estimated to be ~5% of the
revenue generated by the state and a marginal 1.35 % of the Gross State Domestic
Product. Considering, financial profits / Losses of Discoms in the year, the financing
requirement of the sector increases to 12% of the state revenues and 2.89% of the State
GSDP.
The financing requirement of the sector is significantly higher than the revenues generated
from the sector. The main component contributing to the requirement is substantial Discom
Losses. In 2011-12, entire capital expenditure went towards T & D. However, there is a
need for further investments in building and strengthening the infrastructure in the state.

AF-MERCADOS EMI
Power Sector Operations and Impact on State Finances 79
5. ASSESSMENT OF REGULATORY EFFECTIVENESS
The Chhattisgarh state electricity regulatory commission was constituted by the government
of Chhattisgarh in 2002 as a two member commission.
5.1. STATUS OF IMPORTANT REGULATIONS
The Commission came out with CSERC (Terms and Conditions of Determination of Tariff
according to Multi-Year Tariff Principles) Regulations, 2010.The commission has notified MYT
regulations in December, 2010 for CSPGCL, CSPTCL, CSPDCL and CSLDC for a control
period of 3 years from FY 2010-11 to FY 2012-13. The commission notified CSERC (MYT)
regulations, 2012 for a control period of 3 years from FY 2013-14 to FY 2015-16.
Open access of transmission lines was introduced in the state in 2007. Currently the open
access norms in the state are guided by CSERC (Connectivity and Intra-State Open Access)
Regulations 2011, in accordance to which the Cross subsidy surcharge to be paid by the
open access consumers for FY 2011-12 is 0.95 paisa/unit for EHV consumers and 0.34
paise/unit for HV consumers. For open access consumers procuring power from renewable
energy based power generating plant, the cross subsidy surcharge payable shall be 50% of
the cross subsidy surcharge determined for that year.
5.3. FREQUENCY OF TARIFF REVISIONS:
The tariff revisions in the state have been frequent. However, the percentage of tariff hike
has been relatively low. The table below presents the tariff revisions.
Table V-10: Trends in Tariff Revisions - Chhattisgarh
FY 05 FY 06 FY 07 FY 08 FY 09 FY 10 FY 11 FY 12 FY 13
Average
Tariff
Revisions
NA 3.45% 3.20% 2.96% NA 2.86% 2.97% 3.39% 4.07%
Source: Approved Tariff Orders of DISCOM for that year

AF-MERCADOS EMI
Power Sector Operations and Impact on State Finances 80
6. SUMMARY
The key aspects of state are discussed below:
1. Generation: The generation capacity and energy availability improved along with
increase in demand. The proximity to coal belts ensures increase in coal based
generation capacity at low cost. Relatively low cost on transportation has also
contributed to low cost of coal based power generation.
2. Losses: The state has a relatively very high level of AT&C losses with no reduction in
the losses or improvement in collection efficiency over the years.
3. Financial losses: Since 2010, the Discoms have incurred increasing level of losses.
This is primarily due to the segregation of Discoms from generation and transmission
sector.
4. State financial exposure: In 2011-12, the state invested significant amount in the
development of T & D infrastructure. The expenses incurred by the state as
assistance to the sector were relatively low. However, a substantial amount of
financial losses of Discoms has worsened the burden of sector on the state.

AF-MERCADOS EMI
Power Sector Operations and Impact on State Finances 81
VI DELHI
1. INTRODUCTION
1.1. BACKGROUND – POWER SECTOR OVERVIEW
Delhi is one of the fastest growing states in the country, with an economic growth rate of 9
per cent in 2012-13; the state government expects to register growth of 11 per cent to
11.5 per cent by the end of 20173. Delhi has one of the highest per capita electricity
consumption among the states in India.
Traditionally, power supply in Delhi was the responsibility of the Delhi Electricity Supply
Undertaking (DESU), which was an integrated utility with generation, transmission, and
distribution functions. Poor performance of DESU led to it being succeeded by the Delhi
Vidyut Board (DVB) in 1997, which was established as a State Electricity Board under the
Electricity (Supply) Act, 1948. The creation of DVB proved to be merely a change in the
legal status of the organization without any structural changes. The change did not affect
the functioning and the work culture of the organization. Its performance continued to
deteriorate.
Further, as privatization was expected to bring efficiency to Delhi Vidyut Board, the board
was unbundled. The generation companies established were -Indraprastha Power
Generation Company Limited(IPGCL) and Pragati Power Corporation Limited(PPCL). Delhi
Transco Limited (DTL) was established with a responsibility of transmission business and,
the business of power distribution was transferred to three private companies – BSES
Yamuna Power Limited (BYPL), BSES Rajdhani Power Limited (BRPL) and North
Delhi Power Limited (NDPL4).
Post privatization financial and operational performance of the state utilities has improved
over the years.
1.2. GENERATION MIX
The total installed capacity as on February 2014 (including allocated share in Joint &
Central Sector plants) was 7789 MW, out of which Coal based power capacity accounted for
~58% followed by Gas (~30% ) and Hydro (~9%). The capacity addition (incl.procurement
from Central & JV plants) has grown by 9%against the previous year.
Figure below highlights the generation capacity including allocated share in Joint & Central
sector plants.
3 Indian Brand Equity Foundation (IBEF)
4 The name has been changed to Tata Power Delhi Distribution Limited (TPDDL)

AF-MERCADOS EMI
Power Sector Operations and Impact on State Finances 82
Figure VI-1: Generation Capacity Mix as on February 2014 - Delhi
Source: CEA
1.3. POWER SUPPLY POSITION
The energy deficit in Delhi has been low over the years. The energy deficits have been
approximately in the range of 0%-2% over the past seven years. However, on the
contrary the peak deficits in Delhi have been high, due to high temperatures in summers.
The peak deficit in Delhi has increased from ~3% in FY 2004-05 to ~6% in FY 2013-14.
In recent past, post 2011-12, the peak deficits in Delhi have increased substantially, owing
to steep rise in the peak demand. The peak demand registered a growth of 19% in FY
2012-13.
The trend of energy and peak deficit observed in Delhi over the years is highlighted in the
figures below:
Figure VI-2: Energy Deficit - Delhi
Source: CEA

AF-MERCADOS EMI
Power Sector Operations and Impact on State Finances 83
Figure VI-3: Peak Deficit – Delhi
Source: CEA

AF-MERCADOS EMI
Power Sector Operations and Impact on State Finances 84
2. ASSESSMENT OF OPERATIONAL PERFORMANCE OF
DISTRIBUTION UTILITIES
2.1. CONSUMER SALES MIX OF DELHI
The distribution utilities in Delhi are BSES Rajdhani, which operates in the area of South
West Delhi; BSES Yamuna Power, which operates in area of Central East and East Delhi;
and Tata Power Delhi Distribution Limited (TPDDL), which operates in specified area of
North and North West of Delhi.
Electricity Sales in Delhi has grown at a CAGR of 12%, which is better than other states in
India. In FY 2011-12, domestic consumers dominated the sales mix with a share of 34%,
followed by Industrial (24%) and commercial (15%). The other category accounted for
27% of the sales mix.
The share of domestic category has reduced from 42% in FY 2004-05 to 34% in FY 2011-
12
The historical trend of consumer sales mix for the state is given in figure below:-
Figure VI-4: Historical Trend in Consumer Sales Mix - Delhi
Source: PFC
The overall sales have increased at a CAGR of ~12% over a span of seven years, wherein
the sales to other category have registered a higher CAGR of 38% followed by commercial
catergory with a CAGR of 8.4%.
In terms of revenue contribution, Industrial and Domestic categories contributed to 33%
each of total revenues, followed by commerical and other categories with a share of 26%
and 8% respectively.
The figure below compares the sales mix of FY 2011-12 and the revenue realized from
different category of consumers.

AF-MERCADOS EMI
Power Sector Operations and Impact on State Finances 85
Figure VI-5: Comparative Analysis of Consumer Sales and Revenue Mix 2011-12 -
Delhi
Source: PFC
2.2. TRENDS IN COMMERCIAL & TECHNICAL LOSSES
The Aggregated Technical & Commercial (AT&C) losses for Delhi state distribution utilities
have improved from 42.9% in 2005-06 to 18.6% in 2011-12.The reduction in losses was
visible post privatization, as many key initiatives by the distribution utilities to reduce
tariffs have been implemented. The table below shows the trend in AT&C Losses and
Collection Efficiency.
Table VI-1: Year on Year Trend in AT&C losses and Collection Efficiency - Delhi
Year FY 05 FY 06 FY 07 FY 08 FY 09 FY 10 FY 11 FY 12
AT&C Losses
(%) 42.9% 40.3% 34.3% 38.0% 17.9% 20.8% 15.8% 18.6%
Collection
Efficiency 92% 96% 101% 87% 105% 95% 103% 97%
Source: PFC
The initiatives undertaken for loss reduction include the following:
A. Technical Initiatives for Loss Reduction by distribution utilities in Delhi
1. Replacement of electromechanical meters,
2. Balancing of unbalanced Distribution Transformer
3. Augmentation of Overloaded Distribution Transformer.
4. Revamping of low tension (LT) distribution systems by changing / repairing worn
out equipment and cables.
5. Installation of automatic power factor controllers for providing reactive compensation
6. Distribution transformers metering for computing AT&C Loss at DT level.
7. Installation of Street Light Controller to avoid Energy Wastage
8. Introduction of Automation and Information Technology
B. Privileged Consumer Schemes
To acknowledge and encourage its regular paying consumers, utilities has institutionalized
a privileged consumer scheme through which discounts are offered to its consumers. They
have also institutionalized a structured approach towards Consumer Relationship
Management as it organizes regular meetings with consumer representative groups such as
RWAs, IWAs etc.

AF-MERCADOS EMI
Power Sector Operations and Impact on State Finances 86
C. Customer Service: Distribution utilities have set up Customer Help Desks (CHD‟s)
and, Commercial Call Centre to for online registration of consumer complaints and to
address Consumer Complaints. Genset vans & Mobile Transformers made available all
round the clock. A special drive “Roshini” was undertaken in which uninterrupted
illumination was provided during the entire festive season.
D. Metering Related : Mass Meter Replacement drive was undertaken for all Large
Industrial Power (LIP) consumers. Electronic Meters have also been introduced for
Domestic Consumers and faulty meters are being replaced on a priority basis with
tamper-proof electronic meters.
2.3. TRENDS IN DISTRIBUTION COST
The power purchase cost accounts for ~80% of the total distribution cost). The distribution
cost in Delhi has grown at a CAGR of 21% over a span of seven years and power purchase
cost has grown at a CAGR of 22%.
The per unit cost break-up for different cost components is highlighted in the table below:-
Table VI-2: Year on Year Trend Distribution Cost Breakup – Delhi
Cost Component
(Rs. per kWh) FY 06 FY 07 FY 08 FY 09 FY 10 FY 11 FY 12
Power Purchase
Cost 2.03 2.16 3.23 3.30 3.99 4.73 5.75
O&M (R&M + A&G
+ EC) 0.33 0.36 0.37 0.41 0.60 0.50 0.57
Interest 0.04 0.14 0.20 0.23 0.24 0.36 0.52
Depreciation 0.14 0.16 0.18 0.17 0.15 0.15 0.17
Other cost -0.03 0.07 -0.02 0.03 -0.01 0.01 0.06
Source: PFC
Until 2007, DTL was responsible for power purchase from various sources. The DISCOMS
paid DTL for the power purchase cost as per the Bulk Supply Tarff (BST) determined by
DERC based on the paying capacity of each DISCOM. However, post the policy direction
period, PPAs were allocated to the DISCOMs based on the ration of energy drawl in the
previous year.
Hence, the procurement shifted from bulk purchase to individual purchases and even
bilateral purchases. As a result, the power purchase cost witnessed a steep rise in FY 08 as
against FY 07. The power purchase cost has also increased to the tune of 30 % in past two
years i.e. FY 2011 and FY 2012. Majority of power procurement in Delhi is through central
sector based power plants, the cost of which is determined by CERC5.
Hence, power purchase cost is not in control of the state utilities. Moreover, the state own
generation capacity which majorly are costly gas based stations have no gas, but the
utilities have to pay the fixed charges to these generators.
The distribution utilities in Delhi are doing their best to reduce the power
purchase cost, a policy advocacy at various forums to reduce the same, including
surrendering of costly power plant, is being made. TPDDL’s petition regarding
5 As per the Tariff Order of 2013-14 for TPDDL,BYPL & BRPL

AF-MERCADOS EMI
Power Sector Operations and Impact on State Finances 87
surrendering of costly power from gas based stations has been admitted by DERC.
On the other hand, BSES, has approached the State government to shut their old
coal based power plants, and reallocate their coal allocation for new plants, which
will further reduce the power purchase cost.
The interest cost has also increased substantially in FY 11 and FY 12. The cost has
increased by 65% in FY 11 and by 49% in FY 12. The interest cost which accounted for 1%
in FY 2004-05, now accounts for 7% of the distribution cost. Due to high outstanding
regulatory assets, the distribution utilities are facing cash crunch, wherein they have to
procure short term loans for working capital requirements at high interest rates.
2.4. REVENUE REALIZATION
The tariff realizations have increased in FY 2011-12 except agricultural
consumers as tariff revisions to the tune of 12% were approved by the regulator
for all the three distribution utilities. The tariff revisions are not frequent in the
state; however, utilities are being provided fuel surcharge, which is on account of fuel
price variations and apart from it, utilities revenue gap is also created as a regulatory .
The table below shows the revenue realization (without subsidies) from different consumer
categories over the years.
Table VI-3: Historical Trend Consumer Category Wise Revenue Realization - Delhi
Years FY 05 FY 06 FY 07 FY 08 FY 09 FY 10 FY 11 FY 12
Domestic 2.79 2.75 2.79 3.42 3.48 4.30 3.54 3.84
Agriculture 1.25 1.58 2.22 1.67 2.14 2.00 2.35 2.35
Commercial 5.60 5.50 6.08 6.39 6.47 6.40 6.42 7.17
Industrial
LT 5.03 4.95 5.19 4.75 4.93 4.71 4.68 5.64
Source: PFC
The state has a favorable consumer mix, and low losses have led to better tariff
realizations from all consumer categories.
Having discussed the operational performance and revenue realized by the distribution
utilities, it’s now important to analyze the financial performance of the distribution utilities.

AF-MERCADOS EMI
Power Sector Operations and Impact on State Finances 88
3. ASSESSMENT OF FINANCIAL PERFORMANCE OF –
DISTRIBUTION UTILITY
3.1. FINANCIAL HEALTH OF DISTRIBUTION UTILITIES
The discoms in Delhi have been financially profitable (without subsidies) over the years
However, in FY 2007-08, due to the increase in power purchase cost the net profit margin
of distribution utilities has averaged at 4% in the last three years of assessment i.e. FY
2009-10 to FY 2011-12.
Figure VI-6: Historical Trend Financial Losses (w/o) subsidies – Delhi
Source: PFC
The continuous improvement in the operational norms has led to a profitable situation of
Delhi distribution sector.
The regulator has also approved the revenue gap as regulatory assets, which is supposed
to be liquidated every three years, however, the outstanding regulatory assets have
increased substantially over the years, and liquidating it altogether will give tariff shock to
the consumers. As per the tariff order of FY 2013-14, the status of regulatory assets is Rs
2066 Cr for TPDDL, Rs 9327 Cr for BRPL and Rs 5553 Cr for BYPL.
3.2. SUBSIDY BOOKED V/S SUBSIDY RECEIVED
There is no history available of Subsidies received to Distribution Utilities in Delhi.
3.3. ACS V/S ARR
The distribution utilities in Delhi have reported negative gap between average cost of
supply and average revenue realized, hence are revenue surplus..

AF-MERCADOS EMI
Power Sector Operations and Impact on State Finances 89
Figure VI-7: Historical Trend ACS v/s ARR (with subsidy) – Delhi
Source: PFC
The prudent operational strategy adopted by the state DISCOMs, with low AT&C losses,
along with favourable consumer mix comprising of marginal percentage share of
agriculture sales and high urban consumers has resulted in robust financial health of the
state DISCOMs.

AF-MERCADOS EMI
Power Sector Operations and Impact on State Finances 90
4. STATE EXPOSURE TO POWER SECTOR
CAG audited annual accounts not available for Delhi.
5. ASSESSMENT OF REGULATORY EFFECTIVENESS
The Government of National Capital Territory of Delhi constituted the Delhi Electricity
Regulatory Commission (DERC) on March 3, 1999 and it became operational from
December 10, 1999. DERC has been proactive in implementing second generation reforms
in the state which notifications of MYT Regulations which are currently in the second control
period and Open Access Regulations.
The key aspects of regulatory effectiveness have been discussed below -
5.1. STATUS OF MYT REGULATIONS
The Commission has notified MYT Regulations in FY 2007-08 for a first control period of
control period of four years from FY 2007-08 to FY 2010-11 and which was further extend
to FY 2011-12. The MYT regulations have been notified for second control period, which
specifies the Terms and Conditions for Determination of Tariff for Generation,
Transmission, and Distribution of electricity under the Multi Year Tariff (MYT) framework for
the period FY 2012-13 to FY 2014-15.
Table VI-4: Status of MYT Regulations - Delhi
States Control Period Control
Period No.1
Control
Period No.2
Delhi
First control period = 4 years; extended to
5 years and subsequent control period = 3
years
FY 2007-08
to FY 2010-
11;
extended till
FY 2011-12
FY 2012-13
to FY 2014-
15
Source: CEA
5.2. STATUS OF OPEN ACCESS IMPLEMENTATION
The Commission has notified the Open Access Regulations in Financial Year 2005-06 for
consumers more than 1MW. The open access in Delhi has been implemented and the
Cross subsidy surcharge in Delhi ranges from Rs 2.30 per unit. In comparison to other
states the cross subsidy surcharge is as follows i.e. Haryana it is (Rs. 0.53/kWh) in Gujarat
(Rs. 0.45/kWh), Bihar (Rs. 0.50/kWh) and in Punjab (Rs. 1.07/kWh) and West Bengal (Rs.
2.21/kWh).
5.3. FREQUENCY OF TARIFF REVISIONS
The tariff revisions in the state have not been frequent. The only major tariff revision
which took place was in FY 2011-12, to the tune of 11%. However, the utilities are being
allowed to pass on increased variable cost due to variation in fuel prices. The table below
presents the tariff revisions.

AF-MERCADOS EMI
Power Sector Operations and Impact on State Finances 91
Table VI-5: Trends in Tariff Revisions - Delhi
FY
05
FY 06 FY 07 FY
08
FY
09
FY
10
FY 11 FY
12
FY
13
FY 14
Average
Tariff
Revisions
0% 0% 0% 0% 0% 0% 0% 11% 0% 3%
Source: Approved Tariff Orders of DISCOM for that year
AF-MERCADOS EMI
Power Sector Operations and Impact on State Finances 92
6. SUMMARY
The operational efficiency of distribution utilities has improved post privatization due to
prudent practices and optimal consumer mix in the state. The success of distribution
model in Delhi has been a trend setter in the country. The Delhi Power Distribution Model
is an example of political will for reforms and efficient performance of private sector.
The key aspects for the state is discussed below-
1. Distribution Practices: The initiatives taken by distribution utilities in Delhi have set
the standards high for distribution practices in India. The implementation of these
practices could provide possible learning for the utilities, which are suffering from huge
losses. With IT implementation in distribution operations and customer service, the
state has improved its quality of supply.
2. Operational Efficiency: The Delhi has recorded AT&C losses as amongst the lowest
in the country. The initiatives taken by Delhi utilities have helped them achieve their
loss reduction targets. The major tariff hikes approved by commission in Delhi has
only been in FY 12. Yet, the distribution utilities in Delhi have managed to be
profitable and the utilities are being approved of Fuel Surcharge against rising price of
fuel.
3. Power Purchase cost: The power purchase cost in Delhi has been increasing like the
other states in country; however, Delhi purchases power majorly from Central sector
plants and thus do not have any control over the efficiencies of this. In this regards,
state has approached regulatory commission to surrender the costly power, so that it
can manage its power purchase portfolio better.
4. Tariff Revisions: the tariff revisions in the state have not been frequent over the
span of seven years. The only major tariff revision that took place was in FY 2011-12,
to the tune of 11%. However, the utilities are being allowed to pass on increased
variable cost due to variation in fuel prices.
5. Financial Performance: The financial performance of the state utilities has improved
over the years. However, the utilities still face cash crunch, given the high
outstanding regulatory assets, which is forcing the utilities to go for costly short term
loans. Hence, it is important to either hike the tariffs or liquidate the regulatory assets
to improve the cash crunch situation of the utilities. However, liquidating will bring
huge tariff shocks to the consumers. Hence, the only option left is to increase the
tariffs.
6. Regulatory asset: As on FY 2013-14, the status of regulatory assets is Rs 2066 Cr for
TPDDL, Rs 9327 Cr for BRPL and Rs 5553 Cr for BYPL. The regulatory assets are
supposed to be liquidated within three years of its creation; however, the same has
not been done.

AF-MERCADOS EMI
Power Sector Operations and Impact on State Finances 93
VII GOA
1. INTRODUCTION
1.1. BACKGROUND – POWER SECTOR OVERVIEW
The Electricity Department of Goa (ED- Goa) created in 1963, is the only licensee in the
state for transmission and distribution of Electrical Energy. The Department does not have
its own generation and purchases power majorly from the Central Sector Power Stations of
the National Thermal Power Corporation as per the allocation made by the Central
Government. There are no direct link lines between the generating station of NTPC and Goa
and hence the NTPC power is availed through the Grids of the neighboring State of
Maharashtra and Karnataka. It also procures power from IPPs, co-generation & other
sources.
1.2. GENERATION MIX
The total installed capacity as on February 2014 (including allocated share in Joint &
Central Sector plants) for Goa was 400.02 MW. Out of total capacity as on Feb 2014, coal
based power capacity accounted for ~82% followed by Gas (~12%) and Nuclear (~6%).
Figure below highlights the generation capacity including allocated share in Joint & Central
sector plants.
Figure VII-1: Generation Capacity Mix as on Feb 2014- Goa
Source: CEA
1.3. POWER SUPPLY POSITION
The energy and peak deficit in the state of Goa has been eliminated in FY 14. The energy
deficit reduced from ~1% in FY 08 to ~0.5 % in FY 14. Simultaneously, the peak deficit
reduced from ~11% in FY 08 to ~0% in FY 14.
Due to long term PPAs with CGS on round the clock basis, there is surplus power available
to ED-Goa during off-peak period.
The trend of energy and peak deficit observed in Goa over the years is highlighted in the
figure below:

AF-MERCADOS EMI
Power Sector Operations and Impact on State Finances 94
Figure VII-2: Historical Trend in Energy Deficit – Goa
Source: CEA
Figure VII-3: Historical Trend in Peak Deficit – Goa
Source: CEA

AF-MERCADOS EMI
Power Sector Operations and Impact on State Finances 95
2. ASSESSMENT OF OPERATIONAL PERFORMANCE OF
DISTRIBUTION UTILITIES
2.1. CONSUMER SALES MIX OF GOA
In FY 2011-12, the industrial consumers dominated the dominated the sales mix, with a
share of ~49% followed by domestic (22.3%) and commercial (9.9%). The others category
accounted for 18.7 % of the sales mix. The share of industrial category and Domestic
increased marginally over the years.
The historical trend of consumer sales mix for the state is given in figure below:-
Figure VII-4: Historical Trend in Consumer Sales Mix - Goa
Source: PFC
The overall sales have increased at a CAGR of ~5% over a span of seven years wherein the
sales of commercial category have registered a higher CAGR of 10% and the sales of
Domestic category have registered a CAGR of 4%.
In terms of revenue contribution, Industrial category contributed to ~38% of total revenue
followed by Commercial and Domestic category which contributed to ~18% and ~9% of
the total revenue respectively.
The figure below compares the sales mix of FY 2011-12 and the revenue realized from
different category of consumers.
Figure VII-5: Comparative Analysis of Consumer Sales and Revenue Mix 2011-12
- Goa
Source: PFC

AF-MERCADOS EMI
Power Sector Operations and Impact on State Finances 96
2.2. TRENDS IN COMMERCIAL & TECHNICAL LOSSES
The Aggregate Technical & Commercial (AT&C) losses for Goa electricity department have
reduced from 18% in 2004-05 to 15% in 2011-12. The table below shows the trend in
AT&C Losses and Collection Efficiency.
Table VII-1: Year on Year Trend in AT&C losses and Collection Efficiency - Goa
Year FY 05 FY 06 FY 07 FY 08 FY 09 FY 10 FY 11 FY 12
AT&C
Losses 18% 12.4% 16.9% 13% 22% 6% 14% 15%
Collection
Efficiency 99% 104% 98% 103% 99% 110% 100% 98%
Source: PFC
Various works under APDRP scheme contributed towards reduction in outages and the
AT&C losses in the state of Goa.
Steps undertaken by ED-Goa to reduce the Distribution Loss at an optimum level are:
The bifurcation of the feeders
New Sub-Stations to improve the voltage profile and reliability of power supply
Augmentation of the capacity of Sub-Stations
Underground cabling in parts of Goa
2.3. TRENDS IN DISTRIBUTION COST
The power purchase cost accounts for 85% of the total distribution cost. The average
distribution cost in Goa has grown at a CAGR of 12% over a span of seven years and power
purchase cost has grown at CAGR of 10 %
The per unit cost break-up for different cost components is highlighted in the table below:-
Table VII-2: Year on Year Trend Distribution Cost Breakup – Goa
Cost Component
(Rs. per kWh)
FY
05 FY 06 FY 07 FY 08 FY 09 FY 10 FY 11 FY 12
Power Purchase
Cost 1.32 1.42 1.64 1.77 1.96 1.91 2.20 2.64
O&M (R&M + A&G
+ EC) 0.22 0.26 0.24 0.26 0.32 0.47 0.44 0.44
Interest 0.03 0.03 0.02 0.02 0.02 0.03 0.03 0.02
Depreciation 0.04 0.05 0.05 0.05 0.06 0.06 0.06 0.01
Other cost 0.00 0.00 0.00 0.00 0.00 0.00 0.00 0.00
Source: PFC
The distribution cost in Goa is relatively low compared to other states. The major portion of
the state power procurement comes from NTPC. Hence the purchasing cost is subject to
fluctuation in coal/ Gas prices. The O&M expenses have majorly increased on account of
inflation.

AF-MERCADOS EMI
Power Sector Operations and Impact on State Finances 97
2.4. REVENUE REALIZATION
The tariff realizations have increased in FY 2011-12 for all categories of
consumers. The major increase in the realization was in Commercial category in
the past seven years. In comparison to FY11, both commercial and industrial
increased significantly.
The table below shows the revenue realization (without subsidies) from different consumer
categories over the years.
Table VII-3: Historical Trend Consumer Category Wise Revenue Realization - Goa
Years FY 05 FY 06 FY 07 FY 08 FY 09 FY 10 FY 11 FY 12
Domestic 2.79 2.75 2.79 3.42 3.48 4.30 3.54 3.84
Agriculture 1.25 1.58 2.22 1.67 2.14 2.00 2.35 2.35
Commercial 5.60 5.50 6.08 6.39 6.47 6.40 6.42 7.17
Industrial
LT 5.03 4.95 5.19 4.75 4.93 4.71 4.68 5.64
Source: PFC
The state has a favorable consumer mix, and low losses have led to better tariff
realizations from all consumer categories. The increase in tariff realization can be attributed
to Tariff revisions of 11.8% in FY12.
The state also earns revenue from the sale of surplus power available to ED-Goa during the
off peak period. In FY 2011-12, the state earned Rs 109 Cr from sale of surplus power.

AF-MERCADOS EMI
Power Sector Operations and Impact on State Finances 98
3. ASSESSMENT OF FINANCIAL PERFORMANCE OF –
DISTRIBUTION UTILITY
3.1. FINANCIAL HEALTH OF DISTRIBUTION UTILITIES
ED-Goa was recorded as a profitable venture over the years. However, in FY 2010-11 and
FY 2011-12, it started to incur financial losses.
Figure VII-6: Historical Trend Financial Losses (w/o) subsidies – Goa
Source: PFC
The primary reason has been the substantial increase in Power purchase cost and O & M
cost in FY 11 and FY 12, without any commensurate increase in tariffs.
3.2. SUBSIDY BOOKED V/S SUBSIDY RECEIVED
There is no history available of Subsidies given to ED- Goa
3.3. ACS V/S ARR
The gap between average cost of supply and average revenue realized has increased in FY
11 and FY12. This is primarily due to the significant increase in power distribution cost and
prevalent AT&C losses in the state.
The figure below depicts the trend in revenue gap on per unit sale of electricity to the
consumer

AF-MERCADOS EMI
Power Sector Operations and Impact on State Finances 99
Figure VII-7: Historical Trend in ACS v/s ARR – Goa
Source: PFC
4. STATE EXPOSURE TO POWER SECTOR
CAG audited annual accounts not available for Goa.
5. ASSESSMENT OF REGULATORY EFFECTIVENESS
A Joint Electricity Regulatory Commission for all Union Territories (except Delhi) was
established in 2005, as “Joint Electricity Regulatory Commission for Union Territories” Later
with the joining of the state of Goa, in 2008, the Commission came to be known as “Joint
Electricity Regulatory Commission for the state of Goa and Union Territories”.
The key aspects of regulatory effectiveness have been discussed below -
5.1. STATUS OF MYT REGULATIONS
Draft report on MYT framework has been issued but is yet to be implemented.
The control Period is of three financial years i.e. from April 1, 2014 to March 31,
2017
It comprises (but not be limited to) the detailed category-wise sales and demand
projections, power procurement plan, capital investment plan, financing plan and
physical targets.
5.2. STATUS OF OPEN ACCESS IMPLEMENTATION:
The regulation framework for open access has been issued. However, it is still under
implementation.
5.3. FREQUENCY OF TARIFF REVISIONS:
The tariff revisions were done in FY 2012-13, w.e.f 1st June 2012, after a gap of 11 years,
wherein the tariffs were hiked substantially by 11.8%. Thereafter, another tariff revision
has been accepted for the FY 2014-15 to the tune of 7.62%

AF-MERCADOS EMI
Power Sector Operations and Impact on State Finances 100
Table VII-4: Trends in Tariff Revisions - Goa
FY
05
FY 06 FY 07 FY
08
FY
09
FY
10
FY 11 FY
12
FY 13 FY 14
Average
Tariff
Revisions
0% 0% 0% 0% 0% 0% 0% 0% 11.8% 0%

AF-MERCADOS EMI
Power Sector Operations and Impact on State Finances 101
6. SUMMARY
1. Reforms: The power sector in the state has yet not undergone the structural
reforms and hence there is a Power Department (ED- Goa) that is responsible for all
the functions of the sector. Also the state does not have an independent regulatory
commission and comes under JERC for Goa and union territories.
2. AT&C Losses: The technical improvements and initiatives like underground
transmission lines or increasing capacity of substations have helped extensively to
reduce the losses.
3. Peak and Energy Deficit: The peak and energy deficit for the state has reduced
over the years and came down to less than 1% in FY 2011-12. This can be
attributed to the ED-Goa’s strategy of entering into long term PPAs with CGS on
RTC basis and to the infrastructural development for decreasing the losses.
4. Tariff Hikes: There has been tariff revision in the state after a gap of 11 years. The
proposal of tariff revision was rejected in FY2013-14. A revision of 7% has been
accepted by the commission for Fy2014-15. However, due to the increasing cost
and no commensurate increase in tariff, Discoms have started to incur losses since
FY 2010-11.
5. Regulatory effectiveness: In spite of the good operational and financial
performance, the state is lagging behind in terms of its regulatory effectiveness.
Even though commission has notified JERC (Open Access in Transmission and
Distribution) Regulations 2009, the progress of implementation have been very
slow. The MYT framework and Open Access regulation is yet to be implemented. The
establishment of SLDC and STU which are required to facilitate Open access is yet
to be notified.

AF-MERCADOS EMI
Power Sector Operations and Impact on State Finances 102
VIII GUJARAT
1. INTRODUCTION
1.1. BACKGROUND – POWER SECTOR OVERVIEW
The Government of Gujarat constituted the Gujarat Electricity Regulatory Commission
(GERC) in November, 1998. Until the year, 1998 Gujarat Electricity Board (GEB) was a
profit earning organization but for various reasons it started incurring losses and by the
end of Financial Year (FY) 03 the cumulative losses were Rs 6,233 Cr. The Government of
Gujarat decided to restructure the electricity industry with an objective to improve the
operational efficiency and consumer services. The vertically integrated state electricity
board, GEB was unbundled from 1st April 2005. The Companies that were incorporated as
a part of this restructuring exercise were:
Gujarat State Electricity Corporation Limited (GSECL) - Generating Company to
which all generating plants of GEB were transferred
Gujarat Electricity Transmission Corporation Limited (GETCL) - Transmission
Company to which transmission business of GEB were transferred.
Uttar Gujarat Vij Company Limited (UGVCL) - Distribution Company to which
distribution function of GEB was transferred.
Dakshin Gujarat Vij Company Limited (DGVCL) - Distribution Company to which
distribution function of GEB was transferred.
Madhya Gujarat Vij Company Limited (MGVCL) - Distribution Company to which
distribution function of GEB was transferred.
Paschim Gujarat Vij Company Limited (PGVCL) - Distribution Company to which
distribution function of GEB was transferred.
Gujarat Urja Vikas Nigam Limited (GUVNL) - Holding Company responsible for
trading and residual functions of extinct SEB.
The current structure of the power sector in the state is shown below along with the
functional responsibilities of each utility.
Figure VIII-1: Power Sector Structure – Gujarat
Source: GERC

AF-MERCADOS EMI
Power Sector Operations and Impact on State Finances 103
1.2. GENERATION MIX
The total installed capacity as on December 2013 (including allocated share in Joint &
Central Sector plants), for Gujarat was 26,269 MW, out of which coal-based capacity
accounted for ~60% of the total installed capacity; followed by gas (~19%) and
renewable-based (~16%).
Figure below highlights the generation capacity mix in the state of Gujarat.
Figure VIII-2: Generation Capacity Mix - Gujarat
60%19%
0%2%3%
16%
Generation Capacity (incl. allocates share from Joint and Central Sector plants)
Coal Gas Diesel Nuclear Hydro Renewable
Source: CEA
1.3. POWER SUPPLY POSITION
The energy and peak deficit in the state of Gujarat has been eliminated in recent years.
The energy deficit reduced from ~16% in FY 08 to ~0% in FY 12. Simultaneously, the peak
deficit reduced from ~29% in FY 08 to ~0% in FY 13 and FY 14. The increasing capacity
addition, through long-term power purchase agreements (especially coal and gas-based
capacity addition), has been able to meet the increasing energy demand in the state, also
cover the previous year deficit levels.
Load-shedding or power cuts in the urban areas are almost zero, although due to rise in
demand during harvesting season, power supply is sometimes rationed in rural areas.
The trend of energy and peak deficit observed in Gujarat over the years is highlighted in
the figure below:
Figure VIII-3: Historical Trend in Energy Deficit – Gujarat
8%
13%16%
10%
4% 6%
0% 0% 0% 0%
5%
10%
15%
20%
0
20,000
40,000
60,000
80,000
100,000
MU
Energy Deficit
Energy Required (MU) Energy Avail (MU) Deficit (%)
Source: CEA

AF-MERCADOS EMI
Power Sector Operations and Impact on State Finances 104
Figure VIII-4: Historical Trend in Peak Deficit – Gujarat
22%
30%27% 24%
9% 8%2% 0% 0% 0%
10%
20%
30%
40%
0
5,000
10,000
15,000M
W
Peak Deficit
Peak Demand (MW) Peak Met (MW) Deficit (%)
Source: CEA
In order to cater the increasing power demand in the state GUVNL, had signed long-term
power purchase agreements with independent power producer, for the state distribution
companies (DISCOMs). However, with the decline in growth of demand of power in the
state has made the state power surplus. Further, the inability to sell the excess power has
resulted in payment of fixed charges to these power producers, leading to an increased
power purchase cost. This is particularly true for the gas station, which are stranded for the
lack or cost of gas. The figure below indicates the operating PLFs of the state run gas
based plants.
Figure VIII-5: Operating PLF of State Gas Based Plants – Gujarat
38.89%
49.39%
32.81%
17.27%
0.00%
10.00%
20.00%
30.00%
40.00%
50.00%
60.00%
Dhuvaran (Gas 1)* Dhuvaran (Gas 2) Utran Gas* Utran Extension*
Actual PLF of GSECL Gas Based Plants - 2012-13
Source: GSECL Filing of Petition for True Up of FY 2012-13
*GUVNL has signed Long Term PPA with above plants.
The above trend is expected to continue in near future, which will impose a huge financial
burden on the state power sector.

AF-MERCADOS EMI
Power Sector Operations and Impact on State Finances 105
2. ASSESSMENT OF OPERATIONAL PARAMETERS OF
DISTRIBUTION UTILITIES
2.1. CONSUMER SALES MIX OF GUJARAT
The distribution activity in the state of Gujarat is segregated into four state government
DISCOMs and a private DISCOM. The state distribution utility in the state serves ~12
million consumers in the state, with more 9.5 million consumers or ~79% domestic
consumers served by the state DISCOMs. The industrial consumers constitute ~2% share
in the consumer mix of the state DISCOMs. 6
In 2011-12, industries dominated the sales mix with a share of 42%, followed by
agriculture (25%) and domestic (14%) categories
The share of agricultural sales have reduced over the years while the share of industrial
sales have increased. The share of agricultural sales have reduced from 36% in 2005-06 to
25% in 2011-12 and the industrial sales have increased marginally from 40% in 2005-06
to 42% in 2011-12. Although, the sales towards railway traction was added to the
consumer sales mix in FY 11, increasing the share of other consumer segments in FY 11
and FY 12.
The figure below illustrates the year on year trend in the consumer mix for the state of
Gujarat.
Figure VIII-6: Historical Trend Consumer Sales Mix - Gujarat
0%
20%
40%
60%
80%
100%
2005-06 2006-07 2007-08 2008-09 2009-10 2010-11 2011-12
Perc
enta
ge
Years
Domestic Agriculture Commercial
Industrial - HT Industrial - LT others
Source: PFC
The overall sales has registered a CAGR of ~8% from FY 06 to FY 12; wherein sales to
industrial and domestic consumers have registered a comparatively higher CAGR of
~12.1% and 10.3% in the same period.
In 2011-12, with ~7% consumers and ~25% share in the overall consumer sales mix the
agriculture segment contributed ~13% share in the overall revenue of the state DISCOMs.
The industrial segment contributed ~ 56% of the overall revenue to the state DISCOMs,
followed by sales to domestic and agriculture categories, with a share of ~13% each. This
clearly indicates that electricity sales to agriculture segment and certain categories of
6 Approved Multi-Year Tariff Order 2012-16, for the state DISCOMs.

AF-MERCADOS EMI
Power Sector Operations and Impact on State Finances 106
domestic consumers (especially BPL consumers) are cross-subsidized by the industrial
consumer categories and are also supported via state government subsidies.The figure
below compares the sales mix of FY 2011-12 and the revenue realized from the different
category of consumer categories.
Figure VIII-7: Comparative Analysis Consumer Sales and Revenue Mix (w/o
subsidy) in 2011-12 – Gujarat
Domestic 13% Agriculture
13%
Commercial 3%
Industrial - HT 39%
Industrial - LT 17%
others 15%
Category wise Revenuein 2011-12
Domestic 14%
Agriculture25%
Commercial 2%
Industrial - HT 29%
Industrial - LT 13%
others 17%
Category wise Sales - 2011-12
Source: PFC
2.2. TRENDS IN COMMERCIAL AND TECHNICAL LOSSES
The Aggregated Technical & Commercial losses (AT&C) for Gujarat distribution utilities
have historically remained on a lower side compared to the national average. Further, the
loss levels in the state have reduced significantly from 27% in FY 06 19% in FY 12. The
loss levels have been calculated with an approved consumption norm for the unmetered
agriculture pumps that constitute ~57% of agriculture consumers and ~81% of total
energy sales to agriculture consumer segment. The trends observed in collection efficiency
have been on the higher side, with state registering more than 95% collection efficiency in
all the representative years7.
The table below illustrates the year on year trend on commercial losses and collection
efficiency of the state DISCOMs.
Table VIII-1: Historical Trend AT&C losses and Collection Efficiency - Gujarat
Year FY 06 FY 07 FY 08 FY 09 FY 10 FY 11 FY 12
AT&C Losses (%) 27% 24% 23% 22% 23% 17% 19%
Collection Efficiency (%) 100% 98% 100% 99% 99% 99% 97%
Source: PFC
Further, with initiatives like Jyotigram Yojna the state DISCOMs have been able to
segregate the agriculture users from other users in the village, which has enabled efficient
metering in the state. The box below provides a brief about the Jyotigram Yojna adopted in
the state.
7 Approved Multi-Year Tariff Order 2012-16, for the state DISCOMs.

AF-MERCADOS EMI
Power Sector Operations and Impact on State Finances 107
Box VIII-1: A Brief about Jyotigram Yojna
Historically, the HT/LT ratio (0.94 in 2009-10) in the state has remained high.
2.3. TRENDS IN DISTRIBUTION COSTS
Power purchase cost accounts for majority of distribution cost, accounting for ~91% of the
overall distribution costs.
The per-unit cost break-up for different cost components for the state of Gujarat is
provided in the table below:-
Table VIII-2: Historical Trend in Distribution Cost Breakup - Gujarat
Cost Component
(Rs per kWh) FY 06 FY 07 FY 08 FY 09 FY 10 FY 11 FY 12
Power Purchase Cost 2.08 2.35 2.63 3.15 2.92 3.55 3.97
O&M (R&M + A&G + EC) 0.15 0.23 0.21 0.22 0.23 0.23 0.21
Interest 0.10 0.09 0.08 0.09 0.08 0.07 0.06
Depreciation 0.06 0.07 0.08 0.09 0.09 0.10 0.11
Other cost 0.00 0.01 0.02 0.01 0.04 0.03 0.01
Source: PFC
The power purchase cost has increased significantly in recent years on account of
increasing capacity addition through long term power purchase agreements. Further, with
the recent decline in growth-rate of demand for power, the sector in Gujarat has become a
surplus state with stranded capacity and an obligation to pay the fixed charges to the
power producers.
Jyotigram Yojna
A Gujarat Government initiated to improve the rural power supply in the state, aimed at
providing 24-hour, three-phase power supply to more than 18,000 villages in the state and
pre-announced eight hours per day supply to the tube-well owners. The initiative required
complete rewiring in the rural part of the state. The users covered under the programme
include domestic, schools, hospitals, and village industries. The electricity to all the users
are provided at metered rates.
The scheme focuses on providing rationally managed subsidies where needed, and pricing
where possible. Further, the farmers operating tube-wells continue to receive electricity for
8 hours.
The scheme initially launched for eight districts on pilot basis, was extended to the entire
state by November 2004, covering ~90% of Gujarat’s villages. The scheme initiated a
massive laying of parallel rural transmission network. Feeders supplying agricultural
connection were bifurcated from those supplying to commercial and residential connection
at sub-station itself. Meters on distribution transformer centers were also installed on both
the sides of feeders to improve the accuracy for energy accounting [MGVCL 2007].
The outcome of the Jyotigram Yojna resulted in 24 hours un-interrupted supply of power
across the 18,000 villages in the state and improved reliability and predictability of supply,
especially to the tube-well operators. Further, the segregation of agricultural energy from
other consumers has reduced the subsidy burden of the state government and improved
the metering capabilities of the state DISCOMs.
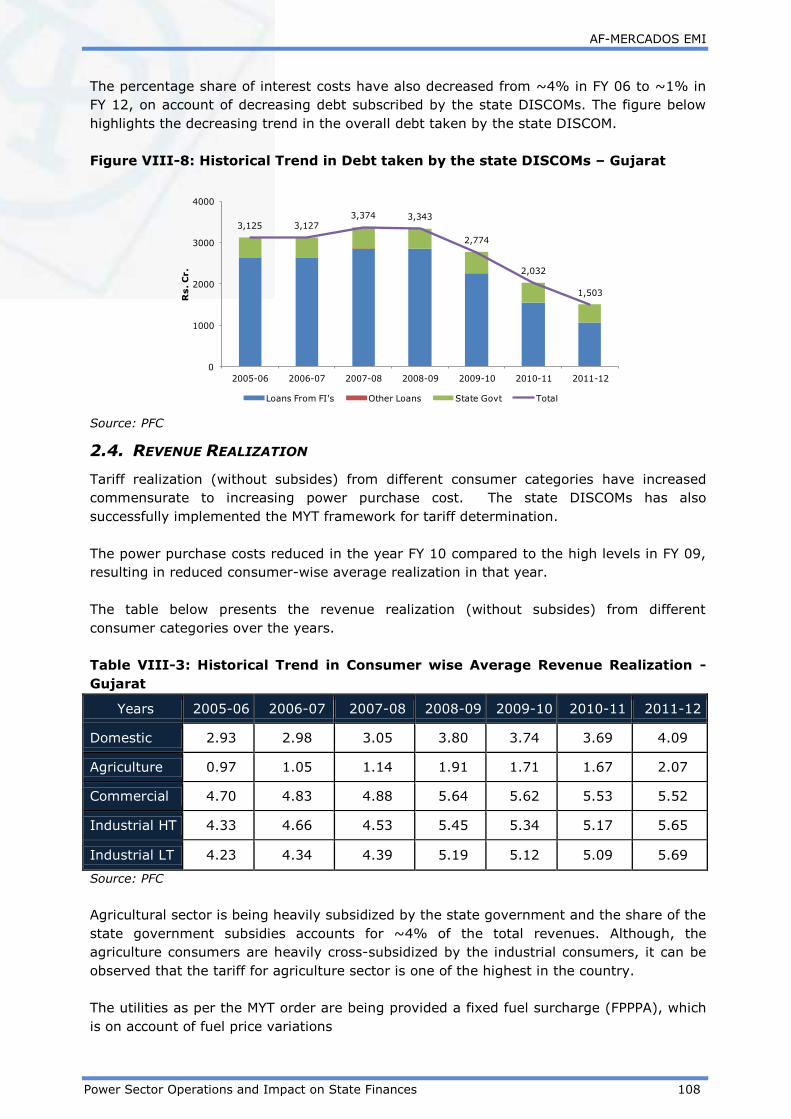
AF-MERCADOS EMI
Power Sector Operations and Impact on State Finances 108
The percentage share of interest costs have also decreased from ~4% in FY 06 to ~1% in
FY 12, on account of decreasing debt subscribed by the state DISCOMs. The figure below
highlights the decreasing trend in the overall debt taken by the state DISCOM.
Figure VIII-8: Historical Trend in Debt taken by the state DISCOMs – Gujarat
3,125 3,1273,374 3,343
2,774
2,032
1,503
0
1000
2000
3000
4000
2005-06 2006-07 2007-08 2008-09 2009-10 2010-11 2011-12
Rs. C
r.
Loans From FI's Other Loans State Govt Total
Source: PFC
2.4. REVENUE REALIZATION
Tariff realization (without subsides) from different consumer categories have increased
commensurate to increasing power purchase cost. The state DISCOMs has also
successfully implemented the MYT framework for tariff determination.
The power purchase costs reduced in the year FY 10 compared to the high levels in FY 09,
resulting in reduced consumer-wise average realization in that year.
The table below presents the revenue realization (without subsides) from different
consumer categories over the years.
Table VIII-3: Historical Trend in Consumer wise Average Revenue Realization -
Gujarat
Years 2005-06 2006-07 2007-08 2008-09 2009-10 2010-11 2011-12
Domestic 2.93 2.98 3.05 3.80 3.74 3.69 4.09
Agriculture 0.97 1.05 1.14 1.91 1.71 1.67 2.07
Commercial 4.70 4.83 4.88 5.64 5.62 5.53 5.52
Industrial HT 4.33 4.66 4.53 5.45 5.34 5.17 5.65
Industrial LT 4.23 4.34 4.39 5.19 5.12 5.09 5.69
Source: PFC
Agricultural sector is being heavily subsidized by the state government and the share of the
state government subsidies accounts for ~4% of the total revenues. Although, the
agriculture consumers are heavily cross-subsidized by the industrial consumers, it can be
observed that the tariff for agriculture sector is one of the highest in the country.
The utilities as per the MYT order are being provided a fixed fuel surcharge (FPPPA), which
is on account of fuel price variations

AF-MERCADOS EMI
Power Sector Operations and Impact on State Finances 109
ASSESSMENT OF FINANCIAL PERFORMANCE OF –
DISTRIBUTION UTILITY
2.5. FINANCIAL HEALTH OF DISTRIBUTION UTILITIES
The distribution financial losses without subsides in Gujarat has decreased over the years.
The figure below depicts the year on year trend in the profit/ (loss) booked by the state
DISCOMs.
Figure VIII-9: Historical Trend in Financial Losses (w/o subsidy) - Gujarat
(1,124) (1,135) (1,093) (1,085) (1,051)(997) (966)
(1,500)
(1,300)
(1,100)
(900)
(700)
(500)
(300)
(100)
100
2005-0
6
2006-0
7
2007-0
8
2008-0
9
2009-1
0
2010-1
1
2011-1
2
Rs. C
r
Financial Profit/(Loss) (PAT w/o subsidy )
Source: PFC
Further, after accounting for the subsidies provided by the state government, the state
DISCOMs reports a financial profit. In 2011-12, the state DISCOMs reported a profit (with
subsidy) of Rs. 134.05 Cr.
2.6. SUBSIDY BOOKED V/S SUBSIDY RECEIVED
In 2011-12, the subsidy contributed ~4% of the total revenues of the state DISCOMS
compared to ~12% in 2005-06. The subsidy level was fixed at ~Rs 1100 Cr by the state
government (in the MYT 2012-16) and is distributed among DISCOMs, in proportion to the
unmetered category consumers. The subsidy booked has reported an annual decline of 1%
over the span of six years, to the ACS that has registered a CAGR of 10% over the same
period.
The figure below depicts the year on year trend in subsidies booked and received by the
state DISCOMs.
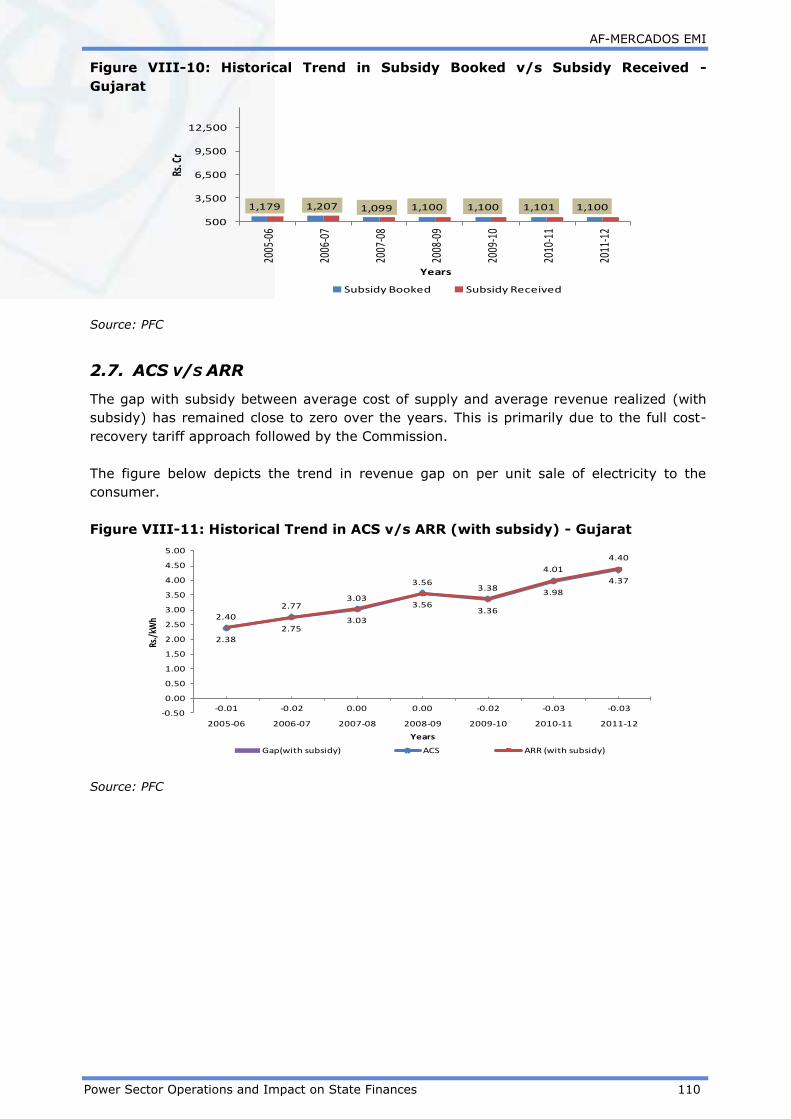
AF-MERCADOS EMI
Power Sector Operations and Impact on State Finances 110
Figure VIII-10: Historical Trend in Subsidy Booked v/s Subsidy Received -
Gujarat
1,179 1,207 1,099 1,100 1,100 1,101 1,100
500
3,500
6,500
9,500
12,500
2005
-06
2006
-07
2007
-08
2008
-09
2009
-10
2010
-11
2011
-12
Rs. C
r
Years
Subsidy Booked Subsidy Received
Source: PFC
2.7. ACS V/S ARR
The gap with subsidy between average cost of supply and average revenue realized (with
subsidy) has remained close to zero over the years. This is primarily due to the full cost-
recovery tariff approach followed by the Commission.
The figure below depicts the trend in revenue gap on per unit sale of electricity to the
consumer.
Figure VIII-11: Historical Trend in ACS v/s ARR (with subsidy) - Gujarat
-0.01 -0.02 0.00 0.00 -0.02 -0.03 -0.03
2.38
2.753.03
3.563.36
3.98
4.37
2.40
2.773.03
3.563.38
4.01
4.40
-0.50
0.00
0.50
1.00
1.50
2.00
2.50
3.00
3.50
4.00
4.50
5.00
2005-06 2006-07 2007-08 2008-09 2009-10 2010-11 2011-12
Rs./
kWh
Years
Gap(with subsidy) ACS ARR (with subsidy)
Source: PFC

AF-MERCADOS EMI
Power Sector Operations and Impact on State Finances 111
3. STATE EXPOSURE TO POWER SECTOR
3.1. INCOME FROM POWER SECTOR
The source of tax revenue is the electricity distribution tax, paid to the state government
by the distribution utilities. The tax revenue from the power sector formed ~7% of the
total tax revenue in the state in 2011-12. The details for the same are provided in the
table below:
Table VIII-4: Tax Revenue from Power Sector - Gujarat
Revenue 2009-10 2010-11 2011-12
Rs Cr
Tax Revenue From Power Sector 2,644 3,263 3,654.56
Total Tax Revenue 32,631 43,018 52,032.60
Power sector Tax Revenue / Total
state Tax Revenue 8.10% 7.58% 7.02%
Source: Audited CAG Accounts for the state 2011-12, 2010-11, 2009-10
The Tax Revenue from the sector has increased over the years; however, the contribution
of sector in total tax revenue generation has decreased marginally.
The non-tax revenue from power sector is through Royalty/CESS on water for power
generation, transmission and distribution, Rural Electrification etc. The Non-Tax
revenue, which contributes a marginal ~2% of the total non-tax revenues in 2011-12. The
details for the same are provided in the table below:
Table VIII-5: Non-Tax Revenue from Power Sector - Gujarat
Revenue 2009-10 2010-11 2011-12
Rs Cr
Non-Tax Revenue From Power
Sector 0.5 5.3 105.75
Total Non-Tax Revenue 5,452 4,915 5,276.52
Power sector Non-Tax Revenue
/Total state Non-Tax Revenue 0.01% 0.11% 2.00 %
Source: Audited CAG Accounts for the state 2011-12, 2010-11, 2009-10
In FY12, there has been a substantial rise in the revenue generation from the sector as
compared to Rs 0.5 Cr in FY10
The overall income generated from power sector has increased from Rs 2,664 Cr in 2009-
10 to Rs 3,760 Cr in 2011-12. However, the contribution of Power Sector in overall State
Revenues has been approximately constant (~7%) since FY10.

AF-MERCADOS EMI
Power Sector Operations and Impact on State Finances 112
3.2. EXPENDITURE ON POWER SECTOR
The details of the expenditure made on the power sector by the state are provided in the
table below:
Table VIII-6: Expenditure on Power Sector - Gujarat
Categories 2009-10 2010-11 2011-12
Rs Cr
Capital Expenditure 442 735 880.20
Revenue Expenditure 2,896 3,146 3,358.70
Total Expenditure 3,338 3,882 4,238.90
Source: Audited CAG Accounts for the state 2011-12, 2010-11, 2009-10
The Capital and Revenue expenditure incurred on the Power sector has increased
over the period of three years.
Further, it can be observed that the state power sector has moved towards self sufficiency
as revenue from Power sector exceeded the revenue expenditure made by the state
towards the power sector in FY 11 and FY 12.
3.3. ANALYSIS ON STATE GUARANTEES AND SUBSIDIES
The table below depicts the guarantees given to power sector relative to the total revenues
of the state.
Table VIII-7: Guarantees as a Percentage of Total Revenues - Gujarat
Parameter 2009-10 2010-11 2011-12
Rs Cr
Guarantees given by State Govt. 2,257 2,076 576
Total Revenues of the State 38,083 47,933 57,309
Guarantees as a %age of Total
Revenues of State 5.93% 4.33% 1.00%
Source: Audited CAG Accounts for the state 2011-12, 2010-11, 2009-10
As shown above, The state government guarantees have declined substantially in FY 2012,
constituting a marginal ~1.00% of the overall state revenue from a share of ~6% in FY
2010.
The table below depicts the three year average share of different utilities in sector
guarantees:
Table VIII-8: Guarantees Utility wise Breakup - Gujarat
Share of various utilities in
state Guarantees 2009-10 2010-11 2011-12
Average
Share in
Sector
Guarantees
(%)

AF-MERCADOS EMI
Power Sector Operations and Impact on State Finances 113
Rs Cr
Gujarat Urja Vikas Nigam
Limited- 2,199 1,485 544.84 86%
Gujarat State Electricity
Corporation Limited 58 10 27.22 2%
Other 0 582 3.65 12%
Source: Audited CAG Accounts for the state 2011-12, 2010-11, 2009-10
The majority share of the guarantee (~86%) towards power sector since FY10 is pledged
towards the loan taken by the state holding and trading company, GUVNL.
Subsidy
The table below depicts the average share of utilities in subsidies given to Power sector and
the average share of sector in total state subsidy over three years:
Table VIII-9: Power Sector Subsidy as a Percentage of overall subsidy – Gujarat
Particulars 2009-10 2010-11 2011-12
Rs Cr
Power Sector subsidy 2,838 2,635 3,167
Source: Audited CAG Accounts for the state 2011-12, 2010-11, 2009-10
The power sector received a substantial average share of ~57% of the overall subsidy
given by the state government. As stated earlier ~1100 Cr, is directed towards the state
DISCOMs to cover the agriculture sales in the state.
3.4. POWER BONDS
As per RBI ‘State Finance Report’ 2014, the outstanding liability of Power Bond as on 31st
March 2014 was Rs 330 Cr.
3.5. POWER SECTOR FINANCING REQUIREMENT RELATIVE TO STATE’S ECONOMY
In this section, the expenditure (under all possible heads) on the power sector by the state
government has been listed to determine the state Power sector financing requirement,
which is then compared to state finances.
The sector financing requirement is estimated as the summation of total expenditure of the
state government on the sector including Capital and Revenue Expenditure, Loans and
Advances (Net Of Recoveries) and Public Debt repaid (Net of Receipts) by the State
Government.
Table VIII-10: Power Sector Financing (2011-12) - Gujarat
Particulars
2011-12
Rs. Cr
Power Sector Expenditure (Capital and Revenue) 4238.91

AF-MERCADOS EMI
Power Sector Operations and Impact on State Finances 114
Particulars
2011-12
Rs. Cr
Loans And Advances made by the State Government (Net of
Recoveries) 16.82
8.5% Tax Free Special Bonds of the State Government (Power
Bonds) disbursed during the year (Net of Receipts)* 0
Loans for Power Projects-T&D from the Central Govt. Discharged
during the year (Net of Receipts) 5.39
Total Power Sector Financing during the year 4261.12
Sector Financing Requirement as a % age of total revenues of state 7.44%
GSDP nominal 3,98,884
Sector Financing Requirement as a % age of GSDP 1.07%
Financial Profit/ (Losses) of DISCOMs during the year (With Subsidy
realized) 134.00
Sector Financing Requirement (including financial losses of Discoms )
as a % age of total revenues of state 7.20%
Sector Financing Requirement (including financial losses of Discoms )
as a % age of GSDP 1.03%
Source: State Government annual accounts from CAG, Data book for DCH - 22nd April, 2013, PFC
Report on Utility finances – 2011-12
The financing requirement for the Power sector in the state was estimated at 7.44% of the
revenue generated by the state and 1.07% of the Gross State Domestic Product. Further,
the profits (with subsidy realized) reduced the financing requirement of the sector to
~7.20% of the state revenue and ~1.03% of the state GSDP.
However, it can be observed that the power sector in Gujarat is self-sufficient and is able
to generate sufficient revenues to cover the state grants.
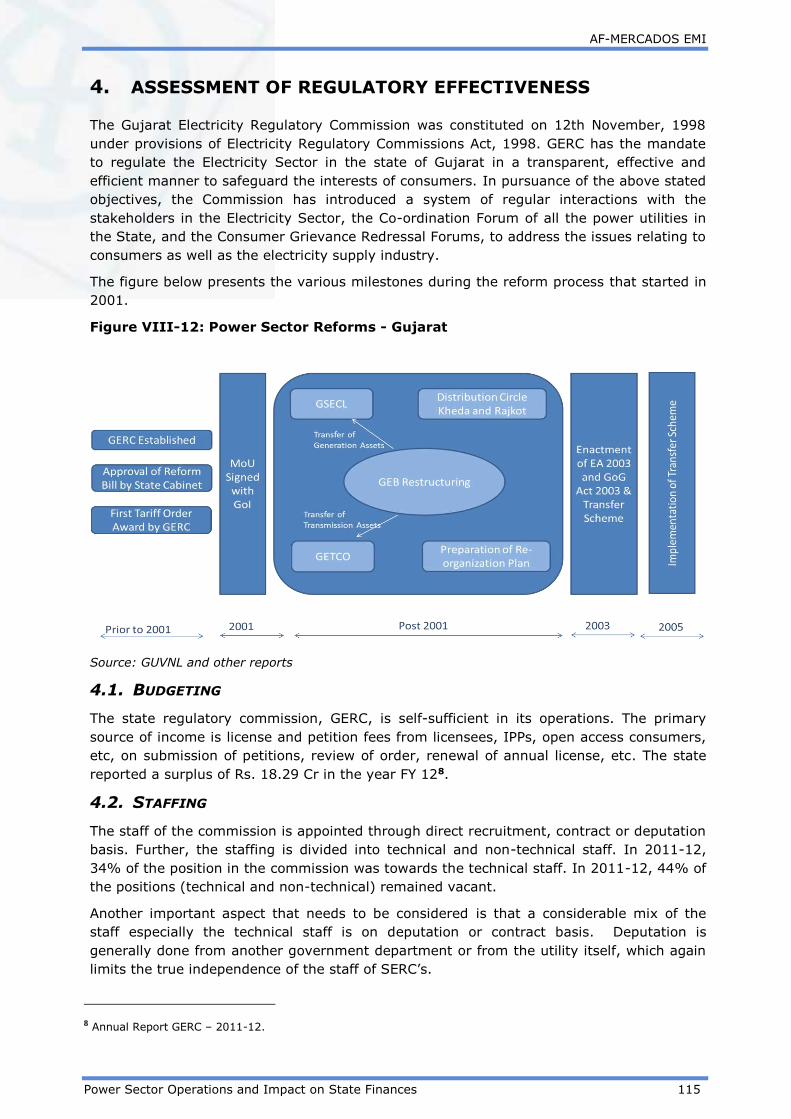
AF-MERCADOS EMI
Power Sector Operations and Impact on State Finances 115
4. ASSESSMENT OF REGULATORY EFFECTIVENESS
The Gujarat Electricity Regulatory Commission was constituted on 12th November, 1998
under provisions of Electricity Regulatory Commissions Act, 1998. GERC has the mandate
to regulate the Electricity Sector in the state of Gujarat in a transparent, effective and
efficient manner to safeguard the interests of consumers. In pursuance of the above stated
objectives, the Commission has introduced a system of regular interactions with the
stakeholders in the Electricity Sector, the Co-ordination Forum of all the power utilities in
the State, and the Consumer Grievance Redressal Forums, to address the issues relating to
consumers as well as the electricity supply industry.
The figure below presents the various milestones during the reform process that started in
2001.
Figure VIII-12: Power Sector Reforms - Gujarat
Source: GUVNL and other reports
4.1. BUDGETING
The state regulatory commission, GERC, is self-sufficient in its operations. The primary
source of income is license and petition fees from licensees, IPPs, open access consumers,
etc, on submission of petitions, review of order, renewal of annual license, etc. The state
reported a surplus of Rs. 18.29 Cr in the year FY 128.
4.2. STAFFING
The staff of the commission is appointed through direct recruitment, contract or deputation
basis. Further, the staffing is divided into technical and non-technical staff. In 2011-12,
34% of the position in the commission was towards the technical staff. In 2011-12, 44% of
the positions (technical and non-technical) remained vacant.
Another important aspect that needs to be considered is that a considerable mix of the
staff especially the technical staff is on deputation or contract basis. Deputation is
generally done from another government department or from the utility itself, which again
limits the true independence of the staff of SERC’s.
8 Annual Report GERC – 2011-12.

AF-MERCADOS EMI
Power Sector Operations and Impact on State Finances 116
4.3. MYT REGULATION
The MYT has been implemented for the second control period. The commission had
selected a shorter first control period (three years). After the successful implementation of
the first control period (FY 09 to FY 11), through reduction in AT&C losses, revenue
realization, improved metering and other operational parameters the state commission
approved second control period for five years (FY 12 to FY 16).
The utilities as per the MYT order are being provided a fixed fuel surcharge (FPPPA), which
is on account of fuel price variations
4.4. LEVEL OF METERING
The commission had directed all the distribution licensees to submit their plans to the state
commission on the level of metering in the state. The state distribution utilities have
submitted that all connections in the state are metered, except the agriculture connections.
Further, the new agriculture connections are provided with meters. The figure below
presents the increase metering in DISCOM (FY 10 to FY 12).
Figure VIII-13: Historical Trend in Agriculture Metering (FY 10 – FY 12) - Gujarat
29%
46%41%
36%31%
50%
63%
43%32%
52%
65%
48%
0%
10%
20%
30%
40%
50%
60%
70%
UGVCL DGVCL MGVCL PGVCL
DISCOM wise Agriculture Metering
FY 10 FY 11 FY 12
Source: Annual Report GERC (FY 10 to FY 12)
4.4.1. AGRICULTURE METERING
The state commission has approved a consumption norm for both the metered and
unmetered agriculture connection in the state. The table below depicts the consumption
norms approved by the commission for unmetered and metered connections.
Table VIII-11: Consumption Norms of Metered and Un Metered Agriculture
Consumers - Gujarat
DISCOM Consumption Norm – Unmetered
Connection
Weighted Average Consumption
Norm – Metered Connections
UGVCL 1700 kWh/HP/annum 970 kWh/HP/annum
MGVCL 1700 kWh/HP/annum 1011 kWh/HP/annum
DGVCL 1700 kWh/HP/annum 524 kWh/HP/annum
PGVCL 1700 kWh/HP/annum 529 kWh/HP/annum
Source: Approved Multi Year Tariff Order, FY 2012-16

AF-MERCADOS EMI
Power Sector Operations and Impact on State Finances 117
Minimum 8 hours of supply is provided to the agriculture consumers, with excess hours of
supply being provided during cropping season. Further, in a critical case when the power
supply is reduced to 5 hours, the shortage of supply is compensated during subsequent
period when power position improved.
4.5. OPEN ACCESS
Gujarat State Load Dispatch Center has been mandated with dealing of open access
function in the state. Open access has started only a few years ago in the State, but has
been well accepted by the players, essentially the captive consumers. In year 2007-08,
total of 5 captive consumers filed applications for open access of 50 MW worth capacity.
However the implementation was in 2 cases with a capacity of 5 MW.
Post 2008-09 several short term open access cases have been received and handled by the
state commission. The figure below presents the short term open access application
statistics in Gujarat from FY 09 to FY 13.
Figure VIII-14: Historical Trend in Short Term Open Access Application (FY 09 –
FY 12) - Gujarat
124650 599
1187
4816
0
1000
2000
3000
4000
5000
6000
2008-09 2009-10 2010-11 2011-12 2012-13
Short Term Open Access Application Statistics - Gujarat
No. of Application Approved No. of Application Rejected
No. of Application Received
Source: SLDC Annual Report, FY 09 to FY 13
Further, the state has granted capacity reaching more than 5009.32 MW or 12629.52 MU
through short-term transactions in the year 2011-12, as shown in the table below:
Table VIII-12: Comparative Analysis of short term transaction in Gujarat – FY 09
and FY 12
2008-09 2011-12
Granted
MW MUs
Granted
MW MUs
Intra State Short Term Open
Access 25 24.5 617.50 2177.99
Power Exchange Transactions 85 86.4 3391.92 4046.38
Bilateral Transactions 441 501.6 999.90 6405.16
Total 551 612.7 5009.32 12629.52
Source: GETCO Annual Reports

AF-MERCADOS EMI
Power Sector Operations and Impact on State Finances 118
5. SUMMARY
1. Demand Supply Gap: The state has completely been able to eliminate the deficit
levels through significant capacity addition in recent years and has resulted in state
having surplus generation capacity.
2. Excess Power Generation: As stated earlier, the excess power generation in the
state could pose a significant financial risk on the state power sector. The gas plants
continue to operate at low PLFs on account of lack or cost of gas and the trend is
expected to continue in near future. GUVNL can redesign the existing contracts
(where technically feasible) of gas plants to supply peaking and Ancillary Services
that would make them productive and perhaps (under revised contracts) reduce the
fixed costs burden. It would also help the state absorb more Renewable Energy in
the system.
3. AT&C Loss Reduction: The state DISCOMs are one of the most efficiently operated
DISCOMs in the country. The DISCOMs have hedged the risk of increasing power
purchase costs through long-term power purchase agreements with generation
units. The year on year tariff revision is aligned to the increasing costs of the state
DISCOMs. Further, the decreasing AT&C losses by the state DISCOMs are have also
reduced the financial burden of the state DISCOMs.
4. Rural Electrification: The state DISCOMs have successfully been able to achieve
100% rural electrification in the state, with provision of three-phase power supply in
more than 18000 villages, through Jyotigram Yojna.
5. Regulatory Effectiveness: The state commission has efficiently been able to
implement most of the policy reforms over the last decade. The financial
independence of the state commission is one of the important factors to achieve the
regulatory effectiveness in the state.
6. Decline in Subsidy: The state distribution utility has witnessed a decline in subsidy
over the span of six years, which reiterates the robust financial policy adopted by
the state distribution utilities to reduce the dependency on the state government
and increase self-sufficiency in the state.
7. Self Sufficiency: The state DISCOMs has consistently reported financial profits (with
subsidy), indicating the financial prudence of the state DISCOMs. Further, the state
power sector generates sufficient revenues to cover the state grants and subsidies
towards the power sector.
The decision to provide metered sales to the new agriculture consumers will reduce the
proportion of un-metered sales in the overall consumer mix in the state and would also
support the state DISCOMs to efficiently ascertain the agricultural demand in the state and
help further reducing the commercial losses.
Although, the current financial health of the power sector pose a low risk on the
state finances, but the increased power purchase costs due to stranded capacity
can pose a financial risk in the future.

AF-MERCADOS EMI
Power Sector Operations and Impact on State Finances 119
IX HARYANA
1. INTRODUCTION
1.1. BACKGROUND – POWER SECTOR OVERVIEW
Haryana, with a population of 2.5 crores is one of the wealthier states in India with second
highest per capita income in the country. The state is located in the northern part of India,
with significant parts of its southern region now a part of the national capital region (NCR).
Over the last decade, a growing manufacturing and services sector has fuelled rapid real
estate and infrastructure growth and a shift away from agriculture in the composition of
the economy. However, despite this Haryana is primarily an agricultural state and
agriculture plays an important role in the state’s identity and economic structure.
Haryana was among the first states to initiate the structural changes considered a
prerequisite for strengthening utility governance and moving the sector towards operating
on commercial principles. Although, was a laggard in terms of implementing the second
generation reforms e.g. MYT etc.
In 1998-99, Government of Haryana (GoH) unbundled the vertically integrated Haryana
State Electricity Board (HSEB) and corporatized the four successor companies - Haryana
Power Generation Corporation Limited (HPGC), to undertake generation of electricity,
Haryana Vidyut Prasaran Nigam Limited (HVPN) to undertake transmission, and Uttar
Haryana Bijli Vitran Nigam Ltd. (UHBVN) and Dakshin Haryana Bijli Vitran Nigam Ltd.
(DHBVN) with the exclusive mandate over electricity distribution and retail supply in the
north and south of the state respectively. The Haryana Electricity Regulatory Commission
(HERC) was set up in 1998, as an autonomous entity responsible for regulation.
1.2. GENERATION MIX
As on Feburary 2014, Haryana’s total generation installed capacity (including allocated
share in Joint & Central Sector plants) of 9,865 MW out of which 74% share is of Coal
based generation, followed by Hydro (17%) and gas (7%). The capacity has grown by 22%
against last year, which was 7695 MW in Feb 2013.
Figure below presents the generation capacity including allocated share in Joint & Central
sector plants.
Figure IX-1: Generation Capacity Mix as on Feb 2014- Haryana
Source: CEA
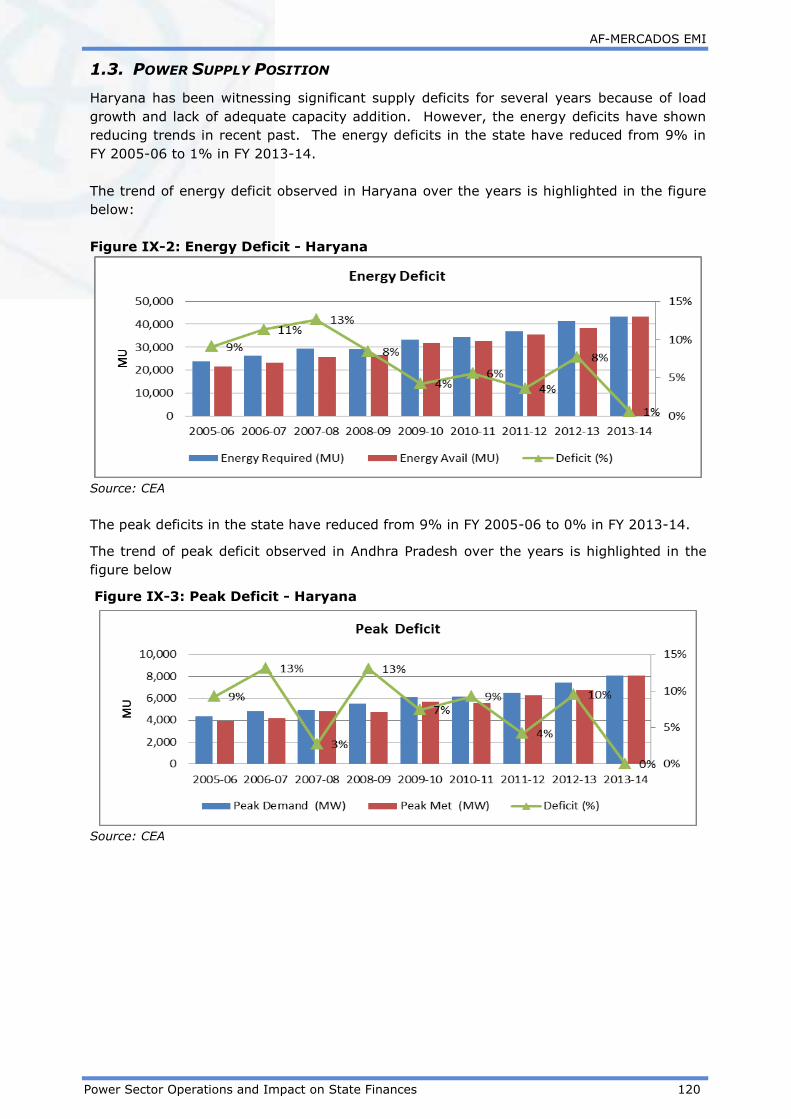
AF-MERCADOS EMI
Power Sector Operations and Impact on State Finances 120
1.3. POWER SUPPLY POSITION
Haryana has been witnessing significant supply deficits for several years because of load
growth and lack of adequate capacity addition. However, the energy deficits have shown
reducing trends in recent past. The energy deficits in the state have reduced from 9% in
FY 2005-06 to 1% in FY 2013-14.
The trend of energy deficit observed in Haryana over the years is highlighted in the figure
below:
Figure IX-2: Energy Deficit - Haryana
Source: CEA
The peak deficits in the state have reduced from 9% in FY 2005-06 to 0% in FY 2013-14.
The trend of peak deficit observed in Andhra Pradesh over the years is highlighted in the
figure below
Figure IX-3: Peak Deficit - Haryana
Source: CEA
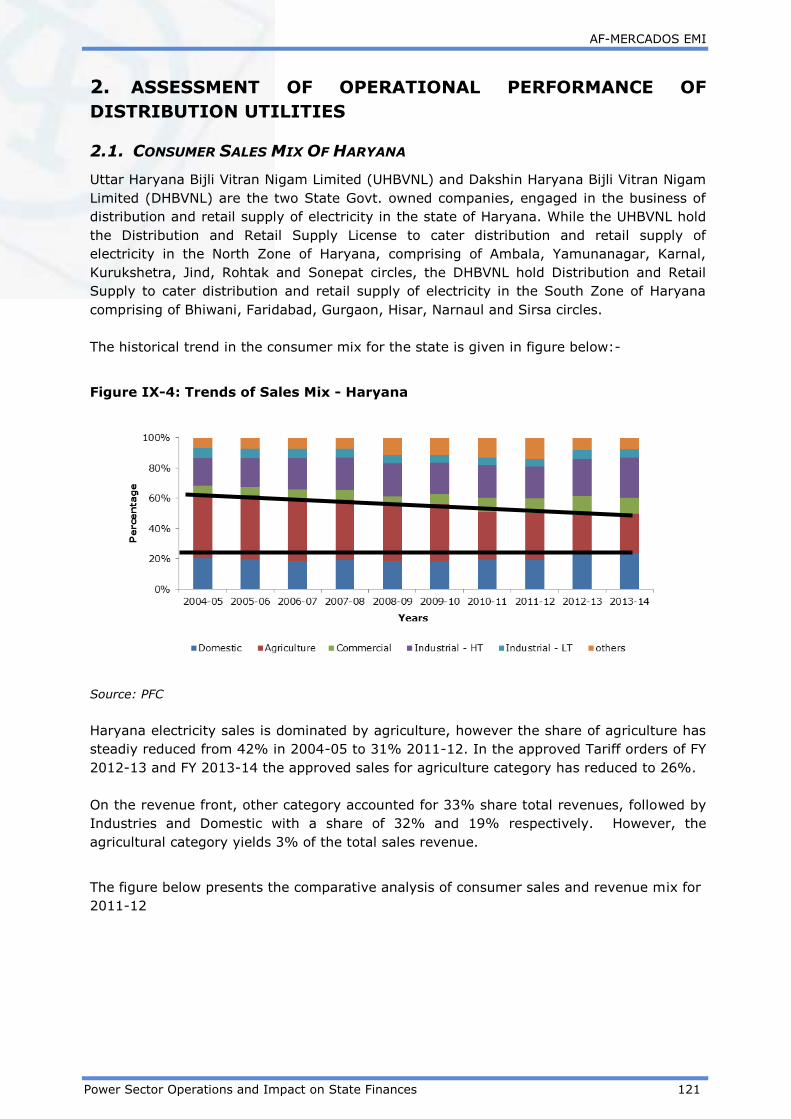
AF-MERCADOS EMI
Power Sector Operations and Impact on State Finances 121
2. ASSESSMENT OF OPERATIONAL PERFORMANCE OF
DISTRIBUTION UTILITIES
2.1. CONSUMER SALES MIX OF HARYANA
Uttar Haryana Bijli Vitran Nigam Limited (UHBVNL) and Dakshin Haryana Bijli Vitran Nigam
Limited (DHBVNL) are the two State Govt. owned companies, engaged in the business of
distribution and retail supply of electricity in the state of Haryana. While the UHBVNL hold
the Distribution and Retail Supply License to cater distribution and retail supply of
electricity in the North Zone of Haryana, comprising of Ambala, Yamunanagar, Karnal,
Kurukshetra, Jind, Rohtak and Sonepat circles, the DHBVNL hold Distribution and Retail
Supply to cater distribution and retail supply of electricity in the South Zone of Haryana
comprising of Bhiwani, Faridabad, Gurgaon, Hisar, Narnaul and Sirsa circles.
The historical trend in the consumer mix for the state is given in figure below:-
Figure IX-4: Trends of Sales Mix - Haryana
Source: PFC
Haryana electricity sales is dominated by agriculture, however the share of agriculture has
steadiy reduced from 42% in 2004-05 to 31% 2011-12. In the approved Tariff orders of FY
2012-13 and FY 2013-14 the approved sales for agriculture category has reduced to 26%.
On the revenue front, other category accounted for 33% share total revenues, followed by
Industries and Domestic with a share of 32% and 19% respectively. However, the
agricultural category yields 3% of the total sales revenue.
The figure below presents the comparative analysis of consumer sales and revenue mix for
2011-12
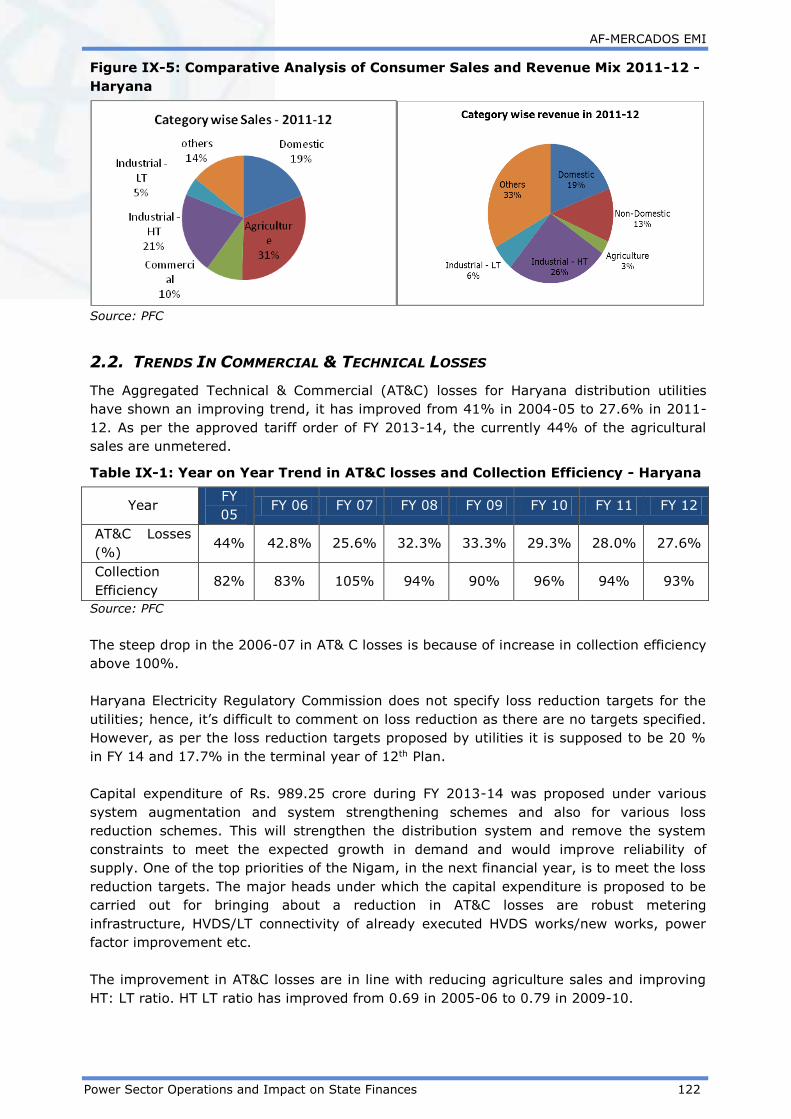
AF-MERCADOS EMI
Power Sector Operations and Impact on State Finances 122
Figure IX-5: Comparative Analysis of Consumer Sales and Revenue Mix 2011-12 -
Haryana
Source: PFC
2.2. TRENDS IN COMMERCIAL & TECHNICAL LOSSES
The Aggregated Technical & Commercial (AT&C) losses for Haryana distribution utilities
have shown an improving trend, it has improved from 41% in 2004-05 to 27.6% in 2011-
12. As per the approved tariff order of FY 2013-14, the currently 44% of the agricultural
sales are unmetered.
Table IX-1: Year on Year Trend in AT&C losses and Collection Efficiency - Haryana
Year FY
05 FY 06 FY 07 FY 08 FY 09 FY 10 FY 11 FY 12
AT&C Losses
(%) 44% 42.8% 25.6% 32.3% 33.3% 29.3% 28.0% 27.6%
Collection
Efficiency 82% 83% 105% 94% 90% 96% 94% 93%
Source: PFC
The steep drop in the 2006-07 in AT& C losses is because of increase in collection efficiency
above 100%.
Haryana Electricity Regulatory Commission does not specify loss reduction targets for the
utilities; hence, it’s difficult to comment on loss reduction as there are no targets specified.
However, as per the loss reduction targets proposed by utilities it is supposed to be 20 %
in FY 14 and 17.7% in the terminal year of 12th Plan.
Capital expenditure of Rs. 989.25 crore during FY 2013-14 was proposed under various
system augmentation and system strengthening schemes and also for various loss
reduction schemes. This will strengthen the distribution system and remove the system
constraints to meet the expected growth in demand and would improve reliability of
supply. One of the top priorities of the Nigam, in the next financial year, is to meet the loss
reduction targets. The major heads under which the capital expenditure is proposed to be
carried out for bringing about a reduction in AT&C losses are robust metering
infrastructure, HVDS/LT connectivity of already executed HVDS works/new works, power
factor improvement etc.
The improvement in AT&C losses are in line with reducing agriculture sales and improving
HT: LT ratio. HT LT ratio has improved from 0.69 in 2005-06 to 0.79 in 2009-10.
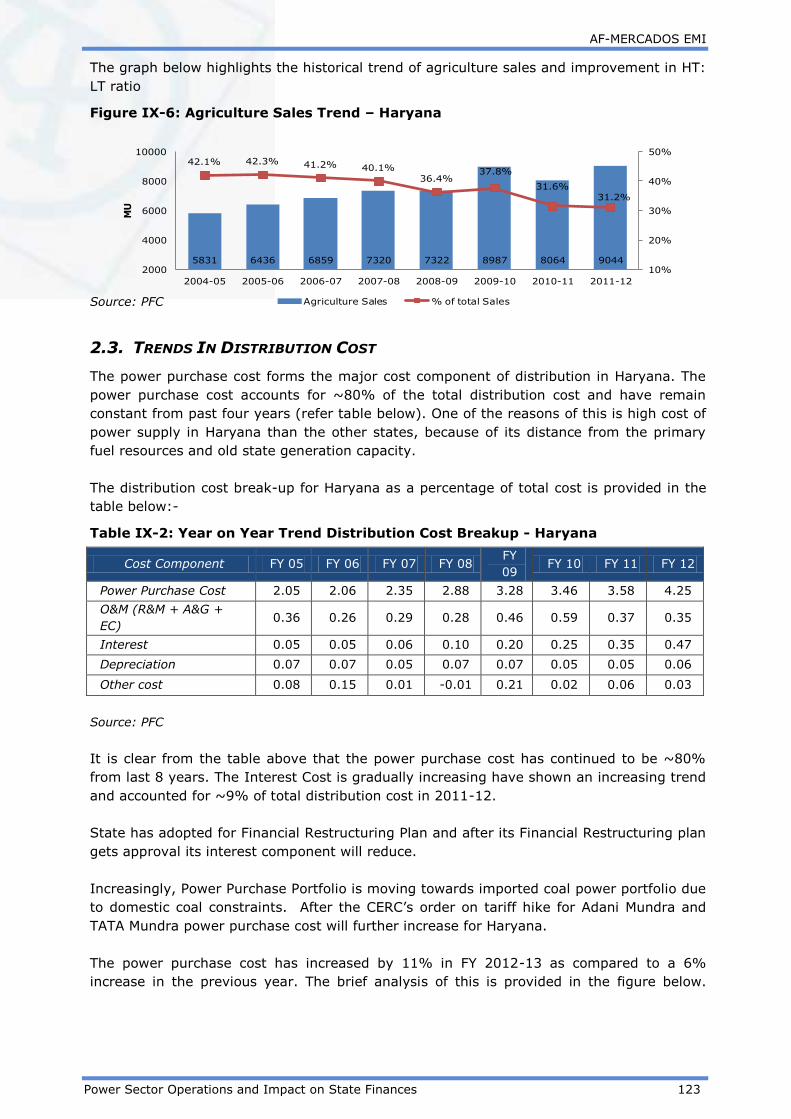
AF-MERCADOS EMI
Power Sector Operations and Impact on State Finances 123
The graph below highlights the historical trend of agriculture sales and improvement in HT:
LT ratio
Figure IX-6: Agriculture Sales Trend – Haryana
Source: PFC
2.3. TRENDS IN DISTRIBUTION COST
The power purchase cost forms the major cost component of distribution in Haryana. The
power purchase cost accounts for ~80% of the total distribution cost and have remain
constant from past four years (refer table below). One of the reasons of this is high cost of
power supply in Haryana than the other states, because of its distance from the primary
fuel resources and old state generation capacity.
The distribution cost break-up for Haryana as a percentage of total cost is provided in the
table below:-
Table IX-2: Year on Year Trend Distribution Cost Breakup - Haryana
Cost Component FY 05 FY 06 FY 07 FY 08 FY
09 FY 10 FY 11 FY 12
Power Purchase Cost 2.05 2.06 2.35 2.88 3.28 3.46 3.58 4.25
O&M (R&M + A&G +
EC) 0.36 0.26 0.29 0.28 0.46 0.59 0.37 0.35
Interest 0.05 0.05 0.06 0.10 0.20 0.25 0.35 0.47
Depreciation 0.07 0.07 0.05 0.07 0.07 0.05 0.05 0.06
Other cost 0.08 0.15 0.01 -0.01 0.21 0.02 0.06 0.03
Source: PFC
It is clear from the table above that the power purchase cost has continued to be ~80%
from last 8 years. The Interest Cost is gradually increasing have shown an increasing trend
and accounted for ~9% of total distribution cost in 2011-12.
State has adopted for Financial Restructuring Plan and after its Financial Restructuring plan
gets approval its interest component will reduce.
Increasingly, Power Purchase Portfolio is moving towards imported coal power portfolio due
to domestic coal constraints. After the CERC’s order on tariff hike for Adani Mundra and
TATA Mundra power purchase cost will further increase for Haryana.
The power purchase cost has increased by 11% in FY 2012-13 as compared to a 6%
increase in the previous year. The brief analysis of this is provided in the figure below.
5831 6436 6859 7320 7322 8987 8064 9044
42.1% 42.3% 41.2% 40.1%
36.4%37.8%
31.6%31.2%
10%
20%
30%
40%
50%
2000
4000
6000
8000
10000
2004-05 2005-06 2006-07 2007-08 2008-09 2009-10 2010-11 2011-12
MU
Agriculture Sales % of total Sales
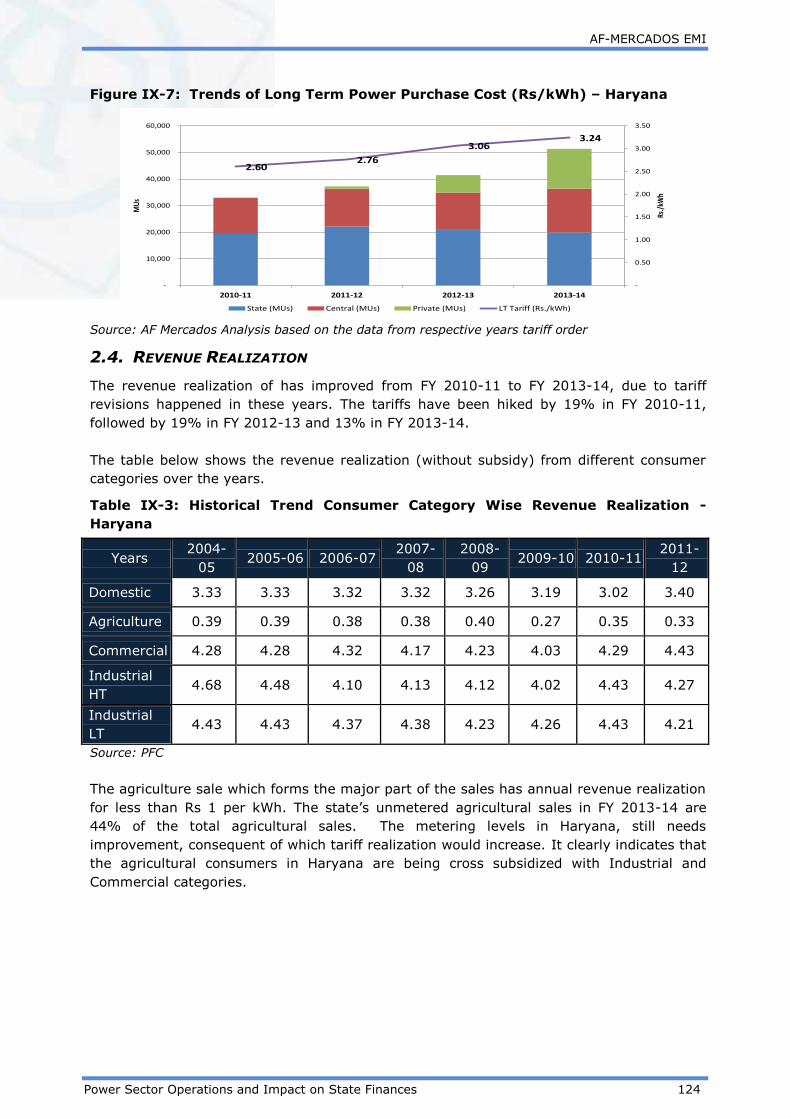
AF-MERCADOS EMI
Power Sector Operations and Impact on State Finances 124
Figure IX-7: Trends of Long Term Power Purchase Cost (Rs/kWh) – Haryana
2.60 2.76
3.06 3.24
-
0.50
1.00
1.50
2.00
2.50
3.00
3.50
-
10,000
20,000
30,000
40,000
50,000
60,000
2010-11 2011-12 2012-13 2013-14
Rs./
kWh
MU
s
State (MUs) Central (MUs) Private (MUs) LT Tariff (Rs./kWh)
Source: AF Mercados Analysis based on the data from respective years tariff order
2.4. REVENUE REALIZATION
The revenue realization of has improved from FY 2010-11 to FY 2013-14, due to tariff
revisions happened in these years. The tariffs have been hiked by 19% in FY 2010-11,
followed by 19% in FY 2012-13 and 13% in FY 2013-14.
The table below shows the revenue realization (without subsidy) from different consumer
categories over the years.
Table IX-3: Historical Trend Consumer Category Wise Revenue Realization -
Haryana
Years 2004-
05 2005-06 2006-07
2007-
08
2008-
09 2009-10 2010-11
2011-
12
Domestic 3.33 3.33 3.32 3.32 3.26 3.19 3.02 3.40
Agriculture 0.39 0.39 0.38 0.38 0.40 0.27 0.35 0.33
Commercial 4.28 4.28 4.32 4.17 4.23 4.03 4.29 4.43
Industrial
HT 4.68 4.48 4.10 4.13 4.12 4.02 4.43 4.27
Industrial
LT 4.43 4.43 4.37 4.38 4.23 4.26 4.43 4.21
Source: PFC
The agriculture sale which forms the major part of the sales has annual revenue realization
for less than Rs 1 per kWh. The state’s unmetered agricultural sales in FY 2013-14 are
44% of the total agricultural sales. The metering levels in Haryana, still needs
improvement, consequent of which tariff realization would increase. It clearly indicates that
the agricultural consumers in Haryana are being cross subsidized with Industrial and
Commercial categories.

AF-MERCADOS EMI
Power Sector Operations and Impact on State Finances 125
3. ASSESSMENT OF FINANCIAL PERFORMANCE OF –
DISTRIBUTION UTILITY
3.1. FINANCIAL HEALTH OF DISTRIBUTION UTILITIES
The financial losses of distribution utilities combined have increased every year with an
improvement in FY 2010-11, where tariff hike by 19% was approved by the regulator.
Figure IX-8: Historical Trend Financial Losses (w/o) subsidies – Haryana
Source: PFC
The financial losses have increased substantially in FY 2011-12 due to substantial increase
in power purchase cost (increase by 31% over last year) and interest cost (increase by
49% over last year). The total accumulated losses till FY 2011-12 are over 9700 Cr.
3.2. SUBSIDY BOOKED V/S SUBSIDY RECEIVED
The subsidy burden of the State Government has been high over the years. In 2011-12,
subsidy booked was 32% of the total revenues (excluding subsidy) which was 29% in FY
2004-05. The graph below highlights the subsidy booked v/s subsidy received.
Figure IX-9: Historical Trend Subsides Booked v/s Subsidies Received – Haryana
Source: PFC
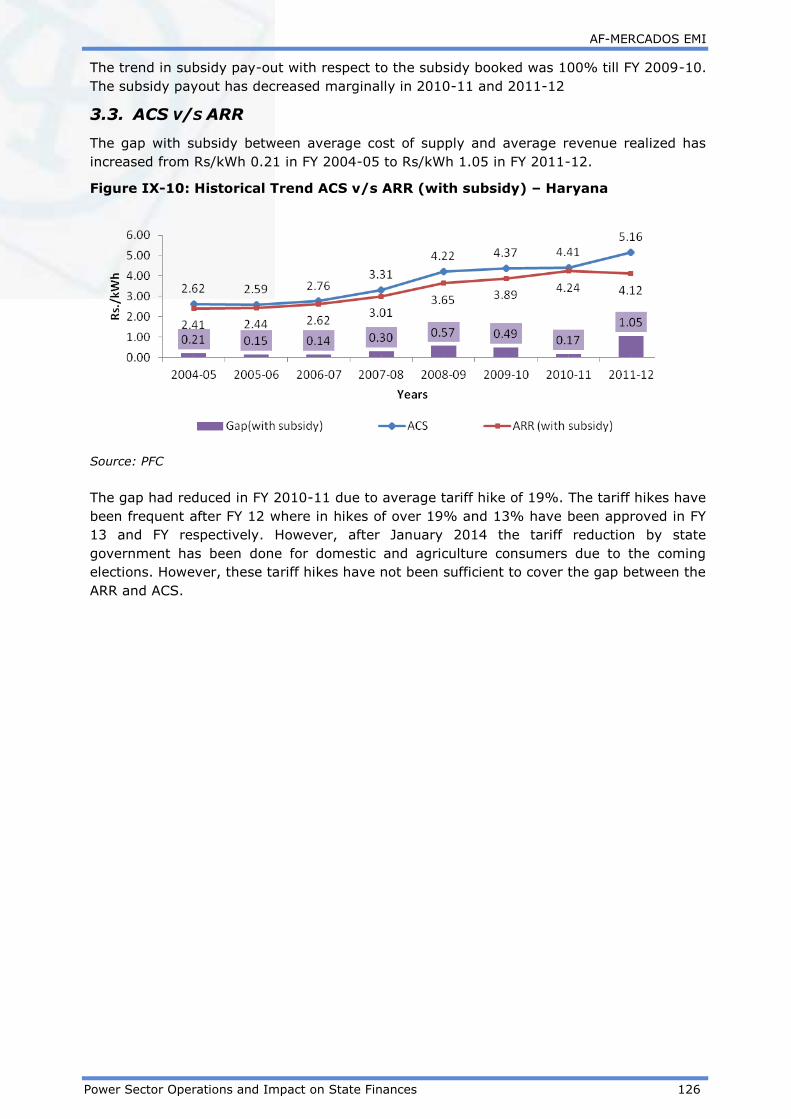
AF-MERCADOS EMI
Power Sector Operations and Impact on State Finances 126
The trend in subsidy pay-out with respect to the subsidy booked was 100% till FY 2009-10.
The subsidy payout has decreased marginally in 2010-11 and 2011-12
3.3. ACS V/S ARR
The gap with subsidy between average cost of supply and average revenue realized has
increased from Rs/kWh 0.21 in FY 2004-05 to Rs/kWh 1.05 in FY 2011-12.
Figure IX-10: Historical Trend ACS v/s ARR (with subsidy) – Haryana
Source: PFC
The gap had reduced in FY 2010-11 due to average tariff hike of 19%. The tariff hikes have
been frequent after FY 12 where in hikes of over 19% and 13% have been approved in FY
13 and FY respectively. However, after January 2014 the tariff reduction by state
government has been done for domestic and agriculture consumers due to the coming
elections. However, these tariff hikes have not been sufficient to cover the gap between the
ARR and ACS.

AF-MERCADOS EMI
Power Sector Operations and Impact on State Finances 127
4. STATE EXPOSURE TO POWER SECTOR
4.1. INCOME FROM POWER SECTOR
The tax income is majorly through electricity distribution tax, which is paid by the
distribution utilities to the state government. The tax revenue from the power sector forms
~1% of the total tax revenue.
Table IX-4: Tax Revenue from Power Sector - Haryana
Revenue 2009-10 2010-11 2011-12
Rs Cr
Tax Revenue from Power Sector 120 130 166.43
Total Tax Revenue 14,994 19,092 23,081.00
Power sector Tax Revenue / Total
state Tax Revenue 1% 1% 1%
Source: Audited CAG Accounts for the state 2011-12, 2010-11, 2009-10
The Non Tax revenue, formed a marginal 0.07% of the total non-tax revenues in 2011-12.
The non-tax revenue from power sector is through royalty/cess on water for power
generation. The details for the same are provided in the table below.
Table IX-5: Non-Tax Revenue from Power Sector - Haryana
Revenue 2009-10 2010-11 2011-12
Rs Cr
Non Tax Revenue From Power
Sector 120 130 166
Total Non-Tax Revenue 2,741 3,421 4,721.65
Power sector Non-Tax Revenue
/Total state Non-Tax Revenue 4.36% 3.81% 3.52%
Source: Audited CAG Accounts for the state 2011-12, 2010-11, 2009-10
Even though the non tax revenue has increased from Rs 120 Cr in FY10 to Rs 166 Cr in
FY12, there has been a decrease in contribution of power sector in state non tax revenues.
The Non Tax revenue from the Power Sector appear as General Receipts in the CAG
accounts
The overall income generated from power sector, has increased from Rs 111 Cr in
2009-10 to Rs. 169.66 Cr in 2011-12.
4.2. EXPENDITURE ON POWER SECTOR
The table below depicts the expenditure towards power sector by the state of Haryana
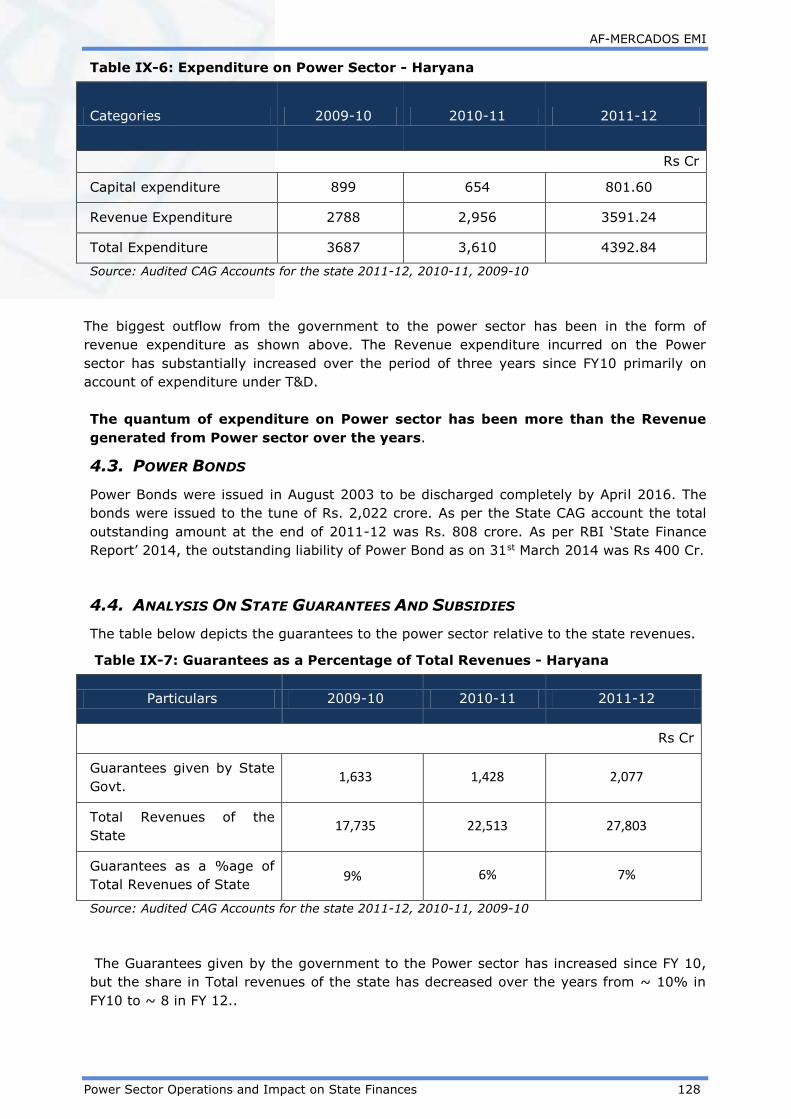
AF-MERCADOS EMI
Power Sector Operations and Impact on State Finances 128
Table IX-6: Expenditure on Power Sector - Haryana
Categories 2009-10 2010-11 2011-12
Rs Cr
Capital expenditure 899 654 801.60
Revenue Expenditure 2788 2,956 3591.24
Total Expenditure 3687 3,610 4392.84
Source: Audited CAG Accounts for the state 2011-12, 2010-11, 2009-10
The biggest outflow from the government to the power sector has been in the form of
revenue expenditure as shown above. The Revenue expenditure incurred on the Power
sector has substantially increased over the period of three years since FY10 primarily on
account of expenditure under T&D.
The quantum of expenditure on Power sector has been more than the Revenue
generated from Power sector over the years.
4.3. POWER BONDS
Power Bonds were issued in August 2003 to be discharged completely by April 2016. The
bonds were issued to the tune of Rs. 2,022 crore. As per the State CAG account the total
outstanding amount at the end of 2011-12 was Rs. 808 crore. As per RBI ‘State Finance
Report’ 2014, the outstanding liability of Power Bond as on 31st March 2014 was Rs 400 Cr.
4.4. ANALYSIS ON STATE GUARANTEES AND SUBSIDIES
The table below depicts the guarantees to the power sector relative to the state revenues.
Table IX-7: Guarantees as a Percentage of Total Revenues - Haryana
Particulars 2009-10 2010-11 2011-12
Rs Cr
Guarantees given by State
Govt. 1,633 1,428 2,077
Total Revenues of the
State 17,735 22,513 27,803
Guarantees as a %age of
Total Revenues of State 9% 6% 7%
Source: Audited CAG Accounts for the state 2011-12, 2010-11, 2009-10
The Guarantees given by the government to the Power sector has increased since FY 10,
but the share in Total revenues of the state has decreased over the years from ~ 10% in
FY10 to ~ 8 in FY 12..

AF-MERCADOS EMI
Power Sector Operations and Impact on State Finances 129
The table below depicts the three year average share of different utilities in sector
guarantees:
Table IX-8: Guarantees Utility wise Breakup - Haryana
Utilities 2009-10 2010-11 2011-12
Average
Share in
Sector
Guarantees
(%)
Rs Cr
Haryana Power Generation
Limited 443 352 253 20%
Haryana Vidyut Parsaran
Nigam Limited 1,137 1,037 1,006 62%
Uttar Haryana Bijli Vitran
Nigam Limited 29 21 321 7%
Dakshin Haryana Bijli
Vitran Nigam 24 17 497 10%
Source: Audited CAG Accounts for the state 2011-12, 2010-11, 2009-10
The Guarantees to the power sector has primarily risen due to increase in Guarantees
towards Discoms and Genco. Over the span of three years, Discoms accounted for a share
of 53% in the Power Sector Guarantees.
Subsidy
The table below depicts the average share of utilities in subsidies given to Power sector and
the average share of sector in total state subsidy over three years:
Table IX-9: Power Sector Subsidy as a Percentage of overall subsidy - Haryana
Particulars 2009-10 2010-11 2011-12
Average
Share in
Sector
Subsidy
(%)
Rs Cr
Transmission and
Distribution- 2,771 2,940 3,576.58 99.7%
New and Renewable Energy 8 8 7.47 0.3%
Special Component Plan for
Scheduled Castes 1 1 0.70 0.0%
Power Sector Subsidy/
Total State Subsidy 2,780 2,949 3,584.75 91.1%
Source: Audited CAG Accounts for the state 2011-12, 2010-11, 2009-10

AF-MERCADOS EMI
Power Sector Operations and Impact on State Finances 130
Over the span of three years subsidy to the T&D accounted for ~99% of the total subsidy
given to the Power Sector by the state government. The sector accounted for a significant
three year aggregate share of 91% in the total state subsidy.
4.5. POWER SECTOR FINANCING REQUIREMENT RELATIVE TO STATE ECONOMY
In this section, the expenditure (under all possible heads) on the power sector by the state
government has been listed to determine the state Power sector financing requirement
which is then compared to state finances.
The sector financing requirement is estimated as the summation of total expenditure of the
state government on the sector including Capital and Revenue Expenditure, Loans and
Advances (Net Of Recoveries) and Public Debt repaid (Net of Receipts) by the State
Government.
Table IX-10: Power Sector Financing Requirement (2011-12) - Haryana
Particulars
2011-12
Rs Cr
Power Sector Expenditure (Capital and Revenue) 4,392.84
Loans And Advances made by the State Government (Net of
Recoveries) 127.02
8.5% Tax Free Special Bonds of the State Government (Power Bonds)
disbursed during the year (Net of Receipts)* 202.23
Loans for Power Projects-T&D from the Central Govt. Discharged during
the year (Net of Receipts) 0.10
Total Power Sector Financing during the year 4,722.20
Sector Financing Requirement as a % age of total revenues of state 17%
GSDP nominal 179097.00
Sector Financing Requirement as a % age of GSDP 2.64%
Financial Profits/(Loss) of Discoms during the year (with subsidy
realized) (3674.00)
Sector Financing Requirement (including financial losses of Discoms )
as a % age of total revenues of state 30%
Sector Financing Requirement (including financial losses of Discoms )
as a % age of GSDP 4.69%
Source: State Government annual accounts from CAG, Data book for DCH - 22nd April, 2013, PFC
Report on Utility finances – 2011-12
The financing requirement for the Power sector in the state has been estimated at 17% of
the revenue generated by the state and 2.64 % of the Gross State Domestic Product.

AF-MERCADOS EMI
Power Sector Operations and Impact on State Finances 131
In order to cover the financial losses of Discoms in 2011-12, the financing requirement of
the sector increases to 30% as a percentage of the State revenue and 4.69 % as a
percentage of the GSDP.

AF-MERCADOS EMI
Power Sector Operations and Impact on State Finances 132
5. FINANCIAL RESTRUCTURING PLAN
Increase in power purchase costs, inadequate tariff hikes, almost free supply of electricity
to the agricultural sector and low subsidy realization from the state government has
deteriorated the financial position of the utilities in the state. In this context, distribution
utilities of Andhra Pradesh adopted the FRP of the central government. The current status
and likely outlook of FRP in the state is discussed in the section below.
5.1. STATUS OF FINANCIAL RESTRUCTURING PLAN
Given below is the current status of the implementation of financial restructuring plan
(FRP) in the state.
Table IX-11: Current Status of FRP in Haryana
Haryana
Accumulated Losses as on
31.3.2012
19707 cr.
STL (eligible under the
scheme)
14,764 cr.
Bonds issued by Discoms to
participating lenders
7366 cr.
Tariff petition for 2014-15 ARR filed
Operational losses to be
funded (2013-14)
2018 cr.
Road-Map for private
participation in distribution
Under finalization
Status of liquidation of
regulatory assets
HERC has allowed 45% during
current year
Status of preparation of
time bound plan for
metering of all category of
consumers
Being Prepared
Status of enactment of
State Electricity
Distribution Responsibility
Bill
Under Progress
The financial restructuring plan for Haryana has been approved by the government and the
banks. The restructuring amount eligible under the scheme is Rs. 14,764 crore. 50% of
short-term liabilities stand at Rs 7,366 crore as of 1st March, 2012. As part of the plan, the
tariff petition for 2014-15 has been filed. Also, the commission has allowed liquidation of
45% of the regulatory assets during the current year.
5.2. FRP OUTLOOK
In this section, key parameters for the state have been looked at in order to comment on
the likeliness of the state to meet the mandatory conditions set forth by the FRP and be
eligible for the central grants incentive scheme.
The color scheme used in the table depicting state parameters refers to the color key
provided here -
Area of concern
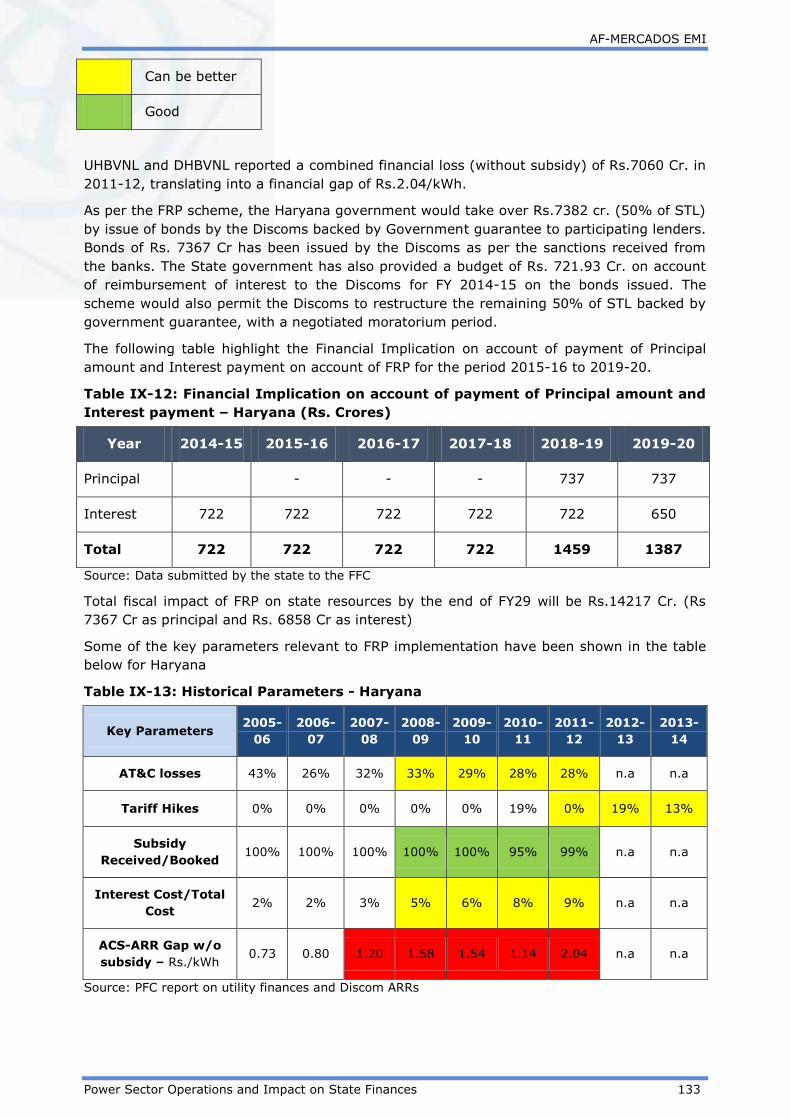
AF-MERCADOS EMI
Power Sector Operations and Impact on State Finances 133
Can be better
Good
UHBVNL and DHBVNL reported a combined financial loss (without subsidy) of Rs.7060 Cr. in
2011-12, translating into a financial gap of Rs.2.04/kWh.
As per the FRP scheme, the Haryana government would take over Rs.7382 cr. (50% of STL)
by issue of bonds by the Discoms backed by Government guarantee to participating lenders.
Bonds of Rs. 7367 Cr has been issued by the Discoms as per the sanctions received from
the banks. The State government has also provided a budget of Rs. 721.93 Cr. on account
of reimbursement of interest to the Discoms for FY 2014-15 on the bonds issued. The
scheme would also permit the Discoms to restructure the remaining 50% of STL backed by
government guarantee, with a negotiated moratorium period.
The following table highlight the Financial Implication on account of payment of Principal
amount and Interest payment on account of FRP for the period 2015-16 to 2019-20.
Table IX-12: Financial Implication on account of payment of Principal amount and
Interest payment – Haryana (Rs. Crores)
Year 2014-15 2015-16 2016-17 2017-18 2018-19 2019-20
Principal - - - 737 737
Interest 722 722 722 722 722 650
Total 722 722 722 722 1459 1387
Source: Data submitted by the state to the FFC
Total fiscal impact of FRP on state resources by the end of FY29 will be Rs.14217 Cr. (Rs
7367 Cr as principal and Rs. 6858 Cr as interest)
Some of the key parameters relevant to FRP implementation have been shown in the table
below for Haryana
Table IX-13: Historical Parameters - Haryana
Key Parameters 2005-
06
2006-
07
2007-
08
2008-
09
2009-
10
2010-
11
2011-
12
2012-
13
2013-
14
AT&C losses 43% 26% 32% 33% 29% 28% 28% n.a n.a
Tariff Hikes 0% 0% 0% 0% 0% 19% 0% 19% 13%
Subsidy
Received/Booked 100% 100% 100% 100% 100% 95% 99% n.a n.a
Interest Cost/Total
Cost 2% 2% 3% 5% 6% 8% 9% n.a n.a
ACS-ARR Gap w/o
subsidy – Rs./kWh 0.73 0.80 1.20 1.58 1.54 1.14 2.04 n.a n.a
Source: PFC report on utility finances and Discom ARRs

AF-MERCADOS EMI
Power Sector Operations and Impact on State Finances 134
Some of the key observations from the above table, along with relevant state-level aspects
are listed below.
- The AT&C losses have come down considerably in the last few years – from over
40% in 2005-06 to 28% in 2011-12. This is in line with reducing agricultural sales. A
>1.5% annual reduction in AT&C losses is required in order to benefit from the
central grants scheme. If the discoms continue to reduce AT&C losses at the rate
they have decreased in the past, the potential grants from the central government
will be significant.
- The tariffs were not revised for a period of 8 years. While the tariffs have been
revised in the last 2-3 years, the frequency of these hikes will play a key role in
determining the financial gap in the future.
- The subsidy received-booked ratio has consistently been close to 100%, indicating
that the Discom, regulator, and the state government have been in sync with respect
to the amount booked and actually disbursed. It is however important to note that
since the FRP requires the state government to release agricultural subsidy based
purely on accurate feeder metering data levels, it might limit subsidy levels
considering the lack of complete agricultural metering in the state. At present, the
agricultural metering is 44%.
- The share of Interest expenses is increasing significantly YoY. With the moratorium
on principal repayments on 50% STL and the remaining being taken over by the
government, the interest burden will reduce to some extent in the short term.
- The ACS-ARR Gap needs to be reduced annually by 25% of the 2010-11 benchmark
level in the moratorium period, in order to be eligible for the central grants incentive.
By 2014-15, the Gap will need to be reduced to 28 paise/unit. To reduce the financial
gap by that extent, tariff revisions will need to be frequent and substantial.
In Haryana, AT&C losses have improved significantly over the years. However, tariff
revisions have not been frequent. Regular tariff revisions in the last 2-3 years point towards
the utilities’ intent to improve its financial health and meet the requirements set forth by the
FRP.

AF-MERCADOS EMI
Power Sector Operations and Impact on State Finances 135
6. ASSESSMENT OF REGULATORY EFFECTIVENESS
Haryana Electricity Regulatory Commissions (HERC) was established in August 1998.
Haryana was one of the first few states in India who endeavored to implement
comprehensive power sector reforms much before the enactment of the Electricity Act,
2003 by the Government of India.
The aspects of regulatory effectiveness are discussed below:-
6.1. STATUS OF IMPORTANT REGULATIONS :
The state has notified MYT regulations for the first control period from FY 2014-15 to FY
2016-17.
Table IX-14: Details of MYT Regulations (2011-12) - Haryana
States Control Period Control Period
No.1
Haryana First control period = 3 years; for Generation,
Transmission, Wheeling and Distribution
FY 2014-15 to FY
2016-17
Source: CEA
6.2. STATUS OF OPEN ACCESS IMPLEMENTATION :
Haryana Electricity Regulatory Commission has notified (Terms and Conditions for grant of
connectivity and open access for intra-state transmission and distribution system)
Regulations, 2012. Cross Subsidy Surcharge in Haryana (Rs. 0.53/kWh) is comparable to
Gujarat (Rs. 0.45/kWh), Bihar (Rs. 0.50/kWh) and is less than in Maharashtra (~Rs.
2.30/kWh) Punjab (Rs. 1.07/kWh) and West Bengal (Rs. 2.21/kWh)
Though there has been an increase in number of consumers over the years, the number is
not significant when compared to other States like T.N., Punjab, and Rajasthan (despite
the fact that Haryana has a huge industrial base). The details are provided below:-
Figure IX-11: Trends of Open Access – Haryana
Source: IEX
Non-tariff barriers like requirement of independent feeder is a concern for consumers
connected on mixed feeder.

AF-MERCADOS EMI
Power Sector Operations and Impact on State Finances 136
6.3. FREQUENCY OF TARIFF REVISIONS:
The tariff revisions were done in FY 2010-11 after a gap of 8 years wherein tariffs were
hiked substantially i.e. 19%. Thereafter commission has approved a tariff hike in FY 2012-
13 & FY 2013-14 by 19% and 13% respectively. The table below provides the details of
tariff revision in the state.
Table IX-15: Trends of Tariff Revisions - Haryana
FY
05
FY 06 FY 07 FY
08
FY
09
FY
10
FY 11 FY
12
FY
13
FY 14
Average
Tariff
Revisions
0% 0% 0% 0% 0% 0% 19% 0% 19% 13%
6.4. REVIEW OF APPROACHES ADOPTED FOR MEASURING AGRICULTURAL
CONSUMPTION
In 2011-12, agricultural sales in Haryana contributed to ~31% of total sales. As per the
approved tariff order for 2013-14, unmetered agricultural sales approved by Commission
are 44% of total agricultural sales.
The Commission in Haryana has estimates consumption of Agricultural Pump (AP)
consumers on the basis of the actual consumptions recorded by the energy meters
installed on 11 KV segregated AP feeders at the grid substations and a small percentage of
consumption of AP consumers connected on feeders other than the segregated AP feeders.
The Commission has retained the same methodology for projecting AP Sales from past five
years.
The tariff applicable for agriculture pump (AP) supply consumers in Haryana is currently
under two categories i.e. AP metered consumers billed on energy consumption basis and
AP un – metered consumers who are currently paying a flat rate per BHP per month. As per
CoS estimates of the Commission the AP consumers are paying just about 6% of the CoS.
However, as per the Commission order that the entire revenue gap in the AP consumer
category is bridged by way of AP Subsidy from the State Government and no consumer
category is cross – subsidizing the AP consumers.

AF-MERCADOS EMI
Power Sector Operations and Impact on State Finances 137
7. SUMMARY
The key aspects of the state are discussed below :-
1. Tariff Hikes: In line with increasing gap between ACS and ARR the tariffs have been
hiked every year from 2010-11 to 2013-14.
2. Subsidy: The trend in subsidy pay-out with respect to subsidy booked was 100% till FY
2009-10. However, Subsidy payout has decreased marginally in 2010-11 and 2011-12
3. Past Financial Baggage: 8.5% Tax Free Special Bonds of the State Government
(Power Bonds) were issued by State Government in August 2003 to be discharged
completely by April 2016. The bonds were issued to the tune of Rs. 2, 022 Crores. The
total outstanding at the end of 2011-12 was Rs. 808 Crores
4. Operational Efficiency: The cost of supply of Discoms has been increasing over the
years especially due to the increase in power purchase costs and interest burden. AT&C
losses are decreasing but are still at a higher level. The distribution loss reduction plan
aims to bring losses at 12.2% by FY 2021-22 prepared under the FRP by Haryana
Discoms. Efficiency gains need to be pushed forward- Tariffs are already high
after increases in FY 13 and 14.
5. Power Purchase Cost: State should optimize power purchase and a power sale given it
has a relative surplus.
6. States Guarantees: for the sector are significant and account for ~8% of Total
Revenues of the state
7. Financial Restructuring Plan: The financial restructuring plan for Haryana has been
approved by the government and the banks. The restructuring amount eligible under the
scheme is Rs. 14,764 crore. 50% of short-term liabilities stand at Rs 7,366 crore as of
1st March, 2012.
8. Revenues from the sector to the state: Total Revenue (Rs. 169 Crores) from the
Power sector is less than the total expenditure on the sector (Rs. 4394 Crores). The
revenues of the State Government from the taxes imposed on the distribution of
electricity are to the tune of Rs.155 Crores. Income of HERC in 2011-12 was 3.2 Cores
as against expenditure of 3.1 Crores. The expenditure of the Commission is met mainly
by Grants from the State Government

AF-MERCADOS EMI
Power Sector Operations and Impact on State Finances 138
X HIMACHAL PRADESH
1. INTRODUCTION
1.1. BACKGROUND – POWER SECTOR OVERVIEW
The economy of Himachal Pradesh is currently the third fastest growing economy in India.
Himachal Pradesh has been ranked fourth in the list of the highest per capita incomes of
Indian states9. The abundance of perennial rivers enables Himachal to sell hydroelectricity
to other states such as Delhi, Punjab, and Rajasthan. The economy of the state is highly
dependent on three sources: hydroelectric power, tourism, and agriculture.
The Himachal Pradesh State Electricity Board (HPSEB) was constituted in accordance with
the provisions of Electricity Supply Act (1948) in the year 1971. HPSEB was responsible for
all the three function of power sector viz. Generation, Transmission and Distribution of
electricity, until 2006, when Himachal Pradesh Power Corporation Limited (HPPCL) a
separate Generation Company was created for execution of new projects in State sector.
In June 10, 2010, HPSEB was unbundled and the functions of generation, distribution and
trading of electricity was transferred to Himachal Pradesh State Electricity Board Limited
(HPSEBL) and the function of evacuation of power by transmission lines to Himachal
Pradesh Power Transmission Company Limited (HPPTCL), vide the Himachal Pradesh Power
Sector Reforms Transfer Scheme, 2010.
With a hydro power potential of 23,000 megawatt (MW), out of which just 8,368 MW has
been harnessed, Himachal Pradesh accounts for 25 per cent of the country’s total hydro
power potential10. The state also boasts of a high level of village electrification; about
17,480 of 17,495 villages had been electrified by the end of March 2013.
1.2. GENERATION MIX
The total installed capacity as on February 2014 (including allocated share in Joint &
Central Sector plants) for Himachal Pradesh was ~3865 MW. It has grown by mere 4%
from Feb 2013 from the level of 3,714 MW . Out of total capacity as on Feb 2014, large
hydro based power capacity accounted for ~77% followed by renewable energy (16% )
and Thermal (~6%).
Figure below highlights the generation capacity including allocated share in Joint & Central
sector plants.
9 Indian Brand Equity Foundation (IBEF)
10 Indian Brand Equity Foundation (IBEF)

AF-MERCADOS EMI
Power Sector Operations and Impact on State Finances 139
Figure X-1: Generation Capacity Mix as on Feb 2014 – Himachal Pradesh
Source: CEA
1.3. POWER SUPPLY POSITION
The energy deficit in Himachal Pradesh has remained in the range from 0% to 4% over the
span of nine years. The energy deficit in FY 2013-14 was 2%. However, the peak deficits
in the state have grown post FY 2010-11. The peak deficits in FY 2010-11 was 7% have
continued to increase to 21% in FY 2012-13, however in FY 2013-14 the deficit has
reduced to 11%. The peak deficits in the state is due to increase in the load growth, due
to increasing Industrial and commercial hubs in the state, however the capacity addition
have slowed due to delay in execution of hydro power plants, owing to environment and
forest clearance.
The trend of energy and peak deficit observed in Himachal Pradesh over the years is
highlighted in the figure below:
Figure X-2: Energy Deficit – Himachal Pradesh
Source: CEA

AF-MERCADOS EMI
Power Sector Operations and Impact on State Finances 140
Figure X-3: Peak Deficit –Himachal Pradesh
Source: CEA
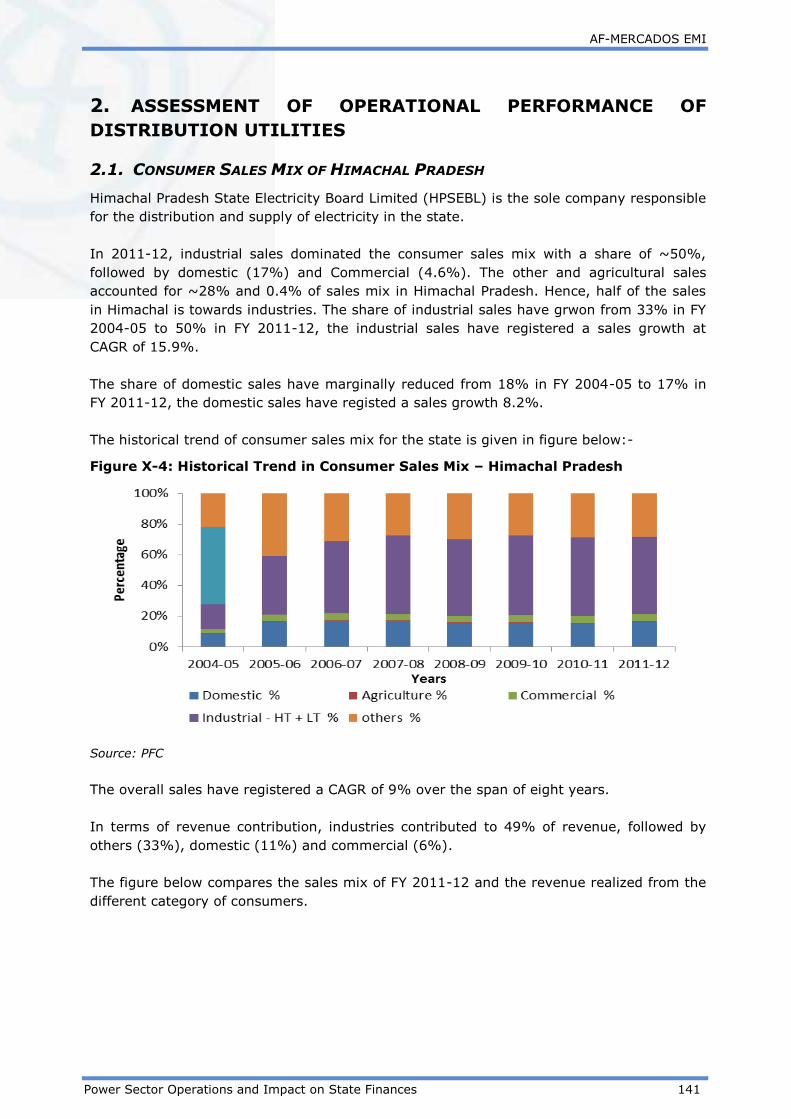
AF-MERCADOS EMI
Power Sector Operations and Impact on State Finances 141
2. ASSESSMENT OF OPERATIONAL PERFORMANCE OF
DISTRIBUTION UTILITIES
2.1. CONSUMER SALES MIX OF HIMACHAL PRADESH
Himachal Pradesh State Electricity Board Limited (HPSEBL) is the sole company responsible
for the distribution and supply of electricity in the state.
In 2011-12, industrial sales dominated the consumer sales mix with a share of ~50%,
followed by domestic (17%) and Commercial (4.6%). The other and agricultural sales
accounted for ~28% and 0.4% of sales mix in Himachal Pradesh. Hence, half of the sales
in Himachal is towards industries. The share of industrial sales have grwon from 33% in FY
2004-05 to 50% in FY 2011-12, the industrial sales have registered a sales growth at
CAGR of 15.9%.
The share of domestic sales have marginally reduced from 18% in FY 2004-05 to 17% in
FY 2011-12, the domestic sales have registed a sales growth 8.2%.
The historical trend of consumer sales mix for the state is given in figure below:-
Figure X-4: Historical Trend in Consumer Sales Mix – Himachal Pradesh
Source: PFC
The overall sales have registered a CAGR of 9% over the span of eight years.
In terms of revenue contribution, industries contributed to 49% of revenue, followed by
others (33%), domestic (11%) and commercial (6%).
The figure below compares the sales mix of FY 2011-12 and the revenue realized from the
different category of consumers.

AF-MERCADOS EMI
Power Sector Operations and Impact on State Finances 142
Figure X-5: Comparative Analysis of Consumer Sales and Revenue Mix 2011-12 –
Himachal Pradesh
Source: PFC
2.2. TRENDS IN COMMERCIAL & TECHNICAL LOSSES
The Aggregated Technical & Commercial (AT&C) Losses in Himachal have improved over
the years. The AT&C loss in FY 2011-12 was 12.2% which was 22% in FY 2004-05, and is
among the lowest in the country. However, the collection efficiency in the state has shown
fluctuating trends, in FY 2011-12, collection efficiency was all time low to the tune of 93%.
The collection efficiency has remained in the range of 100% to 93%.
Table X-1: Year on Year Trend in AT&C losses and Collection Efficiency – Himachal
Pradesh
Year FY
05 FY 06 FY 07 FY 08 FY 09 FY 10 FY 11 FY 12
AT&C Losses
(%) 22% 17.1% 13.5% 17.2% 12.9% 18.5% 15.7% 12.2%
Collection
Efficiency 95% 100% 101% 96% 101% 95% 98% 93%
Source: PFC
One of the major reasons for low AT&C losses is dominant industrial sales, which is at high
voltage levels and hence leads to low AT&C losses. HPSEBL has also framed circle-wise
targets for reduction in T&D and AT&C losses and is incentivizing the best performing
circles. The commission for the second control period has approved the T&D trajectory of
14%, 13.5%, and 12.5% for FY 12, FY 13, and FY 14 respectively. HBSEPL, has in the past
achieved better than the targets set by the commission.
2.3. TRENDS IN DISTRIBUTION COST
The major cost component of distribution cost in Himachal Pradesh in FY 12 was power
purchase cost, which accounted for 60% share in the total cost, followed by O&M (25%),
the high O&M cost is due the fact that distribution utility in Himachal is also responsible for
the generation assets of the state.
The per unit cost, break-up for different cost components for the state of Himachal Pradesh
is provided in the table below:-

AF-MERCADOS EMI
Power Sector Operations and Impact on State Finances 143
Table X-2: Year on Year Trend Distribution Cost Breakup – Himachal Pradesh
Cost Component
(Rs. per kWh) FY 05 FY 06 FY 07 FY 08 FY 09 FY 10 FY 11 FY 12
Power Purchase
Cost 1.34 1.73 1.95 2.63 3.09 3.19 3.40 3.68
O&M (R&M + A&G +
EC) 0.74 0.73 0.82 1.04 1.09 1.19 1.29 1.56
Interest 0.23 0.20 0.21 0.30 0.27 0.26 0.23 0.34
Depreciation 0.08 0.09 0.09 0.15 0.15 0.16 0.17 0.27
Other cost -0.03 0.06 0.12 -0.04 0.03 -0.09 0.14 0.32
Source: PFC
The power purchase cost in the state in FY 2011-12, was Rs 3.86 per unit, which is less
compared to other states in India. The state procurement of power is majorly from hydro
sources and free power entitlement of Government of Himachal Pradesh (GoHP) which is
sold to the utility at a price of Rs 2.69 per unit11. The state also procures and sells power
through the banking arrangement to meet the winter deficit of the state.
2.4. REVENUE REALIZATION
The tariff realization in the state has increased in FY 11 and FY 12. This is because of tariff
revisions approved by the commission to the tune of 12% and 9% in FY 11 and FY 12
respectively. In FY 11, the tariff revisions were done for the select consumers categories,
however in FY 12 the tariff was revised for all the consumers.
The table below shows the revenue realization (without subsidy) from different consumer
categories over the years.
Table X-3: Historical Trend Consumer Category Wise Revenue Realization –
Himachal Pradesh
Category FY 05 FY 06 FY 07 FY 08 FY 09 FY 10 FY 11 FY 12
Domestic 1.36 1.96 2.28 2.35 2.61 2.62 2.35 2.98
Agriculture 2.80 4.40 6.30 6.30 5.52 5.14 3.90 4.72
Commercial 3.83 4.47 4.94 4.70 5.02 5.08 5.34 5.89
Industrial HT + LT 2.84 3.03 3.04 3.17 3.46 3.49 3.63 4.21
Others 2.86 3.36 4.23 4.84 5.66 5.73 4.26 5.19
Source: PFC
The tariff realization from the industrial consumers is less as compared to the other states,
given that the state to increase its industrial hub has provided promotional polices of cheap
land and electricity. Tariff was further increased by 11% in FY 13, which is expected to
increase the tariff realization.
11 Source : Tariff order for HPSEBL for FY 12

AF-MERCADOS EMI
Power Sector Operations and Impact on State Finances 144
3. ASSESSMENT OF FINANCIAL PERFORMANCE OF –
DISTRIBUTION UTILITY
3.1. FINANCIAL HEALTH OF DISTRIBUTION UTILITIES
The financial losses (without subsides) of the distribution utility have increased post
unbundling, due to the increase in the operational and power purchase cost. The increase
in the operational cost was due to increase in employee and depreciation cost post
unbundling.
Figure X-6: Historical Trend Financial Losses (w/o) subsidies – Himachal Pradesh
Source: PFC
However, the tariffs have been revised in FY 11 and FY 12, but the revisions were not
commensurate with the increase in distribution cost post unbundling. Hence, the utility
have reported a significant increase in the cost post unbundling.
3.2. SUBSIDY BOOKED V/S SUBSIDY RECEIVED
The subsidy burden has remained negligible from past five years i.e. from the period of FY
08 to FY 12 as per PFC data. However, the GoHP have been providing subsides to the
consumer categories, which are below poverty line as reported in the tariff orders of the
distribution utility. The subsidies booked in FY 06 were Rs 77 cr and Rs 96 Cr in FY 07.
The figure below provides the subsidy booked v/s subsidy received for the distribution
utilities in the state
Table X-4: Historical Trend Subsides Booked v/s Subsidies Received – Himachal
Pradesh
2004-
05
2005-
06
2006-
07
2007-
08
2008-
09
2009-
10
2010-
11
2011-
12
Subsidy Booked
(Rs Cr) 0 77 96 0 0 0 0 0
Subsidy
Received (Rs Cr) 0 77 96 0 0 0 0 0
Source: PFC
The trend in subsidy pay-out with respect to the subsidy booked has always been 100% in
the state. The subsidy received in FY 2011-12 as per the PFC data is nil, however as per
CAG accounts the subsidy received is to power sector is Rs 140 crs.
3.3. ACS V/S ARR
The gap (with subsidy) between average cost of supply and average revenue realized (with
subsidy) has increased over the years. The gap was Rs 0.07 per unit in FY 2004-05 and Rs
0.62 per unit in FY 2011-12. The gap had reduced to almost nil in FY 2005-06 and FY

AF-MERCADOS EMI
Power Sector Operations and Impact on State Finances 145
2006-07 due to subsidy received from GoHP. The cost of supply post unbundling i.e post
FY 2010 has increased substantially, however the tariff hikes have been inadequate to
cover the gap between ACS and ARR.
Figure X-7: Historical Trend ACS v/s ARR (with subsidy) – Himachal Pradesh
Source: PFC

AF-MERCADOS EMI
Power Sector Operations and Impact on State Finances 146
4. STATE EXPOSURE TO POWER SECTOR
4.1. INCOME FROM POWER SECTOR
The tax income is majorly through electricity distribution tax, which is paid by the
distribution utilities to the state government. The tax revenue from the power sector forms
3% of the total tax revenue of the state government in 2011-12. The details for the same
are provided in the table below.
Table X-5: Tax Revenue from Power Sector – Himachal Pradesh
Revenue 2009-10 2010-11 2011-12
Rs Cr
Tax Revenue from Power Sector 39 302 186
Total Tax Revenue 3,436 5, 358 6,106
Power sector Tax Revenue / Total
state Tax Revenue 1% 6% 3%
Source: CAG Audited Accounts for the state – 2011-12, 2010-11, 2009-10
The tax revenue from the sector has increased substantially from Rs 39 Cr in FY10 to Rs
186 Cr in FY12.
The Non-Tax revenue from power sector is through dividends, interest on loans and
advances, Royalty/Cess on water for power generation, T & D, Rural
Electrification etc. The non tax revenue from power sector accounted for 60% non-tax
revenues of the state in 2011-12. The details for the same are provided in the table below.
Table X-6: Non-Tax Revenue from Power Sector –Himachal Pradesh
Revenue 2009-10 2010-11 2011-12
Rs Cr
Non Tax Revenue From Power
Sector 1,234 1,093 1,146
Total Non-Tax Revenue 1,784 1,695 1,915
Power sector Non-Tax Revenue
/Total state Non-Tax Revenue 69% 64% 60%
Source: CAG Audited Accounts for the state – 2011-12, 2010-11, 2009-10
The Non tax revenue from the power sector has decreased since FY10 along with the
contribution to total state non tax revenue. Hence, the revenue from power sector forms a
17% of total revenues.
The overall Revenue generated from the power sector is to the tune of Rs
~1322.Cr.
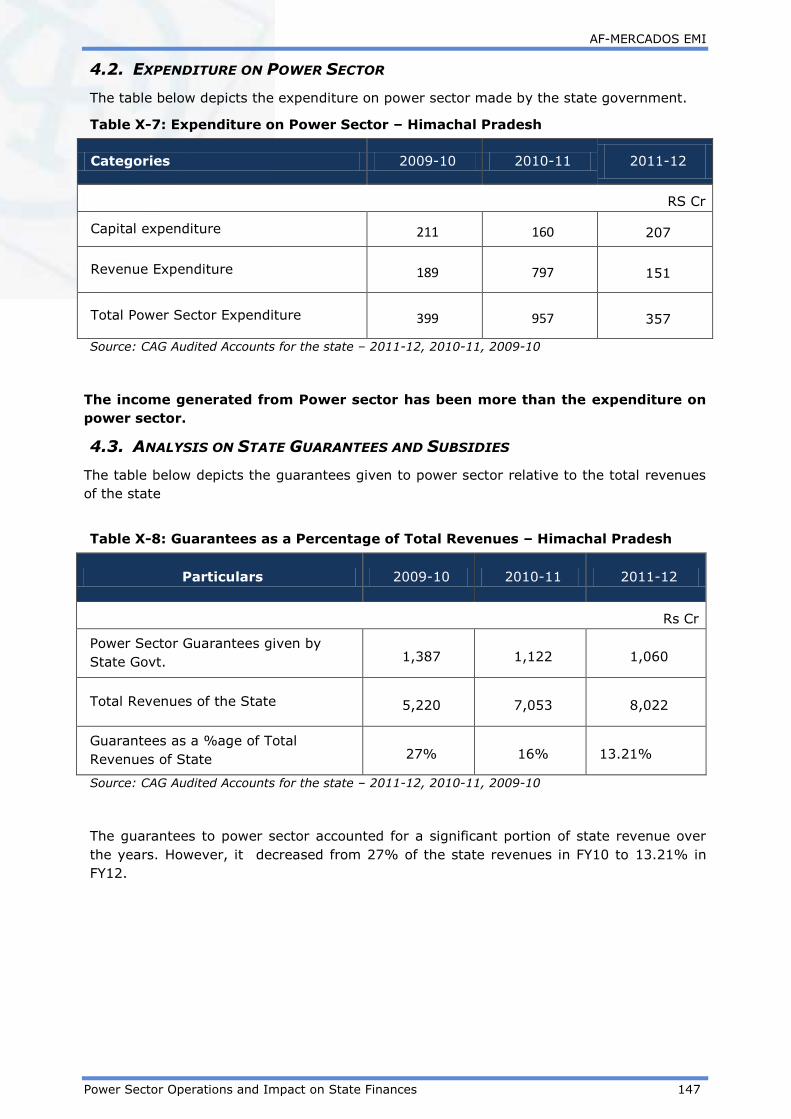
AF-MERCADOS EMI
Power Sector Operations and Impact on State Finances 147
4.2. EXPENDITURE ON POWER SECTOR
The table below depicts the expenditure on power sector made by the state government.
Table X-7: Expenditure on Power Sector – Himachal Pradesh
Categories 2009-10 2010-11 2011-12
RS Cr
Capital expenditure 211 160 207
Revenue Expenditure 189 797 151
Total Power Sector Expenditure 399 957 357
Source: CAG Audited Accounts for the state – 2011-12, 2010-11, 2009-10
The income generated from Power sector has been more than the expenditure on
power sector.
4.3. ANALYSIS ON STATE GUARANTEES AND SUBSIDIES
The table below depicts the guarantees given to power sector relative to the total revenues
of the state
Table X-8: Guarantees as a Percentage of Total Revenues – Himachal Pradesh
Particulars 2009-10 2010-11 2011-12
Rs Cr
Power Sector Guarantees given by
State Govt. 1,387 1,122 1,060
Total Revenues of the State 5,220 7,053 8,022
Guarantees as a %age of Total
Revenues of State 27% 16% 13.21%
Source: CAG Audited Accounts for the state – 2011-12, 2010-11, 2009-10
The guarantees to power sector accounted for a significant portion of state revenue over
the years. However, it decreased from 27% of the state revenues in FY10 to 13.21% in
FY12.

AF-MERCADOS EMI
Power Sector Operations and Impact on State Finances 148
The table below depicts the three year average share of different utilities in
sector guarantees Table X-9: Utility wise Breakup of Guarantees – Himachal
Pradesh
Utilities 2009-10 2010-11 2011-12
Average
Share in
Sector
Guarantees
(%)
Rs Cr
HP Electricity board 1,274 1,010 947 91%
HP Transmission Corporation 113 113 113 9%
Source: CAG Audited Accounts for the state – 2011-12, 2010-11, 2009-10
The Guarantees to the power sector has primarily declined due to decrease in Guarantees
given to HP Electricity board. Over the span of three years, HP Electricity board in the Power
Sector Guarantees has accounted for a significant ~91%.
Subsidy
The table below depicts the average share of utilities in subsidies given to Power sector and
the average share of sector in total state subsidy over three years:
Table X-10: Utility wise Breakup of Guarantees – Himachal Pradesh
Particulars 2009-10 2010-11 2011-12
Average
Share in
Sector
Subsidy %
Rs Cr
Tariff Roll Back 140 140 140 100%
Power Sector subsidy (%
of total subsidy) 140 140 140
10.7%
Over the span of three years, the subsidies solely went towards Tariff Roll Back. The subsidy
given to Power sector accounted for a share of ~11% of the total state subsidy.
4.4. POWER BONDS
As per RBI ‘State Finance Report’ 2014, the outstanding liability of Power Bonds in the
state as on 31st March 2014 was Rs 10 Cr.

AF-MERCADOS EMI
Power Sector Operations and Impact on State Finances 149
4.5. POWER SECTOR FINANCING REQUIREMENT RELATIVE TO STATE ECONOMY
In this section, the expenditure (under all possible heads) on the power sector by the state
government has been listed to determine the state Power sector financing requirement
which is then compared to state finances.
The sector financing requirement is calculated by a summation of the total Expenditure of
the state government on the sector including Capital and Revenue expenditure, Loans and
Advances (Net Of Recoveries) and Public Debt repaid(Net of Receipts) by the State
Government.
Table X-11: Financing Requirement of Power Sector (2011-12) – Himachal
Pradesh
Particulars 2011-12
Rs. Cr.
Power Sector Expenditure (Capital and Revenue) 357
Loans And Advances made by the State Government (Net of
Recoveries) 472
8.5% Tax Free Special Bonds of the State Government (Power
Bonds) disbursed during the year (Net of Receipts) 0
Loans for Power Projects-T&D from the Central Govt.
Discharged during the year (Net of Receipts) 0.44
Total Power Sector Financing during the year 830
Sector Financing Requirement as a % age of total revenues of
state 10%
GSDP nominal 41,939
Sector Financing Requirement as a % age of GSDP 1.98%
Financial Profits/(Losses) of DISCOMs during the year (with
subsidy realised) (513)
Sector Financing Requirement as a % age of total revenues of
state including financial losses of Discoms 17%
Sector Financing Requirement as a % age of GSDP including
financial losses 3.20%
Source: State Government annual accounts from CAG, Data book for DCH - 22nd April, 2013, PFC
Report on Utility finances – 2011-12
The financing requirement for the Power sector in the state was estimated to be 10% of
the revenue generated by the state and 1.98 % of the Gross State Domestic Product.
Considering the Financial losses of Discoms in the year, the financing requirement of the
sector increases to 17% of the State revenue and 3.20% of the GSDP

AF-MERCADOS EMI
Power Sector Operations and Impact on State Finances 150
The sector financing requirement is lesser than the revenue generation by the sector.
Hence the sector productivity or returns from investment is significant. However, the
Discom losses are substantial and it increases the burden of sector on the state. The state
investment in the Discom sector is negligible and the expenses on the segment are only
the assistance in the form of guarantees and subsidies. It is important for the sector to
invest in strengthening the infrastructure of the Transmission and Distribution segments.

AF-MERCADOS EMI
Power Sector Operations and Impact on State Finances 151
5. ASSESSMENT OF REGULATORY EFFECTIVENESS
The Himachal Pradesh Electricity Regulatory Commission (HPERC) constituted under the
Electricity Regulatory Commission Act, 1998 came into being in December 2000 and
started functioning with effect from 06th January, 2001.
Some of the key aspects have been discussed below: -
5.1. FINANCIAL INDEPENDENCE OF REGULATOR
The Commission receives budget from the State Government annually in the shape of
Grant-in-aid for carrying out its various functions. Rs.90.00 lacs were allotted to this
Commission for the year 2011-12. The total income of the Commission for the financial
year 2011-12 works-out to Rs.392.66 lacs, whereas the expenditure for the relevant year
was Rs.295.61 lacs, thereby the excess of income over expenditure as disclosed by the
Income and Expenditure Account of the year ended 31.03.2012 works-out to Rs.97.05 lacs.
5.2. STATUS OF IMPORTANT REGULATIONS
The state regulator has been proactive in notifying the MYT regulations; the regulator is currently in
the second control period of its MYT framework. HPSERC has introduced Multi-Year-Tariff
framework and have notified Terms and Conditions for Determination of Tariff in 2009 for
the control period of three years viz. FY 2009 to FY 2011. HPSERC, have also notified the
MYT regulations in 2012 for the second control period from FY 12 to FY 14.
5.3. FREQUENCY OF TARIFF REVISIONS
The tariff revisions were done in FY 2010-11 after several years wherein tariffs were hiked
to the tune of 12%. Thereafter commission has approved a tariff hike in FY 2012 and FY 13
by 11% and 13% respectively. However, the tariff revisions in the state have not been
commensurate with the increase in the distribution cost.

AF-MERCADOS EMI
Power Sector Operations and Impact on State Finances 152
6. SUMMARY
The key aspects of the state are discussed below;-
1. Low AT&C Losses : The state AT&C & T&D losses are among the lowest in the
country. The AT&C losses in the state in FY 2011-12 was ~12%.
2. Inadequate Tariff Revisions: The tariff revisions were done in FY 2010-11 after
several years wherein tariffs were hiked to the tune of 12%. Thereafter commission
has approved a tariff hike in FY 2012 and FY 2013 by 11% and 13% respectively.
However, the tariff revisions in the state have not been commensurate with the
increase in the distribution cost.
3. Subsidy: The subsidy burden has remained negligible from past five years i.e. from
the period of FY 08 to FY 12 as per PFC data. The subsidies booked in FY 06 were Rs
77 cr and Rs 96 Cr in FY 07.
4. Financial Losses: The financial losses (without subsides) of the distribution utility
have increased post unbundling, due to the increase in the operational cost and
power purchase cost. The increase in the operational cost was due to increase in
employee and depreciation cost.
5. Exposure to the State Gov. to power sector: The financing requirement for the
Power sector in the state was estimated to be 10% of the revenue generated by the
state and 1.98 % of the Gross State Domestic Product. Considering the Financial
losses of Discoms in the year, the financing requirement of the sector increases to
17% of the State revenue and 3.20% of the GSDP

AF-MERCADOS EMI
Power Sector Operations and Impact on State Finances 153
XI JAMMU & KASHMIR
1. INTRODUCTION
1.1. BACKGROUND – POWER SECTOR OVERVIEW
The power sector in Jammu & Kashmir comes directly under the jurisdiction of the state
government. The Electricity Act, 2010 is specific to the state of Jammu & Kashmir. The
state government has been successfully been able to implement some of the important
legislations of the Electricity Act like formation of independent regulator, implementation of
MYT framework and Open Access regulations.
The Jammu & Kashmir Power Development Department (Power Department) is the sole
transmission and distribution utility in the State of Jammu and Kashmir. The Government
of Jammu & Kashmir, vide GO no. 264 PDD of 2012 dated 5th September 2012, has
ordered for unbundling of JKPDD and setting up of one transmission company, two
distribution companies (one each for Jammu and Kashmir divisions) and one trading
company with the function of a holding company. In line with the above order, GoJK has
ordered for setting up of the following companies vide GO no. 285 PDD of 2012 dated 21st
September 2012:
Jammu & Kashmir State Power Transmission Company Limited
Jammu & Kashmir State Power Trading Company Limited
Jammu Power Distribution Company Limited
Kashmir Power Distribution Company Limited
Jammu & Kashmir Power Development Corporation, responsible for Generation in the
state.
The power sector is confronted with immense problems including deficit in production and
supply and huge arrears within the state, particularly from the public sector undertaking
and government departments. Hence, in order to improve the financial health of the state
Power Sector the planning commission has approved non-planned revenue expenditure
aimed at improving the persistent operational inefficiencies in the sector.
1.2. GENERATION MIX
The total installed capacity as on February 2014 (including allocated share in Joint &
Central Sector plants), for Jammu & Kashmir was 2,578.74MW, out of which hydro-based
capacity accounted for ~66% of the total installed capacity; followed by coal (~13%) and
gas (~12%). Renewable based capacity accounted for ~6% of the overall capacity mix in
the state.
Figure below presents the generation capacity mix in the state of Jammu & Kashmir.

AF-MERCADOS EMI
Power Sector Operations and Impact on State Finances 154
Figure XI-1: Generation Capacity Mix - Jammu & Kashmir
13%
12%
0%
3%
66%
6%
Generation Capacity (incl. allocated share from Joint and Central Sector Plants)
Coal Gas Diesel Nuclear Hydro Renewable
Source: CEA
1.3. POWER SUPPLY POSITION
Jammu & Kashmir has been witnessing consistent power supply shortage. The energy
deficit has remained more than 20% from FY 2006-07. The peak deficit increased from
16% in FY 2005-06 to 25% in FY 2012-13. The peak deficit increased substantially in FY
2007-08 to 26% and 35% in FY 2008-09 as compared to 15% in FY 2006-07. The
increasing energy and peak deficit in the state is due to slow rate of capacity addition
compared to increase in demand in the state. Further, low Plant Load Factor (PLF) of hydro
power plants caused by poor/weak monsoons has contributed to the high energy and peak
deficit in the state.
However, the energy and peak deficit decreased to 22% and 20% in FY 2013-14 from 25%
and 24.98% in FY 2012-13, on account declining growth rate in the energy demand.
The trend of energy deficit observed in Jammu & Kashmir over the years is presented in
the figure below:
Figure XI-2: Historical Trend in Energy Deficit – Jammu & Kashmir
15%
30%28%
24% 25% 25%23%
25%22%
0%
5%
10%
15%
20%
25%
30%
35%
0
2000
4000
6000
8000
10000
12000
14000
16000
18000
MU
Energy Deficit
Energy Required (MU) Energy Available (MU) Energy Deficit
Source: CEA
The trend of peak deficit observed in Jammu & Kashmir over the years is presented in the
figure below:

AF-MERCADOS EMI
Power Sector Operations and Impact on State Finances 155
Figure XI-3: Historical Trend in Peak Deficit – Jammu & Kashmir
16% 15%
26%
35% 34% 34%
25% 25%20%
0%
10%
20%
30%
40%
0
500
1,000
1,500
2,000
2,500
3,000
2005-06 2006-07 2007-08 2008-09 2009-10 2010-11 2011-12 2012-13 2013-14
MW
Peak Deficit
Peak Demand (MW) Peak Met (MW) Deficit (%)
Source: CEA
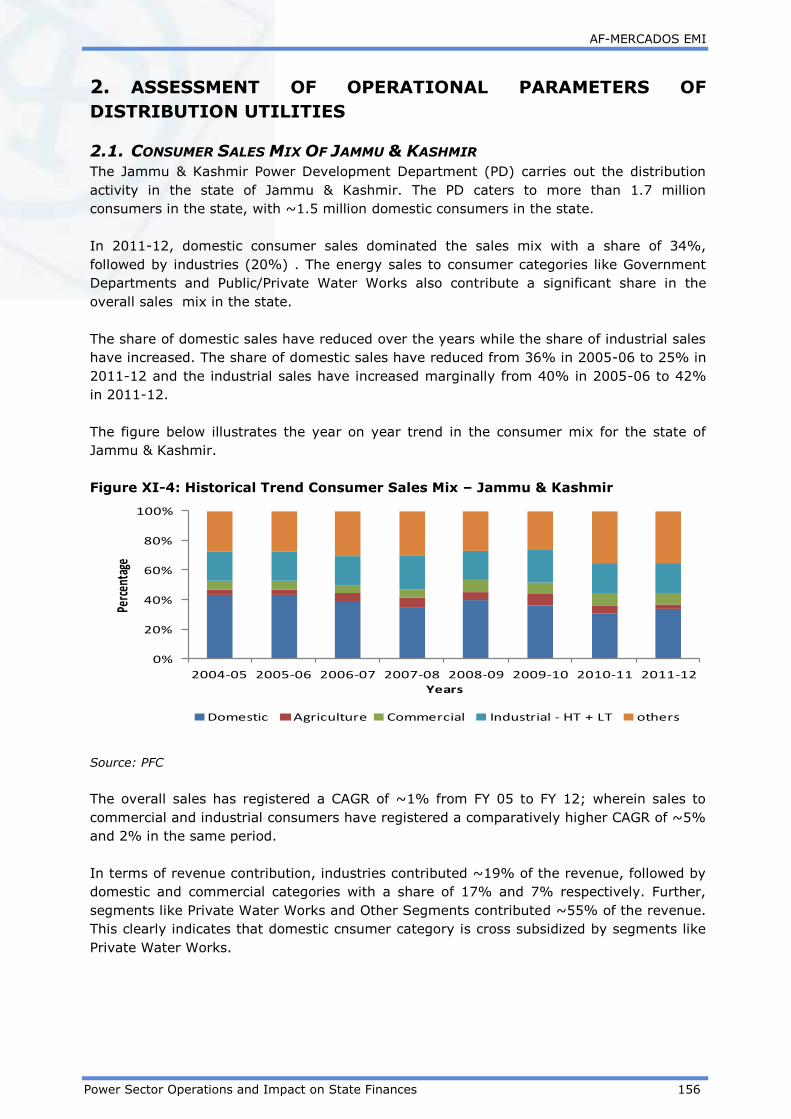
AF-MERCADOS EMI
Power Sector Operations and Impact on State Finances 156
2. ASSESSMENT OF OPERATIONAL PARAMETERS OF
DISTRIBUTION UTILITIES
2.1. CONSUMER SALES MIX OF JAMMU & KASHMIR
The Jammu & Kashmir Power Development Department (PD) carries out the distribution
activity in the state of Jammu & Kashmir. The PD caters to more than 1.7 million
consumers in the state, with ~1.5 million domestic consumers in the state.
In 2011-12, domestic consumer sales dominated the sales mix with a share of 34%,
followed by industries (20%) . The energy sales to consumer categories like Government
Departments and Public/Private Water Works also contribute a significant share in the
overall sales mix in the state.
The share of domestic sales have reduced over the years while the share of industrial sales
have increased. The share of domestic sales have reduced from 36% in 2005-06 to 25% in
2011-12 and the industrial sales have increased marginally from 40% in 2005-06 to 42%
in 2011-12.
The figure below illustrates the year on year trend in the consumer mix for the state of
Jammu & Kashmir.
Figure XI-4: Historical Trend Consumer Sales Mix – Jammu & Kashmir
0%
20%
40%
60%
80%
100%
2004-05 2005-06 2006-07 2007-08 2008-09 2009-10 2010-11 2011-12
Perc
enta
ge
Years
Domestic Agriculture Commercial Industrial - HT + LT others
Source: PFC
The overall sales has registered a CAGR of ~1% from FY 05 to FY 12; wherein sales to
commercial and industrial consumers have registered a comparatively higher CAGR of ~5%
and 2% in the same period.
In terms of revenue contribution, industries contributed ~19% of the revenue, followed by
domestic and commercial categories with a share of 17% and 7% respectively. Further,
segments like Private Water Works and Other Segments contributed ~55% of the revenue.
This clearly indicates that domestic cnsumer category is cross subsidized by segments like
Private Water Works.

AF-MERCADOS EMI
Power Sector Operations and Impact on State Finances 157
Figure XI-5: Comparative Analysis Consumer Sales and Revenue Mix (w/o
subsidy) in 2011-12 – Jammu & Kashmir
Domestic 17% Agriculture
7%
Commercial 2%
Industrial -HT + LT
19%
others 55%
Category wise Revenue 2011-12
Domestic 34%
Agriculture
3%
Commercial 8%
Industrial -HT + LT
20%
others 35%
Category wise Sales - 2011-12
Source: PFC
2.2. TRENDS IN COMMERCIAL AND TECHNICAL LOSSES
The Aggregated Technical & Commercial losses (AT&C) for Jammu & Kashmir distribution
utilities have historically remained extremely high, on account of poor collection efficiency
and high levels of line losses, due to low HT/LT ratio (0.57) in 2011-12. The loss levels
have remained in the range of 63% and 73% from FY 06 to FY 12. The above loss
estimation is based on the demand estimation for the unmetered sales that constitute
more than 50% of the connections in the state, resulting in high levels of electricity theft,
The table below illustrates the year on year trend on commercial losses and collection
efficiency of the state PD.
Table XI-1: Historical Trend AT&C losses and Collection Efficiency - Jammu &
Kashmir
Year FY 06 FY 07 FY 08 FY 09 FY 10 FY 11 FY 12
AT&C Losses (%) 68% 63% 65% 72% 69% 70% 73%
Collection Efficiency (%) 60% 63% 66% 70% 76% 76% 68%
Source: PFC
2.3. TRENDS IN DISTRIBUTION COSTS
Power purchase cost accounts for majority of distribution cost, accounting for ~84% of the
overall distribution costs. The per unit cost break-up for different cost components for the
state of Jammu & Kashmir is provided in the table below:-
Table XI-2: Historical Trend in Distribution Cost Breakup - Jammu & Kashmir
Cost Component
(Rs per kWh) FY 06 FY 07 FY 08 FY 09 FY 10 FY 11 FY 12
Power Purchase Cost 1.88 2.27 1.88 2.21 2.06 2.59 2.78
O&M (R&M + A&G + EC) 0.26 0.19 0.29 0.40 0.32 0.38 0.41
Interest 0.05 0.03 0.03 0.02 0.02 0.02 0.01
Depreciation 0.08 0.07 0.07 0.08 0.08 0.08 0.09
Other cost 0.03 0.03 0.00 0.00 0.00 0.02 0.02
Source: PFC
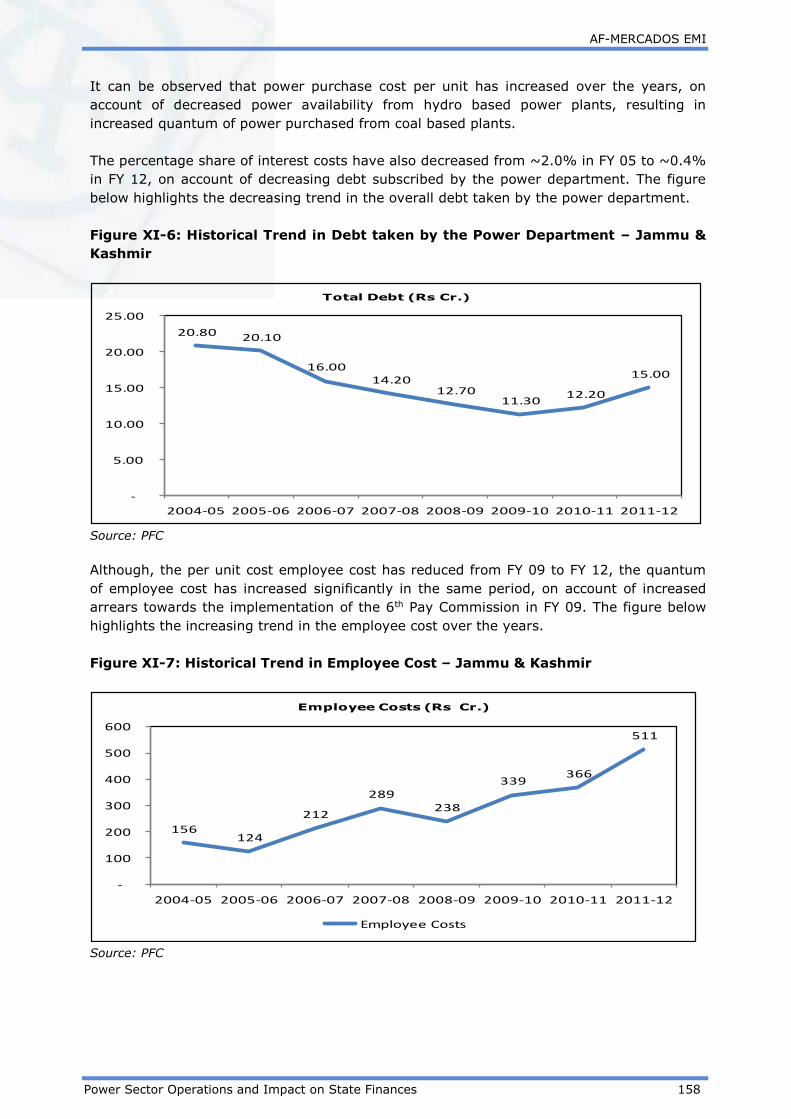
AF-MERCADOS EMI
Power Sector Operations and Impact on State Finances 158
It can be observed that power purchase cost per unit has increased over the years, on
account of decreased power availability from hydro based power plants, resulting in
increased quantum of power purchased from coal based plants.
The percentage share of interest costs have also decreased from ~2.0% in FY 05 to ~0.4%
in FY 12, on account of decreasing debt subscribed by the power department. The figure
below highlights the decreasing trend in the overall debt taken by the power department.
Figure XI-6: Historical Trend in Debt taken by the Power Department – Jammu &
Kashmir
20.80 20.10
16.00 14.20
12.70 11.30
12.20
15.00
-
5.00
10.00
15.00
20.00
25.00
2004-05 2005-06 2006-07 2007-08 2008-09 2009-10 2010-11 2011-12
Total Debt (Rs Cr.)
Source: PFC
Although, the per unit cost employee cost has reduced from FY 09 to FY 12, the quantum
of employee cost has increased significantly in the same period, on account of increased
arrears towards the implementation of the 6th Pay Commission in FY 09. The figure below
highlights the increasing trend in the employee cost over the years.
Figure XI-7: Historical Trend in Employee Cost – Jammu & Kashmir
156 124
212
289 238
339 366
511
-
100
200
300
400
500
600
2004-05 2005-06 2006-07 2007-08 2008-09 2009-10 2010-11 2011-12
Employee Costs (Rs Cr.)
Employee Costs
Source: PFC
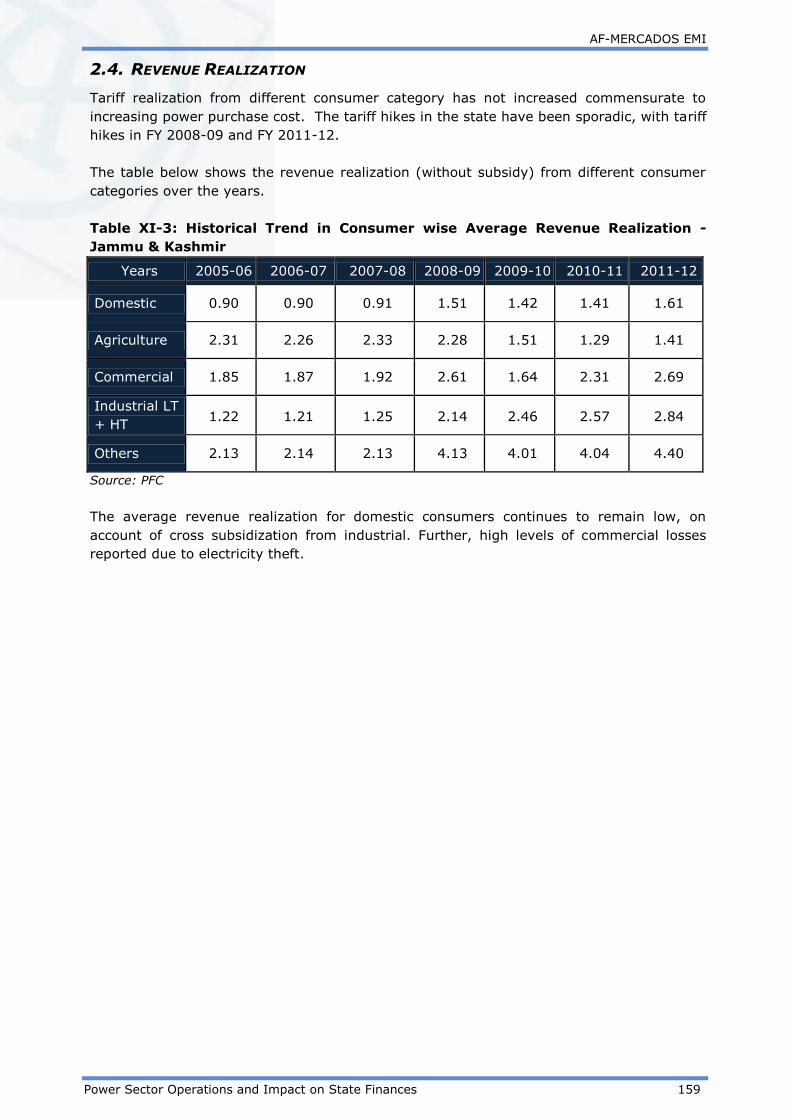
AF-MERCADOS EMI
Power Sector Operations and Impact on State Finances 159
2.4. REVENUE REALIZATION
Tariff realization from different consumer category has not increased commensurate to
increasing power purchase cost. The tariff hikes in the state have been sporadic, with tariff
hikes in FY 2008-09 and FY 2011-12.
The table below shows the revenue realization (without subsidy) from different consumer
categories over the years.
Table XI-3: Historical Trend in Consumer wise Average Revenue Realization -
Jammu & Kashmir
Years 2005-06 2006-07 2007-08 2008-09 2009-10 2010-11 2011-12
Domestic 0.90 0.90 0.91 1.51 1.42 1.41 1.61
Agriculture 2.31 2.26 2.33 2.28 1.51 1.29 1.41
Commercial 1.85 1.87 1.92 2.61 1.64 2.31 2.69
Industrial LT
+ HT 1.22 1.21 1.25 2.14 2.46 2.57 2.84
Others 2.13 2.14 2.13 4.13 4.01 4.04 4.40
Source: PFC
The average revenue realization for domestic consumers continues to remain low, on
account of cross subsidization from industrial. Further, high levels of commercial losses
reported due to electricity theft.

AF-MERCADOS EMI
Power Sector Operations and Impact on State Finances 160
3. ASSESSMENT OF FINANCIAL PERFORMANCE OF –
DISTRIBUTION UTILITY
3.1. FINANCIAL HEALTH OF DISTRIBUTION UTILITIES
The distribution financial losses without subsides in Jammu & Kashmir has increased
substantially over the years. Further, the tariff levels does not reflect the actual cost to
serve in the state. The figure below depicts the year on year trend in the profit/ (loss)
booked by the state PD
Figure XI-8: Historical Trend in Financial Losses (w/o subsidy) - Jammu &
Kashmir
(1,125)(1,463)
(1,271) (1,384) (1,317)
(2,102) (2,167)
(3,037)
(4,000)
(3,500)
(3,000)
(2,500)
(2,000)
(1,500)
(1,000)
(500)
-
2004
-05
2005
-06
2006
-07
2007
-08
2008
-09
2009
-10
2010
-11
2011
-12
Rs. C
r
Financial Losses (PAT )
Source: PFC
The loss levels increased significantly in FY 12, on account increased power purchase costs
combined with high levels of commercial losses reported in that year.
3.2. SUBSIDY BOOKED V/S SUBSIDY RECEIVED
The power department has not booked any subsidies from FY 05 to FY 12.
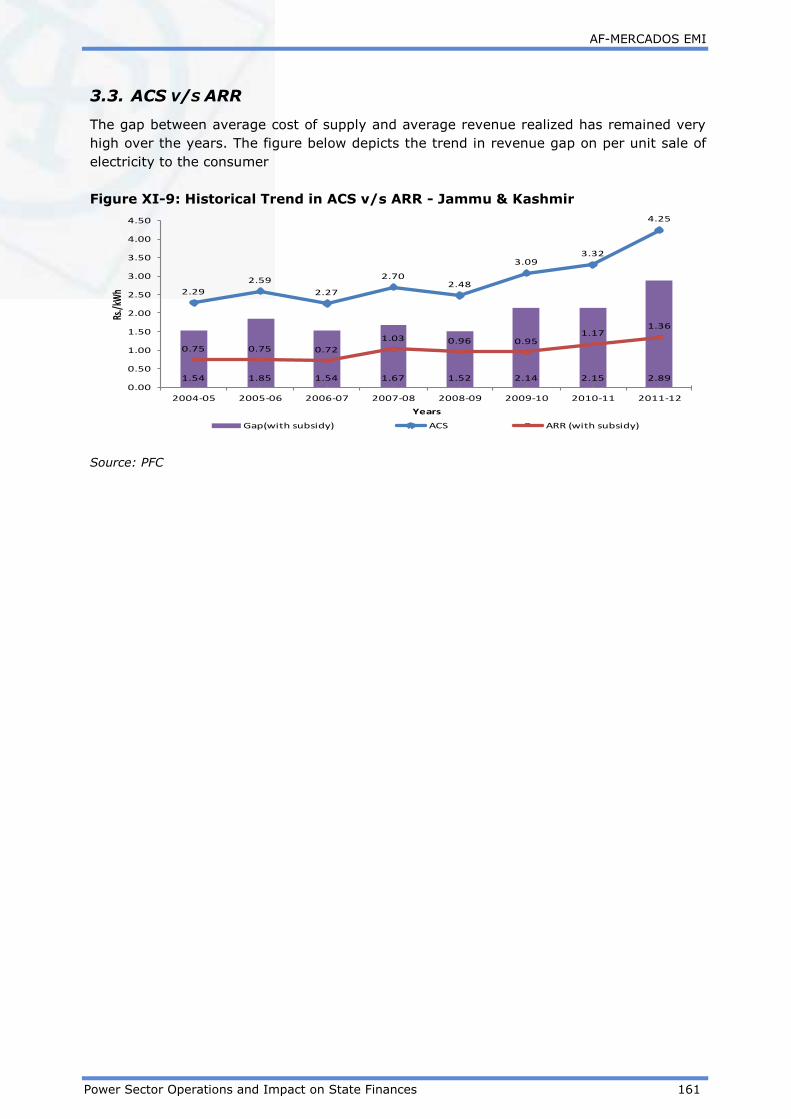
AF-MERCADOS EMI
Power Sector Operations and Impact on State Finances 161
3.3. ACS V/S ARR
The gap between average cost of supply and average revenue realized has remained very
high over the years. The figure below depicts the trend in revenue gap on per unit sale of
electricity to the consumer
Figure XI-9: Historical Trend in ACS v/s ARR - Jammu & Kashmir
1.54 1.85 1.54 1.67 1.52 2.14 2.15 2.89
2.29
2.59
2.27
2.702.48
3.093.32
4.25
0.75 0.75 0.72
1.03 0.96 0.951.17
1.36
0.00
0.50
1.00
1.50
2.00
2.50
3.00
3.50
4.00
4.50
2004-05 2005-06 2006-07 2007-08 2008-09 2009-10 2010-11 2011-12
Rs./
kWh
Years
Gap(with subsidy) ACS ARR (with subsidy)
Source: PFC

AF-MERCADOS EMI
Power Sector Operations and Impact on State Finances 162
4. STATE EXPOSURE TO POWER SECTOR
4.1. INCOME FROM POWER SECTOR
The source of tax revenue is the electricity distribution tax, paid to the state government
by the distribution utilities. The tax revenue from the power sector constituted ~2.2% of
the total tax revenue in the state in FY2011-12. The details for the same are provided in
the table below:
Table XI-4: Tax Revenue from Power Sector - Jammu & Kashmir
Revenue 2009-10 2010-11 2011-12
RS Cr
Tax Revenue From Power
Sector 120 148 179
Total Tax Revenue 4,942 6,550 8,241
Power sector Tax Revenue /
Total state Tax Revenue 2.44% 2.25% 2.2%
Source: Audited C&AG Accounts for the state 2011-12, 2010-11, 2009-10
The non-tax revenue from power sector is through Royalty/CESS on water for power
generation, transmission and distribution, Rural Electrification etc. The Non-Tax
revenue, which is Rs 1007 Cr in 2011-12, contributes a significant ~50% of the total non-
tax revenues. The details for the same are provided in the table below:
Table XI-5: Non-Tax Revenue from Power Sector - Jammu & Kashmir
Revenue 2009-10 2010-11 2011-12
Rs Cr
Non-Tax Revenue From Power
Sector 115 822 1,007
Total Non-Tax Revenue 955 1,093 2,002
Power sector Non-Tax
Revenue /Total state Non-Tax
Revenue 12.05% 75.21% 50%
Source: Audited C&AG Accounts for the state 2011-12, 2010-11, 2009-10
The Non tax revenue from the sector has increased significantly over the three years along
with increase in sector’s contribution in state non tax revenues i.e. from 12.05% in FY10 to
a significant 50% in FY12.
In case of J & K, electricity is supplied by Jammu and Kashmir Power Development
Department (JKPDD)and therefore non tax revenue comes from power tariff revenue from
sale of electricity to consumers.

AF-MERCADOS EMI
Power Sector Operations and Impact on State Finances 163
The overall revenue generated from the power sector increased from Rs 235 Cr in FY2010
to Rs 1186 Cr in Fy2012.
4.2. EXPENDITURE ON POWER SECTOR
The details of the expenditure made on the power sector by the state in the year 2011-12
are provided in the table below:
Table XI-6: Expenditure on Power Sector - Jammu & Kashmir
Categories 2009-10 2010-11 2011-12
Rs Cr
Capital Expenditure 1,035 NA 534
Revenue Expenditure 2,755 NA 3,768
Total Expenditure 3,790 NA 4,303
Source: Audited C&AG Accounts for the state 2011-12, 2010-11, 2009-10
The capital expenditure incurred on power sector has decreased since FY10 primarily on
account of decrease in investments under T&D. the revenue expenditure incurred on the
power sector has increased since FY10 primarily on account of increase in the expenses
under Hydel Generation and Rural electrification.
Further, it can be observed that the state power sector has not been self sufficient to carry
out its operations as revenue from tax and non-tax revenue is less than the revenue
expenditure made by the state towards the power sector.
The above grants were approved from the Planning Commission aimed at improving the
financial and operational parameters in the state of Jammu & Kashmir. The restructure
plan aims at improving the loss levels, introduce accountability and metering levels.
However, the level of non-planned expenditure has increased in FY 13 and FY 14, indicating
the persistent inefficiencies in the power sector.
4.3. ANALYSIS ON STATE GUARANTEES AND SUBSIDIES
The state government guarantees constituted a significant ~19.10% of the overall state
revenue in 2011-12. The same has been depicted in the table below:
Table XI-7: Guarantees as a Percentage of Total Revenues - Jammu & Kashmir
Parameter 2009-10 2010-11 2011-12
Rs Cr
Guarantees given by State Govt. 2,777 2,550 1,956
Total Revenues of the State 5,897 7,643 10,242
Guarantees as a %age of Total
Revenues of State 47.08% 33.37% 19.10%
Source: Audited C&AG Accounts for the state 2011-12, 2010-11, 2009-10

AF-MERCADOS EMI
Power Sector Operations and Impact on State Finances 164
The guarantees given to power sector in proportion to the revenues generated by the state
has decreased substantially i.e. from ~47% of state revenues in 2009-10 to 19.10% in
2011-12.
The table below depicts the three year average share of different utilities in sector
guarantees:
Table XI-8: Guarantees Utility wise Breakup - Jammu & Kashmir
Particulars 2009-10 2010-11 2011-12
Aggregate
Share in
Sector
Guarantees
(%)
Rs Cr
Jammu & Kashmir Power
Development Department 229 229 229 9%
Jammu & Kashmir
Development Corporation 2,547 2,321 1,727 91%
Source: Audited C&AG Accounts for the state 2011-12, 2010-11, 2009-10
Over the span of three years, Jammu & Kashmir Development Corporation accounted for a
share of 91% of sector guarantees.
The sector did not receive any subsidy from state government.
4.4. POWER BONDS
As per RBI ‘State Finance Report’ 2014, the outstanding liability of Power Bonds in the
state as on 31st March 2014 was Rs 320 Cr.
4.5. POWER SECTOR FINANCING REQUIREMENT RELATIVE TO STATE’S ECONOMY
In this section, the expenditure (under all possible heads) on the power sector by the state
government has been listed to determine the state Power sector financing requirement
which is then compared to state finances.
The sector financing requirement is estimated as the summation of total expenditure of the
state government on the sector including Capital and Revenue Expenditure, Loans and
Advances (Net Of Recoveries) and Public Debt repaid (Net of Receipts) by the State
Government.
Table XI-9: Power Sector Financing (2011-12) - Jammu & Kashmir
Particulars
2011-12
Rs. Cr
Power Sector Expenditure (Capital and Revenue) 4,303
Loans And Advances made by the State Government (Net of
Recoveries) (167)

AF-MERCADOS EMI
Power Sector Operations and Impact on State Finances 165
Particulars
2011-12
Rs. Cr
8.5% Tax Free Special Bonds of the State Government (Power
Bonds) disbursed during the year (Net of Receipts)* (2,465)
Loans for Power Projects-T&D from the Central Govt. Discharged
during the year (Net of Receipts) 0
Total Power Sector Financing during the year 4,111
Sector Financing Requirement as a % age of total revenues of state 40%
GSDP nominal 40,771
Sector Financing Requirement as a % age of GSDP 10.08%
Financial Profit/ (Losses) of PD during the year (With Subsidy
realised) (3,037)
Sector Financing Requirement (including financial losses of PD ) as
a % age of total revenues of state 70%
Sector Financing Requirement (including financial losses of PD ) as
a % age of GSDP 17.53%
Source: State Government annual accounts from CAG, Data book for DCH - 22nd April, 2013, PFC Report on
Utility finances – 2011-12
The financing requirement for the Power sector in the state was estimated to be 40% of
the revenue generated by the state and 10.08 % of the Gross State Domestic Product.
Considering, the financial losses of PD in the year, the financing requirement of the sector
increases to 70 % of the State revenue and 17.53 % of the GSDP.
The major portion of state investments made towards power sector went to Transmission &
Distribution. The major portion of Revenue expenditure on power sector went towards
improvement of operational parameters and modernization of the power sector in the
state. The substantial Power Department losses have increased the burden of the sector on
state finances. Hence, there is a need for further investments to build and strengthen the
infrastructure.

AF-MERCADOS EMI
Power Sector Operations and Impact on State Finances 166
5. REGULATORY EFFECTIVENESS
In accordance with the legislature passed in Jammu and Kashmir, the Jammu & Kashmir
State Electricity Regulatory Commission was established in 11th April 2000. The figure
below presents the current organization structure of JKSERC.
Figure XI-10: Organization Structure - Jammu & Kashmir State Electricity
Regulatory Commission
Source: JKSERC
5.1. BUDGETING
The status of budgeting information is not available in public domain.
5.2. STAFFING
The office of the Commission consists of permanent employees besides officials on
deputation and on contract basis. The current total working strength of the Commission is
9 (including the chairman and two members).
5.3. MYT REGULATION
The MYT has been implemented for the first control period (FY 14 to FY 16). The
commission had selected a first control period (three years). The primary focus of the MYT
in the state was to improve the level of metering along with efficient tariff setting
mechanism.
5.4. LEVEL OF METERING
The major proportion of the domestic consumer category continues to be unmetered.
Further, considerable proportion of commercial, agriculture and public water works
consumer category are also unmetered. The figure below presents the overall and
consumer category wise unmetered connections in the state.

AF-MERCADOS EMI
Power Sector Operations and Impact on State Finances 167
Figure XI-11: Historical Trend in Agriculture Metering (FY 10 – FY 12) - Jammu &
Kashmir
52% 27% 22% 32%0%
10%
20%
30%
40%
50%
60%
Domestic-Unmetered
Commercial -Unmtered
Agriculture -Unmtered
LT Public Water Works -
Unmetered
Consumer Category wise Unmetered Sales - (2013-14)
Overall Unmetered - 45%
Source: MYT Tariff Order FY 14 – FY 16
The electricity theft is especially pertinent in the domestic consumer category, that has
high percentage of un-metered connections, which has resulted in high AT&C losses in the
state.
5.5. OPEN ACCESS
Jammu & Kashmir State Electricity Commission notified, the Open Access Regulations vide
12, 13, 15 and 16 of the J&K SERC (Open Access in Intra-State Transmission and
Distribution) Regulation, 2006, on January 25, 2006.Further, the information related to the
number of applications received/approved and the volume of power traded is available in
public domain
The state’s Electricity Act was implemented in 2010, although the state regulator has
implemented many provisions of the Act like implementation of Open Access, MYT
framework and the commission continues to be sufficiently staffed, the power sector in the
state has not benefited largely with the provisions enacted.

AF-MERCADOS EMI
Power Sector Operations and Impact on State Finances 168
6. SUMMARY
1. Demand Supply Gap: The state has witnessed high levels of deficit levels. Further,
the power department procures low quantum of power from the short-term market.
The power department can contemplate purchasing the surplus power available in
the short-term market to reduce the deficit levels in the state.
2. High levels of Unmetered Connections: High percentage of connections in the
state remains unmetered, resulting in incorrect demand estimation in the state. The
energy sales to the unmetered category constitute a significant proportion in the
overall sales mix, resulting in electricity thefts and other commercial losses.
3. High Levels of AT&C Losses: The levels of AT&C losses in the state are
unsustainably high. The high line losses due to high percentage share of LT
consumers, combined with electricity theft in unmetered categories.
4. High Financial Losses: The financial losses have increased over the years. The high
levels of AT&C losses combined with insufficient tariff revisions are the primary
causes for the high levels of losses in the state.
5. High Dependence on Grants Planning Commission: The Power Department from
the state had received grants from the planning commission aimed at improving the
overall operational efficiency. Although, the power projects receipt in the state has
increased in FY 13 and FY 14; the quantum of non-planned revenue expenditure has
increased during the same period.
Although, the current financial health of the power sector pose a high risk on the
state finances, with high levels of unmetered connection leading to electricity
theft and improper billing.

AF-MERCADOS EMI
Power Sector Operations and Impact on State Finances – Volume II 169
XII JHARKHAND
1. INTRODUCTION
1.1. BACKGROUND – POWER SECTOR OVERVIEW
The state of Jharkhand was carved out of Bihar on 15th November 2000 by virtue of
promulgation of Bihar Reorganization Act, 2000. Owning to its proximity to the coal belt,
cheap land, availability of water and labor, state is ideally suited for power generation.
This is particularly true as transporting coal is costlier than transmitting power to any part
of the country. However, despite the above factors, power infrastructure in the state
remains poor. Jharkhand State Electricity Board (JSEB) still operates as a vertically
integrated entity.
Overall performance of power sector in the state has been poor. The operating
performance of the generating stations in the state is inefficient with high auxiliary
consumption levels, low capacity utilization and poor renovation and modernization of
plants. The state faces high levels of AT&C losses due to inadequate metering and poor
commercial practices, also T&D network are in very poor state. There is lack of
transparency and quality of data is poor which makes relying on reported figures of JSEB
hard. There is strong dependence on the state government for finances.
1.2. GENERATION MIX
As on Feburary 2014, Jharkhand’s total generation installed capacity (including allocated
share in Joint & Central Sector plants) was 2579 MW out of which coal based power
capacity accounted for 91% followed by Hydro (~8%). The capacity addition
(incl.procurment from Central & JV plants) has grown by 14% from last year,
showing a significant increment in investments in capacity addition.
Figure below highlights the generation capacity including allocated share in Joint & Central
sector plants.
Figure XII-1: Generation Capacity Mix - Jharkhand
Source: CEA

AF-MERCADOS EMI
Power Sector Operations and Impact on State Finances – Volume II 170
1.3. POWER SUPPLY POSITION
The energy availability in Jharkhand has grown at a CAGR 7% over the span of nine years,
and energy availability at 9%. The Indian flagship programs like RGGVY and R-APDRP are
running on a fast track mode in the state under which, around 67% of the villages have
been electrified so far.
Jharkhand energy deficits has been in the range of 2 -5% in the last 9 years, except in
2007-08 & 2009-10. In 2007-08 the energy deficit was 13% and 8% in 2009-10
respectively. The peak deficit in the state has shown a decreasing trend from 16% in FY
2011-12 to 4% in FY 2013-14, this is because of increase in capacity addition coupled with
lower demand in the state for the FY 2013-14.
The trend of energy and peak deficit observed in Jharkhand over the years is highlighted in
the figure below:
Figure XII-2: Energy Deficit - Jharkhand
Source: CEA
Figure XII-3: Peak Deficit - Jharkhand
Source: CEA

AF-MERCADOS EMI
Power Sector Operations and Impact on State Finances – Volume II 171
2. ASSESSMENT OF OPERATIONAL PERFORMANCE OF
DISTRIBUTION UTILITIES
2.1. CONSUMER SALES MIX OF JHARKHAND
In FY 2011-12, domestic sales dominated the sales mix with a share of ~38%, followed by
industrial –LT (34%) and other12 category sales (~19%). The commercial and agricultural
sales in the state accounted for 5% and 1% respectively.
The share of domestic sales have increased from 29% in FY2004-05 to 38% in FY 2011-12,
the domestic sales have registered a CAGR of 15.2% over the span of seven years and is
highest among all the consumer categories. This is due to the increasing electricity acess in
the state under the flagship programme of rural electrification.
The historical trend of consumer sales mix for the state is given in figure below:-
Figure XII-4: Historical Trend in Consumer Sales Mix - Jharkhand
Source: PFC
The industral sales as a percentage total sales have reduced over time from 48% in FY
2004-05 to 34% in FY 2011-12. The industrial sales have grown at a CAGR of 5.5% which
is lowest among all the other consumer catagories.
In terms of revenue contribution, industries contributes to 51% of the total revenues,
followed by others (23%), domestic (13%) and commercial/ non domestic (9%). This
clearly indicates that domestic category is cross subsidized by the industrial and
commercial categories.
The figure below compares the sales mix of FY 2011-12 and the revenue realized from the
different category of consumers.
12 The other category comprises of sales to Railways, Public Lighting, Public Water works, Bulk Supply and
Interstate categories

AF-MERCADOS EMI
Power Sector Operations and Impact on State Finances – Volume II 172
Figure XII-5: Comparative Analysis of Consumer Sales and Revenue Mix (w/o
subsidies) 2011-12 - Jharkhand
Source: PFC
2.2. TRENDS IN COMMERCIAL & TECHNICAL LOSSES
The Aggregated Technical & Commercial (AT&C) losses for Jharkhand distribution utility
have remained high over the years. The AT&C losses in the state are higher than the
national average.
The table below highlights the year on year trends in AT&C Losses and collection efficiency.
Table XII-1: Year on Year Trend in AT&C losses and Collection Efficiency -
Jharkhand
Year FY
05 FY 06 FY 07 FY 08 FY 09 FY 10 FY 11 FY 12
AT&C Losses
(%) 63% 52.1% 54.4% 58.2% 54.2% 10.4% 46.8% 42.8%
Collection
Efficiency
(%)
60% 63% 66% 70% 76% 137% 68% 71%
Source: PFC
The major reasons for high losses in the state are due to (i) pertinent theft of electricity (ii)
weak distribution infrastructure due to increasing LT network in the state and (iii) high
unmetered consumers in the state. The high AT&C and T&D losses in the state is an area
of concern, in this regards state regulatory commission has set the loss reduction
trajectory and have set a target of to achieve the T&D loss level of 15% by the end of FY
2016-17. However, keeping in view the huge target of rural electrification, release of Kutir
Jyoti connection and expansion of LT network a huge loss reduction seems unachievable.
To achieve it, the Commission has directed the distribution utility to formulate a task force
for supervising the losses in the state and also carry out energy audit of its system and
provide quarterly reports to the Commission regarding the progress of energy audit.
The HT/LT ratio has increased over the years; however is still lower than the best
performing states indicating that there is scope for improvement in this area. HT LT ratio
has improved from 0.63 in 2005-06 to 0.70 in 2009-10.

AF-MERCADOS EMI
Power Sector Operations and Impact on State Finances – Volume II 173
Hence, in terms of operations efficiency, the Jharkhand discoms need to speed up their loss
reduction measures and achieve metering of high un-metered domestic and rural
consumers in the state.
2.3. TRENDS IN DISTRIBUTION COST
The distribution cost of JSEB has grown at a CAGR of 17.56% over the span of seven years
and power purchase cost which forms the major cost component of distribution cost, has
grown at a CAGR of 14.72%. The power purchase cost in Jharkhand is lower compared to
other states given the state proximity to the coal belt.
The per-unit cost break-up for different cost components for the state of Jharkhand is
provided in the table below:-
Table XII-2: Year on Year Trend Distribution Cost Breakup - Jharkhand
Cost Component FY 05 FY 06 FY 07 FY 08 FY 09 FY 10 FY 11 FY 12
Power Purchase Cost 1.92 1.51 1.65 1.88 2.55 2.91 3.39 2.48
O&M (R&M + A&G +
EC) 0.34 0.26 0.26 0.30 0.45 0.48 0.44 0.32
Interest 0.32 0.37 0.54 0.57 0.80 0.92 0.52 0.40
Depreciation 0.11 0.04 0.04 0.05 0.07 0.07 0.07 0.09
Other cost 0.68 0.41 0.27 0.51 0.35 0.01 0.01 1.87
Source: PFC
The power purchase cost has been steadily increasing from FY 06 to FY 11, attributed to
steep growth in per unit power purchase cost for NTPC plants allocated to JSEB, which is
beyond the control of the state distribution utility. However, the prices have slightly
dropped in FY 12, as Coal India Limited, shifted its coal pricing policy from UHV based to
GCV, hence there was slight drop in the steam coal prices for power sector.
However, in FY 12, the other cost has increased substantially against FY 11. The interest
burden of the state has remained high over the years, form FY 09 to FY 11.
2.4. REVENUE REALIZATION
Tariff realizations from different consumer category have not increased commensurate to
increasing power purchase cost. No tariff hikes were observed for several years and tariffs
were increased only in FY 12. However, in FY 2012-13, the commission considered no
tariff revisions.
The table below shows the revenue realization from different consumer categories over the
years.
Table XII-3: Historical Trend Consumer Category Wise Revenue Realization -
Jharkhand
Years FY 05 FY 06 FY 07 FY 08 FY 09 FY 10 FY 11 FY 12
Domestic 1.03 1.20 - 0.98 0.91 0.74 0.93 1.21
Agriculture 0.34 0.25 - 0.42 0.43 0.45 0.54 0.62
Commercial 4.15 4.23 - 4.11 4.18 4.32 4.63 5.76
Industrial HT 4.72 4.40 - 4.32 4.33 4.31 4.58 5.14

AF-MERCADOS EMI
Power Sector Operations and Impact on State Finances – Volume II 174
Industrial LT 4.12 4.64 - 4.68 4.71 4.66 5.13 6.46
Source: PFC; data for FY 07 has not been reported by PFC
The revenue realization for the domestic category is low, which clearly indicates that the
domestic consumers in the state are been cross subsidized from Industrial and commercial
consumers. High AT&C losses in the state have led to low realization of revenues from sale
of power.
Increase in distribution cost, inadequate tariff hikes, and high AT&C losses over the years
have resulted in deterioration of the financial position of the distribution utility of the state.

AF-MERCADOS EMI
Power Sector Operations and Impact on State Finances – Volume II 175
3. ASSESSMENT OF FINANCIAL PERFORMANCE OF –
DISTRIBUTION UTILITY
3.1. FINANCIAL HEALTH OF DISTRIBUTION UTILITIES
The financial losses (without subsides) of state has increased every year given the
increasing distribution cost, high losses, and no frequent tariff hikes.
Figure XII-6: Historical Trend Financial Losses (w/o) subsidies – Jharkhand
Source: PFC
The tariff revised in FY 2011-12, was not commensurate with the increase in distribution
cost, as explained the other cost has substantially increased in FY 12. Thus explains the
sudden increase in the losses in FY 2011-12. The subsides provided are also not able to
bridge the gap of revenues and cost, the same has been discussed in the subsequent
section.
3.2. SUBSIDY BOOKED V/S SUBSIDY RECEIVED
The subsidy burden on state government has remained high over the years. The subsidy
accounted for 14% of total revenues in FY 2004-05 and 24% in FY 2011-12. The figure
below highlights the subsidy booked v/s subsidy received for the distribution utility in the
state.
Figure XII-7: Historical Trend of Subsides Booked v/s Subsidies Received –
Jharkhand
Source: PFC
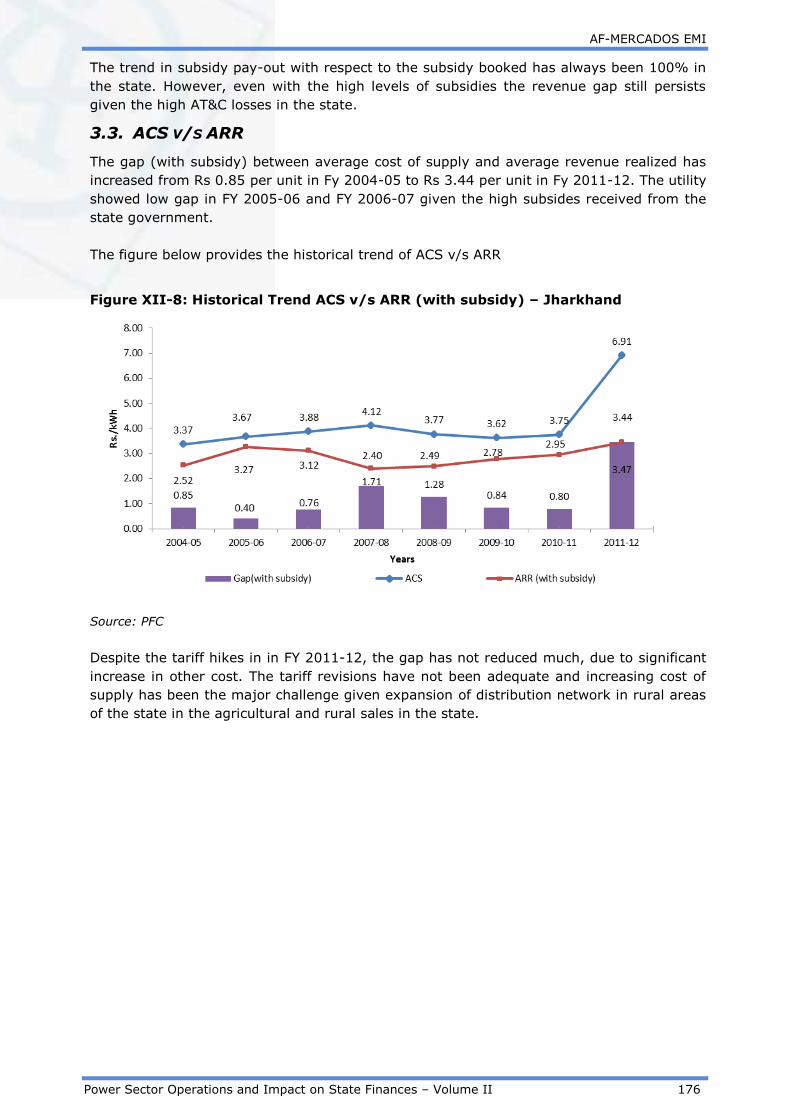
AF-MERCADOS EMI
Power Sector Operations and Impact on State Finances – Volume II 176
The trend in subsidy pay-out with respect to the subsidy booked has always been 100% in
the state. However, even with the high levels of subsidies the revenue gap still persists
given the high AT&C losses in the state.
3.3. ACS V/S ARR
The gap (with subsidy) between average cost of supply and average revenue realized has
increased from Rs 0.85 per unit in Fy 2004-05 to Rs 3.44 per unit in Fy 2011-12. The utility
showed low gap in FY 2005-06 and FY 2006-07 given the high subsides received from the
state government.
The figure below provides the historical trend of ACS v/s ARR
Figure XII-8: Historical Trend ACS v/s ARR (with subsidy) – Jharkhand
Source: PFC
Despite the tariff hikes in in FY 2011-12, the gap has not reduced much, due to significant
increase in other cost. The tariff revisions have not been adequate and increasing cost of
supply has been the major challenge given expansion of distribution network in rural areas
of the state in the agricultural and rural sales in the state.

AF-MERCADOS EMI
Power Sector Operations and Impact on State Finances – Volume II 177
4. STATE EXPOSURE TO POWER SECTOR
4.1. INCOME FROM POWER SECTOR
The tax revenue from the power sector forms less than 1% of the total tax revenue. The
tax income is majorly through electricity distribution tax, which is paid by the distribution
utilities to the state government. The table below provides the total tax revenue of state
and share of power sector in it.
Table XII-4: Tax Revenue from Power Sector - Jharkhand
Revenue 2009-10 2010-11 2011-12
Rs Cr
Tax Revenue from Power Sector NA NA 72.76
Total Tax Revenue NA NA 14,123.82
Power sector Tax Revenue /
Total state Tax Revenue NA NA 0.52%
Source: Audited CAG reports for the state: 2011-12, 2010-11, 2009-10
The non-tax revenue from power sector is through Dividends, Interest on Loans and
Advances, Royalty/Cess on water for power generation, T n D, Rural
Electrification etc. The Non Tax revenue from the power sector is provided under the
head of General Receipts in the CAG accounts. The Non Tax revenue, which is only Rs 0.15
Cr, forms an insignificant portion of the total non-tax revenues. The detail for the same is
provided in the table below.
Table XII-5: Non-Tax Revenue from Power Sector - Jharkhand
Revenue 2009-10 2010-11 2011-12
Rs Cr
Non Tax Revenue From Power
Sector NA NA 0.15
Total Non-Tax Revenue NA NA 3,038.22
Power sector Non-Tax Revenue
/Total state Non-Tax Revenue NA NA 0%
Source: Audited CAG reports for the state: 2011-12, 2010-11, 2009-10
The overall income generated from power sector, in the year 2011-12, is ~Rs.
72.91 Cr, which is insignificant relative to the total revenues of state.

AF-MERCADOS EMI
Power Sector Operations and Impact on State Finances – Volume II 178
4.2. EXPENDITURE ON POWER SECTOR
The table below depicts the expenditure on the power sector made by the state
Government under various heads.
Table XII-6: Expenditure on Power Sector - Jharkhand
Categories 2009-10 2010-11 2011-12
Rs Cr
Capital expenditure NA NA 0
Revenue Expenditure NA NA 859.83
Total Expenditure NA NA 859.83
Source: Audited CAG reports for the state: 2011-12, 2010-11, 2009-10
The capital expenditure by the state Government in FY 2011-12, is nil highlighting no
expense is being done to improve the power sector infrastructure in the state.
The quantum of expenditure on Power sector exceeds the Revenue generated
from Power sector in the year.
4.3. POWER BONDS
Power Bonds were issued in 2004-05 & 2005-06. Outstanding balance in the beginning of
2006-07 was Rs. 2115.32 Cr. The total outstanding balance at the end of 2011-12 was Rs.
846.13 Cr. As per RBI ‘State Finance Report’ 2014, the outstanding liability of Power Bonds
in the state as on 31st March 2014 was Rs 420 Cr.
4.4. ANALYSIS ON STATE GUARANTEES AND SUBSIDIES
Guarantees
There are no guarantees given by the State Government to Power sector.
Subsidy
The subsides extended to power sector were Rs 784 Cr in FY 2011-12, out of which Rs 750
Cr were extended towards Jharkhand State Electricity Board.
4.5. POWER SECTOR FINANCING REQUIREMENT RELATIVE TO STATE ECONOMY
In this section, the expenditure (under all possible heads) on the power sector by the state
government has been listed to determine the state Power sector financing requirement,
which is then compared to state finances.
The sector financing requirement is estimated as the summation of total expenditure of the
state government on the sector including Capital and Revenue Expenditure, Loans and

AF-MERCADOS EMI
Power Sector Operations and Impact on State Finances – Volume II 179
Advances (Net Of Recoveries) and Public Debt repaid (Net of Receipts) by the State
Government.
Table XII-7: Financing Requirement for the Power Sector (2011-12) – Jharkhand
Particulars
2011-12
Rs Cr
Power Sector Expenditure (Capital and Revenue) 859.83
Loans And Advances made by the State Government (Net of
Recoveries) 164.95
8.5% Tax Free Special Bonds of the State Government (Power Bonds)
disbursed during the year (Net of Receipts)* 211.53
Loans for Power Projects-T&D from the Central Govt. Discharged
during the year (Net of Receipts) 0.003
Total Power Sector Financing during the year 1236.31
Sector Financing Requirement as a % age of total revenues of state 7%
GSDP nominal 91,421.00
Sector Financing Requirement as a % age of GSDP 1.35%
Financial Profit/(Loss) of Discoms during the year (with Subsidy
Realized) (3,211)
Sector Financing Requirement (including financial losses of Discoms )
as a % age of total revenues of state 26%
Sector Financing Requirement (including financial losses of Discoms )
as a % age of GSDP 4.86%
Source: State Government annual accounts from CAG, Data book for DCH - 22nd April, 2013, PFC
Report on Utility finances – 2011-12
The financing requirement for the Power sector in the state was estimated to be 7%% of
the revenue generated by the state and 1.35% of the Gross State Domestic Product.
Considering, the financial losses of Discoms in the year, the financing requirement of the
sector increases to 26% of the State revenue and 4.86% of the GSDP.

AF-MERCADOS EMI
Power Sector Operations and Impact on State Finances – Volume II 180
5. FINANCIAL RESTRUCTURING PLAN
Increase in power purchase costs, inadequate tariff hikes, almost free supply of electricity
to the agricultural sector and low subsidy realization from the state government has
deteriorated the financial position of the utilities in the state. In this context, distribution
utility of Jharkhand adopted the FRP of the central government. The status and likely
outlook of FRP in the state is discussed in the section below.
5.1. STATUS OF FINANCIAL RESTRUCTURING PLAN
Given below is the status of the financial restructuring plan’s (Fry’s) implementation in the
state.
Table XII-8: Status of FRP – Jharkhand
Particulars Jharkhand
Accumulated Losses as on cutoff date 10880 cr.
STL (eligible under the scheme) 5710 cr.
Bonds issued by Discoms to
participating lenders
2855 cr. – likely to be
issued by end of March, 14
Tariff petition for 2014-15 MYT filed in Jan 13, not
finalized
Operational losses to be funded
(2013-14)
1871 cr.
Road-Map for private participation in
distribution
Started in Ranchi and
Jamshedpur
Status of liquidation of regulatory
assets
Being examined
Status of preparation of time bound
plan for metering of all category of
consumers
Being Prepared
Status of enactment of State
Electricity Distribution Responsibility
Bill
Under Progress
Some of the key parameters relevant to FRP implementation have been shown in the table
below for Jharkhand
5.2. FRP OUTLOOK
In this report, key parameters for all the states mentioned above have been looked at in
order to comment on the likeliness of the state to meet key eligibility conditions set forth
by the FRP and be eligible for the central grants incentive scheme.
The color scheme used in the tables for each state in this section, refer to the color key
provided here:
Area of concern

AF-MERCADOS EMI
Power Sector Operations and Impact on State Finances – Volume II 181
Can be better
Good
Jharkhand has recently unbundled its operations in March, 2014. The erstwhile JSEB
reported a financial loss (without subsidy) of Rs.3211 Cr. in 2011-12, translating into a
financial gap of Rs.4.28/kWh.
With reference to the letter number 1544, dated 21st July 2014, submitted by the
Department of Energy, Government of Jharkhand, to Ministry of Power, the DISCOM has
requested for the entire amount of STL of Rs. 5710 Cr to be financed by debt, with Rs. 3000
Cr to be financed by Power Finance Corporation and Rs 2710 by Bank of India in consortium
with other banks.
As per the notified scheme, the bonds to be issued by Discoms were to be taken over by the
respective State Government. However, in the current scenario, it is proposed that the
entire amount will be serviced through debt only, which is in deviation from the FRP
scheme. The matter is pending with the Ministry of Power.
Some of the key parameters relevant to FRP implementation have been shown in the table
below for Jharkhand
Table XII-9: Historical Parameters – Jharkhand
Key Parameters 2005-06 2006-
07
2007-
08
2008-
09
2009-
10
2010-
11
2011-
12
2012-
13
2013-
14
AT&C losses 52% 54% 58% 54% 10% 47% 43% n.a n.a
Tariff Hikes - - - - - - Yes - n.a
Subsidy
Received/Booked 100% 100% 100% 100% 100% 100% 100% n.a n.a
Interest Cost/Total
Cost 14% 20% 17% 19% 21% 12% 8% n.a n.a
ACS-ARR Gap w/o
subsidy – Rs./kWh 0.99 1.06 1.82 1.38 1.14 1.30 4.28 n.a n.a
Source: PFC report on utility finances and Discom ARRs
Some of the key observations from the above table, along with relevant state-level aspects
are listed below.
- The AT&C losses have remained very high over the years due to persisting power
thefts, weak distribution infrastructure, and high level of unmetered consumers in
the state. A >3% annual reduction in AT&C losses from 47% (2010-11 benchmark
value) is required for the utility to benefit from the central grants incentive.
- Before being revised once in 2011-12, tariffs were not revised for a period of more
than 8 years. This is one of the biggest areas of concern for JSEB. Without frequent
and substantial tariff revisions, the Discom would not be able to benefit from any of
the financial incentives that are part of the FRP.

AF-MERCADOS EMI
Power Sector Operations and Impact on State Finances – Volume II 182
- The subsidy received-booked ratio has been high, indicating that the Discom,
regulator, and the state government have been in sync with respect to the amount
booked and actually disbursed.
- The share of Interest expenses has been significant. The moratorium on principal
repayments of 50% STL will help reduce the interest burden to some extent in the
short term.
- The ACS-ARR Gap needs to be reduced to by 25% annually from the Rs. 1.30/kWh
2010-11 in order to be eligible for the central grants incentive. In order to achieve
this reduction, both tariff revisions and operational efficiency improvements are
essential in Jharkhand. Assuming the AT&C losses are reduced by 3% in a year, the
financial gap will come down by around 16 paise/unit in terms of the cost reduction
achieved by purchasing fewer units to supply the same power as in 2010-1113
Unlike in the past few years, frequent and substantial tariff revisions coupled with consistent
reduction in AT&C losses is the only way that Jharkhand can benefit from the FRP scheme
and improve its financial health in the long term.
13 In order to estimate gap reduction, 2010-11 data has been taken for Jharkhand because the ACS in 2011-12 is
very high due to a huge increase in ‘other cost’ component.

AF-MERCADOS EMI
Power Sector Operations and Impact on State Finances – Volume II 183
6. ASSESMENT OF REGULATORY EFFECTIVENESS
The reforms in Jharkhand State were introduced by the mandates of the Electricity Act,
2003. However, with the exception of the setting up of the Jharkhand State Electricity
Commission, the progress of reforms has been slow. Electricity reforms in Jharkhand power
sector are far from complete and many stumbling blocks remain.
Some of the problems at the start of the reforms were:
The power sector in Jharkhand suffered from capacity shortages, frequent blackouts
and poor reliability
Less than full cost recovery together with theft and uncollected bills put a severe
strain on the financial health of the sector, reducing its capacity to invest and
sustain the power system
Losses at the Jharkhand State Electricity Board funded by large subsidies were a
major drain on the state budget
Commitment: Cooperation and commitment of government officials was essential for
smooth functioning of the system
6.1. FINANCIAL INDEPENDENCE/AUTONOMY
The primary source of income for the SERC’s include grant from the state government and
their own revenue generated through fees for annual license, fees for fling application etc.
If the SERC’s are significantly dependent on state grants for their operations vis-a-vis their
ability to generate revenue implies that they are financially dependent on the state
government, hence might not be able to undertake independent decisions, and may get be
influenced by the decisions of the State Government.
The Jharkhand State Electricity Commission is dependent on the state government funding
and the comparison with other states is provide in the table below.
The table below highlights the dependence of state electricity regulatory commission
Table XII-10: State Government funding as a percentage of income of SERC –
Jharkhand compared with other states.
S. No. States State Government funding as a
percentage of income of SERC’s
1 Haryana 100%
2 Meghalaya 80%
3 Karnataka 72%
4 Manipur and Mizoram 71%
5 Jharkhand 58%
6 Gujarat 0%
7 Maharashtra 0%

AF-MERCADOS EMI
Power Sector Operations and Impact on State Finances – Volume II 184
6.2. STATUS OF IMPORTANT REGULATIONS :
JSERC have notified MYT regulations for distribution and transmission in 2011 and for
generation utilities in FY 2012-13 which is the first control period for generation utilities.
Table XII-11: Status of Important Regulations - Jharkhand.
States MYT - Control Period Control
Period No.1
Jharkhand
Generation = First control period, 4 years;
Distribution = First control period, 4years;
Distribution = First control period, 4years.
Submitted on 02.08.2012 for approval.
FY 2012-13 to
FY 2015-16
Source: CEA
Jharkhand State Electricity Regulatory commission issued the Jharkhand State Electricity
Regulatory Commission (Open Access in Intra-State Transmission & Distribution)
Regulations in 2005.
6.3. FREQUENCY OF TARIFF REVISIONS:
The tariff revisions in the state have not been frequent over the past several years. The
tariff revisions in the state have been approved by regulator in FY 2011-12 The distribution
utility in Jharkhand has filled a tariff hike to the tune of 51% in FY 2011-12, and to the
tune of 36% In FY 2012-13. However, the tariff hike in was only approved in FY 2011-12.
AF-MERCADOS EMI
Power Sector Operations and Impact on State Finances – Volume II 185
7. SUMMARY
The key aspects of the state are discussed below :-
1. Power Supply Position: The power supply position in the state has improved in the
recent past; however, this is the situation when state has achieved only 67% of
electrification.
2. Tariff Hikes: There have been no tariff revisions in the past several years. The tariff
revisions in the state have been approved by regulator only FY 2011-12.
3. Subsidy: The subsidy burden for the state power sector is very high. It has grown
from 14% of total revenues to 24% over span of seven years. The subsidy payout
trend has been 100% all over the years.
4. Past Financial Burden: Power Bonds were issued in 2004-05 & 2005-06.
Outstanding balance in the beginning of 2006-07 was Rs. 2115.32 Cr. The total
outstanding balance at the end of 2011-12 was Rs. 846.13 Cr
5. Financial Restructuring Plan : The state has adopted for the FRP, and distribution
utility of the state is likely to issue bonds to the tune of Rs 2855 Cr. However,
seeing the past performance of the distribution utility, the key area of concern for
the state is are high AT&C losses and the increasing gap the utility.
6. High AT&C Losses : AT&C losses in the state has been very high. The AT&C losses
in 2011-12 were around 42% which is significantly higher than the national
average. This is due to poor distribution infrastructure, thefts and unmetered
consumers are the main reasons for the dismal performance of the utility on the
operational side.
7. Revenues from the sector to the state: Total Revenue (Rs. 72.91 Cr) from the
Power sector is less than the total expenditure on the sector (Rs. ~859 Cr) the
expenditure in the sector has increased due to improving capacity addition in the
recent past.
JSEB has consistently been making losses since inception due to very low
operating efficiency and its inability to recover costs. As a result, there has been
increasing dependence on the State Government for support.
AF-MERCADOS EMI
Power Sector Operations and Impact on State Finances – Volume II 186
XIII KARNATAKA
1. INTRODUCTION
1.1. BACKGROUND – POWER SECTOR OVERVIEW
In 1970, with the establishment of Karnataka Power Corporation Limited, the transmission
business was separated from the generation and distribution business, which was carried
out by Karnataka Electricity Board (KEB).
The Government of Karnataka initiated the power sector reforms in 1997 with the
announcement of reform policy. The policy aimed at attracting private investments,
establishing a regulatory mechanism to promote competition, improved operational
efficiency and cost reduction, and encouraging energy conservation.
In pursuance of the policy statement, the State Government issued the Karnataka Power
Sector Reform Act, 1999, which provided for the establishment of the Karnataka Electricity
Regulatory Commission (KERC). The erstwhile KEB was unbundled into Karnataka Power
Transmission Corporation Limited (KPTCL) that took over the functions of KEB and a
generating company of Vishweshwaraiah Viduyt Nigam Limited (VVNL).
In June 2002 KPTCL was further unbundled into KPTCL (transmission company) and four
distribution companies (DISCOMs) namely:
Bangalore Electricity Supply Company (BESCOM), which took over the city of
Bangalore Urban, Bangalore Rural, and four contiguous districts;
Mangalore Electricity Supply Company (MESCOM) by carving out the Mangalore Zone
of the former KEB with ten districts; Subsequently this has been split into two
Discoms;
Gulbarga Electricity Supply Company (GESCOM) with operational responsibility for
five districts; and;
Hubli Electricity Supply Company (HESCOM), with seven districts falling under the
Hubli Zone.
Further in 2005, a fifth DISCOM, Chamundeshwari Electricity Supply Corporation Limited
(CESC), was carved out of MESCOM and to manage the distribution of electric power for
the five districts. The five districts under CESC jurisdiction are Mysore, Chamarajanagar,
Mandya, Hassan and Madakeri.
1.2. GENERATION CAPACITY MIX
The total installed capacity in February 2014 (including allocated share in Joint & Central
Sector plants) for Karnataka was 13,997 MW out of which Coal based power capacity
accounted for ~44% followed by Hydro (~26% ) and Renewable (~26%). Diesel and
Nuclear based capacity accounted for a combined share of ~4%.
Figure below presents the generation capacity including allocated share in Joint & Central
sector plants.

AF-MERCADOS EMI
Power Sector Operations and Impact on State Finances – Volume II 187
Figure XIII-1: Generation Capacity Mix - Karnataka
44%
2%2%
26%
26%
Generation Capacity (incl. allocated share from Joint & Central Sector Plants)
Coal Diesel Nuclear Hydro Renewable
Source: CEA
1.3. POWER SUPPLY POSITION
Historically, the state of Karnataka has witnessed high levels of energy and peak deficit,
resulting in regular load shedding across most parts of the state. The energy deficit in the
state increased from ~1% in FY 06 to ~14% in FY 13. Simultaneously, the peak deficit
levels increased from ~7% in FY 06 to ~19% in FY 13. The decreasing PLFs of hydro-based
plants due to poor/weak monsoon and limited transmission corridor available between NEW
(North Eastern Western) and South grid added with the rapid level of commercialization in
the urban pockets of the state increased the deficit levels in the state.
However, with the integration of Southern Grid with the National Grid in January 2014 and
coupled with decline in energy demand, the energy and peak deficit is expected to
decrease. Energy deficit and peak deficit in FY 2013-14 was 9.5% and 7.8% respectively.
The trend of energy and peak deficits observed in Karnataka over the years is highlighted
in the figure below:
Figure XIII-2: Historical Trend in Energy Deficit - Karnataka
1%2%
3%
6%
8% 8%
11%
14%
10%
0%
2%
4%
6%
8%
10%
12%
14%
16%
0
10000
20000
30000
40000
50000
60000
70000
MU
Energy Deficit
Energy Required (MU) Energy Available (MU) Energy Deficit
Source: CEA

AF-MERCADOS EMI
Power Sector Operations and Impact on State Finances – Volume II 188
Figure XIII-3: Historical Trend in Peak Demand and Peak Met - Karnataka
7%
11%
15%
5%
13%
7%
19%
13%
7.8%
0%
5%
10%
15%
20%
0
2,000
4,000
6,000
8,000
10,000
12,000
MW
Peak Deficit
Peak Demand (MW) Peak Met (MW) Deficit (%)
Source: CEA
Further, the above deficit levels in the state are expected to reduce further in short to
medium term, on account of huge stranded capacity and low prevalent prices in the short
term market. The figure below presents the average daily short-term prices prevalent in
IEX in FY 14.
Figure XIII-4: Average Daily Short Term Prices IEX – S1 Region (2013-14)
0.001.002.003.004.005.006.007.008.009.00
10.00
1/4/
2013
17-0
4-20
13
3/5/
2013
19-0
5-20
13
4/6/
2013
20-0
6-20
13
6/7/
2013
22-0
7-20
13
7/8/
2013
23-0
8-20
13
8/9/
2013
24-0
9-20
13
10/1
0/20
13
26-1
0-20
13
11/1
1/20
13
27-1
1-20
13
13-1
2-20
13
29-1
2-20
13
14-0
1-20
14
30-0
1-20
14
15-0
2-20
14
3/3/
2014
19-0
3-20
14
Average Daily Day Ahead Market Price - S1
Maximum Price - Rs. 9.07per kWh
Average Price - Rs. 4.73 per kWh
Minimum Price - Rs. 2.33 per kWh
Source: IEX

AF-MERCADOS EMI
Power Sector Operations and Impact on State Finances – Volume II 189
2. ASSESSMENT OF OPERATIONAL PARAMETERS OF
DISTRIBUTION UTILITIES
2.1. CONSUMER SALES MIX OF KARNATAKA
The distribution activity in the state of Karnataka is segregated into five distribution
utilities. The state DISCOMs in the state caters to more than 18 million consumers, with
~43% of the consumers served by BESCOM.
In 2011-12, agriculture share dominated the sales mix with a share of 37%, followed by
industries (22%) and domestic (21%) consumer categories
The share of agricultural sales have marginally reduced over the years while the share of
commercial sales have increased. The share of agricultural sales have reduced from 38% in
2004-05 to 37% in 2011-12 and the commercial sales have increased from 9% in 2004-05
to 13% in 2011-12.
The historical trend of consumer sales mix for the state is given in figure below:-
Figure XIII-5: Historical Trend Consumer Sales Mix - Karnataka
0%
20%
40%
60%
80%
100%
2004-05 2005-06 2006-07 2007-08 2008-09 2009-10 2010-11 2011-12
Perc
enta
ge
Years
Domestic Agriculture Commercial
Industrial - HT Industrial - LT others
Source: PFC
The overall sales have registered a CAGR of 11% over the span of seven years wherein the
sales of commercial category have registered a higher CAGR of 17.2% followed by the
industrial (high tension) category with a CAGR of 12.6%.
In terms of revenue contribution, industries contributed ~29% of the revenue, followed by
commercial and domestic categories with a share of 22% and 21%, respectively. Although,
in 2011-12, agriculture revenue contributed ~21% share to the the overall revenue, which
was significantly higher than ~10% share in 2009-10. This clearly indcates a significant
reduction in both agricultural subsidy and cross-subsidiation from industrial and
commercial consumers.

AF-MERCADOS EMI
Power Sector Operations and Impact on State Finances – Volume II 190
The figure below compares the sales mix of FY 2011-12 and the revenue realized from the
different category of consumers.
Figure XIII-6: Comparative Analysis Consumer wise Sales and Revenue Mix (w/o
subsidy) 2011-12 – Karnataka
Domestic 19%
Commercial22%
Agriculture 21%
Industrial - HT 24%
Industrial - LT 5%
Others 9%
Category wise Revenue 2011-12
Domestic 21%
Agriculture
37%
Commercial 13%
Industrial -
HT
18%
Industrial -LT 4%
others 7%
Category wise Sales - 2011-12
Source: PFC
2.2. TRENDS IN COMMERCIAL AND TECHNICAL LOSSES
The current levels of Aggregated Technical & Commercial losses (AT&C) for Karnataka
distribution utilities are better, compared to the national average. Further, the loss levels in
the state have reduced significantly from 34% in FY 05 to 25% in FY 12.
Table XIII-1: Historical Trend AT&C losses and Collection Efficiency - Karnataka
Year FY 05 FY 06 FY 07 FY 08 FY 09 FY 10 FY 11 FY 12
AT&C Losses (%) 34% 38% 33% 32% 25% 25% 24% 25%
Collection
Efficiency (%) 90% 85% 91% 87% 93% 91% 91% 90%
Source: PFC
The loss levels have reduced significantly from FY 09 due to investments in programmes
like Rural Load Management System (RLMS), Extensive E&I works, involving re-conducting
and augmentation of Distribution Network. The improvement in collection efficiency from
FY 09 has further reduced the AT&C loss levels in the state. The box below depicts some of
the initiatives undertaken by the state DISCOMs to reduce the distribution losses are:
Box XIII-1: Initiatives undertaken by state DISCOMs to reduce AT&C losses
1. Balancing of loads on all the three phases in the LT circuit.
2. Upgrading the existing conductors in the HT/LT network.
3. Optimum utilization of transformer capacity by loading them to rated capacity.
4. Replacement of electro-mechanical meters by more accurate ETV meters for power
installations.
5. Shifting the transformers to load centers.
6. The meter reading schedules of consumer meters are synchronized with that of DTC
meters to arrive at more accurate loss values.
7. Replacing all MNR/faulty meters.
8. Replacement of electro-mechanical and high precision electromechanical meters by
ETV meters for power installations.
9. Increase in the vigilance activity.
10. Fixing meters to all DTC s for energy audit purpose.

AF-MERCADOS EMI
Power Sector Operations and Impact on State Finances – Volume II 191
Source: Approved tariff orders – 2012-13
Further, losses have also reduced due to the investment undertaken in the development of
HT lines over the years. HT/LT ratio improved from 0.49 in 2005-06 to 0.53 in 2009-10.
2.3. TRENDS IN DISTRIBUTION COSTS
Power purchase cost accounts for majority of distribution cost, accounting for ~83% of the
overall distribution costs.
The per-unit cost, break-up for different cost components for the state of Karnataka is
provided in the table below:-
Table XIII-2: Historical Trend in Distribution Cost Breakup - Karnataka
Cost
Component
(Rs. per kWh)
FY 05 FY 06 FY 07 FY 08 FY 09 FY 10 FY 11 FY 12
Power
Purchase Cost 2.16 2.05 2.19 2.36 2.82 2.71 3.04 2.99
O&M (R&M +
A&G + EC) 0.28 0.33 0.26 0.31 0.31 0.34 0.37 0.39
Interest 0.04 0.08 0.11 0.14 0.13 0.18 0.19 0.16
Depreciation 0.09 0.09 0.06 0.04 0.05 0.09 0.08 0.09
Other cost 0.03 0.11 0.05 0.09 0.06 0.03 -0.12 -0.01
Source: PFC
The power purchase cost has increased in recent years on account of reduced PLFs of the
hydro based generation that constitutes ~26% of the generation capacity. Hence, in order
to meet the increasing demand of the state, the state DISCOMs had to procure power from
the expensive short-term markets. The figure below illustrates the trend in short-term
prices the year 2011-12.
Figure XIII-7: Average Daily Short Term Prices IEX – S1 Region
0
2
4
6
8
10
12
14
16
18
01-0
4-20
11
17-0
4-20
11
03-0
5-20
11
19-0
5-20
11
04-0
6-20
11
20-0
6-20
11
06-0
7-20
11
22-0
7-20
11
07-0
8-20
11
23-0
8-20
11
08-0
9-20
11
24-0
9-20
11
10-1
0-20
11
26-1
0-20
11
11-1
1-20
11
27-1
1-20
11
13-1
2-20
11
29-1
2-20
11
14-0
1-20
12
30-0
1-20
12
15-0
2-20
12
02-0
3-20
12
18-0
3-20
12
Rs./k
Wh
Average Daily Short Term Prices - S1 (2011-12)
Maximum Price - Rs.16.63 per kWh
Average Price - Rs. 5.13 per kWh
Minimum Price - Rs. 2.05 per kWh
Source: IEX
The year on year trend in the state debt has increased over the years. Further, the average
interest rates for debt procurement have increased significantly to 8.79% in FY 11 and FY

AF-MERCADOS EMI
Power Sector Operations and Impact on State Finances – Volume II 192
12 from 7.31% and 6.65% in FY 08 to FY 10 and FY 06 to FY 07 respectively.14 The figure
below illustrates the year on year trend of debt undertaken by the state DISCOMs.
Figure XIII-8: Historical Trend in Debt taken by the state DISCOMs– Karnataka
13,140
17,440
23,500 24,920
35,350
39,830
45,580
-
5,000
10,000
15,000
20,000
25,000
30,000
35,000
40,000
45,000
50,000
1 2 3 4 5 6 7
Rs.
Cr.
Loans From FI's Other Loans State Govt Total Debt
Source: PFC
2.4. REVENUE REALIZATION
Tariff realization from different consumer category has not increased commensurate to
increasing power purchase cost. No tariff hikes were observed for several years (FY 05 to
FY 10) and tariffs were increased in FY 11 and FY 12 wherein tariffs were hiked by 4% and
7% respectively.
The table below depicts the average Tariff Realization in Karnataka in Major Consumption
Categories
Table XIII-3: Historical Trend in Consumer Wise Average Revenue Realization -
Karnataka
Years 2004-05 2005-06 2006-07 2007-08 2008-09 2009-10 2010-11 2011-12
Domestic 3.10 3.67 3.23 3.23 3.24 3.30 3.48 3.86
Agriculture 0.49 0.68 0.59 0.70 0.62 0.95 2.32 2.42
Commercial 6.14 4.61 6.14 6.18 12.63 6.42 6.72 7.14
Industrial
HT 4.51 4.60 4.60 4.62 3.26 4.90 5.45 5.73
Industrial
LT 4.40 4.60 4.61 4.28 4.29 4.48 4.57 4.89
Source: PFC
Agricultural and Bhagya Jyothi/Kutir Jyothi consumers are being subsidised by the state
government and the share of the state government subsidies accounts for ~7% of the total
revenues. However, due to low subsidy payout and increasing power purchase costs, the
state commission, increased the tariff for the agriculture consumers in FY 11 and FY 12,
which earlier were completely subsidized by the state government.
The tariff revisions are not frequent in the state; however, utilities are being provided fuel
surcharge through Fuel Adjustment Cost (FAC) as approved by the commission, on account
of fuel price variations
14 Approved MYT FY 08-10 and MYT FY 11-13 for all the state DISCOMs

AF-MERCADOS EMI
Power Sector Operations and Impact on State Finances – Volume II 193
3. ASSESSMENT OF FINANCIAL PERFORMANCE OF –
DISTRIBUTION UTILITY
3.1. FINANCIAL HEALTH OF DISTRIBUTION UTILITIES
The distribution financial losses without subsides in Karnataka have increased over the
years.
The figure below depicts the year on year trend in the profit/ (loss) booked by the state
DISCOMs
Figure XIII-9: Historical Trend in Financial Losses (w/o subsidy) - Karnataka
(1,465)
(1,138)
(1,668) (1,700)
(3,118)
(1,863)
(1,257) (1,298)
(3,500)
(2,800)
(2,100)
(1,400)
(700)
-
2004
-05
2005
-06
2006
-07
2007
-08
2008
-09
2009
-10
2010
-11
2011
-12
Rs.
Cr
Financial Losses (PAT) w/o subsidy
Source: PFC
The losses decreased in FY 2011 and FY 12 due to increase in tariff for different categories
of consumers. However, low realization of subsidy booked contributed to financial
deterioration of the distribution utilities. In 2011-12, the state DISCOMs reported a profit
(with subsidy booked) of Rs. 54 Cr.
3.2. SUBSIDY BOOKED V/S SUBSIDY RECEIVED
In 2011-12, the subsidy contributed ~7% of the total revenues of the state DISCOMS
compared to ~19% in 2005-06. The subsidy booked has reported an annual decline of 2%
over the span of seven years, compared to the ACS that has registered a CAGR of 5% over
the same period.The figure below depicts the year on year trend in subsidies booked and
received by the state utility.

AF-MERCADOS EMI
Power Sector Operations and Impact on State Finances – Volume II 194
Figure XIII-10: Historical Trend in Subsidy Booked v/s Subsidy Received -
Karnataka
1569 1,226 1,764 1,734 1,510 1,638 1,268 1,352
1289 1,228 1,764 1,699 1,451 1,472 1,268 1,195500
3500
6500
9500
12500
2004
-05
2005
-06
2006
-07
2007
-08
2008
-09
2009
-10
2010
-11
2011
-12
Rs. C
r
Years
Subsidy Booked Subsidy Received
Source: PFC
As shown in the figure above, the amount of subsidies booked by the state has decreased
significantly over the years. This is primarily on account of implementation of fixed charges
to the agricultural category and certain sections of domestic category in FY 11 and FY 12.
It can be observed, that in all the years, amount of subsidy realised was less than the
amount of subsidy booked for most of the years.
3.3. ACS V/S ARR
The gap (with subsidy) between average cost of supply and average revenue realized (with
subsidy) has remained marginal over the years. This is primarily due to the full cost-
recovery tariff approach being followed by the Commission.
The figure below depicts the trend in revenue gap on per unit sale of electricity to the
consumer
Figure XIII-11: Historical Trend in ACS v/s ARR (with subsidy) - Karnataka
-0.04 -0.05 -0.03 -0.02
0.41
0.05
-0.26 -0.33
2.59 2.66 2.672.94 3.37
3.363.55 3.61
2.64 2.70 2.692.96
2.96 3.31
3.81 3.94
-1.00
-0.50
0.00
0.50
1.00
1.50
2.00
2.50
3.00
3.50
4.00
4.50
2004-05 2005-06 2006-07 2007-08 2008-09 2009-10 2010-11 2011-12
Rs./
kWh
Years
Gap(with subsidy) ACS ARR (with subsidy)
Source: PFC
The revenue gap was extremely high in 2008-09, on account of increase in power purchase
cost and no tariff hike in that year.

AF-MERCADOS EMI
Power Sector Operations and Impact on State Finances – Volume II 195
4. STATE EXPEOSURE TO POWER SECTOR
4.1. INCOME FROM POWER SECTOR
The source of tax revenue is the electricity distribution tax, paid to the state government
by the distribution utilities. The tax revenue from the power sector formed ~1% of the
total tax revenue in the state in 2011-12. The details for the same are provided in the
table below:
Table XIII-4: Tax Revenue from Power Sector - Karnataka
Revenue 2009-10 2010-11 2011-12
Rs Cr
Tax Revenue From Power Sector 679 663 654.24
Total Tax Revenue 37,939 47,979 5,7551.00
Power sector Tax Revenue / Total
state Tax Revenue 2% 1% 1%
Source: Audited CAG Reports on state: 2011-12, 2010-11, 2009-10
Over the span of three years, the tax from power sector revenue and contribution to the
total state Tax Revenue has decreased.
The non-tax revenue from power sector is through Royalty/CESS on water for power
generation, transmission and distribution, Rural Electrification etc. The non-tax
revenue, which is Rs 5.31 Cr, forms 0.13% of the total non-tax revenues of the state
government in 2011-12. The details for the same are provided in the table below.
Table XIII-5: Non-Tax Revenue from Power Sector - Karnataka
Revenue 2009-10 2010-11 2011-12
Rs Cr
Non-Tax Revenue From Power
Sector 60 48 5.31
Total Non-Tax Revenue 3,334 3,358 4,086.86
Power sector Non-Tax Revenue
/Total state Non-Tax Revenue 2% 1% 0.13%
Source: Audited CAG Reports on state: 2011-12, 2010-11, 2009-10
The Non tax Revenue and the sector contribution in the total state non tax revenue has
decreased over the span of three years over the years.
4.2. EXPENDITURE ON POWER SECTOR
The details of the expenditure made on the power sector by the state are provided in the
table below:

AF-MERCADOS EMI
Power Sector Operations and Impact on State Finances – Volume II 196
Table XIII-6: Expenditure on Power Sector - Karnataka
Categories 2009-10 2010-11 2011-12
Rs Cr
Capital expenditure 1,750 1,381 1,081.64
Revenue Expenditure 2,352 4,460 5,326.07
Total Expenditure 4,103 5,841 6,407.71
Source: Audited CAG Reports on state: 2011-12, 2010-11, 2009-10
There has been an increase in the revenue expenditure since FY10 whereas the capital
Expenditure on the sector has declined. the overall expenditure on power sector has
increased since FY10.
Further, it can be observed that the state power sector is dependent on state government
subsidies to carry out its operations, as the revenue expenditure far exceeded the revenue
from tax and non-tax exceeded the revenue.
The expenditure on power sector has been more than the revenues generated from the
sector over the years.
4.3. ANALYSIS ON STATE GUARANTEES AND SUBSIDIES
The table below depicts the guarantees given to power sector relative to the total revenues
of the state
Table XIII-7: Guarantees as a Percentage of Total Revenues - Karnataka
Parameter 2009-10 2010-11 2011-12
Rs Cr
Guarantees given by State Govt. 469 330 260.00
Total Revenues of the State 41,272 51,338 61,638
Guarantees as a %age of Total Revenues
of State 1.14% 0.64% 0.42%
Source: Audited CAG Reports on state: 2011-12, 2010-11, 2009-10
Over the span of three years, the guarantees given to the Power sector has decreased. The
state government guarantees constituted a marginal ~0.42% of the overall state revenue
in 2011-12.
The table below depicts the three year average share of different utilities in sector
guarantees:

AF-MERCADOS EMI
Power Sector Operations and Impact on State Finances – Volume II 197
Table XIII-8: Breakup of Utility wise Guarantee (2011-12) - Karnataka
Utility 2009-10 2010-11 2011-12
Average
Share in
Sector
Guarantees
(%)
Rs Cr
Karnataka Power Corporation
Limited 323 181 110.00 58%
Hubli Electrcity Company
Limited 0 77 150.00 21%
Karnataka Power Transmission Corporation Limited
147 72 0 21%
Source: Audited CAG Reports on state: 2011-12, 2010-11, 2009-10
Over the span of three years Karnataka Power Corporation Limited accounted for an
aggregate share of 58% of the state revenues. The guarantee assistance to Hubli Electrcity
Company Limited has increased since FY10.
Subsidy
The table below depicts the average share of utilities in subsidies given to Power sector and
the average share of sector in total state subsidy over three years:
Table XIII-9: Power Sector Subsidy as a Percentage of overall subsidy (2011-12)
- Karnataka
Utility 2009-10 2010-11 2011-12
Rs Cr
Power Sector subsidy/ Total Subsidy 2,341 4,442 5,303
Source: Audited CAG Reports on state: 2011-12
The power sector received ~68% of the overall subsidy given by the state government over
the span of three years. In 2011-12, ~ Rs 1,195 Cr (subsidy received), is directed towards
the state DISCOMs to cover the under-recovery and losses by the state DISCOMs.
4.4. POWER SECTOR FINANCING REQUIREMENT RELATIVE TO STATE’S ECONOMY
In this section, the expenditure (under all possible heads) on the power sector by the state
government has been listed to determine the state Power sector financing requirement
which is then compared to state finances.
The sector financing requirement is estimated as the summation of total expenditure of the
state government on the sector including Capital and Revenue Expenditure, Loans and
Advances (Net Of Recoveries) and Public Debt repaid (Net of Receipts) by the State
Government.

AF-MERCADOS EMI
Power Sector Operations and Impact on State Finances – Volume II 198
Table XIII-10: Power Sector Financing Requirement (2011-12) – Karnataka
Particulars
2011-12
Rs. Cr
Power Sector Expenditure (Capital and Revenue) 6407.71.07
Loans And Advances made by the State Government (Net of
Recoveries) 21.07
8.5% Tax Free Special Bonds of the State Government (Power
Bonds) disbursed during the year (Net of Receipts) 0
Loans for Power Projects-T&D from the Central Govt. Discharged
during the year (Net of Recoveries) 1.92
Total Power Sector Financing during the year 6430.70
Sector Financing Requirement as a % age of total revenues of
state 10.43%
GSDP nominal (Rs lakhs) 286410.00
Sector Financing Requirement as a % age of GSDP 2.25%
Financial Profit/(Loss) of Discoms during the year (with Subsidy
Realised) (103)
Sector Financing Requirement (including financial losses of
Discoms ) as a % age of total revenues of state 10.6%
Sector Financing Requirement (including financial losses of
Discoms ) as a % age of GSDP 2.28%
Source: State Government annual accounts from CAG, Data book for DCH - 22nd April, 2013, PFC Report on
Utility finances – 2011-12
The financing requirement for the Power sector in the state was estimated at 10.43% of
the revenue generated by the state and 2.25% of the Gross State Domestic Product.
However, the financial losses of DISCOMs in 2011-12, increased the financing requirement
of the sector to 10.6% of the State revenue and 2.28 % of the GSDP.

AF-MERCADOS EMI
Power Sector Operations and Impact on State Finances – Volume II 199
5. REGULATORY EFFECTIVENESS
In accordance with the provisions of the Karnataka Electricity Reform Act 1999, the
Karnataka Electricity Regulatory Commission was established in 1999 and began
functioning from 15th November 1999.
The figure below presents the current organization structure of KERC.
Figure XIII-12: Organization Structure - KERC
Annex – 1.1 Organizational Chart of KERC
COMMISSION CHAIRMAN MEMBER - I MEMBER -II
SECRETARY
DY. DIRECTOR
(Administration)
ACCOUNTS OFFICER
SENIOR FINANCI
AL ANALYST SENIOR
ECONOMIC ANALYST
CONSUMER ADVOCATE
DY. DIRECTOR
(Legal) DIRECTOR
(Tariff) DIRECTOR
(Technical)
MANAGER
KANNADA TRANSLATION
OFFICER
PUBLIC RELATIONS
OFFICER
ASST. DIRECTOR (LEGAL)
ASST. SECRETARY
DY. DIRECTOR
(Tariff ) DY. DIRECTOR (Generation)
DY. DIRECTOR (Transmission)
DY. DIRECTOR (Distribution)
DY. DIRECTOR
(Demand Forecasting)
OMBUDSMAN
64
Source: KERC Annual Report
5.1. BUDGETING
The state regulatory commission, KERC, is dependent on state government grants and
subsidies to carry out its operations. In 2011-12, state government provided a grant of Rs
4.08 Cr to the commission. The commission generated ~Rs. 1.54 Cr from application,
licence fee. Hence, grants constitute ~72% of the overall revenue of the state commission.
Further, the surplus of ~1.59 Cr was deposited in personal deposit account of the
treasurer.
5.2. STAFFING15
The office of the Commission consists of permanent employees besides officials on
deputation and on contract basis. The total working strength of the Commission as at the
end of the financial year 2011-12 is 50.
In 2011-12, the commission consisted of:
4 permanent employees
20 Officials on deputation basis
23 Officials on contract basis, and;
15 KERC Annual Report 2011-12

AF-MERCADOS EMI
Power Sector Operations and Impact on State Finances – Volume II 200
03 Consultants on contract basis
Another important aspect that needs to be considered is that 92% of the staff especially
the technical staff is on deputation or on contract basis. Deputation is generally done from
another government department or from the utility itself, which again limits the true
independence of the staff of SERC’s.
5.3. MYT REGULATION
The MYT has been implemented for the third control period. The commission had selected a
control period of three years for all the three MYTs. The state utilities have shown
improvement in operational and financial parameters (viz. reduction in AT&C losses, higher
revenue realization through regular tariff increase, reduction in revenue gap) through
implementation of the MYT framework.
5.4. TARIFF REVISION
The tariff revision in the state has been very sporadic. The state did not revise tariff from
FY 06 to FY 10. The tariff has increased regularly from FY 11 to FY 13. The tariff revision
strategy has supported the DISCOMs to significantly reduce the distribution losses during
the same period. The table below depicts the historical trend in tariff revision in the state.
Table XIII-11: Historical Trend in Tariff Revision - Karnataka
FY
06
FY
07
FY
08
FY
09
FY
10
FY
11
FY
12
FY
13
Average Tariff
Revisions 0% 0% 0% 0% 0% 4% 7% 3%
Source: Approved Tariff Orders of DISCOM for that year
5.5. LEVEL OF METERING
The two major consumer segments that continue to be unmetered by the state DISCOMs
are BJ/KJ consumers (urban and rural BPL consumers) and agriculture consumers. In the
year 2011-12, ~76% and ~13% of the agriculture and BJ/KJ consumers were unmetered.
The figure below presents the DISCOM wise percentage of unmetered connections for the
above two categories.
Figure XIII-13: Percentage unmetered consumers in 2011-12 - Karnataka
98% 83%
72% 69%
24%
1% 0%
26%
16%16%
0%
10%
20%
30%
40%
50%
60%
70%
80%
90%
100%
BESCOM CESC GESCOM HESCOM MESCOM
% age un-metered connections (BJ/KJ and IP sets)
IP Sets - % Un-metered BJ/KJ - % Un-metered
Source: Annual Report of DISCOMs.

AF-MERCADOS EMI
Power Sector Operations and Impact on State Finances – Volume II 201
5.5.1. AGRICULTURE METERING
The state commission has approved a consumption norm for the irrigation pump (IP) sets
derived by the actual consumption per IP set as indicated in the monthly reports furnished
by state distribution utilities up to December of the financial year.
Table XIII-12: Agriculture Consumption Norm
DISCOM Weighted Average Consumption Norm
BESCOM 7534 units/installation/year
CESC 8613 units/installation/year
GESCOM 9708 units/installation/year
HESCOM 8210 units/installation/year
MESCOM 3916 units/installation/year
Source: Approved Tariff Order 2012-13 for the respective DISCOMs
The consumption has been projected for 6 hours, three phase supply to the irrigation pump
sets.
5.6. OPEN ACCESS
Open access regulations were issued by KERC 2004 as ‘Open Access Regulations, 2004’.
Further amendments on the regulations allowed open access to the High Tension
consumers in the state. In accordance with the Act, OA is permitted both at Central and
State level involving CTU and STU networks. Seeking access to the above requires
allocation of transmission capacity for the required volume to be transferred from an
injecting location to a drawee location. This access to network has been classified into two
broad categories namely Inter-state and Intra-State
The tariff and non-tariff barriers in the form of banking charge, levy withdraw and again
levy of cross subsidy surcharge, different commercial arrangement having different
technical requirement in terms of Meters, Feeder lines, scheduling restrictions etc., creates
an atmosphere of uncertainty and hence limit entry of investors. The impact of above
limitations, barriers and power deficit situation is evident from the fact that the State has
poor participation in terms of listed OA consumers on IEX
Figure XIII-14: Open Access Consumers - Karnataka
Source: IEX

AF-MERCADOS EMI
Power Sector Operations and Impact on State Finances – Volume II 202
6. SUMMARY
1. Demand Supply Gap: The deficit levels in the state have been on the higher side,
resulting in load shedding for various consumer categories in the state. However, with the
integration of Southern Grid with the NEW grid, the deficit levels are expected to reduce.
2. Level of Metering: The distribution utilities cater to high percentage share of
unmetered agriculture consumers. This has resulted in incorrect demand estimates for the
consumer categories.
3. Reduction in AT&C Loss Levels: As noted by the state commission, the state
DISCOMs have successfully been able to attain the set AT&C loss targets. The
implementation of RAPDRP programme along with improved metering in the state has led
to overall reduction of the AT&C losses in the state.
4. Subsidy: The agriculture and certain categories of domestic consumers are
subsidized the state government. The level of subsidy has reduced in FY 11 and FY 12, with
tariff increase for the above tow consumer categories. Further, the tariff for agriculture
consumers is one of the highest in the country.
5. Marginal Financial Gap: Financial gap is marginal, on account of subsidy received
from the state government, indicating an effective financial management by the state
DISCOMs.
6. Regulatory Effectiveness: Although, the state has been able to implement the
policy reforms initiated over the last decade, the impact of the reforms have been limited.
Although, the state utilities have improved the operational and financial parameters, viz.
reduction in AT&C loss level, reduction in financial gap, the state utilities continues to face
the difficulty of high percentage share of agriculture un-metered connections. Further, the
level of privatization in the state has been limited to the generation sector.
The sector operations pose a low risk on state finances, because of the recently
adopted strategy of better recovery from agriculture customers.
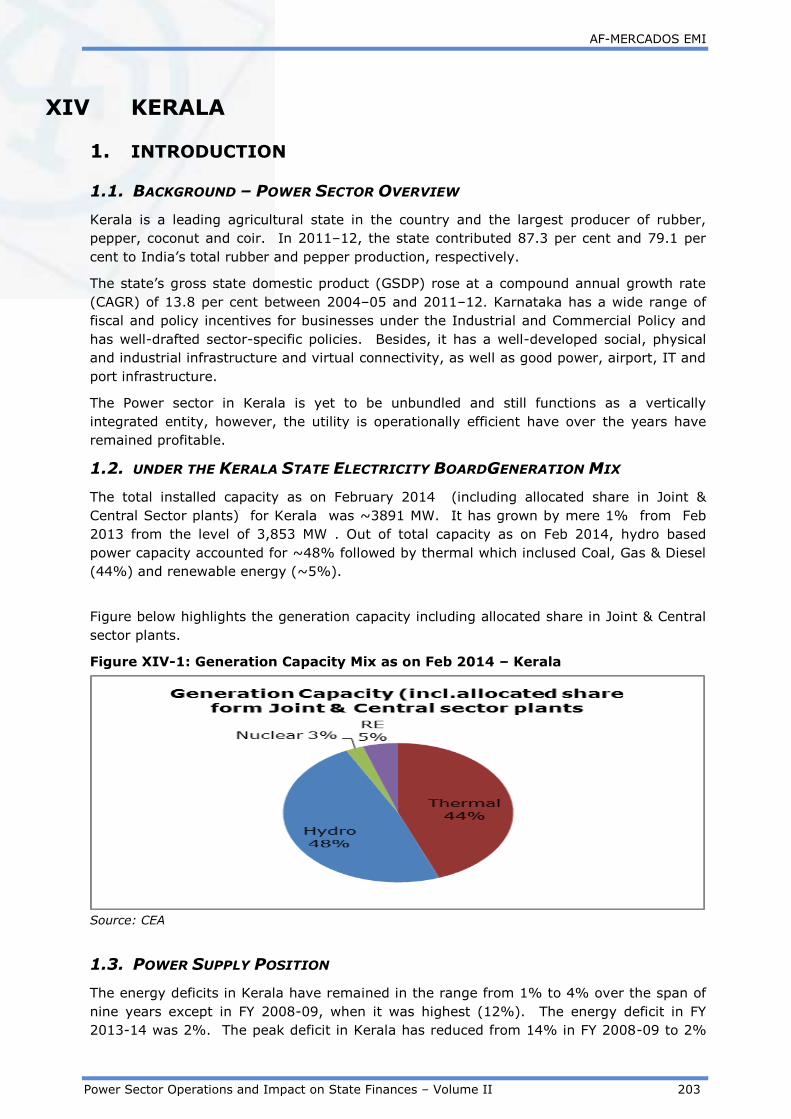
AF-MERCADOS EMI
Power Sector Operations and Impact on State Finances – Volume II 203
XIV KERALA
1. INTRODUCTION
1.1. BACKGROUND – POWER SECTOR OVERVIEW
Kerala is a leading agricultural state in the country and the largest producer of rubber,
pepper, coconut and coir. In 2011–12, the state contributed 87.3 per cent and 79.1 per
cent to India’s total rubber and pepper production, respectively.
The state’s gross state domestic product (GSDP) rose at a compound annual growth rate
(CAGR) of 13.8 per cent between 2004–05 and 2011–12. Karnataka has a wide range of
fiscal and policy incentives for businesses under the Industrial and Commercial Policy and
has well-drafted sector-specific policies. Besides, it has a well-developed social, physical
and industrial infrastructure and virtual connectivity, as well as good power, airport, IT and
port infrastructure.
The Power sector in Kerala is yet to be unbundled and still functions as a vertically
integrated entity, however, the utility is operationally efficient have over the years have
remained profitable.
1.2. UNDER THE KERALA STATE ELECTRICITY BOARDGENERATION MIX
The total installed capacity as on February 2014 (including allocated share in Joint &
Central Sector plants) for Kerala was ~3891 MW. It has grown by mere 1% from Feb
2013 from the level of 3,853 MW . Out of total capacity as on Feb 2014, hydro based
power capacity accounted for ~48% followed by thermal which inclused Coal, Gas & Diesel
(44%) and renewable energy (~5%).
Figure below highlights the generation capacity including allocated share in Joint & Central
sector plants.
Figure XIV-1: Generation Capacity Mix as on Feb 2014 – Kerala
Source: CEA
1.3. POWER SUPPLY POSITION
The energy deficits in Kerala have remained in the range from 1% to 4% over the span of
nine years except in FY 2008-09, when it was highest (12%). The energy deficit in FY
2013-14 was 2%. The peak deficit in Kerala has reduced from 14% in FY 2008-09 to 2%

AF-MERCADOS EMI
Power Sector Operations and Impact on State Finances – Volume II 204
in FY 2013-14. The energy demand and energy availability in the state has both grown at a
CAGR of 6% in the state.
The trend of energy and peak deficit observed in Himachal Pradesh over the years is
highlighted in the figure below:
Figure XIV-2: Energy Deficit – Kerala
Source: CEA
Figure XIV-3: Peak Deficit –Kerala
Source: CEA
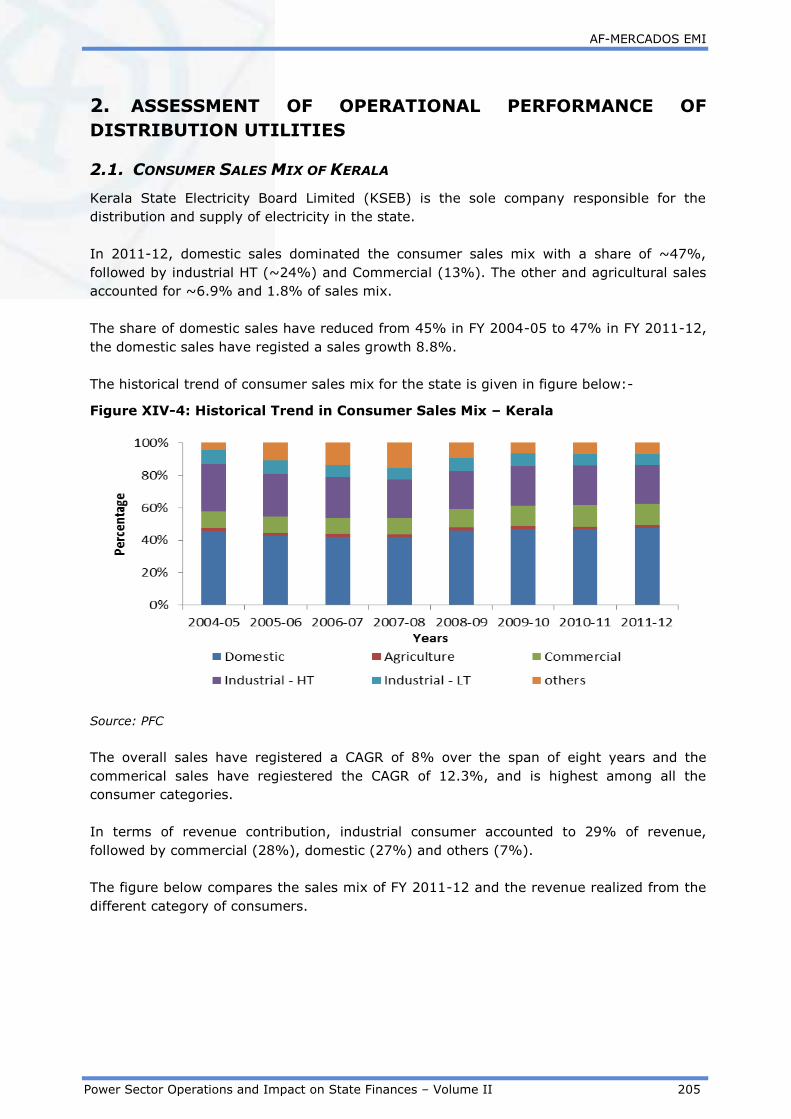
AF-MERCADOS EMI
Power Sector Operations and Impact on State Finances – Volume II 205
2. ASSESSMENT OF OPERATIONAL PERFORMANCE OF
DISTRIBUTION UTILITIES
2.1. CONSUMER SALES MIX OF KERALA
Kerala State Electricity Board Limited (KSEB) is the sole company responsible for the
distribution and supply of electricity in the state.
In 2011-12, domestic sales dominated the consumer sales mix with a share of ~47%,
followed by industrial HT (~24%) and Commercial (13%). The other and agricultural sales
accounted for ~6.9% and 1.8% of sales mix.
The share of domestic sales have reduced from 45% in FY 2004-05 to 47% in FY 2011-12,
the domestic sales have registed a sales growth 8.8%.
The historical trend of consumer sales mix for the state is given in figure below:-
Figure XIV-4: Historical Trend in Consumer Sales Mix – Kerala
Source: PFC
The overall sales have registered a CAGR of 8% over the span of eight years and the
commerical sales have regiestered the CAGR of 12.3%, and is highest among all the
consumer categories.
In terms of revenue contribution, industrial consumer accounted to 29% of revenue,
followed by commercial (28%), domestic (27%) and others (7%).
The figure below compares the sales mix of FY 2011-12 and the revenue realized from the
different category of consumers.

AF-MERCADOS EMI
Power Sector Operations and Impact on State Finances – Volume II 206
Figure XIV-5: Comparative Analysis of Consumer Sales and Revenue Mix 2011-12
– Kerala
Source: PFC
2.2. TRENDS IN COMMERCIAL & TECHNICAL LOSSES
The Aggregated Technical & Commercial (AT&C) Losses in Kerala have improved over the
years. The AT&C loss in FY 2011-12 was 12.2% which was 32% in FY 2004-05, and is
among the lowest in the country. The collection efficiency in the state has also improved
since FY 2009-10, the collection efficiency has remained in the range of 97% to 99%.
Table XIV-1: Year on Year Trend in AT&C losses and Collection Efficiency – Kerala
Year FY
05 FY 06 FY 07 FY 08 FY 09 FY 10 FY 11 FY 12
AT&C Losses
(%) 32% 23.6% 23.3% 21.5% 21.6% 14.9% 14.1% 12.2%
Collection
Efficiency 92% 96% 95% 95% 93% 98% 97% 99%
Source: PFC
The state has achieved low AT&C losses given the following efforts:
Faulty meter replacement: KSEB had replaced 10.21 lakhs faulty meters during
the year 2009-10 and 7.10 lakhs faulty meters during the year 2010-11 with good
quality meters.
Expanding HT Lines KSEB has added 3398 km of 11 kV lines and 7837 km of LT
lines during the year 2009-10. Further, KSEB has added 3644 km of 11kV lines and
6978.69km of LT lines during the year 2010-11.
However, the distribution utility in Kerala is now finding it difficult to improve its HT/LT
ratio According to KSEB, the T&D loss level is 16.09% for the year 2010-11 and further
loss reduction can be achieved mainly through improving HT-LT ratio. But due to public
resistance to drawing of HT lines, procuring land for installing substations and transformer
points etc, KSEB is facing difficulties in improving the HT-LT ratio further.
2.3. TRENDS IN DISTRIBUTION COST
The major cost component of distribution cost in Kerala in FY 12 was power purchase cost,
which accounted for 57% share in the total cost, followed by O&M (29%), the high O&M
cost is due the fact that distribution utility in Kerala is also responsible for the generation
assets of the state.

AF-MERCADOS EMI
Power Sector Operations and Impact on State Finances – Volume II 207
The per-unit cost, break-up for different cost components for the state of Kerala is
provided in the table below:-
Table XIV-2: Year on Year Trend Distribution Cost Breakup – Kerala
Cost Component
(Rs. per kWh) FY 05 FY 06 FY 07 FY 08 FY 09 FY 10 FY 11 FY 12
Power Purchase
Cost 0.99 1.15 1.20 1.72 2.70 2.58 2.92 3.49
O&M (R&M +
A&G + EC) 0.62 0.77 0.33 0.90 1.15 1.30 1.59 1.78
Interest 0.37 0.39 0.29 0.26 0.25 0.18 0.20 0.25
Depreciation 0.25 0.29 0.30 0.34 0.34 0.34 0.37 0.37
Other cost 0.13 0.20 1.07 0.87 0.20 0.30 0.16 0.28
Source: PFC
The power purchase cost in the state in FY 2011-12, was Rs 3.49 per unit, which is less
compared to other states in India as the state is rich in procurement from Hydro based
generation. The power purchase cost and the generation cost has been increasing over the
years, due to increase in the cost of thermal sources.
2.4. REVENUE REALIZATION
The tariff realization in the state is for different consumer categories is low, and is not
commensurate with the increasing distribution cost. The state did not have any tariff
revisions from the past several years hence; the tariff realization is low in the state.
The table below shows the revenue realization (without subsidy) from different consumer
categories over the years.
Table XIV-3: Historical Trend Consumer Category Wise Revenue Realization –
Kerala
Category FY 05 FY 06 FY 07 FY 08 FY 09 FY 10 FY 11 FY 12
Domestic 1.76 1.71 1.67 1.72 1.92 1.83 1.98 1.99
Agriculture 0.99 1.00 1.05 1.04 1.33 1.09 1.16 1.08
Commercial 6.69 6.62 6.61 6.68 7.44 7.46 7.23 7.44
Industrial HT 3.92 3.91 3.94 4.01 4.80 4.14 4.25 4.18
Industrial LT 4.15 4.14 4.14 4.15 4.60 4.09 4.38 4.20
Others 2.40 2.80 4.12 5.44 5.83 3.52 4.24 3.34
Source: PFC
It can be inferred from the above table that the domestic category in the state is being
cross subsidies with the industrial and commercial consumers. However, with the efficient
performance of the state distribution utility, the state financial performance has improved
over the years.

AF-MERCADOS EMI
Power Sector Operations and Impact on State Finances – Volume II 208
3. ASSESSMENT OF FINANCIAL PERFORMANCE OF –
DISTRIBUTION UTILITY
3.1. FINANCIAL HEALTH OF DISTRIBUTION UTILITIES
The financial losses (without subsides) of the distribution utility has improved over the
years, given the efficient operations of the distribution utility in Kerala. The utility has
shown a profit of Rs 2150 Cr in FY 2006-07, which has increased to Rs 2410 Cr in FY 2011-
12.
Figure XIV-6: Historical Trend Financial Losses (w/o) subsidies – Kerala
Source: PFC
The distribution utility in Kerala has shown an average profit margin of 4% over the span
of six years.
3.2. SUBSIDY BOOKED V/S SUBSIDY RECEIVED
The subsidy burden has remained negligible from past five years i.e. from the period of FY
08 to FY 12 as per PFC data. However, the GoK have been providing subsides, as per the
CAG accounts of the state16. The subsidies booked in FY 05 were Rs 343 cr and Rs 145 Cr
in FY 06, however, the subsidy realized were nil in the respective years. In FY 2010-11 the
utility has recived a subsidy of Rs 54 Cr.
The figure below provides the subsidy booked v/s subsidy received for the distribution
utilities in the state
Table XIV-4: Historical Trend Subsides Booked v/s Subsidies Received – Kerala
2004
-05
2005
-06
2006
-07
2007
-08
2008
-09
2009
-10
2010
-11
2011
-12
Subsidy
Booked (Rs Cr) 343 145 0 0 0 0 54 0
Subsidy
Received (Rs
Cr)
- 0 0 0 0 0 54 0
Source: PFC
The trend in subsidy pay-out with respect to the subsidy booked has been poor in the
state.
16 Have been discussed in the subsequent chapter
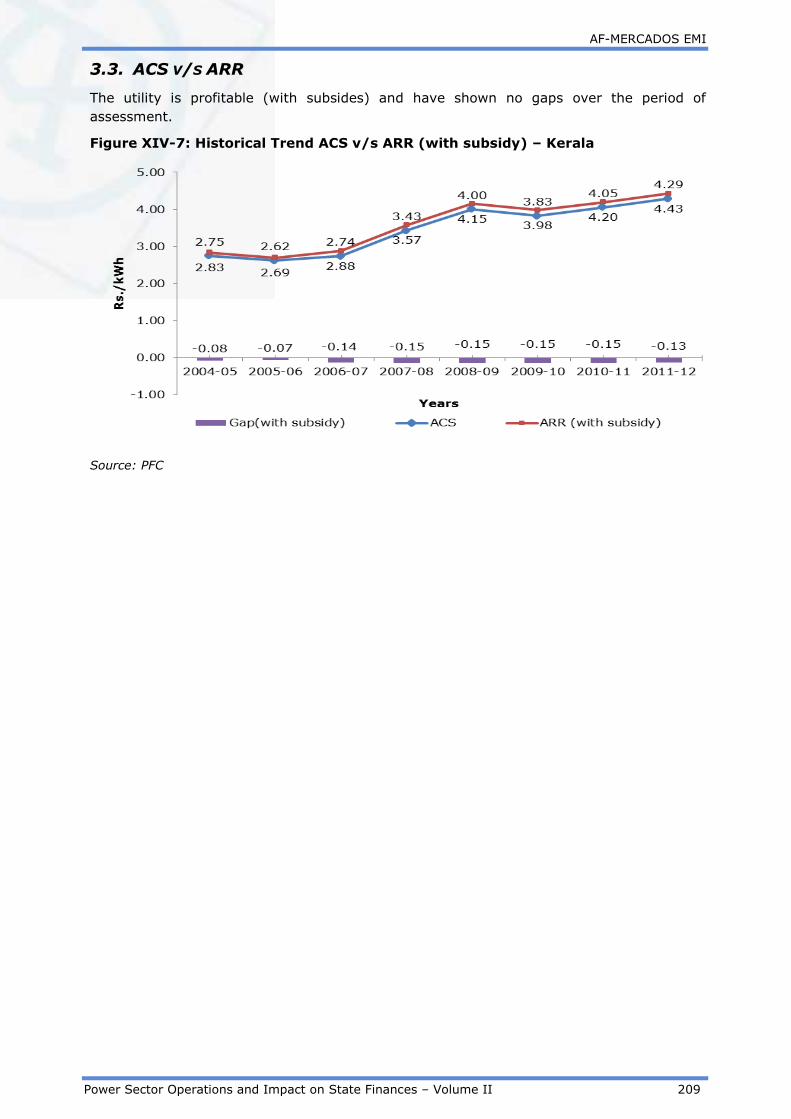
AF-MERCADOS EMI
Power Sector Operations and Impact on State Finances – Volume II 209
3.3. ACS V/S ARR
The utility is profitable (with subsides) and have shown no gaps over the period of
assessment.
Figure XIV-7: Historical Trend ACS v/s ARR (with subsidy) – Kerala
Source: PFC

AF-MERCADOS EMI
Power Sector Operations and Impact on State Finances – Volume II 210
4. STATE EXPOSURE TO POWER SECTOR
4.1. INCOME FROM POWER SECTOR
The tax revenue from the power sector forms less than 1% of the total tax revenue The tax
income is majorly through electricity distribution tax, which is paid by the distribution
utilities to the state government. The details for the same are provided in the table below.
Table XIV-5: Tax Revenue from Power Sector – Kerala
Revenue 2009-10 2010-11 2011-12
Rs Cr
Tax Revenue from Power Sector 25 21 21
Total Tax Revenue 22,024 26,864 31,709
Power sector Tax Revenue /
Total state Tax Revenue 0.11% 0.08% 0.07%
Source: CAG Audited Accounts for the state – 2011-12, 2010-11, 2009-10
The tax revenue from the power sector has decreased over the years. The contribution of
tax revenue from sector in total state tax revenue has been less than 1% since FY10.
The power sector did not generate any non tax revenue over the years.
4.2. EXPENDITURE ON POWER SECTOR
The table below depicts the expenditure on power sector made by the state government.
Table XIV-6: Expenditure on Power Sector – Kerala
Categories 2009-10 2010-11 2011-12
Rs Cr
Capital expenditure 0 8 0.05
Revenue Expenditure 69 134 98
Total Power Sector Expenditure 69 142 98
Source: CAG Audited Accounts for the state – 2011-12, 2010-11, 2009-10

AF-MERCADOS EMI
Power Sector Operations and Impact on State Finances – Volume II 211
Revenue expenditure has formed the major portion of total expenditure on Power sector.
The variations in expenditure have been on account of variation in expenditure towards
Non conventional energy sources and the general expenditure.
The quantum of expenditure towards power has been more than the quantum of
revenue generated from power sector.
4.3. ANALYSIS ON STATE GUARANTEES AND SUBSIDIES
The table below depicts the guarantees given to power sector relative to the total revenues
of the state
Table XIV-7: Guarantees as a Percentage of Total Revenues – Kerala
Particulars 2009-10 2010-11 2011-12
Rs Cr
Guarantees given by State Govt. 253 168 120
Total Revenues of the State 23,876 28,794 34,301
Guarantees as a %age of Total
Revenues of State 1.06% 1% 0.35%
Source: CAG Audited Accounts for the state – 2011-12
The guarantees towards power sector in Kerala has accounted for a share of ~1% of the
state revenues over the years. There has been a significant decrease in the guarantees
given to the Power sector over the years i.e. 1.06%in FY2010 to 0.35% in FY2012.
The table below depicts the three year average share of different utilities in sector
guarantees:
Table XIV-8: Utility wise Breakup of Guarantees– Kerala
Utilities 2009-10 2010-11 2011-12
Average
Share in
Sector
Guarantee
s (%)
Rs Cr
KSEB 0 168 120 99%
Bond issue 253 0 0 1%
Source: CAG Audited Accounts for the state – 2011-12, 2010-11, 2009-10
Guarantees towards KSEB accounted for a major share in total sector guarantees i.e. 99%
over the span of three years.
Subsidy

AF-MERCADOS EMI
Power Sector Operations and Impact on State Finances – Volume II 212
The table below depicts the average share of utilities in subsidies given to Power
sector and the average share of sector in total state subsidy over three years
Table XIV-9: Utility wise Breakup of Guarantees – Kerala
Particulars 2009-10 2010-11 2011-12
Average
Share in
Sector
Subsidy %
Rs Cr
KSEB towards Power Tariff
Concessions 0 100 55
97%
New and Renewable
Energy 0.6 1 3
3%
Power Sector subsidy (%
of total subsidy) 0.6 101 58
8%
Source: CAG Audited Accounts for the state – 2011-12, 2010-11, 2009-10
KSEB accounted for a share of 97% in the subsidy payments made towards Power sector
over the span of three years. The power sector accounted for aggregate share of 8% in
total state subsidy.
4.4. POWER BONDS
As per RBI ‘State Finance Report’ 2014, the outstanding liability of Power Bonds in the
state as on 31st March 2014 was Rs 230 Cr.
4.5. POWER SECTOR FINANCING REQUIREMENT RELATIVE TO STATE ECONOMY
In this section, the expenditure (under all possible heads) on the power sector by the state
government has been listed to determine the state Power sector financing requirement
which is then compared to state finances.
The sector financing requirement is calculated by a summation of the total Expenditure of
the state government on the sector including Capital and Revenue expenditure, Loans and
Advances (Net Of Recoveries) and Public Debt repaid(Net of Receipts) by the State
Government.
Table XIV-10: Financing Requirement of Power Sector (2011-12) – Kerala
Particulars 2011-12
Rs. Cr.
Power Sector Expenditure (Capital and Revenue) 98
Loans And Advances made by the State Government (Net of
Recoveries) 0
8.5% Tax Free Special Bonds of the State Government
(Power Bonds) disbursed during the year (Net of Receipts) 116
Loans for Power Projects-T&D from the Central Govt.
Discharged during the year (Net of Receipts) 0.07
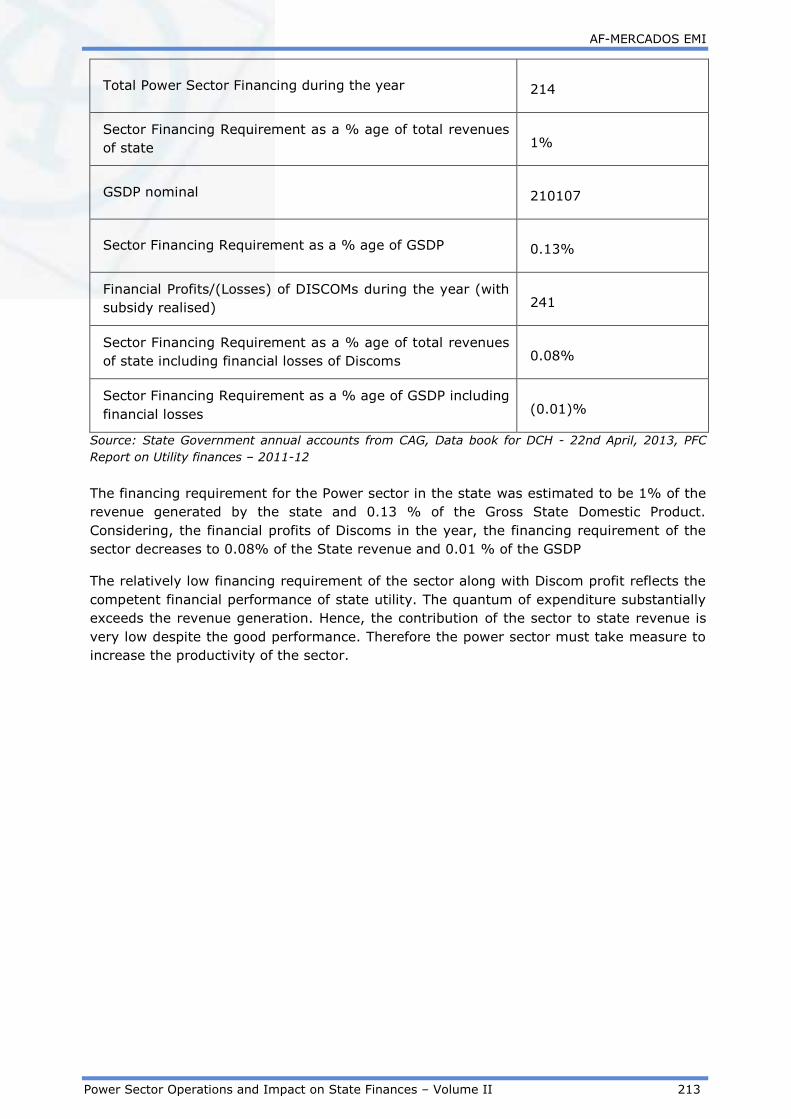
AF-MERCADOS EMI
Power Sector Operations and Impact on State Finances – Volume II 213
Total Power Sector Financing during the year 214
Sector Financing Requirement as a % age of total revenues
of state 1%
GSDP nominal 210107
Sector Financing Requirement as a % age of GSDP 0.13%
Financial Profits/(Losses) of DISCOMs during the year (with
subsidy realised) 241
Sector Financing Requirement as a % age of total revenues
of state including financial losses of Discoms 0.08%
Sector Financing Requirement as a % age of GSDP including
financial losses (0.01)%
Source: State Government annual accounts from CAG, Data book for DCH - 22nd April, 2013, PFC
Report on Utility finances – 2011-12
The financing requirement for the Power sector in the state was estimated to be 1% of the
revenue generated by the state and 0.13 % of the Gross State Domestic Product.
Considering, the financial profits of Discoms in the year, the financing requirement of the
sector decreases to 0.08% of the State revenue and 0.01 % of the GSDP
The relatively low financing requirement of the sector along with Discom profit reflects the
competent financial performance of state utility. The quantum of expenditure substantially
exceeds the revenue generation. Hence, the contribution of the sector to state revenue is
very low despite the good performance. Therefore the power sector must take measure to
increase the productivity of the sector.

AF-MERCADOS EMI
Power Sector Operations and Impact on State Finances – Volume II 214
5. ASSESSMENT OF REGULATORY EFFECTIVENESS
The Kerala Electricity Regulatory Commission (KERC) constituted under the Electricity
Regulatory Commission Act, 1998 came into being in 2002. The state regulator has been
proactive in determining the retail tariff by issuing tariff order since 2003.
Some of the key aspects have been discussed below: -
5.1. STATUS OF IMPORTANT REGULATIONS
KERC has approved the Multi Year Regulations in 2006, however, the KSEB has failed to comply with
the MYT regulations and have not filed MYT tariff petition with the KSERC. The Commission is of the
opinion that, filing of MYT petition need not be insisted as the Board as it is still functioning as a
single entity. The same has to be filed once the KSEB completes the unbundling process. The state
has approved the Open Access Regulations and has determined the Cross Subsidy Surcharge.
5.2. FREQUENCY OF TARIFF REVISIONS
The tariff revisions in the state have not happened for the past several years, until FY
2012-13 where the tariff revisions have been approved to the tune of 24%. Though the
state is in profitable position however, going forward with the increase in employee and
power purchase cost, the tariff revisions are must for the state.

AF-MERCADOS EMI
Power Sector Operations and Impact on State Finances – Volume II 215
6. SUMMARY
The key aspects of the state are discussed below;-
1. Low AT&C Losses: The state AT&C & T&D losses are among the lowest in the
country. The AT&C loss in the state in FY 2011-12 was ~12%.
2. Inadequate Tariff Revisions: The tariff revisions were done in FY 2012-13 after a
gap of several years wherein tariffs were hiked to the tune of 24%. However, the tariff
revisions in the state have not been commensurate with the increase in the distribution
cost, but operational efficiencies of the utility have kept financial position of utility healthy.
3. Financial Health of Utility: The financial losses (without subsides) of the
distribution utility has improved over the years, given the efficient operations of the
distribution utility in Kerala. The utility has shown a profit of Rs 2150 Cr in FY 2006-07,
which has increased to Rs 2410 Cr in FY 2011-12, with a profit margin of 4% over a span
of six years.
4. Exposure to the State Gov. to power sector: The financing requirement for the
Power sector in the state was estimated to be 1% of the revenue generated by the state
and 0.13 % of the Gross State Domestic Product. Considering, the financial profits of
Discoms in the year, the financing requirement of the sector decreases to 0.08% of the
State revenue and 0.01 % of the GSDP

AF-MERCADOS EMI
Power Sector Operations and Impact on State Finances – Volume II 216
XV MADHYA PRADESH
1. INTRODUCTION
1.1. BACKGROUND – POWER SECTOR OVERVIEW
The State of Madhya Pradesh is located in the central India. The state has an agrarian
economy. The state has the largest reserves of diamond and copper in India. Other major
mineral reserves include those of coal and coal-bed methane.
The Government of Madhya Pradesh initiated power sector reforms in the year 1999 by
establishing State Electricity Regulatory Commission and subsequently enacting Madhya
Pradesh Vidyut Sudhar Adhiniyam 2000. This Act provided for unbundling of the state
electricity board into: Madhya Pradesh Power Generating Company Limited (MPPGCL),
responsible for Thermal & Hydro generation; Madhya Pradesh Power Transmission
Company Limited (MPPTCL), responsible for transmission business; Madhya Pradesh Poorv
Ksherta Vidyut Vitran Company Limited (MPPKVVCL), Madhya Pradesh Madhya Kshetra
Vidyut Vitran Company Limited (MPMKVVCL), Madhya Pradesh Paschim Vidyut Vitran
Company Limited (MPPKVVCL) for undertaking distribution eastern, central and western
part of the state. Before these Companies could be registered Chhattisgarh was carved out
of Madhya Pradesh in November 2000 and the generation, transmission, and distribution
assets located in Chhattisgarh were transferred to the new state. The above five companies
were registered in November 2001 but they started functioning from July 2002 under
operation & management contract with Madhya Pradesh State Electricity Board (MPSEB).
1.2. GENERATION MIX
As on Feburary 2014, Madhya Pradesh’s total generation installed capacity (including
allocated share in Joint & Central Sector plants) is 12,902 MW out out of which Coal based
power capacity accounted for 66% followed by hydro (25%). Renewable Energy Resources
accounted for 5% of the total share.
The capacity addition (incl.procurment from Central & JV plants) has grown by
30% from last year, showing a significant increment in investments in capacity
addition.
Figure below highlights the generation capacity including allocated share in Joint & Central
sector plants.
Figure XV-1: Generation Capacity Mix – Madhya Pradesh
Source: CEA

AF-MERCADOS EMI
Power Sector Operations and Impact on State Finances – Volume II 217
1.3. POWER SUPPLY POSITION
Madhya Pradesh has witnessed significant supply deficits for several years on account of
load growth and lack of adequate capacity. However, the energy and peak deficits in the
state have continuously reduced post FY 2010-11. The energy deficit has reduced from
14% in FY 2005-06 to 4% in FY 2013-14. The peak deficit has substantially reduced from
22% in FY 2005-06 to 0% in FY 2013-14. The reduction in energy and peak deficit is due
to high capacity addition coupled with low energy demand in FY 2013-14. The increased
investment in capacity addition in state has led to a surplus generation capacity in MP.
The trend of energy deficit observed in Madhya Pradesh over the years is highlighted in the
figure below:
Figure XV-2: Energy Deficit – Madhya Pradesh
Source: CEA
The trend of peak deficit observed in Madhya Pradesh over the years is highlighted in the
figure below
Figure XV-3: Peak Deficit – Madhya Pradesh
Source: CEA
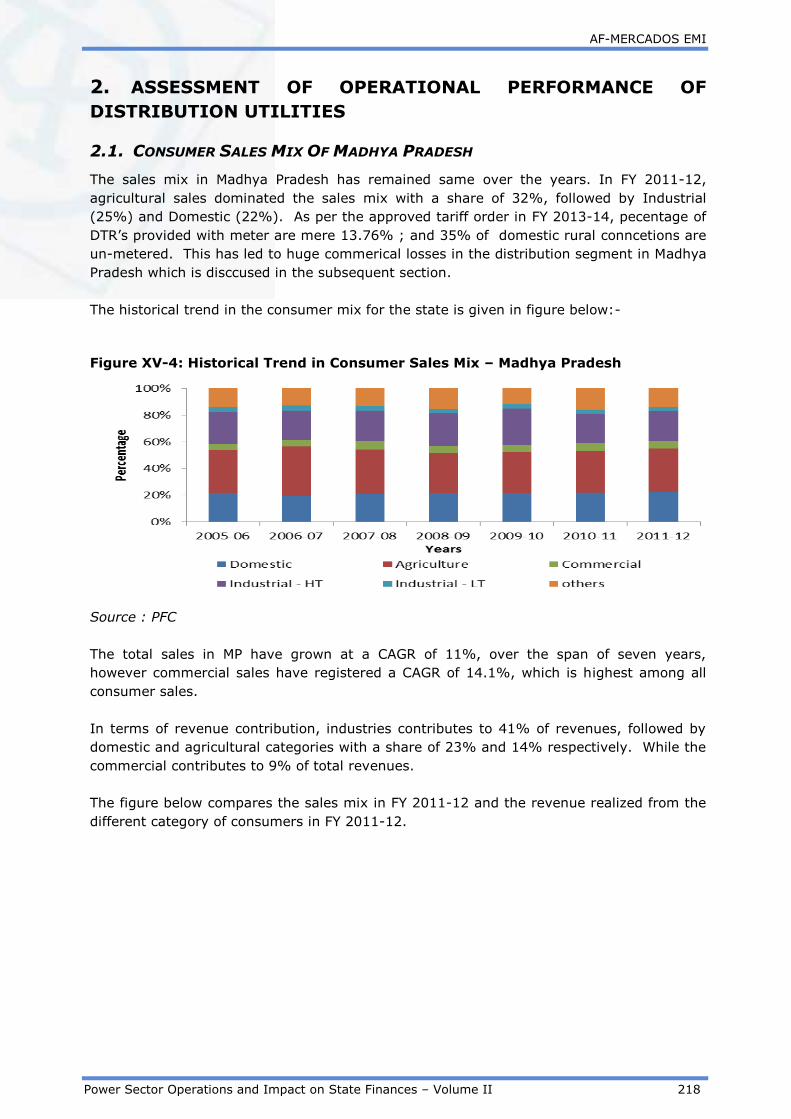
AF-MERCADOS EMI
Power Sector Operations and Impact on State Finances – Volume II 218
2. ASSESSMENT OF OPERATIONAL PERFORMANCE OF
DISTRIBUTION UTILITIES
2.1. CONSUMER SALES MIX OF MADHYA PRADESH
The sales mix in Madhya Pradesh has remained same over the years. In FY 2011-12,
agricultural sales dominated the sales mix with a share of 32%, followed by Industrial
(25%) and Domestic (22%). As per the approved tariff order in FY 2013-14, pecentage of
DTR’s provided with meter are mere 13.76% ; and 35% of domestic rural conncetions are
un-metered. This has led to huge commerical losses in the distribution segment in Madhya
Pradesh which is disccused in the subsequent section.
The historical trend in the consumer mix for the state is given in figure below:-
Figure XV-4: Historical Trend in Consumer Sales Mix – Madhya Pradesh
Source : PFC
The total sales in MP have grown at a CAGR of 11%, over the span of seven years,
however commercial sales have registered a CAGR of 14.1%, which is highest among all
consumer sales.
In terms of revenue contribution, industries contributes to 41% of revenues, followed by
domestic and agricultural categories with a share of 23% and 14% respectively. While the
commercial contributes to 9% of total revenues.
The figure below compares the sales mix in FY 2011-12 and the revenue realized from the
different category of consumers in FY 2011-12.

AF-MERCADOS EMI
Power Sector Operations and Impact on State Finances – Volume II 219
Figure XV-5: Comparative Analysis of Consumer Sales and Revenue Mix 2011-12 –
Madhya Pradesh
Source : CEA
2.2. TRENDS IN COMMERCIAL & TECHNICAL LOSSES
The Aggregated Technical & Commercial (AT&C) losses in Madhya Pradesh have remained
high from past seven years. The High commercial and technical losses are due to the high
dominance of agricultural sales and high unmetered sales for both domestic and
agricultural consumers. Out of total domestic rural connections state has 35% of them as
unmetered; and 14% of agricultural Distribution Transformer (DTR) are metered.
The distribution utilities have failed to achieve distribution loss targets given by the
commission for FY 2012. The trends observed in the collection efficiency are also on lower
side relative to other states.
Table XV-1: Year on Year Trend in AT&C losses and Collection Efficiency - Madhya
Pradesh
Year FY 06 FY 07 FY 08 FY 09 FY 10 FY 11 FY 12
AT&C Losses (%) 44.4% 45.7% 46.8% 46.6% 41.0% 37.3% 38.3%
Collection Efficiency
(%) 93% 86% 87% 84% 86% 87% 91%
Source: PFC
The state regulatory commission in its tariff order for FY 2013-14, has provided the loss
reduction trajectory for each DISCOMs, which seems to be difficult given current levels of
losses. The loss levels for FY 2013-14, FY 2014-15 and FY 2015-16 are 23%, 20%, 23%
for East, West and Central distribution utility respectively.
To achieve loss targets the state regulatory commission has directed to the state utility to
prepare and implement appropriate loss reduction strategies and schemes. Meterization at
various levels of the distribution network such as feeder/ DTR metering and consumer
metering is of prime importance to locate high loss areas to take action to curb losses.
Although HT/LT ratio has increased over the years, however is still lower than the best
performing states indicating that there is scope for improvement. HT LT ratio has
improved from 0.63 in 2005-06 to 0.70 in 2009-10.
Hence, in terms of operations efficiency, the MP discoms need to speed up their loss
reduction measures and achieve metering of consumers in the state.
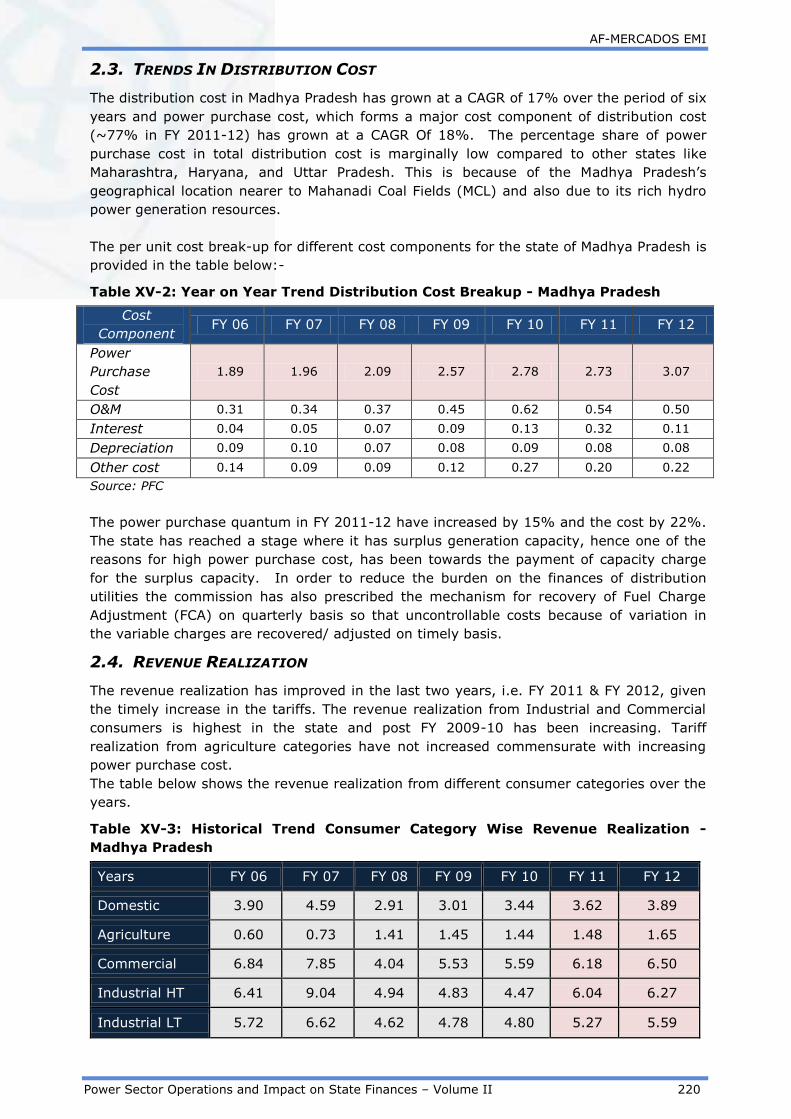
AF-MERCADOS EMI
Power Sector Operations and Impact on State Finances – Volume II 220
2.3. TRENDS IN DISTRIBUTION COST
The distribution cost in Madhya Pradesh has grown at a CAGR of 17% over the period of six
years and power purchase cost, which forms a major cost component of distribution cost
(~77% in FY 2011-12) has grown at a CAGR Of 18%. The percentage share of power
purchase cost in total distribution cost is marginally low compared to other states like
Maharashtra, Haryana, and Uttar Pradesh. This is because of the Madhya Pradesh’s
geographical location nearer to Mahanadi Coal Fields (MCL) and also due to its rich hydro
power generation resources.
The per unit cost break-up for different cost components for the state of Madhya Pradesh is
provided in the table below:-
Table XV-2: Year on Year Trend Distribution Cost Breakup - Madhya Pradesh
Cost
Component FY 06 FY 07 FY 08 FY 09 FY 10 FY 11 FY 12
Power
Purchase
Cost
1.89 1.96 2.09 2.57 2.78 2.73 3.07
O&M 0.31 0.34 0.37 0.45 0.62 0.54 0.50
Interest 0.04 0.05 0.07 0.09 0.13 0.32 0.11
Depreciation 0.09 0.10 0.07 0.08 0.09 0.08 0.08
Other cost 0.14 0.09 0.09 0.12 0.27 0.20 0.22
Source: PFC
The power purchase quantum in FY 2011-12 have increased by 15% and the cost by 22%.
The state has reached a stage where it has surplus generation capacity, hence one of the
reasons for high power purchase cost, has been towards the payment of capacity charge
for the surplus capacity. In order to reduce the burden on the finances of distribution
utilities the commission has also prescribed the mechanism for recovery of Fuel Charge
Adjustment (FCA) on quarterly basis so that uncontrollable costs because of variation in
the variable charges are recovered/ adjusted on timely basis.
2.4. REVENUE REALIZATION
The revenue realization has improved in the last two years, i.e. FY 2011 & FY 2012, given
the timely increase in the tariffs. The revenue realization from Industrial and Commercial
consumers is highest in the state and post FY 2009-10 has been increasing. Tariff
realization from agriculture categories have not increased commensurate with increasing
power purchase cost.
The table below shows the revenue realization from different consumer categories over the
years.
Table XV-3: Historical Trend Consumer Category Wise Revenue Realization -
Madhya Pradesh
Years FY 06 FY 07 FY 08 FY 09 FY 10 FY 11 FY 12
Domestic 3.90 4.59 2.91 3.01 3.44 3.62 3.89
Agriculture 0.60 0.73 1.41 1.45 1.44 1.48 1.65
Commercial 6.84 7.85 4.04 5.53 5.59 6.18 6.50
Industrial HT 6.41 9.04 4.94 4.83 4.47 6.04 6.27
Industrial LT 5.72 6.62 4.62 4.78 4.80 5.27 5.59

AF-MERCADOS EMI
Power Sector Operations and Impact on State Finances – Volume II 221
Source: PFC
The tariff revisions approved by the state regulatory commission, have been provided in
the table below.
Table XV-4: Trends of Tariff Revisions - Madhya Pradesh
FY 06 FY 07 FY
08
FY
09
FY
10
FY 11 FY
12
FY
13
Average Tariff
Revisions - 5% 0% - 4% 11% 6% 7%
Source: Tariff Orders
Although, there has been a timely increase in the tariffs, the increase has not been
adequate given the poor operational efficiency of the utilities. This has led to deterioration
in the financial health of the state distribution utility.
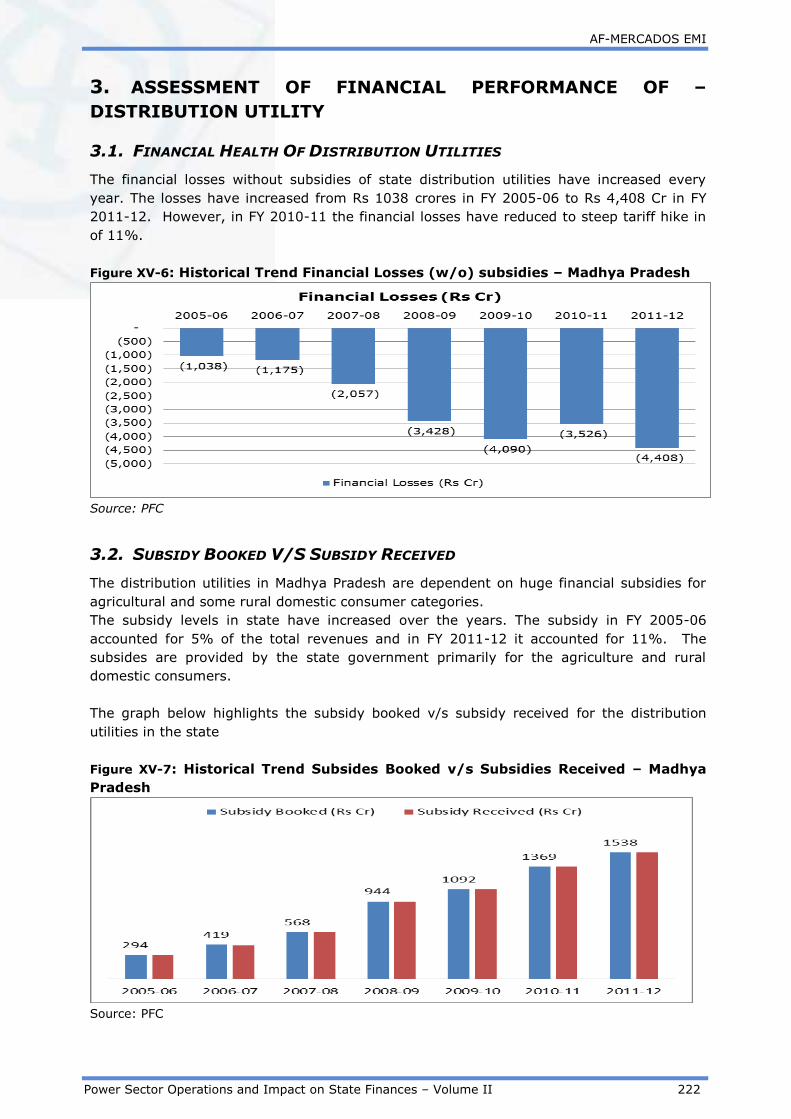
AF-MERCADOS EMI
Power Sector Operations and Impact on State Finances – Volume II 222
3. ASSESSMENT OF FINANCIAL PERFORMANCE OF –
DISTRIBUTION UTILITY
3.1. FINANCIAL HEALTH OF DISTRIBUTION UTILITIES
The financial losses without subsidies of state distribution utilities have increased every
year. The losses have increased from Rs 1038 crores in FY 2005-06 to Rs 4,408 Cr in FY
2011-12. However, in FY 2010-11 the financial losses have reduced to steep tariff hike in
of 11%.
Figure XV-6: Historical Trend Financial Losses (w/o) subsidies – Madhya Pradesh
Source: PFC
3.2. SUBSIDY BOOKED V/S SUBSIDY RECEIVED
The distribution utilities in Madhya Pradesh are dependent on huge financial subsidies for
agricultural and some rural domestic consumer categories.
The subsidy levels in state have increased over the years. The subsidy in FY 2005-06
accounted for 5% of the total revenues and in FY 2011-12 it accounted for 11%. The
subsides are provided by the state government primarily for the agriculture and rural
domestic consumers.
The graph below highlights the subsidy booked v/s subsidy received for the distribution
utilities in the state
Figure XV-7: Historical Trend Subsides Booked v/s Subsidies Received – Madhya
Pradesh
Source: PFC

AF-MERCADOS EMI
Power Sector Operations and Impact on State Finances – Volume II 223
The trend in subsidy pay-out with respect to the subsidy booked has always been 100% in
the state. Even with the high subsidy payouts in the state the distribution utilities still have
high revenue gaps.
3.3. ACS V/S ARR
The gap (with subsidy) between average cost of supply and average revenue realized has
increased every year till 2009-10. The gap has reduced in FY 2010-11 due to tariff hikes
approved by the commission.
Figure XV-8: Historical Trend ACS v/s ARR (with subsidy) – Madhya Pradesh
Source : PFC
The poor distribution operations, inadequate tariff revisions have led to huge burden of
subsideis and gurantess on the state state finances.
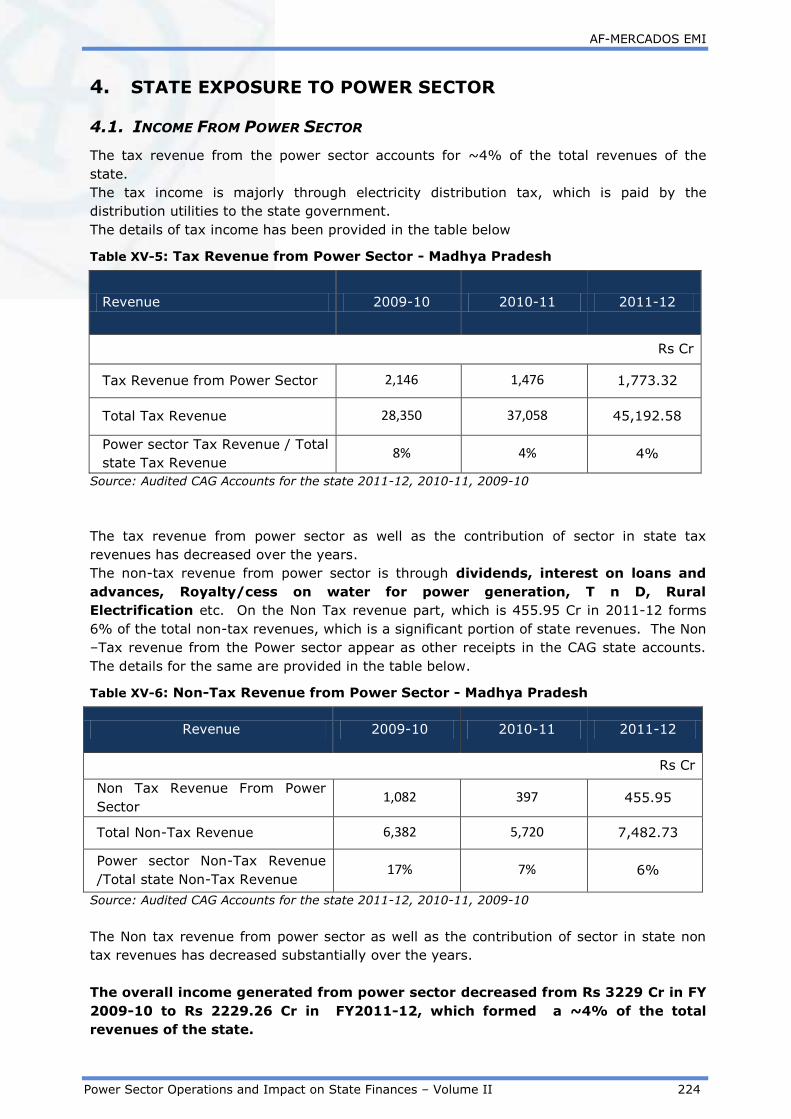
AF-MERCADOS EMI
Power Sector Operations and Impact on State Finances – Volume II 224
4. STATE EXPOSURE TO POWER SECTOR
4.1. INCOME FROM POWER SECTOR
The tax revenue from the power sector accounts for ~4% of the total revenues of the
state.
The tax income is majorly through electricity distribution tax, which is paid by the
distribution utilities to the state government.
The details of tax income has been provided in the table below
Table XV-5: Tax Revenue from Power Sector - Madhya Pradesh
Revenue 2009-10 2010-11 2011-12
Rs Cr
Tax Revenue from Power Sector 2,146 1,476 1,773.32
Total Tax Revenue 28,350 37,058 45,192.58
Power sector Tax Revenue / Total
state Tax Revenue 8% 4% 4%
Source: Audited CAG Accounts for the state 2011-12, 2010-11, 2009-10
The tax revenue from power sector as well as the contribution of sector in state tax
revenues has decreased over the years.
The non-tax revenue from power sector is through dividends, interest on loans and
advances, Royalty/cess on water for power generation, T n D, Rural
Electrification etc. On the Non Tax revenue part, which is 455.95 Cr in 2011-12 forms
6% of the total non-tax revenues, which is a significant portion of state revenues. The Non
–Tax revenue from the Power sector appear as other receipts in the CAG state accounts.
The details for the same are provided in the table below.
Table XV-6: Non-Tax Revenue from Power Sector - Madhya Pradesh
Revenue 2009-10 2010-11 2011-12
Rs Cr
Non Tax Revenue From Power
Sector 1,082 397 455.95
Total Non-Tax Revenue 6,382 5,720 7,482.73
Power sector Non-Tax Revenue
/Total state Non-Tax Revenue 17% 7% 6%
Source: Audited CAG Accounts for the state 2011-12, 2010-11, 2009-10
The Non tax revenue from power sector as well as the contribution of sector in state non
tax revenues has decreased substantially over the years.
The overall income generated from power sector decreased from Rs 3229 Cr in FY
2009-10 to Rs 2229.26 Cr in FY2011-12, which formed a ~4% of the total
revenues of the state.
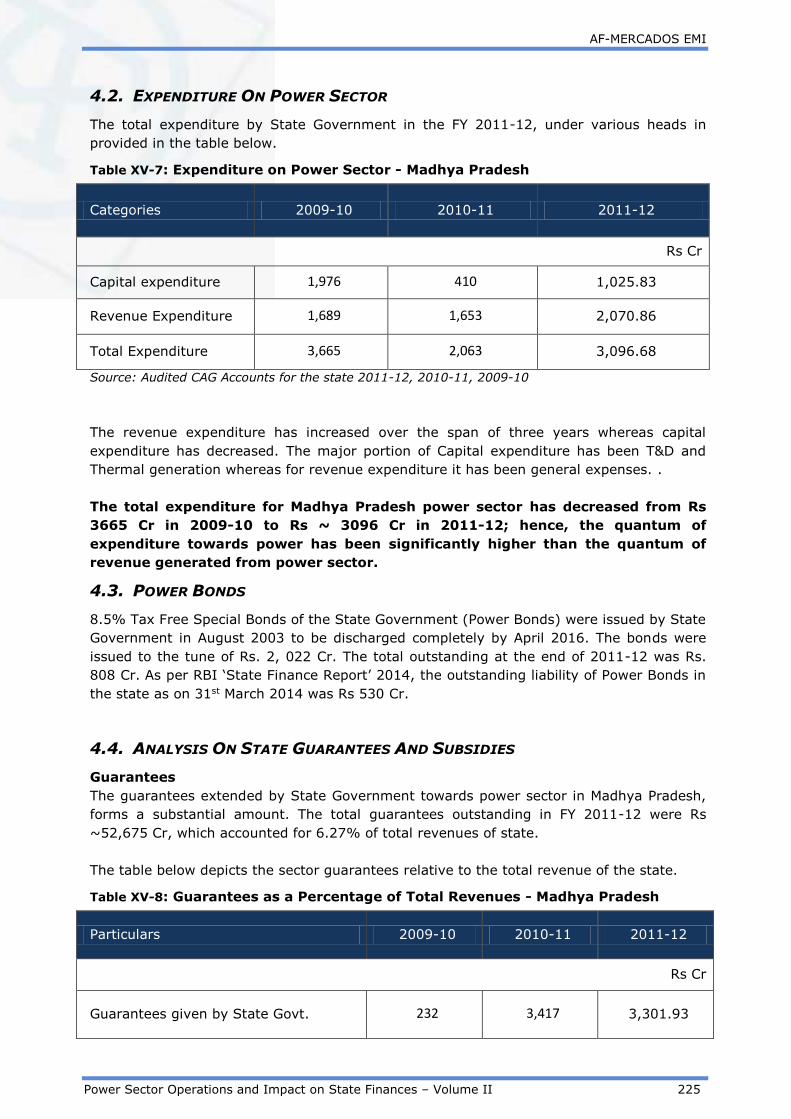
AF-MERCADOS EMI
Power Sector Operations and Impact on State Finances – Volume II 225
4.2. EXPENDITURE ON POWER SECTOR
The total expenditure by State Government in the FY 2011-12, under various heads in
provided in the table below.
Table XV-7: Expenditure on Power Sector - Madhya Pradesh
Categories 2009-10 2010-11 2011-12
Rs Cr
Capital expenditure 1,976 410 1,025.83
Revenue Expenditure 1,689 1,653 2,070.86
Total Expenditure 3,665 2,063 3,096.68
Source: Audited CAG Accounts for the state 2011-12, 2010-11, 2009-10
The revenue expenditure has increased over the span of three years whereas capital
expenditure has decreased. The major portion of Capital expenditure has been T&D and
Thermal generation whereas for revenue expenditure it has been general expenses. .
The total expenditure for Madhya Pradesh power sector has decreased from Rs
3665 Cr in 2009-10 to Rs ~ 3096 Cr in 2011-12; hence, the quantum of
expenditure towards power has been significantly higher than the quantum of
revenue generated from power sector.
4.3. POWER BONDS
8.5% Tax Free Special Bonds of the State Government (Power Bonds) were issued by State
Government in August 2003 to be discharged completely by April 2016. The bonds were
issued to the tune of Rs. 2, 022 Cr. The total outstanding at the end of 2011-12 was Rs.
808 Cr. As per RBI ‘State Finance Report’ 2014, the outstanding liability of Power Bonds in
the state as on 31st March 2014 was Rs 530 Cr.
4.4. ANALYSIS ON STATE GUARANTEES AND SUBSIDIES
Guarantees
The guarantees extended by State Government towards power sector in Madhya Pradesh,
forms a substantial amount. The total guarantees outstanding in FY 2011-12 were Rs
~52,675 Cr, which accounted for 6.27% of total revenues of state.
The table below depicts the sector guarantees relative to the total revenue of the state.
Table XV-8: Guarantees as a Percentage of Total Revenues - Madhya Pradesh
Particulars 2009-10 2010-11 2011-12
Rs Cr
Guarantees given by State Govt. 232 3,417 3,301.93

AF-MERCADOS EMI
Power Sector Operations and Impact on State Finances – Volume II 226
Total Revenues of the State 34,732 42,778 52,675.30
Guarantees as a %age of Total
Revenues of State 1% 8% 6.27%
Source: Audited CAG Accounts for the state 2011-12, 2010-11, 2009-10
There has been an increase in guarantees towards the power sector from 1% in 2009-10 to
6.27% in 2011-12.
The table below depicts the three year average share of different utilities in sector
guarantees:
Table XV-9: Utility wise Breakup of Guarantees - Madhya Pradesh
Utilities 2009-10 2010-11 2011-12
Average
Share in
Sector
Guarantee
s (%)
Rs Cr
MPSEB 0 232 205.87 6%
M.P.Power Generating Company 0 2,222 2,037.54 61%
M.P. Power Transmission
Company 79 216 252.36 8%
M.P.East Region Power
Distribution Company 48 293 214.18 8%
M.P.Central Region Power
Distribution Company 52 269 248.41 8%
M.P. Western Region Power
Distribution Company 54 185 343.55 8%
Source: Audited CAG Accounts for the state 2011-12, 2010-11, 2009-10
The Guarantees to the power sector has primarily risen due to increase in Guarantees
towards MP Power Generating Company.
Over the span of three years, the share of Genco in the Power Sector Guarantees has
accounted for a significant ~61%%.

AF-MERCADOS EMI
Power Sector Operations and Impact on State Finances – Volume II 227
Subsidy
The table below depicts the share of utilities in subsidies given to Power sector and share of
sector in total state subsidy.
Table XV-10: Power Sector Subsidy as a Percentage of overall subsidy - Madhya
Pradesh
Particulars 2009-10 2010-11 2011-12
Average
Share in
Sector
Subsidy
(%)
Rs Cr
Power Sector 1,807 1,535 1,551 100%
Power Sector subsidy/ Total
Subsidy 1,807 1,535 1,551 72%
Source: Audited CAG Accounts for the state 2011-12, 2010-11, 2009-10
Over the span of three years, the Subsidy given to Power sector has decreased and hence
the three year average share of sector subsidy in total state subsidy has been 72%
4.5. POWER SECTOR FINANCING REQUIREMENT RELATIVE TO STATE ECONOMY
In this section, the expenditure (under all possible heads) on the power sector by the state
government has been listed to determine the state Power sector financing requirement,
which is then compared to state finances.
The sector financing requirement is estimated as the summation of total expenditure of the
state government on the sector including Capital and Revenue Expenditure, Loans and
Advances (Net Of Recoveries) and Public Debt repaid (Net of Receipts) by the State
Government.
Table XV-11: Power Sector Financing Requirement (2011-12) - Madhya Pradesh
Particulars
2011-12
Rs Cr
Power Sector Expenditure (Capital and Revenue) 3,096.68
Loans And Advances made by the State Government (Net of
Recoveries) 5,954.49
8.5% Tax Free Special Bonds of the State Government (Power
Bonds) disbursed during the year (Net of Receipts)* 360.71
Loans for Power Projects-T&D from the Central Govt. Discharged
during the year (Net of Receipts) 0.38
Total Power Sector Financing during the year 9,412.27
Sector Financing Requirement as a % age of total revenues of state 18%

AF-MERCADOS EMI
Power Sector Operations and Impact on State Finances – Volume II 228
Particulars
2011-12
Rs Cr
GSDP nominal 201290
Sector Financing Requirement as a % age of GSDP 4.68%
Financial Profit/(Loss) of Discoms during the year (with Subsidy
realized) (2,870)
Sector Financing Requirement (including financial losses of Discoms
) as a % age of total revenues of state 23%
Sector Financing Requirement (including financial losses of Discoms
) as a % age of GSDP 6.10%
Source: State Government annual accounts from CAG, Data book for DCH - 22nd April, 2013, PFC Report on
Utility finances – 2011-12
The financing requirement for the Power sector in the state was estimated to be 18% of
the revenue generated by the state and 4.68 % of the Gross State Domestic Product.
Considering, the financial losses of Discoms in the year, the financing requirement of the
sector increases to 23% of the State revenue and 6.10 % of the GSDP.

AF-MERCADOS EMI
Power Sector Operations and Impact on State Finances – Volume II 229
5. ASSESMENT OF REGULATORY EFFECTIVENESS
The key aspects are discussed below :
5.1. STATUS OF MYT REGULATIONS
The state has notified all the important regulations viz. MYT regulations. MYT’s first control
period for Distribution was from 2007-08 to 2009-10 and second control period from 2010-
11 to 2012-13.
Table XV-12: Status of MYT Regulations - Madhya Pradesh
States Control Period Control Period
No.1
Control Period
No.2
Madhya Pradesh First control period = 3 years; for Generation,
Transmission and Distribution
FY 2007-08 to
FY 2009-10
FY 2010-11 to
FY 2012-13
5.2. STATUS OF OPEN ACCESS IMPLEMENTATION :
As on March 2013, Madhya Pradesh has 23 number of open access consumers in power
exchange which is among the lowest in India. Cross subsidy surcharge in Madhya Pradesh
ranges from Rs 0.81 at 33kV level and Rs 1.22/kWh at 133 kV level. In terms of
implementation of open access in the state commission in its order has directed the utilities
as follows: -
“The Commission has noticed with strong sense of dismay the lethargy and indifference
with which the applications for short term open access by consumers of 1 MW and above
are treated by the Discoms. The Commission would like to make it absolutely clear that it is
the right of every consumer of 1 MW and above to obtain electricity through open access at
the time and for the period of his choosing. Any hesitation on the part of Discoms to
obstruct or otherwise hinder open accessibility of electricity would be dealt with severely.”
5.3. FREQUENCY OF TARIFF REVISIONS:
The costs of the utilities have been increasing significantly in the last few years, adding to
the gap. The regulatory commission has only increased the tariffs in the recent past and
that have not been commensurate with increasing cost of power.
Table XV-13: Trends of Tariff Revisions - Madhya Pradesh
FY
05
FY
06
FY
07
FY
08
FY
09
FY
10
FY 11 FY 12 FY 13 FY 14
Average
Tariff
Revisions
- - 5% 0% - 4% 11% 6% 7% 1%
Source: Tariff orders
The commission has also being allowing the regulatory assets for basically to avoid tariff
shocks to consumers. This is not an unhealthy trend. This actually allows deferring of
burden on the consumers, as well as, time and scope for the Licensee to improve its
performance and altogether obviate the burden currently being envisaged.

AF-MERCADOS EMI
Power Sector Operations and Impact on State Finances – Volume II 230
5.4. REVIEW OF APPROACHES ADOPTED FOR MEASURING AGRICULTURAL
CONSUMPTION
In 2011-12, agricultural sales in Madhya Pradesh accounted for 33% of total sales. The
approach followed for determination of agriculture sales is the Compound Annual Growth
Rates (CAGRs) CAGR (for small, medium and long term) approach along with correction
factor to account for any State/ Central Govt schemes, pending connections.
The analysis of the data, appropriate/reasonable growth rates are assumed for future
consumer/ sale forecasts from the past CAGRs of the Category/Sub-category. The forecast
also considers the impact of schemes/ plans of licensees such as RGGVY as stated above.
The Commission had emphasized the importance of energy accounting and meterisation
and hence, Discoms are directed to prepare and implement appropriate loss reduction
strategies and schemes. Meterisation at various levels of the distribution network such as
feeder/ DTR metering and consumer metering is of prime importance. The Commission,
has however, noted with deep concern that not much headway has been made in this
direction by the distribution licensees during the past years. While there appears to be
some progress with regard to feeder meterisation, meterisation of agricultural DTRs and
individual un-metered domestic connections remains neglected.
The Commission is of the firm view that all consumers should be metered individually or at
least in group in case of agriculture consumers. The present regime of billing on benchmark
consumption to either domestic or agriculture consumers has no incentive for energy
saving by the consumers.17
The State Govt. has announced a flat rate payment scheme for the year 2013-14 for
agriculture pump consumers. Under this scheme the consumer shall make payment at a
flat rate per HP twice a year in advance in the months of April and October and the balance
amount shall be paid by the State Govt. as subsidy. This scheme includes un-metered
agriculture consumers. In view of the features of this scheme, it has now become
imperative that Discoms should provide meters expeditiously on agricultural predominant
DTRs to ensure that supply to agriculture consumers is measured and that proper energy
audit is possible.
17 Approved Tariff Order of 2012-13

AF-MERCADOS EMI
Power Sector Operations and Impact on State Finances – Volume II 231
6. SUMMARY
The level of Distribution losses, billings and collections remains an important issue. There is
a significant gap between the actual cost of the Distribution Licensees and the tariffs
allowed to them by the MPERC. The key aspects of the state are discussed below:-
1. Energy Supply Position: The energy supply position in the state has improved, and
the peak deficit in the state is zero, because of significant capacity addition coupled with
reduced energy and peak demand. The state has reached a surplus level of its power
generation capacity.
2. Tariff Hikes: The tariff hikes have been timely in the state , however, the hikes
have not been commensurate with the increase in the power purchase cost. The significant
tariff hikes have been approved in 2010-11 to the tune of 11%. However, tariff hikes have
been low in subsequent year, hence increasing the gap of distribution sector of state.
3. Subsidy: The subsidy trends have doubled in a span of six years. The state subsidy
payout trend has been 100% all over the years. The subsidies are primarily towards
agriculture and rural domestic consumers.
4. Past Financial Baggage: 8.5% Tax Free Special Bonds of the State Government
(Power Bonds) were issued by State Government in August 2003 to be discharged
completely by April 2016. The bonds were issued to the tune of Rs. 2, 022 Crores. The
total outstanding at the end of 2011-12 was Rs. 808 Crores.
5. Operational Efficiency: The distribution utilities are having high levels of losses in
terms of technical and commercial losses due to high level of unmetered sales and
increasing distribution network in the rural/remote areas under rural electrification
program.
6. States Guarantees: The guarantees for the sector are significant and account for
6.27 % of Total Revenues of the state.
7. Revenues from the sector to the state: Total Revenue (Rs. ~2229 Crores) from
the Power sector is less than the total expenditure on the sector (Rs.~ 3096 Crores) The
expenditure in the sector have increased due to improving capacity addition in the recent
past. The revenues from the power sector in Madhya Pradesh forms a significant amount
in tax and non-tax revenues.
The sector operations pose a high risk on state finances due to large level of
subsidy and deficit exposure.

AF-MERCADOS EMI
Power Sector Operations and Impact on State Finances – Volume II 232
XVI MAHARASHTRA
1. INTRODUCTION
1.1. BACKGROUND – POWER SECTOR OVERVIEW
Located in the Western part of India, Maharashtra is India’s third largest state, stretching
over 307,690 sq km. Maharashtra has a population of 112 million as on 2011 census,
making it the second most populous state in India. Maharashtra is one of the most
economically advanced states in the country, and is the leading hub for financial services
as well as manufacturing industries in the country. It is also a state where power shortages
are the most severe. After a decade of chronic underinvestment in its power sector,
Maharashtra is now gearing up for rapid growth in the electricity sector through massive
investments through the value chain.
As the State Utility was in huge disarray it became inevitable to unbundle the oversized
Maharashtra State Electricity Board (MSEB). Hence on June 6, 2005 the SEB was dissolved
and four companies came into the existence:
Maharashtra State Electricity Distribution Company (MSEDCL/Mahadiscom or
Mahavitaran)
Maharashtra State Electricity Transmission Company (MSETCL/Mahatransco or
Mahapareshan)
Maharashtra State Electricity Generation Company (MSPGCL/Mahagenco or
Mahanirmiti)
MSEB Holding Company
Apart from these State sector entities which supply power to the entire State of
Maharashtra except the State capital - Mumbai, historically, generation, transmission and
distribution networks in the city of Mumbai were developed and owned by private licensees
such as The Tata Power Company Ltd (TPC) and Reliance Energy Ltd. (REL). Moreover, in
the island city of Mumbai (i.e., the metropolitan area excluding its suburbs) the retail
supply of electricity has been the responsibility of a local municipal authority namely
Brihan-Mumbai Electricity Supply and Transport Undertaking (BEST). The State also has a
rural electric co-operative society - Mula- Pravara Electric Co-operative Society (MPECS) in
Ahmednagar district.
1.2. GENERATION MIX
As on Feburary 2014, Maharshtra’s total generation installed capacity (including allocated
share in Joint & Central Sector plants) was 33,043 MW out of which coal based capacity
accounted for 63% followed by RE based generation (14%), gas (11%), and hydro (10%).
The capacity addition (incl.procurment from Central & JV plants) has grown by 15% from
last year, showing a significant increment in capacity addition and procurement from
central sector plants.
Figure below presents the generation capacity including allocated share in Joint & Central
sector plants.

AF-MERCADOS EMI
Power Sector Operations and Impact on State Finances – Volume II 233
Figure XVI-1: Generation Capacity Mix – Maharashtra
Source: CEA
1.3. POWER SUPPLY POSITION
Maharashtra has been witnessing significant energy and peak deficit for several years on
account of load growth and lack of adequate capacity addition. However, the deficit has
fallen to all time low in last two financial years, because of increased capacity addition
coupled with low demand in the state.
The energy deficits in the state have decreased from 18% in FY 2005-06 to 2% in FY 2013-
14 and the peak deficits have reduced from 23% in FY 2005-06 to 7% in FY 2013-14.
The trend of energy and peak deficit observed in Maharashtra over the years is highlighted
in the figure below:
Figure XVI-2: Energy Deficit - Maharashtra
Source: CEA

AF-MERCADOS EMI
Power Sector Operations and Impact on State Finances – Volume II 234
Figure XVI-3: Peak Deficit – Maharashtra
Source: CEA
2. ASSESSMENT OF OPERATIONAL PERFORMANCE OF
DISTRIBUTION UTILITIES
2.1. CONSUMER SALES MIX OF MAHARASHTRA
The sales mix in Maharashtra is presented for the regions of state distribution utilities and
exclude private distribution companies. In FY 2011-12, industries dominated the sales mix
with a share of 38%, followed by agricultural and domestic sales with share of 27% and
~16% respectively. However, share of Industrial sales in total sales have fallen from 2004-
05 levels of 43% to 38% in FY 2011-12, on the other hand agriculture sales as as a
percentage of total sales have grown from 22% in 2004-05 to 27% in FY 2011-12, this is
because of increasing rural electrification and increasing metering in the state.
The historical trend of consumer sales mix for the state is given in figure below:-
Figure XVI-4: Historical Trend in Consumer Sales Mix – Maharashtra
Source: PFC
The sales in state have grown at a CAGR of 6.4% over the span of seven years, whereas,
commercial sales have registered the CAGR of 15.7%, which is highest among all the
consumer categories.
In terms of revenue contribution, industries contributed 49% of revenue, followed by
domestic, commercial and agricultural categories with a share of 15%, 12% and 12%,
respectively.

AF-MERCADOS EMI
Power Sector Operations and Impact on State Finances – Volume II 235
The figure below compares the sales mix of FY 2011-12 and the revenue realized from the
different category of consumers.
Figure XVI-5: Comparative Analysis of Consumer Sales and Revenue Mix 2011-12
- Maharashtra
Source: PFC
2.2. TRENDS IN COMMERCIAL & TECHNICAL LOSSES
The Aggregated Technical & Commercial (AT&C) losses for Maharashtra state distribution
utilities have shown an improving trend, it has improved from 33% in 2005-06 to 21.6% in
2011-12. Over the years AT&C losses (%) has improved as more investments were being
done on the HT lines. The trends of collection efficiency, however needs more
improvement.
Table XVI-1: Year on Year Trend in AT&C losses and Collection Efficiency –
Maharashtra
Year FY 05 FY 06 FY 07 FY 08 FY 09 FY 10 FY 11 FY 12
AT&C Losses
(%)
28% 33.2% 34.6% 31.3% 31.2% 25.0% 23.3% 21.6%
Collection
Efficiency
109% 91% 93% 90% 88% 94% 93% 93%
Source: PFC
The reasons for high losses are due to theft, pilferage, defective meters, unmetered
agriculture consumers, and errors in meter reading18. The state increasing distribution
network under rural electrification program is through long 11kV and LT lines. These LT
lines are contributing significantly in technical losses, due to far flung rural nature of
agriculture consumers across the state.
As per the order of MERC in FY 2010-11 the un- metered agricultural consumers accounted
for 49% of total agriculture consumers.
The non-availability of quality agencies for meter reading and tendency on the part of the
consumer not to keep the metering installation in order, increases the errors in meter
readings.
18 As reported by distribution utility (MSEDCL), source Tariff order of MSEDCL for FY 2011-12, & FY 2012-13

AF-MERCADOS EMI
Power Sector Operations and Impact on State Finances – Volume II 236
To reduce the high losses in the Bhiwandi, MSEDCL implemented a Franchisee
Model which proved to be very successful and a trend setter in power distribution
sector of the country. Accordingly a few more franchisees were allotted areas and
review on loss reduction was being taken regularly. On these lines, MSEDCL is
planning to hand over some more high loss making areas of MSEDCL through
distribution franchisee model.
Although HT/LT ratio increased over the years, they are still lower than the best performing
states indicating that there is scope for improvement in this area. HT LT ratio has improved
from 0.47 in 2001 to 0.50 in 2009-10.
In spite of agricultural consumption increasing over the last few years, losses have fallen
indicating that the changes in reported agricultural consumption are not used to mask
losses.
2.3. TRENDS IN DISTRIBUTION COST
Similar, to other states in India, purchase cost forms the major cost component of
distribution in Maharashtra. The power purchase cost accounts for ~80% of the total
distribution cost and have remain constant from past seven years (refer table below).
The per unit cost break-up for different cost components for the state of Maharashtra is
provided in the table below:-
Table XVI-2: Year on Year Trend Distribution Cost Breakup – Maharashtra
Cost
Component FY 06 FY 07 FY 08 FY 09 FY 10 FY 11 FY 12
Power Purchase
Cost 2.16 2.33 2.32 2.76 2.96 3.36 3.68
O&M (R&M +
A&G + EC) 0.29 0.37 0.33 0.47 0.35 0.33 0.35
Interest 0.06 0.08 0.08 0.11 0.11 0.13 0.19
Depreciation 0.08 0.07 0.07 0.09 0.10 0.12 -0.05
Other cost 0.05 0.06 0.04 0.08 0.16 0.17 0.12
Source: PFC
The power purchase cost has increased by 21% in past two years i.e. FY 2011 and FY
2012. MSEDCL has three primary sources of firm power i.e. Maharashtra State Power
Generation Company Limited (MSPGCL), Central Generating Stations (CGS), and Ratnagiri
Gas Power Private Limited (RGPPL). Apart from this MSEDCL also have share in private
power plants viz Tata UMPP. As, major portion of power procurement (74%) is from
thermal sources, hence power purchase cost is venerable to price volatility.
However, as the power purchase cost is not in control of the utility, in that case variation in
the fuel cost (variable charge) of power purchase, MSEDCL able to pass on the
corresponding increase to the consumers through the existing FAC mechanism, subject to
the stipulated ceiling of 10% Energy Charges.
MSEDCL, has entered into Long-term power procurement from imported coal based power
plants under Case 2 and Case 1 bidding viz. Tata Mundra UMPP and Adani Mundra.
However, due to change in Indonesian coal pricing regulations, and subsequent approval of
compensatory tariff by CERC over and above the agreed tariff udder the PPA, would further
increase the power purchase cost of the MSEDCL.

AF-MERCADOS EMI
Power Sector Operations and Impact on State Finances – Volume II 237
2.4. REVENUE REALIZATION
Tariff realization from different consumer category has increased with increasing power
purchase cost due to timely and frequent tariff revisions approved by regulatory
commissions.
The table below shows the revenue realization from different consumer categories over the
years.
Table XVI-3: Historical Trend Consumer Category Wise Revenue Realization -
Maharashtra
Years FY 05 FY 06 FY 07 FY 08 FY 09 FY 10 FY 11 FY 12
Domestic 2.96 3.15 3.42 3.08 3.51 3.75 4.20 4.43
Agriculture 1.75 1.98 2.13 1.73 1.94 1.97 2.00 2.15
Commercial 4.80 4.99 5.33 5.54 7.13 7.17 7.92 8.97
Industrial
HT 3.43 3.75 4.16 4.27 4.75 5.12 5.53 6.32
Industrial
LT 3.43 3.64 - - 3.30 3.61 4.24 6.24
Source: PFC
The tariff realization from agriculture consumers in highest in the country and realization
has increased over times. The frequent tariff revisions in the state have led to increase in
revenue realization in each consumer category. The tariff revision over the years is
provided in the table below:-
Table XVI-4: Historical Trend of Tariff Revisions - Maharashtra
FY
05
FY 06 FY 07 FY
08
FY
09
FY
10
FY 11 FY
12
FY
13
Average
Tariff
Revisions
- - 8.5% 5.6% 6.8% 4.2% 1% 3% 18%
Source: Tariff Order
The commercial and industrial tariffs in MSEDCL are one of the highest in the country. Thus
MSEDCL has lot of Industrial and Commercial consumers who opt for Open Access from
power exchange.
The frequent tariff revisions and improvement in AT&C losses have led to improving
financial health of the state.

AF-MERCADOS EMI
Power Sector Operations and Impact on State Finances – Volume II 238
3. ASSESSMENT OF FINANCIAL PERFORMANCE OF –
DISTRIBUTION UTILITY
3.1. FINANCIAL HEALTH OF DISTRIBUTION UTILITIES
The financial losses without subsides of state distribution utility has increased every year
after FY 2008-09 till FY 2010-11. However, the Discom has consistently been in losses from
2005 to 2011; however the magnitudes of losses have not been very high. In 2007-08, the
Discom showed a small profit of Rs 116 crores.
In 2009-10, a subsidy of Rs 400 Cr was given to MSEDCL. Before 2009-10, practically no
subsidies were given by the government.
Figure XVI-6: Historical Trend Financial Losses (w/o) subsidies – Maharashtra
Source: PFC
3.2. SUBSIDY BOOKED V/S SUBSIDY RECEIVED
The subsidy burden has remained negligible from past five years i.e. from the period of FY
05 to FY 09. The large amount of subsidies was booked in FY 10 which was the election
year in the state.
Table XVI-5: Historical Trend Subsides Booked v/s Subsidies Received
Maharashtra
FY 05 FY 06 FY 07 FY 08 FY 09 FY 10 FY 11 FY 12
Subsidy
Booked
(Rs Cr)
0.68 0.33 - - - 400.00 28.00 -
Subsidy
Received
(Rs Cr)
0.68 0.33 - - - 400.00 28.00 -
Source: PFC
The trend in subsidy pay-out with respect to the subsidy booked has always been 100% in
the state. As, the tariff realization from agricultural consumers is highest among the other
agricultural dominated states in the country, hence subsidy payout is less.
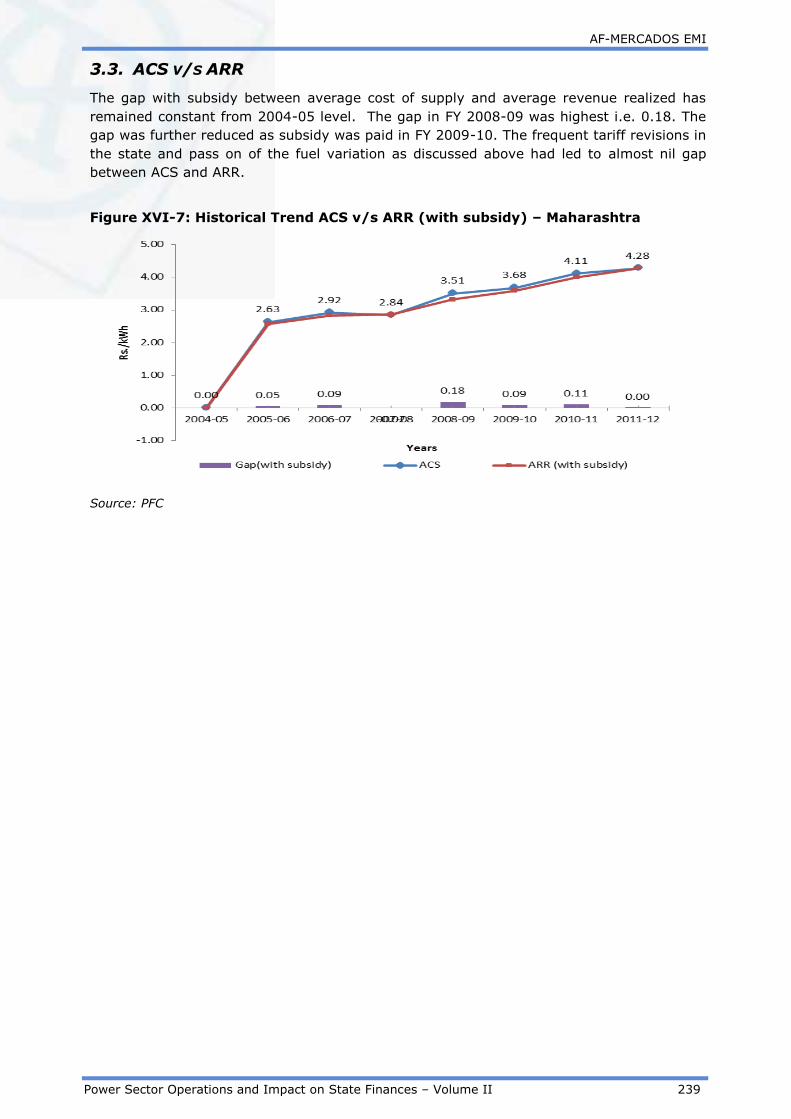
AF-MERCADOS EMI
Power Sector Operations and Impact on State Finances – Volume II 239
3.3. ACS V/S ARR
The gap with subsidy between average cost of supply and average revenue realized has
remained constant from 2004-05 level. The gap in FY 2008-09 was highest i.e. 0.18. The
gap was further reduced as subsidy was paid in FY 2009-10. The frequent tariff revisions in
the state and pass on of the fuel variation as discussed above had led to almost nil gap
between ACS and ARR.
Figure XVI-7: Historical Trend ACS v/s ARR (with subsidy) – Maharashtra
Source: PFC
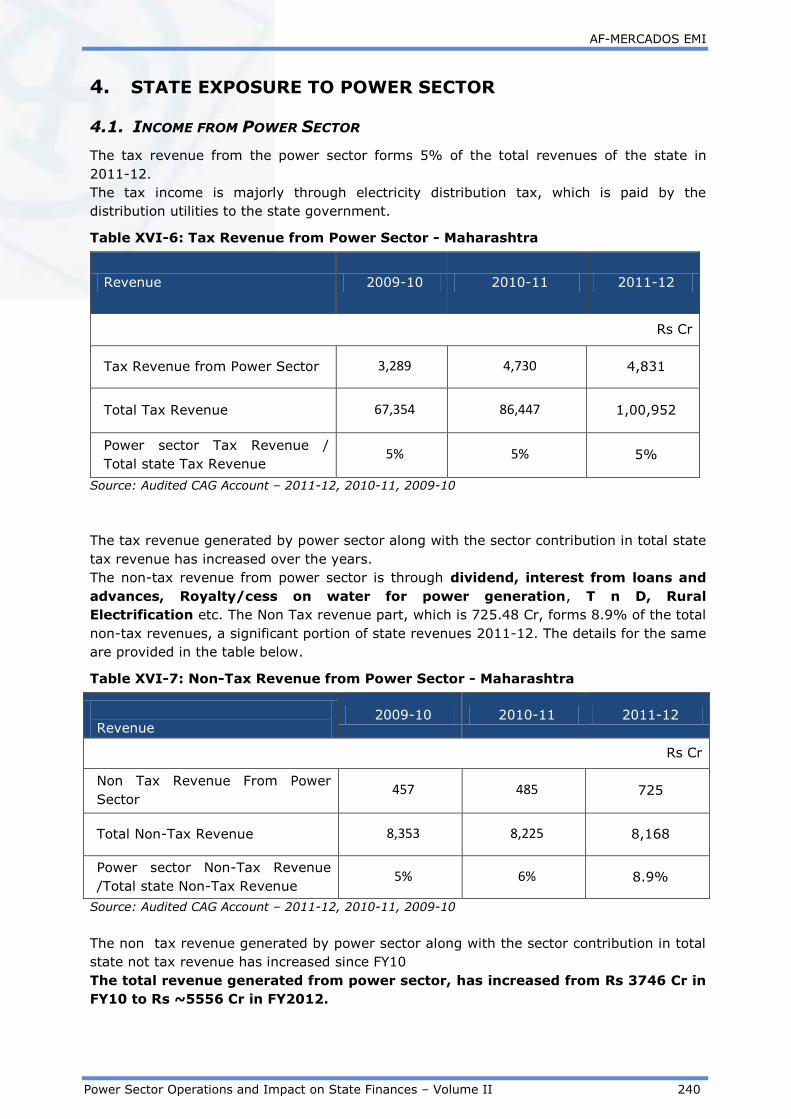
AF-MERCADOS EMI
Power Sector Operations and Impact on State Finances – Volume II 240
4. STATE EXPOSURE TO POWER SECTOR
4.1. INCOME FROM POWER SECTOR
The tax revenue from the power sector forms 5% of the total revenues of the state in
2011-12.
The tax income is majorly through electricity distribution tax, which is paid by the
distribution utilities to the state government.
Table XVI-6: Tax Revenue from Power Sector - Maharashtra
Revenue 2009-10 2010-11 2011-12
Rs Cr
Tax Revenue from Power Sector 3,289 4,730 4,831
Total Tax Revenue 67,354 86,447 1,00,952
Power sector Tax Revenue /
Total state Tax Revenue 5% 5% 5%
Source: Audited CAG Account – 2011-12, 2010-11, 2009-10
The tax revenue generated by power sector along with the sector contribution in total state
tax revenue has increased over the years.
The non-tax revenue from power sector is through dividend, interest from loans and
advances, Royalty/cess on water for power generation, T n D, Rural
Electrification etc. The Non Tax revenue part, which is 725.48 Cr, forms 8.9% of the total
non-tax revenues, a significant portion of state revenues 2011-12. The details for the same
are provided in the table below.
Table XVI-7: Non-Tax Revenue from Power Sector - Maharashtra
Revenue 2009-10 2010-11 2011-12
Rs Cr
Non Tax Revenue From Power
Sector 457 485 725
Total Non-Tax Revenue 8,353 8,225 8,168
Power sector Non-Tax Revenue
/Total state Non-Tax Revenue 5% 6% 8.9%
Source: Audited CAG Account – 2011-12, 2010-11, 2009-10
The non tax revenue generated by power sector along with the sector contribution in total
state not tax revenue has increased since FY10
The total revenue generated from power sector, has increased from Rs 3746 Cr in
FY10 to Rs ~5556 Cr in FY2012.
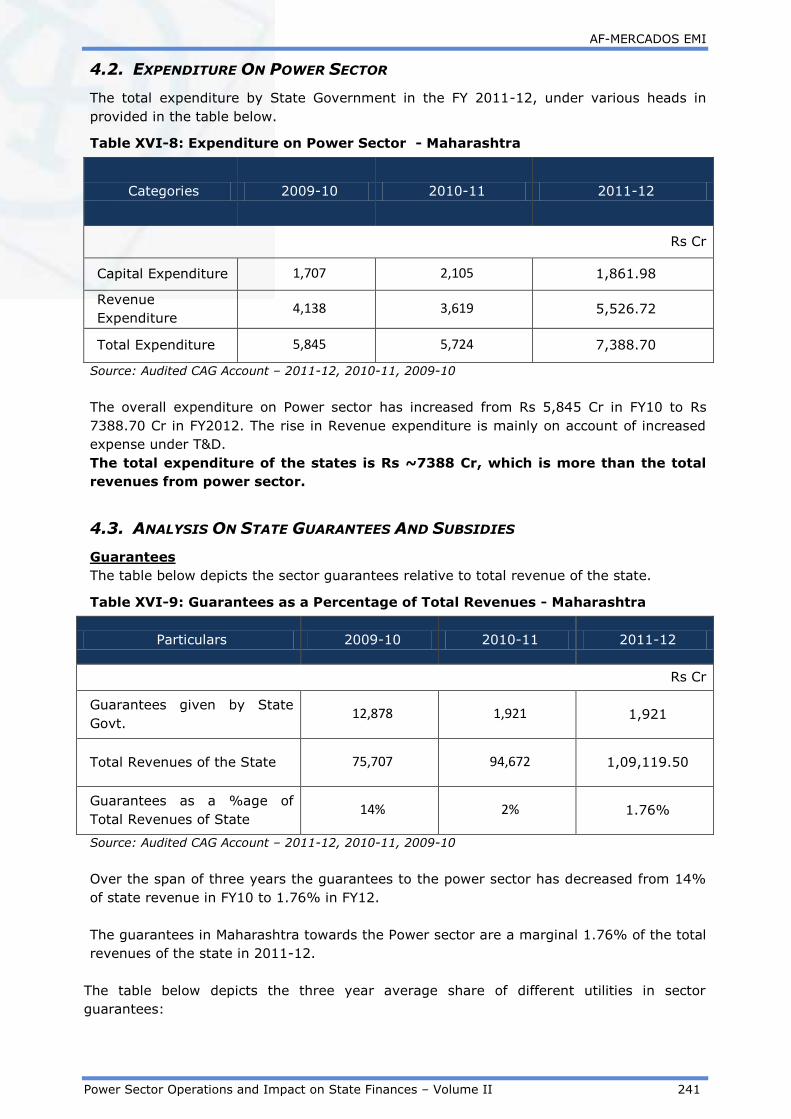
AF-MERCADOS EMI
Power Sector Operations and Impact on State Finances – Volume II 241
4.2. EXPENDITURE ON POWER SECTOR
The total expenditure by State Government in the FY 2011-12, under various heads in
provided in the table below.
Table XVI-8: Expenditure on Power Sector - Maharashtra
Categories 2009-10 2010-11 2011-12
Rs Cr
Capital Expenditure 1,707 2,105 1,861.98
Revenue
Expenditure 4,138 3,619 5,526.72
Total Expenditure 5,845 5,724 7,388.70
Source: Audited CAG Account – 2011-12, 2010-11, 2009-10
The overall expenditure on Power sector has increased from Rs 5,845 Cr in FY10 to Rs
7388.70 Cr in FY2012. The rise in Revenue expenditure is mainly on account of increased
expense under T&D.
The total expenditure of the states is Rs ~7388 Cr, which is more than the total
revenues from power sector.
4.3. ANALYSIS ON STATE GUARANTEES AND SUBSIDIES
Guarantees
The table below depicts the sector guarantees relative to total revenue of the state.
Table XVI-9: Guarantees as a Percentage of Total Revenues - Maharashtra
Particulars 2009-10 2010-11 2011-12
Rs Cr
Guarantees given by State
Govt. 12,878 1,921 1,921
Total Revenues of the State 75,707 94,672 1,09,119.50
Guarantees as a %age of
Total Revenues of State 14% 2% 1.76%
Source: Audited CAG Account – 2011-12, 2010-11, 2009-10
Over the span of three years the guarantees to the power sector has decreased from 14%
of state revenue in FY10 to 1.76% in FY12.
The guarantees in Maharashtra towards the Power sector are a marginal 1.76% of the total
revenues of the state in 2011-12.
The table below depicts the three year average share of different utilities in sector
guarantees:

AF-MERCADOS EMI
Power Sector Operations and Impact on State Finances – Volume II 242
Table XVI-10: Utility wise Breakup of Guarantees - Maharashtra
Utilities 2009-10 2010-11 2011-12
Average
Share in
Sector
Guarantees
%
Rs Cr
Maharashtra State Electricity
Transmission Co. Ltd. 11,255 423 423
44%
Maharashtra State Power
Generation Co. Ltd. 873 678 678
26%
Maharashtra State Electricity
Distribution Co. Ltd. 0 609 609
21%
Ratnagiri Gas and Power
Private Ltd. 750 210 210
9%
Source: Audited CAG Account – 2011-12, 2010-11, 2009-10
The Guarantees to the power sector has primarily declined due to decrease in Guarantees
towards the transmission sector.
Over the span of three years, Transmission sector accounted for a share of 44% in the
Power Sector Guarantees.
In 2011-12, the share of Generation sector was highest in the Guarantee for the Power
sector followed by distribution utilities.
Subsidy
The table below depicts the average share of utilities in subsidies given to Power sector and
the average share of sector in total state subsidy over three years:

AF-MERCADOS EMI
Power Sector Operations and Impact on State Finances – Volume II 243
Table XVI-11: Power Sector Subsidy as a Percentage of overall subsidy -
Maharashtra
Particulars 2009-10 2010-11 2011-12
Average
Share in
Sector
Subsidy
(%)
Rs Cr
Transmission and
Distribution- 3,354 3,131 5,162.98 99.99%
Maharashtra Energy Development Agency
1 0 0 0.01%
Power Sector subsidy (%
of total subsidy) 3,356 3,131 5,162.98 50.45%
Source: Audited CAG Account – 2011-12, 2010-11, 2009-10
Over the span of three years, the subsidies to T&D have risen, accounting for 99% of total
subsidy given to the power sector by the state government. The sector accounts for a
significant share in total state subsidy i.e. ~ 51% over the years.
In 2011-12, the entire subsidy payments for Power sector went to Transmission and
Distribution. The subsidy for Power sector accounted for a significant proportion of the total
Subsidy payment made by State Government. However, as per the PFC reported data the
subsidy payout in 2011-12 is nil.
4.4. POWER BONDS
As per RBI ‘State Finance Report’ 2014, the outstanding liability of Power Bonds in the
state as on 31st March 2014 was Rs 200 Cr.
4.5. POWER SECTOR FINANCING REQUIREMENT RELATIVE TO STATE ECONOMY
In this section, the expenditure (under all possible heads) on the power sector by the state
government has been listed to determine the state Power sector financing requirement
which is then compared to state finances.
The sector financing requirement is estimated as the summation of total expenditure of the
state government on the sector including Capital and Revenue Expenditure, Loans and
Advances (Net Of Recoveries) and Public Debt repaid (Net of Receipts) by the State
Government.
Table XVI-12: Power Sector Financing Requirement (2011-12) - Maharashtra
Particulars
2011-12
Rs Cr
Power Sector Expenditure (Capital and Revenue) 7388.70

AF-MERCADOS EMI
Power Sector Operations and Impact on State Finances – Volume II 244
Particulars
2011-12
Rs Cr
Loans And Advances made by the State Government (Net of
Recoveries) 4.42
8.5% Tax Free Special Bonds of the State Government (Power
Bonds) disbursed during the year (Net of Receipts) 0
Loans for Power Projects-T&D from the Central Govt. Discharged
during the year (Net of Receipts) 0
Total Power Sector Financing during the year 7393.13
Sector Financing Requirement as a % age of total revenues of state 7%
GSDP nominal 805031.00
Sector Financing Requirement as a % age of GSDP 0.92%
Financial Profit/Loss of Discoms during the year (with subsidy
realized) (808.00)
Sector Financing Requirement (including financial losses of Discoms
) as a % age of total revenues of state 8%
Sector Financing Requirement (including financial losses of Discoms
) as a % age of GSDP 1.02%
Source: State Government annual accounts from CAG, Data book for DCH - 22nd April, 2013, PFC
Report on Utility finances – 2011-12
The financing requirement for the Power sector in the state was estimated to be 7% of the
revenue generated by the state and 0.92 % of the Gross State Domestic Product.
Considering, the financial losses of Discoms in the year, the financing requirement of the
sector increases to 8% of the State revenue and 1.02 % of the GSDP.

AF-MERCADOS EMI
Power Sector Operations and Impact on State Finances – Volume II 245
5. ASSESMENT OF REGULATORY EFFECTIVENESS
5.1. FINANCIAL INDEPENDENCE OF SERC
The primary source of income for the SERC’s include grant from the state government and
their own revenue generated through fees for annual license, fees for fling application etc.
If the SERC’s are significantly dependent on state grants for their operations vis-a-vis their
ability to generate revenue implies that they are financially dependent on the state
government, hence might not be able to undertake independent decisions, and may get be
influenced by the decisions of the State Government.
It has been observed that many of the SERC’s are dependent on the state government
grants for meeting their expenditures, However, Maharashtra State Electricity Regulatory
Commission, is among the states which is not dependent on the Government grants.
The table below highlights the State Government funding as a percentage of income of
SERC.
Table XVI-13: State Government Funding as a percentage of income of SERC-
Maharashtra compared with other major states
S. No. States State Government funding as a
percentage of income of SERC’s
1 Haryana 100%
2 Meghalaya 80%
3 Karnataka 72%
4 Manipur and Mizoram 71%
5 Jharkhand 58%
6 Goa and union territories 52%
7 Tripura 42%
8 Andhra Pradesh 34%
9 Himachal Pradesh 23%
10 Uttar Pradesh 5%
11 West Bengal 0%
12 Odisha 0%
13 Maharashtra 0%
5.2. STATUS OF IMPORTANT REGULATIONS :
Table XVI-14: Status of Key Regulations – Maharashtra
Regulatory Measure Progress
Multi Year Tariff
On 4 February, 2011, the Commission notified the Maharashtra Electricity
Regulatory Commission (Multi Year Tariff) Regulations, 2011 (hereinafter
referred to as the “MYT Regulations, 2011”). These Regulations were to be
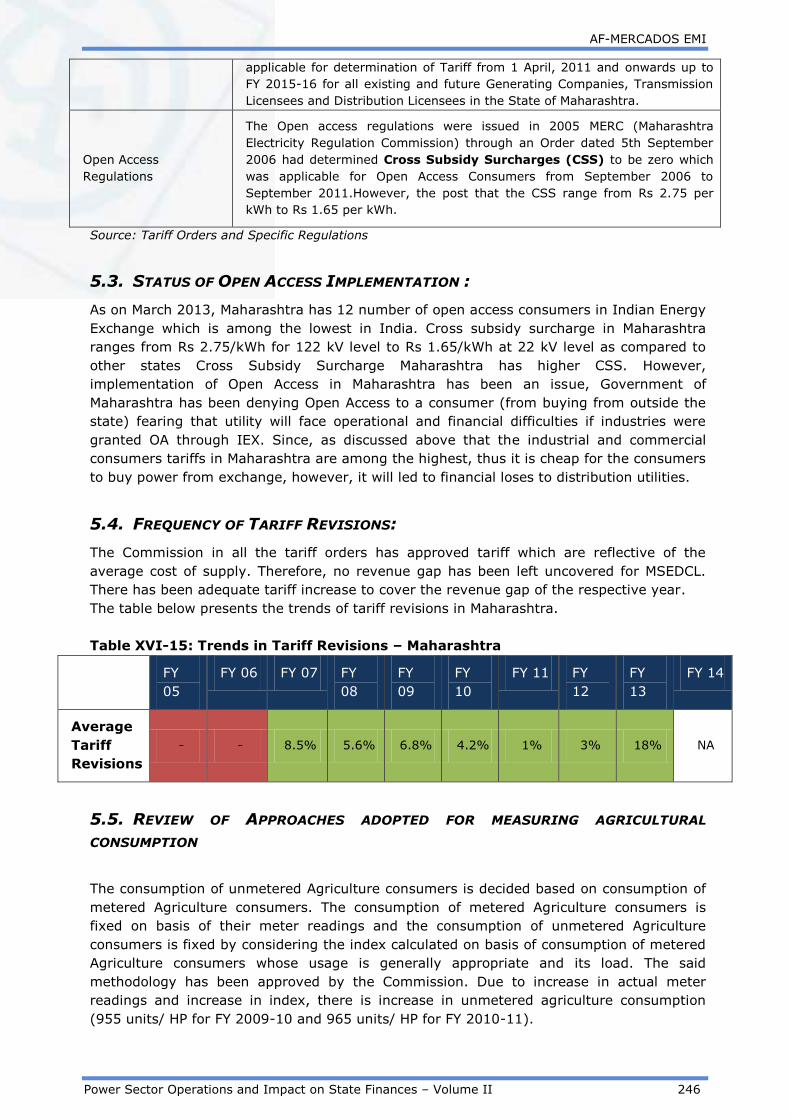
AF-MERCADOS EMI
Power Sector Operations and Impact on State Finances – Volume II 246
applicable for determination of Tariff from 1 April, 2011 and onwards up to
FY 2015-16 for all existing and future Generating Companies, Transmission
Licensees and Distribution Licensees in the State of Maharashtra.
Open Access
Regulations
The Open access regulations were issued in 2005 MERC (Maharashtra
Electricity Regulation Commission) through an Order dated 5th September
2006 had determined Cross Subsidy Surcharges (CSS) to be zero which
was applicable for Open Access Consumers from September 2006 to
September 2011.However, the post that the CSS range from Rs 2.75 per
kWh to Rs 1.65 per kWh.
Source: Tariff Orders and Specific Regulations
5.3. STATUS OF OPEN ACCESS IMPLEMENTATION :
As on March 2013, Maharashtra has 12 number of open access consumers in Indian Energy
Exchange which is among the lowest in India. Cross subsidy surcharge in Maharashtra
ranges from Rs 2.75/kWh for 122 kV level to Rs 1.65/kWh at 22 kV level as compared to
other states Cross Subsidy Surcharge Maharashtra has higher CSS. However,
implementation of Open Access in Maharashtra has been an issue, Government of
Maharashtra has been denying Open Access to a consumer (from buying from outside the
state) fearing that utility will face operational and financial difficulties if industries were
granted OA through IEX. Since, as discussed above that the industrial and commercial
consumers tariffs in Maharashtra are among the highest, thus it is cheap for the consumers
to buy power from exchange, however, it will led to financial loses to distribution utilities.
5.4. FREQUENCY OF TARIFF REVISIONS:
The Commission in all the tariff orders has approved tariff which are reflective of the
average cost of supply. Therefore, no revenue gap has been left uncovered for MSEDCL.
There has been adequate tariff increase to cover the revenue gap of the respective year.
The table below presents the trends of tariff revisions in Maharashtra.
Table XVI-15: Trends in Tariff Revisions – Maharashtra
FY
05
FY 06 FY 07 FY
08
FY
09
FY
10
FY 11 FY
12
FY
13
FY 14
Average
Tariff
Revisions
- - 8.5% 5.6% 6.8% 4.2% 1% 3% 18% NA
5.5. REVIEW OF APPROACHES ADOPTED FOR MEASURING AGRICULTURAL
CONSUMPTION
The consumption of unmetered Agriculture consumers is decided based on consumption of
metered Agriculture consumers. The consumption of metered Agriculture consumers is
fixed on basis of their meter readings and the consumption of unmetered Agriculture
consumers is fixed by considering the index calculated on basis of consumption of metered
Agriculture consumers whose usage is generally appropriate and its load. The said
methodology has been approved by the Commission. Due to increase in actual meter
readings and increase in index, there is increase in unmetered agriculture consumption
(955 units/ HP for FY 2009-10 and 965 units/ HP for FY 2010-11).

AF-MERCADOS EMI
Power Sector Operations and Impact on State Finances – Volume II 247
For approval of sales to unmetered category, the Commission has considered the recorded
consumption of metered consumers based on which a zone-wise consumption norm in
hrs/hp/annum has been computed. This zone-wise consumption norm has been applied for
projecting unmetered agricultural consumption.

AF-MERCADOS EMI
Power Sector Operations and Impact on State Finances – Volume II 248
6. SUMMARY
The energy and peak deficits in Maharashtra have remained high over the years. However,
in recent past due to huge generation capacity addition coupled with low demand has led
to a good power supply position in the state. The distribution utilities given the expansion
of agricultural sales the losses are still at high levels. The state electricity regulator has
been proactive in the state by frequently revising the tariff to cover the revenue gaps.
Hence, the state has low subsidy burden and have minimal gap between ARR and ACS. As
the losses in the state will improve, the gap will further reduce over time.
The major parameters of the state’s performance are provided below :-
1. Tariff Hikes: MERC has remained proactive in tariff revisions. The frequent tariff
revisions in the state, have kept the ARR and ACS almost nil over the years.
2. Subsidy: The distribution utilities in Maharashtra do not have a history of receiving
government support in terms of subsides payout. However, trend of subsidy payment in
Maharashtra is nil except the major subsidy of 400 cr was paid in the election year.
3. Operational Efficiency: The cost of supply of Discoms has been increasing over the
years especially due to the increase in power purchase costs; however, the tariff hikes and
utilities interventions to reduce losses have kept the operations at satisfactory levels. The
AT&C losses in the state are improving, however still are at a higher level. This is due to
increasing rural electrification and large LT lines in the states.
4. Distribution Franchisee Model : The distribution franchisee model in Bhiwandi,
has proved to be successful, other states in India have also tried to replicate the model.
5. States Guarantees: The state guarantees in the power sector accounts for ~1.76%
of Total Revenues of the state.
6. Revenues from the sector to the state: Total Revenue (Rs. ~5556 Crores) from
the Power sector is less than the total expenditure on the sector (Rs. ~7388 Crores) The
expenditure in the sector have increased due to improving infrastructure in transmission
capacity.
7. Regulatory Effectiveness: The regulator in Maharashtra has been proactive in
approving tariff revisions and notification of second generation reforms. However,
implementation has been a issues, especially implementation of Open Access in the state.
On the whole, the state finances face a low risk on account of power sector,
however, un- metering remains the concern for the state.

AF-MERCADOS EMI
Power Sector Operations and Impact on State Finances – Volume II 249
XVII MANIPUR
1. INTRODUCTION
1.1. BACKGROUND – POWER SECTOR OVERVIEW
The Central Government constituted a Joint Electricity Regulatory Commission on 18th
January 2005 for the states of Manipur and Mizoram to bring in efficiency in tariff
determination and functioning of the power department of the respective states. Power
generation, transmission and distribution in Manipur is taken care by the Electricity
Department of the State Government. Under the Power Sector Reform Program, the state is
working towards unbundling of its Electricity Department. In the latest tariff order, it is
reported that from 1st February 2014 onwards, Manipur State Power Distribution Company
Limited (MSPDCL) and Manipur State Power Company Limited (MSPCL) would run and
manage the power sector in the state. Their effectiveness and efficiency post establishment
would be seen in the days to come.
1.2. GENERATION MIX
The total installed capacity as on February 2014 (including allocated share in Joint &
Central Sector plants) for Manipur was 178.8 MW. It has grown by 13% from Feb 2013
level of 157.8 MW . Out of the total capacity as on Feb 2014, Hydro power capacity
accounted for a share of ~45% followed by Gas (~26% ) and Diesel based generation
(~25%). RE based capacity accounted for a share of ~3%.
Figure below highlights the generation capacity including allocated share in Joint & Central
sector plants.
Figure XVII-1: Generation Capacity Mix as on Feb 2014 - Manipur
Source: CEA
1.3. POWER SUPPLY POSITION
Manipur Power Department has very less generation capacity as compared to the
requirement of the state. Moreover, the domestic plants run at a very low plant load factor.
As a result, the state largely depends on power allocations from Central Generating
Stations (CGS) for meeting its energy requirements. The power supply position in the state

AF-MERCADOS EMI
Power Sector Operations and Impact on State Finances – Volume II 250
is scant with power supply being poor and irregular. The state witnesses frequent load
shedding and power cuts. Energy deficit in the state was 5% in 2013-14, while the peak
deficit was 1%. The energy and peak deficit have been highest during 2008-09 and 2009-
10, because of increasing cost of procuring power and no increase in tariff, leading to
power cuts or otherwise sale of power to other states under UI.
The trend of energy and peak deficit observed in Manipur over the years is highlighted in
the figure below:
Figure XVII-2: Energy Deficit - Manipur
Source: CEA
Figure XVII-3: Peak Deficit - Manipur
Source: CEA

AF-MERCADOS EMI
Power Sector Operations and Impact on State Finances – Volume II 251
2. ASSESSMENT OF OPERATIONAL PERFORMANCE OF
DISTRIBUTION UTILITIES
2.1. CONSUMER SALES MIX OF MANIPUR
The electricity department of the state government is responsible for power distribution
across all consumer categories in the state.
In FY 2011-12, domestic sector dominated the sales mix with a share of 41%, followed by
commercial categry (6%). The share of domestic category has increased from 36% in
2004-05 to 41% in 2011-12 and commercial sales have increased from 4% in 2004-05 to
6.3% in 2011-12. Inter state sales of 24.24% in FY 2011-12 is accounted under others in
Figure XVII-5 below.
The historical trend of consumer sales mix for the state is given in figure below:-
Figure XVII-4: Historical Trend in Consumer Sales Mix - Manipur
Source: PFC
The overall sales have registered a CAGR of 7% over the span of seven years wherein the
sales of commercial category have registered a higher CAGR of 13% followed by the
domestic category with a CAGR of 7%.
In terms of revenue contribution, domestic category contributed more than 35% of
revenue, followed by commercial category with a share of 7% (Refer Figure I-5 below).
The figure below compares the sales mix of FY 2011-12 and the revenue realized from the
different category of consumers.

AF-MERCADOS EMI
Power Sector Operations and Impact on State Finances – Volume II 252
Figure XVII-5: Comparative Analysis of Consumer Sales and Revenue Mix 2011-
12 - Manipur
Source: PFC
2.2. TRENDS IN COMMERCIAL & TECHNICAL LOSSES
The Aggregated Technical & Commercial (AT&C) loss for Manipur State Electricity
Department has been historically high because of the large share of domestic category
consumers in the overall sales mix, requiring low tension and wide spread lines for
household consumption.
Moreover, there has been lack of proper metering of consumers which further increases the
losses and brings down the collection efficiency.
Refer to the table below for the trend observed over the years in collection efficiency and
AT&C losses
Table XVII-1: Year on Year Trend in AT&C losses and Collection Efficiency -
Manipur
Year FY
05 FY 06 FY 07 FY 08 FY 09 FY 10 FY 11 FY 12
AT&C Losses
(%) 89% - - - 81.3% 47.6% 40.2% 44.8%
Collection
Efficiency 23% - - - 43% 107% 113% 86%
Source: PFC
However, there have been efforts to upgrade the year old aging components with efficient
ones under schemes like R-APDRP. As a result, the state has witnessed an increasing
collection efficiency and reduction in Transmission and Distribution losses over the past few
years.
2.3. TRENDS IN DISTRIBUTION COST
Power purchase cost accounts for majority of distribution cost. The power purchase cost
accounts for 55% of the total distribution cost (Refer table below).
The per-unit cost break-up for different cost components for the state of Manipur is
provided in the table below:-

AF-MERCADOS EMI
Power Sector Operations and Impact on State Finances – Volume II 253
Table XVII-2: Year on Year Trend Distribution Cost Breakup - Manipur
Cost Component
(Rs. per kWh) FY 05 FY 06 FY 07 FY 08 FY 09 FY 10 FY 11 FY 12
Power Purchase
Cost 1.2 2.9 4.4 2.5 3.0 2.4 2.9 4.6
O&M (R&M +
A&G + EC) 0.7 1.0 1.0 1.0 1.2 1.2 1.6 1.8
Interest 0.2 0.3 0.0 0.1 0.3 0.2 0.2 0.2
Depreciation 0.7 0.8 1.0 0.7 0.7 0.7 0.2 1.8
Other cost 0.0 0.0 0.0 0.0 0.0 0.0 0.0 0.0
Source: PFC
It can be observed that power purchase cost per unit has increased over the years. This is
because, fuel cost have been increasing over the years. Also increase in inter-state
transmission charges by the PGCIL is another reason for increase in the cost.
Power purchase cost significantly increased in FY 07 and later in FY 12 because of the
assembly elections in the state during those years. This led to procurement of costly power
from outside the state in order to avoid any power outages.
Depreciation significantly increased in FY12 because of an increase in capital expenditure of
upto 750% from the previous year. (Source: PFC)
2.4. REVENUE REALIZATION
Tariff realization from different consumer category has not increased commensurate to
increasing power purchase cost. Tariff hikes have not been reported quite often. Recently,
tariffs were increased in FY 11 and FY 13 wherein there was a hike of 10% and 7.5%
respectively.
The table below shows the revenue realization (without subsidy) from different consumer
categories over the years.
Table XVII-3: Historical Trend Consumer Category Wise Revenue Realization -
Manipur
Category FY
05
FY
06
FY
07
FY
08
FY
09
FY
10
FY
11 FY 12
Domestic 0.88 0.83 0.70 2.97 3.08 2.60 2.76 2.53
Agriculture - - - - - - - 0.00
Commercial 2.50 1.54 1.54 3.08 4.29 3.13 3.04 2.96
Industrial HT 0.00 0.00 0.00 5.00 - - 5.00 5.33
Industrial LT 1.43 1.43 0.00 2.86 2.86 2.86 2.73 1.43
Others 2.32 2.07 2.67 3.13 4.78 3.81 2.99 3.08
Source: PFC
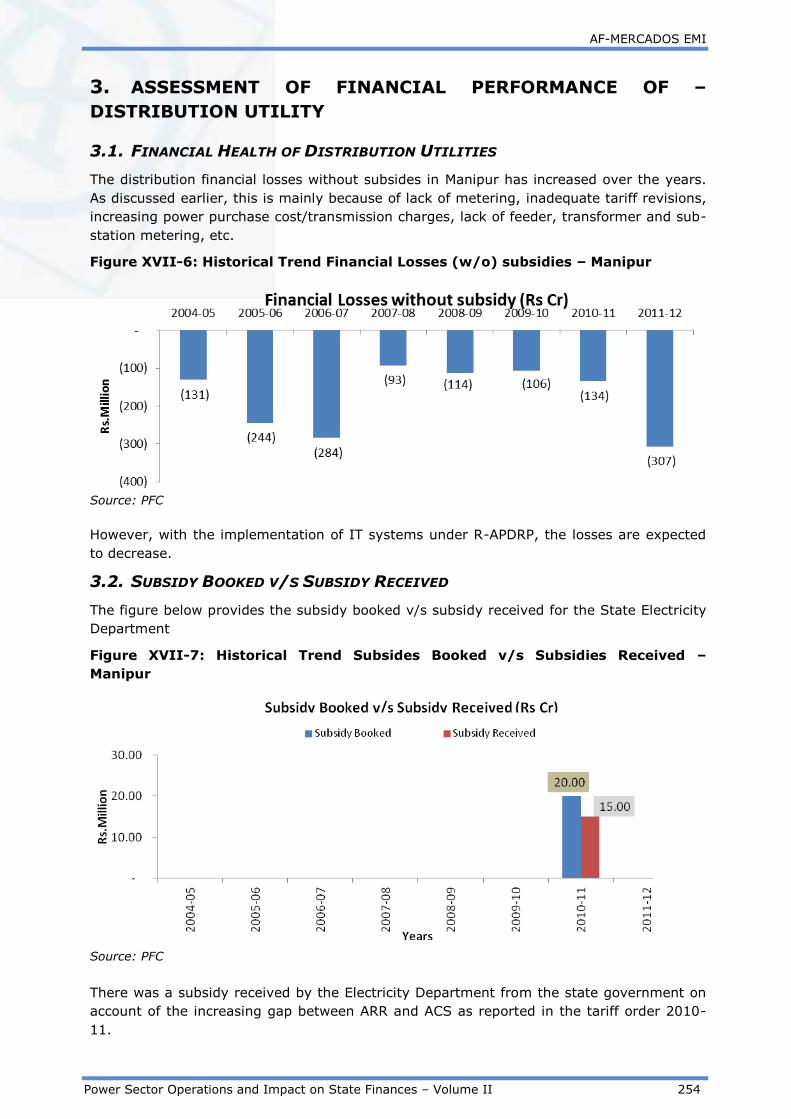
AF-MERCADOS EMI
Power Sector Operations and Impact on State Finances – Volume II 254
3. ASSESSMENT OF FINANCIAL PERFORMANCE OF –
DISTRIBUTION UTILITY
3.1. FINANCIAL HEALTH OF DISTRIBUTION UTILITIES
The distribution financial losses without subsides in Manipur has increased over the years.
As discussed earlier, this is mainly because of lack of metering, inadequate tariff revisions,
increasing power purchase cost/transmission charges, lack of feeder, transformer and sub-
station metering, etc.
Figure XVII-6: Historical Trend Financial Losses (w/o) subsidies – Manipur
Source: PFC
However, with the implementation of IT systems under R-APDRP, the losses are expected
to decrease.
3.2. SUBSIDY BOOKED V/S SUBSIDY RECEIVED
The figure below provides the subsidy booked v/s subsidy received for the State Electricity
Department
Figure XVII-7: Historical Trend Subsides Booked v/s Subsidies Received –
Manipur
Source: PFC
There was a subsidy received by the Electricity Department from the state government on
account of the increasing gap between ARR and ACS as reported in the tariff order 2010-
11.
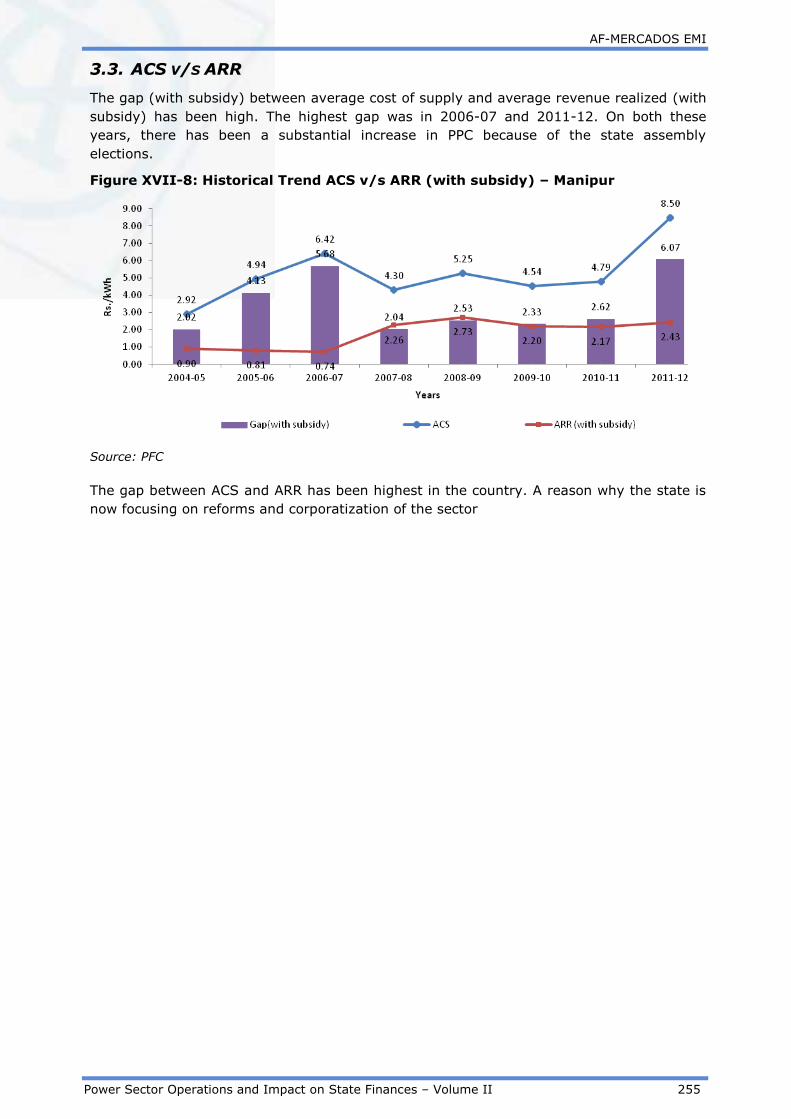
AF-MERCADOS EMI
Power Sector Operations and Impact on State Finances – Volume II 255
3.3. ACS V/S ARR
The gap (with subsidy) between average cost of supply and average revenue realized (with
subsidy) has been high. The highest gap was in 2006-07 and 2011-12. On both these
years, there has been a substantial increase in PPC because of the state assembly
elections.
Figure XVII-8: Historical Trend ACS v/s ARR (with subsidy) – Manipur
Source: PFC
The gap between ACS and ARR has been highest in the country. A reason why the state is
now focusing on reforms and corporatization of the sector

AF-MERCADOS EMI
Power Sector Operations and Impact on State Finances – Volume II 256
4. STATE INCOME AND EXPENDITURE ON POWER SECTOR
3.4. INCOME FROM POWER SECTOR
The tax revenue from the power sector forms a negligible portion of the total tax revenue.
The tax income is majorly through electricity distribution tax, which is paid by the
distribution utilities to the state government. The details for the same are provided in the
table below.
Table XVII-4: Tax Revenue from Power Sector - Manipur
Revenue 2009-10 2010-11 2011-12
Rs Cr
Tax Revenue from Power Sector 0 0 0.34
Total Tax Revenue 794 1,258 1,522
Power sector Tax Revenue /
Total state Tax Revenue 0% 0% 0.0%
Source: C&AG Audited Accounts for the state – 2011-12, 2010-11, 2009-10
The non-tax revenue from power sector is through dividends, interest on loans and
advances, royalty/cess on water for power generation, rural electrification, T & D
etc. The details for the same are provided in the table below.
Table XVII-5: Non-Tax Revenue from Power Sector - Manipur
Revenue 2009-10 2010-11 2011-12
Rs Cr
Non Tax Revenue From Power
Sector 104 88 107
Total Non-Tax Revenue 240 260 312
Power sector Non-Tax Revenue
/Total state Non-Tax Revenue 43% 34% 34.2%
Source: C&AG Audited Accounts for the state – 2011-12
The non tax revenue from Power sector has increased marginally from FY10 level.
However, the contribution of sector in the total state non tax revenue decreased from 43%
in FY10 to ~34 % in FY12.
The major portion of Non Tax revenue appears as general receipts in the CAG accounts
2011-12. The overall income generated from the power sector is to the tune of ~Rs 107
Cr.
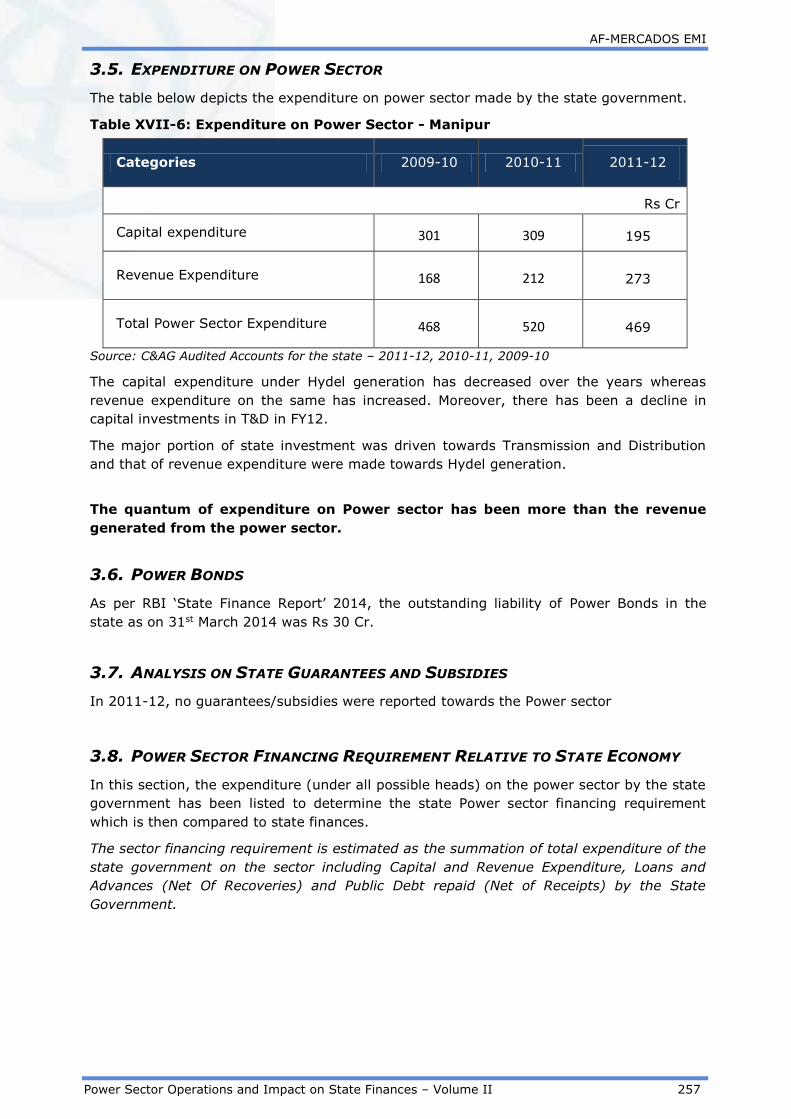
AF-MERCADOS EMI
Power Sector Operations and Impact on State Finances – Volume II 257
3.5. EXPENDITURE ON POWER SECTOR
The table below depicts the expenditure on power sector made by the state government.
Table XVII-6: Expenditure on Power Sector - Manipur
Categories 2009-10 2010-11 2011-12
Rs Cr
Capital expenditure 301 309 195
Revenue Expenditure 168 212 273
Total Power Sector Expenditure 468 520 469
Source: C&AG Audited Accounts for the state – 2011-12, 2010-11, 2009-10
The capital expenditure under Hydel generation has decreased over the years whereas
revenue expenditure on the same has increased. Moreover, there has been a decline in
capital investments in T&D in FY12.
The major portion of state investment was driven towards Transmission and Distribution
and that of revenue expenditure were made towards Hydel generation.
The quantum of expenditure on Power sector has been more than the revenue
generated from the power sector.
3.6. POWER BONDS
As per RBI ‘State Finance Report’ 2014, the outstanding liability of Power Bonds in the
state as on 31st March 2014 was Rs 30 Cr.
3.7. ANALYSIS ON STATE GUARANTEES AND SUBSIDIES
In 2011-12, no guarantees/subsidies were reported towards the Power sector
3.8. POWER SECTOR FINANCING REQUIREMENT RELATIVE TO STATE ECONOMY
In this section, the expenditure (under all possible heads) on the power sector by the state
government has been listed to determine the state Power sector financing requirement
which is then compared to state finances.
The sector financing requirement is estimated as the summation of total expenditure of the
state government on the sector including Capital and Revenue Expenditure, Loans and
Advances (Net Of Recoveries) and Public Debt repaid (Net of Receipts) by the State
Government.

AF-MERCADOS EMI
Power Sector Operations and Impact on State Finances – Volume II 258
Table XVII-7: Financing Requirement of Power Sector (2011-12) - Manipur
Particulars 2011-12
Rs. Cr.
Power Sector Expenditure (Capital and Revenue) 469
Loans And Advances made by the State Government (Net of
Recoveries) 0
8.5% Tax Free Special Bonds of the State Government (Power
Bonds) disbursed during the year (Net of Receipts) 361
Loans for Power Projects-T&D from the Central Govt.
Discharged during the year (Net of Receipts) 0.14
Total Power Sector Financing during the year 830
Sector Financing Requirement as a % age of total revenues of
state 45%
GSDP nominal 7535
Sector Financing Requirement as a % age of GSDP 11.01%
Financial Profits/(Losses) of DISCOMs during the year (with
subsidy realised) (307)
Sector Financing Requirement as a % age of total revenues of
state including financial losses of Discoms 62%
Sector Financing Requirement as a % age of GSDP including
financial losses 15.08%
Source: State Government annual accounts from CAG, Data book for DCH - 22nd April, 2013, PFC
Report on Utility finances – 2011-12
The financing requirement for the Power sector in the state was estimated to be 40% of
the revenue generated by the state and 10.08 % of the Gross State Domestic Product.
Considering, the financial losses of Discoms in the year, the financing requirement of the
sector increases to 70 % of the State revenue and 17.53 % of the GSDP.
The major portion of state investments made towards power sector went to T n D. The
major portion of Revenue expenditure on power sector went towards Hydel generation.
Even though, the source of Non-Tax revenue is rural electrification, the state expenditure
on the segment is a marginal portion.
The substantial Discom losses have increased the burden of the sector on state finances.
Hence, there is a need for further investments to build and strengthen the infrastructure.

AF-MERCADOS EMI
Power Sector Operations and Impact on State Finances – Volume II 259
4. ASSESSMENT OF REGULATORY EFFECTIVENESS
The Central Government constituted a Joint Electricity Regulatory Commission (JERC) for
the states of Mizoram and Manipur on 18th January, 2005 and it started its operations from
24th January, 2008. The first tariff order was issued by the commission on 15th March 2011
for FY 2011-12. The commission has been working towards improving the power sector
scenario in the state with active reforms. The recent notifications include MYT regulations,
2014 and standard of performance for Distribution and Transmission Licensees regulations,
2014
The key aspects of regulatory effectiveness have been discussed below -
4.1. STATUS OF MYT REGULATIONS
The Commission has notified MYT Regulations in FY 2013 for the first control period
covering years from FY 2014 to FY 2016. However, its implementation is not carried
forward by the commission because of lack of requisite and reliable data with the Electricity
Department of the state
4.2. FREQUENCY OF TARIFF REVISIONS
The tariff revisions in the state have not been frequent. The gap between ARR and ACS is
one of the highest in the country. The latest major tariff revision which took place was in
FY 11 and FY 13, to the tune of 10% and 7.5% respectively.

AF-MERCADOS EMI
Power Sector Operations and Impact on State Finances – Volume II 260
5. SUMMARY
With effective capacity addition and developmental programs, the energy deficits in the
state have decreased over the years. However, since most of the power generation in the
state is from hydro energy, there is irregularity in its generation because of its seasonal
nature and dependence on monsoons. Till date, the state meets most of its requirements
through firm allocations from central generating stations. Because of a large share of
domestic consumers, which is further increasing and spread across the state, the power
department is responsible to set up a vast network to meet their requirement. With this,
there is a need to improve the system efficiency and metering level.
1. Power purchase cost: Manipur largely depends on power procurement from
outside states for meeting its domestic requirements. As of now, the power purchase
cost constitutes a major portion of the overall cost and has been constantly
increasing w.r.t demand.
2. Tariff revisions: Even though there have been tariff revisions on FY 2010-11 and FY
2012-13, it hasn’t been in tune to the increasing power purchase cost leading to
increasing gap between ACS and ARR.
3. Financial Losses : The distribution financial losses without subsides in Manipur has
increased over the years form Rs 93 Cr in FY 2007-08 to Rs 307 Cr in FY 2011-12.
Major reason for such losses is the lack of proper metering, billing and IT
infrastructure
4. Regulatory reforms: The regulator for the states of Mizoram and Manipur would
need to work on managing the performance of the respective Electricity department
as per the standard of performance for Distribution and Transmission Licensees
regulations, 2014 in order to facilitate further implementation of regulations on MYT
and Open access.
5. Exposure to the State Gov. to power sector: The financing requirement for the
Power sector in the state was estimated to be 45% of the revenue generated by the
state and 11.01% of the Gross State Domestic Product. Considering, the Financial
losses of Discoms in the year 2011-12, the financing requirement of the sector
increases to 62% of the State revenue and 15.08% of the GSDP.
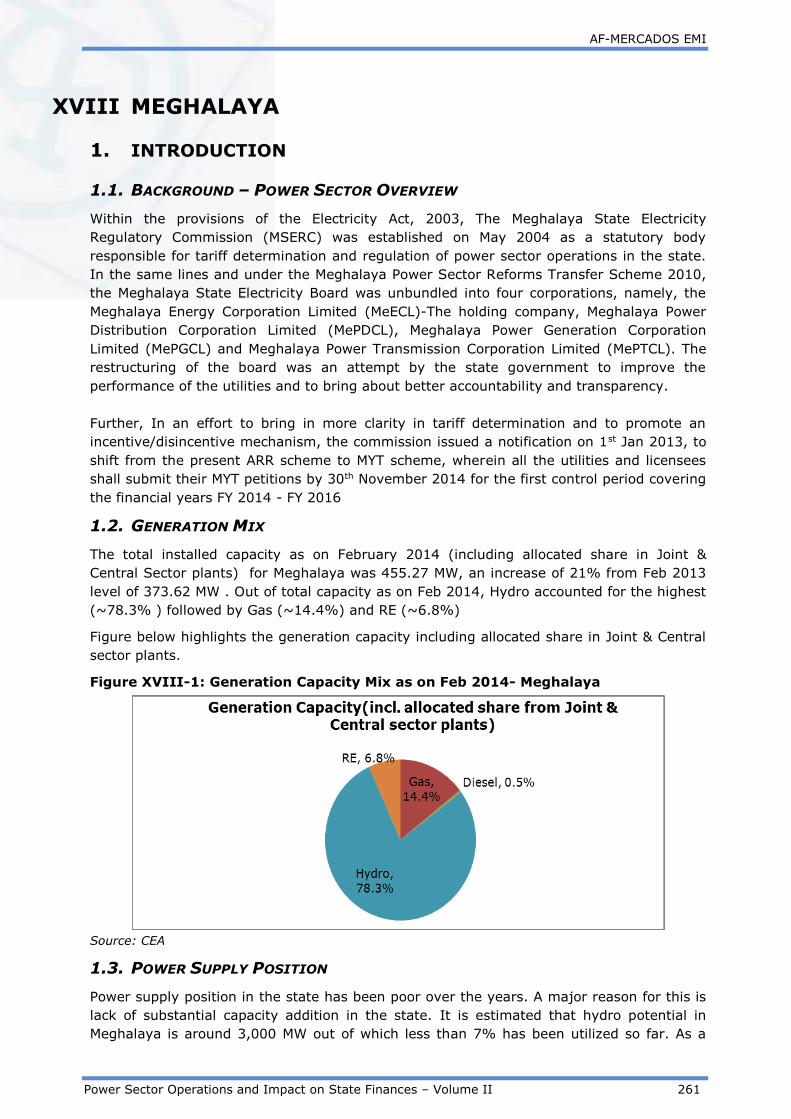
AF-MERCADOS EMI
Power Sector Operations and Impact on State Finances – Volume II 261
XVIII MEGHALAYA
1. INTRODUCTION
1.1. BACKGROUND – POWER SECTOR OVERVIEW
Within the provisions of the Electricity Act, 2003, The Meghalaya State Electricity
Regulatory Commission (MSERC) was established on May 2004 as a statutory body
responsible for tariff determination and regulation of power sector operations in the state.
In the same lines and under the Meghalaya Power Sector Reforms Transfer Scheme 2010,
the Meghalaya State Electricity Board was unbundled into four corporations, namely, the
Meghalaya Energy Corporation Limited (MeECL)-The holding company, Meghalaya Power
Distribution Corporation Limited (MePDCL), Meghalaya Power Generation Corporation
Limited (MePGCL) and Meghalaya Power Transmission Corporation Limited (MePTCL). The
restructuring of the board was an attempt by the state government to improve the
performance of the utilities and to bring about better accountability and transparency.
Further, In an effort to bring in more clarity in tariff determination and to promote an
incentive/disincentive mechanism, the commission issued a notification on 1st Jan 2013, to
shift from the present ARR scheme to MYT scheme, wherein all the utilities and licensees
shall submit their MYT petitions by 30th November 2014 for the first control period covering
the financial years FY 2014 - FY 2016
1.2. GENERATION MIX
The total installed capacity as on February 2014 (including allocated share in Joint &
Central Sector plants) for Meghalaya was 455.27 MW, an increase of 21% from Feb 2013
level of 373.62 MW . Out of total capacity as on Feb 2014, Hydro accounted for the highest
(~78.3% ) followed by Gas (~14.4%) and RE (~6.8%)
Figure below highlights the generation capacity including allocated share in Joint & Central
sector plants.
Figure XVIII-1: Generation Capacity Mix as on Feb 2014- Meghalaya
Source: CEA
1.3. POWER SUPPLY POSITION
Power supply position in the state has been poor over the years. A major reason for this is
lack of substantial capacity addition in the state. It is estimated that hydro potential in
Meghalaya is around 3,000 MW out of which less than 7% has been utilized so far. As a

AF-MERCADOS EMI
Power Sector Operations and Impact on State Finances – Volume II 262
result, the supply has remained more or less constant. The state is largely supported by
hydro power and due to decreasing rainfall, the power supply situation has further
worsened, leading to routine load shedding. The state also procures power from central
power stations to meet its growing demand. However, there has been a lack of proper
transmission network infrastructure for wheeling and distribution of inter-state power.
The 12th Five year plan intends to bring about some improvement to the present condition
of power supply shortage in the state with few hydro projects under construction.
The trend of energy and peak deficit observed in Meghalaya over the years is highlighted in
the figure below:
Figure XVIII-2: Energy Deficit - Meghalaya
Source: CEA
Figure XVIII-3: Peak Deficit - Meghalaya
Source: CEA

AF-MERCADOS EMI
Power Sector Operations and Impact on State Finances – Volume II 263
2. ASSESSMENT OF OPERATIONAL PERFORMANCE OF
DISTRIBUTION UTILITIES
2.1. CONSUMER SALES MIX OF MEGHALAYA
After the restructuring, the power distribution function is carried out by MePDCL across
different consumer categories in the state.
In FY 2011-12, Industrial HT sector dominated the sales mix with a share of 44%, followed
by Domestic category (30%).
The share of domestic consumers has increased over the years. This is a result of
urbanization and high disposable income in the state, leading to more usage of electrical
appliances. The share of domestic sales have increased from 17% in 2004-05 to 30% in
2011-12 and the industrial-HT sales has remained between 45-50% over the years.
The historical trend of consumer sales mix for the state is given in the figure below:-
Figure XVIII-4: Historical Trend in Consumer Sales Mix - Meghalaya
Source: PFC
The overall sales have registered a CAGR of 2% over the span of seven years wherein the
sales of domestic category have registered a higher CAGR of 12% followed by the industrial
category with a CAGR of approximately 2%.
In terms of revenue contribution, industries contributed more than 49% of revenue,
followed by domestic and commercial categories with a share of 20% and 7%, respectively.
The figure below compares the sales mix of FY 2011-12 and the revenue realized from the
different category of consumers.

AF-MERCADOS EMI
Power Sector Operations and Impact on State Finances – Volume II 264
Figure XVIII-5: Comparative Analysis of Consumer Sales and Revenue Mix 2011-
12 - Meghalaya
Source: PFC
2.2. TRENDS IN COMMERCIAL & TECHNICAL LOSSES
The Aggregated Technical & Commercial (AT&C) losses for Meghalaya distribution utility
have increased over the years, except a slight decrease in FY 2012
The higher share of domestic consumers with sale of power at low and medium voltage has
led to increasing technical and commercial losses.
The loss level has decreased in FY12 due to improvements in metering of customers by
MeECL. Around 38% unmetered consumers across all categories have been reported from
the previous level of 59%. The MeECL is making an effort to achieve 100% metering by not
allowing any new connection to a consumer without meters.
Table XVIII-1: Year on Year Trend in AT&C losses and Collection Efficiency –
Meghalaya
Year FY
05 FY 06 FY 07 FY 08 FY 09 FY 10 FY 11 FY 12
AT&C Losses
(%) 38% 38% 39% 40% 43% 49% 52% 45%
Collection
Efficiency 84% 105% 99% 96% 82% 77% 75% 77%
Source: PFC
The increase in AT&C losses in FY 2009-10 and FY 2010-11 is because of part payment of
the bills by the members of the Byrnihat Industries Association (BIA), Ri Bhoi district,
which is the major industrial area in the state and accounts for high consumption.
2.3. TRENDS IN DISTRIBUTION COST
Power purchase cost accounts for majority of distribution cost. The power purchase cost
accounts for ~60% of the total distribution cost (Refer table below).
The per-unit cost break-up for different cost components for the state of Meghalaya is
provided in the table below:-
Table XVIII-2: Year on Year Trend Distribution Cost Breakup - Meghalaya

AF-MERCADOS EMI
Power Sector Operations and Impact on State Finances – Volume II 265
Cost Component
(Rs. per kWh) FY 05 FY 06 FY 07 FY 08 FY 09 FY 10 FY 11 FY 12
Power Purchase
Cost 0.95 1.50 1.90 1.43 1.48 1.66 2.03 2.91
O&M (R&M +
A&G + EC) 0.59 0.76 0.80 0.85 0.95 1.08 1.07 1.21
Interest 0.24 0.35 0.42 0.54 0.64 0.77 0.42 0.50
Depreciation 0.09 0.10 0.10 0.09 0.10 0.19 0.18 0.18
Other cost (0.09) 0.34 (0.26) (0.37) (0.28) (0.44) 0.06 -
Source: PFC
It can be observed that power purchase cost per unit has increased over the years. Power
purchase cost increased most significantly in FY12 and FY 11 due to decreased power
availability from domestic hydro plants and increased purchase of power from public and
private power companies.
According to the chief minister of the state, the outstanding dues of Meghalaya towards
central and state power companies against power purchases has accumulated to a
staggering Rs. 470 crore. (Source: BS, dated 17th April 2014)
2.4. REVENUE REALIZATION
The tariff rates for different consumer category have not increased against the increasing
power purchase cost. Significant tariff hike was witnessed in the year FY06, while the
years after that haven’t seen much hike. With lack of tariff hike in the recent years
especially in FY 11 and FY 12, there has been a huge backlog and subsequently, the State
Government has requested for a whopping 90% tariff hike for the financial year 2014-15.
The MSERC has approved for a 15% increase though.
The table below shows the revenue realization (without subsidy) from different consumer
categories over the years.
Table XVIII-3: Historical Trend Consumer Category Wise Revenue Realization -
Meghalaya
Category FY
05
FY
06
FY
07
FY
08
FY
09
FY
10
FY
11 FY 12
Domestic 1.80 4.01 2.20 2.45 2.68 3.06 2.88 2.48
Agriculture - - - - - - - -
Commercial 4.00 5.00 4.25 5.38 5.45 5.96 5.32 4.61
Industrial HT 2.34 2.12 2.77 2.81 3.80 5.01 4.03 3.98
Industrial LT - - - - - - 4.29 -
Others 1.90 2.87 2.86 3.37 4.24 3.29 2.33 3.10
Source: PFC
Lack of necessary tariff hikes, lack of utilization of hydro and renewable potential,
unfavorable weather conditions and increasing outstanding payments has led to a very
poor financial position of the state power sector calling for an immediate tariff hike and
improved utilization of available resources.

AF-MERCADOS EMI
Power Sector Operations and Impact on State Finances – Volume II 266
3. ASSESSMENT OF FINANCIAL PERFORMANCE OF –
DISTRIBUTION UTILITY
3.1. FINANCIAL HEALTH OF DISTRIBUTION UTILITIES
The distribution financial losses without subsides in Meghalaya has increased over the
years. As discussed earlier, major reason for this is the increasing power purchase cost and
inadequate tariff revisions over the years.
Figure XVIII-6: Historical Trend Financial Losses (w/o) subsidies – Meghalaya
Source: PFC
The losses had decreased in FY 08 till FY 10 due to the commission’s effort of bringing in
revised tariff for different consumer category and carrying out a truing up process for the
distribution company.
3.2. SUBSIDY BOOKED V/S SUBSIDY RECEIVED
The subsidy burden of the State Government increased in the year 2006-07 and 2007-08
so as to cover the increase in cost during those years. The figure below provides the
subsidy booked v/s subsidy received for the distribution utilities in the state
Figure XVIII-7: Historical Trend Subsides Booked v/s Subsidies Received –
Meghalaya
Source: PFC

AF-MERCADOS EMI
Power Sector Operations and Impact on State Finances – Volume II 267
3.3. ACS V/S ARR
The gap (with subsidy) between average cost of supply and average revenue realized (with
subsidy) has widened in the years FY2011-FY2012 due to lack of tariff hike
Figure XVIII-8: Historical Trend ACS v/s ARR (with subsidy) – Meghalaya
Source: PFC

AF-MERCADOS EMI
Power Sector Operations and Impact on State Finances – Volume II 268
4. STATE INCOME AND EXPENDITURE ON POWER SECTOR
4.1. INCOME FROM POWER SECTOR
The tax revenue from the power sector forms less than 1% of the total tax revenue, the
tax income is majorly through electricity distribution tax, which is paid by the distribution
utilities to the state government. The details of the same are given below.
Table XVIII-4: Tax Revenue from Power Sector - Meghalaya
Revenue 2009-10 2010-11 2011-12
Rs Cr
Tax Revenue from Power Sector 0 0 0.87
Total Tax Revenue 1057 1468 1,741.7
Power sector Tax Revenue /
Total state Tax Revenue 0.00% 0.02% 0.0%
Source: C&AG Audited Accounts for the state – 2011-12, 2010-11, 2009-10
The non-tax revenue from power sector is through royalty/cess on water for power
generation. The details for the same are provided in the table below.
Table XVIII-5: Non-Tax Revenue from Power Sector - Meghalaya
Revenue 2009-10 2010-11 2011-12
Rs Cr
Non Tax Revenue From Power
Sector 0
0 -
Total Non-Tax Revenue 275 302 368.25
Power sector Non-Tax Revenue
/Total state Non-Tax Revenue 0 0%
0.0%
Source: C&AG Audited Accounts for the state – 2011-12, 2010-11, 2009-10
Thepower sector did not generate any Non-tax revenue over the years. The overall revenue
generated from power sector has increased from Rs 0.05 Cr in 2009-10 to Rs 0.87 Cr in
2011-12.
4.2. EXPENDITURE ON POWER SECTOR
The table below depicts the expenditure on power sector made by the state government.

AF-MERCADOS EMI
Power Sector Operations and Impact on State Finances – Volume II 269
Table XVIII-6: Expenditure on Power Sector - Meghalaya
Categories 2009-10 2010-11 2011-12
Rs Cr
Capital expenditure 0 0 -
Revenue Expenditure 123 114 166
Total Power Sector Expenditure 123 114 166
Source: C&AG Audited Accounts for the state – 2011-12, 2010-11, 2009-10
Over the span of three years there has been no state investment in Power sector. The
revenue expenditure incurred on power sector has increased from the FY10 level primarily
due to increase in general expenses.
In 2011-12, the expenditure on power sector far exceeded the revenues generated from
the sector.
4.3. POWER BONDS
8.5% Meghalaya Government Power Bonds was issued by State Government in 2003-04 to
be redeemed by 2016. The outstanding balance as on 1st April 2006 was Rs 13.99 Cr. The
total outstanding balance at the end of 2011-12 was Rs. 5.60 Cr. As per RBI ‘State Finance
Report’ 2014, there is no outstanding liability of Power Bonds in the state as on 31st March
2014.
4.4. ANALYSIS ON STATE GUARANTEES AND SUBSIDIES
The table below depicts the guarantees given to power sector relative to the total revenue
of the state
Table XVIII-7: Guarantees as a Percentage of Total Revenues - Meghalaya
Particulars 2009-10 2010-11 2011-12
Rs Cr
Guarantees given by State Govt. 650 1,101 1,292
Total Revenues of the State 1,332 1,769 2,110
Guarantees as a %age of Total
Revenues of State 49% 62% 61%
Source: C&AG Audited Accounts for the state – 2011-12, 2010-11, 2009-10
As shown above, the guarantees constitute a significant share of total revenues of the state
over the three years.

AF-MERCADOS EMI
Power Sector Operations and Impact on State Finances – Volume II 270
Guarantees given by the state government has increased substantially from the FY10 level
i.e. 49% of the state revenue in FY10 to 61% in FY12
Subsidy
The table below depicts the average share of utilities in subsidies given to Power sector and
the average share of sector in total state subsidy over three years:
Table XVIII-9: Subsidy - Meghalaya
Particulars
2011-12
Rs Cr
Average
Share in
Sector
Subsidy %
Rs Cr
Assistance to Electricity
Boards 18 13 13 100.00%
Power Sector subsidy (%
of total subsidy) 18 13 13 40%
Source: C&AG Audited Accounts for the state – 2011-12, 2010-11, 2009-10
The Subsidy payments to Power Sector were given as assistance to Electricity boards.
Over the span of three years, the proportion of subsidy payments made towards Power
Sector, of the total state subsidy payments accounted for a share of 40%.
4.5. POWER SECTOR FINANCING REQUIREMENT RELATIVE TO STATE ECONOMY
In this section, the expenditure (under all possible heads) on the power sector by the state
government has been listed to determine the state Power sector financing requirement
which is then compared to state finances.
The sector financing requirement is estimated as the summation of total expenditure of the
state government on the sector including Capital and Revenue Expenditure, Loans and
Advances (Net Of Recoveries) and Public Debt repaid (Net of Receipts) by the State
Government.
.

AF-MERCADOS EMI
Power Sector Operations and Impact on State Finances – Volume II 271
Table XVIII-10: Financing Requirement of Power Sector (2011-12) - Meghalaya
Particulars 2011-12
Rs. Cr.
Power Sector Expenditure (Capital and Revenue) 166
Loans And Advances made by the State Government (Net of
Recoveries) 29
8.5% Tax Free Special Bonds of the State Government (Power
Bonds) disbursed during the year (Net Of Receipts)* 1.4
Loans for Power Projects-T&D from the Central Govt.
Discharged during the year (Net Of Receipts) 0.46
Total Power Sector Financing during the year 197
Sector Financing Requirement as a % age of total revenues of
state 9%
GSDP nominal 11085
Sector Financing Requirement as a % age of GSDP 1.77%
Financial Profit /(Losses) of Discoms during the year (195)
Sector Financing Requirement as a % age of total revenues of
state including financial losses of Discoms 19%
Sector Financing Requirement as a % age of GSDP including
financial losses 3.53%
Source: State Government annual accounts from CAG, Data book for DCH - 22nd April, 2013, PFC
Report on Utility finances – 2011-12
The financing requirement for the Power sector in the state was estimated to be ~9% of
the revenue generated by the state and 1.77 % of the Gross State Domestic Product.
Considering, the financial losses of Discoms in the year, the financing requirement of the
sector increases to a significant 19% of the State revenue and 3.53% of the GSDP.
The financing requirement of the sector is significantly higher than the revenues generated
from the sector. Also considering the guarantees, the burden of state rises substantially,
whereas the sectors revenue generating capacity is minimal compared to the level of
financing requirement. This can be attributed to the negligible or no expenditure as
investments. It reflects the poor performance of power sector in the state and the high
level of burden on the state finances.
It is suggested that the State must invest in building and strengthening the infrastructure
of Power Sector to enhance the revenue generating capacity of the sector.

AF-MERCADOS EMI
Power Sector Operations and Impact on State Finances – Volume II 272
5. ASSESSMENT OF REGULATORY EFFECTIVENESS
The Government of Meghalaya constituted the Meghalaya State Electricity Regulatory
Commission (MERC) on March, 2005 and it became operational from June, 2006. MSERC
has been proactive in implementing reforms in the state with recent notifications of MYT
regulations, 2013 and Open Access Regulations, 2012.
The key aspects of regulatory effectiveness have been discussed below -
5.1. STATUS OF MYT REGULATIONS
The Commission has notified MYT Regulations in FY 2013 for the first control period
covering years from FY 2014 to FY 2016. However, its implementation is not carried
forward by the commission because of lack of requisite and reliable data with the MePDCL.
5.2. STATUS OF OPEN ACCESS IMPLEMENTATION
The Commission notified the Open Access Regulations on 27th April 2012 for consumers
requiring more than 1MW, stating guidelines on open access wheeling charges, cross
subsidy surcharge and additional surcharges. The Commission has approved the following
costs for open access consumers for FY 2014-15:
Wheeling charge of Rs.28,769/MW/Day
Cross subsidy surcharge of Rs.0.95 per unit for IEHT consumers and Rs.1.05
per unit for IHT consumers.
5.3. FREQUENCY OF TARIFF REVISIONS
The tariff revisions in the state have not been frequent. The latest major tariff revision
which took place was in FY 12, to the tune of 15%.

AF-MERCADOS EMI
Power Sector Operations and Impact on State Finances – Volume II 273
6. SUMMARY
The energy deficits in the state have increased over the years, given the low PLF’s of hydro
plants. This has further increased the power purchase cost of the state, as lower PLF’s of
state generation capacity have led to procurement of costly power from central power
stations and other short term sources. The key parameters of the states are discussed
below-
1. Unmetered sales: In the absence of proper metering and lack of efficient revenue
collection, there is uncertainty about revenue realization and AT&C losses. The state
has however made ways to improve the revenue collection through proper metering
under the RGGVY scheme in the recent years.
2. Inadequate Tariff Revisions: No tariff hikes were observed in FY 11 and FY 12
against the increasing power purchase cost. As a result, there has been a huge
outstanding due to central and other power stations.
3. Power purchase cost: Meghalaya has a substantial share of hydro power in which
majorly depends on proper weather conditions and monsoon. Weak monsoon over
the years has led to low PLF which has forced the state to procure costly medium
and short term power leading to increase in power purchase cost.
4. High Peak and Energy deficit: There has been high energy and peak deficit in the
state because of low capacity addition and infrastructure development. Moreover,
lack of tariff revisions against increasing costs has led the distribution utility to cut
power supply for hours in a day.
5. Financial Losses: The distribution financial losses without subsides in Meghalaya
has increased over the years due to inadequate tariff revisions. The loses without
subsidy have increased form Rs 68 Cr in 2005-06 to Rs 208 Cr in FY 2011-12.
6. States Guarantees: for the sector are significant and account for ~61% of Total
Revenues of the state
7. Exposure to the State Gov. to power sector: The financing requirement for the
Power sector in the state was estimated to be 9% of the revenue generated by the
state and approximately 2% of the Gross State Domestic Product. Considering the
present situation and the increasing financial losses of Discoms in the year 2011-12,
the financing requirement of the sector is expected to increase upto 19% of the
State revenue and 4%(approx) of the GSDP.
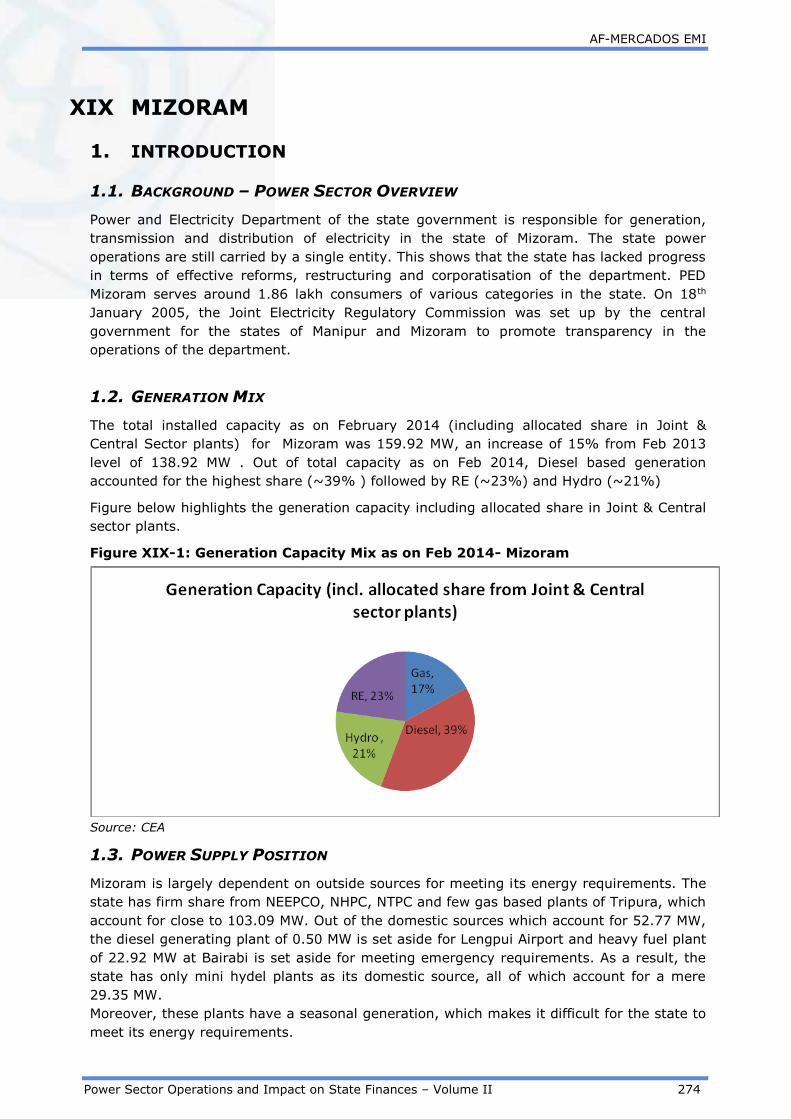
AF-MERCADOS EMI
Power Sector Operations and Impact on State Finances – Volume II 274
XIX MIZORAM
1. INTRODUCTION
1.1. BACKGROUND – POWER SECTOR OVERVIEW
Power and Electricity Department of the state government is responsible for generation,
transmission and distribution of electricity in the state of Mizoram. The state power
operations are still carried by a single entity. This shows that the state has lacked progress
in terms of effective reforms, restructuring and corporatisation of the department. PED
Mizoram serves around 1.86 lakh consumers of various categories in the state. On 18th
January 2005, the Joint Electricity Regulatory Commission was set up by the central
government for the states of Manipur and Mizoram to promote transparency in the
operations of the department.
1.2. GENERATION MIX
The total installed capacity as on February 2014 (including allocated share in Joint &
Central Sector plants) for Mizoram was 159.92 MW, an increase of 15% from Feb 2013
level of 138.92 MW . Out of total capacity as on Feb 2014, Diesel based generation
accounted for the highest share (~39% ) followed by RE (~23%) and Hydro (~21%)
Figure below highlights the generation capacity including allocated share in Joint & Central
sector plants.
Figure XIX-1: Generation Capacity Mix as on Feb 2014- Mizoram
Source: CEA
1.3. POWER SUPPLY POSITION
Mizoram is largely dependent on outside sources for meeting its energy requirements. The
state has firm share from NEEPCO, NHPC, NTPC and few gas based plants of Tripura, which
account for close to 103.09 MW. Out of the domestic sources which account for 52.77 MW,
the diesel generating plant of 0.50 MW is set aside for Lengpui Airport and heavy fuel plant
of 22.92 MW at Bairabi is set aside for meeting emergency requirements. As a result, the
state has only mini hydel plants as its domestic source, all of which account for a mere
29.35 MW.
Moreover, these plants have a seasonal generation, which makes it difficult for the state to
meet its energy requirements.

AF-MERCADOS EMI
Power Sector Operations and Impact on State Finances – Volume II 275
The Energy deficit and peak deficit have decreased in the recent years because of efforts in
generation, transmission and distribution.
Generation:
During the 11th and 12th five year plan, there has been considerable improvement in the
capacity addition program. Following are the hydro projects commissioned/under
construction during 11th and 12th five year plan:
3 MW Maicham-II SHP commissioned on 11/11/2009
12 MW Serlui ‘B’ SHP commission in the year 2010
60 MW Tuirial HEP and 210 MW Tuivai HEP expected to be completed by the end of
12th five year plan.
The total hydro potential of the state is expected to be 4500 MW, out of which less than
1% has been utilized so far. Hence, the state aims to improve its domestic generation
capacity in future.
Transmission:
The state has also improved the transmission line capacity in the state for wheeling of grid
power from outside state and further transmission of power within the state during the 11th
five year plan. At the end of the 10th plan, total 132 KV line was 419.072 KMs, which
increased to 638.37 KMs by 11th plan. The state is further working towards 400 KV line in
the 12th plan
Distribution:
There has been an effort to incorporate IT systems, metering and SCADA under R-APDRP
With these, the energy and peak deficit in the state has also reduced over the years.
The trend of energy and peak deficit observed in Mizoram over the years is highlighted in
the figure below:
Figure XIX-2: Energy Deficit - Mizoram
Source: CEA

AF-MERCADOS EMI
Power Sector Operations and Impact on State Finances – Volume II 276
Figure XIX-3: Peak Deficit - Mizoram
Source: CEA

AF-MERCADOS EMI
Power Sector Operations and Impact on State Finances – Volume II 277
2. ASSESSMENT OF OPERATIONAL PERFORMANCE OF
DISTRIBUTION UTILITIES
2.1. CONSUMER SALES MIX OF MIZORAM
Power and Electricity Department (PED) of the state government is the sole entity
responsible for power distribution across different consumer categories.
In FY 2011-12, domestic sector dominated the sales mix with a share of 54%, followed by
commercial category (6%). The share of domestic category has increased from 28% in
2004-05 to 54% in 2011-12. Inter state sales in FY 2011-12 accounted for 20.25% and is
accounted under others in Figure I-5 below.
The historical trend of consumer sales mix for the state is given in the figure below:-
Figure XIX-4: Historical Trend in Consumer Sales Mix - Mizoram
Source: PFC
The overall sales have registered a CAGR of 4% over the span of seven years wherein the
sales of commercal category have registered a higher CAGR of approximately 12% followed
by the domestic category with a CAGR of 7.45%.
In terms of revenue contribution, domestic consumers contributed 48% of revenue,
followed by commercial category with a share of 7%
The figure below compares the sales mix of FY 2011-12 and the revenue realized from the
different category of consumers.
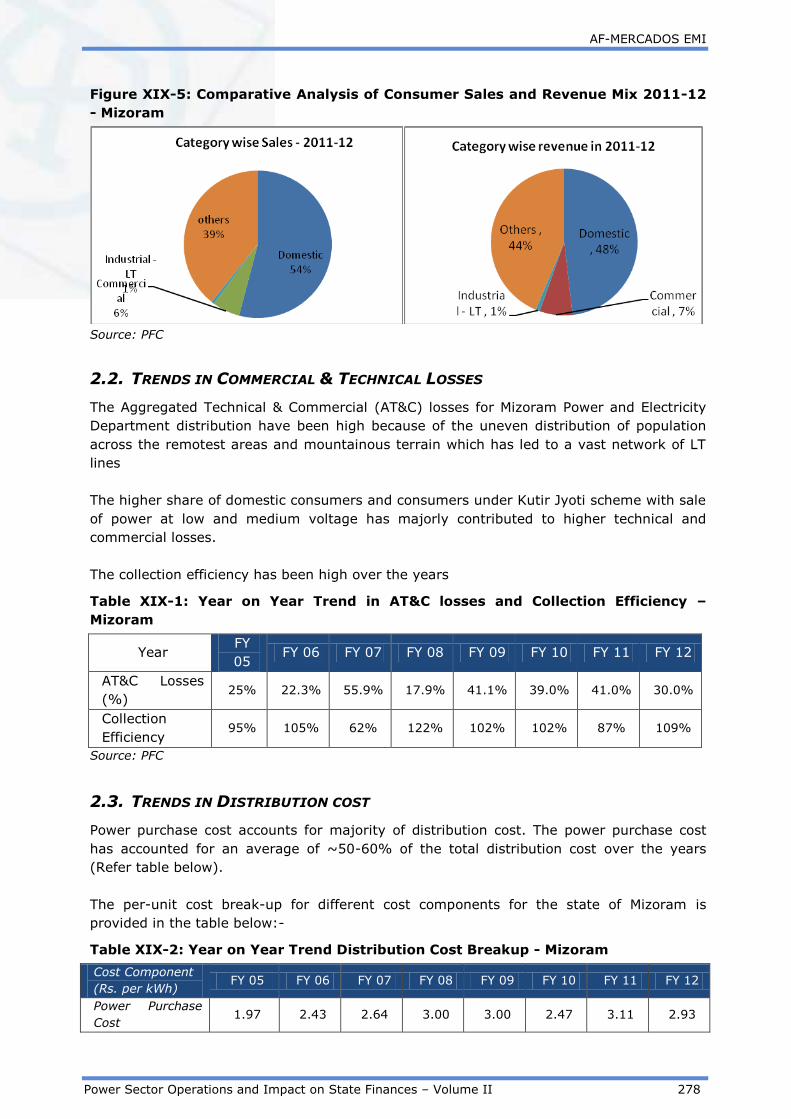
AF-MERCADOS EMI
Power Sector Operations and Impact on State Finances – Volume II 278
Figure XIX-5: Comparative Analysis of Consumer Sales and Revenue Mix 2011-12
- Mizoram
Source: PFC
2.2. TRENDS IN COMMERCIAL & TECHNICAL LOSSES
The Aggregated Technical & Commercial (AT&C) losses for Mizoram Power and Electricity
Department distribution have been high because of the uneven distribution of population
across the remotest areas and mountainous terrain which has led to a vast network of LT
lines
The higher share of domestic consumers and consumers under Kutir Jyoti scheme with sale
of power at low and medium voltage has majorly contributed to higher technical and
commercial losses.
The collection efficiency has been high over the years
Table XIX-1: Year on Year Trend in AT&C losses and Collection Efficiency –
Mizoram
Year FY
05 FY 06 FY 07 FY 08 FY 09 FY 10 FY 11 FY 12
AT&C Losses
(%) 25% 22.3% 55.9% 17.9% 41.1% 39.0% 41.0% 30.0%
Collection
Efficiency 95% 105% 62% 122% 102% 102% 87% 109%
Source: PFC
2.3. TRENDS IN DISTRIBUTION COST
Power purchase cost accounts for majority of distribution cost. The power purchase cost
has accounted for an average of ~50-60% of the total distribution cost over the years
(Refer table below).
The per-unit cost break-up for different cost components for the state of Mizoram is
provided in the table below:-
Table XIX-2: Year on Year Trend Distribution Cost Breakup - Mizoram
Cost Component
(Rs. per kWh) FY 05 FY 06 FY 07 FY 08 FY 09 FY 10 FY 11 FY 12
Power Purchase
Cost 1.97 2.43 2.64 3.00 3.00 2.47 3.11 2.93
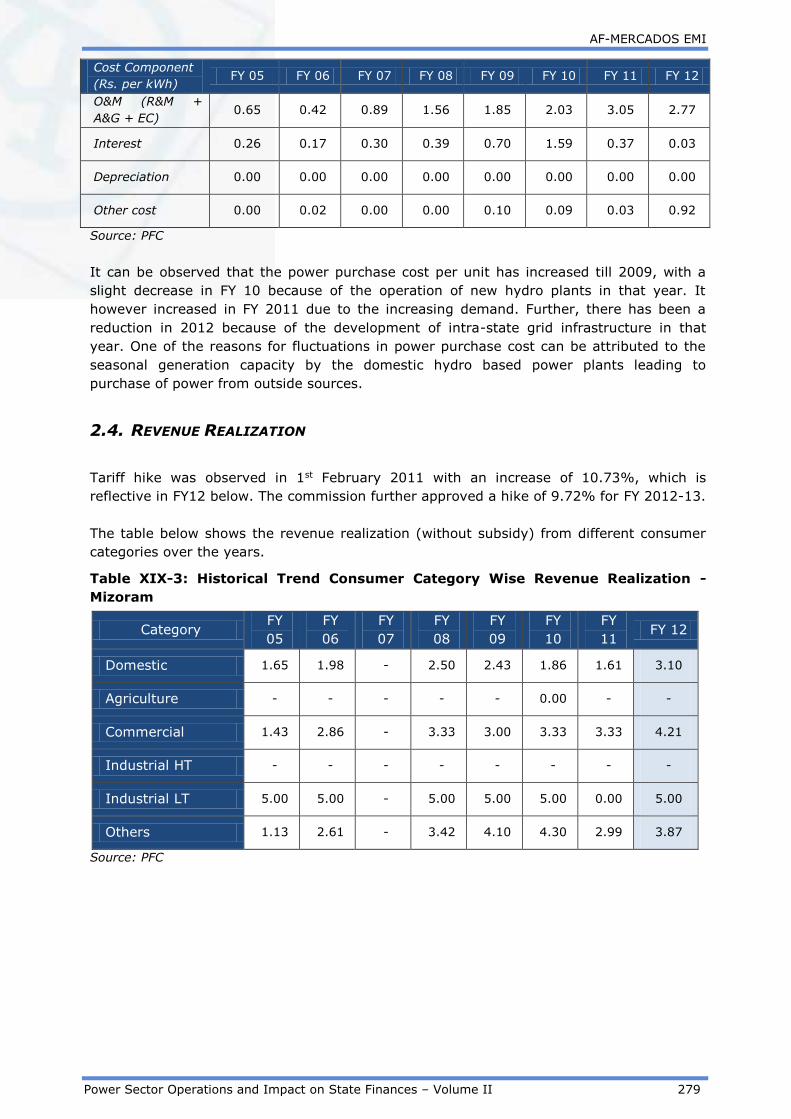
AF-MERCADOS EMI
Power Sector Operations and Impact on State Finances – Volume II 279
Cost Component
(Rs. per kWh) FY 05 FY 06 FY 07 FY 08 FY 09 FY 10 FY 11 FY 12
O&M (R&M +
A&G + EC) 0.65 0.42 0.89 1.56 1.85 2.03 3.05 2.77
Interest 0.26 0.17 0.30 0.39 0.70 1.59 0.37 0.03
Depreciation 0.00 0.00 0.00 0.00 0.00 0.00 0.00 0.00
Other cost 0.00 0.02 0.00 0.00 0.10 0.09 0.03 0.92
Source: PFC
It can be observed that the power purchase cost per unit has increased till 2009, with a
slight decrease in FY 10 because of the operation of new hydro plants in that year. It
however increased in FY 2011 due to the increasing demand. Further, there has been a
reduction in 2012 because of the development of intra-state grid infrastructure in that
year. One of the reasons for fluctuations in power purchase cost can be attributed to the
seasonal generation capacity by the domestic hydro based power plants leading to
purchase of power from outside sources.
2.4. REVENUE REALIZATION
Tariff hike was observed in 1st February 2011 with an increase of 10.73%, which is
reflective in FY12 below. The commission further approved a hike of 9.72% for FY 2012-13.
The table below shows the revenue realization (without subsidy) from different consumer
categories over the years.
Table XIX-3: Historical Trend Consumer Category Wise Revenue Realization -
Mizoram
Category FY
05
FY
06
FY
07
FY
08
FY
09
FY
10
FY
11 FY 12
Domestic 1.65 1.98 - 2.50 2.43 1.86 1.61 3.10
Agriculture - - - - - 0.00 - -
Commercial 1.43 2.86 - 3.33 3.00 3.33 3.33 4.21
Industrial HT - - - - - - - -
Industrial LT 5.00 5.00 - 5.00 5.00 5.00 0.00 5.00
Others 1.13 2.61 - 3.42 4.10 4.30 2.99 3.87
Source: PFC

AF-MERCADOS EMI
Power Sector Operations and Impact on State Finances – Volume II 280
3. ASSESSMENT OF FINANCIAL PERFORMANCE OF –
DISTRIBUTION UTILITY
3.1. FINANCIAL HEALTH OF DISTRIBUTION UTILITIES
The distribution financial losses without subsides in Mizoram has increased over the years.
As discussed earlier, major reason for this is the increasing share consumers under low and
medium voltage, lack of effective metering and in-adequate tariff revisions.
Figure XIX-6: Historical Trend Financial Losses (w/o) subsidies – Mizoram
Source: PFC
3.2. SUBSIDY BOOKED V/S SUBSIDY RECEIVED
There has been no subsidy booked/received reported.
3.3. ACS V/S ARR
The gap (with subsidy) between average cost of supply and average revenue realized (with
subsidy) has remained high and ever increasing. This is primarily due to lack of tariff
revisions against increasing power purchase cost to meet the increasing demand.
Figure XIX-7: Historical Trend ACS v/s ARR (with subsidy) – Mizoram
Source: PFC

AF-MERCADOS EMI
Power Sector Operations and Impact on State Finances – Volume II 281
4. STATE INCOME AND EXPENDITURE ON POWER SECTOR
4.1. INCOME FROM POWER SECTOR
The tax revenue from the power sector has been a negligible portion of the total tax
revenue of the state. The tax income is majorly through electricity distribution tax, which is
paid by the distribution utilities to the state government.
Table XIX-4: Tax Revenue from Power Sector - Mizoram
Revenue 2009-10 2010-11 2011-12
Rs Cr
Tax Revenue from Power Sector 0 0 -
Total Tax Revenue 502 582 1,007
Power sector Tax Revenue /
Total state Tax Revenue 0 0% 0.0%
Source: C&AG Audited Accounts for the state – 2011-12, 2010-11, 2009-10
The non-tax revenue from power sector is through dividends, interest on loans and
advances, royalty/cess on water for power generation, rural electrification, T & D
etc. The details for the same are provided in the table below.
Table XIX-5: Non-Tax Revenue from Power Sector - Mizoram
Revenue 2009-10 2010-11 2011-12
Rs Cr
Non Tax Revenue From Power
Sector 64 71 110
Total Non-Tax Revenue 127 147 168
Power sector Non-Tax Revenue /
Total state Non-Tax Revenue 50.4% 0.5 65.2%
Source: C&AG Audited Accounts for the state – 2011-12, 2010-11, 2009-10
Non Tax revenue from T & D constitutes the major portion of Non Tax revenue of the
sector over the years. The total revenue generated from the power sector has increased
from Rs 64 Cr in 2009-10 to Rs 110 Cr in 2011-12.
4.2. EXPENDITURE ON POWER SECTOR
The table below depicts the expenditure on power sector made by the state government.
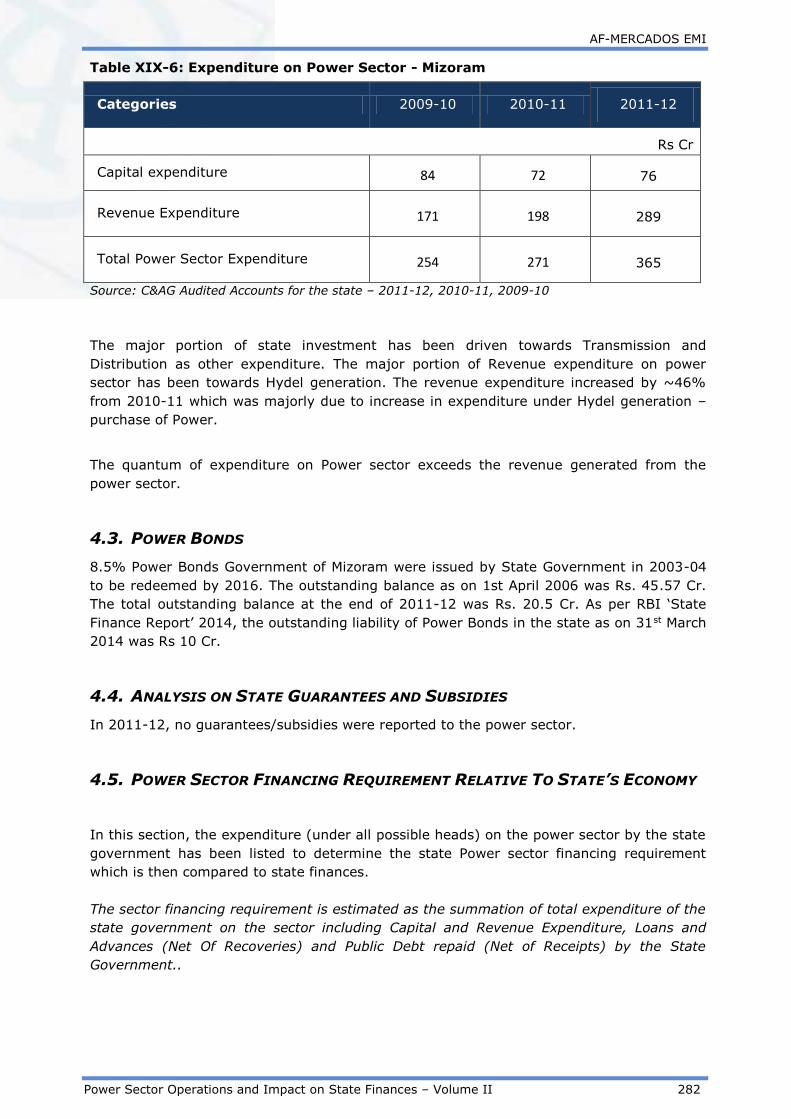
AF-MERCADOS EMI
Power Sector Operations and Impact on State Finances – Volume II 282
Table XIX-6: Expenditure on Power Sector - Mizoram
Categories 2009-10 2010-11 2011-12
Rs Cr
Capital expenditure 84 72 76
Revenue Expenditure 171 198 289
Total Power Sector Expenditure 254 271 365
Source: C&AG Audited Accounts for the state – 2011-12, 2010-11, 2009-10
The major portion of state investment has been driven towards Transmission and
Distribution as other expenditure. The major portion of Revenue expenditure on power
sector has been towards Hydel generation. The revenue expenditure increased by ~46%
from 2010-11 which was majorly due to increase in expenditure under Hydel generation –
purchase of Power.
The quantum of expenditure on Power sector exceeds the revenue generated from the
power sector.
4.3. POWER BONDS
8.5% Power Bonds Government of Mizoram were issued by State Government in 2003-04
to be redeemed by 2016. The outstanding balance as on 1st April 2006 was Rs. 45.57 Cr.
The total outstanding balance at the end of 2011-12 was Rs. 20.5 Cr. As per RBI ‘State
Finance Report’ 2014, the outstanding liability of Power Bonds in the state as on 31st March
2014 was Rs 10 Cr.
4.4. ANALYSIS ON STATE GUARANTEES AND SUBSIDIES
In 2011-12, no guarantees/subsidies were reported to the power sector.
4.5. POWER SECTOR FINANCING REQUIREMENT RELATIVE TO STATE’S ECONOMY
In this section, the expenditure (under all possible heads) on the power sector by the state
government has been listed to determine the state Power sector financing requirement
which is then compared to state finances.
The sector financing requirement is estimated as the summation of total expenditure of the
state government on the sector including Capital and Revenue Expenditure, Loans and
Advances (Net Of Recoveries) and Public Debt repaid (Net of Receipts) by the State
Government..
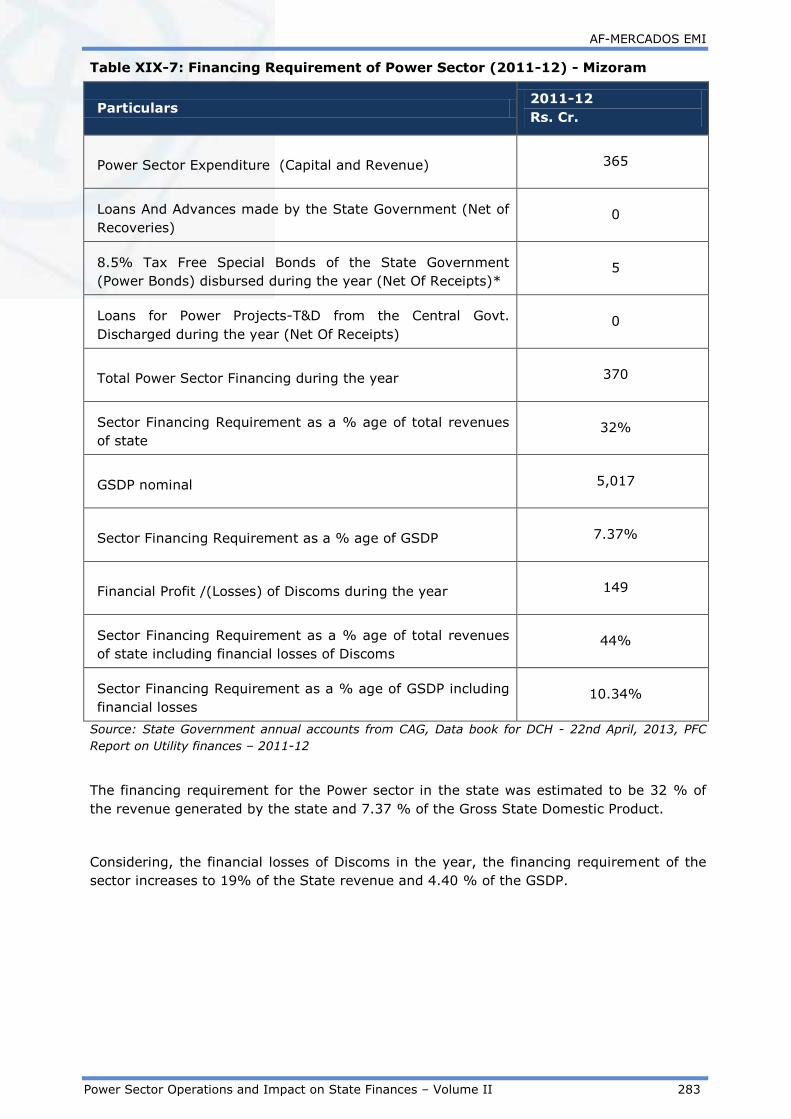
AF-MERCADOS EMI
Power Sector Operations and Impact on State Finances – Volume II 283
Table XIX-7: Financing Requirement of Power Sector (2011-12) - Mizoram
Particulars 2011-12
Rs. Cr.
Power Sector Expenditure (Capital and Revenue) 365
Loans And Advances made by the State Government (Net of
Recoveries) 0
8.5% Tax Free Special Bonds of the State Government
(Power Bonds) disbursed during the year (Net Of Receipts)* 5
Loans for Power Projects-T&D from the Central Govt.
Discharged during the year (Net Of Receipts) 0
Total Power Sector Financing during the year 370
Sector Financing Requirement as a % age of total revenues
of state 32%
GSDP nominal 5,017
Sector Financing Requirement as a % age of GSDP 7.37%
Financial Profit /(Losses) of Discoms during the year 149
Sector Financing Requirement as a % age of total revenues
of state including financial losses of Discoms 44%
Sector Financing Requirement as a % age of GSDP including
financial losses 10.34%
Source: State Government annual accounts from CAG, Data book for DCH - 22nd April, 2013, PFC
Report on Utility finances – 2011-12
The financing requirement for the Power sector in the state was estimated to be 32 % of
the revenue generated by the state and 7.37 % of the Gross State Domestic Product.
Considering, the financial losses of Discoms in the year, the financing requirement of the
sector increases to 19% of the State revenue and 4.40 % of the GSDP.

AF-MERCADOS EMI
Power Sector Operations and Impact on State Finances – Volume II 284
5. ASSESSMENT OF REGULATORY EFFECTIVENESS
The Central Government constituted a Joint Electricity Regulatory Commission (JERC) for
the states of Mizoram and Manipur on 18th January, 2005 and it started its operations from
24th January, 2008. The first tariff order was issued by the commission on 12th January
2011 for FY 2011-12. The commission has been working towards improving the power
sector scenario in the state with active reforms. The recent notifications include MYT
regulations, 2014 and standard of performance for Distribution and Transmission Licensees
regulations, 2014
The key aspects of regulatory effectiveness have been discussed below -
5.1. STATUS OF MYT REGULATIONS
The Commission has notified MYT Regulations in FY 2014 for the first control period viz., FY
2015-16. However, its implementation is not carried forward by the commission because of
lack of requisite and reliable data with the P&E department of the state
5.2. FREQUENCY OF TARIFF REVISIONS
The latest major tariff revision which took place was in FY 2010-11 and FY 2012-13, to the
tune of 10% and 11% respectively

AF-MERCADOS EMI
Power Sector Operations and Impact on State Finances – Volume II 285
6. SUMMARY
With effective capacity addition and developmental programs, the energy deficits in the
state have decreased over the years. However, since most of the power generation in the
state is from hydro energy, there is irregularity in its generation because of its seasonal
nature and dependence on monsoons. Till date, the state meets most of its requirements
through firm allocations from central generating stations. Because of a large share of
domestic consumers, which is further increasing and spread across the state, the power
department is responsible to set up a vast network to meet their requirement. With this,
there is a need to improve the system efficiency and metering level.
1. Power purchase cost: Mizoram has a substantial share of hydro power in its
generation based capacity. There is further capacity addition being done in the state
hydro power generation. With that in line, we expect the power purchase cost to
decrease in the future. As of now, the state meets most of its requirements through
procurement from CGS and power purchase cost constitutes a major portion of the
overall cost.
2. Tariff revisions: Even though there have been tariff revisions on 2010 and 2012, it
has’t been in tune to the increasing power purchase cost leading to increasing gap
between ACS and ARR.
3. Financial Losses : The distribution financial losses without subsides in Mizoram has
increased over the years form Rs 41 Cr in FY 2007-08 to Rs 149 Cr in FY 2011-12.
Major reason for such losses is the lack of proper metering, billing and IT
infrastructure
4. Regulatory reforms: The regulator for the states of Mizoram and Manipur would
need to work on managing the performance of the respective power department as
per the standard of performance for Distribution and Transmission Licensees
regulations, 2014 in order to facilitate further implementation of regulations on MYT
and Open access.
5. Exposure to the State Gov. to power sector: The financing requirement for the
Power sector in the state was estimated to be 32% of the revenue generated by the
state and 7.37% of the Gross State Domestic Product. Considering, the Financial
losses of Discoms in the year 2011-12, the financing requirement of the sector
increases to 44% of the State revenue and 10.34% of the GSDP.
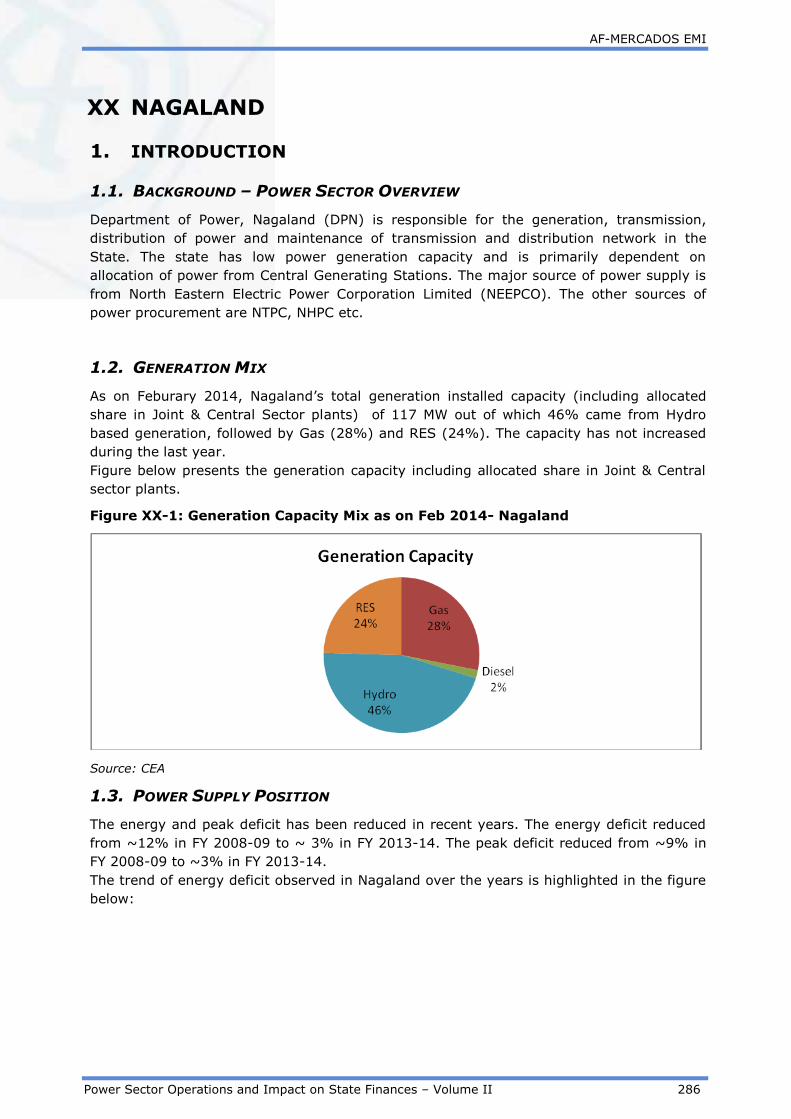
AF-MERCADOS EMI
Power Sector Operations and Impact on State Finances – Volume II 286
XX NAGALAND
1. INTRODUCTION
1.1. BACKGROUND – POWER SECTOR OVERVIEW
Department of Power, Nagaland (DPN) is responsible for the generation, transmission,
distribution of power and maintenance of transmission and distribution network in the
State. The state has low power generation capacity and is primarily dependent on
allocation of power from Central Generating Stations. The major source of power supply is
from North Eastern Electric Power Corporation Limited (NEEPCO). The other sources of
power procurement are NTPC, NHPC etc.
1.2. GENERATION MIX
As on Feburary 2014, Nagaland’s total generation installed capacity (including allocated
share in Joint & Central Sector plants) of 117 MW out of which 46% came from Hydro
based generation, followed by Gas (28%) and RES (24%). The capacity has not increased
during the last year.
Figure below presents the generation capacity including allocated share in Joint & Central
sector plants.
Figure XX-1: Generation Capacity Mix as on Feb 2014- Nagaland
Source: CEA
1.3. POWER SUPPLY POSITION
The energy and peak deficit has been reduced in recent years. The energy deficit reduced
from ~12% in FY 2008-09 to ~ 3% in FY 2013-14. The peak deficit reduced from ~9% in
FY 2008-09 to ~3% in FY 2013-14.
The trend of energy deficit observed in Nagaland over the years is highlighted in the figure
below:
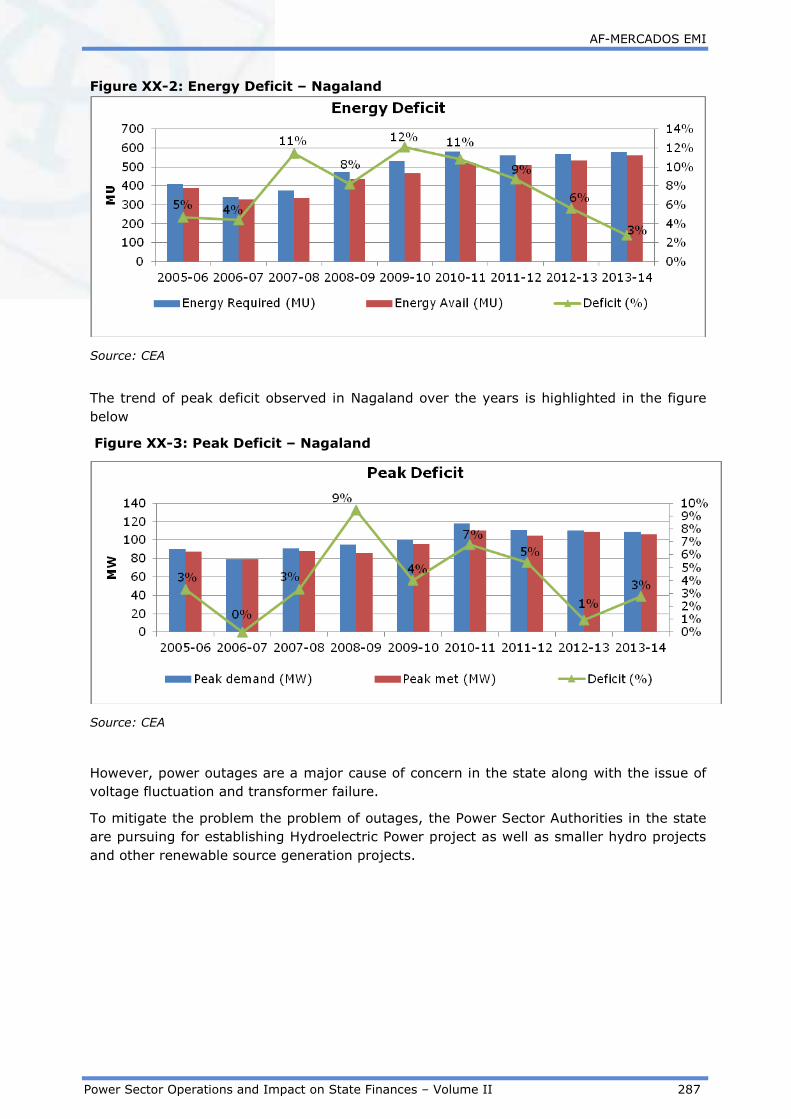
AF-MERCADOS EMI
Power Sector Operations and Impact on State Finances – Volume II 287
Figure XX-2: Energy Deficit – Nagaland
Source: CEA
The trend of peak deficit observed in Nagaland over the years is highlighted in the figure
below
Figure XX-3: Peak Deficit – Nagaland
Source: CEA
However, power outages are a major cause of concern in the state along with the issue of
voltage fluctuation and transformer failure.
To mitigate the problem the problem of outages, the Power Sector Authorities in the state
are pursuing for establishing Hydroelectric Power project as well as smaller hydro projects
and other renewable source generation projects.
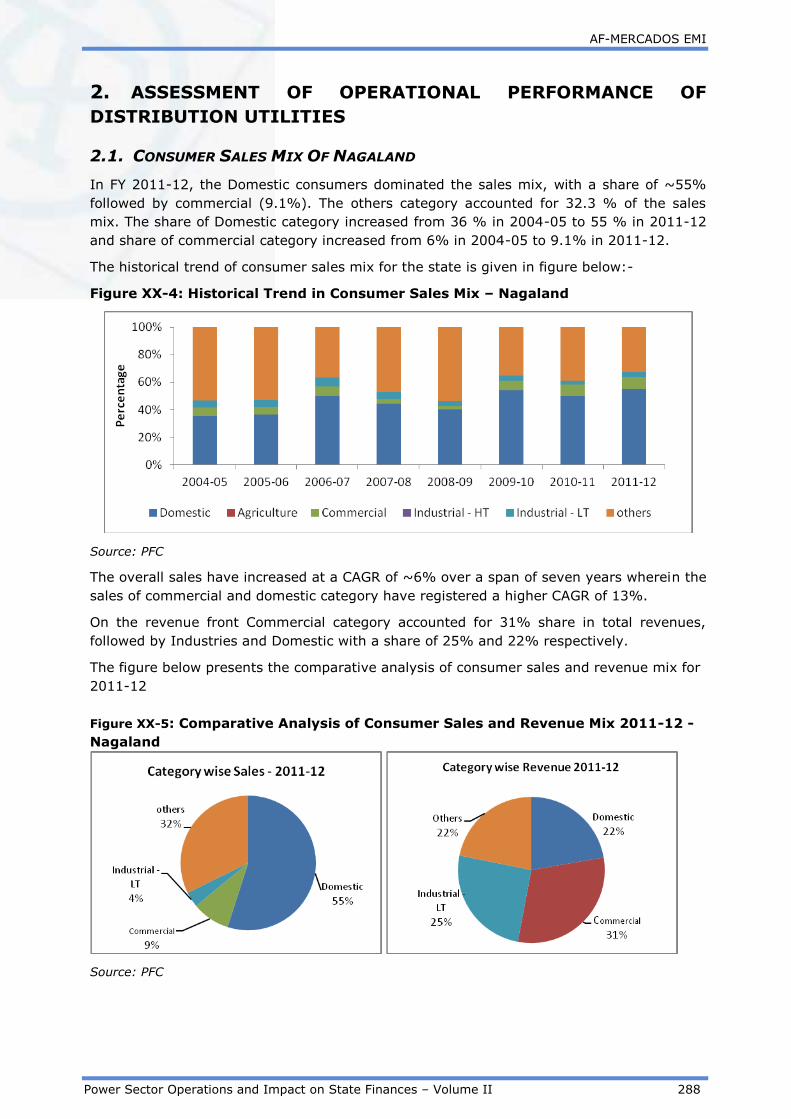
AF-MERCADOS EMI
Power Sector Operations and Impact on State Finances – Volume II 288
2. ASSESSMENT OF OPERATIONAL PERFORMANCE OF
DISTRIBUTION UTILITIES
2.1. CONSUMER SALES MIX OF NAGALAND
In FY 2011-12, the Domestic consumers dominated the sales mix, with a share of ~55%
followed by commercial (9.1%). The others category accounted for 32.3 % of the sales
mix. The share of Domestic category increased from 36 % in 2004-05 to 55 % in 2011-12
and share of commercial category increased from 6% in 2004-05 to 9.1% in 2011-12.
The historical trend of consumer sales mix for the state is given in figure below:-
Figure XX-4: Historical Trend in Consumer Sales Mix – Nagaland
Source: PFC
The overall sales have increased at a CAGR of ~6% over a span of seven years wherein the
sales of commercial and domestic category have registered a higher CAGR of 13%.
On the revenue front Commercial category accounted for 31% share in total revenues,
followed by Industries and Domestic with a share of 25% and 22% respectively.
The figure below presents the comparative analysis of consumer sales and revenue mix for
2011-12
Figure XX-5: Comparative Analysis of Consumer Sales and Revenue Mix 2011-12 -
Nagaland
Source: PFC

AF-MERCADOS EMI
Power Sector Operations and Impact on State Finances – Volume II 289
2.2. TRENDS IN COMMERCIAL & TECHNICAL LOSSES
The Aggregated Technical & Commercial (AT&C) losses for DPN have been relatively high
however; it has reduced significantly from 43% in 2004-05 to 22% in 2011-12.
Table XX-1: Year on Year Trend in AT&C losses and Collection Efficiency -
Nagaland
Year FY
05 FY 06 FY 07 FY 08 FY 09 FY 10 FY 11 FY 12
AT&C Losses
(%) 43% 50.6% 52.7% 49% 44% 65% 49% 22%
Collection
Efficiency 89% 83% 78% 79% 88% 53% 78% 124%
Source: PFC
The high level of losses are primarily due to unpaid electricity bills of public buildings and
Government offices, theft, illegal tapings from electrical lines and meter tampering etc. It is
reported (for FY 2012-13) that about 50% of total connections are with defective meters.
However, high collection efficiency in 2011-12 adds to low AT&C losses in the state.
2.3. TRENDS IN DISTRIBUTION COST
The power purchase cost accounts for 65% of the total distribution cost. The average
distribution cost in Nagaland has grown at a CAGR of ~10% over a span of seven years
and power purchase cost has grown at CAGR of 13 %
The per unit cost break-up for different cost components is highlighted in the table below:-
Table XX-2: Year on Year Trend Distribution Cost Breakup - Nagaland
Cost Component FY 05 FY 06 FY 07 FY 08 FY
09 FY 10 FY 11 FY 12
Power Purchase Cost 1.9 1.9 2.4 2.7 3.6 3.0 3.4 4.5
O&M (R&M + A&G +
EC) 0.6 0.7 1.1 1.5 1.5 1.3 1.6 1.7
Interest 0.6 0.6 0.5 0.6 0.5 0.5 0.5 0.4
Depreciation 0.4 0.4 0.5 0.6 0.6 0.4 0.3 0.4
Other cost 0.0 0.0 0.0 0.0 0.0 0.0 0.0 0.0
Source: PFC
The state of Nagaland is dependent upon Central Generating Station and hence it procures
major portion of energy requirement from external sources like NEEPCO, NTPC, NHPC etc.
Hence, the power purchasing cost is subject to fluctuation in the Coal and Gas prices.
2.4. REVENUE REALIZATION
The tariff realizations have increased in FY 2011-12 for all categories of
consumers.
The table below shows the revenue realization (without subsidy) from different consumer
categories over the years.
Table XX-3: Historical Trend Consumer Category Wise Revenue Realization -
Nagaland

AF-MERCADOS EMI
Power Sector Operations and Impact on State Finances – Volume II 290
Years 2004-
05 2005-06 2006-07
2007-
08
2008-
09 2009-10 2010-11
2011-
12
Domestic 2.38 2.53 2.68 2.54 2.55 2.10 2.13 3.40
Agriculture 3.57 3.57 3.57 3.33 3.33 3.48 3.75 4.69
Industrial
LT 2.50 2.50 3.08 3.08 2.86 2.50 2.73 3.85
Source: PFC
The revenue realization has improved in FY 2011-12. This is due to the tariff revisions to
the tune of ~17% in the year.

AF-MERCADOS EMI
Power Sector Operations and Impact on State Finances – Volume II 291
3. ASSESSMENT OF FINANCIAL PERFORMANCE OF –
DISTRIBUTION UTILITY
3.1. FINANCIAL HEALTH OF DISTRIBUTION UTILITIES
The power department has accounted for losses in the past seven years which has
worsened in last three years. The losses increased from Rs 68 Cr in FY 09 to Rs 201 Cr in
FY 12.
Figure XX-6: Historical Trend Financial Losses (w/o) subsidies – Nagaland
Source: PFC
3.2. SUBSIDY BOOKED V/S SUBSIDY RECEIVED
There is no history available of Subsidies given to DPN
3.3. ACS V/S ARR
The gap with subsidy between average cost of supply and average revenue realized has
increased from Rs/kWh 2.26 in FY 2004-05 to Rs/kWh 4.28 in FY 2011-12.
Figure XX-7: Historical Trend ACS v/s ARR (with subsidy) – Nagaland
Source: PFC
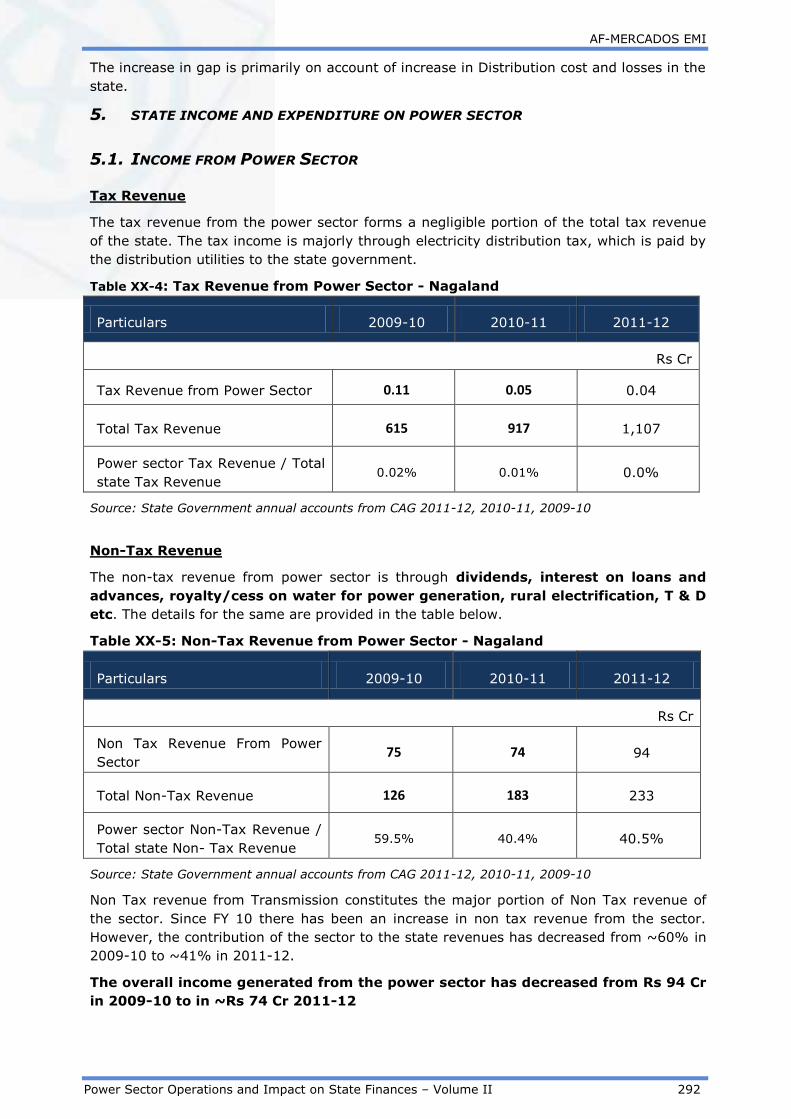
AF-MERCADOS EMI
Power Sector Operations and Impact on State Finances – Volume II 292
The increase in gap is primarily on account of increase in Distribution cost and losses in the
state.
5. STATE INCOME AND EXPENDITURE ON POWER SECTOR
5.1. INCOME FROM POWER SECTOR
Tax Revenue
The tax revenue from the power sector forms a negligible portion of the total tax revenue
of the state. The tax income is majorly through electricity distribution tax, which is paid by
the distribution utilities to the state government.
Table XX-4: Tax Revenue from Power Sector - Nagaland
Particulars 2009-10 2010-11 2011-12
Rs Cr
Tax Revenue from Power Sector 0.11 0.05 0.04
Total Tax Revenue 615 917 1,107
Power sector Tax Revenue / Total
state Tax Revenue 0.02% 0.01% 0.0%
Source: State Government annual accounts from CAG 2011-12, 2010-11, 2009-10
Non-Tax Revenue
The non-tax revenue from power sector is through dividends, interest on loans and
advances, royalty/cess on water for power generation, rural electrification, T & D
etc. The details for the same are provided in the table below.
Table XX-5: Non-Tax Revenue from Power Sector - Nagaland
Particulars 2009-10 2010-11 2011-12
Rs Cr
Non Tax Revenue From Power
Sector 75 74 94
Total Non-Tax Revenue 126 183 233
Power sector Non-Tax Revenue /
Total state Non- Tax Revenue 59.5% 40.4% 40.5%
Source: State Government annual accounts from CAG 2011-12, 2010-11, 2009-10
Non Tax revenue from Transmission constitutes the major portion of Non Tax revenue of
the sector. Since FY 10 there has been an increase in non tax revenue from the sector.
However, the contribution of the sector to the state revenues has decreased from ~60% in
2009-10 to ~41% in 2011-12.
The overall income generated from the power sector has decreased from Rs 94 Cr
in 2009-10 to in ~Rs 74 Cr 2011-12

AF-MERCADOS EMI
Power Sector Operations and Impact on State Finances – Volume II 293
5.2. EXPENDITURE ON POWER SECTOR
The table below depicts the expenditure towards power sector in the state of Nagaland.
Table XX-6: Expenditure on Power Sector - Nagaland
Particulars 2009-10 2010-11 2011-12
Rs Cr
Capital expenditure 71 60 86
Revenue expenditure 170 222 294
Total expenditure 241 283 380
Source: State Government annual accounts from CAG 2011-12, 2010-11, 2009-10
The capital and revenue expenditure have risen over the span of three years primarily due
to increase in investments under T&D and revenue expense under Thermal generation.
The major portion of state investment has been driven towards Transmission and
Distribution. The major portion of Revenue expenditure on power sector went towards
Thermal generation.
The quantum of expenditure on Power sector exceeds the revenue generated
from the power sector.
5.3. POWER BONDS
The details of outstanding balance of power bonds issued by the state are given
below.
The outstanding amount of 8.5% Tax Free Special Bonds of the State Government (Power
Bonds) issued by State Government, as on 1st April 2009 was Rs 55.24 Cr. The balance
outstanding as on 31st March 2012 was Rs 31.57 Cr. As per RBI ‘State Finance Report’
2014, the outstanding liability of Power Bonds in the state as on 31st March 2014 was Rs
20 Cr.
5.4. ANALYSIS ON STATE GUARANTEES AND SUBSIDIES
Guarantees
In 2011-12, no guarantees were given to the power sector.
Subsidy
In 2011-12, there were no subsidy payments to the power sector.
5.5. POWER SECTOR FINANCING REQUIREMENT RELATIVE TO STATE’S ECONOMY
In this section, the expenditure (under all possible heads) on the power sector by the state
government has been listed to determine the state Power sector financing requirement
which is then compared to state finances.
The sector financing requirement is estimated as the summation of total expenditure of the
state government on the sector including Capital and Revenue Expenditure, Loans and

AF-MERCADOS EMI
Power Sector Operations and Impact on State Finances – Volume II 294
Advances (Net Of Recoveries) and Public Debt repaid (Net of Receipts) by the State
Government.
Table XX-7: Power Sector Financing Requirement (2011-12) - Nagaland
Particulars 2011-12
Rs Cr
Power Sector Expenditure (Capital and Revenue) 380
Loans And Advances made by the State Government (Net of
recoveries) 0
8.5% Tax Free Special Bonds of the State Government (Power
Bonds) disbursed during the year (Net of Receipts) (15)
Loans for Power Projects-T&D from the Central Govt. Discharged
during the year (Net Of Receipts) 0
Total Power Sector Financing during the year 365
Sector Financing Requirement as a % age of total revenues of
state 27%
GSDP nominal 9,379
Sector Financing Requirement as a % age of GSDP 3.9%
Financial Profit/ (Losses) of Discoms during the year (201)
Sector Financing Requirement as a % age of total revenues of
state including financial losses of Discoms 42%
Sector Financing Requirement as a % age of GSDP including
financial losses 6%
Source: State Government annual accounts from CAG, Data book for DCH - 22nd April, 2013, PFC
Report on Utility finances – 2011-12
The financing requirement for the Power sector in the state was estimated to be 27 % of
the revenue generated by the state and 3.90 % of the Gross State Domestic Product.
Considering, the financial losses of Discoms in the year, the financing requirement of the
sector increases to 42 % of the State revenue and 6.04 % of the GSDP.
The substantial Discom losses have increased the burden of the sector on state finances.
Hence, there is a need for investments to build and strengthen the infrastructure in the
state.

AF-MERCADOS EMI
Power Sector Operations and Impact on State Finances – Volume II 295
5. ASSESSMENT OF REGULATORY EFFECTIVENESS
Under the provisions the Electricity Act, 2003, the Nagaland Electricity Regulatory Commission was established in 2008. It was formed as a One-member commission. However, it now faces the problem of inadequate manpower to operate efficiently and hence, operates with a functionally- deficient establishment.
5.1. STATUS OF MYT REGULATIONS
Not yet implemented.
The Commission is not in a position to introduce MYT Regime in the State mainly because
of lack of requisite and reliable data. The present MIS and regulatory reporting system of
the DPN is very inadequate for any such exercise at this stage.
5.2. STATUS OF OPEN ACCESS IMPLEMENTATION:
Not yet implemented
5.3. FREQUENCY OF TARIFF REVISIONS:
The tariff revisions were done in FY 2011-12. Thereafter, subsequent tariff revisions were
accepted for the FY 2012-13 to the tune of 14% & FY 2013-14 to the tune of 7%.
FY
05
FY 06 FY 07 FY
08
FY
09
FY
10
FY 11 FY
12
FY
13
FY 14
Average
Tariff
Revisions
0% 0% 0% 0% 0% 0% 0% 17% 14% 7%
Source: Tariff orders

AF-MERCADOS EMI
Power Sector Operations and Impact on State Finances – Volume II 296
6. SUMMARY
Key aspects of the state are summarized below :-
1. Energy and Peak Deficit: There is a concern in state related to voltage fluctuations
and transformer failure apart from the issue of load shedding.
2. Reforms: The power sector in the state has yet not undergone the structural
reforms and hence the state has a Power Department that is responsible for all the
functions of the sector.
3. Under developed infrastructure: The data collection and maintenance of data
base of power sector is not efficient and credible in the state. DPN is directed to
build accurate data and incorporate Management information system (MIS) to meet
the requirements for ARR & Tariff petitions. Technical and commercial losses are yet
to be segregated and quantified voltage wise. Moreover, there is a requirement of
taking up corrective measures to reduce the losses. There is requirement to allocate
funds for building up such an infrastructure.
4. Financial Losses: DPN has been incurring losses for the past nine years. The prime
concern here is the increase in cost, Collection efficiency and no tariff hikes. There
has been tariff hike in FY 14. However, it was not sufficient to cover up all the
losses. Moreover, there has been no state assistance in the form of subsidies for
DPN to bring down the burden of losses.
5. Tariff Hikes: The tariff hikes were approved in FY 2011-12 and hence there were
revision in subsequent years. However, the revisions were not sufficient to cover up
the Discom losses.
6. State Exposure to Power Sector: The Financing requirement of the sector
accounts for ~6% of the GSDP. However, the income generation from the sector in
FY 2011-12 were very low compared to the requirement. Hence the burden on state
finances is significant; however, the expenditure in the form of investments in T & D
segment is extremely important.
AF-MERCADOS EMI
Power Sector Operations and Impact on State Finances – Volume II 297
XXI ORISSA
1. INTRODUCTION
1.1. BACKGROUND – POWER SECTOR OVERVIEW
Orissa has been the pioneer among the Indian states to embark on a comprehensive
reform for the electricity sector in the state. The primary aim of the reform was to deal
with the fundamental issues underlying poor performance of the state utility as well as to
restructure the power sector. The objective was to make power supply more efficient, meet
the demands of a growing economy and develop an economically viable power industry,
which will enable Orissa to attract private capital while safeguarding the interests of the
consumers.
OSEB was unbundled in the year 1996 with the formulation of GRIDCO and OHPC. Further,
on November 19, 1997 GRIDCO divided its distribution functions based on the four
geographical zones viz. Western zone, North-Eastern Zone, Southern Zone and Central
Zone forming four wholly owned subsidiaries (viz. Western Electricity Supply Company of
Orissa Ltd (WESCO), North Eastern Electricity Supply Company of Orissa Ltd. (NESCO),
Southern Electricity Supply Company of Orissa Ltd. (SOUTHCO) and Central Electricity
Supply Utility (CESU, erstwhile Central Electricity Supply Company of Orissa Ltd. (CESU))
under the Companies Act, 1956.
Later in April 1999, the distribution business of GRIDCO was privatized when GRIDCO
disinvested 51% of its share of its equity holding in Distribution Companies to Private
Investors with financial and technical capabilities keeping a share holding of 39% with it
and 10% share for Employees Welfare Trust. The distribution and supply business has
since been undertaken by four Distribution Companies (DISCOMS) namely CESU, WESCO,
NESCO and SOUTHCO. Three DISCOMS viz. WESCO, NESCO and SOUTHCO were taken
over by Bombay Suburban Electric Supply (BSES) of Mumbai with effect from April 01,
1999, and CESU was taken over by the American Electricity Supply Corporation (AES) of
USA with effect from September 01, 1999.
Under the existing legal set up, GRIDCO evacuates powers from the dedicated generating
stations of OHPC and OGPC and delivers it at distribution licensee’s end. The tariff
determined by the Commission is applicable for sale of power by OHPC to GRIDCO.
1.2. GENERATION MIX
The total installed capacity in December 2013 (including allocated share in Joint & Central
Sector plants) for Andhra Pradesh was 7,381 MW out of which Coal based power capacity
accounted for ~69% followed by Hydro (~28%). RE based capacity accounted for a
marginal share of ~1%.
Figure below highlights the generation capacity including allocated share in Joint & Central
sector plants.

AF-MERCADOS EMI
Power Sector Operations and Impact on State Finances – Volume II 298
Figure XXI-1: Generation Capacity Mix (2012-13) - Orissa
69%
29%
1%
Generation Capacity (incl. allocates share from Joint and Central Sector plants)
Coal Hydro Renewables
Source: CEA
1.3. POWER SUPPLY POSITION
Historically, the state of Orissa had witnessed low deficit levels, on account of high levels of
generation capacity, which is supported by wide variety of generation mix.
However, the peak deficit increased to ~7% in the year FY 13 from ~2% in the year FY 12,
because the capacity addition was not able to match the increased demand in the state for
that year. However, with the decline in the energy and peak demand the energy and peak
deficits in the state reduced to ~2% and ~0% respectively, in FY 14.
The trend of energy and peak deficit observed in Orissa over the years is highlighted in the
figure below:
Figure XXI-2: Historical Trend in Energy Deficit – Orissa
1%
2% 2%
1%
1%
0%
1%
3%
2%
0%
1%
1%
2%
2%
3%
3%
4%
0
5000
10000
15000
20000
25000
30000
MU
Energy Deficit
Energy Required (MU) Energy Available (MU) Energy Deficit
Source: CEA

AF-MERCADOS EMI
Power Sector Operations and Impact on State Finances – Volume II 299
Figure XXI-3: Historical Trend in Peak Demand and Peak Met – Orissa
2%
3%
8%
2% 2% 2% 2%
7%
0% 0%
2%
4%
6%
8%
0
1,000
2,000
3,000
4,000
5,000
2005-062006-072007-082008-092009-102010-112011-122012-132013-14
MW
Peak Deficit
Peak Demand (MW) Peak Met (MW) Deficit (%)
Source: CEA
Further, the above deficit levels in the state are expected to remain low for short to
medium term, on account of huge stranded capacity and low prevalent prices in the short
term market. The figure below presents the average daily short-term prices prevalent in
IEX in FY 14.
Figure XXI-4: Average Daily Short Term Prices IEX – S1 Region (2013-14)
0.00
0.50
1.00
1.50
2.00
2.50
3.00
3.50
4.00
1/4/
2013
16-0
4-20
13
1/5/
2013
16-0
5-20
13
31-0
5-20
13
15-0
6-20
13
30-0
6-20
13
15-0
7-20
13
30-0
7-20
13
14-0
8-20
13
29-0
8-20
13
13-0
9-20
13
28-0
9-20
13
13-1
0-20
13
28-1
0-20
13
12/1
1/20
13
27-1
1-20
13
12/1
2/20
13
27-1
2-20
13
11/1
/201
4
26-0
1-20
14
10/2
/201
4
25-0
2-20
14
12/3
/201
4
27-0
3-20
14
Average Daily Day Ahead Market Price - E2
Maximum Price - Rs. 3.69 per kWh
Average Price - Rs. 2.42 per kWh
Minimum Price - Rs. 0.56 per kWh
Sourc
e: IEX
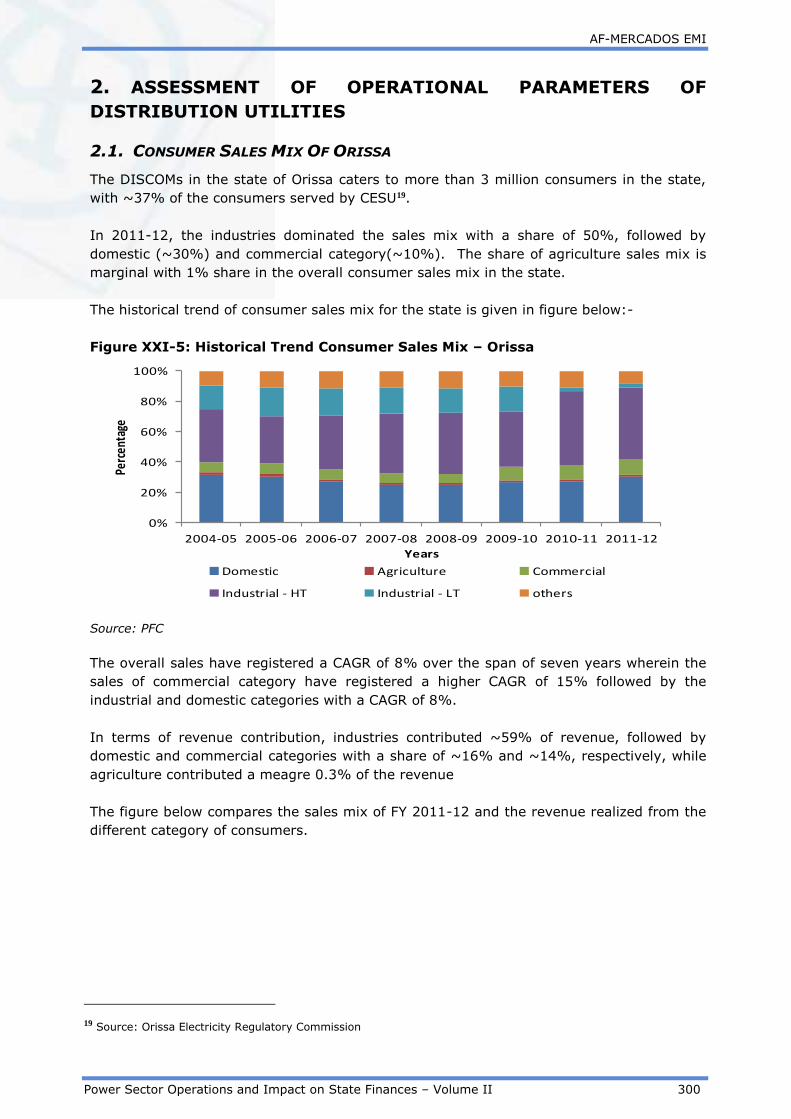
AF-MERCADOS EMI
Power Sector Operations and Impact on State Finances – Volume II 300
2. ASSESSMENT OF OPERATIONAL PARAMETERS OF
DISTRIBUTION UTILITIES
2.1. CONSUMER SALES MIX OF ORISSA
The DISCOMs in the state of Orissa caters to more than 3 million consumers in the state,
with ~37% of the consumers served by CESU19.
In 2011-12, the industries dominated the sales mix with a share of 50%, followed by
domestic (~30%) and commercial category(~10%). The share of agriculture sales mix is
marginal with 1% share in the overall consumer sales mix in the state.
The historical trend of consumer sales mix for the state is given in figure below:-
Figure XXI-5: Historical Trend Consumer Sales Mix – Orissa
0%
20%
40%
60%
80%
100%
2004-05 2005-06 2006-07 2007-08 2008-09 2009-10 2010-11 2011-12
Perc
enta
ge
Years
Domestic Agriculture Commercial
Industrial - HT Industrial - LT others
Source: PFC
The overall sales have registered a CAGR of 8% over the span of seven years wherein the
sales of commercial category have registered a higher CAGR of 15% followed by the
industrial and domestic categories with a CAGR of 8%.
In terms of revenue contribution, industries contributed ~59% of revenue, followed by
domestic and commercial categories with a share of ~16% and ~14%, respectively, while
agriculture contributed a meagre 0.3% of the revenue
The figure below compares the sales mix of FY 2011-12 and the revenue realized from the
different category of consumers.
19 Source: Orissa Electricity Regulatory Commission

AF-MERCADOS EMI
Power Sector Operations and Impact on State Finances – Volume II 301
Figure XXI-6: Comparative Analysis of Consumer sales and Revenue Mix 2011-12
– Orissa
Domestic 16%
Commercial14%
Agriculture 0%
Industrial - HT 56%
Industrial - LT 3% Others
11%
Category wise Revenue in 2011-12
Domestic 30%
Agriculture1%
Commercial 10%
Industrial - HT 47%
Industrial - LT 3%
others 9%
Category wise Sales - 2011-12
Source: PFC
2.2. TRENDS IN COMMERCIAL AND TECHNICAL LOSSES
The Aggregated Technical & Commercial losses (AT&C) for Orissa distribution utilities have
historically remained on an extremely higher side compared to the national average.
The loss levels reported by the state utilities are more than 40% for all the representative
years.
The table below illustrates the year on year trend on commercial losses and collection
efficiency of the DISCOMs.
Table XXI-1: Historical Trend in AT&C Losses and Collection Efficiency - Orissa
Year FY
05
FY
06
FY
07
FY
08
FY
09
FY
10
FY
11
FY
12
AT&C Losses (%) 43% 44% 40% 41% 42% 40% 46% 45
%
Collection Efficiency
(%) 94% 93% 98% 94% 93% 96% 88%
90
%
Source: PFC
The primary reasons for high levels of AT&C losses are lack of any substantial measures
taken by the DISCOMs to reduce the losses through reduction of thefts, collection of
arrears, proper energy auditing and full scale metering.
2.3. TRENDS IN DISTRIBUTION COSTS
Power purchase cost constitutes the major share of distribution cost in the state. The
power purchase cost was ~70%.
The table below illustrates the historical trend of distribution cost break in the state of
Orissa.
Table XXI-2: Historical Trend in Distribution Cost Breakup - Orissa
Cost Component
(Rs per kWh) FY 06 FY 07 FY 08 FY 09 FY 10 FY 11 FY 12
Power Purchase
Cost 1.29 1.28 1.48 1.46 1.43 2.00 2.54
O&M (R&M +
A&G + EC) 0.35 0.48 0.40 0.66 0.44 0.47 0.57
Interest 0.07 0.07 0.07 0.07 0.08 0.08 0.10

AF-MERCADOS EMI
Power Sector Operations and Impact on State Finances – Volume II 302
Cost Component
(Rs per kWh) FY 06 FY 07 FY 08 FY 09 FY 10 FY 11 FY 12
Depreciation 0.09 0.08 0.06 0.05 0.05 0.04 0.05
Other cost 0.06 0.07 0.07 0.05 0.07 0.03 0.02
Source: PFC
The power purchase cost significantly increased in FY 11 and FY 12, on account of purchase
of power from comparatively expensive independent power producers (viz. Sterlite Energy
and Arati Steels Ltd.).
The per unit interest cost increased by ~25% in FY 12 because of increased debt
undertaken by the distribution utilities, on account of capital expenditure loan provided by
Government of Orissa towards improvement of AT&C losses and quality of supply in the
state.
The table below depicts the interest liable on various loans undertaken by the DISCOMs in
the year FY 11 and FY 12
Source FY 11 FY 12
GRIDCO loan 0.00 0.00
World Bank loan 101.64 110.56
Power Bond – Differential Amount 77.13 77.13
APDRP Net of 50% grant (GoO) 11.02 12.05
REC/PFC (Counter Part Funding APDRP) and SI Scheme 15.02 15.56
Interest on security deposit 51.50 58.37
CAPEX (REC) 12.06 5.67
Govt. of Orissa Capex loan 0.00 19.35
Other interest and finance charges 0.00 19.01
Total interest before capitalisation 268.37 317.70
Source: Approved Tariff Order FY 2011 and FY 2012
2.4. REVENUE REALIZATION
Tariff realization from different consumer category has remained proportionate to
increasing power purchase cost. However, the DISCOMs are not report under-recovery on
account of high levels of AT&C losses in the state. The tariff hikes in FY 11 and FY 12
wherein tariffs were hiked by 22% and 20% respectively, were applied to commensurate
the increased power purchase costs.
The table below depicts the historical trend in consumer wise average realization in the
state of Orissa
Table XXI-3: Historical Trend in Consumer wise Average Realization - Orissa
Years 2005-06 2006-07 2007-08 2008-09 2009-10 2010-11 2011-12
Domestic 1.17 1.16 1.95 2.00 1.94 2.33 2.37
Agriculture 0.95 0.89 1.15 1.31 1.85 1.12 1.10
Commercial 1.58 1.69 3.94 4.13 3.78 4.92 6.10
Industrial HT 2.21 1.98 2.80 2.81 3.25 4.08 5.25
Industrial LT 3.11 3.64 3.89 4.72 3.66 4.77 5.62
AF-MERCADOS EMI
Power Sector Operations and Impact on State Finances – Volume II 303
Source: PFC
Financial losses of the utilities are limited to the high levels of AT&C losses in the state.
Tariffs have been hiked over the years to minimize the revenue gap, indicating that burden
of the high levels of AT&C losses are borne by the consumer through tariff increase.

AF-MERCADOS EMI
Power Sector Operations and Impact on State Finances – Volume II 304
3. ASSESSMENT OF FINANCIAL PERFORMANCE OF –
DISTRIBUTION UTILITY
3.1. FINANCIAL HEALTH OF DISTRIBUTION UTILITIES
The distribution financial losses in Orissa have increased from Rs 148 Cr in FY 09 to Rs 423
Cr in FY 12.
The figure below depicts the year on year trend in financial losses registered by the
utilities.
Figure XXI-7: Historical Trend in Financial Losses (w/o subsidy) - Orissa
(294)
(55)
(151)
(217)
(148)(172)
(279)
(423)(500)
(450)
(400)
(350)
(300)
(250)
(200)
(150)
(100)
(50)
-
2004
-05
2005
-06
2006
-07
2007
-08
2008
-09
2009
-10
2010
-11
2011
-12
Rs. Cr
Financial Losses (PAT )
Source: PFC
Although, the loss levels declined from FY 05 (Rs 294 Cr) to FY 10 (Rs 172 Cr), further
increase in power purchase costs in the year FY 11 and FY 12 resulted in increased loss
levels of Rs 279 Cr amd Rs 423 Cr respectively.
3.2. SUBSIDY BOOKED V/S SUBSIDY RECEIVED
The DISCOMs have not booked subsidies from FY 05 to FY 12.
3.3. ACS V/S ARR
The gap with subsidy between average cost of supply and average revenue realized has
increased in last few years in spite of tariff increase. This is primarily due to the prevalent
high AT&C loss levels in the state.
The figure below depicts the trend in revenue gap on per unit sale of electricity to the
consumer
Figure XXI-8: Historical Trend in ACS v/s ARR - Orissa
0.31
0.04 0.10 0.13 0.08 0.09 0.13 0.20
2.66
1.861.97
2.072.29
2.07
2.63
3.27
2.35
1.82 1.87 1.94
2.21
1.98
2.50
3.07
0.00
0.50
1.00
1.50
2.00
2.50
3.00
3.50
2004-05 2005-06 2006-07 2007-08 2008-09 2009-10 2010-11 2011-12
Rs./kW
h
Years
Gap(with subsidy) ACS ARR (with subsidy)
Source: PFC

AF-MERCADOS EMI
Power Sector Operations and Impact on State Finances – Volume II 305
4. STATE EXPOSURE TO POWER SECTOR
4.1. INCOME FROM POWER SECTOR
The source of tax revenue is the electricity distribution tax, paid to the state government
by the distribution utilities. The tax revenue from the power sector formed ~2% of the
total tax revenue in the state in 2011-12. The details for the same are provided in the
table below:
Table XXI-4: Tax Revenue from Power Sector - Orissa
Revenue 2009-10 2010-11 2011-12
Rs Cr
Tax Revenue From Power Sector 460 458 552
Total Tax Revenue 17,501 21,690 25,672
Power sector Tax Revenue / Total
state Tax Revenue 2.63% 2.11% 2%
Source: Audited CAG for the state: 2011-12, 2010-11, 2009-10
Even though there has been an increase in tax revenue from Power sector, the contribution
to the state level tax revenue has declined since FY10.
The non-tax revenue from power sector is through Royalty/cess on water for power
generation, transmission and distribution, Rural Electrification etc. The Non Tax
revenue which is Rs 3.37 Cr forms only 0.05% of the total non-tax revenues in 2011-12.
The details for the same are provided in the table below.
Table XXI-5: Non-Tax Revenue from Power Sector - Orissa
Revenue 2009-10 2010-11 2011-12
Rs Cr
Non-Tax Revenue From Power
Sector 2.7 2.1 3.37
Total Non-Tax Revenue 3,212 4,780 6,443
Power sector Non-Tax Revenue /
Total state Non- Tax Revenue 0.08% 0.04% 0.05%
Source: Audited CAG for the state: 2011-12, 2010-11, 2009-10
4.2. EXPENDITURE ON POWER SECTOR
The table below depicts the expenditure towards power sector by the state government

AF-MERCADOS EMI
Power Sector Operations and Impact on State Finances – Volume II 306
Table XXI-6: Expenditure on Power Sector - Orissa
Categories 2009-10 2010-11 2011-12
Rs Cr
Capital expenditure 9 83 181.10
Revenue Expenditure 95 205 23.70
Total Expenditure 104 289 204.80
Source: Audited CAG for the state: 2011-12, 2010-11, 2009-10
The capital account has risen since FY10 primarily on account of increase in investments in
T&D. The revenue expenditure has declined substantially especially from the FY11 level
primarily due to decrease in expenditure under Rural Electrification.
It can be observed that the power sector in the state has been self-sufficient, on account of
higher revenue generated by the power sector compared to the revenue expenditure made
on the power sector by the state government.
4.3. ANALYSIS ON STATE GUARANTEES AND SUBSIDIES
The state government guarantees constituted a ~7.61% of the overall state revenue,
towards the loan taken by the DISCOMs in 2011-12. The same has been depicted in the
table below:
The table below depicts the sector guarantees relative to the total revenue of the state.
Table XXI-7: Guarantees as a Percentage of Total Revenues - Orissa
Parameter 2009-10 2010-11 2011-12
Rs Cr
Power Sector Guarantees given by
State Govt. 568 1,815 2,442.45
Total Revenues of the State 20,713 26,470 32,114.82
Guarantees as a %age of Total
Revenues of State 2.74% 6.86% 7.61%
Source: Audited CAG for the state: 2011-12, 2010-11, 2009-10
In 2011-12, the majority share of the guarantee (~92%) towards power sector is pledged
towards the loan taken by the state trading company, GRIDCO.
The table below depicts the three year average share of different utilities in sector
guarantees:

AF-MERCADOS EMI
Power Sector Operations and Impact on State Finances – Volume II 307
Table XXI-8: Guarantees Utility wise Breakup - Orissa
Particular 2009-10 2010-11 2011-12
Average
Share in
state
Guarantees
(%)
RS Cr
GRIDCO 151 1,498 2,239.79 81%
OPTCL 301 217 122.33 13%
OPGCL 9 2 0 0%
OHPC 107 97 80.33 6%
Source: Audited CAG for the state: 2011-12, 2010-11, 2009-10
The Guarantees to the power sector has primarily risen due to increase in Guarantees
towards GRIDCO. Over the span of three years, GRIDCO accounted for a major share of
81%.
The power sector in the state has booked no subsidy from the state government over the
years.
4.4. POWER BONDS
The outstanding amount of 8.5% Tax Free Special Bonds of the State Government (Power
Bonds) issued by State Government, as on 1st April 2005, was Rs 1102.40 Cr, to be
redeemed by 2016. The balance outstanding as on 31st March 2012 was Rs 441.15 Cr. The
details regarding the year of issue and redemption of bonds have not been mentioned in
the available CAG accounts. As per RBI ‘State Finance Report’ 2014, the outstanding
liability of Power Bonds in the state as on 31st March 2014 was Rs 220 Cr.
4.5. POWER SECTOR FINANCING REQUIREMENT RELATIVE TO STATE’S ECONOMY
In this section, the expenditure (under all possible heads) on the power sector by the state
government has been listed to determine the state Power sector financing requirement
which is then compared to state finances.
The sector financing requirement is estimated as the summation of total expenditure of the
state government on the sector including Capital and Revenue Expenditure, Loans and
Advances (Net Of Recoveries) and Public Debt repaid (Net of Receipts) by the State
Government.
Table XXI-9: Power Sector Financing Requirement (2011-12) - Orissa
Particulars
2011-12
Rs Cr
Power Sector Expenditure (Capital and Revenue) 204.80

AF-MERCADOS EMI
Power Sector Operations and Impact on State Finances – Volume II 308
Particulars
2011-12
Rs Cr
Loans And Advances made by the State Government (Net of
Recoveries) 207.70
8.5% Tax Free Special Bonds of the State Government (Power
Bonds) disbursed during the year (Net of Receipts) 110.28
Loans for Power Projects-T&D from the Central Govt. Discharged
during the year (Net of Receipts) 7.42
Total Power Sector Financing during the year 530.19
Sector Financing Requirement as a % age of total revenues of state 2%
GSDP nominal 130669.00
Sector Financing Requirement as a % age of GSDP 0.41%
Financial Profit /(Losses) of Discoms during the year
(with subsidy realised) (423)
Sector Financing Requirement (including financial losses of Discoms )
as a % age of total revenues of state 3%
Sector Financing Requirement (including financial losses of Discoms )
as a % age of GSDP 0.73%
Source: State Government annual accounts from CAG, Data book for DCH - 22nd April, 2013, PFC
Report on Utility finances – 2011-12
The financing requirement for the Power sector in the state was estimated at 2% of the
revenue generated by the state and 0.41% of the Gross State Domestic Product. Further,
the losses reported by the DISCOMs have increased the financing requirement of the sector
to 3%o of the total revenue in the state and 0.73% of the state GSDP.
However, it is observed the power sector in Orissa is self-sufficient and is able to generate
sufficient revenues for the state government, but the financial losses reported in the state
can critically impact the financial health of the state finances in future.

AF-MERCADOS EMI
Power Sector Operations and Impact on State Finances – Volume II 309
5. REGULATORY EFFECTIVENESS
5.1. BUDGETING
The state regulatory commission, OERC, is self-sufficient in its operations. The primary
source of income is license and petition fees from licensees, IPPs, open access consumers,
etc, on submission of petitions, review of order, renewal of annual license, etc. The state
reported a surplus of Rs. 3.24 Cr in the year FY 1220, which was invested towards deposit
payments in banks.
5.2. STAFFING
The staff of the commission is appointed through direct recruitment, contract or deputation
basis. Further, the staffing is divided into technical and non-technical staff. In 2011-12,
43% of the position in the commission was towards the technical staff.
The figure below presents the organization chart of the state regulatory commission
Figure XXI-9: Organizational Structure - OERC
Source: OERC
Another important aspect that needs to be considered is that the staff especially the
technical staff is on deputation or contract basis. Deputation is generally done from another
government department or from the utility itself, which again limits the true independence
of the staff of SERC’s.
20 Annual Report OERC – 2011-12.

AF-MERCADOS EMI
Power Sector Operations and Impact on State Finances – Volume II 310
5.3. MYT REGULATION
The MYT has been implemented for the third control period. The commission had selected a
control period of three years for the first MYT. Subsequently, for the next two MYTs a
control period of five years was selected. Although, the impact of the MYTs to improve the
date regime was not substantial as the state continues to report high levels of AT&C loss
levels.
5.4. TARIFF REVISION
The state DISCOMs had no tariff increase from FY 06 to FY 10. The tariff increased
significantly from FY 11 to FY 14. The inefficient tariff setting mechanism was one of the
major reasons for high level of transmission and distribution losses. The table below
depicts the historical trend in tariff revisions in the state of Orissa.
Table XXI-10: Historical Trend in Tariff Revisions - Orissa
FY
06
FY
07
FY
08
FY
09
FY
10
FY
11
FY
12
FY
13
FY
14
Average
Tariff
Revisions
0% 0% 0% 0% 0% 22% 20% 36% 9%
Source: Approved Tariff Orders of the State DISCOMs for that year
5.5. LEVEL OF METERING
The commission has reviewed the status of metering of 33/11 KV feeders, distribution
transformers and consumers at the end of every two months. The progress as reported by
DISCOMs are as under, as on September 2010:
Table XXI-11: Level of Metering across the DISCOMs (as on Sept. 2010) - Orissa
Feeder Metering Position CESU NESC
O
WESC
O
SOUTHC
O Total
No. of No of 33 KV feeders 111 64 88 159 422
No of 33 KV feeder metering 111 63 88 159 421
No of 33 KV feeder metering left 0 1 0 0 1
No. of No of 11 KV feeders 609 428 484 425 1946
No of 11 KV feeder metering 609 86 469 425 1589
No of 11 KV feeder metering left 0 342 15 0 357
No of 33/11 KV transformers 347 266 262 221 1096
No of 33/11 KV transformers metering 81 0 0 30 111
No of 33/11 KV transformers left 266 266 262 191 985
No of distribution transformers 22984 25709 19475 15336 83504
No of distribution transformers metering 8832 569 12558 9236 31195
Consumer Metering Position
Total number of consumers 121512
8
67030
6 587707 659819
313296
0
Total number of meters 117936
3
62213
7 577680 653347
303252
7
Total number of working meters 106909
4
47029
5 532016 592225
266363
0
Percentage of metered consumers 88% 70% 91% 90% 85%

AF-MERCADOS EMI
Power Sector Operations and Impact on State Finances – Volume II 311
(working)
Source: Tariff Order 2011-12
5.6. OPEN ACCESS
Orissa State Load Despatch Center has been mandated with dealing of open access
function in the state. Open access has started only a few years ago in the State, but has
been well accepted by the players, essentially by the captive consumers. In year 2009-10,
total of 314 captive consumers filed applications for Inter State Transmission System.
In 2011-12, the commission approved application for 104 numbers of applications and
rejecting 23 applications. Further two intra-state open access was application was accepted
by state commission.

AF-MERCADOS EMI
Power Sector Operations and Impact on State Finances – Volume II 312
6. SUMMARY
1. Privatization of the distribution utilities: Orissa was the first state to embark
upon the process of privatization of the state distribution companies. However, the
reform was not accompanied by a multi-pronged strategy to reinforce all the pillars
on which a successful distribution sector can be created. Additionally, due to lack of
accurate baseline data, right from the beginning the DISCOMs incurred huge losses.
2. AT&C Losses: The DISCOMs have continued to register high levels of AT&C losses in
the state. The demand collection in the DISCOMs is a major challenge for all the
distribution companies in the state. The state needs to implement robust IT
mechanism for efficient demand collection. Further, the collection efficiency in the
state also needs to be improved.
3. Limited Financial Gap: The revenue gap has increased in recent years, on account
of high levels of AT&C losses and increasing power purchase costs even though, the
tariff increase is regular and substantial. This indicates that the financial burden of
the AT&C losses is borne by the consumers in the state.
4. Regulatory Effectiveness: Although, the state regulator commission in the state
are self-sufficient to carry out its operations, the gaps in the implementation of the
policy reforms persists, with the distribution utilities continue to be ineffective in
improving the data regime in the state.
As stated earlier, Orissa was unable to implement the reforms successfully, due to
inefficient implementation of the policy reforms by the distribution utilities. Further, on the
generation side the state is well endowed with natural resources with significant hydro
capacity as well as strong mineral base including that of coal to support its thermal plant.
The power sector in the state pose a low risk to the state finances, although the
pertaining high levels of losses in the state.

AF-MERCADOS EMI
Power Sector Operations and Impact on State Finances – Volume II 313
XXII PUNJAB
1. INTRODUCTION
1.1. BACKGROUND – POWER SECTOR OVERVIEW
Punjab a northern state of the country, where the energy demand has registered a steady
CAGR of 5.68% on account of industrialization and steady improvement in standards of
living over the last decades. Further, the state was one of th
Prior to unbundling Punjab State Electricity Board (PSEB) functioned as a vertically
integrated utility. The utility operation was unbundled in 16.4.2010 notification of
Government of Punjab notification unbundled PSEB into two companies, viz. Punjab State
Power Corporation Ltd. (POWERCOM) and Punjab State Transmission Corporation Ltd
(TRANSCO).
1.2. GENERATION MIX
The total installed capacity February 2014 (including allocated share in Joint & Central
Sector plants) for Punjab was 8,332 MW out of which Coal based power capacity
accounted for ~54% followed by Hydro (~37% ). RE and gas based capacity accounted for
a share of ~4% and ~3% respectively.
Figure below presents the generation capacity including allocated share in Joint & Central
sector plants.
Figure XXII-1: Generation Capacity Mix - Punjab
54%
3%2%
37%
4%
Generation Capacity (incl. allocated share from Joint & Central Sector)
Coal Gas Nuclear Hydro Renewable
Source: CEA
1.3. POWER SUPPLY POSITION
Punjab has been witnessing consistent power supply shortage. Although, the energy deficit
has decreased from 14% in FY 2009-10 to 2% in FY 2013-14, the peak deficit has
continued to remain high ~13% in 2013-14. The peak deficit increased substantially in FY
2011-12 to 21% and 30% in FY 2012-13 as compared to 16% in FY 2010-11.

AF-MERCADOS EMI
Power Sector Operations and Impact on State Finances – Volume II 314
Although, the state has been able to reduce the energy deficit through significant capacity
addition from independent power producers in the state, the higher levels of peak deficit in
the state are due to declining share of Bhakra Beas Management Board (BBMB), which
continues to serve the base demand of the state.
The trend of energy deficit observed in Punjab over the years is presented in the figure
below:
Figure XXII-2: Historical Trend in Energy Deficit - Punjab
9%10%
9%
11%
14%
6%
3%
5%
2%
0%
2%
4%
6%
8%
10%
12%
14%
16%
0
10000
20000
30000
40000
50000
60000
MU
Energy Deficit
Energy Required (MU) Energy Available (MU) Energy Deficit
Source: CEA
The trend of peak deficit observed in Punjab over the years is presented in the figure
below:
Figure XXII-3: Historical Trend in Peak Demand and Peak Met - Punjab
20%
27%
15% 16%
24%
16% 17%
24%
13%
0%
5%
10%
15%
20%
25%
30%
0
5,000
10,000
15,000
MW
Peak Deficit
Energy Required (MW) Energy Avail (MW) Deficit (%)
Source: CEA
Further, the peak deficit levels in the state are expected to reduce further in short to
medium term, on account of huge stranded capacity and low prevalent prices in the short
term market. The figure below presents the average daily short-term prices prevalent in
IEX in FY 14.

AF-MERCADOS EMI
Power Sector Operations and Impact on State Finances – Volume II 315
Figure XXII-4: Average Daily Short Term Prices IEX – N3 Region (2013-14)
0.00
2.00
4.00
6.00
8.00
10.00
12.00
1/4/
2013
17-0
4-20
13
3/5/
2013
19-0
5-20
13
4/6/
2013
20-0
6-20
13
6/7/
2013
22-0
7-20
13
7/8/
2013
23-0
8-20
13
8/9/
2013
24-0
9-20
13
10/1
0/20
13
26-1
0-20
13
11/1
1/20
13
27-1
1-20
13
13-1
2-20
13
29-1
2-20
13
14-0
1-20
14
30-0
1-20
14
15-0
2-20
14
3/3/
2014
19-0
3-20
14
Average Daily Day Ahead Market Price - N3
Maximum Price - Rs. 10.91 per kWh
Average Price - Rs. 3.01 per kWh
Minimum Price - Rs. 0.00 per kWh
Source: IEX

AF-MERCADOS EMI
Power Sector Operations and Impact on State Finances – Volume II 316
2. ASSESSMENT OF OPERATIONAL PARAMETERS OF
DISTRIBUTION UTILITIES
2.1. CONSUMER SALES MIX OF PUNJAB
The state of Punjab was one of the last utilities to unbundle its operations. Prior to FY 11,
the distribution activities were carried out by the bundled PSEB. After the unbundling the
distribution activity in the state is carried out by Punjab State Power Corporation Ltd.
(POWERCOM).
In 2011-12, share of agriculture sales dominated the sales mix with ~29%, followed by
industrial - HT (25%) , domestic (23%) and commercial category (8%).
The share of agricultural and commercial sales have increased over the years while the
share of industrial sales have decreased over the years. The share of agricultural and
commercial sales have increased from 28% and 6% in 2004-05 to 29% and 9% in 2011-
12. The industrial sales have decreased from 38% in 2004-05 to 32% in 2011-12.
The historical trend of consumer sales mix for the state is given in figure below:-
Figure XXII-5: Historical Trend in Consumer Mix – Punjab
0%
20%
40%
60%
80%
100%
2004-05 2005-06 2006-07 2007-08 2008-09 2009-10 2010-11 2011-12
Perc
enta
ge
Years
Domestic Agriculture Commercial Industrial - HT Industrial - LT others
Source: PFC
The overall sales have registered a CAGR of 6% over the span of seven years wherein the
sales of commercial category have registered a higher CAGR of 12.1% followed by the
domestic and agriculture categories with a CAGR of 8% and 7%.
In terms of revenue contribution, industries contributed for ~50% of revenue, followed by
domestic and commercial categories with a share of 30% and 14%, respectively, while
agriculture contributed 0% of the revenue. This clearly indicates that domestic and
agriculture categories are completely cross subsidized by the industrial and commercial
categories. Further, the sales to the agriculture consumers are completely subsidized by
the state government.
The figure below compares the sales mix of FY 2011-12 and the revenue realized from the
different category of consumers.

AF-MERCADOS EMI
Power Sector Operations and Impact on State Finances – Volume II 317
Figure XXII-6: Comparative Analysis of Consumer Sales and Revenue Mix (w/o
subsidy) 2011-12 - Punjab
Domestic 30%
Agriculture0%
Commercial 14%
Industrial - HT 38%
Industrial - LT 12%
others 6%
Category wise Revenue in 2011-12
Domestic 25%
Agriculture29%
Commercial 8%
Industrial - HT 25%
Industrial - LT 7%
others 6%
Category wise Sales - 2011-12
Source: PFC
2.2. TRENDS IN COMMERCIAL AND TECHNICAL LOSSES
The Aggregated Technical & Commercial losses (AT&C) for Punjab distribution utility has
historically remained on a lower side compared to the national average.
The loss level reported by the distribution utilities of Punjab is in the range of 19% - 24%.
This, however, is based on the estimated consumption in the agricultural sector (in absence
of agriculture metering in the state). The trend observed over the years in collection
efficiency has been on a higher side.
The table below illustrates the year on year trend on commercial losses and collection
efficiency of the state DISCOMs.
Table XXII-1: Historical Trend in AT&C losses and Collection Efficiency - Punjab
Year FY 05 FY 06 FY 07 FY 08 FY 09 FY 10 FY 11 FY
12
AT&C Losses (%) 24% 23% 22% 19% 19% 18% 20% 21%
Collection Efficiency (%) 100% 98% 98% 100% 98% 99% 98% 95%
Source: PFC
Further, losses have also reduced due to the investment undertaken in the development of
HT lines over the years. HT/LT ratio has improved significantly over the years, HT/LT ratio
improved from 0.72 in 2005-06 to 1.01 in 2009-10.
2.3. TRENDS IN DISTRIBUTION COSTS
Power purchase cost accounts for majority of distribution cost. The power purchase cost
accounts for ~60% of the total distribution cost, which is one of the lowest in the country,
due to high levels hydro generation (~37%) in the generation mix.
The per unit cost break-up for different cost components for the state of Punjab is provided
in the table below:-

AF-MERCADOS EMI
Power Sector Operations and Impact on State Finances – Volume II 318
Table XXII-2: Historical Trend in Distribution Cost Breakup - Punjab
Cost Component
(Rs per kWh) FY 05 FY 06 FY 07 FY 08 FY 09 FY 10 FY 11 FY 12
Power Purchase Cost21 1.48 1.54 2.00 2.26 2.32 2.14 2.36 2.33
O&M (R&M + A&G + EC) 0.58 0.60 0.61 0.63 0.72 0.76 0.88 0.99
Interest 0.32 0.30 0.26 0.23 0.33 0.34 0.42 0.52
Depreciation 0.19 0.18 0.18 0.18 0.19 0.21 0.18 0.17
Source: PFC
The power purchase cost in the state has increased significantly, on account of increased
power procurement from the independent power producers to meet the increased demand
for power. Further, the variability in the availability of power from hydro generation plants
(especially BBMB) impacts the power purchase cost in the state.
The interest liable to the financial institution has increased significantly from FY 09, on
account of increased capital investments towards sub-transmission networks in the state.
The trend in debt undertaken by the state utility on capital expenditure is depicted below:
Figure XXII-7: Historical Trend in Debt taken by state utility - Punjab
8,586 8,595 9,936
8,887
11,285
13,246
15,816 17,336
0
2,000
4,000
6,000
8,000
10,000
12,000
14,000
16,000
18,000
20,000
2004-05 2005-06 2006-07 2007-08 2008-09 2009-10 2010-11 2011-12
Loans From FI's State Govt Total Debt
Source: PFC
2.4. REVENUE REALIZATION
Tariff realization from different consumer category has not increased commensurate to
increase in power purchase cost. Although, the tariff hikes in the state have been regular
(except in FY 08), the level of hike has not reflected the increasing cost to serve in the
state.
The table below shows the revenue realization (without subsidy) from different consumer
categories over the years.
21 Inclusive of fuel, generation and other costs

AF-MERCADOS EMI
Power Sector Operations and Impact on State Finances – Volume II 319
Table XXII-3: Historical Trend in Consumer wise Average Revenue Realization
(w/o subsidy) - Punjab
Years 2004-
05 2005-06 2006-07
2007-
08
2008-
09 2009-10 2010-11 2011-12
Domestic 2.59 2.83 2.74 2.53 2.68 2.93 3.20 3.85
Agriculture 0.61 0.28 0.03 0.02 0.00 0.00 0.41 0.00
Commercial 4.24 4.51 4.47 4.31 4.58 4.93 5.13 5.23
Industrial
HT 3.56 3.72 3.71 3.68 3.93 4.30 3.96 4.77
Industrial
LT 3.39 3.73 3.73 3.68 3.97 4.32 4.81 5.68
Source: PFC
Agricultural sector is being heavily subsidised by the state government and the share of the
state government subsidies accounts for ~26% of the total revenues. The increasing sale
to the agriculture consumers has further increased the subsidy burden of the state.
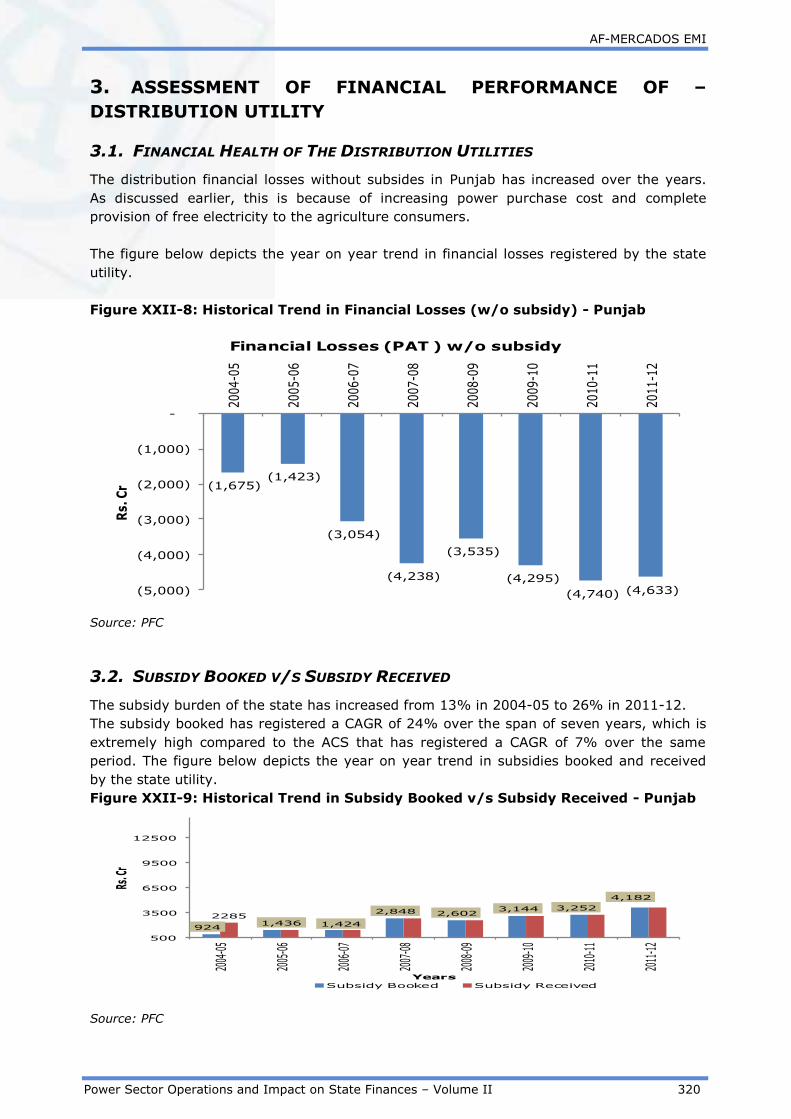
AF-MERCADOS EMI
Power Sector Operations and Impact on State Finances – Volume II 320
3. ASSESSMENT OF FINANCIAL PERFORMANCE OF –
DISTRIBUTION UTILITY
3.1. FINANCIAL HEALTH OF THE DISTRIBUTION UTILITIES
The distribution financial losses without subsides in Punjab has increased over the years.
As discussed earlier, this is because of increasing power purchase cost and complete
provision of free electricity to the agriculture consumers.
The figure below depicts the year on year trend in financial losses registered by the state
utility.
Figure XXII-8: Historical Trend in Financial Losses (w/o subsidy) - Punjab
(1,675)(1,423)
(3,054)
(4,238)
(3,535)
(4,295)
(4,740) (4,633)(5,000)
(4,000)
(3,000)
(2,000)
(1,000)
-
2004
-05
2005
-06
2006
-07
2007
-08
2008
-09
2009
-10
2010
-11
2011
-12
Rs.
Cr
Financial Losses (PAT ) w/o subsidy
Source: PFC
3.2. SUBSIDY BOOKED V/S SUBSIDY RECEIVED
The subsidy burden of the state has increased from 13% in 2004-05 to 26% in 2011-12.
The subsidy booked has registered a CAGR of 24% over the span of seven years, which is
extremely high compared to the ACS that has registered a CAGR of 7% over the same
period. The figure below depicts the year on year trend in subsidies booked and received
by the state utility.
Figure XXII-9: Historical Trend in Subsidy Booked v/s Subsidy Received - Punjab
9241,436 1,424
2,848 2,6023,144 3,252
4,182
2285
500
3500
6500
9500
12500
2004
-05
2005
-06
2006
-07
2007
-08
2008
-09
2009
-10
2010
-11
2011
-12
Rs. C
r
Years
Subsidy Booked Subsidy Received
Source: PFC

AF-MERCADOS EMI
Power Sector Operations and Impact on State Finances – Volume II 321
As shown in the figure above, the amount of subsidies booked by the state has increased
significantly from FY 05 to FY 12, on account of agricultural categories and certain domestic
categories. It can be observed from the above figure, that in all the years, amount of
subsidy realised was equal to the amount of subsidy booked (except in FY 05).
3.3. ACS V/S ARR
The gap between average cost of supply and average revenue realized (with subsidy) has
remained high over the years. This is primarily due to inaccurate demand estimation for
the unmetered agriculture sales in the state.
The figure below depicts the trend in revenue gap on per unit sale of electricity to the
consumers.
Figure XXII-10: Historical Trend in ACS v/s ARR (with subsidy) - Punjab
0.24-0.01
0.48 0.37 0.26 0.30 0.390.11
2.57 2.63
3.053.29
3.563.44
3.844.01
2.33
2.63 2.57
2.92
3.303.15
3.45
3.90
-0.50
0.00
0.50
1.00
1.50
2.00
2.50
3.00
3.50
4.00
4.50
2004-05 2005-06 2006-07 2007-08 2008-09 2009-10 2010-11 2011-12
Rs./k
Wh
Years
Gap(with subsidy) ACS ARR (with subsidy)
Source: PFC

AF-MERCADOS EMI
Power Sector Operations and Impact on State Finances – Volume II 322
4. STATE EXPOSURE TO POWER SECTOR
4.1. INCOME FROM POWER SECTOR
The source of tax revenue is the electricity distribution tax, paid to the state government
by the distribution utilities. The tax revenue from the power sector formed ~4% of the
total tax revenues of the state in 2011-12. The details for the same are provided in the
table below:
Table XXII-4: Tax Revenue from Power Sector - Punjab
Revenue 2009-10 2010-11 2011-12
Rs Cr
Tax Revenue From Power Sector 928 928 928.28
Total Tax Revenue 14,184 19,879 22,395.31
Power sector Tax Revenue /
Total state Tax Revenue 6.54% 4.67% 4%
Source: Audited CAG Accounts of the state: 2011-12, 2010-11, 2009-10
The tax revenue from power sector has remained constant since 2009-10, however, the
contribution in total state tax revenue has declined from 6.5% in FY10 to 4% in FY12.
The power sector did not contribute to the non-tax revenue in 2011-12
Hence the overall income generated from power sector has remained constant at Rs 928 Cr
over the years.
4.2. EXPENDITURE ON POWER SECTOR
The table below depicts the expenditure towards power sector in the state of Punjab.
Table XXII-5: Expenditure on Power Sector - Punjab
Categories 2009-10 2010-11 2011-12
Rs Cr
Capital expenditure 24 0 0
Revenue Expenditure 2,875 3,376 3,201
Total Expenditure 2,899 3,376 3,201
Source: PFC & Audited CAG Accounts of the state: 2011-12, 2010-11, 2009-10
As evident, the share of capital expenditure in the total expenditure towards the sector has
been minimal. The revenue expenditure incurred on power sector has increased from the
FY10 level, primarily on account of increase in other expenditure.

AF-MERCADOS EMI
Power Sector Operations and Impact on State Finances – Volume II 323
It can be observed that the power sector in the state has not been self-sufficient over the
years, on account of revenue expenditure being significantly higher than the power sector
revenue of the state.
4.3. ANALYSIS ON STATE GUARANTEES AND SUBSIDIES
The state government guarantees constituted a substantial ~36.72% of the overall state
revenue, towards the loan taken by the state DISCOMs. The same has been depicted in the
table below:
Table XXII-6: Guarantees as a Percentage of Total Revenues - Punjab
Parameter 2009-10 2010-11 2011-12
Rs Cr
Guarantees given by State Govt. 9,146 9,732 8,735.97
Total Revenues of the State 19,836 25,209 23,793.77
Guarantees as a %age of Total
Revenues of State 46.11% 38.61% 36.72%
Source: Audited CAG Accounts of the state: 2011-12, 2010-11, 2009-10
As shown above, there has been a decrease in guarantees towards power sector since FY10
along with the decrease in proportion of the power sector guarantees in state revenues i.e.
from 46% in FY10 to 36.72% in FY12.
The majority share of the guarantee (~92%) towards power sector is pledged towards the
loan taken by the state POWERCOM Company, PSPCL.
The table below depicts the share distribution of the guarantees provided by the state
government between the utilities.
Table XXII-7: Breakup of Utility wise Guarantee - Punjab
Utility 2009-10 2010-11 2011-12
Average
Share in
State
Guarantee
s (%)
Rs Cr
Punjab State Power Corporation
Limited 9,146 9,732 8,585.97 99%
Punjab State Transmission
Corporation Limited 9,146 9,732 150.00 1%
Source: Audited CAG Accounts of the state: 2011-12, 2010-11, 2009-10
As shown in the table above, almost entire share of the state guarantees have been
directed towards the state DISCOM

AF-MERCADOS EMI
Power Sector Operations and Impact on State Finances – Volume II 324
Table XXII-8: Power Sector Subsidy as a Percentage of overall subsidies - Punjab
Utility 2009-10 2010-11 2011-12
Average
Share in
Sector
Subsidy
(%)
Rs Cr
PSPCL 2,874 3,376 4,182.00 100%
Power Sector subsidy/ Total
Subsidy 2,874 3,376 4,182.83 98%
Source: PFC & Audited CAG Accounts of the state: 2011-12, 2010-11, 2009-10
Since FY10, the power sector has received almost cent percent of the overall subsidy given
by the state government
4.4. POWER BONDS
The outstanding balance of 8.50% Punjab Govt. Power Bonds at the close of 2005-06 was
Rs. 63.73 Cr. A sum of Rs 254.94 Cr remained outstanding at the close of 2011-12. The
details related to year of issue and redemption was not mentioned in the available CAG
state accounts. As per RBI ‘State Finance Report’ 2014, the outstanding liability of Power
Bonds in the state as on 31st March 2014 was Rs 130 Cr.
4.5. POWER SECTOR FINANCING REQUIREMENT RELATIVE TO STATE’S ECONOMY
In this section, the expenditure (under all possible heads) on the power sector by the state
government has been listed to determine the state Power sector financing requirement
which is then compared to state finances.
The sector financing requirement is estimated as the summation of total expenditure of the
state government on the sector including Capital and Revenue Expenditure, Loans and
Advances (Net Of Recoveries) and Public Debt repaid (Net of Receipts) by the State
Government.
Table XXII-9: Power Sector Financing Requirement (2011-12) - Punjab
Particulars
2011-12
Rs. Cr
Power Sector Expenditure (Capital and Revenue) 3200.90
Loans And Advances made by the State Government 0
8.5% Tax Free Special Bonds of the State Government (Power Bonds)
disbursed during the year 63.73
Loans for Power Projects-T&D from the Central Govt. Discharged
during the year 0
Total Power Sector Financing during the year 3264.63
Sector Financing Requirement as a % age of total revenues of state 14%
GSDP nominal 156454.00
Sector Financing Requirement as a % age of GSDP 2.09%
Financial Profit/(Losses) of Discoms during the year (with Subsidy
Realised) (451.00)

AF-MERCADOS EMI
Power Sector Operations and Impact on State Finances – Volume II 325
Particulars
2011-12
Rs. Cr
Sector Financing Requirement (including financial losses of Discoms )
as a % age of total revenues of state 16%
Sector Financing Requirement (including financial losses of Discoms )
as a % age of GSDP 2.37%
Source: State Government annual accounts from CAG, Data book for DCH - 22nd April, 2013, PFC
Report on Utility finances – 2011-12
The financing requirement for the Power sector in the state was estimated at 14% of the
revenue generated by the state and 2.09% of the Gross State Domestic Product. Further,
the financial loss (with subsidy realized) increased the financing requirement of the sector
to ~16.00% of the state revenue and ~2.37% of the state GSDP.
However, it is observed the power sector in Punjab is highly dependent on the state
government subsidy to control the over bearing losses registered. Further, the revenue
generated by the state DISCOM is ~30% of the revenue expenditure by the state.

AF-MERCADOS EMI
Power Sector Operations and Impact on State Finances – Volume II 326
5. REGULATORY EFFECTIVENESS
At the time of unbundling in April 2010, the Government of Punjab had assured a financial
restructuring plan to improve the fiscal health of cash-strapped state power sector and the
interests of the entire staff would be taken care of. However, almost two years down the
line, the government has failed to bail out the Power Corporation from the debt-trap. Apart
from this, many of the promises made by the State government during the unbundling
remain unfulfilled.
The impact of the restructuring exercise is yet to be seen and it would be very premature
to judge the implications at this stage. At the present Stage finalization of the FRP and
establishment of appropriate accounting and governance policies and processes appear to
be the top priority items for the State/ Restructured entities.
Punjab State Electricity Regulatory Commission (PSERC) was setup in 1999 by Government
of Punjab under section 17 of the Electricity Regulatory Commission Act 1998 as a
statutory independent regulatory authority in the electricity sector.
Key Regulations for the State of Punjab is summarized below:
5.1. BUDGETING
The latest income-expenditure statement of the state regulatory commission is not
available in public domain.
5.2. STAFFING
The total number of positions available with the commission is 93, with 28 technical and 65
non-technical posts. The figure presents the prevalent organization structure of the state
regulatory commission

AF-MERCADOS EMI
Power Sector Operations and Impact on State Finances – Volume II 327
Figure XXII-11: Organization Chart - Punjab
Source: PSERC
The state commission has one of the highest staffing requirements across the state
regulatory commissions. Further, the state commission has no reported vacancies.
5.3. MYT REGULATION
The MYT regulation in the state has not been implemented in the state. In the absence of
audited figures, PSERC is not in a position to fix the base line values for various financial
and technical parameters, which are required for determining the tariff under MYT
Regulations.
5.4. TARIFF REVISION
The tariff revision in the state of Punjab has been regular on an annual basis. The regular
tariff revision indicates an efficient practice by the state utility and commission. However,
the tariff for the agriculture segment has not been revised by the state DISCOM.
The table below depicts the historical trend in tariff revision in Punjab
Table XXII-10: Historical Trend in Tariff Revisions - Punjab
FY
05
FY
06
FY
07
FY
08
FY
09
FY
10
FY
11
FY
12
FY
13
FY
14
Average
Tariff
Revisions
0% 11% 0% 5 % 2% 11% 7% 9% 12% 9%
Source: Approved Tariff Order of the state DISCOMs for that year
5.5. LEVEL OF METERING
The state distribution utility has submitted that all connections in the state are metered,
except the agriculture connections. The agriculture connections in the state are completely

AF-MERCADOS EMI
Power Sector Operations and Impact on State Finances – Volume II 328
unmetered. The figure below presents the percentage share of agriculture-unmetered
connection in the state
Figure XXII-12: Historical trend in percentage share of connection - Punjab
16% 17% 17% 18% 18%
0%
10%
20%
30%
40%
50%
60%
70%
80%
90%
100%
2008-09 2009-10 2010-11 2011-12 2012-13
Consumer Category wise connection
General Industrial Agriculture Others
Source: PSPCL
General Categories include: Domestic, Commercial, railway traction etc.
5.5.1. AGRICULTURE METERING
The methodology adopted by the state commission for demand estimation is as follows:
The consumption (in BHP) of agriculture pumps is calculated through installation of
about 10% sample meters and recording of energy pumped through AMR meters
installed at various substations. The impact of level of rainfall in the monsoon
season is also factored to calculate the consumption norm
The consumption is projected for six or eight hours of power supply to the agriculture
pump sets
The state distribution utility has stated difficulty in complete installation of meters to the
tube-well consumers and recording the consumption of all agriculture pump consumers due
to financial aspect, staff shortage aspect and other administrative reasons.
Further, for approval of agriculture sales, the commission allows a 5% growth over the
demand submitted in the review order by the state utility.
5.6. OPEN ACCESS
Punjab State Load Despatch Center has been mandated with dealing of open access
function in the state. PSERC has notified the Open Access Regulation, 2005 on August 9,
2005.
SLDC has further streamlined and strengthened the Open Access process by developing
procedures and formats for application, introducing IT in various activities such as UI data

AF-MERCADOS EMI
Power Sector Operations and Impact on State Finances – Volume II 329
processing and web based application handling cum information system, to make the
process transparent and consumer friendly.
The table below depicts the growth in Open Access Consumers and revenues in FY 12
compared to FY 11.
Table XXII-11: Growth in Open Access Consumers and Revenue from Open Access
Consumers
Year Consumers Power
(MW)
Transmission
Charges (Rs.
Cr.)
Wheeling
Charges (Rs.
Cr)
Misc.
Charges
(Rs. Cr.)
2010-
11 227 1046.81
5.66 36.28 2.41
2011-
12 336 1416.99
27.81 73.59 3.50
Source: Punjab SLDC Annual Report
Further, BBMB which was supplying electricity on behalf of its partner States as per the
directions/ instructions of the Government of India was allowed to continue to supply on
the existing terms and conditions without the need for paying any surcharge or additional
surcharge. However, it was mandated for the BBMB to supply the requisite details of such
arrangements to the STU and SLDC.
AF-MERCADOS EMI
Power Sector Operations and Impact on State Finances – Volume II 330
6. SUMMARY
1. Subsidy Booked: Free power sale to the agriculture segment has led to significant
rise in subsidies over the years. The trend in increase in subsidies levels can lead to
financial un-sustainability in future. Further, over the span of seven years the
annual growth rate increase in subsidy has far exceeded the annual growth rate in
cost. This indicates increased dependency of the state utility on state finances to
cover its costs.
2. Revenues from the sector to the state: The total revenue from the power sector
is not able to match up with the expenditure made by the state government towards
the power sector. The state revenue from power sector constitutes ~30% of the
expenditure on the power sector by the state government.
3. Financial Losses due to low tariff levels: The financial losses in the state pose a
great challenge to the state utility. The key issue appears to be the inability of the
regulatory commission to increase the tariffs to accommodate the increase in costs
and increase in debt and thus increase in interest cost. Costs have been growing at
a much higher pace than the growth in the revenue. Subsidy support also has
increased over the years and can be attributed to the free supply of electricity to
agricultural consumers in the state.
Overall the state power sector appears to be reeling under inherited issues such
as high levels of financial losses, accumulated debt that indicates a significant
financial restructuring is required to clean up the balance sheet. Further, the
tariff in the state remains unreflective of costs, which has increased the subsidy
burden of the state. Hence, the state power sector poses a significant risk on the
state finances in the future.

AF-MERCADOS EMI
Power Sector Operations and Impact on State Finances – Volume II 331
XXIII RAJASTHAN
1. INTRODUCTION
1.1. BACKGROUND – POWER SECTOR OVERVIEW
The Rajasthan State Electricity Board (RSEB) was unbundled into 5 entities in July 2000 to
form Rajasthan Rajya Vidyut Utpadan Nigam Limited (RRVUNL) (generation company),
Rajasthan Rajya Vidyut Prasaran Nigam Limited (RRVPNL) (transmission company), and
three distribution companies namely Ajmer Vidyut Vitran Nigam Ltd. (AVVNL), Jaipur
Vidyut Vitran Nigam Ltd. (JVVNL) and Jodhpur Vidyut Vitran Nigam Ltd. (JdVVNL).
Figure XXIII-1: Power Sector Structure – Rajasthan
Source: RERC
1.2. GENERATION MIX
The total installed capacity as on February 2014 capacity (including allocated share in Joint
& Central Sector plants) for Rajasthan was 14094.32 MW out of which 54% of the share is
of Coal based generation followed by Renewable based generation (25%) and hydro based
(11%). The capacity has grown from 10840 MW by ~30% from last year due to huge
additions to coal and renewable based generation.
Figure below highlights the generation capacity including allocated share in Joint & Central
sector plants.
Figure XXIII-2: Generation Capacity Mix - Rajasthan
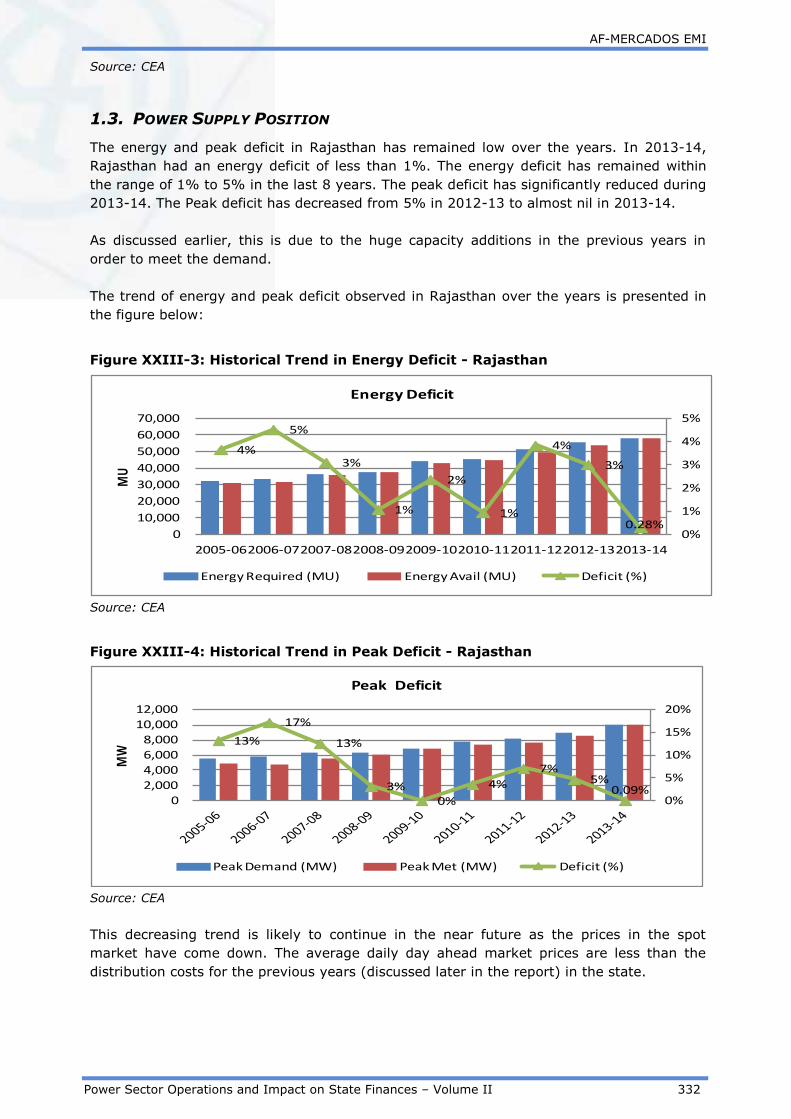
AF-MERCADOS EMI
Power Sector Operations and Impact on State Finances – Volume II 332
Source: CEA
1.3. POWER SUPPLY POSITION
The energy and peak deficit in Rajasthan has remained low over the years. In 2013-14,
Rajasthan had an energy deficit of less than 1%. The energy deficit has remained within
the range of 1% to 5% in the last 8 years. The peak deficit has significantly reduced during
2013-14. The Peak deficit has decreased from 5% in 2012-13 to almost nil in 2013-14.
As discussed earlier, this is due to the huge capacity additions in the previous years in
order to meet the demand.
The trend of energy and peak deficit observed in Rajasthan over the years is presented in
the figure below:
Figure XXIII-3: Historical Trend in Energy Deficit - Rajasthan
4%
5%
3%
1%
2%
1%
4%
3%
0.28%0%
1%
2%
3%
4%
5%
0
10,000
20,000
30,000
40,000
50,000
60,000
70,000
2005-062006-072007-082008-092009-102010-112011-122012-132013-14
MU
Energy Deficit
Energy Required (MU) Energy Avail (MU) Deficit (%)
Source: CEA
Figure XXIII-4: Historical Trend in Peak Deficit - Rajasthan
13%
17%
13%
3%0%
4%
7%5%
0.09%0%
5%
10%
15%
20%
0
2,000
4,000
6,000
8,000
10,000
12,000
MW
Peak Deficit
Peak Demand (MW) Peak Met (MW) Deficit (%)
Source: CEA
This decreasing trend is likely to continue in the near future as the prices in the spot
market have come down. The average daily day ahead market prices are less than the
distribution costs for the previous years (discussed later in the report) in the state.

AF-MERCADOS EMI
Power Sector Operations and Impact on State Finances – Volume II 333
Figure XXIII-5: Average Daily Day Ahead Market Prices N3 – Rajasthan
0.00
2.00
4.00
6.00
8.00
10.00
12.00
04-0
1-13
17-0
4-20
13
05-0
3-13
19-0
5-20
13
06-0
4-13
20-0
6-20
13
07-0
6-13
22-0
7-20
13
08-0
7-13
23-0
8-20
13
09-0
8-13
24-0
9-20
13
10-1
0-13
26-1
0-20
13
11-1
1-13
27-1
1-20
13
13-1
2-20
13
29-1
2-20
13
14-0
1-20
14
30-0
1-20
14
15-0
2-20
14
03-0
3-14
19-0
3-20
14
Average Daily Day Ahead Market Price - N3
Maximum Price - Rs. 10.91 per kWh
Average Price - Rs. 3.01 per kWh
Minimum Price - Rs. 0.00 per kWh
Source: IEX

AF-MERCADOS EMI
Power Sector Operations and Impact on State Finances – Volume II 334
2. ASSESSMENT OF OPERATIONAL PERFORMANCE OF
DISTRIBUTION UTILITIES
2.1. CONSUMER SALES MIX OF RAJASTHAN
AVVNL, JVVNL and JdVVNL are the three State Govt. owned companies, engaged in the
business of distribution and retail supply of electricity in the state of Rajasthan.
AVVNL is engaged in distribution and supply of electricity in 11 districts of Rajasthan,
namely Ajmer, Bhilwara, Nagaur, Sikar, Jhunjhunu, Udaipur, Banswara, Chittorgarh,
Rajsamand, Doongarpur and Pratapgarh. JVVNL is engaged in distribution and supply of
electricity in 12 districts of Rajasthan, namely Jaipur, Dausa, Alwar, Bharatpur, Dholpur,
Kota, Bundi, Baran, Jhalawar, Sawaimadhopur, Tonk and Karauli. JdVVNL is engaged in
distribution and supply of electricity in 10 districts Barmer, Bikaner, Churu, Hanumangarh,
Jaisalmer, Jalore, Jodhpur, Pali, S. Ganganagar, Sirohi.
The historical trend of consumer sales mix for the state is given in figure below:-
Figure XXIII-6: Historical Trend in Consumer Sales Mix - Rajasthan
Source: PFC
The overall sales have registered growth in Rajasthan has grown at a CAGR of 13% over
the span of eight years. Rajasthan electricity sales is dominated by agriculture consumers,
and the share of agriculture has increased from 31% in 2004-05 to 41% 2011-12; in MU
terms the sales have tripled over the last 8 years (CAGR ~17%).
In terms of revenue contribution, industries contributed ~38% of revenue, followed by
domestic and agricultural categories with a share of 22% and 18%, respectively, while
commercial contributed ~10% of the revenue.
It can be seen that despite accounting for highest sales, agriculture contributes just 18% of
the revenue realised. This is due to low tariff rates for agriculture.
The figure below compares the sales mix of FY 2011-12 and the revenue realized from the
different category of consumers.

AF-MERCADOS EMI
Power Sector Operations and Impact on State Finances – Volume II 335
Figure XXIII-7: Comparative Analysis of Consumer Sales and Revenue Mix 2011-
12 – Rajasthan.
Domestic 19%
Agriculture41%
Commercial 6%
Industrial - HT 20%
Industrial - LT 6%
others 8%
Category wise Sales - 2011-12
Domestic 22%
Commercial10%
Agriculture 18%
Industrial - HT 29%
Industrial - LT 9%
Others 12%
Category wise Sales Revenue in 2011-12
Source: PFC
2.2. TRENDS IN COMMERCIAL & TECHNICAL LOSSES
The Aggregated Technical & Commercial (AT&C) losses for Rajasthan distribution utilities
have shown an improving trend, they have decreased from 47% in 2004-05 to 25% in
2011-12. This, however, is based on the estimated consumption in the agricultural sector
(Currently, state’s unmetered (flat) agriculture sale is 8% of total sales). The trend
observed over the years in collection efficiency has been on a higher side.
Table XXIII-1: Historical Trend in AT&C Losses and Collection Efficiency -
Rajasthan
Year FY
05 FY 06 FY 07 FY 08 FY 09 FY 10 FY 11 FY 12
AT&C Losses
(%) 47% 42.2% 35.7% 33% 30% 30% 25% 25%
Collection
Efficiency 96% 97% 98% 98% 96% 95% 97% 94%
Source: PFC
2.3. TRENDS IN DISTRIBUTION COST
The power purchase cost forms the major cost component of distribution in Rajasthan. The
power purchase cost accounts for ~72% of the total distribution cost (FY05 to FY12). These
have increased due to increase in the prices of imported coal. The Interest Cost is gradually
increasing have shown an increasing trend and accounted for ~16% of total distribution
cost in 2011-12.
The per unit cost distribution cost break-up for different cost components for the state of
Rajasthan is provided in the table below:-
Table XXIII-2: Historical Trend in Distribution Costs - Rajasthan
Cost Component
(Rs/KWh)
FY
05
FY
06
FY
07 FY 08 FY 09 FY 10 FY 11 FY 12
Power Purchase Cost 2.06 2.25 2.31 2.82 3.60 3.92 3.46 3.69
O&M (R&M + A&G +
EC) 0.20 0.17 0.18 0.26 0.58 0.66 0.59 0.73
Interest 0.17 0.19 0.23 0.27 0.40 0.63 0.88 1.19

AF-MERCADOS EMI
Power Sector Operations and Impact on State Finances – Volume II 336
Depreciation 0.06 0.10 0.13 0.08 0.11 0.12 0.14 0.15
Other cost 0.03 0.01 0.01 0.02 0.01 -0.07 2.41 1.58
Source: PFC
Rajasthan has booked massive amount of subsidy on its account relative to the amount
actually disbursed by the government during the previous years. The past years’ unpaid
amount has been recognized as “Other Costs” in the books of 2010-11.
2.4. REVENUE REALIZATION
Tariff realization from different consumer category has not increased commensurate to
increasing power purchase cost. No tariff hikes were observed for several years and tariffs
were increased in FY 2011-12 after a gap of 8 years wherein tariffs were hiked
substantially i.e. 24%. In FY 2012-13 & FY 2013-14 the tariffs were further increased by
19% and 14% respectively.
The table below shows the revenue realization (without subsidy) from different consumer
categories over the years.
Table XXIII-3: Historical Trend in Consumer Wise Average Revenue Realization -
Rajasthan
Years 2004-
05 2005-06 2006-07
2007-
08
2008-
09 2009-10 2010-11
2011-
12
Domestic 2.29 2.77 2.68 2.70 2.75 2.66 2.65 3.16
Agriculture 1.14 1.65 1.45 1.36 1.26 1.18 1.17 1.24
Commercial 4.94 4.92 4.89 4.79 4.71 4.62 4.57 4.98
Industrial
HT 3.89 3.83 3.99 4.27 3.69 3.93 3.81 4.17
Industrial
LT 3.78 3.72 3.84 3.75 11.66 3.58 3.50 4.06
Source: PFC
The agriculture sale which forms the major part of the sales has annual revenue realization
for less than Rs 1.25 per kWh. As discussed earlier, only 18% of revenue comes from
agricultural sales. The state’s unmetered (flat) agriculture sale is 8% of total sales.
No incentive is being given to encourage consumers to shift to metered category as in
Rajasthan unmetered tariff is applicable only for a small fraction of agriculture consumers.
No new connections are released under unmetered tariff and Commission has already
issued directions for conversion of these unmetered agriculture consumers to metered
category in a time bound manner.
There is high resistance from flat rate consumers to get converted to metered category.
However, the Commission had directed the Discoms in order dated 06/06/2013, (Petition
No. RERC 356/12, 357/12, 358/12) that the urban flat rate consumers should get
converted into metered category in next 2 months.
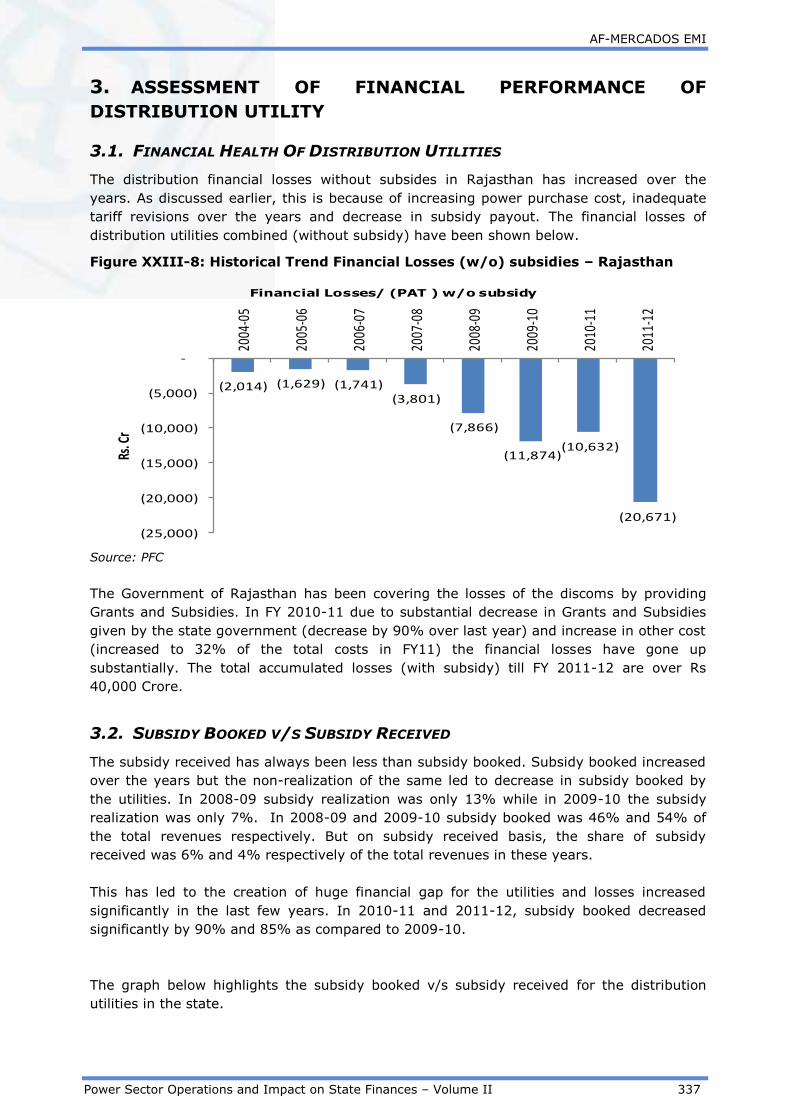
AF-MERCADOS EMI
Power Sector Operations and Impact on State Finances – Volume II 337
3. ASSESSMENT OF FINANCIAL PERFORMANCE OF
DISTRIBUTION UTILITY
3.1. FINANCIAL HEALTH OF DISTRIBUTION UTILITIES
The distribution financial losses without subsides in Rajasthan has increased over the
years. As discussed earlier, this is because of increasing power purchase cost, inadequate
tariff revisions over the years and decrease in subsidy payout. The financial losses of
distribution utilities combined (without subsidy) have been shown below.
Figure XXIII-8: Historical Trend Financial Losses (w/o) subsidies – Rajasthan
(2,014) (1,629) (1,741)(3,801)
(7,866)
(11,874)(10,632)
(20,671)
(25,000)
(20,000)
(15,000)
(10,000)
(5,000)
-
2004
-05
2005
-06
2006
-07
2007
-08
2008
-09
2009
-10
2010
-11
2011
-12
Rs. C
r
Financial Losses/ (PAT ) w/o subsidy
Source: PFC
The Government of Rajasthan has been covering the losses of the discoms by providing
Grants and Subsidies. In FY 2010-11 due to substantial decrease in Grants and Subsidies
given by the state government (decrease by 90% over last year) and increase in other cost
(increased to 32% of the total costs in FY11) the financial losses have gone up
substantially. The total accumulated losses (with subsidy) till FY 2011-12 are over Rs
40,000 Crore.
3.2. SUBSIDY BOOKED V/S SUBSIDY RECEIVED
The subsidy received has always been less than subsidy booked. Subsidy booked increased
over the years but the non-realization of the same led to decrease in subsidy booked by
the utilities. In 2008-09 subsidy realization was only 13% while in 2009-10 the subsidy
realization was only 7%. In 2008-09 and 2009-10 subsidy booked was 46% and 54% of
the total revenues respectively. But on subsidy received basis, the share of subsidy
received was 6% and 4% respectively of the total revenues in these years.
This has led to the creation of huge financial gap for the utilities and losses increased
significantly in the last few years. In 2010-11 and 2011-12, subsidy booked decreased
significantly by 90% and 85% as compared to 2009-10.
The graph below highlights the subsidy booked v/s subsidy received for the distribution
utilities in the state.

AF-MERCADOS EMI
Power Sector Operations and Impact on State Finances – Volume II 338
Figure XXIII-9: Historical Trend Subsides Booked v/s Subsidies Received –
Rajasthan
2082 1,629 1,741
3,636
7,867
11,874
1,201 1,760
1046 1,012 1,143 1,427 1,051 867 1,2001,760
2004
-05
2005
-06
2006
-07
2007
-08
2008
-09
2009
-10
2010
-11
2011
-12
Subsidy Booked Subsidy Received
Source: PFC
The trend in subsidy pay-out with respect to the subsidy booked was 100% from FY 2010-
11 onwards. In 2010-11 and 2011-12, the share of subsidy as a percentage of revenue
was 10% and 12% respectively.
The subsidy received being so much lower than the subsidy booked is a flagrant violation of
the law as per Section 65 of the EA states that "If the State Government requires the
grant of any subsidy to any consumer or class of consumers in the tariff determined by the
State Commission under section 62, the State Government shall, notwithstanding any
direction which may be given under section 108, pay, within in advance in the manner
as may be specified , by the State Commission the amount to compensate the person
affected by the grant of subsidy in the manner the State Commission may direct, as a
condition for the licence or any other person concerned to implement the subsidy provided
for by the State Government".
3.3. ACS V/S ARR
The gap between average cost of supply and average revenue realized (with subsidy) was
nil till 2009-10 primarily due to the huge subsidies booked over the years. However in
2010-11 the subsidies booked decreased significantly leading to creation of gap of ~Rs 4.5
per unit. In 2010-11 there was an increase in the cost of supply and a decrease in the
revenue realized.
In 2011-12, the gap decreased to some extent due to revision in the tariffs after a time
gap of 8 years.
The gap with subsidy between average cost of supply and average revenue realized has
been shown below.

AF-MERCADOS EMI
Power Sector Operations and Impact on State Finances – Volume II 339
Figure XXIII-10: Historical Trend ACS v/s ARR (with subsidy) – Rajasthan
0.00 0.00 0.00 0.05 0.00 0.00
4.72
4.12
2.52 2.72 2.86
3.46
4.70
5.26
7.48 7.33
2.52 2.72 2.86
3.41
4.70
5.26
2.763.21
-1.00
0.00
1.00
2.00
3.00
4.00
5.00
6.00
7.00
8.00
2004-05 2005-06 2006-07 2007-08 2008-09 2009-10 2010-11 2011-12
Rs./
kWh
Years
Gap(with subsidy) ACS ARR (with subsidy)
Source: PFC

AF-MERCADOS EMI
Power Sector Operations and Impact on State Finances – Volume II 340
4. STATE EXPOSURE TO POWER SECTOR
4.1. INCOME FROM POWER SECTOR
The tax income is majorly through electricity distribution tax, which is paid by the
distribution utilities to the state government. The tax revenue from the power sector forms
a marginal ~3% of the total tax revenue.
Table XXIII-4: Tax Revenues - Rajasthan
Revenue 2009-10 2010-11 2011-12
Rs Cr
Tax Revenue from Power Sector 699.9 906 1,094.48
Total Tax Revenue 25,672 33,614 40,354.1
Power sector Tax Revenue / Total
state Tax Revenue 2.73% 2.69% 2.71%
Source: Audited CAG Accounts for the state: 2011-12, 2010-11, 2009-10
The non-tax revenue from power sector is through Royalty/cess on water for power
generation, T n D, Rural Electrification etc. The years the Non Tax revenue from the
sector has been an insignificant proportion of total state Non Tax Revenue.. The details for
the same are provided in the table below.
Table XXIII-5: Non-Tax Revenues - Rajasthan
Revenue 2009-10 2010-11 2011-12
Rs Cr
Non Tax Revenue From Power
Sector* 0.23 - 4.22
Total Non-Tax Revenue 4,558 6,294 9,175.10
Power sector Non-Tax Revenue
/Total state Non-Tax Revenue 0.00% 0.00% 0.05%
*The non-tax revenue from the sector appears as other receipts in CAG State accounts, 2011-12.
Source: Audited CAG Accounts for the state: 2011-12, 2010-11, 2009-10
The overall income generated from power sector has increased from Rs 700 Cr in 2009-10
to Rs 1099 Cr in 2011-12. However, the contribution of Power Sector in overall State
Revenues has been approximately the same (~3%).
4.2. EXPENDITURE ON POWER SECTOR
The table below depicts the expenditure towards power sector by the state of Rajasthan
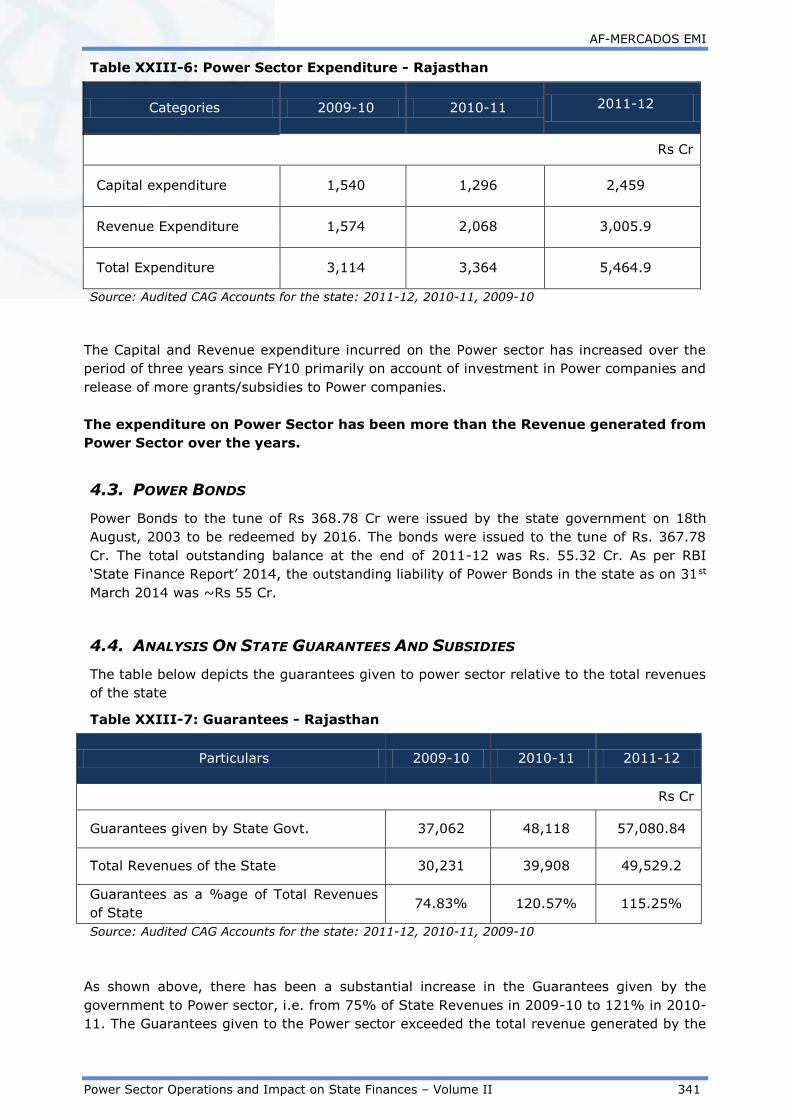
AF-MERCADOS EMI
Power Sector Operations and Impact on State Finances – Volume II 341
Table XXIII-6: Power Sector Expenditure - Rajasthan
Categories 2009-10 2010-11 2011-12
Rs Cr
Capital expenditure 1,540 1,296 2,459
Revenue Expenditure 1,574 2,068 3,005.9
Total Expenditure 3,114 3,364 5,464.9
Source: Audited CAG Accounts for the state: 2011-12, 2010-11, 2009-10
The Capital and Revenue expenditure incurred on the Power sector has increased over the
period of three years since FY10 primarily on account of investment in Power companies and
release of more grants/subsidies to Power companies.
The expenditure on Power Sector has been more than the Revenue generated from
Power Sector over the years.
4.3. POWER BONDS
Power Bonds to the tune of Rs 368.78 Cr were issued by the state government on 18th
August, 2003 to be redeemed by 2016. The bonds were issued to the tune of Rs. 367.78
Cr. The total outstanding balance at the end of 2011-12 was Rs. 55.32 Cr. As per RBI
‘State Finance Report’ 2014, the outstanding liability of Power Bonds in the state as on 31st
March 2014 was ~Rs 55 Cr.
4.4. ANALYSIS ON STATE GUARANTEES AND SUBSIDIES
The table below depicts the guarantees given to power sector relative to the total revenues
of the state
Table XXIII-7: Guarantees - Rajasthan
Particulars 2009-10 2010-11 2011-12
Rs Cr
Guarantees given by State Govt. 37,062 48,118 57,080.84
Total Revenues of the State 30,231 39,908 49,529.2
Guarantees as a %age of Total Revenues
of State 74.83% 120.57% 115.25%
Source: Audited CAG Accounts for the state: 2011-12, 2010-11, 2009-10
As shown above, there has been a substantial increase in the Guarantees given by the
government to Power sector, i.e. from 75% of State Revenues in 2009-10 to 121% in 2010-
11. The Guarantees given to the Power sector exceeded the total revenue generated by the

AF-MERCADOS EMI
Power Sector Operations and Impact on State Finances – Volume II 342
state during the year 2011-12 and 2010-11. The table below depicts the three year
average share of different utilities in sector guarantees:
Table XXIII-8: Share of Guarantees among Utilities - Rajasthan
Utility 2009-10 2010-11 2011-12
Average
Share in
Sector
Guarantee
s (%)
Rs Cr
Rajasthan Rajya Vidyut Prasaran 4,410 5,363 5,964.87 11%
Rajasthan Rajya Vidyut Utpadan 3,447 3,170 3,278.46 7%
Jaipur Vidyut Vitran Nigam Limited 9,619 12,932 15,491.74 27%
Ajmer Vidyut Vitran Nigam Limited 10,746 14,268 17,636.18 30%
Jodhpur Vidyut Vitran Nigam
Limited 4,410 5,363 14,709.59 25%
Source: Audited CAG Accounts for the state: 2011-12, 2010-11, 2009-10
The Guarantees to the power sector has primarily risen due to increase in Guarantees
towards Discoms.
Over the span of three years, Discoms accounted for a share of ~82% in the Power Sector
Guarantees.
Subsidy
The table below depicts the share of utilities in subsidies given to Power sector and share of
sector in total state subsidy:
Table XXIII-9: Subsidy - Rajasthan
Particulars 2009-10 2010-11 2011-12
Average
Share in
Sector
Subsidy %
Rs Cr
Generation 19 19 19 1%
Transmission 41 41 22 2%
Distribution 1,392 1,886 2,760 97%
Power Sector subsidy/ Total
Subsidy 1,452 1,946 2,801 91%

AF-MERCADOS EMI
Power Sector Operations and Impact on State Finances – Volume II 343
Source: Audited CAG Accounts for the state: 2011-12, 2010-11, 2009-10
Over the span of three years, the subsidies to Discoms accounted for 97% of total subsidy
given to the power sector by the state government.
4.5. POWER SECTOR FINANCING REQUIREMENT RELATIVE TO STATE ECONOMY
In this section, the expenditure (under all possible heads) on the power sector by the state
government has been listed to determine the state Power sector financing requirement
which is then compared to state finances.
The sector financing requirement is estimated as the summation of total expenditure of the
state government on the sector including Capital and Revenue Expenditure, Loans and
Advances (Net Of Recoveries) and Public Debt repaid (Net of Receipts) by the State
Government.
Table XXIII-10: Financing Requirement for the Power Sector - Rajasthan
Particulars 2011-12
Rs Cr
Power Sector Expenditure (Capital and Revenue) 5,464.9
Loans And Advances made by the State Government (Net of
Recoveries) (145.31)
8.5% Tax Free Special Bonds of the State Government (Power
Bonds) disbursed during the year ( Net of Receipts)* 16.79
Loans for Power Projects-T&D from the Central Govt. Discharged
during the year ( Net of Receipts) 145.31
Total Power Sector Financing during the year 5,481.69
Sector Financing Requirement as a % age of total revenues of state 11%
GSDP nominal 2,27,824
Sector Financing Requirement as a % age of GSDP 2.41%
Financial Profit/(Loss) of Discoms during the year (with Subsidy
realised) (18,911)
Sector Financing Requirement (including financial losses of Discoms
) as a % age of total revenues of state 49%
Sector Financing Requirement (including financial losses of Discoms
) as a % age of GSDP 10.71%
Source: State Government annual accounts from CAG, Data book for DCH - 22nd April, 2013, PFC
Report on Utility finances – 2011-12

AF-MERCADOS EMI
Power Sector Operations and Impact on State Finances – Volume II 344
The financing requirement for the Power sector in the state was estimated to be 11% of
the Total Revenue generated by the state and 2.41 % of the Gross State Domestic Product.
Considering, the financial losses of Discoms in the year, the financing requirement of the
sector increases to 49% of the State revenue and 10.71 % of the GSDP.

AF-MERCADOS EMI
Power Sector Operations and Impact on State Finances – Volume II 345
5. FINANCIAL RESTRUCTURING PLAN
5.1. STATUS OF FINANCIAL RESTRUCTURING PLAN
Given below is the current status of the financial restructuring plan’s implementation in the
state.
Table XXIII-11: Status of FRP - Rajasthan
Particulars Details
Accumulated Losses as on cutoff
date (23 March 2012) 40942 cr.
STL (eligible under the scheme) 36,038 cr.
Bonds issued by Discoms to
participating lenders 17961 cr.
Tariff petition for 2014-15 ARR filed
Operational losses to be funded
(2013-14) 7647 cr.
Road-Map for private participation in
distribution Road map finalized
Status of liquidation of regulatory
assets
Will start after 2016-
17
Status of preparation of time bound
plan for metering of all category of
consumers
Being Prepared
Status of enactment of State
Electricity Distribution Responsibility
Bill
Under Progress
5.2. FRP OUTLOOK
In this section, key parameters for the state have been looked at in order to comment on
the expected future financial position of the distribution segment after the FRP is fully
implemented in the state. The color scheme used in the tables for each state in this
section, refer to the color key provided here:
Area of concern
Can be better
Good
The three Discoms in Rajasthan reported a combined financial loss (without subsidy) of
Rs.20,671 Cr. in 2011-12, translating into a financial gap of Rs.4.38/kWh. The financial gap
in 2010-11 was Rs 2.4/kWh. The sudden increase in the gap is due to a huge figure of
subsidy receivables being expensed as bad debt in 2011-12.
As per the FRP scheme, the Rajasthan government would take over Rs.17,961 cr. (50% of
STL) by issue of bonds by the Discoms backed by Government guarantee to participating
lenders. The scheme would permit the Discoms to restructure the remaining 50% of STL
backed by government guarantee, with a negotiated moratorium period. The following table
highlights the bond repayment schedule and State Government fiscal impact under FRP.

AF-MERCADOS EMI
Power Sector Operations and Impact on State Finances – Volume II 346
Table XXIII-12: Bonds re-payment Schedule by the State Government and State fiscal
impact – Rajasthan (Rs. Crore)
Particulars Years
FY14 FY15 FY16 FY17 FY18 FY19 FY20
Bonds taken over schedule
3340 4500 5700 4421 - - -
Interest liability (A) - - 1787 1787 1787 1698 1519
Cash support from State Govt. (B)*
- - 3272 3499 3753 4027 4335
Net Repayment liability on bonds taken over by State Govt (C)
- - - - - 1347 1347
Total (A+B+C) 5059 5286 5540 7072 7201
Source: Data submitted by the state to the FFC
* Cash support includes interest-free loans from State Govt., Cash support from State Govt.,
reimbursement of losses, electricity duty retention and interest subsidy on IBRD loan.
Total fiscal impact of the FRP on the State Government finances by the end of FY28 includes
net repayment of bonds/special securities of Rs. 13471 (i.e., gross repayment of bonds of
Rs. 17961 Cr. less capital reimbursement support from Central Government of 25% of
bonds amounting to Rs. 4490 Cr.) and the interest on bonds/special securities amounting to
Rs. 16,892 Cr.
Some of the key parameters relevant to FRP implementation have been shown in the table
below for Rajasthan.
Table XXIII-13: Historical Parameters - Rajasthan
Key Parameters 2005-06 2006-
07
2007-
08
2008-
09
2009-
10
2010-
11
2011-
12
2012-
13
2013-
14
AT&C losses 42% 36% 33% 30% 30% 25% 25% n.a n.a
Tariff Hikes 0% 0% 0% 0% 0% 0% 24% 19% 14%
Subsidy
Received/Booked 62% 66% 38% 13% 7% 11% 100% n.a n.a
Interest Cost/Total
Cost 7% 8% 8% 9% 12% 18% 16% n.a n.a
ACS-ARR Gap w/o
subsidy – Rs./kWh 0.54 0.57 1.10 2.17 2.86 2.40 4.38 n.a n.a
Source: PFC report on utility finances and Discom ARRs
Some of the key observations from the above table, along with relevant state-level aspects
are listed below.
- The AT&C losses have decreased to 25% in 2011-12. A >1.5% annual reduction in
AT&C losses will be required in order to benefit from the central grants support
scheme. If the Discoms continue to reduce AT&C losses at the rate they have
decreased in the past, the potential grants from the central government will be
significant. However, it is important to note that these losses are calculated on the
basis of metered agricultural consumers. Agricultural metering is currently at 50% in

AF-MERCADOS EMI
Power Sector Operations and Impact on State Finances – Volume II 347
Rajasthan. Hence, it might not be totally appropriate to consider the 25% loss level
in 2010-11 as the benchmark for the state.
- Tariffs were not revised for a continuous period of 5 years in Rajasthan. In the last
three years, tariffs have been revised substantially. In 2013-14, Rajasthan increased
agriculture tariffs (general category) from Rs 2.25/kWh to Rs 3.93/kWh. Also, tariffs
for unmetered agriculture consumers were hiked by an even higher percentage, in
order to incentivize them to shift to metered category. With limits on subsidy levels,
the regulator will need to revise tariff hikes on a frequent basis in order to bring
down the financial gap, which is currently very high.
- Barring 2011-12, the subsidy received-booked ratio has been quite low in Rajasthan.
Transparency in subsidy sanction and disbursement is a required condition in the FRP
and can possibly be an area of concern.
- The share of Interest expenses has been very high. With 50% of STL being taken
over by the state government and a moratorium on principal payments for the
remaining 50%, the Discoms’ short-term loans, the liquidity position will significantly
improve and aid its working capital requirements.
- The ACS-ARR Gap needs to be reduced yearly by 25% of the 2010-11 benchmark
level in the moratorium period to be eligible for the central grants incentive. By
2014-15, the financial gap will need to be brought down to around 60 paise/kWh.
Assuming the AT&C losses are reduced by 3%, the financial gap will come down by
around 18 paise/unit in terms of the cost reduction achieved by purchasing fewer
units to supply the same power as in 2010-1122. This implies that the technical losses
will need to be brought down by a considerable percentage, unless the tariffs are
revised to increase the revenue realization.
In the state of Rajasthan, lack of tariff hikes and inadequate disbursement of subsidies
have contributed to the deterioration of financial health of Discoms. The reduction in AT&C
loss levels has been significant and similar reduction in the future will allow the state to
benefit from central government grants. While the FRP is expected to significantly improve
the working capital condition of the state in the short-term, it is important to note that the
accumulated financial losses of the Discoms have gone up to Rs 70,000 Cr. even before the
scheme has been implemented. This will have severe cash flow implications in spite of the
respite provided by the moratorium period on repayment of past loans under FRP.
22 In order to estimate gap reduction, 2010-11 data has been taken for Rajasthan because the ACS in 2011-12 is
very high due to the bad debt (subsidy receivables) expensed in that year.
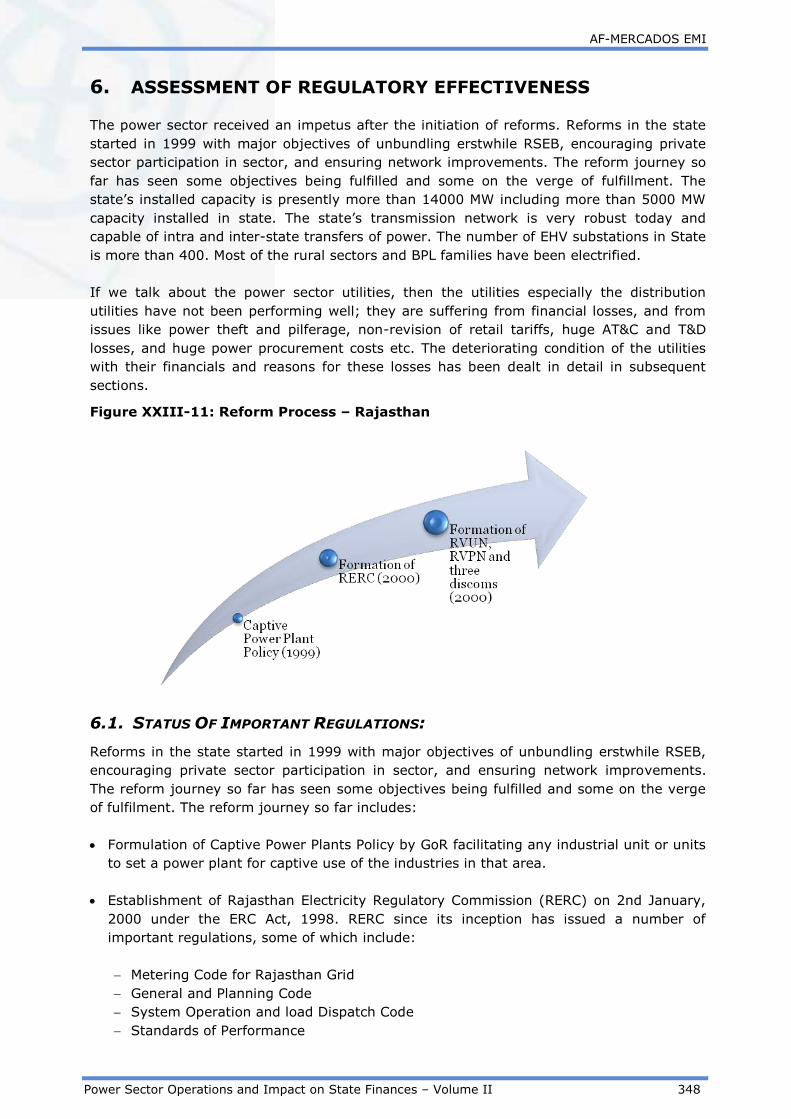
AF-MERCADOS EMI
Power Sector Operations and Impact on State Finances – Volume II 348
6. ASSESSMENT OF REGULATORY EFFECTIVENESS
The power sector received an impetus after the initiation of reforms. Reforms in the state
started in 1999 with major objectives of unbundling erstwhile RSEB, encouraging private
sector participation in sector, and ensuring network improvements. The reform journey so
far has seen some objectives being fulfilled and some on the verge of fulfillment. The
state’s installed capacity is presently more than 14000 MW including more than 5000 MW
capacity installed in state. The state’s transmission network is very robust today and
capable of intra and inter-state transfers of power. The number of EHV substations in State
is more than 400. Most of the rural sectors and BPL families have been electrified.
If we talk about the power sector utilities, then the utilities especially the distribution
utilities have not been performing well; they are suffering from financial losses, and from
issues like power theft and pilferage, non-revision of retail tariffs, huge AT&C and T&D
losses, and huge power procurement costs etc. The deteriorating condition of the utilities
with their financials and reasons for these losses has been dealt in detail in subsequent
sections.
Figure XXIII-11: Reform Process – Rajasthan
6.1. STATUS OF IMPORTANT REGULATIONS:
Reforms in the state started in 1999 with major objectives of unbundling erstwhile RSEB,
encouraging private sector participation in sector, and ensuring network improvements.
The reform journey so far has seen some objectives being fulfilled and some on the verge
of fulfilment. The reform journey so far includes:
Formulation of Captive Power Plants Policy by GoR facilitating any industrial unit or units
to set a power plant for captive use of the industries in that area.
Establishment of Rajasthan Electricity Regulatory Commission (RERC) on 2nd January,
2000 under the ERC Act, 1998. RERC since its inception has issued a number of
important regulations, some of which include:
Metering Code for Rajasthan Grid
General and Planning Code
System Operation and load Dispatch Code
Standards of Performance

AF-MERCADOS EMI
Power Sector Operations and Impact on State Finances – Volume II 349
Safety Standards Code
Open Access Code
Establishment of five power utilities: On 19th July 2000 the assets, liabilities and
personnel of the erstwhile RSEB have been transferred to the newly formed 5 power
companies namely:
RRVUNL, generating company
RRVPNL, transmission company
3 distribution companies, viz. JVNNL, AVVNL and JdVVNL
Encouraging private participating in sector: The reform programs in state have attracted
private sector participation in Generation and Transmission sector
As per the present applicable tariff regulations, Multi Year Tariff (MYT) is set as per
regulations for Control Period for generation, transmission and distribution utilities. The
present control period is FY 2010 to FY 2014. In accordance with the regulations,
distribution licensee (the applicant) in the state prepares annual statement of accounts and
also prepare annual reports and statistics, giving an account of its activities during the
current and previous year and likely to be undertaken in the remaining years of the MYT
Control Period, including the ensuing year. The applicant also submits the forecast of
aggregate revenue requirement and expected revenue from tariff for each year of the
Control Period.
The reform processes has brought much improvements in transmission and generation
sector, but it has not bring in much improvements in the distribution sector. Efficiency
improvements are yet to be seen on both technical and financial fronts. Losses on both
financial and technical fronts are huge and increasing the burden on distribution utilities
despite of subsidy and transitional monetary support provided by GoR.
It has been observed RERC is not financially dependent on the state government for
meeting their expenditure.
Also, out of the total number of posts working/sanctioned in RERC (58) majority comprise
of technical posts (32) and vacancies in technical posts are 6. Hence the staff strength
further gets reduced.
6.2. STATUS OF OPEN ACCESS IMPLEMENTATION:
Open access regulations were issued by RERC in May 2004 as ‘Terms & Conditions for Open
Access’. These regulations were subsequently amended on 4.8.2004, 15.12.2005,
27.12.2006, & 30.3.2007.
During FY12, there were Sixty (60) wind power plants (mainly of M/s Suzlon and M/s
Enercon) having open access on RVPN’s transmission system under NES policies of
Government of Rajasthan. Till date, RVPN has executed Thirty Two (32) open access
agreements of total capacity of 302.05 MW. Of these 32 agreements, 17 agreements have
been long term open access agreements with M/S VS Lignite Power Limited. Rest others
were executed as short term open access agreements.

AF-MERCADOS EMI
Power Sector Operations and Impact on State Finances – Volume II 350
6.3. FREQUENCY OF TARIFF REVISIONS:
At present, though the ARR is worked in MYT basis, linking the same with loss reduction
target but the consumer tariffs are not determined for multi-year, but only for the year, for
which the petition for revision is filed. Utilities in Rajasthan are state owned and they are
still not claiming full cost recovery, though have achieved target for loss reduction.
The tariff revisions were done in FY 2011-12 after a gap of 9 years wherein tariffs were
hiked substantially i.e. 24%. Thereafter commission has approved a tariff hike in FY 2012-
13 & FY 2013-14 by 19% and 14% respectively. The table below provides the details of
tariff revision in the state.
Table XXIII-14: Tariff Revisions - Rajasthan
FY
05
FY 06 FY 07 FY
08
FY
09
FY
10
FY 11 FY
12
FY
13
FY 14
Average
Tariff
Revisions
0% 0% 0% 0% 0% 0% 0% 24% 19% 14%
6.4. REVIEW OF APPROACHES ADOPTED FOR MEASURING AGRICULTURAL
CONSUMPTION
Commission normally considers Compounded Annual Growth Rate (CAGR) of 3 or 5
previous years, as the case may be, in assessing energy requirement in a year. However,
in case of Agriculture, connected load and specific consumption have been used for
calculating sales as adopted in tariff order of FY 2012-13. This methodology is more
appropriate rather than using CAGR of sales, as agricultural consumption varies
considerably on year to year basis due to erratic nature of rainfall in the State. In addition,
supply hours for agriculture in the past have varied considerably due to various reasons,
which also lead to significant changes in consumption of power in agriculture. This
methodology has been used in the order for estimating the energy sales of Agriculture
consumers (both metered and flat rate).
The Commission, however, has approved the sales for FY 2013-14 using the following
assumptions.
1. For metered category, the no. of consumers, specific consumption (kWh/KW/Year) and
connected load (KW) for all Discoms have been taken as per tariff petitions after the
reduction of no. of consumers and connected load of Farm Houses.
2. The Commission has considered that new and converted consumers on the average
could be taken to be in the metered category for 6 months. Accordingly, connected load
and specific consumption as applicable for metered category have been considered for 6
months in case of new consumers and those converted from flat rate for working out
their sales

AF-MERCADOS EMI
Power Sector Operations and Impact on State Finances – Volume II 351
7. SUMMARY
1. Tariff Hikes: In line with increasing gap between ACS and ARR the tariffs have been
hiked every year from 2011-12 to 2013-14. The tariff revisions were done in FY
2011-12 after a gap of 8 years wherein tariffs were hiked substantially i.e. 24%.
Thereafter commission has approved a tariff hike in FY 2012-13 & FY 2013-14 by
19% and 14% respectively.
2. Subsidy: In 2011-12, majority of subsidy was provided to the power sector (~88%)
by the state government. Also, the trend in subsidy pay-out with respect to the
subsidy booked was 100% from FY 2010-11 onwards. In 2010-11 and 2011-12 the
share of subsidy as a percentage of revenue was 10% and 12% respectively.
3. Gap between ACS and ARR: The gap between average cost of supply and average
revenue realized (with subsidy) was nil till 2009-10 primarily due to the huge
subsidies booked over the years. However in 2010-11 the subsidies booked
decreased significantly leading to creation of gap of ~Rs 4.5 per unit. In 2010-11
there was an increase in the cost of supply and a decrease in the revenue realized.
In 2011-12, the gap decreased to some extent due to revision in the tariffs after a
time gap of 8 years. The commission needs to keep this tariff revision process going
to ensure better recovery for discoms.
4. Financial Viability: The single biggest challenge for the State is to attain financial
viability for the power business. Currently the distribution business is making huge
losses and the deficit is increasing year over year. Due to delays in true-up exercise
and non-revision of tariffs in previous financial years, financial losses get
accumulated each year and are becoming high. In FY 2010-11 due to substantial
decrease in Grants and Subsidies given by the state government (decrease by 90%
over last year) and increase in other cost (increased to 32% of the total costs in
FY11) the financial losses have gone up substantially. The total accumulated losses
(with subsidy) till FY 2011-12 are over Rs 40,000 Crore.
5. Operational Efficiency: The Aggregated Technical & Commercial (AT&C) losses for
Rajasthan distribution utilities have shown an improving trend, they have decreased
from 47% in 2004-05 to 25% in 2011-12. This, however, is based on the estimated
consumption in the agricultural sector (Currently, state’s unmetered (flat)
agriculture sale is 8% of total sales). Efficiency improvements are yet to be seen on
both technical and financial fronts. Losses on both financial and technical fronts are
huge and increasing the burden on distribution utilities despite of subsidy and
transitional monetary support provided by GoR.. Utility faces severe cost side risks
(mainly power purchase cost). Increasing power purchase costs are also a cause of
concern, which are increasing the operational costs and are the main reason for
incurring huge financial losses. It is necessary to conduct the demand forecasting
studies for short and long term using the scientific methods to obtain the precise
demand forecasts; it will help the utilities to properly plan their power procurement
strategies and minimizing their power procurement costs.
6. States Guarantees: Guarantees given by the government to the Power sector
exceeded the Total Revenue generated by the state. In 2011-12, the share of
Discom was as high as 84% of the state Guarantees for Power Sector.

AF-MERCADOS EMI
Power Sector Operations and Impact on State Finances – Volume II 352
7. State exposure to the Power Sector: Total Revenue – Tax and Non Tax (Rs. 1098
Crores) from the Power sector is ~20% of the total expenditure on the sector (Rs.
5464.9 Crores). The financing requirement for the Power sector in the state was
estimated to be 11% of the Total Revenue generated by the state and 2.41 % of
the Gross State Domestic Product.

AF-MERCADOS EMI
Power Sector Operations and Impact on State Finances – Volume II 353
XXIV SIKKIM
1. INTRODUCTION
1.1. BACKGROUND – POWER SECTOR OVERVIEW
The Energy and Power Department of the State Government is responsible for power
generation, transmission and distribution in Sikkim. Even after 10 years of the electricity
act, the state has been a laggard in terms of power sector reforms with the operations still
carried out by a single entity. Any detailed information on the formation of a state
electricity regulatory commission is also not available. In recent years, Sikkim has been
focussing on capacity addition and development of hydro potential by handling out projects
to private sector investors. It has a peak potential capacity of around 8000 MW of
hydroelectricity.
1.2. GENERATION MIX
The total installed capacity as on February 2014 (including allocated share in Joint &
Central Sector plants) for Sikkim was 313.99 MW. It has grown by 3% from June 2013
level of 305.38 MW. Out of total capacity as on Feb 2014, Hydro power accounted for
~56% followed by Coal (~26% ) and RE (~17%).
Figure below highlights the generation capacity including allocated share in Joint & Central
sector plants.
Figure XXIV-1: Generation Capacity Mix as on Feb 2014 - Sikkim
Source: CEA
1.3. POWER SUPPLY POSITION
The energy and peak deficit in the state has been considerably low for the last few years.
The energy deficit which has reduced from 10% in 2009-10 to 0% in 2010-11 is because of
continuous capacity addition and favorable hydro power generation in those years. The
peak deficit of 5% observed in the financial year 2011-12 is because of the “Himalayan
earthquake” which occurred on 18th September 2011.

AF-MERCADOS EMI
Power Sector Operations and Impact on State Finances – Volume II 354
The trend of energy and peak deficit observed in Sikkim over the years is highlighted in the
figure below:
Figure XXIV-2: Energy Deficit - Sikkim
Source: CEA
Figure XXIV-3: Peak Deficit - Sikkim
Source: CEA

AF-MERCADOS EMI
Power Sector Operations and Impact on State Finances – Volume II 355
2. ASSESSMENT OF OPERATIONAL PERFORMANCE OF
DISTRIBUTION UTILITIES
2.1. CONSUMER SALES MIX OF SIKKIM
The energy and power department of the state government takes care of the power
distribution across all sets of consumers in the state.
In FY 2011-12, Industrial LT category dominated the sales mix with a share of 38%,
followed by domestic category (29%). The share of agricultural sales have reduced over
the years while the share of LT industrial sales have increased over the years. The share of
agricultural sales have reduced from 32% in 2004-05 to 6.3% in 2011-12 and the
industrial sales have increased from 27% in 2004-05 to 37.5% in 2011-12.
The historical trend of consumer sales mix for the state is given in figure below:-
Figure XXIV-4: Historical Trend in Consumer Sales Mix - Sikkim
Source: PFC
The overall sales have registered a CAGR of 6% over the span of seven years wherein the
sales of LT lndustrial category have registered a higher CAGR of 14.5% followed by the
commercial category with a CAGR of 12.05%.
In terms of revenue contribution, industries contributed close to 60% of the revenue,
followed by commercial and domestic categories with a share of 17% and 15%,
respectively, while agriculture has not contributed to any part of the revenue (Refer Figure
I-5 below). This clearly indicates that the agricultural category is heavily cross subsidized
by the industrial and commercial categories.
The figure below compares the sales mix of FY 2011-12 and the revenue realized from the
different category of consumers.

AF-MERCADOS EMI
Power Sector Operations and Impact on State Finances – Volume II 356
Figure XXIV-5: Comparative Analysis of Consumer Sales and Revenue Mix 2011-
12 - Sikkim
Source: PFC
2.2. TRENDS IN COMMERCIAL & TECHNICAL LOSSES
The Aggregated Technical & Commercial (AT&C) losses for Sikkim power department have
been very high. Lack of proper metering and billing of consumers are the primary reason
for such losses. Further, extension of network in rural areas under the RGGVY scheme and
free electricity to BPL households of upto 50 units of electricity has led to increasing AT&C
losses and low collection efficiency.
Table XXIV-1: Year on Year Trend in AT&C losses and Collection Efficiency –
Sikkim
Year FY
05 FY 06 FY 07 FY 08 FY 09 FY 10 FY 11 FY 12
AT&C Losses
(%) 38% 44.8% 61.4% 51% 47% 59% 62% 59%
Collection
Efficiency 93% 83% 56% 70% 75% 63% 67% 78%
Source: PFC
2.3. TRENDS IN DISTRIBUTION COST
Power purchase cost accounts for majority of the distribution cost with an average of 60%
of the total distribution cost over the years. (Refer table below)
The per-unit cost break-up for different cost components for the state of Sikkim is provided
in the table below:-
Table XXIV-2: Year on Year Trend Distribution Cost Breakup – Sikkim
Cost Component
(Rs. per kWh) FY 05 FY 06 FY 07 FY 08 FY 09 FY 10 FY 11 FY 12
Power Purchase
Cost - 1.28 1.48 1.57 0.51 0.66 1.07 1.25
O&M (R&M +
A&G + EC) - 0.64 0.61 0.51 0.59 0.66 0.62 1.00
Interest - 0.00 0.00 0.00 0.00 0.00 0.00 0.00

AF-MERCADOS EMI
Power Sector Operations and Impact on State Finances – Volume II 357
Cost Component
(Rs. per kWh) FY 05 FY 06 FY 07 FY 08 FY 09 FY 10 FY 11 FY 12
Depreciation - 0.00 0.00 0.00 0.00 0.00 0.00 0.00
Other cost - 0.00 0.00 0.00 0.00 0.00 0.00 0.02
Source: PFC
The state power sector is almost entirely supported by hydel energy, out of which, majority
of the plants are run-of-the-river ones. As a result, there is high dependency on monsoons
and good weather conditions. So, whenever the weather conditions are not suitable for the
hydro plants, the state would require power from outside. This is visible from the table
above wherein the power purchase cost has decreased in FY09 and FY10 due to favorable
hydro power weather conditions and subsequently increased in FY11 and FY12 due to
unfavorable conditions
2.4. REVENUE REALIZATION
Due to increase in financial losses over the years, the tariffs were hiked in 2012 to the tune
of 15%. No hikes have been reported post that.
The table below shows the revenue realization (without subsidy) from different consumer
categories over the years.
Table XXIV-3: Historical Trend Consumer Category Wise Revenue Realization -
Sikkim
Category FY
05
FY
06
FY
07
FY
08
FY
09
FY
10
FY
11 FY 12
Domestic 1.47 1.53 1.54 1.61 1.56 1.67 1.64 1.97
Agriculture - - - - - - - -
Commercial 2.63 2.59 2.59 2.62 2.55 2.55 2.61 4.00
Industrial HT - - - - - - - -
Industrial LT 2.62 2.50 2.50 2.58 2.55 2.52 2.36 6.15
Others 2.31 2.38 2.35 1.79 2.00 2.06 1.79 3.81
Source: PFC

AF-MERCADOS EMI
Power Sector Operations and Impact on State Finances – Volume II 358
3. ASSESSMENT OF FINANCIAL PERFORMANCE OF –
DISTRIBUTION UTILITY
3.1. FINANCIAL HEALTH OF DISTRIBUTION UTILITIES
The distribution financial losses without subsides is observed over the years in Sikkim
because of the extensive set up of low voltage lines, lack of proper metering and inefficient
billing.
Figure XXIV-6: Historical Trend Financial Losses (w/o) subsidies – Sikkim
Source: PFC
The losses decreased in FY 2011-12 due to increase in tariff. The state further aims at
removing the obsolete meters with enhanced ones and introducing computerized billing.
With this in line, we expect the losses to decrease in the future.
3.2. SUBSIDY BOOKED V/S SUBSIDY RECEIVED
There has been no subsidy booked/received over the years.
3.3. ACS V/S ARR
The gap (with subsidy) between average cost of supply and average revenue realized (with
subsidy) has been high in the initial years from 2005-06 till 2007-08. The gap reduced in
2008-09 because of the reduction in power purchase cost. The gap has widened post that
primarily due to increase in power purchase cost and lack of tariff revision. Tariffs were
hiked in 2012 which has reduced the gap considerably.

AF-MERCADOS EMI
Power Sector Operations and Impact on State Finances – Volume II 359
Figure XXIV-7: Historical Trend ACS v/s ARR (with subsidy) – Sikkim
Source: PFC

AF-MERCADOS EMI
Power Sector Operations and Impact on State Finances – Volume II 360
4. STATE INCOME AND EXPENDITURE ON POWER SECTOR
4.1. INCOME FROM POWER SECTOR
The tax revenue from the power is majorly through electricity distribution tax, which is paid
by the distribution utilities to the state government. The details of the same are given
below.
Table XXIV-4: Tax Revenue from Power Sector - Sikkim
Revenue 2009-10 2010-11 2011-12
Rs Cr
Tax Revenue from Power Sector 0
0
Total Tax Revenue 598 805 906
Power sector Tax Revenue / Total
state Tax Revenue 0% 0% 0%
Source: C&AG Audited Accounts for the state – 2011-12, 2010-11, 2009-10
As evident, the sector has not generated any tax revenues over the years.
The Non Tax revenue forms ~8% of the total non-tax revenues in 2011-12. The non-tax
revenue from power sector is through royalty/cess on water for power generation, T &D,
rural electrification. The details for the same are provided in the table below.
Table XXIV-5: Non-Tax Revenue from Power Sector - Sikkim
Revenue 2009-10 2010-11 2011-12
Rs Cr
Non Tax Revenue From Power
Sector 286 88 80
Total Non-Tax Revenue 3,254 1,138 1,045
Power sector Non-Tax Revenue
/Total state Non-Tax Revenue 9% 8% 8%
Source: C&AG Audited Accounts for the state – 2011-12, 2010-11, 2009-10
Non Tax revenue from Hydel Generations constitutes the major portion of Non Tax revenue
of the sector. Over the span of three years, the non tax revenue has declined for the state
as a whole along with the revenue power sector. Hence, despite the decline in revenues,
the contribution has been constant at ~8% over the three years.
The overall income generated from the power sector has declined from Rs 286 Cr in 2009-
10 to Rs 80 Cr in 2011-12.

AF-MERCADOS EMI
Power Sector Operations and Impact on State Finances – Volume II 361
4.2. EXPENDITURE ON POWER SECTOR
The table below depicts the expenditure towards power sector in the state of Sikkim.
Table XXIV-6: Expenditure on Power Sector - Sikkim
Categories 2009-10 2010-11 2011-12
Rs Cr
Capital expenditure 72 NA 38
Revenue Expenditure 0 NA 98
Total Power Sector Expenditure 72 NA 136
Source: C&AG Audited Accounts for the state – 2011-12, 2010-11, 2009-10
There has been a decline in capital expenditure primarily on account of decrease in
expenditure under T&D. The revenue expenditure in power sector has increased primarily
on account of expenses towards Purchase of Power.
The quantum of expenditure made on the power sector has been more than the revenue
generated from the sector.
4.3. ANALYSIS ON STATE GUARANTEES AND SUBSIDIES
In 2009-10 guarantees to the tune Rs 0.5 Cr given towards Power Sector was a marginal
~1% of the state revenues.
4.4. POWER BONDS
The outstanding amount as on 1st April, 2006 was Rs 47.80 Cr. The outstanding amount as
on 31st March was Rs 19.12 Cr. As per RBI ‘State Finance Report’ 2014, the outstanding
liability of Power Bonds in the state as on 31st March 2014 was Rs 10 Cr.
4.5. POWER SECTOR FINANCING REQUIREMENT RELATIVE TO STATE ECONOMY
In this section, the expenditure (under all possible heads) on the power sector by the state
government has been listed to determine the state Power sector financing requirement
which is then compared to state finances.
The sector financing requirement is estimated as the summation of total expenditure of the
state government on the sector including Capital and Revenue Expenditure, Loans and
Advances (Net Of Recoveries) and Public Debt repaid (Net of Receipts) by the State
Government.

AF-MERCADOS EMI
Power Sector Operations and Impact on State Finances – Volume II 362
Table XXIV-7: Financing Requirement of Power Sector (2011-12) - Sikkim
Particulars 2011-12
Rs. Cr.
Power Sector Expenditure (Capital and Revenue) 136
Loans And Advances made by the State Government (Net of
Recoveries) 0
8.5% Tax Free Special Bonds of the State Government (Power
Bonds) disbursed during the year (Net of Receipts) 5
Loans for Power Projects-T&D from the Central Govt.
Discharged during the year (Net of Receipts) 0
Total Power Sector Financing during the year 140
Sector Financing Requirement as a % age of total revenues of
state 7%
GSDP nominal 5,148
Sector Financing Requirement as a % age of GSDP 2.73%
Financial Profits/(Losses) of DISCOMs during the year (with
subsidy realised) (9)
Sector Financing Requirement as a % age of total revenues of
state including financial losses of Discoms 8%
Sector Financing Requirement as a % age of GSDP including
financial losses 2.9%
Source: State Government annual accounts from CAG, Data book for DCH - 22nd April, 2013, PFC
Report on Utility finances – 2011-12
The financing requirement for the Power sector in the state was estimated to be 7% of the
revenue generated by the state and 2.73 % of the Gross State Domestic Product.
Considering, the financial losses of Discoms in the year, the financing requirement of the
sector increases to 8% of the State revenue and 2.9 % of the GSDP.
The major portion of state investments went towards T n D. 30% of the Revenue
expenditure on the power sector were made on Hydel generation and 26% on T n D.
The Discom losses have been increasing the burden of the sector on state finances. Hence,
there is a need for further investments to build and strengthen the infrastructure and
decrease the assistance.
AF-MERCADOS EMI
Power Sector Operations and Impact on State Finances – Volume II 363
5. ASSESSMENT OF REGULATORY EFFECTIVENESS
Sikkim has lacked progress in terms of effective reforms, unbundling and corporatization of
the sector. The State Electricity Regulatory Commission lacks transparency in its
operations. There has been a notification on the unbundling of the utility. However, nothing
concrete has been reported. There has been no transition of tariff scheme from ARR to
MYT. Open access hasn’t been introduced in the distribution segment. Overall, sikkim has
been a laggard in terms of regulatory reforms.

AF-MERCADOS EMI
Power Sector Operations and Impact on State Finances – Volume II 364
6. SUMMARY
Sikkim has been blessed with a beautiful geographical location and an amazing terrain
which has some of the most turbulent and swiftest rivulets in the country that is best
suited for harnessing hydro power development. The state has been recently engaged in
harnessing this potential to the maximum. However, there needs to be further effort in
improving metering, collection techniques and computerized billing. The year old systems
must be replaced with new efficient ones. The key parameters of the states are discussed
below-
1. Tariff Revisions: The tariff revision in the state was last reported in FY 12. There is
lack of visibility about the tariff revisions and implementations in the state.
2. Power purchase cost: Since the state is largely dependent on its hydro power
capacity, weak monsoons would lead to low PLF of these plants forcing the state to
procure power from central stations, which would inturn increase the power
purchase cost.
3. Financial Losses: The increasing distribution financial losses without subsides in
Sikkim is a result of the extensive set of low and medium voltage lines under rural
electrification program and lack of proper billing.
4. Exposure to the State Gov. to power sector: The financing requirement for the
Power sector in the state was estimated to be 7% of the revenue generated by the
state and 2.73 % of the Gross State Domestic Product. Considering, the Financial
losses of Discoms in the year 2011-12, the financing requirement of the sector
decreases to 8% of the State revenue and 2.9% of the GSDP.
5. Reforms: There hasn’t been any strong reform in the state even after a decade of
the electricity act

AF-MERCADOS EMI
Power Sector Operations and Impact on State Finances – Volume II 365
XXV TAMIL NADU
1. INTRODUCTION
1.1. BACKGROUND – POWER SECTOR OVERVIEW
The Tamil Nadu Electricity Board (TNEB) was functioning as a vertically integrated utility
responsible for generation, transmission, and distribution of electricity until 2010. In 2010,
it was restructured into a holding company, viz., TNEB Ltd, and two subsidiary companies –
TANGEDCO responsible for generation and distribution and Tamil Nadu Transmission
Corporation Limited (TANTRANSCO) responsible for transmission of electricity.
1.2. GENERATION MIX
The total installed capacity as on Februray 2014 (including allocated share in Joint &
Central Sector plants) for Tamil Nadu was 21063.39 MW out of which 43% share is of Coal
based generation and 38% is Renewable based generation followed by hydro based
generation (~10%) and gas based generation (5%). Nuclear and diesel based generation
account for 2% share each. The capacity has only grown by 12% from 18729 MW in FY13.
Figure below highlights the generation capacity including allocated share in Joint & Central
sector plants.
Figure XXV-1: Generation Capacity Mix - Tamil Nadu
Source: CEA
1.3. POWER SUPPLY POSITION
Tamil Nadu has been witnessing significant supply deficit. The deficit has increased from
1% in FY06 to 17% in FY13. Presently, it is around 6%. The increasing energy and peak
deficit in the state was due to slow growth of capacity addition and limited transmission
corridor available between NEW (North Eastern Western) and South grid.
The Peak deficit has been varying significantly and remained high over the last 9 years.
This is also due to high amount of Renewable Energy component in the Energy mix which is
highly variable and not capable of helping meet peak requirement. Further, low Plant Load

AF-MERCADOS EMI
Power Sector Operations and Impact on State Finances – Volume II 366
Factor (PLF) of hydro power plants caused by poor/weak monsoons has contributed to
energy and peak deficit in the state.
The trend of energy deficit observed in Tamil Nadu over the years is have been highlighted
in the figure graph below:-
Figure XXV-2: Energy Deficit – Tamil Nadu
1% 2% 3%
8%6% 6%
10%
17%
6%
0%
5%
10%
15%
20%
0
20,000
40,000
60,000
80,000
100,000
MU
Energy Deficit
Energy Required (MU) Energy Avail (MU) Deficit (%)
Source: CEA
The trend of peak deficit observed in Tamil Nadu over the years is have been highlighted in
the figure graph below:-
Figure XXV-3: Peak Deficit – Tamil Nadu
11%
3%
16%
6%
12% 11%
18%
13%
7%
0%
5%
10%
15%
20%
0
5,000
10,000
15,000
MW
Peak Deficit
Peak Demand (MW) Peak Met (MW) Deficit (%)
Source: CEA
However, with the integration of Southern Grid with the National Grid in January 2014,
energy and peak deficit is expected to decrease. We can observe this in 2013-14.
This trend is likely to continue in the near future as the prices in the spot market have
come down. The average daily day ahead market prices are less than the distribution costs
for the previous years (discussed later in the report) in the state.

AF-MERCADOS EMI
Power Sector Operations and Impact on State Finances – Volume II 367
Figure XXV-4: Average Daily Day Ahead Market Prices S2 – Tamil Nadu
0.00
2.00
4.00
6.00
8.00
10.00
12.00
14.00
04-0
1-13
17-0
4-20
13
05-0
3-13
19-0
5-20
13
06-0
4-13
20-0
6-20
13
07-0
6-13
22-0
7-20
13
08-0
7-13
23-0
8-20
13
09-0
8-13
24-0
9-20
13
10-1
0-13
26-1
0-20
13
11-1
1-13
27-1
1-20
13
13-1
2-20
13
29-1
2-20
13
14-0
1-20
14
30-0
1-20
14
15-0
2-20
14
03-0
3-14
19-0
3-20
14
Average Daily Day Ahead Market Price - S2
Maximum Price - Rs. 13.15 per kWh
Average Price - Rs. 3.91 per kWh
Minimum Price - Rs. 0.00 per kWh
Source: IEX

AF-MERCADOS EMI
Power Sector Operations and Impact on State Finances – Volume II 368
2. ASSESSMENT OF OPERATIONAL PERFORMANCE OF
DISTRIBUTION UTILITIES
2.1. CONSUMER SALES MIX OF TAMIL NADU
TANGEDCO has a consumer base of about 223.44 lakh consumers. 100% rural
electrification has been achieved. Per Capita consumption of Tamil Nadu is 1040 units. To
achieve the goal of electrification of all households, the Government has launched the Rajiv
Gandhi Grameen Vidyutikaran Yojana (RGGVY) scheme. Where grid connectivity is not
feasible or not cost effective, Decentralised Distributed Generation is permitted.
The historical trend in the consumer sales mix for the state is given in figure below:-
Figure XXV-5: Historical Trend in Energy Deficit - Tamil Nadu
0%
20%
40%
60%
80%
100%
2004-05 2005-06 2006-07 2007-08 2008-09 2009-10 2010-11 2011-12
Perc
enta
ge
Years
Domestic Agriculture Commercial
Industrial - HT Industrial - LT others Source: PFC
The overall sales have registered a CAGR of 4% over the span of 8 years wherein the sales
of commercial and domestic category have registered a CAGR of 9% each. Industrial has
increased by CAGR of 5%.
The figure below compares the sales mix of FY 2011-12 and the revenue realized from the
different category of consumers.
Figure XXV-6: Comparative Analysis of Consumer Sales and Revenue Mix in 2011-
12 - Tamil Nadu
Domestic 15%
Commercial28%
Agriculture 0%
Industrial - HT 51%
Others 6%
Category wise Revenue in 2011-12
Domestic 33%
Agriculture19%
Commercial 16%
Industrial - HT 27%
others 5%
Category wise Sales - 2011-12
Source: PFC
Tamil Nadu‘s electricity sales is dominated by domestic consumers (33%) followed by
industrial consumers (27%) and agricultural consumers (19%).

AF-MERCADOS EMI
Power Sector Operations and Impact on State Finances – Volume II 369
In terms of revenue contribution, there is no revenue realised from agricultural sales as
there are no tariffs for agricultural consumer. For decades now the agricultural segment is
subsidised in Tamil Nadu. The industrial consumers who account for about ~27% of the
sales produce more than 50% of the sales revenue followed by commercial consumers
(~28%). Domestic consumers contributed to 15% of the revenue realised.
2.2. TRENDS IN COMMERCIAL & TECHNICAL LOSSES
The Aggregated Technical & Commercial losses (AT&C) for TANGEDCO have been ranging
from 14% to 20% over the period from 2004-05 to 2011-12. The loss levels are much
lower as compared to the national average. This, however, is based on the estimated
consumption in the agricultural sector (in absence of agriculture metering in the state).
The collection Efficiency has improved over the years reaching more than 100% during
FY07.
However, the losses and collection efficiency have been considered for metered sales. The
unmetered agricultural sales have not been considered by the state. Tamil Nadu has not
achieved 100% consumer metering so far. Agriculture and hut service connections are
provided free supply of power and they are entirely unmetered.
Table XXV-1: Year on Year Trend in AT&C losses and Collection Efficiency - Tamil
Nadu
Year FY
05 FY 06 FY 07 FY 08 FY 09 FY 10 FY 11 FY 12
AT&C Losses
(%) 19% 17.1% 16.2% 16% 14% 19% 19% 20%
Collection
Efficiency 82% 83% 105% 94% 90% 96% 94% 93%
Source: PFC
2.3. TRENDS IN DISTRIBUTION COST
The power purchase cost forms the major cost component of that accounts for more 50%
of the total distribution cost (2004-05 to 2011-12). It can be observed that power purchase
cost per unit has increased over the years especially in FY09 and FY11. Power purchase
cost increased significantly in due to increase in imported coal prices and increase in
Renewable Based power which is costlier than the conventional power.
The per unit cost break-up for different cost components for the state of Tamil Nadu is
provided in the table below:-
Table XXV-2: Year on Year Trend Distribution Cost Breakup - Tamil Nadu
Cost Component FY
05
FY
06
FY
07
FY
08
FY
09
FY
10 FY 11 FY 12
Power Purchase Cost 1.36 1.58 1.73 1.99 2.34 2.49 3.02 3.23
O&M (R&M + A&G +
EC) 0.35 0.40 0.41 0.45 0.53 0.54 0.62 0.65
Interest 0.18 0.19 0.18 0.23 0.32 0.41 0.54 0.55
Depreciation 0.21 0.23 0.11 0.11 0.12 0.12 0.11 0.09
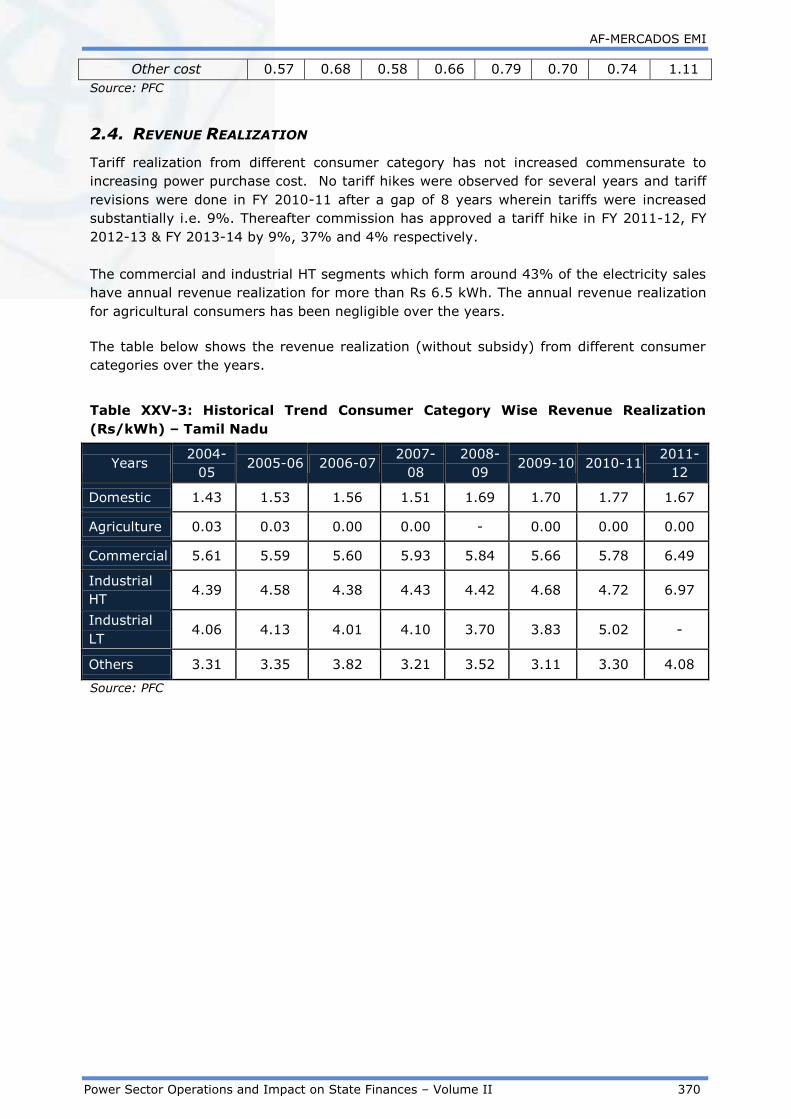
AF-MERCADOS EMI
Power Sector Operations and Impact on State Finances – Volume II 370
Other cost 0.57 0.68 0.58 0.66 0.79 0.70 0.74 1.11
Source: PFC
2.4. REVENUE REALIZATION
Tariff realization from different consumer category has not increased commensurate to
increasing power purchase cost. No tariff hikes were observed for several years and tariff
revisions were done in FY 2010-11 after a gap of 8 years wherein tariffs were increased
substantially i.e. 9%. Thereafter commission has approved a tariff hike in FY 2011-12, FY
2012-13 & FY 2013-14 by 9%, 37% and 4% respectively.
The commercial and industrial HT segments which form around 43% of the electricity sales
have annual revenue realization for more than Rs 6.5 kWh. The annual revenue realization
for agricultural consumers has been negligible over the years.
The table below shows the revenue realization (without subsidy) from different consumer
categories over the years.
Table XXV-3: Historical Trend Consumer Category Wise Revenue Realization
(Rs/kWh) – Tamil Nadu
Years 2004-
05 2005-06 2006-07
2007-
08
2008-
09 2009-10 2010-11
2011-
12
Domestic 1.43 1.53 1.56 1.51 1.69 1.70 1.77 1.67
Agriculture 0.03 0.03 0.00 0.00 - 0.00 0.00 0.00
Commercial 5.61 5.59 5.60 5.93 5.84 5.66 5.78 6.49
Industrial
HT 4.39 4.58 4.38 4.43 4.42 4.68 4.72 6.97
Industrial
LT 4.06 4.13 4.01 4.10 3.70 3.83 5.02 -
Others 3.31 3.35 3.82 3.21 3.52 3.11 3.30 4.08
Source: PFC
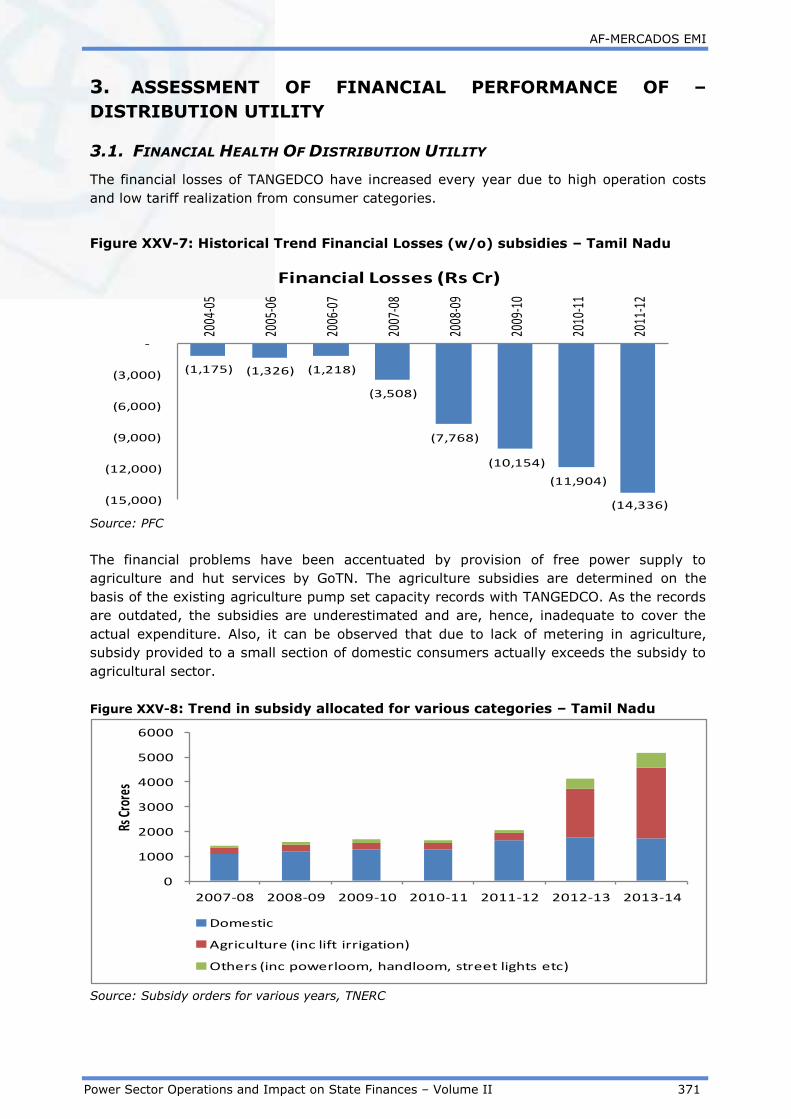
AF-MERCADOS EMI
Power Sector Operations and Impact on State Finances – Volume II 371
3. ASSESSMENT OF FINANCIAL PERFORMANCE OF –
DISTRIBUTION UTILITY
3.1. FINANCIAL HEALTH OF DISTRIBUTION UTILITY
The financial losses of TANGEDCO have increased every year due to high operation costs
and low tariff realization from consumer categories.
Figure XXV-7: Historical Trend Financial Losses (w/o) subsidies – Tamil Nadu
(1,175) (1,326) (1,218)
(3,508)
(7,768)
(10,154)
(11,904)
(14,336)(15,000)
(12,000)
(9,000)
(6,000)
(3,000)
-
2004
-05
2005
-06
2006
-07
2007
-08
2008
-09
2009
-10
2010
-11
2011
-12
Financial Losses (Rs Cr)
Source: PFC
The financial problems have been accentuated by provision of free power supply to
agriculture and hut services by GoTN. The agriculture subsidies are determined on the
basis of the existing agriculture pump set capacity records with TANGEDCO. As the records
are outdated, the subsidies are underestimated and are, hence, inadequate to cover the
actual expenditure. Also, it can be observed that due to lack of metering in agriculture,
subsidy provided to a small section of domestic consumers actually exceeds the subsidy to
agricultural sector.
Figure XXV-8: Trend in subsidy allocated for various categories – Tamil Nadu
0
1000
2000
3000
4000
5000
6000
2007-08 2008-09 2009-10 2010-11 2011-12 2012-13 2013-14
Rs C
rore
s
Domestic
Agriculture (inc lift irrigation)
Others (inc powerloom, handloom, street lights etc)
Source: Subsidy orders for various years, TNERC

AF-MERCADOS EMI
Power Sector Operations and Impact on State Finances – Volume II 372
Figure above shows that till 2011-12 the domestic sector accounts for major share of
subsidies as compared to other sectors including agriculture. However this trend has
changed in the last 2 years and agriculture forms major portion of the subsidies.
Till 2011-12, the tariff for agriculture was Rs.250/HP/annum which amounted to Rs 218.34
Crores. However the tariff was revised to Rs.2500/HP/annum due to which the agricultural
subsidies in the state reached Rs. 2,084.42 Crores.
In addition to the above, Commission has arrived at the net regulatory asset of Rs. 25644
Crs for FY 2013-14 for TANGEDCO. Out of this 1033 Crores have been amortized as on
March 2013. The Regulatory Asset is proposed to be amortized over a period of 5 years
commencing from the year 2013-14 onwards.
TANGEDCO is in the process of finalization of its Financial Restructuring Plan (FRP) scheme
and once the scheme is finalized, the amortization of balance regulatory asset will be
worked out considering GoTN support, FRP scheme etc.
3.2. SUBSIDY BOOKED V/S SUBSIDY RECEIVED
The subsidy burden of the State Government has been low over the years. In 2011-12,
subsidy booked was 9% of the total revenues and has averaged around that number from
2004-05 to 2011-12. The graph below highlights the subsidy booked v/s subsidy booked
for the distribution utilities in the state.
Figure XXV-9: Historical Trend Subsides Booked v/s Subsidies Received – Tamil
Nadu
9251,179
1,832 2,084
1,330 1,4571,582 1,672 1,653
2004
-05
2005
-06
2006
-07
2007
-08
2008
-09
2009
-10
2010
-11
2011
-12
Rs C
rore
s
Subsidy Booked Subsidy Received
Source: PFC
The trend in subsidy pay-out with respect to the subsidy booked was 100% except for
FY09.
3.3. ACS V/S ARR
The gap with subsidy between average cost of supply and average revenue realized has
been increasing over the years. It has increased from Rs 0.23 kWh in FY05 to Rs 2.15 kWh
in FY12. This is due to rising power purchase costs on account of increase in imported coal
prices and increase in Renewable Based power which is costlier than the conventional
power. The widening of this gap has been attributed to the fact that the tariffs in Tamil
Nadu have not been revised over several years.

AF-MERCADOS EMI
Power Sector Operations and Impact on State Finances – Volume II 373
Figure XXV-10: Historical Trend ACS v/s ARR (with subsidy) – Tamil Nadu
0.23 0.26 0.210.57
1.261.52
1.76
2.15
2.66
3.08 3.01
3.43
4.11 4.26
5.02
5.63
2.442.82 2.80 2.86 2.85 2.74
3.263.47
0.00
1.00
2.00
3.00
4.00
5.00
6.00
2004-05 2005-06 2006-07 2007-08 2008-09 2009-10 2010-11 2011-12
Rs./
kWh
Years
Gap(with subsidy) ACS ARR (with subsidy)
Source: PFC

AF-MERCADOS EMI
Power Sector Operations and Impact on State Finances – Volume II 374
4. STATE EXPOSURE TO POWER SECTOR
4.1. INCOME FROM POWER SECTOR
The tax income is majorly through electricity distribution tax, which is paid by the
distribution utilities to the state government. The tax revenue from the power sector forms
a marginal ~1% of the total tax revenue.
Table XXV-4: Tax Revenues - Tamil Nadu
Revenue 2009-10 2010-11 2011-12
Rs Cr
Tax Revenue from Power Sector 37 1,745 1,040.2
Total Tax Revenue 45,303 58,696 72,232.26
Power sector Tax Revenue / Total
state Tax Revenue 0.08% 2.97% 1%
Source: Audited CAG Accounts for the state: 2011-12, 2010-11, 2009-10
The tax revenue from Power sector has increased substantially since FY10. However, the
contribution to state tax revenue has been minimal i.e. ~1%.
The non-tax revenue from power sector is through Royalty/cess on water for power
generation, T n D, etc. The details for the same are provided in the table below.
Table XXV-5: Non-Tax Revenues - Tamil Nadu
Revenue 2009-10 2010-11 2011-12
Rs Cr
Non Tax Revenue From Power
Sector 0 0 0
Total Non-Tax Revenue 5,027 4,651 5,683.57
Power sector Non-Tax Revenue
/Total state Non-Tax Revenue 0.00% 0.00% 0
Source: Audited CAG Accounts for the state: 2011-12, 2010-11, 2009-10
Over the years, the Power sector in the state did not generate any Non Tax revenue.
The overall income generated from power sector, has increased from Rs 37 Cr in
2009-10 to ~Rs 1040.2 Cr in the year 2011-12.

AF-MERCADOS EMI
Power Sector Operations and Impact on State Finances – Volume II 375
4.2. EXPENDITURE ON POWER SECTOR
The table below depicts the expenditure towards power sector by the state of Tamil Nadu.
Table XXV-6: Power Sector Expenditure - Tamil Nadu
Categories 2009-10 2010-11 2011-12
Rs Cr
Capital expenditure 135 1,335 4,100
Revenue Expenditure 1,315 1,268 1,776.49
Total Expenditure 1,450 2,603 5,876.49
Source: Audited CAG Accounts for the state: 2011-12, 2010-11, 2009-10
The capital and revenue expenditure incurred on power sector increased primarily due to
increase in general expenditure under state investments and the increase in subsidy
payments to TNEB under the scheme to electrify villages.
4.3. ANALYSIS ON STATE GUARANTEES AND SUBSIDIES
Guarantees
The table below depicts the Guarantees given to Power Sector relative to State Revenue
Table XXV-7: Guarantees - Tamil Nadu
Particulars 2009-10 2010-11 2011-12
Rs Cr
Guarantees given by State Govt. 4,380 9,383 9,024.25
Total Revenues of the State 50,330 63,348 77,915.83
Guarantees as a %age of Total
Revenues of State 8.70% 14.81% 11.58%
Source: Audited CAG Accounts for the state: 2011-12, 2010-11, 2009-10
As shown above, there has been a substantial increase in the Guarantees given by the
government to Power sector, i.e. from ~9% of State Revenues in 2009-10 to ~12% in
2011-12.
The table below depicts the share of different utilities in sector guarantees in 2011-12:

AF-MERCADOS EMI
Power Sector Operations and Impact on State Finances – Volume II 376
Table XXV-8: Share of Guarantees among Utilities - Tamil Nadu
Utilities 2009-10 2010-11 2011-12
Share in
Sector
Guarantees
% (2011-
12)
Rs Cr
Tamil Nadu Electricity Board 4,380 3,980 0 37%
Tamil Nadu Generation and
Distribution Corporation Limited
(TANGEDCO)
0 3,298 7,199 80%
Tamil Nadu Transmission
Corporation Limited
(TANTRANSCO)
0 2,106 1,825.28 20%
Source: Audited CAG Accounts for the state: 2011-12, 2010-11, 2009-10
Over the span of three years, the Generation and Distribution sector (TANGEDCO)
accounted for a major share of 46%.
Subsidy
The table below depicts the average share of utilities in subsidies given to Power sector and
the average share of sector in total state subsidy over three years:
Table XXV-9: Subsidy - Tamil Nadu
Utility 2009-10 2010-11 2011-12
Average
Share in
Sector
Subsidy
(%)
Rs Cr
Power Sector subsidy 1,358 1,281 1,801.1 100.00%
Total Subsidy 1,358 1,281 8,698 19%
Source: Audited CAG Accounts for the state:2011-12, 2010-11, 2009-10
Over the span of three years, Power sector subsidy has accounted for a significant share in
total subsidy given by the state.
4.4. POWER SECTOR FINANCING REQUIREMENT RELATIVE TO STATE ECONOMY
In this section, the expenditure (under all possible heads) on the power sector by the state
government has been listed to determine the state Power sector financing requirement
which is then compared to state finances.

AF-MERCADOS EMI
Power Sector Operations and Impact on State Finances – Volume II 377
The sector financing requirement is estimated as the summation of total expenditure of the
state government on the sector including Capital and Revenue Expenditure, Loans and
Advances (Net Of Recoveries) and Public Debt repaid (Net of Receipts) by the State
Government.
Table XXV-10: Financing Requirement for the Power Sector – Tamil Nadu
Particulars
2011-12
Rs. Cr
Power Sector Expenditure (Capital and Revenue) 5876.49
Loans And Advances made by the State Government ( Net of
Recoveries) 1,392.26
8.5% Tax Free Special Bonds of the State Government (Power
Bonds) disbursed during the year ( Net of Receipts) 0
Loans for Power Projects-T&D from the Central Govt. Discharged
during the year ( Net of Receipts) 0.02
Total Power Sector Financing during the year 7268.76
Sector Financing Requirement as a % age of total revenues of state 9%
GSDP nominal 4,16,549
Sector Financing Requirement as a % age of GSDP 1.74%
Financial Profit/(Loss) of Discoms during the year (with Subsidy
Realised) (14,336)
Sector Financing Requirement (including financial losses of Discoms
) as a % age of total revenues of state 28%
Sector Financing Requirement (including financial losses of Discoms
) as a % age of GSDP 5.19%
Source: State Government annual accounts from CAG, Data book for DCH - 22nd April, 2013, PFC
Report on Utility finances – 2011-12
The financing requirement for the Power sector in the state was estimated to be 9% of the
revenue generated by the state and 1.74 % of the Gross State Domestic Product.
Considering, the financial losses of Discoms in the year, the financing requirement of the
sector increases to 28% of the State revenue and 5.19 % of the GSDP.
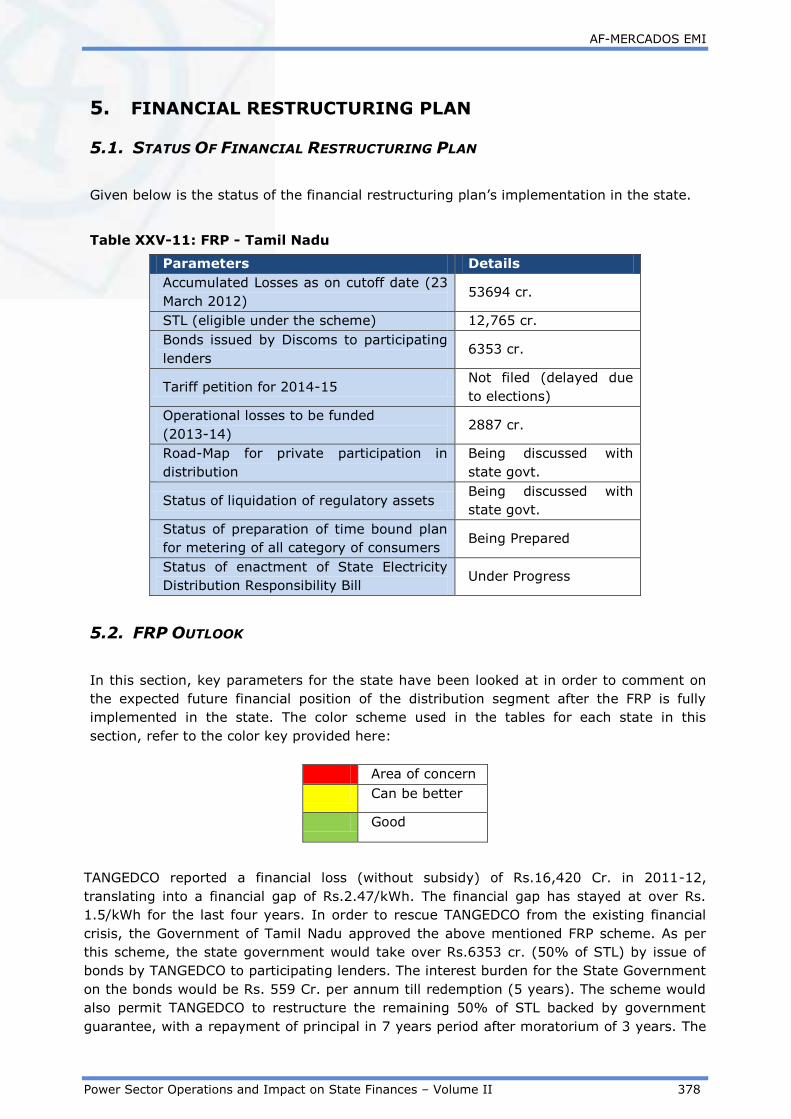
AF-MERCADOS EMI
Power Sector Operations and Impact on State Finances – Volume II 378
5. FINANCIAL RESTRUCTURING PLAN
5.1. STATUS OF FINANCIAL RESTRUCTURING PLAN
Given below is the status of the financial restructuring plan’s implementation in the state.
Table XXV-11: FRP - Tamil Nadu
Parameters Details
Accumulated Losses as on cutoff date (23
March 2012) 53694 cr.
STL (eligible under the scheme) 12,765 cr.
Bonds issued by Discoms to participating
lenders 6353 cr.
Tariff petition for 2014-15 Not filed (delayed due
to elections)
Operational losses to be funded
(2013-14) 2887 cr.
Road-Map for private participation in
distribution
Being discussed with
state govt.
Status of liquidation of regulatory assets Being discussed with
state govt.
Status of preparation of time bound plan
for metering of all category of consumers Being Prepared
Status of enactment of State Electricity
Distribution Responsibility Bill Under Progress
5.2. FRP OUTLOOK
In this section, key parameters for the state have been looked at in order to comment on
the expected future financial position of the distribution segment after the FRP is fully
implemented in the state. The color scheme used in the tables for each state in this
section, refer to the color key provided here:
Area of concern
Can be better
Good
TANGEDCO reported a financial loss (without subsidy) of Rs.16,420 Cr. in 2011-12,
translating into a financial gap of Rs.2.47/kWh. The financial gap has stayed at over Rs.
1.5/kWh for the last four years. In order to rescue TANGEDCO from the existing financial
crisis, the Government of Tamil Nadu approved the above mentioned FRP scheme. As per
this scheme, the state government would take over Rs.6353 cr. (50% of STL) by issue of
bonds by TANGEDCO to participating lenders. The interest burden for the State Government
on the bonds would be Rs. 559 Cr. per annum till redemption (5 years). The scheme would
also permit TANGEDCO to restructure the remaining 50% of STL backed by government
guarantee, with a repayment of principal in 7 years period after moratorium of 3 years. The

AF-MERCADOS EMI
Power Sector Operations and Impact on State Finances – Volume II 379
operational losses of TANGEDCO during the interim period would be funded under the FRP
scheme as per the following terms:
Table XXV-12: Operating losses funding Schedule – TANGEDCO
Particulars
Years
2012-13 2013-14 2014-15
Cash loss/Operating
loss (Rs.Cr.) 8183 3849 2060
Funding by banks 100% 75% 50%
Funding by GoTN - 25% 50%
Source: Data submitted by the state to the FFC
Some of the key parameters relevant to successful FRP implementation at the state level
have been presented for Tamil Nadu in the table below.
Table XXV-13: Historical Parameters – Tamil Nadu
Key Parameters 2005-06
2006-
07
2007-
08
2008-
09
2009-
10
2010-
11
2011-
12
2012-
13
2013-
14
AT&C losses 17% 16% 16% 14% 19% 19% 20% n.a n.a
Tariff Hikes 0% 0% 0% 0% 0% 9% 9% 37% 4%
Subsidy
Received/Booked 100% 100% 100% 86% 100% 100% 100% n.a n.a
Interest Cost/Total
Cost 6% 6% 7% 8% 10% 11% 10% n.a n.a
ACS-ARR Gap w/o
subsidy – Rs./kWh 0.49 0.44 0.81 1.55 1.77 2.00 2.47 n.a n.a
Source: PFC report on utility finances and Discom ARRs
Some of the key observations from the above table, along with relevant state-level aspects
are listed below.
- The AT&C losses in Tamil Nadu have ranged from 15-20% during the period under
review. A >1.5% annual reduction in AT&C losses, in order to benefit from the
central grants support scheme, will require persistent efforts on part of the Discom.
However, it is important to note here that AT&C losses are based on the estimated
consumption in the agricultural sector. Agriculture and hut service connections are
provided free supply of power and they are entirely unmetered in Tamil Nadu.
Hence, it might not be totally appropriate to take the AT&C loss benchmark point of
2010-11 as given in the table above.
- The regulatory commission in Tamil Nadu revised tariffs in 2010-11, after a period of
7 years. In the last 3 financial years, the tariffs have been revised regularly (as much
as 37% in 2012-13). In 2011-12, the state revised tariff for agriculture from Rs.
250/HP/annum to Rs. 2500/HP/annum. As part of the FRP, it is critical for the
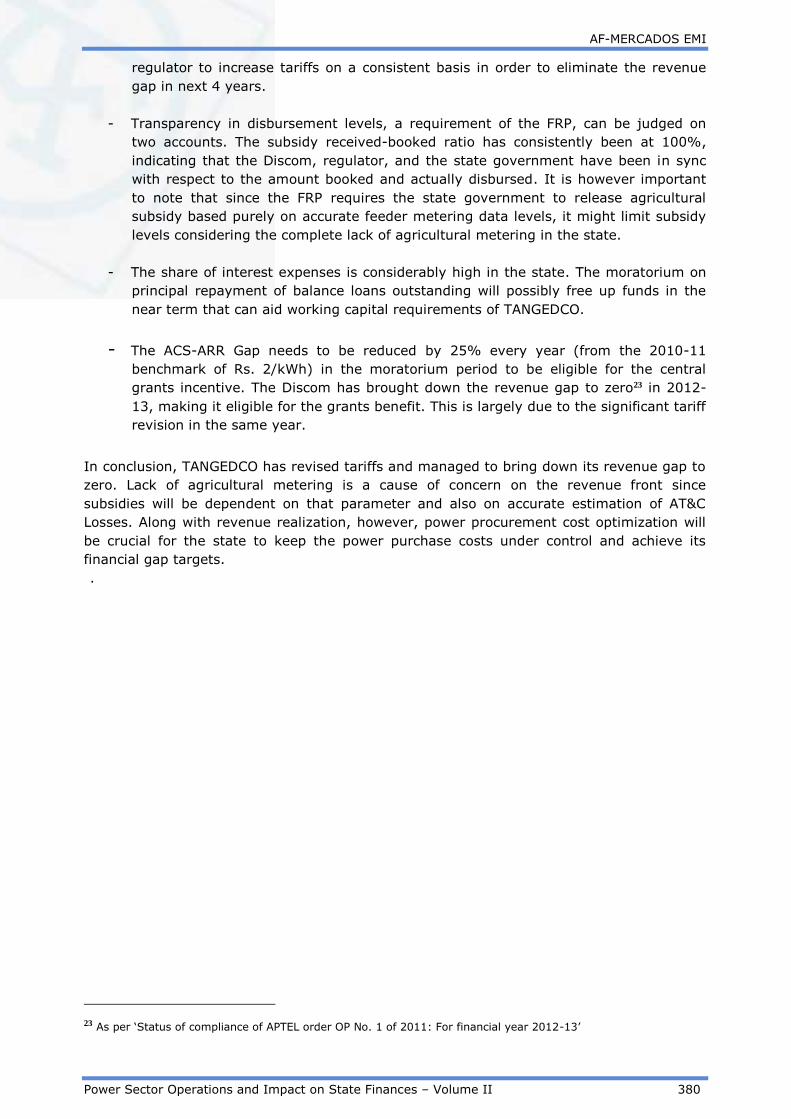
AF-MERCADOS EMI
Power Sector Operations and Impact on State Finances – Volume II 380
regulator to increase tariffs on a consistent basis in order to eliminate the revenue
gap in next 4 years.
- Transparency in disbursement levels, a requirement of the FRP, can be judged on
two accounts. The subsidy received-booked ratio has consistently been at 100%,
indicating that the Discom, regulator, and the state government have been in sync
with respect to the amount booked and actually disbursed. It is however important
to note that since the FRP requires the state government to release agricultural
subsidy based purely on accurate feeder metering data levels, it might limit subsidy
levels considering the complete lack of agricultural metering in the state.
- The share of interest expenses is considerably high in the state. The moratorium on
principal repayment of balance loans outstanding will possibly free up funds in the
near term that can aid working capital requirements of TANGEDCO.
- The ACS-ARR Gap needs to be reduced by 25% every year (from the 2010-11
benchmark of Rs. 2/kWh) in the moratorium period to be eligible for the central
grants incentive. The Discom has brought down the revenue gap to zero23 in 2012-
13, making it eligible for the grants benefit. This is largely due to the significant tariff
revision in the same year.
In conclusion, TANGEDCO has revised tariffs and managed to bring down its revenue gap to
zero. Lack of agricultural metering is a cause of concern on the revenue front since
subsidies will be dependent on that parameter and also on accurate estimation of AT&C
Losses. Along with revenue realization, however, power procurement cost optimization will
be crucial for the state to keep the power purchase costs under control and achieve its
financial gap targets. .
23 As per ‘Status of compliance of APTEL order OP No. 1 of 2011: For financial year 2012-13’

AF-MERCADOS EMI
Power Sector Operations and Impact on State Finances – Volume II 381
6. ASSESSMENT OF REGULATORY EFFECTIVENESS
The Government of Tamil Nadu, duly recognizing the need for reforms in the power sector,
issued a transfer scheme in October 2010 which was called “Tamil Nadu Electricity
(Reorganization and Reforms) Transfer Scheme, 2010”. This scheme extended to whole of
the state as well as all the properties, interests, liabilities etc. of the state and came into
force on November 1, 2010.
6.1. STATUS OF IMPORTANT REGULATIONS:
Power sector reforms are fairly recent in the state and not much time has passed since the
reforms were implemented in Oct 2010. From 1957 till 2010, the power sector in the state
was governed by Tamil Nadu Electricity Board (TNEB) with the responsibility of handling
the generation, transmission and distribution assets and managing over 21 million
consumers of electricity. In October 2010, the state government implemented a transfer
scheme which unbundled TNEB into three separate companies, TNEB Limited (Holding
Company), TANTRANSCO (Transmission Company) and TANGEDCO (Generation and
Distribution Company).
Since the implementation of reforms, TNERC had issued its second tariff order in 2010
(first was in 2003) after a period of seven years and has used the Multi Year Tariff (MYT)
framework for the first time with a control period of 3 years (FY 2010-11 to FY 2012-13). It
is presently in the second control period.
6.2. STATUS OF OPEN ACCESS IMPLEMENTATION:
The Government of India has approved nondiscriminatory open access to the transmission
system to all generators for injecting power and to any consumer to carry the power from
the point of injection to his load. To augment the power supply, the Government of Tamil
Nadu has also permitted third party sale of power produced by IPPs, CPPs & other private
power producers through short term Intra-State open access to HT consumers within Tamil
Nadu as it will provide an incentive to the generators within the State to produce to their
full capacity. Generators within Tamil Nadu are being allowed to sell power to HT
consumers through intra- state open access.
Presently, the state has the maximum number of OA customers in the country.
Figure XXV-11: Comparison of Open Access Consumers – Tamil Nadu
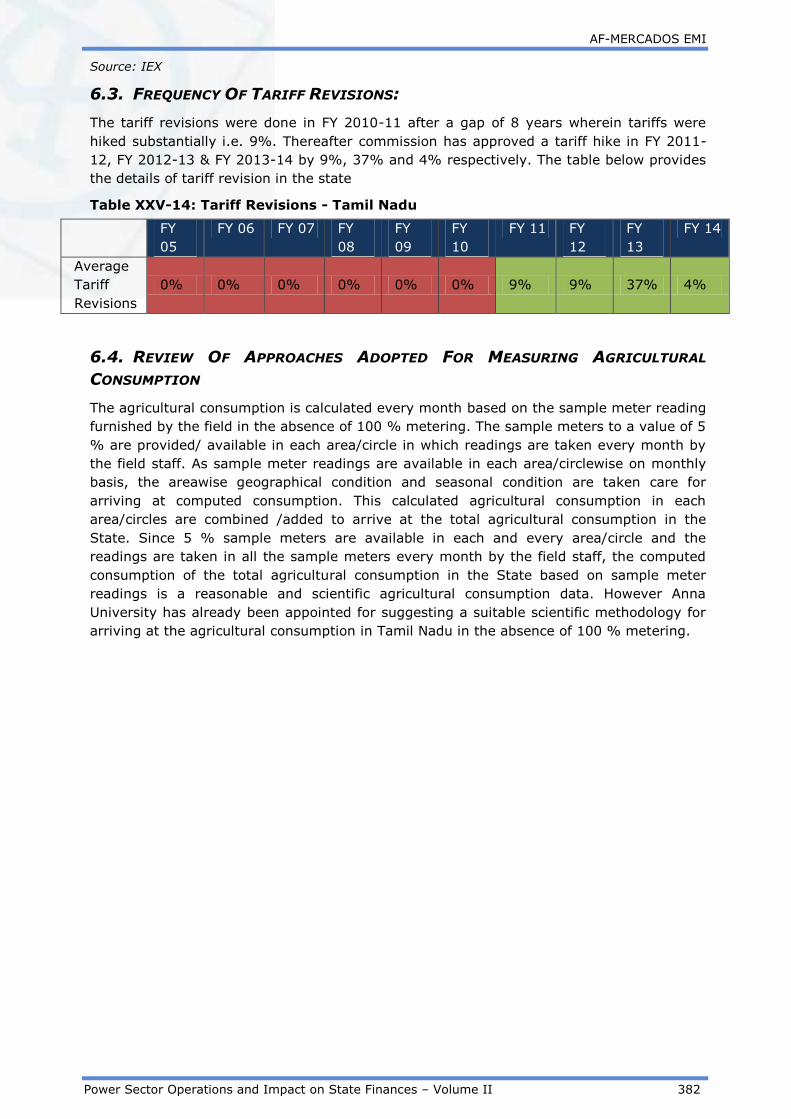
AF-MERCADOS EMI
Power Sector Operations and Impact on State Finances – Volume II 382
Source: IEX
6.3. FREQUENCY OF TARIFF REVISIONS:
The tariff revisions were done in FY 2010-11 after a gap of 8 years wherein tariffs were
hiked substantially i.e. 9%. Thereafter commission has approved a tariff hike in FY 2011-
12, FY 2012-13 & FY 2013-14 by 9%, 37% and 4% respectively. The table below provides
the details of tariff revision in the state
Table XXV-14: Tariff Revisions - Tamil Nadu
FY
05
FY 06 FY 07 FY
08
FY
09
FY
10
FY 11 FY
12
FY
13
FY 14
Average
Tariff
Revisions
0% 0% 0% 0% 0% 0% 9% 9% 37% 4%
6.4. REVIEW OF APPROACHES ADOPTED FOR MEASURING AGRICULTURAL
CONSUMPTION
The agricultural consumption is calculated every month based on the sample meter reading
furnished by the field in the absence of 100 % metering. The sample meters to a value of 5
% are provided/ available in each area/circle in which readings are taken every month by
the field staff. As sample meter readings are available in each area/circlewise on monthly
basis, the areawise geographical condition and seasonal condition are taken care for
arriving at computed consumption. This calculated agricultural consumption in each
area/circles are combined /added to arrive at the total agricultural consumption in the
State. Since 5 % sample meters are available in each and every area/circle and the
readings are taken in all the sample meters every month by the field staff, the computed
consumption of the total agricultural consumption in the State based on sample meter
readings is a reasonable and scientific agricultural consumption data. However Anna
University has already been appointed for suggesting a suitable scientific methodology for
arriving at the agricultural consumption in Tamil Nadu in the absence of 100 % metering.

AF-MERCADOS EMI
Power Sector Operations and Impact on State Finances – Volume II 383
7. SUMMARY
1. Tariff Hikes: The tariff revisions were done in FY 2010-11 after a gap of 8 years
wherein tariffs were hiked substantially i.e. 9%. The gap between ARR and ACS has
been consistently increasing. In addition to this the quantum of power procured to
meet the increased demand, due to inadequate capacity addition in own sources,
has drastically risen. Also there has been an increase in imported coal prices and
increase in Renewable Based power which is costlier than the conventional power.
All this has led to a sharp increase in ACS. On the other hand, the ARR has not kept
pace with the increasing costs; 90 percent of the power sold to consumers is below
Cost of Supply and the current tariff structure has imbalances which have led to
under recovery from Domestic and Agriculture consumers. Efficiency gains need to
be pushed forward – appropriate tariffs revisions need to take place regularly in the
state.
2. Subsidy: The trend in subsidy pay-out with respect to the subsidy booked was
100% except for FY09. The subsidies provided by GoTN have been progressively
increasing over the years. In 2011-12, different consumer categories were given
either free or subsidized electricity. This includes agriculture, hut services, power
loom, handloom and lift irrigation cooperative societies, places of public worship,
streetlights, and public water supply. The financial problems have been accentuated
by provision of free power supply to these consumers by GoTN. The agriculture
subsidies are determined on the basis of the existing agriculture pump set capacity
records with TANGEDCO. As the records are outdated, the subsidies are
underestimated and are, hence, inadequate to cover the actual expenditure. It is
important that these records are suitably updated and show the actual figures based
on present ground level situation.
3. Operational Efficiency: The cost of supply of Discoms has been increasing over the
years especially due to the increase in power purchase costs and interest burden.
The Aggregated Technical & Commercial losses (AT&C) for TANGEDCO have been
more or less averaging ~19% over the period between FY05 to FY12. The collection
Efficiency has improved over the years reaching more than 100% during FY07. This,
however, is based on the estimated consumption in the agricultural sector (in
absence of agriculture metering in the state).
4. Financial Viability: Currently the distribution business is making huge losses and
the deficit is increasing year over year. One big challenge for the state is to increase
its own installed capacity in order to be self-sustainable and not having to buy
expensive power from external sources especially in the short term. The principal
solution, which also remains to be the single biggest challenge, is to increase tariffs
to attain financial viability while keeping the industrial growth steady. This is a big
trade off as a higher industrial tariff could lead to disinvestments in the State.
5. Transmission Infrastructure: The existing transmission system in Tamil Nadu
does not have any ultra-high capacity lines of 700KV or even 440 KV. It only has a
few 230 KV lines which creates a problem for the state in evacuating power from
surplus regions (or load centers) and supplying it to regions with deficit with
minimal transmission losses. The way forward is undergoing feeder separation,
strengthening and upgrading the transmission and distribution systems to reduce
the T&D losses which are currently adversely affecting the power situation in the
state.

AF-MERCADOS EMI
Power Sector Operations and Impact on State Finances – Volume II 384
6. Metering of Consumers: Tamil Nadu has not achieved 100% consumer metering
so far. Agriculture and hut service connections are provided free supply of power
and they are entirely unmetered, accounting for almost 15% of the total consumers.
There is a strong need to meter these consumers to understand the trends and the
exact quantum of power consumed by each of these consumers. Such a mechanism
would ensure more targeted actions towards addressing the problems being faced
by the sector.
7. States Guarantees: Guarantees given by the State to Power sector represent a
significant proportion (11.58%) of Total Revenues of the state in 2011-12.
8. Revenues from the sector to the state: Total Revenue – Tax and Non Tax (Rs.
1040 Crores) from the Power sector is less than the total expenditure on the sector
(Rs. 5876.49 Crores)

AF-MERCADOS EMI
Power Sector Operations and Impact on State Finances – Volume II 385
XXVI TRIPURA
1. INTRODUCTION
1.1. BACKGROUND – POWER SECTOR OVERVIEW
Tripura is the second most populous state in the North Eastern region with a population
density of 350 per square Km. Around 83% of the state population lives in rural areas and
a majority of households still remain un-electrified. The Government of Tripura had set up
the Tripura Electricity Regulatory Commission (TERC) on 31st May 2004 as a statutory body
as one main commission under section 82 of the Electricity Act, 2003 with the objective to
improve performance of the state power sector and bring in more transparency. Similarly,
the operational assets of the state government’s Power Department were transferred to
Tripura State Electricity Corporation Limited (TSECL), responsible for the entire power
value chain of generation, transmission and distribution. The new entity started its
operation from 1st January 2005.
1.2. GENERATION MIX
The total installed capacity as on February 2014 (including allocated share in Joint &
Central Sector plants) for Tripura was 433.07 MW. It has grown by 5% from Feb 2013
level of 412.02 MW. Out of total capacity as on Feb 2014, Gas accounted for the highest
(~81% ) followed by Hydro (~14%) and RE (~4%)
Figure below highlights the generation capacity including allocated share in Joint & Central
sector plants.
Figure XXVI-1: Generation Capacity Mix as on Feb 2014- Tripura
Source: CEA
1.3. POWER SUPPLY POSITION
Energy deficit in Tripura has remained consistent at 5% over the past three financial years.
The peak deficit has also been between 0-2% during these years. This is due to improved
capacity addition and infrastructure development in the state. Further, with Oil and Natural
Gas Company (ONGC) and North East Electric Power Corporation (NEEPCO) setting up new
gas based power plants of 726 MW and 101 MW respectively, the state energy and peak
deficit is expected to be eliminated.
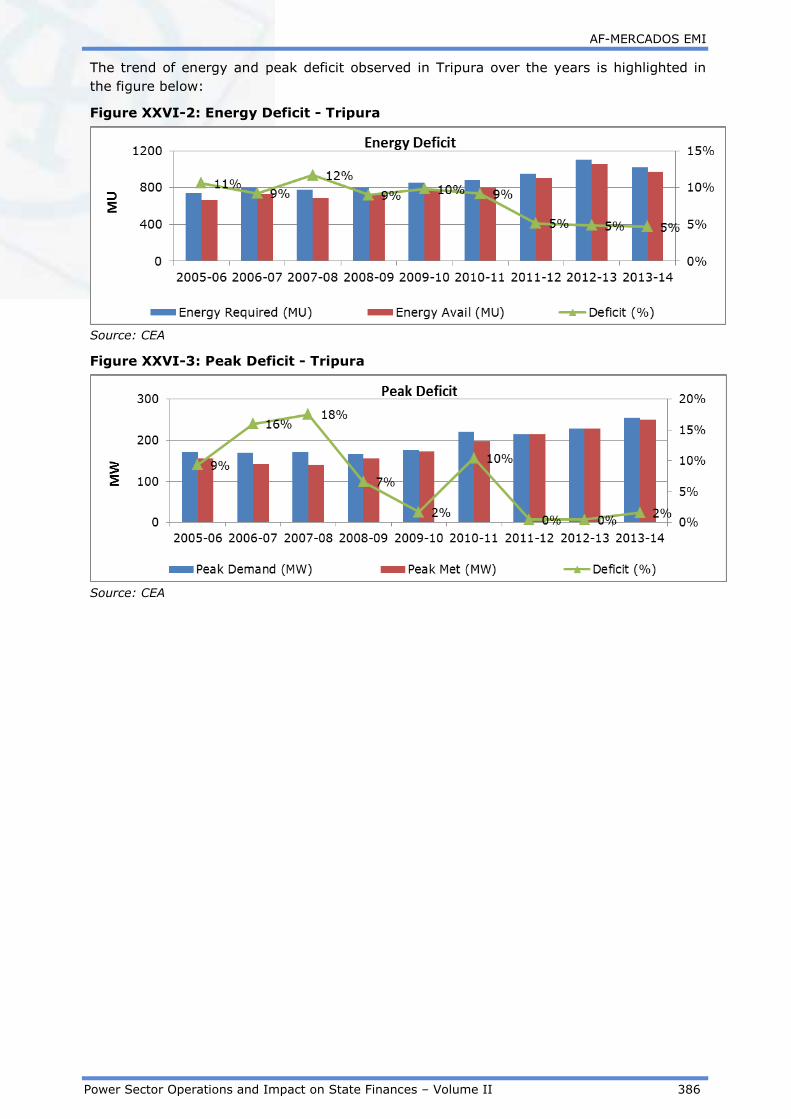
AF-MERCADOS EMI
Power Sector Operations and Impact on State Finances – Volume II 386
The trend of energy and peak deficit observed in Tripura over the years is highlighted in
the figure below:
Figure XXVI-2: Energy Deficit - Tripura
Source: CEA
Figure XXVI-3: Peak Deficit - Tripura
Source: CEA

AF-MERCADOS EMI
Power Sector Operations and Impact on State Finances – Volume II 387
2. ASSESSMENT OF OPERATIONAL PERFORMANCE OF
DISTRIBUTION UTILITIES
2.1. CONSUMER SALES MIX OF TRIPURA
In Tripura, TSECL is the sole entity resposible for power distribution across all sets of
consumers in the state.
In FY 2011-12, domestic sector dominated the sales mix with a share of 36%, followed by
commercial category (6%). The share of domestic sales have increased from 25% in 2004-
05 to 36% in 2011-12. A major reason for such increase is the ongoing RGGVY scheme and
the Kutir Jyoti scheme in the state.
The historical trend of consumer sales mix for the state is given in the figure below:-
Figure XXVI-4: Historical Trend in Consumer Sales Mix - Tripura
Source: PFC
The overall sales have registered a CAGR of 1% over the span of seven years wherein the
sales of commercial category have registered a higher CAGR of approximately 7% followed
by the domestic category with a CAGR of 6%.
In terms of revenue contribution, domestic category contributed more than 33% of the
revenue, followed by commercial category with an 8% share.
The figure below compares the sales mix of FY 2011-12 and the revenue realized from the
different category of consumers.
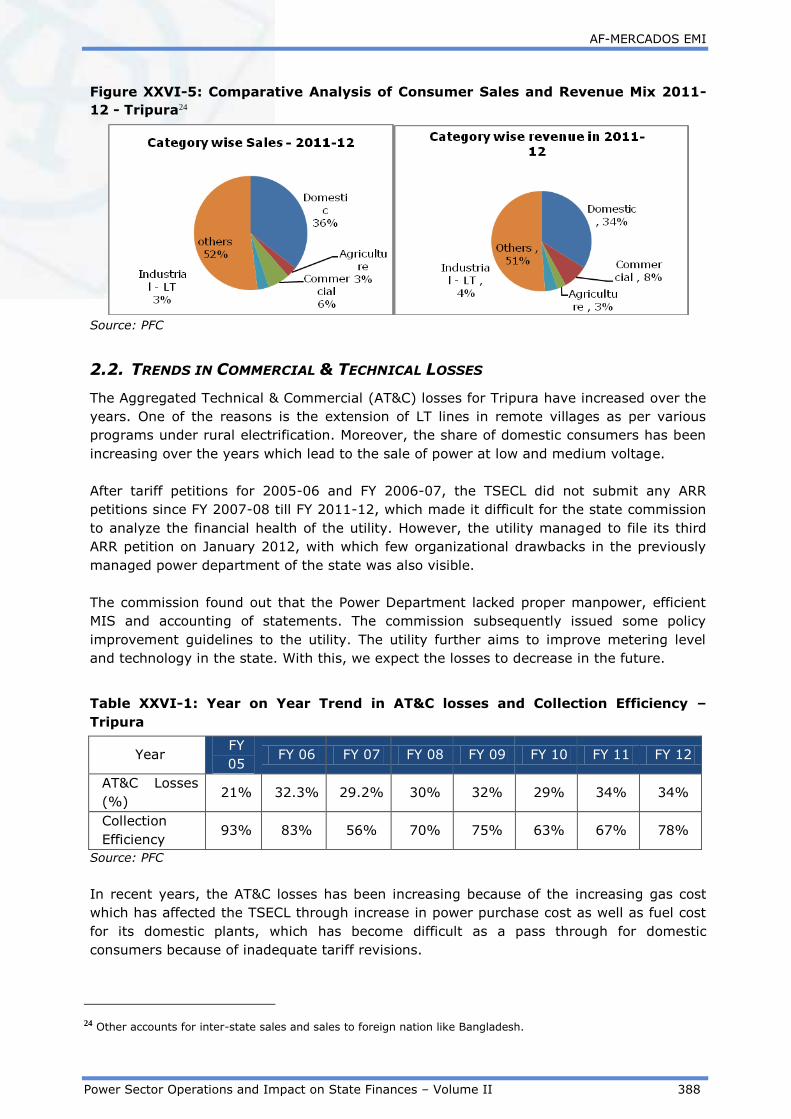
AF-MERCADOS EMI
Power Sector Operations and Impact on State Finances – Volume II 388
Figure XXVI-5: Comparative Analysis of Consumer Sales and Revenue Mix 2011-
12 - Tripura24
Source: PFC
2.2. TRENDS IN COMMERCIAL & TECHNICAL LOSSES
The Aggregated Technical & Commercial (AT&C) losses for Tripura have increased over the
years. One of the reasons is the extension of LT lines in remote villages as per various
programs under rural electrification. Moreover, the share of domestic consumers has been
increasing over the years which lead to the sale of power at low and medium voltage.
After tariff petitions for 2005-06 and FY 2006-07, the TSECL did not submit any ARR
petitions since FY 2007-08 till FY 2011-12, which made it difficult for the state commission
to analyze the financial health of the utility. However, the utility managed to file its third
ARR petition on January 2012, with which few organizational drawbacks in the previously
managed power department of the state was also visible.
The commission found out that the Power Department lacked proper manpower, efficient
MIS and accounting of statements. The commission subsequently issued some policy
improvement guidelines to the utility. The utility further aims to improve metering level
and technology in the state. With this, we expect the losses to decrease in the future.
Table XXVI-1: Year on Year Trend in AT&C losses and Collection Efficiency –
Tripura
Year FY
05 FY 06 FY 07 FY 08 FY 09 FY 10 FY 11 FY 12
AT&C Losses
(%) 21% 32.3% 29.2% 30% 32% 29% 34% 34%
Collection
Efficiency 93% 83% 56% 70% 75% 63% 67% 78%
Source: PFC
In recent years, the AT&C losses has been increasing because of the increasing gas cost
which has affected the TSECL through increase in power purchase cost as well as fuel cost
for its domestic plants, which has become difficult as a pass through for domestic
consumers because of inadequate tariff revisions.
24 Other accounts for inter-state sales and sales to foreign nation like Bangladesh.

AF-MERCADOS EMI
Power Sector Operations and Impact on State Finances – Volume II 389
2.3. TRENDS IN DISTRIBUTION COST
Power purchase cost accounts for majority of distribution cost. The power purchase cost
has accounted for an average of ~40% of the total distribution cost over the years (Refer
table below). However, over the years, the generation cost has been subsequently
increasing. This is because of subsequent capacity addition and setting up of new
generating plants in the state.
The per-unit cost break-up for different cost components for the state of Tripura is
provided in the table below:-
Table XXVI-2: Year on Year Trend Distribution Cost Breakup - Tripura
Cost Component
(Rs. per kWh) FY 05 FY 06 FY 07 FY 08 FY 09 FY 10 FY 11 FY 12
Power Purchase
Cost 0.98 1.03 1.12 1.98 1.80 1.53 1.81 2.43
O&M (R&M +
A&G + EC) 0.46 0.60 0.68 1.45 1.49 1.64 1.42 1.36
Interest 0.04 0.00 0.00 0.00 0.00 0.00 0.00 0.00
Depreciation 0.21 0.23 0.23 0.50 0.48 0.49 0.55 0.54
Generation cost 0.44 0.40 0.47 0.89 0.93 1.03 2.12 2.18
Other cost 0.00 0.00 0.00 0.00 0.02 0.00 0.00 0.00
Source: PFC
W.r.t., the increasing costs and less revenue realization, TSECL had filed a Fuel and Power
Purchase Cost Adjustment (FPPCA) petition in FY 2010-11. Subsequently, TERC approved
for a subsidy to specified category of consumers in the year 2010-11 and later a tariff hike
of 31% for FY13-14 to meet these costs.
2.4. REVENUE REALIZATION
The revenue realization has remained poor in the state because of ineffective metering of
consumers. The erstwhile power department of the state had been historically carrying out
metering, billing and collection manually, leaving wide scope for errors. As a result, the
level of thefts in the state has also been high, further deteriorating the revenue realized.
Moreover, a large number of consumers fall under special category in the rural
electrification program, making it even more difficult for the utility to improve their
revenue realization.
The table below shows the revenue realization (without subsidy) from different consumer
categories over the years.
Table XXVI-3: Historical Trend Consumer Category Wise Revenue Realization -
Tripura
Category FY
05
FY
06
FY
07
FY
08
FY
09
FY
10
FY
11 FY 12
Domestic 1.57 1.87 2.34 2.54 2.60 2.82 2.82 3.46
Agriculture 1.11 1.25 1.11 3.33 1.52 1.50 2.37 3.45
Commercial 2.63 3.24 3.33 3.78 3.41 3.62 4.26 4.67

AF-MERCADOS EMI
Power Sector Operations and Impact on State Finances – Volume II 390
Category FY
05
FY
06
FY
07
FY
08
FY
09
FY
10
FY
11 FY 12
Industrial HT - - - - - - - -
Industrial LT 2.61 3.33 3.04 2.61 3.13 3.33 4.52 4.52
Others 1.90 2.72 3.35 3.09 4.70 3.98 3.20 3.57
Source: PFC
The state needs to invest in better technology in the power distribution area under R-
APDRP so as to improve the present state of poor financial position of TSECL.

AF-MERCADOS EMI
Power Sector Operations and Impact on State Finances – Volume II 391
3. ASSESSMENT OF FINANCIAL PERFORMANCE OF –
DISTRIBUTION UTILITY
3.1. FINANCIAL HEALTH OF DISTRIBUTION UTILITIES
The financial losses of TSECL without subsides has increased over the years. As discussed
earlier, major reason for this is the increasing share of rural consumers and increasing fuel
costs
Figure XXVI-6: Historical Trend Financial Losses (w/o) subsidies – Tripura
Source: PFC
The losses had decreased in FY 06 till FY 09 because of inter-state trading/sale of power by
the utility. Lack of tariff revisions against increasing fuel costs and inefficient collection has
led to losses in the recent years.
3.2. SUBSIDY BOOKED V/S SUBSIDY RECEIVED
The figure below provides the subsidy booked v/s subsidy received for the distribution
utilitiy in the state.
Figure XXVI-7: Historical Trend Subsides Booked v/s Subsidies Received –
Tripura
Source: PFC
The Subsidy received has been the same as subsidy booked over the years, except in the
year 2010-11.

AF-MERCADOS EMI
Power Sector Operations and Impact on State Finances – Volume II 392
3.3. ACS V/S ARR
The gap (with subsidy) between average cost of supply and average revenue realized (with
subsidy) has remained marginal over the years until 2008-09. Thereafter, the gap has
widened. This is because the tariff revisions not being adequate with respect to the
increasing fuel costs.
Figure XXVI-8: Historical Trend ACS v/s ARR (with subsidy) – Tripura
Source: PFC
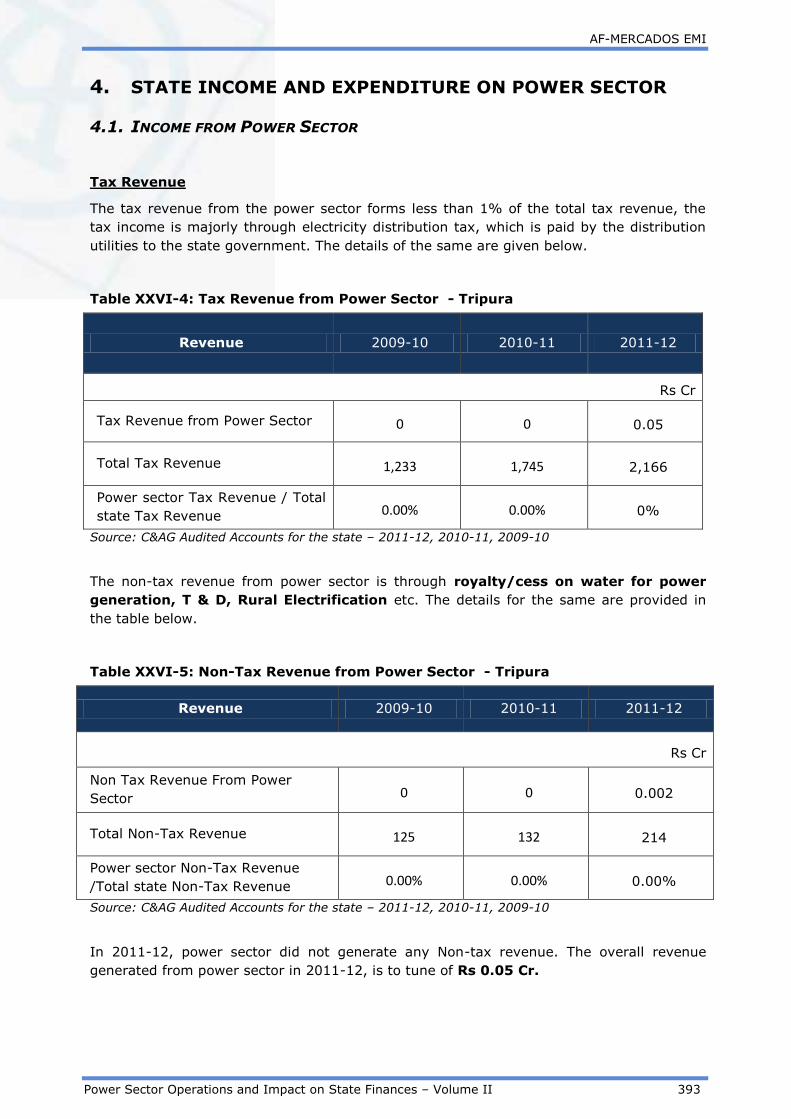
AF-MERCADOS EMI
Power Sector Operations and Impact on State Finances – Volume II 393
4. STATE INCOME AND EXPENDITURE ON POWER SECTOR
4.1. INCOME FROM POWER SECTOR
Tax Revenue
The tax revenue from the power sector forms less than 1% of the total tax revenue, the
tax income is majorly through electricity distribution tax, which is paid by the distribution
utilities to the state government. The details of the same are given below.
Table XXVI-4: Tax Revenue from Power Sector - Tripura
Revenue 2009-10 2010-11 2011-12
Rs Cr
Tax Revenue from Power Sector 0 0 0.05
Total Tax Revenue 1,233 1,745 2,166
Power sector Tax Revenue / Total
state Tax Revenue 0.00% 0.00% 0%
Source: C&AG Audited Accounts for the state – 2011-12, 2010-11, 2009-10
The non-tax revenue from power sector is through royalty/cess on water for power
generation, T & D, Rural Electrification etc. The details for the same are provided in
the table below.
Table XXVI-5: Non-Tax Revenue from Power Sector - Tripura
Revenue 2009-10 2010-11 2011-12
Rs Cr
Non Tax Revenue From Power
Sector 0 0 0.002
Total Non-Tax Revenue 125 132 214
Power sector Non-Tax Revenue
/Total state Non-Tax Revenue 0.00% 0.00% 0.00%
Source: C&AG Audited Accounts for the state – 2011-12, 2010-11, 2009-10
In 2011-12, power sector did not generate any Non-tax revenue. The overall revenue
generated from power sector in 2011-12, is to tune of Rs 0.05 Cr.

AF-MERCADOS EMI
Power Sector Operations and Impact on State Finances – Volume II 394
4.2. EXPENDITURE ON POWER SECTOR
The table below depicts the expenditure on power sector in Tripura.
Table XXVI-6: Expenditure on Power Sector - Tripura
Categories 2009-10 2010-11 2011-12
Rs Cr
Capital expenditure 77 76 22
Revenue Expenditure 30 22 42
Total Power Sector Expenditure 106 98 64
Source: C&AG Audited Accounts for the state – 2011-12, 2010-11, 2009-10
The overall expenditure has come down from Rs 106 Cr in FY10 to Rs 64 Cr in FY12.
Over the years, the expenditure on power sector has far exceeded the revenues generated
from the sector.
4.3. ANALYSIS ON STATE GUARANTEES AND SUBSIDIES
Guarantees
The table below depicts the guarantees given to power sector relative to the total revenue
of the state
Table XXVI-7: Guarantees as a Percentage of Total Revenues - Tripura
Particulars 2009-10 2010-11 2011-12
Rs Cr
Guarantees given by State Govt. 0 0 47
Total Revenues of the State 1,359 1,876 2,310
Guarantees as a %age of Total
Revenues of State 0.00% 0.00% 1.97%
Source: C&AG Audited Accounts for the state – 2011-12, 2010-11, 2009-10
As shown above, the guarantees towards power sector have been minimal and have
constituted a marginal share of total revenues of the state (~1.97% in 2011-12)

AF-MERCADOS EMI
Power Sector Operations and Impact on State Finances – Volume II 395
.The table below depicts the three year average share of different utilities in
sector guarantees:
Table XXVI-8: Utility wise Breakup of Guarantees - Tripura
Utilities 2009-10 2010-11 2011-12
Average
Share in
Sector
Guarante
es (%)
Rs Cr
RGGVY 0 0 4 9%
RAPDRP 0 0 43 91%
Source: C&AG Audited Accounts for the state – 2011-12, 2010-11, 2009-10
In 2011-12, Guarantees to the power sector were towards RAPDRP which accounted for a
substantial share of 91% in total sector guarantees followed by RGGVY.
4.4. POWER BONDS
As per RBI ‘State Finance Report’ 2014, the outstanding liability of Power Bonds in the
state as on 31st March 2014 was Rs 10 Cr.
4.5. POWER SECTOR FINANCING REQUIREMENT RELATIVE TO STATE ECONOMY
In this section, the expenditure (under all possible heads) on the power sector by the state
government has been listed to determine the state Power sector financing requirement
which is then compared to state finances.
The sector financing requirement is estimated as the summation of total expenditure of the
state government on the sector including Capital and Revenue Expenditure, Loans and
Advances (Net Of Recoveries) and Public Debt repaid (Net of Receipts) by the State
Government.
Table XXVI-9: Financing Requirement of Power Sector (2011-12) - Tripura
Particulars 2011-12
Rs. Cr.
Power Sector Expenditure (Capital and Revenue) 64
Loans And Advances made by the State Government (Net of
Recoveries) 10
8.5% Tax Free Special Bonds of the State Government (Power
Bonds) disbursed during the year (Net Of Receipts)* 6
Loans for Power Projects-T&D from the Central Govt.
Discharged during the year (Net Of Receipts) 0

AF-MERCADOS EMI
Power Sector Operations and Impact on State Finances – Volume II 396
Total Power Sector Financing during the year 80
Sector Financing Requirement as a % age of total revenues of
state 3%
GSDP nominal 15,645
Sector Financing Requirement as a % age of GSDP 0.51%
Financial Profit /(Losses) of Discoms during the year (156)
Sector Financing Requirement as a % age of total revenues of
state including financial losses of Discoms 10%
Sector Financing Requirement as a % age of GSDP including
financial losses 1.51%
Source: State Government annual accounts from CAG, Data book for DCH - 22nd April, 2013, PFC
Report on Utility finances – 2011-12
The financing requirement for the Power sector in the state was estimated to be ~3% of
the revenue generated by the state and 0.51 % of the Gross State Domestic Product.
Considering, the financial losses of Discoms in the year, the financing requirement of the
sector increases to a significant 10% of the State revenue and 1.51% of the GSDP.
The financing requirement of the sector far exceeds the revenues generated from the
sector. The main component of the requirement is Discom Losses. This suggests
investments are required to rectify the inefficiencies of the segment. However, there is no
capital expenditure made towards T & D segment. Considering, the guarantees given,
burden on state finances increases further. It is vital that the State must invest in building
and strengthening the infrastructure of Power Sector (especially T n D) to enhance the
revenue generating capacity of the sector.
The Rural Electrification segment of the power sector is one of the main focus areas in the
state. Major portion of capital expenditure and a significant portion of guarantees are
routed towards this segment.
4.6. POWER BONDS
8.5% Power Bonds Government of Tripura was issued by State Government to be
redeemed by 2016. The outstanding balance as on 1st April 2006 was Rs 63.51 Cr. The
total outstanding balance at the end of 2011-12 was Rs. 28.58 Cr.

AF-MERCADOS EMI
Power Sector Operations and Impact on State Finances – Volume II 397
5. ASSESSMENT OF REGULATORY EFFECTIVENESS
The Government of Tripura constituted the Tripura Electricity Regulatory Commission
(TERC) on 31st May, 2004. TERC has introduced number of regulations in the state such as
MYT regulations, 2011 and Open Access regulations, 2010, Renewable Purchase Obligation
(RPO) regulations, 2009, Electricity Supply Code regulations, 2011, etc.
The key aspects of regulatory effectiveness have been discussed below -
5.1. STATUS OF MYT REGULATIONS
The Commission has notified MYT Regulations in FY 2011. However, in the tariff order
2012-13, the commission states that the MYT framework cannot be carried forward
because of lack of reliable data.
5.2. STATUS OF OPEN ACCESS IMPLEMENTATION
The Commission notified the Open Access Regulations on 2010 for consumers requiring
more than 1MW, stating guidelines on open access wheeling charges, cross subsidy
surcharge and additional surcharges.
5.3. FREQUENCY OF TARIFF REVISIONS
The tariff revisions in the state have not been frequent. Tariffs have been revised to the
tune of 31% in FY 2013-14.
5.4. METERING OF CONSUMERS
The commission has issued guidelines under the Electricity Supply Code regulations, 2011
for metering of consumers under different category, stating that no new connections
should be provided without a meter. With a view towards 100% metering of trunk and sub-
transmission lines, the Government of India has also sanctioned the following schemes
worth Rs 27.5 crores towards the state under R-APDRP:
100% metering of the feeders in the entire State, metering of Distribution
Transformers, Consumer metering & augmentation of sub-transmission & distribution
system in West Tripura District.
Metering, computerization, sub-transmission & distribution scheme for Agartala
Town.

AF-MERCADOS EMI
Power Sector Operations and Impact on State Finances – Volume II 398
6. SUMMARY
The state has high energy potential and is expected to be one of the power richest states in
the North Eastern Region. However, the level of metering needs to improve and there must
be efficiency and transparency in operations so as to stabilize the financial scenario. Until
late 2012, the billing for domestic and commercial categories was done under non-
telescopic route. However, the commission has decided to introduce telescopic tariff for
these categories in the state just like other major states in the years forward. The key
parameters of the states are discussed below-
1. Inadequate Tariff Revisions: The tariff revisions in the state have been
inadequate with respect to the increasing fuel costs leading to an increase in
subsidy and/or losses.
2. Power purchase cost: With increasing fuel cost, power purchase costs have been
subsequently increasing. However, in recent years, Tripura has been investing in
power infrastructure development in the state. As a result, the power purchase cost
is expected to decrease in the future.
3. Subsidy: The subsidy burden of the state has increased in the year 2010-11 and
2011-12 in order to meet the unrecovered costs from rural consumers and to meet
the increase in fuel cost.
4. Financial Losses: The distribution financial losses without subsides in Tripura has
increased over the years due to inadequate tariff revisions. The loses without
subsidy have increased form Rs 48 Cr in 2009-10 to Rs 156 Cr in FY 2011-12.
5. States Guarantees: for the sector are not very significant and account for
approximately 2% of Total Revenues of the state
6. Exposure to the State Gov. to power sector: The financing requirement for the
Power sector in the state was estimated to be 3% of the revenue generated by the
state and 0.51 % of the Gross State Domestic Product. Considering, the Financial
losses of Discoms in the year 2011-12, the financing requirement of the sector
decreases to 10% of the State revenue and 1.51% of the GSDP.
AF-MERCADOS EMI
Power Sector Operations and Impact on State Finances – Volume II 399
XXVII UTTAR PRADESH
1. INTRODUCTION
1.1. BACKGROUND – POWER SECTOR OVERVIEW
Uttar Pradesh, one of the largest states in the country shares it border with eight states
and shares international border with Nepal on the northeast. The state in the last five years
has witnessed a significant ~5% CAGR in its energy demand, on account of significant
increase in industrial demand during the same time frame.
Privatization in the distribution sector happened as early as the 1990s wherein the state
government in conjunction with the centre carried out a pilot in the Greater NOIDA region
of UP. About 77 percent of consumers in greater NOIDA were industries, and the rest were
households. There was almost no subsidy offered in that area. An agreement was signed,
in 1993, between UPSEB and a private company, NOIDA Power Company (NPCL) pertaining
to distribution rights in the region.
In 1999 Government of UP notified the UP Electricity Reforms Act wherein it established a
Regulatory Commission and on January 14, 2000 enabled the trifurcation of the UPSEB.
The erstwhile UPSEB was trifurcated into three corporations namely UP Power Corporation
(UPPCL), UP Rajya Vidyut Utpadan Nigam (UPRVUNL), UP Jal Vidyut Nigam (UPJVNL).
Kanpur Electricity Supply Company (KESCO), a distribution company was formed as a 100
percent subsidiary of UPPCL, effective 15th January, 2000. Need for further unbundling of
UPPCL (responsible for both Transmission and Distribution functions) along functional lines
was again felt after the enactment of the Electricity Act 2003, and four new distribution
companies (“Discoms”) were created vide Uttar Pradesh Transfer of Distribution
Undertaking Scheme 2003-
• Dakshinanchal Vidyut Vitaran Nigam Limited (Agra Discom),
• Madhyanchal Vidyut Vitaran Nigam Limited (Lucknow Discom),
• Pashchimanchal Vidyut Vitaran Nigam Limited (Meerut Discom) and
• Poorvanchal Vidyut Vitaran Nigam Limited (Varanasi Discom)
Post the unbundling exercise and transfer scheme dated 15th January 2000 & 14th June
2000, the distribution utilities were formed for the purpose of handling the distribution
business in the State of Uttar Pradesh. The Government of Uttar Pradesh as per the U.P.
Electricity Reform Act 1999 also set up the Uttar Pradesh Electricity Regulatory Commission
(UPERC).

AF-MERCADOS EMI
Power Sector Operations and Impact on State Finances – Volume II 400
1.2. GENERATION MIX
The total installed capacity in February 2014 (including allocated share in Joint & Central
Sector plants) for Uttar Pradesh was 14,339 MW out of which Coal based power capacity
accounted for ~75% followed by Hydro (~13% ) . RE based capacity accounted for a share
of ~4%.
Figure below presents the generation capacity including allocated share in Joint & Central
sector plant
Figure XXVII-1: Generation Capacity Mix - Uttar Pradesh
75%
4%
2%
13%
6%
Generation Capacity (incl. of allocated share from Joint and Central sector plants
Coal Gas Nuclear Hydro Renewable
Source: CEA
1.3. POWER SUPPLY POSITION
Uttar Pradesh has been witnessing consistent power supply shortage with high energy
deficit levels, in the range 11% to 22%.
The capacity addition in the state has not been able to match the increasing demand of the
state resulting in high levels of deficit. Further, the state DISCOMs have not been able to
block power purchase through long term PPAs, increasing the dependency of the state on
short-term power markets.
The peak demand in the state was high from FY 06 to FY 10. Further, with no major spike
in peak deficit (except in FY 13) the peak deficit levels in the state have remained low.
The trend of energy deficit observed in Uttar Pradesh over the years is presented in the
figure below:

AF-MERCADOS EMI
Power Sector Operations and Impact on State Finances – Volume II 401
Figure XXVII-2: Historical Trend in Energy Deficit - Uttar Pradesh
21%
16%17%
22% 22%
15%
11%
17%
14%
0%
5%
10%
15%
20%
25%
0
10000
20000
30000
40000
50000
60000
70000
80000
90000
100000M
UEnergy Deficit
Energy Required (MU) Energy Available (MU) Energy Deficit
Source: CEA
The trend of peak deficit observed in Uttar Pradesh over the years is presented in the
figure below:
Figure XXVII-3: Historical Trend in Peak Deficit - Uttar Pradesh
19%18%
23% 22% 21%
4%2%
14%
6%
0%
5%
10%
15%
20%
25%
0
2,000
4,000
6,000
8,000
10,000
12,000
14,000
16,000
MW
Peak Deficit
Peak Demand (MW) Peak Met (MW) Deficit (%)
Source: CEA
Further, the above deficit levels in the state are expected to reduce further in short to
medium term, on account of huge stranded capacity and low prevalent prices in the short
term market. The figure below presents the average daily short-term prices prevalent in
IEX in FY 14.

AF-MERCADOS EMI
Power Sector Operations and Impact on State Finances – Volume II 402
Figure XXVII-4: Average Daily Short Term Prices IEX – N2 Region (2013-14)
0.00
0.50
1.00
1.50
2.00
2.50
3.00
3.50
4.00
4.50
1/4/
2013
16-0
4-20
13
1/5/
2013
16-0
5-20
13
31-0
5-20
13
15-0
6-20
13
30-0
6-20
13
15-0
7-20
13
30-0
7-20
13
14-0
8-20
13
29-0
8-20
13
13-0
9-20
13
28-0
9-20
13
13-1
0-20
13
28-1
0-20
13
12/1
1/20
13
27-1
1-20
13
12/1
2/20
13
27-1
2-20
13
11/1
/201
4
26-0
1-20
14
10/2
/201
4
25-0
2-20
14
12/3
/201
4
27-0
3-20
14
Average Daily Day Ahead Market Price - N2
Maximum Price - Rs. 3.87 per kWh
Average Price - Rs. 2.55 per kWh
Minimum Price - Rs. 1.10 per kWh
Source: IEX

AF-MERCADOS EMI
Power Sector Operations and Impact on State Finances – Volume II 403
2. ASSESSMENT OF OPERATIONAL PARAMETERS OF
DISTRIBUTION UTILITIES
2.1. CONSUMER SALES MIX OF UTTAR PRADESH25
The distribution activity in the state of Uttar Pradesh is segregated into five distribution
utilities with maximum share of the demand in the state of Uttar Pradesh served by
PaVVNL. Domestic consumers dominate the consumer mix in the state of Uttar Pradesh,
which forms more than 80% of the consumers in the state.
In 2010-11, domestic segmented dominated the sales mix with a share of 37%, followed
by industry (HT) (21%) and agriculture category (18%).
The share of domestic and agriculture sales has reduced over the years from ~40% and
~21% in 2004-05 to ~37% and ~18% in 2010-11 respectively. Further, the demand from
categories like educational institutions, etc that constitute the other segment has increased
from 4% in 2004-05 to 11% in 2010-11.
The historical trend of consumer sales mix for the state is given in figure below:-
Figure XXVII-5: Historical Trend in Consumer Sales Mix - Uttar Pradesh
0%
20%
40%
60%
80%
100%
2004-05 2005-06 2006-07 2007-08 2008-09 2009-10 2010-11
Perc
enta
ge
Years
Domestic Agriculture Commercial
Industrial - HT Industrial - LT others
The overall sales have registered a CAGR of 12% over the span of six years wherein the
sales of commercial category have registered a higher CAGR of 13% followed by the
industrial category with a CAGR of 12%. Simultaneously, the demand of domestic category
has increased at a CAGR of ~11%, from 2004-05 to 2010-11.
In terms of revenue contribution, industries contributed ~39% of revenue, followed by
domestic and commercial categories with a share of 29% and 13%, respectively, while
agriculture contributed a meagre 8% of the revenue. This clearly indicates that domestic
and agriculture categories are heavily cross subsidized by the industrial and commercial
categories.
25 Consumer wise sales and revenue data for MVVN in 2011-12 not available.

AF-MERCADOS EMI
Power Sector Operations and Impact on State Finances – Volume II 404
The figure below compares the sales mix of FY 2011-12 and the revenue realized from the
different category of consumers.
Figure XXVII-6: Consumer wise sales and Revenue Mix 2010-11 – Uttar Pradesh
Domestic 29%
Commercial13%
Agriculture 8%
Industrial - HT 30%
Industrial - LT 9%
Others 11%
Category wise Revenue in 2010-11
Domestic 37%
Agriculture18%
Commercial 10%
Industrial - HT 21%
Industrial - LT 5%
others 9%
Category wise Sales - 2010-11
Source: PFC
2.2. TRENDS IN COMMERCIAL LOSSES AND TECHNICAL LOSSES
The Aggregated Technical & Commercial losses (AT&C) for Uttar Pradesh distribution
utilities have historically remained extremely high compared to the national average.
The loss level reported by the distribution utilities of Uttar Pradesh is in the range of 35%
(FY 09) - 47% (FYO5).
The trend observed over the years in collection efficiency has had a moderate impact on
the AT&C losses in the state. In FY10, with ~90% collection efficiency the reported AT&C
losses were ~34%, which increased to ~40% due to decline in collection efficiency to
~85% in the subsequent year.
Table XXVII-1: Historical Trend in AT&C losses and Collection Efficiency – Uttar
Pradesh
Year FY 05 FY 06 FY 07 FY 08 FY 09 FY 10 FY 11
AT&C Losses (%) 47% 44% 44% 35% 35% 34% 40%
Collection Efficiency (%) 75% 80% 80% 91% 87% 90% 85%
Source: PFC
The persistent high levels of AT&C losses in the state are on account of high line losses due
to ageing transmission and sub-transmission network. Further, the lack of infrastructure to
assess the true usage by consumers across the state has resulted in large-scale power
thefts.
2.3. TRENDS IN DISTRIBUTION COSTS
Power purchase cost accounts for majority of distribution cost. The power purchase cost
accounts for ~85% of the total distribution cost.
The table below indicates the historical trend in the distribution costs in the state of Uttar
Pradesh.
Table XXVII-2: Historical Trend in Distribution Cost Breakup – Uttar Pradesh
Cost Component
(Rs per kWh)
FY
05
FY
06
FY
07
FY
08
FY
09
FY
10
FY
11
FY
12
Power Purchase Cost 2.24 2.47 2.39 2.51 2.69 2.82 2.96 3.1
9
O&M (R&M + A&G +
EC) 0.23 0.22 0.21 0.22 0.26 0.30 0.38
0.3
4

AF-MERCADOS EMI
Power Sector Operations and Impact on State Finances – Volume II 405
Cost Component
(Rs per kWh)
FY
05
FY
06
FY
07
FY
08
FY
09
FY
10
FY
11
FY
12
Interest 0.05 0.12 0.11 0.13 0.12 0.20 0.12 0.0
8
Depreciation 0.13 0.14 0.11 0.12 0.11 0.09 0.07 0.0
8
Other cost 0.03 0.03 0.02 0.04 0.02 0.19 0.03 0.0
2
Source: PFC
The PLFs of the state generating units continue to be on the lower side when compared to
the national average. The PLF of the state owned plant decreased from 64.14% in FY 10 to
60.28% in FY 11. The historical trend in PLF of the state owned generation plant and the
corresponding prevalent prices in short term market is presented below:
Figure XXVII-7: Average Daily Short Term Prices IEX – N2 Region (2011-12)
0.00
1.00
2.00
3.00
4.00
5.00
6.00
7.00
8.00
9.00
01-0
4-20
11
16-0
4-20
11
01-0
5-20
11
16-0
5-20
11
31-0
5-20
11
15-0
6-20
11
30-0
6-20
11
15-0
7-20
11
30-0
7-20
11
14-0
8-20
11
29-0
8-20
11
13-0
9-20
11
28-0
9-20
11
13-1
0-20
11
28-1
0-20
11
12-1
1-20
11
27-1
1-20
11
12-1
2-20
11
27-1
2-20
11
11-0
1-20
12
26-0
1-20
12
10-0
2-20
12
25-0
2-20
12
11-0
3-20
12
26-0
3-20
12
Average Daily Day Ahead Market Price - N2
Maximum Price - Rs. 7.79 per kWh
Average Price - Rs. 3.27 per kWh
Minimum Price - Rs. 1.71 per kWh
Source: IEX
The per unit interest cost liable increased significantly in the year FY 10, to cover for the
sharp increase in power purchase costs from independent power producers and short term
market. The figure below illustrates the increasing debt undertaken by the state DISCOMs.
Figure XXVII-8: Historical Trend in Debt undertaken – Uttar Pradesh
3,216
4,188
5,098
4,468 4,862
5,987
4,903 4,952
-
1,000
2,000
3,000
4,000
5,000
6,000
7,000
2004-05 2005-06 2006-07 2007-08 2008-09 2009-10 2010-11 2011-12
Rs. C
r.
Loans From FI's Other Loans State Govt Total Debt

AF-MERCADOS EMI
Power Sector Operations and Impact on State Finances – Volume II 406
Source: PFC
2.4. REVENUE REALIZATION
Tariff realization from different consumer category has not increased commensurate to
increasing power purchase cost. Although, the tariff were increased from FY 09, the high
levels of AT&C losses eroded the impact of the tariff increase in the state.
Table XXVII-3: Historical Trend in Consumer wise Average Revenue Realization –
Uttar Pradesh
Years 2004-05 2005-06 2006-07 2007-08 2008-09 2009-10 2010-11
Domestic 2.17 1.76 1.54 1.56 1.80 2.01 2.86
Agriculture 1.32 1.11 1.27 1.31 1.53 1.52 1.57
Commercial 5.33 4.86 3.53 3.58 4.80 4.71 4.74
Industrial HT 4.71 4.42 3.98 4.46 5.15 4.81 5.13
Industrial LT 6.92 5.35 3.5726 4.0127 5.20 5.81 6.23
Source: PFC
Agricultural and rural-domestic consumers are being subsidized by the state government
and the share of state government subsidies accounts for ~17% of the total revenues.
Increase in power purchase cost, high levels of AT&C losses and inaccurate demand
estimation for unmetered categories has resulted in deterioration of the financial position of
the distribution utilities of the state.
26 Estimate sale towards Small & Medium Power for the year 2006-07.
27 Estimate sale towards Small & Medium Power for the year 2007-08 – True up Order, ARR 2009-10.

AF-MERCADOS EMI
Power Sector Operations and Impact on State Finances – Volume II 407
3. ASSESSMENT OF FINANCIAL PERFORMANCE OF –
DISTRIBUTION UTILITY
3.1. FINANCIAL HEALTH OF DISTRIBUTION UTILITY
The distribution financial losses without subsides in Uttar Pradesh has increased over the
years. As discussed earlier, this is because of increasing power purchase costs, high levels
of AT&C losses and inaccurate demand estimation for the unmetered category.
The figure below depicts the year on year trend in profit after tax registered by the state
DISCOMs.
Figure XXVII-9: Historical Trend in Financial Losses (w/o subsidy) – Uttar
Pradesh
(3,205)
(4,678) (4,832)
(5,831) (6,076)
(7,121)
(4,918)
(7,928)(9,000)
(7,500)
(6,000)
(4,500)
(3,000)
(1,500)
-
2004
-05
2005
-06
2006
-07
2007
-08
2008
-09
2009
-10
2010
-11
2011
-12
Rs. C
r
Financial Losses (PAT w/o subsidy)
Source: PFC
3.2. SUBSIDY BOOKED V/S SUBSIDY REALIZED
The subsidy burden of the state utility has increased from 9% in 2004-05 to 17% in 2011-
12. The subsidy booked has registered a CAGR of 27% over the span of seven years, which
is extremely high compared to the ACS that has registered a CAGR of 5% over the same
period. The figure below depicts the year on year trend in subsidies booked and received
by the state utility.
Figure XXVII-10: Historical Trend in Subsidy Booked v/s Subsidy Realized - Uttar
Pradesh
693 915 1,0781,853 1,581 1,816 2,107
3,596
500
3,500
6,500
9,500
12,500
2004
-05
2005
-06
2006
-07
2007
-08
2008
-09
2009
-10
2010
-11
2011
-12
Rs. Cr
Years
Subsidy Booked Subsidy Received

AF-MERCADOS EMI
Power Sector Operations and Impact on State Finances – Volume II 408
Source: PFC
As shown in the graph above, the amount of subsidies booked by the state has increased
significantly from FY 05 to FY 12. This is primarily on account of subsidy to the agricultural
category and certain sections of domestic category. It can be observed from the above
figure, that in all the years, amount of subsidy realised was equal to the amount of subsidy
booked by the state DISCOMs.
3.3. ACS V/S ARR
The gap with subsidy between average cost of supply and average revenue realized (with
subsidy) has widened over the years. This is primarily due to the under-recovery of tariff
due to prevalent high levels of AT&C losses in the state.
The figure below depicts the trend in revenue gap on per unit sale of electricity to the
consumer
Figure XXVII-11: Historical Trend in ACS v/s ARR (with subsidy) - Uttar Pradesh
0.630.88 0.79 0.78 0.86 0.95
0.47 0.62
2.68
2.972.84
3.013.19
3.60 3.563.71
2.05 2.09 2.052.23 2.33
2.65
3.09 3.09
0.00
0.50
1.00
1.50
2.00
2.50
3.00
3.50
4.00
2004-05 2005-06 2006-07 2007-08 2008-09 2009-10 2010-11 2011-12
Rs./
kWh
Years
Gap(with subsidy) ACS ARR (with subsidy)
Source: PFC
Lack of power procurement strategy and absence of robust strategy to counter the high
levels of commercial losses have further increased the gap between average cost to serve
and average revenue realized.

AF-MERCADOS EMI
Power Sector Operations and Impact on State Finances – Volume II 409
4. STATE EXPOSURE TO POWER SECTOR
4.1. INCOME FROM POWER SECTOR
The source of tax revenue is the electricity distribution tax, paid to the state government
by the distribution utilities. The tax revenue from the power sector has formed less than
~0.45% of the total tax revenues of the state. The details for the same are provided in the
table below:
Table XXVII-4: Tax Revenue from Power Sector - Uttar Pradesh
Revenue 2009-10 2010-11 2011-12
Rs Cr
Tax Revenue From Power
Sector 272 357 458.20
Total Tax Revenue 65,674 84,574 1,02,964.38
Power sector Tax Revenue /
Total state Tax Revenue 0.41% 0.42% 0.45%
Source: C&AG Audited Accounts for the state – 2011-12, 2010-11, 2009-10
The tax revenue from the power sector has increased since 2009-10. However, the
contribution of sector in Total Tax revenue has increased marginally since FY10.
The non-tax revenue from power sector is through Royalty/CESS on water for power
generation, transmission and distribution, Rural Electrification etc. The Non-Tax
revenue, which is Rs 77.17 Cr, contributes a marginal ~0.76% of the total non-tax
revenues in 2011-12. The details for the same are provided in the table below:
Table XXVII-5: Non-Tax Revenue from Power Sector - Uttar Pradesh
Revenue 2009-10 2010-11 2011-12
Rs Cr
Non-Tax Revenue From Power
Sector 171 103 77.17
Total Non-Tax Revenue 13,601 11,176 10,145.30
Power sector Non-Tax Revenue
/Total state Non-Tax Revenue 1.26% 0.92% 0.76%
Source: C&AG Audited Accounts for the state – 2011-12, 2010-11, 2009-10
The Non tax revenue from the sector has decreased substantially since FY10 and hence the
contribution in state revenues has also declined.
The overall revenue generated from the power sector has increased from Rs 443 Cr in FY
10 to Rs 535 Cr in FY12.

AF-MERCADOS EMI
Power Sector Operations and Impact on State Finances – Volume II 410
4.2. EXPENDITURE ON POWER SECTOR
The table below depicts the expenditure on power sector by the state of Uttar Pradesh.
Table XXVII-6: Expenditure on Power Sector - Uttar Pradesh
Categories 2009-10 2010-11 2011-12
Rs Cr
Capital expenditure 5,092 4,100 4,314.36
Revenue Expenditure 1,896 2,174 3,535.54
Total Expenditure 6,989 6,274 7,849.90
Source: C&AG Audited Accounts for the state – 2011-12, 2010-11, 2009-10
Over the span of three years the capital expenditure has decreased whereas the revenue
expenditure has increased. Decrease in investments is primarily on account of decrease in
overall capital outlay on Power projects. However, in Fy2011-12, there has been an
increase in state investments in UP Power Transmission Corporation Ltd. The revenue
expenditure increased primarily due to state investments and increase in subsidy payments
to UP Power Corporation Ltd.
It can be observed that the power sector in the state has not been self sufficient, on
account of revenue expenditure being significantly higher than the power sector revenue of
the state.
4.3. ANALYSIS ON STATE GUARANTEES AND SUBSIDIES
The state government guarantees constituted a significant ~15.57% of the overall state
revenue, towards the loan taken by the state DISCOMs. The same has been depicted in the
table below:
Table XXVII-7: Guarantees as a Percentage of Total Revenues - Uttar Pradesh
Parameter 2009-10 2010-11 2011-12
RS Cr
Guarantees given by State Govt. 14,152 17,140 17,608
Total Revenues of the State 79,275 95,750 1,13,109.68
Guarantees as a %age of Total
Revenues of State 17.85% 17.90% 16%
Source: C&AG Audited Accounts for the state – 2011-12, 2010-11, 2009-10
As shown above, there has been a substantial increase in the Guarantees given by the
government to Power sector. However, the proportion of guarantee towards Power sector
in the state revenue has declined i.e. from ~17.85 % of State Revenues in 2009-10 to
~15.57% in 2011-12.

AF-MERCADOS EMI
Power Sector Operations and Impact on State Finances – Volume II 411
The power sector received a substantial ~62% of the overall subsidy given by the state
government. The same has been depicted in table below:
Subsidy:
The table below depicts the average share of utilities in subsidies given to Power sector and
the average share of sector in total state subsidy over three years:
Table XXVII-8: Power Sector Subsidy as a Percentage of overall Subsidies - Uttar
Pradesh
Utility 2009-10 2010-11 2011-12
Average
Share in
Sector
Subsidy
(%)
Rs Cr
Compensatory Grant to UPPCL 1,342 1,500 2,996.81 83%
Compensatory Grant for
adjustment against recovery of
electricity tax to UPPCL
250 300 400.00 14%
Compensation against rebate in
electricity rate to Powerloom
Weavers
50 85 8,500.00 3%
Power Sector subsidy (% of Total
Subsidy) 1,642 1,885 3,481.81 49%
Source: C&AG Audited Accounts for the state – 2011-12, 2010-11, 2009-10
Over the span of three years, UPPCL accounted for significant 83% of total subsidy given to
the power sector by the state government. The power sector accounted for a significant
49% of the total state subsidy.
4.4. POWER BONDS
As per RBI ‘State Finance Report’ 2014, the outstanding liability of Power Bonds in the
state as on 31st March 2014 was Rs 1170 Cr.
4.5. POWER SECTOR FINANCING REQUIREMENT RELATIVE TO STATE’S ECONOMY
In this section, the expenditure (under all possible heads) on the power sector by the state
government has been listed to determine the state Power sector financing requirement
which is then compared to state finances.
The sector financing requirement is estimated as the summation of total expenditure of the
state government on the sector including Capital and Revenue Expenditure, Loans and
Advances (Net Of Recoveries) and Public Debt repaid (Net of Receipts) by the State
Government.
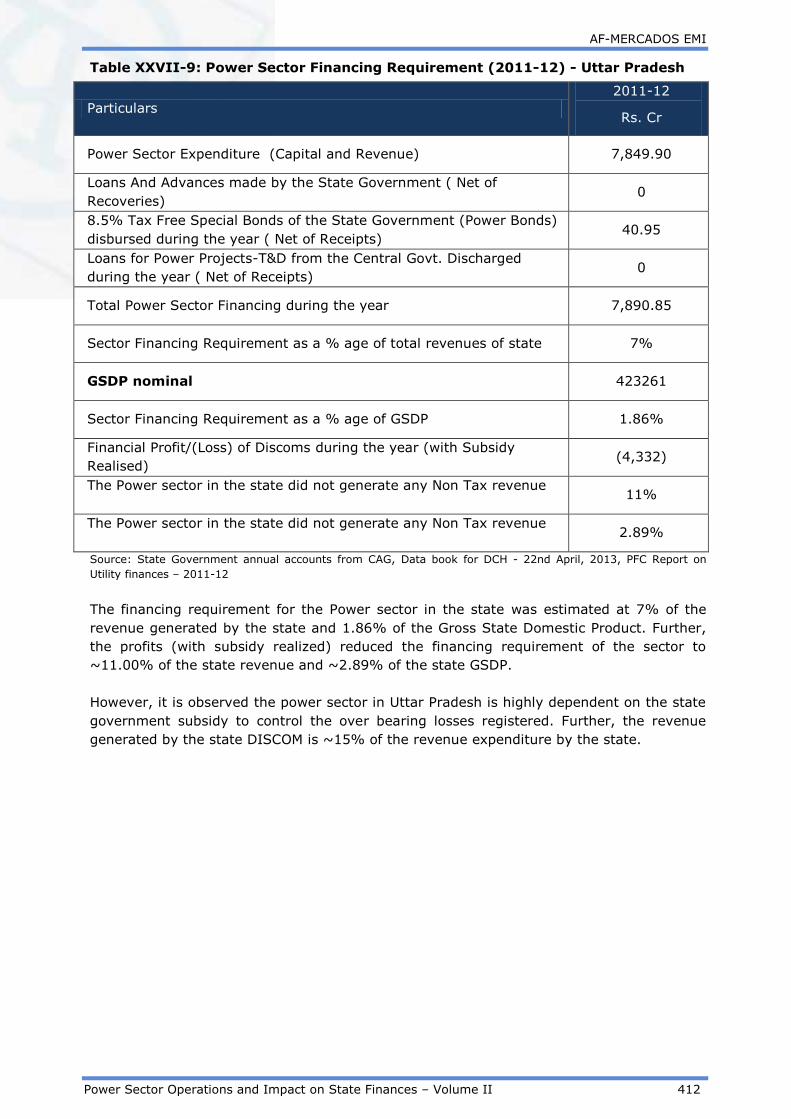
AF-MERCADOS EMI
Power Sector Operations and Impact on State Finances – Volume II 412
Table XXVII-9: Power Sector Financing Requirement (2011-12) - Uttar Pradesh
Particulars
2011-12
Rs. Cr
Power Sector Expenditure (Capital and Revenue) 7,849.90
Loans And Advances made by the State Government ( Net of
Recoveries) 0
8.5% Tax Free Special Bonds of the State Government (Power Bonds)
disbursed during the year ( Net of Receipts) 40.95
Loans for Power Projects-T&D from the Central Govt. Discharged
during the year ( Net of Receipts) 0
Total Power Sector Financing during the year 7,890.85
Sector Financing Requirement as a % age of total revenues of state 7%
GSDP nominal 423261
Sector Financing Requirement as a % age of GSDP 1.86%
Financial Profit/(Loss) of Discoms during the year (with Subsidy
Realised) (4,332)
The Power sector in the state did not generate any Non Tax revenue 11%
The Power sector in the state did not generate any Non Tax revenue 2.89%
Source: State Government annual accounts from CAG, Data book for DCH - 22nd April, 2013, PFC Report on
Utility finances – 2011-12
The financing requirement for the Power sector in the state was estimated at 7% of the
revenue generated by the state and 1.86% of the Gross State Domestic Product. Further,
the profits (with subsidy realized) reduced the financing requirement of the sector to
~11.00% of the state revenue and ~2.89% of the state GSDP.
However, it is observed the power sector in Uttar Pradesh is highly dependent on the state
government subsidy to control the over bearing losses registered. Further, the revenue
generated by the state DISCOM is ~15% of the revenue expenditure by the state.

AF-MERCADOS EMI
Power Sector Operations and Impact on State Finances – Volume II 413
5. FINANCIAL RESTRUCTURING PLAN
5.1. STATUS OF FINANCIAL RESTRUCTURING PLAN
The five Discoms in Uttar Pradesh reported a combined financial loss (without subsidy) of
Rs.7,928 Cr. in 2011-12, translating into a financial gap of Rs.1.13/kWh. The financial gap
has stayed at over Rs. 1/kWh for the last five years. The financial health of the Discoms is
even worse when its short-term liabilities are considered. Due to the existing financial crisis,
the Government of Uttar Pradesh has approved the FRP scheme.
As per the scheme, the state government would take over Rs.15,810 cr. (50% of STL) by
issue of bonds by the Discoms backed by Government guarantee to participating lenders.
The scheme would permit the Discoms to restructure the remaining 50% of STL backed by
government guarantee, with a negotiated moratorium period. The Discoms had issued
bonds for Rs. 15840 Crores, however, the bonds were not fully subscribed by the banks
leaving a shortfall of Rs. 29.62 Crores. This liability remains unfunded and shall be
discharged by the Discoms from their current revenues.
The bonds will be converted into special securities of the Government in three year time
frame starting from 2014-15 till 2016-17 with Rs. 5270.13 Crores converted each year.
The following table highlights the bond repayment schedule and State Government fiscal
impact under FRP.
Table XXVII-10: Bond Repayment Schedule and State Government fiscal impact – Uttar
Pradesh (Rs. Crores)
Particulars
Years
2012-
13
2013-
14
2014-
15
2015-
16
2016-
17
2017-
18
2018-
19
2019-
20 Total
Interest @ 9.68% - - 1530 1530 1530 1530 1530 1379 9029
Redemption of bonds
- - - - - - 1581 1581 3162
Additional subsidy burden
375 461 917 1413 3500 4000 500 0.00 11166
Total 375 461 2447 2943 5030 5530 3611 2960 73319
Source: Data submitted by the state to the FFC
Some of the key parameters relevant to FRP implementation have been shown in the table
below for Uttar Pradesh.
Table XXVII-11: Historical Parameters – Uttar Pradesh
Key Parameters 2005-06
2006-
07
2007-
08
2008-
09
2009-
10
2010-
11
2011-
12
2012-
13
2013-
14
AT&C losses 44% 44% 35% 35% 34% 40% 45% n.a n.a
Tariff Hikes 0% 0% 0% 20% 19% n.a n.a 9% 16%
Subsidy
Received/Booked 100% 100% 100% 100% 100% 100% 100% n.a n.a
Interest Cost/Total
Cost 4% 4% 4% 4% 6% 3% 2% n.a n.a
ACS-ARR Gap w/o 1.10 1.02 1.14 1.17 1.27 0.82 1.13 n.a n.a

AF-MERCADOS EMI
Power Sector Operations and Impact on State Finances – Volume II 414
subsidy – Rs./kWh
Source: PFC report on utility finances and Discom ARRs
Some of the key observations from the above table, along with relevant state-level aspects
are listed below.
- The Aggregated Technical & Commercial losses (AT&C) for Uttar Pradesh distribution
utilities have historically remained high (averaging at 40%) on account of ageing
transmission and sub-transmission network. Uttar Pradesh will require a >3% annual
reduction in AT&C losses in order to benefit from the central grants scheme. The
higher the reduction (over 3%), greater is the potential for receiving the grants from
the central government.
- While the state has revised tariffs in last 2 years, the regulator will need to hike
tariffs frequently and substantially. In the past, there have been periods of 2-3 years
with no tariff revisions at a stretch.
- The subsidies received-booked ratio has continued to be 100% for last 6-7 years. It
is however important to note that since the FRP requires the state government to
release agricultural subsidy based purely on accurate feeder metering data levels, it
might limit subsidy levels considering the existing low level of agricultural metering
(9%).
- The share of interest expenses is not very high in Uttar Pradesh. The total debt taken
by the Discoms was Rs. 4952 crores and the debt-equity ratio stood at 0.4 in 2011-
12. While those figures sound relatively moderate for the loss making Uttar Pradesh
Discoms, the payables to suppliers on the Discoms’ balance sheet stood at Rs.
39,716 crores in the same year. Clearly, the Discoms have not regularly paid the
suppliers. Lack of timely payments will force the suppliers to cut supply, increasing
the Discoms’ reliance on short term power further.
- The ACS-ARR Gap needs to be reduced annually by 25% from the 2010-11
benchmark value to be eligible for the central grants incentive. The gap will need to
be reduced by around 20 paise per year in the next 3-4 years. Assuming the AT&C
losses are reduced by 3%, the financial gap will come down by around 15 paise/unit
in terms of the cost reduction achieved by purchasing fewer units to supply the same
amount of power as in 2011-12. This implies that the technical losses will need to be
brought down by a considerable amount, unless the tariffs are revised to increase
the revenue realization.
In conclusion, the huge short term payables in Uttar Pradesh are a matter of concern and
the FRP is expected to improve its short term liquidity position. The AT&C losses are
significantly high and considerable improvement is required on that front. In order to bring
down the ACS-ARR gap, the Discoms will need to revise tariffs adequately and bring down
technical/commercial losses.
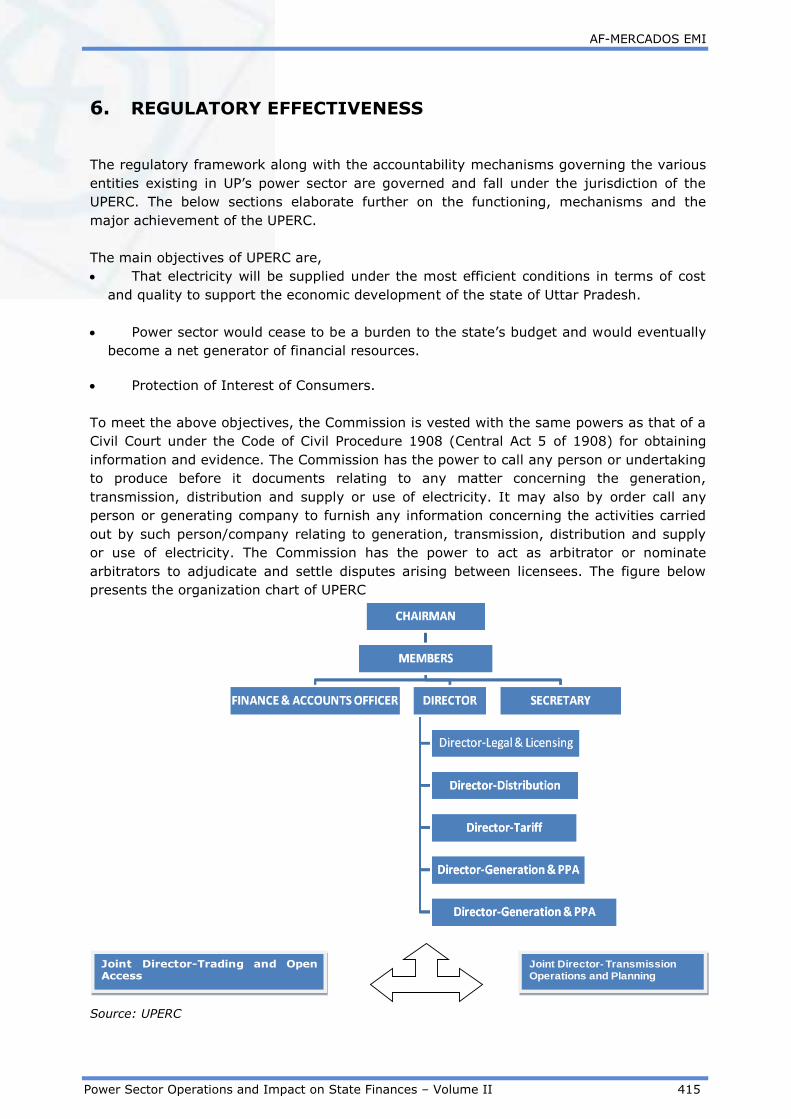
AF-MERCADOS EMI
Power Sector Operations and Impact on State Finances – Volume II 415
6. REGULATORY EFFECTIVENESS
The regulatory framework along with the accountability mechanisms governing the various
entities existing in UP’s power sector are governed and fall under the jurisdiction of the
UPERC. The below sections elaborate further on the functioning, mechanisms and the
major achievement of the UPERC.
The main objectives of UPERC are,
That electricity will be supplied under the most efficient conditions in terms of cost
and quality to support the economic development of the state of Uttar Pradesh.
Power sector would cease to be a burden to the state’s budget and would eventually
become a net generator of financial resources.
Protection of Interest of Consumers.
To meet the above objectives, the Commission is vested with the same powers as that of a
Civil Court under the Code of Civil Procedure 1908 (Central Act 5 of 1908) for obtaining
information and evidence. The Commission has the power to call any person or undertaking
to produce before it documents relating to any matter concerning the generation,
transmission, distribution and supply or use of electricity. It may also by order call any
person or generating company to furnish any information concerning the activities carried
out by such person/company relating to generation, transmission, distribution and supply
or use of electricity. The Commission has the power to act as arbitrator or nominate
arbitrators to adjudicate and settle disputes arising between licensees. The figure below
presents the organization chart of UPERC
Joint Director-Trading and OpenAccess
Joint Director- Transmission Operations and Planning
Source: UPERC

AF-MERCADOS EMI
Power Sector Operations and Impact on State Finances – Volume II 416
6.1. BUDGETING
The state regulatory commission, UPERC, is highly dependent on state government grants
and subsidies to carry out its operations. In 2012-13, state grants provided a by the state
government contributed ~20% of the overall revenue of the state commission. Further, the
state commission incurred a surplus of ~1.77 Cr in the same year.
Hence, the state commission generates marginal revenue from licensee, application fees.
6.2. STAFFING
The office of the Commission consists of permanent employees besides officials on
deputation and on contract basis. The total working strength of the commission at the end
of the financial year 2011-12 is 55. The technical post contributed ~38% of the overall
positions in the state commission
Another important aspect that needs to be considered is that considerable proportion of the
staff especially the technical staff is on deputation or on contract basis. Deputation is
generally done from another government department or from the utility itself, which again
limits the true independence of the staff of SERC’s.
6.3. MYT REGULATION
The state commission has not been able to implement the MYT Order. In July 2013, there
is only one Member in the Commission which comprises of one Chairman and two
Members28. The licensees have been issued various directions in the recent so that they
may gear up/ prepare for the MYT Regime to be put in place by 1st April 2014. The state
commission plans to introduce a MYT order for a control period of five years from FY 15 to
FY 19.
6.4. TARIFF REVISION
The tariff revisions in the state have been very sporadic. The ineffective tariff revision in
the state is one of the primary reasons for high level of gap between cost of supply and
revenue realization. Further, the irregular revisions has led to sharp increase in tariff in the
years where tariff is revised. The table below depicts the historical trend in historical
revision in the state.
Table XXVII-12: Historical Trend in Tariff Revisions - Uttar Pradesh
FY
07
FY
08
FY
09
FY
10
FY
11
FY
12
FY
13
FY
14
Average Tariff
Revisions 0% 0% 20% 19% n.a n.a 9% 16
%
Source: Approved Tariff Orders of DISCOM for that year
n.a – Not available in public domain
6.5. LEVEL OF METERING
The unmetered connections are provided to the rural BPL consumers, agriculture
consumers and public lamps. In 2011-12, ~21% of the overall consumers were unmetered
in the state. The figure below presents the category wise percentage un-metered
connections in the state.
28 Forum of Regulators

AF-MERCADOS EMI
Power Sector Operations and Impact on State Finances – Volume II 417
Figure XXVII-12: Consumer category wise percentage un-metered consumers in
2011-12 – Uttar Pradesh
86%
10%
56%
99% 97%
58%
5%
94%
65%
75%73%
62%
98% 95%88%
82%
40%
91%97%
100%
0%
10%
20%
30%
40%
50%
60%
70%
80%
90%
100%
Rural - Domestic Rural - Commercial Public Lamps Private Tube wells State Tube Wells
Category wise Percentage Unmetered Connections - 2011-12
PaVVN DVVN MVVN PuVVN
Source: Tariff Order of the respective DISCOMs (FY 2012-13).
6.5.1. CONSUMPTION NORM – UN-METERED CATEGORIES
The state commission has approved a consumption norm for the above mention un-
metered consumer categories. The table below depicts the consumption norm approved by
the commission in 2012-13 tariff order.
Table XXVII-13: Consumption Norm Un-Metered Categories
DISCOM Weighted Average Consumption Norm
Private Tube Well 91.66 kWh/KW
Domestic Rural Consumers 72.00 kWh/KW
Rural Commercial Consumers 72.00 kWh/KW
Rural State Tube Well 3562.35 kWh/consumer or pump
Public Lamps - Rural 300 kWh/KW
Public Lamps - Urban 360 kWh/KW
Source: Approved Tariff Order 2012-13 for the respective DISCOMs
6.6. OPEN ACCESS
Open access regulations were issued by UPERC 2004 as ‘Open Access Regulations, 2004’.
The present application status of open access consumers is not available.

AF-MERCADOS EMI
Power Sector Operations and Impact on State Finances – Volume II 418
7. SUMMARY
1. High Levels of Subsidy: The quantum of subsidy booked by the state DISCOMs
have increased substantially compared to the increase in the cost to supply. This
reiterates the high operational losses reported by the state DISCOMs.
2. High Levels of AT&C Losses: The state has continued to register high levels of
AT&C losses. The decreasing levels of collection efficiency coupled with increasing
electricity theft, especially by the unmetered consumers have pose a major
challenge to the state DISCOMs. The utility needs to strengthen the existing
mechanism to estimate the demand of the unmetered consumers.
3. High level of dependency on the state funding: The power sector in the state is
highly dependent on the financial support provided by the state government. The
state revenue generated by power sector forms a meager ~15% of the overall
revenue expenditure made by the state government, towards the power sector.
4. High Financial Gap: The gap (with subsidy) continues to remain high, on account of
high levels of AT&C losses, increasing power purchase costs and electricity thefts in
the state. Further, the subsidy provided by the state government is not sufficient to
cover the losses incurred by the state DISCOMs
5. Decreasing PLFs of the state generating plants: The average PLF of the state
generating plant have continued to be lower than the national average. A low PLF as
observed resulted in higher per unit fixed costs and increased purchase from short
term market, further increasing the financial loss levels of the state DISCOMs.
The overall financing requirements of the utilities places the state finances at a
high risk.

AF-MERCADOS EMI
Power Sector Operations and Impact on State Finances – Volume II 419
XXVIII UTTARAKHAND
1. INTRODUCTION
1.1. BACKGROUND – POWER SECTOR OVERVIEW
The state of Uttarakhand was, formed after reorganization of Uttar Pradesh in the year
2000.
Consequent to the formation of the state,– Uttaranchal Power Corporation Limited (UPCL)
and Uttaranchal Jal Vidyut Nigam Ltd.(UJVNL) were incorporated in 2001 pursuant to sub-
section 4 of Section 63 of UP Reorganization Act 2000. Government of India transferred all
assets located in the State of Uttaranchal to UPCL and UJVNL with effect from November 8,
2001. Subsequently, the transmission operations under UPCL were transferred to a
separate transmission company, the Power Transmission Corporation of Uttarakhand
(PTCUL) in 2005.
1.2. GENERATION CAPACITY MIX
The total installed capacity in February 2014 (including allocated share in Joint & Central
Sector plants) for Uttarakhand was 2,601 MW out of which Hydro based power capacity
accounted for ~78% followed by Coal (~12% ) and Renewable (~7%). Diesel and Nuclear
based capacity accounted for a combined share of ~4%.
Figure below presents the generation capacity including allocated share in Joint & Central
sector plants.
Figure XXVIII-1: Generation Capacity Mix - Uttarakhand
12%
3%1%
78%
7%
Generation Capacity (incl. allocated share from Joint & Central Sector Plants
Coal
Gas
Nuclear
Hydro
Renewable
1.3. POWER SUPPLY POSITION
Historically, the state of Uttarakhand has witnessed low levels of energy and peak deficit.
The energy deficit in the state increased from ~1% in FY 08 to ~7% in FY 09. The energy
deficit was ~4% in FY 14. Further, the peak deficit in the state has decreased from 14% in
FY 06 to 0% in FY 14. This clearly indicates the capacity addition was sufficient to cover the
marginal increase in peak and energy demand in FY 14.
The trend of energy deficit observed in Uttarakhand over the years is highlighted in the
figure below:
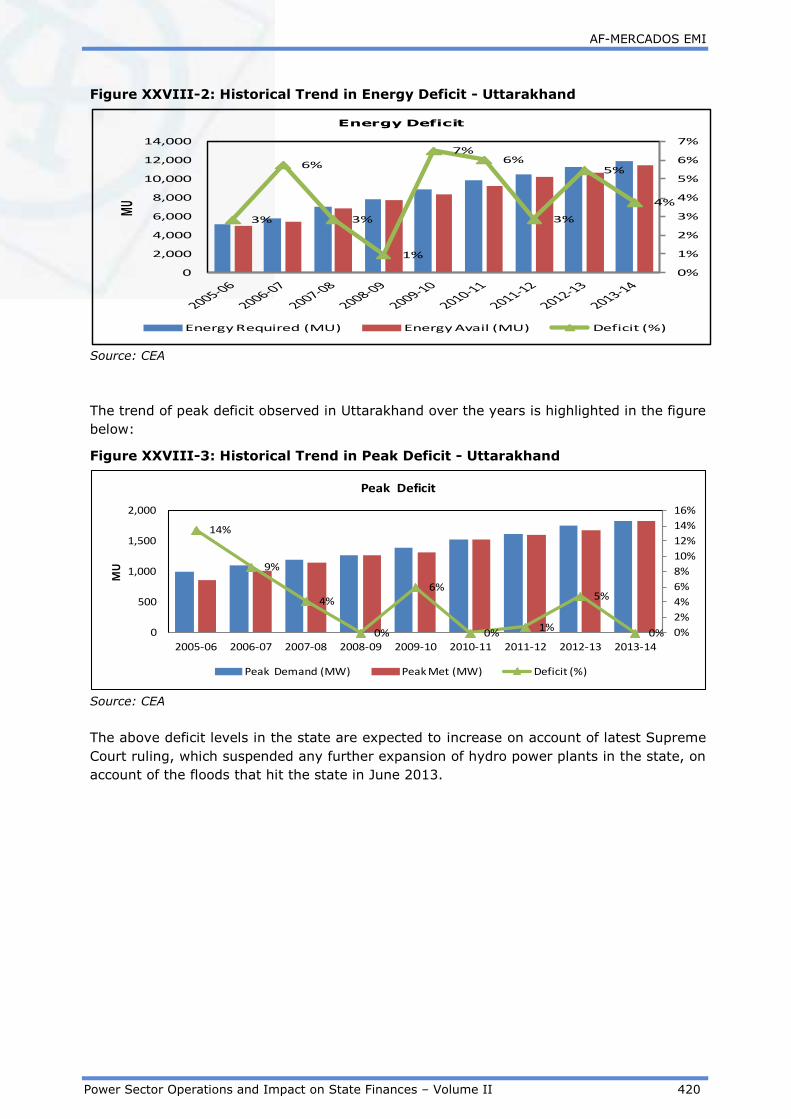
AF-MERCADOS EMI
Power Sector Operations and Impact on State Finances – Volume II 420
Figure XXVIII-2: Historical Trend in Energy Deficit - Uttarakhand
3%
6%
3%
1%
7%6%
3%
5%
4%
0%
1%
2%
3%
4%
5%
6%
7%
0
2,000
4,000
6,000
8,000
10,000
12,000
14,000
MU
Energy Deficit
Energy Required (MU) Energy Avail (MU) Deficit (%)
Source: CEA
The trend of peak deficit observed in Uttarakhand over the years is highlighted in the figure
below:
Figure XXVIII-3: Historical Trend in Peak Deficit - Uttarakhand
14%
9%
4%
0%
6%
0%1%
5%
0% 0%
2%
4%
6%
8%
10%
12%
14%
16%
0
500
1,000
1,500
2,000
2005-06 2006-07 2007-08 2008-09 2009-10 2010-11 2011-12 2012-13 2013-14
MU
Peak Deficit
Peak Demand (MW) Peak Met (MW) Deficit (%)
Source: CEA
The above deficit levels in the state are expected to increase on account of latest Supreme
Court ruling, which suspended any further expansion of hydro power plants in the state, on
account of the floods that hit the state in June 2013.
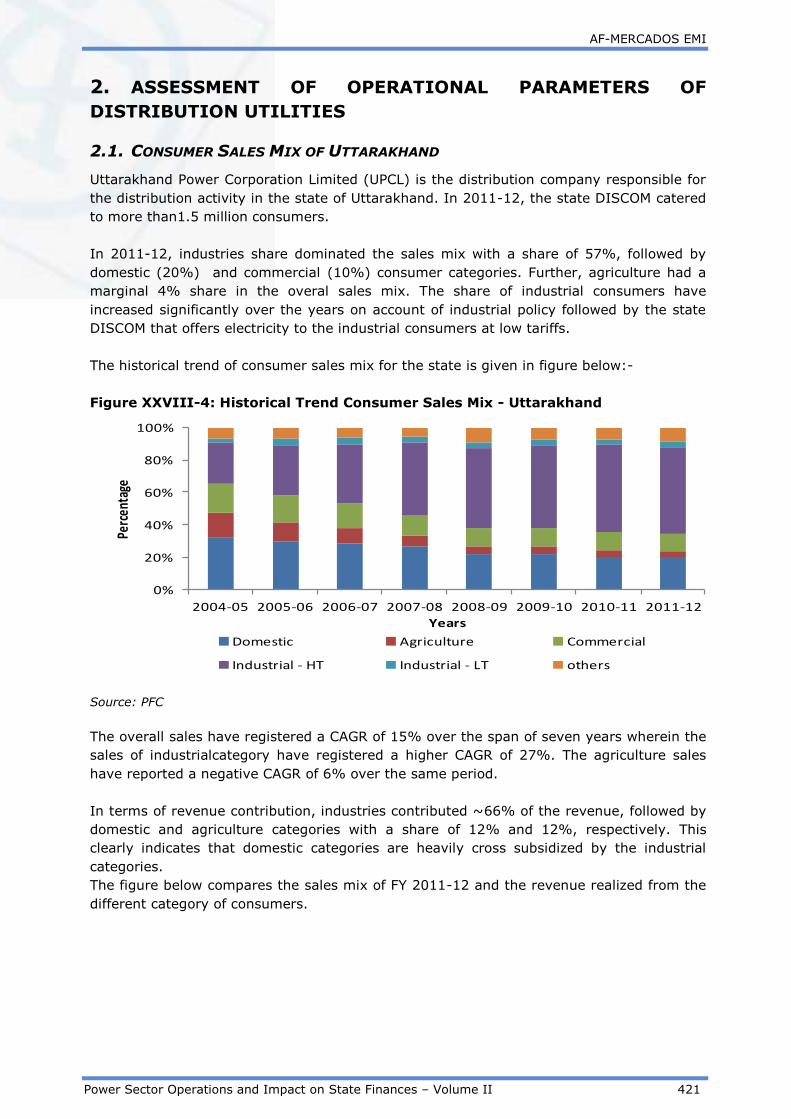
AF-MERCADOS EMI
Power Sector Operations and Impact on State Finances – Volume II 421
2. ASSESSMENT OF OPERATIONAL PARAMETERS OF
DISTRIBUTION UTILITIES
2.1. CONSUMER SALES MIX OF UTTARAKHAND
Uttarakhand Power Corporation Limited (UPCL) is the distribution company responsible for
the distribution activity in the state of Uttarakhand. In 2011-12, the state DISCOM catered
to more than1.5 million consumers.
In 2011-12, industries share dominated the sales mix with a share of 57%, followed by
domestic (20%) and commercial (10%) consumer categories. Further, agriculture had a
marginal 4% share in the overal sales mix. The share of industrial consumers have
increased significantly over the years on account of industrial policy followed by the state
DISCOM that offers electricity to the industrial consumers at low tariffs.
The historical trend of consumer sales mix for the state is given in figure below:-
Figure XXVIII-4: Historical Trend Consumer Sales Mix - Uttarakhand
0%
20%
40%
60%
80%
100%
2004-05 2005-06 2006-07 2007-08 2008-09 2009-10 2010-11 2011-12
Perc
enta
ge
Years
Domestic Agriculture Commercial
Industrial - HT Industrial - LT others
Source: PFC
The overall sales have registered a CAGR of 15% over the span of seven years wherein the
sales of industrialcategory have registered a higher CAGR of 27%. The agriculture sales
have reported a negative CAGR of 6% over the same period.
In terms of revenue contribution, industries contributed ~66% of the revenue, followed by
domestic and agriculture categories with a share of 12% and 12%, respectively. This
clearly indicates that domestic categories are heavily cross subsidized by the industrial
categories.
The figure below compares the sales mix of FY 2011-12 and the revenue realized from the
different category of consumers.

AF-MERCADOS EMI
Power Sector Operations and Impact on State Finances – Volume II 422
Figure XXVIII-5: Comparative Analysis Consumer wise Sales and Revenue Mix
(w/o subsidy) 2011-12 – Uttarakhand
Domestic %20% Agriculture %
4%
Commercial %10%
Industrial - HT %
54%
Industrial - LT %
3%
others %9%
Category wise Sales in 2011-12
Domestic 13% Agriculture
12%
Commercial 2%Industrial - HT
62%
Industrial - LT 4%
others 7%
Category wise Revenue- 2011-12
Source: PFC
2.2. TRENDS IN COMMERCIAL AND TECHNICAL LOSSES
The AT&C losses for Uttarakhand distribution utility have historically remained on a higher
side compared to the national average. The loss level reported by the distribution utilities
of Uttrakhand is in the range of 28% - 46% since FY 2006. The collection efficiency has
remained on the higher side, in the range of 87% to 101%.
The technical losses (~15%) over the years have contributed majority portion of the AT&C
losses in the state.
Table XXVIII-1: Historical Trend AT&C losses and Collection Efficiency -
Uttrakhand
Year FY 05 FY 06 FY 07 FY 08 FY 09 FY 10 FY 11 FY 12
AT&C Losses (%) 46% 28% 36% 38% 40% 28% 28% 31%
Collection
Efficiency (%) 89% 101% 92% 88% 90% 95% 91% 87%
Source: PFC
The above identification of the losses into technical and commercial losses is a good
practice adopted by the state distribution utility. The primary reason cited for the high
levels of technical losses is that the distribution network has not increased commensurate
the increase in the demand, resulting in overloading of the distribution system.
2.3. TRENDS IN DISTRIBUTION COSTS
Power purchase cost accounts for majority of distribution cost, accounting for ~82% of the
overall distribution costs.
The per-unit cost, break-up for different cost components for the state of Uttrakhand is
provided in the table below:-
Table XXVIII-2: Historical Trend in Distribution Cost Breakup - Uttrakhand
Cost
Component
(Rs. per kWh)
FY 05 FY 06 FY 07 FY 08 FY 09 FY 10 FY 11 FY 12
Power
Purchase Cost 1.02 1.35 1.57 1.80 2.04 2.49 2.51 3.00
O&M (R&M +
A&G + EC) 0.27 0.33 0.28 0.27 0.21 0.28 0.31 0.29

AF-MERCADOS EMI
Power Sector Operations and Impact on State Finances – Volume II 423
Cost
Component
(Rs. per kWh)
FY 05 FY 06 FY 07 FY 08 FY 09 FY 10 FY 11 FY 12
Interest 0.29 0.28 0.09 0.18 0.10 0.09 0.09 0.10
Depreciation 0.17 0.19 0.19 0.19 0.09 0.11 0.12 0.12
Other cost 0.07 0.00 -0.04 -0.27 0.06 0.18 0.14 0.15
Source: PFC
The power purchase cost has increased in recent years on account of reduced PLFs of the
hydro based generation that constitutes ~78% of the generation capacity. Hence, in order
to meet the increasing demand, the state DISCOM had to procure power from the
expensive short-term markets.
The figure below illustrates the trend in short-term prices the year 2011-12.
Figure XXVIII-6: Average Daily Short Term Prices IEX – N2 Region
Source: IEX
2.4. REVENUE REALIZATION
Tariff realization from different consumer category has increased commensurate to
increasing power purchase cost. No tariff hikes were observed from FY 05 to FY 08 and
tariffs were increased in FY 09 to FY 12 wherein tariffs were hiked in range of 17% to 3%.
The table below depicts the average Tariff Realization in Uttarakhand in Major Consumption
Categories
Table XXVIII-3: Historical Trend in Consumer Wise Average Revenue Realization -
Uttarakhand
Years 2004-
05 2005-06 2006-07
2007-
08
2008-
09 2009-10 2010-11 2011-12
Domestic 1.70 1.65 1.69 1.82 1.77 1.90 2.30 2.37
Agriculture 0.89 0.95 0.95 0.93 1.32 1.38 1.55 1.75
Commercial 3.18 3.56 3.06 3.26 3.07 3.66 4.02 4.18

AF-MERCADOS EMI
Power Sector Operations and Impact on State Finances – Volume II 424
Years 2004-
05 2005-06 2006-07
2007-
08
2008-
09 2009-10 2010-11 2011-12
Industrial
HT 3.22 2.94 2.48 2.86 3.07 3.28 3.78 4.16
Industrial
LT 4.18 2.67 2.77 2.69 3.94 3.32 3.91 4.04
Source: PFC
As per the industrial policy adopted by the state distribution utility, the industrial tariff in
the state continued to be on the lower side from FY 05 to FY 10. However, with the
increase in power purchase costs the tariff for industrial consumers have increased
proportionately to the increase in cost to serve in the state.

AF-MERCADOS EMI
Power Sector Operations and Impact on State Finances – Volume II 425
3. ASSESSMENT OF FINANCIAL PERFORMANCE OF –
DISTRIBUTION UTILITY
3.1. FINANCIAL HEALTH OF DISTRIBUTION UTILITIES
The distribution financial losses without subsides in Uttarakhand have increased over the
years.The figure below depicts the year on year trend in the profit/ (loss) booked by the
state DISCOM
Figure XXVIII-7: Historical Trend in Financial Losses (w/o subsidy) - Uttarakhand
(169) (152) (201) (243)(353)
(522)
(219)
(417)
(2,000)
(1,800)
(1,600)
(1,400)
(1,200)
(1,000)
(800)
(600)
(400)
(200)
-
2004
-05
2005
-06
2006
-07
2007
-08
2008
-09
2009
-10
2010
-11
2011
-12
Rs. C
r
Financial Losses (PAT)
Source: PFC
The marginal increase in power purchase costs in the year FY 2010-11 coupled with tariff
hike decreased the financial losses in that year.
3.2. SUBSIDY BOOKED V/S SUBSIDY RECEIVED
The state distribution utility has not booked subsidy over the years.
3.3. ACS V/S ARR
The gap between average cost of supply and average revenue realized has remained high
over the years. This is due to inadequate tariff revisions combined with the high levels of
reported AT&C losses by the state distribution utility.
The figure below depicts the trend in revenue gap on per unit sale of electricity to the
consumer

AF-MERCADOS EMI
Power Sector Operations and Impact on State Finances – Volume II 426
Figure XXVIII-8: Historical Trend in ACS v/s ARR - Uttarakhand
0.33 0.31 0.36 0.36 0.410.63
0.240.41
1.82
2.15 2.09 2.17
2.49
3.16 3.17
3.66
1.50
1.841.73 1.81
2.09
2.53
2.93
3.25
0.00
0.50
1.00
1.50
2.00
2.50
3.00
3.50
4.00
2004-05 2005-06 2006-07 2007-08 2008-09 2009-10 2010-11 2011-12
Rs./
kWh
Years
Gap(with subsidy) ACS ARR (with subsidy)
Source: PFC
4. STATE EXPEOSURE TO POWER SECTOR
4.1. INCOME FROM POWER SECTOR
The source of tax revenue is the electricity distribution tax, paid to the state government
by the distribution utilities. The tax revenue from the power sector formed ~3% of the
total tax revenue in the state in 2011-12. The details for the same are provided in the
table below:
Table XXVIII-4: Tax Revenue from Power Sector - Uttarakhand
Revenue 2009-10 2010-11 2011-12
Rs Cr
Tax Revenue from Power Sector 2 2 229
Total Tax Revenue 5,109 6,866 8,482
Power sector Tax Revenue / Total
state Tax Revenue 0.04% 0.03% 3%
Source: Audited C&AG Reports on state: 2011-12
The tax revenue from the power sector increased substantially from Rs 2 Cr in FY10 to Rs
229 Cr in FY12. The sector contribution in state tax revenue has remained a minimal share
of less than 3% over the years despite the increase.
The non-tax revenue from power sector is through Royalty/CESS on water for power
generation, transmission and distribution, Rural Electrification etc. The non-tax
revenue, which is Rs 41 Cr, forms 4% of the total non-tax revenues of the state
government in 2011-12. The details for the same are provided in the table below.
Table XXVIII-5: Non-Tax Revenue from Power Sector - Uttarakhand
Revenue 2009-10 2010-11 2011-12
Rs Cr
Non-Tax Revenue From Power
Sector 56 14 41

AF-MERCADOS EMI
Power Sector Operations and Impact on State Finances – Volume II 427
Total Non-Tax Revenue 632 678 1,136
Power sector Non-Tax Revenue
/Total state Non-Tax Revenue 8.88% 2.00% 4%
Source: Audited C&AG Reports on state: 2011-12
The non tax revenue from Power sector has a decreased from Rs 56 Cr in FY10 to Rs 41 Cr
in FY12. Hence the contribution of the sector in state revenues has accordingly come down.
The overall revenue generated from the power sector increased from Rs 58 Cr in FY10 to
Rs 270 Cr in FY12.
4.2. EXPENDITURE ON POWER SECTOR
The details of the expenditure made on the power sector by the state in the year 2011-12
are provided in the table below:
Table XXVIII-6: Expenditure on Power Sector - Uttarakhand
Categories 2009-10 2010-11 2011-12
Rs Cr
Capital expenditure N.A 57 42
Revenue Expenditure N.A 11 10
Total Expenditure N.A 68 52
Source: Audited C&AG Reports on state: 2011-12, 2010-11, 2009-10
The Capital and Revenue expenditure incurred on the Power sector has decreased over the
period of three years since FY10 primarily on account of lower investments in Hydel
Generation and decrease in revenue expense on T&D.
Further, it can be observed that in 2011-12, the state power sector is self-sufficient with
revenues from Power Sector far exceeding the expenditure made on state power sector.
4.3. ANALYSIS ON STATE GUARANTEES AND SUBSIDIES
The state government guarantees constituted a marginal ~12.35 % of the overall state
revenue. The same has been depicted in the table below:
Table XXVIII-7: Guarantees as a Percentage of Total Revenues - Uttarakhand
Parameter 2009-10 2010-11 2011-12
Rs Cr
Guarantees given by State Govt. N.A 1,309 1,188
Total Revenues of the State N.A 7,544 9,618
Guarantees as a %age of Total
Revenues of State N.A 17.35% 12.35%
Source: Audited C&AG Reports on state: 2011-12, 2010-11, 2009-10
The guarantees given to Power sector have decreased from the FY11 level i.e. 17.35% in
FY11 of the state revenue to 12.35% in FY12.
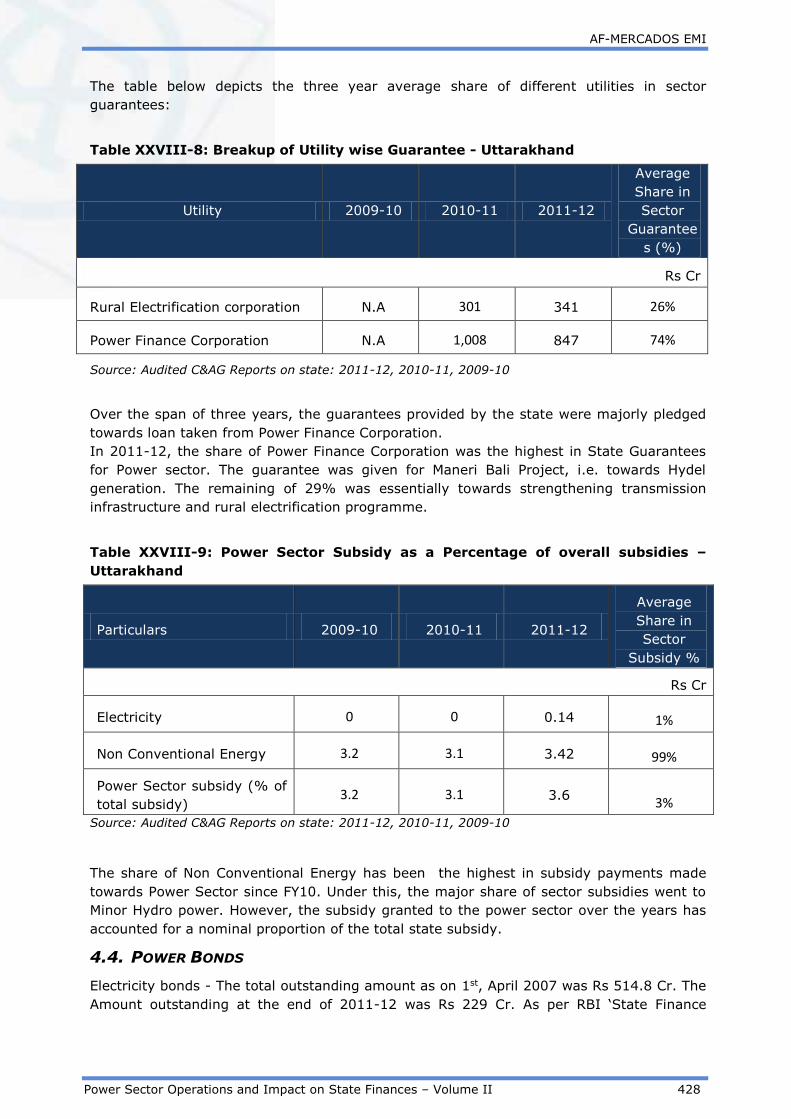
AF-MERCADOS EMI
Power Sector Operations and Impact on State Finances – Volume II 428
The table below depicts the three year average share of different utilities in sector
guarantees:
Table XXVIII-8: Breakup of Utility wise Guarantee - Uttarakhand
Utility 2009-10 2010-11 2011-12
Average
Share in
Sector
Guarantee
s (%)
Rs Cr
Rural Electrification corporation N.A 301 341 26%
Power Finance Corporation N.A 1,008 847 74%
Source: Audited C&AG Reports on state: 2011-12, 2010-11, 2009-10
Over the span of three years, the guarantees provided by the state were majorly pledged
towards loan taken from Power Finance Corporation.
In 2011-12, the share of Power Finance Corporation was the highest in State Guarantees
for Power sector. The guarantee was given for Maneri Bali Project, i.e. towards Hydel
generation. The remaining of 29% was essentially towards strengthening transmission
infrastructure and rural electrification programme.
Table XXVIII-9: Power Sector Subsidy as a Percentage of overall subsidies –
Uttarakhand
Particulars 2009-10 2010-11 2011-12
Average
Share in
Sector
Subsidy %
Rs Cr
Electricity 0 0 0.14 1%
Non Conventional Energy 3.2 3.1 3.42 99%
Power Sector subsidy (% of
total subsidy) 3.2 3.1 3.6
3%
Source: Audited C&AG Reports on state: 2011-12, 2010-11, 2009-10
The share of Non Conventional Energy has been the highest in subsidy payments made
towards Power Sector since FY10. Under this, the major share of sector subsidies went to
Minor Hydro power. However, the subsidy granted to the power sector over the years has
accounted for a nominal proportion of the total state subsidy.
4.4. POWER BONDS
Electricity bonds - The total outstanding amount as on 1st, April 2007 was Rs 514.8 Cr. The
Amount outstanding at the end of 2011-12 was Rs 229 Cr. As per RBI ‘State Finance

AF-MERCADOS EMI
Power Sector Operations and Impact on State Finances – Volume II 429
Report’ 2014, the outstanding liability of Power Bonds in the state as on 31st March 2014
was Rs 110 Cr.
4.5. POWER SECTOR FINANCING REQUIREMENT RELATIVE TO STATE’S ECONOMY
In this section, the expenditure (under all possible heads) on the power sector by the state
government has been listed to determine the state Power sector financing requirement
which is then compared to state finances.
The sector financing requirement is estimated as the summation of total expenditure of the
state government on the sector including Capital and Revenue Expenditure, Loans and
Advances (Net Of Recoveries) and Public Debt repaid (Net of Receipts) by the State
Government.
Table XXVIII-10: Power Sector Financing Requirement (2011-12) – Uttarakhand
Particulars 2011-12
Rs Cr
Power Sector Expenditure (Capital and Revenue) 52
Loans And Advances made by the State Government ( Net of
Recoveries) 44
8.5% Tax Free Special Bonds of the State Government
(Power Bonds) disbursed during the year (Net of Receipts) 57
Loans for Power Projects-T&D from the Central Govt.
Discharged during the year ( Net of Receipts) 0
Total Power Sector Financing during the year 154
Sector Financing Requirement as a % age of total revenues
of state 2%
GSDP nominal 58,561
Sector Financing Requirement as a % age of GSDP 0.26%
Financial Profit/ (Losses) of DISCOM during the year (417)
Sector Financing Requirement as a % age of total revenues
of state including financial losses of DISCOM 6%
Sector Financing Requirement as a % age of GSDP including
financial losses 0.97%
Source: State Government annual accounts from CAG, Data book for DCH - 22nd April, 2013, PFC Report on
Utility finances – 2011-12
The financing requirement for the Power sector in the state was estimated to be 2% of the
revenue generated by the state and 0.26 % of the Gross State Domestic Product.
Considering the Financial losses of DISCOM in the year, the financing requirement of the
sector increases to 6% of the State revenue and 0.97 % of the GSDP

AF-MERCADOS EMI
Power Sector Operations and Impact on State Finances – Volume II 430
The sector as expected has a significant Discom loss. The losses increase the burden of the
sector on the state (financing requirement) which otherwise is marginal relative to
revenues of the state or GSDP.
5. REGULATORY EFFECTIVENESS
The Uttarakhand Electricity Regulatory Commission was constituted by Government of
Uttarakhand, vide Notification 03/9-3- URJA/2002 dated 1st January, 2002 under the
Electricity Regulatory Commission Act, 1998.
The figure below presents the current organization structure of UERC.
Figure XXVIII-9: Organization Structure - UERC
Source: UERC
5.1. BUDGETING
The information related to state budgeting is not available in public domain.
5.2. STAFFING
The office of the Commission consists of permanent employees besides officials on
deputation and on contract basis. The total working strength of the Commission is 15
(including the chairman and members).
5.3. MYT REGULATION
The MYT has been implemented for the first control period. The commission had selected a
control period of three years for the MYT (FY 2014-16). The focus of the MYT regulation is
to reduce the prevalent high levels of AT&C losses along with attainment of 100% metering
for correct assessment of the energy demand in the state.

AF-MERCADOS EMI
Power Sector Operations and Impact on State Finances – Volume II 431
5.4. TARIFF REVISION
The tariff revision in the state has been regular from FY 09 to FY 13. The increase in tariff
has been in the range of 3% to 17% from FY 09 to FY 14. Although, the high levels of
AT&C losses have negated the impact of tariff increase on the state utility finances.
Table XXVIII-11: Historical Trend in Tariff Revision - Uttarakhand
FY
06
FY
07
FY
08
FY
09
FY
10
FY
11
FY
12
FY
13
Average Tariff
Revisions 0% 0% 0% 14% 17% 3% 6% 6%
Source: Approved Tariff Orders of DISCOM for that year
5.5. LEVEL OF METERING
The two major consumer segments that continue to be unmetered by the state utility are
domestic and tube-well consumers. In the year 2011-12, the commission recorded 24,610
unmetered consumers across the state, with more than 98% consumers metered.
5.6. OPEN ACCESS
State Load Despatch Center of Uttarakhand has been mandated with dealing of open
access function in the state. The number of registered open access consumers has
increased from 20 in FY 2010-11 to 26 in FY 2013-14.
The figure below presents the trend in sale of power traded through Open Access from FY
11 to FY 13.

AF-MERCADOS EMI
Power Sector Operations and Impact on State Finances – Volume II 432
Figure XXVIII-10: Trend in Quantity Traded through Open Access (FY 11 to FY
13) - UERC
212210342
100933
0
20000
40000
60000
80000
100000
120000
FY 11 FY 12 FY 13
MW
h
Source: Annual Report PTUCL
The regulator has had a positive impact on the operations of the distribution utilities, with
important provision of the Electricity Act, 2003 and National Tariff Policy enacted by the
state distribution utility like the MYT framework, 100% metering, regular tariff revision and
sufficient staffing.

AF-MERCADOS EMI
Power Sector Operations and Impact on State Finances – Volume II 433
6. SUMMARY
1. Level of Metering: The distribution utility has achieved close to 100% metering,
with domestic and tube-well consumers forming the residual unmetered connections
in the state. The state utility aims to achieve 100% metering that would
significantly improve the data aggregation in the state.
2. Suspension of Hydro Generation Plants: The Supreme Court in August 2013
suspended any further addition of hydro-based capacity in the state after the floods
in June 2013. Further, the Court ordered a detailed study of the impact of the
existing and under-construction hydro based power plants on the environment and
ecology of the state. The above Court order would impact the hydro based capacity
addition in the state that dominates the overall capacity mix in the state. The state
distribution utility needs to explore the option of increasing the purchase of
electricity from short term market to match the growing energy demand of the
state.
3. High levels of Technical Losses: The state distribution utility has continued to
report high levels of technical losses, even though industries (HT) contribute ~55%
of the overall sales in the state.
4. Financial Losses: The high levels of AT&C losses reported by the state utility have
resulted in financial losses in the state. The financial losses have increased over the
years. Further, the state distribution utility does not subscribe to subsidies to reduce
the loss levels.
5. Financial Self Sufficiency: The power sector in Uttarakhand is self-sufficient, with
revenues from tax and non tax sources far exceeding the expenditure made by the
state government towards the power sector.
The sector operations pose a low risk on state finances. Although, the increasing
levels of financial losses has affected the financial strength of the power sector in
the state.

AF-MERCADOS EMI
Power Sector Operations and Impact on State Finances – Volume II 434
XXIX WEST BENGAL
1. INTRODUCTION
1.1. BACKGROUND – POWER SECTOR OVERVIEW
West Bengal State Electricity Board (WBSEB) was a state owned electricity board in West
Bengal in India. It has now been restructured and split into two companies namely West
Bengal State Electricity Transmission Company (WBSETCL) and West Bengal State
Electricity Distribution Company (WBSEDCL). The split came into effect on 01.04.2007
under the provisions of West Bengal Power Reform Scheme, 2007.
Figure XXIX-1: Power Sector Structure – West Bengal
Source: WBERC
WBSEDCL is responsible for distributing power in the state of power at 33 KV level and
below. West Bengal State Electricity Distribution Company Limited has come into effect
from 01.04.2007 after restructuring of erstwhile West Bengal State Electricity Board in
compliance of Electricity Act 2003. The State has three more DISCOMs namely, CESC
Limited (CESC), Durgapur Projects Limited (DPL), Dishergarh Power Supply Company
Limited (DPSCL).
1.2. GENERATION MIX
The total installed capacity as on Februray 2014 (including allocated share in Joint &
Central Sector plants) for West Bengal was 8708.82 MW out of which 83% share is of Coal
based generation followed by hydro based (~14%). Renewable and Gas based generation
account for 2% and 1% share respectively.
Figure below highlights the generation capacity including allocated share in Joint & Central
sector plants.
1985
2007

AF-MERCADOS EMI
Power Sector Operations and Impact on State Finances – Volume II 435
Figure XXIX-2: Generation Capacity Mix - West Bengal
Source: CEA
1.3. POWER SUPPLY POSITION
West Bengal has not been witnessing significant supply deficit. The demand supply
situation is good in the state. The energy deficit has been ranging from 1% to 4% from the
past 8 years. The energy deficit of the state was almost nil in FY 2013-14.
The Peak deficit has reduced from 6% in 2007-08 to 1% in 2012-13.
The trend of energy and peak deficit observed in West Bengal over the years is have been
highlighted in the figure graph below:-
Figure XXIX-3: Energy Deficit– West Bengal
2%2%
4%
3%3%
2%
1%1% 0.3%
0%
1%
2%
3%
4%
5%
0
10,000
20,000
30,000
40,000
50,000
2005-062006-072007-082008-092009-102010-112011-122012-132013-14
MU
Energy Deficit
Energy Required (MU) Energy Avail (MU) Deficit (%)

AF-MERCADOS EMI
Power Sector Operations and Impact on State Finances – Volume II 436
Figure XXIX-4: Peak Deficit – West Bengal
3%2%
6%
0%
2%
1% 1% 1%0.5%
0%
1%
2%
3%
4%
5%
6%
0
2,000
4,000
6,000
8,000
2005-062006-072007-082008-092009-102010-112011-122012-132013-14
MW
Peak Deficit
Peak Demand (MW) Peak Met (MW) Deficit (%)
Source: CEA
This decreasing trend is likely to continue in the near future as the prices in the spot
market have come down. The average daily day ahead market prices are less than the
distribution costs for the previous years (discussed later in the report) in the state.
Figure XXIX-5: Average Daily Day Ahead Market Prices E1 – West Bengal
0.00
0.50
1.00
1.50
2.00
2.50
3.00
3.50
4.00
04-0
1-13
16-0
4-20
13
05-0
1-13
16-0
5-20
13
31-0
5-20
13
15-0
6-20
13
30-0
6-20
13
15-0
7-20
13
30-0
7-20
13
14-0
8-20
13
29-0
8-20
13
13-0
9-20
13
28-0
9-20
13
13-1
0-20
13
28-1
0-20
13
11-1
2-13
27-1
1-20
13
12-1
2-13
27-1
2-20
13
01-1
1-14
26-0
1-20
14
02-1
0-14
25-0
2-20
14
03-1
2-14
27-0
3-20
14
Average Daily Day Ahead Market Price - E1
Maximum Price - Rs. 3.69 per kWh
Average Price - Rs. 2.42 per kWh
Minimum Price - Rs. 0.56 per kWh
Source: IEX

AF-MERCADOS EMI
Power Sector Operations and Impact on State Finances – Volume II 437
2. ASSESSMENT OF OPERATIONAL PERFORMANCE OF
DISTRIBUTION UTILITIES
2.1. CONSUMER SALES MIX OF WEST BENGAL
WBSEDCL is a major power utility of the state with consumer strength over 1.35 crores, 5
zones, 17 regional offices, 64 distribution divisions and 483 customer care centers make up
the backbone to the power distribution system of the state. It is divided into 5 zones:
Kolkata, Burdwan, Midnapore, Berhampore and Siliguri.
The historical trend in the consumer sales mix for the state is given in figure below.
Figure XXIX-6: Historical Trend in Consume Sales Mix - West Bengal
0%
20%
40%
60%
80%
100%
2004-05 2005-06 2006-07 2007-08 2008-09 2009-10 2010-11 2011-12
Perc
enta
ge
Years
Domestic Agriculture Commercial
Industrial - HT Industrial - LT others
Source: PFC
The overall sales have registered a CAGR of 6% over the span of 8 years wherein the sales
of commercial category have registered a highest CAGR of 11% followed by the industrial
category with a CAGR of 10%.
The figure below compares the sales mix of FY 2011-12 and the revenue realized from the
different category of consumers.
Figure XXIX-7: Comparative Analysis of Consumer Sales and Revenue Mix in
2011-12 - West Bengal
Domestic 25%
Non-Domestic
14%
Agriculture 3%
Industrial - HT 36%
Others 22%
Category wise Revenue 2011-12
Domestic 27%
Agriculture6%
Commercial
12%
Industrial - HT 34%
others 21%
Category wise Sales - 2011-12
Source: PFC

AF-MERCADOS EMI
Power Sector Operations and Impact on State Finances – Volume II 438
Industrial consumption is high and contributes more than 34% of the total energy
consumption. The “Other” category forms a considerable portion of the Sales Mix (21%).
In terms of revenue contribution, Industrial consumers account for 34% of the revenues
followed by domestic consumers (27%). The Revenues from “Other” category is 22% even
when it hardly forms a small portion of the total consumers. This is due to a significant
Bulk Supply and Inter State Sale of power by the discom.
2.2. TRENDS IN COMMERCIAL & TECHNICAL LOSSES
The Aggregated Technical & Commercial (AT&C) losses for WBSEDCL have historically
remained on a higher side compared to the national average. The AT&C for WBSEDCL were
33% in FY12 which have been the highest in last 8 years.
Table XXIX-1: Year on Year Trend in AT&C losses and Collection Efficiency - West
Bengal
Year FY 05 FY 06 FY 07 FY 08 FY 09 FY 10 FY 11 FY 12
AT&C Losses
(%) 24% 28% 31% 23% 26% 33% 27% 33%
Collection
Efficiency 109% 105% 98% 100% 99% 94% 100% 93%
Source: PFC
The collection Efficiency has varied over the years from above 100% to 93% in FY12.
2.3. TRENDS IN DISTRIBUTION COST
The power purchase cost forms the major cost component of distribution in West Bengal.
The power purchase cost accounts for ~80% of the total distribution cost (FY05 to FY12).
The per unit cost distribution cost break-up for different cost components for the state of
West Bengal as a percentage of total cost is provided in the table below:-
Table XXIX-2: Year on Year Trend Distribution Cost Breakup - West Bengal
Cost Component
(Rs/KwH) FY 05 FY 06 FY 07 FY 08 FY 09 FY 10 FY 11 FY 12
Power Purchase
Cost 1.68 1.86 1.85 2.40 2.72 2.77 2.86 3.89
O&M (R&M + A&G
+ EC) 0.30 0.32 0.42 0.35 1.21 0.47 0.45 0.49
Interest 0.52 0.37 0.39 0.19 0.22 0.18 0.16 0.23
Depreciation 0.01 0.00 0.00 0.00 0.00 0.00 0.00 0.00
Other cost -0.02 0.00 0.00 0.00 0.00 0.00 0.00 0.00
Source: PFC
WBSEDCL purchases energy from different sources like Central Generating stations, West
Bengal Power Development Corporation Ltd, West Bengal Renewable Energy Development
Authority (WBREDA) and other DISCOMs in the state like DPL, DPSC and CESC.
Power purchase requirement of WBSEDCL is mostly met with energy production of WBPDCL
(including some hydel generating stations), quantum and tariff of which has been approved
by the Commission. WBERC allows recovery of increase in the fuel cost through FPPCA and
takes into account while passing next year tariff order.
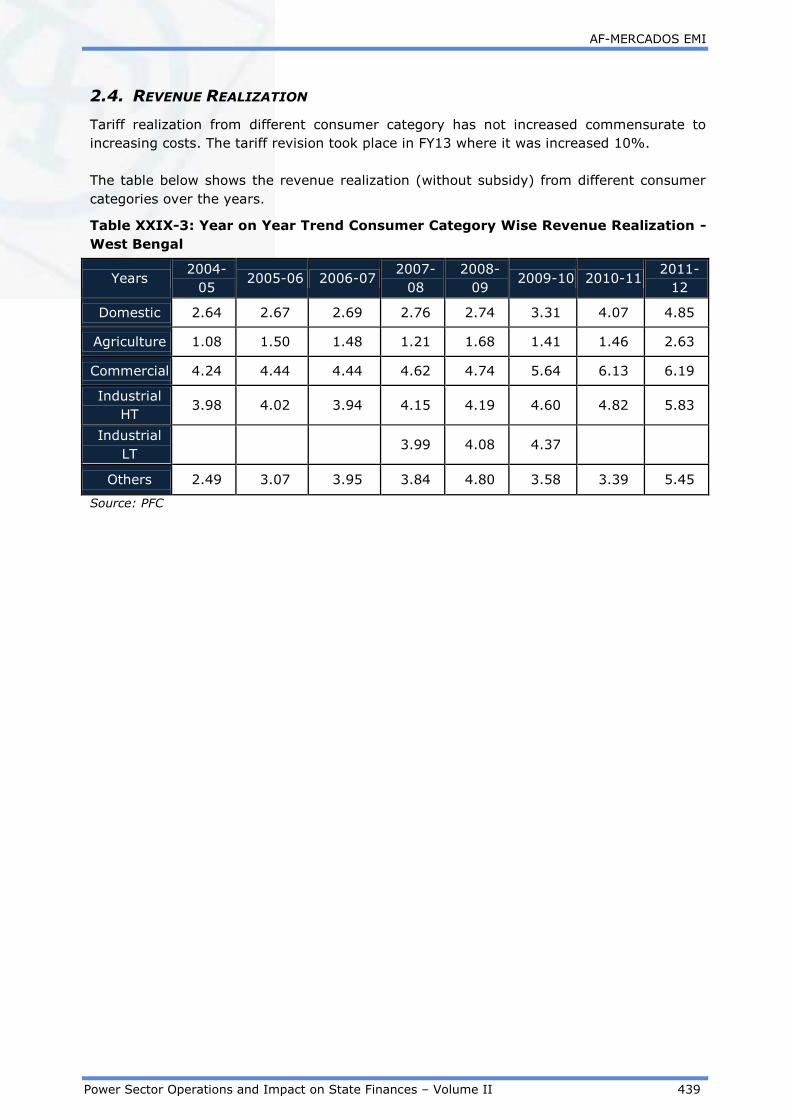
AF-MERCADOS EMI
Power Sector Operations and Impact on State Finances – Volume II 439
2.4. REVENUE REALIZATION
Tariff realization from different consumer category has not increased commensurate to
increasing costs. The tariff revision took place in FY13 where it was increased 10%.
The table below shows the revenue realization (without subsidy) from different consumer
categories over the years.
Table XXIX-3: Year on Year Trend Consumer Category Wise Revenue Realization -
West Bengal
Years 2004-
05 2005-06 2006-07
2007-
08
2008-
09 2009-10 2010-11
2011-
12
Domestic 2.64 2.67 2.69 2.76 2.74 3.31 4.07 4.85
Agriculture 1.08 1.50 1.48 1.21 1.68 1.41 1.46 2.63
Commercial 4.24 4.44 4.44 4.62 4.74 5.64 6.13 6.19
Industrial
HT 3.98 4.02 3.94 4.15 4.19 4.60 4.82 5.83
Industrial
LT 3.99 4.08 4.37
Others 2.49 3.07 3.95 3.84 4.80 3.58 3.39 5.45
Source: PFC
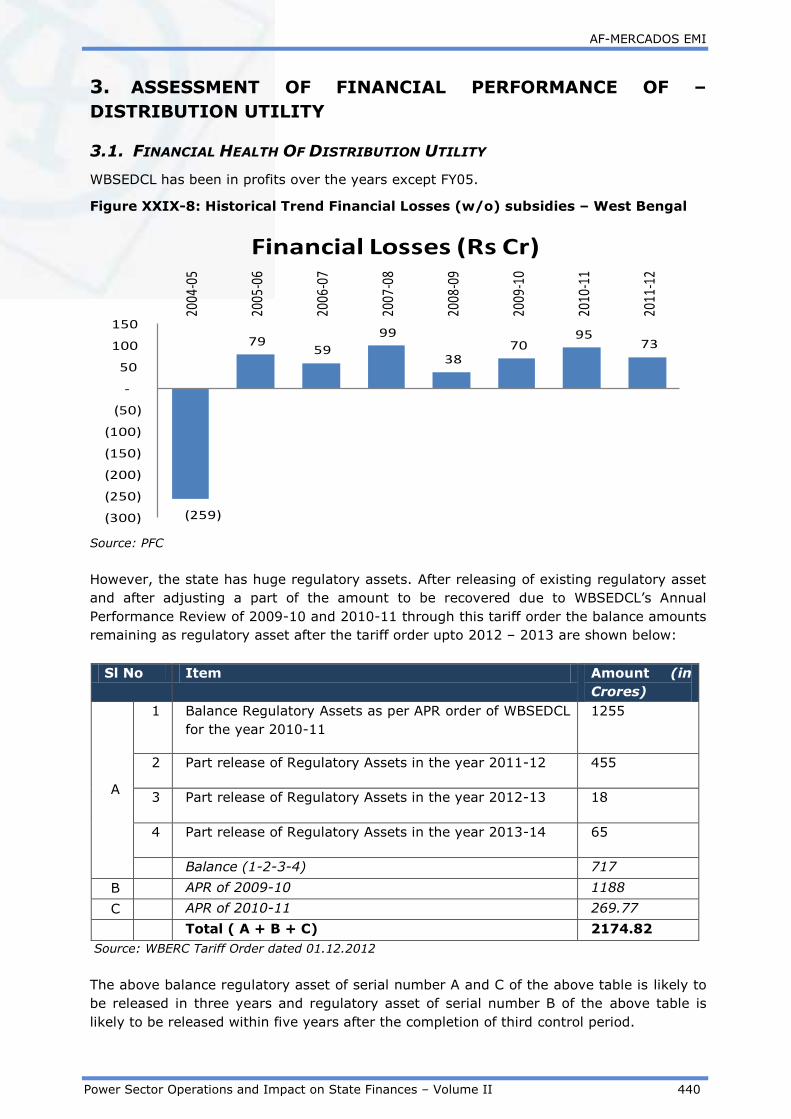
AF-MERCADOS EMI
Power Sector Operations and Impact on State Finances – Volume II 440
3. ASSESSMENT OF FINANCIAL PERFORMANCE OF –
DISTRIBUTION UTILITY
3.1. FINANCIAL HEALTH OF DISTRIBUTION UTILITY
WBSEDCL has been in profits over the years except FY05.
Figure XXIX-8: Historical Trend Financial Losses (w/o) subsidies – West Bengal
(259)
79 59
99
38 70
95 73
(300)
(250)
(200)
(150)
(100)
(50)
-
50
100
150
2004
-05
2005
-06
2006
-07
2007
-08
2008
-09
2009
-10
2010
-11
2011
-12
Financial Losses (Rs Cr)
Source: PFC
However, the state has huge regulatory assets. After releasing of existing regulatory asset
and after adjusting a part of the amount to be recovered due to WBSEDCL’s Annual
Performance Review of 2009-10 and 2010-11 through this tariff order the balance amounts
remaining as regulatory asset after the tariff order upto 2012 – 2013 are shown below:
Sl No Item Amount (in
Crores)
A
1 Balance Regulatory Assets as per APR order of WBSEDCL
for the year 2010-11
1255
2 Part release of Regulatory Assets in the year 2011-12 455
3 Part release of Regulatory Assets in the year 2012-13 18
4 Part release of Regulatory Assets in the year 2013-14 65
Balance (1-2-3-4) 717
B APR of 2009-10 1188
C APR of 2010-11 269.77
Total ( A + B + C) 2174.82
Source: WBERC Tariff Order dated 01.12.2012
The above balance regulatory asset of serial number A and C of the above table is likely to
be released in three years and regulatory asset of serial number B of the above table is
likely to be released within five years after the completion of third control period.

AF-MERCADOS EMI
Power Sector Operations and Impact on State Finances – Volume II 441
3.2. SUBSIDY BOOKED V/S SUBSIDY RECEIVED
Since the utility has been in profits, no subsidies were given by the government in the last
five years. The subsidy burden of the State Government has been nil over the years.
3.3. ACS V/S ARR
Figure XXIX-9: Historical Trend ACS v/s ARR (with subsidy) – West Bengal
0.13 -0.04 -0.03-0.05 -0.02 -0.04 -0.04 -0.03
2.41 2.492.70
3.07
4.35
3.55 3.62
4.73
2.282.53
2.733.12
4.37
3.59 3.66
4.77
-1.00
0.00
1.00
2.00
3.00
4.00
5.00
6.00
2004-05 2005-06 2006-07 2007-08 2008-09 2009-10 2010-11 2011-12
Rs.
/kW
h
Years
Gap(with subsidy) ACS ARR (with subsidy)
Source: PFC
The discom has been able to recover its costs. Except FY05, the ARR has always been
marginally greater than ACS.

AF-MERCADOS EMI
Power Sector Operations and Impact on State Finances – Volume II 442
4. STATE EXPOSURE TO POWER SECTOR
4.1. INCOME FROM POWER SECTOR
The tax income is majorly through electricity distribution tax, which is paid by the
distribution utilities to the state government. The tax revenue from the power sector forms
~2% of the total tax revenue in 2011-12.
Tax revenue
Table XXIX-4: Tax Revenues - West Bengal
Revenue 2009-10 2010-11 2011-12
Rs Cr
Tax Revenue from Power Sector 588 665 769
Total Tax Revenue 25,741 28,548 37,084
Power sector Tax Revenue / Total
state Tax Revenue 2.28% 2.33% 2%
Source: Audited CAG Accounts for the state: 2011-12, 2010-11, 2009-10
There has been an increase in tax revenue from the power sector FY10 from Rs 588 Cr in
FY10 to Rs 769 Cr in FY12. However, the contribution of sector in state tax revenues has
come down to 2.07% in FY12 from 2.28%. As evident, the sector has contributed a
marginal share in total state tax revenues.
The non-tax revenue from power sector is through royalty/cess on water for power
generation, T n D, Rural Electrification etc. The Non Tax revenue which is only Rs 0.01
Cr forms an insignificant part of the total non-tax revenues. The details for the same are
provided in the table below.
Non-tax Revenue
Table XXIX-5: Non Tax Revenues - West Bengal
Revenue 2009-10 2010-11 2011-12
RS Cr
Non Tax Revenue From Power
Sector 0 0 0.01
Total Non-Tax Revenue 4,966 2,438 2,380
Power sector Non-Tax Revenue
/Total state Non-Tax Revenue 0.00% 0.00% ~0%
Source: Audited CAG Accounts for the state: 2011-12, 2010-11, 2009-10
The sector has generated a nominal amount of the non tax revenue since FY10 and hence
the contribution to state revenue has been very marginal.

AF-MERCADOS EMI
Power Sector Operations and Impact on State Finances – Volume II 443
In 2011-12, the Non-Tax revenue from power sector came from Diesel Gas Power
generation.
The overall income generated from power sector, increased from Rs 588 Cr in
FY10 to Rs 769 Cr in FY2011-12.
4.2. EXPENDITURE ON POWER SECTOR
The table below depicts the expenditure towards power sector by the state of West Bengal.
Table XXIX-6: Power Sector Expenditure - West Bengal
Categories 2009-10 2010-11 2011-12
Rs Cr
Capital expenditure 1,090 190 45
Revenue Expenditure 8,438 209 283.08
Total Expenditure 9,528 399 328.08
Source: Audited CAG Accounts for the state: 2011-12, 2010-11, 2009-10
The total expenditure has come down substantially over the period of three years since
2011-12. The capital and revenue expenditure incurred on power sector has decreased
decrease in investments in thermal generation and lesser revenue expenditure as general
expense.
The Revenue generated from the Power sector has exceeded the Expenditure
made on the sector in FY2011 and FY2012.
4.3. POWER BONDS
The outstanding balance for Electricity Bond as on 1st April 2008, was Rs 1571.02 Crores.
The outstanding balance at the end of 2010-11 was Rs 981.89 Crores. The details related
to year of issue of bonds are not mentioned in the available CAG accounts.
As per RBI ‘State Finance Report’ 2014, the outstanding liability of Power Bonds in the
state as on 31st March 2014 was Rs 390 Cr.
4.4. ANALYSIS ON STATE GUARANTEES AND SUBSIDIES
Guarantees
The table below depicts the Guarantees given to Power Sector relative to State Revenue.
Table XXIX-7: Guarantees - West Bengal
Particulars 2009-10 2010-11 2011-12
Rs Cr

AF-MERCADOS EMI
Power Sector Operations and Impact on State Finances – Volume II 444
Guarantees given by State
Govt. 1,856 1,590 1,534
Total Revenues of the State 30,707 30,986 39,464.18
Guarantees as a %age of Total
Revenues of State 6.04% 5.13% 3.89%
Source: Audited CAG Accounts for the state: 2011-12, 2010-11, 2009-10
In 2011-12, the guarantees given towards Power sector were marginal compared to State
revenue.
The table below depicts the share in Guarantees given by the state government to the
Power Sector.
Table XXIX-8: Share of Guarantees - West Bengal
Utilities 2009-10 2010-11 2011-12
Average
Share in
Sector
Guarantees
(%)
Rs Cr
Given to RBI for Power Sector 0 1,300 1,023 47%
For Repayment of share capital,
dividend 1,856 290 267 48%
To Electricity board 0 0 240 5%
Others 0 0 4 0%
Source: Audited CAG Accounts for the state: 2011-12, 2010-11, 2009-10
In 2011-12, majority proportion of the guarantee was towards RBI, Other banks and
Financial Institutions.
Subsidy
In 2010-11, there were no Subsidy payments towards the Power Sector.
4.5. POWER SECTOR FINANCING REQUIREMENT RELATIVE TO STATE ECONOMY
In this section, the expenditure (under all possible heads) on the power sector by the state
government has been listed to determine the state Power sector financing requirement
which is then compared to state finances.
The sector financing requirement is estimated as the summation of total expenditure of the
state government on the sector including Capital and Revenue Expenditure, Loans and
Advances (Net Of Recoveries) and Public Debt repaid (Net of Receipts) by the State
Government.

AF-MERCADOS EMI
Power Sector Operations and Impact on State Finances – Volume II 445
Table XXIX-9: Financing Requirement for the Power Sector (2011-12) - West
Bengal
Particulars
2010-11
Rs. Cr
Power Sector Expenditure (Capital and Revenue) 328.08
Loans And Advances made by the State Government -270.73
8.5% Tax Free Special Bonds of the State Government (Power
Bonds) disbursed during the year 241.84
Loans for Power Projects-T&D from the Central Govt. Discharged
during the year 0
Total Power Sector Financing during the year 299.18
Sector Financing Requirement as a % age of total revenues of state 0.76%
GSDP nominal 3,18,871
Sector Financing Requirement as a % age of GSDP 0.09%
Financial Profit/(Loss) of Discom during the year (with Subsidy
Realised) 95
Sector Financing Requirement (including financial profits of Discom)
as a % age of total revenues of state 0.5%
Sector Financing Requirement (including financial profits of Discoms
as a % age of GSDP 0.06%
Source: Audited CAG Accounts for the state
The financing requirement for the Power sector in the state was estimated to be 0.76% of
the revenue generated by the state and 0.09 % of the Gross State Domestic Product.
Considering, the financial losses of Discoms in the year, the financing requirement of the
sector decreases to 0.5 % of the State revenue and 0.06 % of the GSDP.
AF-MERCADOS EMI
Power Sector Operations and Impact on State Finances – Volume II 446
5. ASSESSMENT OF REGULATORY EFFECTIVENESS
The state of West Bengal demonstrated reasonable performance parameters even in the
pre-reform period.
WBSEB was making significant efforts to reduce transmission and distribution losses.
The Board earned incentive under the APDRP scheme of the Government of India.
Company was making cash profits due to its trading operations, and benefits of the
same were also passed on to the consumers
Consumer tariffs decreased both in real and nominal terms indicating efficiency gains
(besides gains due to trading).
The reforms process was designed through extensive stakeholder consultant to ensure
larger stakeholder buy in. In the post reform period, the State has focused attention on the
need for efficiency improvement and internal reforms within the sector entities.
Accordingly, both the transmission and distribution companies in West Bengal have
embarked upon process of identifying the gaps in the current process and practices, and
adopted best industry practice to address these specific gaps.
Distribution reforms in the West Bengal have been making satisfying progress – interface
metering up to 11 kV has been completed with DTR metering also covered to a reasonable
extent. Completion of consumer metering has been delayed mainly in agricultural segment.
T&D losses have steadily declined over the last few years with improvement in the
collection efficiency.
It has been observed WBERC is not financially dependent on the state government for
meeting their expenditure. Also, WBERC has highest percentage of technical posts (72%)
in the country (42 out of 58).
5.1. STATUS OF IMPORTANT REGULATIONS:
Table XXIX-10: Status of Important Regulations - West Bengal
Parameters Compliance/Details
Formation of SERC Yes
Unbundling Yes
Corporatization of Utilities Yes
Segregation of Trading function from
Transmission
Yes
MYT framework Control Period duration First control period = 1 year (FY 2007-
08); Second control period = 3 years
(FY 2009 to FY 2011); Subsequent
control periods = 3 years (FY 2011-12
to FY 2013-14)
Regularity of Tariff Orders Regular
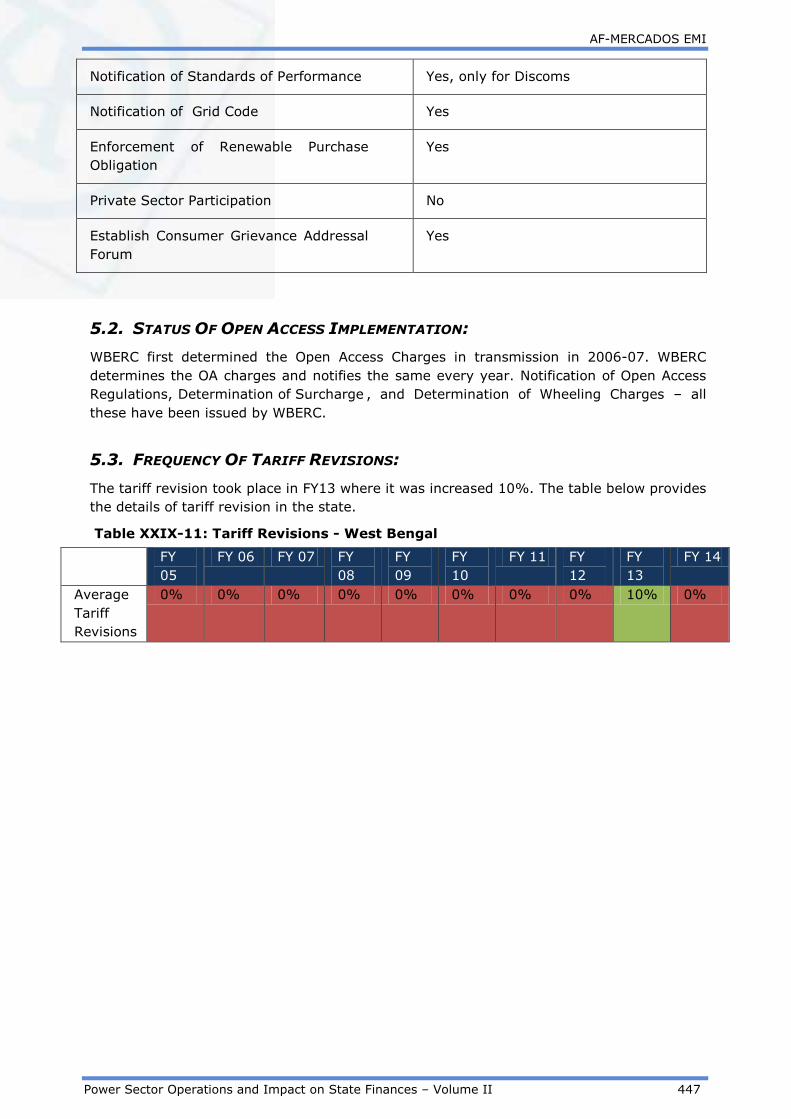
AF-MERCADOS EMI
Power Sector Operations and Impact on State Finances – Volume II 447
Notification of Standards of Performance Yes, only for Discoms
Notification of Grid Code Yes
Enforcement of Renewable Purchase
Obligation
Yes
Private Sector Participation No
Establish Consumer Grievance Addressal
Forum
Yes
5.2. STATUS OF OPEN ACCESS IMPLEMENTATION:
WBERC first determined the Open Access Charges in transmission in 2006-07. WBERC
determines the OA charges and notifies the same every year. Notification of Open Access
Regulations, Determination of Surcharge , and Determination of Wheeling Charges – all
these have been issued by WBERC.
5.3. FREQUENCY OF TARIFF REVISIONS:
The tariff revision took place in FY13 where it was increased 10%. The table below provides
the details of tariff revision in the state.
Table XXIX-11: Tariff Revisions - West Bengal
FY
05
FY 06 FY 07 FY
08
FY
09
FY
10
FY 11 FY
12
FY
13
FY 14
Average
Tariff
Revisions
0% 0% 0% 0% 0% 0% 0% 0% 10% 0%

AF-MERCADOS EMI
Power Sector Operations and Impact on State Finances – Volume II 448
6. SUMMARY
1. Tariff Hikes: The ARR has been greater than ACS in the last 7 years ensuring cost
recovery. The tariff revision had taken place in FY13 where it increased 10%.
2. Financial Viability: WBSEDCL has been in profits over the years except FY05.
However to insure that, the tariff revisions should continue to take place in the state.
3. Regulatory Assets: The state has huge regulatory assets. After releasing of existing
regulatory asset and after adjusting a part of the amount to be recovered due to
WBSEDCL’s Annual Performance Review of 2009-10 and 2010-11 through this tariff
order the balance amounts remaining as regulatory asset after the tariff order upto
2012 – 2013 were 2174.82 Crores. This is a cause of concern going forward and the
commission needs to reduce such regulatory asset rapidly so that its impact can be
reduced fast and in future have small impact on tariff increase beyond 3rd Control
Period though a part of regulatory release that shall continue in subsequent control
periods.
4. Subsidy: The state government does not give any subsidy amount to WBSEDCL and
that would not be expected to change as the Discom continues to be in profits.
5. Past Financial Baggage: The outstanding balance for Electricity Bond as on 1st
April 2008, was Rs 1571.02 Crores. The outstanding balance at the end of 2010-11
was Rs 981.89 Crores.
6. Operational Efficiency: The cost of supply of Discoms has been increasing over the
years especially due to the increase in power purchase costs. However, the Discom
has always been in profits since FY06. The tariff revision needs to take place time to
time to insure profitability in the coming years as well. AT&C losses have been high
and were 33% in FY13. WBSEDCL needs to take significant initiatives to bring down
these losses including introduction of high voltage distribution system; appropriate
metering and billing of agricultural consumers; audit mapping; Spot billing facility for
all categories of L & MV consumers etc.
7. States Guarantees: Guarantees given by the government to the Power sector have
been ~4% of the Total Revenue generated by the state.
8. Revenues from the sector to the state: Total Revenue – tax and non-tax
revenues (Rs. 770 Crores) from the Power sector is more (almost double) than the
total expenditure on the sector (Rs. 328 Crores). The financing requirement for the
Power sector in the state was estimated to be 0.76% of the revenue generated by
the state and 0.09 % of the Gross State Domestic Product.
WBSEB and post unbundling WBSEDCL has turned in improved financial performance in the
past few years due to better collection performance, and income arising from UI charges &
trading. Of the above factors, income due to UI charges may not be recurring in the
coming years. Hence the ability to constantly improve upon its operational efficiency
parameters including reduction in losses etc and reduction in regulatory assets will be
critical in ensuring that the financial improvement seen is sustained, especially if tariffs are
not to increase in the state. Rightly, the power sector entities in the state in the post

AF-MERCADOS EMI
Power Sector Operations and Impact on State Finances – Volume II 449
reform period have focused on internal restructuring to improve their process and
operational efficiency. On account of reforms as well as sale of surplus power, the state
finances face low risk on account of power sector.


![[XLS]fincomindia.nic.infincomindia.nic.in/writereaddata/html_en_files/fincom14/... · Web viewPANAIYAPATTI MANGUDI KILLANUR KALIKULANVAYAL VELLUR MYLAPORE OLIYAMANGALAM PERAMBUR THIRUMAYAM](https://static.fdocuments.us/doc/165x107/5b0c37e07f8b9a0b0f8ebbf6/xls-viewpanaiyapatti-mangudi-killanur-kalikulanvayal-vellur-mylapore-oliyamangalam.jpg)