Power Quality and Voltage Profile Analyses of High ... power plant data and the simulation studies,...
8
1 Power Quality and Voltage Profile Analyses of High Penetration Grid-tied Photovoltaics: A Case Study Arash Anzalchi, Student Member, IEEE, Aditya Sundararajan, Student Member, IEEE, Amir Moghadasi, Member, IEEE, and Arif Sarwat, Senior Member, IEEE Abstract—Installed Photovoltaic (PV) capacity across the smart distribution grid has been on the rise in order to reduce greenhouse gas emissions. However, under high penetration of PV, there could be potential impacts on the operation and planning of distribution networks. In order to evaluate the impacts of grid-tied PV, a case study on power quality and voltage profile analyses is conducted using a 1.1 MW AC grid-tied PV power plant located at Florida International University. As part of the power quality analysis, study explores Total Harmonic Distortion (THD) and high power and high energy ramp rate analysis. Current THD is posed to trigger problems when generation is highly intermittent wherein Voltage THD does not have a tight relationship with power output. For voltage profile analysis, the case study considers peak and minimum daytime load scenarios under different levels of penetration, including the existing level, and appraises the plant’s current and potential impacts in steady- state and time-series scenarios. The effect of using smart inverters with grid-support functions is also simulated. Results show that some major problems like voltage deviations and feeder losses can be expected at 60% PV penetration in minimum daytime load. The number of switching operations for voltage regulators also increase when smart inverters operate at Volt/VAr control mode. Results of the case study are discussed to highlight the significance of these issues in high penetration scenarios. Index Terms—Smart distribution grid, High penetration PV, Overvoltage, Power Quality, Total Harmonic Distortion (THD) I. I NTRODUCTION T RADITIONAL power plants are designed with centrally controlled power plants that have a large inertial response [1]. Renewable energy, however, is independently controlled and intermittent in nature. Hence, adapting the smart grid to include renewable generation sources, improving its energy delivery and efficiency, enhancing and maintaining its power reliability and quality, and ensure power availability with self- healing principles have emerged as the important cornerstones for the future smart grid renewable integration studies. It is common knowledge that synchronous generators are capable of riding through system disturbances in order to maintain the grid voltage and frequency at desired levels. However, renewable energy, especially solar Photovoltaic (PV) and wind, is now a key contributor to our society’s dynamic energy needs, but their integration into the power grid poses significant technical challenges [2]. As the penetration levels of PV increases, especially into the distribution grid network, its intermittency causes power quality and voltage fluctuation issues, among others [3]. The impact of PV in- tegration into the smart grid at a particular feeder decreases with the increase in its distance from the distribution substation from which the feeder originates. Some critical power quality concerns are: 1) Voltage, frequency and power fluctuations at the point of interconnection caused by the intermittencies in PV generation that is, in-turn, dependent on local weather con- ditions [4]; and 2) Harmonics introduced by power electronic devices utilized in renewable energy generation under high penetration levels [5]. Additionally, voltage fluctuations could be observed in the form of: 1) Overvoltage scenarios where the maximum feeder voltage exceeds the threshold stipulated by grid codes and standards such as IEEE 1547 [6] and UL 1741; and 2) Significant voltage deviations observed which surpass the recommended limits of 3% at the primary and 5% at the secondary [7]. These changes cause the voltage regulators to undergo switching operations, which could be further aggravated when the plant’s smart inverters operate in control modes such as Volt/VAr instead of unity power factor [8]. More frequently changing operations reduces the life of regulators, and makes them less efficient in the longer run. A summary of high penetration PV impacts on distribution grid is provided in Section II. In order to understand and signify the impacts of PV penetration on the smart grid at a distribution grid level, a case study is proposed in this paper. To this effect, the paper explores two classes of analyses: power quality and voltage profiling. Remainder of the paper is organized as follows. Section II briefly summarizes the impacts of high-penetration PV scenarios on the distribution smart grid, highlighting impacts, reasons for those impacts, associated problems, and proposed mitigation solutions. Section III introduces the case study and its scope by describing the considered grid-tied PV power plant. Section IV provides the results gathered from real PV power plant data and the simulation studies, then discusses the observations inferred from them. The Section conducts both power quality as well as voltage profile analyses, each with multiple use-cases delineated correspondingly. Section V provides a brief conclusion summarizing the study and documents future work. II. I MPACTS OF PV As briefly mentioned in Section I, there are multiple conse- quences that arise out of large-scale integration of PV into the distribution level smart grid. These impacts can be grouped as Voltage, Power Quality , Power Flow, Protection, and Active Device impacts. Voltage impacts can be further considered as High Voltage Impacts (HVIs) due to low load conditions Page 1 of 8 978-1-5090-4894-6/17/$31.00 © 2017 IEEE 2017-PSEC-0794
Transcript of Power Quality and Voltage Profile Analyses of High ... power plant data and the simulation studies,...

1
Power Quality and Voltage Profile Analyses of High
Penetration Grid-tied Photovoltaics: A Case StudyArash Anzalchi, Student Member, IEEE, Aditya Sundararajan, Student Member, IEEE,
Amir Moghadasi, Member, IEEE, and Arif Sarwat, Senior Member, IEEE
Abstract—Installed Photovoltaic (PV) capacity across thesmart distribution grid has been on the rise in order to reducegreenhouse gas emissions. However, under high penetration of PV,there could be potential impacts on the operation and planningof distribution networks. In order to evaluate the impacts ofgrid-tied PV, a case study on power quality and voltage profileanalyses is conducted using a 1.1 MW AC grid-tied PV powerplant located at Florida International University. As part of thepower quality analysis, study explores Total Harmonic Distortion(THD) and high power and high energy ramp rate analysis.Current THD is posed to trigger problems when generation ishighly intermittent wherein Voltage THD does not have a tightrelationship with power output. For voltage profile analysis, thecase study considers peak and minimum daytime load scenariosunder different levels of penetration, including the existing level,and appraises the plant’s current and potential impacts in steady-state and time-series scenarios. The effect of using smart inverterswith grid-support functions is also simulated. Results show thatsome major problems like voltage deviations and feeder lossescan be expected at 60% PV penetration in minimum daytimeload. The number of switching operations for voltage regulatorsalso increase when smart inverters operate at Volt/VAr controlmode. Results of the case study are discussed to highlight thesignificance of these issues in high penetration scenarios.
Index Terms—Smart distribution grid, High penetration PV,Overvoltage, Power Quality, Total Harmonic Distortion (THD)
I. INTRODUCTION
TRADITIONAL power plants are designed with centrally
controlled power plants that have a large inertial response
[1]. Renewable energy, however, is independently controlled
and intermittent in nature. Hence, adapting the smart grid to
include renewable generation sources, improving its energy
delivery and efficiency, enhancing and maintaining its power
reliability and quality, and ensure power availability with self-
healing principles have emerged as the important cornerstones
for the future smart grid renewable integration studies. It is
common knowledge that synchronous generators are capable
of riding through system disturbances in order to maintain the
grid voltage and frequency at desired levels.
However, renewable energy, especially solar Photovoltaic
(PV) and wind, is now a key contributor to our society’s
dynamic energy needs, but their integration into the power grid
poses significant technical challenges [2]. As the penetration
levels of PV increases, especially into the distribution grid
network, its intermittency causes power quality and voltage
fluctuation issues, among others [3]. The impact of PV in-
tegration into the smart grid at a particular feeder decreases
with the increase in its distance from the distribution substation
from which the feeder originates. Some critical power quality
concerns are: 1) Voltage, frequency and power fluctuations at
the point of interconnection caused by the intermittencies in
PV generation that is, in-turn, dependent on local weather con-
ditions [4]; and 2) Harmonics introduced by power electronic
devices utilized in renewable energy generation under high
penetration levels [5]. Additionally, voltage fluctuations could
be observed in the form of: 1) Overvoltage scenarios where
the maximum feeder voltage exceeds the threshold stipulated
by grid codes and standards such as IEEE 1547 [6] and UL
1741; and 2) Significant voltage deviations observed which
surpass the recommended limits of 3% at the primary and
5% at the secondary [7]. These changes cause the voltage
regulators to undergo switching operations, which could be
further aggravated when the plant’s smart inverters operate in
control modes such as Volt/VAr instead of unity power factor
[8]. More frequently changing operations reduces the life of
regulators, and makes them less efficient in the longer run. A
summary of high penetration PV impacts on distribution grid
is provided in Section II.
In order to understand and signify the impacts of PV
penetration on the smart grid at a distribution grid level, a
case study is proposed in this paper. To this effect, the paper
explores two classes of analyses: power quality and voltage
profiling. Remainder of the paper is organized as follows.
Section II briefly summarizes the impacts of high-penetration
PV scenarios on the distribution smart grid, highlighting
impacts, reasons for those impacts, associated problems, and
proposed mitigation solutions. Section III introduces the case
study and its scope by describing the considered grid-tied PV
power plant. Section IV provides the results gathered from real
PV power plant data and the simulation studies, then discusses
the observations inferred from them. The Section conducts
both power quality as well as voltage profile analyses, each
with multiple use-cases delineated correspondingly. Section
V provides a brief conclusion summarizing the study and
documents future work.
II. IMPACTS OF PV
As briefly mentioned in Section I, there are multiple conse-
quences that arise out of large-scale integration of PV into the
distribution level smart grid. These impacts can be grouped as
Voltage, Power Quality , Power Flow, Protection, and Active
Device impacts. Voltage impacts can be further considered
as High Voltage Impacts (HVIs) due to low load conditions
Page 1 of 8
978-1-5090-4894-6/17/$31.00 © 2017 IEEE
2017-PSEC-0794
2
but high PV generation, or Low Voltage Impacts (LVIs) due
to peak load scenarios. While HVIs reduce the lifespan of
electrical equipment and trip PV inverters off-line, LVIs trigger
malfunctioning of appliances. To address HVIs, PV inverters
could be operated at a lagging power factor in order to absorb
reactive power, or the switch capacitor bank controls could
be modified. Additionally, fixed Capacitor Banks (CB) could
be removed or converted to switched capacitors. To mitigate
LVIs, inverters must inject reactive power by operating at
a leading power factor. Control settings of capacitors, Load
Tap Changers (LTCs), and Voltage Regulators (VR) could
be modified, besides installing additional voltage regulation
equipment.
Power quality issues due to variations in PV output, cause
fluctuations in customer service voltage. To curb power
quality-related issues, the utility should review the phase
balance of the circuitry, since a well balanced phase circuit
offers better relief typically. Increased switching operations of
LTCs, CBs, and VRs due to intermittencies in PV generation
reduces their active lives, prompting frequent repairs and
replacements. Changing setpoint voltage, bandwidth, and/or
time delays for LTCs and VRs; and changing the control
mode and time delays for capacitor banks are some mitigation
strategies proposed in literature.
PV inverters are nonlinear loads and contribute to the
harmonic distortion in the network. Different studies docu-
ment their impacts on the harmonic distortion in the grid.
The bottomline concern of these studies is that additional
injection of harmonic currents by PV inverters increases
voltage distortion in the network. Currently, while synchronous
generators produce electric power, nonlinear loads remain the
cause for voltage distortions. Under high penetration scenarios,
however, the following changes come into effect: 1) Harmonic
emission of PV inverters that currently act as current sources
of distortion; and 2) Equivalent impedance of inverters behave
as mainly capacitive elements in contrast with directly-coupled
inductive electrical machines. While the earlier models of
PV inverters had current Total Harmonic Distortions (THDs)
between 10% and 20%, the standards stipulate the Total
Demand Distortion (TDD) of all distributed generators to 5%.
A harmonic distortion of 5% or less is specified by the recent
models of PV inverters under nominal operating conditions,
which is relatively low for loads in today’s network.
Reverse power flow is caused due to light load and high PV
generation, creating problems for the protection systems and
voltage regulators, effectively lowering the system reliability.
Using bidirectional protection, adding additional regulations
and/or making modifications to the regulator control are some
approaches available in literature to address this concern.
When high levels of PV penetration is realized under the
same transformer, it causes overloading and malfunctioning
of critical devices, to mitigate which, distribution transformers
are proposed to be replaced with those that can bear the
entire PV output. Increase in the fault current levels can lead
to system protection-related impacts. Desensitizing substation
relays, surpassing interruption rating, fault sensing, asyn-
chronous reclosing, and transient overvoltage are some prob-
lems that become pronounced under such conditions. Installing
current-limiting devices, revising relay settings, reducing delay
trip time for PV tripping, modifying inverter protection, and
installing lightning arrestors are some mitigatory strategies
proposed in literature. The case study emphasizes its focus
on two of these wide range of impacts, namely the voltage
and power quality impacts. Before discussing the results, it is
important to provide context and scope for the case study by
describing and highlighting the features of the PV power plant
considered, included in the following Section.
III. PV PLANT DESCRIPTION AND CASE STUDY SCOPE
In order to analyze the voltage profile and power quality
due to grid-tied PV, a comprehensive study was conducted on
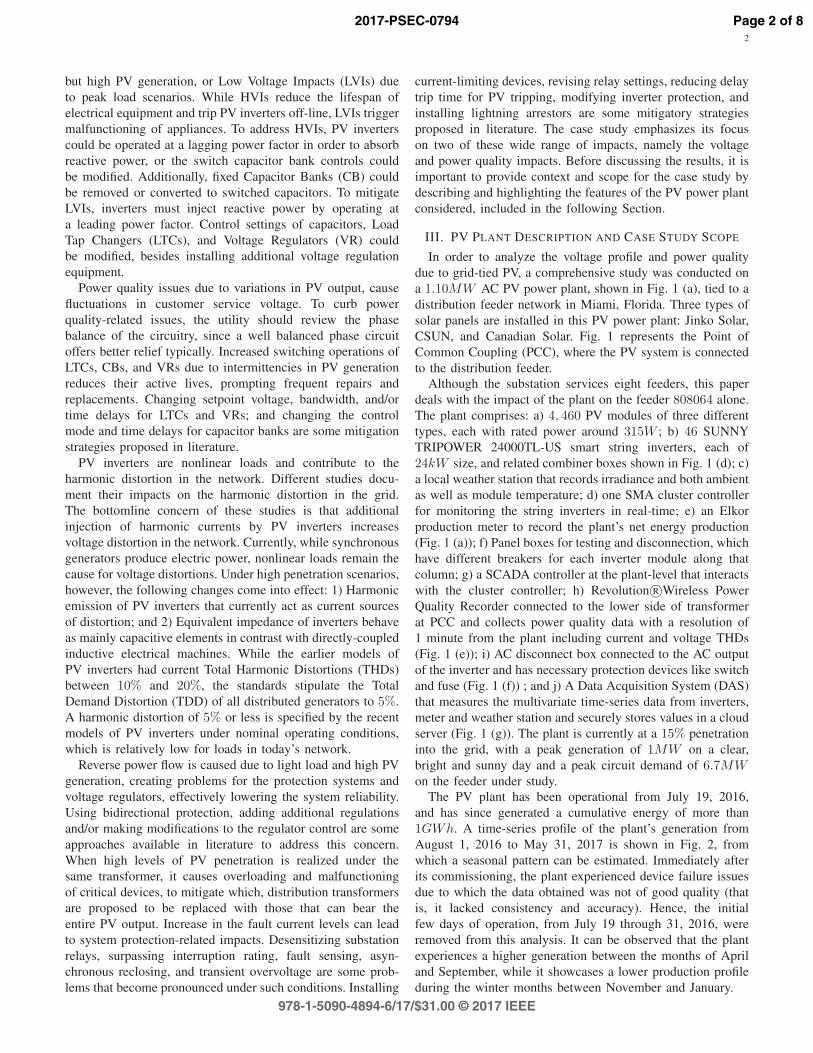
a 1.10MW AC PV power plant, shown in Fig. 1 (a), tied to a
distribution feeder network in Miami, Florida. Three types of
solar panels are installed in this PV power plant: Jinko Solar,
CSUN, and Canadian Solar. Fig. 1 represents the Point of
Common Coupling (PCC), where the PV system is connected
to the distribution feeder.
Although the substation services eight feeders, this paper
deals with the impact of the plant on the feeder 808064 alone.
The plant comprises: a) 4, 460 PV modules of three different
types, each with rated power around 315W ; b) 46 SUNNY
TRIPOWER 24000TL-US smart string inverters, each of
24kW size, and related combiner boxes shown in Fig. 1 (d); c)
a local weather station that records irradiance and both ambient
as well as module temperature; d) one SMA cluster controller
for monitoring the string inverters in real-time; e) an Elkor
production meter to record the plant’s net energy production
(Fig. 1 (a)); f) Panel boxes for testing and disconnection, which
have different breakers for each inverter module along that
column; g) a SCADA controller at the plant-level that interacts
with the cluster controller; h) Revolution R©Wireless Power
Quality Recorder connected to the lower side of transformer
at PCC and collects power quality data with a resolution of
1 minute from the plant including current and voltage THDs
(Fig. 1 (e)); i) AC disconnect box connected to the AC output
of the inverter and has necessary protection devices like switch
and fuse (Fig. 1 (f)) ; and j) A Data Acquisition System (DAS)
that measures the multivariate time-series data from inverters,
meter and weather station and securely stores values in a cloud
server (Fig. 1 (g)). The plant is currently at a 15% penetration
into the grid, with a peak generation of 1MW on a clear,
bright and sunny day and a peak circuit demand of 6.7MWon the feeder under study.
The PV plant has been operational from July 19, 2016,
and has since generated a cumulative energy of more than
1GWh. A time-series profile of the plant’s generation from
August 1, 2016 to May 31, 2017 is shown in Fig. 2, from
which a seasonal pattern can be estimated. Immediately after
its commissioning, the plant experienced device failure issues
due to which the data obtained was not of good quality (that
is, it lacked consistency and accuracy). Hence, the initial
few days of operation, from July 19 through 31, 2016, were
removed from this analysis. It can be observed that the plant
experiences a higher generation between the months of April
and September, while it showcases a lower production profile
during the winter months between November and January.
Page 2 of 8
978-1-5090-4894-6/17/$31.00 © 2017 IEEE
2017-PSEC-0794

3
(a) (b) (c)
(d) (e) (f) (g)
Fig. 1. PV Plant Components: a) 4460 PV modules of three different types but each with rated power around 315W, b) Transformer, Energy meter, andMain dosconnect at the Point of Common Coupling(PCC), c) Panel Boxes for testing and disconnection, d) Smart field SUNNY TRIPOWER 24000TL-USinverters, e) Revolution R Wireless Power Quality Recorder connected at the low side of transformer, f) AC disconnect box which is connected to the ACoutput of the inverter, g) DAS that measures the multivariate time-series data from inverters, meter and weather station and securely stores in a cloud server.
Fig. 2. Aggregated plant energy generation (kWh) of the PV plant since itscommissioning
The plant is located at a distance of 1.7 miles from the
feeder’s substation, as represented in Fig. 3. At the substation,
there is a 138kV /23kV step-down transformer and circuit
breakers tapping into different feeders for distribution of
power. At the plant, a 480V /277V , 2000 KVA oil-cooled step-
down transformer is present, as shown in Fig. 1 (b).
Prior to analysis, the real-time data recorded from the plant
was subjected to an organized sequence of data pre-processing
stages that involved reformatting, structuring, detecting and
filtering missing data, and identifying and removing outliers.
Exploratory visualization techniques were also employed to
determine the nature, behavior and structure of the individual
datasets. These steps were useful in determining not only the
fitness of the data for further analysis, but also in understand-
ing how the various datasets (such as weather and net produc-
tion, for instance) are inherently dependent on one another.
Further discussion of data cleansing and preprocessing steps
is beyond the scope of this paper. However, once cleansed,
the data is considered ready to be used for the power quality
study and voltage profile analysis discussed in this paper.
Effective voltage profile analysis and power quality study
are multi-step approaches which require developing the system
model and reviewing the feeder monitoring criteria recom-
mended by grid code requirements set by IEEE standard 1547.
In order to develop the system model, Synergi, a modeling
software with license, is used. Synergi is capable of advanced
modeling applications where the feeder and substation model
snapshots are loaded as Microsoft Access Database files
into it and corresponding Single Line Diagrams (SLDs) are
generated. Real-time solar irradiance data is acquired from the
site’s DAS and averaged to hourly values prior to importing
into Synergi.
IV. RESULTS AND ANALYSIS
Based on the review of grid code requirements documented
by standards IEEE 1547 and UL 1741, different feeder moni-
Page 3 of 8
978-1-5090-4894-6/17/$31.00 © 2017 IEEE
2017-PSEC-0794

4
Fig. 3. Single Line Diagram of concerned system
TABLE IFEEDER MONITORING CRITERIA
Category Criteria Basis Flag
VoltageOvervoltage Feeder
voltage> 1.05V pu
Voltage deviation Deviationfrom noPV tofull PV
3% primary, 5%
secondary
Power QualityIndividualharmonics
Harmonicmagni-tude
> 3%
Voltage THD Totalhar-monic
> 5%
Legacy DevicesLTC, Regulator Increased
Duty> basecase+ 1
Capacitor IncreasedDuty
> basecase+ 1
toring criteria were elicited, summarized in Table I. It clearly
shows the criteria, basis and threshold values for both the
power quality study as well as voltage profile analysis. It
is noteworthy that the concerned feeder, which serves 700
residential and 200 commercial customers, has three capacitor
banks, one voltage regulator, and two transformers. Following
subsections look at power quality and voltage profile analysis.
A. Power Quality Study
The power quality study under grid-integrated PV scenarios
is examined in this section under two analyses: a) Power Ramp
Rate study, and b) Harmonic Distortion study. While the power
ramp rate study includes the analysis of high power density
and high energy density ramp rates, the harmonic distortion
study looks at both current as well as voltage THDs.
1) Power Ramp Rate Study: Ramp rates in power can be
caused due to multiple reasons, of which cloud-induced power
intermittencies are considered as a major characteristic. Single-
sided power ramp rates, either ramp-up or ramp-down, at
the point of interconnection (also called Point of Common
Coupling or PCC), are represented in Fig. 4, which shows
that majority of the power ramps are under 50kW/min, and
almost 20% of them exceed the 12% limit (corresponding
to 140kW/min). Thus, it is clear that ramp rates will pose
serious threat as penetration levels increase. However, power
ramps of this order can be easily mitigated and smoothed by
integrating them with hybrid energy storage systems.
Fig. 4. Histogram of real power ramp rates for Mar 1-10, 2017
(a)
(b)
Fig. 5. Power ramping scenarios for the PV power plant. a)High power densityramp rate profile, b) High energy density ramp rate profile.
The power ramp rates have been categorized in this case
study as high power and high energy density ramp rates, each
of which are shown in Figs. 5 (a) and 5 (b), respectively.
A high power density ramp rate with a 771kW/min of
ramp down and a 799kW/min ramp up was observed. Using
supercapacitors minimizes impacts of these ramps. The high
energy density ramp exhibits an energy deviation of 13.6kWhin less than 5 minutes, effectively mitigated by battery banks.
2) Harmonic Distortion Study: THD is not the best mea-
sure of PV-induced harmonics, since the fundamental current
is reduced by PV generation, making harmonics larger by com-
parison and consequently increasing THD values. The effect
of low solar irradiation level on injected current emissions is
Page 4 of 8
978-1-5090-4894-6/17/$31.00 © 2017 IEEE
2017-PSEC-0794

5
(a)
(b)
Fig. 6. THDs monitored over 1 month for the case study. a) Voltage THDfor the PV power plant, b)Current THD for the PV power plant.
accounted for in the case study. Monitored for a period of one
month, the voltage and current THDs recorded for the power
plant are plotted against the real power output in Figs. 6 (a)
and 6 (b). It can be seen that the total current THD is highly
sensitive to changes in irradiance but the total voltage THD
does not maintain such a strong relation with the same. As
the real power output crosses 870kW , the voltage THD does
not exceed 4.1%, with its values ranging between 4.5 and 5%
when the power output is between 100 and 400kW .
Fig. 7. Current THD with respect to real power and time
The power output and current THD for March 11, 2017,
when a lot of fluctuations in irradiance was observed, is
depicted by Fig. 7. This goes on to validate the relation
between power and current THD more precisely. It can be
further noted that the shape of current THD curve is nearly
inverted to that of the output real power.
B. Voltage Profile Analysis
Analyzing real time voltage data from January 2017 to
July 28 2017, does not show any voltage violation above
5%, except for days May 17 to May 24, 2017 and June 21
to July 16, 2017. Real RMS voltage of the lower side of
transformer, real PV power output data from Provision PQ
meter is illustrated in Fig. 8. Since most of voltages out of limit
were happened during this period, these days were selected.
As it can be seen from the right side of Fig. 8, these violations
happened mostly at night time, when there is no PV output.
Moreover, the overall voltage rises throughout the day as the
load decreases (during late night). Therefore, these voltage
violations are not due to PV penetration to the feeder. The
voltage profile analysis under grid-integrated PV scenarios is
examined in this section as two analyses: a) Steady-state, and
b) Time-series. While the steady-state analysis determines the
worst-case feeder response that would occur when the PV
generation changes drastically from zero to maximum, time-
series analysis is conducted for the load or PV time-of-day
coincidental scenarios.1) Steady-State Scenario Study: Considering steady-state
scenario is static in nature, the load flow analysis for the
system is conducted for different use-cases. Each use-case has
two scenarios that define it: the dynamic load profile scenario,
and the different levels of PV penetration scenario. Although
the existing level of penetration is 15%, this study considers
futuristic scenarios where the penetration could go as high as
140% of the peak load. The load scenarios, on the other hand,
could be the Peak Daytime Load (PDL) day, or the Minimum
Daytime Load (MDL) day. Accordingly, the mapping between
these two classes of scenarios as shown in Fig. 9 would create
multiple use-cases for which the results are shown. For each
use-case, all steady-state technical criteria tabulated in Table
I are verified.
Voltage Deviation Study: In order to conduct this study,
the two load scenarios were each mapped to two different
penetration levels (existing and 60%), to generate four use-
cases. It is to be noted that for this setup, the voltage deviation
in accordance with the recommendations from Table I should
not exceed 0.3V. Fig. 10 (a) shows the voltage deviation for
the PDL scenario under existing penetration level with respect
to the distance from the substation. It is a general trend that
the deviations subside as the distance increases. Moreover,
it is seen that the values are well below the recommended
one shown in Table I. However, at 60% penetration, shown
in Fig. 10 (b), although the deviations are still below the
threshold, they are dangerously close to exceeding it, espe-
cially at distances closer to the substation. Much similarly,
Fig. 11 shows the deviation in voltage for the MDL scenario
again for existing and 60% penetration levels with respect to
distance from the substation. While the deviations are below
the stipulated threshold for existing penetration level, they
exceed the same under levels of 60% penetration significantly
by 0.15V , at a distance closest to the substation. Considering
PV is located at the end of the feeder, no significant impacts
were observed.
Page 5 of 8
978-1-5090-4894-6/17/$31.00 © 2017 IEEE
2017-PSEC-0794

6
Fig. 8. Maximum RMS values for voltage, Power output, and Load (May 17 - Jul 27, 2017.
Fig. 9. Mapping scenario classes for use-case generation
Feeder Loss Study: The feeder losses (kW) for the PDL
and MDL scenarios under different penetration levels is illus-
trated graphically in Fig. 12. It can be observed that the losses
show a gradually declining trend for the PDL scenario where
the losses drop by a factor of 66% from 0 to 140% penetration,
but the same cannot be said for the MDL scenario, where the
losses initially seem to decline, with the lowest losses observed
for 60 − 80% penetration, but steadily climb up again as the
penetration hikes to 140%. It is incidentally seen the losses are
more or less the same for both extremities of the penetration
level in this load scenario.
2) Time-Series Scenario Study: Unlike the steady-state
scenario, the time-series study requires a different kind of
system modeling, also conducted on Synergi. All distributed
loads are assumed to be modeled as urban residential loads
and all spot loads are modeled as urban commercial loads
in order to construct the load model for the study, shown in
Fig. 13. Further, two scenarios are considered here: a sunny
day where the sky is clear and bright blue, and a cloudy
day where the sky is overcast. The irradiance models for
both these scenarios using 15-min irradiance interval data are
shown in Fig. 13. However, in Synergi software, the one-hour
resolution data is used by taking an average from 15-min
resolution data. Further, three different PV inverter control
modes are considered for this study, namely: Power Factor
control, Volt/VAr control, and Volt/Watt control.
For PF control mode, PF=0.85 was considered. The voltage
profile analysis was then conducted for a sunny day scenario,
as depicted by Fig. 14, by varying PV penetration levels as:
existing (sky blue), 40% (orange), 60% (grey), 80% (yellow),
(a)
Fig. 10. Voltage deviation study for PDL scenario. a)Existing Penetration, b)60% Penetration
100% (deep blue), 120% (green), and 140% (dark blue).
As shown in Fig. 14 (a), the maximum voltage exceeds
the threshold at 60% penetration and above for PF=0.85.
Similarly, the threshold is exceeded at the same level of
penetration even for Volt/VAr control mode, shown in Fig.
14 (b). This might prompt the inverters to be operated at
PF=1 considering the limit is not violated. However, this
contradicts the recommendations made by IEEE 1547 which
requires inverters to operate in Volt/VAr control mode. Hence,
appropriate mitigation strategies are required. It can be further
Page 6 of 8
978-1-5090-4894-6/17/$31.00 © 2017 IEEE
2017-PSEC-0794

7
(a)
(b)
Fig. 11. Voltage deviation study for MDL scenario. a) Existing Penetration,b) 60% Penetration.
Fig. 12. Feeder Losses for MDL and PDL scenarios
noted that the number of switching operation is 6 for PF=0.85,
and jumps to 36 for Volt/VAr mode
The above study was now repeated for a cloudy day
scenario, and the number of switching operations was observed
for PF=0.85, and Volt/VAr control modes. The maximum
feeder voltage variations are shown in Fig. 15. At 60% pene-
tration level and beyond, the maximum feeder voltage exceeds
the threshold for both PF=0.85 and Volt/VAr modes, depicted
respectively in Figs.15 (a) and 15 (b), with corresponding
switching operations as 6 and 69. When compared with their
operations on a sunny day, it can be observed that when
PV inverters operate in Volt/VAr mode on a cloudy day, the
voltage regulators undergo switching operations nearly twice
more, which significantly reduces their performance and spells
adverse effects on the grid.
Fig. 13. Irradiance and Load models for System Modeling. Irradiance modelfor sunny day (10/22/2017), Irradiance model for cloudy day (10/12/2017),Load Model
(a)
(b)
Fig. 14. Maximum Feeder Voltage for different control modes on sunny daya)Power Factor = 0.85 b) Volt/VAr mode
A consolidated representation of the number of switching
operations for the 8 voltage regulators operating under various
control modes in both sunny as well as cloudy days. As
can be seen in Table II, the number of switching opera-
tions is relatively stable between 1 and 2 until 100%, with
the number creeping to 3 on a cloudy day scenario. When
PF=0.85, the number of operations show a steady rise with
penetration levels, peaking at 11 and 15 operations for sunny
and cloudy days, respectively at 140% penetration. Similarly,
when operated under Volt/Watt mode, the operations peak
at 16 and 19 for the same penetration level, represented
in Table II. Finally, under Volt/VAR, maximum number of
switching operations is observed, with 44 on sunny and 113
on cloudy day for maximum penetration scenario considered
in this paper. This supports the hypothesis that number of
operations increases with penetration levels, and that Volt/Watt
and Volt/VAR modes are more dramatic than PF. This might
Page 7 of 8
978-1-5090-4894-6/17/$31.00 © 2017 IEEE
2017-PSEC-0794

8
TABLE IITOTAL NUMBER OF SWITCHING OPERATIONS.
PF= 1 PF= 0.85 Volt/Watt Volt/Watt
Sunny Cloudy Sunny Cloudy Sunny Cloudy Sunny Cloudy
20% PV 1 2 1 2 1 2 1 2
40% PV 1 2 1 2 1 2 1 2
60% PV 1 2 2 3 2 3 5 16
80% PV 1 2 3 3 6 6 22 42
100% PV 2 2 6 6 8 11 36 69
140% PV 2 3 11 15 16 19 44 113
(a)
(b)
Fig. 15. Maximum Feeder Voltage for different control modes on cloudy daya) Power Factor = 0.85 b)Volt/VAr mode
prompt the inverters to be operated at PF considering the limit
is not violated. However, it contradicts recommendations made
by IEEE 1547 which require inverters to operate in Volt/VAr
mode. Hence, mitigation strategies are required.
V. CONCLUSION AND FUTURE WORK
A case study was presented in this paper for evaluating the
impacts of high penetration PV on the distribution level of
smart grid. Two crucial impacts were selected from literature,
power quality and voltage impacts. A system model using
Synergi and data from the plant’s data acquisition unit and
power quality recorder was constructed. Multiple use-cases
and scenarios were delineated for the two studies. Power
quality issues were studied using high resolution data for
current and voltage THDs based on real measurements. It was
concluded that no problematic issues persisted at the existing
penetration level of 1.1 MW. Current THDs over 5% has been
increased when the power output is less than 451 kW and it has
a tight connection to the output power. Voltage profile analyses
for steady-state and time-series scenarios revealed that at 60%
penetration level, significant impacts due to voltage deviation
and feeder losses could be observed. Further, the number of
switching operations for voltage regulators increases dramat-
ically when PV inverters operate in Volt/VAr control mode,
followed by Volt/Watt, and finally Power Factor. Although
unity power factor causes least number of operations, the grid
codes require the use of Volt/VAr mode for inverter control.
Hence, strategies to mitigate these impacts are required.
REFERENCES
[1] A. Anzalchi, M. M. Pour, and A. Sarwat, “A combinatorial approachfor addressing intermittency and providing inertial response in a grid-connected photovoltaic system,” in 2016 IEEE Power and Energy Society
General Meeting (PESGM), July 2016, pp. 1–5.
[2] A. Anzalchi and A. Sarwat, “Artificial neural network based duty cycleestimation for maximum power point tracking in photovoltaic systems,”in SoutheastCon 2015, April 2015, pp. 1–5.
[3] R. Seguin, J. Woyak, D. Costyk, J. Hambrick, and B. Mather,High-Penetration PV Integration Handbook for Distribution Engineers,Jan 2016. [Online]. Available: http://www.osti.gov/scitech/servlets/purl/1235905
[4] X. Liang, “Emerging power quality challenges due to integration ofrenewable energy sources,” IEEE Transactions on Industry Applications,vol. 53, no. 2, pp. 855–866, March 2017.
[5] A. Anzalchi, M. Moghaddami, A. Moghaddasi, A. I. Sarwat, and A. K.Rathore, “A new topology of higher order power filter for single-phase grid-tied voltage-source inverters,” IEEE Transactions on Industrial
Electronics, vol. 63, no. 12, pp. 7511–7522, Dec 2016.
[6] “Ieee application guide for ieee std 1547(tm), ieee standard for inter-connecting distributed resources with electric power systems,” IEEE Std
1547.2-2008, pp. 1–217, April 2009.
[7] T. T. Ku, C. H. Lin, C. S. Chen, C. T. Hsu, W. L. Hsieh, and S. C.Hsieh, “Coordination of pv inverters to mitigate voltage violation forload transfer between distribution feeders with high penetration of pvinstallation,” IEEE Transactions on Industry Applications, vol. 52, no. 2,pp. 1167–1174, March 2016.
[8] A. O’Connell and A. Keane, “Volt-var curves for photovoltaic inverters indistribution systems,” IET Generation, Transmission Distribution, vol. 11,
no. 3, pp. 730–739, 2017.
Page 8 of 8
978-1-5090-4894-6/17/$31.00 © 2017 IEEE
2017-PSEC-0794