Power not fear: A collusion-based account of betting … Power not fear: a collusion-based account...
36
0 Power not fear: A collusion-based account of betting market inefficiency Alistair Bruce a and David Marginson b a Nottingham University Business School Jubilee Campus Nottingham NG8 1BB Email: [email protected] Tel: 0115 84 66614 b Cardiff Business School Aberconway Building Colum Drive Cardiff CF10 3EU Email: [email protected] Tel: 02920 87 5481
Transcript of Power not fear: A collusion-based account of betting … Power not fear: a collusion-based account...

0
Power not fear: A collusion-based account of betting market inefficiency
Alistair Brucea and David Marginsonb
aNottingham University Business School Jubilee Campus
Nottingham NG8 1BB
Email: [email protected] Tel: 0115 84 66614
bCardiff Business School Aberconway Building
Colum Drive Cardiff
CF10 3EU Email: [email protected]
Tel: 02920 87 5481
1
Power not fear: a collusion-based account of betting market inefficiency Abstract We examine racetrack betting market inefficiency. We argue that the overround, an
established measure of inefficiency, may be seen as a reflection of bookmakers’ collusive
returns maximising behaviour rather than simply as their response to an adverse selection
problem. We test, and find empirical support for, several proposed market effects of
bookmaker (market maker) collusion. Besides number of race participants, overround varies
significantly according to (1) whether or not the race is the last at the race meeting, (2)
racetrack location, (3) day of the week (weekday versus weekend), (4) type of race (handicap
versus non-handicap), and (5) type of race event (Flat/National Hunt). The study provides
fresh insight into the origins of betting market inefficiency, where the link between market
structure and context and bookmaker behaviour is a key feature. Regarding the broader
implications, the study alerts us to the potential for financial market inefficiencies such as the
bid-ask spread to be explained, in part, as a consequence of market makers’ opportunistic
behaviour wherever and whenever it is possible for intermediaries to exploit their
understanding of investor behaviour.
JEL classification: D03, D43, G14 Key words: Market inefficiency, overround, tacit collusion, betting.

2
Power not fear: a collusion-based account of betting market inefficiency
1 Introduction
We examine racetrack betting market inefficiency. We argue and present evidence to suggest
that the overround, an established measure of horserace betting market inefficiency, reflects,
in part at least, bookmakers’ exploitative returns maximising behaviour, rather than simply
their response to an adverse selection problem. Our research raises questions concerning
extant explanations for the overround which posit adverse selection as a, if not the, key
determinant (Shin, 1991, 1992, 1993). More broadly, our results imply that bid-ask spreads
may increase above competitive levels whenever/wherever market-makers are able to exploit
their understanding of investor behaviouri.
The paper is organized as follows. The next section outlines the background and motivation
for the present research. Section 3 explains bookmaking and discusses the architecture of the
on-course betting market. Section 4 develops our collusion based account and presents
several propositions for empirical analysis. Section 5 describes data collection and
measurement. Section 6 presents the results of the empirical analysis. Section 7 concludes.
2 Background
As with other financial markets, investors (bettors) in bookmaker-operatedii betting markets
must contend with market inefficiencies. A non-trivial and pervasive inefficiency in betting
markets is the ‘overround (OR)’. Formally, the bookmakers’ OR is represented as the sum of
implied win probabilities inherent in individual prices (x) minus 1 (hereby x – 1). x normally
exceeds 1 (x > 1)iii , with the magnitude of the difference (normally expressed as a percentage)
representing the degree of market inefficiency. Market inefficiency arises because the OR
compresses prices below their ‘true’ or objective level, as represented by the frequency of

3
winning outcomes. For instance, suppose, in a four-runner event, each horse is priced at 2/1.
This implies that each should win 33.33% of races, or, say, four races out of 12. But of course
there are four runners, and so, assuming equal ability (as indicated by the equal prices), the
‘true’ outcome would be three wins each. Objectively, this frequency is represented by odds
of 3/1 (25%) for each runner, which equates to x = 1 or zero OR. Thus, for efficiency, market
prices should approximate to their ‘true’ or objective win probabilities. Outcomes priced at
1/1 should occur 50% of the time. Outcomes priced at 100/1 should happen, on average, one
in 101 casesiv. In our example, however, each horse wins 25% of races, a lower ratio than the
33.33% implied in the odds of 2/1. Odds of 2/1 therefore represent an inefficient price. The
OR is 33.33% (1.33 – 1).
An OR indicates, in principle, the extent of monies transferred from bettor to bookmaker,
regardless of event outcomev. For instance, suppose, in our four-runner example, the
bookmaker lays each horse priced at 2/1 to lose £200 (i.e. a £100 bet is placed on each of the
four horses at 2/1). Here, the bookmaker gains £100 overall regardless of race outcome: £400
is received in stake money (£100 for each horse), £200 is paid out on the winner plus the
return of £100 stake money. If each horse were priced at 3/1 (‘true’ price), the returns to the
bookmaker would be zero (the four £100 bets would result in £300 in retained stakes, but also
£300 being paid out on the winner).
Given these examples, it is evidently in the interest of the bookmaker to maximise the
magnitude of the OR; the higher the OR, the greater the potential returns to the bookmakervi.
Studies have shown that the OR is subject to significant variation, but can reach a magnitude
of +35% or more (see Law and Peel 2002). Differences in reported OR values raise an
important question from a market efficiency perspective: what might explain the observed

4
variation in the OR? We examine this question. In so doing, we contribute to extant literature
in providing insight into the cause(s) of the OR. Arguments to date centre on the notion that
the OR is a supply side (bookmaker) response to an adverse selection problem in which one
set of investors (insider traders) may be trading on the basis of superior information (Shin
1991; 1992). Bookmakers respond by adjusting their price-setting procedures; specifically,
they reduce the odds offered on longshots (low probability, high returns) relative to the odds
offered on favourites (high probability, low returns). The effect is to increase the OR.
A consistent finding is evidence to show that the magnitude of the OR varies positively with
the number of runners in a given race (see e.g. Smith et al. 2006); x – 1 gets larger as the
number of race entrants increases. This relationship is explained as an adverse selection
problem (Shin 1991; 1993; Cain et al. 2003). As Cain et al (2003, p.270) argue: “...a larger
field of competitors leads to higher odds against any individual winning the event and thus
higher winnings for insiders. In these circumstances bookmakers need enhanced margins to
protect themselves”. The effect is that sum of prices, x “increases with the number of runners
as the bookie tries to recoup greater losses to the insider by raising the prices faced by
outsiders” (Shin 1993: 1152). Shin (1993, p.1153) concludes that: “any alternative account of
the betting market would have to provide a convincing alternative explanation of this feature
[i.e. the value of x – 1]”.
Acknowledging the potential for adverse selection to explain horserace betting market
inefficiency, our aim in this paper is to offer a more enriched account of the OR. Using UK
on-course horserace betting markets as the context, we suggest that a non-trivial factor which
explains variation in the OR is bookmakers’ opportunistic return maximising behaviour (i.e.
their desire to maximise the value of the OR). We suggest that such opportunistic behaviour

5
takes the form of tacit collusion among bookmakers and is underpinned by their rich
experience and understanding of bettors’ wagering behaviour and of the composition of on-
course betting populations. We develop these arguments and frame the forthcoming analysis
by reference to existing theoretical and empirical work in relation to financial markets
generally, and betting markets in particular. This is complemented by consideration of the
significance of particular institutional features and established norms of bettor behaviour
which characterise on-course betting markets. We argue that, besides potentially accounting
for the recognised positive relationship between OR and number of runners (Shin 1993),
bookmakers’ collusive return maximising behaviour is observable via several additional
market effects. These include: (1) last race effect, (2) day of the week effect, (3) handicap
vis-à-vis non-handicap differential, (4) Flat versus National Hunt differential, and (5) a
track/regional effect. As will be discussed, none of these effects fits well with the idea that
the OR exists as simply a supply-side response to adverse selection risk.
We test our arguments on a sample of 994 horse races which took place during 2005 and
2006. The analysis indicates that variation in the OR is explained, not only by the number of
runners, n, but also by the five market effects identified above. Together, the five predictor
variables account for approximately 19% of the variation in x – 1. Our analysis also suggests
a clear relationship between the number of runners and these additional effects; regional
effects and last race effects are significant (p< 0.01) for low values of n (6-runner races); all
six factors show significance when n ≥ 10 runners. These results are explained in terms of
differences in the form of tacitly collusive behaviour displayed by bookmakers as the number
of race participants increases, with increasing numbers diminishing the need to offer value in
the face of bettor inertia. In the absence of this value imperative, as n increases, bookmakers
collectively are increasingly able to exploit their knowledge of the idiosyncrasies of bettor

6
behaviour and betting market composition as embodied in the five additional effects, which
are explained in greater detail below. As such, our study challenges the predominant view of
the OR as originating in the risk aversion of bookmakers in the face of adverse selection
(Shin 1991; 1992; 1993), arguing that the value of x – 1 may also be a function of the
collusive expression of bookmakers’ market power. This power relates to and derives from
both the structure of the supply side, and the collective experience and knowledge of client
characteristics and behaviour embedded in the bookmaker community. The next section
develops these points.
3 Bookmakers and bookmaking
‘Bookmaking’ has, at is heart, two basic ideas. One concerns the notion of laying. Basically,
one person (the ‘layer’) accepts a wager (bet) on the uncertain outcome of some future event
from one or more other persons (the bettor or punter). The other idea is that the layer
(bookmaker) offers to accept bets on all possible outcomes to a particular event. This is
perhaps the defining principle of ‘bookmaking’, where bookmakers are obliged to lay each
and every horse in any given race in order to “maintain a credible market structure embracing
all runners” (Smith et al, 2006, p.14). For this reason the notion of ‘market-maker’ readily
describes the bookmaker’s role within betting markets.
Multiple factors determine the assigned odds. In a horseracing context, for instance, these
can include: monies wagered (a significant factor), a horse’s recent form and comparative
ability, the form and ability of jockey and trainer, racecourse ‘gossip’, ground conditions (i.e.
the ‘going’), tipsters’ choices, late withdrawals of other horses from the race, and so on. At
the heart of many of these factors is ‘information’.

7
Bookmakers have long acknowledged the central importance of information to their business.
The more the bookmaker ‘knows’ about, say, each competitor in an event, the easier it is to
establish market prices which reflect available information. A key consideration is to avoid
pricing any particular outcome to an event above its ‘true’ or objective value (e.g. 6/1 when
the ‘true’ odds are 7/2), which could leave the bookmaker vulnerable to concentrated or
unusual betting patterns aimed at profiting from ‘value’ prices.
Unsurprisingly, the bookmaking profession invests significantly in cultivating links within
and beyond its community to gather market-relevant intelligence. In a horseracing context,
this involves links with key horseracing personnel, by maintaining a presence at race
meetings, and through the use of ‘informants’. Bookmakers also employ well-developed risk-
sharing mechanisms to insure against exposure to concentrated patterns of bettor investment.
As market makers, bookmakers can reduce the magnitude and/or odds offered on bets
received. In the limit, they can (and do) refuse to accept what they may regard as ‘suspicious
bets’. Thus, whilst insider trading may be an inevitable feature of horserace betting (see e.g.
Figlewski 1979; Crafts 1985; Law and Peel 2002), it may be argued that bookmakers, as a
coherent, informed and influential group, are well-equipped to recognise, respond and
manage their exposure to such activity.
Given the above, and whilst acknowledging the theoretical appeal of Shin’s argument, we
would contend that the alleged influence of fear and risk-aversion on odds-setting, and the
value of the OR, may be overstated. Further, we contend that Shin’s account may be
supplemented and enriched by a combination of two additional factors which influence
bookmakers’ pricing behaviour: (1) their knowledge of bettor idiosyncrasies (e.g. the
tendency for risk-loving and/or ‘over-confident’ bettors to over-bet longshots - see Rosett

8
1965; Golec and Tamarkin 1995), and (2) the potential, based on collective market power (as
market makers) to exploit this knowledge at the expense of a diffuse, relatively ill-informed
and largely amateur/recreational clientele of bettors. These arguments seem particularly
applicable to the on-course bookmaking fraternity, which, it will be argued below, embodies
many of the preconditions for collusive behaviour.
4 Bookmaking and the overround: a collusion-based account
4.1 Preconditions for collusion in on-course bookmaking
The industrial organisation literature offers largely theoretical perspectives on factors which
are held to induce or enhance the viability of collusive arrangements between suppliers (see,
for example, Tirole 2000; Viscusi et al. 2000; Symeonidis 2002; Pepall et al. 2005).
Significant factors include the relative fewness of suppliers, similarity of cost conditions
between suppliers, transparency of pricing behaviour, entry barriers and the range of media
via which competitive behaviour finds expression (e.g. price vs. non-price). We draw on this
literature to examine the potential for collusion in the on-course bookmaking community,
from an empirical perspective.
On-course bookmakers face similar cost conditions and form a tight professional community,
operating in close physical proximity with each other and with the number of operators per
race meeting generally ranging from around fifteen to twenty five in the principal betting
enclosure. They share widely understood and accepted norms for odds setting and a
consistently employed menu of odds values. Prices offered by bookmakers are immediately
and fully transparent to their competitors and tools to enhance the rapid communication of
price changes are an established feature of the environment. These included, until recently, a
unique sign-language `tic-tac’ with an associated price-encoding tool `twist cards’ to

9
confound interpretation by the public. More recently, this means of communication has
largely given way to technology-based communication. Use of such tools signals the
seriousness with which bookmakers guard the information they share and the extent to which
this information is seen as the basis for a collectively exploitable opportunity. It is important
to stress that if collusion can be achieved in terms of alignment of odds menus, there is
negligible opportunity to differentiate between the offerings of alternative bookmakers in
other ways; the dimensions of competition are limited and, as such, more easily aligned and
monitored. As well as sharing information, on-course bookmakers often also share social
networks and transact regularly with each other as they `lay off’ liabilities in the collective
sharing of risk.
Non-trivial entry barriers, embodied in the limits on the number of on-course `pitches’,
ensure a relatively stable communityvii. This characterisation of supply side conditions
suggests that bookmakers have both the incentive and the capability to suppress competition.
It is important to reiterate here that there are two dimensions to this power; the industrial
organisational dimension, associated with supply side structure, environment and entry
barriers, reinforces the exploitative opportunity inherent in bookmakers’ rich understanding
of their clientele’s behaviour. The above characterisation of UK on-course betting argues that
the behaviour of bookmakers can in part be rationalised in terms of tacit collusion. The
following section develops this theme, by explaining how a collusion-based account enriches
our understanding of the relationship between OR and the number of runners and offers a
sound basis for establishing propositions which test how bookmakers’ collusive behaviour
may be further expressed in other ways.
10
4.2 Overround, number of runners and collusion
In developing a collusion-based perspective on OR variation as a function of number of
runners, we consider aspects of races which feature, respectively, small and large numbers of
runners.
In races with a small number of runners (say 6 or fewer) bettor interest necessarily focuses on
a smaller number of available betting options, which may not meet the particular needs of
individual bettors. In this context, bookmakers may induce participation by offering relatively
high value (i.e. low OR). As this would imply generally low margins, it is then unlikely that
individual bookmakers would be tempted to offer still further value to attract business from
other bookmakers. In small fields, any such action could be easily monitored and matched by
fellow bookmakers. Equally, any individual bookmaker seeking higher margin via a less
favourable menu of odds would be unlikely to succeed, given the low monitoring costs for
bettors in small field markets. In this situation, where gains from independent action are at
best limited and likely to be collectively damaging, the incentive for collusion is strong. Thus
low and relatively homogeneous levels of OR in small field markets may reflect either
collective effort by bookmakers to induce betting or tacit agreement not to offer individually
more favourable prices.
With larger fields, where consumer inertia is reduced (Johnson and Bruce 1997), bookmakers
can afford a more relaxed approach to individual deviations from strict alignment of prices,
especially given the difficulties faced by bettors in effecting continuous comparisons of value
across bookmakers, or in computing and comparing the evolving ORs across operators where
large numbers of runners are involved. In addition, in such markets, variation in odds offered
might create an impression of active and healthy competition. Tacit agreement between

11
bookmakers to collectively offer higher levels of OR in larger field markets offers the
prospect of higher margins to all.
The above, therefore, proposes a new strand of analysis to augment Shin’s (1992, 1993)
account of the relationship between OR and number of runners in terms of tacit collusion by
bookmakers. If we accept that a collusion-based argument has the potential to enrich our
understanding of the OR/runners relationship, this then raises the possibility that further
expression of bookmakers’ collective market power may result from their ability to exploit
aspects of bettor behaviour of which they have an extensive and sophisticated understanding.
In particular, bookmakers may be in a position to exploit bettor motivation and behaviour
where it deviates from the prescriptions of economic rationality, including for example, the
use of heuristics and tendencies for systematic biases in behaviour. Sections 4.3 to 4.7
develop propositions which seek to enrich further our understanding of OR variations in
terms of these additional aspects, which are strongly rooted in the behavioural economics
tradition (see Thaler 1994 for a general discussion and Gilovich et al. 2002 in relation to
heuristics and biases). It is important to recognise, in this context, that accommodation of
behavioural influences which challenge the strict tenets of economic rationality can lead to a
wide variety of propositions relating to behaviour, not all of which are mutually consistent.
4.3 Last race effect
A common empirical phenomenon in on-course betting markets concerns bettors’ appetite to
bet on the last race of the day in order to recoup earlier losses. This behaviour, known
colloquially as `Charlie chasing’, is formalised in Markowitz’s (1952) model of utility and
Peel and Law’s (2009: 253) ‘general non-expected utility model’ as behaviour which is “risk-
seeking over losses”. It relates to the strong probability that on-course bettors who have
12
engaged in betting throughout a race meeting, will face a loss on their trading prior to the last
race. Initial risk-averseness regarding losses is then replaced by risk-seeking behaviour as
bettors attempt to retrieve a favourable trading outcome.
Implicit here is the notion that bettors may not view the issue of how to bet in a particular
race as an isolated decision, but rather as part of a series of decisions. This then suggests a
different set of behavioural influences on decision process and outcome (see e.g. Keren and
Wagenaar 1985; Rachlin 1990). A number of contributions point to the relationship between
declining capital and increasing risk preference (see e.g. McGlothlin 1956; Gilovich and
Douglas 1986; Golec and Tamarkin 1995) which results in over-betting of longshots in the
last race. It has also been argued that an increased propensity to bet on longshots in the last
race increases the value and appeal of favourite betting among bettors who are aware of it
(Johnson and Bruce 1993). Bookmakers, uniquely placed to observe these last race effects,
may seek to capitalise on them by reducing the odds of both favourites and longshots, thereby
increasing the OR, in the expectation that strong demand for last race betting is unlikely to be
deterred by such adjustments. Such behaviour by bookmakers may be particularly
pronounced where the sequence of results suggests that bettors’ losses are abnormally high
prior to the last race. Given these points, our predictions based on a collusion-based account
are as follows:
P1a: The OR for the last race is significantly greater than the OR for prior races at a given race meeting P1b: As the potential for collusive opportunistic behaviour increases with n, the strength of the last race effect is dependent on number of race entrants
4.4 Day of the week effect
A substantial literature relates to `day of the week’ and similar effects in relation to financial
markets generally, where systematic variations in trading patterns across the week have been

13
identified in a number of contexts ( see Vaughan Williams 2005). Similarly, the literature
suggests that there may be material differences in the composition of betting populations
across the week (Kopelman and Minkin 1991; Sung et al. 2008) with attendant differences in
betting behaviour and potential for exploitation by on-course bookmakers who recognise and
can respond to such differences. Specifically, there is a tendency for the racecourse
population to be disproportionately represented by recreational racegoers towards and at the
weekend, compared with weekdays where the generally much smaller racecourse attendances
represent the `hardcore’ of the racing and betting clientele.viii This factor might be expected to
influence bookmakers in terms of different levels of OR offered across days of the week. In
particular, bookmakers have an incentive to inflate ORs to extract value from the recreational
clientele, suggesting higher bid-ask spreads towards and at the weekend. A counter-argument,
based on Shin’s perspective, might suggest that ORs should be higher on weekdays, given the
relatively high density of `hardcore’ racegoers and the attendant likelihood of greater access
to insider information. As such the following proposition represents an interesting
comparison of Shin’s insight into OR and that proposed in this paper.
P2a: The OR is significantly greater at the weekend compared to weekdays P2b: As the potential for collusive opportunistic behaviour increases with n, the strength of the day of the week effect is dependent on number of race entrants
4.5 Handicap versus non-handicap races
A further feature of betting markets with the potential for adding explanatory power to OR
differentials is the distinction between handicap and non-handicap races. Handicap races are
events where the weights carried by horses are individually set by an independent
handicapper. In assigning weights, the handicapper takes account of the previous form of
each participant and aims to produce a highly competitive event via a set of weights which
will equalise the chances of each horse winning the race.

14
Various factors may be significant in the relationship between a race’s handicap status and its
OR. One influence leading to expectations of lower ORs in handicap races relates to evidence
suggesting that insider behaviour is more prevalent in non-handicap events, and particularly
lower class non-handicaps (for a discussion, see Bruce and Johnson 2003) which would, in
Shin’s terms, be likely to result in relatively high and low ORs in non-handicap and handicap
races respectively.
However, there are further aspects of the handicap/non-handicap distinction and bettors’
associated behaviour, which bookmakers may be able to exploit via higher ORs in handicap
compared to non-handicap races. Whilst handicap races might appear unattractive to bettors
in that they are designed to be difficult to predict, an alternative view sees handicaps as
positively appealing to bettors. The argument here is that handicaps are less likely to offer
very short odds about any participant (of the 121 odds-on favourites captured in our study,
only 13 appeared in handicap races.) and it has been demonstrated that many, particularly
recreational, bettors tend to favour longer-odds prospects associated with handicaps (Bruce
and Johnson 1992). Bookmakers may, therefore, not need to incentivise participation in
handicap markets, but may instead exploit bettors’ appetite for such events by inflating ORs.
This leads to the following:
P3a: The OR for handicap races is significantly greater than the OR observed for non-handicap races P3b: As the potential for collusive opportunistic behaviour increases with n, the strength of the type of race effect is dependent on number of race entrants
4.6 Flat versus National Hunt races
This section raises the possibility that part of the explanation for variation in ORs may lie in
differences between the nature of betting markets which relate respectively, to Flat and

15
National Hunt (jumps) races. A factor here is the different nature of the populations
associated with each form of racing. In National Hunt racing, breeding, training and
ownership of horses is much more widely dispersed than it is in Flat racing. In part this
reflects the nature of the National Hunt racehorse, where male horses are typically not
equipped for breeding (they are invariably geldings) and where, consequently, the supply of
horses to the sport is not dominated by international breeding organisations, as is the case
with Flat racing.
The National Hunt scene is altogether more parochial, more accessible to the small breeder,
owner and trainer and more reasonably characterised as an enthusiast’s pastime rather than
part of an international business. As such, the National Hunt clientele is generally less
focused on racing as a business and more motivated by the sport itself. Bookmakers may
therefore expect to face greater inertia from National Hunt racegoers in relation to betting and
so may need to offer inducement to participate via lower ORs.
Apart from clientele-based distinctions, it is also the case that National Hunt racing is much
less predictable than Flat racing. The presence of fences, longer race distances and generally
more testing conditions (National Hunt racing is predominantly a winter sport) mean that it is
quite common for horses not to complete a race. The National Hunt season is frequently
disrupted by weather-based cancellations, which complicates analysis and interpretation of
form. Finally, in recent years, National Hunt racing as a betting medium has faced
competition from all weather Flat racing, which is relatively invulnerable to the weather and
which offers unparalleled consistency in terms of track conditions. For these reasons, bettors
may require incentives to engage in National Hunt betting and as such bookmakers may be
inclined to offer lower levels of OR in such markets.

16
P4a: The OR is significantly higher for Flat racing than for NH racing P4b: As the potential for collusive opportunistic behaviour increases with n, type of race event effect is dependent on number of race entrants
4.7 Track/regional effect
A commonly held view among UK bookmakers is that there are material differences between
on-course betting markets according to the geographical location of the racecourse.
Midlands-based racecourses are seen as disproportionately populated by recreational bettors,
whereas Northern and Southern courses are seen as more densely populated by racing
insiders. This may reflect the relative absence of racehorse training centres in the Midlands,
compared with the North and South, where the proximity of courses to such centres suggests
a greater density of informed racing industry personnel and a more informed betting market.
This argument has echoes of the home bias effect, where investment performance in local
assets enjoys a premium, based on superior access to local asset information (see, for
example, Ivkovic and Weisbenner 2005). If the Midlands clientele is perceived in aggregate
as `less smart’, bookmakers might seek to exploit this by inflating ORs in Midlands betting
markets. Our final propositions are thus:
P5a: The OR is significantly greater at Midlands based racetracks than for either Northern or Southern based racetracks P5b: As the potential for collusive opportunistic behaviour increases with n, the strength of the track/regional effect is dependent on number of race entrants
Each of the propositions developed above relates to a potential influence on OR associated
with the tacitly collusive activity of bookmakers, as they seek to exploit their collective
market power and sophisticated knowledge of bettor behaviour. We do not claim that the set
of influences identified is either comprehensive or definitive; rather, that it contributes to a

17
richer empirical account of the OR. The following sections explain how we test the validity
of this claim.
5 Data collection and measurement
Data for the study were collected for 994 horse races run in the UK during 2005 and 2006.
Sample races were drawn from both the 2005 and 2006 Flat seasons, as well as the 2005/06
National Hunt (NH) season. Data collection was spread across 163 race meetings and 51 (out
of a possible 59) racetracks located throughout the UK. These 51 courses were categorised by
geographical region in line with the British Horseracing Authority’s classification of
Northern, Midlands and Southern racetracks. For the purposes of analysis, Northern and
Southern racetracks were then combined in order to create a binary variable consistent with
the study’s arguments (i.e. non-Midlands vis-à-vis Midlands racetracks). This resulted in a
split of 36 non-Midlands racecourses (coded 0; number of races involved: 677) and 15
Midlands racecourses (coded 1; 317 races involved)ix.
The study’s focus and dependent variable is bookmakers’ OR (x – 1). For each race in the
994-race sample, the value of x – 1 was calculated by summing the probabilities inherent in
racetrack bookmaker mean starting prices (SPs). Official SP data are publicly accessible from
various sources (e.g. media outlets such as newspapers). For the present study, SP data for all
race entrants for a given race were obtained from the Racing Post website the morning
following the horserace event. These data were audited and later checked against official SP
information published by Raceform Ltd (Raceform Ltd produces the British Horseracing
Authority’s ‘official form book’). The average OR (bookmakers’ margin) for the 994-race
sample is 18.42% (standard deviation: 0.6755; minimum OR: 1.65%; maximum: 40.83%).

18
Consistent with Shin (1993), Table 1 shows the distribution of the sum of prices (OR) for our
sample set.
INSERT TABLE 1 HERE
We collected race data across all days of the week (Monday through to Saturday, but
excluding Sunday).x For the purposes of analysis, races taking place on weekdays (Mondaysxi
to Thursdays) were coded 0; races taking place at weekends (Friday and Saturday) were
coded 1. Use of a binary variable reflects the theoretical arguments pertaining to day of the
week effect. Similarly, for race type, handicap races were coded 1 and non-Handicap races 0.
Regarding type of race event, Flat races were coded 0 and National Hunt (jumps) races 1xii.
For ‘last race effect’, races prior to the last race at a given race meeting were coded 0; the last
race of the meeting was coded 1. This yields a split of 833 prior races and 161 ‘last races’.
Finally, regarding number of runners for the 994-race sample, the maximum field size is 18,
minimum is 3. Mean number of runners = 9.81; median = 10; mode: 10; standard deviation:
3.03. Again consistent with Shin (1993), Table 2 presents frequency distributions based on
number of runners.
INSERT TABLE 2 HERE
6 Analysis and results
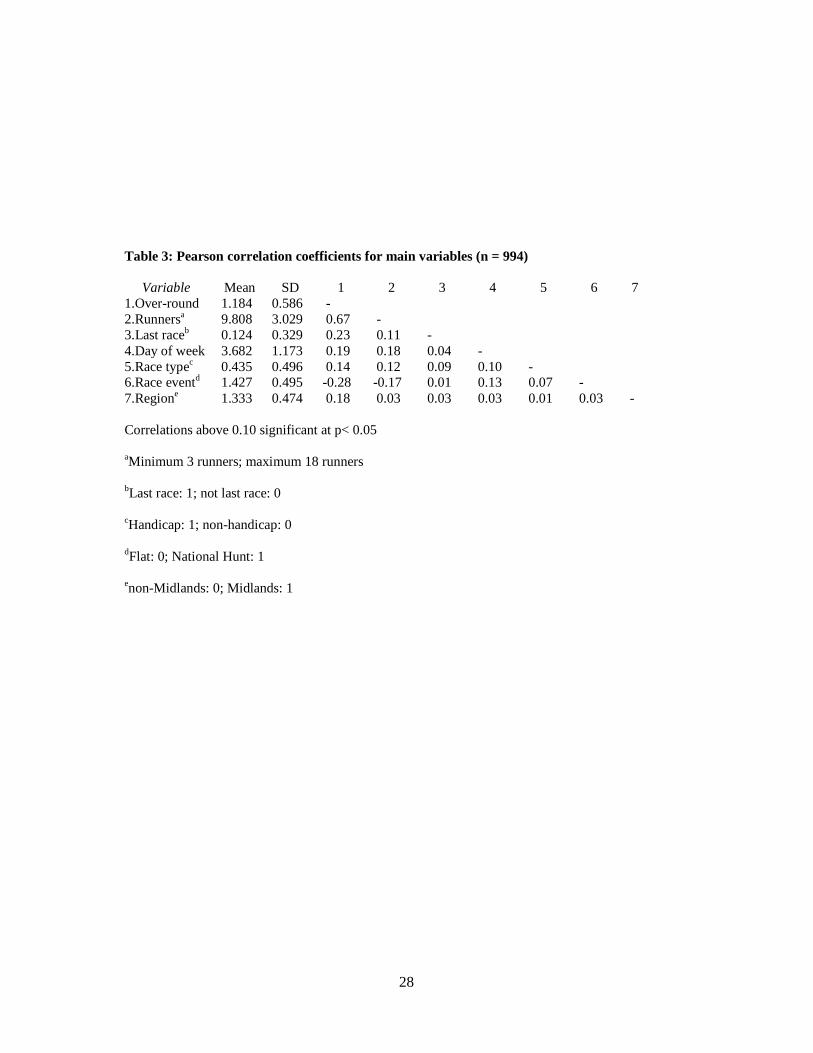
Table 3 reports means, standard deviations and Pearson correlation coefficients. Diagnostic
tests for normality, functional form, heteroskedasticity, and multicollinearity suggest no data
problems. For instance, number of runners is normally distributed, as are OR data.
Heteroskedasticity is not an issue, while tests for multicollinearity among the predictor

19
variables reveal variance inflation factors and tolerances substantially within acceptable
limits (<1.2 and >0.85 respectively).xiii In sum, our diagnostic tests suggest no significant
problems in terms of using ordinary least squares multiple regression analysis to test our
predictions (Belsley et al. 1980).
INSERT TABLE 3 HERE
6.1 Test of first-order predictions
We tested our first-order predictions (propositions 1a – 5a inclusive) by including all
predictor variables in a single multiple regression model, with OR as the dependent variable.
Table 4 presents the results.
INSERT TABLE 4 HERE
Results shown in Table 4 suggest that, while varying in significance (p< 0.01 – p< 0.001), all
five predictor variables explain variation in the magnitude of the OR. Individual correlation
coefficients suggest, as a minimum, race type explains 1.6% of the variation in bookmakers’
OR, rising to approximately 6.5% for last race effect. The combined effect of the five
predictor variables is approximately 19%. Propositions 1a – 5a are supported. Bookmakers’
opportunistic returns maximising behaviour, as manifest in the five effects examined in this
study, appears to explain, in part, variation in the OR.
6.2 Test of second order predictions
Our second-order propositions suggest that bookmaker opportunistic behaviour is contingent
on the number of race entrants. That is, as explained earlier, increasing values of n increase
the opportunity for bookmakers to exploit their rich understanding of bettors’ wagering
20
behaviour and the composition of on-course betting populations through the predicted market
effects.
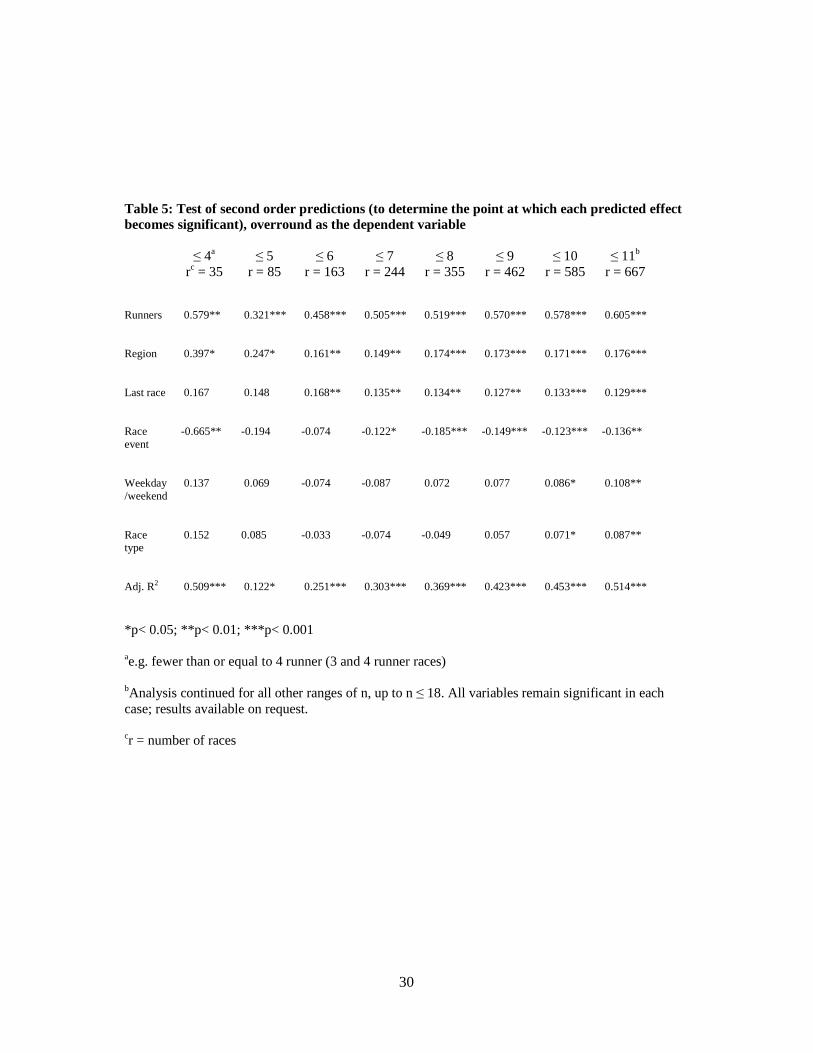
We tested our second-order propositions (propositions 1b – 5b) using multiple regression
analysis. We develop separate regression models for increasing values of n, number of race
entrants. For each model, the five predicted manifestations of bookmakers’ collusive
opportunistic behaviour are regressed against the OR as the dependent variable. To be
consistent with our first-order analysis, number of race entrants is also included as an
independent variable. The difference between each reported model is the value of n. Number
of race entrants is increased by a factor of 1 in each case, until, given the results shown in
Table 4, all five predictor variables show a significant effect.xiv Importantly, given that
statistical significance can be affected by sample size, we applied a stricter measure of
probability (p< 0.01) than is typically used (p< 0.05) when determining the point at which a
particular predictor variable is deemed to show a significant effect. Results are reported in
Table 5.
INSERT TABLE 5 HERE
The results of Table 5 are revealing. They suggest, for instance, that, of the five market
effects, bookmakers are most readily able to capitalise on their understanding of (1) bettors’
propensity to engage in ‘Charlie chasing’ on the last race of a race meeting, and (2) regional
differences in the composition of on-course betting populations. In both cases, a significant
effect (p< 0.01) is first reported when n (number of race entrants) reaches 6.
These results have intuitive appeal. For instance, it seems logical that, developing our earlier
arguments, racecourse bookmakers should be able to exploit their understanding that

21
Midlands-based racecourses tend to be disproportionately populated by recreational bettors
by inflating the OR, even when n is relatively small. Similarly, it appears from the results that
bettors’ appetite for last race betting enables bookmaker collusive exploitation of bettor
behaviour to over-ride potential intra-market competition, even for small values of n.
Of the remaining phenomena, we see a significant effect for race event (Flat vis-à-vis
National Hunt) at n ≤ 8 runners, while significant weekday/weekend and race type (handicap
versus non-handicap) effects are shown to arise when n reaches ≤ 11 runners. The results
suggest that, compared to regional and last race effects, these three predicted market effects
are more sensitive to the magnitude of n, and thereby intra-market dynamics. Number of race
entrants shows a significant effect throughout. The results of our first and second-order
analyses are discussed further in the concluding section.
6.4 Further analysis
The results reported in Tables 4 and 5 support our theoretical arguments. Not only do the
results show that, as number of race entrants increases, the increasing potential for collusive
behaviour enables bookmakers to inflate the bid-ask spread (OR), but our findings also
suggest significant differences in bookmakers’ OR in terms of the five market effects
analysed. For instance, findings indicate a normally higher average over-round applies for
Midlands based racetrack compared to non-Midlands tracks. Table 6 presents a comparison
of ORs for each of the predicted manifestations of bookmaker collusive utility maximising
behaviour. The figures show that, of the five measured variables, last race effect creates both
the highest average OR (21.8%, which compares to an overall average of 18.42% for the 994-
race sample) and the highest differential between comparator over-rounds (a difference of 3.9%
from the 17.9% recorded for the prior race average OR). Race type records the smallest
22
differences (differential: 1.6%; handicap 19.3% compared to 17.7% average for non-handicap
races). Overall, results shown in Table 4 help to corroborate our central thesis, which is that
bookmakers’ collusive opportunistic behaviour helps to explain observed variation in the
magnitude of x – 1.
INSERT TABLE 6 HERE
We undertook additional tests to examine the robustness of our findings. This additional
analysis is required, not least because both extant literature (e.g. Shin 1993) and the present
study demonstrate a positive relationship between number of race entrants, n, and
bookmakers’ OR, x – 1; the latter increases with the former. For Shin (1993: 1148), this
positive relationship is explained by reference to the notion of insider trading. He suggests
that, as the “Insider’s payoff will be large when there are many runners (so that longer odds
are offered on the horses)”, so bookies “raise their margins in order to recoup their loss to the
insider”. In other words, for Shin (1993) the value of x – 1 is explained by the magnitude of n.
Given this, our objective with the robustness tests is to examine the extent to which number
of race entrants underlies the results for the five predicted market effects of bookmakers’
collusive opportunistic behaviour. For instance, it is possible that the average number of race
entrants is greater for handicap races than for non-handicap races. To the extent this is the
case, we would expect the OR to be greater for handicap races than for non-handicap races,
simply because of the difference in n and not because of any collusive exploitative behaviour
by racecourse bookmakers. Similar arguments may be made for each of the other four
predictor variables.
23
There are several ways in which we can test for possible spurious relationships involving the
five predictor variables and bookmakers’ OR. One approach is to employ partial correlation
analysis. Partial correlation analysis allows examination of the effect of one variable, the
control, on the relationship between two other variables (Meng et al. 1992). The approach is
to examine the effect of B (number of race entrants in our case) on the association between A
(predictor variable) and C (OR) by computing a partial correlation coefficient to remove the
association that B has with both A and C (Blaikie 2003).
Table 7 presents the results of the partial correlation analysis. The results show that, of the
five predictor variables, the association between day of week and OR appears to be most
affected by number of race entrants. When the effect of number of race entrants is removed,
the partial correlation between day of week and OR becomes less significant (p< 0.01)
compared to the Pearson correlation coefficient (p< 0.001). This suggests that, while the
association between day of week and OR remains significant, the relationship may be
partially spurious due to both variables being related to number of runners.
Regarding the four other variables, the results of Table 7 also suggest possible partial
spuriousness in the case of race type, as a lower correlation is observed (0.097 compared to a
Pearson coefficient of 0.140). However, application of the Meng et al. (1992) test for
comparing correlations shows no significant change in the strength of the association between
race type effect and bookmakers’ OR when controlling for number of race entrants. The other
three variables show minimal change in correlation with OR when number of race entrants is
removed, and formal analysis using the Meng et al. (1992) test reveals no significant
differences. Overall, therefore, apart from perhaps weekday/weekend effect, results shown in
Table 7 support the notion that each of the predicted manifestations of bookmaker collusive

24
behaviour has an effect on the magnitude of x – 1 which is independent of number of race
entrants.
INSERT TABLE 7 HERE
The above point is brought into sharper relief by a visual inspection of our sample data.
Based on the analysis of frequency distributions for both sum of prices (OR) and number of
race entrants, n, Shin (1993: 1150) suggests that: “..the tails of both distributions consist of
the same observations”. In other words, for Shin, high values of bookmakers’ OR equate with
high values of n. For us, however, the magnitude of x – 1 is dependent on various
manifestations of bookmakers’ collusive opportunistic behaviour, such that, for the same
number of race entrants, the highest OR should be observed when all five market effects are
present; that is, for a handicap race which is the last race on the card at a Flat meeting taking
place at a Midlands racecourse on a Saturday. For the same number of race entrants, the
lowest OR should be observed when none of these five conditions is met.
Visual examination of the data set yields the following examples. For a 13-runner race in
which all five conditions are met the OR is 35.6%. For an equivalent 13 runner race in which
none of the five conditions applies, the OR is 15.2%. A 9-runner race in which all five
conditions are met shows an OR of 26.4%, while the OR for a 9-runner race in which the
conditions are not met is 11.1%. Two 6-runner races show an OR of 20.2% when the five
conditions apply and 6.2% when they do not. Similar differences in OR were found for the
same or similar number of race entrants in cases where either four out of the five conditions
are present (in various combinations) or only one or no condition applies.

25
Notwithstanding the anecdotal nature of these three examples, the difference in OR is striking.
Such differences are clearly not driven by variation in the number of race entrants. Generally,
our additional analyses help to further demonstrate how factors other than, or in addition to,
adverse selection appear to shape the magnitude of x – 1, and thereby the efficiency of
bookmaker dominated betting markets. We discuss the significance of our analyses in the
concluding section.
7 Discussion and conclusions
The OR in bookmaker operated horserace betting markets creates an inefficiency which Shin
(1992; 1993) accounts for by reference to the problem of adverse selection. He suggests that
bookmakers protect themselves against the threat of insider trading by compressing the odds
they offer to bettors, particularly on relative outsiders. The resulting divergence of the sum of
prices from 1 represents the bookmakers’ margin or OR, which is equivalent to the bid-ask
spread in financial markets (Shin 1993: 1141), and which increases with the number of race
participants.
We also find a positive relationship between number of race participants, n, and bookmakers’
OR. The results reported in both tables 4 and 5 suggest that variation in n explains a
considerable proportion of the variation in the OR. However, whilst acknowledging the
theoretical appeal of Shin’s adverse selection account, our explanation centres on the notion
that inefficiency in bookmaker-dominated horserace betting markets arises principally from
bookmakers’ collusive returns maximising behaviour.
The results of our empirical analysis relating to five additional proposed market effects of
bookmaker collusive behaviour support this thesis. For example, we show that the magnitude

26
of the OR is linked to type of race such that the OR is significantly higher for handicap races
than for non-handicap races. These findings are difficult to explain through the lens of
information asymmetry, not least because Shin’s (1992; 1993) analysis implies a higher OR
for non-handicap races vis-à-vis handicap races, given a supposedly greater adverse selection
problem in the former compared to the latter (see e.g. Vaughan Williams and Paton 1997).xv
We also show how the OR increases significantly for (1) the last race, (2) at Midlands based
racetracks compared to non-Midlands based tracks, (3) for Flat races vis-à-vis NH races, and
(4) as the weekend approaches. All these results further support our thesis that collusive
opportunistic behaviour may be a significant factor in determining the magnitude of OR.
In conclusion, Shin’s (1993) account of the principal determinant of OR has dominated the
betting market efficiency literature since the early 1990s. This study does not seek to deny
that episodes of bookmaker exposure occur, but the reality of the sophisticated intelligence
networks and the risk-sharing/management mechanisms which bookmakers routinely employ
suggests that systematic exploitation by a betting clientele which comprises a motivationally-
diverse population of differentially-informed bettors is unlikely. Ultimately, it is this
difficulty of reconciling Shin’s view with the empirical realities of bookmaking which forms
the motivation for developing our more enriched account. In addition to its strong empirical
underpinning, the importance of the account developed here lies in the implications it carries
for those policymaking and regulatory agencies entrusted with promoting competitive trading
environments and consumer welfare, both in the specific betting context and in markets more
generally. Informed and vigilant regulation is of particular importance in the betting and
gambling sector, where strong growth and widening participation suggest a consumer base
which may be especially vulnerable to the exploitation of powerful and collusive suppliers.

27
Table 1: Distribution of sum of bookmaker prices
Overround Frequency 1.000 – 1.049 10 1.050 – 1.099 162 1.100 – 1.149 279 1.150 – 1.199 301 1.200 – 1.249 148 1.250 – 1.299 65 1.300 – 1.349 16 1.350 – 1.399 11 1.400 – 1.449 2 994
Table 2: Distribution of number of race entrants
Number of race entrants Frequency (number of races) 3 3 4 31 5 51 6 79 7 81 8 111 9 107 10 113 11 92 12 105 13 84 14 77 15 27 16 21 17 8 18 4 994
28
Table 3: Pearson correlation coefficients for main variables (n = 994)
Variable Mean SD 1 2 3 4 5 6 7 1.Over-round 1.184 0.586 - 2.Runnersa 9.808 3.029 0.67 - 3.Last raceb 0.124 0.329 0.23 0.11 - 4.Day of week 3.682 1.173 0.19 0.18 0.04 - 5.Race typec 0.435 0.496 0.14 0.12 0.09 0.10 - 6.Race eventd 1.427 0.495 -0.28 -0.17 0.01 0.13 0.07 - 7.Regione 1.333 0.474 0.18 0.03 0.03 0.03 0.01 0.03 - Correlations above 0.10 significant at p< 0.05 aMinimum 3 runners; maximum 18 runners
bLast race: 1; not last race: 0
cHandicap: 1; non-handicap: 0
dFlat: 0; National Hunt: 1
enon-Midlands: 0; Midlands: 1

29
Table 4: Test of first-order predictions, bookmakers’ overround as the dependent variable (n = 994) Variable Standard beta coefficient t-value Runnersa
0.642
31.354**
Last race
0.254
6.985**
Track/region
0.211
8.195**
Race event
-0.179
-9.124**
Weekday/weekend
0.162
3.693**
Race type
0.128
2.886**
Adjusted R2
0.719**
F = 279.01**
*p< 0.01; **p< 0.001 aRunners = number of race entrants
30
Table 5: Test of second order predictions (to determine the point at which each predicted effect becomes significant), overround as the dependent variable ≤ 4a
rc = 35 ≤ 5
r = 85 ≤ 6
r = 163 ≤ 7
r = 244 ≤ 8
r = 355 ≤ 9
r = 462 ≤ 10
r = 585 ≤ 11b
r = 667
Runners
0.579**
0.321***
0.458***
0.505***
0.519***
0.570***
0.578***
0.605***
Region
0.397*
0.247*
0.161**
0.149**
0.174***
0.173***
0.171***
0.176***
Last race
0.167
0.148
0.168**
0.135**
0.134**
0.127**
0.133***
0.129***
Race event
-0.665**
-0.194
-0.074
-0.122*
-0.185***
-0.149***
-0.123***
-0.136**
Weekday /weekend
0.137
0.069
-0.074
-0.087
0.072
0.077
0.086*
0.108**
Race type
0.152
0.085
-0.033
-0.074
-0.049
0.057
0.071*
0.087**
Adj. R2
0.509***
0.122*
0.251***
0.303***
0.369***
0.423***
0.453***
0.514***
*p< 0.05; **p< 0.01; ***p< 0.001
ae.g. fewer than or equal to 4 runner (3 and 4 runner races)
bAnalysis continued for all other ranges of n, up to n ≤ 18. All variables remain significant in each case; results available on request. cr = number of races

31
Table 6: Values of (average) overround for each predictor variable Variable Mean OR Variable Mean OR Mean differencea Last race: 1.218 Not last race: 1.179 0.039*** Weekdayb: 1.171 Weekendb: 1.191 0.020** Midlands: 1.201 North/South: 1.174 0.027*** Handicap: 1.193 Non-handicap: 1.177 0.016** Flat: 1.198 National Hunt: 1.165 0.033*** *p< 0.05; **p< 0.01; ***p< 0.001
aAnalysis based on independent t-tests
bWeekday = Monday-Thursday; weekend = Friday/Saturday OR = Overround
Table 7: Partial correlation analysis (number of race entrants as the control variable) Variable
Overround Partial correlation Pearson correlation
Last race 0.211*** 0.227*** Track/region 0.215*** 0.177*** Weekday/weekend 0.105** 0.194*** Race event (Flat/NH) -0.239*** -0.281*** Race type (Non/H’cap) 0.097** 0.140** *p< 0.05; **p< 0.01; ***p< 0.001

32
References Belseley, D.A., E. Kuh, and R.E. Welsh. 1980. Regression Diagnostics, New York: John Wiley and Sons. Blaikie, N. 2003. Analyzing Quantitative Data, London: Sage. Bruce, A.C., and J.E.V. Johnson. 1992. Toward an explanation of betting as a leisure pursuit. Leisure Studies 11 (3): 201-218. Bruce, Alistair C., and Johnnie E.V. Johnson. 2003. Market ecology and decision behaviour in state-contingent claims markets. Journal of Economic Behavior and Organisation 56 (2): 199-217. Coleman, Les. 2007. Measurement of insider trading in wagering markets. Applied Financial Economics 17 (5): 351-356. Cain, M., Law, D. and Peel, D.A. 2003. The Favourite-Longshot Bias, bookmaker Margins and Insider Trading in a Variety of Betting Markets. Bulletin of Economic Research 55, 263-73. Coval, Joshua D., and Tobias J. Moskowitz. 2001. The geography of investment: informed trading and asset prices. Journal of Political Economy 109 (4): 811-841. Crafts, N.F.R. 1985. Some evidence of insider knowledge in horse race betting in Britain. Economica 52 (27): 295-304. Dowie, J. 1976. On the efficiency and equity of betting markets. Economica 43 (17): 139-150. Figlewski, Stephen. 1979. Subjective information and market efficiency in a betting market. Journal of Political Economy 87 (1): 75-88. Gilovich, T., and C. Douglas. 1986. Biased evaluations of randomly determined gambling outcomes. Journal of Experimental Social Psychology 22 (3): 228-41. Gilovich, Thomas, Griffin, Dale, and Kahnemann, Daniel. (Eds) 2002 Heuristics and Biases, New York: Cambridge University Press. Golec, J., and M. Tamarkin. 1995. Do bettors prefer long shots because they are risk-lovers or are they just over-confident? Journal of Risk and Uncertainty 11 (1): 51-64. Hartmann, Frank G., and Frank Moers. 1999. Testing contingency hypotheses in budgetary research: an evaluation of the use of moderated regression analysis. Accounting, Organizations and Society 24 (4): 291-315. Hau, Harald. 2001. Location matters: an examination of trading profits. Journal of Finance 56 (5): 1959-1983.

33
Ivkovich, Z., and S. Weisbenner. 2005. Local does as local is: information content of the geography of individual investors’ common stock investments. Journal of Finance 60 (1): 267-306. Johnson, Johnnie E. V., and Alistair C. Bruce. 1993. Gluck’s second law: an empirical investigation of horserace betting in early and late races. Psychological Reports 72 (2): 1251-8. Johnson, J.E.V., and A.C. Bruce. 1997. An empirical study of the impact of complexity on participation in horserace betting. Journal of Gambling Studies 13 (2): 159 -172. Keren, G., and W.A. Wagenaar. 1985. On the psychology of playing blackjack: normative and prescriptive considerations with implications for decision theory. Journal of Experimental Psychology: General 114 (2): 133-158. Kopelman, R.E., and B.L. Minkin. 1991. Toward a psychology of pari-mutuel behaviour: a test of Gluck’s Laws. Psychological Reports 68: 701-2. Law, David, and David A. Peel. 2002. Insider trading, herding behavior and market plungers in the British horse–race betting market. Economica 69 (274): 327-338. Levitt, Stephen D. 2004. Why are gambling markets organized so differently from financial markets? Economic Journal, 114, 223-246. Marginson, David. 2010. Market inefficiency in person-to-person betting: examining ‘known loser insider trading on the exchanges. Southern Economic Journal 76 (4): 932-952. Markowitz, Harry M. 1952. The utility of wealth. Journal of Political Economy 56: 151-154. McGlothlin, William H. 1956. Stability of choices among uncertain alternatives. American Journal of Psychology 69: 604-15. Meng, X., R. Rosenthal, and D.B. Rubin. 1992. Comparing correlation coefficients. Psychological Bulletin 111 (1): 172-175. O’Connor, N.A. 2007. Betting exchanges – disruptive innovation at work. Bettingmarket.com (accessed 3 January 2008). Peel, David and David Law. 2009. A more general non-expected utility model as an explanation of gambling outcomes for individuals and markets. Economica 76: 251-263. Pepall, Lynne, Dan J. Richards and George Norman. 2005. Industrial Organization, Mason, Ohio: Thomson South-Western. Rachlin, H. 1990. Why do people gamble and keep gambling despite heavy losses? Psychological Science 1 (5): 294-297. Rosett, Richard N. 1965. Gambling and Rationality. Journal of Political Economy , 6, 595-607.

34
Schnytzer, Avi, and Yuval Shilony. 1995. Inside information in a betting market. Economic Journal 105: 963-971. Shin, Hyun Song. 1991. Optimal betting odds against insider traders. Economic Journal 101 (408): 1179-1185. Shin, Hyun Song. 1992. Prices of state-contingent claims with insider traders, and the favourite-longshot bias. Economic Journal 102 (411): 426-435. Shin, Hyun Song. 1993. Measuring the incidence of insider trading in a market for state-contingent claims. Economic Journal 103 (420): 1141-1153. Smith, M.A., D. Paton, and L. Vaughan Williams. 2006. Market efficiency in person-to-person betting. Economica 73 (292): 673-689. Snyder, Wayne W. 1978. Horse racing: testing the efficient markets model. The Journal of Finance XXXIII (4), 1109-1118. Sung, M-C., J.E.V. Johnson, and J. Peirson. (2008). Understanding the weekend effect: insights from a market for state-contingent claims. University of Southampton Department of Management Working Paper. Symeonidis, George. 2002. The Effects of Competition, Cambridge, Mass. and London: MIT Press. Thaler, Richard H. 1994. Quasi Rational Economics, New York: Russell Sage Foundation. Tirole, Jean. 2000. The Theory of Industrial Organization, Cambridge, Mass. and London: MIT Press. Vaughan Williams, L., and D. Paton. 1997. Why is there a favourite-longshot bias in British racetrack betting markets? Economic Journal 107 (440): 150-158. Vaughan Williams, Leighton. (Ed.). 2005. Information Efficiency in Financial and Betting Markets, Cambridge: Cambridge University Press. Viscusi, W. Kip, John M. Vernon, and Joseph E. Harrington, Jnr. 2000. Economics of Regulation and Antitrust, Cambridge, Mass: Cambridge MIT Press. Woodland, Linda M., and Bill M. Woodland. 1994. Market efficiency and the favourite-longshot bias: the baseball betting market. Journal of Finance 49: 269-279. i The study’s findings have wider appeal, given the accepted similarities between markets for state contingent claims (betting markets) and other financial markets (see e.g. Snyder 1978; Levitt 2004). Shin (1992, 1993) explains the similarities between the bookmakers’ overround and the bid-ask spread in other financial markets. ii Bookmaking is explained further in Section 3. iii On very rare occasions, sum of implied probabilities may be < 1 (Coleman 2007), in which case we would have an ‘under-round’.

35
iv While we use a horse race example to illustrate the OR and betting market efficiency, the points made apply to any event, sporting or otherwise, for which there is more than one possible outcome, and for which bookmaker odds are available. v We say ‘in principle’ because the ability of the OR to signify an overall transfer of monies from punter to bookmaker depends on the ‘making of a perfect book’ (see Dowie 1976). A perfect book exists, to the extent that the bookmaker is able to lay each possible event outcome to lose the same amount of money. In practice, market complexities often prevent a perfect book from being realised. Some bookmakers may also adopt deliberately long positions with one or more race entrants to potentially enhance profits, while increasing risk exposure. vi Any returns to the bookmaker must contribute to covering the costs of bookmaking. These costs can include, for instance, administrative costs, travelling expenses, licensing fees, salaries and wages, and bad debts. For large bookmaking businesses such as Ladbrokes and William Hill, the advent of person-to-person internet betting exchanges (e.g. Betfair.com) has, and is threatening bookmaker margins, as demonstrated in an apparent reduction in overround per runner. While acknowledging these points, our study focuses on examining race-based factors which may influence the magnitude of the overround, independent of the effects created by external pressures. vii The total number of bookmakers permitted to operate at any given race meeting is determined by the number of list positions or ‘pitches’ available. This number is set by the British Horseracing Authority (BHA) in conjunction with racecourse owners. A key determinant is the physical size and layout of the ‘betting ring’ at the particular racetrack. Within the total permitted, the actual number of bookmakers operating at a given race meeting will depend on, for instance, the quality and nature of the race meetings (some bookmakers prefer Flat to National Hunt racing), the number and geographical proximity of alternative race meetings on that day, the location of the particular racetrack, and the expected number of race-goers. For the individual bookmaker, a significant determinant is whether or not s/he has or can obtain a licence to operate at a given racetrack. viii In the context of racecourse attendance, we categorise Fridays as a weekend rather than a weekday. Compared to Monday-Thursday, Friday racecourse attendances tend to include considerably more `works outings’ and similar organised events involving recreational racegoers. ix A list of the racetracks comprising each category is available on request. x The reasons for excluding Sundays from data collection are threefold: (1) the generally lower frequency or incidence of Sunday race meetings compared to other days of the week, (2) the selectivity of Sunday racing (not all racetracks engage in Sunday racing), and, (3) given the still relative ‘newness’ of Sunday racing, the greater uncertainty regarding the type of clientele frequenting race meetings on a Sunday. xi Bank holiday Mondays were excluded from data collection, given the likelihood of significant numbers of recreational bettors patronising race meetings on these days. xii The 994-race sample comprised 539 Flat races and 455 NH races. There are 463 handicap races and 531 non-handicap races. xiii Basically, the closer both values are to 1, the lower the collinearity among the predictor variables (Blaikie 2003). xiv An alternative would be to use interaction terms to test our five second-order propositions. In each case, a separate variable representing the product of the interaction between the predictor variable and number of runners would be added to a regression model comprising the five main effect variables (e.g. last race effect, race type, etc.). Thus, there would be five additional variables (interaction terms), the significance of which would indicate the sensitivity of the predictor variables to field size. Unfortunately, however, the use of binary variables (1, 0) to measure the predicted market effects renders the use of interaction terms problematic. A particular problem is that the interaction between, say, Flat-NH effect (Flat = 1, NH = 2) and number of runners (range 3- 18) creates a product term for which a score of, for example, 10, could represent either a Flat race comprising ten runners (1 × 10) or a NH race comprising five runners (2 × 5). The mathematical problems (and problems of interpretation) are even greater for binary variables of 1, 0. For these reasons, it is inappropriate and potentially misleading to employ interaction terms to test second-order propositions. xv This argument draws on the point that horses competing in handicap races tend to have accumulated more public form than horses competing in non-handicap races (which can sometimes involve race entrants, all of which are having their first public outing. Examples are maiden 2-year-old races taking place at the beginning of the Flat season). The potential for insider trading is thus considered to be greater in the latter than the former.