Power Laws and the Mega-Idiosyncratic Origins of Aggregate ...
33
Power Laws and the Mega-Idiosyncratic Origins of Aggregate Fluctuations Xavier Gabaix ∗ MIT, Department of Economics and NBER November 12, 2004 Abstract If firm sizes have a small dispersion, idiosyncratic firm-level shocks lead to negligible aggregate fluctuations. This has led economists to appeal to macroeconomic (sectoral or ag- gregate shocks) shocks to explain aggregate fluctuations. However, the empirical distribution of firms is fat-tailed. This paper shows how, in a world with fat-tailed firm size distribution, idiosyncratic firm-level fluctuations aggregate up to non-trivial aggregate fluctuations. We illustrate why and how this happens, and contend that aggregate fluctuations come in large part from idiosyncratic shocks to firms. We show empirically that idiosyncratic volatility is indeed large enough to account for GDP volatility. The idiosyncratic movements of the largest 100 firms in the US appear to explain about 40% of variations in output and the Solow residual. This “granular” hypothesis suggests new directions for macroeconomic research, in particular that macroeconomic questions will be clarified by looking at the behavior of large firms. This mechanism might be useful for understanding the fluctuations of many aggregate quantities, such as business cycle fluctuations, inventories, inflation, short or long run movements in productivity, and the current account. 1 Introduction This paper proposes a simple origin for aggregate shocks. It develops the view that a large part of aggregate shocks comes from idiosyncratic shocks to individual firms. This approach sheds light on a number of issues that are difficult to address in models that postulate aggregate shocks. Though economy-wide shocks (inflation, wars, policy shocks) are no doubt important, they have a difficulty explaining most fluctuations (Cochrane 1994). Often, the explanation for year to year jumps of aggregate quantities is elusive. On the other hand, there is a host of anecdotal evidence for important idiosyncratic shocks. For instance, the McKinsey Institute (2001) estimates that in 1995-1999, 1/6 of the increase in productivity growth of the whole U.S. ∗ Department of Economics, MIT, Cambridge, MA 02142. [email protected]. I thank Carlos Caro, Thomas Chaney, Fernando Duarte, Francesco Franco, Jinsook Kim, Heiwai Tang, Ding Wu for excellent research assistance. For helpful discussions I thank seminar participants at Berkeley, Boston University, Brown, Columbia, ECARE, the Federal Reserve Bank of Minneapolis, Harvard, Michigan, MIT, New York University, NBER, Toulouse, the 2004 Summer Econometric Society meetings, the 2004 Stanford Institute for Theoretical Economics, and Daron Acemoglu, Robert Barksy, Susanto Basu, Olivier Blanchard, Ri- cardo Caballero, David Canning, Andrew Caplin, Thomas Chaney, V. V. Chari, Larry Christiano, Diego Comin, Don Davis, Bill Dupor, Martin Eichenbaum, Jesus Fernandez-Villaverde, Francesco Franco, Mark Gertler, Robert Hall, John Haltiwanger, Boyan Jovanovic, David Laibson, Ellen McGrattan, Todd Mit- ton, Thomas Philippon, Robert Solow and David Weinstein. 1
Transcript of Power Laws and the Mega-Idiosyncratic Origins of Aggregate ...

Power Laws and the Mega-Idiosyncratic Originsof Aggregate Fluctuations
Xavier Gabaix∗
MIT, Department of Economics and NBER
November 12, 2004
Abstract
If firm sizes have a small dispersion, idiosyncratic firm-level shocks lead to negligibleaggregate fluctuations. This has led economists to appeal to macroeconomic (sectoral or ag-gregate shocks) shocks to explain aggregate fluctuations. However, the empirical distributionof firms is fat-tailed. This paper shows how, in a world with fat-tailed firm size distribution,idiosyncratic firm-level fluctuations aggregate up to non-trivial aggregate fluctuations. Weillustrate why and how this happens, and contend that aggregate fluctuations come in largepart from idiosyncratic shocks to firms. We show empirically that idiosyncratic volatilityis indeed large enough to account for GDP volatility. The idiosyncratic movements of thelargest 100 firms in the US appear to explain about 40% of variations in output and the Solowresidual. This “granular” hypothesis suggests new directions for macroeconomic research,in particular that macroeconomic questions will be clarified by looking at the behavior oflarge firms. This mechanism might be useful for understanding the fluctuations of manyaggregate quantities, such as business cycle fluctuations, inventories, inflation, short or longrun movements in productivity, and the current account.
1 Introduction
This paper proposes a simple origin for aggregate shocks. It develops the view that a largepart of aggregate shocks comes from idiosyncratic shocks to individual firms. This approachsheds light on a number of issues that are difficult to address in models that postulate aggregateshocks. Though economy-wide shocks (inflation, wars, policy shocks) are no doubt important,they have a difficulty explaining most fluctuations (Cochrane 1994). Often, the explanationfor year to year jumps of aggregate quantities is elusive. On the other hand, there is a hostof anecdotal evidence for important idiosyncratic shocks. For instance, the McKinsey Institute(2001) estimates that in 1995-1999, 1/6 of the increase in productivity growth of the whole U.S.
∗ Department of Economics, MIT, Cambridge, MA 02142. [email protected]. I thank Carlos Caro,Thomas Chaney, Fernando Duarte, Francesco Franco, Jinsook Kim, Heiwai Tang, Ding Wu for excellentresearch assistance. For helpful discussions I thank seminar participants at Berkeley, Boston University,Brown, Columbia, ECARE, the Federal Reserve Bank of Minneapolis, Harvard, Michigan, MIT, New YorkUniversity, NBER, Toulouse, the 2004 Summer Econometric Society meetings, the 2004 Stanford Institutefor Theoretical Economics, and Daron Acemoglu, Robert Barksy, Susanto Basu, Olivier Blanchard, Ri-cardo Caballero, David Canning, Andrew Caplin, Thomas Chaney, V. V. Chari, Larry Christiano, DiegoComin, Don Davis, Bill Dupor, Martin Eichenbaum, Jesus Fernandez-Villaverde, Francesco Franco, MarkGertler, Robert Hall, John Haltiwanger, Boyan Jovanovic, David Laibson, Ellen McGrattan, Todd Mit-ton, Thomas Philippon, Robert Solow and David Weinstein.
1

.15
.2.2
5.3
.35
.4
1950 1960 1970 1980 1990 2000year
Share of top 50 firms Share of top 100 firms
Figure 1: Share of the top 50 and 100 non-oil firms in Compustat. The share is the sum of thesales of the firms, divided by GDP. Hulten’s theorem (Appendix E) motivates the use of salesrather than value added.
economy was due to one firm, Wal-Mart1. Likewise, shocks to GDP may stem from a varietyof events such as a success by Nokia, the difficulties of a Japanese bank, new sales by Boeing, anew chip by Intel, and a downsizing at Nestlé.
Idiosyncratic shocks aggregate to non-trivial shocks, because modern economies have manylarge firms. For instance, in Japan, the top 10 firms account for 35% of the exports (Canals etal. 2004). For the U.S., Figure 1 reports the total sales of the of the top 50 and 100 firmsasa fraction of GDP. On average, the sales of the top 50 firms are 23% of GDP, while the salesof the top 100 firms are 30% of GDP. The top 100 firms hence represent a large part of themacroeconomic activity. It is perhaps not surprising that understanding their actions give agood insight into aggregate economy. Indeed, by looking at their respective actions, one cantake a peek into the inner workings of the economy, indeed of about 1/4 of the economy as awhole.
This hypothesis, that idiosyncratic shocks generate aggregate shocks, offers a microfounda-tion for the “aggregate shocks” of real business cycle models. Hence real business cycle shocksare not, at heart, mysterious “aggregate productivity shocks”. Rather they are well-definedshocks to individual firms2. This view sheds lights on a number of issues, such as the depen-dence of the amplitude of GDP fluctuations with GDP level, the microeconomic composition ofGDP, the distribution of GDP and firm-level fluctuation.
Some of the mathematics will be involved, so it is useful to highlight the main argument.First, a result based on Hulten (1978) shows that, if firm i has a productivity shock dπi, those
1 In their interesting study, McKinsey (2001) seek to understand why U.S. productivity growth increased from1.5% to 2.8% per year in the second half of the 1990s.
2These shocks can propagate to the rest of the economy. There is a very large literature on these “propagationmechanisms”. This paper focuses on the original shocks, not their propagation.
2

shocks are i.i.d., then the standard deviation of GDP growth is:
σGDP = hSσπ (1)
where hS is the Sales herfindahl of the economy:
hS =
ÃNXi=1
µSales of firm i
GDP
¶2!1/2and σπ is the standard deviation of the i.i.d. productivity shocks. Second, microeconomicvolatility is very large. We find that, even for large firms, the volatility of productivity isσπ = 20%/year. Third, as countries have large firms the sales herfindahl hS is high. Forinstance, for the U.S. in 2002, it is hS = 6.2%. Using (1), we predict a GDP volatility equalto: σGDP = 20% · 6.2% = 1.2%. This is the order of magnitude of business cycle fluctuations.Using non-US data leads to even larger business cycle fluctuations.
We will also show how demand linkages such as Long and Plosser (1982)’s generate anamount of comovement among firms that resembles the one of business cycles. Hence, firm levelshocks create both non-trivial aggregate fluctuations, but also comovement. We have all theingredients we need for a business cycle.
The main theoretical contribution is to break the curse of 1/√N diversification. A simple
diversification argument shows that, in an economy with N firms with independent shocks,aggregate fluctuations should have a size proportional to 1/
√N . Given modern economies
can have millions of firms, this suggests that those idiosyncratic fluctuations will be negligible.Horvath (1998,2000) and Dupor (1999) discuss ways out of this problem based on the sparsityof the input output matrix. We offer a simple alternative solution. When firm size is powerlaw distributed, then conditions under which one derives the central limit theorem break down,and other mathematics (due to Paul Lévy) apply. In the central case of Zipf’s law, aggregatevolatility scales like 1/ lnN , rather than 1/
√N . The draconian 1/
√N diversification is replaced
by a much milder one that goes in 1/ lnN . In an economy with fat tailed distribution of firms,diversification effects due to country size are quite small. Section 6 provide gathers the empiricalevidence on this, and is very congruent with the model.
We will present the argument with several degrees of sophistication. Section 2 developsa simple model that can be calibrated. Section 3 provides a calibration that shows that oureffects of the right order of magnitude to account for macroeconomic fluctuations. Section 4shows directly that the idiosyncratic movements of firms appear to explain, year by year, a goodfraction (40%) of actual fluctuations in GDP and the Solow residual. Section 5 revisits howdemand linkages can in turn create comovements. Section 6 discusses some extensions.
1.1 Related literature
1.1.1 Macroeconomics
A few papers have proposed way to generate macro shocks from purely micro shocks. A pioneer-ing paper is Jovanovic (1987), which we discuss in section 2.2. It relies on an extremely largemultiplier M that has an order of magnitude of 1000 — the square root of the number of firmsin the economy. This high multiplier has proved an obstacle of the Jovanovic model by macro-economists. Different routes were explored by very innovative papers, Durlauf (1993) and Baket al. (1993). Durlauf (1993) generates macroeconomic uncertainty with idiosyncratic shocksand local interactions between firms. The action comes from the non-linear interactions between
3

firms, while in our paper the core comes from the skewed distribution of firms. Durlauf’s modelis analytically difficult, and we suspect that embedding our power law distributed firm in hismodels could be quite interesting. This is difficult to do at this point. Bak et al. (1993) exploreself-organizing criticality 3. While we have much sympathy for their approach (which is verydifferent from ours), their model generates fluctuations that are probably “too fat tailed”: theyhave a power law exponent of 1/3, so that fluctuations don’t even have a mean, much less avariance. Nirei (2003) proposes an elaborate model whose spirit is related to Bak et al. 1993,and finds fluctuations with a power law exponent 1/2.
Long and Plosser (1983) worked out the view that sectoral (rather than firm) shocks mightaccount for GDP fluctuations. As their model has a small number of sectors, those shockscan be viewed as mini aggregate shocks. Horvath (1998, 2000) and Conley and Dupor (2003)explore this hypothesis further. They find that sector-specific shock are an important source ofaggregate volatility. Studies disagree somewhat on the share of sector specific shocks, aggregateshocks, and complementarities. Shea (2002) quantifies that complementarities play a major rolein aggregate business cycle fluctuations. Caballero, Engel and Haltiwanger find that aggregateshocks are important (1997), while Horvath (1998) find that sector-specific shocks go a long wayto explain aggregate disturbances. Finally Horvath (1998,2000) and Dupor (1999) debate aboutwhether N sectors can have a volatility that does not decay in N−1/2. We find an alternativesolution to their debate. This solution, formalized in Proposition 2, is that firm size distributionis very skewed4, that a few large firms dominate the economy. Also, we propose that thinkingabout firms might be a useful way to think about the world. Many “industry shocks” originatein the decision of one large firms (Toyota, WalMart, IBM) to introduce a radical innovation. Theshocks are also easier to explain: they are the fruit of R&D efforts, and bets on the organizationof production.
1.1.2 Power laws in economics
A growing number of economic variables appear to follow power laws. The earliest is the distri-bution of incomes (Pareto, 1896). Many power laws have an exponent 1, i.e. they follow Zipf’slaw. A number of economic systems appear to follow Zipf’s law: cities (Zipf 1949, Gabaix andIoannides 2004), firms (Axtell 2001, Okuyama et al. 2003), mutual funds (Gabaix, Reuter andRamalho 2003), web sites (Barabasi and Albert 1999). Gabaix (1999) provides an explanationand a survey of the literature. Stock market fluctuations also follow power laws. Intriguingly,the exponent is typically either 3 or 3/2. Gabaix et al. (2003, 2004) survey and propose anexplanation for a series of puzzling facts on the distribution of stock market returns. They basetheir explanation on the power law distribution of large traders. This is analogous to the waythis paper bases GDP fluctuations on a power law distribution of large firms.
2 The essence of the idea
2.1 A simple “islands” economy
To illustrate the idea, we consider a very simple economy, composed of N firms that are in-dependent islands with no feedback5. In this economy there are only idiosyncratic shocks to
3Also see the pedagogical version in Scheinkman and Woodford (1994).4Canals et al. (2004) find that this is particularly true for the exports, whose distribution are extremely
skewed. For instance, they find that the root-Herfindahl of exports is about 50%.5Appendix A fleshes out such a model.
4

firms. We study its aggregate volatility. We call this volatility the GDP volatility coming fromidiosyncratic shocks, σGDP . Say that firm i produces Sit. In a year t, it has a growth rate:
∆Si,t+1Si,t
=Si,t+1 − Sit
Sit= σiεi,t+1 (2)
where σi is firm i’s volatility and the εi,t+1 are independent random variables with mean 0 andvariance 1. Total GDP is:
Yt =NXi=1
Sit (3)
and GDP growth is:
∆Yt+1Yt
=1
Yt
NXi=1
∆Si,t+1 =NXi=1
σiSitYt
εi,t+1.
As the shocks εi,t+1 are uncorrelated, the variance of GDP growth is:
σ2GDP = var∆Yt+1Yt
=NXi=1
σ2i
µSitYt
¶2.
The volatility of GDP fluctuations coming from the idiosyncratic micro shocks are
σGDP =
ÃNXi=1
σ2i ·µSitYt
¶2!1/2. (4)
Hence the variance of GDP, σ2GDP , is the weighted sum of the variance σ2i of idiosyncratic shocks
with weights equal to³SitYt
´2, the squared share of output that firm i accounts for. We shall use
equation (4) throughout the paper.If the firms all have the same volatility σi = σ, we get the following simple identity:
σGDP = σh (5)
with
h =
"NXi=1
µSitYt
¶2#1/2. (6)
h is the square root of the Herfindahl of the economy. For simplicity, we call it the “herfindahl”of the economy.
In the body of this paper, we work with the “bare-bones” model (2)-(3). This can be viewedas the linearization of a host of richer models. We present such a model in Appendix A. Ourarguments apply if feedback mechanisms are added, as we do in section 24.1. We take advantageof the high tractability and portability of the simple model.
2.2 The 1/√N argument for the appeal to aggregate shocks
First, we briefly recall the reason why macroeconomics usually appeals to common (or at leastsector-wide) aggregate shocks. With a large number of firms N , one could expect the sum of
5

their σGDP shocks to be vanishingly small. Indeed, take firms of initially identical size equal to1/N of GDP, and identical standard deviation σi = σ. Then (5)-(6) gives:
σGDP =σ√N.
To get an idea of the order of magnitude delivered by this view, we take an estimate of firmvolatility σ = 20% from Appendix B, and consider an economy with N = 106 firms6. We get
σGDP =σ√N=20%
103= 0.02% per year.
This theoretical annual GDP volatility of 0.02% is just too small to account for the empiricallymeasured size of macroeconomic fluctuations. This is why economists typically appeal to ag-gregate shocks.7 We will see that in fact this argument will fail, because large firms in moderneconomies have a size much bigger than 1/N . Before we do that, we show that more generalmodeling assumptions predict a 1/
√N scaling.
Proposition 1 Consider an islands economy with N firms whose sizes are drawn from a distri-bution with finite variance. Suppose that they all have the same volatility σ. Then the economy’sGDP volatility is:
σGDP =E£S2¤1/2
E [S]
σ√N.
Proposition 1 should be contrasted to Proposition 2 below. Its proof is in Appendix D.We now show how a different model of the size distribution of firms leads to dramatically
different results.
2.3 The 1/√N argument breaks down with power law firms
2.3.1 Empirical evidence shows that the distribution of firms has fat tails
A long literature establishes that the distribution of firm sizes (sales, assets, or number ofemployees give the same results) is very skewed. A good model parametrization is a power lawdistribution:
P (S > x) = ax−ζ . (7)
for x > a1/ζ . To estimate this, it is useful to take the density:
f (x) =ζa
xζ+1
and its logarithm:ln f (x) = − (ζ + 1) lnx+C (8)
where C is a constant. A long literature has estimated the size distribution of firms, but typicallythe sample would include only firms listed in the stock market. Axtell (2001) breaks new groundby using the Census, which lists all the U.S. firms.
6Axtell (2001) reports that in 1997 there were 5.5 million firms in the United States.7One way around this has been proposed by Jovanovic (1987), who observes that when the multiplier is very
large (1/ (1− λ) = M ∼√N , so 1 − λ ∼ 1/
√N), we get non-vanishing aggregate fluctuations. The problem is
that empirically, such a large multiplier (of order of magnitude√N ' 1000) is very implausible. The impact
of government purchases or trade shocks, for instance, would be much higher than we observe. Hence mosteconomists do not think plausible the “extremely large multiplier” route.
6

Figure 2: Log frequency ln f (S) vs log size lnS of U.S. firm sizes (by number of employees) for1997. OLS fit gives a slope of 2.059 (s.e.= 0.054; R2 =0.992). This corresponds to a frequencyf (S) ∼ S−2.059, i.e. a power law distribution with exponent ζ = 1.059. This is very close toZipf’s law, which says that ζ = 1. Source: Axtell (2001).
We reproduce his8 plot of (8) in Figure 2. The horizontal axis shows lnx, where x is the sizeof a firm in number of employees. The vertical axis shows the log of the fraction of firms withsize x, ln f (x). One expects to see a straight line in the region where (8) holds, and indeed theFigure shows a very nice fit. An OLS fit of (8) yields an R2 = 0.992, and a slope = −2.059,with a standard error of 0.054. This yields an estimate of ζ = 1.059± 0.054.
In the rest of the paper we will often take the approximation ζ = 1, the “Zipf” value. Thisvalue (ζ ' 1) is often found in the social sciences, for instance in the size of cities (Zipf 1949), andthe in the amount of assets under management of mutual funds (Gabaix, Ramalho and Reuter2003). The origins of this distribution are becoming better understood (see Gabaix (1999), andGabaix and Ioannides (2004) for a survey of various candidate explanations).
The power law distribution (7) has fat tails, and thus produces some very large firms. Welook at the implications for GDP fluctuations in the next section.
2.3.2 GDP volatility when the volatility of a firm does not depend on of its size
Proposition 1 does not address what happens when the variance of sizes is infinite. Moreprecisely, the empirical distributions we find, with power laws ζ < 2 , have infinite variance. Thenext Proposition examines what happens in that case of a “fat tailed” distribution of firms. Itsproof is in Appendix D.
Proposition 2 Consider an islands economy with N firms that have power law distributions
8Okuyama et al. (1999) also find that ζ ' 1 for Japanese firms.
7

(7) with exponent ζ ∈ [1, 2) and volatility σ. Then its GDP volatility is:
σGDP ∼ vζlnN
σ for ζ = 1
σGDP ∼ vζ
N1− 1ζ
σ for 1 < ζ < 2
where vζ is a random variable that is independent of N and σ.
The main conclusion is that if firms have fat tails, σGDP decreases as N−β for 0 ≤ β < 1/2,and thus decays much more slowly than N−1/2. In the Zipf limit ζ = 1, we get β = 0, and thedecay is barely perceptible9.
2.3.3 GDP volatility when the volatility of a firm depends on its size
This section completes the theoretical picture, but in the first reading we recommend the readerskip to section 3.
We just understood the benchmark case where all firms have the same volatility σ. We nowturn to the case where the volatility decreases with size, which seems to be the case empirically.We examine the functional form suggested by the empirical discussion in section 6.1
σFirm (S) = kS−α (9)
for α ≥ 0.
Proposition 3 Take an islands economy with N firms that have power law distributions P (S > x) =x−ζ for ζ ∈ [1,∞]. Assume that the volatility of a firm of size S is
σFirm (S) = kS−α (10)
for some α ≥ 0. Then, GDP fluctuations have the form:
∆YtYt
= kN−α0gt (11)
with
α0 = min
µ1
2,α+ ζ − 1
ζ
¶(12)
and gt is a symmetrical Lévy stable distribution with exponent min {ζ/ (1− α) , 2}.
In particular, the volatility σ (S) of GDP decreases in a power law fashion as a function ofits size S 10:
σGDP (S) ∼ S−α0. (13)
9 If there are N identical firms, 1/h2N = N . So 1/h2N reveals the “effective” number of firms in the economy, fordiversification purposes. So, in a Zipfian world (where ζ = 1), the effective number of firms is not N but (lnN)2.For 1 < ζ < 2, the effective number of firms scales as N2−2/ζ . This notion of the “effective” number of firmsis important as long as diversification plays a role, as is the case in Caballero and Engel (2004) and the presentpaper.10 In this paper, f (S) ∼ g (S) for some functions f, g, means that the ratio f (S) /g (S) tends, for large S, to a
positive real number. So f and g have the same scaling “up to a constant real factor”.
8
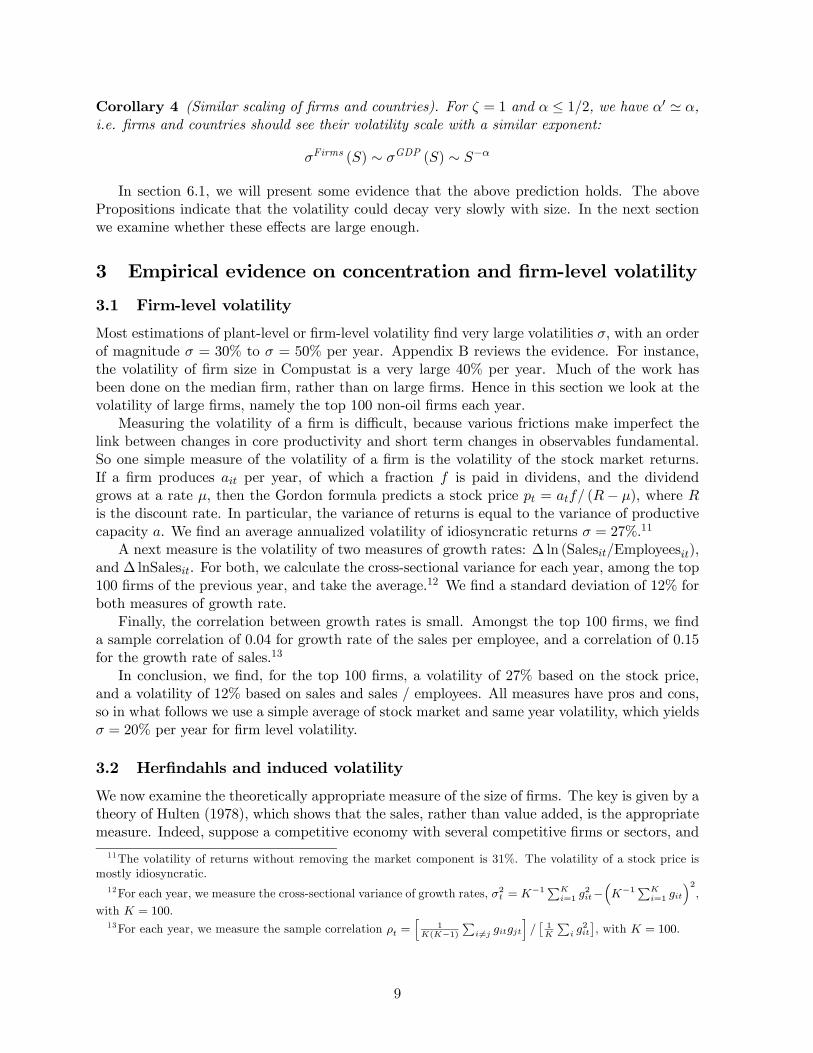
Corollary 4 (Similar scaling of firms and countries). For ζ = 1 and α ≤ 1/2, we have α0 ' α,i.e. firms and countries should see their volatility scale with a similar exponent:
σFirms (S) ∼ σGDP (S) ∼ S−α
In section 6.1, we will present some evidence that the above prediction holds. The abovePropositions indicate that the volatility could decay very slowly with size. In the next sectionwe examine whether these effects are large enough.
3 Empirical evidence on concentration and firm-level volatility
3.1 Firm-level volatility
Most estimations of plant-level or firm-level volatility find very large volatilities σ, with an orderof magnitude σ = 30% to σ = 50% per year. Appendix B reviews the evidence. For instance,the volatility of firm size in Compustat is a very large 40% per year. Much of the work hasbeen done on the median firm, rather than on large firms. Hence in this section we look at thevolatility of large firms, namely the top 100 non-oil firms each year.
Measuring the volatility of a firm is difficult, because various frictions make imperfect thelink between changes in core productivity and short term changes in observables fundamental.So one simple measure of the volatility of a firm is the volatility of the stock market returns.If a firm produces ait per year, of which a fraction f is paid in dividens, and the dividendgrows at a rate µ, then the Gordon formula predicts a stock price pt = atf/ (R− µ), where Ris the discount rate. In particular, the variance of returns is equal to the variance of productivecapacity a. We find an average annualized volatility of idiosyncratic returns σ = 27%.11
A next measure is the volatility of two measures of growth rates: ∆ ln (Salesit/Employeesit),and ∆ lnSalesit. For both, we calculate the cross-sectional variance for each year, among the top100 firms of the previous year, and take the average.12 We find a standard deviation of 12% forboth measures of growth rate.
Finally, the correlation between growth rates is small. Amongst the top 100 firms, we finda sample correlation of 0.04 for growth rate of the sales per employee, and a correlation of 0.15for the growth rate of sales.13
In conclusion, we find, for the top 100 firms, a volatility of 27% based on the stock price,and a volatility of 12% based on sales and sales / employees. All measures have pros and cons,so in what follows we use a simple average of stock market and same year volatility, which yieldsσ = 20% per year for firm level volatility.
3.2 Herfindahls and induced volatility
We now examine the theoretically appropriate measure of the size of firms. The key is given by atheory of Hulten (1978), which shows that the sales, rather than value added, is the appropriatemeasure. Indeed, suppose a competitive economy with several competitive firms or sectors, and
11The volatility of returns without removing the market component is 31%. The volatility of a stock price ismostly idiosyncratic.12For each year, we measure the cross-sectional variance of growth rates, σ2t = K−1
PKi=1 g
2it−
³K−1
PKi=1 git
´2,
with K = 100.13For each year, we measure the sample correlation ρt =
h1
K(K−1)P
i 6=j gitgjti/£1K
Pi g
2it
¤, with K = 100.
9

that firm i has a Hicks-neutral productivity growth dπi. Hulten (1978) shows that the increasein GDP is:
dGDPGDP
=Xi
Sales of firm i
GDPdπi (14)
The weights add up to more than 1. This reflects the fact that productivity growth in a firmgenerate an increase in the social value of all the inputs it uses. The firms’ sales are the properstatistics for that social value. For clarity, Appendix E offers a simple derivation of Hulten’stheorem, and shows that the result holds under weaker conditions that Hulten’s.
We now draw the implications for the volatility of GDP. Suppose productivity shocks dπiare i.i.d. with standard deviation σπ. Then, the variance of productivity growth is:
vardGDPGDP
=Xi
µSales of firm i
GDP
¶2var (dπi)
soσGDP = hSσπ (15)
where hS is the Sales herfindahl:
hS =
ÃNXi=1
µSalesitGDPt
¶2!1/2. (16)
Hulten’s theorem allows us to simplify a lot the analysis. For the total volatility, one doesnot need to know the details of the input-output matrix. The sales herfindahl is the sufficientstatistics.
We also report the “workforce herfindahl” hW :
hW =
ÃNXi=1
µWorkforceit
Total workforcet
¶2!1/2(17)
It is less well motivated theoretically, but may be useful.We get our herfindahls from Acemoglu, Johnson and Mitton (2004), who analyze the Dun
and Bradstreet data. This data has a good coverage of the major firms for many countries. Itis not without problems, but at least it provides an order of magnitude for the empirical valuesof the herfindahls.
All Countries Rich Countries USASales herfindahl hS 22.0 26.6 6.1Workforce herfindahl hW 3.8 4.0 1.2GDP volatility induced byidiosyncratic firm-level shocks
σGDP = σhS 4.4 5.2 1.2
Table 1: Sales herfindahl hS and Workforce herfindahl hW (Eqs.16—17) in 2002. Units are %.Rich countries are the countries with GDP per capita greater than $13,000. For the inducedGDP volatility, we use take σGDP = σhS, with a firm-level volatility σ = 20%. See Eq. 15.Source: Acemoglu, Johnson and Mitton (2004) for the international data, and Compustat for
the USA data.
10

As seen above, a good estimate for the firm-level volatility is σ = 20%. Table 1 displaysthe results. We see that the sales herfindahl hS is quite large: hS = 22% for all countries, andhS = 6.1% for the USA. By Eq. 15 this corresponds to a GDP volatility
σGDP = 20%× 6.1% = 1.2%
for the USA, and σGDP = 20% × 22% = 4.4% for a typical country. This is very much in theorder of magnitude of GDP fluctuations. As shown in Section 24.1, feedback mechanisms canincrease this estimate. We conclude that idiosyncratic volatility is quantitatively large enoughto explain macroeconomic volatility.
4 Using idiosyncratic movements to explain aggregate fluctua-tions
4.1 The granular residual
We now present tentative evidence that the idiosyncratic movements of the top 100 firms affectexplain a large fraction — 40 % — of the movements of total factor productivity (TFP). Doingthis exactly right requires vastly better data, and a different focus than this paper. However,we wish to present some suggestive evidence.
We choose a simple proxy for the labor productivity of firm i, sales per worker:
zit := lnSales of firm i in year t
Number of employees in firm i and year t(18)
This proxy is crude, but has the merit of demanding only simple data. It is also more likely tobe available with non-U.S. data. than less frugal measures, such that a firm-level Solow residual.In any case, it has good predictive power, so it is helpful to show granular effects in a clear way.
Firm-level productivity growth ∆z is affected by a common factor f and an idiosyncraticfactor ε
∆zit = zit − zi,t−1 = ft + εit (19)
We choose to focus on the K = 100 firms that had the largest sales in year t− 1. The number100 is largely arbitrary. The size-weighted average productivity growth of large firms is:
ASt :=
ÃKXi=1
Salesi,t−1GDPt−1
!−1Ã KXi=1
Salesi,t−1GDPt−1
∆zit
!(20)
and their equal—weighted average productivity is:
Aet = K−1
KXi=1
∆zit (21)
We call their difference the “granular residual” A∆t
A∆t : = AS
t −Aet =
ÃKXi=1
Salesi,t−1GDPt−1
!−1Ã KXi=1
Salesi,t−1GDPt−1
¡∆zit −∆zt
¢!(22)
∆zt = K−1KXi=1
∆zit (23)
11

In words, the granular residual is the difference between the size-weighted and the equal-weightedaverages of the productivity growth or the top K = 100 firms. Thus, it is free of a commoncomponent ft, and reflects how much the very large firms grew, compared to the typical firm.To see this, we observe that under representation (19),
A∆t =
ÃKXi=1
Salesi,t−1GDPt−1
!−1Ã KXi=1
Salesi,t−1GDPt−1
(εit − εt)
!(24)
εt = K−1KXi=1
εit
The common shock term disappears. The granular residual A∆t reflects only the idiosyncratic
movements of large firms. Hence the granular residual is a residual in two senses. It is theresidual productivity of large firms, and under the granular hypothesis it is a empirical proxyfor the Solow residual of large firms, purged of the aggregate shocks captured by Ae
t .
4.2 The granular residual seems to explain much of the fluctuations in GDPand the Solow residual
As is now clear to the reader, under the granular hypothesis, the idiosyncratic movements oflarge firms do affect aggregate productivity, and their granular residual affects TFP. To examinethe , we use annual U.S. Compustat data from 1951 to 2001. We take the Solow residual fromHall (2004), which itself comes from the Bureau of Labor Statistics. For the granular residual,we take for each year t− 1 the K = 100 largest non-oil firms in Compustat.14 We regress GDPgrowth and the Solow residual on the granular residual.
GDP Growtht = 0.028 + 0.71A∆t + 0.40A
∆t−1
(5.0) (5.6) (5.0)
R2 = 37%.
Solow Residualt = 0.0085 + 0.70A∆t + 0.31A
∆t−1
(3.5) (5.5) (2.7)
R2 = 40%.
Table 2: For the year t = 1952 to 2001, we regress the Solow Residual, and GDP growth, onthe granular residual A∆
t of the top 100 non-oil firms. The firms are the largest by sales of theprevious year. Robust t−statistics are in parentheses.
These regressions are heartening support of the granular hypothesis. Again, if the importantshocks were only aggregate (ft in Eq.19), then the fit of the regressions in Table 2 should benil. This is because common shocks are purged from the granular residual. In particular, it isimpossible to explain those results with a representative firm framework, or in a framework inwhich idiosyncratic shocks cancel out in the aggregate.
We conclude that the idiosyncratic movements of the top 100 firms in the economy, explaina large (40%) fraction of the Solow residual and a large fraction (37%) of GDP fluctuations.
14We exclude firms in the oil industry, because the wild swings in oil prices make (18) a too poor proxy of theproductivity of oil firms.
12

4.3 Dissecting the results a bit further
After this main empirical punchline, we look further at the detail of the mechanism. In the“strong version” of the granular hypothesis, equal weighted movements Ae
t in productivity shouldnot even predict the Solow residual — only size weighted movements do. This prediction isconfirmed in Table 3. On the other hand, equal weighted movements Ae
t do predict about 15%of GDP, which confirms that indeed they capture some of the economy-wide movements, suchas demand factors.
GDP Growtht = 0.021 + 0.18Aet − 0.25Ae
t−1(4.7) (0.99) (-1.95)
R2 = 15%.
Solow Residualt = 0.014 + 0.014Aet − 0.22Ae
t−1(4.5) (0.09) (-2.3)
R2 = 10%.
Table3: For the year t = 1952 to 2001, we regress the Solow Residual, and GDP growth, onthe equal-weighted productivity growth rate Ae
t of the top 100 non-oil firms. The firms are thelargest by sales in year t− 1. Robust t−statistics are in parentheses.
5 Enriching the model with demand linkages
5.1 Demand linkages create plausibly strong output comovement
The above calibration showed that idiosyncratic shocks can account to a large aggregate volatil-ity. We provide here some detail about the comovement they imply. Shea (2002) present a seriesof models that generate comovement. We take his “instantaneous” version of the Long Plosser
(1982) model. There are N firms. The representative consumer has utility: U = expNXi=1
θi lnCi.
Firm i produces Qi with Li units of labor, and Xik inputs from firm k. The production functionis Cobb-Douglas:
Qi = λi exp
Ãb [(1− α) lnLi + α lnKi] +
Xk
φk lnXik
!
with 1 = b+P
k φk. The clearing constraints are Qi = Ci+P
kXki and K =P
iKi, L =P
i Li,where L is the fixed labor supply. We assume that firms behave competitively15.
The analysis is standard. The economic importance of firms is captured by
γi =Sales of firm i
GDP=
piQi
GDP=
φib+ θi
while its share of value added is Li/L = bγi.
15This is to simplify the analysis. Firms could be competitive because markets are contestable (Baumol 1982).Otherwise, our “firms” can be interpreted as “sectors”. There is some debate about the size of markups. Basu andFernald (1997) find markups less than 10%, while other studies find higher markups, and much of macroeconomicsuses on zero markups.
13

Let hats mean proportional changes, i.e. bZ = dZ/Z. If firm i has a productivity shock bλi,then Eq. 14 indicates that GDP increases by:bY =X
i
γibλi. (25)
while the production of firm i increases by:bQi = bCi = bλi + (1− b) bY (26)
The term bY generates a comovement of between firms. To quantify it, we first interpret b, thenquantify it.
To interpret b, imagine that all firms have productivity growth bλi = bΛ%. Then GDP growthis bY = bΛX
i
γi = bΛXi
φib+ θi = bΛµ1− b
b+ 1
¶=1
bbΛ.
So 1/b is the “multiplier” of productivity shocks: a uniform 1% increase in productivity translatesinto a 1/b% increase in GDP.
How big is b empirically? b is 1 minus the share of intermediate inputs (“materials”) in theproduction function. For the U.S., the Jorgensen, Gollop and Fraumeni (1987) data, updated in1996, gives b = 0.50.16 So we conclude that b is between 0.15 and 0.5. Alternatively, b = hW/hSis the ratio of value added to sales of a typical firm, which yields b = 0.15. In what follows, wetake the conservative estimate of Jorgensen, Gollop and Fraumeni (1987), which gives b = 0.5.This translates into a “productivity multiplier” 1/b = 2.
This allows us to quantify better intensity of the comovement. Shea (2002) proposes a usefulmeasure of comovement. If, by a statistical or mental procedure, we removed the commoncomponent of firms firm level volatility would be bQi = bλi rather than (26). GDP increase wouldbe: bYNo Cov =X
i
Value added of firm i
GDPbλi
But with the Long Plosser demand linkages, GDP increase is: bY =P
iSales of firm i
GDPcQi. We havebYNo Cov = bbY . So the ratio of GDP variance attributed to comovements is:
1−var
³bYNo Cov´varbY = 1− b2 (27)
This is the type of ratio that Shea calculates. He finds that 80% to 96% of the variance isdue to complementarities. We compare this to what the model predicts. If b = 0.2 (resp. ifb = 0.5), then 1− b2 = 96% (resp. 75%) of comovements are attributable to complementarities.We conclude that Long Plosser demand linkages generate enough realistically high comovementsbetween firms.
This section shows that, to analyze the size of complementarities, it is enough (under someconditions) to work with the herfindahls of the economy. One does not need to know the detailsof the input output matrix. When we use the empirical values for the value added to sales ratio b,we find that the complementarities generated by demand linkages indeed generate a large enoughcomovement across firms. We conclude that our “granular” hypothesis, when augmented by theLong Plosser model, generates both plausible aggregate fluctuations and comovements betweenfirms.16Susanto Basu kindly provided this number.
14

5.2 Long Plosser demand linkages create perfect correlation in employment
A prominent feature of business cycles is the large comovement of employment across sector. Ina granular world, productivity shocks are specific to a firm. Indeed, so one could think that insuch a world, a successful firm gains employment at the expense of unsuccessful firms. We showthat, in an instantaneous Long Plosser world at least, this is not the case. In fact, even thoughthe primitive productivity shocks are perfectly uncorrelated across firms, the employment shocksare perfectly correlated17.
Proposition 5 Consider the above Long-Plosser economy, and make labor supply elastic. Callψ the elasticity of labor supply, and say that the utility is:
U = exp
"NXi=1
θi lnCi
#− L1+1/ψ (28)
Then, if firm i has productivity shock bλi, TFP growth is:bλ =X
i
γibλi (29)
where γi =Sales of firms i / GDP. GDP growth is:
bY =1 + ψ
1 + αψbλ. (30)
Employment growth in firm i is: bLi =1
α+ 1/ψbλ (31)
where 1−α is the labor share of value added. So even though the primitive productivity shocks bλiare perfectly uncorrelated across firms, the employment shocks bLi are perfectly correlated acrossfirms.
Hats mean proportional changes, e.g.. bλ = dλ/λ.Proof. The proof is very simple. Because of the Cobb-Douglas consumption and production
structure, labor shares are constant. If total labor supply is Lt, labor employed by sector i isLit = bγiLt. There is perfect comovement of employment across firms We have bLit = bLt.
We next derive the expression of fluctuations in aggregate employment L. The productionfunction is CRS in (K,L), and so create an amount of the final consumption good equal to:BKαL1−α. When firm i has productivity λi = eπi , the above derivations show that GDP is:
Y = AλKαL1−α (32)
for some constant A and λ = exp (P
i γi lnλi). Optimal labor supply L maximizes AλKαL1−α−
L1+1/ψ, and so is: L = [(1− α)AλKα]1/(α+1/ψ). Taking logs and differentiating, this yieldsbL = 1α+1/ψ
bλ. Finally, taking the log of (32) and differentiating gives:bY = bλ+ (1− α) bL = µ1 + 1− α
α+ 1/ψ
¶bλ = 1 + ψ
1 + αψbπ (33)
17 I thank Robert Hall for prompting me to address this question.
15

As is known, a non-zero elasticity of labor supply ψ increases the impact of productivity growthon GDP to more than more for one.
Proposition 5 shows that that Long Plosser demand linkages generate perfect comovement ofemployment across firms. This is due to the Cobb-Douglas nature of the utility and productionfunctions. The lesson for more general models is that demand linkages easily generate largecomovements in employment.
6 Evidence on scalings and distributions
This section examines Proposition 2’s predictions for the scaling of country level and firm levelquantities. The reader may skip this section in the first reading.
6.1 Scaling of firm-level volatility
Here we summarize some evidence for the scaling of the growth rate of firms (9) and the scalingof GDP growth (13). It has been discussed in a series of papers by Stanley et al. (1996), Amaralet al. (1997), Canning et al. (1998) and Lee et al. (1998). In a nutshell, firms and countries haveidentical, non-trivial, scaling of growth rates. Stanley et al. (1996) and Amaral et al. (1997)study how the volatility of the growth rate of firms changes with size18 S . To do this, onedivides the firms in a number of bins of sizes S, calculate the standard deviation of the growthrate of their sales σ (S), and plots lnσ (S) vs lnS. One finds a roughly affine shape, displayedin Figure 3:
lnσfirms (S) = −α lnS + β. (34)
Exponentiation gives (9). A firm of size S has volatility proportional to S−α with α = 0.15.This means that large firms have a smaller proportional standard deviation than small firms,but this diversification effect is weaker than would happen if a firm of size S was composed ofS independent units of size 1, which would predict α = 1/2.
Canning et al. (1999) do the same analyses for country growth rates and find19 that countrieswith a GDP of size S also have a volatility of size S−α
0, with α0 = 0.15. The two graphs are
plotted in Figure 3. The slopes are indeed very similar, and statistical tests reported in Canninget al. (1998) say that one cannot reject the null that α = α0. This is particularly interestingin light of Proposition 3 and Corollary 4, which say that this should be the case if Zipf’s lawholds20.
One important caveat is in order. The above estimate of α, the scaling exponent of firms,is likely biased upwards. The reason is that it is estimated only with firms in Compustat, i.e.listed in the stock market. For a given size, a firm that is highly volatile is more likely to be inCompustat than a less volatile firm. This effect is weaker for big firms. This implies that thevalue of α measured in a sample composed only of firms in Compustat is likely to be larger thanthe true empirical value. So, the empirical value we find is more likely to be an upper bound on
18The measure of size can be assets, sales, or number of employees. Those three measures give similar results.19Another way to see their result is to regress:
lnσi = −α lnYi + β lnGDP/Capita+γOpenness
+δGvt share of GDP+constant
where σi is the standard deviation of lnYit/Yit−1 and Yi the mean of the Yit.We run this over the top 90% of thecountries to avoid the tiniest countries, and find that α = .15 with a standard deviation of .015.20Acemoglu and Zilibotti (1997) propose a different mechanism by which large countries are more diversified
and have a smaller volatility.
16

Figure 3: Standard deviation of the distribution of annual growth rates (log log axes). Note thatσ (S) decays with size S with the same exponent for both countries and firms, as σ (S) ∼ S−α,with α = .15. The size is measured in sales for the companies (top axis) and in GDP for thecountries (bottom axis). The firm data are taken from the Compustat from 1974, the GDP datafrom Summers and Heston (1991). Source: Lee et al. (1998).
the true α rather than the true value. The best way to estimate the true value of α would beto run a regression (34) on a sample that includes all firms, not just firms listed in Compustat(Census data, for example lists more firms). It is possible, indeed, that the best value is α = 0,as random growth models have long postulated. More research is needed to assess this.
6.2 The distribution of fluctuations in firms and GDP growth
This section examines the prediction of Proposition 3 for the distribution of fluctuations in firmsand GDP.
6.2.1 Fluctuations without border effects: Empirical evidence on a Lévy distribu-tion of firms’ fluctuations
One can reinterpret Proposition 3 by interpreting a large “firm” as a “country” made up ofsmaller entities. If those entities follow a power law distribution, then Proposition 3 appliesand predicts that the fluctuations of the growth rate ∆ lnSit, once rescaled by S−αit , followsa Levy distribution with exponent min {ζ/ (1− α) , 2}. Amaral et al. (1997) and Canning etal. (1998) plot this empirical distribution, and we reproduce their finding in Figure 4. Wenext compare this graph to Proposition 3’s prediction — a symmetrical Lévy distribution with
17

exponent 1/ (1− α) and α = 0.15. Figure 5 draws this distribution (ln p(x) vs x).We see thatthe shapes are both much fatter than a Gaussian.
We now investigate the best fist, assuming that the growth rate follows a symmetrical Lévydistribution with exponent β. The Gaussian benchmark corresponds to β = 2. Calling git thegrowth rate of firm i in year t, we transform γit = Atgit+Bt such that for all t’s, E [γit] = 0 andMedian(|γit|) = 1. We plot the distribution of γit, which is strikingly close to a Lévy withexponent 1/ (1− α). There are some deviations, for very large |γ|. Hypothesizing that for|γit| ≤ γ, γit follows a Lévy with exponent β, we estimate β by maximum likelihood. We takeγ = 10. As P (|γit| ≤ γ) = 0.99 empirically, this means that we fit the 99% of the points. Wedo this for each year separately, which give us a series of β’s. We find:
Mean of β = 1.28
Standard deviation of βt = 0.11
σ (β) /(Number of years)1/2 = 0.016.
Empirically, we conclude that β = 1.28 with a standard deviation of 0.016. The predictionis 1/ (1− α) = 1.18 for α = 0.15. Thus, the empirical data is fairly close to the theoreticalprediction.
Figure 4: Empirical distribution of the fluctuation of firm sizes. The shape is very similar tothat of the Levy distribution predicted by the model (see Figure 5 below). Source: Amaral etal. (1997).
6.2.2 Fluctuations with border effects: Distribution of GDP growth
The above theory needs to be amended slightly for GDP, because typically the largest firm in acountry only accounts for a small fraction (say couple of percentage points) of a country’s GDP.We speculate that this is because of antitrust concerns.
We now modify the analysis to incorporate this fact. The payoff will be a better predictionof the shape of GDP fluctuations. We adopt the following representation. If we have a countrywith N firms, the size of firms Si are drawn from a power law with exponent ζ = 1 + ε, butwith bounded support [1,mN ] . The density is assumed to be a power law with an exponent ζ
18

-6 -4 -2 2 4 6
-4
-3
-2
-1
lnHProbability L
Figure 5: Log of a symmetrical Levy distribution with an exponent of 1/ (1− α), with α = 0.15.
in [1,mN ], i.e.:
f (S) =ζ
1− (mN)−ζS−ζ−1.
The total size is Y =PN
i=1 Si. We can also establish the distribution of the fluctuations inY .
Proposition 6 If the subcomponents cannot have a size bigger than mN , for some finite m, wehave, given the standard deviation σi of a country, that the fluctuations are normal
∆Y
Y=d Y −αu
where u is a normal variable. In particular, if m < ∞, all moments are finite. Given only thesize Y of the country, the fluctuations have the density:
fm,α (g) =
Z ∞
0e−ψm,2−2α(k2/2) cos (kg)
dk
π(35)
and all the moments are finite. We call this distribution a “modified Levy distribution”. In thelimit m → ∞, this distribution tends to a symmetrical Lévy distribution with an exponent of1/ (1− α) . In the limit m→ 0, this distribution tends to a Gaussian.
The proof is in Appendix D.
We find a new “universal” distribution that does not depend on the details of the shocks tothe individual firms. This is analogous to the fact that in the central limit theorem the limitingdistribution does not depend on the details of the distribution of the initial shocks.
We make a few observations on our modified Levy distribution. When m → ∞, there areno restrictions on the support of the subunits, and we get the the Lévy 1/ (1− α) distributionpredicted by Proposition 3. When m → 0, even the largest firms are small (they are boundedabove by mY/E [S]). Since the total variance is the sum of lots of small variances, the centrallimit theorem applies, and hence the fluctuations are Gaussian. The proof shows that their orderof magnitude is m1/2−α.
The empirical distribution is plotted in Figure 6. Figure 7 shows the corresponding theo-retical plot for the distribution of growth rates. We see that the two distributions are quiteclose.
19

Figure 6: Empirical distribution of GDP fluctuations. Source: Canning et al. (1998)
-4 -2 2 4
-7
-6
-5
-4
-3
-2
-1
ln Probability
Figure 7: ln(Probability of a growth rate g) vs g under the null of the modified Lévy distributionpredicted by the model (with parameters 2− 2α = 1.7 and m = 1).
20

7 Conclusion
There are clearly “macroeconomic” shocks: monetary policy shocks, policy shocks, trade (e.g.exchange rate) shocks, and possibly aggregate productivity shocks. However, is it possible that,though they are the most visible ones, they are not the major contributors to GDP fluctua-tions. The present paper lays down the theoretical possibility that idiosyncratic shocks are animportant, and possibly the major, part of the origins of business cycle fluctuations.
It may be worthwhile to contemplate the possible consequences of the hypothesis that idio-syncratic shocks to large firms are an important determinant of the volatility of aggregate quan-tities.
First, one may understand the origins of fluctuations better: they do not come from mysteri-ous “aggregate productivity shocks,” but from concretely observable shocks to the large players,such as Wal-Mart, Intel, and Nokia.
Second, these shocks to large firms, initially independent of the rest of the economy, offera rich source of shocks for VARs and impulse response studies — the real-side equivalent of the“Romer and Romer” shocks for monetary economics. For instance, a strike, or the tenure of anew CEO could be a source of for a macroeconomic shocks plausibly independent from the restof the economy.
Third, this gives a new theoretical angle for the propagation of fluctuations: For instance, ifWal-Mart innovates, its competitors may suffer in the short term, but then scramble to catch-up. This creates rich industry-level dynamics (that are already actively studied in IO) shouldbe very useful for studying macroeconomic fluctuations, since they allow to trace the dynamicsof productivity shocks.
Fourth, this could explain the reason why people, in practice, do not know “the state of theeconomy” — i.e. the level of productivity, in the RBC language. In our view, this is because“the state of the economy” depends on the behavior (productivity and investment behavior,among others) of many large firms. So the integration is not easy, and no readily accessiblesingle number can summarize this state. This could offer a new and relevant mechanism for thedynamics of “animal spirits”.
Finally this mechanism might explain a large part of the volatility of many aggregate quan-tities such as inventories, inflation, short or long run movements in productivity, and the currentaccount. The latter is explored in Canals et al. (2004).
21

8 Appendix A: A simple model illustrating the “islands” econ-omy
The paper presents a mechanism that emerges from a variety of economic structures. Here wepresent one possible type of model that generates the mechanism. Markets are competitive.Firm i has a capital Kit. It invests in a technology with random productivity Ait such thatE [Ait] is constant across i’s and
σ (Ait) = bK−αti . (36)
A variety of mechanisms (e.g. Amaral et al. (1998), Sutton (2001)) can generate the microeco-nomic scaling presented in equation (36). These mechanisms typically assume that firms of sizeS are made up of N smaller units, with N ∼ Sα/2, which generates (9) and (36). Capital isfully reinvested, so that:
Ki,t+1 = Ai,t+1Kt. (37)
GDP is simply Yt =Xi
Ai,tKt−1.
Adding labor does not change the conclusion of this paper. Suppose that the productionfunction is Ai,tF (Kti, Lti), with constant returns to scale. Risk neutral firms maximize
maxLit
E [Ait]F (Kti, Lti)− wtLti.
The quantity of labor chosen Lti is Lit = λtKit, for a factor of proportionality λ, so that:
Ki,t+1 = Ai,t+1F (Kit, λtKit)− wtλtKit = (Ai,t+1F (1, λt)−wtλt)Kit.
The equation of motion follows the same structure as (37), with random productivity:
A0it = Ai,t+1F (1, λt)− wtλt.
GDP is Yt =Xi
Ai,tKt−1F (1, λt−1) and evolves as the stochastic sum in the paper.
Random growth theories (see Gabaix 1999, Luttmer 2004 and the survey in Gabaix andIoannides 2004) propose further microfoundations for such a process, derive how it converges toa power law distribution, and work out the conditions under which it leads to Zipf’s law.
9 Appendix B: Evidence on firm-level volatility
9.1 Idiosyncratic volatility is very large
Our data on idiosyncratic volatility come from Compustat. For large firms it is likely thatCompustat is very representative, as it includes most of these firms. For small firms, Compustatmay not be fully representative, just like the stock market may not represent all firms21. It isstill the best dataset we have so far. Future studies using Census data will give us much betterestimates.
As firms can die, some choices have to be made on which firms are included in the sample.Luckily, various specifications give very similar results. The simplest exercise is to follow a seta firms for an extended amount of time. To have good statistics, we need many firms, and thus
21 Indeed this “selection bias” creates an upward bias in the measurement of α in the microeconomic scalinglaw (9).
22

fairly recent data as the Compustat coverage has been growing. Thus, we use all firms for allyears from 1980 to 2002. The results do not depend at all on the starting year,1980. Yet, a muchearlier starting date would yield too few firms while a much later one would yield too few years.We remove foreign firms and we use reports on sales (data12: sales(net) in MM$). Alternativemeasures give similar results, as indeed they are proportional in the medium run. We deflatesales using BEA Implicit Price Deflators for Gross Domestic Product (year 2000=100). Thuswe have observations from 6155 firms (21016 if we don’t remove firms absent in 1980) from 1980to 2002. This adds up to 76926 (186075 if we don’t remove firms absent in 1980) data-points(year-firm) on sales, and 69743 (159660 if we don’t remove firms absent in 1980) data-points(year-firm) on the growth rate git = ln (Sit/Sit−1).
The raw standard deviation of the git is 0.442. This means that the standard deviation of thesales of firms in Compustat is 44.2% a year — a very high number. This number is a bit smallerfor large firms, according to (9). The average standard deviation is a very similar number, 0.462.
Simple standard deviation stddev (git) = 0.442
Average standard deviationqE£σ2i¤= 0.462
Absolute deviation absdevtot = E [|git −E [git]|] = 0.204Interquartile range IQRtot (git) = 0.193
Table: Statistics on the dispersion of growth rates git = ln (Sit/Sit−1), where Sit are the sales offirm i at time t.
As firms’ growth rates have fat tails, the variance might not be a very robust estimator.We look at two robust estimators of deviation. The interquartile range is the value of the 75%percentile minus the 25% percentile of growth rates. It is equal to 0.193. For a Gaussian withstandard deviation σ, the interquartile range is 0.675σ, so if the distribution was Gaussian wewould infer a standard deviation 0.193/0.675= 0.285. Again, this is a very high dispersion. Ourlast measure of dispersion is the absolute deviation, which gives 0.204. If the distribution isGaussian, we would infer a standard deviation of 0.203
pπ/2 = 0.254. As the distribution has
tails fatter than a Gaussian, the true standard deviation is higher than those last two values.We conclude from this analysis that indeed, the typical standard deviation of the growth
rate of firm in Compustat is very high, with a point estimate of 0.44% per year, which is robustto a variety of other measures of dispersion.
It is clear that this must be accounted for by idiosyncratic shocks, as the standard deviationof macroeconomic quantities such as GDP growth is much lower. To verify this formally, we runthe following regression with fixed effects and AR(1) noise:
git = αi + ft + εit
εit = γεit−1 + uit
where uit is i.i.d. with mean zero. We find a standard deviation
σ (ft) = 0.044
σ (εit) = 0.400
σ (git − αi) = 0.402.
Hence aggregate shocks account for only 1.25% (= σ (ft)2 /σ (git − αi)
2) of the variance of firmgrowth rate. Likewise, the correlation of the growth rate between two random firms is only0.012.
23

9.2 Firm-level scaling
The scaling law says that the growth rate of a firm of size S, in a year t, has a standard deviation:
σ (S, t) = standard deviation (lnSt+1 − lnSt | St = S) = btS−αt . (38)
Amaral et al. (1997) present evidence for the scaling law for a particular year t. Here weextend their empirical analysis.
We first proceed with size as a measure of sales. We estimate αt for each year and plot in theresulting values of αt in Figure 8. We show here that αt has remained fairly constant throughoutthe years. Its mean value is 0.188.
Alp
ha
Alpha for sales (standard deviation)year
Alpha 95% confidence interval
1950 1955 1960 1965 1970 1975 1980 1985 1990 1995
.188
0
.1
.2
.3
.4
Figure 8: Time series of the scaling exponent αt for the growth of sales. For each year t weestimate the scaling exponent αt such that σ (gt | St = S) ∼ S−αt .
Interestingly, the coefficient bt has increased over the time.
10 Appendix C: Lévy’s theorem
The basic theorem can be found in most probability textbooks, e.g. Durrett (1996, p.153).
Theorem 7 Suppose that x1, x2, ... are i.i.d. with a distribution that satisfies:(i) limx→∞ P (x1 > x) /P (|x1| > x) = θ ∈ [0, 1](ii) P (|x1| > x) = x−ζL (x)with ζ ∈ (0, 2) and L (x) slowly varying22. Let sn =
Pni=1 xi, and
an = inf {x : P (|x1| > x) ≤ 1/n} and bn = nE£x11|x1|≤an
¤22L (x) is said to be slowly varying (e.g. Embrechts et al. 1997, p.564) if
limx→∞
L (tx) /L (x) = 1 for all t > 0.
Prototypical examples are L = a and L (x) = a lnx for a non-zero constant a.
24

As n→∞, (sn − bn) /an →d Y where Y is a Lévy distribution with exponent ζ.
In practice, for a power law distribution P (x1 > x) = (x/x0)−ζ , an = x0n
−1/ζ .A symmetrical Lévy distribution with exponent ζ ∈ (0, 2] has the distribution λ (x, ζ) =
1π
R∞0 e−k
ζcos (kx) dk and the cumulative Λ (x, ζ) = 1
2 +1π
R∞0 e−k
ζ sin(kx)k dk.
For ζ = 2, a Levy distribution is a Gaussian. For ζ < 2, the distribution has power law tailwith exponent ζ. Unfortunately, there are no closed form formulae for λ and Λ except in thecase ζ = 1 (Cauchy distribution) and ζ = 2 (Gaussian distribution).
11 Appendix D: Longer derivations
11.1 Proof of Proposition 1
Because of σGDP = σh, we examine h.
N1/2h =
³N−1PN
i=1 S2i
´1/2N−1PN
i=1 Si
The law of large numbers ensures that N−1PNi=1 S
2i →a.s. E
£S2¤, and N−1PN
i=1 Si →a.s. E [S].
This yields: N1/2h→a.s. E£S2¤1/2
/E [S] .
11.2 Proof of Proposition 2
Because of σGDP = σh, we examine h.
h =
³PNi=1 S
2i
´1/2PN
i=1 Si(39)
We treat the cases where ζ > 1 and ζ = 1 separately.When 1 < ζ ≤ 2. By the law of large numbers,
N−1NXi=1
Si → E [S] .
However, S2i has power law exponent ζ/2 ≤ 1, as shown by:
P¡S2 > x
¢= P
³S > x1/2
´= a
³x1/2
´−ζ= ax−ζ/2.
So to handle the numerator of (39), we use Lévy’s Theorem from Appendix C. This implies:
N−2/ζNXi=1
S2i → u
where u is a Levy distributed random variable with exponent ζ/2. So
N1−1/ζh =
³N−2/ζPN
i=1 S2i
´1/2N−1PN
i=1 Si→d u1/2
E [S].
25

When ζ = 1. Some more care is required, because E [S] = ∞. We use Theorem 7, whichgives bn = n lnn, hence:
N−1Ã
NXi=1
Si −N lnN
!→d g
where g is a Levy with exponent 1. We conclude lnN · h→d u1/2/g.
11.3 Proof of Proposition 3
As ∆Si/Si = S−αi ui:∆Yt+1Yt
=
PNi=1∆SitYt
=
PNi=1 S
1−αi uitPN
i=1 Si. (40)
By the law of large numbers:
N−1Yt = N−1NXi=1
Si → S.
To tackle the numerator, we observe that S1−αi has power law tails with exponent ζ 0 =ζ/ (1− α). We need to consider two cases.
If ζ 0 < 2, xi = S1−αi ui, which has power law tails with exponent ζ 0, and by Levy’s theorem:
N−1/ζ0∆Yt = N−1/ζ0NXi=1
S1−αi uit →d g
where g is a Levy with exponent ζ 0.If ζ 0 ≥ 2, S1−αi ui has finite variance, and N−1/2∆Yt →d g, where g is a Gaussian.We conclude that in both cases:
N−max(1/2,1/ζ0)∆Yt →d g
for a distribution g. So
N1−max(1/2,1/ζ0)∆Yt+1Yt
→d g
Sg.
We conclude that the Proposition holds, with
α0 = 1−max¡1/2, 1/ζ 0
¢= 1 +min
¡−1/2,−1/ζ 0
¢= min
¡1/2, 1− 1/ζ 0
¢= min
µ1/2, 1− 1− α
ζ
¶.
11.4 Proof of Proposition 6
We start by stating:
Proposition 8 If the subcomponents cannot have a size bigger than mN , for some finite m,the variance of Y scales as:
σ2Y ∼ Y −2αV
where V is a random variable whose Laplace transform is:
LV (k) := Ehe−kV
i= e−ψm,2−2α(k)
where ψ (k) is defined in (44). In the limit m → ∞, V is a totally positive Lévy distributionwith exponent 1/ (2− 2α) .
26

In particular, all the moments are finite. Indeed, one can easily calculate the cumulants ofV (the κi such that − lnLV (k) =
Pκik
i/i!) and find:
κi (V ) =mγi−1
γi− 1 .
Recall that the 4 first cumulants (κi)i=1...4 are respectively hV i , varV ,D(V − hV i)3
E, andD
(V − hV i)4E− 3varV ; i.e. the mean, variance, skewness and excess kurtosis. We proceed
to the proof. We define:
VN :=1
N2−2α
NXi=1
S2−2αi
where Si is drawn from the above distribution. We study VN in the limit of large N 0s. Weknow from the analysis above, that for m =∞, VN tends to a Lévy distribution with exponent1/ (2− 2α).We study its behavior for m <∞. The tool of choice is the Laplace transform (usingζ = 1 + ε ' 1)
LVN (k) : = Ehe−kVN
i= E
"exp
−kN2−2α
NXi=1
S2−2αi
#
= E
∙exp−kNγ
Sγi
¸Nwith γ = 2− 2α. (41)
Now
H : = E
∙exp−kNγ
Sγi
¸=
Z mN
1
ζ
1− (mN)−ζS−ζ−1 exp
µ−kNγ
Sγi
¶dS
=1
1− (mN)−1
Z mN
1exp
µ−kNγ
Sγi
¶dS
S2
=1
1− (mN)−1N−1
Z mγ
N−γ
exp (−kt)γt1+1/γ
dt by the change in variables S = Nt1/γ .
As N →∞, H ∼ N−1 Rmγ
N−γdt
γt1+1/γ∼ 1. So we use (verifying that H (k = 0) = 1)
H − 1 = N−1Z mγ
N−γ
exp (−kt)− 1γt1+1/γ
dt+ o
µ1
N
¶= − 1
Nψ (k) + o
µ1
N
¶(42)
with the new function:
ψm,γ (k) :=
Z mγ
0
1− exp (−kt)γt1+1/γ
dt (43)
which has a closed form in terms of the incomplete Gamma function Γ (a, z) =R z0 e
−tta−1dt:
ψm,γ (k) = −k1/γ
γΓ
µ−1γ, k mγ
¶−m. (44)
27

Finally, Eqs (41) and (42) give, in the limit of large N ’s:
lnLVN (k) = N lnH = N ln
µ1− 1
Nψ (k) + o
µ1
N
¶¶= −ψ (k) + o (1) .
Thus VN converges in distribution to a well-defined random variable V , whose Laplace transformis: LV (k) = e−ψ(k).
We can also establish the distribution of the fluctuations in Y . ∆YY =d Y −αV 1/2u from
above. Thus the Fourier transform of the GDP growth is:
F (k) = Ehe−ikV
1/2ui= E
he−k
2V /2i= e−ψ(k
2/2)
so taking the inverse Fourier transform we get (35).When m→∞,
ψm,γ=2−2α¡k2/2
¢→Z ∞
0
1− exp¡−k2/2t
¢γt1+1/γ
dt =k2/γΓ (−1/γ)
21/γγ= bk1/(1−α)
for some b. The characteristic function is that of a symmetric Lévy distribution.When m→ 0,
ψm,γ (k) =
Z mγ
0
1− exp (−kt)γt1+1/γ
dt ∼Z mγ
0
kt
γt1+1/γdt =
mγ−1
γ − 1k =m1−2α
1− 2αk
so that ψm,γ
¡k2/2
¢∼ m1−2α
1−2α k2/2, which shows that ∆Y/Y³m1−2α
1−2α
´−1/2tends to a standard
Gaussian distribution.
12 Appendix E: Hulten’s theorem with and without instanta-neous reallocation of factors
For clarity, we rederive and extend Hulten (1978)’s result, which says that a Hicks-neutralproductivity shock dπi to firm i causes an increase in GDP equal to:
GDP growth =Xi
Sales of firm i
GDPdπi.
There are N firms. Firm i produces good i, and uses a quantity Xij is intermediary inputsfrom firm j. It also uses Li units of labor, Ki units of capital. It has productivity πi. Ifproduction is: Qi = eπiF i (Xi1, ...,XiN , Li,Ki). The representative agent consumer Ci of goodi, and has a utility function is U (C1, ..., CN ). Production of firm i serves as consumption, andintermediary inputs, so: Qi = Ci +
PkXki. The optimum in this economy reads:
maxCi,Xik,Li,Ki
U (C1, ..., CN ) s.t.
Ci +Xk
Xki = eπiF i (Xi1, ...,XiN , Li,Ki) ;Xi
Li = L;Xi
Ki = K
The Lagrangian is:
W = U (C1, ..., CN ) +Xi
pi
"eπiF i (Xi1, ...,XiN , Li,Ki)− Ci −
Xk
Xki
#
+w
"L−
Xi
Li
#+ r
"K −
Xi
Ki
#.
28

Assume marginal cost pricing23. GDP is this economy is Y = wL+ rK =P
i piCi. The valueadded of firm i is wLi + rKi, and its sales are piQi.
If each firm i has a shock dπi to productivity, we differentiate the expression of W to findGDP growth:
dW
W=1
W
Xi
pi£eπiGi (Xi1, ...,XiN , Li,Ki) dπi
¤=Xi
Sales of firm i
GDPdπi,
which is Eq. 14.The above analysis shows that Hulten’s theorem holds even if, after the shock, the capital,
labor, and material inputs are not reallocated. This is a simple consequence of the envelope’stheorem. Hence Hulten’s result holds also if there are frictions to adjust labor, capital, orintermediate inputs.
23Basu and Fernald (2001) provide an analysis with imperfect competition.
29

References
[1] Abramowitz, Moses (1956) “Resource and Output Trends in the United States since 1870.”American Economic Review, 46: 5-23.
[2] Acemoglu, Daron, Simon Johnson, and Todd Mitton (2004) “Reassessing Entry Barriers”,mimeo.
[3] Acemoglu, Daron, and Fabrizio Zilibotti, “Was Prometheus Unbound by Chance? Risk,Diversification and Growth”, August 1997, Journal of Political Economy, volume 105, pp.709-751.
[4] Amaral, L. A. N. , S. V. Buldyrev, S. Havlin, H. Leschhorn, P. Maass, M. A. Salinger, H.E. Stanley, and M. H. R. Stanley, “Scaling behavior in economics: I. Empirical results forcompany growth”, J. Phys. (France) I 7, 621-633 (1997).
[5] Axtell, Robert (2001) “Zipf distribution of U.S. firm sizes”, Science 293, p.1818-20.
[6] Bak, P., K. Chen, José Scheinkman and M. Woodford (1993) “Aggregate Fluctuationsfrom Independent Sectoral Shocks: Self-Organized Criticality in a Model of Productionand Inventory Dynamics”, Ricerche Economiche, 47, p.3-30.
[7] Barabási, A.-L. and R. Albert, “Emergence of Scaling in Random Networks” Science 286,509-12 (1999)
[8] Basu, Susanto and Fernald, John, (1997). "Returns to Scale in U.S. Production: Estimatesand Implications," Journal of Political Economy, Vol. 105 (2) pp. 249-83.
[9] Basu, Susanto and John Fernald (2001) “Why is Productivity Procyclical? Why Do WeCare?” In Charles R. Hulten, Edwin R. Dean and Michael J. Harper, eds., New Develop-ments in Productivity Analysis, Chicago: University of Chicago Press, 2001.
[10] Basu, Susanto, John Fernald and Miles Kimball (2004) “Are Technology ImprovementsContractionary?”, NBER WP 10592.
[11] Baumol, William J, 1982. “Contestable Markets: An Uprising in the Theory of IndustryStructure,” American Economic Review, vol. 72(1), pages 1-15
[12] Bertrand, Marianne and Antoinette Schoar “Managing with Style: The Effect of Managerson Firm Policies,” The Quarterly Journal of Economics, November 2003.
[13] Blanchard, Olivier and Simon Johnson (2001) “The Long and Large Decline in U.S. OutputVolatility” Brookings Papers on Economic Activity.
[14] Buldyrev, S. V. , L. A. N. Amaral, S. Havlin, H. Leschhorn, P. Maass, M. A. Salinger, H.E. Stanley, and M. H. R. Stanley “Scaling behavior in economics: II. Modeling of companygrowth”, J. Phys. (France) I 7, 635-650 (1997).
[15] Caballero, Ricardo and Eduardo M.R.A. Engel, “Adjustment is Much Slower than YouThink” (2004), NBER WP.
[16] Caballero, Ricardo, Eduardo M.R.A. Engel, and John C. Haltiwanger, “Aggregate Employ-ment Dynamics: Building from Microeconomic Evidence”, American Economic Review, 87(1), March 1997, 115—137.
30

[17] Canals, Claudia, Xavier Gabaix, Josep Vilarrubia, David Weinstein (2004), “Can macro-economics explain trade balance fluctuations?”, Columbia and MIT mimeo.
[18] Canning, D. , L. A. N. Amaral, Y. Lee, M. Meyer, and H. E. Stanley (1998), “Scaling thevolatility of GDP growth rates”, Economics Letters 60, 335-341.
[19] Chaney, Thomas (2004) “Distorted gravity: heterogeneous firms, market structure and thegeography of international trade”, MIT working paper.
[20] Chaney, Thomas; Gabaix, Xavier and Philippon, Thomas. “The evolution of microeconomicand macroeconomic volatility,” Mimeo, MIT, 2003.
[21] Cochrane, John “Shocks”, Carnegie-Rochester Conference Series on Public Policy, vol. 41,(1994), pp. 295-364.
[22] Comin, Diego, and Mulani (2003). “Diverging Trends in Macro and Micro Volatility: Facts,”NYU mimeo.
[23] Conley, Timothy and Bill Dupor “A spatial analysis of sectoral complementarity”, Journalof Political Economy, vol. 111(2), p.311-52.
[24] Davis, Steven, John C. Haltiwanger, and Scott Schuh (1996) “Job Creation and Destruc-tion”, MIT Press.
[25] Dupor, William, “Aggregation and irrelevance in multi-sector models”, Journal of MonetaryEconomics 43 (1999) 391—409
[26] Durlauf, Steven (1993) “Non ergodic economic growth”, Review of Economic Studies, vol.60(2), p.349-66.
[27] Eaton, Jonathan, Samuel Kortum and Francis Kramarz “Dissecting Trade: Firms, Indus-tries, and Export Destinations”, American Economic Review Papers and Proceedings, 94,2004, 150-154.
[28] Gabaix, Xavier (1999) “Zipf’s law for cities: An explanation”, Quarterly Journal of Eco-nomics 114 (3), August 1999, pp.739-67.
[29] Gabaix, Xavier, Parameswaran Gopikrishnan, Vasiliki Plerou and H. Eugene Stanley, “Atheory of power law distributions in financial market fluctuations,” Nature, 423 (2003),267—230.
[30] Gabaix, Xavier, Parameswaran Gopikrishnan, Vasiliki Plerou and H. Eugene Stanley, “Atheory of large fluctuations in stock market activity,” (2004) mimeo.
[31] Gabaix, Xavier and Yannis Ioannides, “The evolution of the city size distributions”, inHandbook of Urban and Regional Economics, 4 (2004) V. Henderson and J.-F. Thisse eds.,Chapter 53, p. 2341-2378.
[32] Gibrat, R., Les inégalités économiques, (Paris, France: Librairie du Recueil Sirey, 1931).
[33] Harberger, A.,“A vision of the growth process”. The American Economic Review, Vol. 88,No. 1. (Mar., 1998), pp. 1-32.
31

[34] Head, A.C., 1995. “Country size, aggregate fluctuations, and international risk sharing”.Canadian Journal of Economics 28 (4b), 1096—1119.
[35] Horvath, M.T.K., 1998. “Cyclicality and sectoral linkages: aggregate fluctuations fromsectoral shocks”. Review of Economic Dynamics 1, 781-808.
[36] Horvath, Michael “Sectoral shocks and aggregate fluctuations” 2000, Journal of MonetaryEconomics Vol. 45 (1) pp. 69-106.
[37] Horvath, M.T.K., Verbrugge, R.J., 1999. Shocks and sectoral interactions: an empiricalinvestigation. Manuscript, Stanford University.
[38] Hulten, Charles(1978) “Growth accounting with intermediary inputs”, vol. 45(3) Review ofEconomic Studies, p.511-18..
[39] Ijiri, Y. and Simon, H., Skew distributions and the sizes of business firms, (Amsterdam,Netherlands: North-Holland, 1977).
[40] Jones, Charles I (2004). “The Shape of Production Functions and the Direction of TechnicalChange”, Berkeley mimeo.
[41] Jorgenson, Dale W., Frank M. Gollop and Barbara M. Fraumeni (1987) “Productivity andU.S. Economic Growth” Harvard University Press, Cambridge, MA.
[42] Jovanovic, B. (1987) “Micro Shocks and Aggregate Risk,” Quarterly Journal of Economics,102, 395-409.
[43] Kim, C.-J. and C.R. Nelson (1999), “Has the U.S. Economy Become More Stable? ABayesian Approach Based on a Markov-Switching Model of the Business Cycle,” The Reviewof Economics and Statistics 81, 608 — 616.
[44] Klette, Tor Jakob and Zvi Griliches “Empirical Patterns of Firm Growth and R&D Invest-ment: A Quality Ladder Model Interpretation”, NBER 6753.
[45] Kray, Aart and Jaume Ventura (2001) “Comparative advantage and the cross-section ofbusiness cycles”, NBER WP 8104.
[46] Lamont, Owen, “Cash Flow and Investment:Evidence from Internal Capital Market,” Jour-nal of Finance, 52, 83-109, 1997
[47] Lee, Y. , L. A. N. Amaral, M. Meyer, D. Canning, and H. E. Stanley, “Universal featuresin the growth dynamics of complex organizations”, Phys. Rev. Lett. 81, 3275-3278 (1998).
[48] Long, John and Plosser, Charles “Real Business Cycles”, Journal of Political Economy,1983, p.49—69.
[49] Luttmer, Erzo G.J. (2004) “The Size Distribution of Firms in an Economy with Fixed andEntry Costs”, Minneapolis Federal Reserve Bank WP.
[50] McConnell, M.M and G. Perez-Quiros, (2000), “Output Fluctuations in the United States:What has Changed Since the Early 1980’s” American Economic Review, Vol. 90, No. 5,1464-1476.
32

[51] McKinsey Global Institute (2001), “Productivity in the United States”, October.http://www.mckinsey.com/knowledge/mgi/reports/productivity.asp.
[52] Long, John and Charles Plosser (1983), “Real business cycles”, Journal of Political Economy91, 1(Feb.), 39-69.
[53] Nirei, Makoto (2005). “Threshold Behavior and Aggregate Critical Fluctuations”, forth.,Journal of Economic Theory.
[54] Okuyama, K., M. Takayasu and Hideki Takayasu, “Zipf’s Law in Income Distribution ofCompanies,” Physica A, 269 (1999), 125-131.
[55] Pareto, V., Cours d’Economie Politique, (Geneva, Switzerland: Droz, 1896).
[56] Philippon, Thomas “Corporate Governance and Aggregate Volatility” (2002), NYU mimeo.
[57] Scharfstein, David S., “The Dark Side of Internal Capital Markets II: Evidence from Diver-sified Conglomerates”
[58] Shea, John (2002) “Complementarities and Comovements”, Journal of Money, Credit andBanking, vol. 42(2), p. 412—433.
[59] Shin, Hyun-Han and René Stulz, “Are Internal Capital Markets Efficient?” Quarterly Jour-nal of Economics, 113, 531-553, 1998.
[60] Stanley, M. H. R. , L. A. N. Amaral, S. V. Buldyrev, S. Havlin, H. Leschhorn, P. Maass,M. A. Salinger, and H. E. Stanley, “Scaling behaviour in the growth of companies”, Nature379, 804-806 (1996).
[61] Stock, James and Mark Watson, “Has the Business Cycle Changed and Why?” NBERMacroeconomics Annual, Mark Gerler and Kenneth Rogoff ed. (2003), MIT Press.
[62] Stock, James and Mark Watson, “Understanding Changes in International Business CycleDynamics” (2004), NBER WP 9859.
[63] Summers, R., Heston, A., 1991. “The Penn World Tables (Mark 5): An expanded set ofinternational comparisons, 1950—1988”. Quarterly Journal of Economics 106, 327—368.
[64] Sutton, John “The Variance of Firm Growth Rates: The ‘Scaling’ Puzzle”, Physica A, 2003.
[65] Weron, Alexander and R.Weron (1995) “Computer simulation of Lévy stable variables andprocesses”, Lecture Notes in Physics 457, 379-392, Springer.
[66] Wyart, Matthieu and Jean-Philippe Bouchaud, “Statistical models for company growth”,Physica A (2003).
33