Power Factor Correction and Energy Savings with. Power Factor Correction of Inductive Motors...
21
Power Factor Correction and Energy Savings with
-
Upload
genevieve-weatherall -
Category
Documents
-
view
223 -
download
2
Transcript of Power Factor Correction and Energy Savings with. Power Factor Correction of Inductive Motors...

Power Factor Correction
and Energy Savings with

Power Factor Correction of Inductive Motors
Inductive Motors- Compressors- Pumps- A/C units- Chillers- Dust collectors- Conveyors- Etc.

How Inductive Motors Work
AC motors require reactive power to develop magnetic fields in addition to real power which
actually does the work.
Reactive Power (kVars)
+
Real Power (kW)
=
Apparent Power (kVa)

Calculating Power Factor (PF)
PF = kW / kVa
100/142 = 70% PF
Only 70% of the current provided by the electrical utility is being used to produce useful work.

Why Improve Poor Power Factor?• Utilities typically charge a penalty fee to customers with PF less than 90%
• Uncorrected PF causes excessive loss in your distribution system
• Excessive voltage drop causes over heating and premature failure of motors and other inductive equipment
• Energy savings realized
• Reduce your carbon footprint
- The AC inductive motor typically operates at 80% efficiency when under full load, but the efficiency drops dramatically at lower loads.
- A typical inductive motor consumes over 80 times its purchase price in electricity over its life!

Power Factor Correction with KVAR® KEC (Kvar Energy Controller)
By implementing KEC technology at individual inductive loads, the KVARs required by the motor is provided by
the KEC unit rather than the electrical system. Consequently, the power used from the electricity
provider is mostly kW.

How KVAR ® KEC Works
• As motors operate, reactive power is “pulled” and “pushed” to and from the KEC by the motor at 60 cycles/second.
• The KEC stores and releases what the motors need to function more efficiently.
• This unique approach serves to reduce the heat generated on the lines, therefore reducing the strain placed on all the electrical components.
• Electricity, that would normally be pushed back through the power distribution lines, is reclaimed and recycled by the KEC.
• The KEC stores and supplies power to all inductive loads.

Our Methodology
Businesses can now dramatically reduce the cost of determining how much capacitance is required to optimize each inductive load at
their facility. The patent KVAR® apparatus and methodology achieves this by eliminating the typical electrical engineering,
design, and manufacturing costs. This precision technology fine-tunes each motor to unity for immediate savings with a quick return on investment. Installation is fast, simple and sized to the specific
unit.

The ECO-EN-ERGY AUDIT1. FREE CONSULTATION - Review the electricity bills and determine the number of
inductive loads at the facility to determine if an audit is warranted. A nominal fee is required for an audit.
2. THE AUDIT - Our trained licensed electricians equipped with the patented KVAR® apparatus will test your circuits and motors to determine the optimal power factor correction of each load. In addition, determine the best locations to install the capacitors in your electrical system.
3. THE PROPOSAL - Trained personnel analyze the data and a comprehensive written proposal is prepared. It includes a precise analysis of your current power factor readings, guaranteed PF correction, estimated savings and estimated ROI.
4. ANALYSING THE DATA - The data is explained to you clearly by your agent. We will demonstrate the savings we can provide for you by installing our custom product.
5. INSTALLATION - The results of the audit will be sent to our manufacturer who will build the units specifically for your facility. You will decide with your sales agent the best time for one of our licensed electricians to install your units. A qualified electrician must perform all work.

Compressor Power Factor Correction Power and Line Calculation Example:
Real Power Calculation:
Volts x Amps x PF = Watts
460 x 56 x .55 = 14168 watts
- After PF correction
460 x 23 x .98 = 10368 watts
- Reduction of 3800 Watts = 27%
Line % Reduction: (N2= new efficiency N1= old efficiency)
N2 - N1 / N2
.98 - .55 / .98 = 44% current line reduction

IESO – Profile( Independent Electricity System Operator)
Under normal circumstances, Dan O’Mara would prefer to be a leader than a follower. When it comes to electricity pricing, however, he’s quite content to follow someone else’s lead.
That someone else is Tim Prokopetz, Manager of Purchasing at Timmins and District Hospital, a 159-bed full-service emergency, teaching and referral hospital serving the City of Timmins and Cochrane District as well as adjoining areas of the Temiskaming, Sudbury and Algoma Districts.
According to O’Mara, the savings resulting from the shift to hourly pricing have been invested in interval meters, another essential in the institutional electricity user’s energy management toolkit. These newly installed interval meters allow his staff to monitor and measure – with considerable precision – how electricity is consumed in each facility in 15-minute chunks.
Switching to hourly electricity pricing has been the most important move made by the Timmins and District Hospital, but it’s certainly not the only one. Over the next few months, Prokopetz plans to implement a number of energy-related initiatives, including a $17,000 power factor correction project, which will pay for itself in less than 18 months. The installation of a capacitor bank and other associated equipment has raised the hospital’s power factor from 83 to 90, which exempts the facility from an annual penalty of $12,000 commonly imposed by local utilities to recover added transmission and distribution costs to compensate for current and voltage irregularities.
Prokopetz considers power factor correction one of the easy wins. “When you’re dealing with hospital executives on energy efficiency projects, it’s important to show progress,” he said. “And while it’s good to be seen to be doing the right thing environmentally, the financial implications of a project are paramount.”
The hospital is also undergoing a $5.5-million energy retrofit expected to yield a 34-per-cent reduction in energy consumption. Improvements are being made in all corners of the facility’s operation. Enhancements include new building automation and direct digital controls; variable-speed pumps, drives and air handling units; glycol-based heat recovery systems; air and water optimization; lighting retrofits and redesigns; and laundry water and heat recovery. Hospital administrators are also considering other measures such as solar water and space heating; and co-generation to produce steam and electricity.
In the coming months, Prokopetz hopes to create a regional energy team to encourage further dialogue and information-sharing, a mechanism that would dovetail nicely with the Government of Ontario’s goal of encouraging better planning, collaboration, and coordination of services among regional hospitals.
“Up here, it’s better to work as a group,” O’Mara states. “We are always looking for ways to become more efficient. It makes sense to work together to evolve the industry so we can deliver better care to our respective patients"

IESO – Profile( Independent Electricity System Operator)
Molesworth Farm Supply Limited is a livestock feed manufacturing facility, located in the heart of dairy and hog country at the border of Perth and Huron Counties in south-western Ontario. Thirty years ago, Molesworth was a small and simple gristmill operation. Today, Molesworth uses researched and high-tech processes to blend and process grain for commercial livestock production.
As Molesworth grew, management knew that the company was not using electricity as effectively as it could. The 20 motors used to grind, mix and transfer equipment for feed had a sub-standard power factor of 74 per cent to 77 per cent, whereas 90 per cent is considered the acceptable industry target.
For years, management tried to resolve the problem on its own without success.
In 2002, Molesworth decided to tackle the problem head-on and hire a professional energy auditor. “Feed manufacturing is a very low margin business. We knew every month when we received our electricity bill that we were paying a power factor penalty. We realized that in order to compete with multi-nationals, we needed to better manage our electricity costs,” said Ron Coghlin, President of Molesworth.
The energy audit recommended installing a series of capacitors on the company’s major electric motors. The installation cost $27,000 and took one month to complete. The audit projected that Molesworth would recover the cost of the installation within 36 months.
Upon completion of the project, Molesworth’s power factor jumped immediately to between 93 per cent and 95 per cent. Molesworth was able to recover the costs of the capacitors within 15 months – less than half the amount of time projected by the audit.
“By taking control of our power factor, we have been able to pass on savings to farmers and put more money back into our company. Since 2002, Molesworth’s volume has doubled and more efficient electricity usage has been a contributing factor to our success,” said Coghlin.
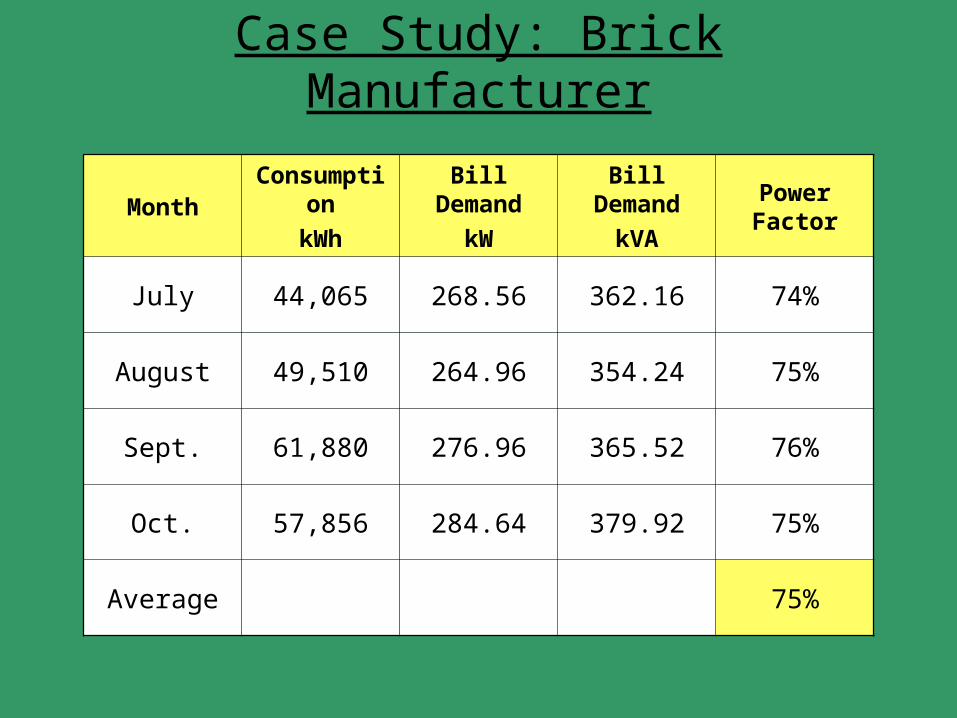
Case Study: Brick Manufacturer
MonthConsumption
kWh
Bill Demand
kW
Bill Demand
kVAPower Factor
July 44,065 268.56 362.16 74%
August 49,510 264.96 354.24 75%
Sept. 61,880 276.96 365.52 76%
Oct. 57,856 284.64 379.92 75%
Average 75%

Case Study: Audit Results
ITEMSINITIAL
AMPS
OPTOMIZED
AMPS
INITIAL
PF
OPTOMIZED
PF
ESTIMATED
KW SAVINGS
ESTIMATED
SAVINGS PER MONTH
MIXER 58 46 75 % 94 % 1446.61 $165.06
BLOCK MACHINE 93 75 80 % 96 % 2474.2 $282.31
DUST COLLECTOR 32.5 25 76 % 99 % 1026.76 $17.61
COMPRESSOR 56 23 55 % 98 % 1280.33 $146.09
HOPPER #1 3.2 1.5 40 % 96 % 8.51 $0.97
HOPPER #2 3.2 1.5 40 % 96 % 8.514 $0.97
HOPPER #3 3.2 1.5 40 % 96 % 8.51 $0.97
CONVEYOR 8.5 4.5 45 % 94 % 38.16 $4.35
TOTAL 6291.6 $717.89

Projected Return on Investment/Savings
• Cost of investment = $8,750.00• ROI = 12.2 months * • Installation = 1.25 days
Projected Savings Based on Current Rates
5 years = $34,458.00
10 years = $77,532.00
20 years = $163,678.00
*The indicated savings does not reflect additional charges for facilities with less than a 90% PF imposed by the hydro company.

HoneywellKVAR Test Executive Summary
Overview - The KVAR Power Optimization Capacitors were installed on the chiller and chilled water pump at Apollo Elementary School in Titusville, Florida. A data logger was used for brief periods prior and after the installation, in order to measure the effects of the installation on the electrical power system.
Conclusion - Actual savings for the retrofit were calculated as follows:
Energy Savings * Cost Savings * Payback
PUMP 17,600 kWh $1,185 .5 years
CHILLER 20,800 kWh $1,684 1.8 years
* Yearly

NASA Testing
Overview – The test was performed at the prototype shop on a 10 H.P. compressor motor. All values pertinent to motor efficiency have been recorded on the electric motor performance form.
Conclusion – The real power draw by this motor decreased from 5.63 kW to 5.14 kW after optimization. This corresponds to a power reduction of 8.7%

NASA Performance Form
VOLTAGE AMPS KW KVAR Power Factor
Initial Values
Phase A 277 8.09 1.91 1.13 86%
Phase B 277 7.75 1.89 1.03 88%
Phase C 275 7.85 1.84 1.1 86%
TOTAL 5.63 3.26
Final Values
Phase A 277 6.38 1.76 -0.199 99%
Phase B 277 6.38 1.71 -0.308 99%
Phase C 275 6.38 1.65 -0.215 99%
TOTAL 5.14 -0.722

KVAR ® KEC Certifications
Canadian Standards Association
Underwriters Laboratory
Nasa Tested
Restriction of Hazardous Substances
Cleaner and Greener Certified

• Manufactured in the U.S.A. with a 5 year warranty • Quick return on investment (typically less than 2 years)• Savings of 8-15% for industrial/commercial facilities• Portable, expandable with your facility• Quick installation with immediate results• Reduces amperage surges • Increases the life of inductive motors through heat reduction• Can be implemented to fit your budget• Maximum efficiency at each inductive load, reducing the load on
the distribution system• The most cost effective and efficient manner to address poor
Power Factor and reduce energy consumption.• Reduces your carbon footprint!

A Division of AFI Group Inc.
SAVE MONEY SAVE ENERGY SAVE EARTH
430 King Street WestChatham, Ontario
519-397-4388
www.eco-en-ergy.com