Power Electronics: The Key technology for CH- 5300 Turgi ... · PDF fileCH- 5300 Turgi...
40
© ABB Switzerland Ltd - 1 - 6/25/2007 Power Electronics: The Key technology for Energy Efficiency and Renewables Dr. Peter K. Steimer Vice President Power Electronics & MV Drives CH- 5300 Turgi Switzerland
Transcript of Power Electronics: The Key technology for CH- 5300 Turgi ... · PDF fileCH- 5300 Turgi...

©AB
B Sw
itzer
land
Ltd
-1
-6/
25/2
007
Power Electronics:The Key technology for Energy Efficiency and Renewables
Dr. Peter K. SteimerVice President
Power Electronics & MV DrivesCH- 5300 Turgi
Switzerland

©AB
B Sw
itzer
land
Ltd
-2
-What we offer: divisional structure and portfolio
* Estimated 2006 revenues, Including internal sales to other divisions
Market-leading positions in most key product areasIntegrated solutions for grid reliability, productivity and energy efficiencyRobust global value chain to serve established and emerging marketsExtensive global network of value-added channel partners
Robots, peripheral devices and modular manufacturing solutions for industry
ProcessAutomation
Sales: $5.4 billion
Control systems and application-specific automation solutions for process industries
Substations, FACTS, HVDC, HVDC Light, power plant & network automation
Power SystemsSales: $4.5 billion
RoboticsSales: $1.3 billion
Transformers, high-and medium-voltage switchgear, breakers,automation relays
Power ProductsSales: $7.4 billion
AutomationProducts
Sales: $6.8 billion
Low-voltage products, LV & MV drives, motors, power electronics, and instrumentation

©AB
B Sw
itzer
land
Ltd
-3
-Innovation key to competitive advantage
$1.1 billion spent on research and order-related development in 2006, a 10 percent increase compared with 20056,000 researchers and developers worldwideR&D and new product focus in both power and automation:
Energy efficiency (e.g., advanced transmission systems, high-efficiency motors and drives)Flexibility and productivity (e.g., automation and control software, wireless communication systems)
* Comprises Non-order related R&D and order-related development for ABB’s five core division and excludes expenditures in Non-core activities
ABB’s current strong market position has been built through consistent R&D investment

©AB
B Sw
itzer
land
Ltd
-4
-
Total ~ 1100 Employees
Power Power ElectronicsElectronics
TriangleTriangle
Competence Center Power Electronics
ABB Power ElectronicsABB MV Drives
Turgi
ABB Corporate Research
Dättwil
ABB Semiconductors
Lenzburg
©AB
B Sw
itzer
land
Ltd
-5
-
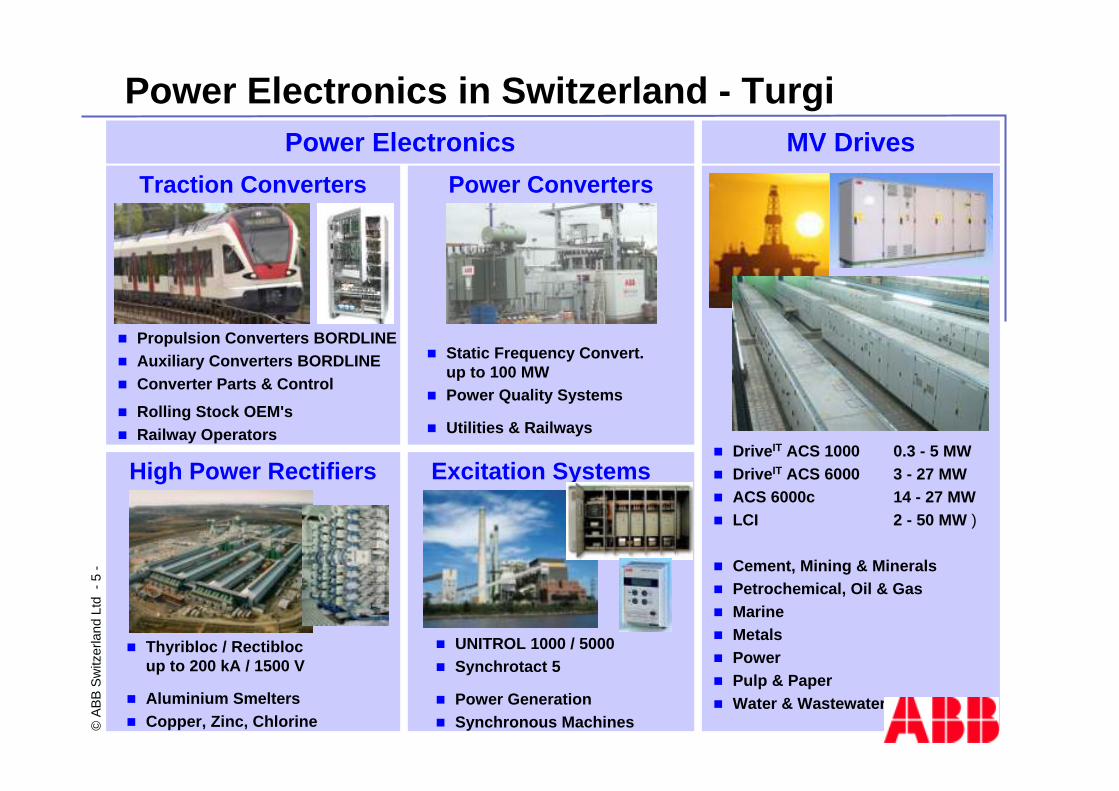
Power ConvertersTraction Converters
High Power Rectifiers
ProcessMM3 ~3 ~
f1
f2
~
~
ConverterCooling
MachineCooling
ProtectionProtection Control Control ExcitationExcitationn
ProcessMM3 ~3 ~
f1
f2
~
~
ConverterCooling
MachineCooling
ProtectionProtection Control Control ExcitationExcitationn
Standard Scope of Supply for a Drive System
ProcessMM3 ~3 ~
f1
f2
~
~
ConverterCooling
MachineCooling
ProtectionProtection Control Control ExcitationExcitationn
ProcessMM3 ~3 ~
f1
f2
~
~
ConverterCooling
MachineCooling
ProtectionProtection Control Control ExcitationExcitationn
Standard Scope of Supply for a Drive SystemStandard Scope of Supply for a Drive System
Power Electronics in Switzerland - TurgiPower Electronics MV Drives
Excitation Systems
UNITROL 1000 / 5000Synchrotact 5
Power GenerationSynchronous Machines
Propulsion Converters BORDLINEAuxiliary Converters BORDLINEConverter Parts & Control
Rolling Stock OEM'sRailway Operators
DriveIT ACS 1000 0.3 - 5 MWDriveIT ACS 6000 3 - 27 MWACS 6000c 14 - 27 MWLCI 2 - 50 MW )
Cement, Mining & MineralsPetrochemical, Oil & GasMarineMetalsPowerPulp & PaperWater & Wastewater
Thyribloc / Rectiblocup to 200 kA / 1500 V
Aluminium SmeltersCopper, Zinc, Chlorine
Static Frequency Convert.up to 100 MWPower Quality Systems
Utilities & Railways

©AB
B Sw
itzer
land
Ltd
-6
-Electrical Energy - the future demand
Worldwide eletrical energy demand is fast growingGrowth of energy demand at 3.5% per yearThe installed capacity will grow by 60% until 2020
from 4300 GW (2006) to 6700 GW (2020) by 150 to 200 GW per year
Renewables enabled by Power ElectronicsRenewables have the potential to reduce the C02 emmissions in power generation (in Europe 20% by 2020)Windpower 2006: new installations 15 GW / year (25% growth rate)
Solar Power 2006: new installations at 2 GW / year (50% growth rate)
Energy efficiency enabled by Power ElectronicsVariable speed power generationTransmission and distribution (HVDC and FACTS)Variable speed drivesPower conversion for rolling stock
©AB
B Sw
itzer
land
Ltd
-7
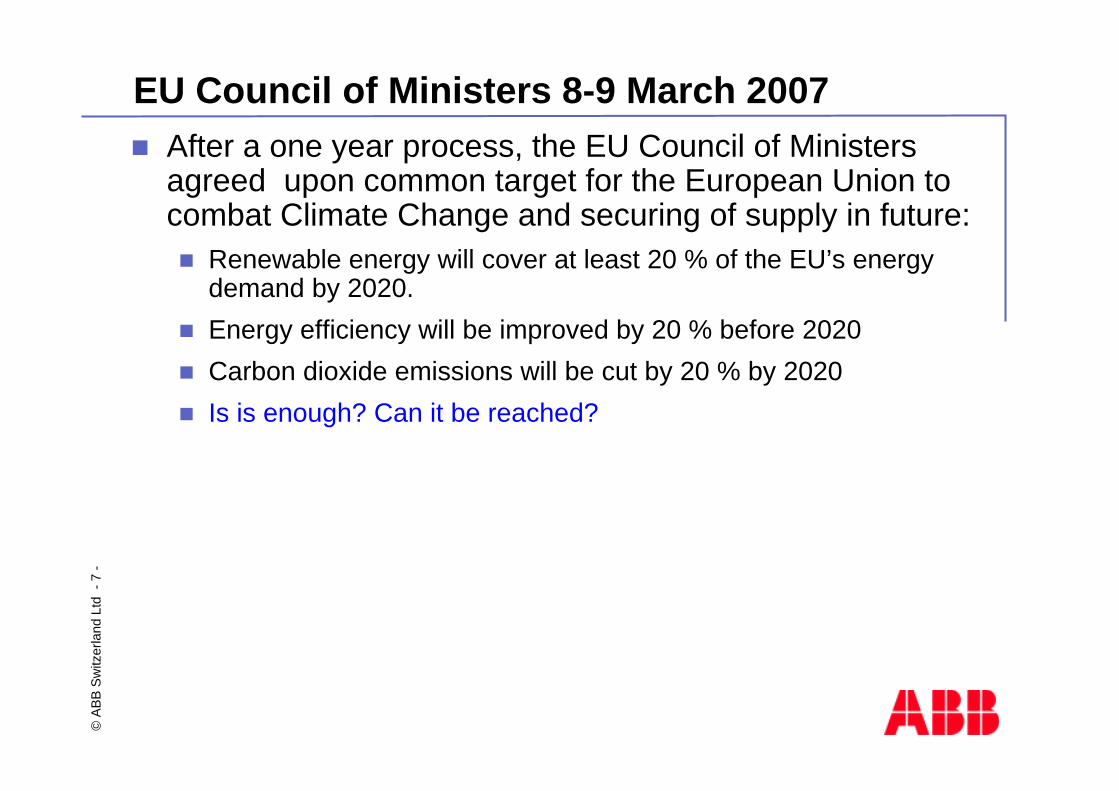
-EU Council of Ministers 8-9 March 2007
After a one year process, the EU Council of Ministers agreed upon common target for the European Union to combat Climate Change and securing of supply in future:
Renewable energy will cover at least 20 % of the EU’s energy demand by 2020.Energy efficiency will be improved by 20 % before 2020Carbon dioxide emissions will be cut by 20 % by 2020Is is enough? Can it be reached?

©AB
B Sw
itzer
land
Ltd
-8
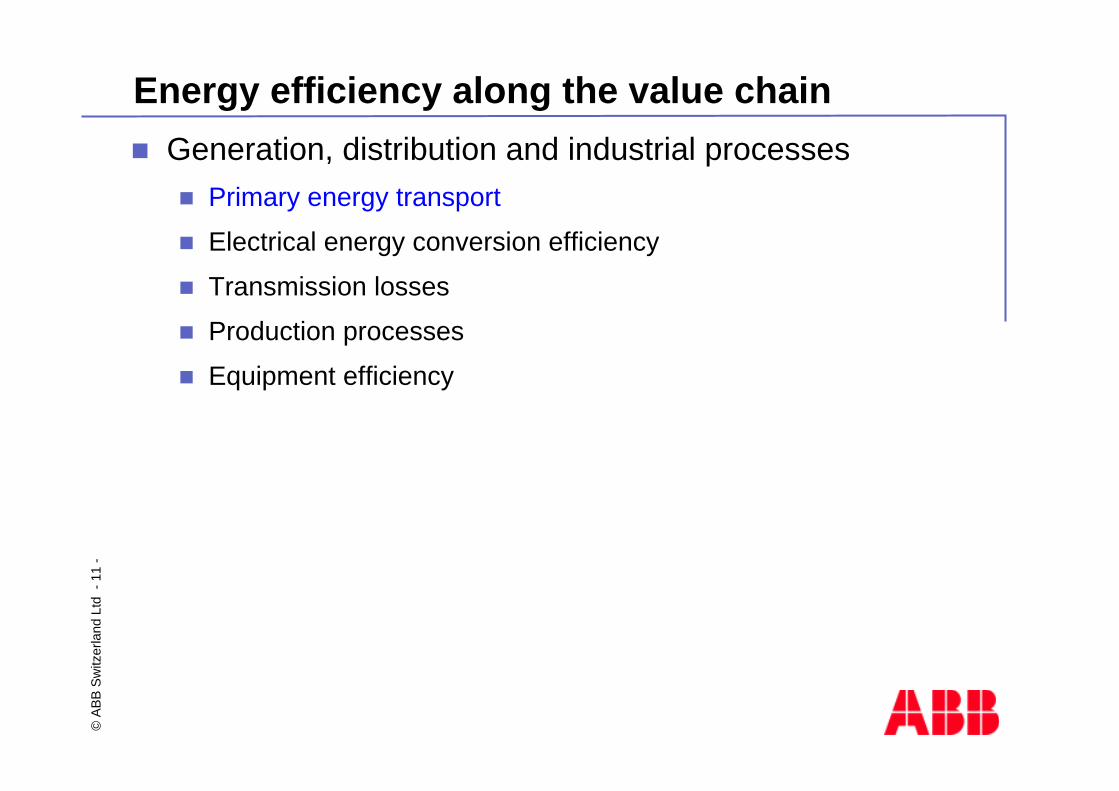
-Energy efficiency along the value chain
Generation, distribution and industrial processesPrimary energy transport
Electrical energy conversion efficiency
Transmission losses
Production processes
Equipment efficiency

©AB
B Sw
itzer
land
Ltd
-9
-
Usefulenergy
primaryenergytransport
electricalconversionefficiency
line lossesproduction
process
primaryenergy(e.g. coal,oil, gas,hydro, wind)
equipmentefficiency
(e.g. motors)
Energy Efficiency & Power Conversion Steps

©AB
B Sw
itzer
land
Ltd
-10
-
Usefulenergy
primaryenergytransport
electricalconversionefficiency
line lossesproductionprocesses
primaryenergy(e.g. coal,oil, gas,hydro, wind) equipment
efficiency
Potential Power Electronics Contribution
Power Electronics is a cross-cutting technologythat allows saving energy
across all steps ofconverting primary energy into goods and life quality
©AB
B Sw
itzer
land
Ltd
-11
-Energy efficiency along the value chain
Generation, distribution and industrial processesPrimary energy transport
Electrical energy conversion efficiency
Transmission losses
Production processes
Equipment efficiency
©AB
B Sw
itzer
land
Ltd
-12
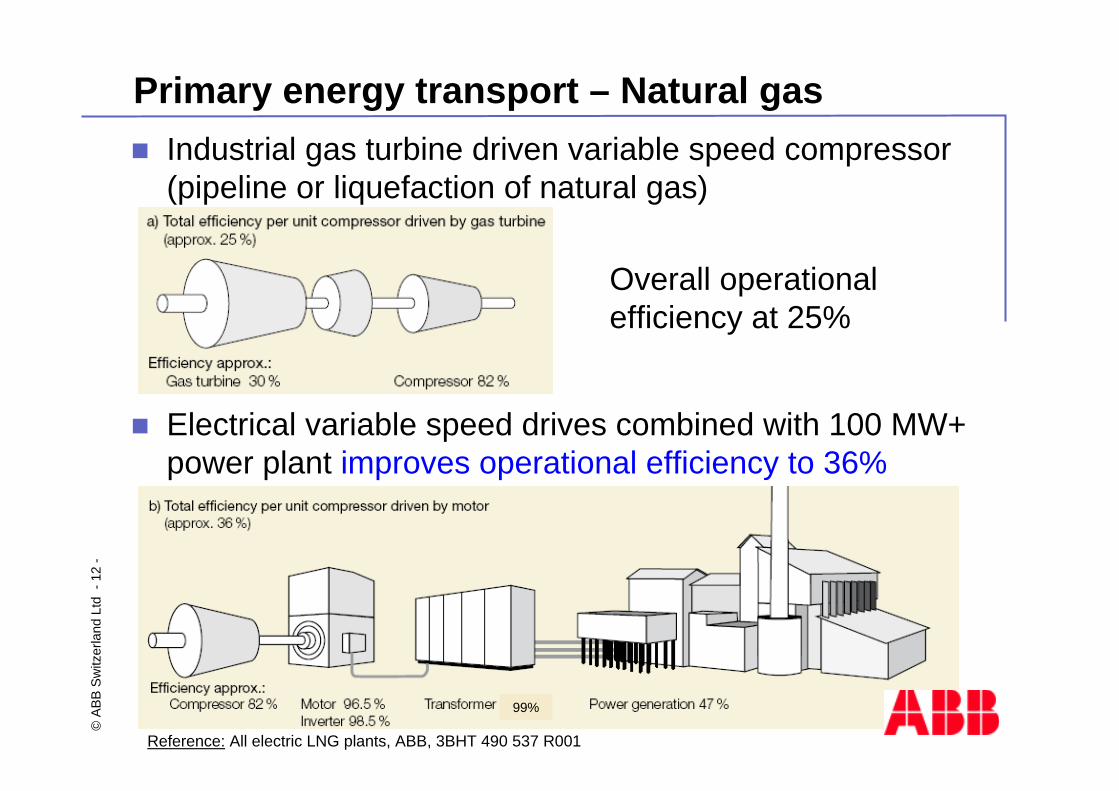
-Primary energy transport – Natural gas
Industrial gas turbine driven variable speed compressor (pipeline or liquefaction of natural gas)
Overall operational efficiency at 25%
Electrical variable speed drives combined with 100 MW+ power plant improves operational efficiency to 36%
Reference: All electric LNG plants, ABB, 3BHT 490 537 R001
99%

©AB
B Sw
itzer
land
Ltd
-13
-Energy efficiency along the value chain
Generation, distribution and industrial processesPrimary energy transport
Electrical energy conversion efficiency
Transmission losses
Production processes
Equipment efficiency
©AB
B Sw
itzer
land
Ltd
-14
-Electrical energy conversion efficiency - Bulk
100 MW + gas turbine driven power generation has a primary to electrical energy conversion efficiency of
typically 47%up to 55% in a combined cycle plantmore than 80% in triple cycle (district heating or water desalination plant)
Most efficient electrical energy generation is based onOptimized bulk power generation
In regards of C02 emmissions nuclear energy is the right choice
Utilization of low-temperature heat for heating or industrial processes → to be retrofitted for existing plantsImprovement of efficiency of auxiliaries by means of variable speed drives → to be retrofitted for existing plants

©AB
B Sw
itzer
land
Ltd
-15
-Electrical energy conversion efficiency - Wind
The environmental factore.g. climate change, pollution, Kyoto Protocol, clean power initiatives worldwide
Energy demandGlobal demand increasing, new growth economies
One new coal-fired power plant every week in China
The economy of windAverage generation cost per kWh has declined by 60% since 1980
Immune from fuel price spikes, fossil fuel sources are limited
ResultWind energy is becoming a mature, global business
European Wind Energy Technology Platform Launch Event Page 1
0.02
0.03
0.04
0.05
0.06
0.07
0.08
€/kW
h
Source: RISØ
Wind power generation coston good wind locations
Windpower generation costs
5MW Windturbine

©AB
B Sw
itzer
land
Ltd
-16
-PCS6000 - MV converter for wind turbines
Wind turbine at 5 -10 MWTrend towards full power converter
Brushless / no sliprings → substantially longer maintenance cycles
Controlled stress on the gear box (Gearless as an option)
Trend towards medium voltageMV voltage → Lower (fault) current levels
MV semiconductors (IGCT) → Minimum component number
3
MC
B
Active RectifierUnit
InverterUnit
PMGen
DC-Link
4.0 kV
PCS6000 – 5 MW Wind converter

©AB
B Sw
itzer
land
Ltd
-17
-Electrical energy conversion efficiency - WindGrowth of Wind Power in a World Wide Generation Context2006 Windpower ConventionalGrowth 26.2% 3.3%Average asset utilization 25% 50%Added capacity in 2006 15 GW 126 GWAdded produced energy in 2006 32 TWh (5%) 562 TWh (95%)
©AB
B Sw
itzer
land
Ltd
-18
-
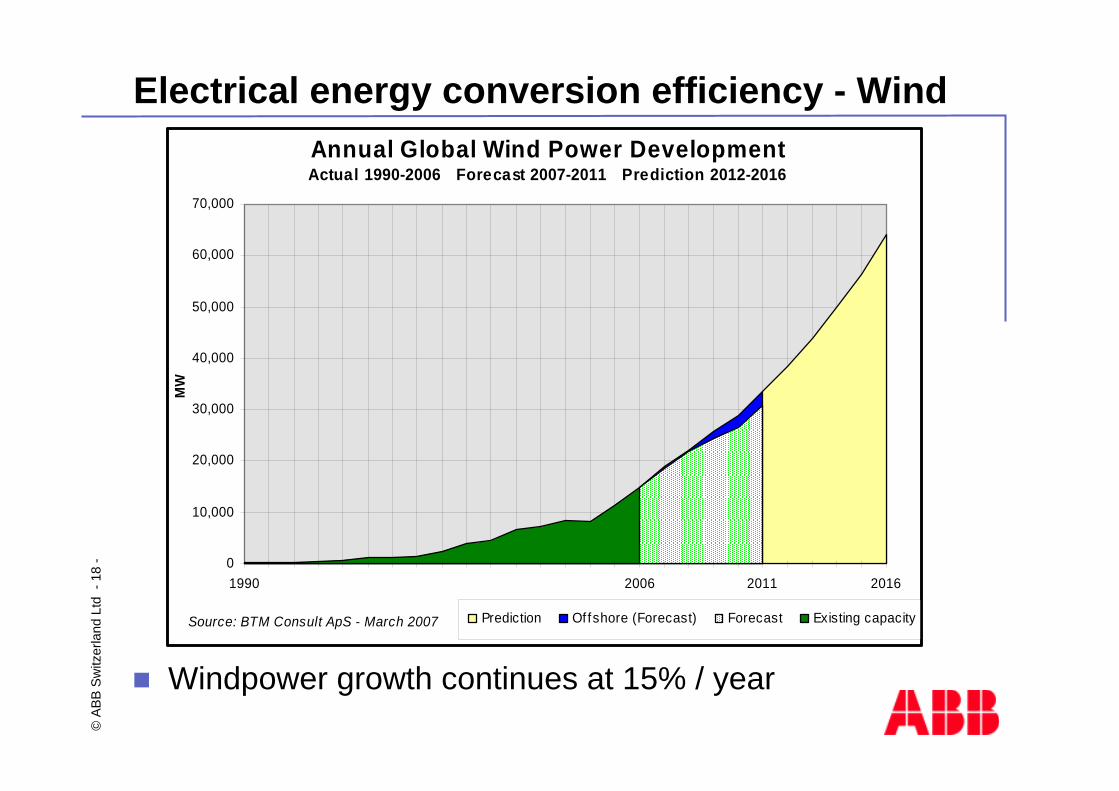
Annual Global Wind Power DevelopmentActual 1990-2006 Forecast 2007-2011 Prediction 2012-2016
0
10,000
20,000
30,000
40,000
50,000
60,000
70,000
1990 2006 2011 2016
MW
Prediction Of fshore (Forecast) Forecast Existing capacitySource: BTM Consult ApS - March 2007
Windpower growth continues at 15% / year
Electrical energy conversion efficiency - Wind
©AB
B Sw
itzer
land
Ltd
-19
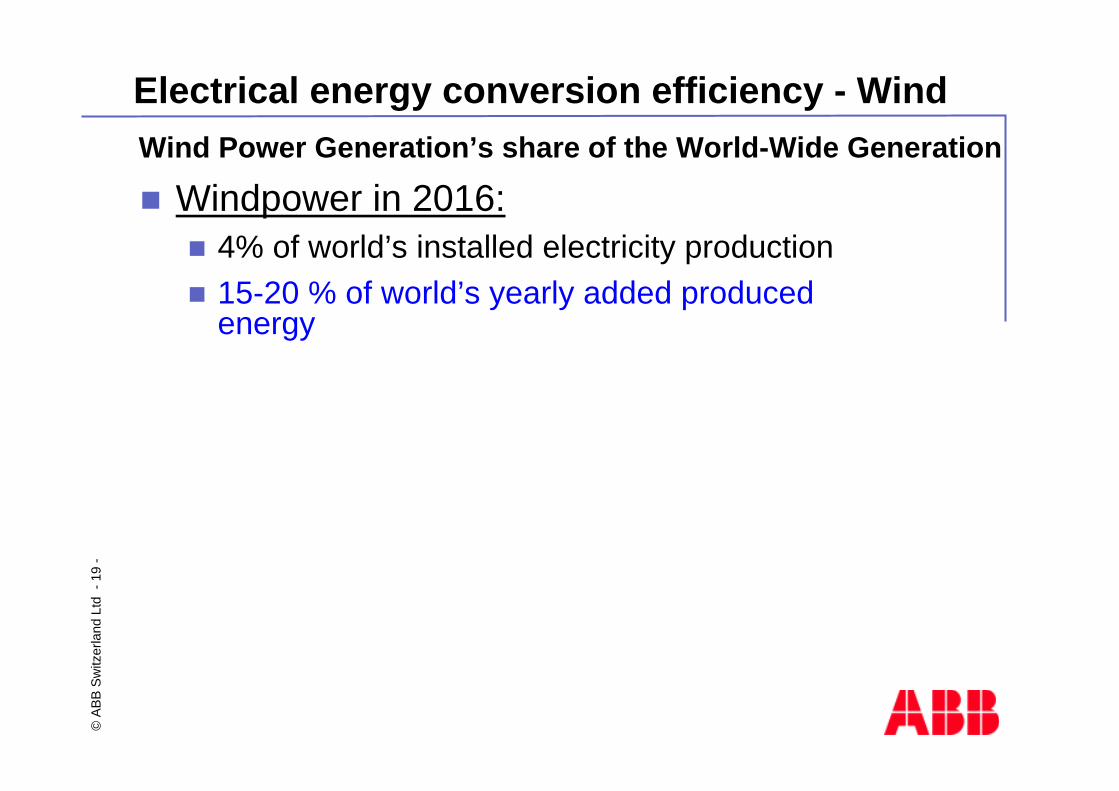
-Electrical energy conversion efficiency - WindWind Power Generation’s share of the World-Wide Generation
Windpower in 2016:4% of world’s installed electricity production15-20 % of world’s yearly added produced energy

©AB
B Sw
itzer
land
Ltd
-20
-Electrical energy conversion efficiency - Solar
Hydro power at Itaipu (Brazil)12’600 MW installed power
80 TWh per year (util. factor = 72%)
Dam 200 x 7 km = 1400 km2
Solar power in South EuropeSolar irradiation 5 kWh/m2 and day
1400 km2 equipped with 20 % efficiency solar cells
500 TWh per year
380 thousand km2 of solar cells to cover all world energy
Itaipu dam
Sweden 450 thousand km2
USA 9.6 million km2
Solar cells
Source: G. Asplund, ABB Power Systems, Sweden

©AB
B Sw
itzer
land
Ltd
-21
-
World production of photovoltaic cells increase very rapidly (40-50% growth rate)
Electrical energy conversion efficiency - Solar
Surface of Sahara9 million km2
Area needed for Europe's electricity25000 km2
Source: G. Asplund, ABB Power Systems, Sweden
©AB
B Sw
itzer
land
Ltd
-22
-
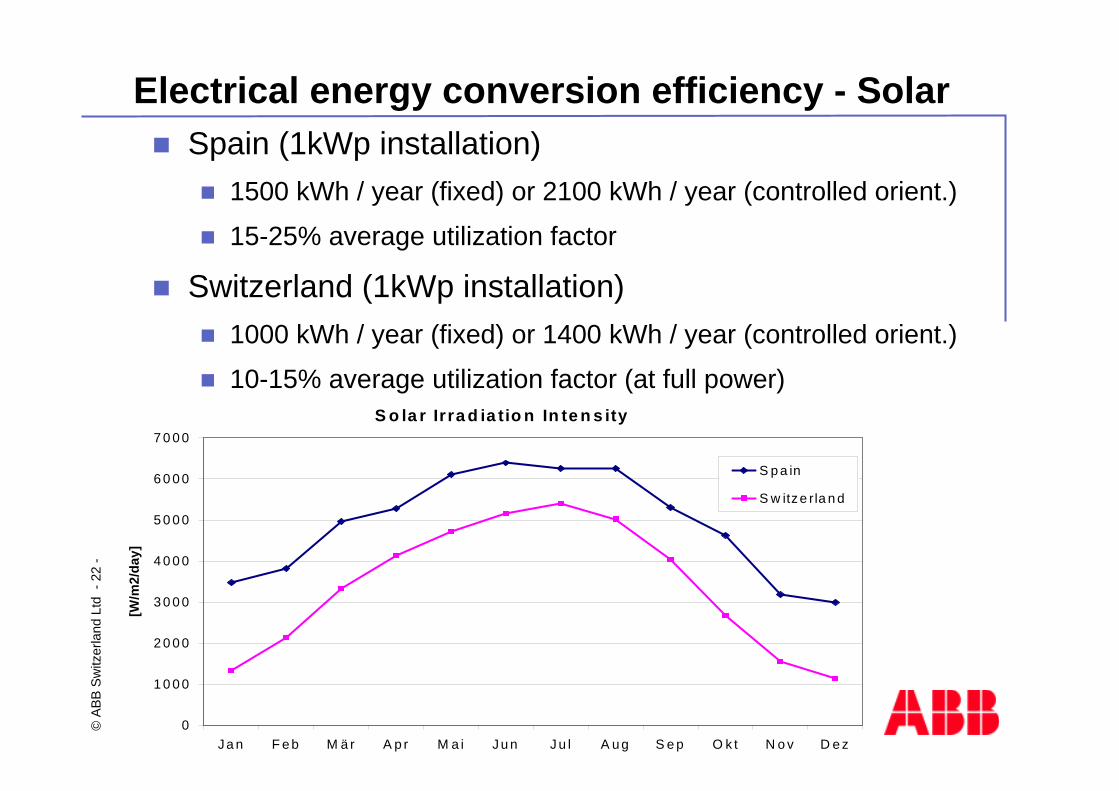
Spain (1kWp installation)1500 kWh / year (fixed) or 2100 kWh / year (controlled orient.)
15-25% average utilization factor
Switzerland (1kWp installation)1000 kWh / year (fixed) or 1400 kWh / year (controlled orient.)
10-15% average utilization factor (at full power)
Electrical energy conversion efficiency - Solar
S o la r Irra d ia tio n In te n s ity
0
1 0 0 0
2 0 0 0
3 0 0 0
4 0 0 0
5 0 0 0
6 0 0 0
7 0 0 0
Ja n F e b M ä r A p r M a i J u n J u l A u g S e p O k t N o v D e z
[W/m
2/da
y]
S p a in
S w itze rla n d

©AB
B Sw
itzer
land
Ltd
-23
-
Simple technology has the potential to spread fastSwitzerland has 70% of the solar irradiation of Gibraltar
Limited basic disadvantage Use orientation intelligence (40% benefit)
Leadership in Renewables created in the EU€20 billion turnover and 300.000 jobs
Solar in 20162-20% of world’s yearly added produced energy
2% with yearly growth rate of 20% - LOW assumption20% with yearly growth rate of 50% - HIGH assumption
Will outperform windpower in the long run
Electrical energy conversion efficiency - Solar
©AB
B Sw
itzer
land
Ltd
-24
-Energy efficiency
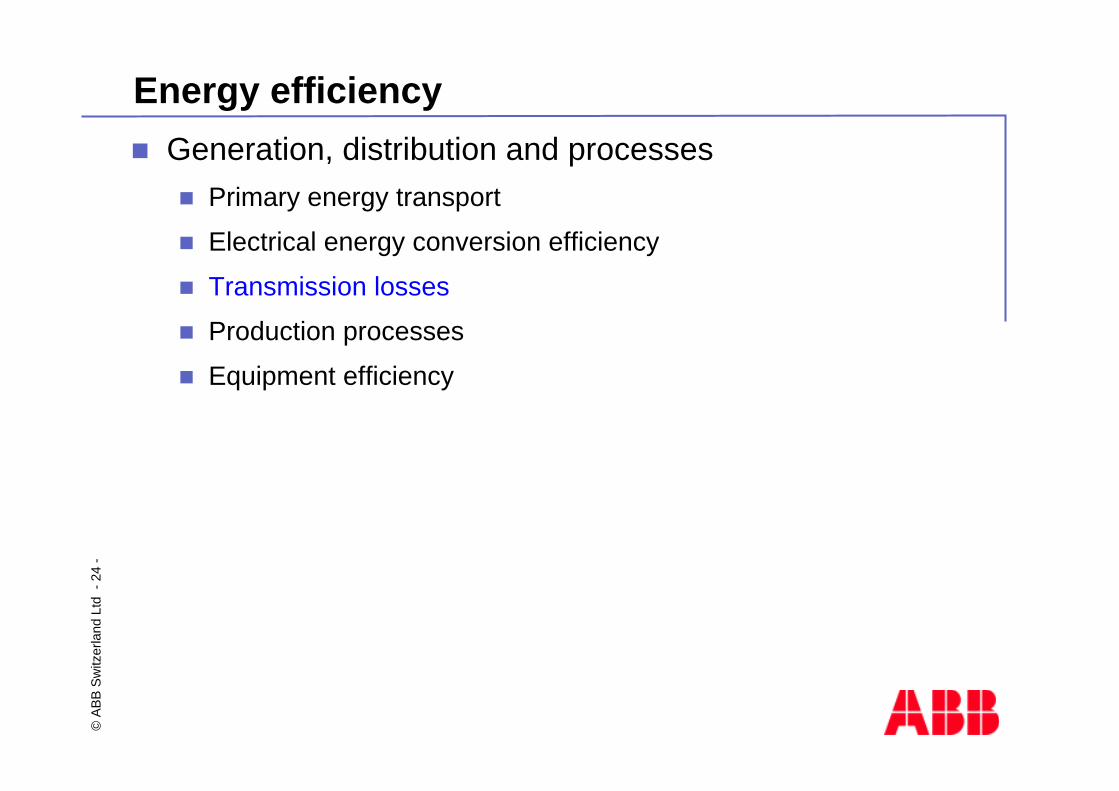
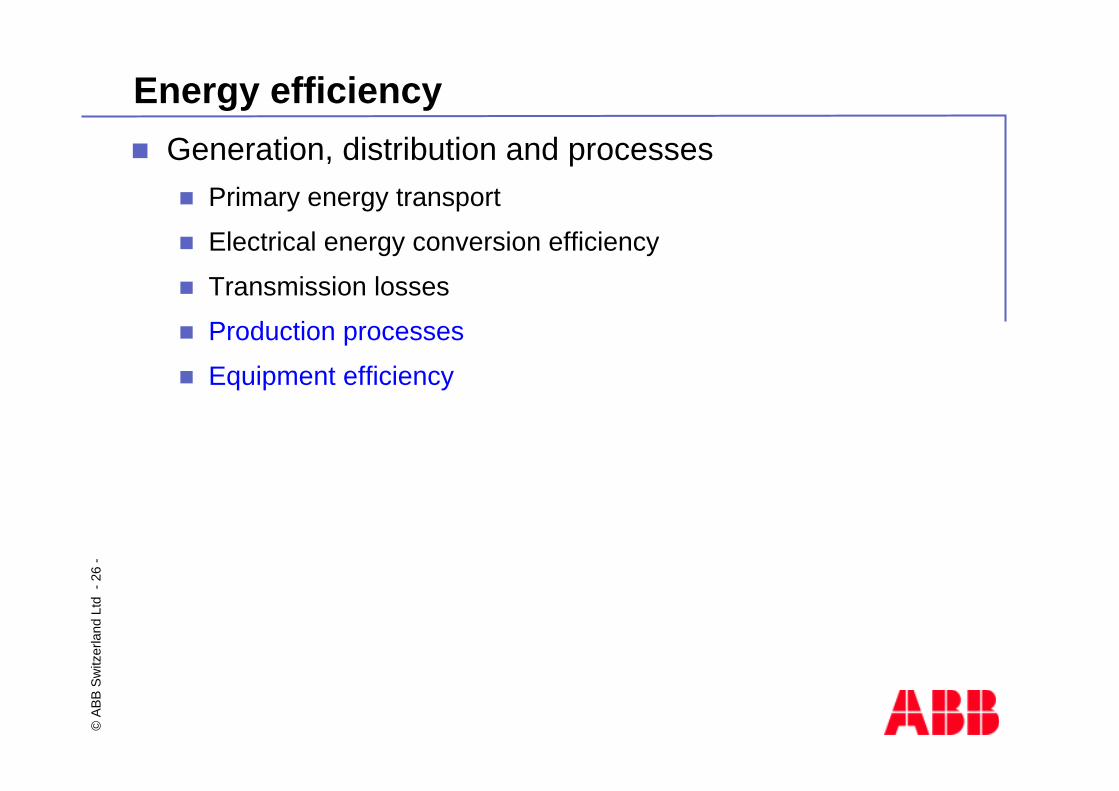
Generation, distribution and processesPrimary energy transport
Electrical energy conversion efficiency
Transmission losses
Production processes
Equipment efficiency

©AB
B Sw
itzer
land
Ltd
-25
-Transmission losses – Ultra High Voltage
120 GW
50 GW
50 GW100 GW
Total 320 GW = 50 projects * 6 GW
©AB
B Sw
itzer
land
Ltd
-26
-Energy efficiency
Generation, distribution and processesPrimary energy transport
Electrical energy conversion efficiency
Transmission losses
Production processes
Equipment efficiency

©AB
B Sw
itzer
land
Ltd
-27
-Variable Frequency Drives – VFDs
Uline UDC UoutUline UDC Uout
IGBT switches0.18 to 5600 kW 110 V – 690 V
IGCT Switches
3-27 MW/ 3kV0.3 – 5 MW/ 2.3/3.3/4kV
2-22MW / 6/6.9 kV

©AB
B Sw
itzer
land
Ltd
-28
-Where Can Motor Drives Save The Most?
Pumps, fans, and blowers are theapplications with highest saving potential
Power varies largely as a function of theflow rate
2NT ∝
3NP∝
NQ∝ Affinity Laws
Small FlowReduction Large Power
Reduction

©AB
B Sw
itzer
land
Ltd
-29
-Equipment efficiency – Pumps
For each 1 EUR spent to purchase a motor, 100 EUR are spent for energy cost during its lifetime
Many motors still run at fixed speeds, power electronic drives can control the speed of the motor to match output with the needs
Power (%)
Flow (%)
Motor lossesPump lossesValve lossesUseful work
0
2040
6080
100
120140160
0 10 20 30 40 50 60 70 80 90 100
Saved powerLossesUseful work
Flow (%)
Power (%)
020406080
100120140
160
0 10 20 30 40 50 60 70 80 90 100
Throttling

©AB
B Sw
itzer
land
Ltd
-30
-
0
2'000
4'000
6'000
8'000
10'000
12'000
0 20 40 60 80 100
120
140
160
Flow
Pres
sure
12
3 4 10% extra pressure
10% extra flow
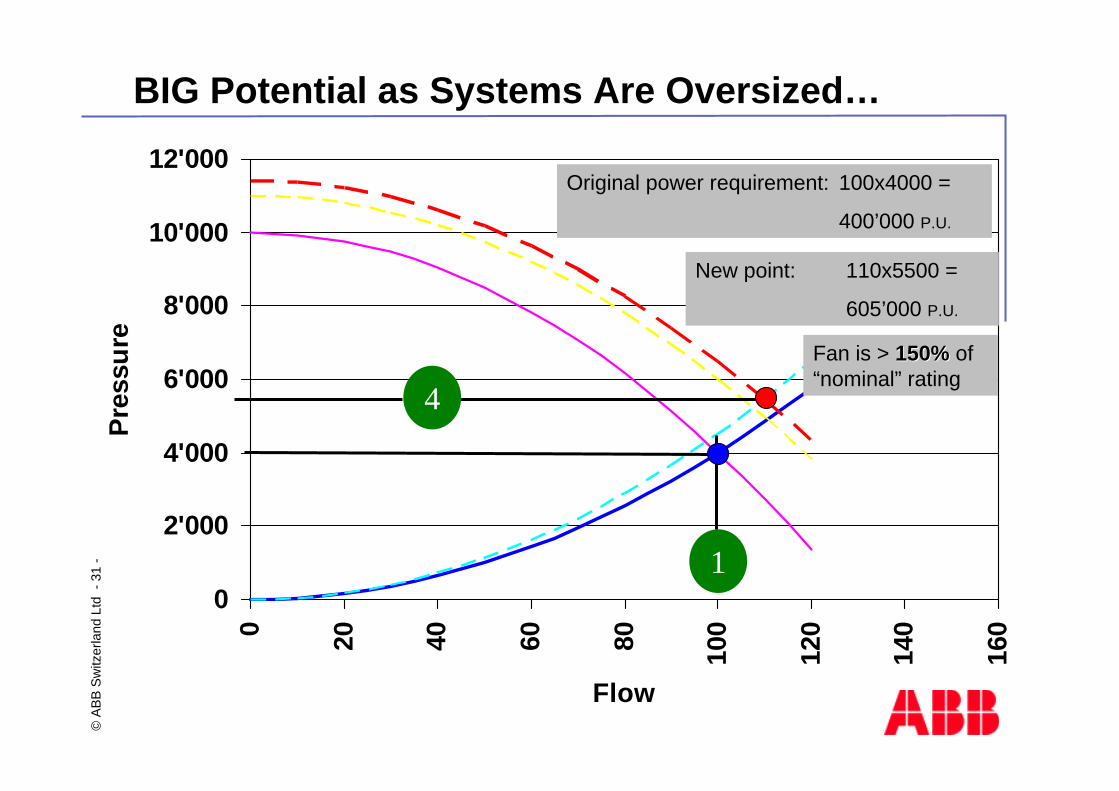
BIG Potential as Systems Are Oversized…
©AB
B Sw
itzer
land
Ltd
-31
-
0
2'000
4'000
6'000
8'000
10'000
12'000
0 20 40 60 80 100
120
140
160
Flow
Pres
sure
Original power requirement: 100x4000 =
400’000 P.U.
1
4
New point: 110x5500 =
605’000 P.U.
Fan is > 150%150% of “nominal” rating
BIG Potential as Systems Are Oversized…

©AB
B Sw
itzer
land
Ltd
-32
-
DATA
PROFILE
ECONOMICS
RESULTS
©AB
B Sw
itzer
land
Ltd
-33
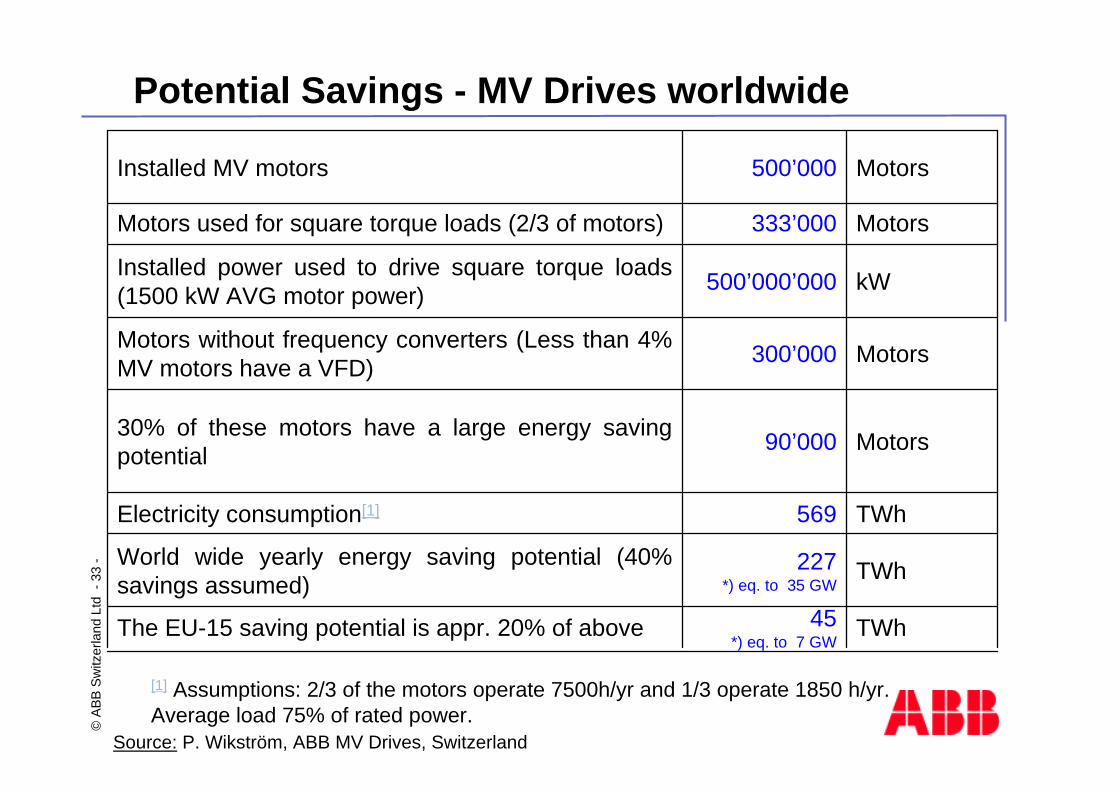
-Potential Savings - MV Drives worldwide
TWh45*) eq. to 7 GW
The EU-15 saving potential is appr. 20% of above
TWh227*) eq. to 35 GW
World wide yearly energy saving potential (40% savings assumed)
TWh569Electricity consumption[1]
Motors90’00030% of these motors have a large energy saving potential
Motors300’000Motors without frequency converters (Less than 4% MV motors have a VFD)
kW500’000’000Installed power used to drive square torque loads (1500 kW AVG motor power)
Motors333’000Motors used for square torque loads (2/3 of motors)
Motors500’000Installed MV motors
[1] Assumptions: 2/3 of the motors operate 7500h/yr and 1/3 operate 1850 h/yr.Average load 75% of rated power.
Source: P. Wikström, ABB MV Drives, Switzerland
©AB
B Sw
itzer
land
Ltd
-34
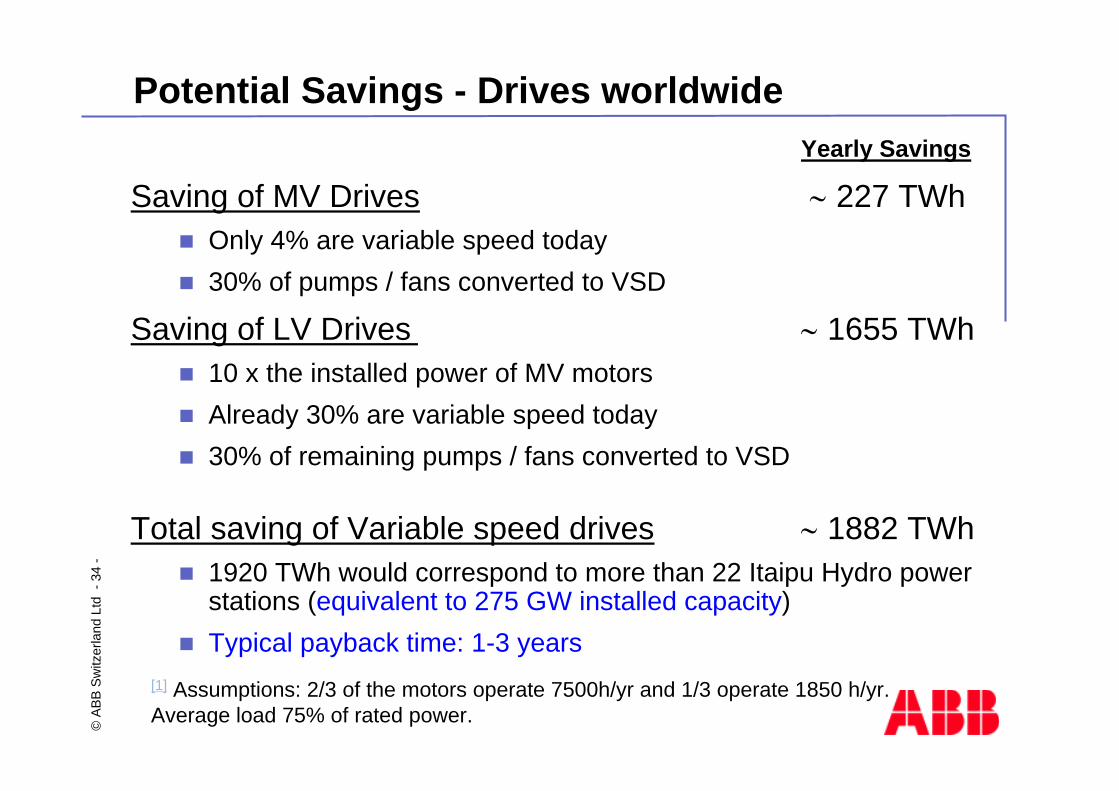
-Potential Savings - Drives worldwide
Yearly Savings
Saving of MV Drives ∼ 227 TWhOnly 4% are variable speed today30% of pumps / fans converted to VSD
Saving of LV Drives ∼ 1655 TWh10 x the installed power of MV motorsAlready 30% are variable speed today30% of remaining pumps / fans converted to VSD
Total saving of Variable speed drives ∼ 1882 TWh1920 TWh would correspond to more than 22 Itaipu Hydro power stations (equivalent to 275 GW installed capacity)Typical payback time: 1-3 years
[1] Assumptions: 2/3 of the motors operate 7500h/yr and 1/3 operate 1850 h/yr.Average load 75% of rated power.
©AB
B Sw
itzer
land
Ltd
-35
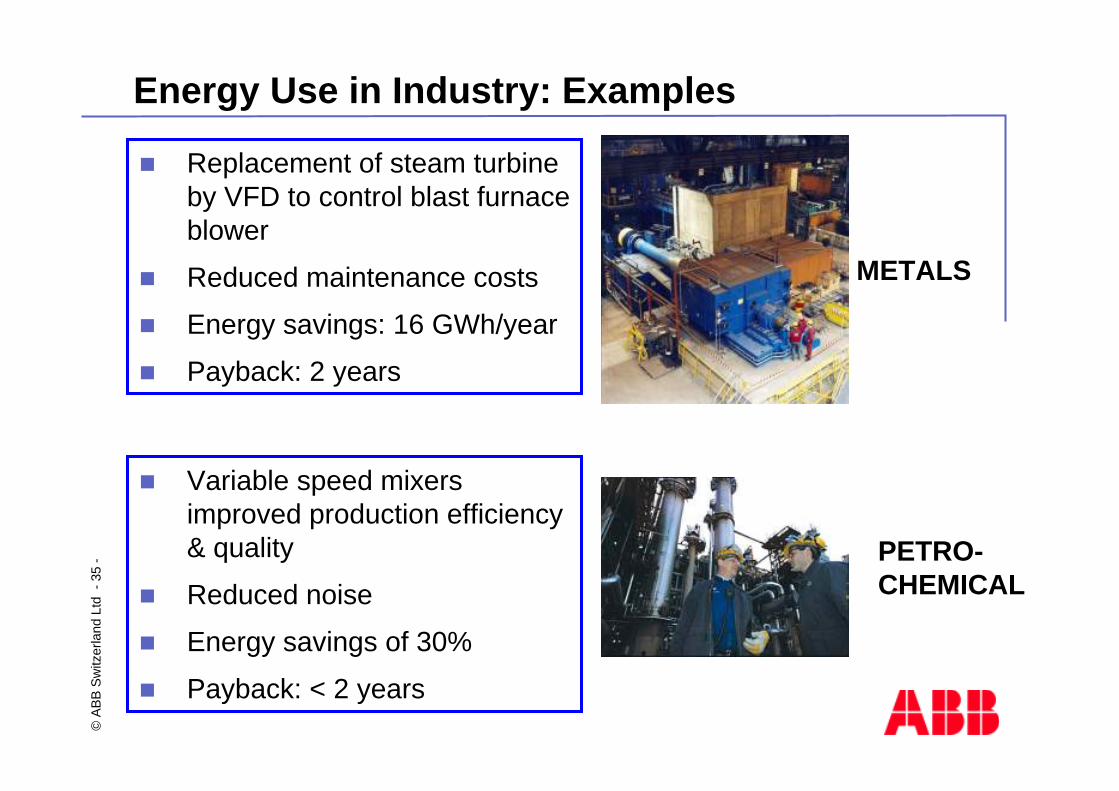
-Energy Use in Industry: Examples
Replacement of steam turbine by VFD to control blast furnace blower
Reduced maintenance costs
Energy savings: 16 GWh/year
Payback: 2 years
METALS
PETRO-CHEMICAL
Variable speed mixers improved production efficiency & quality
Reduced noise
Energy savings of 30%
Payback: < 2 years

©AB
B Sw
itzer
land
Ltd
-36
-Equipment efficiency – Transportation
Common DC-link power systems connect variable speed energy generation, energy storage and traction motor for
CarsBusesTrains andShips
Energy savings due toVariable speed power generation of fossil fuel based systems
up to 30% fuel saving, if used in part load conditions
Energy storage for fossil fuel based (and grid supplied) systems 30% fuel saving in acceleration / deceleration mode demonstrated
This benefits would exist, but are not considered by ope-rators, manufacturers or users

©AB
B Sw
itzer
land
Ltd
-37
-Equipment efficiency – Transportation
Generically high-efficient DC-link based Power System
with variable speed power generation and energy storage
For (hybrid) cars, buses, trains, airplanes, ships, …
©AB
B Sw
itzer
land
Ltd
-38
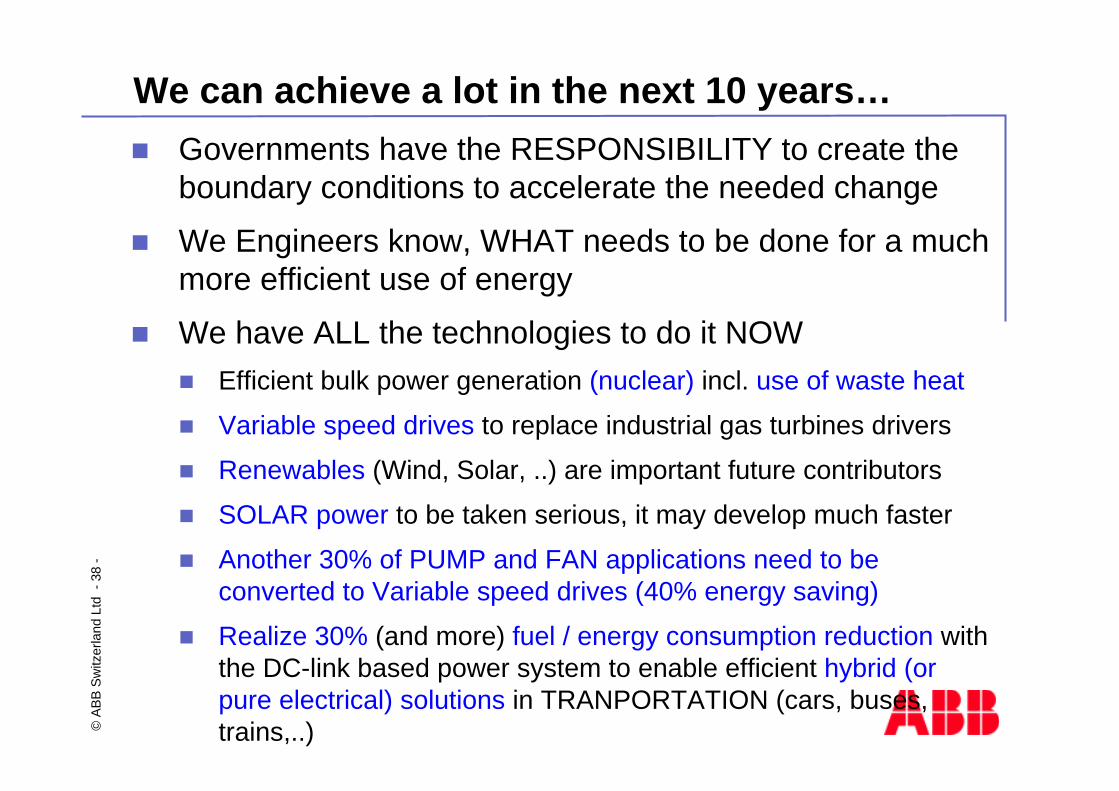
-We can achieve a lot in the next 10 years…
Governments have the RESPONSIBILITY to create the boundary conditions to accelerate the needed change
We Engineers know, WHAT needs to be done for a much more efficient use of energy
We have ALL the technologies to do it NOWEfficient bulk power generation (nuclear) incl. use of waste heat
Variable speed drives to replace industrial gas turbines drivers
Renewables (Wind, Solar, ..) are important future contributors
SOLAR power to be taken serious, it may develop much faster
Another 30% of PUMP and FAN applications need to be converted to Variable speed drives (40% energy saving)
Realize 30% (and more) fuel / energy consumption reduction with the DC-link based power system to enable efficient hybrid (or pure electrical) solutions in TRANPORTATION (cars, buses,trains,..)
©AB
B Sw
itzer
land
Ltd
-39
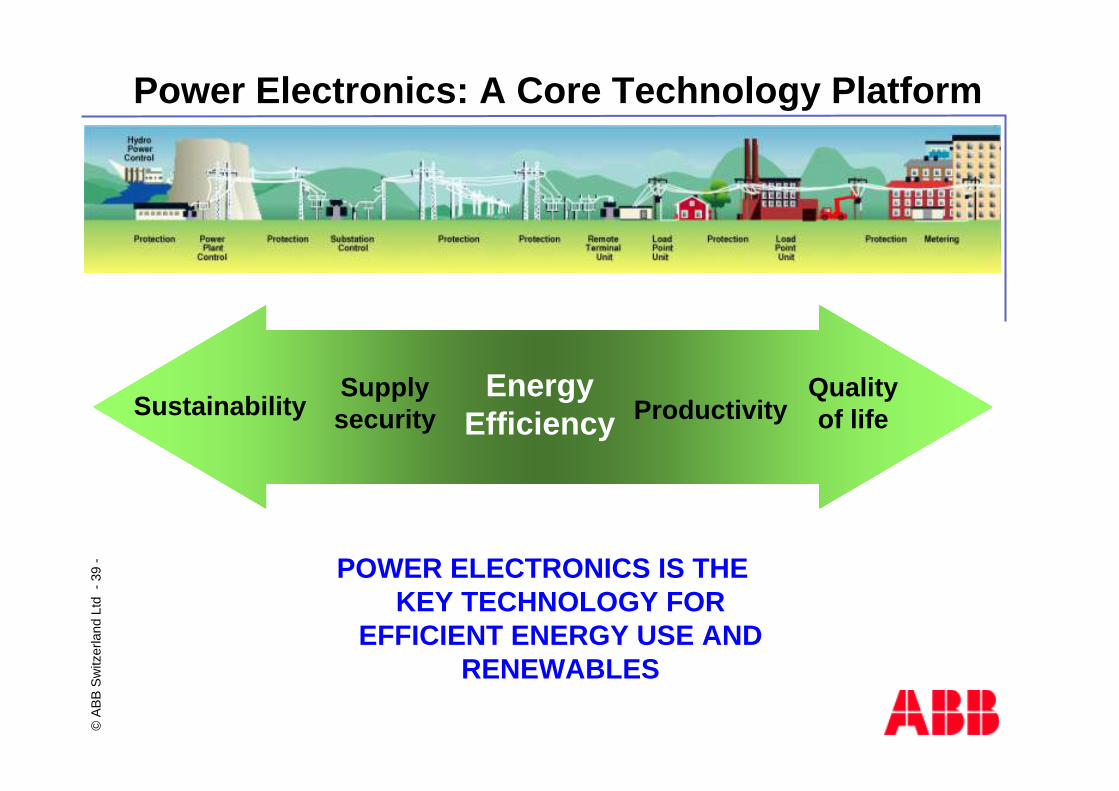
-Power Electronics: A Core Technology Platform
SustainabilitySupplysecurity
EnergyEfficiency Productivity
Qualityof life
POWER ELECTRONICS IS THE KEY TECHNOLOGY FOR
EFFICIENT ENERGY USE AND RENEWABLES

©AB
B Sw
itzer
land
Ltd
-40
-