Powell Villa OR-sdr - phillipsedison.com · 03506 Baskin Robbins 1,200 SF 03508 Leased/AVAILABLE...
5
POWELL VILLA PORTLAND, OR SIZE SIZE 59,660 square feet MAJOR TENANT(S) MAJOR TENANT(S) City Maxx Grocery Dollar Tree Ace Hardware DEMOGRAPHIC DEMOGRAPHICS LEA LEASING CONT SING CONTACT CT Carol Sitzenstatter Carol Sitzenstatter Office (801) 869-1824 Mobile (916) 297-0353 [email protected] MORE INFO MORE INFO www.phillipsedison.com LOC OCATION TION 3510-3544 SE 122nd Avenue | Portland, OR 97236 PR PROPER OPERTY HIGHLIGHTS TY HIGHLIGHTS • Anchored by Ace Hardware, Dollar Tree and City Maxx Grocery • National tenants include Baskin Robbins, Jackson Hewitt and Metro PCS • Situated across from Safeway and Walgreen’s, on the corner of SE 122nd Avenue (20,246 VPD) and SE Powell Boulevard, a strong primary retail thoroughfare in the Portland market • Population exceeds 174,100 in three miles with a median household income greater than $43,600 Population Population 27,300 27,300 176,661 176,661 428,147 428,147 Households Households 9,258 9,258 64,546 64,546 165,798 165,798 Median HH Income ($) Median HH Income ($) 40,074 40,074 47,054 47,054 54,515 54,515 1 mile 1 mile 3 mile 3 mile 5 mile 5 mile
Transcript of Powell Villa OR-sdr - phillipsedison.com · 03506 Baskin Robbins 1,200 SF 03508 Leased/AVAILABLE...

POWELL VILLA PORTLAND, OR
S I Z ES I Z E
59,660 square feet
M A J O R T E N A N T ( S )M A J O R T E N A N T ( S )
City Maxx GroceryDollar TreeAce Hardware
D E M O G R A P H I CD E M O G R A P H I C SS
L E AL E A S I N G C O N TS I N G C O N TAAC TC T
Carol SitzenstatterCarol Sitzenstatter
Office (801) 869-1824
Mobile (916) 297-0353
M O R E I N F OM O R E I N F O
www.phillipsedison.com
LLO CO C AAT I O NT I O N
3510-3544 SE 122nd Avenue | Portland, OR 97236
P RP RO P E RO P E RT Y H I G H L I G H T ST Y H I G H L I G H T S
• Anchored by Ace Hardware, Dollar Tree and City Maxx Grocery
• National tenants include Baskin Robbins, Jackson Hewitt and
Metro PCS
• Situated across from Safeway and Walgreen’s, on the corner of
SE 122nd Avenue (20,246 VPD) and SE Powell Boulevard, a
strong primary retail thoroughfare in the Portland market
• Population exceeds 174,100 in three miles with a median
household income greater than $43,600
PopulationPopulation
27,30027,300 176,661176,661 428,147428,147
HouseholdsHouseholds
9,2589,258 64,54664,546 165,798165,798
Median HH Income ($)Median HH Income ($)
40,07440,074 47,05447,054 54,51554,515
1 mile1 mile 3 mile3 mile 5 mile5 mile

DISCLAIMER - This site plan is for general information purposes only and is not intended to constitute representations and
warranties by Landlord as to the ownership of the real property depicted herein or the identity or nature of any occupants thereof.
POWELL VILLA 3510-3544 SE 122nd Avenue | Portland, OR 97236
SITE LEGEND
Available Occupied
Leased (not occupied) Owned by Others
Site Boundary
SPACESPACE TENANTTENANT SQ. FT.SQ. FT.
PAD1 7-ELEVEN
03506 Baskin Robbins 1,200 SF
0350803508 Leased/AVAILABLELeased/AVAILABLE 1,600 SF1,600 SF
03510 MetroPCS 750 SF
03512 Jackson Hewitt 1,597 SF
0351403514 AVAILABLEAVAILABLE 4,736 SF4,736 SF
03617 Dollar Tree 12,985 SF
03618 City Maxx Grocery 17,181 SF
03632 Classic Billiards 6,000 SF
3644 Coin Laundry 1,850 SF
03660 Ace Hardware 11,761 SF
TOTAL SQ. FT.TOTAL SQ. FT. 59,660

POWELL VILLA 3510-3544 SE 122nd Avenue | Portland, OR 97236

POWELL VILLA 3510-3544 SE 122nd Avenue | Portland, OR 97236
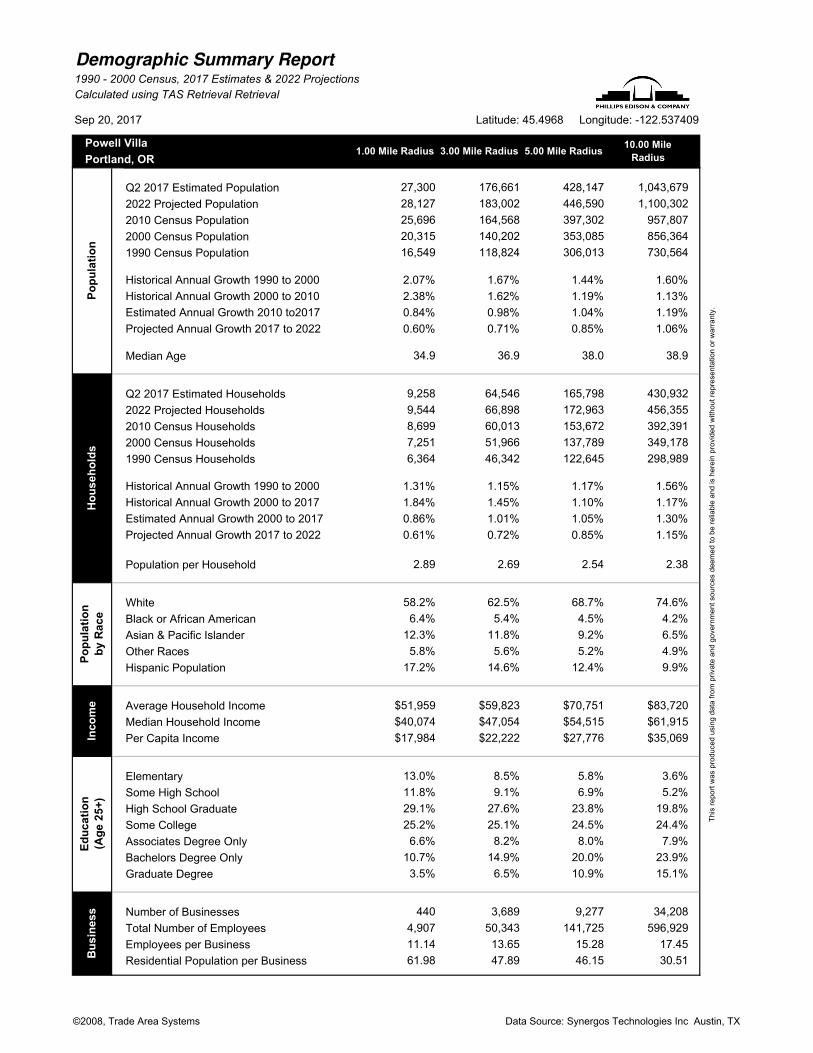
Demographic Summary Report1990 - 2000 Census, 2017 Estimates & 2022 Projections
Calculated using TAS Retrieval Retrieval
Latitude: 45.4968 Longitude: -122.537409Sep 20, 2017
1.00 Mile Radius 3.00 Mile Radius 5.00 Mile Radius10.00 Mile
Radius
Powell Villa
Portland, OR
Q2 2017 Estimated Population 27,300 176,661 428,147 1,043,679
2022 Projected Population 28,127 183,002 446,590 1,100,302
2010 Census Population 25,696 164,568 397,302 957,807
2000 Census Population 20,315 140,202 353,085 856,364
1990 Census Population 16,549 118,824 306,013 730,564
Historical Annual Growth 1990 to 2000 2.07% 1.67% 1.44% 1.60%
Historical Annual Growth 2000 to 2010 2.38% 1.62% 1.19% 1.13%
Estimated Annual Growth 2010 to2017 0.84% 0.98% 1.04% 1.19%
Projected Annual Growth 2017 to 2022 0.60% 0.71% 0.85% 1.06%
Median Age 34.9 36.9 38.0 38.9
Q2 2017 Estimated Households 9,258 64,546 165,798 430,932
2022 Projected Households 9,544 66,898 172,963 456,355
2010 Census Households 8,699 60,013 153,672 392,391
2000 Census Households 7,251 51,966 137,789 349,178
1990 Census Households 6,364 46,342 122,645 298,989
Historical Annual Growth 1990 to 2000 1.31% 1.15% 1.17% 1.56%
Historical Annual Growth 2000 to 2017 1.84% 1.45% 1.10% 1.17%
Estimated Annual Growth 2000 to 2017 0.86% 1.01% 1.05% 1.30%
Projected Annual Growth 2017 to 2022 0.61% 0.72% 0.85% 1.15%
Population per Household 2.89 2.69 2.54 2.38
White 58.2% 62.5% 68.7% 74.6%
Black or African American 6.4% 5.4% 4.5% 4.2%
Asian & Pacific Islander 12.3% 11.8% 9.2% 6.5%
Other Races 5.8% 5.6% 5.2% 4.9%
Hispanic Population 17.2% 14.6% 12.4% 9.9%
Average Household Income $51,959 $59,823 $70,751 $83,720
Median Household Income $40,074 $47,054 $54,515 $61,915
Per Capita Income $17,984 $22,222 $27,776 $35,069
Elementary 13.0% 8.5% 5.8% 3.6%
Some High School 11.8% 9.1% 6.9% 5.2%
High School Graduate 29.1% 27.6% 23.8% 19.8%
Some College 25.2% 25.1% 24.5% 24.4%
Associates Degree Only 6.6% 8.2% 8.0% 7.9%
Bachelors Degree Only 10.7% 14.9% 20.0% 23.9%
Graduate Degree 3.5% 6.5% 10.9% 15.1%
Number of Businesses 440 3,689 9,277 34,208
Total Number of Employees 4,907 50,343 141,725 596,929
Employees per Business 11.14 13.65 15.28 17.45
Residential Population per Business 61.98 47.89 46.15 30.51
Po
pu
lati
on
This
report
was p
roduced u
sin
g d
ata
fro
m p
rivate
and
govern
ment sourc
es d
eem
ed to b
e r
elia
ble
and is
here
in p
rovid
ed w
ithout re
pre
senta
tion o
r w
arr
anty
.
Ho
us
eh
old
sP
op
ula
tio
n
by
Ra
ce
Ed
uc
ati
on
(Ag
e 2
5+
)B
us
ine
ss
Inc
om
e
©2008, Trade Area Systems Data Source: Synergos Technologies Inc Austin, TX