Poverty week 11.ppt - Universitetet i Oslo · Poverty Numbers • According to the World ......
31
Poverty and development – Week 11 March 15 Readings: Ray chapter 8 1
Transcript of Poverty week 11.ppt - Universitetet i Oslo · Poverty Numbers • According to the World ......

Poverty and development – Week 11March 15
Readings: Ray chapter 8
1
Introduction Poverty is both of intrinsic and functional
significance.
Poverty has enormous implications for the way in which entire economies function.
Some of the functional implications were tied up in our discussion of inequality, but there are other that are specific to poverty itself.
2
Outline
Poverty measures
Empirical observations of poverty
Functional aspects of poverty.
3

Poverty is an outcome of inequality at various levels
• Inequality of world income levels
• Inequality within the country
• Inequality within the household
4

Poverty Line• An individual is poor if her income falls below some income
deemed by various criteria to be necessary for basic necessities and ‘adequate’ participation in economic life.
• Nutrition based poverty lines:– The cost of a diet containing enough nutrition to meet basic human
requirements.– In this case, poverty line is the income needed to acquire this diet.
• Purely income based poverty lines:– Some level of real income accepted as the poverty line.
• Countries have different types of poverty lines
5

Conceptual issues• Overall expenditure or item-by-item consumption?
• Absolute or relative?– Relative poverty: evaluated relative to the standards in each
society– Absolute poverty: based on standards that apply to all
societies.
• Temporary or chronic?
• Households or individuals?
6

The head count ratio• The head count ratio, HCR, measures the number of poor
people (head count, HC) whose incomes are below the poverty line, relative to the whole population:
• # indicates the number of individuals in the set {} • p = poverty line.
n
HCn
pyHCR i
#
7

Problems with the head-count ratio• It is completely insensitive to the degree of individual poverty:
– It does not matter how close people’s incomes are to the poverty line.
– Biases policy geared towards reducing HCR towards the richest of the poor.
– Same amount of resources can obtain a larger fall in HCR if the money is spent on people close to p lifting their incomes just above p, rather than spending it on people with incomes much below p.
• What does the target “Halve extreme poverty by 2015!” mean?:– Should one focus on people just below the poverty line or on the poor
among the poor?
8
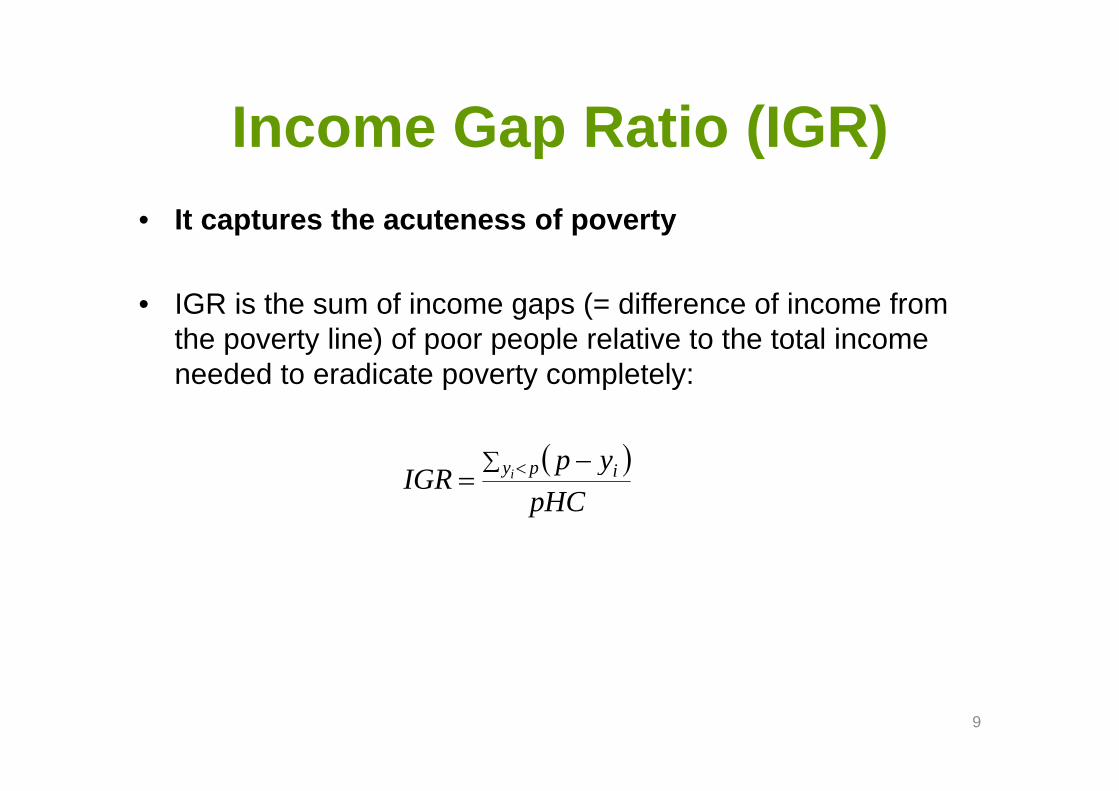
Income Gap Ratio (IGR)• It captures the acuteness of poverty
• IGR is the sum of income gaps (= difference of income from the poverty line) of poor people relative to the total income needed to eradicate poverty completely:
pHC
ypIGR py ii
9

Poverty Gap Ratio• A measure of resources required to eradicate poverty.
• PGR measures the average income needed to get all poor people to the poverty line, divided by the mean income (m):
• IGR and PGR measures are to some extent insensitive to the degree of poverty: – The same weight is given to all income gaps to p.– Inequality among the poor ignored
nm
ypPGR py ii
10

Poverty Numbers• According to the World Bank’s much cited “dollar-a-day”
international poverty line, which was revised in 2008 to $1.25 a day in 2005 prices, there are still 1.4 billion people living in poverty.
• This represents a decline from the 1.9 billion in 1981.
• This figure is higher than the 2004 estimate of 984 million made with the old measure of $1-a-day.
• Millennium Development Goals set out in the Millennium Declaration: Halve the proportion of the world’s people living on less than one dollar a day by 2015.
11

12

13

14

Source: World Bank, Development Research Group (2009).
a By 2005, the region had achieved the 2015 target of halving poverty, using 1990 as the baseline.
15

The Functional Impact of Poverty - Credit• The poor are unable to obtain loans that can be used to better
their lives by allowing them to invest in productive activities. The failure occurs for several reasons:
1. Lack of collateral that can be put up for loan repayment.
2. It can be argued that the incentives to repay for the poor are limited, independent of their inability to put up collateral.
– Each additional unit of money in hand means far more to a poor individual than to a rich individual. The calculus of whether or not to default on the loan is naturally twisted in favor of default.
16

income
Incentives to repay for the poor and rich: a comparison
utility
Y poor Y rich
17

The Functional Impact of Poverty - Credit• It can be argued that the assumption of similar loan size
is not sensible.– The poor do get smaller loans, and precisely for the reason just
described.
• We are not taking the costs of default into account. Perhaps the stakes are higher for the poor: they have more to lose from lack of future access to credit. – It is possible that the poor have more to lose from default, but
this only reinforces our argument that initial poverty reduces access to the credit market
18

The Functional Impact of Poverty - Nutrition and labor markets
A simple story of energy balance within the human body:
1. Energy Input
2. Resting metabolism
3. Energy required for work
4. Storage and borrowing
– At least in the long run there has to be some form of balance between item 1 and the sum of item 2 and 3.
– In the short or medium run the body may run an excess or deficit of energy.
– A sustained deficit leads to undernutrition, and ultimately, the breakdown of the body.
19

income
The capacity curve.
Work Capacity
What happens as we move from left to right along the x axis?
Initially, most of this nutrition goes into maintaining resting metabolism, very little extra energy is left over for work. So work capacity in this region is low and does not increase too quickly.
Once resting metabolism is taken care of, there is a marked increase in work capacity.
This phase is followed by a phase of diminishing returns.
20

Nutrition and labor markets • Labor markets generate income and therefore create the source of
nutrition, and good nutrition in turn affects work capacity that generate income.
• There is a cycle here, and this cycle alerts us to the possibility that in developing countries, a significant fraction of the population may be caught in a poverty trap.
• This is the functional aspect of undernutrition: apart from being of social and ethical concern in its own right, it has an impact on the ability to earn.
21

The unequal sharing of poverty
• One of the great tragedies of poverty is that the poor may not afford to share their poverty equally.
• Unequal sharing because a certain minimum of nutrition have to be devoted to each person in order for that person’s life to be productive.
• The potential gain of unequal division is that it helps some individuals in the household to be minimally productive under extreme circumstances.
22

income
The capacity curve and unequal allocation
Work Capacity
Y*Y*/2
A
B Equal consumption allocation has no effect on total household work capacity
23

income
The capacity curve and unequal allocation
Work Capacity
Y/2 Y
A
B
Unequal consumption allocation creates greater household work capacity than equal allocation.
24

The receiving end• How does the unequal sharing look like? Who are the
individuals at the bottom?
• They are typically the old.– Nutrition and medical care serve a functional role, they
provide the foundation for income-earning capabilities in the future. The old are in less of a position to provide these capabilities.
• They are typically females, both adults and children.– Unless we believe that men are more fit than women for
tasks of various sorts, we cannot make the case for discrimination against women.
25

Poverty and gender gaps
• Females receive systematically lower nutrition than men.
• It may not be enough to simply observe that women receive less nutrition than men: the question is whether they receive less nutrition relative to their requirement.
• The evidence on this matter is not clear-cut.
26

Calorie intakes and requirements by sex in rural Bangladesh (1975-76)
MALE FEMALE
Age group Calorie intake
Calorie requirement
Ratio Calorie intake
Calorie requirement
Ratio
10‐12 1,989 2,600 0.77 1,780 2,350 0.76
13‐15 2,239 2,753 0.81 1,919 2.224 0.86
16‐19 3,049 3,040 1.00 2,110 2,066 1.02
20‐39 2,962 3,122 0.95 2,437 1,988 1.23
40‐49 2,866 2,831 1.01 2,272 1,870 1.21
50‐59 2,702 2,554 1.06 2,193 1,771 1.24
60‐69 2,569 2,270 1.13 2,088 1,574 1.33
70+ 2,617 1,987 1.32 1,463 1,378 1.06
27

Poverty and gender gaps• A female child may not be given education or her
education may be neglected because education of female children is not expected to pay off.
• The World Development Report (1996) noted that for low-income countries as a whole, there were almost twice as many female illiterates as there were males in 1995.
28

Sibling Rivalry: Evidence from Ghana• Garg and Morduch (1997) explored how economic
constraints might create gender differences in Ghana.
• They shows that children aged 12-23 with three siblings are over 50% more likely to attend middle or secondary school when all three of their siblings are sisters than when the three are brothers.
• The study illustrates the importance of considering issues of gender within the context of markets and institutions available to households.
29

Poverty and gender gaps
• Sex-based differences in infant mortality may explain a large amount of discrimination.
• The survivors may be treated relatively equally, but in looking for this we fail to count the dead (or never born).
30

Sex ratios (females per 100 males) in Asia, 2000
50
60
70
80
90
100
110
120
Afghanistan
Armen
iaAzerbaijan
Bahrain
Banglade
shBh
utan
Brun
eiBu
lgaria
Cambo
dia
China
India
Indo
nesia Iran
Iraq
Iraq
Israel
Israel
Jordan
Kazakhstan
Korea DP
RKo
rea Re
pKo
rea Re
pKu
wait
Kyrgyzstan
Lao PD
RLebano
nMalaysia
Malaysia
Mon
golia
Myanm
arNep
alOman
Pakistan
Philipp
ines
Qatar
Saud
i Arabia
Singapore
Sri Lanka
Tajikistan
Thailand
Turkey
Turkmen
istan
United Arab
Emira
tes
Uzbekistan
Vietnam
Females per 100 males 100 European Average
31