POVERTY REDUCTION STRATEGY PAPER · 2010-06-03 · and services. It is a critical pillar of...
39
POVERTY REDUCTION STRATEGY PAPER: 1 ST QUARTERLY PROGRESS REPORT FY 2008/09 PRSP Secretariat - Finance Division Government of Pakistan
Transcript of POVERTY REDUCTION STRATEGY PAPER · 2010-06-03 · and services. It is a critical pillar of...
POVERTY REDUCTION STRATEGY PAPER:
1ST QUARTERLY PROGRESS REPORT FY 2008/09
PRSP Secretariat - Finance Division Government of Pakistan

1st Quarterly Progress Report FY 2008/09 Poverty Reduction Strategy Paper (PRSP)
2
List of Acronyms AJ&K Azad Jammu & Kashmir BISP Benazir Income Support
Programme CCT Conditional Cash Transfers CDA Capital Development
Authority CDWA Clean Drinking Water for All CDWI Clean Drinking Water
Initiative CFI Commercial Financial
Institution CPI Consumer Price Index CSW Civil Society Wing DAP Di-Ammonium Phosphate EOBI Employees’ Old Age Benefit
Institution FANA Federally Administered
Northern Areas FATA Federally Administered Tribal
Areas FDI Foreign Direct Investment FRDLA Fiscal Responsibility and
Debt Limitation Act FSP Food Support Programme FY Fiscal Year GDP Gross Domestic Product ICT Islamabad Capital Territory IFA Individual Finance Assistance KPP Khushal Pakistan
Programme LFS Labour Force Survey LHWs Lady Health Workers LSM Large Scale Manufacturing
MDGs Millennium Development Goals
MF Microfinance MFB Microfinance Banks
MFI Microfinance Institutions MFP Microfinance Providers MSP Macroeconomic Stabilization
Programme NCRCL National Centre for
Rehabilitation of Child Labour
NEMIS National Education Management Information System
NFNE Non-Food Non-Energy NGO Non-Governmental
Organization NWFP North Western Frontier
Province PBM Pakistan Bait-ul-Mal PFSS Punjab Food Support Scheme PMN Pakistan Microfinance
Network PPAF Pakistan Poverty Alleviation
Fund PPPs Public Private Partnerships PRSP Poverty Reduction Strategy
Paper PSDP Public Sector Development
Programme PSLM Pakistan Social and Living
Standards Measurement Survey
PWP Peoples’ Works Programme RSPs Rural Support Programmes SBP State Bank of Pakistan SPI Sensitive Price Indicator TT-1 Tetanus Toxoid-1 TT-2+ Tetanus Toxoid-2+ WPI Wholesale Price Index
1st Quarterly Progress Report FY 2008/09 Poverty Reduction Strategy Paper (PRSP)
3
Table of Contents
List of Tables and Figures ............................................................................................................... 4 1 Introduction .......................................................................................................................... 5 2 Trends in Macroeconomic Indicators ..................................................................................... 7
2.1 Agriculture ..................................................................................................................... 7 2.2 Industry .......................................................................................................................... 8 2.3 Services .......................................................................................................................... 8 2.4 Inflation .......................................................................................................................... 9 2.6 Trade Balance .............................................................................................................. 10 2.7 Current Account Balance ............................................................................................. 10
3 Pro-Poor Budgetary Expenditures ........................................................................................ 11
3.1 PRSP Expenditures by Province and Sectors ............................................................... 13 3.2 PRSP Expenditures on the Sub Sector of Education ................................................... 14 3.3 PRSP Expenditures on the Sub Sector of Health ......................................................... 16
4 Protecting the Poor and the Vulnerable ................................................................................ 19
4.1 Zakat ............................................................................................................................ 19 4.2 Employees’ Old Age Benefit Institution (EOBI) ......................................................... 20 4.3 Pakistan Bait-ul-Mal (PBM) ........................................................................................ 21 4.4 Microfinance ................................................................................................................ 22 4.4.1 Active Borrowers by Peer Group ............................................................................ 23 4.4.2 Active Savers by Peer Group ................................................................................... 23 4.4.3 Active Policy Holders by Peer Group...................................................................... 24 4.4.4 Summary of Microcredit Indicators ......................................................................... 25 4.5 New Initiatives ............................................................................................................. 27 4.5.1 Benazir Income Support Programme (BISP) ........................................................... 27 4.5.2 Punjab Food Support Scheme (PFSS) ..................................................................... 27 4.5.3 Punjab Sasti Roti Programme .................................................................................. 27
5 Monitoring of PRSP Output (Intermediate) Indicators ......................................................... 28
5.1 TT- Immunization Coverage ........................................................................................ 28 5.2 Lady Health Workers (LHWs) ..................................................................................... 29 5.3 Land Distribution ......................................................................................................... 29 5.4 People Works Programme (PWP)-I ............................................................................. 30 5.5 Employment ................................................................................................................. 31
Annex I .......................................................................................................................................... 32 Annex II ......................................................................................................................................... 35 Annex III ....................................................................................................................................... 38
1st Quarterly Progress Report FY 2008/09 Poverty Reduction Strategy Paper (PRSP)
4
List of Tables and Figures
Table 2.1 Growth in Key Macroeconomic Indicators ..................................................................... 9 Table 3.1 : PRSP Budgetary Allocations and Expenditures Q1 FY 2008/09 ................................ 11 Table 3.2: PRSP Expenditures During Quarter 1 FY 2008/09 Sectors and Provinces...............…13 Table 3.3: Total Current and Development PRSP Expenditure Q1 FY 2008/09 .......................... 14 Table 3.4: Education Expenditures Q1 FY 2008/09 ...................................................................... 15 Figure 3.1: Share of Development and Current Expenditures in Education Q1 FY 2008/09........15 Table 3.5: Percentage Distribution of Education Expenditures in Q1 FY 2008/09 by Provinces and Sectors of Education ............................................................................................................... 16 Table 3.6: Health Expenditures Q1 FY 2008/09 ........................................................................... 17 Figure 3.2: Share of Development and Current Expenditure in Health Q1 FY 2008/09 .............. 17 Table 3.7: Percentage Health Expenditures Province Wise Q1 FY 2008/09 ................................ 18 Table 4.4: Microfinance Analysis ................................................................................................ 22 Table 4.5: Active Borrowers by Peer Group ................................................................................. 23 Figure: Active Borrowers 1st Quarter FY 2007/08……………………………………………….23 Figure: Active Borrowers 1st Quarter FY 2008/09 ........................................................................ 23 Table 4.6: Active Savers by Peer Group ....................................................................................... 24 Figure: Active Savers 1st Quarter FY 2007/08……………………………………………………24 Figure: Active Savers 1st Quarter FY 2008/09 .............................................................................. 24 Table 4.7: Active Policy Holders by Peer Group .......................................................................... 24 Figure: Active Policy holders 1st Quarter FY 2007/08………………………………...…………25 Figure: Active Policy holders 1st Quarter FY 2008/09 .................................................................. 25 Table 5.1: TT- Immunization Coverage for Pregnant Women ...................................................... 28 Table 5.2: Lady Health Workers ................................................................................................... 29 Table 5.3: Allotment of State and Resumed Land ......................................................................... 30 Table 5.4: Number of PWP Schemes approved under each category ........................................... 31 Table 5.5: Labour Force and Employed Labour Force ................................................................. 31
1st Quarterly Progress Report FY 2008/09 Poverty Reduction Strategy Paper (PRSP)
5
1 Introduction 1.1 This Poverty Reduction Strategy Paper (PRSP) quarterly progress report for Q1 of FY 2008/09 is the 17th report, since the monitoring of pro-poor budgetary and non-budgetary expenditures began in 2001. This report is also first of the quarterly reports since the PRSP-II was finalized in FY 2008/09. The PRSP-II covers the three-year period FY 2008/09 – FY 2010/11. The PRSP-I has been a successful strategy, as sound progress has been made in all pro-poor sectors during the last seven years. During 2003 onwards, the Strategy focused on four pillars, i.e. (i) Accelerating Economic Growth; (ii) Improving Governance; (iii) Investing in Human Capital; and (iv) Targeting the Poor and the Vulnerable. Taking into account recent socio-economic developments, both domestic and international, the PRSP-II has been built upon the government’s nine-point economic reform-poverty reduction agenda encompassing the following nine pillars, i.e. (i) Macroeconomic Stability and Real Sector Growth; (ii) Protecting the Poor and the Vulnerable; (iii) Increasing Productivity and Value Addition in Agriculture; (iv) Integrated Energy Development Programme; (v) Making Industry Internationally Competitive; (vi) Human Development for the 21st Century; (vii) Removing Infrastructure Bottlenecks through Public Private Partnerships (PPPs); (viii) Capital and Finance for Development; and (ix) Governance for a Just and Fair System. 1.2 The economic crisis felt worldwide gripped Pakistan’s economy as well during initial months of FY 2008/09. The unsteady and unsustainable balance of payment position and heavy reliance of the government on borrowings from State Bank of Pakistan (SBP) remained the major sources of macroeconomic instability in Quarter 1 of FY 2008/09. On the external front, high international commodity prices, global financial crisis, and slowing economic growth worldwide aggravated Pakistan’s economic vulnerability. On the domestic front, economic growth slowed down due to a combination of factors e.g. energy shortages, high fuel prices, and unsatisfactory crop harvests. 1.3 This Quarterly Progress Report covers the status of tracking poverty reduction efforts during first quarter of FY 2008/09 (July – September). Section 1 of the report briefly introduces the PRSP-II and its nine pillars. Section 2 gives an overview of Pakistan’s economy along with a brief discussion on key economic indicators. This section also compares the economic progress of Quarter 1 FY 2008/09 with Quarter 1 of FY 2007/08. Section 3 portrays an analysis of the budgetary expenditures against allocations for 17 pro-poor sectors in general and education and health sectors in particular. While section 4 highlights both budgetary and non-budgetary strategies and methods that directly provide social protection to the poor, and also illustrates expenditure tracking of the non-budgetary programmes, section 5 briefly discusses monitoring of PRSP output (intermediate) indicators.

1st Quarterly Progress Report FY 2008/09 Poverty Reduction Strategy Paper (PRSP)
6
Box 1.1: Nine Pillars of PRSP-II The Poverty Reduction Strategy Paper (PRSP)-II is built upon the following nine pillars:
Pillar I: Macroeconomic Stability and Real Sector Growth: First and foremost, the government’s top priority is regaining macroeconomic stability, which will act as an umbrella over all other government policies. It is on the basis of the macroeconomic framework that assumptions and targets of all policies will be set.
Pillar 2: Protecting the Poor and the Vulnerable: Social safety nets that provide minimal safeguard for the poor and the vulnerable which must form an essential element of any poverty reduction strategy. The chapter comprises a range of programmes and policies such as social insurance and assistance; income transfers to the very poor; support to vulnerable households to manage risks; and investment in human capital and physical assets to strengthen their resilience.
Pillar III: Increasing Productivity and Value Addition in Agriculture: Agriculture contributes one of the largest shares in the country’s Gross Domestic Product (GDP). Agriculture will receive high priority in the PRSP-II as bulk of the poor are concentrated in rural areas.
Pillar IV: Integrated Energy Development Programme: Ensuring energy security and energy efficiency will be amongst the government’s top priorities in order to tackle the current energy crisis and enable sufficient supply of energy for domestic as well as commercial use.
Pillar V: Making Industry Internationally Competitive: The government realizes the need to improve the general business environment to provide a conducive platform for efficient economic activity.
Pillar VI: Human Development for the 21st Century: Human development is a prerequisite for improving all aspects of the quality of life of citizens. The government is aware that improvement in social indicators needs to be expedited and has, therefore, adopted human resource development as a priority area particularly in the areas of (i) education; (ii) health; (iii) safe water and sanitation; (iv) population planning; and (v) gender equality.
Pillar VII: Removing Infrastructure Bottlenecks through Public Private Partnerships (PPPs): The government’s vision for economic growth and poverty reduction sets ambitious targets, which will require massive investment in quality and affordable infrastructure (roads and highways, dams, energy, transport) to sustain high rates of private sector led growth, enhance economic competitiveness and optimize Pakistan’s locational advantage. This will be a primary objective during the PRSP-II period and beyond.
Pillar VIII: Capital and Finance for Development: Financial institutions allocate resources to the most efficient utilization ensuing rapid accumulation of physical and human capital and technological progress, which in turn leads to higher economic growth - a prerequisite for poverty alleviation. The pillar highlights the financial development path of Pakistan.
Pillar IX: Governance for a Just and Fair System: Governance is the manner in which public institutions and officials acquire and exercise authority to shape public policy and provide public goods and services. It is a critical pillar of Pakistan’s Poverty Reduction Strategy, because it is the poor that especially suffer from lack of security, empowerment and opportunities. Source: Poverty Reduction Strategy Paper (PRSP)-II, FY 2008/09 - FY 2011/11, Finance Division, Government of Pakistan.

1st Quarterly Progress Report FY 2008/09 Poverty Reduction Strategy Paper (PRSP)
7
2 Trends in Macroeconomic Indicators 2.1 During Q1 FY2008/09, there is some progress on containing fiscal imbalances, with the government moving bravely to reduce subsidies, containing growth in unnecessary spending, and focusing on increasing revenues. The result of these efforts has been encouraging improvements in some fiscal indicators, including a sharp fall in the fiscal deficit from 1.6 percent of Gross Domestic Product (GDP) during Q1 FY 2007/08 to 1 percent of GDP in Q1 FY 2008/09 (see Table 2.1). This figure appears consistent with the target set in the Macroeconomic Stabilization Programme (MSP) of the government. The supply side improvements have been reinforced by the reasonably better performance of crops during Kharif season FY 2008/09 cropping season and growth in services sector. This has improved prospects for low inflation; while inflation is still very high, there is an expectation that it will decelerate sharply in the subsequent quarters of the fiscal year. While the country’s macroeconomic conditions are not worsening further, the disparities in key economic indicators are nonetheless very large and resolving them will require disciplined efforts over an extended timeframe. This challenge is all the greater because of the difficult international economic environment; it has restricted the country’s ability to tap international capital markets and carries risks for other external receipts (exports, remittances, Foreign Direct Investment/FDI, etc.). 2.1 Agriculture 2.2 The initial months’ review of agriculture sector’s performance in FY 2008/09, suggests that agricultural growth in the current fiscal year could be significantly better as compared to FY2007/08.This expectation is based on a record rice harvest of 6.5 million tones, and a small improvement in cotton production during Kharif season. Some important policy measures announced in the FY 2008/09 budget (and later) to encourage farmers may have played a role. These include an increase in subsidy on Di-Ammonium Phosphate (DAP) fertilizer (to promote a balanced mix of fertilizers) and exemption of fertilizers and pesticides from excise (see Box 2.1 for the agriculture package in Federal Budget FY 2008/09).1 If fully implemented, the package would encourage mixed use of fertilizers, increased use of pesticides to cope with fast spreading disease, enhanced farmer confidence to earn and save more, improved water availability in farms and increased agricultural production. 2.3 Rice crop primarily benefited from increases in farming along with record high rice prices at sowing time. Cotton harvest, which had declined during the last three years, rose by 3.5 percent to 12.1 million bales during FY 2008/09.2 Sugarcane crop suffered because of disappointment among farmers in the preceding season. Not only realized prices were lower than the anticipated prices (as per announced procurement prices), delays in the beginning of crushing season and payments also placed them at a disadvantage. As a result, for the FY 2008/09 cropping season growers switched from sugarcane to other crops. Consequently, the area allotted to sugarcane fell by 16.0 percent. The wheat production target had been fixed at 25.0 million
1 Agriculture-Package was announced in Federal Budget FY 2008/09. 2 This section comprise of excerpts from SBP First Quarterly Report FY 2008/09.
1st Quarterly Progress Report FY 2008/09 Poverty Reduction Strategy Paper (PRSP)
8
tonnes for FY 2008/09 season. By mid November 2008, wheat plantation registered 9.3 percent rise over the same period last year.
Box 2.1: Agriculture-package in Federal Budget FY 2008/09 Agriculture package in the Federal Budget aims at reducing cost of production, increasing output, enhancing water availability and raising income of the farming sector. The package includes following measures: 1. Higher subsidy for farming sector of Rs 32 billion compared with Rs 25 billion in FY 2007/08. 2. Subsidy on DAP raised by 113.0 percent or by Rs 530 to Rs 1,000/50kg bag which would reduce
the price of DAP and encourage balanced use of fertilizers which in turn will lead to higher crop yields.
3. Allocation of Rs 75 billion for building new dams. 4. Exemption of general sales tax on fertilizers and pesticides. 5. Elimination of 5 percent excise duty on crop insurance to encourage crop insurance scheme. 6. Withdrawal of 10 percent customs duty on import of rice seed to enhance plantation of better seeds
for higher rice yield. 7. Allow duty free import of bulldozers/laser land leveling technology to help improve water
efficiency. 8. Under White Revolution Programme Rs 1.5 billion to be spent on dairy development.
2.2 Industry 2.4 Growth of Large Scale Manufacturing (LSM) continued to decline during Quarter 1 FY 2008/09. It registered a negative growth of 6.2 percent in Quarter 1 FY2008/09 as against a high growth of 7.3 percent in Q1 FY 2007/08, see table 2.1 below. This disappointing outcome was a result of a number of factors including: severe energy shortages, deterioration in domestic law & order situation, impact of pass through of international oil prices, rupee depreciation, and most importantly, weak external demand on the back of global recession and slowdown in domestic demand. 2.5 Within the non-agricultural based industries section, consumer durables (cars and jeeps, motorcycles, refrigerators, deep freezers, TV sets) registered a decline of 31.2 percent in production during Q1 FY 2008/09. On the contrary during Q1 FY 2008/09, fertilizers, engineering, wood and chemicals sub sectors registered positive growth in their production. In order to achieve and sustain a high growth route, it is increasingly important for the sector to focus on removing structural constraints that hinder its path to high growth in the longer term. Indeed, government’s immediate measures to tackle the ongoing energy crisis remain vital in this regard. 2.3 Services 2.6 The services sector has exhibited resilience to fluctuations in economic activity in recent years. Key indictors of wholesale and retail indicate a clear fall in trading activities during Quarter 1 FY 2008/09, mainly due to significant decline in manufacturing activities and relative softening demand for imported consumer goods. A slowdown also reflects the impact of substantial depreciation of the rupee, as well as the substitution effect as people prioritize their consumption of essential goods given high inflation in the economy. In contrast to a number of adverse developments, an improvement in agriculture growth will support increases in value

1st Quarterly Progress Report FY 2008/09 Poverty Reduction Strategy Paper (PRSP)
9
addition in the trade sub sector. The major impetus to growth in finance and insurance is from an expected rise in SBP profits, which is expected to be supplemented by improved performance of the insurance sector, strong FDI inflow, as well as reasonable commercial bank profits resulting from recent government measures to ease liquidity constraints in the banking system.
Table 2.1 Growth in Key Macroeconomic Indicators Period Selected Economic Indictors Quarter 1 FY 2007/08 Quarter 1 FY 2008/09
Growth Rate July-Sep Large Scale Manufacturing 7.3 - 6.2 Jul-Nov Exports 6.5 12.7 Jul-Nov Imports 18.4 16.5 Nov. Inflation (CPI)* 7.6 19.1
As Percentage of GDPJuly-Sep Fiscal Deficit 1.6 1.0 Jul-Nov. Trade Deficit 4.6 4.9 Jul-Nov. Current A/c Deficit 2.8 3.9
Source: State Bank of Pakistan Quarterly Reports 1 FY 2007/08 and FY 2008/09. * CPI: Consumer Price Index. 2.4 Inflation 2.6 Inflationary pressures remained strong in the economy during the first quarter of FY 2008/09. In particular, Consumer Price Index (CPI) and the Sensitive Price Indicator (SPI) have seen strong increases throughout FY 2008/09. On average, CPI inflation during Q1 FY 2008/09 was in the range of 19-20 percent compared with 7.6 percent during Q1 FY 2007/08. However, after recording strong growth during the first two months of FY 2008/09, a significant decline in Wholesale Price Index (WPI) inflation has been observed during the later months. Similar to CPI inflation, both measures of core inflation, Non-Food Non-Energy (NFNE), continued to accelerate. Strength in core inflation is indicating the persistence of inflationary pressures. As a result of the tight monetary stance by SBP, inflationary pressures are likely to ease from second quarter of FY 2008/09. The persistence of inflationary pressures also requires sustained macroeconomic discipline in the subsequent quarters. 2.5 Fiscal Balance 2.7 The large fiscal deficit in FY2007/08 and the adverse economic consequences of its financing placed fiscal consolidation at the top of government’s Macroeconomic Stabilization Programme for FY2008/09. The fiscal consolidation programme of the government for FY 2008/09 is based on a two-pronged strategy and includes:
Substantial reduction in overall budget deficit, as a percentage of GDP, through a mix of cut in expenditures (as a share of GDP) and a rise in tax revenues (as a share of GDP); and
A gradual elimination of government budgetary borrowings from SBP. 2.8 As a result, the fiscal performance in Q1 FY 2008/09 improved consequent to the policy shift, with the overall fiscal deficit estimated to have dropped to 1 percent of annual GDP, which is also consistent with the annual fiscal deficit target set under the MSP.
1st Quarterly Progress Report FY 2008/09 Poverty Reduction Strategy Paper (PRSP)
10
2.6 Trade Balance 2.9 The strong import growth of 21.6 percent outstripped a healthy 11.9 percent rise in exports during Q1 FY 2008/09. As a result, trade deficit expanded to 4.9 percent of GDP during Quarter 1 FY 2008/09 compared with 4.6 percent in the same Quarter last fiscal year. During Jul-Nov this fiscal year, strong growth in imports, mainly due to higher import prices, outpaced the otherwise substantial improvement in export growth causing the trade deficit for the period to widen by US$ 1.4 billion. 2.7 Current Account Balance 2.10 Pakistan’s external account remained under stress through Jul-Nov FY2008/09, as acceleration in the growth of the current account deficit, coupled with sharply reduced financial & capital account inflows drew the country’s foreign currency reserves to perilously low levels. Pakistan’s current account deficit increased considerably to 3.9 percent during Q1 FY 2008/09 compared to 2.8 percent during the same period i.e. Q1 FY 2007/08. As in the later half of FY 2007/08, the expansion in current account deficit during Jul-Nov FY 2008/09 was mainly driven by a substantial acceleration in import growth. 2.11 The above discussion of key economic indicators suggests that in FY 2008/09, economy needs effective policies and implementation of reforms to regain macroeconomic stability in the midst of a challenging year. Moreover, lowering inflation and limiting the twin deficits, in particular, would be crucial for a transition from a stabilization framework to one focused on reviving growth. The recent trends in key macroeconomic variables are, therefore, quite encouraging. Amongst the biggest challenges for the government for acceleration in growth in the following quarters may require further adherence to fiscal discipline, and a significant shift in taxation and expenditures with a supportive increase in development spending, as well as a targeted increase in spending on social safety nets.

1st Quarterly Progress Report FY 2008/09 Poverty Reduction Strategy Paper (PRSP)
11
3 Pro-Poor Budgetary Expenditures
3.1 This section reviews the pro-poor budgetary expenditures during Q1 FY 2008/09. The PRSP actual expenditures incurred in 17 pro-poor sectors during Q1 FY 2008/09, and projected allocations for overall FY 2008/09 are reported in Table 3.1. As notified in last year’s Annual Progress Report the 17 pro-poor sectors have been revisited for the PRSP-II period and beyond. Table 3.1 reflects PRSP budgetary expenditure tracking under the new sectors. Changes are not drastic; additional sub sectors have been incorporated in selected sectors mainly, subsidies; Food Support Programme; agriculture; health; and education (see footnote in Table 3.1). In accordance with the promulgation of the Fiscal Responsibility Debt and Limitation Act (2005) the Government of Pakistan is committed to spend not less than 4.5 percent of annual GDP on these social and poverty related sectors. The analysis of PRSP expenditures with reference to GDP would be more useful in subsequent quarters.
Table 3.1 : PRSP Budgetary Allocations and Expenditures Q1 FY 2008/09
Sectors Allocations and Expenditures
(Rs million) Percentage expenditures incurredAllocations
FY 2008/09 Expenditures
Q 1 Roads, Highways & Bridges 46,705 11,036 23.6 Water Supply & Sanitation 9,074 3,009 33.2 Education 195,602 46,237 23.6 Health 43,935 13,383 30.5 Population Planning 4,084 1,297 31.8 Social Security & Welfare^ 37,040 2,282 6.2 Natural Calamities 3,172 372 11.3 Agriculture* 91,231 9,876 10.8 Land Reclamation 2,618 458 17.5 Rural Development 9,553 828 8.7 Law & Order^^ 46,603 21,244 45.9 Low Cost Housing 1,327 46 3.5 Justice Administration^^^ 5,890 2,084 35.4 Subsidies** 231,112 59,197 25.6 Food Support Programme (FSP)^^^^ 15,250 1,100 7.2 People’s Works Programme-I 2,612 0 0 People’s Works Programme-II*** 14,184 3,020 21.3 Total 759,992 175,433 23.08 Source: Civil Accounts provided by Accountant General Offices. Quarterly expenditures * Includes irrigation, fisheries, forestry, and livestock. ** Includes subsidies on financial and fiscal affairs, commercial affairs and food. *** Includes schemes in the area of electricity, gas, water supply & sanitation and roads. Annual allocations ^ Benazir Income Support Programme is included in Social Security and Welfare in the federal budgetary allocations. However, no releases were made in Q1. Expenditure in Pakistan Bait-ul-Mal (excluding FSP) is also included. ^^ Law & order includes both current and development allocations. ^^^ Justice Administration includes higher and subordinate judiciary. ^^^^ Punjab Food Support Scheme is included under Punjab budgetary allocations. However, no releases were incurred in Q1.
1st Quarterly Progress Report FY 2008/09 Poverty Reduction Strategy Paper (PRSP)
12
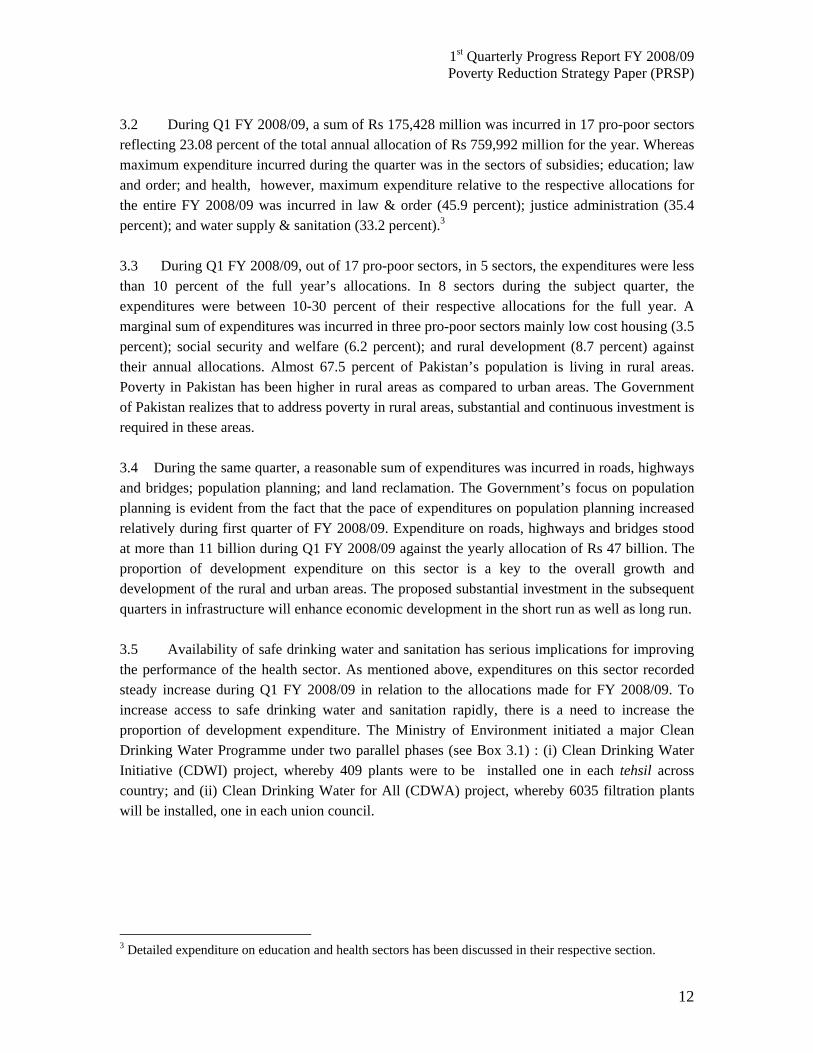
3.2 During Q1 FY 2008/09, a sum of Rs 175,428 million was incurred in 17 pro-poor sectors reflecting 23.08 percent of the total annual allocation of Rs 759,992 million for the year. Whereas maximum expenditure incurred during the quarter was in the sectors of subsidies; education; law and order; and health, however, maximum expenditure relative to the respective allocations for the entire FY 2008/09 was incurred in law & order (45.9 percent); justice administration (35.4 percent); and water supply & sanitation (33.2 percent).3 3.3 During Q1 FY 2008/09, out of 17 pro-poor sectors, in 5 sectors, the expenditures were less than 10 percent of the full year’s allocations. In 8 sectors during the subject quarter, the expenditures were between 10-30 percent of their respective allocations for the full year. A marginal sum of expenditures was incurred in three pro-poor sectors mainly low cost housing (3.5 percent); social security and welfare (6.2 percent); and rural development (8.7 percent) against their annual allocations. Almost 67.5 percent of Pakistan’s population is living in rural areas. Poverty in Pakistan has been higher in rural areas as compared to urban areas. The Government of Pakistan realizes that to address poverty in rural areas, substantial and continuous investment is required in these areas. 3.4 During the same quarter, a reasonable sum of expenditures was incurred in roads, highways and bridges; population planning; and land reclamation. The Government’s focus on population planning is evident from the fact that the pace of expenditures on population planning increased relatively during first quarter of FY 2008/09. Expenditure on roads, highways and bridges stood at more than 11 billion during Q1 FY 2008/09 against the yearly allocation of Rs 47 billion. The proportion of development expenditure on this sector is a key to the overall growth and development of the rural and urban areas. The proposed substantial investment in the subsequent quarters in infrastructure will enhance economic development in the short run as well as long run. 3.5 Availability of safe drinking water and sanitation has serious implications for improving the performance of the health sector. As mentioned above, expenditures on this sector recorded steady increase during Q1 FY 2008/09 in relation to the allocations made for FY 2008/09. To increase access to safe drinking water and sanitation rapidly, there is a need to increase the proportion of development expenditure. The Ministry of Environment initiated a major Clean Drinking Water Programme under two parallel phases (see Box 3.1) : (i) Clean Drinking Water Initiative (CDWI) project, whereby 409 plants were to be installed one in each tehsil across country; and (ii) Clean Drinking Water for All (CDWA) project, whereby 6035 filtration plants will be installed, one in each union council.
3 Detailed expenditure on education and health sectors has been discussed in their respective section.
1st Quarterly Progress Report FY 2008/09 Poverty Reduction Strategy Paper (PRSP)
13
Box 3.1: Clean Drinking Water for All (CDWA) The federal government launched a mega project, namely, Clean Drinking water Programme, at a cost of Rs 7,872 million in FY 2004/05, envisaging the installation of one water filtration plant in each union council.
The Ministry of Science & Technology was assigned the responsibility for analyzing the water quality in these sites and recommending the type of plant to install. Almost all the sites have been surveyed, and reports on most of them have been received.
The CDWA project was approved on April 16th, 2006 to install 6035 water filtration plants, one at each union council of the country.
After thorough consultations and discussions with stakeholders and the experience of Phase-I of the programme (CDWI), the technology and implementation methodology of the CDWA Project was improved. The number of plants to be installed under the Project was also enhanced to 6585 by including leftover plants of CDWI Project in the total figure.
Source: Ministry of Industries, Production & Special Initiatives, Government of Pakistan, 2008. 3.1 PRSP Expenditures by Province and Sectors 3.6 PRSP expenditures by the federal and provincial governments during Q1 FY 2008/09 are shown in Table 3.2. The largest proportion of PRSP expenditures incurred by the federal and provincial governments, given in descending order are; subsidies (33 percent); education (26 percent); law and order (12 percent); health (8 percent); and roads, highways and bridges (6 percent). During the same quarter, no expenditures were incurred in People’s works Programme–I by the Ministry of Local Government and Rural Development. The federal government spent a large sum of expenditures on subsidies because of the high inflationary pressures as national and international food prices compelled the government to provide subsidies on essential food items during the subject quarter.
Table 3.2: PRSP Expenditures During Q 1 FY 2008/09 Sectors and Provinces (Rs million)
Sectors Federal Punjab Sindh NWFP Balochistan Pakistan Roads, highways & bridges 689 6,646 2,136 642 1,103 11,036 (6%) Water supply & sanitation 34 1,501 848 363 263 3,009 Education 7,912 19,339 9,873 6,440 2,673 46,237 (26%) Health 3,217 5,420 2,587 1,583 576 13,383(8%) Population planning 900 271 13 80 33 1,297 Social security & welfare 421 236 1,534 36 55 2,282 Natural calamities and disasters 65 201 3 103 0 372 Agriculture 1,581 4,155 2,306 956 878 9,876 (6%) Land reclamation 0 42 416 0 0 458 Rural development 34 401 39 219 135 828 Law & order 5,803 8,111 4,729 1,588 1,013 21,244 (12%) Low cost housing 0 46 0 0 0 46 Justice administration 222 1,043 463 220 100 2,048 Subsidies 58,629 0 1 567 0 59,197 (34%) Food Support Programme 1,100 - - - - 1100 People’s Works Programme-I 0 - - - - 0 People’s Works Programme-II 3,020 - - - - 3020 Total 83,627 47,412 24,948 12,617 6,829 175,433 Source: Civil Accounts provided by Accountant General Offices.
1st Quarterly Progress Report FY 2008/09 Poverty Reduction Strategy Paper (PRSP)
14
3.7 During the subject quarter, large proportion of expenditures relative to total expenditure in that particular province were incurred in the Sindh province in the sectors of education; law & order; and health during Q1 FY 2008/09 (40, 19 and 10 percent, respectively). No expenditure took place in low cost housing in Sindh during the same quarter. Substantial increases in expenditures took place in the Punjab province in education; law and order; and roads, highways and bridges (41, 17 and 14 percent, respectively), followed by 11 percent in the health sector. Largest proportion of spending in Balochistan incurred in education (39 percent); roads highways & bridges (16 percent); and law & order (15 percent) during Q1 FY 2008/09, while expenditure on 4 pro-poor sectors during the subject quarter remained untapped. During the same period, the Government of North Western Frontier Province (NWFP) spent a major proportion of expenditures on education (51 percent); law and order (13 percent); and health (13 percent) while no expenditure was incurred in land reclamation; and low cost housing.
Table 3.3: Total Current and Development PRSP Expenditure Q1 FY 2008/09
PRSP Expenditures (Rs million) Current Development Total 146,707 28,726 175,433
Source: Civil Accounts provided by Accountant General’s office. 3.8 Table 3.3 depicts that total development expenditure incurred during Q1 FY 2008/09 totaled Rs 28,726 million (16.37 percent of total expenditure). On the other hand, current expenditure equaled Rs 146,707 million, i.e. 83.63 percent of total expenditure. Increasingly high expenditure in subsidies; education; health; and law & order can be accounted for the large proportion of current expenditure in this period.
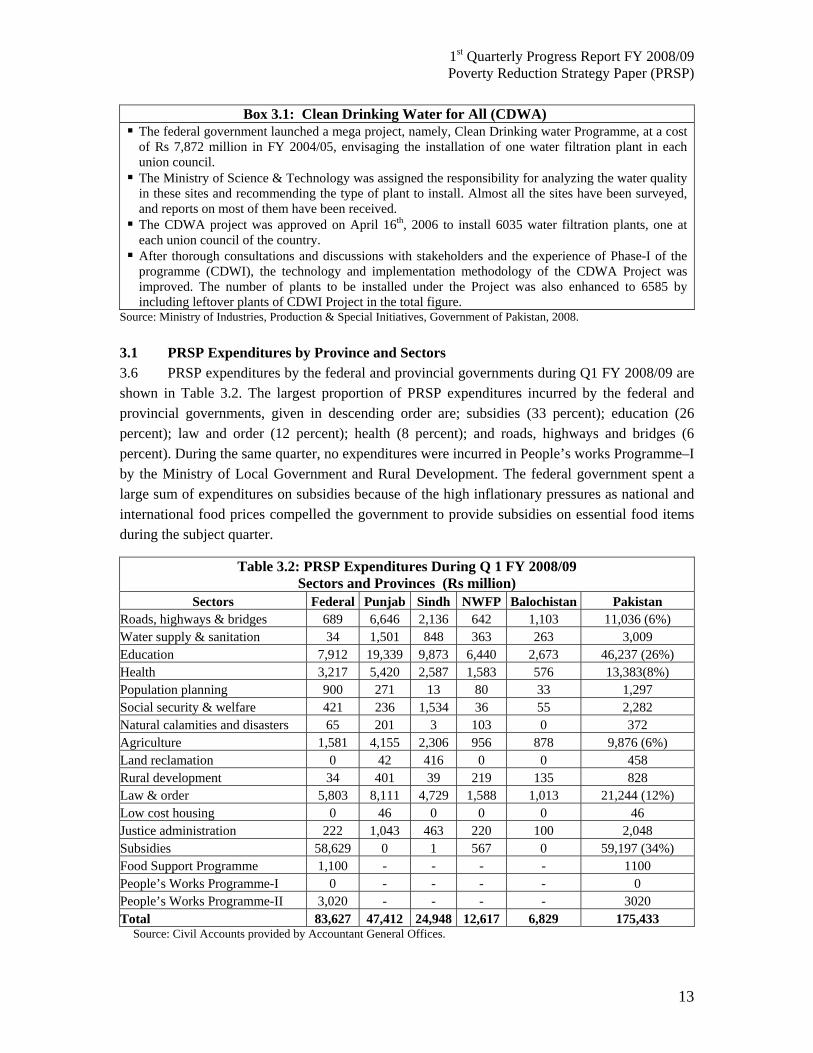
3.2 PRSP Expenditures on the Sub Sector of Education 3.9 A large proportion (26 percent) of the total PRSP expenditure was incurred in the education sector by federal and provincial governments during the first quarter in FY 2008/09. Table 3.4 gives data on proportionate expenditures incurred in various sectors in education during Q1 FY 2008/09. Of the total expenditure incurred in all sub sectors of education, a substantive amount, i.e. Rs 18, 216 million (39 percent) of the total expenditures were spent on primary education, followed by Rs 12,421 million and Rs 7,991 million i.e. 27 and 17 percent, incurred in secondary; and university/college education, respectively.
3.10 Table 3.4 also shows that a minimal amount of expenditure (1 percent), i.e. Rs 553 million was incurred in teacher and vocational training during the subject quarter. Small proportions of expenditure were spent on professional/technical universities; and on other educational institutions, i.e. 5 and 10 percent, respectively in the first quarter in FY 2008/09.
1st Quarterly Progress Report FY 2008/09 Poverty Reduction Strategy Paper (PRSP)
15
Table 3.4: Education Expenditures Q1 FY 2008/09 (Rs million)
Province/region Federal Punjab Sindh NWFP Balochistan Pakistan Primary Education 681 9,374 4,528 2,764 869 18,216 (39%)
Secondary Education 849 4,829 3,205 2,623 915 12,421 (27%)
University/College Education
4,831 1,475 1,120 433 132 7,991(17%)
Professional/Technical Universities
961 430 514 440 91 2,436 (5%)
Teacher and Vocational Training
11 455 53 1 33 553 (1%)
Other Educational Expenditures
579 2,776 453 179 633 4,620 (10%)
All Sectors of Education
7,912 19,336 9,873 6,440 2,673 46,237
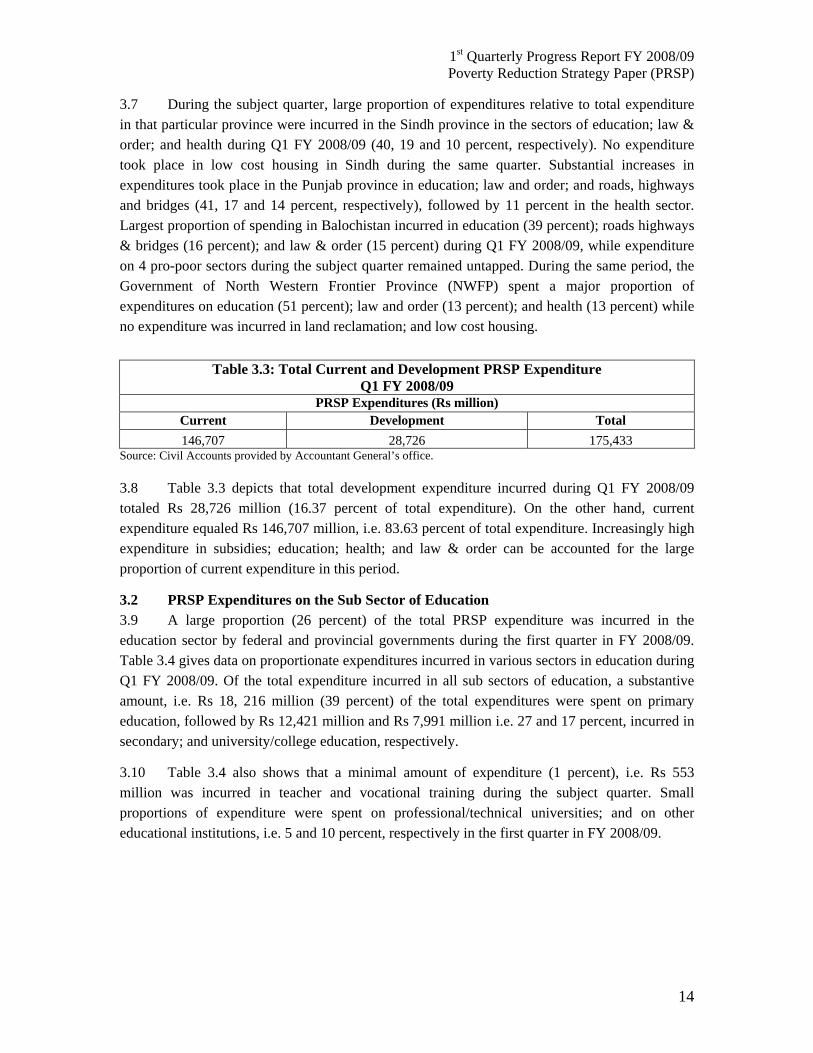
Source: Civil Accounts provided by Accountant General Offices. 3.11 Share of development expenditure as a percentage of total expenditure incurred in education during Q1 FY 2008/09 was highest at the federal level (33.28 percent). Compared to development expenditure, the overall share of current expenditure in education was much higher (91.49 percent) amounting to Rs 42,303 million of the total education expenditure, i.e. Rs 46,237 million. The NWFP province incurred the highest share of development expenditure (8.13 percent) relative to current; whereas Balochistan incurred the highest share of current expenditure (99.93 percent) amongst the provinces.
Figure 3.1 Share of Development and Current Expenditures in Education Q1 FY 2008/09
02040
6080
100
Percentage Share
Pakistan Federal Punjab Sindh NWFP Balochistan
Region
CurrentDevelopment
Source: PRSP Secretariat, Finance Division, Government of Pakistan. 3.12 Under the overall PRSP education expenditures, maximum expenditure was incurred in the primary education sector i.e. 39 percent of total expenditure in education during Q1 FY 2008/09. Overall expenditure incurred in secondary education and university/college education in Pakistan totalled 27 and 17 percent, respectively (Table 3.5). Only 1 percent of total expenditures were, however, incurred in teacher and vocational training during the quarter. The federal government spent a maximum of more than 73 percent expenditure on higher education (general, as well as, professional colleges and universities) and lowest, i.e. less than 1 percent on teacher

1st Quarterly Progress Report FY 2008/09 Poverty Reduction Strategy Paper (PRSP)
16
and vocational training. Maximum expenditures were incurred in primary followed by secondary education at the provincial level with the exception of Balochistan where the order was reverse. At the federal level, a small amount, i.e. 9 and 11 percent was spent on these sectors, respectively having spent the largest proportion on higher education i.e. university college education (61 percent). Expenditure on professional/technical universities and other educational expenses was 12 and 7 percent, respectively during Q1 FY 2008/09.
Table 3.5 : Percentage Distribution of Education Expenditures in Q1 FY 2008/09 by Provinces and Sectors of Education
Province/ region
All Sectors of
Education Primary
Education Secondary Education
University/College
Education
Professional/Technical
Universities
Teacher and
Vocational Training
Other Educational
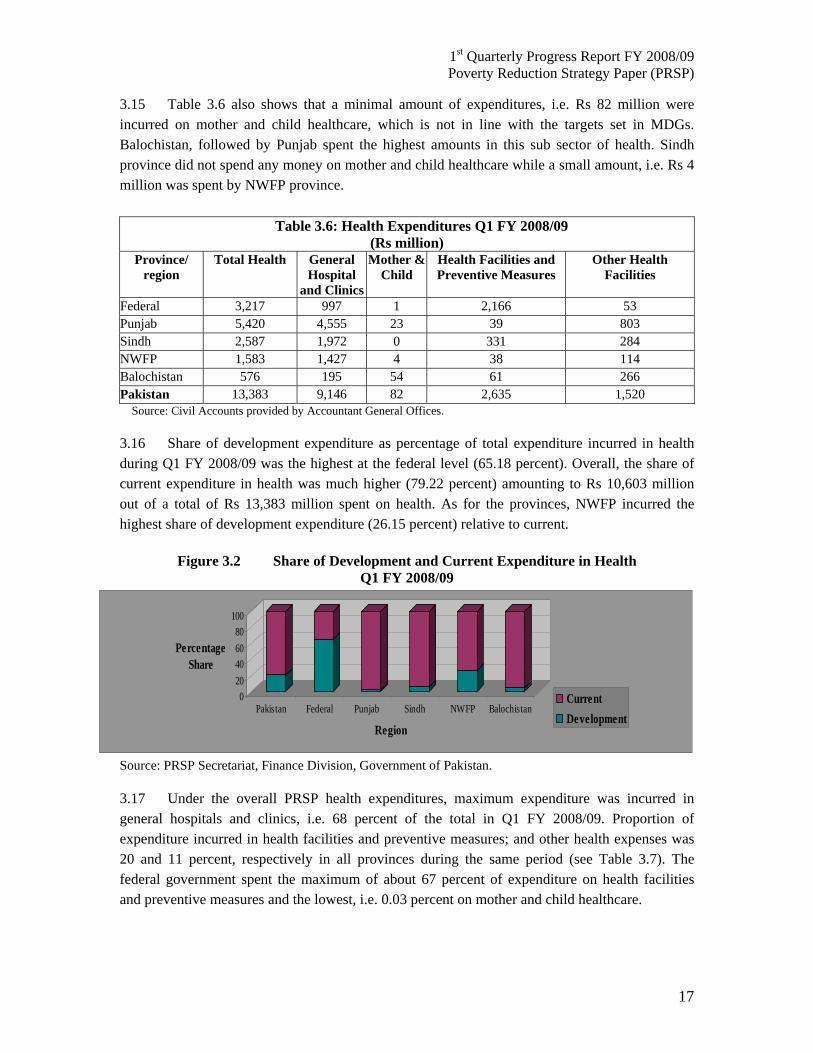
ExpendituresFederal 100.00 9 11 61 12 0 7 Punjab 100.00 48 25 8 2 2 14 Sindh 100.00 46 32 11 5 1 5 NWFP 100.00 43 41 6 7 0.02 3 Balochistan 100.00 33 34 5 3 1 24 Pakistan 100.00 39 27 17 5 1 10 Source: Civil Accounts provided by Accountant General Offices. 3.13 As for the provinces, Punjab spent the highest percentage of expenditures on primary education, i.e. 48 percent and lowest on profession/technical universities (2 percent); and teacher and vocational training each (2 percent). Sindh province spent the highest percentage of expenditures on primary education (46 percent) and lowest on teacher and vocational training (1 percent). The NWFP province spent the highest percentage of expenditures on primary education i.e. 43 percent and lowest on teacher and vocational training, i.e. less than 1 percent. Lastly, Balochistan province spent the highest percentage of expenditures on secondary education (34 percent) and lowest on teacher and vocational training (1 percent). Large amounts of expenditure on primary education by the provinces reflect their high commitment to achieve the primary educational targets set out in the Millennium Development Goals (MDGs). The NWFP has focused almost equally on primary and secondary education by spending 43 and 41 percent of the province’s total expenditure, respectively. 3.3 PRSP Expenditures on the Sub Sector of Health 3.14 Table 3.6 gives data on the proportionate expenditures incurred in various sectors in health during Q1 FY 2008/09. A reasonable proportion (7.63 percent) i.e. Rs 13,383 million of the total PRSP expenditures was incurred in the health sector by federal and provincial governments during Q1 FY 2008/09. Out of the overall total expenditure incurred in all sub sectors of health in Pakistan (Rs 13,383 million), a substantive amount of Rs 9,146 million or 68 percent was spent on general hospitals and clinics. A total of Rs 2,635 million and Rs 1,520 million, i.e. 20 and 11 percent were incurred in health facilities and preventive measures; and other health expenses, respectively.
1st Quarterly Progress Report FY 2008/09 Poverty Reduction Strategy Paper (PRSP)
17
3.15 Table 3.6 also shows that a minimal amount of expenditures, i.e. Rs 82 million were incurred on mother and child healthcare, which is not in line with the targets set in MDGs. Balochistan, followed by Punjab spent the highest amounts in this sub sector of health. Sindh province did not spend any money on mother and child healthcare while a small amount, i.e. Rs 4 million was spent by NWFP province.
Table 3.6: Health Expenditures Q1 FY 2008/09 (Rs million)
Province/ region
Total Health General Hospital
and Clinics
Mother & Child
Health Facilities and Preventive Measures
Other Health Facilities
Federal 3,217 997 1 2,166 53 Punjab 5,420 4,555 23 39 803 Sindh 2,587 1,972 0 331 284 NWFP 1,583 1,427 4 38 114 Balochistan 576 195 54 61 266 Pakistan 13,383 9,146 82 2,635 1,520
Source: Civil Accounts provided by Accountant General Offices. 3.16 Share of development expenditure as percentage of total expenditure incurred in health during Q1 FY 2008/09 was the highest at the federal level (65.18 percent). Overall, the share of current expenditure in health was much higher (79.22 percent) amounting to Rs 10,603 million out of a total of Rs 13,383 million spent on health. As for the provinces, NWFP incurred the highest share of development expenditure (26.15 percent) relative to current.
Figure 3.2 Share of Development and Current Expenditure in Health Q1 FY 2008/09
020406080
100
Percentage Share
Pakistan Federal Punjab Sindh NWFP Balochistan
Region
CurrentDevelopment
Source: PRSP Secretariat, Finance Division, Government of Pakistan.
3.17 Under the overall PRSP health expenditures, maximum expenditure was incurred in general hospitals and clinics, i.e. 68 percent of the total in Q1 FY 2008/09. Proportion of expenditure incurred in health facilities and preventive measures; and other health expenses was 20 and 11 percent, respectively in all provinces during the same period (see Table 3.7). The federal government spent the maximum of about 67 percent of expenditure on health facilities and preventive measures and the lowest, i.e. 0.03 percent on mother and child healthcare.

1st Quarterly Progress Report FY 2008/09 Poverty Reduction Strategy Paper (PRSP)
18
Table 3.7: Percentage Health Expenditures Province Wise Q1 FY 2008/09
Province/ Region
Total Health
General Hospitals and Clinics
Mother & Child
Health Facilities and Preventive Measures
Other Health Facilities
Federal 100.00 31.0 0.03 67.3 1.6 Punjab 100.00 84.0 0.4 0.7 14.8 Sindh 100.00 76.2 0 12.8 11.0 NWFP 100.00 90.1 0.3 2.3 7.2 Balochistan 100.00 33.9 9.4 10.6 46.2 Pakistan 100.00 68.3 0.6 19.7 11.4
Source: Civil Accounts provided by Accountant General Offices.
3.18 All provinces incurred maximum expenditures in general hospitals and clinics. Punjab province spent the highest percentage of expenditures on general hospitals and clinics, i.e. 84 percent during the subject quarter, while NWFP and Sindh spent 90 and 76 percent in this sub sector, respectively. Sindh province did not incur any expenditure in mother and child healthcare during the quarter. Balochistan was the only province which focused more or less equally on all sub sectors of health during the subject quarter.

1st Quarterly Progress Report FY 2008/09 Poverty Reduction Strategy Paper (PRSP)
19
4 Protecting the Poor and the Vulnerable 4.1 There is always a section of the population that require direct additional support and a socially conscious society always tries to ensure that special measures are devised to bring the poor and the vulnerable and backward regions into the mainstream of development to make progress in reducing existing inequalities. In this regard, existing social safety nets like Zakat4, Pakistan Bait-ul-Mal5, Employees’ Old Age Benefit Institution (EOBI) and Microfinance are the main instruments to assist the needy. The performance of these social safety nets during the Q1 FY 2008/09 has been reviewed in this section. In addition, for protecting the poor against rising inflation due to global increase in oil and commodity prices, the government in FY 2008/09 has taken various measures which have also been discussed in this section.
4.1 Zakat 4.2 Table 4.1 illustrates Zakat disbursement and beneficiaries under each programme. During Q1 FY 2008/09, a sum of Rs. 639 million was distributed among 283,829 beneficiaries under regular and other Zakat programmes and national level schemes. Under Regular Zakat Programmes including Guzara6 allowance, educational and Deeni Madaris7 stipends, healthcare, social welfare and marriage assistance, an amount of Rs 420 million was transferred to 137,193 beneficiaries showed share of 66 percent in total Zakat disbursement. About 16 percent of Zakat, i.e Rs 103 million was channeled through Other Zakat Programmes reflecting grant for eid8, leprosy patients and rehabilitation and technical education stipends. This benefited 79,539 beneficiaries. Zakat along with other regular programmes also implemented two national level schemes for health institutions and deeni madaris. A total of Rs 116 million (18 percent of total Zakat disbursement) was distributed to 67,097 beneficiaries during Q1 FY 2008/09. A large proportion of Zakat, i.e. 61 percent was disbursed in Sindh followed by 21 percent in NWFP, 11 percent in Punjab, 3 percent in ICT9 and Northern Areas and 2 percent in Balochistan. However, no Zakat disbursement was made in the Federally Administrated Tribal Areas (FATA) during the subject quarter.
4 Zakat is the Islamic concept of tithing and alms. It is an obligation on Muslims to pay 2.5% of their wealth to specified categories in society when their annual wealth exceeds a minimum level (nisab). 5 Tracked entirely (all components) under budgetary expenditure as of FY 2008/09. 6 Subsistence. 7 Islamic Schools. 8 Islamic festival/celebration. 9 Islamabad Capital Territory (ICT) includes the surrounding areas of Islamabad.

1st Quarterly Progress Report FY 2008/09 Poverty Reduction Strategy Paper (PRSP)
20
Table 4.1: Programmes of Zakat Q1 FY 2008/09
Punjab Sindh NWFP Balochistan ICT Northern
Areas FATA Total
Regular Zakat Programmes Disbursement
(Rs million) 3 312 78 2 7 18 0 420
Beneficiaries 1,425 109,186 11,759 511 2,340 11,972 0 137,193Other Zakat Programmes
Disbursement (Rs million)
11 48 41 0.043 1 2 0 103
Beneficiaries 1,031 57,847 13,617 87 3,277 3,680 0 79,539 National Level Schemes
Disbursement (Rs million)
54 27 16 9 10 0 0 116
Beneficiaries 26,000 16,500 12,020 5,320 7,257 0 0 67,097 Total Amount Disbursed (Rs million)
68 387 135 11.043 18 20 0 639
Total Beneficiaries
28,456 183,533 37,396 5,918 12,874 15,652 0 283,829
Source: Ministry of Religious Affairs, Zakat & Ushr.
4.2 Employees’ Old Age Benefit Institution (EOBI) 4.3 Several grant programmes targeting the poor are implemented through EOBI. Total grant disbursement through EOBI stood at Rs 1,230 million during Q1 FY 2008/09 compared to Rs 977 million in Q1 of FY 2007/08 recording an increase of 26 percent (see Table 4.2). Total beneficiaries increased by 9 percent to 272,390 during Q1 FY 2008/09 compared to the same period last year. All EOBI grant programmes showed positive growth. 4.4 The disbursement under Old Age Pension increased by 26 percent to Rs 801 million in Q1 FY 2008/09 from Rs 637 million during the same period last year. An amount of Rs 18 million was disbursed through Invalidity Pension in contrast to Rs 15 million showing an increase of 20 percent in disbursement. An increase of 27 percent was recorded in disbursement of Survivors Pension reaching at Rs 403 million in the subject quarter. A total of Rs 9 million was disbursed through Old Age Grants registering an increase of 29 percent in Q1 of FY 2008/09 compared to Q1 FY 2007/08.
1st Quarterly Progress Report FY 2008/09 Poverty Reduction Strategy Paper (PRSP)
21
Table 4.2: Programmes of Employees Old Age Benefits Institution (EOBI)
Grant Nature
Q1 FY 2007/08 Q1 FY 2008/09
Beneficiaries Disbursement (Rs million)
Beneficiaries Disbursement (Rs million)
Old Age Pension 161,446 637 175,869 801 Invalidity Pension 3,841 15 4,223 18 Survivors Pension 84,005 318 91,936 403 Old Age Grants 357 7 362 9
Grand Total 249,649 977 272,390 1,230 Source: Employees’ Old Age Benefits Institution (EOBI). 4.3 Pakistan Bait-ul-Mal (PBM) 4.5 Details of disbursement and beneficiaries against each grant are presented in table 4.3. Total disbursement through PBM stood at Rs 1,362 million during Q1 FY 2008/09 as compared to Rs 3,700 million during Q1 FY 2007/08, recorded a decline of 63 percent. The number of households that benefited from PBM schemes decreased by 59 percent from 1,338,269 to 552,715 during this period. 4.6 The largest programme of PBM is the Food Support Programme (FSP), which is a part of PRSP budgetary expenditures. Under FSP, a total of Rs 1,100 million was disbursed during Q1 FY 2008/09 in contrast to Rs 3,410 million during same period last year, registering a decline of 68 percent in disbursement. This benefited 366,770 households. Similarly, Individual Financial Assistance (IFA) programme disbursement declined by 24 percent to Rs 160 million during Q1 FY 2008/09 over Q1 last fiscal year. Number of households benefited from IFA programme during this period also decreased by 56 percent from 12,743 to 5,616. A decline of 50 percent from Rs 10 million to Rs 5 million was registered in Civil Society Wing (CSW) disbursement which decreased the beneficiaries by 97 percent during the period. 4.7 However, disbursement under National Centre for Rehabilitation of Child Labour (NCRCL) increased by 19 percent from Rs 52 million (Q1 FY 2007/08) to Rs 62 million (Q1 FY 2008/09). During this period households that benefited from this programme increased by 28 percent from 90,696 in Q1 FY 2007/08 to 116,429 in Q1 FY 2008/09. Vocational/Dastakari10 Schools showed an increase of 61 percent from Rs 18 million to Rs 29 million in disbursement during Q1 FY 2008/09 as compared to Q1 FY 2007/08. Number of households that benefited from this grant also increased by 33 percent from 37,971 to 56,522 during this period.
10 Vocationl/skills.
1st Quarterly Progress Report FY 2008/09 Poverty Reduction Strategy Paper (PRSP)
22
Table 4.3: Programmes of Pakistan Bait-ul-Mal (PBM)
Grant Nature
Q1 FY 2007/08 Q1 FY 2008/09
Beneficiaries Disbursement (Rs. million)
Beneficiaries Disbursement (Rs. million)
Food Support Programme 1,136,577 3,410 366,720 1,100
Child Support Programme 0 0 5,536 6
Individual Financial Assistance 12,743 211 5,616 160
Civil Society Wing (NGOs) 60,282 10 1,892 5 National Centre for Rehabilitation of Child Labour
90,696 52 116,429 62
Vocational / Dastkari Schools 37,971 18 56,522 29
Grand Total 1,338,269 3,700 552,715 1,362 Source: Pakistan Bait-ul-Mal.
4.4 Microfinance 4.8 Table 4.1 shows microfinance services details as microcredit, micro savings and micro-insurance. The growth in microfinance services was found to be substantial. The increase was more pronounced in terms of value than active borrowers, active savers, and insurance policy holders. Microcredit in value term increased by 56 percent from Rs 13,767 million in Q1 FY 2007/08 to 21,427 million in Q1 FY 2008/09. The number of active borrowers of this service also grew by 37 percent i.e. to 1,871,508 during the period. Similarly, micro savings in terms of value grew by 34 percent to Rs 4,961 million in Q1 FY 2008/09 as compared to Rs 3,701 million during Q1 FY 2007/08. Active savers recorded an increase of 24 percent from 1,492,381 to 1,857,737. Micro-insurance outreach posted enormous growth with an increase of 306 percent from 566,559 to 2,300,289 in policy holders and 430 percent in insured sum. Large increase in insurance policy holders during subject quarter was because of revision made by microfinance service delivery organizations to insurance policy holders which now cover the spouses of active borrowers as well.
Table 4.4: Microfinance Analysis
Details
Micro credit Micro Savings Micro Insurance
Active Borrowers
Value (Rs
million)
Active Savers
Value (Rs million)
Policy Holders
Sum insured
(Rs million) Q1 FY 2007/08 1,371,004 13,767 1,492,381 3,701 566,559 7,130
Q1 FY 2008/09 1,871,508 21,427 1,857,737 4,961 2,300,289 37,824
Increase/Decrease (Net) + 500,504 + 7,660 + 365,356 + 1,260 + 1,733,730 + 30,694
Increase/Decrease (%) + 37 + 56 + 24 + 34 + 306 + 430
Source: Pakistan Microfinance Network (PMN), Islamabad.
1st Quarterly Progress Report FY 2008/09 Poverty Reduction Strategy Paper (PRSP)
23
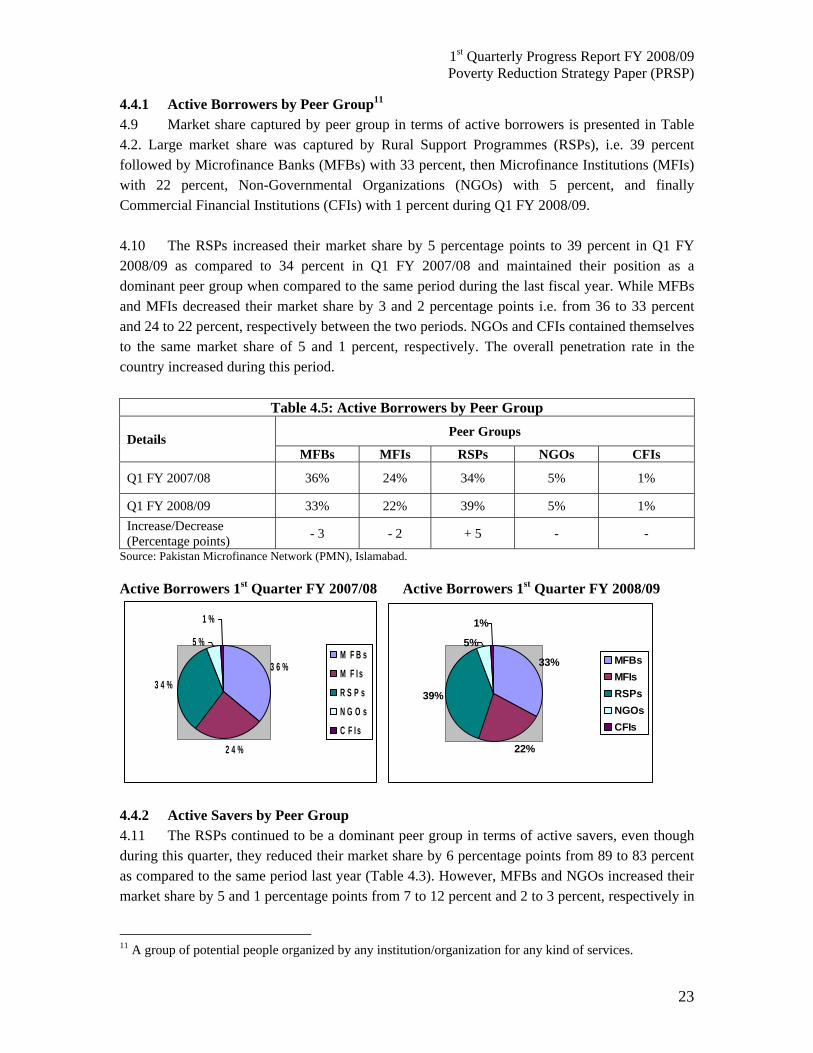
4.4.1 Active Borrowers by Peer Group11 4.9 Market share captured by peer group in terms of active borrowers is presented in Table 4.2. Large market share was captured by Rural Support Programmes (RSPs), i.e. 39 percent followed by Microfinance Banks (MFBs) with 33 percent, then Microfinance Institutions (MFIs) with 22 percent, Non-Governmental Organizations (NGOs) with 5 percent, and finally Commercial Financial Institutions (CFIs) with 1 percent during Q1 FY 2008/09. 4.10 The RSPs increased their market share by 5 percentage points to 39 percent in Q1 FY 2008/09 as compared to 34 percent in Q1 FY 2007/08 and maintained their position as a dominant peer group when compared to the same period during the last fiscal year. While MFBs and MFIs decreased their market share by 3 and 2 percentage points i.e. from 36 to 33 percent and 24 to 22 percent, respectively between the two periods. NGOs and CFIs contained themselves to the same market share of 5 and 1 percent, respectively. The overall penetration rate in the country increased during this period.
Table 4.5: Active Borrowers by Peer Group
Details Peer Groups
MFBs MFIs RSPs NGOs CFIs
Q1 FY 2007/08 36% 24% 34% 5% 1%
Q1 FY 2008/09 33% 22% 39% 5% 1% Increase/Decrease (Percentage points) - 3 - 2 + 5 - -
Source: Pakistan Microfinance Network (PMN), Islamabad. Active Borrowers 1st Quarter FY 2007/08 Active Borrowers 1st Quarter FY 2008/09
3 6 %
2 4 %
3 4 %
5 %
1 %
M F B sM F I sR S P sN G O sC F I s
33%
22%
39%
5%
1%
MFBsMFIsRSPsNGOsCFIs
4.4.2 Active Savers by Peer Group 4.11 The RSPs continued to be a dominant peer group in terms of active savers, even though during this quarter, they reduced their market share by 6 percentage points from 89 to 83 percent as compared to the same period last year (Table 4.3). However, MFBs and NGOs increased their market share by 5 and 1 percentage points from 7 to 12 percent and 2 to 3 percent, respectively in
11 A group of potential people organized by any institution/organization for any kind of services.

1st Quarterly Progress Report FY 2008/09 Poverty Reduction Strategy Paper (PRSP)
24
Q1 FY 2008/09 as compared to the same period in the last fiscal year. The MFIs retained same market share of 2 percent while CFIs are yet to capture the market share in terms of active savers during Q1 FY 2008/09 as compared to the same period last fiscal year.
Table 4.6: Active Savers by Peer Group
Details Peer Groups
MFBs MFIs RSPs NGOs CFIs
Q1 FY 2007/08 7% 2% 89% 2% 0%
Q1 FY 2008/09 12% 2% 83% 3% 0% Increase/Decrease (Percentage points) + 5 - - 6 + 1 -
Source: Pakistan Microfinance Network (PMN), Islamabad.
Active Savers 1st Quarter FY 2007/08 Active Savers 1st Quarter FY 2008/09
7%2%
89%
2%0%
MFBsMFIsRSPsNGOsCFIs
12%
2%
83%
3%
0%
MFBsMFIsRSPsNGOsCFIs
4.4.3 Active Policy Holders by Peer Group 4.12 Table 4.4 represents active policy holders by peer group. Although MFIs increased their outreach substantially by 19 percentage points from 11 to 30 percent in number of policy holders but RSPs are still leading the market even though their performance has declined during this quarter by 14 percentage points to 41 percent. Share of both MFBs and NGOs also declined by 2 percentage points to 26 and 3 percent, respectively in Q1 FY 2008/09 as compared to the same period last year whereas CFIs lost their outreach by 1 percentage points during this period.
Table 4.7: Active Policy Holders by Peer Group
Details Peer Groups MFBs MFIs RSPs NGOs CFIs
Q1 FY 2007/08 28% 11% 55% 5% 1%
Q1 FY 2008/09 26% 30% 41% 3% 0% Increase/Decrease (Percentage points) - 2 + 19 - 14 - 2 - 1
Source: Pakistan Microfinance Network (PMN), Islamabad.

1st Quarterly Progress Report FY 2008/09 Poverty Reduction Strategy Paper (PRSP)
25
Active Policy holders 1st Quarter FY 2007/08 Active Policy holders 1st Quarter FY 2008/09
28%
11%55%
5%
1%
MFBsMFIsRSPsNGOsCFIs
26%
30%
41%
3%0%
MFBsMFIsRSPsNGOsCFIs
4.4.4 Summary of Microcredit Indicators 4.13 Summary of microcredit indictors given in Table 4.5 covers the period of Q1 FY 2008/09 compared to the same period in FY 2007/08. The credit programme outreach increased for all key indicators during the subject period. During this period, total numbers of branches increased by 18 percent from 1,348 to 1,594, which will further increase the outreach of micro credit in new areas, and create a lot more new clientele. The high increase in number of branches was because of the NGOs, which increased their credit programme operation by 69 percent from 70 to 118 branches, the highest among all partner organizations, followed by MFBs with 35 percent, MFIs with 21 percent and finally RSPs with 8 percent. CFI figures showed a downward trend during the subject quarter from 21 to 19 branches compared to the same period last year. 4.14 During the period, average loan balance12 increased by 14 percent from Rs 10,041 to Rs 11,449. This was attributed to all microfinance providing organizations except CFIs where average loan balance declined by 17 percent from Rs 19,621 to Rs 16,286. In terms of number of loans disbursed; an increase of 19 percent was noticed i.e. to 448,332 during Q1 FY 2008/09 as compared to 376,728 in same period of FY 2007/08. In terms of loans, NGOs maintained their position as a dominant group and increase loan disbursement by 85 percent while MFBs and MFIs increased their market share once again by 40 and 19 percent, respectively. Surprisingly, the RSPs reduced their loans disbursement by 3 percent during the period. 4.15 An increase of 36 percent in credit disbursement from Rs 4,774 million to Rs 6,509 million was recorded in Q1 FY 2008/09 compared to this period in FY 2007/08. All microcredit provider organizations contributed to this increase but is mainly attributed to NGOs whose credit disbursement increased by 78 percent during the period. Average loan size13 increased to Rs 14,518 in Q1 FY 2008/09 relative to Rs 12,671 in comparable period in the last fiscal year. This increase of 15 percent was contributed by all microfinance providing organizations except NGOs where average loan size decreased by 3 percent during the period.
12 Average loan balance = outstanding balance divided by total number of loans in a given period. 13 Average loan size = Disbursement divided by number of loans in a given period.

1st Quarterly Progress Report FY 2008/09 Poverty Reduction Strategy Paper (PRSP)
26
Table 4.8: Summary of Microcredit Provision Indicators Q1 FY 2007/08 Q1 FY 2008/09 % Change
MFBs
Number of Branches/Units 264 357 35 Gross Loan Portfolio14 (Rs million) 4,861 7,021 44 Average Loan Balance (Rs) 9,826 11,278 15 Number of Loans disbursed 92,114 128,712 40
Credit Disbursements (Rs million) 1,165 1,931 66
Average Loan Size (Rs) 12,643 15,000 19
MFIs
Number of branches/Units 197 238 21 Gross Loan Portfolio (Rs millions) 2,850 3,889 36
Average Loan Balance (Rs) 8,844 9,582 8
Number of Loans disbursed 135,031 160,312 19
Credit Disbursements (Rs million) 1,581 2,088 32
Average Loan Size (Rs) 11,712 13,028 11
RSPs
Number of Branches/Units 796 862 8 Gross Loan Portfolio (Rs million) 4,960 8,915 80
Average Loan Balance (Rs) 10,644 12,353 16
Number of Loans disbursed 130,365 126,114 -3
Credit Disbursements (Rs million) 1,713 1,964 15
Average Loan Size (Rs) 13,143 15,572 18
NGOs
Number of Branches/Units 70 118 69 Gross Loan Portfolio (Rs million) 767 1,274 66
Average Loan Balance (Rs) 10,761 12,595 17
Number of Loans disbursed 15,815 29,267 85
Credit Disbursements (Rs million) 251 448 78
Average Loan Size (Rs) 15,840 15,296 -3
CFIs
Number of Branches/Units 21 19 -10 Gross Loan Portfolio (Rs million) 328 324 -1
Average Loan Balance (Rs) 19,621 16,286 -17
Number of Loans disbursed 3,403 3,927 15
Credit Disbursements (Rs million) 64 78 22
Average Loan Size (Rs) 18,745 19,872 6
Total
Number of Branches/Units 1,348 1,594 18 Gross Loan Portfolio (Rs million) 13,766 21,423 56
Average Loan Balance (Rs) 10,041 11,449 14 Number of Loans disbursed 376,728 448,332 19 Credit Disbursements (Rs million) 4,774 6,509 36
Average Loan Size (Rs) 12,671 14,518 15 Source: Pakistan Microfinance Network (PMN).
14 Gross loan portfolio = total disbursement minus principle amount of loan.

1st Quarterly Progress Report FY 2008/09 Poverty Reduction Strategy Paper (PRSP)
27
4.5 New Initiatives 4.5.1 Benazir Income Support Programme (BISP) 4.16 In the current FY 2008/09, an amount of Rs 34 billion has initially been allocated in the Public Sector Development Programme (PSDP) to provide assistance to economically stressed households across the country through direct cash grant scheme titled ‘Benazir Income Support Programme’ (BISP). This would initially cover about 3.4 million households and gradually be extended to 7 million households. The programme envisages cash grant of Rs 1,000 per month to each qualifying household through banks/post offices with the aim to ameliorate the conditions of the poorest of the poor by directly accessing them and supplementing their sources of income. 4.17 In the short to medium term, BISP will also serve as a platform for complementary social assistance programmes, the main being health insurance for the poor and the vulnerable. This programme will cover the entire family including household head and spouse, children up to 18 years, dependent parents, and unmarried daughters aged 18 and above. The policy benefit will cover full hospitalization, pregnancy, daycare treatment and diagnostic tests up to a maximum limit of US$ 312 per person per year. This insurance policy will also provide accident compensation for earning members of the family. The premium for this health insurance policy will cost US$ 10 per family per year and is proposed to be picked up by the government as a part of the BISP benefits. In addition, cash transfer programmes will be complemented with poverty exit strategies to promote household independence by various means including transition to Conditional Cash Transfers (CCT); training and employment of one person per household; and workfare initiatives through social mobilization. 4.5.2 Punjab Food Support Scheme (PFSS) 4.18 The Government of Punjab has also announced the PFSS to provide cash grant of Rs 1,000 per poor household per month. The scheme covers both rural and urban areas with total subsidy in the scheme amounting to Rs 21.60 billion (at Rs 1.8 billion per month) for 1.8 families (at 6 persons per family). Beneficiaries of the food scheme include households that do not have a breadwinner; widows, orphans, destitutes; chronically sick, disabled and the elderly who have been abandoned by their families; and the poorest of the poor. 4.5.3 Punjab Sasti Roti15 Programme 4.19 The Government of Punjab has also announced Punjab Sasti Roti Programme with a total outlay of Rs 7.5 billion to provide bread at prices that the poor could afford. The government intends to help set up more than 30,000 subsidized bread-making sites. The programme will be monitored right down to the level of tehsils and mohallahs.16 District governments intend to utilize services of Revenue, Cooperative, Health and Union Council staff in the monitoring process.
15 Cheap bread. 16 Local neighbourhoods.
1st Quarterly Progress Report FY 2008/09 Poverty Reduction Strategy Paper (PRSP)
28
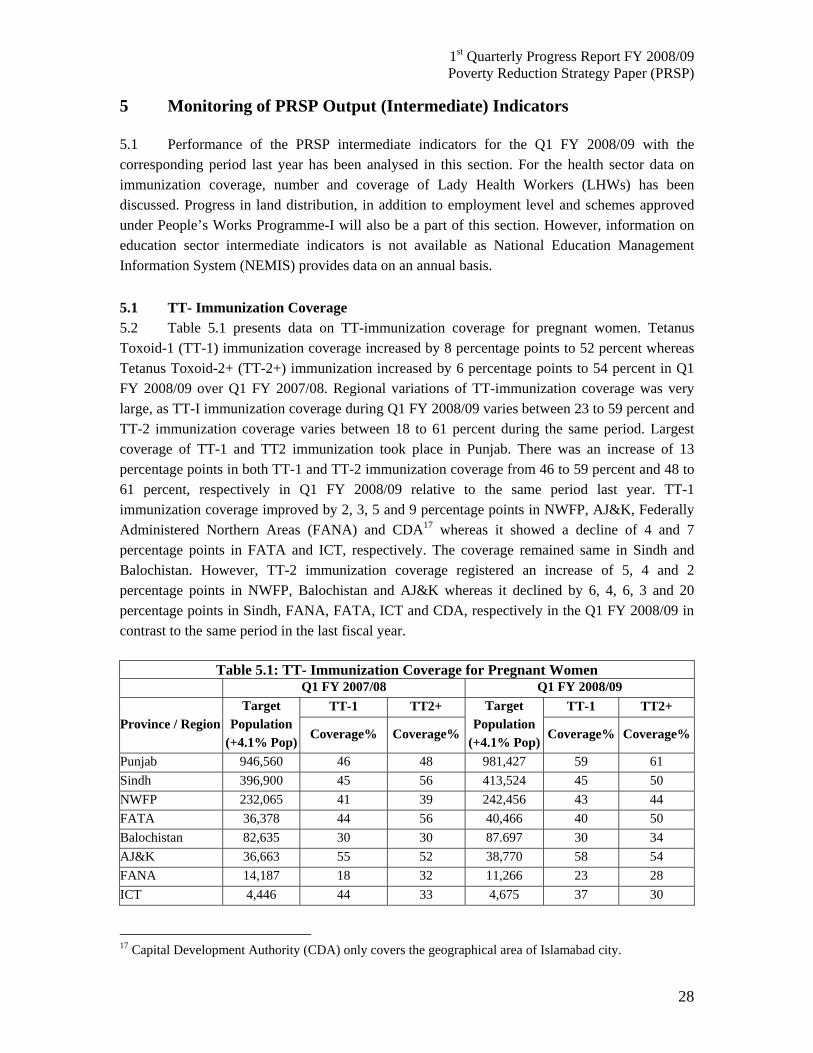
5 Monitoring of PRSP Output (Intermediate) Indicators 5.1 Performance of the PRSP intermediate indicators for the Q1 FY 2008/09 with the corresponding period last year has been analysed in this section. For the health sector data on immunization coverage, number and coverage of Lady Health Workers (LHWs) has been discussed. Progress in land distribution, in addition to employment level and schemes approved under People’s Works Programme-I will also be a part of this section. However, information on education sector intermediate indicators is not available as National Education Management Information System (NEMIS) provides data on an annual basis. 5.1 TT- Immunization Coverage 5.2 Table 5.1 presents data on TT-immunization coverage for pregnant women. Tetanus Toxoid-1 (TT-1) immunization coverage increased by 8 percentage points to 52 percent whereas Tetanus Toxoid-2+ (TT-2+) immunization increased by 6 percentage points to 54 percent in Q1 FY 2008/09 over Q1 FY 2007/08. Regional variations of TT-immunization coverage was very large, as TT-I immunization coverage during Q1 FY 2008/09 varies between 23 to 59 percent and TT-2 immunization coverage varies between 18 to 61 percent during the same period. Largest coverage of TT-1 and TT2 immunization took place in Punjab. There was an increase of 13 percentage points in both TT-1 and TT-2 immunization coverage from 46 to 59 percent and 48 to 61 percent, respectively in Q1 FY 2008/09 relative to the same period last year. TT-1 immunization coverage improved by 2, 3, 5 and 9 percentage points in NWFP, AJ&K, Federally Administered Northern Areas (FANA) and CDA17 whereas it showed a decline of 4 and 7 percentage points in FATA and ICT, respectively. The coverage remained same in Sindh and Balochistan. However, TT-2 immunization coverage registered an increase of 5, 4 and 2 percentage points in NWFP, Balochistan and AJ&K whereas it declined by 6, 4, 6, 3 and 20 percentage points in Sindh, FANA, FATA, ICT and CDA, respectively in the Q1 FY 2008/09 in contrast to the same period in the last fiscal year.
Table 5.1: TT- Immunization Coverage for Pregnant Women
Q1 FY 2007/08 Q1 FY 2008/09
Province / Region Target
Population (+4.1% Pop)
TT-1 TT2+ Target Population
(+4.1% Pop)
TT-1 TT2+
Coverage% Coverage% Coverage% Coverage%
Punjab 946,560 46 48 981,427 59 61 Sindh 396,900 45 56 413,524 45 50 NWFP 232,065 41 39 242,456 43 44 FATA 36,378 44 56 40,466 40 50 Balochistan 82,635 30 30 87.697 30 34 AJ&K 36,663 55 52 38,770 58 54 FANA 14,187 18 32 11,266 23 28 ICT 4,446 44 33 4,675 37 30
17 Capital Development Authority (CDA) only covers the geographical area of Islamabad city.
1st Quarterly Progress Report FY 2008/09 Poverty Reduction Strategy Paper (PRSP)
29
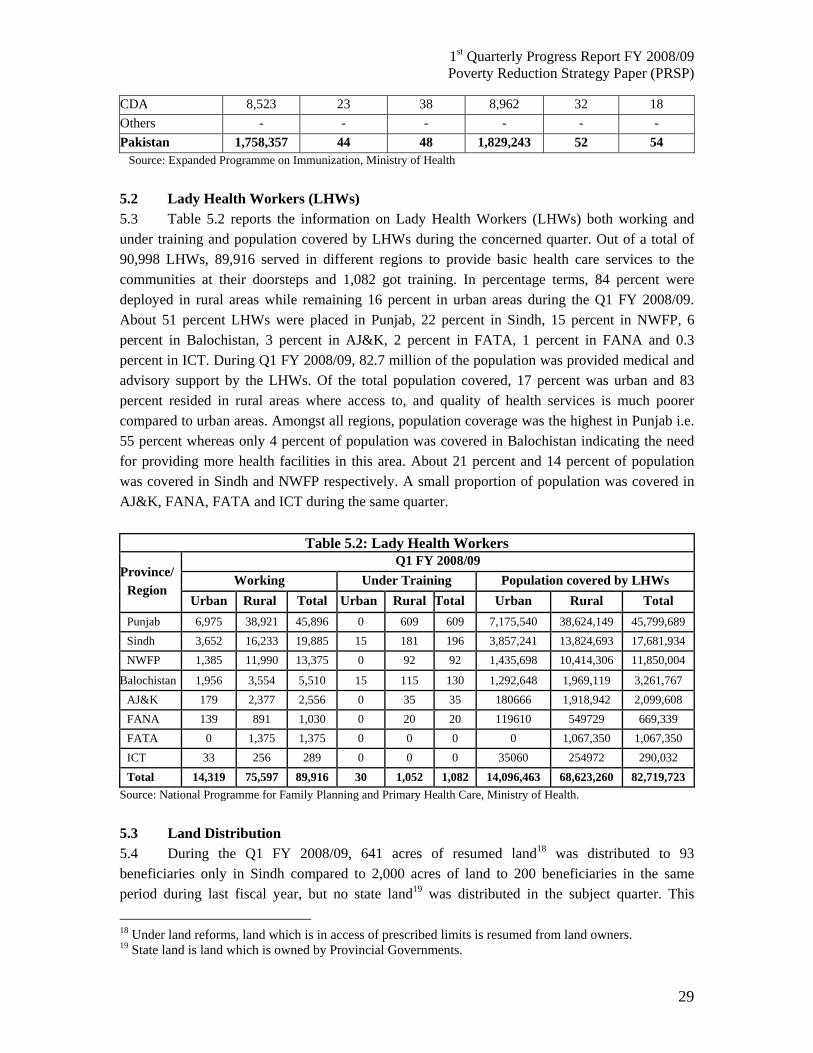
CDA 8,523 23 38 8,962 32 18 Others - - - - - - Pakistan 1,758,357 44 48 1,829,243 52 54 Source: Expanded Programme on Immunization, Ministry of Health 5.2 Lady Health Workers (LHWs) 5.3 Table 5.2 reports the information on Lady Health Workers (LHWs) both working and under training and population covered by LHWs during the concerned quarter. Out of a total of 90,998 LHWs, 89,916 served in different regions to provide basic health care services to the communities at their doorsteps and 1,082 got training. In percentage terms, 84 percent were deployed in rural areas while remaining 16 percent in urban areas during the Q1 FY 2008/09. About 51 percent LHWs were placed in Punjab, 22 percent in Sindh, 15 percent in NWFP, 6 percent in Balochistan, 3 percent in AJ&K, 2 percent in FATA, 1 percent in FANA and 0.3 percent in ICT. During Q1 FY 2008/09, 82.7 million of the population was provided medical and advisory support by the LHWs. Of the total population covered, 17 percent was urban and 83 percent resided in rural areas where access to, and quality of health services is much poorer compared to urban areas. Amongst all regions, population coverage was the highest in Punjab i.e. 55 percent whereas only 4 percent of population was covered in Balochistan indicating the need for providing more health facilities in this area. About 21 percent and 14 percent of population was covered in Sindh and NWFP respectively. A small proportion of population was covered in AJ&K, FANA, FATA and ICT during the same quarter.
Table 5.2: Lady Health Workers
Province/ Region
Q1 FY 2008/09 Working Under Training Population covered by LHWs
Urban Rural Total Urban Rural Total Urban Rural Total Punjab 6,975 38,921 45,896 0 609 609 7,175,540 38,624,149 45,799,689 Sindh 3,652 16,233 19,885 15 181 196 3,857,241 13,824,693 17,681,934 NWFP 1,385 11,990 13,375 0 92 92 1,435,698 10,414,306 11,850,004
Balochistan 1,956 3,554 5,510 15 115 130 1,292,648 1,969,119 3,261,767 AJ&K 179 2,377 2,556 0 35 35 180666 1,918,942 2,099,608 FANA 139 891 1,030 0 20 20 119610 549729 669,339 FATA 0 1,375 1,375 0 0 0 0 1,067,350 1,067,350 ICT 33 256 289 0 0 0 35060 254972 290,032 Total 14,319 75,597 89,916 30 1,052 1,082 14,096,463 68,623,260 82,719,723
Source: National Programme for Family Planning and Primary Health Care, Ministry of Health. 5.3 Land Distribution 5.4 During the Q1 FY 2008/09, 641 acres of resumed land18 was distributed to 93 beneficiaries only in Sindh compared to 2,000 acres of land to 200 beneficiaries in the same period during last fiscal year, but no state land19 was distributed in the subject quarter. This
18 Under land reforms, land which is in access of prescribed limits is resumed from land owners. 19 State land is land which is owned by Provincial Governments.
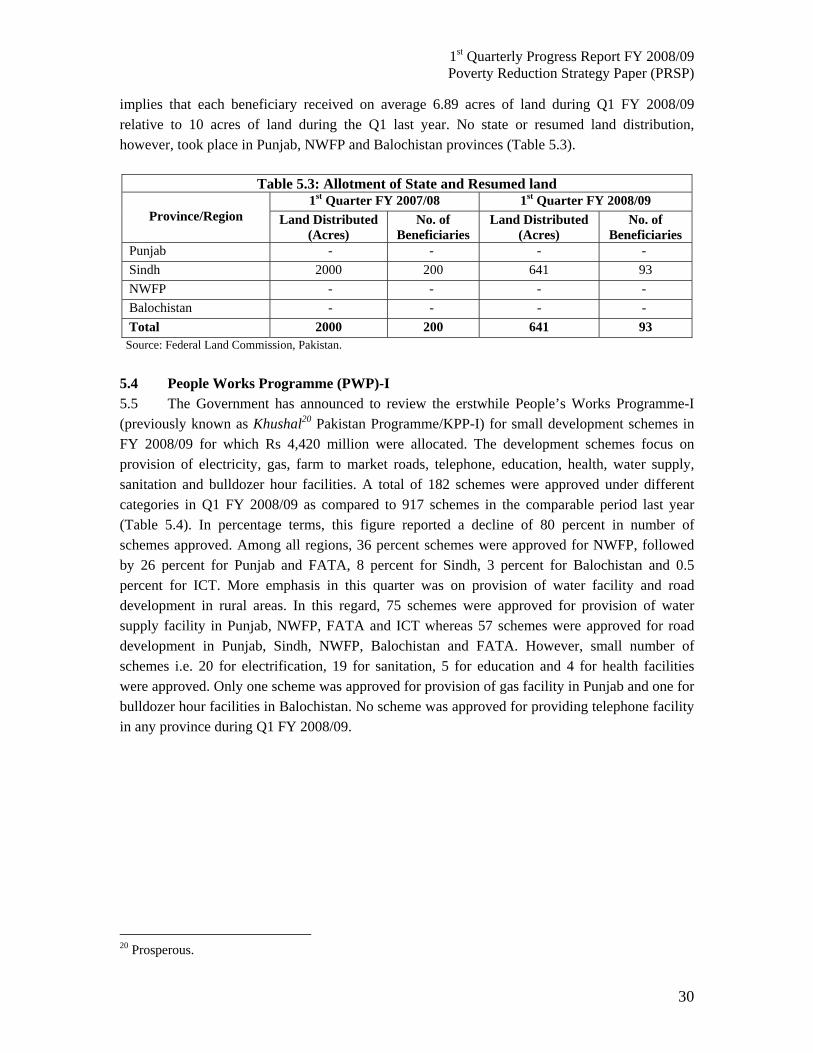
1st Quarterly Progress Report FY 2008/09 Poverty Reduction Strategy Paper (PRSP)
30
implies that each beneficiary received on average 6.89 acres of land during Q1 FY 2008/09 relative to 10 acres of land during the Q1 last year. No state or resumed land distribution, however, took place in Punjab, NWFP and Balochistan provinces (Table 5.3).
Table 5.3: Allotment of State and Resumed land
Province/Region 1st Quarter FY 2007/08 1st Quarter FY 2008/09
Land Distributed (Acres)
No. of Beneficiaries
Land Distributed (Acres)
No. of Beneficiaries
Punjab - - - - Sindh 2000 200 641 93 NWFP - - - - Balochistan - - - - Total 2000 200 641 93
Source: Federal Land Commission, Pakistan. 5.4 People Works Programme (PWP)-I 5.5 The Government has announced to review the erstwhile People’s Works Programme-I (previously known as Khushal20 Pakistan Programme/KPP-I) for small development schemes in FY 2008/09 for which Rs 4,420 million were allocated. The development schemes focus on provision of electricity, gas, farm to market roads, telephone, education, health, water supply, sanitation and bulldozer hour facilities. A total of 182 schemes were approved under different categories in Q1 FY 2008/09 as compared to 917 schemes in the comparable period last year (Table 5.4). In percentage terms, this figure reported a decline of 80 percent in number of schemes approved. Among all regions, 36 percent schemes were approved for NWFP, followed by 26 percent for Punjab and FATA, 8 percent for Sindh, 3 percent for Balochistan and 0.5 percent for ICT. More emphasis in this quarter was on provision of water facility and road development in rural areas. In this regard, 75 schemes were approved for provision of water supply facility in Punjab, NWFP, FATA and ICT whereas 57 schemes were approved for road development in Punjab, Sindh, NWFP, Balochistan and FATA. However, small number of schemes i.e. 20 for electrification, 19 for sanitation, 5 for education and 4 for health facilities were approved. Only one scheme was approved for provision of gas facility in Punjab and one for bulldozer hour facilities in Balochistan. No scheme was approved for providing telephone facility in any province during Q1 FY 2008/09.
20 Prosperous.

1st Quarterly Progress Report FY 2008/09 Poverty Reduction Strategy Paper (PRSP)
31
Table 5.4: Number of PWP Schemes approved under each category Q1 FY 2008/09
Province Roads Electrification Gas Telephones Education Health Water Supply
Sanitation Bulldozer
Hours Total
Schemes Punjab 25 19 1 - 1 - 2 - - 48 Sindh 2 1 - - 3 3 - 6 - 15 NWFP 23 - - - - - 29 13 - 65 Balochistan 3 - - - 1 1 - - 1 6 FATA 4 - - - - - 43 - - 47 ICT - - - - - - 1 - - 1
Total 57 20 1 - 5 4 75 19 1 182 Q1 FY 2007/08
Province Road Electrification Gas Telephone Education Health Water Supply
Sanitation Bulldozer
Hours Total
Schemes
Punjab 110 234 22 - 3 1 3 24 - 397 Sindh 79 32 - - 16 2 3 3 1 136 NWFP 6 77 - - 1 - 1 - - 85 Balochistan 14 26 - - 2 2 16 1 3 64 FATA 57 - - - 7 13 143 - - 220 ICT 7 3 1 - - 3 1 - - 15
Total 273 372 23 - 29 21 167 28 4 917 Source: Ministry of Local Government and Rural Development 5.5 Employment 5.6 Table 5.5 represents total labour force and percentage of employed labour force during Q1 FY 2008/09. Total labour force stood at 13.47 million representing 10.46 million males and 3.01 million females. Out of the total labour force, 94 percent was employed including 74 percent males and 20 percent females during the period.
Table 5.5: Labour Force and Employed Labour Force
Q1 FY 2008/09
Total Male Female
Labour Force (million) 13.47 10.46 3.01
Employed Labour Force (%) 94 74 20
Note: Estimated labour force for the FY 2008/09 is based on the Labour Force Survey (LBS) FY 2007/08 and average population growth rate of 1.73 per annum. Source: Ministry of Labour and Manpower.
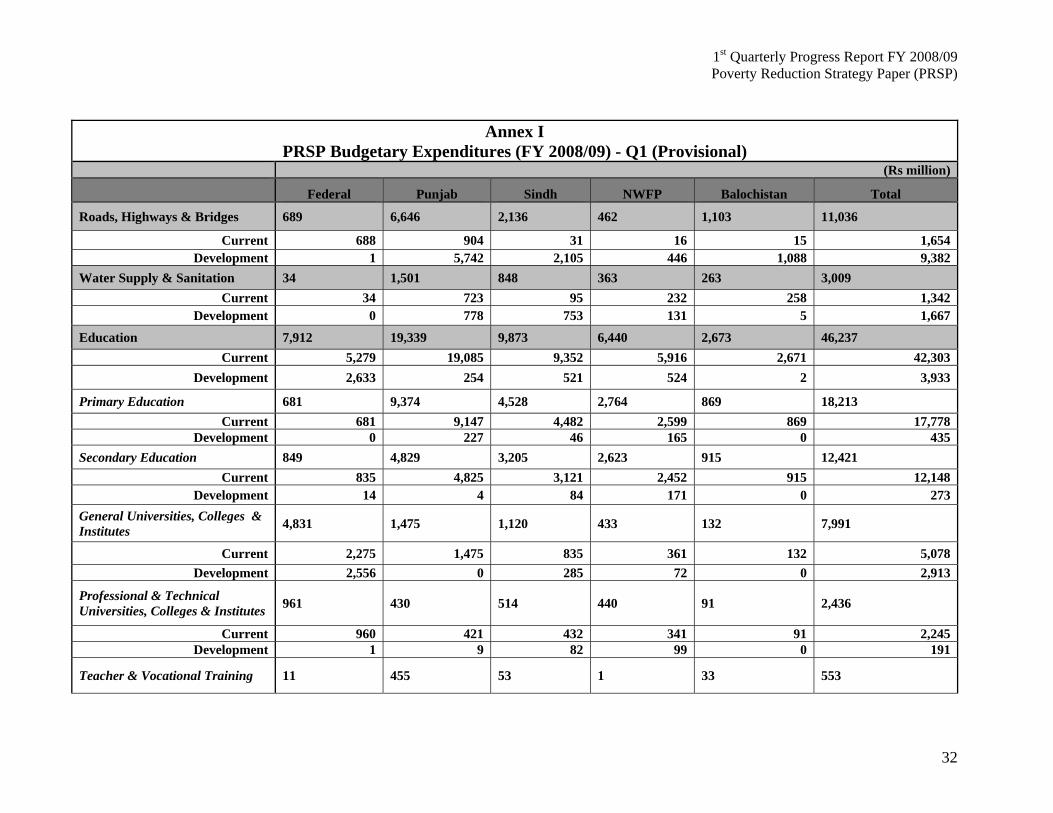
1st Quarterly Progress Report FY 2008/09 Poverty Reduction Strategy Paper (PRSP)
32
Annex I PRSP Budgetary Expenditures (FY 2008/09) - Q1 (Provisional)
(Rs million) Federal Punjab Sindh NWFP Balochistan Total
Roads, Highways & Bridges 689 6,646 2,136 462 1,103 11,036
Current 688 904 31 16 15 1,654Development 1 5,742 2,105 446 1,088 9,382
Water Supply & Sanitation 34 1,501 848 363 263 3,009 Current 34 723 95 232 258 1,342
Development 0 778 753 131 5 1,667
Education 7,912 19,339 9,873 6,440 2,673 46,237 Current 5,279 19,085 9,352 5,916 2,671 42,303
Development 2,633 254 521 524 2 3,933
Primary Education 681 9,374 4,528 2,764 869 18,213 Current 681 9,147 4,482 2,599 869 17,778
Development 0 227 46 165 0 435Secondary Education 849 4,829 3,205 2,623 915 12,421
Current 835 4,825 3,121 2,452 915 12,148Development 14 4 84 171 0 273
General Universities, Colleges & Institutes 4,831 1,475 1,120 433 132 7,991
Current 2,275 1,475 835 361 132 5,078Development 2,556 0 285 72 0 2,913
Professional & Technical Universities, Colleges & Institutes 961 430 514 440 91 2,436
Current 960 421 432 341 91 2,245Development 1 9 82 99 0 191
Teacher & Vocational Training 11 455 53 1 33 553
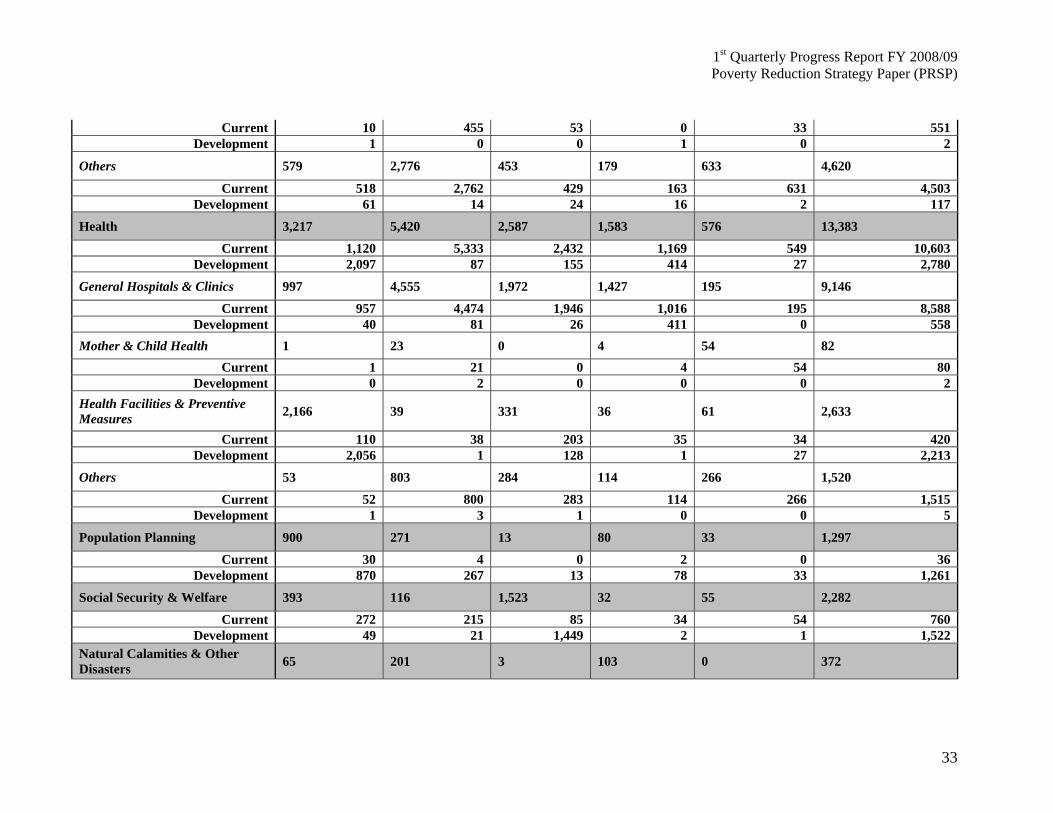
1st Quarterly Progress Report FY 2008/09 Poverty Reduction Strategy Paper (PRSP)
33
Current 10 455 53 0 33 551Development 1 0 0 1 0 2
Others 579 2,776 453 179 633 4,620
Current 518 2,762 429 163 631 4,503Development 61 14 24 16 2 117
Health 3,217 5,420 2,587 1,583 576 13,383
Current 1,120 5,333 2,432 1,169 549 10,603Development 2,097 87 155 414 27 2,780
General Hospitals & Clinics 997 4,555 1,972 1,427 195 9,146
Current 957 4,474 1,946 1,016 195 8,588Development 40 81 26 411 0 558
Mother & Child Health 1 23 0 4 54 82 Current 1 21 0 4 54 80
Development 0 2 0 0 0 2Health Facilities & Preventive Measures 2,166 39 331 36 61 2,633
Current 110 38 203 35 34 420Development 2,056 1 128 1 27 2,213
Others 53 803 284 114 266 1,520
Current 52 800 283 114 266 1,515Development 1 3 1 0 0 5
Population Planning 900 271 13 80 33 1,297
Current 30 4 0 2 0 36Development 870 267 13 78 33 1,261
Social Security & Welfare 393 116 1,523 32 55 2,282
Current 272 215 85 34 54 760Development 49 21 1,449 2 1 1,522
Natural Calamities & Other Disasters 65 201 3 103 0 372
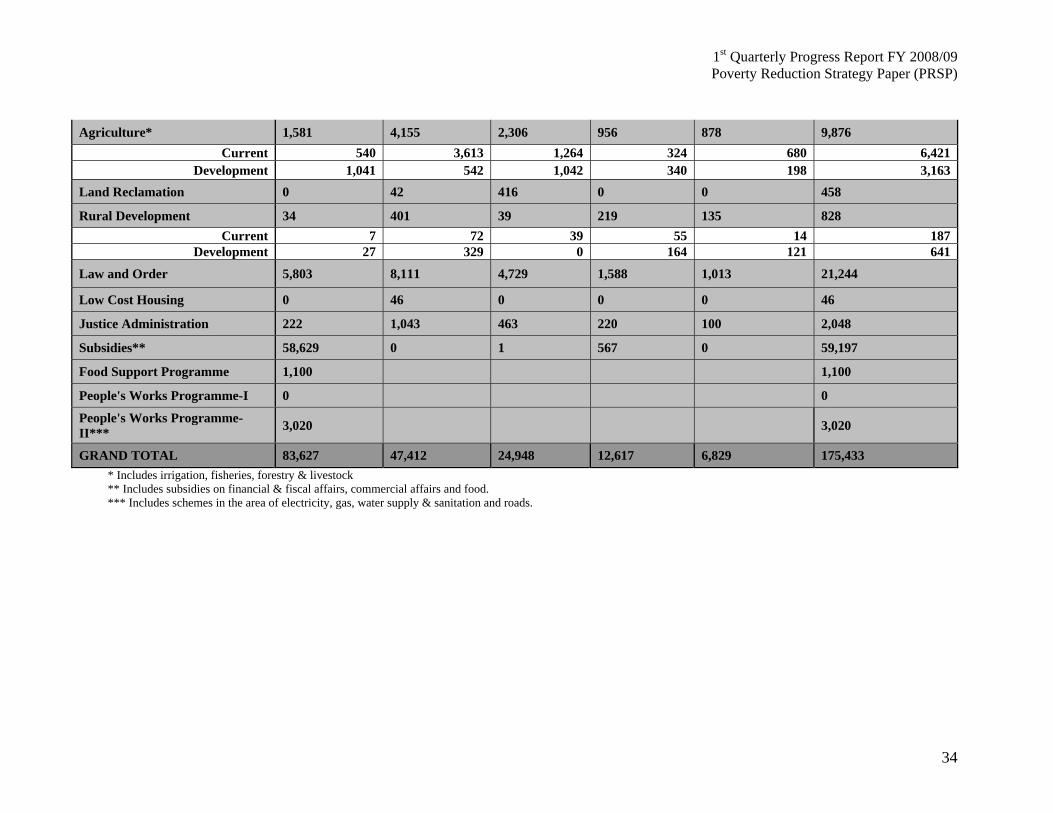
1st Quarterly Progress Report FY 2008/09 Poverty Reduction Strategy Paper (PRSP)
34
Agriculture* 1,581 4,155 2,306 956 878 9,876 Current 540 3,613 1,264 324 680 6,421
Development 1,041 542 1,042 340 198 3,163Land Reclamation 0 42 416 0 0 458
Rural Development 34 401 39 219 135 828 Current 7 72 39 55 14 187
Development 27 329 0 164 121 641
Law and Order 5,803 8,111 4,729 1,588 1,013 21,244
Low Cost Housing 0 46 0 0 0 46
Justice Administration 222 1,043 463 220 100 2,048
Subsidies** 58,629 0 1 567 0 59,197
Food Support Programme 1,100 1,100
People's Works Programme-I 0 0
People's Works Programme-II*** 3,020 3,020
GRAND TOTAL 83,627 47,412 24,948 12,617 6,829 175,433 * Includes irrigation, fisheries, forestry & livestock ** Includes subsidies on financial & fiscal affairs, commercial affairs and food. *** Includes schemes in the area of electricity, gas, water supply & sanitation and roads.
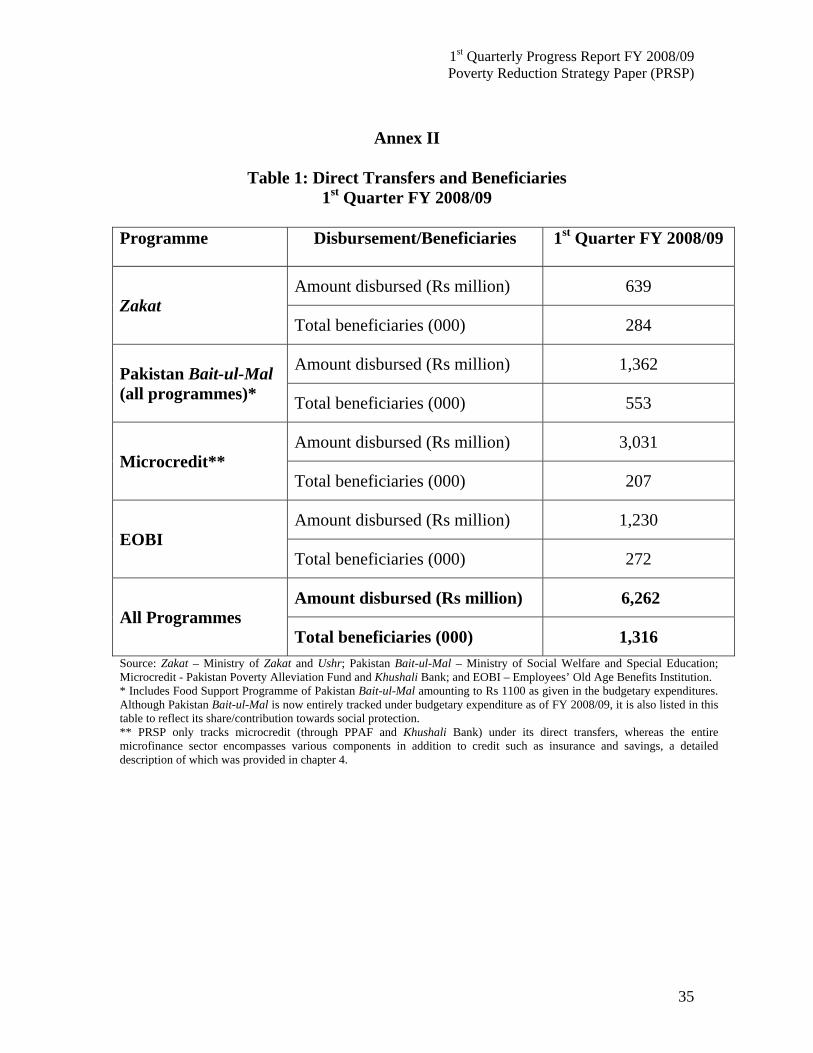
1st Quarterly Progress Report FY 2008/09 Poverty Reduction Strategy Paper (PRSP)
35
Annex II
Table 1: Direct Transfers and Beneficiaries 1st Quarter FY 2008/09
Programme Disbursement/Beneficiaries 1st Quarter FY 2008/09
Zakat Amount disbursed (Rs million) 639
Total beneficiaries (000) 284
Pakistan Bait-ul-Mal (all programmes)*
Amount disbursed (Rs million) 1,362
Total beneficiaries (000) 553
Microcredit** Amount disbursed (Rs million) 3,031
Total beneficiaries (000) 207
EOBI Amount disbursed (Rs million) 1,230
Total beneficiaries (000) 272
All Programmes Amount disbursed (Rs million) 6,262
Total beneficiaries (000) 1,316 Source: Zakat – Ministry of Zakat and Ushr; Pakistan Bait-ul-Mal – Ministry of Social Welfare and Special Education; Microcredit - Pakistan Poverty Alleviation Fund and Khushali Bank; and EOBI – Employees’ Old Age Benefits Institution. * Includes Food Support Programme of Pakistan Bait-ul-Mal amounting to Rs 1100 as given in the budgetary expenditures. Although Pakistan Bait-ul-Mal is now entirely tracked under budgetary expenditure as of FY 2008/09, it is also listed in this table to reflect its share/contribution towards social protection. ** PRSP only tracks microcredit (through PPAF and Khushali Bank) under its direct transfers, whereas the entire microfinance sector encompasses various components in addition to credit such as insurance and savings, a detailed description of which was provided in chapter 4.
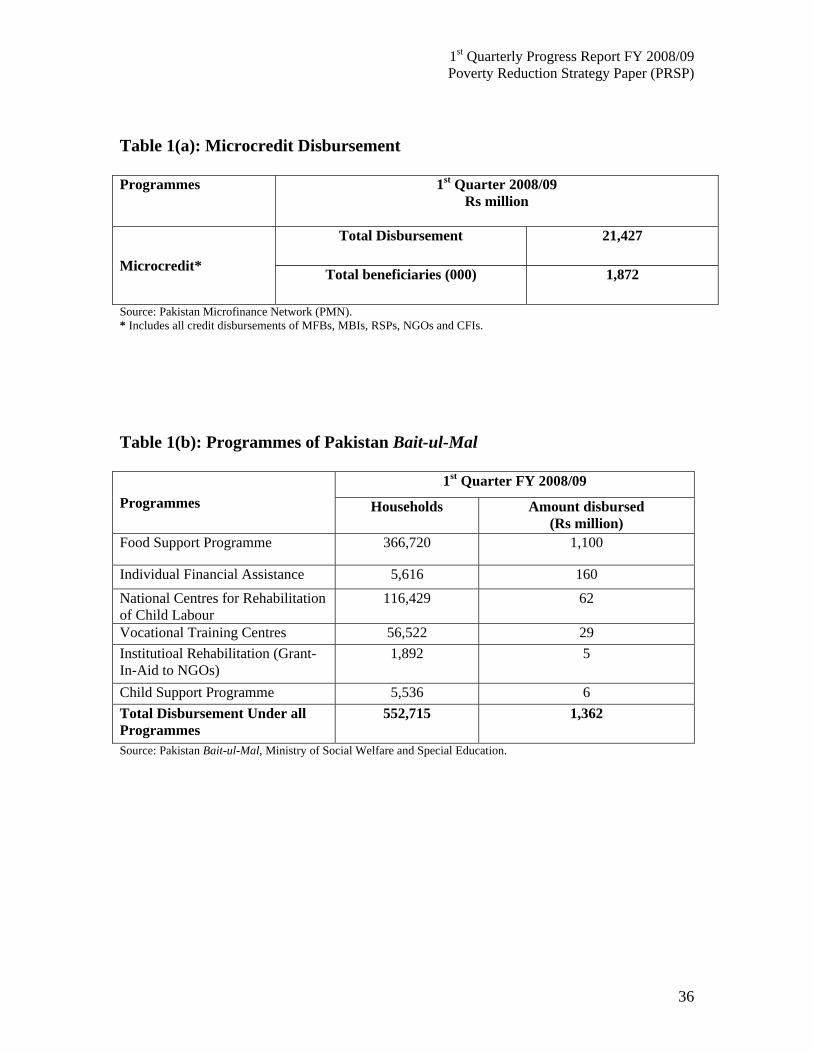
1st Quarterly Progress Report FY 2008/09 Poverty Reduction Strategy Paper (PRSP)
36
Table 1(a): Microcredit Disbursement Programmes 1st Quarter 2008/09
Rs million
Microcredit*
Total Disbursement 21,427
Total beneficiaries (000) 1,872
Source: Pakistan Microfinance Network (PMN). * Includes all credit disbursements of MFBs, MBIs, RSPs, NGOs and CFIs. Table 1(b): Programmes of Pakistan Bait-ul-Mal
Programmes 1st Quarter FY 2008/09
Households Amount disbursed (Rs million)
Food Support Programme 366,720 1,100
Individual Financial Assistance 5,616 160 National Centres for Rehabilitation of Child Labour
116,429 62
Vocational Training Centres 56,522 29 Institutioal Rehabilitation (Grant-In-Aid to NGOs)
1,892 5
Child Support Programme 5,536 6 Total Disbursement Under all Programmes
552,715 1,362
Source: Pakistan Bait-ul-Mal, Ministry of Social Welfare and Special Education.

1st Quarterly Progress Report FY 2008/09 Poverty Reduction Strategy Paper (PRSP)
37
Table 1(c): Zakat Disbursement (1st Quarter FY 2008/09)
(Rs million) Punjab Sindh NWFP Balochistan ICT Northern
Areas FATA
Regular Zakat Programmes
Disbursement 3 312 78 2 7 18 0
Beneficiaries 1,425 109,186 11,759 511 2,340 11,972 0
Other Zakat Programmes
Disbursement 11 48 41 0.043 1 2 0
Beneficiaries 1,031 57,847 13,617 87 3,277 3,680 0
National Level Schemes
Disbursement 54 27 16 9 10 0 0
Beneficiaries 26,000 16,500 12,020 5,320 7,257 0 0
Total amount disbursed
68 387 135 11.04 18 20 0
Total beneficiaries
28,456 183,533 37,396 5,918 12,874 15,652 0
Grand Total Amount Disbursed (Rs million): 639 Grand Total beneficiaries: 283,829 Source: Ministry of Zakat and Ushr.
Table 1(d): Programmes of Employees’ Old Age Benefits Institution (EOBI)
Grant Nature
Q1 FY 2008/09
Beneficiaries Disbursement (Rs million)
Old Age Pension 175,869 801
Invalidity Pension 4,223 18 Survivors Pension 91,936 403 Old age Grants 362 9
Grand Total 272,390 1,230 Source: Employees’ Old Age Benefits Institution (EOBI).

1st Quarterly Progress Report FY 2008/09 Poverty Reduction Strategy Paper (PRSP)
38
Annex III Microfinance Reporting Organizations
Category Microfinance Providers (MFP) MFB Microfinance Bank licensed and prudentially regulated by the State Bank of Pakistan to exclusively service microfinance market.
Khushali Bank Network Microfinance Bank Ltd.
Pak-Oman Microfinance Bank Ltd. Rozgar Microfinance Bank Ltd. Tameer Microfinance Bank Ltd. The First Microfinance Bank Ltd.
MFI Microfinance Institution providing specialized microfinance services.
Akhuwat
Asasah
Kashf Foundation
Orangi Pilot Project
Sindh Agricultural and Forestry Workers Cooperative Organization RSP Rural Support Programme running microfinance operation as part of multi-dimensional rural development programme.
Lachi Poverty Reduction Project
National Rural Support Programme
Punjab Rural Support Programme Sarhad Rural Support Programme Thardeep Rural Support Programme
NGO Non-Governmental Organization running microfinance operations as part of multi-dimensional developed programme.
Centre for Women Cooperative Development Community Support Concern
Development Action for Mobilization and Emancipation
Jinnah Welfare Society Narowal Rural Development Programme Organization for Participatory Development Rural Community Development Society Save the Poor Sindh Rural Support Programme Sungi Development Foundation Swabi Women’s Welfare Society Taraqee Foundation
CFI Commercial Financial Institution providing microfinance services as separate function.
ORIZ Leasing Pakistan Ltd.
Bank of Khyber
Note: The classification given above is made by Pakistan Microfinance Network (PMN) during FY 2005/06.

1st Quarterly Progress Report FY 2008/09 Poverty Reduction Strategy Paper (PRSP)
39
Poverty Reduction Strategy Paper (PRSP) Secretariat External Finance Policy Wing Room # 321 Ministry of Finance Q-Block Pakistan Secretariat Islamabad Pakistan Ph: 0092 (51) 9204844 Fax: 0092 (51) 9205219 Email: [email protected] Website: http://www.finance.gov.pk/poverty/index.aspx