poverty perspective paper-cmr - Philippine Institute for ... - Ilocos 3,499 4,769 7,799 9,822 11,603...
74
25 For comments, suggestions or further inquiries please contact: Philippine Institute for Development Studies Surian sa mga Pag-aaral Pangkaunlaran ng Pilipinas The PIDS Discussion Paper Series constitutes studies that are preliminary and subject to further revisions. They are be- ing circulated in a limited number of cop- ies only for purposes of soliciting com- ments and suggestions for further refine- ments. The studies under the Series are unedited and unreviewed. The views and opinions expressed are those of the author(s) and do not neces- sarily reflect those of the Institute. Not for quotation without permission from the author(s) and the Institute. Service through policy research 1977 1977 1977 1977 1977 2002 2002 2002 2002 2002 December 2002 The Research Information Staff, Philippine Institute for Development Studies 3rd Floor, NEDA sa Makati Building, 106 Amorsolo Street, Legaspi Village, Makati City, Philippines Tel Nos: 8924059 and 8935705; Fax No: 8939589; E-mail: [email protected] Or visit our website at http://www.pids.gov.ph DISCUSSION PAPER SERIES NO. 2002-20 Celia M. Reyes The Poverty Fight: Have We Made an Impact?
Transcript of poverty perspective paper-cmr - Philippine Institute for ... - Ilocos 3,499 4,769 7,799 9,822 11,603...
25
For comments, suggestions or further inquiries please contact:
Philippine Institute for Development StudiesSurian sa mga Pag-aaral Pangkaunlaran ng Pilipinas
The PIDS Discussion Paper Seriesconstitutes studies that are preliminary andsubject to further revisions. They are be-ing circulated in a limited number of cop-ies only for purposes of soliciting com-ments and suggestions for further refine-ments. The studies under the Series areunedited and unreviewed.
The views and opinions expressedare those of the author(s) and do not neces-sarily reflect those of the Institute.
Not for quotation without permissionfrom the author(s) and the Institute.
Service through policy research
1977197719771977197720022002200220022002
December 2002
The Research Information Staff, Philippine Institute for Development Studies3rd Floor, NEDA sa Makati Building, 106 Amorsolo Street, Legaspi Village, Makati City, PhilippinesTel Nos: 8924059 and 8935705; Fax No: 8939589; E-mail: [email protected]
Or visit our website at http://www.pids.gov.ph
DISCUSSION PAPER SERIES NO. 2002-20
Celia M. Reyes
The Poverty Fight:Have We Made an Impact?
Philippine Institute for Development Studies Surian sa mga Pag-aaral Pangkaunlaran ng Pilipinas
The Poverty Fight:
Have We Made An Impact?
by Dr. Celia M. Reyes
12 September 2002 Carlos P. Romulo Hall, NEDA-Makati Bldg., Makati City
In celebration of PIDS Silver Annivesary
1
Abstract
The paper examines the performance of the Philippines with respect to the fight against poverty. It reviews the trends in poverty using the various human development indicators. It also examines the changes in the policy environment over the last 25 years. It identifies issues relating to programs, institutional arrangements and poverty measurement. Keywords: poverty, human development indicators, decomposition, chronic poverty, transient poverty, targeting schemes, social safety nets, poverty reduction programs, community-based monitoring system, minimum basic needs
2
The Poverty Fight: Have We Made An Impact?
by
Celia M. Reyes1
1. Introduction
It is frequently claimed that development efforts in the 1950s overemphasized economic growth rather than the reduction of poverty. The “trickle down” effect was expected to take care of the poverty problem, but this was not the case. In the 1970s and 1980s, there was a conscious shift in the orientation of development effort towards poverty reduction and income equality in the 1970s and 1980s. The urgency to address macroeconomic stabilization and adjustment issues in the 1980s, however, has hindered poverty alleviation policies and programs.
At present, however, the growing consensus is towards a comprehensive approach to poverty reduction. Rapid and sustained economic growth is needed to improve the quality of life of the population; at the same time targeted interventions aimed at reducing poverty are needed to reach the very poor and marginalized sectors of the economy.
The overarching goal of development efforts is the improvement in the improvement in the quality of life of the people. The Philippines is no exception. It is one of 191 nations who participated in the Millenium Summit in September 2000 and committed to achieve 48 targets including eradication of poverty. In addition to international commitments, the Philippines has been working toward poverty reduction for decades. It has even included targets on human development and poverty reduction in its medium-term development plans.
This paper examines the performance of the Philippines with respect to the fight against poverty. It reviews the trends in poverty using the various human development indicators. It also examines the changes in the policy environment over the last 25 years. It identifies issues relating to programs, institutional arrangements and poverty measurement.
Section 2 presents an assessment of the poverty situation using the various
indicators of poverty and human development. Section 3 looks at the decomposition of poverty. It decomposes the change in poverty incidence to growth component and redistributive component. It also decomposes poverty into chronic and transient poverty. Section 4 provides a brief description of the various poverty reduction policies and strategies adopted by the various administrations. Section 5 identifies some of the issues related to poverty reduction programs, institutional arrangements
1 Senior Research Fellow at the Philippine Institute for Development Studies; the author wishes to acknowledge the excellent research assistance provided by her staff: Aubrey D. Tabuga, Marie Anne T. Cagas, Ronina D. Asis and Ma. Blessila G. Datu

3
and poverty measurement and monitoring. Finally, Section 6 provides a summary of the findings and some recommendations. 2. The Poverty Situation 2.1 Status and Trends in Poverty
This section examines the trends and status in poverty using the conventional measures of poverty as well as the more recent ones that looks at the other dimensions of poverty. The different indicators show that the country has been generally successful in improving the quality of life of its population. There have been improvements in the different dimensions, some large and some modest. However, regional disparities are still large and for some indicators have even widened. Moreover, the population seems to be vulnerable to shocks and recent shocks have reversed some of the positive trends.
Income-based Measure of Poverty
The official estimate of poverty incidence is based on a comparison of income
with a poverty threshold defined by the National Statistical and Coordination Board. The poverty threshold is the income needed to meet basic food and non-food needs. The food threshold or subsistence threshold is the income needed to meet basic food needs. Poverty and food thresholds are computed every three years for the different regions and by urban/rural. The poverty thresholds are presented in Table 1.
The official source of income data is the Family Income and Expenditure Survey conducted by the National Statistics Office every three years.
In 1985, 44.2% of the total number of families can be considered poor. Since
then, poverty incidence has declined to 31.8% in 1997. However, the Asian financial crisis coupled with the El Nino in 1997-1998 has reversed the downward trend and has caused poverty incidence to increase to 33.7% in 2000 as shown in Table 2.

4
Table 1. Annual Per Capita Poverty Thresholds (In Pesos), Urban-Rural by Region
1985-2000
Region 1985 1988 1991 1994 1997 2000
Urban NCR 4,527 6,576 9,286 11,230 14,299 17,713 1 - Ilocos 4,643 5,460 8,449 10,326 12,768 15,421 2 - Cagayan Valley 4,538 6,263 9,030 9,457 11,654 15,698 3 - Central Luzon 4,555 6,516 9,177 10,607 12,926 16,437 4 - Southern Tagalog 4,403 5,829 8,956 10,082 13,127 16,405 5 - Bicol 3,676 5,625 7,978 8,679 11,072 14,630 6 - Western Visayas 4,302 4,682 6,886 8,432 10,588 12,696 7 - Central Visayas 3,854 4,279 5,954 7,148 9,345 11,446 8 - Eastern Visayas 3,952 4,246 5,883 7,327 9,991 12,011 9 - Western Mindanao 4,248 4,680 7,701 8,449 11,299 12,643 10 - Northern Mindanao 4,201 5,713 7,256 8,783 11,259 12,906 11 - Southern Mindanao 4,217 5,667 7,528 8,851 11,704 13,737 12 - Central Mindanao 4,120 6,117 8,322 10,078 12,468 14,589 CAR . 6,514 8,154 11,054 13,521 17,207 ARMM . . 8,468 10,035 12,603 15,690 Rural NCR . . . . . . 1 - Ilocos 3,499 4,769 7,799 9,822 11,603 14,429 2 - Cagayan Valley 3,265 4,286 6,370 7,942 9,402 11,430 3 - Central Luzon 3,402 4,360 6,791 8,566 10,467 12,477 4 - Southern Tagalog 3,435 4,318 7,141 8,948 11,710 13,725 5 - Bicol 3,372 3,756 5,695 8,165 10,120 12,196 6 - Western Visayas 3,428 4,212 6,099 8,053 10,543 12,543 7 - Central Visayas 3,033 3,428 5,285 5,826 8,222 10,736 8 - Eastern Visayas 3,091 3,681 4,815 6,083 8,250 10,287 9 - Western Mindanao 3,380 3,600 5,648 6,360 9,055 10,247 10 - Northern Mindanao 3,328 4,120 5,745 7,253 9,869 11,632 11 - Southern Mindanao 3,342 4,445 5,678 7,644 9,762 11,513 12 - Central Mindanao 3,571 3,785 6,725 8,364 10,573 11,271 CAR . 4,696 8,412 10,766 12,554 14,616 ARMM . . 7,137 8,537 10,711 13,371 Source: TWG on Income and Poverty Statistics, NSCB
5
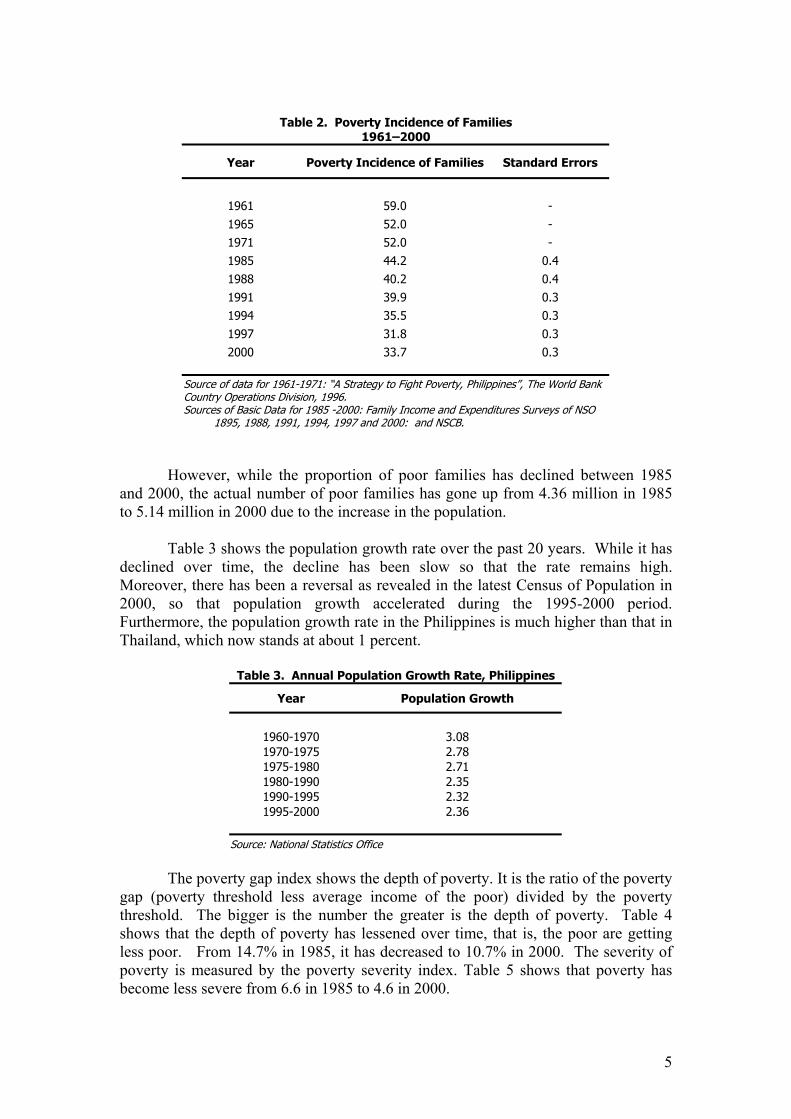
Table 2. Poverty Incidence of Families
1961–2000
Year Poverty Incidence of Families Standard Errors
1961 59.0 - 1965 52.0 - 1971 52.0 - 1985 44.2 0.4 1988 40.2 0.4 1991 39.9 0.3 1994 35.5 0.3 1997 31.8 0.3 2000 33.7 0.3
Source of data for 1961-1971: “A Strategy to Fight Poverty, Philippines”, The World Bank Country Operations Division, 1996. Sources of Basic Data for 1985 -2000: Family Income and Expenditures Surveys of NSO 1895, 1988, 1991, 1994, 1997 and 2000: and NSCB.
However, while the proportion of poor families has declined between 1985 and 2000, the actual number of poor families has gone up from 4.36 million in 1985 to 5.14 million in 2000 due to the increase in the population.
Table 3 shows the population growth rate over the past 20 years. While it has
declined over time, the decline has been slow so that the rate remains high. Moreover, there has been a reversal as revealed in the latest Census of Population in 2000, so that population growth accelerated during the 1995-2000 period. Furthermore, the population growth rate in the Philippines is much higher than that in Thailand, which now stands at about 1 percent.
Table 3. Annual Population Growth Rate, Philippines
Year Population Growth
1960-1970 3.08 1970-1975 2.78 1975-1980 2.71 1980-1990 2.35 1990-1995 2.32 1995-2000 2.36
Source: National Statistics Office
The poverty gap index shows the depth of poverty. It is the ratio of the poverty
gap (poverty threshold less average income of the poor) divided by the poverty threshold. The bigger is the number the greater is the depth of poverty. Table 4 shows that the depth of poverty has lessened over time, that is, the poor are getting less poor. From 14.7% in 1985, it has decreased to 10.7% in 2000. The severity of poverty is measured by the poverty severity index. Table 5 shows that poverty has become less severe from 6.6 in 1985 to 4.6 in 2000.
6
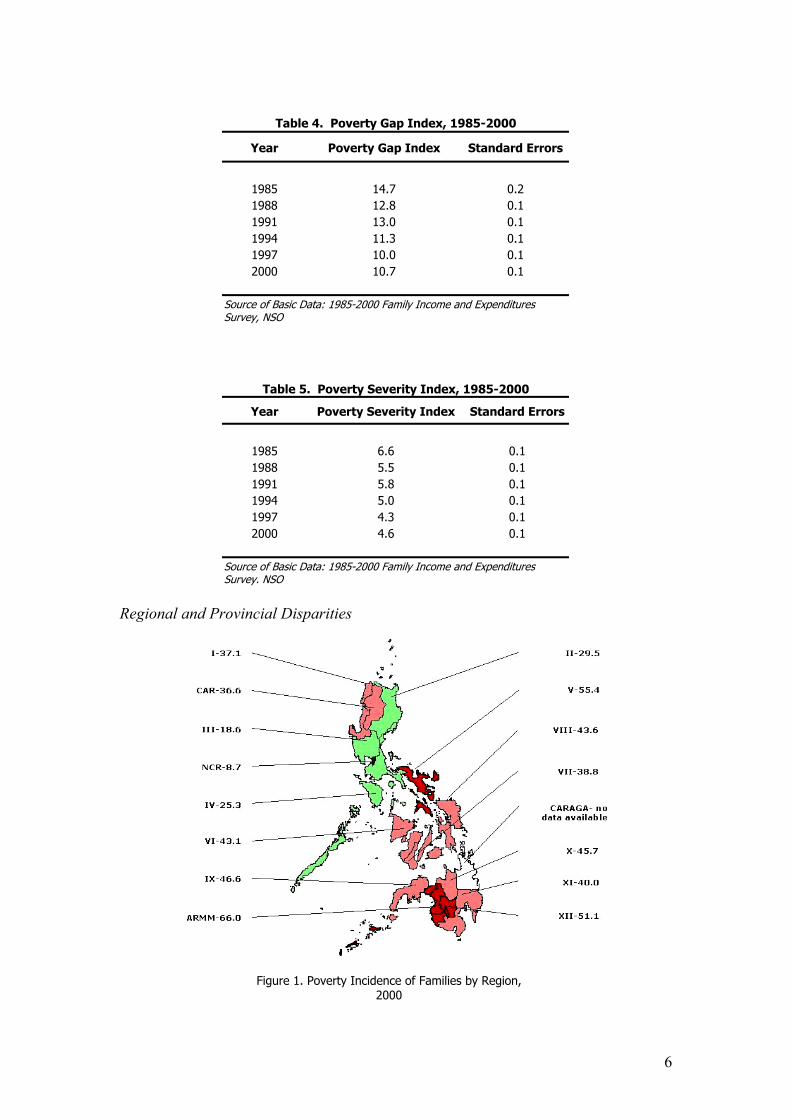
Table 4. Poverty Gap Index, 1985-2000
Year Poverty Gap Index Standard Errors
1985 14.7 0.2 1988 12.8 0.1 1991 13.0 0.1 1994 11.3 0.1 1997 10.0 0.1 2000 10.7 0.1
Source of Basic Data: 1985-2000 Family Income and Expenditures Survey, NSO
Table 5. Poverty Severity Index, 1985-2000
Year Poverty Severity Index Standard Errors
1985 6.6 0.1 1988 5.5 0.1 1991 5.8 0.1 1994 5.0 0.1 1997 4.3 0.1 2000 4.6 0.1
Source of Basic Data: 1985-2000 Family Income and Expenditures Survey. NSO
Regional and Provincial Disparities
Figure 1. Poverty Incidence of Families by Region, 2000
7
Despite the decline in poverty incidence, it is worrisome to note that poverty incidence remains very high in certain regions and provinces. In 2000, poverty incidence is highest in the Autonomous Region of Muslim Mindanao where almost 66 out of every 100 families can be considered poor. The Bicol Region comes second where 55 out of every 100 families can be considered poor. In contrast, only 9 out of every 100 families in the National Capital Region can be considered poor.
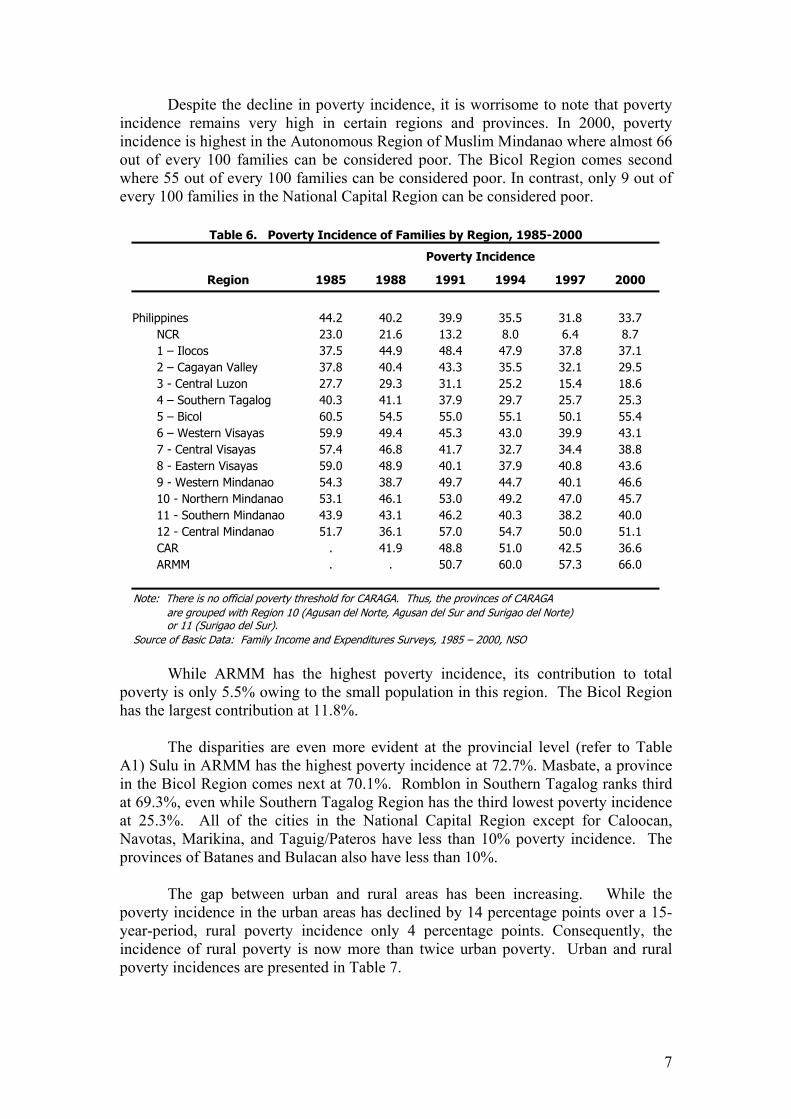
Table 6. Poverty Incidence of Families by Region, 1985-2000
Poverty Incidence
Region 1985 1988 1991 1994 1997 2000
Philippines 44.2 40.2 39.9 35.5 31.8 33.7 NCR 23.0 21.6 13.2 8.0 6.4 8.7 1 – Ilocos 37.5 44.9 48.4 47.9 37.8 37.1 2 – Cagayan Valley 37.8 40.4 43.3 35.5 32.1 29.5 3 - Central Luzon 27.7 29.3 31.1 25.2 15.4 18.6 4 – Southern Tagalog 40.3 41.1 37.9 29.7 25.7 25.3 5 – Bicol 60.5 54.5 55.0 55.1 50.1 55.4 6 – Western Visayas 59.9 49.4 45.3 43.0 39.9 43.1 7 - Central Visayas 57.4 46.8 41.7 32.7 34.4 38.8 8 - Eastern Visayas 59.0 48.9 40.1 37.9 40.8 43.6 9 - Western Mindanao 54.3 38.7 49.7 44.7 40.1 46.6 10 - Northern Mindanao 53.1 46.1 53.0 49.2 47.0 45.7 11 - Southern Mindanao 43.9 43.1 46.2 40.3 38.2 40.0 12 - Central Mindanao 51.7 36.1 57.0 54.7 50.0 51.1 CAR . 41.9 48.8 51.0 42.5 36.6 ARMM . . 50.7 60.0 57.3 66.0 Note: There is no official poverty threshold for CARAGA. Thus, the provinces of CARAGA are grouped with Region 10 (Agusan del Norte, Agusan del Sur and Surigao del Norte) or 11 (Surigao del Sur). Source of Basic Data: Family Income and Expenditures Surveys, 1985 – 2000, NSO
While ARMM has the highest poverty incidence, its contribution to total
poverty is only 5.5% owing to the small population in this region. The Bicol Region has the largest contribution at 11.8%.
The disparities are even more evident at the provincial level (refer to Table A1) Sulu in ARMM has the highest poverty incidence at 72.7%. Masbate, a province in the Bicol Region comes next at 70.1%. Romblon in Southern Tagalog ranks third at 69.3%, even while Southern Tagalog Region has the third lowest poverty incidence at 25.3%. All of the cities in the National Capital Region except for Caloocan, Navotas, Marikina, and Taguig/Pateros have less than 10% poverty incidence. The provinces of Batanes and Bulacan also have less than 10%. The gap between urban and rural areas has been increasing. While the poverty incidence in the urban areas has declined by 14 percentage points over a 15-year-period, rural poverty incidence only 4 percentage points. Consequently, the incidence of rural poverty is now more than twice urban poverty. Urban and rural poverty incidences are presented in Table 7.
8
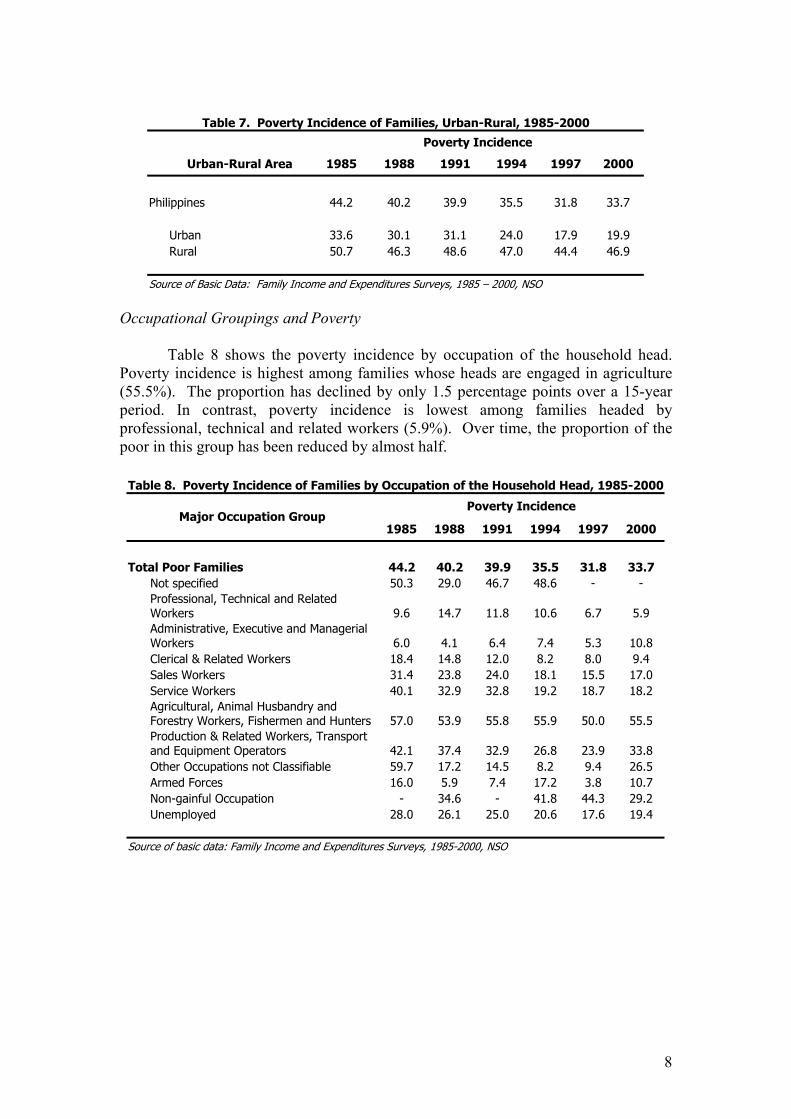
Table 7. Poverty Incidence of Families, Urban-Rural, 1985-2000
Poverty Incidence
Urban-Rural Area 1985 1988 1991 1994 1997 2000
Philippines 44.2 40.2 39.9 35.5 31.8 33.7 Urban 33.6 30.1 31.1 24.0 17.9 19.9 Rural 50.7 46.3 48.6 47.0 44.4 46.9 Source of Basic Data: Family Income and Expenditures Surveys, 1985 – 2000, NSO
Occupational Groupings and Poverty Table 8 shows the poverty incidence by occupation of the household head. Poverty incidence is highest among families whose heads are engaged in agriculture (55.5%). The proportion has declined by only 1.5 percentage points over a 15-year period. In contrast, poverty incidence is lowest among families headed by professional, technical and related workers (5.9%). Over time, the proportion of the poor in this group has been reduced by almost half.
Table 8. Poverty Incidence of Families by Occupation of the Household Head, 1985-2000
Poverty Incidence Major Occupation Group
1985 1988 1991 1994 1997 2000
Total Poor Families 44.2 40.2 39.9 35.5 31.8 33.7 Not specified 50.3 29.0 46.7 48.6 - -
Professional, Technical and Related Workers 9.6 14.7 11.8 10.6 6.7 5.9
Administrative, Executive and Managerial Workers 6.0 4.1 6.4 7.4 5.3 10.8
Clerical & Related Workers 18.4 14.8 12.0 8.2 8.0 9.4 Sales Workers 31.4 23.8 24.0 18.1 15.5 17.0 Service Workers 40.1 32.9 32.8 19.2 18.7 18.2
Agricultural, Animal Husbandry and Forestry Workers, Fishermen and Hunters 57.0 53.9 55.8 55.9 50.0 55.5
Production & Related Workers, Transport and Equipment Operators 42.1 37.4 32.9 26.8 23.9 33.8
Other Occupations not Classifiable 59.7 17.2 14.5 8.2 9.4 26.5 Armed Forces 16.0 5.9 7.4 17.2 3.8 10.7 Non-gainful Occupation - 34.6 - 41.8 44.3 29.2 Unemployed 28.0 26.1 25.0 20.6 17.6 19.4 Source of basic data: Family Income and Expenditures Surveys, 1985-2000, NSO

9
More than half of the farm households are poor (Table 9). Moreover, the poverty incidence has not significantly declined over the 15-year period. This is due to the low productivity in the agriculture sector.
Table 9. Poverty Incidence of Families among Farmers, 1985-2000
Year Poverty Incidence
1985 56.7 1988 55.5 1991 57.3 1994 55.4 1997 52.3 2000 55.8
Source of basic data: Family Income & Expenditures Survey, NSO
Educational Attainment and Poverty The proportion of poor families decreases as the educational attainment of the household head increases (Table 10). Three out of every 5 families whose head did not attend school are poor. On the other hand, only 2 out of every 100 families headed by a college graduate are poor. Over time, the incidence has declined for this group (from 6.5% to 2.5%) while the incidence has increased for the first group (55.9% to 60.5%), indicating that it is becoming more difficult for those with no schooling to earn enough to become non-poor.
Table 10. Poverty Incidence by Highest Educational Attainment of the Household Head
Poverty Incidence Highest Educational Attainment
of the Household Head 1985 1988 1991 1994 1997 2000
Poverty Incidence 44.2 40.2 39.9 35.5 31.8 33.7 No Grade 55.9 47.3 55.8 55.2 52.5 60.5 Elementary Undergraduate 57.2 54.1 53.2 50.7 48.6 45.2 Elementary Graduate 51.6 49.6 48.7 43.6 39.8 26.0 1st-3rd Year High School 46.5 40.5 43.1 35.3 33.2 11.9 High School Graduate 31.6 29.3 29.6 23.6 21.0 18.2 College Undergraduate 17.0 17.9 16.2 11.7 10.9 10.3 At least College Graduate 6.5 4.4 4.0 4.0 2.4 2.5 Source of basic data: Family Income and Expenditures Surveys, 1985-2000, NSO
10
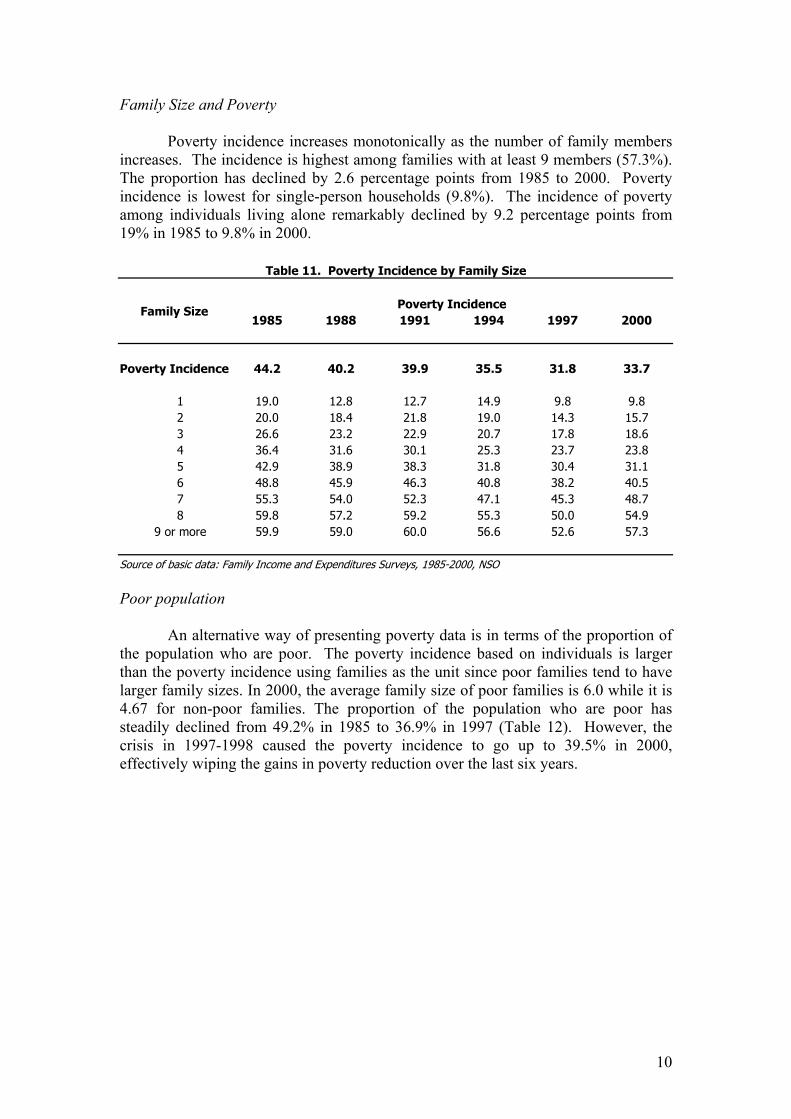
Family Size and Poverty Poverty incidence increases monotonically as the number of family members increases. The incidence is highest among families with at least 9 members (57.3%). The proportion has declined by 2.6 percentage points from 1985 to 2000. Poverty incidence is lowest for single-person households (9.8%). The incidence of poverty among individuals living alone remarkably declined by 9.2 percentage points from 19% in 1985 to 9.8% in 2000.
Table 11. Poverty Incidence by Family Size
Poverty Incidence Family Size 1985 1988 1991 1994 1997 2000
Poverty Incidence 44.2 40.2 39.9 35.5 31.8 33.7 1 19.0 12.8 12.7 14.9 9.8 9.8 2 20.0 18.4 21.8 19.0 14.3 15.7 3 26.6 23.2 22.9 20.7 17.8 18.6 4 36.4 31.6 30.1 25.3 23.7 23.8 5 42.9 38.9 38.3 31.8 30.4 31.1 6 48.8 45.9 46.3 40.8 38.2 40.5 7 55.3 54.0 52.3 47.1 45.3 48.7 8 59.8 57.2 59.2 55.3 50.0 54.9 9 or more 59.9 59.0 60.0 56.6 52.6 57.3 Source of basic data: Family Income and Expenditures Surveys, 1985-2000, NSO Poor population An alternative way of presenting poverty data is in terms of the proportion of the population who are poor. The poverty incidence based on individuals is larger than the poverty incidence using families as the unit since poor families tend to have larger family sizes. In 2000, the average family size of poor families is 6.0 while it is 4.67 for non-poor families. The proportion of the population who are poor has steadily declined from 49.2% in 1985 to 36.9% in 1997 (Table 12). However, the crisis in 1997-1998 caused the poverty incidence to go up to 39.5% in 2000, effectively wiping the gains in poverty reduction over the last six years.

11
Seven out of the 15 regions have more than half of their population who are poor.
Table 12. Poverty Incidence of Population by Region, 1985-2000
Poverty Incidence Region
1985 1988 1991 1994 1997 2000
Philippines 49.2 45.4 45.2 40.6 36.9 39.5 NCR 27.1 25.1 16.6 10.4 8.5 11.5 1 – Ilocos 43.4 51.7 55.1 53.5 44.2 43.6 2 – Cagayan Valley 42.7 44.7 48.9 41.9 38.0 35.0 3 - Central Luzon 32.0 33.7 35.5 29.2 18.6 23.0 4 – Southern Tagalog 45.7 46.6 43.1 35.0 30.0 31.0 5 – Bicol 67.5 61.3 61.2 60.8 57.0 61.9 6 - Western Visayas 66.4 56.5 52.8 49.8 45.9 51.1 7 - Central Visayas 61.9 52.1 46.7 37.4 39.0 43.8 8 - Eastern Visayas 65.1 54.7 47.1 44.6 48.5 51.1 9 - Western Mindanao 59.9 43.8 54.2 50.5 45.5 53.0 10 - Northern Mindanao 56.6 50.1 57.4 54.2 52.7 52.2 11 - Southern Mindanao 49.6 48.8 51.5 45.4 44.3 45.1 12 - Central Mindanao 56.3 40.9 63.0 58.5 55.8 58.1 CAR . 50.5 55.5 56.5 50.1 43.8 ARMM . . 56.0 65.5 62.5 71.3 Source of Basic Data: 1985-2000 Family Income and Expenditures Survey, NSO
In terms of magnitude, the number of poor has increased from 26.7 million in 1985 to 26.8 million in 1997. This went up further to 30.8 million in 2000.
Table 13. Magnitude of Poor Population, 1985-2000
Year Magnitude of Poor Population
1985 26,674,645 1988 25,385,200 1991 28,554,247 1994 27,372,971 1997 26,768,596 2000 30,850,262
Source of Basic Data: 1985-2000 Family Income and Expenditures Survey, NSO
12
Subsistence incidence
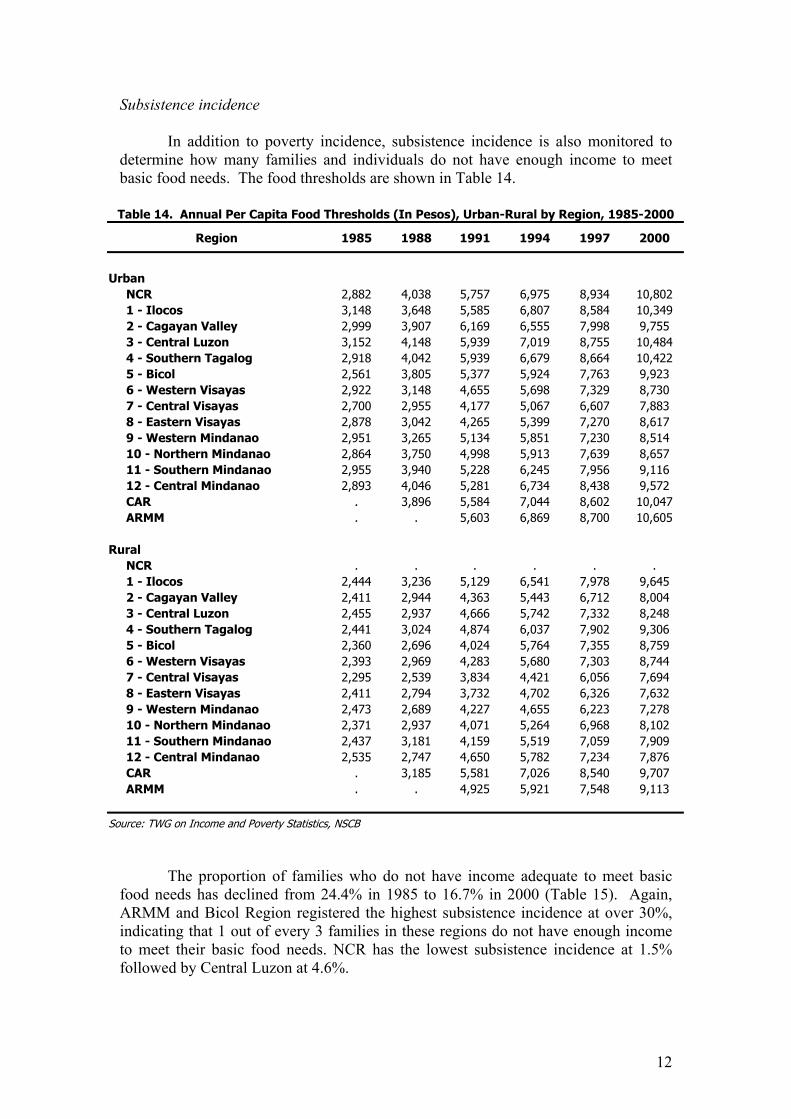
In addition to poverty incidence, subsistence incidence is also monitored to determine how many families and individuals do not have enough income to meet basic food needs. The food thresholds are shown in Table 14.
Table 14. Annual Per Capita Food Thresholds (In Pesos), Urban-Rural by Region, 1985-2000
Region 1985 1988 1991 1994 1997 2000
Urban NCR 2,882 4,038 5,757 6,975 8,934 10,802 1 - Ilocos 3,148 3,648 5,585 6,807 8,584 10,349 2 - Cagayan Valley 2,999 3,907 6,169 6,555 7,998 9,755 3 - Central Luzon 3,152 4,148 5,939 7,019 8,755 10,484 4 - Southern Tagalog 2,918 4,042 5,939 6,679 8,664 10,422 5 - Bicol 2,561 3,805 5,377 5,924 7,763 9,923 6 - Western Visayas 2,922 3,148 4,655 5,698 7,329 8,730 7 - Central Visayas 2,700 2,955 4,177 5,067 6,607 7,883 8 - Eastern Visayas 2,878 3,042 4,265 5,399 7,270 8,617 9 - Western Mindanao 2,951 3,265 5,134 5,851 7,230 8,514 10 - Northern Mindanao 2,864 3,750 4,998 5,913 7,639 8,657 11 - Southern Mindanao 2,955 3,940 5,228 6,245 7,956 9,116 12 - Central Mindanao 2,893 4,046 5,281 6,734 8,438 9,572 CAR . 3,896 5,584 7,044 8,602 10,047 ARMM . . 5,603 6,869 8,700 10,605 Rural NCR . . . . . . 1 - Ilocos 2,444 3,236 5,129 6,541 7,978 9,645 2 - Cagayan Valley 2,411 2,944 4,363 5,443 6,712 8,004 3 - Central Luzon 2,455 2,937 4,666 5,742 7,332 8,248 4 - Southern Tagalog 2,441 3,024 4,874 6,037 7,902 9,306 5 - Bicol 2,360 2,696 4,024 5,764 7,355 8,759 6 - Western Visayas 2,393 2,969 4,283 5,680 7,303 8,744 7 - Central Visayas 2,295 2,539 3,834 4,421 6,056 7,694 8 - Eastern Visayas 2,411 2,794 3,732 4,702 6,326 7,632 9 - Western Mindanao 2,473 2,689 4,227 4,655 6,223 7,278 10 - Northern Mindanao 2,371 2,937 4,071 5,264 6,968 8,102 11 - Southern Mindanao 2,437 3,181 4,159 5,519 7,059 7,909 12 - Central Mindanao 2,535 2,747 4,650 5,782 7,234 7,876 CAR . 3,185 5,581 7,026 8,540 9,707 ARMM . . 4,925 5,921 7,548 9,113 Source: TWG on Income and Poverty Statistics, NSCB
The proportion of families who do not have income adequate to meet basic food needs has declined from 24.4% in 1985 to 16.7% in 2000 (Table 15). Again, ARMM and Bicol Region registered the highest subsistence incidence at over 30%, indicating that 1 out of every 3 families in these regions do not have enough income to meet their basic food needs. NCR has the lowest subsistence incidence at 1.5% followed by Central Luzon at 4.6%.

13
Table 15. Subsistence Incidence of Families by Region, 1985-2000
Subsistence Incidence Region
1985 1988 1991 1994 1997 2000
Philippines 24.4 20.3 20.4 18.1 16.2 16.7 NCR 6.0 5.0 2.1 0.7 0.8 1.5 1 – Ilocos 15.5 19.6 24.6 23.5 17.8 15.9 2 - Cagayan Valley 19.1 18.4 20.1 16.8 13.5 12.4 3 - Central Luzon 11.6 10.2 11.1 9.4 4.7 4.6 4 – Southern Tagalog 20.3 21.6 17.1 13.3 10.5 10.1 5 – Bicol 37.4 31.5 31.6 32.9 30.2 34.1 6 - Western Visayas 33.6 25.9 21.8 22.2 19.5 22.1 7 - Central Visayas 39.7 27.6 23.4 17.2 19.8 22.5 8 - Eastern Visayas 42.4 31.2 26.1 23.4 25.8 24.8 9 - Western Mindanao 34.6 22.8 28.0 25.9 20.6 26.7 10 - Northern Mindanao 33.4 27.2 33.6 30.1 26.8 26.3 11 - Southern Mindanao 23.3 24.0 26.2 21.2 21.7 20.0 12 - Central Mindanao 29.6 16.8 34.3 32.6 30.6 28.0 CAR - 16.4 31.8 27.8 24.9 18.0 ARMM - - 26.7 25.3 27.7 35.5
Source of Basic Data: 1985-2000 Family Income and Expenditures Survey, NSO
Income Inequality
Income inequality has not improved over the last 15 years. The share of the poorest quintile has declined from 4.8 percent in 1985 to 4.7 percent in 2000, while the share of the richest quintile has increased from 52.1 percent to 54.8 percent over the same period.
Table 16. Share of Income of Bottom 20% to Income of all Households
Year Share of Bottom 20%
1985 4.79 1988 4.64 1991 4.49 1994 4.50 1997 4.58 2000 4.67
Source of Basic Data: 1985-2000 Family Income and Expenditures Survey, NSO

14
Moreover, the ratio of the average income of the richest decile to the average income of the poorest decile has basically remained unchanged over the same period at 21.
Table 17. Decile Dispersion Ratio, 1985-2000
Year Ratio of Average Income of Richest Decile to Poorest Decile
1985 21.1 1988 22.2 1991 22.5 1994 22.8 1997 21.9 2000 21.2
Source of Basic Data: 1985-2000 Family Income and Expenditures Survey, NSO
The Gini concentration ratio has gone up from 0.47 in 1985 to 0.51 in 2000,
indicating greater inequality.
0.51
0.52
0.47
0.49
0.47
0.47
0.44
0.45
0.46
0.47
0.48
0.49
0.50
0.51
0.52
0.53
1985 1988 1991 1994 1997 2000
Other human development indicators Education
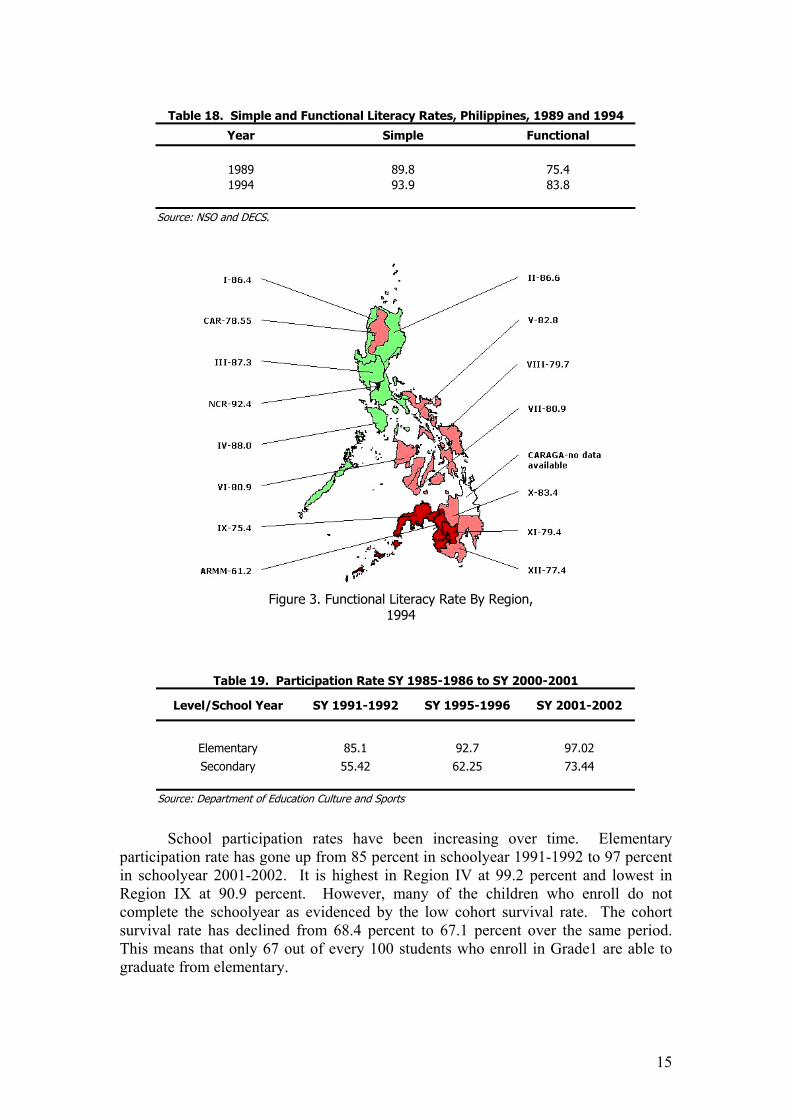
There have been significant improvements in the educational status of the population. Simple literacy rate has gone up from 90 percent in 1989 to 94 percent in 1994. Moreover, functional literacy rate has also increased from 75 percent to 84 percent over the same period. Functional literacy rate is lowest in ARMM at 61.2 percent and highest in NCR at 92.3 percent.
Figure 2. Gini Concentration Ratios, 1985-2000
15
School participation rates have been increasing over time. Elementary
participation rate has gone up from 85 percent in schoolyear 1991-1992 to 97 percent in schoolyear 2001-2002. It is highest in Region IV at 99.2 percent and lowest in Region IX at 90.9 percent. However, many of the children who enroll do not complete the schoolyear as evidenced by the low cohort survival rate. The cohort survival rate has declined from 68.4 percent to 67.1 percent over the same period. This means that only 67 out of every 100 students who enroll in Grade1 are able to graduate from elementary.
Table 18. Simple and Functional Literacy Rates, Philippines, 1989 and 1994
Year Simple Functional
1989 89.8 75.4 1994 93.9 83.8
Source: NSO and DECS.
Table 19. Participation Rate SY 1985-1986 to SY 2000-2001
Level/School Year SY 1991-1992 SY 1995-1996 SY 2001-2002
Elementary 85.1 92.7 97.02 Secondary 55.42 62.25 73.44
Source: Department of Education Culture and Sports
Figure 3. Functional Literacy Rate By Region, 1994
16
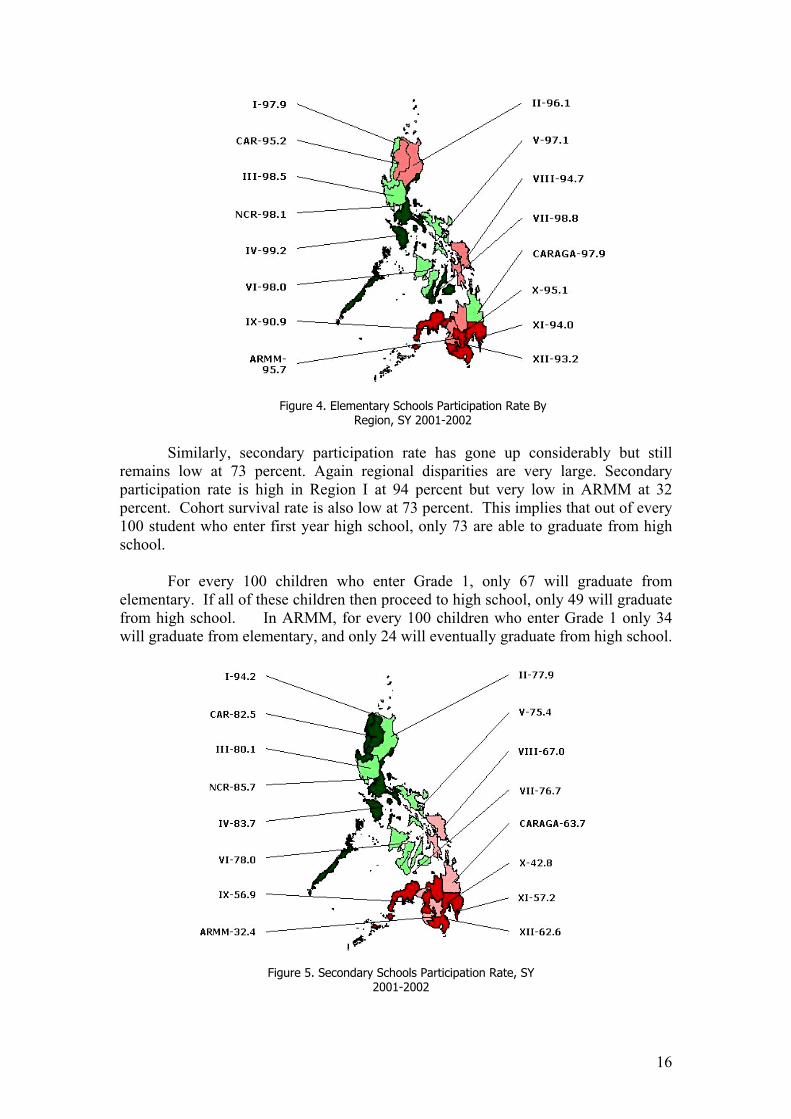
Similarly, secondary participation rate has gone up considerably but still
remains low at 73 percent. Again regional disparities are very large. Secondary participation rate is high in Region I at 94 percent but very low in ARMM at 32 percent. Cohort survival rate is also low at 73 percent. This implies that out of every 100 student who enter first year high school, only 73 are able to graduate from high school.
For every 100 children who enter Grade 1, only 67 will graduate from
elementary. If all of these children then proceed to high school, only 49 will graduate from high school. In ARMM, for every 100 children who enter Grade 1 only 34 will graduate from elementary, and only 24 will eventually graduate from high school.
Figure 4. Elementary Schools Participation Rate By Region, SY 2001-2002
Figure 5. Secondary Schools Participation Rate, SY 2001-2002

17
Figure 6. Elementary Schools Cohort Survival Rate, SY 2001-2002
Figure 7. Secondary Schools Cohort Survival Rate, SY 2001-2002

18
Health Improvements in the health status of the population is evident in the increase in the life expectancy from 56.9 in 1975 to 66.6 years in 2001 for males and from 59.9 years in 1975 to 71.9 years in 2001 for females.
Table 20. Life Expectancy at Birth
Gender 1975 1980 1985 1990 1995 2000 2001
Male 56.9 59.8 61.3 62.8 64.8 66.3 66.6
Female 59.9 63.4 64.9 66.4 70.1 71.6 71.9
Source: Philippine Statistical Yearbook, 1991 and 2001, NSO
Infant and child mortality rates have declined significantly. Infant mortality rate (IMR) was reduced from 57 per 1000 live births in 1990 to 35 in 1998. Mortality rate among children below five years old was also reduced from 80 per 1000 children aged les than 5 years old to 48 in 1998. However, disparities are very large with IMR in ARMM more than double that in NCR and Region VII.
Figure 8. Infant Mortality Rate By Region, 1998

19
Maternal mortality rate (MMR), however, remains high despite the decline from 209 per 100,000 live births in 1993 to 172 in 1998. Furthermore, MMR in ARMM is very high at 320, almost triple that in NCR.
Figure 9. Child Mortality Rate By Region, 1995
Figure 10. Maternal Mortality Rate By Region, 1995

20
The mortality data suggests that areas where access to primary health care may be limited by geography or political conflict, the risk of dying is double that in areas where health care is more available. Nutrition
The nutritional status of the population has improved, albeit modestly. Malnutrition prevalence among 0-5 year old children has declined by 4 percentage points over an 11-year period. Despite the improvement, 3 out of every 10 children are still underweight based on international standards.
Table 21. Prevalence of Malnutrition Among 0-5 Year-Old Children
Percentage of children who are underweight for their age Year
Philippine Reference Standards International Reference Standards
1987 9.9 a/ .
1989-90 9.8 a/ 34.5 1992 10.2 a/ 34.0 1993 8.4 a/ 29.9 1996 8.8 30.8 1998 9.2 32.0 2001 . 30.6
A/ 0-6 year-old children
Source: FNRI, DOST
Figure 11. Malnutrition Prevalence (International Standards), 2001

21
Access to basic facilities Access to safe water has gone up steadily from 69.9% in 1985 to 78.5% in 2000. However, despite this improvement, some areas continue to suffer from low access. Only 3 out of every 10 households in ARMM have access to potable water.
Table 22. Access to Potable Water, 1985-2000
Proportion with Access to Potable Water Region
1985 1988 1991 1994 1997 2000
Philippines 69.9 71.9 73.7 77.4 76.9 78.5 Source of Basic Data: 1985-2000 Family Income and Expenditures Survey, NSO
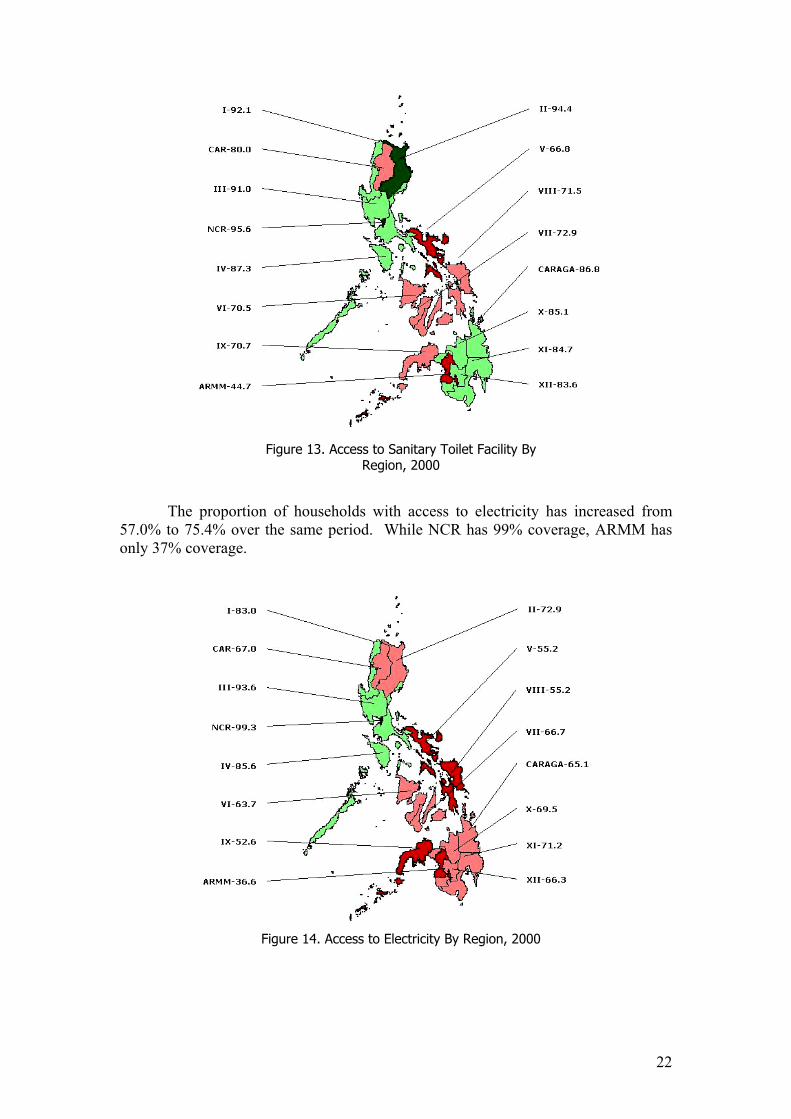
Access to sanitation increased from 68.8% in 1985 to 82.5% in 2000. Again, ARMM has the lowest access at 44.7% while NCR has the highest access at 95.6%.
Table 23. Access to Sanitary Toilet Facility, 1985-2000
Proportion with Access Sanitary Toilet Facility Region
1985 1988 1991 1994 1997 2000
Philippines 68.8 69.1 71.6 74.9 77.2 82.5
Source of Basic Data: 1985-2000 Family Income and Expenditures Survey, NSO
Figure 12. Access to Potable Water By Region, 2000
22
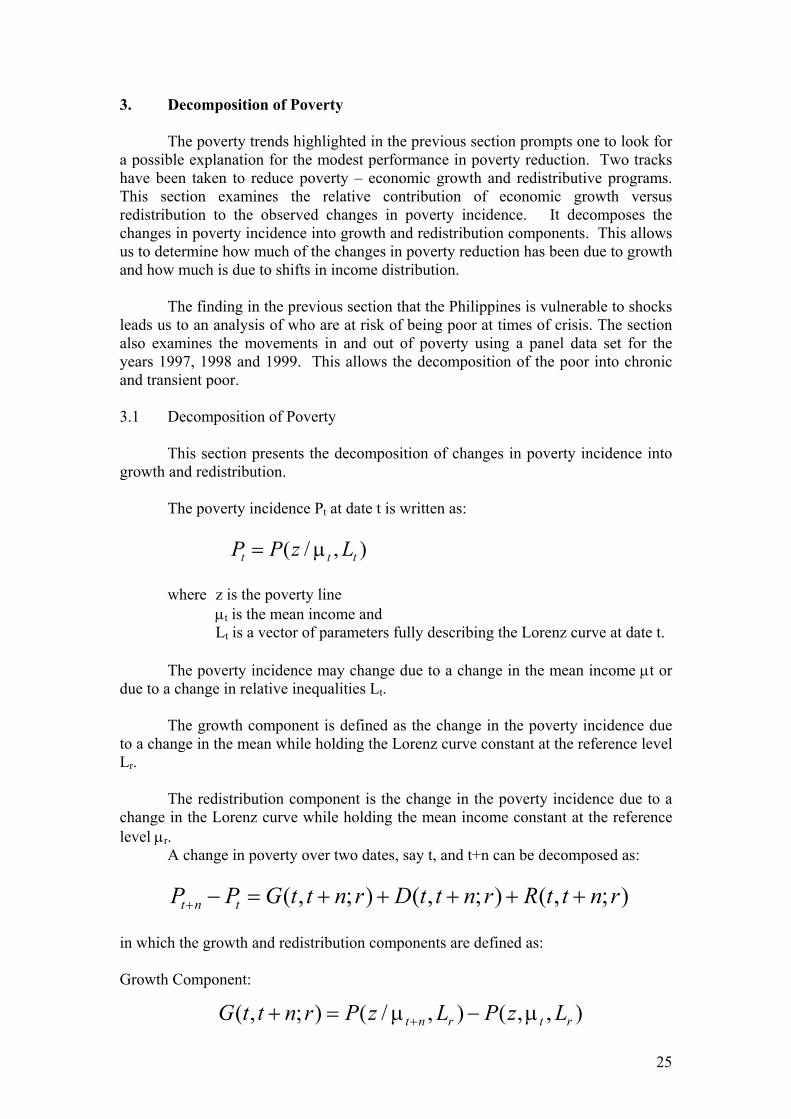
The proportion of households with access to electricity has increased from 57.0% to 75.4% over the same period. While NCR has 99% coverage, ARMM has only 37% coverage.
Figure 13. Access to Sanitary Toilet Facility By Region, 2000
Figure 14. Access to Electricity By Region, 2000

23
Comparison with other countries Table 24 shows selected social indicators for the Philippines, Malaysia, Indonesia, Thailand and Vietnam. Philippines has the highest poverty incidence based on the US$1 /day criterion adopted by the World Bank for international comparison. Vietnam, which had a poverty incidence of 51 percent in 1990 while the Philippines had 19 percent at that time, now has a lower poverty incidence. However, the Philippines performs better than Vietnam in the area of nutrition, literacy, health and education. Thailand, which is often regarded as very similar to the Philippines 20 years ago, has been more successful in reducing poverty. The Philippines is the second best performer in education as evidenced by the high elementary participation rate.
Table 24. Selected Social Indicators, Philippines and Some Neighboring Countries
Indicator Philippines Malaysia Indonesia Thailand Vietnam
Poverty Incidence (% of popn below US$1/day), 2000 12.7 0 8 3.5 9.1
Malnutrition Prevalence (Latest data available) 30.6 a/ 20 b/ 34 b/ 18 b/ 37 c/
Adult Literacy Rate, 2000 95.3 87.5 86.9 95.5 93.4
Life Expectancy at Birth, 2000 69.3 72.5 66.2 70.2 68.2
Infant Mortality Rate, 1999 31 8 38 26 31
Elementary Participation Rate, 1998 96.4 d/ 98.3 . 76.9 61
Annual Population Growth Rate, 1995-2000 2.36 2.47 1.47 1 1.6
Notes: a/ 2001 b/ 1995 c/ 1999 d/ 2000 Sources: Food and Nutrition Research Institute, DOST The World Bank Group, Health, Nutrition and Population (HNP) Statistics UNESCAP Statistics Literacy Facts and Figures in Asia and the Pacific, Asia/Pacific Cultural Centre for UNESCO (ACCU) Human Development Report 2002 UN Statistics Division Department of Education, Philippines
The Philippines, like the other countries, have experienced improvements in human development as measured by the human development index (HDI) developed by the UNDP. HDI is a composite index that puts together the following four indicators: life expectancy at birth; functional literacy and the combined elementary and high school enrollment ratio; and real income per capita.

24
Table 25 shows that the 5 countries experienced improvements in the quality
of life. Malaysia has the highest HDI, followed by Thailand. The Philippines used to be number 1 in 1980 but the country has slipped to number 3. For the period 1985-2000, the largest increase (difference between end year HDI and beginning year HDI) was experienced by Vietnam, closely followed by Indonesia. The smallest increase was obtained by the Philippines. If trends continue, we might be overtaken by countries like Vietnam. Summary of Performance
The different indicators show that the country has been generally successful in improving the quality of life of its population. There have been improvements in the different dimensions, some large and some modest. However, regional disparities are still large and for some indicators have even widened. Moreover, the population seems to be vulnerable to shocks and recent shocks have reversed some of the positive trends. The slow pace of improvement has not kept pace with the high population growth and this has led to an increase in the magnitude of the poor.
Furthermore, the Philippines has been overtaken by some of its neighboring countries. The pace of improvement for some of the indicators has not been at par with the pace in other countries.
Table 25. Human Development Index Trends
Country/Year 1975 1980 1985 1990 1995 2000
Philippines 0.652 0.684 0.688 0.716 0.733 0.754 Malaysia 0.616 0.659 0.693 0.722 0.76 0.782 Thailand 0.604 0.645 0.676 0.713 0.749 0.762 Indonesia 0.469 0.53 0.582 0.623 0.664 0.684 Vietnam . . 0.583 0.605 0.649 0.688 Source: Human Development Indicators, HDR 2002
25
3. Decomposition of Poverty
The poverty trends highlighted in the previous section prompts one to look for a possible explanation for the modest performance in poverty reduction. Two tracks have been taken to reduce poverty – economic growth and redistributive programs. This section examines the relative contribution of economic growth versus redistribution to the observed changes in poverty incidence. It decomposes the changes in poverty incidence into growth and redistribution components. This allows us to determine how much of the changes in poverty reduction has been due to growth and how much is due to shifts in income distribution.
The finding in the previous section that the Philippines is vulnerable to shocks
leads us to an analysis of who are at risk of being poor at times of crisis. The section also examines the movements in and out of poverty using a panel data set for the years 1997, 1998 and 1999. This allows the decomposition of the poor into chronic and transient poor.
3.1 Decomposition of Poverty
This section presents the decomposition of changes in poverty incidence into growth and redistribution.
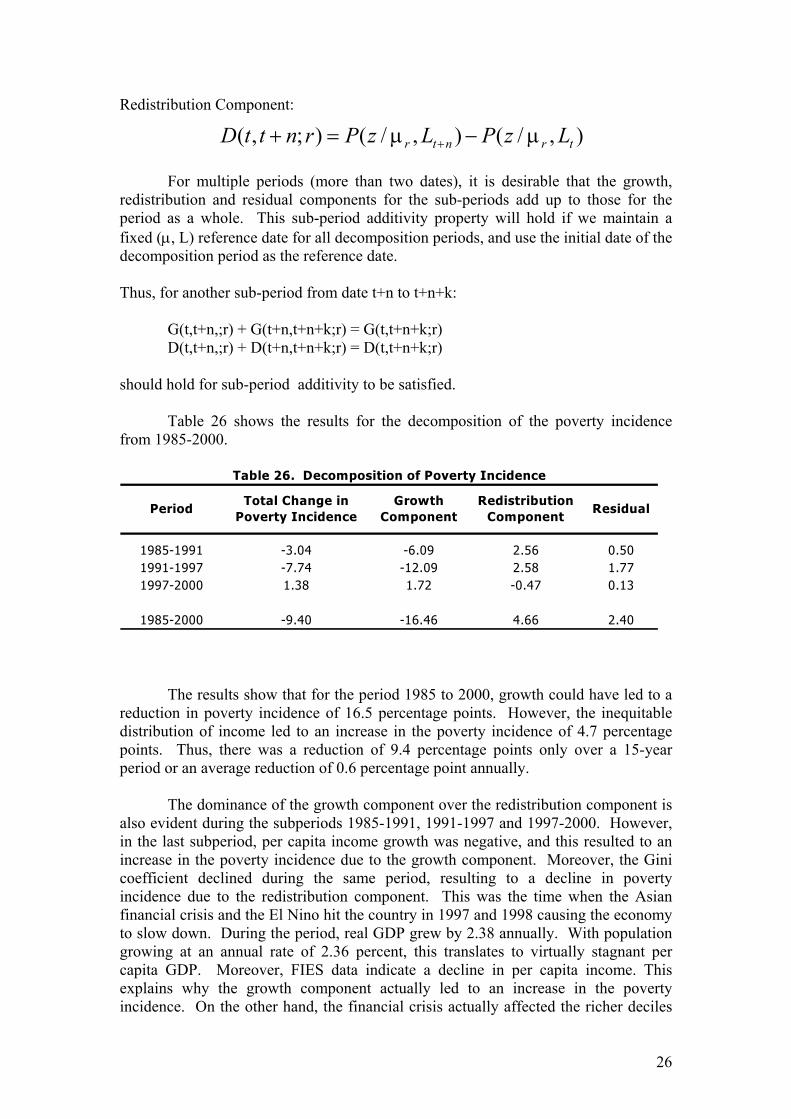
The poverty incidence Pt at date t is written as:
where z is the poverty line
µt is the mean income and Lt is a vector of parameters fully describing the Lorenz curve at date t.
The poverty incidence may change due to a change in the mean income µt or
due to a change in relative inequalities Lt. The growth component is defined as the change in the poverty incidence due
to a change in the mean while holding the Lorenz curve constant at the reference level Lr.
The redistribution component is the change in the poverty incidence due to a
change in the Lorenz curve while holding the mean income constant at the reference level µr.
A change in poverty over two dates, say t, and t+n can be decomposed as:
in which the growth and redistribution components are defined as: Growth Component:
);,();,();,( rnttRrnttDrnttGPP tnt +++++=−+
),,(),/();,( rtrnt LzPLzPrnttG µµ −=+ +
),/( ttt LzPP µ=
26
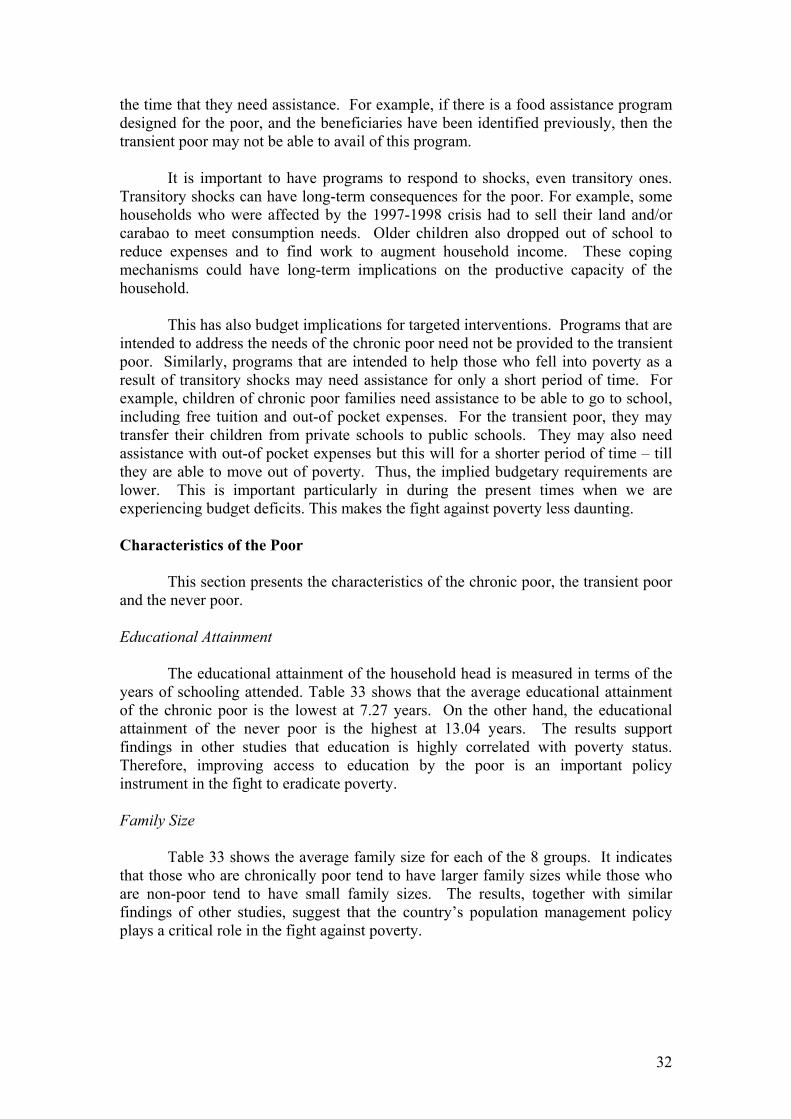
Redistribution Component:
For multiple periods (more than two dates), it is desirable that the growth, redistribution and residual components for the sub-periods add up to those for the period as a whole. This sub-period additivity property will hold if we maintain a fixed (µ, L) reference date for all decomposition periods, and use the initial date of the decomposition period as the reference date. Thus, for another sub-period from date t+n to t+n+k: G(t,t+n,;r) + G(t+n,t+n+k;r) = G(t,t+n+k;r) D(t,t+n,;r) + D(t+n,t+n+k;r) = D(t,t+n+k;r) should hold for sub-period additivity to be satisfied. Table 26 shows the results for the decomposition of the poverty incidence from 1985-2000.
The results show that for the period 1985 to 2000, growth could have led to a
reduction in poverty incidence of 16.5 percentage points. However, the inequitable distribution of income led to an increase in the poverty incidence of 4.7 percentage points. Thus, there was a reduction of 9.4 percentage points only over a 15-year period or an average reduction of 0.6 percentage point annually.
The dominance of the growth component over the redistribution component is
also evident during the subperiods 1985-1991, 1991-1997 and 1997-2000. However, in the last subperiod, per capita income growth was negative, and this resulted to an increase in the poverty incidence due to the growth component. Moreover, the Gini coefficient declined during the same period, resulting to a decline in poverty incidence due to the redistribution component. This was the time when the Asian financial crisis and the El Nino hit the country in 1997 and 1998 causing the economy to slow down. During the period, real GDP grew by 2.38 annually. With population growing at an annual rate of 2.36 percent, this translates to virtually stagnant per capita GDP. Moreover, FIES data indicate a decline in per capita income. This explains why the growth component actually led to an increase in the poverty incidence. On the other hand, the financial crisis actually affected the richer deciles
),/(),/();,( trntr LzPLzPrnttD µµ −=+ +
1985-1991 -3.04 -6.09 2.56 0.501991-1997 -7.74 -12.09 2.58 1.771997-2000 1.38 1.72 -0.47 0.13
1985-2000 -9.40 -16.46 4.66 2.40
Table 26. Decomposition of Poverty Incidence
ResidualPeriodTotal Change in
Poverty IncidenceGrowth
ComponentRedistribution
Component

27
more than the poorer groups. The 1998 APIS shows that while all income groups experienced declines in average income, the percentage declines were greater for the higher income groups. This resulted to a more equitable distribution of income.
Table 27. Growth of Real Per Capita Income & Change in Gini Concentration Ratios
Year Real Per Capita Income Growth Change in Gini
1985-1991 4.3327 0.0214 1991-1997 3.6737 0.0185 1997-2000 -0.5992 -0.0047
1985-2000 2.9418 0.0352
Source of basic data: National Statistical Coordination Board and National Statistics Office
Policy Implications
The results indicate that the observed poverty reduction was due mainly to economic growth and not to redistribution. Economic growth resulted to an increase in per capita income, thereby reducing the incidence of poverty. However, the inequitable distribution of income prevented the poor from benefiting fully from this growth. In fact, the results show that the unequal distribution actually contributed to an increase in poverty.
It is clear from the results that the rate at which poverty incidence could be
reduced is very much dependent on economic growth. Sustained high economic growth is what is needed to bring down poverty incidence. The results also suggest that the nature of economic growth is important in our fight against poverty. It is not enough for GNP to grow at a high rate, it is important that the poor benefit from this growth.
Another implication is that given the kind of growth that we have had and if
this pattern will not change, it is imperative that the country also has programs directed at the poor. Otherwise, it is possible that even if we experience growth, we would not make significant progress in our fight against poverty.
3.2 Chronic and Transient Poverty2
This section looks at the movements in and out of poverty to distinguish between chronic and transient poverty. This is the first time that we have panel households from the FIES that extends for more than one year. Consequently, this is the first time in the Philippines that a study on the movements in and out of poverty is conducted using a panel set of households from a nationwide survey of the National Statistics Office.
2 This section draws from the paper “Movements In and Out of Poverty” by Celia M. Reyes, MIMAP Philippines Research Paper, January 2002.

28
The recent experience of the Philippines has shown that it is possible to wipe out gains in poverty reduction with just one major crisis. This highlights the vulnerability not just of the poor but also of the non-poor to macroeconomic crises and natural calamities.
To assess how shocks such as the Asian financial crisis and abnormal weather
phenomenon affect the poverty situation in the Philippines, it is important to distinguish between chronic and transient poverty. A panel dataset of 17,897 households has been made available by the National Statistics Office from the 1997 Family Income and Expenditure Survey (FIES) and the 1998 and 1999 Annual Poverty Indicators Surveys (APIS).
Using this panel dataset, it was found that 31.4% of the families were poor in
1997. The official poverty thresholds in 1997 were then adjusted for inflation to generate estimates of poverty thresholds in 1998 and 1999. The National Statistical Coordination Board decided not to release official figures for poverty thresholds and incidence since the APIS is not exactly comparable to the FIES. The two major differences are the questionnaires used and the reference period. The FIES questionnaire is more detailed than the APIS questionnaire. The FIES collects data for the first and second semesters of the reference year in two survey rounds. The APIS collects data for the second and third quarters of the reference year in one survey round.
For this study, the income for the two quarters from APIS is doubled to come
up with the annual income. It would have been ideal to incorporate a seasonality adjustment factor but there is no information on the seasonality of family income by quarter or by month.
Table 28. Poverty Incidence of Families, 1997, 1998 and 1999 (Unweighted)
1997 1998 1999
Magnitude 5,612 7,251 7,287
Proportion (%) 31.4 40.5 40.7
Source of Basic Data: Run from the matched Public Use Files of the 1997 Family Income and Expenditures Survey, and the 1998 and 1999 Annual Poverty Indicators Survey
For purposes of this paper, chronic poor are defined as those who are poor in 1997, 1998 and 1999 (PPP). While three years may be too short to define them as chronically poor, data constraints do not permit an alternative definition. Similarly, transient poor are those who are non-poor in 1997 and poor in 1999 (NPN, NPN).

29
It would also be instructive to find out who recovers easily from a shock (NPN, non-poor in 1997, poor in 1998 and non-poor in 1999), and those who take longer, if ever, to recover from a shock (NPP or non-poor in 1997, poor in 1998 and 1999). Another group worth tracking are those who are able to take advantage of the situation (PNN or poor in 1997, non-poor in 1998 and 1999) and those who are able to protect themselves from shocks (NNN, or the non-poor in 1997, 1998 and 1999).
Table 29 shows the number and proportion of families belonging to the
abovementioned 8 categories, depending on their poverty status in each of the three years. Seemingly unaffected by shocks are 46.4% who have remained non-poor all throughout the three years. On the other hand, 21.7% have remained poor all throughout the period.
Table 29. Number and Percent of Families by Poverty Status (Unweighted)
Poverty Status 1997 1998 1999 Number of Families Percent
PPP Poor Poor Poor 3,881 21.7 PPN Poor Poor Nonpoor 665 3.7 PNP Poor Nonpoor Poor 578 3.2 PNN Poor Nonpoor Nonpoor 488 2.7 NPP Nonpoor Poor Poor 1,551 8.7 NPN Nonpoor Poor Nonpoor 1,154 6.4 NNP Nonpoor Nonpoor Poor 1,277 7.1 NNN Nonpoor Nonpoor Nonpoor 8,303 46.4
Total 17,897 100
Sources of Basic Data: Run from the matched Public Use Files of the 1997 Family Income and Expenditures Survey, and the 1998 and 1999 Annual Poverty Indicators Surveys.
Figure 15. Movements In and Out of Poverty

30
Table 30 shows the distribution of the poor and non-poor by region. In addition, the poor are disaggregated into chronic poor (PPP) and transient poor (those who belong to the NPP, NNP and PNP groups). Similarly, the non-poor are disaggregated into the never poor (NNN) and the previously poor (PPN, PNN and NPN).
Across regions, the chronic poor are concentrated in Southern Tagalog,
Northern Mindanao, Western Visayas, ARMM and the Bicol Region (Table 30). In terms of percentage to total number of sample households, the incidence of chronic poverty is highest in ARMM, Central Mindanao, Bicol and Northern Mindanao (Table 31).
Table 30. Number of Households by Poverty Status, 1999
Poor Households Non-poor Households
Region Chronic poor
Transient poor
Total Poor
Previously poor
Never poor
Total Non-poor
Total
Philippines 3881 3406 7287 2307 8302 10609 17896 Ilocos Region 207 180 387 141 361 502 889 Cagayan Valley 138 141 279 103 346 449 728 Central Luzon 148 354 502 244 1009 1253 1755 Southern Tagalog 482 466 948 311 1561 1872 2820 Bicol Region 335 206 541 113 314 427 968 Western Visayas 343 250 593 183 600 783 1376 Central Visayas 239 196 435 116 498 614 1049 Eastern Visayas 236 244 480 145 380 525 1005 Western Mindanao 176 181 357 109 285 394 751 Northern Mindanao 444 275 719 200 537 737 1456 Southern Mindanao 251 194 445 155 445 600 1045 Central Mindanao 275 158 433 76 233 309 742 NCR 60 223 283 158 1230 1388 1671 CAR 206 121 327 101 315 416 743 ARMM 341 217 558 152 188 340 898 Sources of Basic Data: Run from the matched Public Use Files of the 1997 Family Income and Expenditures
Survey, and the 1998 and 1999 Annual Poverty Indicators Surveys. Table 31 shows that of the 40.7 percent who are classified as poor in 1999, only 21.7 percent are chronic poor. The other half can be classified as transient poor, or those who were previously non-poor. On the other hand, of the 59.3 percent who are nonpoor in 1999, 12.9 percent were previously poor. A total of 31.9 percent or about a third of the sample have been moving in and out of poverty within this three-year period.

31
Table 31. Distribution of Households by Poverty Status, 1999
Poor Households Non-poor Households Region Chronic
poor Transient
poor Total Poor
Previously poor
Never poor
Total Non-poor
Total
Philippines 21.7 19.0 40.7 12.9 46.4 59.3 100 Ilocos Region 23.3 20.3 43.5 15.9 40.6 56.5 100 Cagayan Valley 18.9 19.4 38.3 14.2 47.5 61.7 100 Central Luzon 8.4 20.2 28.6 13.9 57.5 71.4 100 Southern Tagalog 17.1 16.5 33.6 11.0 55.4 66.4 100 Bicol Region 34.6 21.3 55.9 11.7 32.4 44.1 100 Western Visayas 24.9 18.2 43.1 13.3 43.6 56.9 100 Central Visayas 22.8 18.7 41.5 11.1 47.5 58.5 100 Eastern Visayas 23.5 24.3 47.8 14.4 37.8 52.2 100 Western Mindanao 23.4 24.1 47.5 14.5 38.0 52.5 100 Northern Mindanao 30.5 18.9 49.4 13.7 36.9 50.6 100 Southern Mindanao 24.0 18.6 42.6 14.8 42.6 57.4 100 Central Mindanao 37.1 21.3 58.4 10.2 31.4 41.6 100 NCR 3.6 13.4 16.9 9.5 73.6 83.1 100 CAR 27.8 16.3 44.0 13.6 42.4 56.0 100 ARMM 38.0 24.2 62.1 16.9 21.0 37.9 100 Sources of Basic Data: Run from the matched Public Use Files of the 1997 Family Income and Expenditures
Survey, and the 1998 and 1999 Annual Poverty Indicators Surveys.
Policy Implications
The results also suggest that we should not treat the poor as given by the official poverty incidence as a homogeneous group. Usually, we tend to regard the 40 percent who are poor as one group. The findings indicate that there are actually several distinct groups. The poor can be classified into: (1) chronic poor, and (2) transient poor. In turn the transient poor consists of: (a) NPP (vulnerable to shock and cannot recover), (b) NNP (not as vulnerable), and (c) PNP (able to take advantage of the shock but only temporarily). Similarly, the non-poor can be classified into: (3) never poor, and (4) previously poor. The latter consists of: (a) PNN (able to take advantage of the shock immediately), (b) PPN (able to take advantage of the shock), and (c) NPN (not that vulnerable and easily recovers from a shock).
The distinction between chronic and transient poverty has important policy
implications because some of the interventions needed by the chronic poor may be different from those needed by the transient poor. Different policies and programs are called for in addressing these two types of poverty. Longer-term investments in the poor, such as increasing their human and physical assets or returns to those assets are likely to be more appropriate for chronic poverty. On the other hand, insurance and income stabilization schemes which protect households against man-made or natural shocks would appear to more useful when responding to transient poverty.
Moreover, some programs are locked to certain criteria. Consequently, it is
possible that the transient poor may not be able to avail of some of these programs at
32
the time that they need assistance. For example, if there is a food assistance program designed for the poor, and the beneficiaries have been identified previously, then the transient poor may not be able to avail of this program.
It is important to have programs to respond to shocks, even transitory ones. Transitory shocks can have long-term consequences for the poor. For example, some households who were affected by the 1997-1998 crisis had to sell their land and/or carabao to meet consumption needs. Older children also dropped out of school to reduce expenses and to find work to augment household income. These coping mechanisms could have long-term implications on the productive capacity of the household.
This has also budget implications for targeted interventions. Programs that are intended to address the needs of the chronic poor need not be provided to the transient poor. Similarly, programs that are intended to help those who fell into poverty as a result of transitory shocks may need assistance for only a short period of time. For example, children of chronic poor families need assistance to be able to go to school, including free tuition and out-of pocket expenses. For the transient poor, they may transfer their children from private schools to public schools. They may also need assistance with out-of pocket expenses but this will for a shorter period of time – till they are able to move out of poverty. Thus, the implied budgetary requirements are lower. This is important particularly in during the present times when we are experiencing budget deficits. This makes the fight against poverty less daunting. Characteristics of the Poor
This section presents the characteristics of the chronic poor, the transient poor and the never poor. Educational Attainment The educational attainment of the household head is measured in terms of the years of schooling attended. Table 33 shows that the average educational attainment of the chronic poor is the lowest at 7.27 years. On the other hand, the educational attainment of the never poor is the highest at 13.04 years. The results support findings in other studies that education is highly correlated with poverty status. Therefore, improving access to education by the poor is an important policy instrument in the fight to eradicate poverty. Family Size
Table 33 shows the average family size for each of the 8 groups. It indicates that those who are chronically poor tend to have larger family sizes while those who are non-poor tend to have small family sizes. The results, together with similar findings of other studies, suggest that the country’s population management policy plays a critical role in the fight against poverty.
33
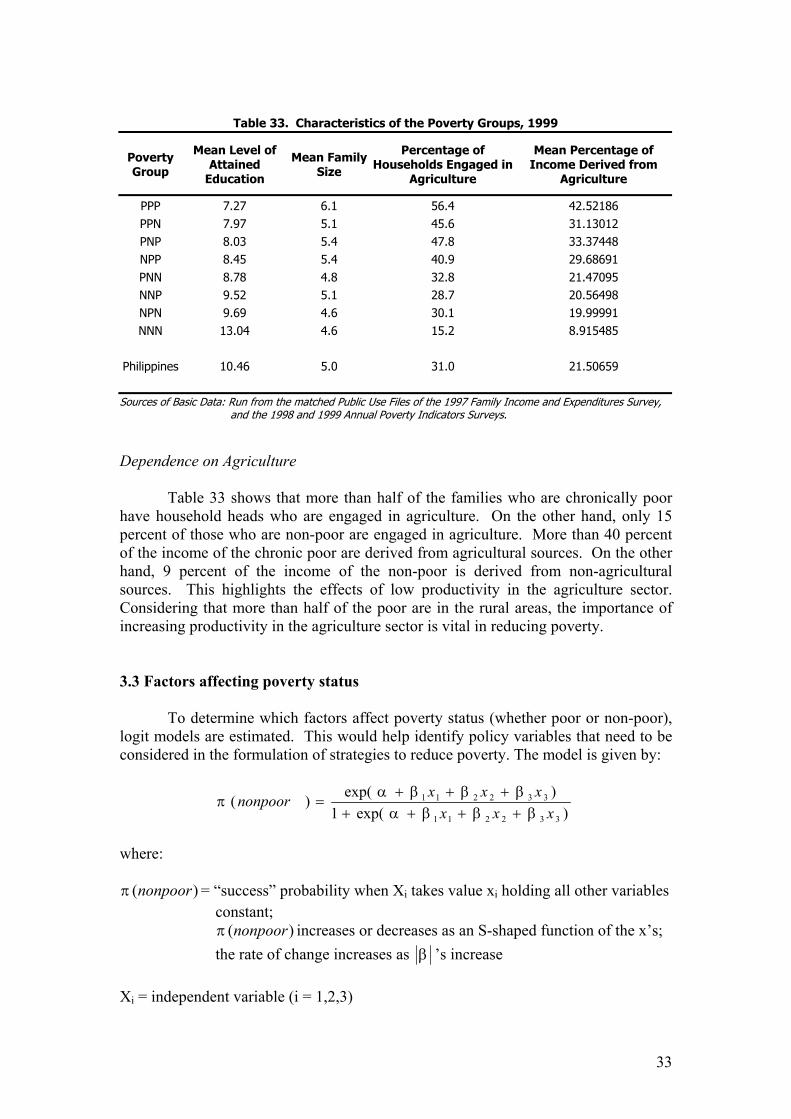
Table 33. Characteristics of the Poverty Groups, 1999
Poverty Group
Mean Level of Attained
Education
Mean Family Size
Percentage of Households Engaged in
Agriculture
Mean Percentage of Income Derived from
Agriculture
PPP 7.27 6.1 56.4 42.52186 PPN 7.97 5.1 45.6 31.13012 PNP 8.03 5.4 47.8 33.37448 NPP 8.45 5.4 40.9 29.68691 PNN 8.78 4.8 32.8 21.47095 NNP 9.52 5.1 28.7 20.56498 NPN 9.69 4.6 30.1 19.99991 NNN 13.04 4.6 15.2 8.915485
Philippines 10.46 5.0 31.0 21.50659
Sources of Basic Data: Run from the matched Public Use Files of the 1997 Family Income and Expenditures Survey, and the 1998 and 1999 Annual Poverty Indicators Surveys.
Dependence on Agriculture
Table 33 shows that more than half of the families who are chronically poor have household heads who are engaged in agriculture. On the other hand, only 15 percent of those who are non-poor are engaged in agriculture. More than 40 percent of the income of the chronic poor are derived from agricultural sources. On the other hand, 9 percent of the income of the non-poor is derived from non-agricultural sources. This highlights the effects of low productivity in the agriculture sector. Considering that more than half of the poor are in the rural areas, the importance of increasing productivity in the agriculture sector is vital in reducing poverty.
3.3 Factors affecting poverty status
To determine which factors affect poverty status (whether poor or non-poor), logit models are estimated. This would help identify policy variables that need to be considered in the formulation of strategies to reduce poverty. The model is given by:
)exp(1)exp()(332211
332211
xxxxxxnonpoor
βββαβββα
π++++
+++=
where:
)(nonpoorπ = “success” probability when Xi takes value xi holding all other variables constant;
)(nonpoorπ increases or decreases as an S-shaped function of the x’s; the rate of change increases as β ’s increase
Xi = independent variable (i = 1,2,3)

34
β = determines the rate of increase or decrease of the S-shaped curve sign of β = indicates whether the curve ascends or descends Six models were estimated for the different rounds of the Family Income and Expenditures Survey (FIES). Factors included in all models to determine the probability of being nonpoor are: highest educational attainment of the household head (HHEDUC), family size (FSIZE) and proportion of income derived from agriculture (AGGRP). The figures shown below are based on the FIES 2000 data. The same pattern is observed for the other FIES years, 1985, 1988, 1991, 1994, and 1997.
Figure 16 shows the probability of being non-poor for those households with income derived from non-agricultural sources. Seven lines are shown to represent the 7 levels of educational attainment. The graphs indicate that the probability of being non-poor increases with higher educational attainment. Moreover, the probability of being non-poor for the same educational attainment decreases with family size. Thus, for families whose household heads have the same level of educational attainment, larger-sized families tend to be poorer than smaller-sized families.
0
0.2
0.4
0.6
0.8
1
1.2
1 3.5 5 7.5 10 12.5 15 17.5 19.5
Family Size
P(no
npoo
r)
no grade completedelementary undergraduateelementary graduatehigh school undergraduatehigh school graduatecollege undergraduatecollege graduate or higher
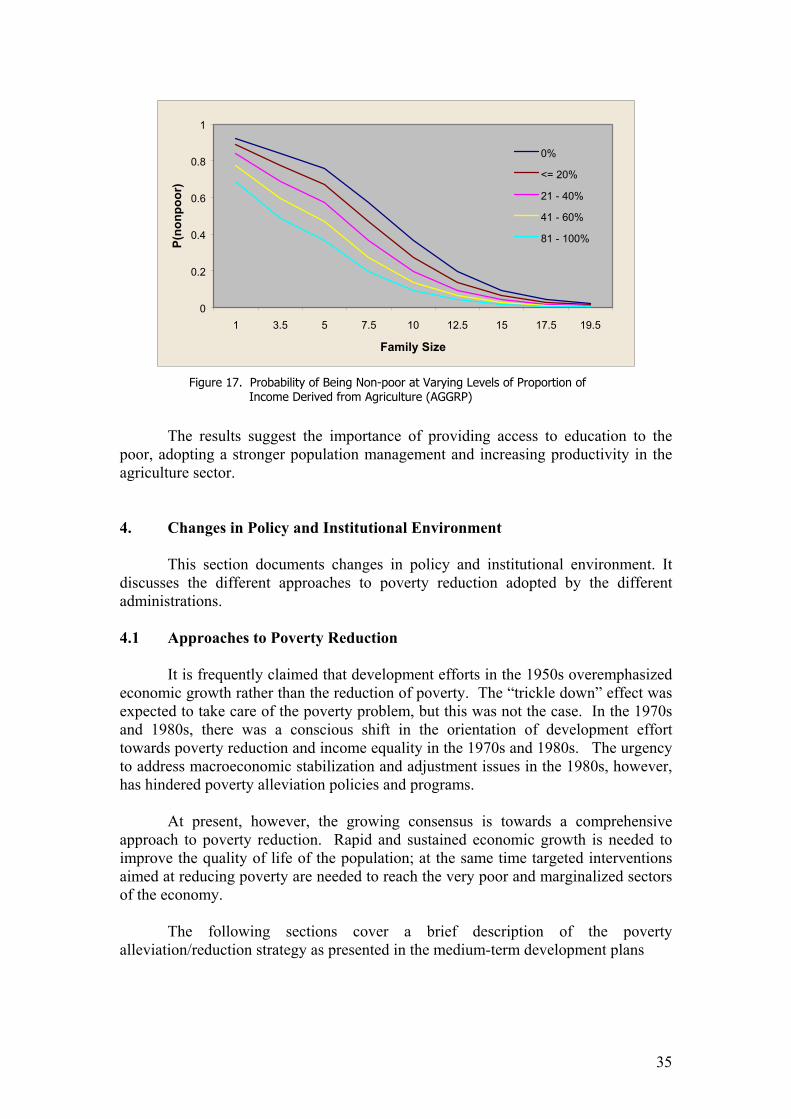
Figure 17 shows the probability of being non-poor for those families whose
heads have had some elementary schooling but have not graduated from elementary. Dependence on agriculture is represented by the share of income derived from agricultural sources to total income. Five lines are shown to represent the 5 groups of income shares from agriculture. The results indicate that probability of being non-poor decreases as the share of agricultural income increases. Again, the probability of being non-poor decreases as family size increases.
Figure 16. Probability of Being Non-poor at Varying Levels of Highest Level of Education Attained by the Household Head (HHEDUC)
35
0
0.2
0.4
0.6
0.8
1
1 3.5 5 7.5 10 12.5 15 17.5 19.5
Family Size
P(no
npoo
r)
0%
<= 20%
21 - 40%
41 - 60%
81 - 100%
The results suggest the importance of providing access to education to the poor, adopting a stronger population management and increasing productivity in the agriculture sector. 4. Changes in Policy and Institutional Environment
This section documents changes in policy and institutional environment. It discusses the different approaches to poverty reduction adopted by the different administrations. 4.1 Approaches to Poverty Reduction
It is frequently claimed that development efforts in the 1950s overemphasized economic growth rather than the reduction of poverty. The “trickle down” effect was expected to take care of the poverty problem, but this was not the case. In the 1970s and 1980s, there was a conscious shift in the orientation of development effort towards poverty reduction and income equality in the 1970s and 1980s. The urgency to address macroeconomic stabilization and adjustment issues in the 1980s, however, has hindered poverty alleviation policies and programs.
At present, however, the growing consensus is towards a comprehensive approach to poverty reduction. Rapid and sustained economic growth is needed to improve the quality of life of the population; at the same time targeted interventions aimed at reducing poverty are needed to reach the very poor and marginalized sectors of the economy. The following sections cover a brief description of the poverty alleviation/reduction strategy as presented in the medium-term development plans
Figure 17. Probability of Being Non-poor at Varying Levels of Proportion of Income Derived from Agriculture (AGGRP)
36
4.2 Marcos Administration 4.2.1. Four-Year Development Plan 1971-1974
For this particular Plan, the Marcos administration’s priorities included maximum economic growth and stability, equitable distribution of income and wealth and to solve the problem of unemployment. This Plan however did not mention any major anti-poverty strategy. Discussion on poverty reduction and how the government would go about it was not mentioned in any part of the Plan. However, the Plan tackled areas that were important components of a poverty reduction strategy. It included sections on population and family planning, employment promotion, land reform, access to water, education, housing and health.
4.2.2. Four-Year Development Plan 1974-1977 The Marcos administration had set for this Plan the general development goal of improving the standards of living of the greater mass of the population. In addition to this, the government had also planned to promote employment, economic growth, equitable distribution of income, regional development, industrialization, social development and price and BOP stability. Like the previous plan, this development plan did not mention any specific target for poverty reduction. However, to be able to achieve the goal of social development and equitable distribution of income, the government called for the intensification of social welfare and community development programs. The government wanted to ensure that these programs were directed to wards enabling the not-so-fortunate people to become active and useful members of the society. Other important programs mentioned in this plan included the integrated regional projects, land reform program, development of cooperatives, food production program, infrastructure development, family planning program, housing, tourism development, health programs, rural electrification, and education and manpower development.
4.2.3. Philippine Development Plan 1978-1982
The Marcos regime’s main focus was towards achievement of a better quality of life and to achieve this, the main focus of the administration was the promotion of social development and social justice. Thus, the government’s planned activities were into creation of jobs, reduction of income disparities, and improvement of the living standards of the poor. The Philippine Development Plan however, did not mention an overall strategy for poverty reduction. However, to attain its priorities, the Marcos government aimed for sustained economic growth, self-sufficiency in food, self-reliance in energy, price stability, upliftment of less developed regions, environmental management and internal security. 4.2.4. Philippine Development Plan 1983-1987
The country’s major national goals were the attainment of sustained economic growth; equitable distribution of the fruits of development; and total human development. To sustain economic growth, the policies that were set include balanced growth among sectors and regions; self-sufficiency in food and development of natural resources; industrial restructuring and export development; greater self-
37
reliance in energy and infrastructure support; private sector orientation; supportive public sector role; resource mobilization and usage; tourism development; promotion and development of Science and Technology; and international economic cooperation. To equitably distribute the fruits of development, the government has adopted the following strategies: expanding opportunities for productive employment; regional and human settlements development; agrarian reform, agricultural and natural resources development; increased access to development facilities and resources; improved provision of social services. To achieve human development, the following policies and strategies were adopted: improvement of population and social services; education and manpower development; enhancing of health and nutrition services; and better housing. 4.3 Aquino Administration 4.3.1 Philippine Development Plan 1987-1992
The country’s development efforts were principally directed towards the achievement of the following goals: (a) poverty alleviation; (b) generation of more productive employment; (c) promotion of equity and social justice; and (d) achievement of sustainable economic growth. For the first time, the government has set a target for poverty reduction (see Table 33 for the targets) and activities for this objective formed part of the Plan.
To address the goals of poverty alleviation and equitable distribution of benefits, the Aquino administration had to implement an employment-oriented, rural-based development strategy. In the medium term, a rural-based strategy was necessary since about two-thirds of the population at that time lived in the rural areas and was largely dependent on agriculture for their employment. Thus, the direction of the country was towards attainment of agricultural development and employment generating industries. On the other hand, the short-term strategy was to stimulate recovery by inducing demand through increased incomes. For this purpose, the government launched the Community Employment and Development Program (CEDP) to generate an additional one million jobs during the 18-month period beginning July 1986. The program’s focus was on the rural areas and part of the planned activities was the construction of small-scale, labor-intensive infrastructure projects. 4.3.2. Philippine Development Plan Updates 1990-1992
The Plan’s main objective was the total development of the human being. For this, the government continued to address the same concerns of economic development; productivity and growth; equitable distribution of opportunities, income, wealth and the means of production; and poverty alleviation. The centerpiece of the development strategy was one that is an employment-oriented, rural-based and one that maximizes the complementarities between agriculture and industry.
The main strategy for alleviating poverty was the upliftment of the rural poor. To attain rural development and equity objectives, planned activities include provision of physical infrastructure, enhancement of social services delivery, agrarian

38
reform and decentralization. The areas of policy emphasis were the following: economic stabilization, countryside agro-industrial development, market liberalization, human resource development, institutional reforms and decentralization. 4.4. Ramos Administration: Medium-Term Philippine Development Plan 1993-1998
All economic development efforts were geared towards human development and improvement of the quality of life. The main strategies for these were people empowerment, acceleration of global competitiveness, and reinforcing the mutual relationship between the two. To be able to achieve sustained development, the policies to be implemented were: decentralization, reliance on non-government initiative and on democratic consultation, full cost recovery, social equity and macroeconomic stability.
The Ramos administration realized that there is urgency for industrialization and rapid growth in average incomes to alleviate poverty and attain human development. People empowerment was the key strategy. The idea was that the government should not anchor development on its own actions. Rather development should proceed primarily from the economic initiatives of communities, households, firms, cooperatives, nongovernmental organizations, as expressed in well-functioning markets. The policies under people empowerment included decentralization, deregulation, reliance on the private sector, the encouragement of cooperatives, and the removal of bureaucratic hindrances and penalties to small enterprises. International competitiveness was the other strategy for attaining human development. The Ramos Administration launched the Social Reform Agenda in 1994 as its integrated national action agenda on anti-poverty. An assessment of the SRA can be found in Reyes and Del Valle (1998). 4.5. Estrada Administration: Medium-Term Philippine Development Plan 1999-2004
The priorities of the Estrada administration include acceleration of rural development, delivery of basic social development services, strengthening competitiveness, sustained development of infrastructure, ensuring macroeconomic stability and reforming governance.
The Estrada administration has formulated policies that promotes community- and center-based gender sensitive social welfare interventions for the poor, vulnerable, and disadvantaged including children, youth, women persons with disabilities, indigenous peoples, informal sector workers, victims of disasters and human rights violations, older persons, dysfunctional families, and depressed communities using the Total Family Approach. Another policy was to enable LGUs to empower communities, especially in the 5th and 6th municipalities and urban poor communities through the comprehensive and integrated delivery of social services to address their minimum basic needs. The government has also focused on enabling

39
LGUs, NGOs, POs and cooperatives to deliver social welfare and community development services. Also, the government also focused on improving the implementation of laws, which promote the welfare, and protection of the poor and vulnerable groups. Aside from these, there was also the strengthening of the database for monitoring poverty. The Erap administration also concentrated on expanding the CIDSS to the 5th and 6th class municipalities and urban poor areas. Moreover, providing capability building for LGUs, NGOs, POs and cooperatives on the delivery of welfares services and complementing resources through partnership, augmentation, joint venture, etc. were also in the government’s medium-term plan.
The government adopted the Lingap Para sa Mahihirap as its main
centerpiece program for poverty reduction. 4.6 Arroyo Administration: Medium-Term Philippine Development Plan 2001-2004
The Arroyo government’s national priorities include macroeconomic stability with equitable growth based on free enterprise, agriculture and fisheries modernization with social equity, comprehensive human development and protecting the vulnerable, good governance and the rule of law.
One of the government’s main strategies for poverty reduction is convergence.
Under this, the activities to be undertaken include: (1) Develop and implement the government’s banner program for poverty reduction, the Kapit-Bisig Laban sa Kahirapan (or KALAHI), a comprehensive and integrated convergence strategy to improve delivery of services for the poorest municipalities and provinces in the country; (2) Assist LGUs in preparing local poverty action programs that will assess the poverty situation in their respective localities and identify services needed to alleviate poverty in their area; (3) Improve efficiency and effectiveness of the use of public funds in targeting the poorest groups in society by reviewing affirmative action programs for vulnerable groups; and (4)Develop mechanisms to involve the private sector actively in the provision of services and other assistance to the poverty areas. Another activities worth mentioning are assistance to vulnerable groups, micro finance, poverty statistics generation and cross-sectoral issues. To complement the regular antipoverty programs, the government is also committed to implement temporary but result-oriented measures that are meant to bring the poor and vulnerable back to the mainstream development process. These interventions come in the form of social assistance and welfare, social security, and social safety nets.
Social Security Activities to attain social security that the government plans to undertake include the following: (1) improve access of low-income informal sector workers to social security; (2) design/operationalize provident fund schemes for OFWs that will ensure their protection upon retirement, disability, loss of job, among others; (3) Activate and strengthen community participation in implementing a national health insurance program to reduce health and nutrition risks of the poor; (4) Adopt an integrated approach in the implementation of the National Health Insurance Program’s Indigent Program otherwise known as the “Medicare para sa Masa”; (5) Tap private sector and other sources to support the LGU counterpart for premium payment; and (6) Improve Phil Health systems and procedures.

40
Social safety nets To protect the country, especially the most disadvantaged
and vulnerable groups and from sudden crises, the government has to set up some social safety nets. The steps to be undertaken includes: (1) Develop the capacity to institutionalize an early warning indicator system aimed at detecting the onset of socioeconomic disruptions which will provide sound basis in designing and implementing social safety net programs; (2) Improve access of the poorest households to subsidized rice, especially in the rural areas and Mindanao; (3) Improve the efficiency of rice subsidy programs; (4) Improve the impact of targeted nutrition programs; (5) Encourage private sector to provide emergency cost of living allowance to workers in times of economic crisis; (6) Ensure accessibility to public employment facilitation and marketing services by displaced workers especially those in the informal sector; (7) Improve design, targeting and implementation of labor-based infrastructure programs to generate more employment; and (8) Strengthen the capacity of LGUs, NGOs and the community to improve preventive, emergency and rehabilitative assistance/services to cope with effects of disasters/calamities. 5. Some Issues in Poverty Reduction
This section focuses on some issues in poverty reduction. In particular, it focuses on three major areas: measurement of poverty, programs, and institutional arrangements. Issues related to The issues resulting from the changes in the measurement of poverty and the emerging demands for information are discussed in section 5.1.
5.1 Programs
The various development plans seem to have paid attention to the problem of
poverty, although in varying degrees. The inclusion of poverty reduction strategies and targets seem to be an indication of the government’s commitment. We have seen poverty reduction targets incorporated for the first time in the 1987-1992 development plan. Subsequent plans included poverty incidence targets. In the 1999-2004 MTPDP, regional targets were also included. However, the current plan for 2001-2004 does not include poverty reduction targets.
There was also an obvious shift in the terminology used. While earlier plans
talked of “alleviating” poverty, more recent pronouncements talk about “reducing” or “eradicating” poverty. Perhaps this reflects the new thrust of not just alleviating or “making it easier to endure” poverty but really reducing or “bringing down” and even eradicating or “removing absolutely” poverty.
Programs directed towards eradicating poverty tend to occupy a prominent
part, if not the centerpiece of an administration’s program. Consequently, programs tend to be identified with a specific administration and therefore, tend to coterminous with the administration that initiated it. This practice of discontinuing programs associated with previous administrations has been disadvantageous to the poor.
For instance, the Social Reform Agenda (SRA) was launched by the Ramos Administration. The SRA consisted of 10 flagship projects, namely: (1) agricultural

41
development, (2) fisheries and aquatic resources management, (3) ancestral domains, (4) socialized housing, (5) comprehensive and integrated delivery of social services, (6) worker’s welfare and protection, (7) livelihood, (8) credit, and (9) institution-building and effective participation in governance. This was dropped after the term of the Ramos Administration. Many of the reforms that were put in place were institutional changes and therefore would take some time before their impact would be felt (Reyes and del Valle, 2000).
42
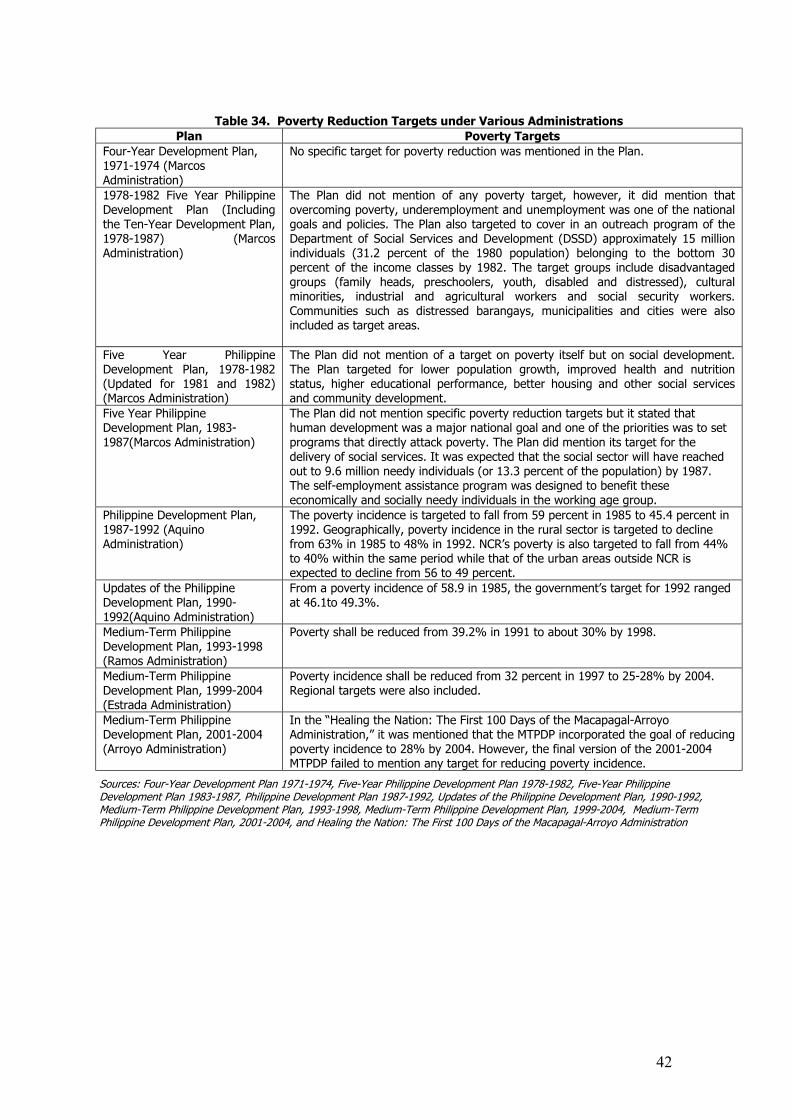
Table 34. Poverty Reduction Targets under Various Administrations
Plan Poverty Targets Four-Year Development Plan, 1971-1974 (Marcos Administration)
No specific target for poverty reduction was mentioned in the Plan.
1978-1982 Five Year Philippine Development Plan (Including the Ten-Year Development Plan, 1978-1987) (Marcos Administration)
The Plan did not mention of any poverty target, however, it did mention that overcoming poverty, underemployment and unemployment was one of the national goals and policies. The Plan also targeted to cover in an outreach program of the Department of Social Services and Development (DSSD) approximately 15 million individuals (31.2 percent of the 1980 population) belonging to the bottom 30 percent of the income classes by 1982. The target groups include disadvantaged groups (family heads, preschoolers, youth, disabled and distressed), cultural minorities, industrial and agricultural workers and social security workers. Communities such as distressed barangays, municipalities and cities were also included as target areas.
Five Year Philippine Development Plan, 1978-1982 (Updated for 1981 and 1982) (Marcos Administration)
The Plan did not mention of a target on poverty itself but on social development. The Plan targeted for lower population growth, improved health and nutrition status, higher educational performance, better housing and other social services and community development.
Five Year Philippine Development Plan, 1983-1987(Marcos Administration)
The Plan did not mention specific poverty reduction targets but it stated that human development was a major national goal and one of the priorities was to set programs that directly attack poverty. The Plan did mention its target for the delivery of social services. It was expected that the social sector will have reached out to 9.6 million needy individuals (or 13.3 percent of the population) by 1987. The self-employment assistance program was designed to benefit these economically and socially needy individuals in the working age group.
Philippine Development Plan, 1987-1992 (Aquino Administration)
The poverty incidence is targeted to fall from 59 percent in 1985 to 45.4 percent in 1992. Geographically, poverty incidence in the rural sector is targeted to decline from 63% in 1985 to 48% in 1992. NCR’s poverty is also targeted to fall from 44% to 40% within the same period while that of the urban areas outside NCR is expected to decline from 56 to 49 percent.
Updates of the Philippine Development Plan, 1990-1992(Aquino Administration)
From a poverty incidence of 58.9 in 1985, the government’s target for 1992 ranged at 46.1to 49.3%.
Medium-Term Philippine Development Plan, 1993-1998 (Ramos Administration)
Poverty shall be reduced from 39.2% in 1991 to about 30% by 1998.
Medium-Term Philippine Development Plan, 1999-2004 (Estrada Administration)
Poverty incidence shall be reduced from 32 percent in 1997 to 25-28% by 2004. Regional targets were also included.
Medium-Term Philippine Development Plan, 2001-2004 (Arroyo Administration)
In the “Healing the Nation: The First 100 Days of the Macapagal-Arroyo Administration,” it was mentioned that the MTPDP incorporated the goal of reducing poverty incidence to 28% by 2004. However, the final version of the 2001-2004 MTPDP failed to mention any target for reducing poverty incidence.
Sources: Four-Year Development Plan 1971-1974, Five-Year Philippine Development Plan 1978-1982, Five-Year Philippine Development Plan 1983-1987, Philippine Development Plan 1987-1992, Updates of the Philippine Development Plan, 1990-1992, Medium-Term Philippine Development Plan, 1993-1998, Medium-Term Philippine Development Plan, 1999-2004, Medium-Term Philippine Development Plan, 2001-2004, and Healing the Nation: The First 100 Days of the Macapagal-Arroyo Administration

43
Aside from the “SRA-enrolled” regular agency budgets, three special funds
totaling P6.1 billion were created to augment the regular resources to attain the objectives of the SRA. These are the 1996 Poverty Alleviation Fund (PAF-1), the 1996 Local Government Empowerment Fund (LGEF) and the 1997 Poverty Alleviation Fund (PAF-2) and the 1998 Poverty Alleviation Fund (PAF-3).
Table 35. Special Poverty Alleviation Funds
Name of Fund Amount (In Million Pesos)
Poverty Alleviation Fund – 1 (1996) 4,000
Local Government Empowerment Fund (1996) 1st Component 100 Poverty Alleviation Fund – 2 (1997) 2,000 Poverty Alleviation Fund – 3 (1998) 2,500 Lingap Para sa Mahirap Fund (2000) 2,500 KALAHI .
Source: GAA; MTPDP 2001-2004 and NAPC In 1998, the Estrada Administration launched the Lingap Para sa Mahihirap
(Caring for the Poor) Program. This program was granted a P2.5 billion allocation from the national budget to deliver medical assistance, livelihood, socialized housing, potable water supply, food subsidy and protective programs or services to the 100 poorest families in every city and province nationwide. Due to the absence of data at the household level, it took a long time to identify and validate the poorest families. The lists provided by the LGUs when subjected to validation showed the absence of uniform criteria across LGUs. Before the Lingap Para sa Mahihirap Program could be fully implemented, political events caused a change in administration.
The Lingap Program had several major weaknesses: (a) lack of program ownership by the LGUs which were not given adequate time to identify the 100 poorest families in their areas; (b) low targeting effectiveness and welfare impact which may be expected from a nationwide program that is spread over a wide area and to non-poor beneficiaries; (c) lack of beneficiary consultation and monitoring; and (d) politicized process of beneficiary selection.” (MTPDP 2001-2004)
In 2000, the Arroyo Administration launched its banner program for poverty reduction, the Kapit-Bisig Laban sa Kahirapan (KALAHI), a comprehensive and integrated convergence strategy to improve delivery of services for the poorest municipalities and provinces in the country. KALAHI has five strategies: (1) asset reform; (2) human development services; (3) employment and livelihood; (4) participation in governance of basic sectors; and (5) social protection and security against violence. KALAHI subscribes to the “convergence” approach earlier propagated in the Social Reform Agenda (SRA) while recognizing the need for “joint programming, implementation, and monitoring among national and local agencies, civil society sectors and people’s organizations in the poor communities.”

44
While a special fund has not yet been established for KALAHI, some amount has been set aside to pilot test the KALAHI approach in urban and rural barangays. In the KALAHI areas, a project is funded to address the most pressing need of the community. The short lifespan of the different poverty reduction programs has made it difficult to realize the full impact of these programs. Even before a program is fully implemented, it is scrapped and replaced with a new one, only to suffer the same fate, a few years hence. 5.2 Institutional Arrangements The lack of continuity in the programs may be partly due to institutional arrangements. Before the advent of the Social Reform Agenda, NEDA was the agency coordinating poverty alleviation efforts.
Figure 18. Institutions in Poverty Alleviation
1986 1992 1994 1998 2002
PCUP PCUP
NEDA NEDA
PCFP
PCCD NAPC SRC
NAPC
45
Even before its reorganization in 1987, NEDA is primarily responsible for formulating continuing, coordinated and fully integrated social and economic policies, plans and programs. The NEDA Board was composed of the following: The President as Chairman; Director-General of the NEDA Secretariat as Vice-Chairman; and the following as members: Executive Secretary , Secretary of Finance, Secretary of Trade and Industry, Secretary of Agriculture, Secretary of Environment and Natural Resources, Secretary of Public Works and Highways, Secretary of Budget and Management, Secretary of Labor and Employment, and Secretary of Local Government.
On April 10, 1986, a significant number of urban poor marched to Malacanang
asking for a moratorium on demolition. It was then that the Presidential Arm on Urban Poor Affairs was created. Subsequently, this was changed to Presidential Committee for the Urban Poor as a result of a National Consultation Workshop by two major urban poor alliances on May 30-June2, 1986. Later, the name Presidential Council for the Urban Poor was adopted in lieu of the Presidential Committee for the Urban Poor.
Then on December 8, 1986, Pres. Corazon Aquino created the Presidential
Commission for the Urban Poor (PCUP) through E.O. No. 82 to serve as direct link of the urban poor to the government in policy formulation and program implementation addressed to their needs. Its main functions are: (1) to coordinate the speedy implementation of government policies and programs for the urban poor; and (2) to set up a consultative mechanism which shall provide a forum of continuing dialogue between the government and the urban poor on the proper planning and evaluation of programs and project affecting them.
The Presidential Council for Countryside Development was established in
1992 by virtue of E.O. No. 6 to identify and address the socio-economic problems of regions, provinces and areas that have lagged behind terms of economic growth. The Council assists in identifying opportunities for growth and development, and motivates regions and provinces to concentrate on development efforts that would accelerate the growth process. The PCCD also assists in the development of infrastructures by mobilizing resources for this purpose.
In 1992, the Presidential Commission to Fight Poverty (PCFP) was created to administer all government activities on poverty alleviation to ensure pro-poor bias, focus on the poorest of the poor and critical services, and fast implementation of programs and projects. The PCFP’s functions were to:
1. Prepare a blue print of action that shall embody the Administration’s poverty
alleviation framework and translate this into short, medium and long-term targets which shall reflect the priority action areas of the government;
2. Monitor the implementation and impact of government poverty alleviation programs, projects and activities;
3. Coordinate and integrate government poverty alleviation efforts; 4. Review and evaluate the level of performance of concerned agencies and
activities; 5. Prod and facilitate the implementation of poverty alleviation activities;
46
6. Communicate to the public government’s poverty alleviation activities and its impact;
7. Provide the support and assistance needed by local government units to ensure that they deliver the basic services to their respective constituencies; and
8. Ensure that all government pro-poor programs build the capability of our people to be empowered and to be self-reliant.
In 1994, the Social Reform Council (SRC) was established to be the policy-
making body behind the Social Reform Agenda. The Social Reform Council (SRC), chaired by the President, oversees and coordinates parallel networks at the national, regional and local levels, with a basic sector counterpart structure matching each level of the bureaucracy. The Council is referred to as an “expanded Cabinet”, since 13 Sectoral Representatives sit in the SRC as counterparts to the Cabinet members designated as Flagship Champions. The Council is supported by a National Technical Working Group and the SRC Secretariat.
The National Anti-Poverty Commission (NAPC) was created under the Office of the President through Republic Act No. 8425 passed in to give support to the Social Reform and Poverty Alleviation Program of the Ramos Administration. It was created to serve as the coordinating and advisory body for the implementation of the Social Reform Agenda. Republic Act No. 8425 has abolished the Presidential Commission to Fight Poverty (PCFP), the Social Reform Council (SRC), and the Presidential Council for Countryside Development (PCCD). The NAPC took over the functions of the three abolished commissions and councils. It is not clear, however, why the PCUP was not included in this reorganization.
The NAPC is composed of the Chairperson (the President of the Republic);
Lead Convenor as the Head of the NAPC Secretariat (appointed by the President of the Republic); Vice-chairpersons, each for the government and basic sectors; and members which composed of the Heads of the involved departments (DAR, DA, DOLE, DBM, DSWD, DOH, DECS, DILG, DENR, DOF, NEDA, PCFC and PCUP), Presidents of the Leagues of Local Government Units and representatives from each of the basic sectors (farmers and landless rural workers, artisanal fisherfolk, urban poor, indigenous cultural communities, workers in the informal sector, women, youth and students, persons with disabilities, victims of disasters and calamities, senior citizens, NGOs, children and cooperatives. This was the first time that the participation of the basic sectors in national policymaking and coordination was institutionalized.
The NAPC’s primary functions are coordinate with different national and local
government agencies and private sector to assure full implementation of all social reform and poverty alleviation programs as well as with local government units in the formulation of social reform and poverty alleviation programs for their respective areas in conformity with the national Poverty Action Agenda; recommend policies and other measures to ensure the responsive implementation of the commitments under the SRA; ensure meaningful representation and active participation of the basic sectors; and oversee, monitor and recommend measures to ensure the effective formulation, implementation and evaluation of policies, programs and resource allocation and management of social reform and poverty alleviation programs.

47
It took more than year to constitute the NAPC because of the process of selecting representatives of basic sector representatives so that NAPC became operational in 1999. Unfortunately, while NAPC was “ created to serve as the coordinating and advisory body for the implementation of the Social Reform Agenda” the SRA has been dropped by the Estrada Administration and replaced by the Lingap Program.
With the change in administration in 2000, the NAPC also had changes in
personnel. Moreover, the first set of basic sector representatives ended their term in 2002 (they have 3 year terms) and a new set of representatives have been selected in May 2002. In addition, a new program was adopted. All these changes affected the pace at which NAPC could develop and implement programs aimed at reducing poverty.
At present, the NAPC coordinates the poverty reduction programs while
NEDA coordinates all economic and social policies and programs. PCUP continues to perform its mandate of coordinating policies and programs for the urban poor. The heads of NEDA and PCUP are members of the NAPC.
The challenge for these 3 agencies is to put in place a poverty reduction
program that will outlast any administration. We have seen programs that last only as long as the originators of the program. Some have managed to stay but partly because the agency responsible for that program has made the program politically relevant by changing the names of the Program. One example is the Kadiwa stores of the NFA. This has survived various administrations by changing its name to NFA rolling stores to ERAP (Enhanced Retail Access for the Poor) and then to GMA (Greater Market Access) stores.
One program that has managed to continue despite changes in administration
is the CIDSS program, mainly because it is a regular program of the Department of Social Welfare and Development. This will be continued in the present administration with some modifications and will be called KALAHI-CIDSS.
It has been recently recognized that LGUs could play a critical role in poverty
reduction. While policies and programs may be formulated at the national level, implementation of many of these programs depend on the machinery of the LGUs. With devolution resulting from the Local Government Code of 1991, LGUs are in a better position to prioritize the needs of the localities and identify the eligible program beneficiaries.
The importance of local level participation has been further strengthened with
the issuance of Memorandum Circular No. 2001-105 by the Department of Interior and Local Governments (DILG) on August 13, 2001 calling for the identification of Local Poverty Reduction Action (LPRAOs) in all municipalities, cities and provinces. The LPRAOs are tasked to oversee the poverty reduction efforts in their localities. In addition, DILG issued Memorandum Circular No. 2001-109 on August 21, 2001 to enjoin all Local Chief Executives to undertake local programs on poverty reduction and local economic transformation. It also reiterated the need to designate LPRAOs and to formulate Local Poverty Reduction Action Agenda. Furthermore, it provided for the inventory of poorest families, identification of local needs in the areas of food,

48
shelter, employment and education as well as external and internal sources of assistance to implement the action agenda.
Given that the Internal Revenue Allotment (IRA) received by LGUs represents
about 17 percent of the total budget, this represents a potentially large amount that can be used to address poverty at the local level. The challenge is to build capacity of LPRAOs to be able to carry out their tasks.
5.3 Changes in Poverty Measurement
The definition of poverty has undergone significant changes over time. The official measure is based on income. Thus, a person is considered poor if his income falls below the poverty threshold. The poverty threshold, determined by the National Statistical and Coordination Board, is the level of income necessary to meet basic food and non-food needs. The first official poverty threshold was released in 1986 for the year 1985 and paved the way for the estimation of the first official poverty incidence. Thereafter, poverty incidence data are generated every three years from the triennial FIES.
“Although national surveys of family income and expenditures were done by
official statistical agencies in the Philippines at least as early as 1957, for a long time their main use was for determining consumer basket weights to be used in monthly consumer price indexing. It was not until the mid-1970s that academic researchers began to construct poverty lines, and then apply them to the distributions of income or expenditures from the existing surveys in order to estimate, unofficially, the incidence of poverty (Abrera 1976). Consumption as a Welfare Measure
Some have advocated for the use of expenditure rather than income as the basis for computing the poverty measures. The use of consumption as a means to measure poverty can be seen way back in 1975 wherein the Social Indicators Project (SIP) by the Development Academy of the Philippines used both income and expenditure to estimate poverty incidence. The poverty incidence generated by the FIES expenditure data was lower than that of the income data. The expenditure data has generated 70% poverty incidence for 1991 while that of the income data was 78%. This was because the FIES figures indicated large degree of dissaving where income figures were grossly understated (Mangahas, 1979).
A paper by Balisacan in 1998 says that the use of current income as an indicator of well-being might yield misleading estimates as it may overestimate or underestimate current well-being. He says that even if the current income is correctly measured, if the person can borrow or use his savings, he is not constrained by current income. Current consumption is thus a better indicator of welfare level than current income because of the capability of a person to buffer their welfare from temporary sources of income such as borrowings, savings or community-based risk sharing. Current consumption, Balisacan says, is a good approximation of the so-called “life-cycle” or “permanent” income and thus a better measure of not only current welfare but also long-term average well-being compared to current income, even if consumption changes over time. Moreover, households may also understate their

49
income to avoid future problems with taxation and the possibility of being kidnapped since kidnap-for-ransom activities are rampant nowadays. Also, measurement errors tend to be greater for income than for consumption due to “shortcuts” on the survey instruments used by statistical agencies in estimating “net income.” (Balisacan and Fujisaki, 1998).
Minimum Basic Needs Approach
In the 1990s it has become obvious that income alone is not an adequate
measure of the welfare of the population In 1992, the Philippine Institute for Development Studies (PIDS) through one
of its projects, the Micro Impacts of Macroeconomic Adjustment Policies (MIMAP) Project funded by the International Development Research Center, released a study by Florentino and Pedro. In this paper, they identified 12 key indicators that could be used to monitor the basic needs of the population.
In 1993, PIDS was commissioned by the United Nations Consultative Group
on Policy to prepare a strategy paper for the Presidential Commission to Fight Poverty. In this paper, the authors identified 21 minimum basic needs indicators (survival, security and enabling) as measures of welfare. Subsequent consultations with government agencies and international donors have led to an increase in the number of indicators. The official set of indicators, now totaling 33, includes the original 21 indicators plus several input and program-specific indicators.
The PCFP spearheaded the conduct of the data gathering of the MBN
indicators and spent P100 million for this. The data was supposed to have been compiled by the PCFP and put online in the Poverty Watch. However, before this could be done, the PCFP was abolished and the project was discontinued. Fortunately, some LGUs continue to use the MBN instrument. Furthermore, the CIDSS program has adopted the MBN instrument. CIDSS areas collect data on the MBN indicators either once or twice a year. The results, however, have been used mainly by CIDSS program implementers. Data have not been compiled across barangays and municipalities and have not been mainstreamed into development planning.
The experience after more than 5 years of using the 33 MBN indicators is that
they are just too many and some of the indicators are not that useful. In response, an inter-agency committee is reviewing the indicators. The author has proposed a core set of 12 indicators that could be adopted by LGUs to diagnose poverty at the local level. These indicators is basically a subset of the 18 indicators that have proposed by MIMAP for the Community-based monitoring system (Reyes and Alba, 1994).
The level of disaggregation of poverty data is no longer adequate in the
context of devolution. The Philippine Statistical System, led by NSCB, is trying to respond by developing provincial poverty thresholds to facilitate the generation of provincial poverty estimates from the FIES. The inter-agency Technical Working Group is still validating the methodology and estimates.
50
Nevertheless, the FIES cannot provide data for municipalities and barangays. The author has proposed for the institutionalization of a community-based monitoring system to respond to this need. The data will be used by barangays, municipalities and provinces in the preparation of their annual plans. The data will also be used to identify unmet needs of the community, to track performance over time and to monitor the impact of projects. In addition, the data when compiled by a national agency like DILG or NAPC could be used by national agencies in identifying eligible province, municipal, barangay or household beneficiaries for national projects. This is the kind of monitoring system that would have facilitated the implementation of the Lingap program.
While the statistical community has been busy developing and measuring the
different dimensions of poverty using the above-mentioned MBN indicators, the Social Weather Stations headed by Dr. Mahar Mangahas have been collecting data on self-rated poverty.
Self-Rated Poverty
The self-rating approach to poverty (SRP) measurement was designed in 1974 in the Social Indicators Project (SIP), which Mangahas directed at the Development Academy of the Philippines. In the SRP system, poverty is defined as whatever the people themselves associate with the word “mahirap.” When first used at the national level in April 1983, SRP was 55 percent. In the March 2002 Social Weather Survey, 58% of households in the Philippines consider themselves mahirap or poor, and that 11.1% of them experienced involuntary hunger at least once in the previous three months. The SWS surveys involve asking household heads to point to where they belong on a card with the words MAHIRAP or POOR on one side, DI-MAHIRAP or NOT POOR on the opposite side, and a line in-between. SRP has been regularly obtained in the Social Weather Surveys, every semester starting in 1986, and every quarter since 1992.
Figure 19 shows the self-rated poverty incidence with the official poverty
incidence. It is apparent that the proportion of families who perceived themselves to be poor is much higher than the proportion estimated by the NSCB based on the official poverty threshold. There seems to be a slight trend decline in self-rated poverty but the decline is much less than the official measure. Also, self rated poverty does not always move in conjunction with the official measure.
The SWS surveys also looked at chronic and seasonal poverty. The ordinary
poverty self-rating refers to the moment when the respondent is answering the survey question. The aspect of chronic poverty can be brought out by asking the self-rated poor for how many of the last five years they felt this way. The aspect of seasonal poverty can be brought out by asking the self-rated poor for how many of the past 12 months they felt this way. In April 1997, the last time this was surveyed by SWS, four out of five poor Philippine households were found to be chronically poor, as well as non-seasonally poor.

51
5.4 Targeting Schemes of Poverty Reduction Programs and Social Safety Nets Given the magnitude of the poverty situation, significant resources are needed to address the problem. Under the present scenario of budget deficit, it becomes imperative to use targeted programs to assist the poor. Yet available data shows that some of our programs are not well-targeted.
Table 36 shows that for scholarships and housing programs, the poorer quintiles of the families are able to benefit less than the richer quintiles. In the case of scholarship at the tertiary level, only 7.8 percent of the beneficiaries belong to the poorest quintile, while the 36.9 percent belong to the richest quintile. The regressive nature of the subsidies is also evident in the case of the housing financing program. Only 8.9 percent of the beneficiaries belong to the poorest quintile, while 44.9 percent belong to the richest quintile.
Table 36. Access to Selected Programs by Quintile: 1998
Quintile Programs 1 2 3 4 5
TOTAL
Tertiary scholarship 26,335 43,365 63,860 80,809 125,234 339,604 Program 7.8 12.8 18.8 23.8 36.9 100.0 Housing and financing 55,071 69,678 79,071 138,932 278,955 621,707 Program 8.9 11.2 12.7 22.3 44.9 100.0
Source: 1998 Annual Poverty Indicator Survey (APIS)
Figure 19. Self-Rated Poverty Incidence and Official Poverty Incidence Sources: Development Academy of the Philippines (1983); Bishops-Businessmen's Conference (1985); NSCB Official
0
10
20
30
40
50
60
70
80
1983 1985 1988 1991 1994 1997 2000
Period
Prop
ortio
n of
poo
r fam
ilies
(%)
Self-rated poverty incidence Official Poverty Incidence

52
In 1999, the same pattern is evident. Richer quintiles are able to benefit more from the government programs on housing and education. Only 2 percent of the beneficiaries of the tertiary scholarship program belong to the poorest quintile while more than 40 percent of the beneficiaries are in the richest quintile. For government scholarships, a smaller percentage can be found among the poorest quintile compare to private scholarships.
When it comes to housing subsidies, the rich tend to benefit more than the
poor. Only 7.5 percent of the poorest quintile able to able of the housing program while 48 percent of the richest quintile are able to access the program.
Table 37. Access to Selected Programs by Quintile: 1999 Quintile
Programs 1 2 3 4 5
TOTAL
Tertiary scholarship 5,281 23,901 47,229 74,701 108,592 259,704 Program 2.0 9.2 18.2 28.8 41.8 100.0 Government 1,820 14,355 24,370 35,777 50,760 127,082 1.4 11.3 19.2 28.2 39.9 100.0 Private 3,462 9,546 22,859 38,923 57,832 132,623 2.6 7.2 17.2 29.3 43.6 100.0 Housing and financing 45,438 68,352 80,771 118,352 289,580 602,493 Program 7.5 11.3 13.4 19.6 48.1 100.0
Source: 1999 Annual Poverty Indicator Survey (APIS)
The problem of targeting is one of the major challenges faced by government agencies tasked with reducing poverty, more particularly the National Anti-Poverty Commission. Often, it is the precision (or imprecision) of targeting that determines the success (or failure) of any poverty reduction program. Leakages are brought about by the high costs of information necessary to distinguish the poor from the non-poor. The government’s Social Reform Agenda used geographical targeting in allocating funds to finance poverty alleviation programs. Unfortunately, this type of targeting which has the virtue of simplicity is susceptible to the problem of exclusion as well as leakages. A case in point is the 20 priority provinces that the government initially identified for the implementation of the SRA. Only 11 percent of the poor were in these areas.
The government then moved to focusing on 5th and 6th class municipalities,
where the class of the municipality depends not on the income of its residents, but on the income of the municipality. The latter is derived from the real estate tax and other revenues collected by the municipality.
For the Lingap Program, the targets for assistance were poor families in each
of the 78 provinces and 83 cities. The process of identifying the 100 poorest families in each locality was dropped before it was even completed.
53
The current government has modified this scheme by considering other factors
in choosing priority areas. For its KALAHI program, the government seeks to identify pilot municipalities and barangays. The criteria for identifying priority areas include the following:
• High poverty incidence • Communities experiencing or recovering from the crisis or armed
conflict • Presence of asset reform problem or large gap in asset reform program • Presence of vulnerable poor sectors • Areas not included in major financial assistance projects
Since the official poverty statistics coming from the National Statistics Office
are available only at the provincial level and not at the municipal and barangay levels, the NAPC has to rely on local government units to provide the necessary information. The importance of having a poverty monitoring system at the barangay level cannot be overemphasized to be able to carry out this program. Only with a CBMS can it be ensured that targeted programs can be carried out. Local level statistics are necessary national agencies for identifying priority areas and allocating resources while they are necessary for local government units and program implementers for identifying beneficiaries.
To address the issue of cost, the poverty monitoring system can be integrated
as part of the planning system of the LGU. Data collection and analysis can be done by the LGU in support of the preparation of their Annual Investment Plan. This has been given a boost with recent developments.
6. Summary and Recommendations The paper shows that the Philippines has achieved modest success in the area of poverty reduction and human development. Life expectancy has gone up, mortality rates have gone down, malnutrition prevalence has gone down and school participation rates have gone up. Poverty incidence has been reduced, but actual number of the poor has gone up due to the high growth in population. Moreover, spatial disparities remain large and some regions have lagged behind. The pace of improvement has also made it possible for other neighboring countries to overtake us based on the human development index. The recent Asian Financial crisis and the El Nino episode in 1997 and 1998 have highlighted the vulnerability of the Filipinos to shocks that are either man-made or natural. Some poverty trends have been reversed (poverty incidence went up in 2000). This suggests the need to put in place social safety nets to avert adverse long-term impacts on the population due to coping mechanisms adopted in response to the crisis. Economic growth was more dominant than the redistribution component in accounting for the decline in poverty incidence over the period 1985-2000. This highlights two things: (1) economic growth has not been high during the period and

54
that accounts for the modest decline in poverty incidence (0.6 percentage point annually; and (2) the nature of economic growth matters. A growth that benefits the poor and therefore has a large redistribution component can lead to a greater decline in poverty incidence than was observed.
While we have tended to regard the poor as one group, recent data has allowed us to distinguish between chronic and transient poor. Estimates done by the author suggest that only half of those who are classified as poor are chronically poor, while the other half are transient poor (meaning non-poor before but poor now). The distinction between chronic and transient poverty has important policy implications because some of the interventions needed by the chronic poor may be different from those needed by the transient poor. Different policies and programs are called for in addressing these two types of poverty. Longer-term investments in the poor, such as increasing their human and physical assets or returns to those assets are likely to be more appropriate for chronic poverty. On the other hand, insurance and income stabilization schemes which protect households against man-made or natural shocks would be likely to be more useful when responding to transient poverty. Several issues are identified in relation to 3 major areas: programs, institutional arrangements and poverty measurement and monitoring. Some recommendations are also listed. Programs
1. There is lack of continuity in the programs. Poverty reduction action plans tend to be coterminous with the administration that developed it. Programs are changed even before they are fully implemented. The challenge is for NAPC to put in place a poverty reduction program that will survive changes in administration.
2. Programs are not well-targeted. One reason is that designs of targeted programs are not implemented. For example, targeted programs are seldom carried out in accordance with the design because the data needed to operationalize the criteria identified for selecting the eligible beneficiaries are not available.
3. There is no monitoring and evaluation component built in with the programs.
Thus, some programs and projects continue to be implemented for a long time without assessing the effectiveness of the programs. The results of the M&E could be used to fine-tune the design of programs. On the other hand, some programs are dropped with knowing its impact on the poor. We should already have a menu of social safety nets so we could readily respond to shocks.
4. It is important to identify programs that will address chronic poverty and those
that will respond to transient poverty.
5. The slow decline in poverty incidence can be traced to the boom-bust cycle that the Philippine economy has experienced over the last 25 years. Sustained economic growth is what is needed to attain faster reduction in poverty.

55
6. Improving access of the poor to education is important. Schemes have to be
devised to keep the students who enroll. Well-designed and well-targeted scholarships for the poor are needed.
7. Despite the decline in poverty incidence, the magnitude of the poor continues
to increase. Larger families tend to be poorer. A stronger population management policy is an important component of a poverty reduction program.
8. The poor are largely dependent on agriculture. Increasing productivity in
agriculture is key to reducing poverty in the rural areas. Institutional Arrangements
1. There have been significant institutional reforms. It takes time to set up new
offices and to establish their relationships with other existing agencies. 2. Changes in personnel have also accompanied changes in administration. This,
together with the first item, could affect the pace at which the new agencies/personnel could carry out its mandate.
3. The experience of the Social Reform Agenda is that convergence is quite
difficult to operationalize. Asking the different government agencies to reorient its programs toward the national anti-poverty action agenda may be easier said than done.
4. With devolution, Local Government Units have assumed an important role in
the fight against poverty. There is a need to build the capacity of Local Poverty Reduction Action Officers (LPRAOs) to oversee poverty reduction efforts in the local levels. Training modules on poverty diagnosis, local level planning, project monitoring and impact assessment should be provided to officials of LGUs, particularly the LPRAOs.
Poverty Measurement and Monitoring 1. The available data from national surveys are not adequate to meet the
information needs of both national and local policymakers and program implementers. A community-based monitoring system has to be institutionalized. This will provide the LGUs, particularly the PLPRAOS, the needed tool to formulate, implement and monitor poverty reduction programs and projects. This will also provide national agencies like the NAPC the information base for choosing eligible barangays or households for programs like KALAHI.
2. This author demonstrated that it is possible to analyze chronic and transient
poverty using the panel data from the 1997 FIES and the 1998 and 1999 APIS. There should be efforts to continue the collection of panel data to allow continued analysis of chronic and transient poverty. The author advocates for the conduct of panel surveys to provide data on chronic and transient poverty.

56
It is unfortunate that the sample of the 2000 FIES did not include the panel set of households in the 1997 FIES, 1998 APIS and 1999 APIS. The NSO might want to consider including in the sample for the 2003 FIES the panel set of households.
3. APIS should be redesigned to make it more comparable to the FIES. This will
allow the estimation of poverty incidence during non-FIES years to maximize the use of APIS. While it is useful to monitor the access to safe water and sanitation facilities annually using the APIS, it is more important to monitor changes in income. Income responds readily to shocks. Thus, it is more likely to see fluctuations in income yearly. It is less likely that the family will lose its access to safe water this year since it experienced a shock the same year.
4. Provincial poverty thresholds will provide better estimates of provincial
poverty incidence. At present, researchers use regional poverty thresholds to generate provincial data. An inter-agency committee led by the National Statistical Coordination Board has been working on this and it would be useful if the thresholds are released soon.

57
References Asian Development Bank Website. “Reducing Poverty: Major Findings and
Implications.” ADB Publication. September 1999. Asian Development Bank Website. Glossary of Poverty Statistics. Available at:
(http://www.adb.org/Statistics/Poverty/P.asp#poverty). Balisacan, A.M. 2001. “Poverty Comparison in the Philippines: Is What We Know
About the Poor Robust?” Asia and Pacific Forum on Poverty: Reforming Policies and Institutions for Poverty Reduction. Asian Development Bank.
Balisacan, A.M. and S. Fujisaki, ed.1998. “Growth, Poverty and Income Inequality in
the Philippines” Institute of Development Economics. Tokyo. Bautista, V.A. 2001. “A Critique of the KALAHI Program (A Paper Prepared for the
National Anti-Poverty Commission).” UP National College of Public Administration and Governance.
Department of Social Welfare and Development Official Website. Programs/Projects.
Available at: www.dswd.gov.ph. Five-Year Philippine Development Plan, 1978-1982 (Including the Ten-Year
Development Plan, 1978-1987). September 1977. Manila. Philippines. Four-Year Development Plan 1971-1974 Four-Year Development Plan 1974-1977 Healing the Nation: The First 100 Days of the Macapagal-Arroyo Administration.”
April 30, 2001. HUDCC Website. Available at: www.hudcc.gov.ph. Human Development Report Website. HDR Frequently Asked Questions. Available
at: http://hdr.undp.org/statistics/faq.cfm#1. Kapit-Bisig Laban sa Kahirapan (KALAHI) Primer.2001. National Anti-Poverty
Commission. Llanto, G.M. 1997. “Using Micro finance Institutions in Poverty Alleviation: A Case
of the Blind Leading the Blind?” PIDS Policy Notes No. 97-09. Philippine Institute for Development Studies.
Mangahas, M. (1999). “Monitoring Philippine Poverty By Operational Social
Indicators.” Social Weather Stations Website. Available at http://www.sws.org.ph/prem.htm.

58
Mangahas, M. “ The Latest Trend in Poverty. Social Climate. August 2, 1999. Social Weather Stations Website. Available at http://www.sws.org.ph.
Mangahas, M. 1979. On How To Measure Poverty. UPSE Discussion Paper 79-05. University of the Philippines School of Economics. University of the Philippines Diliman.
Medium-Term Philippine Development Plan 1993-1998. Medium-Term Philippine Development Plan 1999-2004. Medium-Term Philippine Development Plan 2001-2004. Milo, M. "Social Safety Net Programs in the Philippines." In Lamberte, M.B. ed.
2001. Economics Crisis Once More, PIDS Publication. National Statistics and Coordinating Board (NSCB) Website. NSCB Technical Notes:
Human Development Index. Available at: http://www.nscb.gov.ph/technotes/hdi_tech_human.htm
Orbeta, A. and M. Sanchez (1996). “Micro Interventions for Poverty Alleviation: The
Philippine Case,” PIDS Discussion Paper Series No. 96-13.
Orbeta, A. C. 1996. “Structural Adjustment and Poverty Alleviation in the Philippine.” PIDS Discussion Paper Series No. 96-04.
Pascual, C. 1987. Measuring the Intensity of Poverty in Metro Manila 1980-1985.
Undergraduate Thesis, University of the Philippines Diliman. Philippine Development Plan, 1987-1992. Pineda, V. "Impact of the East Asian Financial Crisis on Social Services Financing
and Delivery." In Lamberte, M.B. ed. 2001. Economic Crisis Once More. PIDS. Makati City.
Poverty Report 2000. “Overcoming Human Poverty.” United Nations Development
Programme. Reyes, C. and E. del Valle, 1999. Poverty Alleviation and Equity Promotion, PIDS
Discussion Paper Series 1996-08. Rola D. A. ed.1981. Integrated Rural Development: Problems and Issues,
Management Education Council, University of the Philippines. Social Reform and Poverty Alleviation Act (Republic Act No. 8425), 1997. Social Weather Stations Website. Survey Indicators, Available at: www.sws.org.ph. Socioeconomic Report 2001. National Economic and Development Authority.
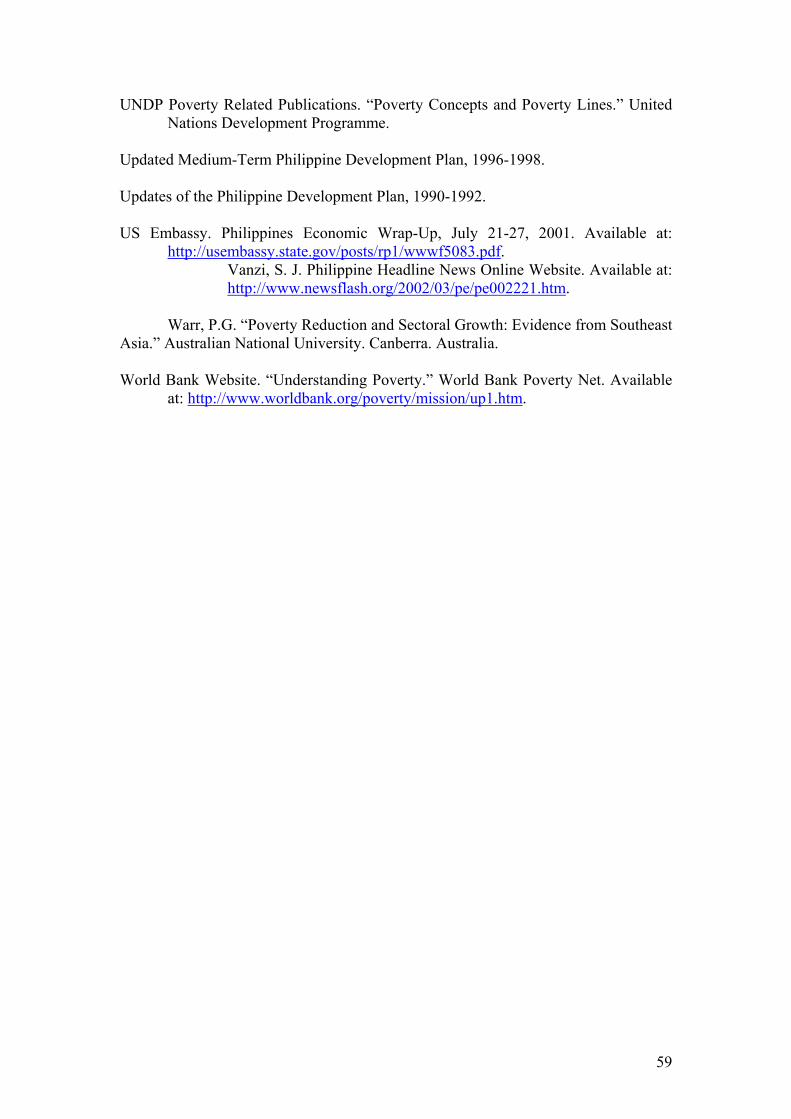
59
UNDP Poverty Related Publications. “Poverty Concepts and Poverty Lines.” United Nations Development Programme.
Updated Medium-Term Philippine Development Plan, 1996-1998. Updates of the Philippine Development Plan, 1990-1992. US Embassy. Philippines Economic Wrap-Up, July 21-27, 2001. Available at:
http://usembassy.state.gov/posts/rp1/wwwf5083.pdf. Vanzi, S. J. Philippine Headline News Online Website. Available at: http://www.newsflash.org/2002/03/pe/pe002221.htm.
Warr, P.G. “Poverty Reduction and Sectoral Growth: Evidence from Southeast Asia.” Australian National University. Canberra. Australia.
World Bank Website. “Understanding Poverty.” World Bank Poverty Net. Available
at: http://www.worldbank.org/poverty/mission/up1.htm.

60
Table A.1.1 Poverty Incidence, by Province, 1994-2000
PROVINCE 1994 1997 1998 2000
ABRA 76.0 66.5 69.1 52.4 AGUSAN DEL NORTE 49.8 49.8 60.7 46.6 AGUSAN DEL SUR 62.2 54.5 63.7 56.2 AKLAN 39.7 35.7 44.1 38.0 ALBAY 44.5 47.2 52.5 43.1 ANTIQUE 58.3 48.2 53.2 42.3 APAYAO 56.9 43.3 50.1 46.4 AURORA 49.1 37.6 43.9 42.1 BASILAN 37.6 23.8 48.6 47.3 BATAAN 31.6 11.6 27.9 18.3 BATANES 8.7 7.2 9.7 5.0 BATANGAS 22.3 19.2 23.2 18.8 BENGUET 26.1 23.6 30.2 16.9 BILIRAN - 35.7 39.7 38.8 BOHOL 45.4 48.8 59.2 55.6 BUKIDNON 56.8 49.7 59.4 46.8 BULACAN 13.3 9.0 19.1 9.8 CAGAYAN 42.4 32.9 41.1 28.3 CALOOCAN CITY 12.8 9.1 15.2 15.6 CAMARINES NORTE 48.6 49.1 53.7 58.1 CAMARINES SUR 51.0 47.5 52.5 50.0 CAMIGUIN 63.2 40.5 51.5 54.2 CAPIZ 55.9 38.3 50.2 52.7 CATANDUANES 34.5 43.6 52.2 47.9 CAVITE 8.7 7.6 16.1 12.8 CEBU 26.1 26.8 34.6 32.1 COTABATO CITY 14.5 31.5 36.6 35.0 DAVAO DEL NORTE 44.0 42.8 51.3 45.1 DAVAO DEL SUR 34.3 26.9 39.1 30.2 DAVAO ORIENTAL 61.5 50.7 60.1 42.2 EASTERN SAMAR 27.5 58.5 56.4 53.2 GUIMARAS - 38.1 46.3 32.7 IFUGAO 81.4 61.0 67.7 67.1 ILOCOS NORTE 40.6 28.0 29.6 24.6 ILOCOS SUR 49.2 33.0 43.2 35.7 ILOILO 40.1 36.7 45.3 31.9 ISABELA 32.0 34.1 38.1 32.6 KALINGA 56.9 50.5 57.4 51.0 LA UNION 46.4 40.8 50.0 41.5 LAGUNA 18.0 15.1 21.2 15.0 LANAO DEL NORTE 60.4 48.7 58.9 51.5 LANAO DEL SUR 47.4 57.8 57.6 57.1
Source of Basic Data: Family Income and Expenditures Surveys, 1985 – 2000, NSO

61
Table A.1.2 Poverty Incidence, by Province, 1994-2000
PROVINCE 1994 1997 1998 2000 LAS PIÑAS CITY 9.4 9.8 11.2 2.1 LEYTE 37.4 34.5 44 41.3 MAGUINDANAO 65.7 57.1 66.2 67.8 MAKATI CITY 5.4 2.1 9.7 2.8 MALABON 9.4 5.9 16.8 17.6 MANDALUYONG CITY 9.4 5 12.9 4.9 MANILA CITY 7.1 7.9 14.7 8.2 MARAWI CITY 33.3 51.7 34.8 50.8 MARIKINA CITY 6.8 9.5 20.2 10.2 MARINDUQUE 53.1 49.1 61.3 54.6 MASBATE 81.3 64.9 74.7 70.1 MISAMIS OCCIDENTAL 45.9 51.5 58.2 55.9 MISAMIS ORIENTAL 37.5 36.1 44.3 33.4 MOUNTAIN PROVINCE 67.1 54.3 55.5 46.7 MUNTINLUPA CITY 9.4 7.1 14.6 12.4 NAVOTAS 9.4 13.5 23.9 26 NEGROS OCCIDENTAL 39.5 41.6 54.9 50.1 NEGROS ORIENTAL 37.5 39.8 52.1 42.2 NORTH COTABATO 58.6 56 63.8 49.6 NORTHERN SAMAR 47.7 52.2 53.3 49.4 NUEVA ECIJA 32.5 22.8 42 21.8 NUEVA VIZCAYA 21.2 21.9 30.3 19.6 OCCIDENTAL MINDORO 33.2 47.2 55.6 55.4 ORIENTAL MINDORO 42 36.1 45.8 42.2 PALAWAN 60.2 45.9 57.3 40.1 PAMPANGA 14.3 9.1 19 15 PANGASINAN 49.9 40.8 52.4 39.3 PARAÑAQUE CITY 5.7 4.9 11.3 5.4 PASAY CITY 7.1 5.3 14.1 4.6 PASIG CITY 5.8 4.8 13 4 PATEROS 9.4 4.8 9.9 10.5 QUEZON 43.6 40 46 41.1 QUEZON CITY 6.4 5.4 12.3 6.1 QUIRINO 59.9 36.9 51.1 37.5 RIZAL 14.4 9.8 19.4 10.2 ROMBLON 83.6 68.5 73 69.3 SAMAR 40.2 40.3 45 47.5 SAN JUAN 9.4 5.4 7 4.1 SARANGANI 0 49.8 66.4 54.5 SIQUIJOR 42.2 50.7 61.3 41.1 SORSOGON 59.8 45.6 55.6 49.9
Source of Basic Data: Family Income and Expenditures Surveys, 1985 – 2000, NSO
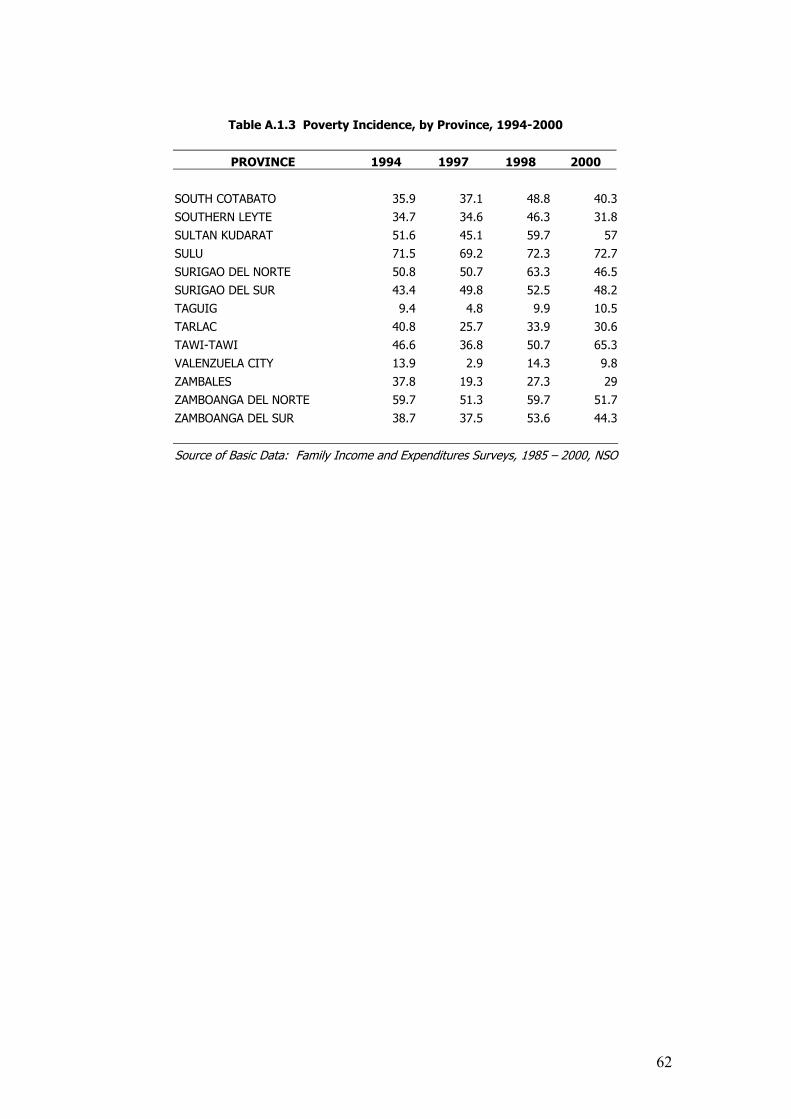
62
Table A.1.3 Poverty Incidence, by Province, 1994-2000
PROVINCE 1994 1997 1998 2000
SOUTH COTABATO 35.9 37.1 48.8 40.3 SOUTHERN LEYTE 34.7 34.6 46.3 31.8 SULTAN KUDARAT 51.6 45.1 59.7 57 SULU 71.5 69.2 72.3 72.7 SURIGAO DEL NORTE 50.8 50.7 63.3 46.5 SURIGAO DEL SUR 43.4 49.8 52.5 48.2 TAGUIG 9.4 4.8 9.9 10.5 TARLAC 40.8 25.7 33.9 30.6 TAWI-TAWI 46.6 36.8 50.7 65.3 VALENZUELA CITY 13.9 2.9 14.3 9.8 ZAMBALES 37.8 19.3 27.3 29 ZAMBOANGA DEL NORTE 59.7 51.3 59.7 51.7 ZAMBOANGA DEL SUR 38.7 37.5 53.6 44.3
Source of Basic Data: Family Income and Expenditures Surveys, 1985 – 2000, NSO
Programs Marcos (1965-1986) Aquino (1986-1992) Ramos (1992-1998) Estrada (1998-2001) Arroyo (2001 to present)
63
Appendix A. Key Poverty Reduction Programs of the Different Administrations
Main Programs The Kilusang Kabuhayan at Kaunlaran (KKK) Program was a national priority program which aimed to stimulate economic and social development especially among the least developed regions or provinces
The Integrated Area Development (IAD) project was a holistic approach to rural development launched in several areas in an effort to correct the fast-growing disparities among and within the different regions in the country; the objectives were to accelerate economic growth in depressed areas and increase participation and equitable distribution of its gains; and the agency involved in coordinating the activities of the IAD was the National Council on Integrated Area Development (NACIAD).
Integrated Area Development projects (IADP) The overall direction, coordination and supervision of implementation of existing IAD projects and similar projects were transferred from the NACIAD to the respective Regional Development Councils (RDCs) and LGUs concerned, in the case of IAD projects which covered only one province, the responsibility was vested in the concerned offices of the governor.
The Program to Refocus Orientation on the Poor (PRO-Poor by EO 170) was one of the major poverty alleviation programs of the Aquino administration. EO 170 was enacted in 1989 which

Programs Marcos (1965-1986) Aquino (1986-1992) Ramos (1992-1998) Estrada (1998-2001) Arroyo (2001 to present)
64
Appendix A. Key Poverty Reduction Programs of the Different Administrations
launched PRO-Poor Program aimed at accelerating the delivery of government services to about 450 low income municipalities (LIMs)
The Countryside Agro-Industrial Development Strategy (CAIDS) was a major development thrust of the Aquino government in the last three years of its term, it aimed to promote modernization and productivity of agriculture and of small- and medium-scale countryside industries, while at the same time providing for direct assistance to address the immediate and critical concerns of those belonging to the bottom 30 percent of families.
The Livelihood Enhancement Agricultural Development (LEAD) Program was one of the programs to improve agricultural/rural incomes in line with the overall goal of poverty alleviation; it aimed at helping farmers in setting up site-specific, agro-based projects.
The Livelihood Program was composed of usually
Comprehensive Employment Strategy
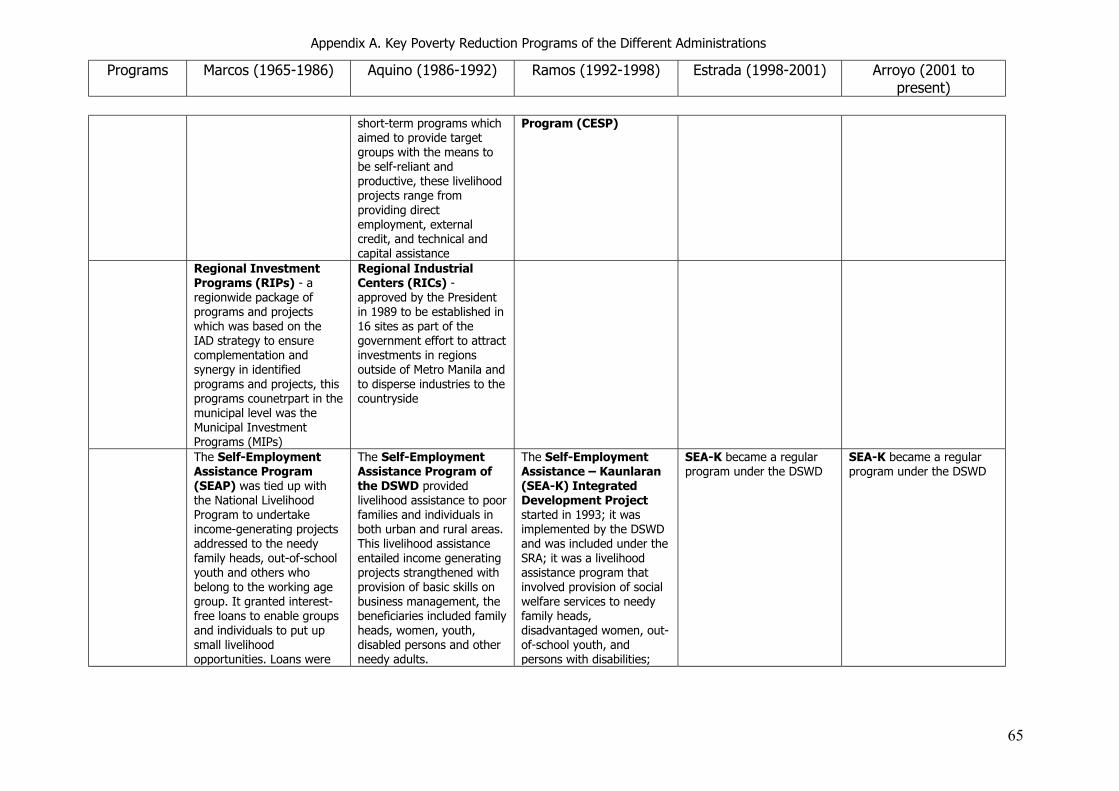
Programs Marcos (1965-1986) Aquino (1986-1992) Ramos (1992-1998) Estrada (1998-2001) Arroyo (2001 to present)
65
Appendix A. Key Poverty Reduction Programs of the Different Administrations
short-term programs which aimed to provide target groups with the means to be self-reliant and productive, these livelihood projects range from providing direct employment, external credit, and technical and capital assistance
Program (CESP)
Regional Investment Programs (RIPs) - a regionwide package of programs and projects which was based on the IAD strategy to ensure complementation and synergy in identified programs and projects, this programs counetrpart in the municipal level was the Municipal Investment Programs (MIPs)
Regional Industrial Centers (RICs) - approved by the President in 1989 to be established in 16 sites as part of the government effort to attract investments in regions outside of Metro Manila and to disperse industries to the countryside
The Self-Employment Assistance Program (SEAP) was tied up with the National Livelihood Program to undertake income-generating projects addressed to the needy family heads, out-of-school youth and others who belong to the working age group. It granted interest-free loans to enable groups and individuals to put up small livelihood opportunities. Loans were
The Self-Employment Assistance Program of the DSWD provided livelihood assistance to poor families and individuals in both urban and rural areas. This livelihood assistance entailed income generating projects strangthened with provision of basic skills on business management, the beneficiaries included family heads, women, youth, disabled persons and other needy adults.
The Self-Employment Assistance – Kaunlaran (SEA-K) Integrated Development Project started in 1993; it was implemented by the DSWD and was included under the SRA; it was a livelihood assistance program that involved provision of social welfare services to needy family heads, disadvantaged women, out-of-school youth, and persons with disabilities;
SEA-K became a regular program under the DSWD
SEA-K became a regular program under the DSWD
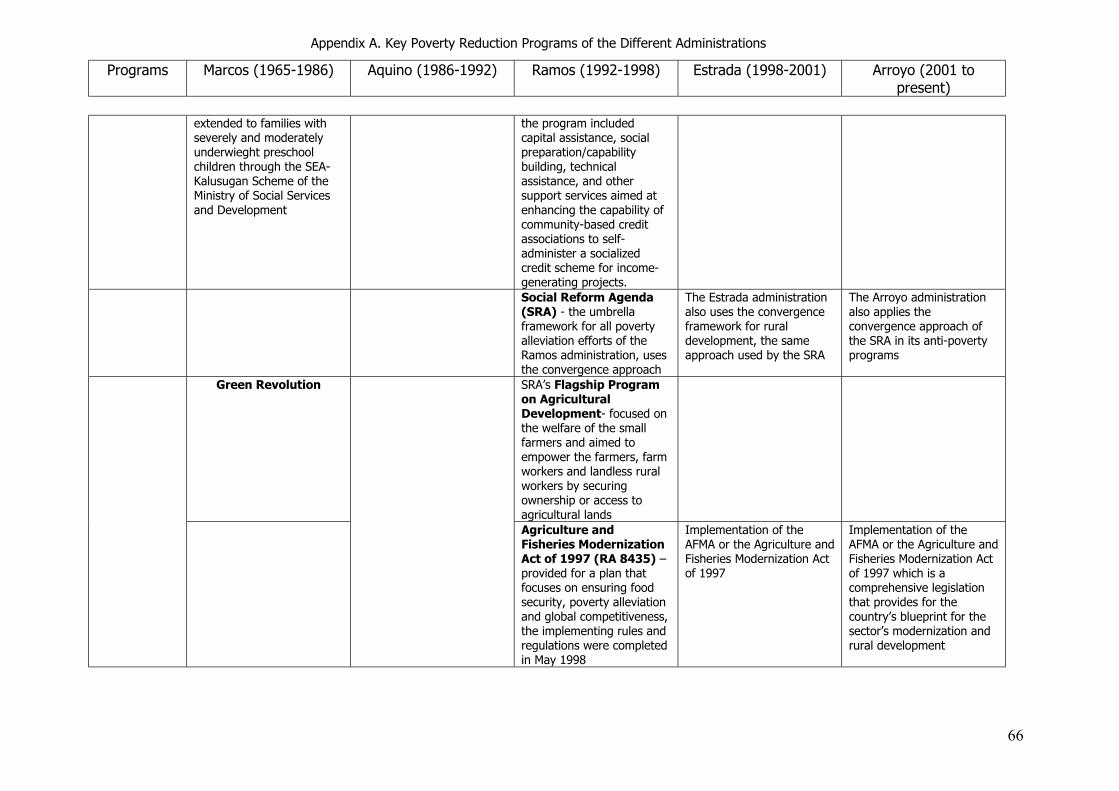
Programs Marcos (1965-1986) Aquino (1986-1992) Ramos (1992-1998) Estrada (1998-2001) Arroyo (2001 to present)
66
Appendix A. Key Poverty Reduction Programs of the Different Administrations
extended to families with severely and moderately underwieght preschool children through the SEA-Kalusugan Scheme of the Ministry of Social Services and Development
the program included capital assistance, social preparation/capability building, technical assistance, and other support services aimed at enhancing the capability of community-based credit associations to self-administer a socialized credit scheme for income-generating projects.
Social Reform Agenda (SRA) - the umbrella framework for all poverty alleviation efforts of the Ramos administration, uses the convergence approach
The Estrada administration also uses the convergence framework for rural development, the same approach used by the SRA
The Arroyo administration also applies the convergence approach of the SRA in its anti-poverty programs
Green Revolution SRA’s Flagship Program on Agricultural Development- focused on the welfare of the small farmers and aimed to empower the farmers, farm workers and landless rural workers by securing ownership or access to agricultural lands
Agriculture and Fisheries Modernization Act of 1997 (RA 8435) – provided for a plan that focuses on ensuring food security, poverty alleviation and global competitiveness, the implementing rules and regulations were completed in May 1998
Implementation of the AFMA or the Agriculture and Fisheries Modernization Act of 1997
Implementation of the AFMA or the Agriculture and Fisheries Modernization Act of 1997 which is a comprehensive legislation that provides for the country’s blueprint for the sector’s modernization and rural development
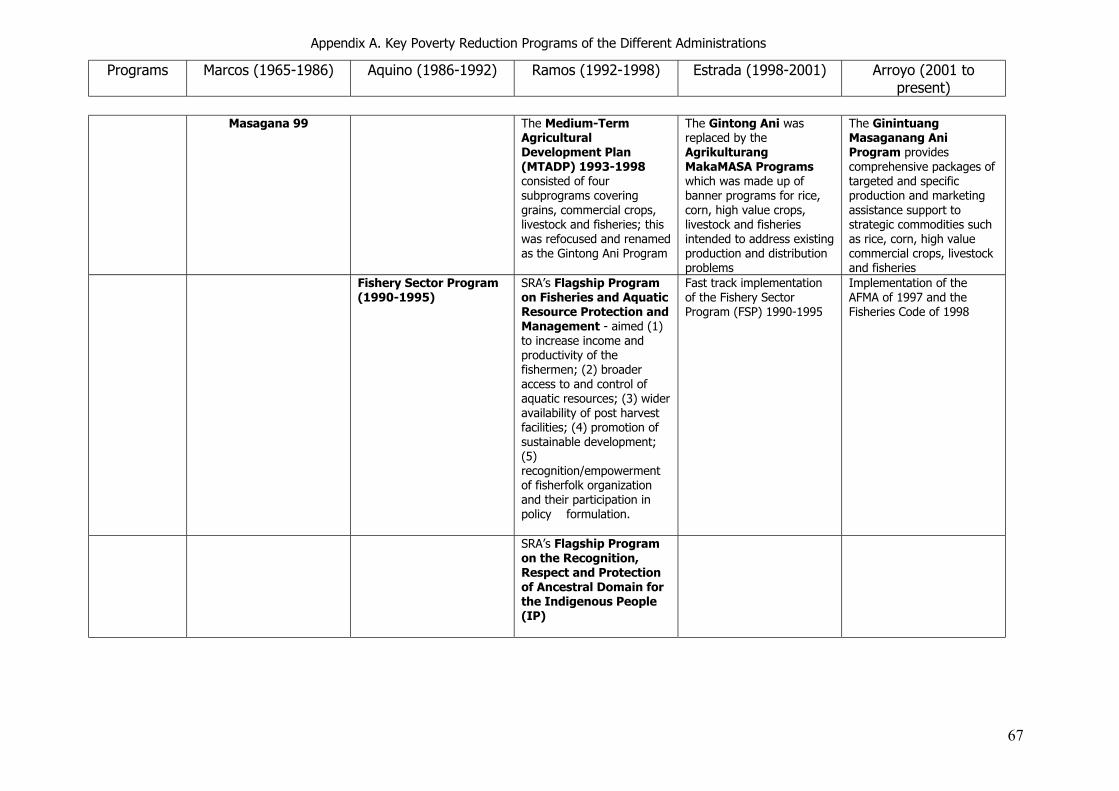
Programs Marcos (1965-1986) Aquino (1986-1992) Ramos (1992-1998) Estrada (1998-2001) Arroyo (2001 to present)
67
Appendix A. Key Poverty Reduction Programs of the Different Administrations
Masagana 99 The Medium-Term Agricultural Development Plan (MTADP) 1993-1998 consisted of four subprograms covering grains, commercial crops, livestock and fisheries; this was refocused and renamed as the Gintong Ani Program
The Gintong Ani was replaced by the Agrikulturang MakaMASA Programs which was made up of banner programs for rice, corn, high value crops, livestock and fisheries intended to address existing production and distribution problems
The Ginintuang Masaganang Ani Program provides comprehensive packages of targeted and specific production and marketing assistance support to strategic commodities such as rice, corn, high value commercial crops, livestock and fisheries
Fishery Sector Program (1990-1995)
SRA’s Flagship Program on Fisheries and Aquatic Resource Protection and Management - aimed (1) to increase income and productivity of the fishermen; (2) broader access to and control of aquatic resources; (3) wider availability of post harvest facilities; (4) promotion of sustainable development; (5) recognition/empowerment of fisherfolk organization and their participation in policy formulation.
Fast track implementation of the Fishery Sector Program (FSP) 1990-1995
Implementation of the AFMA of 1997 and the Fisheries Code of 1998
SRA’s Flagship Program on the Recognition, Respect and Protection of Ancestral Domain for the Indigenous People (IP)
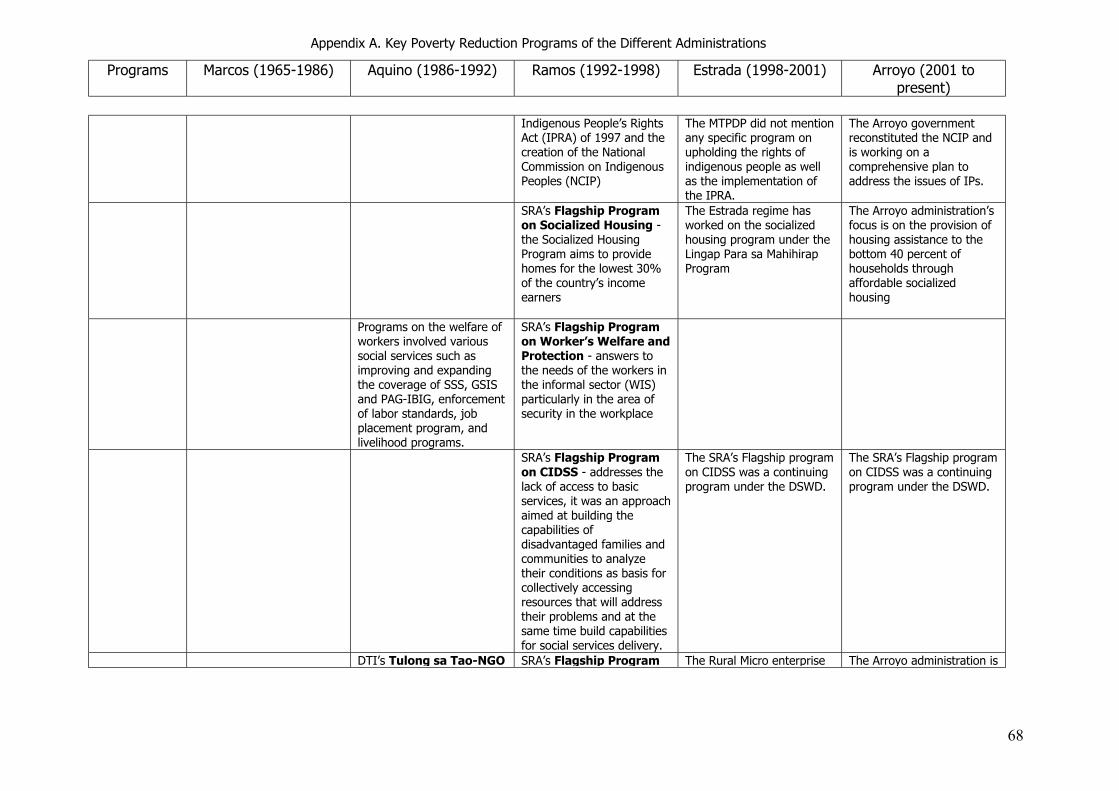
Programs Marcos (1965-1986) Aquino (1986-1992) Ramos (1992-1998) Estrada (1998-2001) Arroyo (2001 to present)
68
Appendix A. Key Poverty Reduction Programs of the Different Administrations
Indigenous People’s Rights Act (IPRA) of 1997 and the creation of the National Commission on Indigenous Peoples (NCIP)
The MTPDP did not mention any specific program on upholding the rights of indigenous people as well as the implementation of the IPRA.
The Arroyo government reconstituted the NCIP and is working on a comprehensive plan to address the issues of IPs.
SRA’s Flagship Program on Socialized Housing - the Socialized Housing Program aims to provide homes for the lowest 30% of the country’s income earners
The Estrada regime has worked on the socialized housing program under the Lingap Para sa Mahihirap Program
The Arroyo administration’s focus is on the provision of housing assistance to the bottom 40 percent of households through affordable socialized housing
Programs on the welfare of workers involved various social services such as improving and expanding the coverage of SSS, GSIS and PAG-IBIG, enforcement of labor standards, job placement program, and livelihood programs.
SRA’s Flagship Program on Worker’s Welfare and Protection - answers to the needs of the workers in the informal sector (WIS) particularly in the area of security in the workplace
SRA’s Flagship Program on CIDSS - addresses the lack of access to basic services, it was an approach aimed at building the capabilities of disadvantaged families and communities to analyze their conditions as basis for collectively accessing resources that will address their problems and at the same time build capabilities for social services delivery.
The SRA’s Flagship program on CIDSS was a continuing program under the DSWD.
The SRA’s Flagship program on CIDSS was a continuing program under the DSWD.
DTI’s Tulong sa Tao-NGO SRA’s Flagship Program The Rural Micro enterprise The Arroyo administration is
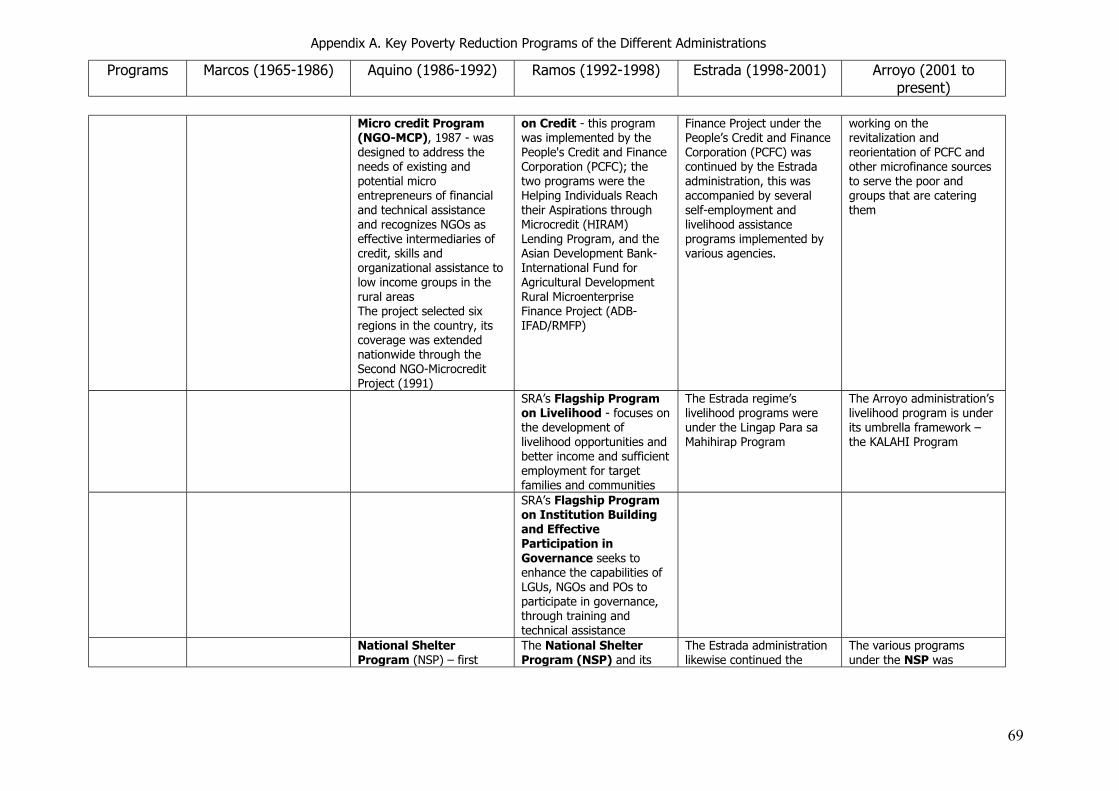
Programs Marcos (1965-1986) Aquino (1986-1992) Ramos (1992-1998) Estrada (1998-2001) Arroyo (2001 to present)
69
Appendix A. Key Poverty Reduction Programs of the Different Administrations
Micro credit Program (NGO-MCP), 1987 - was designed to address the needs of existing and potential micro entrepreneurs of financial and technical assistance and recognizes NGOs as effective intermediaries of credit, skills and organizational assistance to low income groups in the rural areas The project selected six regions in the country, its coverage was extended nationwide through the Second NGO-Microcredit Project (1991)
on Credit - this program was implemented by the People's Credit and Finance Corporation (PCFC); the two programs were the Helping Individuals Reach their Aspirations through Microcredit (HIRAM) Lending Program, and the Asian Development Bank-International Fund for Agricultural Development Rural Microenterprise Finance Project (ADB-IFAD/RMFP)
Finance Project under the People’s Credit and Finance Corporation (PCFC) was continued by the Estrada administration, this was accompanied by several self-employment and livelihood assistance programs implemented by various agencies.
working on the revitalization and reorientation of PCFC and other microfinance sources to serve the poor and groups that are catering them
SRA’s Flagship Program on Livelihood - focuses on the development of livelihood opportunities and better income and sufficient employment for target families and communities
The Estrada regime’s livelihood programs were under the Lingap Para sa Mahihirap Program
The Arroyo administration’s livelihood program is under its umbrella framework – the KALAHI Program
SRA’s Flagship Program on Institution Building and Effective Participation in Governance seeks to enhance the capabilities of LGUs, NGOs and POs to participate in governance, through training and technical assistance
National Shelter Program (NSP) – first
The National Shelter Program (NSP) and its
The Estrada administration likewise continued the
The various programs under the NSP was

Programs Marcos (1965-1986) Aquino (1986-1992) Ramos (1992-1998) Estrada (1998-2001) Arroyo (2001 to present)
70
Appendix A. Key Poverty Reduction Programs of the Different Administrations
implemented in 1987 under which the government provided housing assistance in the form of home mortgage financing, productions, and development loans to public and private developers and community housing programs.
1. Unified Home Lending Program (UHLP), 1987
2. NSP’s Production Program, 1989
3. Development Loan Program, 1988
4. Social Housing Loan program, 1988 and
5. Community Mortgage Program (CMP), 1988
subprograms were sustained by the Ramos administration and two major legislations were passed, these were the Urban Development and Housing Act (UDHA) of 1992 and RA 7835 on the Comprehensive and Integrated Shelter Financing Act of 1994 (CISFA), the CISFA provided for the sustained financing to the NSP. The 1st National Urban Development and Housing Framework was formulated in May 1994 as a guide for local action, which led to the formulation of Comprehensive Land use Plans (CLUPs) and Zoning Ordinances (Zos).
National Shelter Program (NSP); the Unified Home Lending Program (UHLP) was replaced by the Multi-Window Lending System (MWLS), which utilized government financial institutions (GFIs) as separate lending windows. The socialized housing program for LGUs was facilitated under the Lingap Para sa Mahihirap Program
sustained by the Arroyo administration; the focus however is to channel housing assistance to the bottom 40 percent of the population.
Lingap Para sa Mahihirap Lingap Para sa Mahihirap was replaced by the KALAHI Program of Arroyo administration
Food Subsidy NFA’s Food Subsidy NFA’s Food subsidy NFA’s Food subsidy The NFA’s food subsidy Due to inefficiencies of past

Programs Marcos (1965-1986) Aquino (1986-1992) Ramos (1992-1998) Estrada (1998-2001) Arroyo (2001 to present)
71
Appendix A. Key Poverty Reduction Programs of the Different Administrations
Program Program started when NFA was established in 1981 The Kadiwa was a subsidized non-grains retailing center
program was continued through the Bigasang-Bayan distribution program
program was continued through the Bigasang-Bayan distribution program; rolling stores were not part of the regular program, they were used only for emergency purposes in times of crises
program was continued through the Lingap Para sa Mahihirap Program and was able to: - distribute rice at
subsidized rate in poor barangays
- set-up retail stores, and
- provide production loans
- Rolling stores were called ERAP (Enhance Retail Access for the Poor) Rolling Stores
food subsidy programs, the NFA under the Arroyo administration has developed new food subsidy programs, these are the Targeted Rice Distribution Program (TRDP); Coconut Farmers Food Access Program (CFFAP); and Focus Rice Distribution Program (FRDP) - Greater Market Access (GMA) Tindahang Bayan Para sa Mamamayan –retail outlets for the food subsidy programs Tindahan Ni Gloria (TNG) Rice Distribution Program
Community Employment Development Program (CEDP)
Community Employment Development Program (CEDP)- Started in 1986 for the purpose of creating one million jobs in the countryside by end of 1987 After 1987, the CEDP ceased to be implemented as a separate program. Most of its elements were institutionalized and adopted in most of the regular projects implemented by the agencies.
A similar program was launched in 1993 called Kabuhayan 2000. This aims at generating 2 million jobs between 1994 and 1995. It integrates all employment assistance of national government agencies. Unlike, the CEDP however, the current the activities under the program include such activities as reforestation, land development, physical infrastructure and livelihood creation.
Annual emergency employment program for 20,000 out-of-school and out-of-work youth in Metro initially and in Regions III and IV
Agrarian Reform
PD 27 covering only rice and corn lands engaged in
CARL (RA 6657) was passed into law in 1988
Continued CARP; Enactment of RA 8532
Continued CARP
Continued CARP

Programs Marcos (1965-1986) Aquino (1986-1992) Ramos (1992-1998) Estrada (1998-2001) Arroyo (2001 to present)
72
Appendix A. Key Poverty Reduction Programs of the Different Administrations
leasehold operation, land transfer, land consolidation and settlements; Agrarian reform Estates development Financing Program; Samahang Nayon were used to channel services
establishing the CARP which covered all private and public agricultural lands regardless of commodity produced and tenurial status of the tiller including other lands of the public domain suitable for agriculture; CARP adopted the strategy of creating Agrarian Reform Communities (ARCs) to channel its services
which Amended Section 63 of CARL making the Agrarian Reform Fund a revolving fund and granting an additional P50 Billion to augment the ARF until 2008
Sources: 1971-1974 Philippine Development Plan 1984 Philippine Development Report, NEDA, 1985 1989 Philippine Development Report, NEDA 1990 1991 Philippine Development Report, NEDA 1992 Asian Development Bank Philippine Headline News Online http://usembassy.state.gov/posts/rp1/wwwf5083.pdf http://users.iloilo.net/jlozada/PDIReply2.html HUDCC website (www.hudcc.gov.ph) Manila Bulletin, July 19, 1998 Milo, M. "Social Safety net Programs in the Philippines",In Lamberte ed. Economics Crisis Once More, PIDS 2001. MTPDP 1987-1992 MTPDP 1999-2004 MTPDP 2001-2004 Orbeta and Sanchez (1996) Philippine Development Report, 1987-1992, NEDA 1993, p. X-2 Pineda, V. "Impact of the East Asian Financial Crisis on Social Services Financing and Delivery." In Lamberte, M.B. ed. Economic Crisis Once More, PIDS, Makati City 2001 www.dswd.gov.ph Reyes C. and E. Del Valle. 1999. Poverty Alleviation and Equity Promotion. PIDS Reyes C. and E. Del Valle. 1999. Poverty Alleviation and Equity Promotion. PIDS Rola D. A. ed. Integrated Rural Development: Problems and Issues, Management Education Council, University of the Philippines 1981 Socioeconomic Report 2001 The President’s 1997 Socioeconomic Report The President’s 1998 Socioeconomic Report Updated MTPDP 1996-1998, p.3-2 Updates of the Philippine Development Plan 1990-1992 www.pids.gov.ph