Poverty Counts: Data for Activists and Analysts Cultivating Hope: Harvesting Action Rural Poverty...
27
Poverty Counts: Data for Activists and Analysts Cultivating Hope: Harvesting Action Rural Poverty and Social Change Conference, UMass Amherst June 2, 2006 Susan Edwards
-
date post
22-Dec-2015 -
Category
Documents
-
view
221 -
download
1
Transcript of Poverty Counts: Data for Activists and Analysts Cultivating Hope: Harvesting Action Rural Poverty...
Poverty Counts: Data for Activists and Analysts
Cultivating Hope: Harvesting Action Rural Poverty and Social Change
Conference, UMass Amherst June 2, 2006
Susan Edwards
Getting Started
Who are you? What do you want to know? Can we find it?
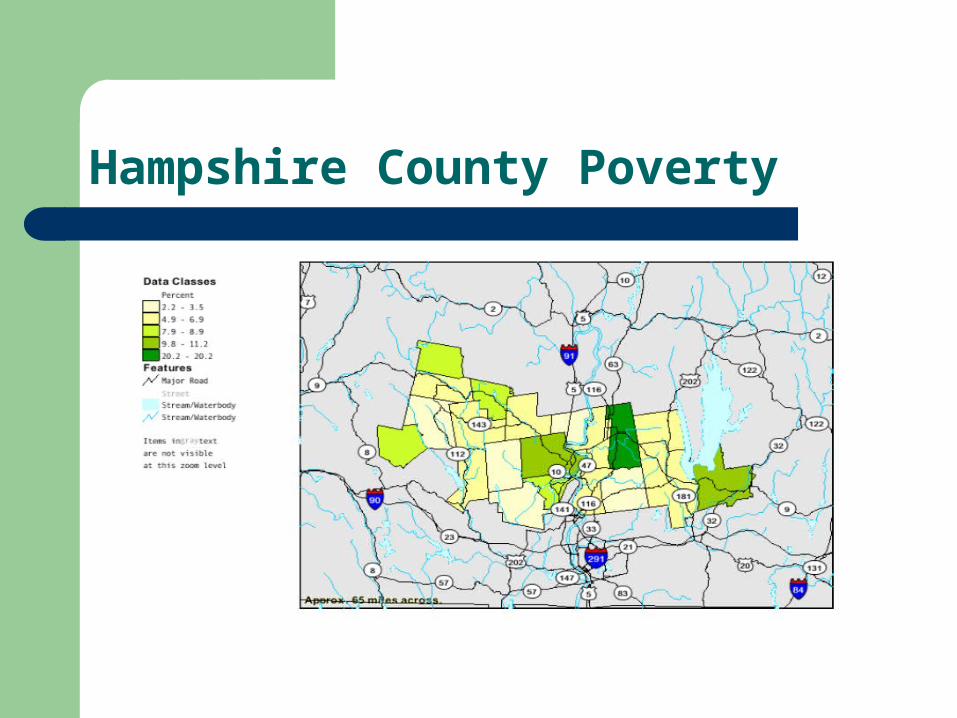
Hampshire County Poverty
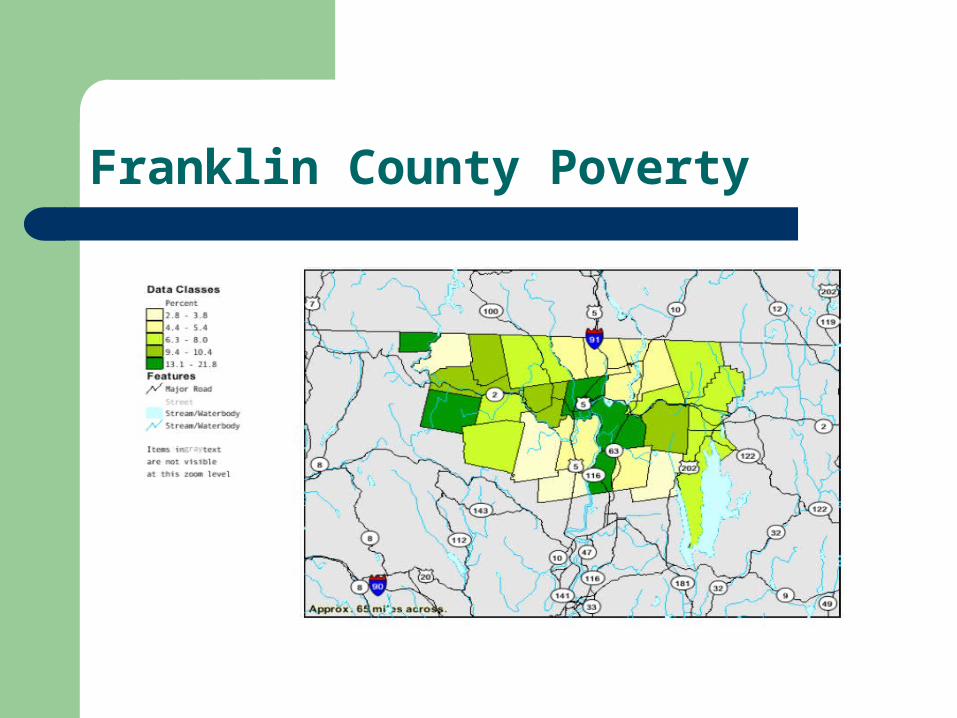
Franklin County Poverty
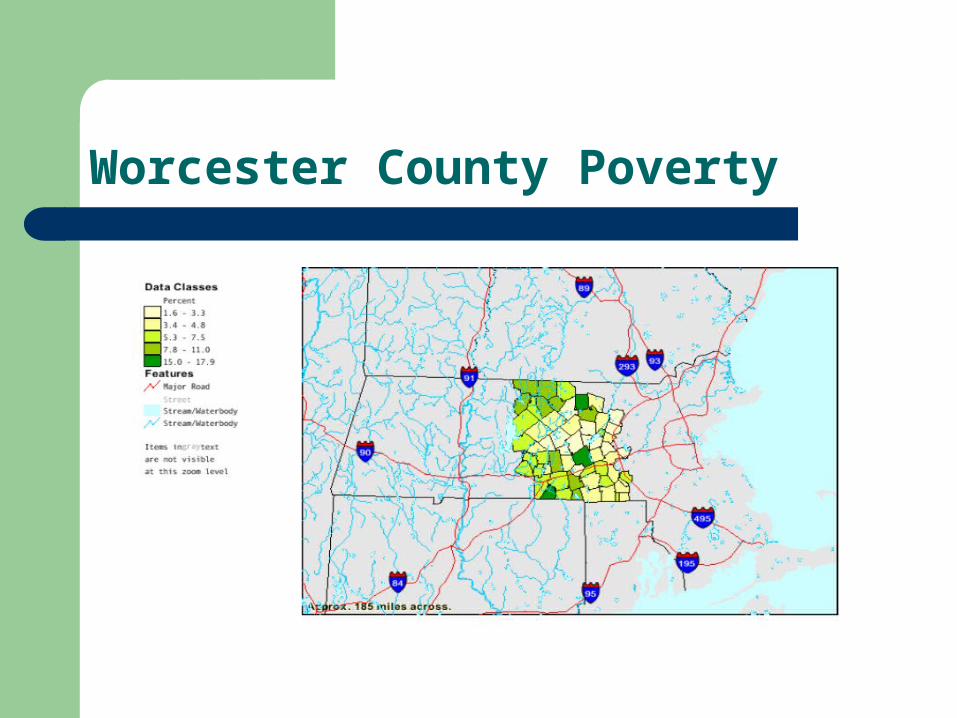
Worcester County Poverty
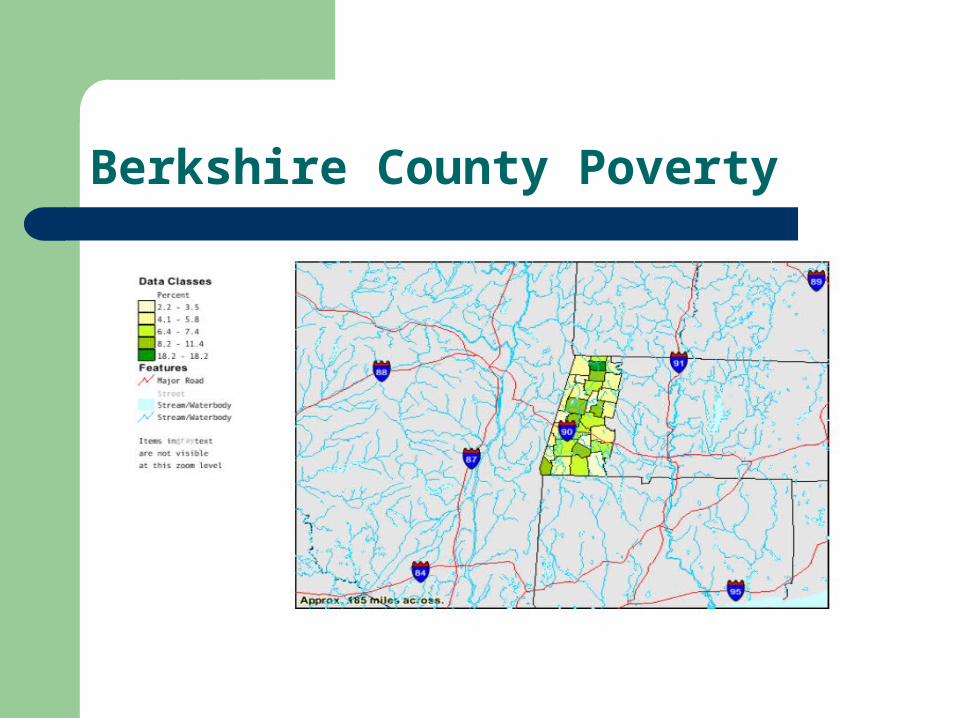
Berkshire County Poverty
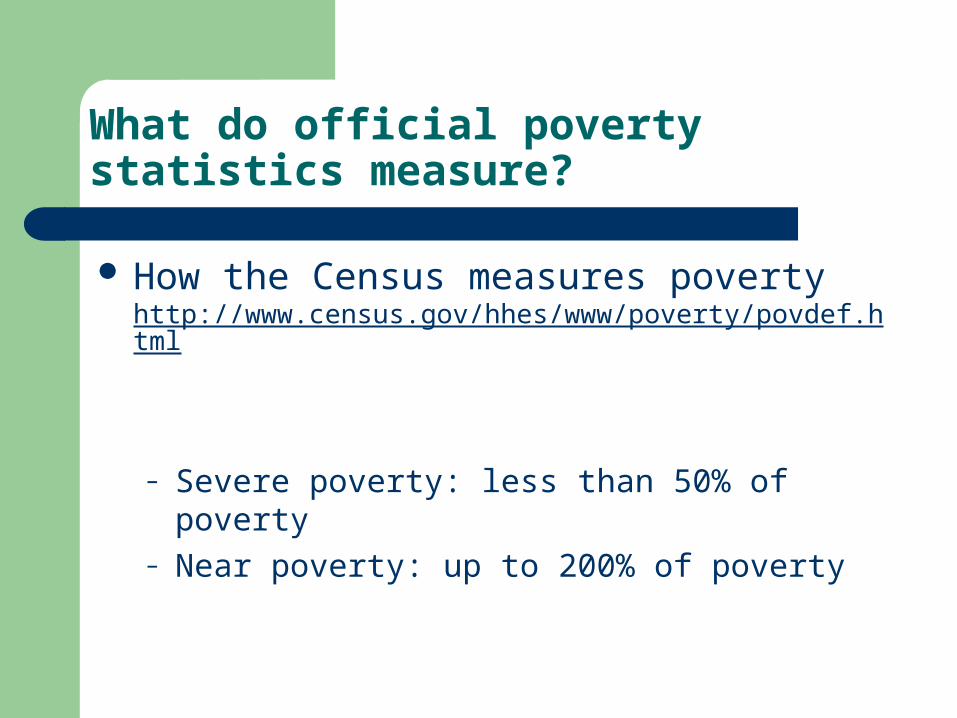
What do official poverty statistics measure?
How the Census measures poverty http://www.census.gov/hhes/www/poverty/povdef.html
– Severe poverty: less than 50% of poverty– Near poverty: up to 200% of poverty
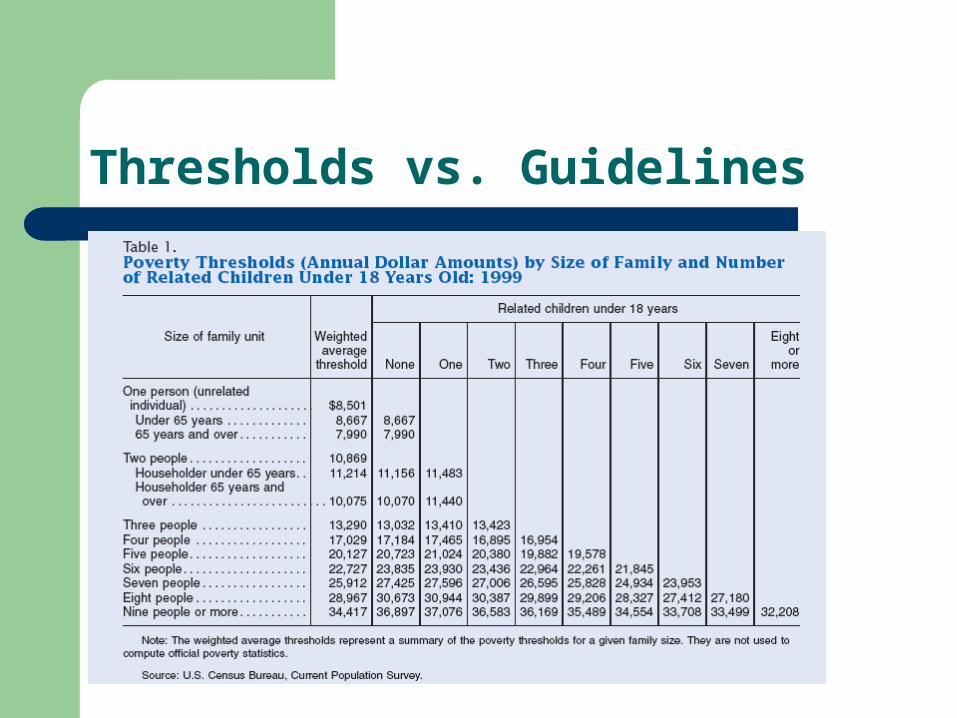
Thresholds vs. Guidelines
HHS Bases the Poverty Guidelines on the Thresholds
Published by the Department of Health and Human Services in February, in the Federal Register http://aspe.hhs.gov/poverty/index.shtml
Thresholds are the same for urban and rural areas and all 50 states. Guidelines are different for Alaska and Hawaii.
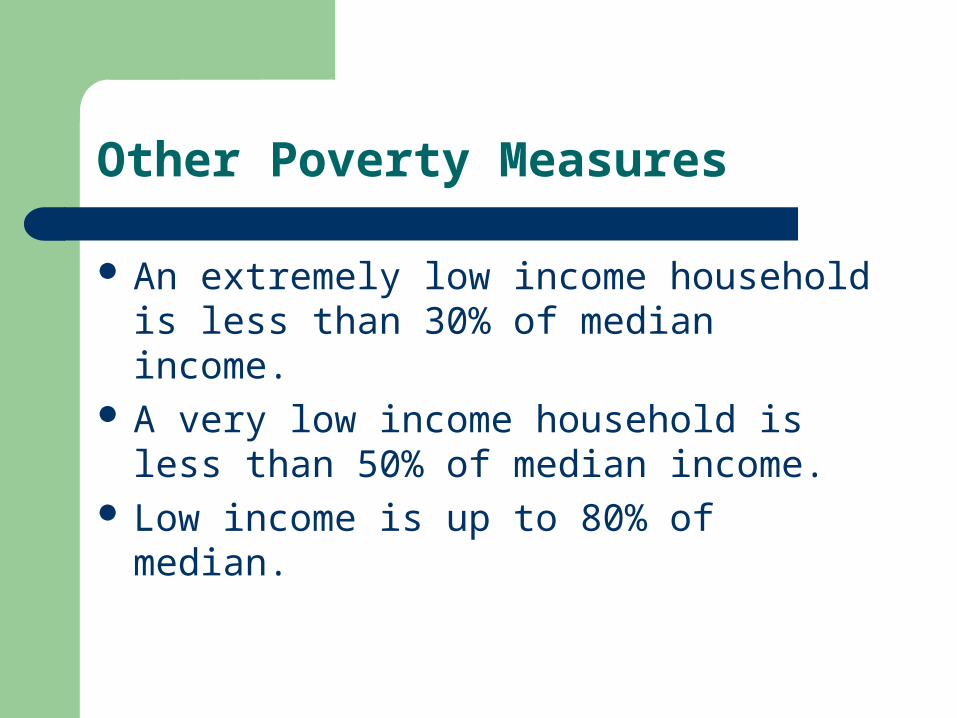
Other Poverty Measures
An extremely low income household is less than 30% of median income.
A very low income household is less than 50% of median income.
Low income is up to 80% of median.
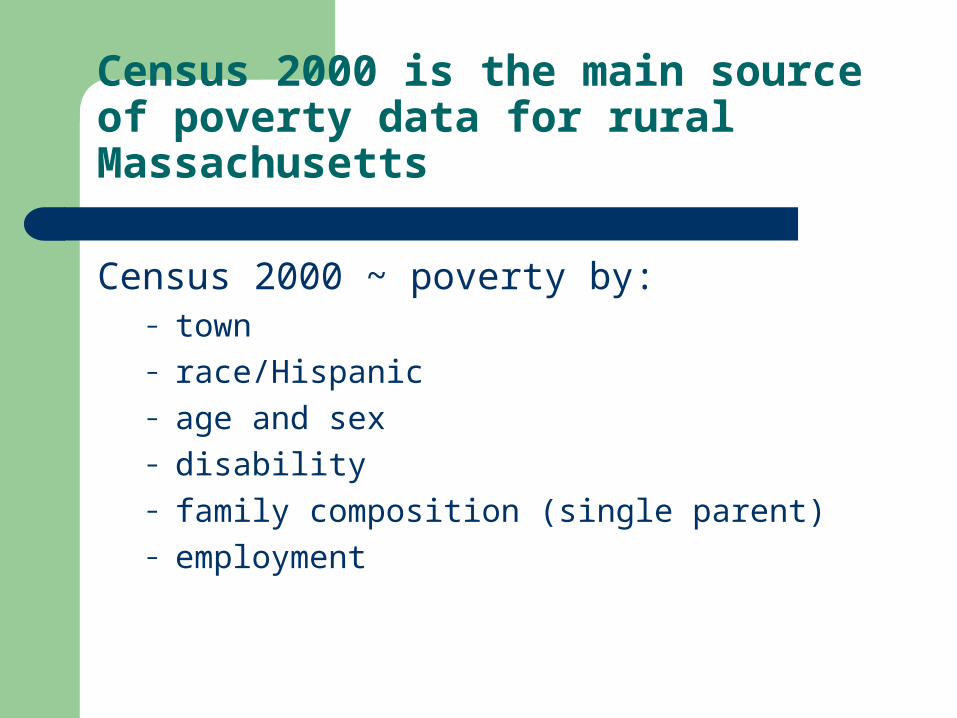
Census 2000 is the main source of poverty data for rural Massachusetts
Census 2000 ~ poverty by:– town– race/Hispanic – age and sex– disability – family composition (single parent)– employment
Race
The fact that race matters… does not mean that the salience and consequences of racial distinctions are good or that race must continue to matter in the future. Nor does the brute sociological fact that race matters dictate what one’s response to that fact should be.
--Randall Kennedy
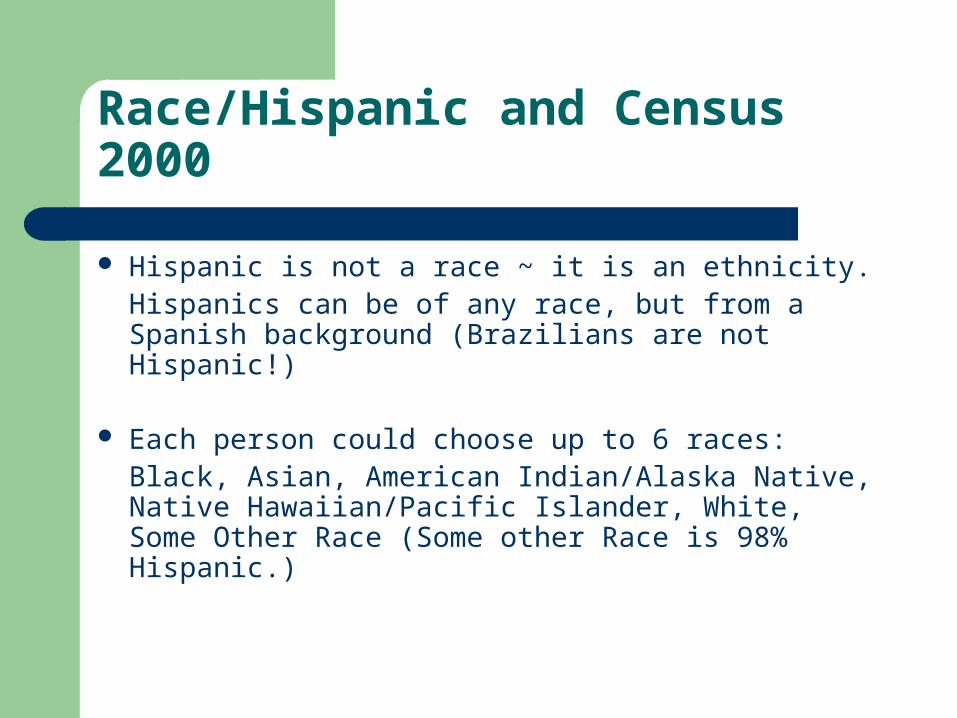
Race/Hispanic and Census 2000
Hispanic is not a race ~ it is an ethnicity.Hispanics can be of any race, but from a Spanish background (Brazilians are not Hispanic!)
Each person could choose up to 6 races:Black, Asian, American Indian/Alaska Native, Native Hawaiian/Pacific Islander, White, Some Other Race (Some other Race is 98% Hispanic.)
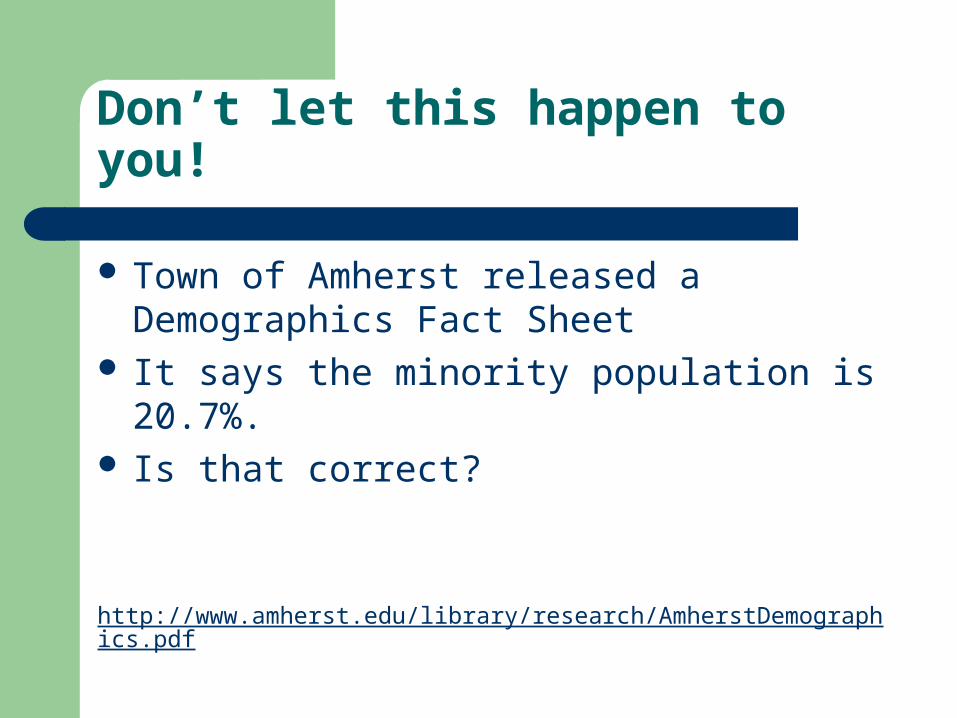
Don’t let this happen to you!
Town of Amherst released a Demographics Fact Sheet
It says the minority population is 20.7%. Is that correct?
http://www.amherst.edu/library/research/AmherstDemographics.pdf
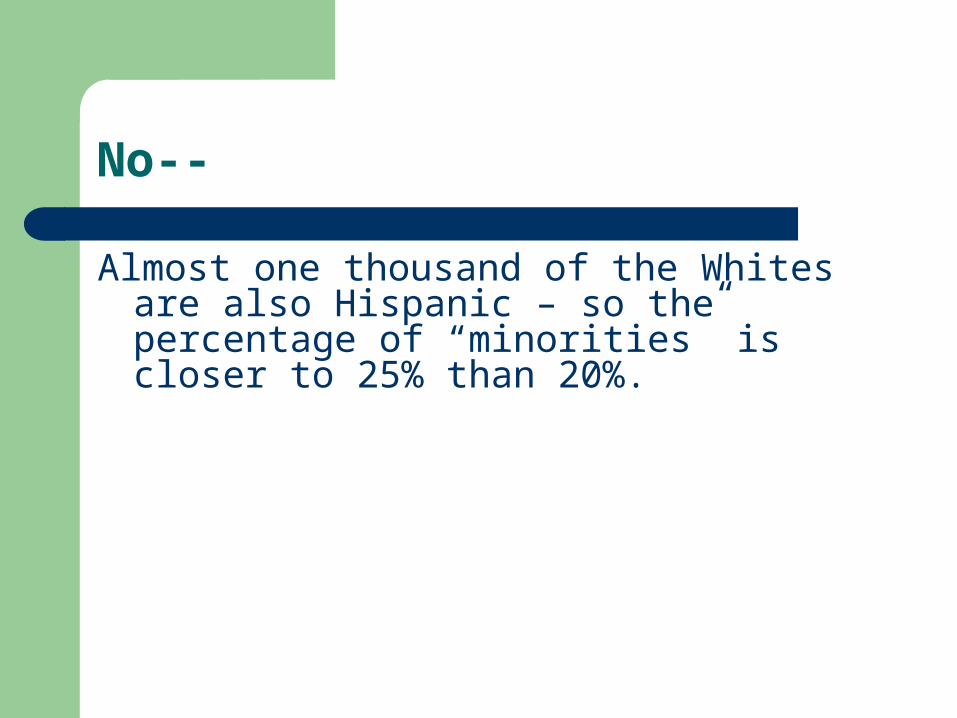
No--
Almost one thousand of the Whites are also Hispanic – so the percentage of “minorities” is closer to 25% than 20%.
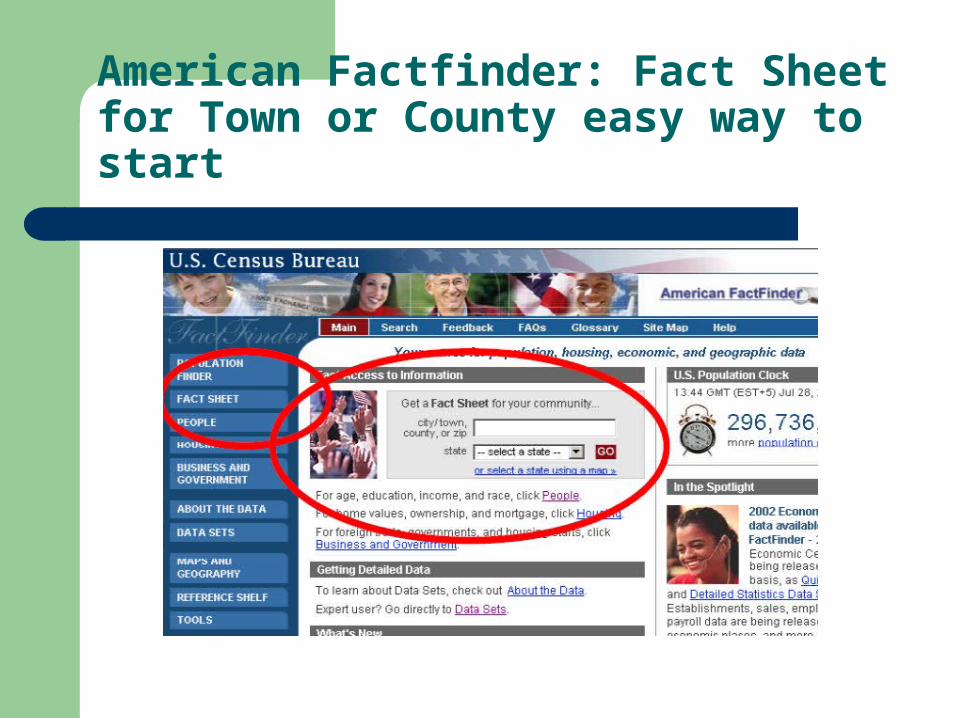
American Factfinder: Fact Sheet for Town or County easy way to start
Finding Poverty Data – Census 2000
American Factfinder http://factfinder.census.gov/ Fact Sheet by Towns or Counties quickest
way to find poverty for individuals and families.
Can switch to any race/Hispanic group to see poverty for that group (Non-Hispanic Whites, for example.)
Updating the poverty numbers:
American Community Survey (ACS) will be replacing the Decennial Census long form (questions about income, etc.)
It will be available for all towns in Massachusetts by 2010, but should be available for counties in’06, large towns ’08.
It will be added to the Fact Sheets/Data Sets.
SAIPE – Small Area Income and Poverty Data
Created by the Census and other federal agencies to update the Decennial Census poverty data. Latest year of coverage is 2003.
States, counties and school districts – not towns. Poverty for all ages, children under 5 (only at the
state level), children 0-17, and children 5-17. County level it also gives the median family income.
http://www.census.gov/hhes/www/saipe/
Poverty Related Data
Cliks: Community Level Information on Kids
Data about children from all the towns in Massachusetts.
From local sources, such as health departments, human services agencies, and schools.
Includes WIC participation, DSS investigations, teen pregnancy rate, MCAS scores, poverty, etc.
http://www.aecf.org/cgi-bin/cliks.cgi?
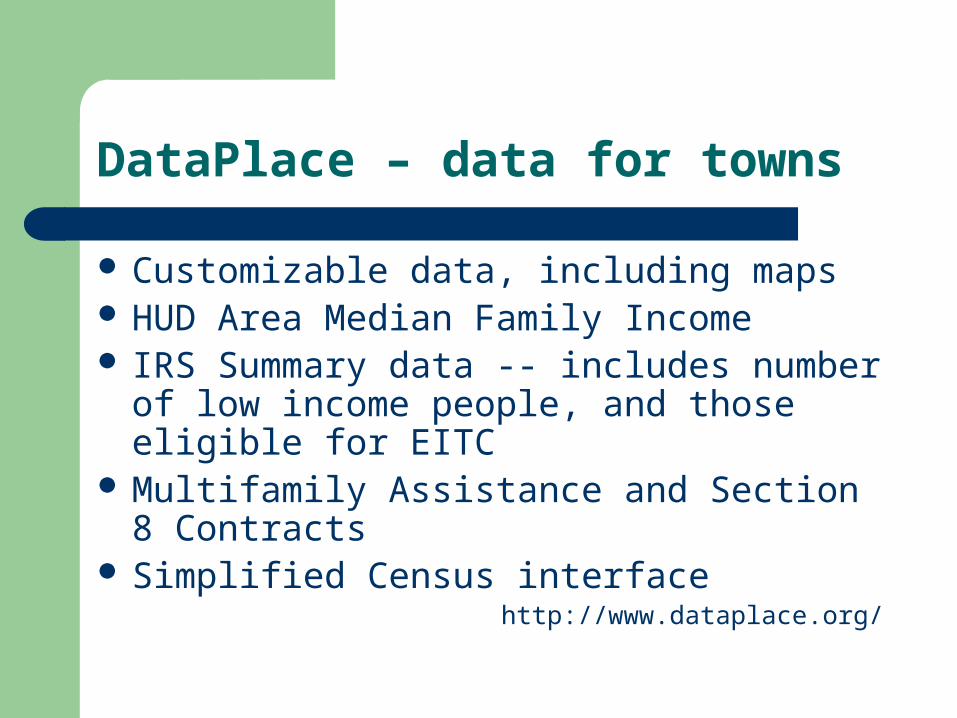
DataPlace – data for towns
Customizable data, including maps HUD Area Median Family Income IRS Summary data -- includes number of low
income people, and those eligible for EITC Multifamily Assistance and Section 8
Contracts Simplified Census interface
http://www.dataplace.org/
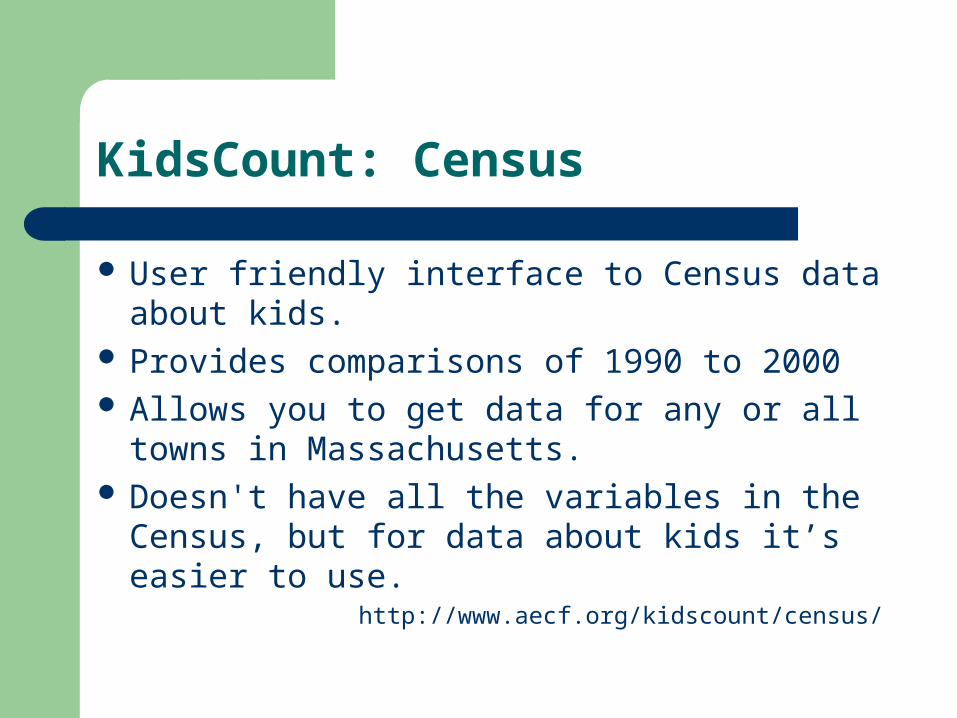
KidsCount: Census
User friendly interface to Census data about kids.
Provides comparisons of 1990 to 2000 Allows you to get data for any or all towns in
Massachusetts. Doesn't have all the variables in the Census,
but for data about kids it’s easier to use.http://www.aecf.org/kidscount/census/
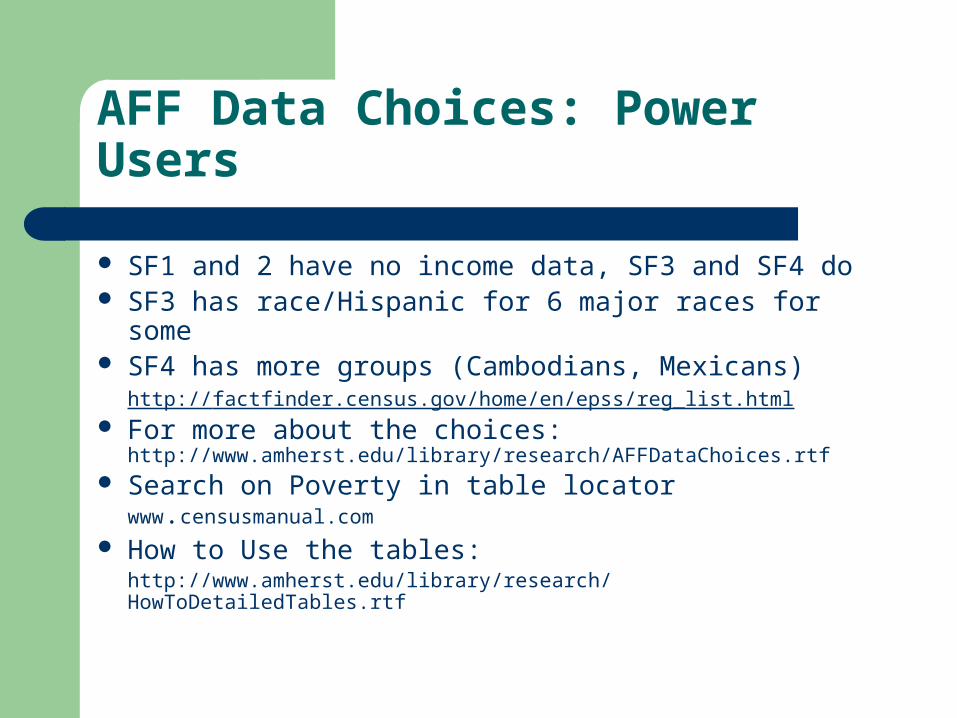
AFF Data Choices: Power Users
SF1 and 2 have no income data, SF3 and SF4 do SF3 has race/Hispanic for 6 major races for some SF4 has more groups (Cambodians, Mexicans)
http://factfinder.census.gov/home/en/epss/reg_list.html For more about the choices:
http://www.amherst.edu/library/research/AFFDataChoices.rtf Search on Poverty in table locator
www.censusmanual.com
How to Use the tables:http://www.amherst.edu/library/research/HowToDetailedTables.rtf
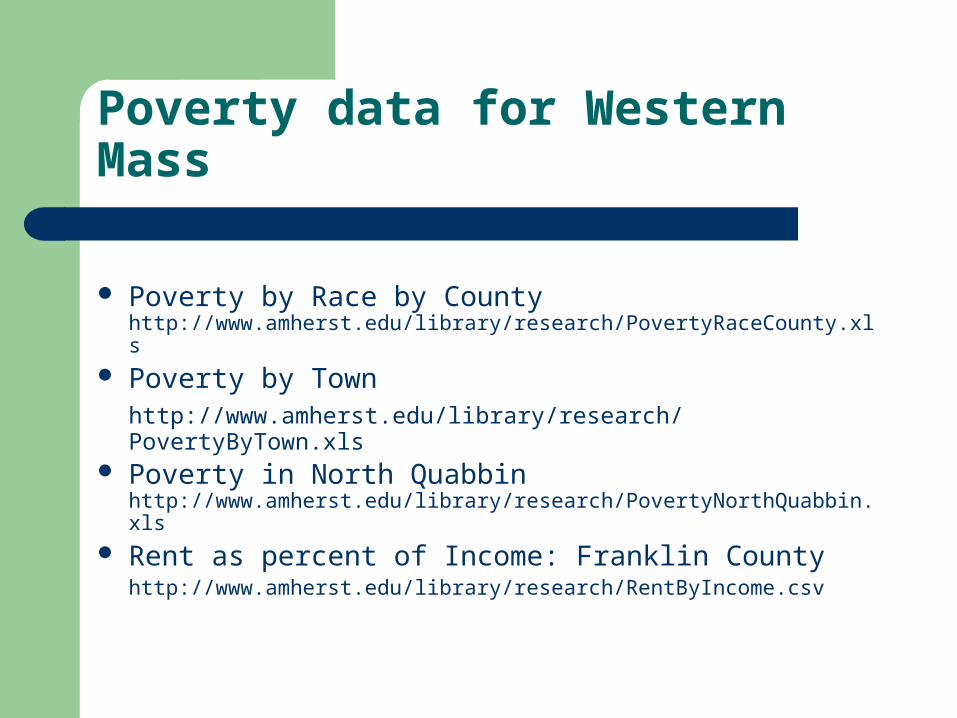
Poverty data for Western Mass
Poverty by Race by County http://www.amherst.edu/library/research/PovertyRaceCounty.xls
Poverty by Townhttp://www.amherst.edu/library/research/PovertyByTown.xls
Poverty in North Quabbin http://www.amherst.edu/library/research/PovertyNorthQuabbin.xls
Rent as percent of Income: Franklin Countyhttp://www.amherst.edu/library/research/RentByIncome.csv
Detailed Race/Hispanic categories(on Summary File 4)
SF4 has poverty for very specific groups –
Cambodians (as opposed to Asians), Mexicans (not just Hispanics), and for groups that aren’t “races” but ancestries – Brazilians, Arabs. You can get the data for all the towns in several counties at the same time.
Good tutorial from UCSC --http://ssdc.ucsd.edu/ssdc/cen2k/raceguide.pdf
Where to get help:
M-F 8:30-4:30 from Boston Regional Census Office, (617) 424-4501
MISER, State Data Center at UMass Amherst, (413) 545-3460http://www.umass.edu/miser/contact.html
Susan Edwards, Amherst College Library
[email protected], (413)542-2767