Poverty and Inequality Dynamics in Manaus: Legacy of a ...
45
HAL Id: halshs-01245394 https://halshs.archives-ouvertes.fr/halshs-01245394 Preprint submitted on 17 Dec 2015 HAL is a multi-disciplinary open access archive for the deposit and dissemination of sci- entific research documents, whether they are pub- lished or not. The documents may come from teaching and research institutions in France or abroad, or from public or private research centers. L’archive ouverte pluridisciplinaire HAL, est destinée au dépôt et à la diffusion de documents scientifiques de niveau recherche, publiés ou non, émanant des établissements d’enseignement et de recherche français ou étrangers, des laboratoires publics ou privés. Poverty and Inequality Dynamics in Manaus: Legacy of a Free Trade Zone? Marta Castilho, Marta Menéndez, Aude Sztulman To cite this version: Marta Castilho, Marta Menéndez, Aude Sztulman. Poverty and Inequality Dynamics in Manaus: Legacy of a Free Trade Zone?. 2015. halshs-01245394
Transcript of Poverty and Inequality Dynamics in Manaus: Legacy of a ...

HAL Id: halshs-01245394https://halshs.archives-ouvertes.fr/halshs-01245394
Preprint submitted on 17 Dec 2015
HAL is a multi-disciplinary open accessarchive for the deposit and dissemination of sci-entific research documents, whether they are pub-lished or not. The documents may come fromteaching and research institutions in France orabroad, or from public or private research centers.
L’archive ouverte pluridisciplinaire HAL, estdestinée au dépôt et à la diffusion de documentsscientifiques de niveau recherche, publiés ou non,émanant des établissements d’enseignement et derecherche français ou étrangers, des laboratoirespublics ou privés.
Poverty and Inequality Dynamics in Manaus: Legacy ofa Free Trade Zone?
Marta Castilho, Marta Menéndez, Aude Sztulman
To cite this version:Marta Castilho, Marta Menéndez, Aude Sztulman. Poverty and Inequality Dynamics in Manaus:Legacy of a Free Trade Zone?. 2015. �halshs-01245394�
Poverty and Inequality Dynamics in Manaus: Legacy of a Free Trade Zone?
Marta CASTILHO
Inst. de Economia, Universidade Federal do Rio de Janeiro
Marta MENENDEZ
PSL, Université Paris-Dauphine, IRD, LEDa, DIAL UMR 225
Aude SZTULMAN
PSL, Université Paris-Dauphine, IRD, LEDa, DIAL UMR 225
December 2015
This work has been supported by the French National Research Agency,
through the program Investissements d'Avenir, ANR-10-LABX-93-01
G-MonD Working Paper n°43
For sustainable and inclusive world development

1
Poverty and Inequality Dynamics in Manaus: Legacy of a Free Trade Zone?*
Marta Castilhoa
[email protected] Marta Menéndezb,c
[email protected] Aude Sztulmanb,c
a Instituto de Economia, Universidade Federal do Rio de Janeiro, Brazil
b PSL, Université Paris-Dauphine, LEDa, DIAL UMR 225, F-75016 Paris, France
c IRD, LEDa, DIAL UMR 225, F-75010 Paris, France
ABSTRACT This study contributes to the literature on the social impacts of Special Economic Zones by analyzing the dynamics of poverty and inequality in the Brazilian state of Amazonas, where the Free Trade Zone of Manaus (FTZM) is located. Using census data, micro-decompositions and counterfactual simulations, we show that if labor income was a major driver of poverty and inequality declines for the municipality of Manaus in the 2000-2010 decade, non-labor income was far more important in the rest of the state of Amazonas. Our contrasting results illustrate both the benefits and limitations of the influence of the FTZM. A better targeting of both social policies and training programs could improve distributional outcomes in the whole area. Keywords: Free trade zone, poverty; inequality; Manaus; Brazil.
JEL codes: D31, F16, F14, I32
* We are grateful for insightful comments received at seminars at the Universidade Federal de Rio de Janeiro (UFRJ), Universidade Federal Fluminense (UFF), Universidade Federal do Amazonas (UFAM), at the 2015 DIAL Development Conference on "Barriers to Development" (Université Paris-Dauphine) and at the NOPOOR Workshop “Poverty, Inequality and Redistribution” (CSAE Oxford St Catherine's College). Correspondence : [email protected]
2
1. INTRODUCTION
Special economic zones (SEZs) can be broadly defined as “demarcated geographic areas
contained within a country’s national boundaries where the rules of business are different from
those that prevail in the national territory” (see Farole and Akinci, 2011). The creation of these
zones inside a country’s borders has been used in past decades as a policy instrument to generate
employment, promote industrialization, enhance regional integration and, ultimately, as a tool to
foster economic development and raise peoples’ standards of living. The number of SEZs has
indeed surged in the world, particularly in developing countries, and a wide range of them can
now be found with different goals and distinct strategies.1
Despite this widespread use of SEZs in developing countries, their economic and social record
has remained controversial. Although SEZs can drive up job creations and technology transfers,
attract foreign direct investment and multinational companies, strengthen integration into global
value chains and create backward and forward linkages with the rest of the economy, they can
also create distortions (tax-based, geographical, etc.) and their impact on labor standards and
human development is still a subject of considerable debate. Recent reviews of descriptive case
studies point out how gains from zone operations vary across countries, but also within countries
and across zones and time (see Aggarwal 2007, 2012; FIAS 2008; Farole 2011).
One area in which evidence is still scarce (partly due to data availability problems and
measurement difficulties) has to do with the potential poverty-alleviating effect of SEZs in
developing countries. Some recent studies find how SEZs might offer better job opportunities,
particularly for more vulnerable groups (women, young people, minorities and poor people in
general), which may include higher wages (Amengual and Milberg, 2008; McCallum, 2011) and
better labor conditions (Jenkins, 2005; Cling et al., 2005; Glick and Roubaud, 2006; Cling et al.,
2009; Aggarwal, 2007; Amengual and Milberg, 2008; De Hoyos et al., 2012). These factors may
lead to poverty and/or inequality reduction. At the same time, several case studies (Oberai et al.,
2001; Kwaku Akpokavie, 2001; ILO, 2003 and 2008; Glick and Roubaud, 2006; McCallum, 2011)
1 The denomination ‘SEZ’ covers a broad range of more specific zone types such as Free Trade Zones (FTZ), Export Processing Zones (EPZ), Enterprise Zones, Free Ports and others. See Farole (2011), Farole and Akinci (2011), and Siroën and Yücer (2014) for descriptions and classifications of different types of SEZs in the world. As an example of their development, the International Labour Organization’s (ILO) database of SEZs reported 176 zones in 47 countries in 1986, and approximately 3,500 zones in 130 countries by 2006 (Singa Boyenge, 2007). In addition, Yücer, Siroën and Archanskaia (2014) find some 1,083 zones (not counting Maquiladoras and US Foreign Trade Zones) in 2008 in their World FTZ Database covering 158 countries. Note that differences in the numbers of SEZs found across databases are closely linked to the type of SEZ definition chosen, but there is clear evidence of growth in numbers.

3
also find some troubling signals associated with the development of SEZs, such as lax
enforcement of labor laws (unrestrictive firing regulations and a lack of social protection), lower
labor standards (with respect to social dialogue, freedom of association, collective bargaining,
etc.), high turnover due to “sweatshop” working conditions in factories (working hours, pace of
work, health and safety), and persistently low wage levels over time. However, almost none of the
abovementioned studies focus on the ultimate effects of SEZs on household poverty and
inequality and indeed few are based on individual data (average sector data or aggregate firm-level
data are more frequently used). Among the exceptions, Glick and Roubaud (2006) and Cling et al.
(2005, 2009), for Madagascar, do focus on workers’ earnings using individual-level labor force
surveys in the Malagasy capital (Antananarivo), and De Hoyos et al.(2012), for Honduras, is one
of the rare studies to look at the effects of SEZs on total household income poverty. For
example, Cling et al. (2005) find that, in the 1995-2001 period, firms in the Malagasy Zone
Franche offered wages as high as the formal private sector ones, while employees’ working
conditions were in general more generous (with the exception of working hours).2 The
econometric study of De Hoyos et al. (2012) also shows for Honduras that workers in the
maquila sector earned higher wages between 1991 and 2006 and the authors evaluate, through a
partial equilibrium simulation exercise, that poverty would have been higher without the maquila
sector.
Depending on the set of characteristics and the environment of each SEZ, the consequences for
poverty and inequality at a local or regional level can be very different.3 For example, the type of
activities promoted and their links with the local economy matter. Consequently, the role of
SEZs in poverty alleviation and, more generally, in income distribution changes still calls for
clarification and an in-depth analysis of each specific case, and in the end, remains an empirical
issue. Our aim is to contribute to the literature by analyzing poverty and inequality changes in the
Free Trade Zone of Manaus (FTZM) and, more generally, in the Brazilian state of Amazonas in
the past decade.
The FTZM in Brazil is an interesting case study to analyze the impact of SEZs on distributional
outcomes. First, the creation of the FTZM, in the center of the Amazon Forest, was designed
from the outset to contribute to the economic and social development of the Amazon Region,
2 In a subsequent study, Cling et al. (2009) show that the end of the Multifibre Arrangement had, the following years, a negative impact on wages and working conditions in the Zone Franche. 3 For a review on the theoretical approaches describing the effects of SEZs on different outcomes, see Aggarwal (2012).

4
one of the poorest regions in Brazil4, and to step up its political integration into the rest of the
country. The municipality of Manaus is an isolated enclave where the only means of
transportation are the Amazon River and airplane. Despite these problems with transport and
market access (local, regional, domestic and foreign), the creation of the FTZM prompted the
development of an important industrial hub in Manaus that has posted particularly good
economic outcomes over the last decade. By way of illustration, between 2000 and 2010, gross
domestic product in Manaus posted high levels of growth (4.4% on an annual average basis),
resulting in major job creations.5 As of 2010, the manufacturing sector represented a higher share
of employment in the municipality of Manaus than the average for Brazil as a whole and even for
Brazil’s urban areas only.6 Defenders of the FTZM argue that this economic boom generated
economic gains as well as positive environmental and social effects. However, if the FTZM’s
good economic performance can be related to particularly relevant improvements in poverty and
inequality indicators in the municipality of Manaus, and more widely in the poor state of
Amazonas, still needs to be documented.7
This study uses micro-decomposition methods to identify and quantify the relevant factors that
account for observed changes in income poverty and inequality from 2000 to 2010 in the
municipality of Manaus, where the Free Trade Zone is established, and in the rest of the
Amazonas state, based on a series of counterfactual simulations. As we will see, the FTZM is a
rather unique experience in Brazil, with a complex and evolving system of taxes and incentives,
and the implementation of alternative evaluation methods (such as experimental or cost-benefit
analysis) are problematic. In our case, we use two micro-decomposition approaches that have
been recently employed in the analysis and comparison of poverty and inequality dynamics in
developing and emerging countries, in particular in Latin American countries (Azevedo et al.
2013b; Inchauste et al. 2014). The first methodology is a Shapley-Shorrocks estimate of the
standard Datt-Ravallion (1992) decomposition method, which sets out to assess the intricate
4According to the Institute of Applied Economic Research Poverty Series (see www.ipeadata.gov.br), high levels of poverty are historically encountered mostly in the Northeast and North. Taking their longest time series available (which uses a poverty line based on an estimation of basic needs in terms of calorie intake), the proportion of poor in 1976 was estimated as 62% in the Northeast and 42% in the North (with values ranging from 32% to 20% in the other regions). In 2011, poverty numbers fell, but rankings across the regions remained almost the same: 28% in the Northeast, 25% in the North and around 7% elsewhere (IPEA, 2015). 5 GDP growth in the municipality of Manaus, and even that observed at the level of the state of Amazonas (5.3%), was higher on average than the growth observed in Brazil (3.6%) in the 2000-2010 decade. 6 In 2010, this share stood at 17% in Manaus, compared to 14.3% in Brazil as a whole and 15.2% in urban Brazil. 7 Figures A1 and A2 in the appendix present the poverty and inequality maps for Brazil for 2001 and 2011 (see also, for example, Ferreira de Souza, 2012), and show how the country saw not only a sharp reduction in poverty rates in the past decade, but also - for the first time in decades - a steady decline in income inequality. Note, however, that the lack of coverage of rural areas in the Northern region in the Brazilian household surveys through to 2003 (see Section 3.1) have edged out these areas from these figures and most studies on poverty and inequality in Brazil.
5
relationship between poverty, economic growth and inequality by breaking down changes in
poverty into the two main poverty reduction mechanisms: growth and redistribution
components. Our second decomposition method seeks to gauge which income sources and
household characteristics make large contributions to changes in poverty and/or inequality. We
use the Azevedo et al. (2012a and 2012b) recently developed Shapley-value decomposition, which
builds on the Barros et al. (2006) method, to quantify contributions to distributional changes due
to changes in demographics, employment, labor income and non-labor income. Though these
decomposition methods are an accounting exercise and do not prove causality, understanding the
relative importance of the proximate determinants considered in our analysis can inform
discussions on the potential particularities of Manaus within the region and the country as well as
the role that different types of public policies may have effectively played in the area’s poverty
and inequality dynamics. These accounting methods are thus applied separately to the
municipality of Manaus and the rest of the state of Amazonas, but also to total and urban Brazil
samples to view our results from a country perspective.
This paper is organized as follows. Section 2 gives an overview of the FTZM regime, its
characteristics and its economic performance in the last decade. Section 3 describes the data,
samples and variables used (subsection 3.1) and provides some summary statistics (subsection
3.2). Section 4 presents our two decomposition methods and Section 5 summarizes the
decomposition results. Lastly, Section 6 concludes.
2. THE FREE TRADE ZONE OF MANAUS (FTZM)
The Free Trade Zone of Manaus (FTZM) was established in 1967, although the issue of the
Amazon Region’s economic development and political integration had been on Brazil’s official
agenda for a long time.8 Following the collapse of the rubber-based economy in the early
twentieth century, many government measures were adopted to create incentives and enhance the
8 The WTO (2013) states that, “Brazilian legislation defines free-trade zones (FTZ), for imports and exports, as zones created to promote the development and regional integration of border areas in the north region, for which they are granted fiscal incentives” (p.92). Eight FTZs have been created (Manaus and Tabatinga, in Amazonas; Macapá/Santana in Amapá, Brasiléia and Cruzeiro do Sul in Acre; Boa Vista and Bonfim in Roraima; and Guajará-Mirim, in Rondônia). However, the Manaus Free Trade Zone is the only one engaged in production operations, while the others are free ports for the import and export of goods involved only in trade operations. Twenty-four export-processing zone (EPZ) projects with a specific legal framework had also been approved as of December 2012. However, none had yet started operations (WTO, 2013).

6
region’s development, suffering as it was from a lack of economic buoyancy, poverty and
geostrategic handicaps.9
Decree-Law No. 288 of February 1967 created “an area of free trade of imports and exports and
special tax incentives, established with the purpose of creating an industrial, commercial,
agricultural and livestock center” in the Amazon region, with a government agency - the
Superintendent of the Manaus Free Trade Zone (SUFRAMA) – responsible for the
implementation of the incentive schemes.10 Since its creation, the FTZM has nevertheless
undergone a number of economic, legal and institutional changes following changes to the
government’s development strategy. In the 1970s, for example, the objective of deepening
Brazilian industrialization (with an import substitution strategy) prompted stricter restrictions on
imports in the FTZM to encourage the emergence of local industry. The industrial hub gradually
flourished as wholesale and retail trade activities declined. In the 1990s, Brazilian trade
liberalization measures reduced import restrictions nation-wide, especially in the FTZM where a
system of federal incentives with counterparts was also implemented (firms applying for these
benefits had to comply with some minimum requirements in terms of tasks, number of jobs and
investment in R&D).11 Since the 1990s, only minor changes have been made to FTZM policies,
such as firms’ contributions to public R&D funds in the Amazon region.
Consequently, the FTZM is now a “fiscal incentive area” (Garcia, 2009), and its fiscal benefits
were recently extended through to 2073 by an amendment to the Brazilian Constitution.12 The
main incentives granted to firms in the industrial hub in the 2000-2010 decade were federal, state
and local tax breaks and exemptions.13 Firms in the FTZM also have the benefit of infrastructure.
9 Article 199 of the Federal Constitution of 1946 already stipulates the obligation to invest for the execution of the Economic Recovery Plan for the Amazon region (Plano de Valorização Econômica da Amazonia). 10 Note that a first FTZM was created by law (No. 3173, 1957) back in in 1957, with a trading zone and a warehouse. However, Sá (1996) finds that poor fiscal incentives and the small geographical area involved (less than 200 ha) failed to create the expected economic boost in the Amazon area. The 1967 Decree-Law amended the initial 1957 Law, implementing the new FTZM format. 11 Launched in 1991, the “Basic Productive Process” program (Processo Produtivo Básico or PPB) grants tax reductions or exemptions for all products (except arms and munitions, alcoholic beverages,.. See art.3º, Decree-Law 288/1967 for a complete list) to companies that set up a manufacturing process for these products in the FTZM. The PPB scheme is used for the FTZM and the special tax regime that applies to information technology (IT Law, 2001 and 2004). 12 A first extension of FTZM incentives was granted in 2003 through to 2023, with the second extension in 2014 through to 2073. 13 The main measures in the system of FTZM fiscal incentives were: (i) 88% reduction of or exemption from import duties on inputs (depending on the product’s final destination) and total exemption for capital goods, (ii) a 75% reduction on corporate tax (Imposto de Renda sobre Pessoa Jurídica - IRPJ), (iii) exemption from federal tax on industrial products (Imposto sobre produtos industriais - IPI), (iv) exemption from or reduction of a number of social contributions (such as PIS/PASEP and COFINS, which are employers’ contributions based on sales), (v); a 55% to 100% reduction on the state tax on value-added (ICMS – Imposto sobre a Circulação de Mercadorias e

7
An important feature that differentiates the FTZM from many SEZs around the world is the fact
that it imports many inputs from abroad to sell most of its output to the domestic market. As
pointed out by Siroën and Yücer (2014), the FTZM is more of an import processing zone than
an export processing zone, which is the more usual type of SEZ. In the 2000-2010 decade,
around 50% of inputs were imported from foreign markets and more than 90% of sales were
made either to other Brazilian states (the majority) or to the rest of Amazonas.14 Consequently,
the FTZM’s external trade balance showed an increasing deficit15 while its internal trade balance
posted a growing surplus.
The fiscal incentive policies have created a thriving industrial center in Manaus, with a growing
share of this Amazonian industry in national production. The Annual Industrial Survey by the
Brazilian Census Bureau (PIA/IBGE) reports that the share of the state of Amazonas (the
survey’s smallest geographical unit) in Brazilian manufacturing production reached 3.7% in 2010
(while Manaus accounts for just 0.9% of the Brazilian population).16 After a decade of high
growth, Amazonas’ manufacturing production had grown by a factor of 3.4, with an annual
average growth rate of 13% (see Figure 1a). SUFRAMA data on the firms set up in the FTZM
present a similar pattern of growth in the FTZM’s sales, also posting average annual growth of
13% between 2000 and 2010 (compared with -2% from 1995 to 2000). This economic buoyancy
drove a huge wave of job creations (see Figure 1b). In the state of Amazonas, manufacturing
employment almost doubled between 2000 and 2010: PIA/IBGE data show that the number of
workers in formal manufacturing industries grew from 59,586 to 116,503 over the period - a 96%
increase soaring above Brazil’s average 50%. In the FTZM specifically (SUFRAMA data), the
number of employees rose from 50,005 in 2000 to 103,673 in 2010 (+107%). In the same time
period, the number of firms rose from 307 to 431 (on an annual average basis) while the structure
of the FTZM industries remained highly concentrated.
Serviços, Brazilian VAT) for industrial goods, and (vi) exemption from local taxes on real estate (Imposto sobre a Propriedade Territorial Urbana - IPTU). This last exemption applied only to firms with more than 500 employees and was phased out in 2008. 14 In 2010, the five main countries from which the FTZM imported were: China, South Korea, Japan, US and Taiwan. The five main export partners were: Argentina, Colombia, Venezuela, US and Mexico. In 2000, the five main export countries were the same. The import countries were: Japan, US, Korea, China and Malaysia (SECEX data). 15 Even after stated efforts to increase the region’s exports in the 1990s, exports remained very low. The average share of exports in total sales was 6.3% over the decade (2000-2010) with its highest level of 12% attained in 2003. The ratio of imports to total purchases started growing in 2004 and stood at 60% by 2012 (SUFRAMA data). 16 Almost all the formal manufacturing activities covered by PIA/IBGE in the state of Amazonas are concentrated in the FTZM.
8
One explanation of the FTZM’s dynamism in the 2000-2010 period is its production
specialization in durable goods for the domestic market.17 Throughout the last decade, Brazilian
GDP growth was driven strongly by rising household consumption and growing investment. The
growth in household consumption is linked both to an increase in household income (labor
earnings along with pensions and social transfers) and a boom in consumer credit (IPEA, 2010).
Household income growth together with the upturn in credit gave low-income families the
means to buy durable goods. Motorcycles and electronic devices, the FTZM’s main industrial
sectors, largely benefited from this increase in domestic demand. Among other factors, Machado
and Sá (2012) also underline the positive impact on business expectations of the stated time
extensions of the FTZM incentives and some improvements to the fiscal incentive system that
stimulated the development of the production of intermediate goods in the area.
The FTZM’s costs and benefits are the subject of long-standing ongoing debate among Brazilian
economists. FTZM detractors talk about the cost of the tax incentives and the allegedly poor
competitiveness of the goods produced in the FTZM. Defenders of the FTZM argue that it
generates economic gains as well as positive social and environmental effects, because industrial
activities add up to less deforestation and predatory vegetal extraction.18 The success of a SEZ
and its effect on the economic development of a region also depend on its backward and forward
linkages with the rest of the regional economy. On average for the 2000-2010 decade, 52% of
inputs were imported from abroad, 28% produced by “regional firms”19 and 20% by companies
in the rest of the country.20 Sá (2015) believes that the FTZM’s regional linkages might still be too
weak considering policymakers’ expectations and should therefore be strengthened. However, the
FTZM does have linkages with local and national suppliers albeit with regional differences.21
In a move to gauge how the FTZM’s good economic performance in the past decade may have
helped improve social outcomes in the area and see if wider regional effects are in play, we
17 Electronics (basically consumer electronic goods), computers, two-wheelers and beverages are the FTZM’s main sectors. In 2010, the state of Amazonas’ computer and electronics industries represented 40.5% of Brazilian gross output (compared with 39.9% for São Paulo). In addition, the FTZM became the main producer of two-wheelers in the country in the 2000-2010 period. 18 For more details on this argument, see Rivas et al (2009). 19
SUFRAMA publishes statistics on the origin of intermediate goods differentiating between regional, national and foreign markets. Regional inputs are those bought either in the FTZM itself or in the other Amazonian regions whose incentives are administered by SUFRAMA (see footnote 7 on Brazilian FTZs). 20 Average sales for the 2000-2010 decade show that 75% of FTZM goods were produced for the domestic market, 18% for the region and only 7% were exported. 21 A total of 79.3% of electronics inputs came from abroad in 2010, while most two-wheeler inputs were “regional” (44.3% of inputs were produced in the FTZM or the region, 30.3 % in the rest of the country). Other sectors – like optical products and industries intensive in natural resources (paper and metallurgy) – import most of their inputs from the rest of the country.

9
present all our descriptive statistics and decomposition results separately for the municipality of
Manaus and the rest of the state of Amazonas, with urban and total Brazil samples used as a
benchmark.
3. DATA AND DESCRIPTIVE STATISTICS
3.1. The data
The usual data source in Brazilian income poverty and inequality studies is the Pesquisa National
por Amostra dos Domicilios (PNAD), a well-known Brazilian household survey conducted
annually by the Brazilian Census Bureau. This survey has detailed data on income and its sources
and now boasts both national and Federation Unit representativeness. However, two important
limitations made it unsuitable for our study: (i) its representativeness and coverage do not extend
to below state level, and (ii) prior to 2003, the sample excluded rural areas in six Federation Units
(including the Amazon region, and it was not until 2004 that the PNAD achieved total national
coverage).22 So in order to focus on Manaus and remain representative at the municipality level,
we turned to census data. In this paper, we use the two most recent Brazilian Population Census
datasets for the years 2000 and 2010.23 Census data are collected every ten years in Brazil and
cover the entire population. A detailed questionnaire (questionario da amostra) including household
and individual information on socio-economic variables is administered to a census sample of
around 11% of the Brazilian population in such a way as to maintain population
representativeness at the municipality level.24
The variable used in this study to compute poverty and inequality measures over the 2000-2010
period is total monthly household income per capita, expressed in 2010 Brazilian Reais (deflated
using the national price index). A major issue when estimating income poverty and inequality
indicators is the quality of income data, which usually includes measurement errors and outliers,
often more prevalent at the two tails of the distribution. A common practice is to simply trim a
22 The rural areas not covered previously by the PNAD are in the states of Acre, Amapá, Amazonas, Pará, Rondônia and Roraima. 23 Our focus on the 2000-2010 decade is not without reason. First of all, it allows us to concentrate on a period where the overall Brazilian extensive trade liberalization reform had already taken place, and economic and distributional indicators seem to have generally improved, which permits to better understand and isolate the relative effect of the FTZM. Moreover, the definition of period of activity for income variables changed in the last two census datasets, and proper comparisons with previous census years is troublesome. 24 Basically, this detailed questionnaire is put to a sample of 10% of households in municipalities with more than 15,000 inhabitants, and to a sample of 20% of households in municipalities with up to 15,000 inhabitants.

10
certain number or percentage of observations at the top and bottom of the income distribution.25
In our case, we decided to use additional Census information on households’ non-monetary
welfare conditions and essentially exclude from the top and bottom income quintiles those
households that declared inconsistent information on asset holdings. Basically, we excluded from
our sample those households in the top income quintile that said they had no electric lighting or
water supply problems (i.e. no municipal supply or water well in the household), a type of
dwelling other than a house, flat or room (i.e. makeshift, collective, etc.), no toilet in the
household, or no more than one asset on the following list: refrigerator, washing machine, phone
line, computer, television, car. Observations of monthly household per capita income over R$
100,000 were also excluded from the sample. From the bottom income quintile, we excluded
those households that said they had all the assets in the above list and those with a household
head declaring more than 14 years of schooling.26 Also, as is usual, households with missing
information on variables were dropped from this study. All in all, data cleaning eliminated about
10% of the sample. Yet since we use Census data, our final sample sizes are still very large. For
Manaus, we have some 131,000 observations (representing around 1.3 million individuals) in
2000 and around 77,000 observations (representing around 1.6 million individuals) in 2010. For
the rest of the state of Amazonas, our sample sizes are respectively approximately 150,000
observations (representing 1.2 million individuals) in 2000 and 192,000 observations
(representing 1.5 million individuals) in 2010. For urban Brazil, we have 13.6 million observations
(representing 122.5 million individuals) in 2000 and 14.7 million observations (representing 148.4
million individuals) in 2010. Lastly, for Brazil, the samples cover 18.1 million observations
(representing 151.5 million individuals) in 2000 and 19.3 million observations (representing 176.9
million individuals) in 2010.
Given that we are interested in understanding which factors contribute to changes in poverty and
inequality, our decomposition exercises differentiate, among others, between labor and non-labor
income sources. Labor income is defined here as the proportion of total monthly household
income per capita earned from all household members’ jobs. Non-labor income covers
retirement, pensions, rents, social transfers, unemployment insurance and others. Note that
25 For example, Hoffmann and Ney (2008) make inequality comparisons using data from the 2000 Census as well as the PNAD and the National Accounts. In their study, they conclude that the proportion of households declaring zero income in the Census is suspiciously larger than in the PNAD. They also report some very extreme income values at the very top. They end up trimming all zero incomes as well as observations with household incomes over R$ 30,000 in 2000 Brazilian Reais. 26 We believe that excluding zero incomes from our analysis could misrepresent rural areas in the Amazon region. But as a robustness test, we also computed all our results eliminating all zero incomes and setting a lower top income threshold (R$ 50,000 in 2010 Brazilian Reais), as found in some other studies on Brazil. All our main conclusions remain unchanged.

11
although the 2000 Census specified the income quantities corresponding to different non-labor
income sources, the 2010 Census database only provides a constructed aggregate for total non-
labor income. Thus, the distinction between labor and non-labor income sources is the only one
that we can fully identify at the municipality level between 2000 and 2010.27
3.2. Descriptive statistics
Table 1 reports on the descriptive statistics for the poverty and inequality indicators in 2000 and
2010, as well as for the mean household per capita income levels.28 Two poverty thresholds are
used to measure poverty: a R$ 70 line that we consider captures extreme poverty; and a R$ 140
line to include more moderate poverty in our numbers.29 Two poverty and two inequality
indicators are presented: the headcount ratio and the poverty gap index (which places more
weight on the poorest households), the Gini index and the Theil T measure. We differentiate
between the municipality of Manaus and the rest of the state of Amazonas (RAM hereafter), and
present total Brazil and urban Brazil as benchmarks.
As expected, poverty decreased in the four areas considered between 2000 and 2010, irrespective
of the poverty threshold or indicator used. Poverty levels (and changes) in the municipality of
Manaus are very close to the average Brazilian situation (so still worse off than in urban Brazil).
In the RAM, where urban areas accounted for just 51% of the population in 2000 and 58% in
2010 (compared to 99% for the metropolitan area of Manaus), poverty levels were three times
higher (or more) in 2010 than in the state capital of Manaus (irrespective of the poverty line or
indicator used). In percentage points, poverty reductions were lower in the RAM with the
exception of extreme poverty when considering the poverty gap index (with a decrease of 22.4%
compared to 18.7% in Manaus).
Turning to inequality, Gini and Theil index decreases are again observed everywhere, though they
are smaller in Manaus and in the RAM than at the national level (urban and total Brazil). This
27 Studies at the country level based on the Brazilian household survey (PNAD) can actually disentangle the different non-labor income sources, but as explained and unlike the Census data, the PNAD is not representative of the municipalities. 28 Mean hourly wages are also reported for workers aged 15-65 earning positive income from their main job in the survey’s reference week. 29 Though Brazil does not have an official poverty line, ad-hoc administrative poverty lines of R$ 70 and R$ 140 can be used respectively for extreme poverty and poverty. They correspond to the 2009 values used to define the monetary benefits for the Brazilian main cash assistance program, Bolsa Familia.

12
implies that whereas the municipality of Manaus had a slightly less unequal income distribution
than the average observed in Brazil in 2000, it was slightly more unequal in 2010.
In terms of average income (and wage) levels, the municipality of Manaus posted a sharp rise in
the last decade (a 38% increase in both mean monthly per capita income and mean hourly
wages). This performance outweighs – by far for hourly wages - the already good results for
urban Brazil (respectively 33% and 23%). Although household income levels were still lower in
Manaus than the Brazilian averages (urban and total), workers were being relatively better paid in
Manaus (with hourly wages averaging at R$ 10) than in urban Brazil (respectively at R$ 9.1) by
2010. In the RAM, mean household per capita income weighed in at just 27% of the Brazilian
average in 2000. Although the situation had improved by 2010 (at 32% of the Brazilian average),
income (and wage) levels remained strikingly low.
The Census also enables us to look at non-monetary aspects of poverty since it provides
information on households’ living conditions. Table A1 in the Appendix shows how the
population of the RAM suffers from much worse living conditions in addition to higher income
poverty levels. For example, the percentage of the population with access to a municipal water
supply in the RAM still stood at less than 50% (more than 75% in Manaus) in 2010. Regarding
sanitation facilities, over 80% of the population in the RAM had access to neither a public
network nor a septic tank (less than 40% in Manaus). In terms of household assets, 37.8% of the
population in the RAM (2.9% in Manaus) had just one or none of the following household assets:
refrigerator, washing machine, phone line, computer, TV and car.
Tables A2 and A3 in the Appendix report major population differences, both for the total
population and for workers, between the municipality of Manaus and the RAM (again with
country averages included as a benchmark). For example, levels of education in the RAM were
much lower than in Manaus (still at 3.8 versus 6.2 years of schooling in 2010) and household
sizes and numbers of children per household were larger (2.8 children on average in the RAM
versus 1.6 in Manaus in 2010). Nonetheless, migration from the RAM to the municipality of
Manaus or across states is remarkably low and only increased slightly by about 3% in the 2000-
2010 decade. The sector-based structure of employment finds the weight of agriculture, forestry
and fishing activities in the RAM to be 30% in 2010, while the manufacturing sector represented
less than 6% (compared to 17% in Manaus). Throughout the decade, approximately one quarter
13
of workers had access to a formal job30 in the RAM, whereas numbers climbed to more than 50%
in Manaus.31
To sum up, although poverty and inequality indicators fell everywhere in the 2000-2010 decade,
income distribution levels and trends differed between Manaus and the RAM. Manaus generally
posted better indicators close to the average situation for Brazil and even sometimes for urban
Brazil, while the RAM remained poor with high inequality.
4. DECOMPOSITION METHODS
Our first step to better understand the links between the economic performance of the area
where the FTZM is established and observed changes in poverty and inequality indicators, is to
perform a Shapley-Shorrocks estimate of the standard Datt-Ravallion (1992) poverty
decomposition into growth and redistribution components. Although there is little doubt that
economic growth contributes to poverty reduction,32 initial conditions (in terms of economic
development or inequality levels) and growth patterns (i.e. the sector and/or geographic
composition of economic activity) are usually behind the observed heterogeneity in the poverty-
growth relationship. Our aim is to explore if the state of Amazonas (both Manaus and the rest of
the state) presents particularities compared to Brazil.33
Let the level of poverty at period t be written as a function 𝑃𝑡 = 𝑃(𝑧𝑡, 𝜇𝑡, 𝐿𝑡 ), where 𝑧𝑡 is the
poverty line, 𝜇𝑡 is the mean income and 𝐿𝑡 is the associated Lorenz curve, at date t, representing
distributional inequality. Holding the poverty line constant over time, the overall change in
poverty from the base period to the end period is equal to
∆𝑃 = 𝑃(𝜇1, 𝐿1) − 𝑃(𝜇0, 𝐿0 ),
30 Our definition of formal workers corresponds to private and public employees with a registered or signed contract (“assinada carteira de trabalho”) as required by Brazilian law, the military and civil servants, and employers and own-account workers with social security coverage. 31 Formalization in Manaus (from 53% in 2000 to 61% in 2010) displays the same growth pattern as the national trend over the decade (from 53% to 62% for Brazil). 32A partial list of contributions include cross-country studies such as the World Bank (1990, 2000), Ravallion and Chen (1997), Datt and Ravallion (2002), Dollar and Kray (2002). Recent evidence on Latin America or, more specifically, Brazil includes Menezes-Filho and Vasconcellos (2006) and Inchauste et al. (2014). 33 See, for example, Bourguignon (2003), Headey (2008), Loayza and Raddatz (2010) and Ferreira et al. (2010).
14
The Datt-Ravallion(1992) method measures, in a ceteris paribus strategy, how much of observed
poverty changes can be attributed to changes in income growth and how much to changes along
the income distribution, respectively known as the growth and redistribution effects, and
represented below:
Growth effect = ∆𝜇 = 𝑃(𝜇1, 𝐿0) − 𝑃(𝜇0, 𝐿0 )
Redistribution effect = ∆𝐿 = 𝑃(𝜇0, 𝐿1) − 𝑃(𝜇0, 𝐿0 )
Note that these expressions are counterfactual outcomes. In order to amount to observed
poverty changes, they need to include a third argument, the residual, interpreted as an interaction
effect between the growth and redistribution components. Additionally, different decompositions
are possible depending on the period of reference (or path) taken, and no particular one is
preferable a priori. In order to deal with these concerns, Shorrocks (1999) proposed, and
Kolenikov and Shorrocks (2005) empirically implemented the Shapley approach, deriving a single
decomposition value that is always accurate (i.e. includes no residual) and treats all possible routes
symmetrically. In this paper, we calculate this Shapley-Shorrocks estimate for each component of
the Datt-Ravallion decomposition using an algorithm proposed by Azevedo et al. (2012b).
The second decomposition method we apply in this paper generates entire counterfactual income
distributions and quantifies the contributions that changes in demographics, employment, labor
and non-labor income sources may have made to observed poverty and inequality changes.
Following the methodology proposed by Azevedo et al. (2012a), which builds on previous work
by Barros et al. (2006), we decompose the contributions of different household income factors to
observed distributional changes by simulating the distribution of monthly total household per
capita income, changing only one income component at a time and keeping everything else
constant.
In concrete terms, we begin by modelling household per capita income (𝑦𝑝𝑐) as the sum of
individual income sources 𝑦𝑖 divided by the number of household members 𝑛.
𝑦𝑝𝑐 =1
𝑛∑ 𝑦𝑖
𝑛
𝑖=1
15
If we assume that only individuals older than 15 years old contribute to household income,34 and
if we capture labor (𝑦𝐿) and non-labor (𝑦𝑁𝐿) income sources separately, we can write per capita
household income as:
𝑦𝑝𝑐 =𝑛𝐴
𝑛(
1
𝑛𝐴∑ 𝑦𝑖
𝐿𝑛
𝑖=1+
1
𝑛𝐴∑ 𝑦𝑖
𝑁𝐿𝑛
𝑖=1)
where 𝑛𝐴 is the number of adults (as of 15 years old) in the household. Since not all adults work
in a household, we can go one step further and differentiate the number of employed (𝑛𝐸) adults
from those unemployed or inactive in the household such that our final decomposition reads:
𝑦𝑝𝑐 =𝑛𝐴
𝑛(
𝑛𝐸
𝑛𝐴(
1
𝑛𝐸∑ 𝑦𝑖
𝐿𝑛
𝑖=1) +
1
𝑛𝐴∑ 𝑦𝑖
𝑁𝐿𝑛
𝑖=1)
This equation enables us to decompose income changes into changes in two demographic
components – the share of adults in the household and the share of the occupied adults – and
two income components – the contribution of labor income per occupied adult and the
contribution of non-labor income per adult. The decomposition method consists in constructing
counterfactual distributions by substituting the observed distribution for each component in one
period, one at a time, until we attain a complete change from that period to the next. For each
counterfactual distribution, poverty (or inequality) measures are computed and interpreted as the
level of poverty (or inequality) that would have prevailed in the absence of a change in that
indicator. Note that since sample sizes may differ from one period to the next, a rank rescaling
procedure is applied between the two periods. In addition, since results are again sensitive to the
order in which effects are calculated (by component and over time), a Shapley value rule is also
implemented here and decompositions calculated across all possible paths to present average
results for each component (for more details on the decomposition method, see Azevedo et al.
2012a).
In order to capture what happened in the Free Trade Zone of Manaus and place our results in a
country perspective, all estimations are again repeated separately for the municipality of Manaus,
for the rest of the state of Amazonas (RAM) and for urban Brazil and Brazil as a whole. Our
decomposition results are described in the next section.
34 Although the Brazilian Census surveys ask all household members from 10 years old up about earnings, given that schooling in Brazil is compulsory until 14 years old, we fixed the bottom age threshold of our sample at 15.

16
5. DECOMPOSITION RESULTS
5.1. Decomposition Analysis into Growth and Redistribution Components
The Shapley-Shorrocks estimate of the Datt-Ravallion (1992) decomposition quantifying the
relative contributions of (distribution-neutral) growth versus redistribution to changes in poverty
is performed using the headcount ratio and the poverty gap index, and using our two poverty
thresholds (R$ 70 and R$ 140). Findings are reported in Table 2.35 Between 2000 and 2010, we
find that growth explains a slightly larger part of the observed reduction in poverty (R$ 140) in
Brazil; that is, if the Lorenz curve had remained constant over the decade, the poverty indexes
would have decreased by approximately 54% due solely to growth in mean incomes over the
period.36 When we focus on extreme poverty (poverty line fixed at R$ 70), the relative importance
of the growth component generally drops in Brazil (down to values of 50% of the total change
based on the headcount ratio). This decrease is larger when we focus on urban areas of Brazil
only (from 54% down to values of 48 %).37 In Manaus, where the reduction in inequality was less
significant over the decade, changes in poverty over the same time period are essentially
explained by the growth component, irrespective of which poverty indicator or threshold is used
(the growth percentage contribution ranges from 56% to 63%). In the RAM, where inequality
levels are more persistent and still very high in 2010, the observed reductions in poverty over the
decade are clearly the result of distribution-neutral growth.
To conclude, our findings from the above decomposition show that, over this decade of
particularly good economic performance, especially in the FTZM, growth played an important
role in the observed poverty changes in the Amazonas state (not exclusively in the municipal area
of Manaus). The role of redistribution, though similar to the growth component in Brazil, seems
to have counted less in RAM and Manaus. If most of the poverty reduction observed in Manaus
and the RAM in this past decade was the result of mean income growth, the obvious question
35
Table A4 in the Appendix presents decomposition results eliminating all zero incomes as a robustness test, and all our main conclusions remain unchanged. 36 This result of growth as the slightly larger contributor to poverty reduction is in line with what is found by Inchauste et al. (2014) for Brazil using PNAD data for the similar 2001-2009 period (note that they use different international poverty lines, in PPP dollars, in order to draw up international comparisons). In their study (Figure 3.2 on page 45), Brazil appears as one of the three Latin American countries where the growth component contributes the least to poverty reduction (only Argentina and Paraguay display lower contributions of growth to poverty reduction over the decade). 37 The reduction is less pronounced for the poverty gap index.
17
that arises is how household per capita income growth reduced poverty and which particularities
can be found for the FTZM area.
5.2. Decomposition Analysis into Demographics and Income Components
Our second decomposition exercise provides a better understanding of the factors behind
poverty and inequality reductions. At least three factors could have influenced poverty and
inequality declines: demographic changes (particularly the share of adults per household); growth
in labor income (either because more people are employed or because their earnings have
increased), and growth in non-labor income (in the form of public or private transfers or possibly
savings patterns).
Before presenting our decomposition results, Table 3 shows descriptive statistics on the changes
in these factor components for the entire population as well as for the poor and extremely poor
to make it easier to understand our decomposition exercise. Over the 2000-2010 decade, the
average number of hours worked decreased everywhere (Manaus, RAM, urban and total Brazil),
for the whole population as well as for poor households. This change, together with the observed
overall increase in hourly wages, captures the economy-wide improvement in working conditions
in the country.38 Note that, whereas the average number of hours worked was higher in Manaus
than in Brazil in 2000 (looking at both urban and total samples), this was no longer the case in
2010.39 Over the same time period, the share of adults per household increased everywhere.
Indeed Brazil has been experiencing a typical demographic transition in recent decades, with
sustained declines in mortality rates since the 1940s and fertility falling sharply at a much faster
rate than mortality since the late 1960s (see, for example, Gragnolati et al., 2011).40 As expected in
such a large and heterogeneous country, demographic indicators in Brazil vary considerably
across geographic areas. Here we see that both Manaus and the RAM have lower shares of adults
per household than found in the national figures. When we focus on the poor or when figures
include rural areas (total Brazil compared to urban Brazil; the RAM compared to Manaus), the
relative number of adults in the household is smaller. The share of occupied adults in the
household increased over the 2000-2010 decade for the entire population and in all areas
38 Brazil’s labor market performed well in the 2000s, with strong rates of job creation and formal job growth outpacing informal job growth by a three-to-one ratio (see below and, among others, Berg, 2010). 39 Although the general decrease in the number of hours worked can be linked to a positive reading of increased formality and improved working conditions, the fact that the lowest work duration is found among the extreme poor in all samples may reveal some barriers to employment opportunities for certain disadvantaged population groups. 40 Note that although Brazil is in an advanced phase of demographic transition (compared to other Latin American countries), it is still a relatively young country compared to OECD countries (Gragnolati et al., 2011).
18
considered, but converse trends appear when only the poor are considered (irrespective of
whether we look at households with an income per capita under R$ 70 or R$ 140). In terms of
levels, the situation in Manaus is close to the Brazilian average while the share of occupied adults
in the household is much smaller in the RAM.41
Table 4 displays the results of our decomposition into demographic and income components for
poverty measures and Table 5 for inequality measures. We present the respective contributions of
demographics, employment, labor income and non-labor income factors to observed reductions
in poverty and inequality in the municipality of Manaus, in the RAM, and in urban and total
Brazil.42 We will first present the results common to all areas. Then we will identify particularities
in the area of Manaus that could point to the influence of the FTZM and the existence (or
absence) of spillover effects in the rest of the state of Amazonas.
First of all, the demographic transition that started in Brazil in past decades and continued over
the 2000-2010 period, with rises in the share of the working-age population and the elderly,
contributed everywhere to a reduction in poverty, irrespective of the poverty measure or
threshold used (Table 4), as it did to inequality declines (Table 5). With respect to the poverty
decompositions, the RAM, which includes many rural municipalities, is where demographics
plays a greater role (shares increasing 16.5% to 21.3%), while the share of adults per household
accounts for up to 14% in Manaus. When it comes to reductions in inequality, however, the
demographic transition has the greatest impact in Manaus, not in the RAM. Yet differences are
less marked within the state.
When we focus on the role played by the share of occupied adults per household, we obtain
mixed results in both poverty and inequality. Looking at the poverty decompositions (Table 4),
although the share of working adults per household declined among the poor in all our samples
over the decade (Table 3), this change had a different effect across the income distribution. The
household employment rate drop is found to have a positive impact on poverty reduction when
the higher R$ 140 threshold is used, but not necessarily when we focus on the extreme poor. This
may be interpreted as a positive effect of better labor market conditions, particularly growth in
41 Descriptive statistics in Table A2 already display lower employment rates in the RAM compared to Manaus. 42 Tables A5 and A6 present decomposition results eliminating all zero incomes as a robustness test, and all our main conclusions remain unchanged. We also run our estimations fixing the top income threshold at a lower level (R$ 5,000) and again our main conclusions remain unchanged (these estimations are available from the authors on request).

19
mean hourly wages,43 which could possibly allow young household members to stay in school and
older adults to retire. Yet this effect would only apply to those individuals closer to the higher
poverty thresholds. At lower income levels, the positive effect of employment rate decreases in
the household could actually become negative. Note that there is not a clear pattern to the
relative importance of this factor across samples, which is probably linked to this dual role across
the income distribution. Inequality decompositions, on the other hand, display a systematically
positive, albeit small, role of household employment shares in Manaus (7% to 12% using the Gini
and Theil indexes respectively), with a fairly large negative effect in the RAM (similarly, 52% to
57%). Thus, the increase in employment shares within households across the total population
(see Table 3) is a source of income inequality in the RAM whereas it slightly reduces it in Manaus.
Differential changes in the sector-based structure of employment (see Table A3) may explain
these results: for example, the share of public administration jobs (known to be among the better
paid jobs) in the RAM increased over the decade, while there the share of agricultural jobs
contracted. The sector-based employment structure is much more stable in Manaus.
Turning now to labor income, we find that growth in labor income almost always leads to a
decline in poverty. The only exception is when we look at extreme poverty using the poverty gap
index, particularly in those samples that include rural areas (the RAM and our total Brazilian
sample). The fact that the influence of labor income on poverty reduction seems to fade away for
these extremely poor populations when the poverty gap index is used (an index that
overrepresents the poorest of the poor) may be explained by the fact that the extremely poor do
not yet have full access to the Brazilian labor market and do not benefit as much from the recent
positive developments on this market at the country level.44 The impact of labor income on
poverty reduction is much greater relatively speaking in Manaus than in the three other areas
considered, irrespective of the poverty measure or threshold used (ranging from 20% for the
poverty gap to 50% of total poverty reduction based on the headcount index with the lowest R$
70 threshold). In the RAM, the greatest impact on poverty reduction by labor income reaches just
26% (again with the headcount index and the R$ 140 poverty line). In urban Brazil, it jumps as
high as 35% (again for the headcount and the R$ 140 line), a number significantly lower than
43 Note that the average number of hours worked by the poor dropped over the decade, so it is probably not due to workers working more hours. An alternative explanation might be found in the increase in social protection coverage (pensions and social transfers). Yet it is less clear why the poorest of the poor would benefit less in this case. A mix of the two factors is probably at play. 44 Lavinas (2013, p. 31) comes to a similar conclusion for Brazil: “The effects of economic growth were not as favorable to those living in extreme poverty as they had been for those classed simply as ‘poor’. The much lower levels of schooling, and the even more precarious, badly paid jobs held by the indigent, make them much less likely to benefit from upward trends in the job market.”
20
observed in Manaus. Turning now to our results for the inequality decompositions (Table 5), the
highest contributor to inequality reduction is without doubt labor income, both in Manaus and
Brazil (urban and total samples), with the highest impact of labor income again observed in the
municipality of Manaus. In the RAM, however, the non-labor income factor takes the lead in
reducing both Gini and Theil indexes.
Lastly, changes in non-labor income over the 2000-2010 decade always lead to a reduction in
poverty. The contribution of non-labor income to poverty changes is higher when poverty is
measured using the lower poverty threshold of R$ 70 or the poverty gap index. So as expected,
the relative weight of non-labor income grows when we focus on the poorest of the poor: either
by restricting our study to changes in extreme poverty (capturing households below R$ 70 per
month) rather than including households with monthly per capita incomes of between R$ 70 and
R$ 140 in our poverty numbers; or by giving the poorest of the poor more weight in our poverty
calculations by using the poverty gap index instead of the headcount ratio. Note that, although
our measure of non-labor income covers a range of heterogeneous sources (theoretically
including social transfers, pensions, capital income, etc.), the fact that our poverty
decompositions focus on the very low end of the income distribution allows us to presume the
essential role played by public transfers in this non-labor income component. In particular, we
can assume that pensions45 and the Bolsa Familia Program (BFP) – Brazil’s “flagship” conditional
cash transfer program covering 12.8 million families in 2010 despite its relatively small benefit
amounts46 – have both played a role in improving extremely poor families’ living standards.47 Our
inequality decompositions, which are not restricted to the low end of the distribution, find a
mixed role for non-labor income. Although non-labor income reduces inequality in the RAM and
in Brazil (urban and total samples), it drives up inequality in Manaus. In addition, non-labor
income plays a smaller role when only the urban sample is considered than when the entire
Brazilian population is taken into account. These mixed results may be due to the fact that the
non-labor income measure contains more capital income in urban areas.
45 Public pensions have largely benefited from growth in the minimum wage as two thirds of public pensions correspond to the minimum wage (Lavinas, 2013). 46 According to data from the Social Development Ministry (Ministerio do Desenvolvimento Social), 5.6% of the people living in the municipality of Manaus received the BFP in 2010, compared to 8% for the state of Amazonas and 6.7% in Brazil as a whole. 47 Soares (2012) reviews several studies on the impact of the BFP on poverty and inequality in Brazil: the BFP has had a growing impact on poverty reduction over time and its influence is also stronger when the intensity of poverty is taken into account. Nevertheless, although evaluations vary greatly (mainly because of studies’ methodological differences), the BFP has had a modest effect on inequality reduction. The author also underlines that the cost of the BFP - dubbed “a little big program” (p. 6) - is low considering its wide coverage, but “in spite of the improvement of welfare among those who remain poor, greater impacts on the percentage in poverty require higher benefits” (p .22).
21
The relative weight of the labor income factor in poverty and inequality reduction in emerging
and developing countries compared to other factors such as non-labor income is a subject of
recent debate. For example, Inchauste et al. (2014), using a similar time frame (2001-2009) to
ours and international poverty lines in PPP dollars48, show for a sample of 21 countries (including
Brazil) that, "The most important contributor to reductions in moderate poverty has been the
growth in labor income. In particular, among 12 of them with substantial declines in poverty,
changes in labor income and employment explain more than half of the change in poverty; in
another 6 countries, the same changes account for more than 40 percent of reduced poverty".
In the specific case of Brazil, our results are in line with recent evidence despite the fact that our
study uses census data and is therefore not strictly comparable to research based on Brazilian
household surveys. For example, Inchauste et al. (2014) find in their abovementioned study of
Brazil (using PNAD surveys) that the most important factor for poverty reduction when
measured by the lowest poverty lines (US$ 1.25 a day) is growth in non-labor income.49 It is only
when the highest poverty line is considered (US$ 4 a day) that labor income becomes the most
important contributor.. On inequality, Azevedo et al. (2013b) - using the same decomposition
technique and PNAD surveys for the 2001-2011 period - show that the contributions of labor
income and non-labor income to the Gini coefficient downturn come to 45% and 46%
respectively. Using a similar decomposition approach (despite some methodological differences)
and again PNAD surveys, Barros et al. (2010) find that decreases in inequality (measured
successively by a Gini coefficient and the ratio between the income of the richest 20 percent and
the poorest 20 percent) were due to changes in the distribution of non-labor income per adult50
in 40-50% of cases and to changes in the distribution of labor income per adult (taking the
proportion of working adults and labor income per working adult) in 31-46% of cases between
2001 and 2007. Our results on inequality in Brazil find that labor income has an even greater
influence. In addition, we find a clear distinctive pattern within the state of Amazonas: the
predominant role that labor income appears to play in Manaus contrasts with the major influence
of non-labor income in the RAM in explaining poverty and inequality dynamics. This greater
48 Inchauste et al. (2014) consider several international poverty lines, respectively US$1.25, US$2.50, US$4.00 for Brazil (the two lowest ones being the most adequate for comparisons with our two poverty lines). 49 Taking the US$ 1.25-a-day poverty line, the shares are 47.9% for non-labor income versus 44.7% for labor income based on the headcount ratio and 75.3% and 28.1% respectively using the poverty gap index. Taking the US$ 2.50-a-day poverty line, non-labor income is the most important contributor in the case of the poverty gap index (45.2% versus 41.7%), but not with the headcount ratio (31.7% versus 44.8%). 50 The authors decomposed non-labor income in seven sources: rents, interest and dividends, private transfers from non-residents, private pensions and three types of public transfers (pensions and other standard contributory social security benefits, Beneficio de Prestaçào Continuada – BPC is a transfer for people aged 65 and over and disabled –Bolsa Familia and similar programs). Public transfers explain 49% of the total reduction in inequality with the role of contributory transfers being predominant (almost 30%).
22
relative importance of labor income in the municipality of Manaus is due, at least in part, to the
FTZM’s good economic performance throughout the 2000-2010 decade.
6. CONCLUSION
The recent proliferation and wide range of SEZs in emerging and developing countries show that
these types of policies are more than just a trade openness instrument. They are part of a broader
economic development strategy to promote additional investment, scale up technology transfers,
increase employment and fight regional inequalities, among others. Although SEZs appear to
have found increasing support among developing nation governments as a means to expand and
modernize the economy, their economic effectiveness and social repercussions are the subject of
ongoing debate.
This article focuses on the Free Trade Zone of Manaus (FTZM) in Brazil to gain a better
understanding of the impact of SEZs on distributional outcomes. The FTZM is a particularly
suitable case for an analysis of the influence of a SEZ on poverty and inequality due to its
location in an isolated, poor enclave of the country. The FTZM was designed from the outset as
a regional development strategy to address the lack of economic buoyancy and harsh living
conditions in the area. Trade liberalization measures and, more generally, fiscal incentives have
now made it a dynamic industrial hub - operating as an import processing zone - in the middle of
the Amazon rainforest.
The 2000-2010 decade was a period of significant, widespread improvements in poverty and
inequality indicators in Brazil. The state of Amazonas, where the FTZM is located, was no
exception to this trend. This analysis seeks to identify the possible sets of factors behind the
reduction in poverty and inequality in the Amazonas state (with Brazil taken as a benchmark),
and investigate the role played by the FTZM. Attempts to clearly capture the FTZM’s causal
effects on welfare outcomes would call for a counterfactual of the situation without the FTZM,
which is not possible. Another option might be to use time and cross-section variations in SEZs’
establishment across municipalities.51 Unfortunately, the FTZM is a rather unique experience in
Brazil (as already mentioned the FTZM is the only one engaged in production operations in
51 See, for example, the recent Picarelli (2014) study of Nicaragua for the period from 1993 to 2009.
23
Brazil).52 However, our results based on micro-decomposition techniques and a series of
counterfactual simulations already shed some light on how the FTZM’s establishment in this
remote Amazon region has influenced poverty and inequality dynamics. In addition, we use
census data to study the municipality of Manaus, where the FTZM is established, and the rest of
the state of Amazonas separately. Comparisons of our findings in these two separate areas hint at
the extent of the FTZM’s influence and its potential spillover effects.
In the 2000-2010 decade, income growth was the most important factor behind observed poverty
changes in Amazonas state (not solely in the municipal area of Manaus). The role of
redistribution, although very similar in importance to the growth component in Brazil, seems to
have always counted less in Manaus and especially in the rest of the state of Amazonas (RAM).
Among the poverty and inequality reduction drivers, our second micro-decomposition exercise
finds that labor income plays a major role in Manaus whereas the contribution of non-labor
income is far more important in the RAM. These contrasting results illustrate both the benefits
and limitations of the FTZM’s good economic performance over the last decade.
Labor market buoyancy in the municipality of Manaus is closely linked with the FTZM’s success
driving direct and indirect job creations. Not only did the share of employed adults in households
grow, but the income gains perceived by the workers also rose while the number of hours
worked fell, evidencing an improvement in job quality. Our micro-decomposition approaches
find that these labor market developments contributed significantly to poverty and inequality
reduction in the state capital.
In the RAM, where poverty and inequality levels were still high in 2010 and considerably higher
than in Manaus, the much lower incidence of the labor income component points to problems of
weak “employability” among the poor (as already mentioned, migration across municipalities in
Amazonas state and also to other states is particularly low in this region). The spillover effects of
the FTZM in the state might be said to be limited still. However, without the FTZM, the
situation would probably have been worse, not only in terms of social outcomes, but also
possibly from an ecological point of view. For example, in a household-level interview study of
Ecuadorian Amazon migrant farmers in 1990, Murphy et al. (1997) already discuss how economic
development in small urban areas in the Amazon Rainforest Frontier could increase employment
52 Another approach would be a cost-benefit analysis. However, as pointed out by Aggarwal (2012), a real cost-benefit study requires exhaustive data on numerous parameters that are very hard to collect rigorously. In the FTZM, and Amazonas state more generally, a complex and evolving system of incentives and taxes is in place that makes this type of methodology very difficult to implement.
24
opportunities (in local government, retail sales, services and ecotourism) and how increasing such
opportunities could alleviate pressure to keep clearing the forest. More recently, comparisons of
deforestation and predatory vegetal extraction rates with other Amazonian states in Brazil rate
the state of Amazonas among the lowest ranks. This result is often put forward as an indicator of
the FTZM’s positive environmental impact since the FTZM’s attractiveness and buoyancy has
concentrated people and economic activity in the capital city of Manaus (see Rivas et al. 2012). In
addition to ecological arguments, the creation of the FTZM is also regarded as a successful
regional development strategy, contributing to the spatial decentralization of Brazilian industrial
activities (see Saboia and Kubrusly, 2015).53
While the FTZM’s spillover effects may still be limited, it is also rather bothersome to find that
non-labor income appears to contribute less to poverty reduction in the RAM than in Brazil as a
whole. We interpret this result as probable evidence of social transfer targeting problems in
remote areas of the state. Recommendations to improve social outcomes in poorer areas of the
Amazon region could include the need for training programs for the poor to improve their
“employability” and better targeting of social policies in the area.
53 In Brazil, federal and state governments and municipalities have implemented measures in past decades to attract investments and firms to regions less developed than the main urban coastal areas. The FTZM is seen as successful from this point of view (see Saboia and Kubrusly, 2015). Naturally, the FTZM’s special regime has a cost, and the recent extension of fiscal incentives through to 2073 may suggest that the federal government does not believe the region is ready for autonomous development.

25
7. REFERENCES
Aggarwal A. (2007), "Impact of Special Economic Zones on Employment, Poverty and Human Development". Working Paper No.194, Indian Council for Research on International Economic Relations. Aggarwal, A. (2012) Social and Economic Impact of SEZs in India, Oxford University Press, March. Amengual, M. and W. Milberg (2008) "Economic development and working conditions in export processing zones: A survey of trends". International Labour Office, Geneva: ILO, 72 p. Azevedo, J.P., Nguyen, M. and V. Sanfelice (2012a) ADECOMP: Stata module to estimate Shapley Decomposition by Components of a Welfare Measure, Statistical Software Components S457562, Boston College Department of Economics. Azevedo, J.P., Nguyen, M. and V. Sanfelice (2012b) DRDECOMP: Stata module to estimate Shapley value of growth and distribution components of changes in poverty indicators, Statistical Software Components S457563, Boston College Department of Economics. Azevedo, J. P., Inchauste G., Olivieri S, Saavedra J. and H. Winkler (2013a). "Is Labor Income Responsible for Poverty Reduction? A Decomposition Approach". Policy Research Working Paper 6414, World Bank, Washington, DC. Azevedo, J. P., Inchauste, G. and V. Sanfelice (2013b). "Decomposing the recent inequality decline in Latin America". Policy Research Working Paper Series 6715, The World Bank. Azevedo, J. P., Davalos, M. E., Diaz-Bonilla, C., Atuesta, B. and R. A. Castaneda (2013c). "Fifteen years of inequality in Latin America: how have labor markets helped?". Policy Research Working Paper Series 6384, The World Bank. Baltar, P., Dos Santos, A., Krein, J. D., Leone, E., Weishaupt Proni, M., Moretto, A., Gori Maia, A., and C. Salas (2010). "Moving towards Decent Work. Labour in the Lula government: reflections on recent Brazilian experience". Global labour university working papers No. 9, Hochschule für Wirtschaft und Recht, Berlin. Barros, R.P., Carvalho, M., Franco, A. and R. Mendonça (2006). "Uma Análise das Principais Causas da Queda Recente na Desigualdade de Renda Brasileira". Revista Econômica, 8 (1), p.p. 117–47. Barros, R., De Carvalho, M., Franco, S. and R. Mendonça (2010). "Markets, the state and the dynamics of inequality in Brazil". In L. F. Lopez-Calva & N. Lustig (Eds.), Declining inequality in Latin America: A decade of progress? (chapter 6). Washington DC: Brookings Institution and UNDP. Berg, J. (2010). "Laws or luck? Understanding rising formality in Brazil in the 2000s". International Labour Office. Brasilia: ILO, 1 v. (Decent Work in Brazil Series; Working paper, n.5).
26
Bourguignon F. and F. Ferreira (2005). "Decomposing Changes in the Distribution of Household Incomes: Methodological Aspects", In F. Bourguignon, F. Ferreira and N. Lustig(ed) The Microeconomics of Income Distribution Dynamics in East Asia and Latin America, Washington, DC; The World Bank and Oxford University Press. Bourguignon, F. (2003). "The growth elasticity of poverty reduction: explaining heterogeneity across countries and time periods". In T. Eicher and S. Turnovski (eds.): Growth and Inequality, Cambridge, MA: MIT Press. Chen, S. and M. Ravallion (2007). "Absolute poverty measures for the developing world, 1981-2004", Policy Research Working Paper Series 4211, The World Bank, Washington DC. Cling J.-P., Razafindrakoto M. and F. Roubaud (2005). "Export Processing Zones in Madagascar: a Success Story under Threat? World development, Vol. 33, No. 5, May, p. 785-803. Cling J.-P., Razafindrakoto M. and F. Roubaud (2009). "Export Processing Zones in Madagascar: The Impact of Dismantling of Clothing Quotas on Employment and Labor Standards", in R. Robertson, D. Brown, G. Pierre and M.L. Sanchez-Puerta (eds.) Globalization, Wages, and the Quality of Jobs, Chapter 8, Washington D.C.: The World Bank, pp. 237-264. Datt, G. and M. Ravallion (1992). "Growth and redistribution components of changes in poverty measures: A decomposition with applications to Brazil and India in the 1980s". Journal of Development Economics, HN° Vol. 38, pages 275-295. Datt, G. and M. Ravallion (2002). "Is India's Economic Growth Leaving the Poor Behind?", Journal of Economic Perspectives, American Economic Association, vol. 16(3), pages 89-108, Summer. De Hoyos, R., Bussolo, M. and O. Nunez (2012). "Exports, Gender Wage Gaps, and Poverty in Honduras," Oxford Development Studies, Taylor & Francis Journals, vol. 40(4), pages 533-551, December. Dollar, D., and A. Kray (2002). "Growth is Good for the Poor". Journal of Economic Growth, Vol. 7(3), pp. 195-225. Farole, T. (2011). "Special Economic Zones: What Have We Learned? World Bank - Economic Premise, The World Bank, issue 64, pages 1-5, September. Farole T. and G. Akinci (eds) (2011). "Special economic zones: progress, emerging challenges, and future directions". Directions in development and trade. Washington, DC: World Bank. Ferreira de Souza, P. H. (2012). "Poverty, Inequality and Social Policies in Brazil, 1995-2009". International Policy Center for Inclusive Growth Working Paper No.87, February. Ferreira, F.H.G., Leite, P. and M. Ravallion (2010). "Poverty reduction without economic growth?: Explaining Brazil's poverty dynamics, 1985-2004", Journal of Development Economics, Elsevier, vol. 93(1), pages 20-36, September. FIAS (2008). Special Economic Zones: Performance, Lessons Learned, and Implications for Zone Development. The Multi-Donor Investment Climate Advisory Service of the World Bank Group, Washington, DC: The World Bank Group, April.

27
Garcia, E. (2009). "Manaus Free Trade Zone Development Model: History, Achievements and Challenges", Suframa, Manaus. Glick, P. and F. Roubaud (2006) Export Processing Zone Expansion in Madagascar: What are the Labour Market and Gender Impacts?, Journal of African Economies, 15(4):722-756. Gragnolati, M., Jorgensen, O. H., Rocha, R. and A. Fruttero (2011). "Growing Old in an Older Brazil: Implications of Population Ageing on Growth, Poverty, Public Finance, and Service Delivery". Washington D.C.: The World Bank. Headey, D. (2008). "National policies and the sectoral pattern of economic growth". Agricultural
Economics, vol. 38, pp. 287-299.
Hoffmann R. (2013) Transferências de renda e desigualdade no Brasil (1995-2011). In: Campello, T. and Neri, M. (Orgs). Programa Bolsa Família: uma década de inclusão e cidadania. Brasília: Ipea. Hoffmann, R. and Ney, M. G. (2008). "A recente queda da desigualdade de renda no Brasil: análise de dados da PNAD, do Censo Demografico e das Contas Nacionais", Economica, Rio de Janeiro, Vol. 10 pp. 7-39. ILO (2003) Employment and Social Policy in Respect of Export Processing Zones. Committee on Employment and Social Policy. International Labour Organization, Geneva, Governing Body, 286th Session, GB.286/ESP/3, March. ILO (2008) Report of the InFocus Initiative on export processing zones (EPZs): Latest trends and policy developments in EPZs, Governing Body, Committee on Employment and Social Policy.ILO, Geneva In Papers of the Governing Body. 301st Session (Mar. 2008), GB.301/ESP/5, The World Bank, Washington DC. Inchauste, G., Azevedo, J. P., Olivieri, S., Saavedra, J., and H. Winkler (2012). "When job earnings are behind poverty reduction". Economic premise; no. 97. Washington, DC: World Bank. Inchauste, G., Azevedo, J.P., Essama-Nssah, E., Olivieri, S., Van Nguyen, T., Saavedra-Chanduvi, J. and Winkler, H. (2014) Understanding Changes in Poverty, World Bank Publications Instituto de Pesquisa Econômica Aplicada (IPEA) (2010). Brasil em Desenvolvimento: Estado, planejamento e políticas públicas. Instituto de Pesquisa Econômica Aplicada. Brasília : Ipea, 2010. Instituto de Pesquisa Econômica Aplicada (IPEA) (2015) IPEADATA. Available at http://www.ipeadata.gov.br/ Jenkins, M. (2005). "Economic and social effects of export processing zones in Costa Rica", International Labour Office (Multinational Enterprises and Social Policy), Geneva, Multinational enterprises programme Working Paper No. 97.

28
Kolenikov, S. and A. Shorrocks (2005). "A Decomposition Analysis of Regional Poverty in Russia", Review of Development Economics, Wiley Blackwell, Vol. 9(1), pages 25-46, 02 Kwaku Akpokavie, C. (2001). "Core labour standards in export processing zones. In ILO Fundamental rights at work: overview and prospects". International Labour Organization, Geneva, Labour education N. 122 (2001/1), Pages p. 35-39. Lavinas, L. (2013) 21st century welfare. New Left Review, 84 Nov-Dec, p. 5-40. Loayza, N. V. and Raddatz, C. (2010) "The composition of growth matters for poverty alleviation," Journal of Development Economics, Elsevier, vol. 93(1), pages 137-151, September. Machado, J. and Sá, M. (2012) Polo Industrial de Manaus: Suas Transformações e seus Êxitos na Agregação de Valor Regional, no período 1996-2009. Congresso Brasileiro de Economia, 2013, Manaus. Available at: http://ftz.dauphine.fr/fileadmin/mediatheque/masters/ftz/documents/MauroThury_ZFM_AdicaoDeValor_Conexos_CBE2013.pdf McCallum J. K. (2011). "Export processing zones: comparative data from China, Honduras, Nicaragua, and South Africa". International Labour Office, Industrial and Employment Relations Department, Geneva (Working Paper No. 21). Menezes Filho, N. A. and Vasconcellos, L. (2006). "Human Capital, Inequality and Pro-poor Growth in Brazil". In: T. Besley and Louise Cord. (Org.). Delivering on the Promise of Pro-Poor Growth: Insights and Country Experiences. 1ed.Washington: World Bank, v. 1, pp. 250-287.
Murphy L., Bilsborrow, R. and F. Pichón (1997). "Poverty and prosperity among migrant settlers
in the Amazon rainforest frontier of Ecuador". The Journal of Development Studies, Vol. 34(2),
pp. 35-65.
Oberai, A. S., Sivananthiran, A. and VenkataRatnam, C. S. (2011). "Labour issues in export processing zones in South Asia: the role of social dialogue". International Labour Office, New Delhi, 465 p. Picarelli, N. (2014). "Who Really Benefits from Export Processing Zones? Evidence from
Nicaraguan Municipalities". London School of Economics. Mimeo.
Ravallion, M. and Chen, S. (1997). "What Can New Survey Data Tell Us about Recent Changes in Distribution and Poverty?", World Bank Economic Review, 11(2), 357-82. Rivas, A., Mota, J. and Machado, J. (2009). "Instrumentos econômicos para a proteção da Amazônia: a experiência do Polo Industrial de Manaus". CRV e PIATAM, Curitiba. Sá, M. (1996). "O modelo industrial da zona franca de manaus: importância e limitações para o desenvolvimento regional". Master dissertation, PUC-SP, São Paulo. Sá, M. T. (2015). "The Free Trade Zone of Manaus: purposely and unwittingly results". Presentation at the conference “The Future of Free Trade Zones”, June 3rd and 4th, Universite Paris-Dauphine and Institut de la Recherche pour le Développement, Paris, available at http://ftz.dauphine.fr/fr/evenements/conferences.html.

29
Saboia, J. and Kubrusly, L. (2015). "Pobreza e Desconcentração Regional da Indústria Brasileira". Texto para Discussão 03/2015, Instituto de Economia, Rio de Janeiro. Shorrocks, A. F. (1999). "Decomposition procedures for distributional analysis: A unified framework based on the Shapley value", mimeo, University of Essex. Singa Boyenge, J. (2007). "ILO database on export processing zones (Revised)." Sectoral Activities Programme, Working Paper 251, Geneva: ILO, 2007. Siroën J.-M., Yücer A.(2014). "Trade Performance of Free Trade Zones", 28 pages, DIAL Working paper No.2014-09, September. Soares, S. (2012). "Bolsa Família, its design, its impacts and possibilities for the future". Brasília: IPC-IG (Working Paper, No. 89). Tejani, S. (2011). "The Gender Dimension of Special Economic Zones". In T. Farole and G. Akinci (eds): Special economic zones: progress, emerging challenges, and future directions. Directions in development; trade. Washington, DC: World Bank. World Trade Organization (2013). "Trade Policy Review Brazil". Report by the Secretariat, WT/TPR/S/283/Rev.1, 26 July 2013. World Bank (1990), World Development Report: Poverty, New York: Oxford University Press. World Bank (2000), World Development Report: Attacking Poverty, New York: Oxford University Press. Yücer, A., Siroën, J.-M., Archanskaia, E. (2014). "World FTZ Database", available at: http://ftz.dauphine.fr.
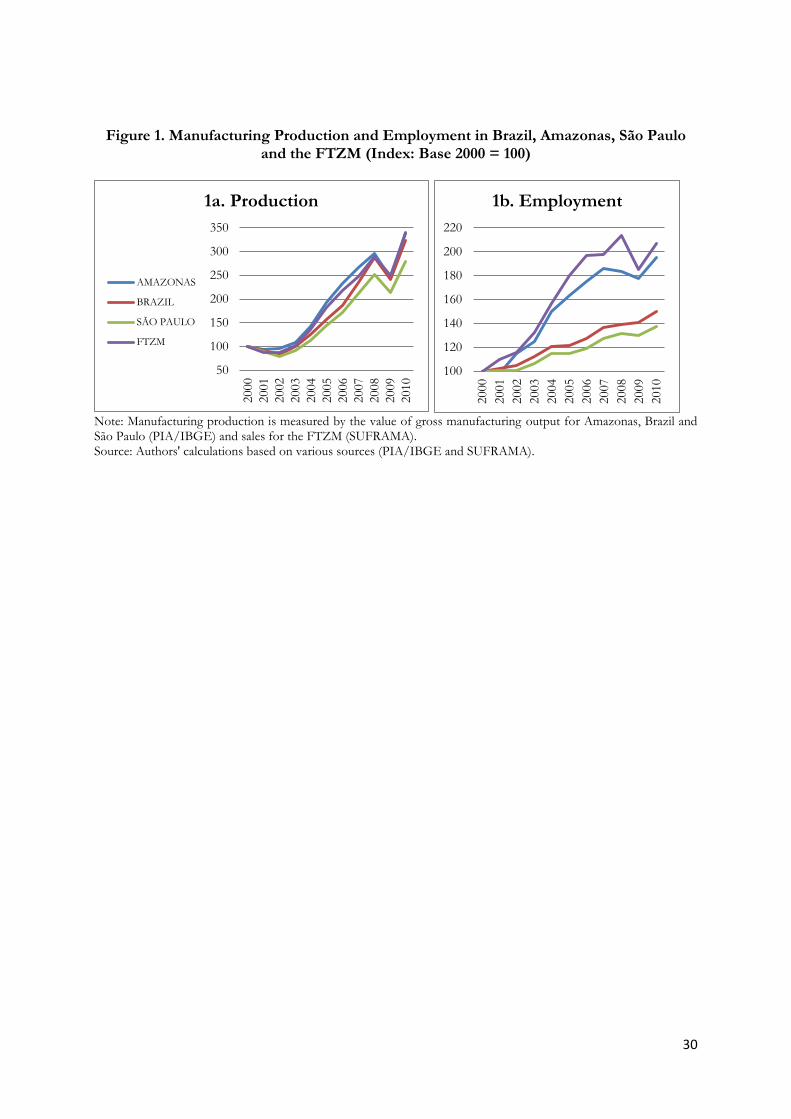
30
Figure 1. Manufacturing Production and Employment in Brazil, Amazonas, São Paulo and the FTZM (Index: Base 2000 = 100)
Note: Manufacturing production is measured by the value of gross manufacturing output for Amazonas, Brazil and São Paulo (PIA/IBGE) and sales for the FTZM (SUFRAMA). Source: Authors' calculations based on various sources (PIA/IBGE and SUFRAMA).
50
100
150
200
250
300
350
2000
2001
2002
2003
2004
2005
2006
2007
2008
2009
2010
1a. Production
AMAZONAS
BRAZIL
SÃO PAULO
FTZM
100
120
140
160
180
200
220
2000
2001
2002
2003
2004
2005
2006
2007
2008
2009
2010
1b. Employment

31
Table 1. Poverty and Inequality Levels
Manaus Amazonas excluding Manaus
Urban Brazil
Brazil
2000 2010 2000 2010 2000 2010 2000 2010
Poverty (R$ 140 threshold):
Headcount ratio 32.0 18.1
74.4 53.9
24.3 13.0
30.9 17.6
Poverty gap index 16.4 10.5
46.4 33.5
12.1 6.9
16.4 9.7 Extreme poverty (R$ 70 threshold):
Headcount ratio 14.8 9.4
48.3 33.5
10.9 6.4
15.5 9.3
Poverty gap index 9.3 7.6
29.6 23.0
6.3 4.5
9.0 6.3
Inequality:
Gini index 0.64 0.61
0.66 0.64
0.63 0.59
0.65 0.60
Theil index 0.87 0.82
1.06 0.92
0.84 0.76
0.90 0.80 Mean monthly hh per capita income 501 693
150 240
640 848
555 759
Mean hourly wages 7.2 10.0 4.2 5.5 7.4 9.1 6.8 8.5
Note: Mean hourly wages are calculated for workers between 15 and 65 years old declaring a monthly labor income from their main job. Manaus refers to the municipality of Manaus; Amazonas excluding Manaus corresponds to the rest of the state of Amazonas (RAM), where the municipality of Manaus has been excluded. Source: Authors’ calculations from 2000 and 2010 Brazilian Census microdata.
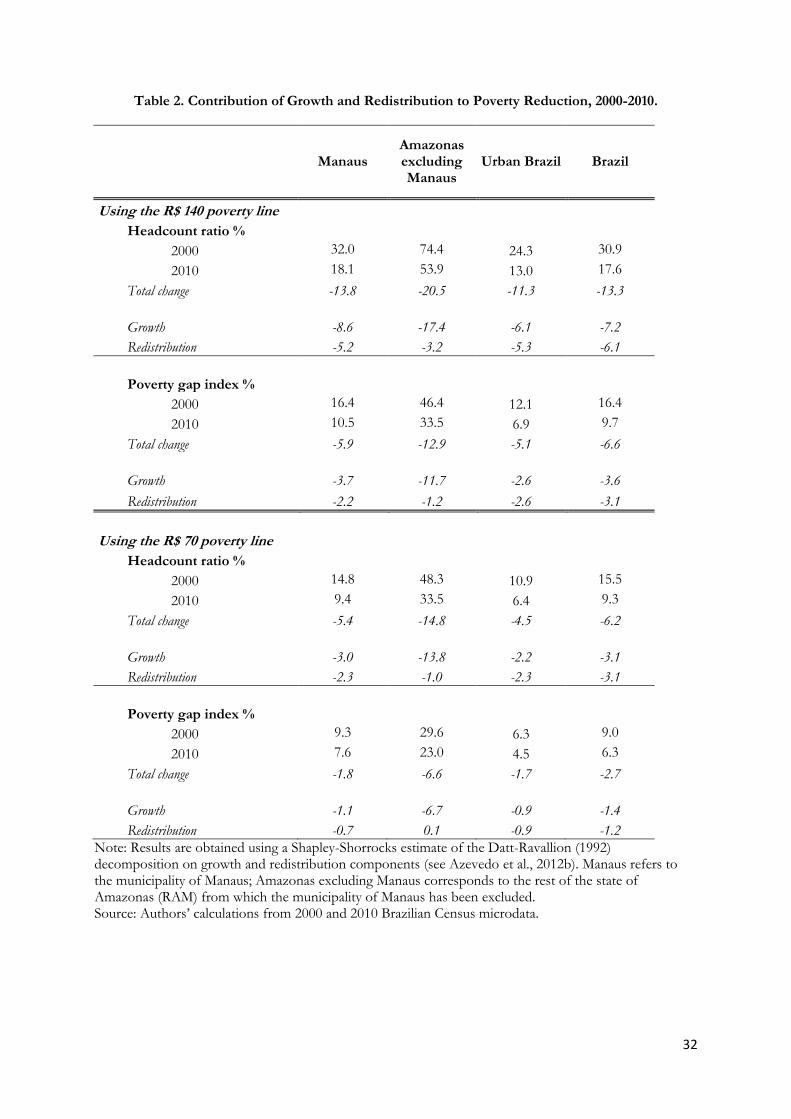
32
Table 2. Contribution of Growth and Redistribution to Poverty Reduction, 2000-2010.
Manaus Amazonas excluding Manaus
Urban Brazil Brazil
Using the R$ 140 poverty line
Headcount ratio %
2000 32.0 74.4 24.3 30.9
2010 18.1 53.9 13.0 17.6
Total change -13.8 -20.5 -11.3 -13.3
Growth -8.6 -17.4 -6.1 -7.2
Redistribution -5.2 -3.2 -5.3 -6.1
Poverty gap index %
2000 16.4 46.4 12.1 16.4
2010 10.5 33.5 6.9 9.7
Total change -5.9 -12.9 -5.1 -6.6
Growth -3.7 -11.7 -2.6 -3.6
Redistribution -2.2 -1.2 -2.6 -3.1
Using the R$ 70 poverty line Headcount ratio %
2000 14.8 48.3 10.9 15.5
2010 9.4 33.5 6.4 9.3
Total change -5.4 -14.8 -4.5 -6.2
Growth -3.0 -13.8 -2.2 -3.1
Redistribution -2.3 -1.0 -2.3 -3.1
Poverty gap index %
2000 9.3 29.6 6.3 9.0
2010 7.6 23.0 4.5 6.3
Total change -1.8 -6.6 -1.7 -2.7
Growth -1.1 -6.7 -0.9 -1.4
Redistribution -0.7 0.1 -0.9 -1.2
Note: Results are obtained using a Shapley-Shorrocks estimate of the Datt-Ravallion (1992) decomposition on growth and redistribution components (see Azevedo et al., 2012b). Manaus refers to the municipality of Manaus; Amazonas excluding Manaus corresponds to the rest of the state of Amazonas (RAM) from which the municipality of Manaus has been excluded. Source: Authors’ calculations from 2000 and 2010 Brazilian Census microdata.
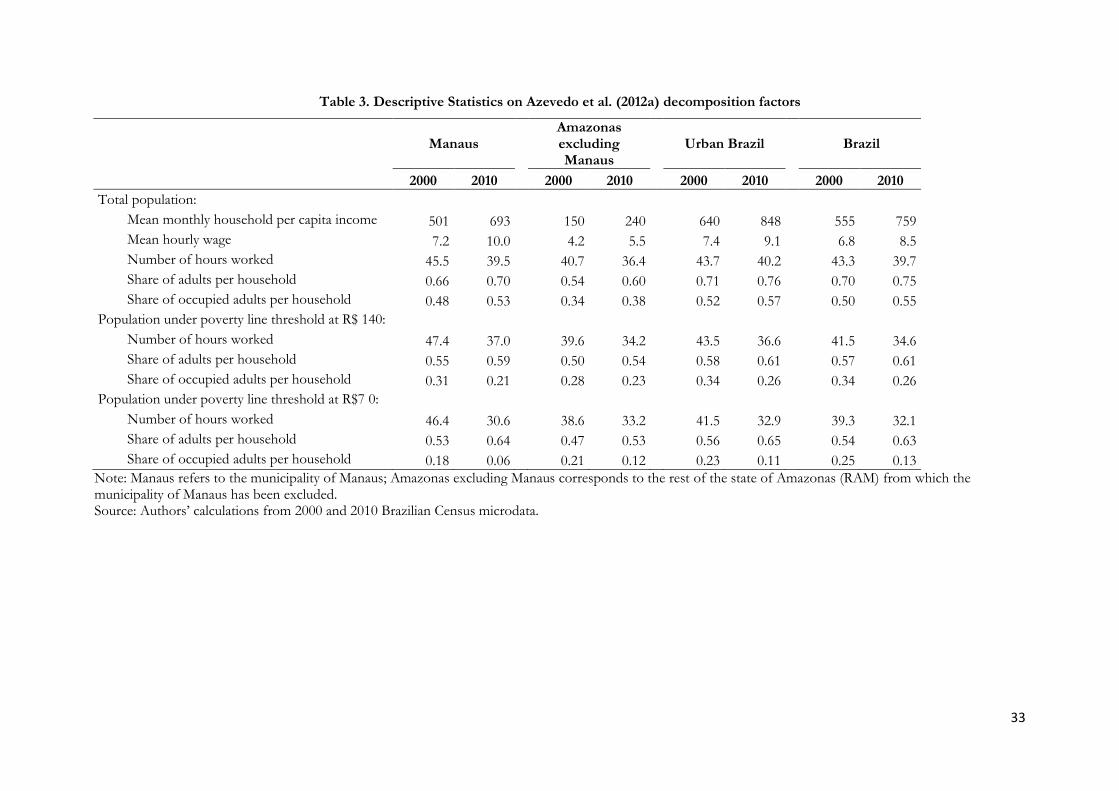
33
Table 3. Descriptive Statistics on Azevedo et al. (2012a) decomposition factors
Manaus
Amazonas excluding Manaus
Urban Brazil Brazil
2000 2010 2000 2010 2000 2010 2000 2010
Total population:
Mean monthly household per capita income 501 693 150 240
640 848 555 759
Mean hourly wage 7.2 10.0 4.2 5.5
7.4 9.1 6.8 8.5
Number of hours worked 45.5 39.5 40.7 36.4
43.7 40.2 43.3 39.7
Share of adults per household 0.66 0.70 0.54 0.60
0.71 0.76 0.70 0.75
Share of occupied adults per household 0.48 0.53 0.34 0.38
0.52 0.57 0.50 0.55
Population under poverty line threshold at R$ 140:
Number of hours worked 47.4 37.0 39.6 34.2
43.5 36.6 41.5 34.6
Share of adults per household 0.55 0.59 0.50 0.54
0.58 0.61 0.57 0.61
Share of occupied adults per household 0.31 0.21 0.28 0.23
0.34 0.26 0.34 0.26
Population under poverty line threshold at R$7 0:
Number of hours worked 46.4 30.6 38.6 33.2
41.5 32.9 39.3 32.1
Share of adults per household 0.53 0.64 0.47 0.53
0.56 0.65 0.54 0.63
Share of occupied adults per household 0.18 0.06 0.21 0.12 0.23 0.11 0.25 0.13
Note: Manaus refers to the municipality of Manaus; Amazonas excluding Manaus corresponds to the rest of the state of Amazonas (RAM) from which the municipality of Manaus has been excluded. Source: Authors’ calculations from 2000 and 2010 Brazilian Census microdata.
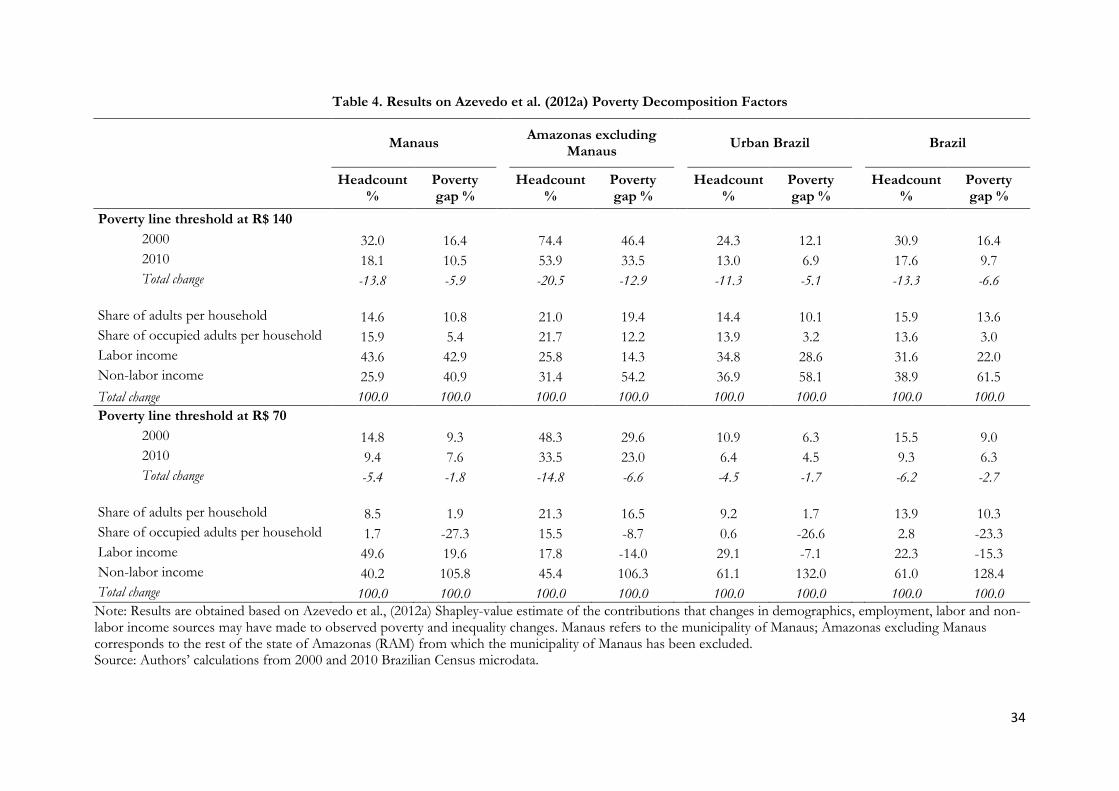
34
Table 4. Results on Azevedo et al. (2012a) Poverty Decomposition Factors
Manaus Amazonas excluding
Manaus Urban Brazil Brazil
Headcount
% Poverty gap %
Headcount
% Poverty gap %
Headcount
% Poverty gap %
Headcount
% Poverty gap %
Poverty line threshold at R$ 140
2000 32.0 16.4
74.4 46.4
24.3 12.1
30.9 16.4
2010 18.1 10.5
53.9 33.5
13.0 6.9
17.6 9.7
Total change -13.8 -5.9
-20.5 -12.9
-11.3 -5.1
-13.3 -6.6
Share of adults per household 14.6 10.8
21.0 19.4
14.4 10.1
15.9 13.6
Share of occupied adults per household 15.9 5.4
21.7 12.2
13.9 3.2
13.6 3.0
Labor income 43.6 42.9
25.8 14.3
34.8 28.6
31.6 22.0
Non-labor income 25.9 40.9
31.4 54.2
36.9 58.1
38.9 61.5
Total change 100.0 100.0 100.0 100.0 100.0 100.0 100.0 100.0
Poverty line threshold at R$ 70
2000 14.8 9.3
48.3 29.6
10.9 6.3
15.5 9.0
2010 9.4 7.6
33.5 23.0
6.4 4.5
9.3 6.3
Total change -5.4 -1.8
-14.8 -6.6
-4.5 -1.7
-6.2 -2.7
Share of adults per household 8.5 1.9
21.3 16.5
9.2 1.7
13.9 10.3
Share of occupied adults per household 1.7 -27.3
15.5 -8.7
0.6 -26.6
2.8 -23.3
Labor income 49.6 19.6
17.8 -14.0
29.1 -7.1
22.3 -15.3
Non-labor income 40.2 105.8
45.4 106.3
61.1 132.0
61.0 128.4
Total change 100.0 100.0 100.0 100.0 100.0 100.0 100.0 100.0
Note: Results are obtained based on Azevedo et al., (2012a) Shapley-value estimate of the contributions that changes in demographics, employment, labor and non-labor income sources may have made to observed poverty and inequality changes. Manaus refers to the municipality of Manaus; Amazonas excluding Manaus corresponds to the rest of the state of Amazonas (RAM) from which the municipality of Manaus has been excluded. Source: Authors’ calculations from 2000 and 2010 Brazilian Census microdata.

35
Table 5. Results on Azevedo et al. (2012a) Inequality Decomposition Factors
Manaus Amazonas excluding
Manaus Urban Brazil Brazil
Gini index Theil index Gini index Theil index Gini index Theil index Gini index Theil index
Inequality
2000 0.64 0.87
0.66 1.06
0.63 0.84 0.65 0.90
2010 0.61 0.82
0.64 0.92
0.59 0.76
0.60 0.80
Total change -0.03 -0.06 -0.02 -0.14 -0.04 -0.08 -0.04 -0.10
Share of adults per household 16.7 35.3
14.3 27.9
7.7 20.0
9.3 18.9
Share of occupied adults per household 6.7 11.8
-52.4 -57.1
-5.1 -9.6
-7.0 -14.6
Labor income 86.7 126.5
4.8 15.0
82.1 80.7
69.8 65.2
Non-labor income -13.3 -73.5
133.3 114.3
15.4 8.9
25.6 30.5
Total change 100.0 100.0 100.0 100.0 100.0 100.0 100.0 100.0
Note: Results are obtained based on Azevedo et al., (2012a) Shapley-value estimate of the contributions that changes in demographics, employment, labor and non-labor income sources may have made to observed poverty and inequality changes. Manaus refers to the municipality of Manaus; Amazonas excluding Manaus corresponds to the rest of the state of Amazonas (RAM) from which the municipality of Manaus has been excluded. Source: Authors’ calculations from 2000 and 2010 Brazilian Census microdata.

36
Figure A1. Maps on Poverty Measures by State, 2001-2011.
2001
2011
Note: Data from the Institute of Applied Economic Research Poverty Series (see www.ipeadata.gov.br),
which uses Brazilian household surveys (PNAD). Poverty is measured using the headcount index (with a
poverty line based on an estimation of basic calorie intake needs).
Figure A2. Maps on Inequality Measures by State, 2001-2011.
2001
2011
Note: Data from the Institute of Applied Economic Research Poverty Series (see www.ipeadata.gov.br),
which uses Brazilian household surveys (PNAD). Inequality is measured using the Gini index.

37
Table A1. Descriptive Statistics on Living Conditions
Manaus Amazonas excluding Manaus
Urban Brazil Brazil
2000 2010 2000 2010 2000 2010 2000 2010
Number of persons per bedroom:
One or two 40.4 48.8
20.7 32.4
63.2 73.1
61.3 71.8
Three 28.8 25.7
27.3 26.7
22.7 17.7
23.7 18.3
More than three 30.8 25.5
52.0 40.9
14.1 9.3
15.0 9.9
Type of housing:
House 91.5 91.3
97.4 97.4
89.9 89.7
91.3 91.2
Flat 4.3 7.4
0.2 0.8
8.9 9.8
7.4 8.2
Room 3.8 1.2
0.9 0.2
1.0 0.5
0.9 0.4
Other (makeshift, etc.) 0.3 0.1
1.5 1.6
0.3 0.1
0.4 0.2
Type of access to water:
Municipal supply 76.2 75.2
41.7 49.3
89.4 91.3
76.3 81.1
Water well 13.4 24.0
16.5 19.9
7.6 7.7
16.6 15.0
Other (rainwater, etc.) 10.4 0.8
41.9 30.9
3.1 1.1
7.0 3.9
Access to electric lighting 99.0 99.6
65.4 84.4
99.1 99.8
93.7 98.6
Type of sanitation facility:
Public network 33.1 39.4
3.6 6.0
54.8 61.7
45.4 52.3
Septic tank 36.2 22.1
12.6 10.7
15.9 11.5
14.7 11.8
Other 26.6 37.5
61.9 71.7
26.6 26.2
31.2 32.8
No toilet 4.0 1.0
21.9 11.6
2.8 0.6
8.8 3.1
Number of household assets:
One or less 8.8 2.9 59.5 37.8 11.5 3.9 19.3 7.2
Two to five 85.3 84.5 40.2 61.4 79.7 76.2 73.5 75.9
All 5.9 12.7 0.3 0.7 8.8 19.9 7.3 17.0

38
Table A2. Characteristics of Total Population
Manaus Amazonas
excluding Manaus Urban Brazil Brazil
2000 2010 2000 2010 2000 2010 2000 2010
Total population sample (millions) 1.33 1.59 1.22 1.56 122.50 148.40 151.50 176.90
Urban (% of total) 99.4% 99.5%
51.2% 57.8%
100.0% 100.0%
80.8% 83.9%
Men (% of total) 48.5% 48.0%
51.2% 51.3%
48.1% 47.6%
48.9% 48.3%
Self-declared White/Asian (% of total) 32.3% 27.1%
17.1% 16.1%
55.7% 50.4%
53.4% 48.2%
Average years of schooling 5.2 6.2
2.5 3.8
5.2 6.2
4.7 5.8
Average age 24.4 27.2
20.9 23.4
28.7 31.7
28.2 31.4
Average hh size 5.4 5.0
7.3 6.5
4.6 4.1
4.7 4.2
Average number of children in hh 2.0 1.6
3.5 2.8
1.5 1.1
1.7 1.2
Always resident in municipality (% of total) 63.2% 65.8%
83.0% 79.8%
57.2% 56.7%
60.1% 59.0%
Always resident in state (% of total) 73.1% 83.4%
93.1% 95.0%
72.0% 82.0%
74.5% 83.4%
Employed (% of working-age population) 49.1% 54.8%
34.3% 38.5%
54.2% 60.2%
52.1% 57.8%
Note: The employed correspond in our analysis to the persons between 15 and 65 years old declaring a monthly labor income from their main job. Source: Authors’ calculations from 2000 and 2010 Brazilian Census microdata.
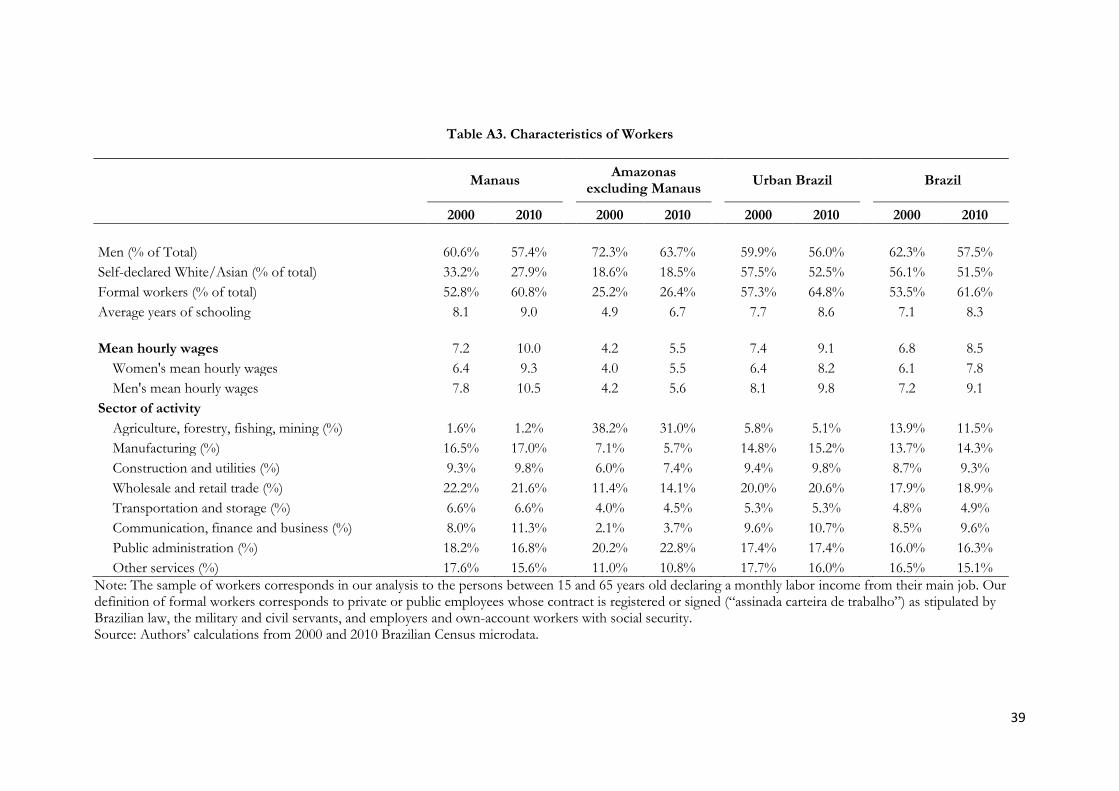
39
Table A3. Characteristics of Workers
Manaus
Amazonas excluding Manaus
Urban Brazil Brazil
2000 2010 2000 2010 2000 2010 2000 2010
Men (% of Total) 60.6% 57.4%
72.3% 63.7%
59.9% 56.0%
62.3% 57.5%
Self-declared White/Asian (% of total) 33.2% 27.9%
18.6% 18.5%
57.5% 52.5%
56.1% 51.5%
Formal workers (% of total) 52.8% 60.8%
25.2% 26.4%
57.3% 64.8%
53.5% 61.6%
Average years of schooling 8.1 9.0
4.9 6.7
7.7 8.6
7.1 8.3
Mean hourly wages 7.2 10.0
4.2 5.5
7.4 9.1
6.8 8.5
Women's mean hourly wages 6.4 9.3 4.0 5.5
6.4 8.2
6.1 7.8
Men's mean hourly wages 7.8 10.5 4.2 5.6
8.1 9.8
7.2 9.1
Sector of activity
Agriculture, forestry, fishing, mining (%) 1.6% 1.2%
38.2% 31.0%
5.8% 5.1%
13.9% 11.5%
Manufacturing (%) 16.5% 17.0%
7.1% 5.7%
14.8% 15.2%
13.7% 14.3%
Construction and utilities (%) 9.3% 9.8%
6.0% 7.4%
9.4% 9.8%
8.7% 9.3%
Wholesale and retail trade (%) 22.2% 21.6%
11.4% 14.1%
20.0% 20.6%
17.9% 18.9%
Transportation and storage (%) 6.6% 6.6%
4.0% 4.5%
5.3% 5.3%
4.8% 4.9%
Communication, finance and business (%) 8.0% 11.3%
2.1% 3.7%
9.6% 10.7%
8.5% 9.6%
Public administration (%) 18.2% 16.8%
20.2% 22.8%
17.4% 17.4%
16.0% 16.3%
Other services (%) 17.6% 15.6% 11.0% 10.8% 17.7% 16.0% 16.5% 15.1%
Note: The sample of workers corresponds in our analysis to the persons between 15 and 65 years old declaring a monthly labor income from their main job. Our definition of formal workers corresponds to private or public employees whose contract is registered or signed (“assinada carteira de trabalho”) as stipulated by Brazilian law, the military and civil servants, and employers and own-account workers with social security. Source: Authors’ calculations from 2000 and 2010 Brazilian Census microdata.
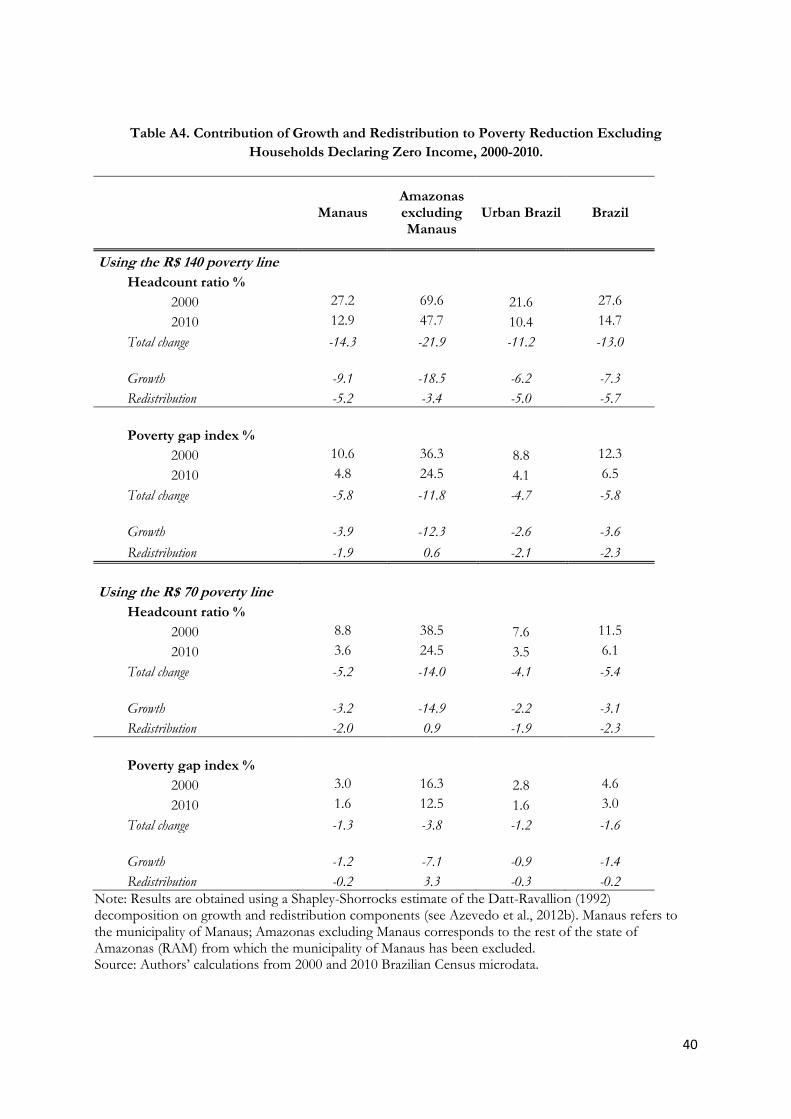
40
Table A4. Contribution of Growth and Redistribution to Poverty Reduction Excluding
Households Declaring Zero Income, 2000-2010.
Manaus Amazonas excluding Manaus
Urban Brazil Brazil
Using the R$ 140 poverty line
Headcount ratio %
2000 27.2 69.6 21.6 27.6
2010 12.9 47.7 10.4 14.7
Total change -14.3 -21.9 -11.2 -13.0
Growth -9.1 -18.5 -6.2 -7.3
Redistribution -5.2 -3.4 -5.0 -5.7
Poverty gap index %
2000 10.6 36.3 8.8 12.3
2010 4.8 24.5 4.1 6.5
Total change -5.8 -11.8 -4.7 -5.8
Growth -3.9 -12.3 -2.6 -3.6
Redistribution -1.9 0.6 -2.1 -2.3
Using the R$ 70 poverty line Headcount ratio %
2000 8.8 38.5 7.6 11.5
2010 3.6 24.5 3.5 6.1
Total change -5.2 -14.0 -4.1 -5.4
Growth -3.2 -14.9 -2.2 -3.1
Redistribution -2.0 0.9 -1.9 -2.3
Poverty gap index %
2000 3.0 16.3 2.8 4.6
2010 1.6 12.5 1.6 3.0
Total change -1.3 -3.8 -1.2 -1.6
Growth -1.2 -7.1 -0.9 -1.4
Redistribution -0.2 3.3 -0.3 -0.2
Note: Results are obtained using a Shapley-Shorrocks estimate of the Datt-Ravallion (1992) decomposition on growth and redistribution components (see Azevedo et al., 2012b). Manaus refers to the municipality of Manaus; Amazonas excluding Manaus corresponds to the rest of the state of Amazonas (RAM) from which the municipality of Manaus has been excluded. Source: Authors’ calculations from 2000 and 2010 Brazilian Census microdata.
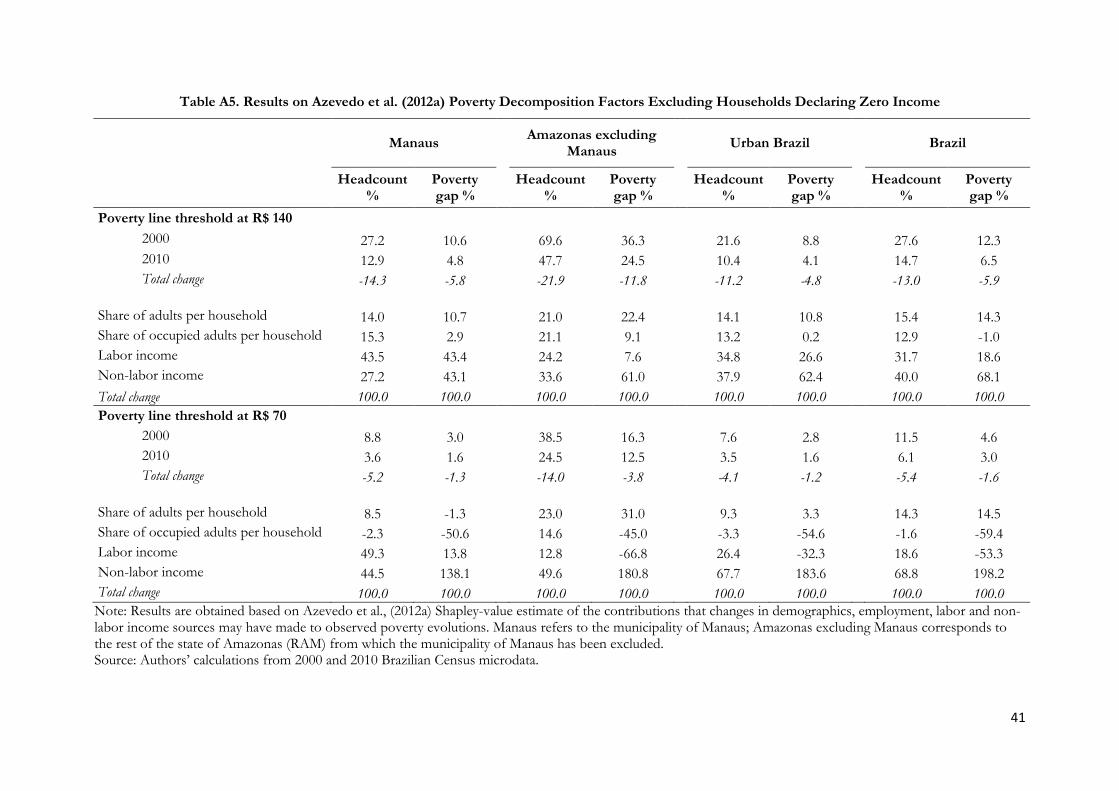
41
Table A5. Results on Azevedo et al. (2012a) Poverty Decomposition Factors Excluding Households Declaring Zero Income
Manaus Amazonas excluding
Manaus Urban Brazil Brazil
Headcount
% Poverty gap %
Headcount
% Poverty gap %
Headcount
% Poverty gap %
Headcount
% Poverty gap %
Poverty line threshold at R$ 140
2000 27.2 10.6
69.6 36.3
21.6 8.8
27.6 12.3
2010 12.9 4.8
47.7 24.5
10.4 4.1
14.7 6.5
Total change -14.3 -5.8
-21.9 -11.8
-11.2 -4.8
-13.0 -5.9
Share of adults per household 14.0 10.7
21.0 22.4
14.1 10.8
15.4 14.3
Share of occupied adults per household 15.3 2.9
21.1 9.1
13.2 0.2
12.9 -1.0
Labor income 43.5 43.4
24.2 7.6
34.8 26.6
31.7 18.6
Non-labor income 27.2 43.1
33.6 61.0
37.9 62.4
40.0 68.1
Total change 100.0 100.0 100.0 100.0 100.0 100.0 100.0 100.0
Poverty line threshold at R$ 70
2000 8.8 3.0
38.5 16.3
7.6 2.8
11.5 4.6
2010 3.6 1.6
24.5 12.5
3.5 1.6
6.1 3.0
Total change -5.2 -1.3
-14.0 -3.8
-4.1 -1.2
-5.4 -1.6
Share of adults per household 8.5 -1.3
23.0 31.0
9.3 3.3
14.3 14.5
Share of occupied adults per household -2.3 -50.6
14.6 -45.0
-3.3 -54.6
-1.6 -59.4
Labor income 49.3 13.8
12.8 -66.8
26.4 -32.3
18.6 -53.3
Non-labor income 44.5 138.1
49.6 180.8
67.7 183.6
68.8 198.2
Total change 100.0 100.0 100.0 100.0 100.0 100.0 100.0 100.0
Note: Results are obtained based on Azevedo et al., (2012a) Shapley-value estimate of the contributions that changes in demographics, employment, labor and non-labor income sources may have made to observed poverty evolutions. Manaus refers to the municipality of Manaus; Amazonas excluding Manaus corresponds to the rest of the state of Amazonas (RAM) from which the municipality of Manaus has been excluded. Source: Authors’ calculations from 2000 and 2010 Brazilian Census microdata.

42
Table A6. Results on Azevedo et al. (2012a) Inequality Decomposition Factors Excluding Households Declaring Zero Income
Manaus Amazonas excluding
Manaus Urban Brazil Brazil
Gini index Theil index Gini index Theil index Gini index Theil index Gini index Theil index
Inequality
2000 0.61 0.81
0.60 0.89
0.62 0.80 0.63 0.85
2010 0.58 0.75
0.59 0.79
0.58 0.73
0.59 0.76
Total change -0.03 -0.05 -0.01 -0.09 -0.04 -0.08 -0.04 -0.09
Share of adults per household 16.7 37.1
16.7 34.1
7.9 20.0
7.5 18.9
Share of occupied adults per household 6.7 4.8
-300.0 -128.0
-7.9 -14.4
-10.0 -21.6
Labor income 93.3 137.1
-50.0 -11.0
84.2 83.2
75.0 66.9
Non-labor income -13.3 -77.4
433.3 204.9
15.8 10.4
27.5 35.8
Total change 100.0 100.0 100.0 100.0 100.0 100.0 100.0 100.0
Note: Results are obtained based on Azevedo et al., (2012a) Shapley-value estimate of the contributions that changes in demographics, employment, labor and non-labor income sources may have made to observed inequality changes. Manaus refers to the municipality of Manaus; Amazonas excluding Manaus corresponds to the rest of the state of Amazonas (RAM) from which the municipality of Manaus has been excluded. Source: Authors’ calculations from 2000 and 2010 Brazilian Census microdata.

43


![[T] The effects of brief physical conditioning on immune ... · citocinas em idosos na cidade de Manaus, ... Centro de Ensino Literatus (CEL), Manaus, AM, Brazil [c] Universidade](https://static.fdocuments.us/doc/165x107/5c1f50b209d3f2f1388c7020/t-the-effects-of-brief-physical-conditioning-on-immune-citocinas-em-idosos.jpg)


