Poultry meat & eggs
77
agribusiness handbook Poultry Meat & Eggs
-
Upload
cakrawala-peternakan -
Category
Food
-
view
161 -
download
8
Transcript of Poultry meat & eggs
agrib
usiness
han
db
oo
k
Please address comments and enquiries to:
Investment Centre DivisionFood and Agriculture Organization of the United Nations (FAO)E-mail: [email protected]
Po
ult
ry M
eat
& E
ggs
Agr
ibus
ines
s H
andb
ook
PoultryMeat
& Eggs
PoultryMeat
& Eggs
agrib
usiness
han
db
oo
k
This handbook is part of a series of agribusiness manuals prepared by the FAO Investment Centre Division, in collaboration with FAO’s Rural Infrastructure and Agro-Industries Division. It was prepared for the EBRD Agribusiness team, under the FAO/EBRD programme of cooperation. The production of the manuals was financed by FAO and by the EBRD multidonor Early Transition Countries Fund and the Western Balkans Fund. The purpose of this handbook is to help agribusiness bankers and potential investors in the Early Transition countries (ETCs) and the Western Balkan countries (WBCs) to acquire basic knowledge about the technical features of poultry meat processing and to become acquainted with recent economic trends in the sector around the world, with a special focus on the ETCs and the WBCs. This volume was prepared by Inna Punda, FAO Agribusiness Expert, and reviewed by Dmitry Prikhodko, Economist, FAO Investment Centre Division, as well as by members of the EBRD Agribusiness team. Electronic copies can be downloaded from www.eastagri.org, where a database of agribusiness companies, including poultry meat processing companies that operate in the ETCs and the WBCs, is also available. Please send comments and suggestions for a future edition of the manual to [email protected].
The designations employed and the presentation of material in this information product do not imply the expression of any opinion whatsoever on the part of the Food and Agriculture Organization of the United Nations (FAO) concerning the legal or development status of any country, territory, city or area or of its authorities, or concerning the delimitation of its frontiers or boundaries. The mention of specific companies or products of manufacturers, whether or not these have been patented, does not imply that these have been endorsed or recommended by FAO in preference to others of a similar nature that are not mentioned. The views expressed in this information product are those of the author(s) and do not necessarily reflect the views of FAO.
All rights reserved. Reproduction and dissemination of material in this information product for educational or other non-commercial purposes are authorized without any prior written permission from the copyright holders provided the source is fully acknowledged. Reproduction of material in this information product for resale or other commercial purposes is prohibited without written permission of the copyright holders. Applications for such permission should be addressed to:
DirectorInvestment Centre DivisionFAOViale delle Terme di Caracalla, 00153 Rome, Italyor by e-mail to: [email protected]
© FAO 2010
Des
ign
and
page
layo
ut A
lber
to P
edro
Di S
anto
TABLE OF CONTENTS
ACRONYMS 5
1. INTRODUCTION 71.1 Characteristics of poultry meat 81.2 Different varieties of poultry meat 11
2. BROILERS FOR MEAT PRODUCTION 112.1 Classification of birds 112.2 Production process in the broiler industry 112.3 Breeding and feeding 132.4 Sale prices of live broilers 142.5 Average margins of producers 152.6 Problems with diseases 162.7 Environmental considerations and sustainability of poultry farming 17
3. CHICKEN SLAUGHTERING AND PROCESSING 193.1 Chickens and chicken parts 193.2 Description of poultry processing 193.3 Poultry by-products 213.4 Conversion factors for live animals 233.5 Broiler wholesale prices 24
4. THE BROILER INDUSTRY 254.1 Global poultry market 254.2 Consumption patterns 264.3 Global poultry meat production 284.4 The contribution of various meats to the global increase in meat production 324.5 The impact of sanitary and phytosanitary measures 334.6 Major industry players 334.7 Global trade in poultry meat 354.8 Prices of broiler meat 38
5. LAYING HENS FOR EGG PRODUCTION 395.1 Raising egg-laying hens 395.2 The composition and nutritional value of eggs 415.3 Egg products 415.4 Sale prices of hen eggs 435.5 Average margins of breeders 445.6 Egg production 465.7 Egg consumption 485.8 Trade in eggs 51
6. THE POULTRY AND EGG INDUSTRIES IN THE EARLY TRANSITION COUNTRIES (ETCs) AND THE WESTERN BALKAN COUNTRIES (WBCs) 55
6.1 Poultry meat consumption 556.2 Production of poultry meat and hen eggs in WBCs and the ETCs 586.3 Trade in poultry meat and eggs 636.4 Investment projects 69
7. FURTHER READING 71
ANNEX 1 73
ANNEX 2 75
5
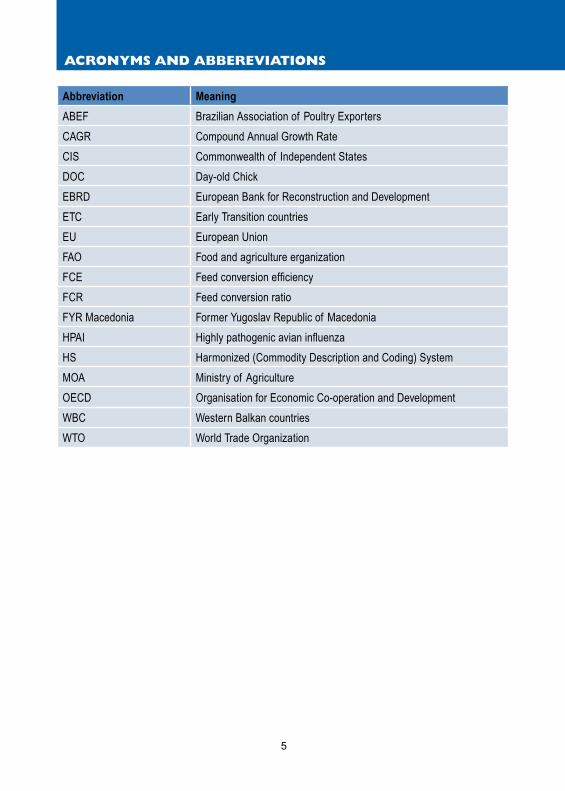
ACRONYMS AND ABBEREVIATIONS
Abbreviation Meaning
ABEF Brazilian Association of Poultry Exporters
CAGR Compound Annual Growth Rate
CIS Commonwealth of Independent States
DOC Day-old Chick
EBRD European Bank for Reconstruction and Development
ETC Early Transition countries
EU European Union
FAO Food and agriculture erganization
FCE Feed conversion efficiency
FCR Feed conversion ratio
FYR Macedonia Former Yugoslav Republic of Macedonia
HPAI Highly pathogenic avian influenza
HS Harmonized (Commodity Description and Coding) System
MOA Ministry of Agriculture
OECD Organisation for Economic Co-operation and Development
WBC Western Balkan countries
WTO World Trade Organization

7
1. INTRODUCTION
Pigeons, ducks, and geese were bred in China more than 3,000 years ago. Chickens, developed from Asian jungle fowl, were domesticated probably about the same time. In the sixteenth century, chickens were introduced into America from Europe and turkeys were introduced into Europe from America.
Although poultry eggs were artificially incubated in ancient China and Egypt, this method of hatching poultry was not used on a commercial scale until the 1870s. The modern poultry industry emerged in the late nineteenth century in Europe and America as breeders focused on improving meat and egg production. Research and technical innovations in poultry housing, feeding, and breeding have led to the rapid development of the industry since the 1930s.
Production and consumption of poultry products increased significantly during World War II when beef and pork were in limited supply. Since 1945, improved methods of storing and distributing poultry meat and eggs have helped stimulate consumption of these foods. Specialization in raising broilers has been important to the expansion of the poultry industry.
The current integrated poultry production system evolved from the many small, independent farms and companies that existed around the 1940s as hatcheries, feed mills and processing plants and then over the ensuing years integrated under a single ownership. In North America, the integration process was nearly completed by 1970.
1.1 Characteristics of poultry meat
Poultry, or domestic birds, are raised for their meat and eggs and are an important source of edible animal protein. Poultry meat accounts for 30% of global meat consumption. The worldwide average per capita consumption of poultry meat has nearly quadrupled since the 1960s (11 kg in 2003 compared with 3 kg in 19631).
Poultry meat and eggs are highly nutritious. The meat is rich in proteins and is a good source of phosphorus and other minerals, and of B-complex vitamins. Poultry meat contains less fat than most cuts of beef and pork. Poultry liver is especially rich in vitamin A. It has a higher proportion of unsaturated fatty acids than saturated fatty acids. This fatty acid ratio suggests that poultry may be a more healthful alternative to red meat.2
1 FAOSTAT. © FAO Statistics Division 2009.2 Encyclopedia Britannica.
8
The following five factors are believed to have contributed to the increasing popularity of chicken meat:
■ value/price compared with other foods;■ good nutritional profile/low in fat;■ convenience/ease of preparation;■ versatility; and■ well suited for quick-service and casual dining menus.
1.2 Different varieties of poultry meat
Poultry meat represents about 33% of global meat production: in 2007, some 269 million tons of meat were produced globally, of which 88 million tons were poultry meat.
Chickens and turkeys are the most common sources of poultry meat (87% and 6.7% of total poultry production, respectively). However, other commercially available poultry meats include meat from ducks (4% of total poultry production) and from geese, pigeons, quails, pheasants, ostriches and emus (combined about 2.7% of total poultry production). In the United States and Canada, turkey meat is the second most important poultry meat consumed after chicken meat; however, in other countries turkey meat is less important.
Chicken accounts for about 86% of all poultry raised worldwide. In the European Union (EU), chicken meat accounted for only 79% of all poultry meat produced in 2007, while turkey, duck, pigeon, geese and quail meat accounted for 15%. Hen eggs represent 92% of the global primary production of eggs.
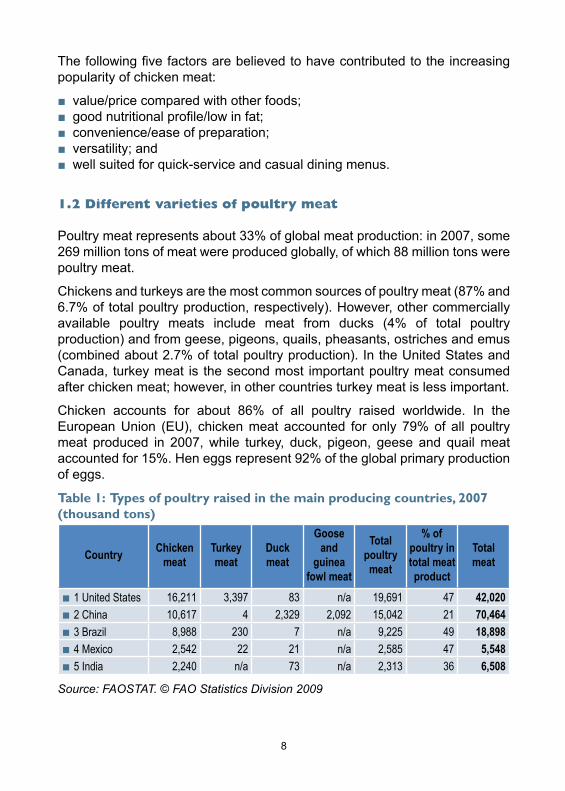
Table 1: Types of poultry raised in the main producing countries, 2007 (thousand tons)
CountryChicken
meatTurkey meat
Duck meat
Goose and
guinea fowl meat
Total poultry meat
% of poultry in total meat product
Total meat
■ 1 United States 16,211 3,397 83 n/a 19,691 47 42,020■ 2 China 10,617 4 2,329 2,092 15,042 21 70,464■ 3 Brazil 8,988 230 7 n/a 9,225 49 18,898■ 4 Mexico 2,542 22 21 n/a 2,585 47 5,548■ 5 India 2,240 n/a 73 n/a 2,313 36 6,508
Source: FAOSTAT. © FAO Statistics Division 2009
9
Broilers are the main type of chicken produced by modern integrated poultry raising facilities due to their high feed-meat conversion ratio. This handbook will, therefore, focus on broilers for meat production and laying hens for egg production.
The genetic line of broilers is Cornish cross (Cornish x White Rock) and the genetic lines of layers are Leghorn (white eggs) and Rhode Island Red and New Hampshire (brown eggs). The colour of the eggshell is directly influenced by the breed of the hen. Approximately 50% of the eggs produced in the world are brown and 50% are white.

11
2. BROILERS FOR MEAT PRODUCTION
A broiler is a type of chicken specially bred for meat production because it grows much faster than an egg breed of chicken.
2.1 Classification of birds
Broilers are generally grown for a specific number of days and until they reach a specific weight. In North America, seven-week-old chickens are classified as broilers or fryers and fourteen-week-old chickens are classified as roasters3.
2.2 Production process in the broiler industry
In the modern poultry industry, producers usually do not own the primary breeding stock (i.e. the parent lines supplying their operation). They purchase birds from primary breeders. Specialized firms and institutes obtain chicks from hybrid lines selected for specific characteristics such as resistance to diseases, growth curve and adaptation to certain types of feed.
The average growth cycle is about six weeks for a broiler. The length of the cycle is influenced by the degree to which the feeding diet is balanced and considers the cost of feed per 1 kg of meat produced, the feed-to-meat conversion ratio and the sale price of boiler meat. Feed quality, heat regulation, veterinary/sanitary control and animal density within breeding houses (on average 10 animals/m²) are the most important factors affecting growth.
After six weeks, broilers reach an average weight of 2.5 kg. They are then gathered into cages and sold to processors for slaughtering. In broiler meat production, cages are used only for transportation purposes and not for containing broilers during their growth.
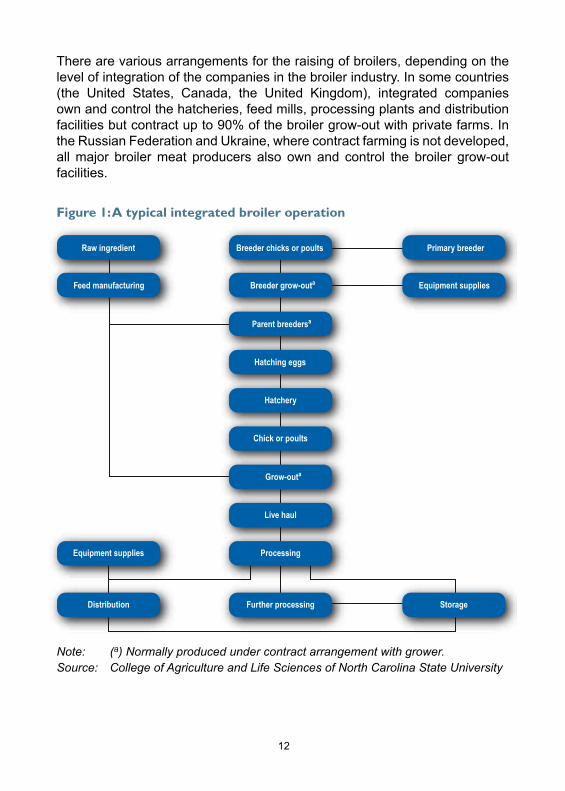
Figure 1 depicts the following major elements of a modern broiler production chain:
■ the hatching – the egg farm provides fertile eggs to the hatchery; ■ the hatchery where fertile eggs incubate and day-old chicks (DOCs) hatch
from the eggs. All healthy DOCs are sent to broiler grow-out facilities. The DOCs are raised for about 42 days, and after that time they are ready for slaughter or to be sold live; and
■ the processing plant where birds are slaughtered and either prepared as ready-to-cook whole chicken or cut-up chicken parts, or further processed into deboned chicken, polony and viennas.
3 Encyclopedia Britannica.
12
There are various arrangements for the raising of broilers, depending on the level of integration of the companies in the broiler industry. In some countries (the United States, Canada, the United Kingdom), integrated companies own and control the hatcheries, feed mills, processing plants and distribution facilities but contract up to 90% of the broiler grow-out with private farms. In the Russian Federation and Ukraine, where contract farming is not developed, all major broiler meat producers also own and control the broiler grow-out facilities.
Figure 1: A typical integrated broiler operation
Note: (a) Normally produced under contract arrangement with grower.Source: College of Agriculture and Life Sciences of North Carolina State University
Parent breedersa
Hatching eggs
Breeder grow-outa
Breeder chicks or poults
Equipment supplies
Primary breeder
Feed manufacturing
Raw ingredient
Hatchery
Chick or poults
Grow-outa
Live haul
ProcessingEquipment supplies
Further processing StorageDistribution
13
The advantages of farming broilers over other animals are:■ broilers have a growth cycle of six to seven weeks, which allows for repeated
production throughout the year;■ more broilers than layers can be placed in a shed; ■ broilers have high feed conversion efficiency (FCE)4 in comparison with
other birds or livestock. FCE of broilers is 2, of turkeys is 2.5 and of ducks is 2.5–3. FCE depends on many factors, including the age of birds, feed quality, duration of lighting, etc. Cattle need more than 8 kg of feed per head to put on 1 kg of live weight per head, a ruminant will convert about 7 kg of feed to 1 kg of meat and a pig will convert about 3.5 kg of feed to 1 kg of meat;
■ return from the investment in broilers is fast. Different growth cycles have a direct impact on net cash flow. For example, eight generations of birds can be raised per year compared with from two to two-and-one-half generations of pigs and less than one generation (0.8) of cattle; and
■ high consumer demand and preference for broilers.
Today’s poultry industry is characterized by vertical integration whereby a single company owns the facilities and controls the breeding, hatching and/or processing of broilers but contracts with private poultry farmers for the raising of the chicks (up to 90% of grow-out may take place on private farms). Although an integrated company (e.g. Piligrim’s Pride Corp. or Tyson Foods, Inc.), referred to as an integrator, owns the birds and provides feed, medication and other supplies, the grower owns the chicken house and provides litter, labour and utilities.
2.3 Breeding and feeding
Until the 1950s, all poultry was raised outdoors and sunlight provided a natural source of vitamin D. In the 1950s, producers turned to indoor confinement of poultry for the protection of chicks from predators, tighter control of operations, greater labour efficiency and disease control. The advent of synthetic vitamin D permitted total indoor production.
There are two systems of poultry raising: extensive and intensive production.
4 Feed conversion ratio (FCR), feed conversion rate or feed conversion efficiency (FCE) is a measure of an animal’s efficiency in converting feed mass into increased body mass, i.e. least amount of feed that is required for unit body weight gain. Animals that have a low FCR are considered efficient users of feed.
14
2.3.1 The extensive (or pasture-based) production systemFrom a production standpoint, birds are pastured to obtain nutrients from the pasture, improve land fertility and improve bird health. Poultry obtain nutrients from young, vegetative forage plants but because they cannot digest cellulose as ruminants do, they do not make use of the vast energy stored in the plant fibre. In addition to foraging for plants, poultry in pasture also forage for seeds and live protein such as worms and insects. Extensive breeding is largely practiced in developing countries where natural native genetic lines are used.
Small farmers raise poultry in “free-range” or pasture-based systems that are part of a diversified farm.
There is a niche market for “free-range” poultry, which is rare in the modern industry. Most producers would rather not expose birds to predators and wildlife to avoid diseases. However, some farmers manage this type of production successfully and obtain premium prices for their poultry (for instance, in France, up to 30% of poultry is produced on range under the Label Rouge certification programme). However, the price premium for “free-range” chickens in the EU, North America and other developed markets should be viewed against consumer disposable income and willingness to pay for this type of product.
2.3.2 The intensive (or cereal-oilseed protein-based) production systemUnder the intensive system, all the nutrients required by the birds must be provided in the feed, usually in the form of a balanced and mixed feed.
The following main features distinguish an intensive poultry production system from an extensive poultry production system:
■ Intensive range poultry production can be a stand-alone enterprise and requires only a small amount of land. However, careful manure management is needed to prevent environmental damage.
■ Extensive range poultry production requires much more land and is usually part of a diversified operation with ruminants. Mixed husbandry can be very important in range poultry production.
2.4 Sale prices of live broilers
Poultry prices may vary significantly, influenced by seasonal patterns, input costs and relative costs of competing meats.
Production costs are very volatile. They greatly depend on the desired characteristics of the final product (whether chicken of a brand name or of low quality) and also on feed prices (mainly grain prices), climatic conditions and the genetic lines used. Therefore, they vary considerably from one region to another region.

15
Figure 2: Producer prices of chicken meat in selected countries (USD/ton of live weight)
Note: 2007 data. Source: FAOSTAT. © FAO Statistics Division 2009
2.5 Average margins of producers
Margins for producers of broilers largely depend on final product characteristics (quality, brand, brand name). Indeed, high quality meat usually requires a longer growing period, which means higher production costs because more feed is used, as well as slightly increased costs of other miscellaneous variables. The choice of final product characteristics is largely determined by how much consumers are prepared to pay for high quality broilers.
An approximate average gross margin calculation for broilers is provided in Table 2.
Prod
uctio
n, th
ousa
nd to
ns
18,000
16,000
14,000
12,000
10,000
8,000
6,000
4,000
2,000
1,800
1,600
1,400
1,200
1,000
800
600
400
200
RussianFederation
IndiaMexicoBrazilChinaUnited States
Ukraina

16
Table 2: Broiler contribution margin for 100,000 birds in British Columbia, Canada (target weight 1.92 kg/bird)
Income Yield Price USD Unit Income USD
Broiler sales 1,920 1.365 kg 2,621
Condemnations (13.5) 1.365 kg (18.43)
Total income 2,602
Direct expenses Quantity Price USD Unit Expense USD
Feed 3,456 0.398 kg 1,375
Chicks (vaccinated) 1,053 0.560 kg 593
Levies 1,920 0.010 kg 19
Medications 30
Catching 40
Litter 24
Waste removal (litter & dead birds) 30
Energy and water 77
Maintenance and repairs 17
Total direct expenses 2,206
Contribution margin 397
Contribution margin/broiler 0.40
Contribution margin/kg 0.21
Source: British Columbia Ministry of Agriculture, Fisheries and Food
One of the important by-products of poultry production is the manure, which has a significant economic value, be it sold by producers or directly applied by producers to the crops grown.
2.6 Problems with diseases
Biosecurity and sanitation are necessary to prevent disease outbreaks. Biosecurity involves isolating birds by age group, restricting human access to buildings, keeping the buildings clean and properly disposing of dead birds.
17
2.7 Environmental considerations and sustainability of poultry farming
It takes less than 2 kg of cereals to produce 1 kg of chicken meat as compared with 4 kg of cereals to produce 1 kg of pork. This feed conversion ratio (FCR) (2:1 or less) is better than that of livestock or other poultry. Compared with cattle, chickens emit no methane and emit less phosphate and carbon dioxide than other meat-producing animals. The modern broiler industry raises more food on less land with less input than any other terrestrial food animal industry. If carefully managed, poultry litter (manure) can also be processed for commercial fertilizer.
Recent research5 suggests, contrary to widespread belief, that intensive (housed) poultry production may have a lesser impact on the environment and global warming than organic or free-range production. Organic poultry has a higher FCR and a longer growing period for the heavier chickens that are produced, resulting in a net increase in energy requirement for organic poultry meat production. Organic egg production also needs more energy than non-organic egg production and increases most environmental burdens (except pesticides).
5 Life Cycle Assessment by Cranfield University in Silsoe, United Kingdom.

19
3. CHICKEN SLAUGHTERING AND PROCESSING
The most common product produced in poultry slaughterhouses is the whole bird. However, poultry meat can be further processed into various products based on the type of poultry meat desired (e.g. from simple cuts to ready-to-eat meals). In fact, during recent years there has been a shift from fresh, whole-bird sales to sales of cut-up bird parts and convenience products because these products have higher value.
3.1 Chickens and chicken parts
Whole chickens are available fresh, frozen, bone-in, boneless, uncooked, fully cooked and seasoned.
Chicken parts are available as drumsticks, thighs, wings and breasts (see Annex 1 for further details). They are also available as legs (drumstick and thigh attached), leg quarters, breast quarters, breast halves and poultry halves. Wingettes and drummettes made from the wing are available. Chicken products taken from the breast and wing are considered white meat and the products taken from the drumstick and thigh are considered dark meat.
Cutting up and further processing chickens add value to the product and increase convenience to consumers.
3.2 Description of poultry processing
3.2.1 Poultry processing operationsBecause poultry meat is a perishable product (chilled poultry meat must be sold to consumers within 72 hours after processing), the conception/organization of the slaughterhouse must be closely adapted to feed cost and availability, meat supply conditions and consumer markets (average weight and age of animals, available quantity of animals per week and seasonality of supplies).
Annex 2 provides a simplified diagram of the various operations performed in poultry processing.
■ Preprocessing6 The birds are usually transported by truck to the poultry slaughterhouse. Upon arrival, the birds are held in the reception area in the transport crates,
6.Based on Environmental, Health, and Safety Guidelines. Poultry Processing. IFC 04/2007.
20
pending veterinarian inspection. In most countries, the official veterinarian then inspects each transport crate of live birds to approve them for human consumption. Sick birds are killed and disposed of. After inspection, the birds are removed from the crates in the reception area and put on the killing line. The birds are hung upside down by their feet by shackles on a conveyor, which moves them to the stunning area. Once the birds are shackled, stunning is carried out using one of three possible methods that include (i) an electrically-charged water bath, (ii) gas inhalation or (iii) a blow to the head using a blunt object.
■ Slaughtering, bleeding and scaldingSlaughtering can be performed manually or by using an automatic circular-knife system. The birds should bleed for at least two minutes to ensure a total bleed-out. The blood is collected in a tank and handled as an animal by-product for further processing.
After bleeding, the birds are exposed to either steam or hot water as part of the scalding procedure. Scalding loosens the feathers and facilitates plucking.
■ Further processing and eviscerationFeathers are removed in a specially designed plucking machine or by hand. Feathers are collected and treated as an animal by-product. The birds are showered with water during the automated plucking operation and the feathers are collected in a trough under the plucking machine. Following scalding and plucking activities, the head and feet are removed. Inedible organs, including the intestinal tract and lungs, are removed and treated as animal by-products. The eviscerated carcass should be rinsed internally and externally with potable water before further processing. Depending on country-specific regulations, companies may use disinfectants (chlorine or tri-sodium phosphate solutions) to reduce the bacteriological contamination on meat surfaces.
■ Storing and packagingAfter rinsing, the carcass should be cooled as quickly as possible to or below 4 °C. Several methods are used for chilling, including: air chilling, which takes place in either a chill room or by continuous air blast; spray chilling whereby water aerosols are added to the air; and immersion chilling, which involves moving carcasses through a counter-flow current in a water bath.
Birds are weighed individually and sorted according to their weight. After weighing, the birds are inspected visually and categorized. Whole birds are typically packed in plastic bags or in containers wrapped in film. Birds
21
are stored before sale at or below 4 °C. Birds intended to be sold as quick-frozen poultry are frozen in a blast freezer or similar equipment that enables rapid freezing.
■ Cleaning of the processing plantCleaning of the plant is one of the most important tasks in a poultry processing plant. Some rinsing and cleaning should occur during working hours. After working hours, a total cleaning and disinfection of the plant is carried out, normally on a daily basis. Cleaning involves the following major steps, including disassembling of machinery and equipment, as necessary; physical removal of solid material; cycles of rinsing and washing; disinfection; drying; and application of lubricants.
■ RenderingRendering is the heat treatment of animal by-products to eliminate the risk of spreading disease to animals and humans and to produce usable products such as proteins and fat. Rendering involves evaporative processes that may generate a foul odour.
3.3 Poultry by-products
3.3.1 Low-risk materialLow-risk by-products are by-products obtained from poultry that have been approved as fit for human consumption (e.g. blood, heads and feet).
Blood is collected in a separate tank. Depending on the storage time before further processing, the need for cooling and chemicals that can prevent coagulation should be considered. Blood is filtered and spray-dried to produce blood meal. Blood meal can be used for feeding fish, pets and other animals.
Feathers are collected in a separate container. Before transfer to the container, water from the scalding process has to be pressed out of the feathers. Because the plucking process can remove portions of the heads as well, some head bits may be present among the feathers. Feathers can be burned to produce heat or processed with heat to hydrolyze the proteins. The low-value proteins from feathers can be used in pet food or animal feed.
Heads and feet that are not destined for human consumption are collected in a separate container. When these by-products are to be used for human consumption, they should be approved during the inspection process. Typically, feet used for human consumption are heat treated in order to remove skin and nails before packing. Heads are normally not used for human consumption, although duck tongues are consumed in some countries.
22
3.3.2 High-risk materialHigh-risk by-products include birds that have died for reasons other than slaughtering, condemned birds, and condemned parts of birds, as well as all other by-products not intended for human consumption. Solid organic material that is captured in the wastewater treatment system screens and has a particle size of 6 mm or greater should also be treated as a high-risk by-product and sent for rendering. Grids used in the slaughterhouse and prefiltering of waste streams should be designed so that these kinds of animal by-products can be recovered and sent for rendering.
3.3.3 Processing of by-productsBy-products should be collected in separate containers, which are isolated in such a way that food safety is not jeopardized. The containers should be covered to prevent wild birds and animals from coming into contact with the material they contain. At the rendering plant, the materials are chopped up and then heated under pressure (e.g. in the conventional batch dry rendering method) to kill micro-organisms and remove moisture.
The liquefied fat and solid protein are separated by centrifugation or pressing. The solid product can then be ground into various animal protein powders for animal feed or pet food.
The effectiveness of the heat process used for rendering depends on various factors, including the holding time, the core temperature and the particle size of the products treated. The rendering process should produce final products that are free from salmonella and clostridium and contain only a limited number of enterobacteriaceae.
3.3.4 Environmental aspects ■ Waste and wastewater Water contamination has become a major issue
confronting industrial poultry operators.■ Chicken manure Almost 18 billion birds are raised each year in the world
and produce more than 22 million tons of manure. Poultry manure is rich in nitrogen and phosphorous and contaminates groundwater and surface waterways such as rivers and bays. Ammonia gas must be ventilated from the chicken houses and can contaminate soil and water. Arsenic, an additive to chicken feed, contaminates litter or waste generated each year by the broiler chicken industry and also contaminates the communities in which it is generated or disposed.
■ Chicken processing Chicken guts, heads, feathers, blood and wastewater that remain from the processing are rendered down to their essence before being hauled as sludge to fertilize farmlands in the area. Treated wastewater
23
is released into nearby streams or sprayed on farmlands in the area.■ Water use. Three thousand five-hundred litres of water are used in the
production of 1 kg of meat. Modern broiler houses (e.g. typically 500 ft long) require almost 38 litres of water per minute.
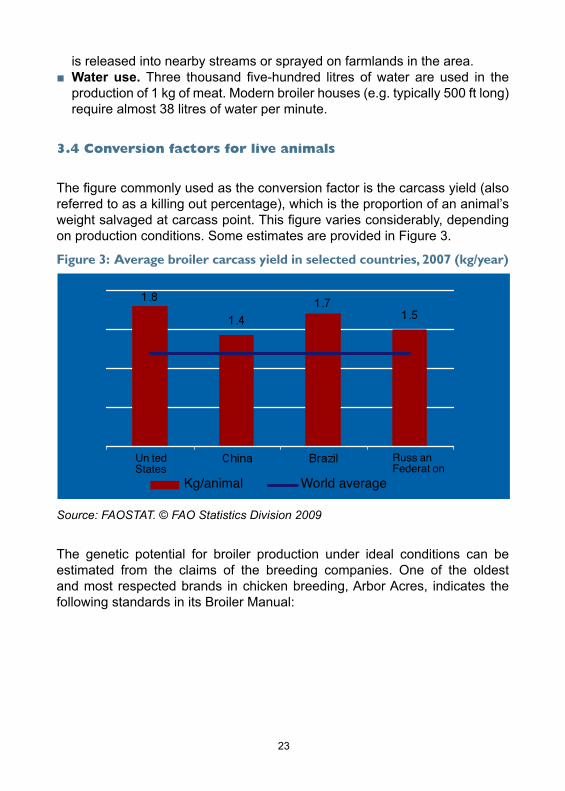
3.4 Conversion factors for live animals
The figure commonly used as the conversion factor is the carcass yield (also referred to as a killing out percentage), which is the proportion of an animal’s weight salvaged at carcass point. This figure varies considerably, depending on production conditions. Some estimates are provided in Figure 3.
Figure 3: Average broiler carcass yield in selected countries, 2007 (kg/year)
Source: FAOSTAT. © FAO Statistics Division 2009
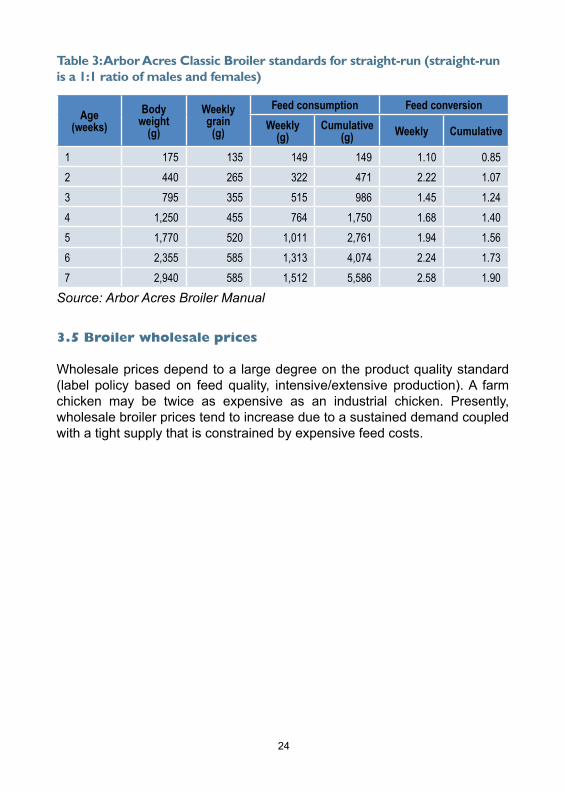
The genetic potential for broiler production under ideal conditions can be estimated from the claims of the breeding companies. One of the oldest and most respected brands in chicken breeding, Arbor Acres, indicates the following standards in its Broiler Manual:
Russ anFederat on
Un ted States
Kg/animal World average
24
Table 3: Arbor Acres Classic Broiler standards for straight-run (straight-run is a 1:1 ratio of males and females)
Age(weeks)
Bodyweight
(g)
Weeklygrain
(g)
Feed consumption Feed conversion
Weekly(g)
Cumulative (g) Weekly Cumulative
1 175 135 149 149 1.10 0.85
2 440 265 322 471 2.22 1.07
3 795 355 515 986 1.45 1.24
4 1,250 455 764 1,750 1.68 1.40
5 1,770 520 1,011 2,761 1.94 1.56
6 2,355 585 1,313 4,074 2.24 1.73
7 2,940 585 1,512 5,586 2.58 1.90
Source: Arbor Acres Broiler Manual
3.5 Broiler wholesale prices
Wholesale prices depend to a large degree on the product quality standard (label policy based on feed quality, intensive/extensive production). A farm chicken may be twice as expensive as an industrial chicken. Presently, wholesale broiler prices tend to increase due to a sustained demand coupled with a tight supply that is constrained by expensive feed costs.
25
4. THE BROILER INDUSTRY
4.1 Global poultry market
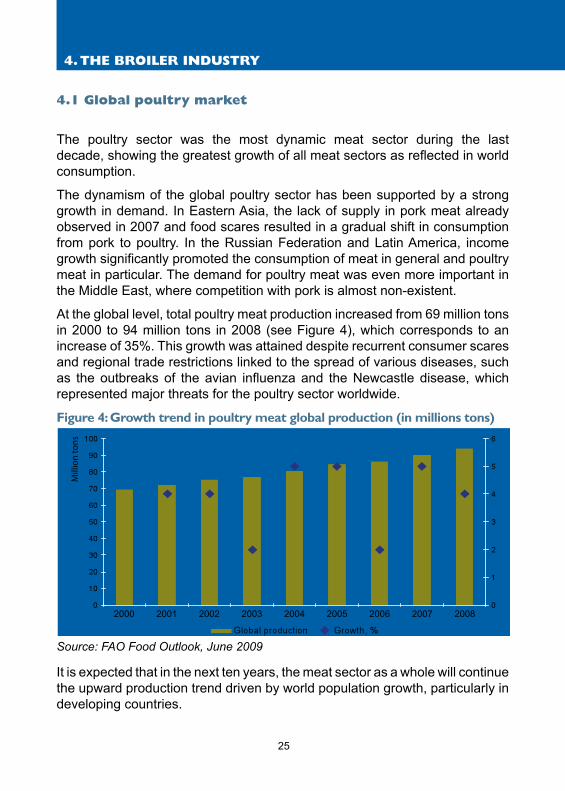
The poultry sector was the most dynamic meat sector during the last decade, showing the greatest growth of all meat sectors as reflected in world consumption.
The dynamism of the global poultry sector has been supported by a strong growth in demand. In Eastern Asia, the lack of supply in pork meat already observed in 2007 and food scares resulted in a gradual shift in consumption from pork to poultry. In the Russian Federation and Latin America, income growth significantly promoted the consumption of meat in general and poultry meat in particular. The demand for poultry meat was even more important in the Middle East, where competition with pork is almost non-existent.
At the global level, total poultry meat production increased from 69 million tons in 2000 to 94 million tons in 2008 (see Figure 4), which corresponds to an increase of 35%. This growth was attained despite recurrent consumer scares and regional trade restrictions linked to the spread of various diseases, such as the outbreaks of the avian influenza and the Newcastle disease, which represented major threats for the poultry sector worldwide.
Figure 4: Growth trend in poultry meat global production (in millions tons)
Source: FAO Food Outlook, June 2009
It is expected that in the next ten years, the meat sector as a whole will continue the upward production trend driven by world population growth, particularly in developing countries.
2000 2001 2002 2003 2004 2005 2006 2007 2008
Mill
ion
tons
26
4.2 Consumption patterns
With continued economic growth, protein demand in developing countries also is increasing especially for low-priced foods such as poultry and eggs. Also consumer preferences are changing in many developed countries. Demand for low-calorie food products and changes in lifestyle, which reduce the time consumers wish to spend on food preparation, have been observed in the past and will likely continue in the future. Again, it is mainly poultry meat that complies with increased consumer demands for lean and easy-to-cook meat.
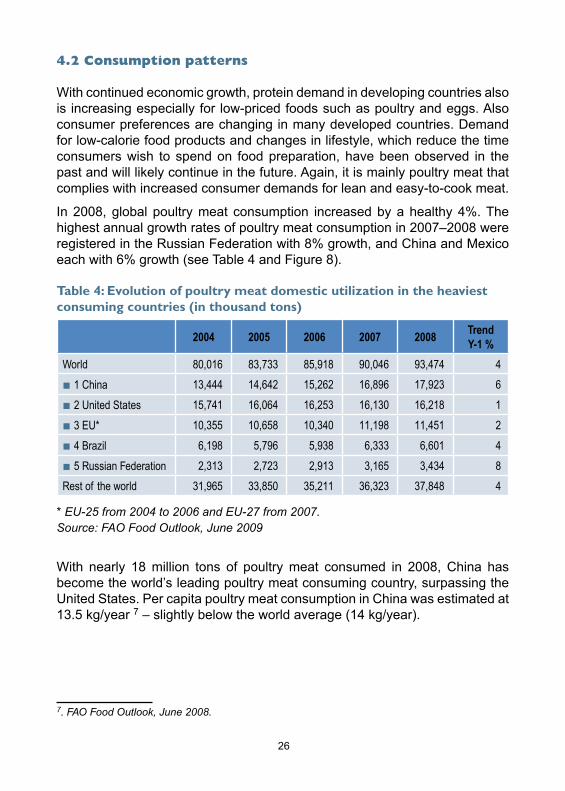
In 2008, global poultry meat consumption increased by a healthy 4%. The highest annual growth rates of poultry meat consumption in 2007–2008 were registered in the Russian Federation with 8% growth, and China and Mexico each with 6% growth (see Table 4 and Figure 8).
Table 4: Evolution of poultry meat domestic utilization in the heaviest consuming countries (in thousand tons)
2004 2005 2006 2007 2008Trend Y-1 %
World 80,016 83,733 85,918 90,046 93,474 4
■ 1 China 13,444 14,642 15,262 16,896 17,923 6
■ 2 United States 15,741 16,064 16,253 16,130 16,218 1
■ 3 EU* 10,355 10,658 10,340 11,198 11,451 2
■ 4 Brazil 6,198 5,796 5,938 6,333 6,601 4
■ 5 Russian Federation 2,313 2,723 2,913 3,165 3,434 8
Rest of the world 31,965 33,850 35,211 36,323 37,848 4
* EU-25 from 2004 to 2006 and EU-27 from 2007.Source: FAO Food Outlook, June 2009
With nearly 18 million tons of poultry meat consumed in 2008, China has become the world’s leading poultry meat consuming country, surpassing the United States. Per capita poultry meat consumption in China was estimated at 13.5 kg/year 7 – slightly below the world average (14 kg/year).
7. FAO Food Outlook, June 2008.

27
Figure 5: Shares of leading countries in global consumption of poultry meat, 2008
Source: FAO Food Outlook, June 2009
In the EU, per capita poultry meat consumption has been stable at the level of 24 kg/year (2008 data, 23 kg/year in 2004). Population growth induced a slight increase in consumption, which reached 11.5 million tons of poultry meat in 2008 or 2% more than in the previous period.
In the Russian Federation, poultry meat consumption has grown rapidly in recent years. In 2008, Russia’s per capita consumption reached 24.7 kg (close to the EU-average of 23.6) as compared with 16.2 kg in 2004.
Table 5: Consumption of poultry meat in selected countries (kg/capita/year)
2007 2008 2008/2007
World average 13.6 14.0 3%
■ 1 Qatar 92.4 99.2 7%
■ 2 United Arab Emirates 89.1 93.3 5%
■ 3 Israel 71.4 71.6 0%
■ 4 Hong Kong 53.9 54.8 2%
■ 5 United States 52.7 52.5 0%
Developed countries 27.7 28.4 2%
Developing countries 9.8 10.1 3%
EU including Baltic states 23.1 23.6 2%
CIS 16.4 18.3 12%
Source: FAO Food Outlook, June 2009
2 United States 17%
1 China 19%
3 EU 12%
Rest of the world 41% 4 Brazil 7%
5 Russian Federation 4%

28
In developing countries, poultry meat consumption growth is much more pronounced than in developed countries.
Figure 6: Poultry meat domestic utilization five-year CAGR* (growth 2008/2003, %)
* Compound Annual Growth Rate (CAGR).Source: FAO Food Outlook, June 2009
4.3 Global poultry meat production
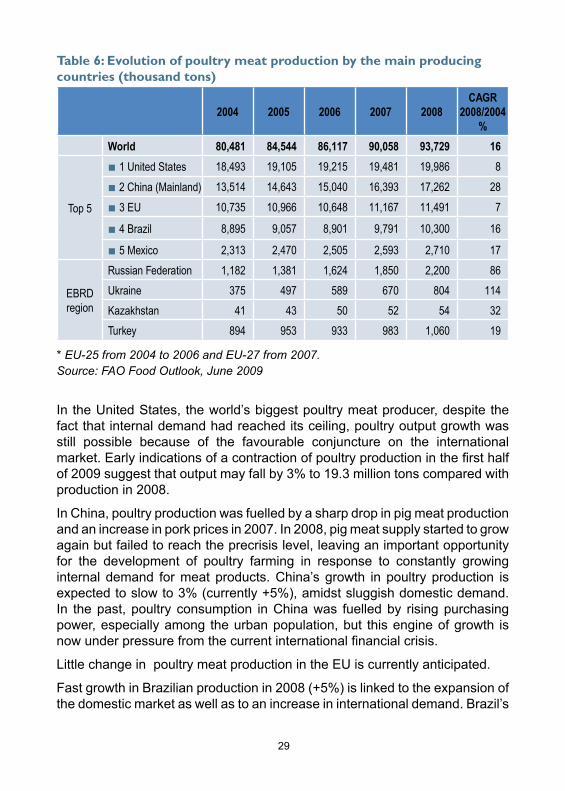
Despite high feed costs (due to high prices of cereals and oilseeds in 2007–2008), poultry meat production continued to grow and reached 93.7 million tons in 2008 (see Table 6). This phenomenon (production growth despite high cereal prices that imply higher production costs) can be explained by the fact that poultry meat is a very efficient way to transform vegetable mass into meat protein. Consequently, cereal price growth impacts on poultry production costs to a lesser extend than on other meat production.
29
Table 6: Evolution of poultry meat production by the main producing countries (thousand tons)
2004 2005 2006 2007 2008CAGR
2008/2004 %
World 80,481 84,544 86,117 90,058 93,729 16
Top 5
■ 1 United States 18,493 19,105 19,215 19,481 19,986 8
■ 2 China (Mainland) 13,514 14,643 15,040 16,393 17,262 28
■ 3 EU 10,735 10,966 10,648 11,167 11,491 7
■ 4 Brazil 8,895 9,057 8,901 9,791 10,300 16
■ 5 Mexico 2,313 2,470 2,505 2,593 2,710 17
EBRD region
Russian Federation 1,182 1,381 1,624 1,850 2,200 86
Ukraine 375 497 589 670 804 114
Kazakhstan 41 43 50 52 54 32
Turkey 894 953 933 983 1,060 19
* EU-25 from 2004 to 2006 and EU-27 from 2007. Source: FAO Food Outlook, June 2009
In the United States, the world’s biggest poultry meat producer, despite the fact that internal demand had reached its ceiling, poultry output growth was still possible because of the favourable conjuncture on the international market. Early indications of a contraction of poultry production in the first half of 2009 suggest that output may fall by 3% to 19.3 million tons compared with production in 2008.
In China, poultry production was fuelled by a sharp drop in pig meat production and an increase in pork prices in 2007. In 2008, pig meat supply started to grow again but failed to reach the precrisis level, leaving an important opportunity for the development of poultry farming in response to constantly growing internal demand for meat products. China’s growth in poultry production is expected to slow to 3% (currently +5%), amidst sluggish domestic demand. In the past, poultry consumption in China was fuelled by rising purchasing power, especially among the urban population, but this engine of growth is now under pressure from the current international financial crisis.
Little change in poultry meat production in the EU is currently anticipated.
Fast growth in Brazilian production in 2008 (+5%) is linked to the expansion of the domestic market as well as to an increase in international demand. Brazil’s
30
output was forecasted to grow by only 2% in 2009, as farmers were requested by the Brazilian Association of Poultry Exporters (ABEF) to reduce production for export to counter the difficult world market situation.
In the Russian Federation, production benefited from the dynamism of internal demand as well as from the different measures regularly undertaken by the local authorities that aim to reduce the country’s dependence on imports (import quotas, sanitary barriers). Production growth in the Russian Federation may slow to 9%, weaker than the growth of 16% on average witnessed during the last two years.
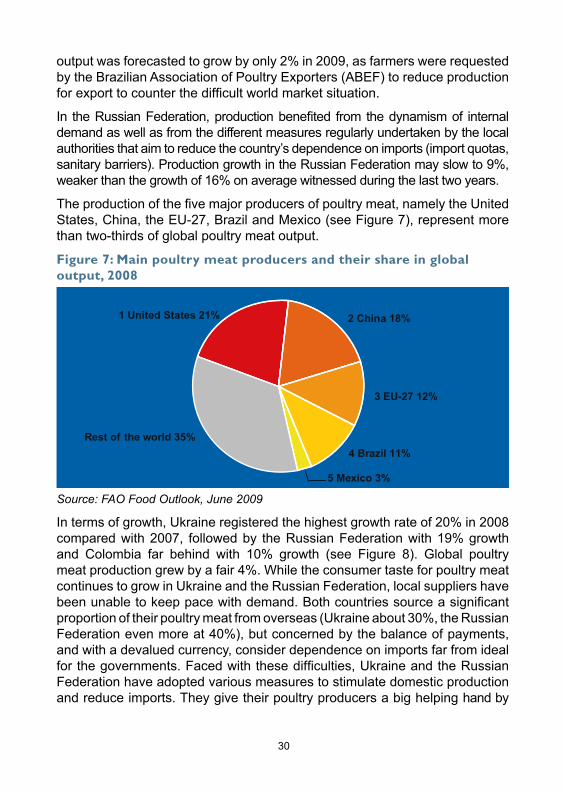
The production of the five major producers of poultry meat, namely the United States, China, the EU-27, Brazil and Mexico (see Figure 7), represent more than two-thirds of global poultry meat output.
Figure 7: Main poultry meat producers and their share in global output, 2008
Source: FAO Food Outlook, June 2009
In terms of growth, Ukraine registered the highest growth rate of 20% in 2008 compared with 2007, followed by the Russian Federation with 19% growth and Colombia far behind with 10% growth (see Figure 8). Global poultry meat production grew by a fair 4%. While the consumer taste for poultry meat continues to grow in Ukraine and the Russian Federation, local suppliers have been unable to keep pace with demand. Both countries source a significant proportion of their poultry meat from overseas (Ukraine about 30%, the Russian Federation even more at 40%), but concerned by the balance of payments, and with a devalued currency, consider dependence on imports far from ideal for the governments. Faced with these difficulties, Ukraine and the Russian Federation have adopted various measures to stimulate domestic production and reduce imports. They give their poultry producers a big helping hand by
1 United States 21% 2 China 18%
3 EU-27 12%
Rest of the world 35%
4 Brazil 11%
5 Mexico 3%
31
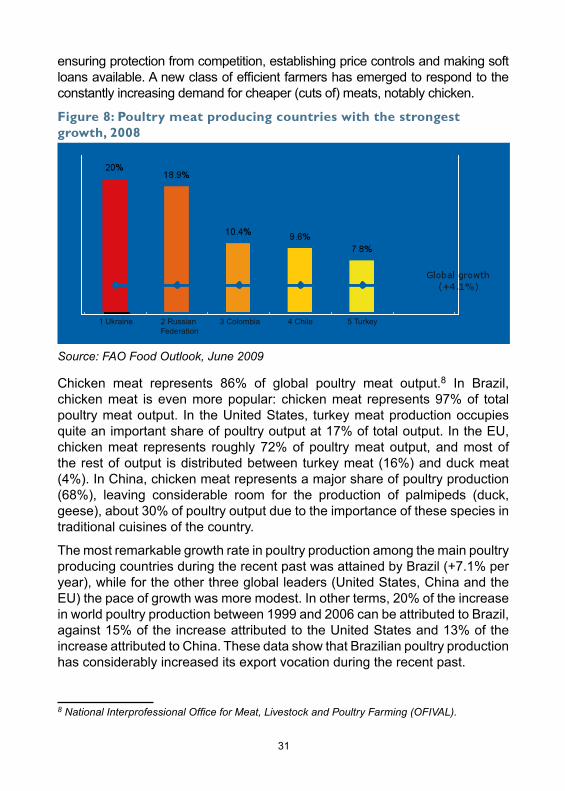
ensuring protection from competition, establishing price controls and making soft loans available. A new class of efficient farmers has emerged to respond to the constantly increasing demand for cheaper (cuts of) meats, notably chicken.
Figure 8: Poultry meat producing countries with the strongest growth, 2008
Source: FAO Food Outlook, June 2009
Chicken meat represents 86% of global poultry meat output.8 In Brazil, chicken meat is even more popular: chicken meat represents 97% of total poultry meat output. In the United States, turkey meat production occupies quite an important share of poultry output at 17% of total output. In the EU, chicken meat represents roughly 72% of poultry meat output, and most of the rest of output is distributed between turkey meat (16%) and duck meat (4%). In China, chicken meat represents a major share of poultry production (68%), leaving considerable room for the production of palmipeds (duck, geese), about 30% of poultry output due to the importance of these species in traditional cuisines of the country.
The most remarkable growth rate in poultry production among the main poultry producing countries during the recent past was attained by Brazil (+7.1% per year), while for the other three global leaders (United States, China and the EU) the pace of growth was more modest. In other terms, 20% of the increase in world poultry production between 1999 and 2006 can be attributed to Brazil, against 15% of the increase attributed to the United States and 13% of the increase attributed to China. These data show that Brazilian poultry production has considerably increased its export vocation during the recent past.
8 National Interprofessional Office for Meat, Livestock and Poultry Farming (OFIVAL).
1 Ukraine 3 Colombia 4 Chile 5 Turkey2 Russian Federation
32
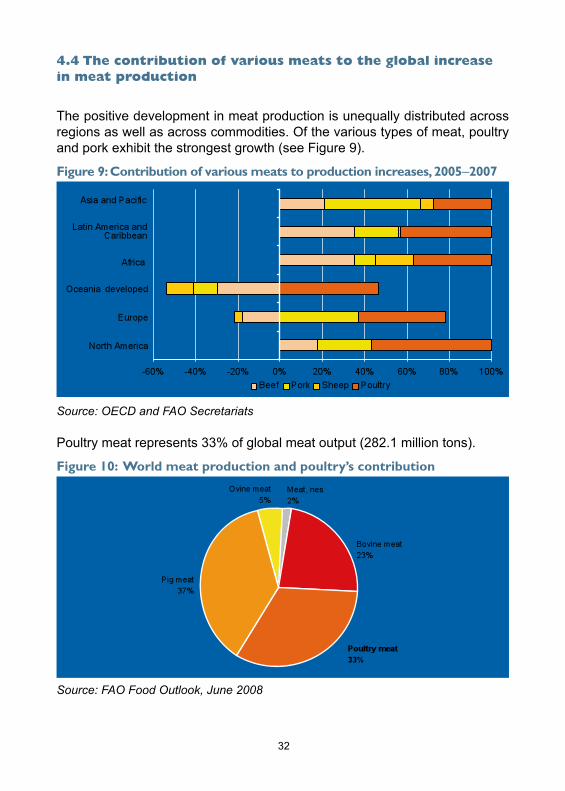
4.4 The contribution of various meats to the global increase in meat production
The positive development in meat production is unequally distributed across regions as well as across commodities. Of the various types of meat, poultry and pork exhibit the strongest growth (see Figure 9).
Figure 9: Contribution of various meats to production increases, 2005–2007
Source: OECD and FAO Secretariats
Poultry meat represents 33% of global meat output (282.1 million tons).
Figure 10: World meat production and poultry’s contribution
Source: FAO Food Outlook, June 2008
33
Nevertheless, the growth in chicken meat production has slightly slowed in 2008 (4% compared with 2007, see Figure 10). Slower growth is a reaction to generally low returns on chicken production caused by the economic troubles during 2001–2003, trade disruptions, avian influenza and, most recently, higher grain prices.
4.5 The impact of sanitary and phytosanitary measures
The outlook for global poultry meat production has been revised downwards since November 2008 to 94.7 million tons, largely because of the avian influenza epidemic in Asia, where numerous outbreaks have been reported since the end of last year. At the forecast level, global poultry meat production will increase by a mere 1% compared with 2008, reflecting the slower pace of growth during the past decade. Although the price of feeds, a key component of costs, fell in the last quarter of 2008, poultry meat prices remained stable, but in early 2009, the price of poultry meat fell when consumer demand started to falter, portending another year of low profits or even losses.
4.6 Major industry players
The global chicken trade is dominated by large, multinational companies – mainly based in the United States – which are commonly referred to as “integrators” because they run a vertically integrated production process whereby each firm controls every stage of its operation from the embryo to the market shelf (production, processing and distribution controlled by a single entity). The integrators coordinate the supply of chickens through a system of contracts with growers. Growers (poultry farmers) provide the land, buildings, equipment, utilities and labour in the raising of birds to a marketable age, while the companies supply the chickens, feed and medication and buy back the mature birds.
The share of the United States market of poultry industry leaders, such as Tyson Foods, Pilgrim’s Pride Corp., Perdue and Sanderson Farms, grew from 35% in 1986 to 50% in 20019. In 1950, for example, there were over 250 firms operating in the United States broiler industry and today there are fewer than 50 firms.
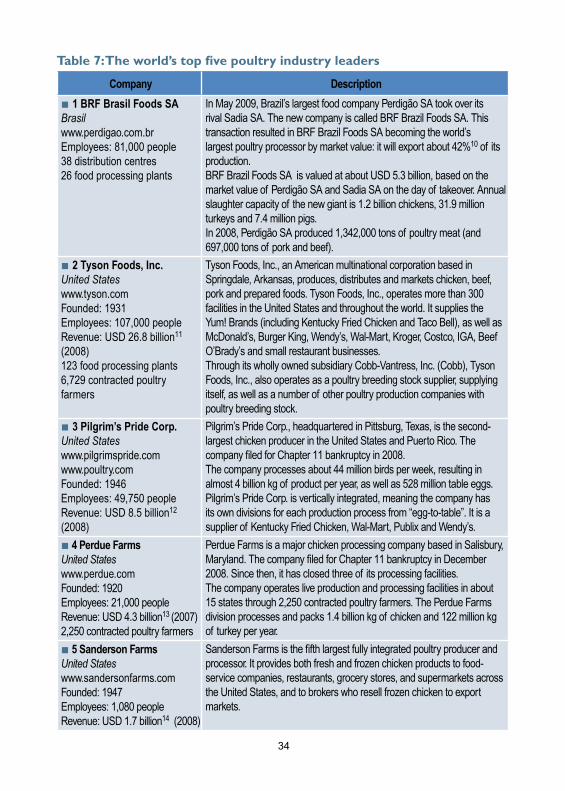
The top five poultry producers worldwide are as follows, based on publicly available information for 2008/2009:
9 Feedstuffs 15 January 2007.
34
Table 7: The world’s top five poultry industry leaders
Company Description
■ 1 BRF Brasil Foods SABrasil www.perdigao.com.brEmployees: 81,000 people38 distribution centres26 food processing plants
In May 2009, Brazil’s largest food company Perdigão SA took over its rival Sadia SA. The new company is called BRF Brazil Foods SA. This transaction resulted in BRF Brazil Foods SA becoming the world’s largest poultry processor by market value: it will export about 42%10 of its production.BRF Brazil Foods SA is valued at about USD 5.3 billion, based on the market value of Perdigão SA and Sadia SA on the day of takeover. Annual slaughter capacity of the new giant is 1.2 billion chickens, 31.9 million turkeys and 7.4 million pigs.In 2008, Perdigão SA produced 1,342,000 tons of poultry meat (and 697,000 tons of pork and beef).
■ 2 Tyson Foods, Inc.United Stateswww.tyson.com Founded: 1931Employees: 107,000 people Revenue: USD 26.8 billion11 (2008) 123 food processing plants6,729 contracted poultry farmers
Tyson Foods, Inc., an American multinational corporation based in Springdale, Arkansas, produces, distributes and markets chicken, beef, pork and prepared foods. Tyson Foods, Inc., operates more than 300 facilities in the United States and throughout the world. It supplies the Yum! Brands (including Kentucky Fried Chicken and Taco Bell), as well as McDonald’s, Burger King, Wendy’s, Wal-Mart, Kroger, Costco, IGA, Beef O’Brady’s and small restaurant businesses.Through its wholly owned subsidiary Cobb-Vantress, Inc. (Cobb), Tyson Foods, Inc., also operates as a poultry breeding stock supplier, supplying itself, as well as a number of other poultry production companies with poultry breeding stock.
■ 3 Pilgrim’s Pride Corp.United States www.pilgrimspride.com www.poultry.comFounded: 1946Employees: 49,750 peopleRevenue: USD 8.5 billion12 (2008)
Pilgrim’s Pride Corp., headquartered in Pittsburg, Texas, is the second-largest chicken producer in the United States and Puerto Rico. The company filed for Chapter 11 bankruptcy in 2008.The company processes about 44 million birds per week, resulting in almost 4 billion kg of product per year, as well as 528 million table eggs. Pilgrim’s Pride Corp. is vertically integrated, meaning the company has its own divisions for each production process from “egg-to-table”. It is a supplier of Kentucky Fried Chicken, Wal-Mart, Publix and Wendy’s.
■ 4 Perdue Farms United Stateswww.perdue.com Founded: 1920Employees: 21,000 people Revenue: USD 4.3 billion13 (2007)2,250 contracted poultry farmers
Perdue Farms is a major chicken processing company based in Salisbury, Maryland. The company filed for Chapter 11 bankruptcy in December 2008. Since then, it has closed three of its processing facilities.The company operates live production and processing facilities in about 15 states through 2,250 contracted poultry farmers. The Perdue Farms division processes and packs 1.4 billion kg of chicken and 122 million kg of turkey per year.
■ 5 Sanderson FarmsUnited Stateswww.sandersonfarms.com Founded: 1947Employees: 1,080 people Revenue: USD 1.7 billion14 (2008)
Sanderson Farms is the fifth largest fully integrated poultry producer and processor. It provides both fresh and frozen chicken products to food-service companies, restaurants, grocery stores, and supermarkets across the United States, and to brokers who resell frozen chicken to export markets.
35
Other major producers include: Cargill (the United States), Wayne Farms (the United States), Montaire Farms (the United States), Dachan (China) and CP Foods (Thailand)15.
4.7 Global trade in poultry meat
Animal diseases such as avian influenza or Newcastle disease have affected poultry meat trade during recent years. Support policies for biofuels in many developed countries determine the availability of grain for feed production. Sanitary requirements, however, ultimately determine whether an increase in market access can de facto be used or not. The evolution of reciprocal sanitary agreements, therefore, along with tariff reduction, play a crucial role in shaping the world’s meat trade.
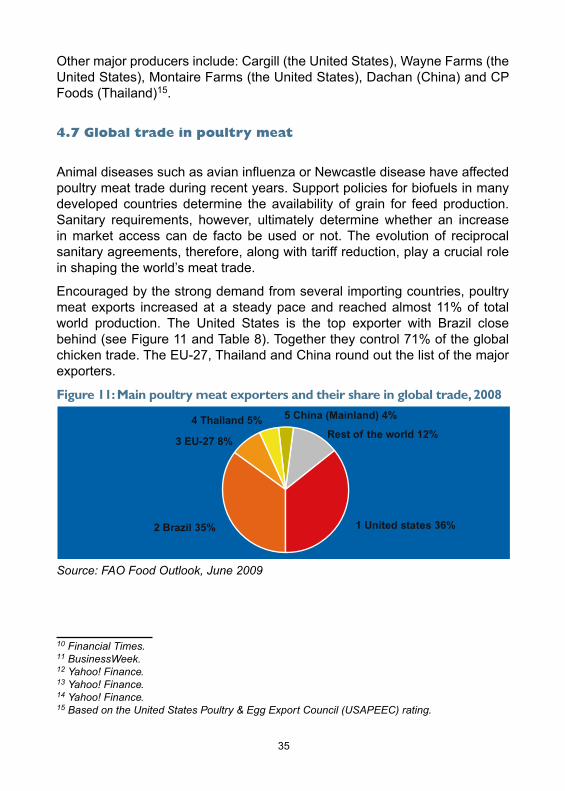
Encouraged by the strong demand from several importing countries, poultry meat exports increased at a steady pace and reached almost 11% of total world production. The United States is the top exporter with Brazil close behind (see Figure 11 and Table 8). Together they control 71% of the global chicken trade. The EU-27, Thailand and China round out the list of the major exporters.
Figure 11: Main poultry meat exporters and their share in global trade, 2008
Source: FAO Food Outlook, June 2009
10 Financial Times.11 BusinessWeek.12 Yahoo! Finance.13 Yahoo! Finance.14 Yahoo! Finance.15 Based on the United States Poultry & Egg Export Council (USAPEEC) rating.
1 United states 36%
5 China (Mainland) 4%4 Thailand 5%
3 EU-27 8%Rest of the world 12%
2 Brazil 35%
36
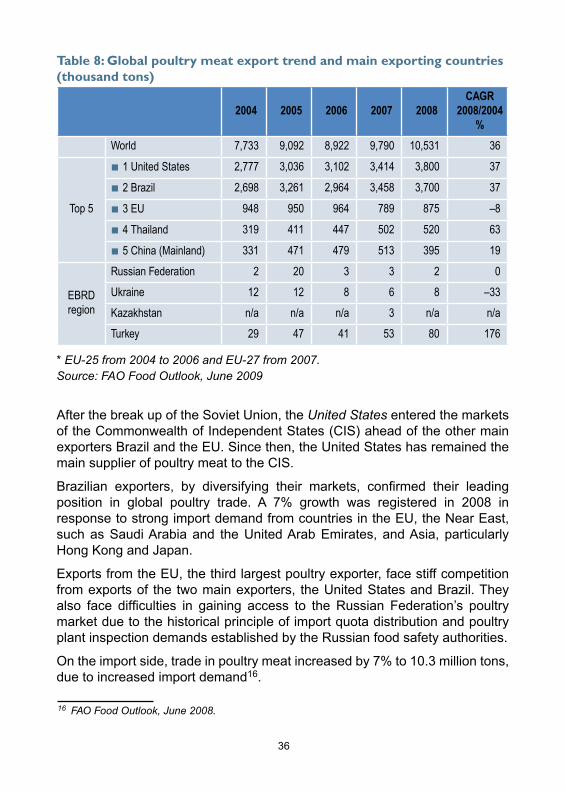
Table 8: Global poultry meat export trend and main exporting countries (thousand tons)
2004 2005 2006 2007 2008CAGR
2008/2004 %
World 7,733 9,092 8,922 9,790 10,531 36
Top 5
■ 1 United States 2,777 3,036 3,102 3,414 3,800 37
■ 2 Brazil 2,698 3,261 2,964 3,458 3,700 37
■ 3 EU 948 950 964 789 875 –8
■ 4 Thailand 319 411 447 502 520 63
■ 5 China (Mainland) 331 471 479 513 395 19
EBRD region
Russian Federation 2 20 3 3 2 0
Ukraine 12 12 8 6 8 –33
Kazakhstan n/a n/a n/a 3 n/a n/a
Turkey 29 47 41 53 80 176
* EU-25 from 2004 to 2006 and EU-27 from 2007.Source: FAO Food Outlook, June 2009
After the break up of the Soviet Union, the United States entered the markets of the Commonwealth of Independent States (CIS) ahead of the other main exporters Brazil and the EU. Since then, the United States has remained the main supplier of poultry meat to the CIS.
Brazilian exporters, by diversifying their markets, confirmed their leading position in global poultry trade. A 7% growth was registered in 2008 in response to strong import demand from countries in the EU, the Near East, such as Saudi Arabia and the United Arab Emirates, and Asia, particularly Hong Kong and Japan.
Exports from the EU, the third largest poultry exporter, face stiff competition from exports of the two main exporters, the United States and Brazil. They also face difficulties in gaining access to the Russian Federation’s poultry market due to the historical principle of import quota distribution and poultry plant inspection demands established by the Russian food safety authorities.
On the import side, trade in poultry meat increased by 7% to 10.3 million tons, due to increased import demand16.
16 FAO Food Outlook, June 2008.
37
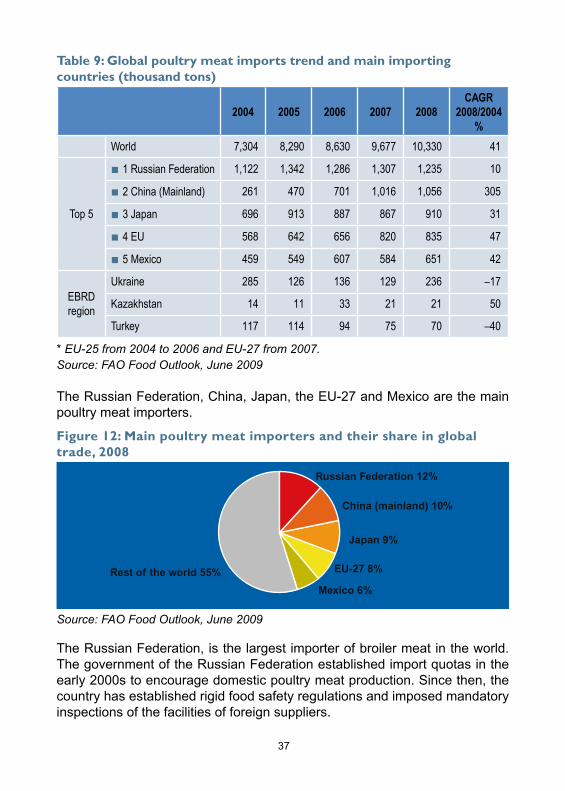
Table 9: Global poultry meat imports trend and main importing countries (thousand tons)
2004 2005 2006 2007 2008CAGR
2008/2004 %
World 7,304 8,290 8,630 9,677 10,330 41
Top 5
■ 1 Russian Federation 1,122 1,342 1,286 1,307 1,235 10
■ 2 China (Mainland) 261 470 701 1,016 1,056 305
■ 3 Japan 696 913 887 867 910 31
■ 4 EU 568 642 656 820 835 47
■ 5 Mexico 459 549 607 584 651 42
EBRD region
Ukraine 285 126 136 129 236 –17
Kazakhstan 14 11 33 21 21 50
Turkey 117 114 94 75 70 –40
* EU-25 from 2004 to 2006 and EU-27 from 2007. Source: FAO Food Outlook, June 2009
The Russian Federation, China, Japan, the EU-27 and Mexico are the main poultry meat importers.
Figure 12: Main poultry meat importers and their share in global trade, 2008
Source: FAO Food Outlook, June 2009
The Russian Federation, is the largest importer of broiler meat in the world. The government of the Russian Federation established import quotas in the early 2000s to encourage domestic poultry meat production. Since then, the country has established rigid food safety regulations and imposed mandatory inspections of the facilities of foreign suppliers.
China (mainland) 10%
Russian Federation 12%
Mexico 6%
EU-27 8%
Japan 9%
Rest of the world 55%
38
Half of the growth in poultry imports originated in Asia, especially China, where consumers are substituting broiler meat for pig meat.
The EU became a net importer in 2008, with Brazil being the major supplier. In 2008, imports increased by 2%. The importers exceeded the import quotas because high domestic prices made importing profitable despite full import duties.
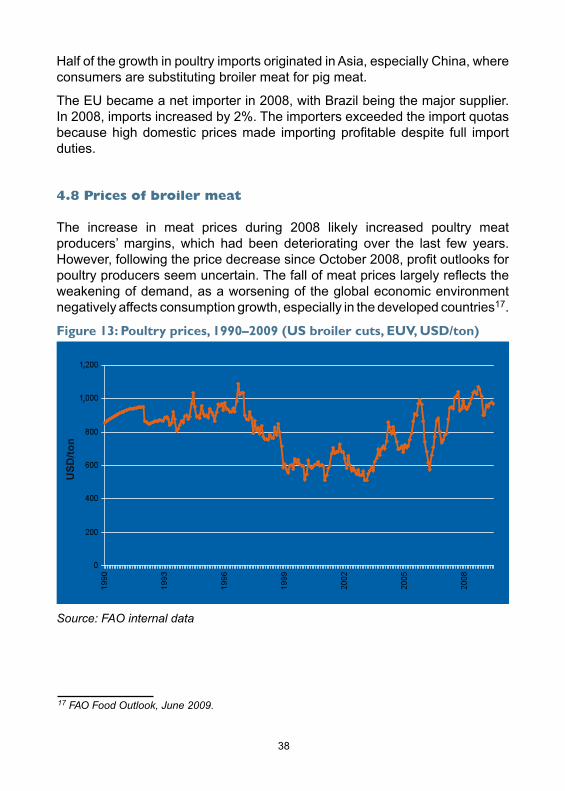
4.8 Prices of broiler meat
The increase in meat prices during 2008 likely increased poultry meat producers’ margins, which had been deteriorating over the last few years. However, following the price decrease since October 2008, profit outlooks for poultry producers seem uncertain. The fall of meat prices largely reflects the weakening of demand, as a worsening of the global economic environment negatively affects consumption growth, especially in the developed countries17.
Figure 13: Poultry prices, 1990–2009 (US broiler cuts, EUV, USD/ton)
Source: FAO internal data
17 FAO Food Outlook, June 2009.
,
,
US
D/t
on
39
5. LAYING HENS FOR EGG PRODUCTION
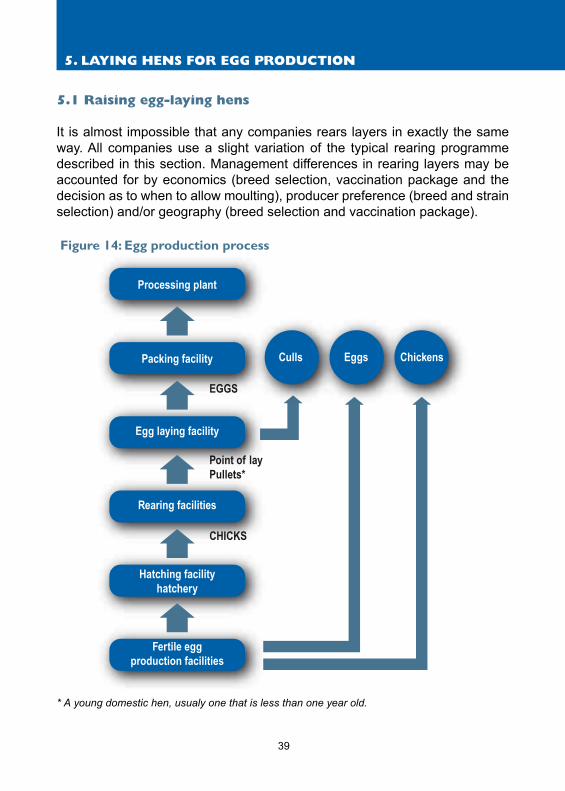
5.1 Raising egg-laying hens
It is almost impossible that any companies rears layers in exactly the same way. All companies use a slight variation of the typical rearing programme described in this section. Management differences in rearing layers may be accounted for by economics (breed selection, vaccination package and the decision as to when to allow moulting), producer preference (breed and strain selection) and/or geography (breed selection and vaccination package).
* A young domestic hen, usualy one that is less than one year old.
Figure 14: Egg production process
Egg laying facility
EGGS
CHICKS
Point of layPullets*
Rearing facilities
Packing facility
Processing plant
Culls Eggs Chickens
Hatching facilityhatchery
Fertile eggproduction facilities
40
Hatching and placement. Egg producers purchase their layer stock (i.e. day-old Leghorn or other genetic lines of chicks) from a hatchery. At the hatchery, chicks are vaccinated according to the producer’s specifications. Hatcheries deliver chicks to the producer within one to two days of hatching. Upon arrival, chicks are placed in typical layer pens or are reared in a pullet house.
Lighting and temperature. From chick placement through to approximately 16 weeks of life, the pullets are fed according to body-weight gain and/or age. The goal is to raise a strong and healthy bird that can support egg production. An increase in daily light exposure triggers hens to begin laying eggs. If the laying hen has not reached proper body weight (usually 1 kg) by week 18, egg production will cease very quickly.
Feeding. Feed is usually offered to birds via the chain system. The chain system transports feed into the metal feeder at precise times during the day. In addition to monitoring dietary protein, producers must closely examine other feed ingredients: lysine, methionine, calcium and phosphorus. Before being slaughtered, laying hens are given appropriate feed to reconstitute muscle volume.
Egg production. Hens start laying regularly at around 18–20 weeks of age and in commercial systems, they typically lay for about a year before being sent for slaughter18. Producers begin to photostimulate (regulate the light and its intensity) and adjust the diet around 18 weeks of age in order to support egg production. The calcium levels in the diet are approximately 5–7 times greater than phosphorus levels. When a flock first enters egg production, the rate of egg lay will be around 10 to 20%. This means that 10 to 20% of the hens are laying eggs at 18 to 22 weeks of age. The flock quickly reaches peak egg production (>90%) at 30 to 32 weeks of age. After about 50 weeks, when the laying curve decreases greatly, hens are gathered a few weeks out of the regulated light cycle in order to perform the so-called moulting (change of feathers). A second laying cycle can then begin. Post-peak egg production (after 30 to 32 weeks of age) continually decreases to approximately 50% of the hens around 60 to 70 weeks of age. At this point an economic decision must be made by the producer; production by 50% of the hens is near the “break-even” point for egg producers (e.g. feed cost = market price of eggs).
The time from ovulation to laying is about 25 hours. About 30 minutes after laying, the hen will begin to make another egg. Commercial hens have been bred to produce a very high yield of around 300 eggs per year. Feed quality, heat regulation, sanitary control and animal density within hen-houses are the key factors that affect chick mortality rates. 18 Layers raised organically and used for producing organic eggs are much more valuable at the end of their production cycle; they can be sold as roasters. Non-organically raised layers are sold for use as protein supplements for dog and cat food.
41
Egg collection. Hens lay eggs onto an angled wire floor and the eggs roll towards the front of the cage and onto a belt. The belt transports eggs out of the house either to the egg packaging facility or to a storage cooler. Once the eggs enter the egg packaging centre, they are washed (detergent solution near 40 °C and pH 11 that removes soil) within minutes or no later than 12 to 14 hours post-lay.
Bacteria can be on the outside of an eggshell because the egg exits the hen’s body through the same passageway as faeces; thus, the reason for washing and sanitizing eggs at the processing plant. Bacteria can be inside an uncracked, whole egg. Contamination of eggs may be due to bacteria such as Salmonella Enteritidis in the hen’s ovary or oviduct before the shell forms around the yolk and white. Salmonella Enteritidis does not make the hen sick. It is also possible for eggs to become infected by Salmonella Enteritidis faecal contamination via the pores of the shells after they have been laid.
After washing, eggs are visually inspected (checked for eggshell problems, cracks and blood spots), and then graded for packaging. The weight of a hen’s egg may vary from 50 to 70 g, but the average weight is 55 g. Following packaging, eggs are moved to a cool room (4–7 °C), where they await shipment to retail outlets.
5.2 The composition and nutritional value of eggs
Eggs are one of nature’s highest quality sources of protein and indeed contain many important nutrients. They are a good source of high biological-value pro-tein and they are easily digested. Therefore, they are valuable food for people who are recovering from illness.
Eggs are composed of three main parts:
1. Shell 2. Egg white 3. Egg yolk
88.5% of an egg is edible.
Shell. The shell of an egg is porous to allow the developing chick to obtain oxygen. Other than oxygen, bacteria and odours can enter the egg. The pores also allow water and carbon dioxide to escape. The membrane that lines
Sizing of eggs
Chicken eggs are graded by size for the purpose of sales. In Europe, current egg sizes are defined as follows:
Modern sizes (Europe) Mass per egg
Very large 73 g and over
Large 63–73 g
Medium 53–63 g
Small 53 g and under
42
the inside of a shell acts as a filter to protect against bacteria. At one end of the egg, the membrane separates into an air space to supply the chick with oxygen. The shell is generally strong but the older birds tend to produce weaker shells. The shell’s colour varies according to the breed of the bird.
Egg white. There are two layers of egg white:
1. The thick white layer (nearest to the yolk) 2. The thin white layer (nearest to the shell)
Yolk. The colour of the egg yolk is related to the diet of the hen and is due to the presence of carotenes and colourings added to a hen’s feed. The nutritional value of the egg is not affected by the colour of the yolk.
The nutritional content of egg white is:
■ 10.5% protein ■ 88.5% water ■ riboflavin and other B vitamins ■ a trace of fat
The nutritional content of egg yolk is:
■ 16.5% protein ■ 33% fat ■ 50% water ■ fat-soluble vitamins A, D, E and K ■ mineral elements, including iron ■ lecithin (an emulsifier)
5.3 Egg products
The term “egg products” refers to eggs that are removed from their shells for processing. The processing of egg products includes breaking eggs, fil-tering, mixing, stabilizing, blending, pasteurizing, cooling, freezing or drying, and packaging. Liquid, frozen, and dried egg products are used widely by the food-service industry and the commercial-food industry. They are scrambled or made into omelettes, or used as ingredients in egg dishes or other foods such as mayonnaise or ice cream. Pasteurized egg products are products that were rapidly heated and held at a minimum required temperature for a specified time. This destroys Salmonella, but it does not cook the eggs or af-fect their colour, flavour, nutritional value or use. Dried whites are pasteurized by heating them in the dried form again for a specified time and at a minimum required temperature.
43
Egg white powder is dried egg white (pure albumen). It can be reconstituted by mixing the powder with water. The reconstituted powder whips like fresh egg white and, because it is pasteurized, can be used safely without cooking or baking it. The product is usually sold along with supplies for cake baking and decorating.
Eggs are commonly used in food preparation for:
■ Thickening. Eggs are used to thicken custards, sauces, soups, etc., because of the coagulation of the egg proteins.
■ Emulsifying. Egg yolk contains lecithin, which is an emulsifier and enables oil and water to be mixed without separating. It is used in making mayonnaise and cakes.
■ Binding. Ingredients for rissoles, croquettes, and meat or fish cakes can be bound together with egg, which when heated will coagulate and hold the ingredients together.
■ Coating. Eggs are used as a coating for fried foods because they form a protective layer on the outside of the food that sets and holds the food together and prevents it from being overcooked.
■ Glazing. Egg yolk, egg white or whole egg is brushed over pastries and bread to produce a golden brown shiny glaze during baking.
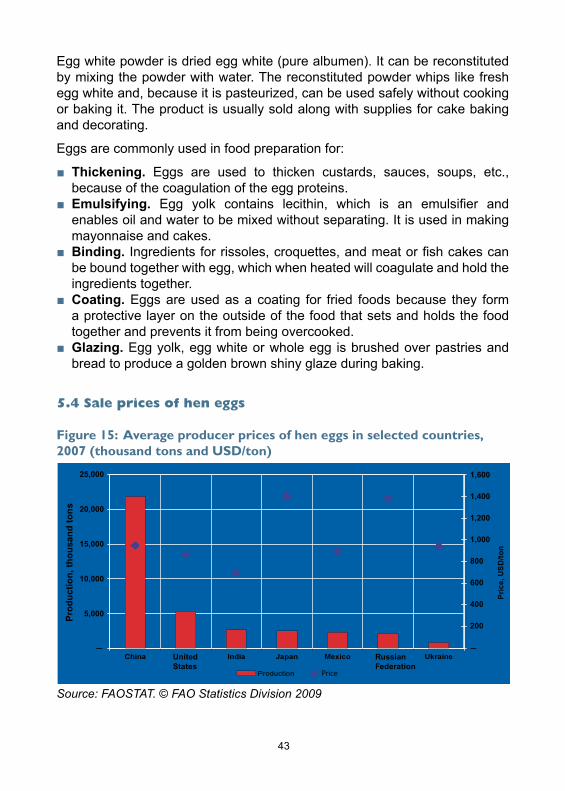
5.4 Sale prices of hen eggs
Figure 15: Average producer prices of hen eggs in selected countries, 2007 (thousand tons and USD/ton)
Source: FAOSTAT. © FAO Statistics Division 2009
Pro
du
ctio
n, t
ho
usa
nd
to
ns
25,000
20,000
15,000
10,000
5,000
RussianFederation
1,600
1,400
1,200
1,000
800
600
400
200
Price
United States
44
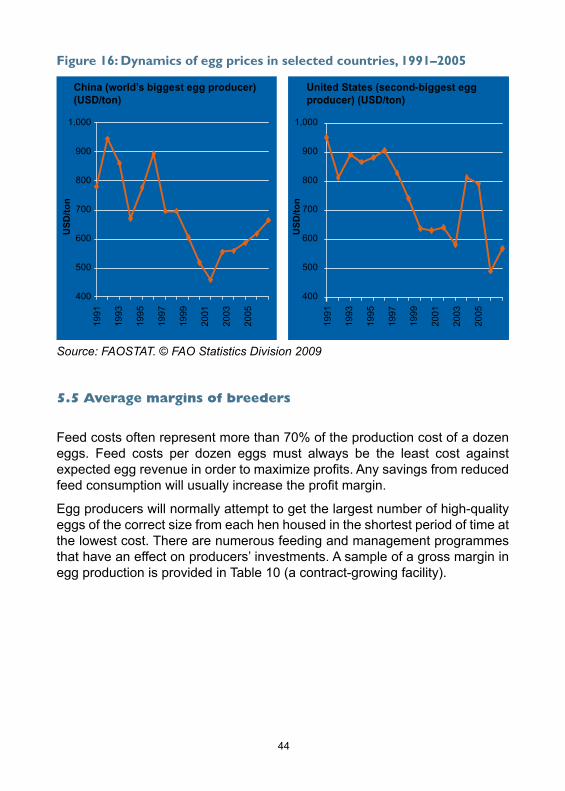
Figure 16: Dynamics of egg prices in selected countries, 1991–2005
Source: FAOSTAT. © FAO Statistics Division 2009
5.5 Average margins of breeders
Feed costs often represent more than 70% of the production cost of a dozen eggs. Feed costs per dozen eggs must always be the least cost against expected egg revenue in order to maximize profits. Any savings from reduced feed consumption will usually increase the profit margin.
Egg producers will normally attempt to get the largest number of high-quality eggs of the correct size from each hen housed in the shortest period of time at the lowest cost. There are numerous feeding and management programmes that have an effect on producers’ investments. A sample of a gross margin in egg production is provided in Table 10 (a contract-growing facility).
China (world’s biggest egg producer) (USD/ton)
United States (second-biggest egg producer) (USD/ton)
1,000
900
800
1991
1993
1995
1997
1999
2001
2003
2005
1991
1993
1995
1997
1999
2001
2003
2005
700
600
500
400
1,000
900
800
700
600
500
400
US
D/t
on
US
D/t
on
45
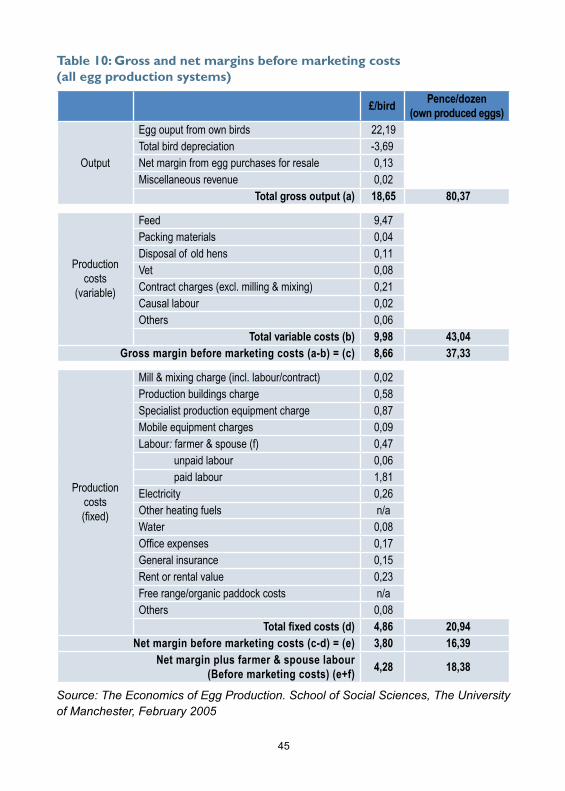
Table 10: Gross and net margins before marketing costs (all egg production systems)
£/birdPence/dozen
(own produced eggs)
Output
Egg ouput from own birds 22,19 Total bird depreciation -3,69 Net margin from egg purchases for resale 0,13 Miscellaneous revenue 0,02
Total gross output (a) 18,65 80,37
Production costs
(variable)
Feed 9,47 Packing materials 0,04 Disposal of old hens 0,11 Vet 0,08 Contract charges (excl. milling & mixing) 0,21 Causal labour 0,02 Others 0,06
Total variable costs (b) 9,98 43,04 Gross margin before marketing costs (a-b) = (c) 8,66 37,33
Production costs(fixed)
Mill & mixing charge (incl. labour/contract) 0,02 Production buildings charge 0,58 Specialist production equipment charge 0,87 Mobile equipment charges 0,09 Labour: farmer & spouse (f) 0,47 unpaid labour 0,06 paid labour 1,81 Electricity 0,26 Other heating fuels n/a Water 0,08 Office expenses 0,17 General insurance 0,15 Rent or rental value 0,23 Free range/organic paddock costs n/a Others 0,08
Total fixed costs (d) 4,86 20,94Net margin before marketing costs (c-d) = (e) 3,80 16,39
Net margin plus farmer & spouse labour (Before marketing costs) (e+f)
4,28 18,38
Source: The Economics of Egg Production. School of Social Sciences, The University of Manchester, February 2005
46
5.6 Egg production
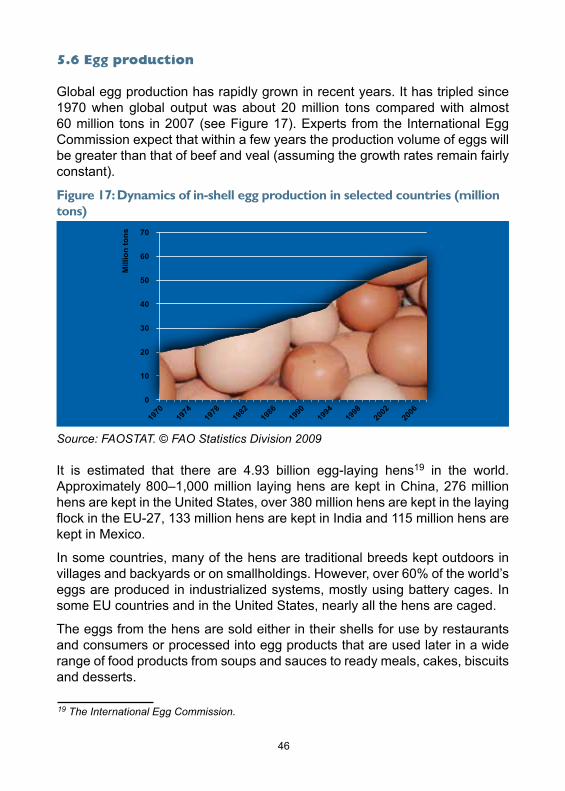
Global egg production has rapidly grown in recent years. It has tripled since 1970 when global output was about 20 million tons compared with almost 60 million tons in 2007 (see Figure 17). Experts from the International Egg Commission expect that within a few years the production volume of eggs will be greater than that of beef and veal (assuming the growth rates remain fairly constant).
Figure 17: Dynamics of in-shell egg production in selected countries (million tons)
Source: FAOSTAT. © FAO Statistics Division 2009
It is estimated that there are 4.93 billion egg-laying hens19 in the world. Approximately 800–1,000 million laying hens are kept in China, 276 million hens are kept in the United States, over 380 million hens are kept in the laying flock in the EU-27, 133 million hens are kept in India and 115 million hens are kept in Mexico.
In some countries, many of the hens are traditional breeds kept outdoors in villages and backyards or on smallholdings. However, over 60% of the world’s eggs are produced in industrialized systems, mostly using battery cages. In some EU countries and in the United States, nearly all the hens are caged.
The eggs from the hens are sold either in their shells for use by restaurants and consumers or processed into egg products that are used later in a wide range of food products from soups and sauces to ready meals, cakes, biscuits and desserts.
19 The International Egg Commission.
70
60
50
40
30
20
10
0
Mill
ion
to
ns
1970
1974
1978
1982
1986
1990
1994
1998
2002
2006
47
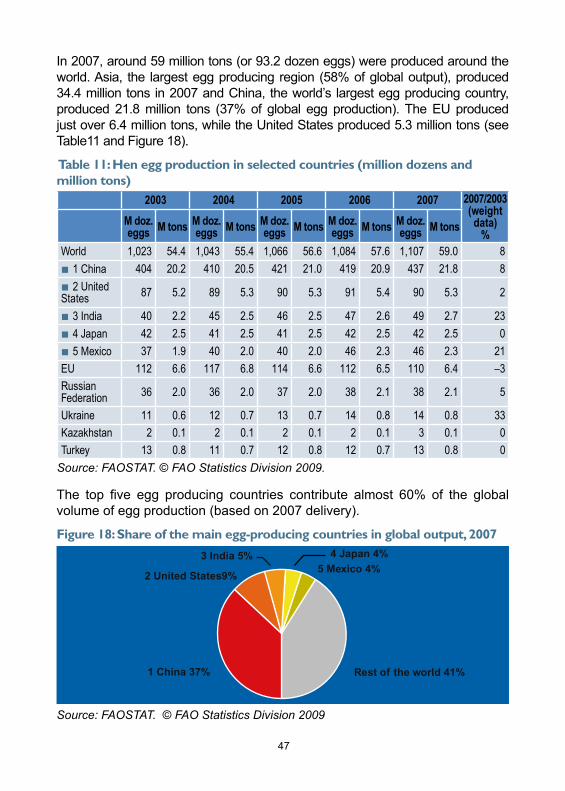
In 2007, around 59 million tons (or 93.2 dozen eggs) were produced around the world. Asia, the largest egg producing region (58% of global output), produced 34.4 million tons in 2007 and China, the world’s largest egg producing country, produced 21.8 million tons (37% of global egg production). The EU produced just over 6.4 million tons, while the United States produced 5.3 million tons (see Table11 and Figure 18).
Table 11: Hen egg production in selected countries (million dozens and million tons)
2003 2004 2005 2006 2007 2007/2003(weight data)
%M doz. eggs M tons M doz.
eggs M tons M doz. eggs M tons M doz.
eggs M tons M doz. eggs M tons
World 1,023 54.4 1,043 55.4 1,066 56.6 1,084 57.6 1,107 59.0 8
■ 1 China 404 20.2 410 20.5 421 21.0 419 20.9 437 21.8 8
■ 2 United States 87 5.2 89 5.3 90 5.3 91 5.4 90 5.3 2
■ 3 India 40 2.2 45 2.5 46 2.5 47 2.6 49 2.7 23
■ 4 Japan 42 2.5 41 2.5 41 2.5 42 2.5 42 2.5 0
■ 5 Mexico 37 1.9 40 2.0 40 2.0 46 2.3 46 2.3 21
EU 112 6.6 117 6.8 114 6.6 112 6.5 110 6.4 –3
Russian Federation 36 2.0 36 2.0 37 2.0 38 2.1 38 2.1 5
Ukraine 11 0.6 12 0.7 13 0.7 14 0.8 14 0.8 33
Kazakhstan 2 0.1 2 0.1 2 0.1 2 0.1 3 0.1 0
Turkey 13 0.8 11 0.7 12 0.8 12 0.7 13 0.8 0
Source: FAOSTAT. © FAO Statistics Division 2009.
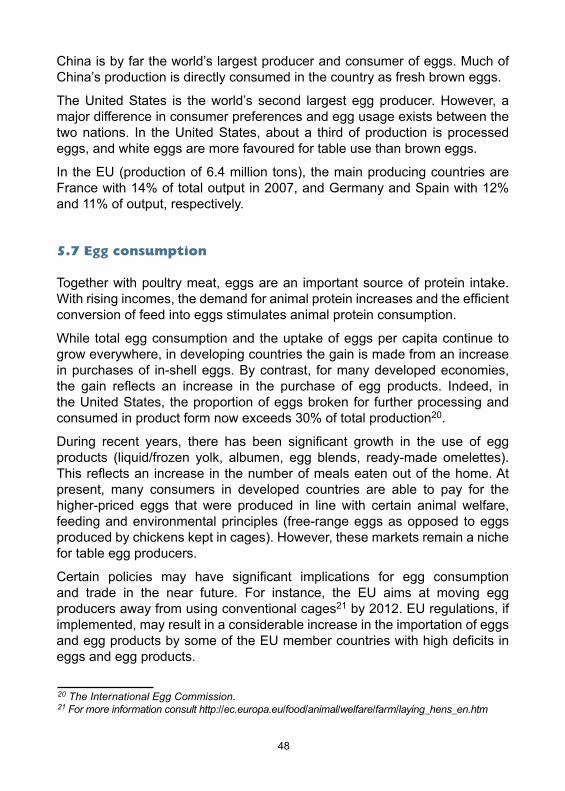
The top five egg producing countries contribute almost 60% of the global volume of egg production (based on 2007 delivery).
Figure 18: Share of the main egg-producing countries in global output, 2007
Source: FAOSTAT. © FAO Statistics Division 2009
2 United States9%
3 India 5%
1 China 37%
5 Mexico 4%4 Japan 4%
Rest of the world 41%
48
China is by far the world’s largest producer and consumer of eggs. Much of China’s production is directly consumed in the country as fresh brown eggs.
The United States is the world’s second largest egg producer. However, a major difference in consumer preferences and egg usage exists between the two nations. In the United States, about a third of production is processed eggs, and white eggs are more favoured for table use than brown eggs.
In the EU (production of 6.4 million tons), the main producing countries are France with 14% of total output in 2007, and Germany and Spain with 12% and 11% of output, respectively.
5.7 Egg consumption
Together with poultry meat, eggs are an important source of protein intake. With rising incomes, the demand for animal protein increases and the efficient conversion of feed into eggs stimulates animal protein consumption.
While total egg consumption and the uptake of eggs per capita continue to grow everywhere, in developing countries the gain is made from an increase in purchases of in-shell eggs. By contrast, for many developed economies, the gain reflects an increase in the purchase of egg products. Indeed, in the United States, the proportion of eggs broken for further processing and consumed in product form now exceeds 30% of total production20.
During recent years, there has been significant growth in the use of egg products (liquid/frozen yolk, albumen, egg blends, ready-made omelettes). This reflects an increase in the number of meals eaten out of the home. At present, many consumers in developed countries are able to pay for the higher-priced eggs that were produced in line with certain animal welfare, feeding and environmental principles (free-range eggs as opposed to eggs produced by chickens kept in cages). However, these markets remain a niche for table egg producers.
Certain policies may have significant implications for egg consumption and trade in the near future. For instance, the EU aims at moving egg producers away from using conventional cages21 by 2012. EU regulations, if implemented, may result in a considerable increase in the importation of eggs and egg products by some of the EU member countries with high deficits in eggs and egg products.
20 The International Egg Commission.21 For more information consult http://ec.europa.eu/food/animal/welfare/farm/laying_hens_en.htm
49
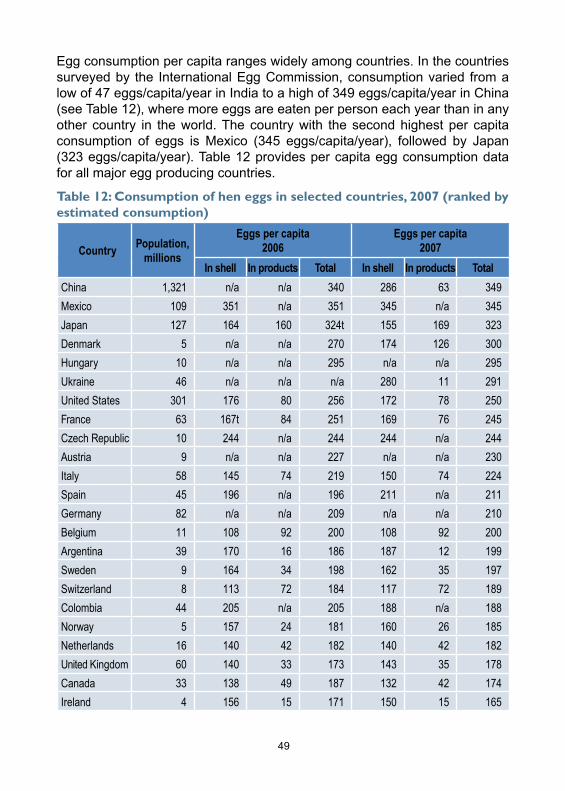
Egg consumption per capita ranges widely among countries. In the countries surveyed by the International Egg Commission, consumption varied from a low of 47 eggs/capita/year in India to a high of 349 eggs/capita/year in China (see Table 12), where more eggs are eaten per person each year than in any other country in the world. The country with the second highest per capita consumption of eggs is Mexico (345 eggs/capita/year), followed by Japan (323 eggs/capita/year). Table 12 provides per capita egg consumption data for all major egg producing countries.
Table 12: Consumption of hen eggs in selected countries, 2007 (ranked by estimated consumption)
CountryPopulation,
millions
Eggs per capita2006
Eggs per capita2007
In shell In products Total In shell In products Total
China 1,321 n/a n/a 340 286 63 349
Mexico 109 351 n/a 351 345 n/a 345
Japan 127 164 160 324t 155 169 323
Denmark 5 n/a n/a 270 174 126 300
Hungary 10 n/a n/a 295 n/a n/a 295
Ukraine 46 n/a n/a n/a 280 11 291
United States 301 176 80 256 172 78 250
France 63 167t 84 251 169 76 245
Czech Republic 10 244 n/a 244 244 n/a 244
Austria 9 n/a n/a 227 n/a n/a 230
Italy 58 145 74 219 150 74 224
Spain 45 196 n/a 196 211 n/a 211
Germany 82 n/a n/a 209 n/a n/a 210
Belgium 11 108 92 200 108 92 200
Argentina 39 170 16 186 187 12 199
Sweden 9 164 34 198 162 35 197
Switzerland 8 113 72 184 117 72 189
Colombia 44 205 n/a 205 188 n/a 188
Norway 5 157 24 181 160 26 185
Netherlands 16 140 42 182 140 42 182
United Kingdom 60 140 33 173 143 35 178
Canada 33 138 49 187 132 42 174
Ireland 4 156 15 171 150 15 165
50
CountryPopulation,
millions
Eggs per capita2006
Eggs per capita2007
In shell In products Total In shell In products Total
Greece 11 120 12 132 n/a n/a 136
Brazil 189 122 10 132 120 12 132
South Africa 48 118 6 124 130 7 130
India 1,177 38 n/a 38 47 n/a 47
Slovakia 5 199 n/a 199 n/a n/a n/a
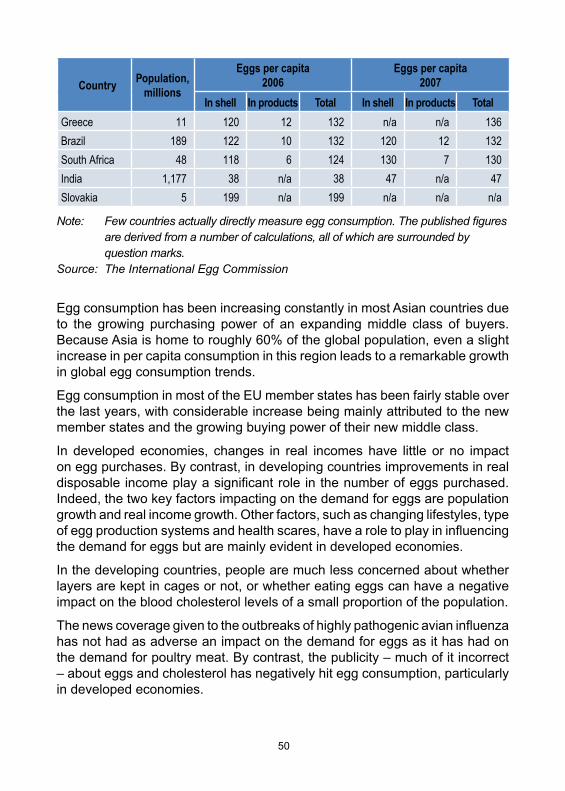
Note: Few countries actually directly measure egg consumption. The published figures are derived from a number of calculations, all of which are surrounded by question marks.Source: The International Egg Commission
Egg consumption has been increasing constantly in most Asian countries due to the growing purchasing power of an expanding middle class of buyers. Because Asia is home to roughly 60% of the global population, even a slight increase in per capita consumption in this region leads to a remarkable growth in global egg consumption trends.
Egg consumption in most of the EU member states has been fairly stable over the last years, with considerable increase being mainly attributed to the new member states and the growing buying power of their new middle class.
In developed economies, changes in real incomes have little or no impact on egg purchases. By contrast, in developing countries improvements in real disposable income play a significant role in the number of eggs purchased. Indeed, the two key factors impacting on the demand for eggs are population growth and real income growth. Other factors, such as changing lifestyles, type of egg production systems and health scares, have a role to play in influencing the demand for eggs but are mainly evident in developed economies.
In the developing countries, people are much less concerned about whether layers are kept in cages or not, or whether eating eggs can have a negative impact on the blood cholesterol levels of a small proportion of the population.
The news coverage given to the outbreaks of highly pathogenic avian influenza has not had as adverse an impact on the demand for eggs as it has had on the demand for poultry meat. By contrast, the publicity – much of it incorrect – about eggs and cholesterol has negatively hit egg consumption, particularly in developed economies.
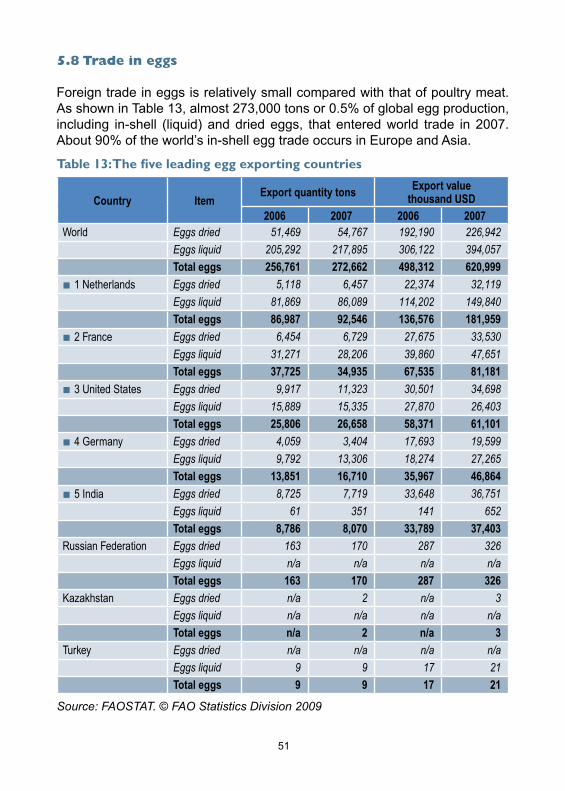
51
5.8 Trade in eggs
Foreign trade in eggs is relatively small compared with that of poultry meat. As shown in Table 13, almost 273,000 tons or 0.5% of global egg production, including in-shell (liquid) and dried eggs, that entered world trade in 2007. About 90% of the world’s in-shell egg trade occurs in Europe and Asia.
Table 13: The five leading egg exporting countries
Country ItemExport quantity tons Export value
thousand USD2006 2007 2006 2007
World Eggs dried 51,469 54,767 192,190 226,942
Eggs liquid 205,292 217,895 306,122 394,057
Total eggs 256,761 272,662 498,312 620,999
■ 1 Netherlands Eggs dried 5,118 6,457 22,374 32,119
Eggs liquid 81,869 86,089 114,202 149,840
Total eggs 86,987 92,546 136,576 181,959
■ 2 France Eggs dried 6,454 6,729 27,675 33,530
Eggs liquid 31,271 28,206 39,860 47,651
Total eggs 37,725 34,935 67,535 81,181
■ 3 United States Eggs dried 9,917 11,323 30,501 34,698
Eggs liquid 15,889 15,335 27,870 26,403
Total eggs 25,806 26,658 58,371 61,101
■ 4 Germany Eggs dried 4,059 3,404 17,693 19,599
Eggs liquid 9,792 13,306 18,274 27,265
Total eggs 13,851 16,710 35,967 46,864
■ 5 India Eggs dried 8,725 7,719 33,648 36,751
Eggs liquid 61 351 141 652
Total eggs 8,786 8,070 33,789 37,403
Russian Federation Eggs dried 163 170 287 326
Eggs liquid n/a n/a n/a n/a
Total eggs 163 170 287 326
Kazakhstan Eggs dried n/a 2 n/a 3
Eggs liquid n/a n/a n/a n/a
Total eggs n/a 2 n/a 3
Turkey Eggs dried n/a n/a n/a n/a
Eggs liquid 9 9 17 21
Total eggs 9 9 17 21
Source: FAOSTAT. © FAO Statistics Division 2009
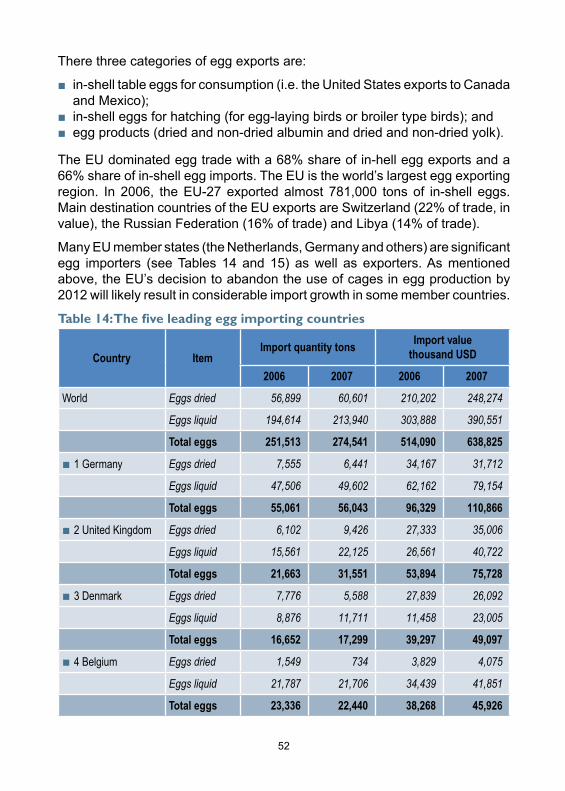
52
There three categories of egg exports are:
■ in-shell table eggs for consumption (i.e. the United States exports to Canada and Mexico);
■ in-shell eggs for hatching (for egg-laying birds or broiler type birds); and■ egg products (dried and non-dried albumin and dried and non-dried yolk).
The EU dominated egg trade with a 68% share of in-hell egg exports and a 66% share of in-shell egg imports. The EU is the world’s largest egg exporting region. In 2006, the EU-27 exported almost 781,000 tons of in-shell eggs. Main destination countries of the EU exports are Switzerland (22% of trade, in value), the Russian Federation (16% of trade) and Libya (14% of trade).
Many EU member states (the Netherlands, Germany and others) are significant egg importers (see Tables 14 and 15) as well as exporters. As mentioned above, the EU’s decision to abandon the use of cages in egg production by 2012 will likely result in considerable import growth in some member countries.
Table 14: The five leading egg importing countries
Country ItemImport quantity tons
Import value thousand USD
2006 2007 2006 2007
World Eggs dried 56,899 60,601 210,202 248,274
Eggs liquid 194,614 213,940 303,888 390,551
Total eggs 251,513 274,541 514,090 638,825
■ 1 Germany Eggs dried 7,555 6,441 34,167 31,712
Eggs liquid 47,506 49,602 62,162 79,154
Total eggs 55,061 56,043 96,329 110,866
■ 2 United Kingdom Eggs dried 6,102 9,426 27,333 35,006
Eggs liquid 15,561 22,125 26,561 40,722
Total eggs 21,663 31,551 53,894 75,728
■ 3 Denmark Eggs dried 7,776 5,588 27,839 26,092
Eggs liquid 8,876 11,711 11,458 23,005
Total eggs 16,652 17,299 39,297 49,097
■ 4 Belgium Eggs dried 1,549 734 3,829 4,075
Eggs liquid 21,787 21,706 34,439 41,851
Total eggs 23,336 22,440 38,268 45,926
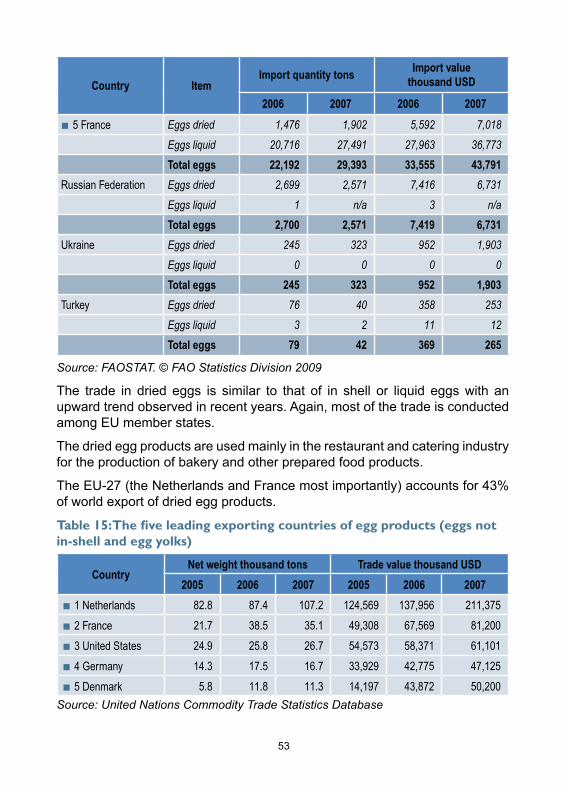
53
Country ItemImport quantity tons
Import value thousand USD
2006 2007 2006 2007
■ 5 France Eggs dried 1,476 1,902 5,592 7,018
Eggs liquid 20,716 27,491 27,963 36,773
Total eggs 22,192 29,393 33,555 43,791
Russian Federation Eggs dried 2,699 2,571 7,416 6,731
Eggs liquid 1 n/a 3 n/a
Total eggs 2,700 2,571 7,419 6,731
Ukraine Eggs dried 245 323 952 1,903
Eggs liquid 0 0 0 0
Total eggs 245 323 952 1,903
Turkey Eggs dried 76 40 358 253
Eggs liquid 3 2 11 12
Total eggs 79 42 369 265
Source: FAOSTAT. © FAO Statistics Division 2009
The trade in dried eggs is similar to that of in shell or liquid eggs with an upward trend observed in recent years. Again, most of the trade is conducted among EU member states.
The dried egg products are used mainly in the restaurant and catering industry for the production of bakery and other prepared food products.
The EU-27 (the Netherlands and France most importantly) accounts for 43% of world export of dried egg products.
Table 15: The five leading exporting countries of egg products (eggs not in-shell and egg yolks)
CountryNet weight thousand tons Trade value thousand USD
2005 2006 2007 2005 2006 2007
■ 1 Netherlands 82.8 87.4 107.2 124,569 137,956 211,375
■ 2 France 21.7 38.5 35.1 49,308 67,569 81,200
■ 3 United States 24.9 25.8 26.7 54,573 58,371 61,101
■ 4 Germany 14.3 17.5 16.7 33,929 42,775 47,125
■ 5 Denmark 5.8 11.8 11.3 14,197 43,872 50,200
Source: United Nations Commodity Trade Statistics Database
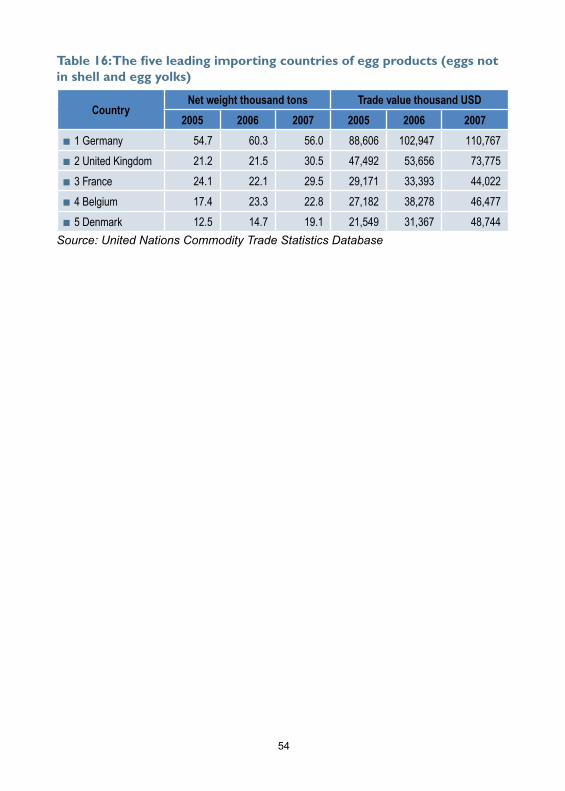
54
Table 16: The five leading importing countries of egg products (eggs not in shell and egg yolks)
CountryNet weight thousand tons Trade value thousand USD
2005 2006 2007 2005 2006 2007
■ 1 Germany 54.7 60.3 56.0 88,606 102,947 110,767
■ 2 United Kingdom 21.2 21.5 30.5 47,492 53,656 73,775
■ 3 France 24.1 22.1 29.5 29,171 33,393 44,022
■ 4 Belgium 17.4 23.3 22.8 27,182 38,278 46,477
■ 5 Denmark 12.5 14.7 19.1 21,549 31,367 48,744
Source: United Nations Commodity Trade Statistics Database
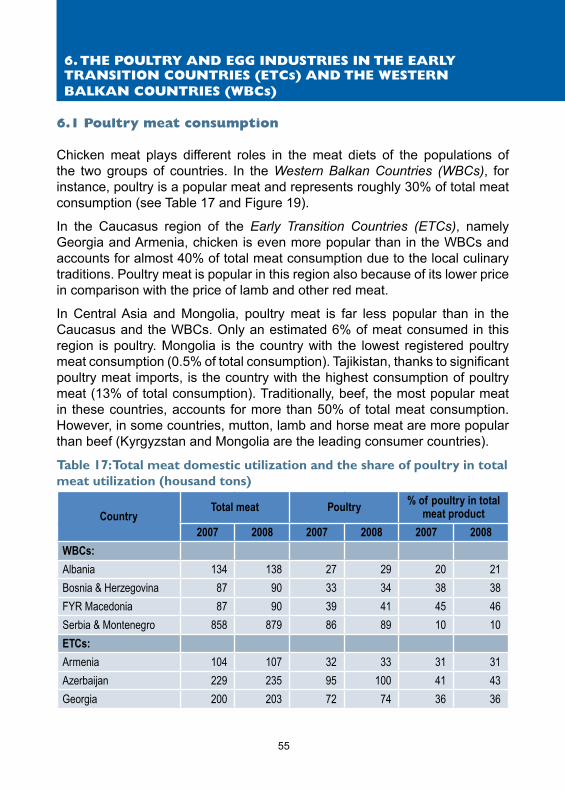
55
6. THE POULTRY AND EGG INDUSTRIES IN THE EARLY TRANSITION COUNTRIES (ETCs) AND THE WESTERN BALKAN COUNTRIES (WBCs)
6.1 Poultry meat consumption
Chicken meat plays different roles in the meat diets of the populations of the two groups of countries. In the Western Balkan Countries (WBCs), for instance, poultry is a popular meat and represents roughly 30% of total meat consumption (see Table 17 and Figure 19).
In the Caucasus region of the Early Transition Countries (ETCs), namely Georgia and Armenia, chicken is even more popular than in the WBCs and accounts for almost 40% of total meat consumption due to the local culinary traditions. Poultry meat is popular in this region also because of its lower price in comparison with the price of lamb and other red meat.
In Central Asia and Mongolia, poultry meat is far less popular than in the Caucasus and the WBCs. Only an estimated 6% of meat consumed in this region is poultry. Mongolia is the country with the lowest registered poultry meat consumption (0.5% of total consumption). Tajikistan, thanks to significant poultry meat imports, is the country with the highest consumption of poultry meat (13% of total consumption). Traditionally, beef, the most popular meat in these countries, accounts for more than 50% of total meat consumption. However, in some countries, mutton, lamb and horse meat are more popular than beef (Kyrgyzstan and Mongolia are the leading consumer countries).
Table 17: Total meat domestic utilization and the share of poultry in total meat utilization (housand tons)
CountryTotal meat Poultry % of poultry in total
meat product
2007 2008 2007 2008 2007 2008
WBCs:
Albania 134 138 27 29 20 21
Bosnia & Herzegovina 87 90 33 34 38 38
FYR Macedonia 87 90 39 41 45 46
Serbia & Montenegro 858 879 86 89 10 10
ETCs:
Armenia 104 107 32 33 31 31
Azerbaijan 229 235 95 100 41 43
Georgia 200 203 72 74 36 36
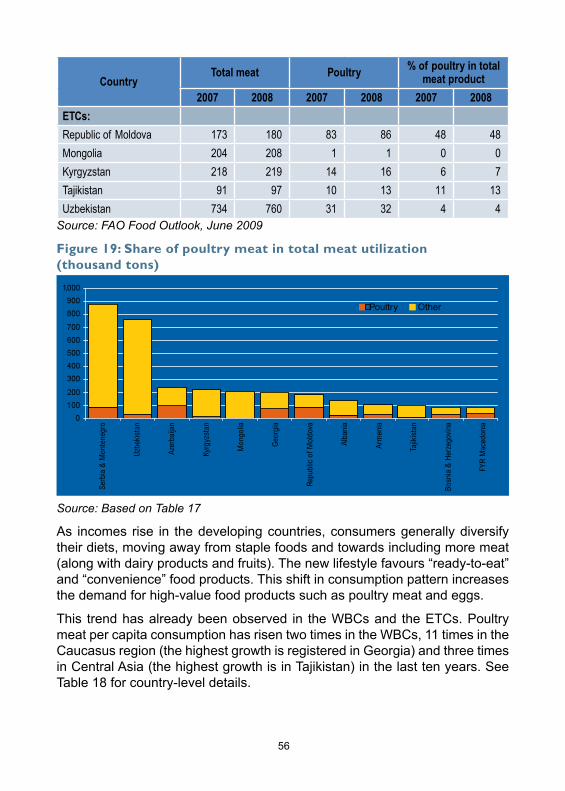
56
CountryTotal meat Poultry % of poultry in total
meat product
2007 2008 2007 2008 2007 2008
ETCs:
Republic of Moldova 173 180 83 86 48 48
Mongolia 204 208 1 1 0 0
Kyrgyzstan 218 219 14 16 6 7
Tajikistan 91 97 10 13 11 13
Uzbekistan 734 760 31 32 4 4Source: FAO Food Outlook, June 2009
Figure 19: Share of poultry meat in total meat utilization (thousand tons)
Source: Based on Table 17
As incomes rise in the developing countries, consumers generally diversify their diets, moving away from staple foods and towards including more meat (along with dairy products and fruits). The new lifestyle favours “ready-to-eat” and “convenience” food products. This shift in consumption pattern increases the demand for high-value food products such as poultry meat and eggs.
This trend has already been observed in the WBCs and the ETCs. Poultry meat per capita consumption has risen two times in the WBCs, 11 times in the Caucasus region (the highest growth is registered in Georgia) and three times in Central Asia (the highest growth is in Tajikistan) in the last ten years. See Table 18 for country-level details.
Poultry Other
,
Serb
ia &
Mon
tene
gro
Uzb
ekis
tan
Azer
baija
n
Kyrg
yzst
an
Mon
golia
Geo
rgia
Repu
blic
of M
oldo
va
Alba
nia
Arm
enia
Tajik
ista
n
Bosn
ia &
Her
zego
vina
FYR
Mac
edon
ia
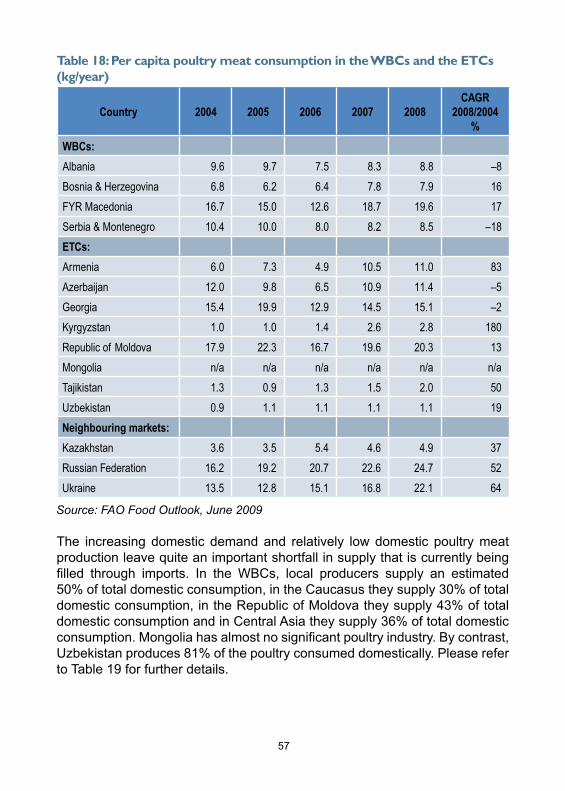
57
Table 18: Per capita poultry meat consumption in the WBCs and the ETCs (kg/year)
Country 2004 2005 2006 2007 2008CAGR
2008/2004%
WBCs:
Albania 9.6 9.7 7.5 8.3 8.8 –8
Bosnia & Herzegovina 6.8 6.2 6.4 7.8 7.9 16
FYR Macedonia 16.7 15.0 12.6 18.7 19.6 17
Serbia & Montenegro 10.4 10.0 8.0 8.2 8.5 –18
ETCs:
Armenia 6.0 7.3 4.9 10.5 11.0 83
Azerbaijan 12.0 9.8 6.5 10.9 11.4 –5
Georgia 15.4 19.9 12.9 14.5 15.1 –2
Kyrgyzstan 1.0 1.0 1.4 2.6 2.8 180
Republic of Moldova 17.9 22.3 16.7 19.6 20.3 13
Mongolia n/a n/a n/a n/a n/a n/a
Tajikistan 1.3 0.9 1.3 1.5 2.0 50
Uzbekistan 0.9 1.1 1.1 1.1 1.1 19
Neighbouring markets:
Kazakhstan 3.6 3.5 5.4 4.6 4.9 37
Russian Federation 16.2 19.2 20.7 22.6 24.7 52
Ukraine 13.5 12.8 15.1 16.8 22.1 64
Source: FAO Food Outlook, June 2009
The increasing domestic demand and relatively low domestic poultry meat production leave quite an important shortfall in supply that is currently being filled through imports. In the WBCs, local producers supply an estimated 50% of total domestic consumption, in the Caucasus they supply 30% of total domestic consumption, in the Republic of Moldova they supply 43% of total domestic consumption and in Central Asia they supply 36% of total domestic consumption. Mongolia has almost no significant poultry industry. By contrast, Uzbekistan produces 81% of the poultry consumed domestically. Please refer to Table 19 for further details.
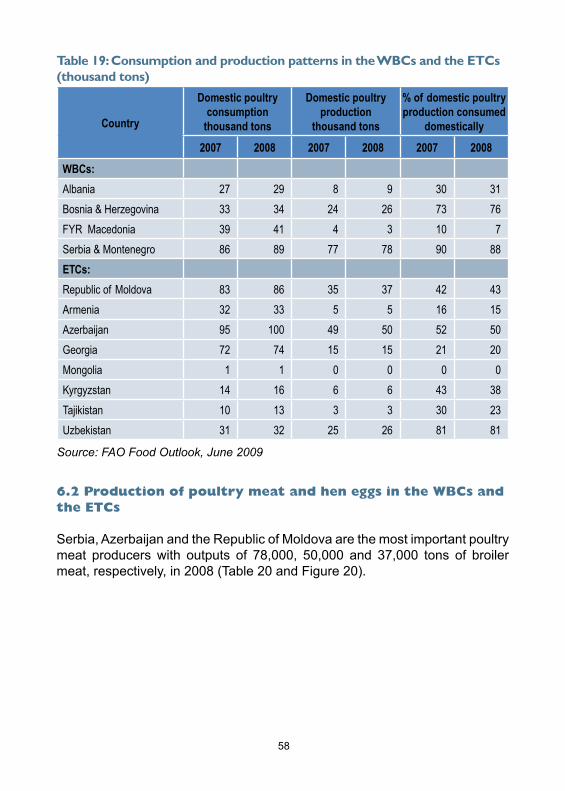
58
Table 19: Consumption and production patterns in the WBCs and the ETCs (thousand tons)
Country
Domestic poultry consumption
thousand tons
Domestic poultry production
thousand tons
% of domestic poultry production consumed
domestically
2007 2008 2007 2008 2007 2008
WBCs:
Albania 27 29 8 9 30 31
Bosnia & Herzegovina 33 34 24 26 73 76
FYR Macedonia 39 41 4 3 10 7
Serbia & Montenegro 86 89 77 78 90 88
ETCs:
Republic of Moldova 83 86 35 37 42 43
Armenia 32 33 5 5 16 15
Azerbaijan 95 100 49 50 52 50
Georgia 72 74 15 15 21 20
Mongolia 1 1 0 0 0 0
Kyrgyzstan 14 16 6 6 43 38
Tajikistan 10 13 3 3 30 23
Uzbekistan 31 32 25 26 81 81
Source: FAO Food Outlook, June 2009
6.2 Production of poultry meat and hen eggs in the WBCs and the ETCs
Serbia, Azerbaijan and the Republic of Moldova are the most important poultry meat producers with outputs of 78,000, 50,000 and 37,000 tons of broiler meat, respectively, in 2008 (Table 20 and Figure 20).
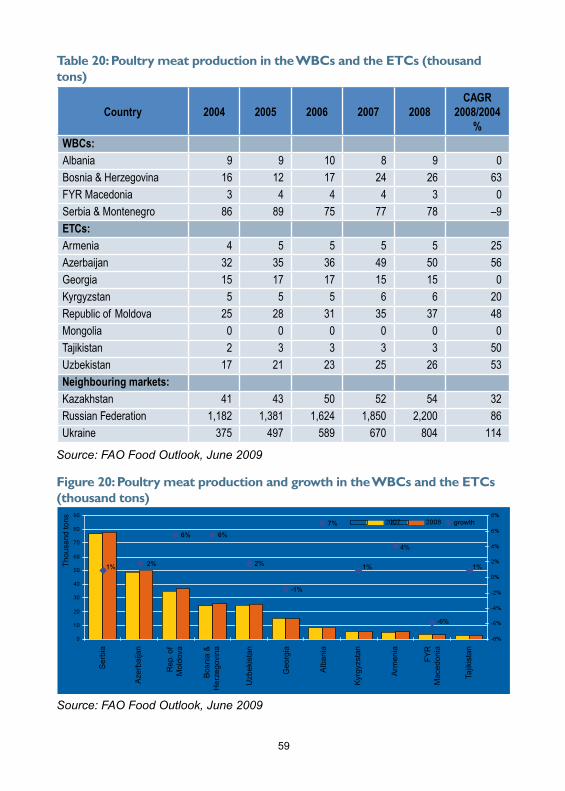
59
Table 20: Poultry meat production in the WBCs and the ETCs (thousand tons)
Country 2004 2005 2006 2007 2008CAGR
2008/2004 %
WBCs:Albania 9 9 10 8 9 0Bosnia & Herzegovina 16 12 17 24 26 63FYR Macedonia 3 4 4 4 3 0Serbia & Montenegro 86 89 75 77 78 –9ETCs:Armenia 4 5 5 5 5 25Azerbaijan 32 35 36 49 50 56Georgia 15 17 17 15 15 0Kyrgyzstan 5 5 5 6 6 20Republic of Moldova 25 28 31 35 37 48Mongolia 0 0 0 0 0 0Tajikistan 2 3 3 3 3 50Uzbekistan 17 21 23 25 26 53Neighbouring markets:Kazakhstan 41 43 50 52 54 32Russian Federation 1,182 1,381 1,624 1,850 2,200 86Ukraine 375 497 589 670 804 114
Source: FAO Food Outlook, June 2009
Figure 20: Poultry meat production and growth in the WBCs and the ETCs (thousand tons)
Source: FAO Food Outlook, June 2009
Tho
usan
d to
ns
Rep
. of
Mol
dova
Ser
bia
Aze
rbai
jan
Uzb
ekis
tan
Geo
rgia
Alb
ania
Kyr
gyzs
tan
Arm
enia
FY
RM
aced
onia
Tajik
ista
n
Bos
nia
&H
erze
govi
na
1%1%1% 2%
6%6%
2%
-1%
4%
growth7%
-6%
60
When private business moved into the poultry industry after the fall of the centrally planned economies in the WBCs and the ETCs, local poultry production and processing facilities were severely hampered by technological and managerial inefficiencies (outdated equipment and lack of a skilled and motivated workforce). In a little over ten years, many countries showcase successful projects in the poultry industry. For example, the Albanian company Driza Limited currently produces high-quality poultry and poultry meat products on an industrial scale.
In the Caucasus as well, poultry meat production has been rising over recent years, doubling between 2000 and 2008. The Georgian poultry industry is doing well compared with the difficulties in other agricultural sectors. There are 20 large- and medium-sized poultry farms and about 1,500 small farms in the country, employing a total of 10,000 people24. The Kvemo Kartli region, with 1.1 million birds, is the most important poultry producer in Georgia. In Armenia, until 1997–1998 the demand for chicken eggs was met predominantly through imports. Since the spring of 2001, Armenia stopped importing eggs and has become an egg exporter. The most popular local products are supplied by the companies Arzni and Lusakert.
In Central Asia, the poultry industry has also grown almost 3%, with Uzbekistan contributing to this positive growth. There are 58 poultry farms, of which 20 are broiler farms, 26 are laying-hen farms, 5 are turkey farms and 7 farms are specialized breeding farms.
In Tajikistan, there are 16 poultry farms, which25 produce 3,000 tons of poultry meat and over 100 million eggs per year. This production covers about 25% of the domestic demand for poultry meat. Poultry farming is mostly located in the districts of Vahdat, Jomi and Shahritus, as well as in the city of Kulob.
In Mongolia, until recently there were 27 chicken farms. However, seven farms had to shut down because of difficulties arising from the economic crisis and growing egg imports. As per Mongolia’s Poultry Association, 345,000 laying hens could supply all of Mongolian’s demand for eggs. For the time being, the parliament does not plan to halt egg imports (which would help the domestic sector to cope with the financial crisis) but has approved a tax increase on imported eggs26. Despite high local meat production, poultry from the United States has been popular, especially in Ulaanbaatar. Outside Ulaanbaatar, sales of frozen products are limited by the undeveloped cold-storage chain and by low incomes. As a result of the recent economic crisis, the significant decease in meat prices and imports reflects
24 Business/Rezonansi (Resonance), July 2008.25 MOA, 2008 data.26 http://ubpost.mongolnews.mn (accessed19 March 2009).
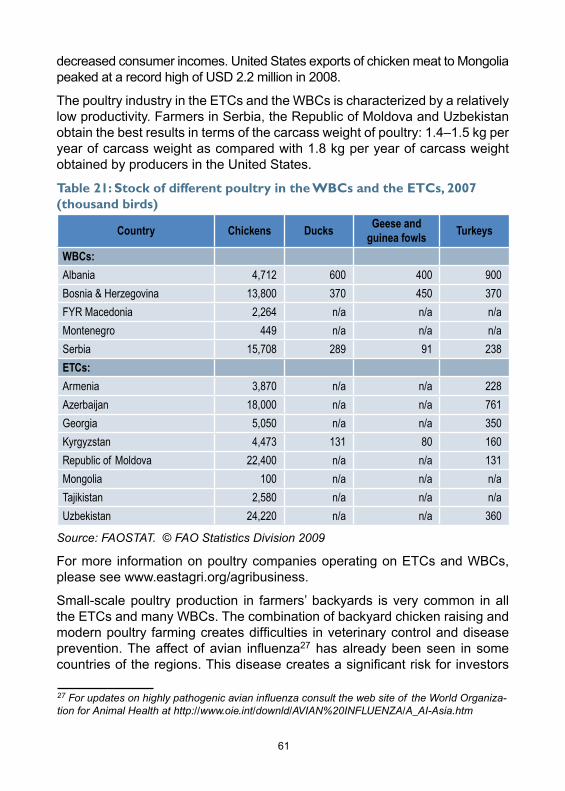
61
decreased consumer incomes. United States exports of chicken meat to Mongolia peaked at a record high of USD 2.2 million in 2008.
The poultry industry in the ETCs and the WBCs is characterized by a relatively low productivity. Farmers in Serbia, the Republic of Moldova and Uzbekistan obtain the best results in terms of the carcass weight of poultry: 1.4–1.5 kg per year of carcass weight as compared with 1.8 kg per year of carcass weight obtained by producers in the United States.
Table 21: Stock of different poultry in the WBCs and the ETCs, 2007 (thousand birds)
Country Chickens DucksGeese and
guinea fowlsTurkeys
WBCs:
Albania 4,712 600 400 900
Bosnia & Herzegovina 13,800 370 450 370
FYR Macedonia 2,264 n/a n/a n/a
Montenegro 449 n/a n/a n/a
Serbia 15,708 289 91 238
ETCs:
Armenia 3,870 n/a n/a 228
Azerbaijan 18,000 n/a n/a 761
Georgia 5,050 n/a n/a 350
Kyrgyzstan 4,473 131 80 160
Republic of Moldova 22,400 n/a n/a 131
Mongolia 100 n/a n/a n/a
Tajikistan 2,580 n/a n/a n/a
Uzbekistan 24,220 n/a n/a 360
Source: FAOSTAT. © FAO Statistics Division 2009
For more information on poultry companies operating on ETCs and WBCs, please see www.eastagri.org/agribusiness.
Small-scale poultry production in farmers’ backyards is very common in all the ETCs and many WBCs. The combination of backyard chicken raising and modern poultry farming creates difficulties in veterinary control and disease prevention. The affect of avian influenza27 has already been seen in some countries of the regions. This disease creates a significant risk for investors
27 For updates on highly pathogenic avian influenza consult the web site of the World Organiza-tion for Animal Health at http://www.oie.int/downld/AVIAN%20INFLUENZA/A_AI-Asia.htm
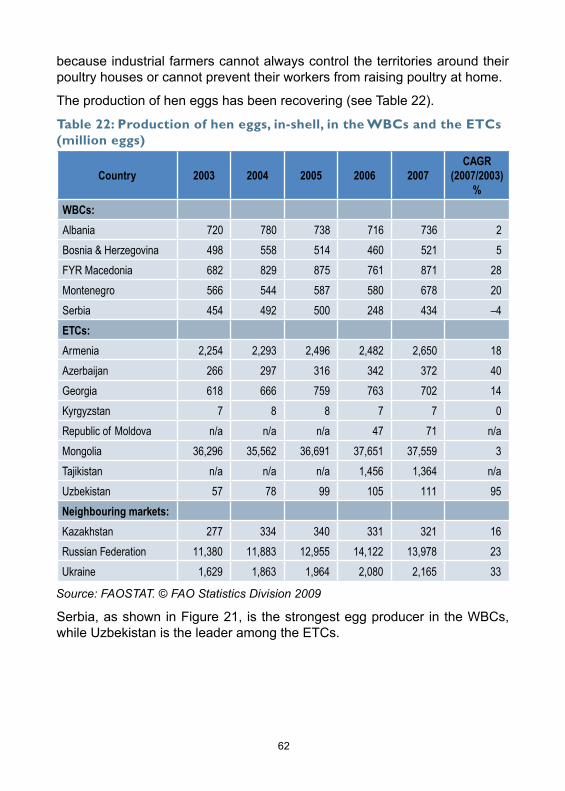
62
because industrial farmers cannot always control the territories around their poultry houses or cannot prevent their workers from raising poultry at home.
The production of hen eggs has been recovering (see Table 22).
Table 22: Production of hen eggs, in-shell, in the WBCs and the ETCs (million eggs)
Country 2003 2004 2005 2006 2007CAGR
(2007/2003) %
WBCs:
Albania 720 780 738 716 736 2
Bosnia & Herzegovina 498 558 514 460 521 5
FYR Macedonia 682 829 875 761 871 28
Montenegro 566 544 587 580 678 20
Serbia 454 492 500 248 434 –4
ETCs:
Armenia 2,254 2,293 2,496 2,482 2,650 18
Azerbaijan 266 297 316 342 372 40
Georgia 618 666 759 763 702 14
Kyrgyzstan 7 8 8 7 7 0
Republic of Moldova n/a n/a n/a 47 71 n/a
Mongolia 36,296 35,562 36,691 37,651 37,559 3
Tajikistan n/a n/a n/a 1,456 1,364 n/a
Uzbekistan 57 78 99 105 111 95
Neighbouring markets:
Kazakhstan 277 334 340 331 321 16
Russian Federation 11,380 11,883 12,955 14,122 13,978 23
Ukraine 1,629 1,863 1,964 2,080 2,165 33
Source: FAOSTAT. © FAO Statistics Division 2009
Serbia, as shown in Figure 21, is the strongest egg producer in the WBCs, while Uzbekistan is the leader among the ETCs.
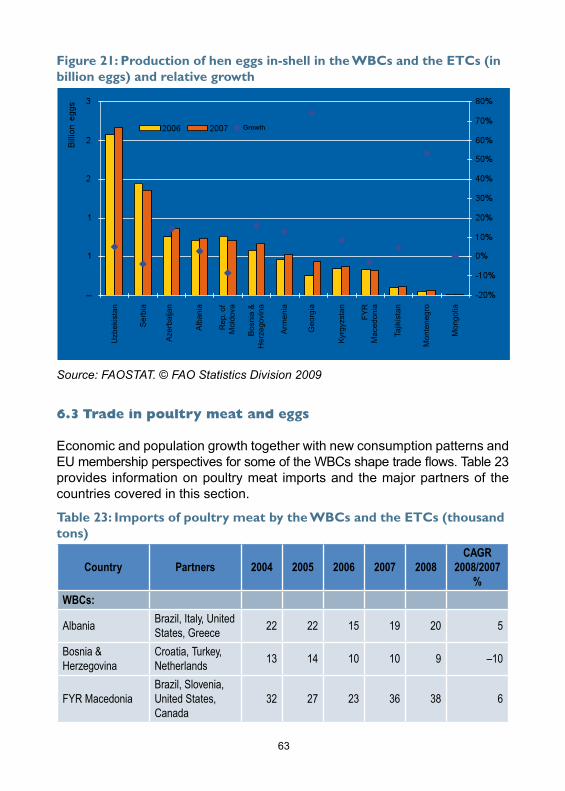
63
Figure 21: Production of hen eggs in-shell in the WBCs and the ETCs (in billion eggs) and relative growth
Source: FAOSTAT. © FAO Statistics Division 2009
6.3 Trade in poultry meat and eggs
Economic and population growth together with new consumption patterns and EU membership perspectives for some of the WBCs shape trade flows. Table 23 provides information on poultry meat imports and the major partners of the countries covered in this section.
Table 23: Imports of poultry meat by the WBCs and the ETCs (thousand tons)
Country Partners 2004 2005 2006 2007 2008CAGR
2008/2007%
WBCs:
AlbaniaBrazil, Italy, United States, Greece
22 22 15 19 20 5
Bosnia & Herzegovina
Croatia, Turkey, Netherlands
13 14 10 10 9 –10
FYR MacedoniaBrazil, Slovenia, United States, Canada
32 27 23 36 38 6
Growth
Rep
. of
Mol
dova
Ser
bia
Aze
rbai
jan
Uzb
ekis
tan
Geo
rgia
Alb
ania
Kyr
gyzs
tan
Arm
enia
FY
RM
aced
onia
Tajik
ista
n
Mon
golia
Mon
tene
gro
Bos
nia
&H
erze
govi
na
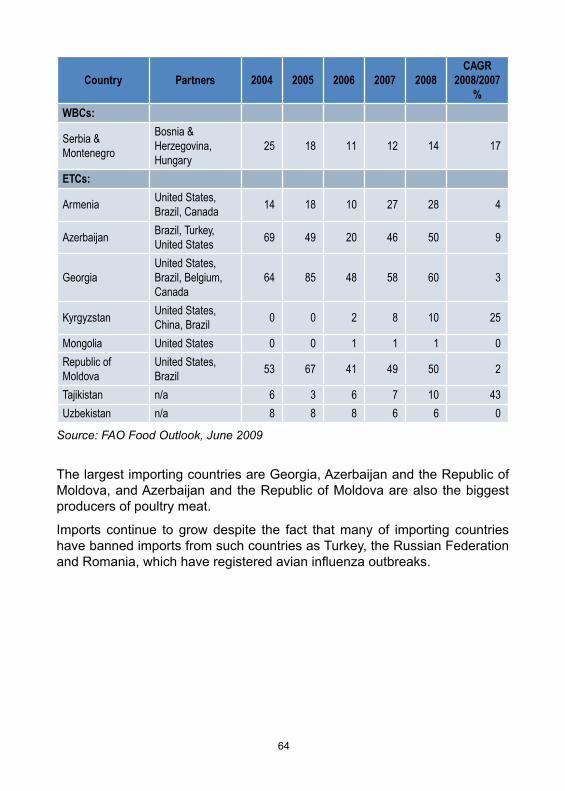
64
Country Partners 2004 2005 2006 2007 2008CAGR
2008/2007%
WBCs:
Serbia & Montenegro
Bosnia & Herzegovina, Hungary
25 18 11 12 14 17
ETCs:
ArmeniaUnited States, Brazil, Canada
14 18 10 27 28 4
AzerbaijanBrazil, Turkey, United States
69 49 20 46 50 9
GeorgiaUnited States, Brazil, Belgium, Canada
64 85 48 58 60 3
KyrgyzstanUnited States, China, Brazil
0 0 2 8 10 25
Mongolia United States 0 0 1 1 1 0
Republic of Moldova
United States, Brazil
53 67 41 49 50 2
Tajikistan n/a 6 3 6 7 10 43
Uzbekistan n/a 8 8 8 6 6 0
Source: FAO Food Outlook, June 2009
The largest importing countries are Georgia, Azerbaijan and the Republic of Moldova, and Azerbaijan and the Republic of Moldova are also the biggest producers of poultry meat.
Imports continue to grow despite the fact that many of importing countries have banned imports from such countries as Turkey, the Russian Federation and Romania, which have registered avian influenza outbreaks.
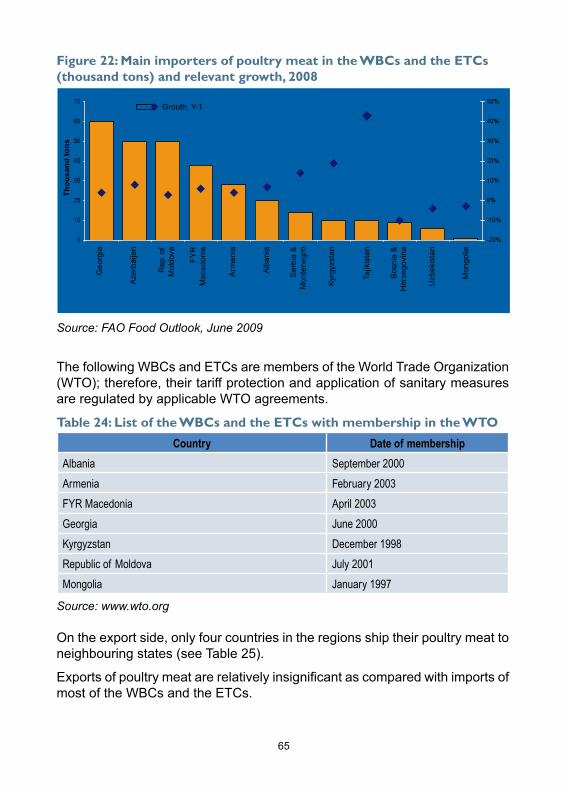
65
Figure 22: Main importers of poultry meat in the WBCs and the ETCs (thousand tons) and relevant growth, 2008
Source: FAO Food Outlook, June 2009
The following WBCs and ETCs are members of the World Trade Organization (WTO); therefore, their tariff protection and application of sanitary measures are regulated by applicable WTO agreements.
Table 24: List of the WBCs and the ETCs with membership in the WTO
Country Date of membership
Albania September 2000
Armenia February 2003
FYR Macedonia April 2003
Georgia June 2000
Kyrgyzstan December 1998
Republic of Moldova July 2001
Mongolia January 1997
Source: www.wto.org
On the export side, only four countries in the regions ship their poultry meat to neighbouring states (see Table 25).
Exports of poultry meat are relatively insignificant as compared with imports of most of the WBCs and the ETCs.
Th
ou
san
d t
on
s
Grouth, Y-1
Rep
. of
Mol
dova
Aze
rbai
jan
Uzb
ekis
tan
Geo
rgia
Alb
ania
Kyr
gyzs
tan
Arm
enia
FY
RM
aced
onia
Tajik
ista
n
Mon
golia
Ser
bia
&M
onte
negr
o
Bos
nia
&H
erze
govi
na
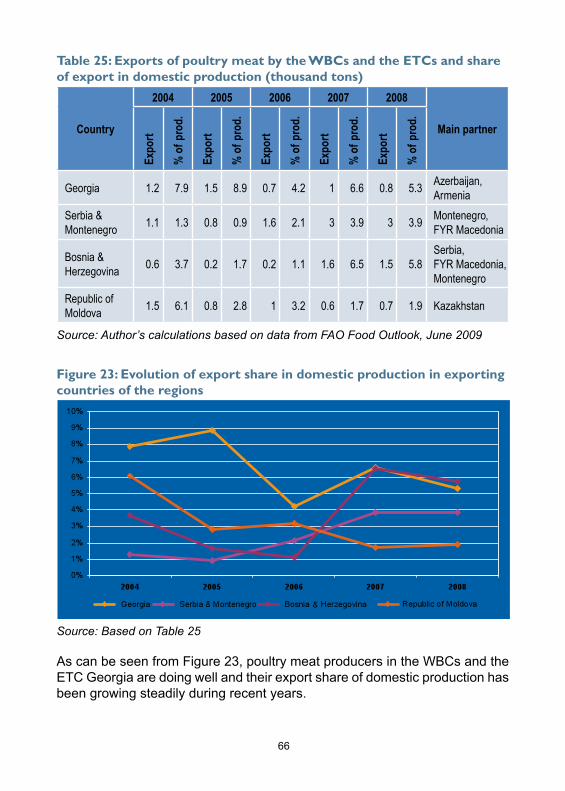
66
Table 25: Exports of poultry meat by the WBCs and the ETCs and share of export in domestic production (thousand tons)
Country
2004 2005 2006 2007 2008
Main partner
Expo
rt
% o
f pro
d.
Expo
rt
% o
f pro
d.
Expo
rt
% o
f pro
d.
Expo
rt
% o
f pro
d.
Expo
rt
% o
f pro
d.
Georgia 1.2 7.9 1.5 8.9 0.7 4.2 1 6.6 0.8 5.3Azerbaijan, Armenia
Serbia & Montenegro
1.1 1.3 0.8 0.9 1.6 2.1 3 3.9 3 3.9Montenegro, FYR Macedonia
Bosnia & Herzegovina
0.6 3.7 0.2 1.7 0.2 1.1 1.6 6.5 1.5 5.8Serbia, FYR Macedonia, Montenegro
Republic of Moldova
1.5 6.1 0.8 2.8 1 3.2 0.6 1.7 0.7 1.9 Kazakhstan
Source: Author’s calculations based on data from FAO Food Outlook, June 2009
Figure 23: Evolution of export share in domestic production in exporting countries of the regions
Source: Based on Table 25
As can be seen from Figure 23, poultry meat producers in the WBCs and the ETC Georgia are doing well and their export share of domestic production has been growing steadily during recent years.
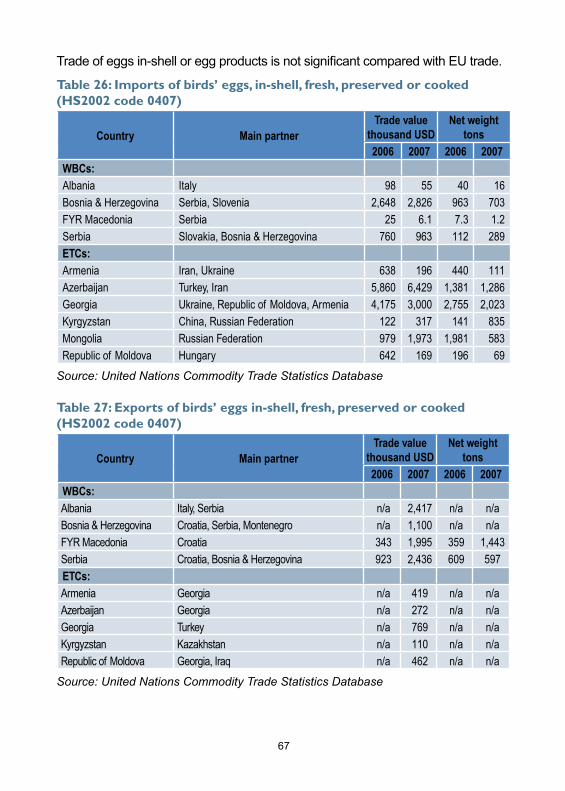
67
Trade of eggs in-shell or egg products is not significant compared with EU trade.
Table 26: Imports of birds’ eggs, in-shell, fresh, preserved or cooked (HS2002 code 0407)
Country Main partnerTrade value
thousand USDNet weight
tons2006 2007 2006 2007
WBCs:Albania Italy 98 55 40 16 Bosnia & Herzegovina Serbia, Slovenia 2,648 2,826 963 703 FYR Macedonia Serbia 25 6.1 7.3 1.2 Serbia Slovakia, Bosnia & Herzegovina 760 963 112 289 ETCs:Armenia Iran, Ukraine 638 196 440 111 Azerbaijan Turkey, Iran 5,860 6,429 1,381 1,286 Georgia Ukraine, Republic of Moldova, Armenia 4,175 3,000 2,755 2,023 Kyrgyzstan China, Russian Federation 122 317 141 835 Mongolia Russian Federation 979 1,973 1,981 583 Republic of Moldova Hungary 642 169 196 69
Source: United Nations Commodity Trade Statistics Database
Table 27: Exports of birds’ eggs in-shell, fresh, preserved or cooked (HS2002 code 0407)
Country Main partnerTrade value
thousand USDNet weight
tons2006 2007 2006 2007
WBCs:Albania Italy, Serbia n/a 2,417 n/a n/aBosnia & Herzegovina Croatia, Serbia, Montenegro n/a 1,100 n/a n/aFYR Macedonia Croatia 343 1,995 359 1,443Serbia Croatia, Bosnia & Herzegovina 923 2,436 609 597 ETCs:Armenia Georgia n/a 419 n/a n/aAzerbaijan Georgia n/a 272 n/a n/aGeorgia Turkey n/a 769 n/a n/aKyrgyzstan Kazakhstan n/a 110 n/a n/aRepublic of Moldova Georgia, Iraq n/a 462 n/a n/a
Source: United Nations Commodity Trade Statistics Database

68
Table 28: Imports of birds’ eggs not in-shell and egg yolks by the WBCs and the ETCs (HS0408)
Country Main partnersTrade value
thousand USDNet weight tons
2006 2007 2006 2007
WBCs:
Albania Greece, Italy 18 58 8.8 15
Bosnia & Herzegovina Croatia 86 85 16 13
FYR Macedonia Croatia, Argentina 625 1,360 152 251
Serbia Argentina, France 483 440 100 79
ETCs:
Armenia India, Poland 56 68 22 23
Azerbaijan Germany 0.9 n/a 0.5 n/a
Georgia Germany 15 5.5 3.1 1
Kyrgyzstan Russian Federation 4.0 3.2 12 5.5
Mongolia China 7.6 8.8 13 15
Source: United Nations Commodity Trade Statistics Database
Table 29: Exports of birds’ eggs not in-shell and egg yolks by the WBCs and the ETCs (HS0408)
Country Main partnersTrade value
thousand USDNet weight tons
2006 2007 2006 2007
WBCs:
Bosnia & Herzegovina Serbia 6 n/a 9.2 n/a
FYR Macedonia Croatia n/a 7.1 n/a 5
SerbiaFYR Macedonia, Bosnia & Herzegovina
44.1 83.6 11 12
ETCs:
Mongolia China 0.5 n/a 0.4 n/a
Source: United Nations Commodity Trade Statistics Database
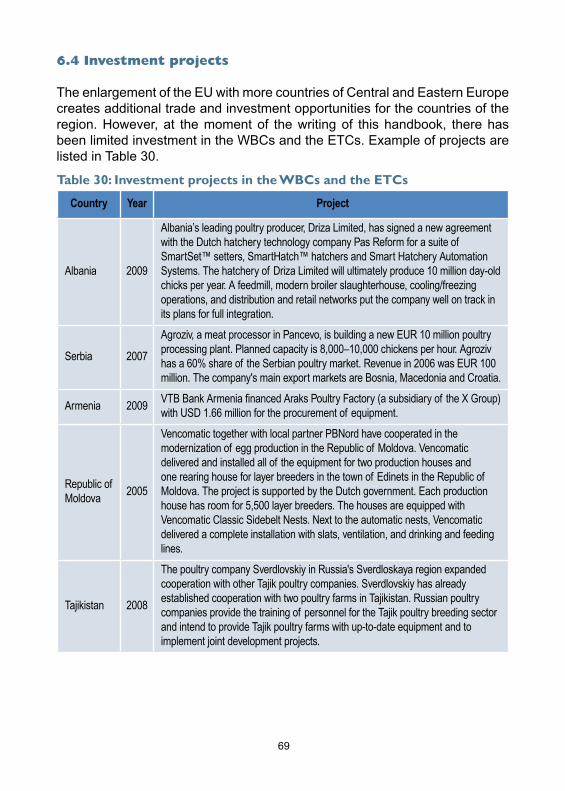
69
6.4 Investment projects
The enlargement of the EU with more countries of Central and Eastern Europe creates additional trade and investment opportunities for the countries of the region. However, at the moment of the writing of this handbook, there has been limited investment in the WBCs and the ETCs. Example of projects are listed in Table 30.
Table 30: Investment projects in the WBCs and the ETCs
Country Year Project
Albania 2009
Albania’s leading poultry producer, Driza Limited, has signed a new agreement with the Dutch hatchery technology company Pas Reform for a suite of SmartSet™ setters, SmartHatch™ hatchers and Smart Hatchery Automation Systems. The hatchery of Driza Limited will ultimately produce 10 million day-old chicks per year. A feedmill, modern broiler slaughterhouse, cooling/freezing operations, and distribution and retail networks put the company well on track in its plans for full integration.
Serbia 2007
Agroziv, a meat processor in Pancevo, is building a new EUR 10 million poultry processing plant. Planned capacity is 8,000–10,000 chickens per hour. Agroziv has a 60% share of the Serbian poultry market. Revenue in 2006 was EUR 100 million. The company's main export markets are Bosnia, Macedonia and Croatia.
Armenia 2009VTB Bank Armenia financed Araks Poultry Factory (a subsidiary of the X Group) with USD 1.66 million for the procurement of equipment.
Republic of Moldova
2005
Vencomatic together with local partner PBNord have cooperated in the modernization of egg production in the Republic of Moldova. Vencomatic delivered and installed all of the equipment for two production houses and one rearing house for layer breeders in the town of Edinets in the Republic of Moldova. The project is supported by the Dutch government. Each production house has room for 5,500 layer breeders. The houses are equipped with Vencomatic Classic Sidebelt Nests. Next to the automatic nests, Vencomatic delivered a complete installation with slats, ventilation, and drinking and feeding lines.
Tajikistan 2008
The poultry company Sverdlovskiy in Russia's Sverdloskaya region expanded cooperation with other Tajik poultry companies. Sverdlovskiy has already established cooperation with two poultry farms in Tajikistan. Russian poultry companies provide the training of personnel for the Tajik poultry breeding sector and intend to provide Tajik poultry farms with up-to-date equipment and to implement joint development projects.

71
7. FURTHER READING
■ The International Egg Commission, www.internationalegg.com
■ The USA Poultry & Egg Export Council, www.usapeec.org
■ Association of Poultry Processors and Poultry Trade in the EU countries, www.avec-poultry.eu
■ National Interprofessional Office for Meat, Livestock and Poultry Farming, (OFIVAL), www.office-elevage.fr
■ www.thepoultrysite.com
■ www.wattpoultry.com and www.wattagnet.com
■ Egg Industry Magazine, www.eggindustry-digital.com/eggindustry
■ World Poultry Magazine and Poultry Processing Magazine, www.worldpoultry.net

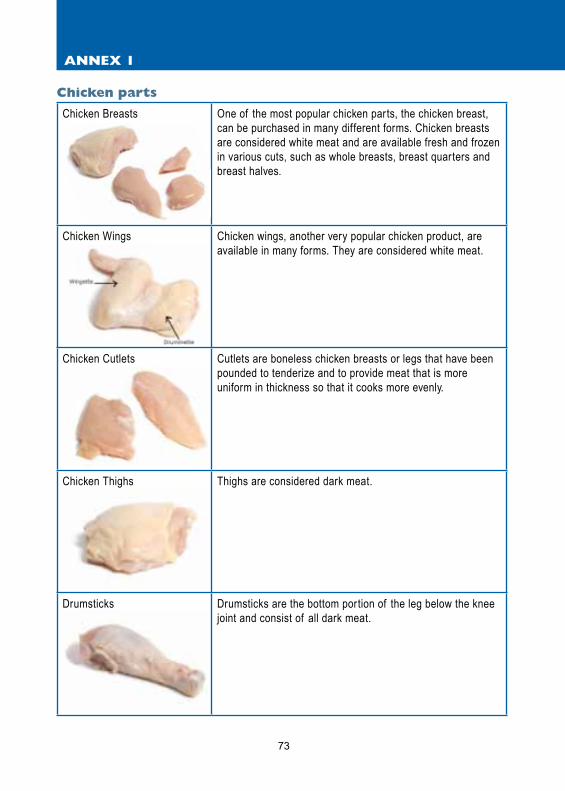
73
ANNEX 1
Chicken parts
Chicken Breasts One of the most popular chicken parts, the chicken breast, can be purchased in many different forms. Chicken breasts are considered white meat and are available fresh and frozen in various cuts, such as whole breasts, breast quarters and breast halves.
Chicken Wings
Chicken wings, another very popular chicken product, are available in many forms. They are considered white meat.
Chicken Cutlets
Cutlets are boneless chicken breasts or legs that have been pounded to tenderize and to provide meat that is more uniform in thickness so that it cooks more evenly.
Chicken Thighs
Thighs are considered dark meat.
Drumsticks Drumsticks are the bottom portion of the leg below the knee joint and consist of all dark meat.
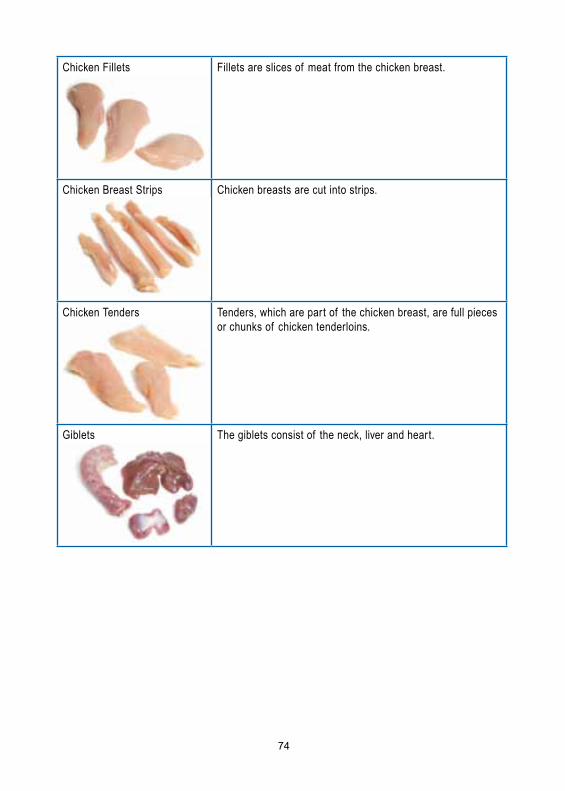
74
Chicken Fillets
Fillets are slices of meat from the chicken breast.
Chicken Breast Strips
Chicken breasts are cut into strips.
Chicken Tenders
Tenders, which are part of the chicken breast, are full pieces or chunks of chicken tenderloins.
Giblets
The giblets consist of the neck, liver and heart.
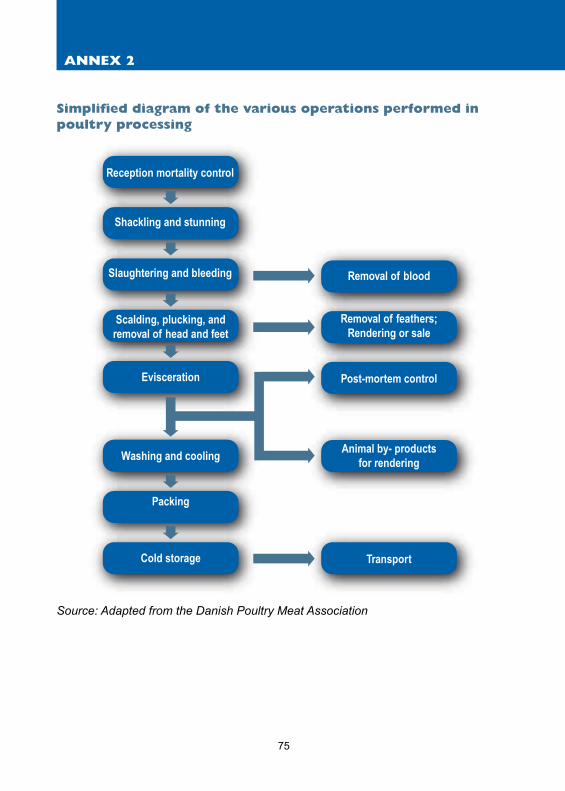
75
ANNEX 2
Simplified diagram of the various operations performed in poultry processing
Source: Adapted from the Danish Poultry Meat Association
Slaughtering and bleeding
Scalding, plucking, andremoval of head and feet
Shackling and stunning
Reception mortality control
Removal of blood
Removal of feathers;Rendering or sale
Post-mortem control
Animal by- productsfor rendering
Transport
Evisceration
Washing and cooling
Packing
Cold storage