
TÖLVUNARFRÆÐIDEILD BJÖRN ÞÓR JÓNSSON, DEILDARFORSETI 21.3.2011
POTENTIALS AND TECHNOLOGIES FOR UTILISATION OF RENEWABLE ENERGY SOURCES
Professor em. Björn Kjellström
Heat and Power Technology Royal Institute of Technology
Stockholm
NOMENCLATURE c speed of light cp specific heat at constant pressure cv specific heat at constant volume F force g acceleration of gravity h specific enthalpy H heating value I electric current m mass p pressure P power Q thermal energy, heat t time T temperature u specific internal energy v specific volume = 1/ρ V electric tension w velocity W energy, general x distance y parameter defining physical state z vertical distance η energy efficiency ρ density Subscripts el electricity fuel fuel heat useful heat loss loss marg marginal th thermal LIST OF ABBREVIATIONS ARC Anti-reflection coating cap capita GNP Gross national product IPCC Intergovernmental Panel on Climate Change PAH polyaromatic hydrocarbons PV Photo-voltaic RME rapsmetylester SEK Swedish crown USD US Dollar VOC volatile organic compounds
1. INTRODUCTION
1.1 Scope of these notes The objective of the lecture notes is to give an introduction to the current issues of energy engineering with a focus on the role of energy supply for development of the human societies. Technical issues are treated only to the extent that this is necessary for understanding of the limitations and potential of the current technologies. These notes discuss the potential and technologies of renewable energy sources for generation of energy carriers in industrial and developing countries. The approach is source-oriented rather than user-oriented, but this does not mean that it is implied that a switch from a “conventional” energy source to a renewable energy source requires that the same energy carrier or the same amount of energy shall serve the needs of the user after the switch. Since use of renewable energy is often more expensive than use of the conventional energy sources, introduction of energy conservation measures is often economically justified when the switch to renewable energy is made.
1.2 Definition of renewable energy In the strict thermodynamic sense energy cannot be destroyed or produced, only converted from one form to another. These conversions are associated with an increase of the total entropy, which means a loss in the “quality” of the energy i.e. a loss of exergy. Apparently, renewable energy is a contradiction from a strict thermodynamic point of view. The term is nevertheless used frequently, not only by politicians and laymen, but also by those who understand their thermodynamics. Renewable energy is then understood as energy that is supplied directly or indirectly from the Sun or the Moon and thermal energy stored or generated below the crust of our planet, the Earth. In other words, renewable energy represents energy that can be expected to be available for as long as the Earth is habitable for the human race. Certainly these energy flows will deteriorate at some stage, but in the human perspective they may be considered as perpetual. This is in contrast with the large but much more limited deposits of fossil fuels, coal, petroleum and natural gas and the likewise limited deposits of fissile uranium. Even though renewable energy is based on energy sources that are expected to be available very far into the future, there is no guarantee that an energy system is sustainable just because it relies on renewable energy sources. A discussion of different requirements for sustainability is the subject of a forthcoming lecture. It may be sufficient at this stage to mention two requirements for sustainability that must be fulfilled in addition to a sustainable energy source. These are economic sustainability and environmental sustainability. Economic sustainability requires that the resources generated by utilisation of the energy source exceed those needed for the utilisation. Environmental sustainability requires that first of all the resource base is not deteriorated by excessive utilisation. This can easily be the case when biomass energy is over-utilised. Environmental sustainability also requires that the impacts and risks caused by the utilisation are
1

acceptable and do not jeopardise the possibilities for future generations to survive on the Earth.
1.3 Overview As mentioned, renewable energy is either energy that is supplied directly or indirectly from the Sun or the Moon or thermal energy stored or generated below the crust of our planet, the Earth. The annual energy flow from the sun is very large compared to the present use of technical energy, about 0,112 EWh, as illustrated by figure 1. The problem with utilising this energy flow is that the energy density is much lower than needed in most technical applications, see some examples in table 1.
Figure 1. Comparison between natural and technical energy flows Table 1. Energy densities for solar energy and technical energy Energy source or user application
Average power kW
Projected area for supply or user application, m2
Average power density, W/m2
Solar radiation to Earth 121.1012 510.1012 2371
Single family house in Sweden 3 120 25 Car 100 10 10000 Electric light bulb 0,6 0,003 200000 The power density in most applications for technical energy is much higher than the power density of solar energy on the projected surface of the device used for final energy conversion. Also, there is generally a mis-match between the daily and 1 Average to whole Earth. In Stockholm 114 W/m2, year
2
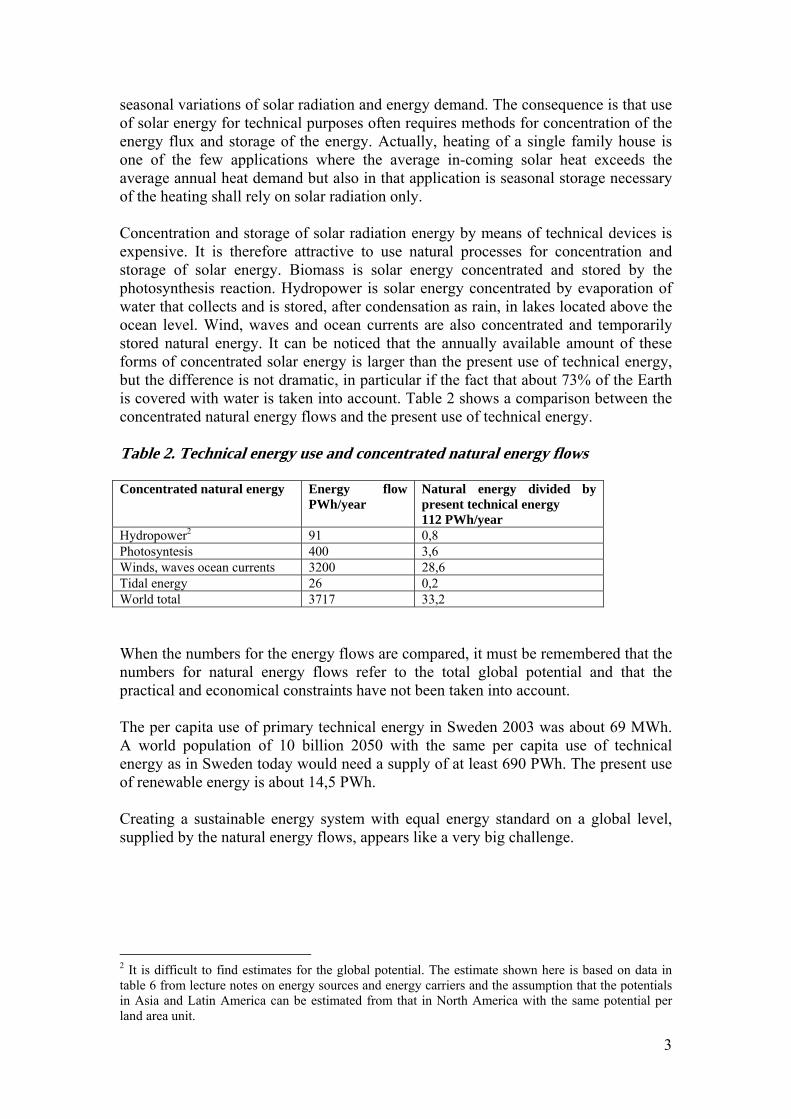
seasonal variations of solar radiation and energy demand. The consequence is that use of solar energy for technical purposes often requires methods for concentration of the energy flux and storage of the energy. Actually, heating of a single family house is one of the few applications where the average in-coming solar heat exceeds the average annual heat demand but also in that application is seasonal storage necessary of the heating shall rely on solar radiation only. Concentration and storage of solar radiation energy by means of technical devices is expensive. It is therefore attractive to use natural processes for concentration and storage of solar energy. Biomass is solar energy concentrated and stored by the photosynthesis reaction. Hydropower is solar energy concentrated by evaporation of water that collects and is stored, after condensation as rain, in lakes located above the ocean level. Wind, waves and ocean currents are also concentrated and temporarily stored natural energy. It can be noticed that the annually available amount of these forms of concentrated solar energy is larger than the present use of technical energy, but the difference is not dramatic, in particular if the fact that about 73% of the Earth is covered with water is taken into account. Table 2 shows a comparison between the concentrated natural energy flows and the present use of technical energy. Table 2. Technical energy use and concentrated natural energy flows Concentrated natural energy Energy flow
PWh/year Natural energy divided by present technical energy 112 PWh/year
Hydropower2 91 0,8 Photosyntesis 400 3,6 Winds, waves ocean currents 3200 28,6 Tidal energy 26 0,2 World total 3717 33,2 When the numbers for the energy flows are compared, it must be remembered that the numbers for natural energy flows refer to the total global potential and that the practical and economical constraints have not been taken into account. The per capita use of primary technical energy in Sweden 2003 was about 69 MWh. A world population of 10 billion 2050 with the same per capita use of technical energy as in Sweden today would need a supply of at least 690 PWh. The present use of renewable energy is about 14,5 PWh. Creating a sustainable energy system with equal energy standard on a global level, supplied by the natural energy flows, appears like a very big challenge.
2 It is difficult to find estimates for the global potential. The estimate shown here is based on data in table 6 from lecture notes on energy sources and energy carriers and the assumption that the potentials in Asia and Latin America can be estimated from that in North America with the same potential per land area unit.
3
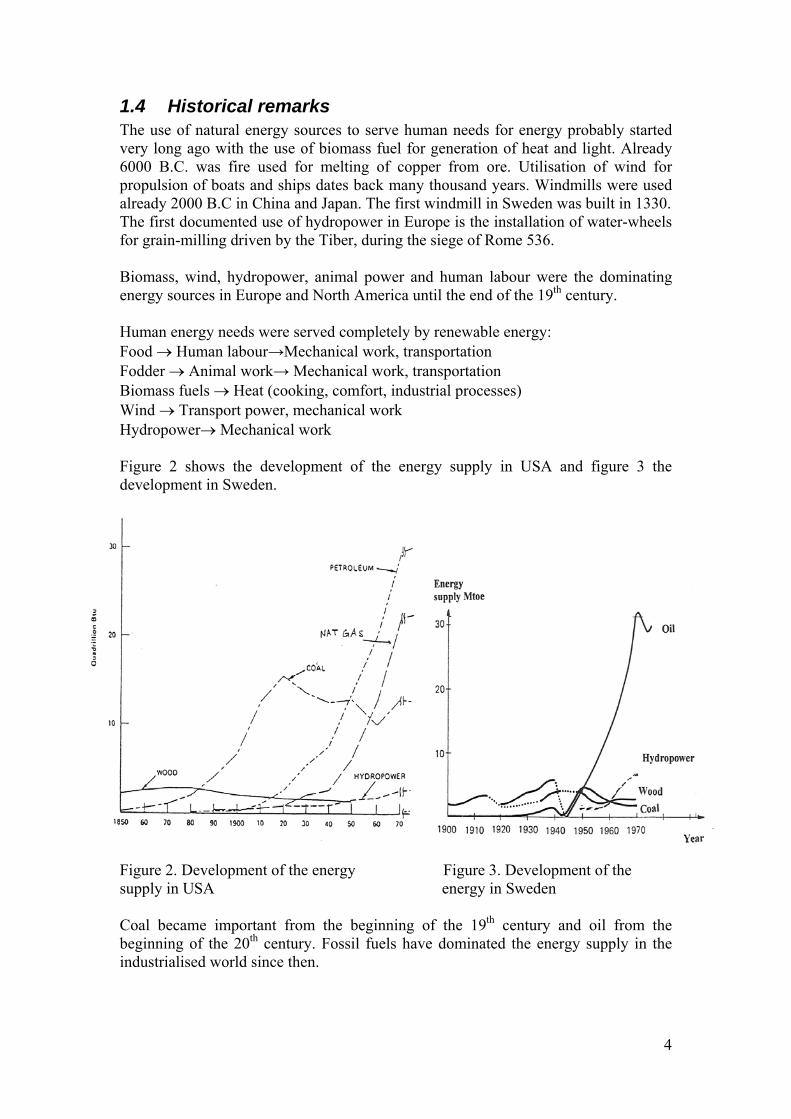
1.4 Historical remarks The use of natural energy sources to serve human needs for energy probably started very long ago with the use of biomass fuel for generation of heat and light. Already 6000 B.C. was fire used for melting of copper from ore. Utilisation of wind for propulsion of boats and ships dates back many thousand years. Windmills were used already 2000 B.C in China and Japan. The first windmill in Sweden was built in 1330. The first documented use of hydropower in Europe is the installation of water-wheels for grain-milling driven by the Tiber, during the siege of Rome 536. Biomass, wind, hydropower, animal power and human labour were the dominating energy sources in Europe and North America until the end of the 19th century. Human energy needs were served completely by renewable energy: Food → Human labour→Mechanical work, transportation Fodder → Animal work→ Mechanical work, transportation Biomass fuels → Heat (cooking, comfort, industrial processes) Wind → Transport power, mechanical work Hydropower→ Mechanical work Figure 2 shows the development of the energy supply in USA and figure 3 the development in Sweden. Figure 2. Development of the energy Figure 3. Development of the supply in USA energy in Sweden Coal became important from the beginning of the 19th century and oil from the beginning of the 20th century. Fossil fuels have dominated the energy supply in the industrialised world since then.
4

In some countries, for instance Sweden that depend on import of fossil fuels, there was a shift back to biomass fuels during the second World War, but the transition back to fossil fuels was rapid after the end of the war. The increasing oil prices during the 1970:s initiated a world wide growth of interest in indigenous energy sources that could serve as a substitute for oil. This coincided with growing concerns about the environmental impacts caused by use of fossil fuels and resulted in launching of ambitious research programs all over the world with the objective to make better use of the natural energy flows. Despite the falling oil prices in the 1980:s, this research and development is still pursued, although with somewhat lower priority, and has resulted in a significantly better understanding of the available potentials and development of technologies for utilisation of natural energy resources. The impact on the energy balances varies. Generation of energy carriers generated from the renewable sources must compete economically with generation from fossil fuels and nuclear fission. With the present costs for fossil fuels and nuclear electricity, renewable energy is only competitive to a limited extent – where the conditions for use of renewable energy are particularly favourable. 2. HYDROPOWER
2.1 Basic principles and features The basic principles are explained in the lecture notes on Energy Sources and Generation of Energy Carriers, see sections 4 and 6.3.2.
2.2 Sustainable potential Also the sustainable potential is discussed in the lecture notes on Energy Sources and Generation of Energy Carriers, see section 4. The emphasis there is on large scale hydropower generation. Small scale use of hydropower can be quite important locally even though the contribution to the overall national energy balance is marginal. In Sweden, small hydropower plants with a capacity below 1500 kW is contributing with about 2 TWh(el) annually. The potential for expansion of small hydropower in Sweden has been estimated to about 2,5 TWh(el).
2.3 Technological state of the art The technology for exploitation of hydropower in large and small scale is well developed and fully commercial.
2.4 Economy A hydropower plant does not normally cost much to operate. The driving energy is available at zero cost. The economy is almost entirely depending on the initial investment for civil work, like dams and water channels, machines, buildings and installation of the machines. Building of a power line from the site of the power plant to the national grid or an isolated group of consumers may also require a significant investment.
5

The necessary investment varies depending on the conditions on site. The range can be 1300 – 6000 SEK/annual kWh. With an interest rate of 5% and an economic life of 40 years, the capital cost for generation will be 86 – 396 SEK/MWh(el). Maintenance costs range between 10 and 40 SEK/MWh(el)
2.5 Environmental considerations3
Exploitation of hydropower resources will always lead to landscape changes. The picture is seldom as idyllic as the illustration of small scale hydropower generation in figure 4 implies.
Figure 4. Artists view of a small hydropower installation A water-fall or rapids will disappear or at least show a reduced water flow. Large parts of the original river may be left dry. If a man-made water reservoir is included in the project, the dam as such means a change in the landscape. More important is the flooding of land caused by the dam and the appearance of the shores when the water level in the reservoir is low. The effects on aquatic life can be significant. In particular migrating fish will be affected. Flooding of large land areas may make it necessary to relocate people and when that is not necessary their possibilities to use agriculture, fishing and other similar activities as main economic activities may be eliminated or reduced. Also cultural heritage may be affected.
3 See SOU 1974:22 and SOU 1976:28 for detailed descriptions of environmental impacts of hydropower exploitation in Sweden
6
The seriousness of these effects is very site specific. The effects may be mitigated by various means but at some cost. Few large hydropower projects today can be implemented without considerable disturbances for the local population.
2.6 Possible future Despite the large local environmental disturbances caused by exploitation of large hydropower resources, a considerable expansion of hydropower all over the World can be expected. The effects are after all local and those that are directly affected can be compensated at least for economic losses. It is likely though that environmental concerns will be more important when projects are designed. 3. WIND ENERGY
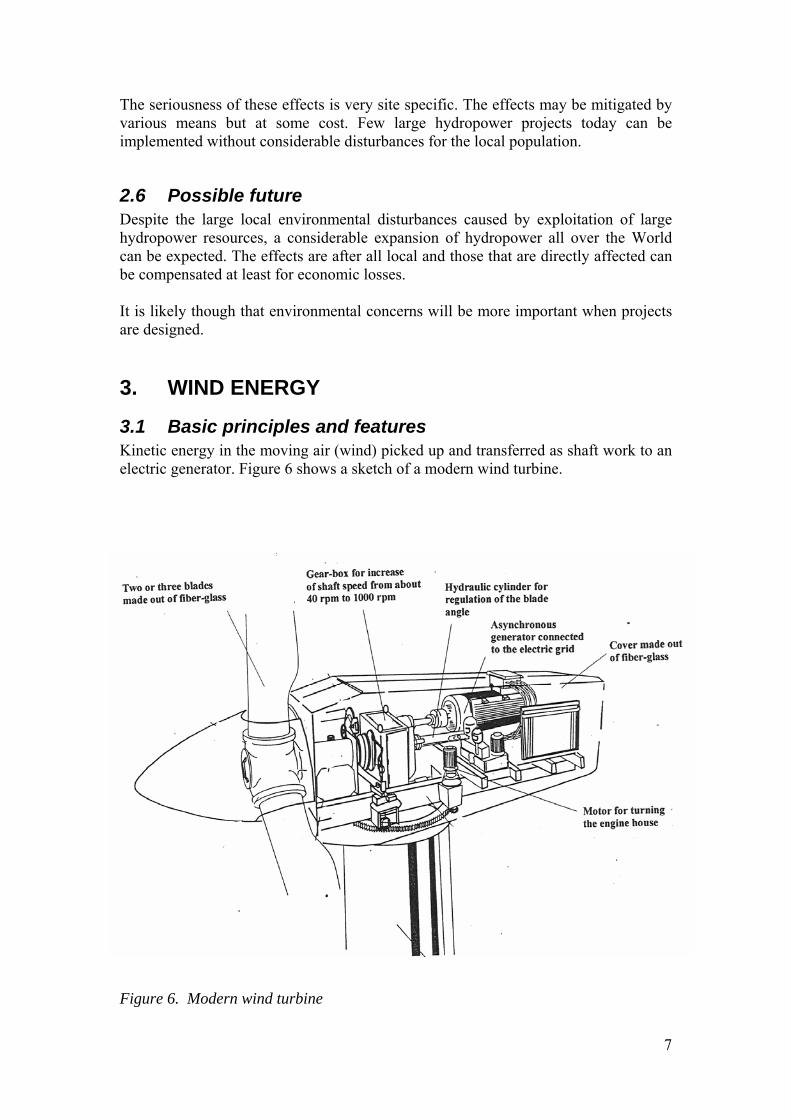
3.1 Basic principles and features Kinetic energy in the moving air (wind) picked up and transferred as shaft work to an electric generator. Figure 6 shows a sketch of a modern wind turbine.
Figure 6. Modern wind turbine
7

Theoretically, 59% of the kinetic energy in the wind can be converted to mechanical energy. In reality, the efficiency is close to 50%. Table 3 shows the theoretically possible generation per unit area at different wind speeds. The theoretical power output is proportional to the wind speed in third power. Table 3. Theoretical generation of mechanical power from wind Wind speed, m/s Theoretical mechanical
power, W/m2
3 9 4,5 30 6 75 9 250 12 600 15 1170 Sites with average wind speeds below 3 m/s are normally considered as unsuitable for wind power
3.2 Sustainable potential The total global potential for use of wind power is very large. However the best wind resources, with average wind speeds above 6 m/s, are only found above the oceans and in the coastal regions. There seem to be no estimates for the global potential in such areas but also this is probably quite large. Several studies have been made in Sweden for estimation of the potential for wind power generation. One of these4 estimated the annual electric generation potential to 70 TWh along the coast from Bohus län to Gävleborgs län if the minimum distance to buildings was set at 300 m. After reduction for opposing interests for land use, the potential was reduced to 7 TWh. The potential for off-shore wind generation in Sweden was estimated to 20 TWh/year. A very recent study5 of possible sites for large scale wind power generation also included areas along the coast and in the mountains of northern Sweden, see map figure 7. There were no detailed estimates of the generation potential in this study but one important conclusion is that the planning goal for 10 TWh wind power in 2015 formulated by the Swedish parliament, probably requires a substantial installation of off-shore wind power plants.
3.3 Technological state of the art Complete wind generators in the capacity range from a few kW to about 800 kW are available on commercial conditions from several suppliers. Table 4 shows data for standard wind generators from one of these, Vestas Wind Systems A/S in Denmark.
4 SOU 1988:32 Läge för vindkraft 5 Boverket 2003 “Förutsättningar för storskalig utbyggnad av vindkraft
8
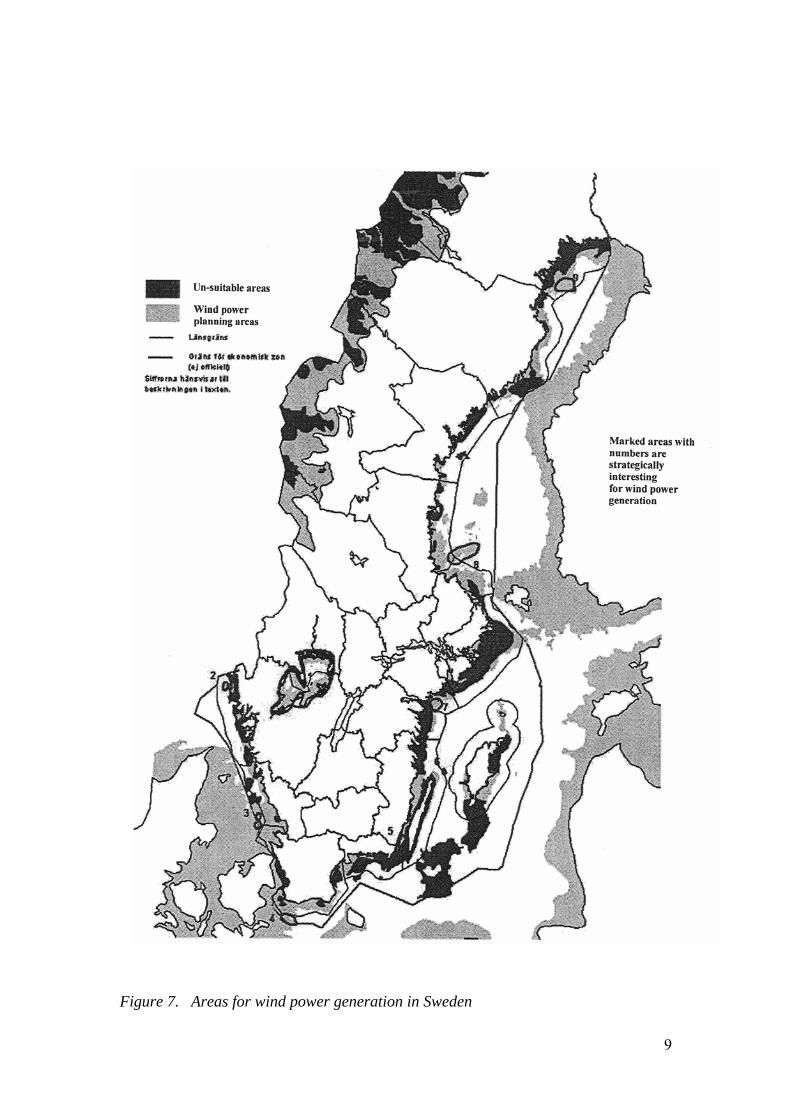
Figure 7. Areas for wind power generation in Sweden
9

Table 4. Data for wind generators from Vestas Wind Systems A/S Model V 47 V 52 V 80 Nominal power output , kW 660 850 2000 Diameter, m 47 52 80 Swept area, m2 1735 2124 5027 Speed, rpm 28,5 26 16,7 Number of blades 3 3 3 Hub height, m 40 - 55 44 - 65 60 - 100 Operational wind speed data Cut in wind speed, m/s 4 4 4 Wind speed at nominal power, m/s 15 16 15 Stop at wind speed, m/s 25 25 25 Annual generation, MWh6 Utilisation time 2500 h/year 1650 2125 5000 Utilisation time 1500 h/year 990 1275 3000 Vestas Wind Systems A/S is now testing a larger wind generator with 90 m rotor diameter and a nominal output of 3 MW. In Sweden, wind power generation has increased during the last decade from almost zero, see table 5. Table 5. Development of wind power generation in Sweden Year Number of
wind generators Installed nominal capacity, MW
Average capacity, kW
Average utilisation time h/year
Generation,GWh
1992 89 20 225 1650 33 1993 128 29 227 1759 51 1994 157 38 242 1974 75 1995 220 67 305 1493 100 1996 304 108 355 1352 146 1997 348 130 374 1585 206 1998 428 178 416 1781 317 1999 486 220 453 1696 373 2000 527 241 457 1855 447 2001 569 293 515 1631 478 It can be seen that the average capacity has been steadily increasing, from 225 kW to just above 500 kW. The data also shows that the actual utilisation time is varying in the range between about 1400 and 2000 hours. The variation is partly an effect of varying wind conditions between the years and partly an effect of different conditions at new sites. The international situation for wind power is summarised in table 6. Germany, followed by USA is leading in installed capacity. Denmark is leading in fraction of electricity supply from wind power.
6 For typical utilisation time 2500 h/year
10

Table 6. Wind power in the world 2001 Country Installed capacity,
MW Fraction of electricity generation, %
Germany 8754 USA 4261 Spain 3337 Denmark 2417 15 India 1407 Italy 697 Netherlands 493 Great Britain 474 0,4 China 352 Sweden 293 0,3
3.4 Economy The economy of wind power generation depends mainly on the capital costs. The wind energy is for free and the costs for operation and maintenance can be estimated to between 50 and 60 SEK/MWh(el). The investment for the wind generator including construction work on the site can be estimated to about 9000 SEK/kW. At an interest rate of 5% and 25 years economic life, this leads to an annual cost of 638 SEK/kW. The cost per generated kWh then depends on the annual generation. For a utilisation time of 2500 hours, the capital cost per kW will be 255 SEK/MWh(el) and the total generation cost about 310 SEK/MWh(el). For a utilisation time of 1500 h/year the total cost will be about 480 SEK/MWh. As can be seen from table 5, the actual utilisation times for the wind generators that have been built in Sweden are closer to 1500 h than 2500 h. There is however an additional cost associated with the irregularity of wind power generation. The generation depends on the wind speed and cannot be controlled to match the electricity demand unless the demand happens to be less than the possible generation. For full utilisation of the wind potential, either storage of the electricity or combined operation with other types of power plants is necessary. In Sweden, the hydropower can be used for compensation of low wind power generation during periods of low winds. During periods with strong winds, the hydropower generation can be reduced and water stored in the reservoirs. The costs for this depend on the capacity of wind power in the system. For wind power generation in Sweden, there will be no additional cost if the annual wind power generation is less than 2 – 2,5 TWh. A generation of 7 TWh from wind leads to an additional cost of about 5 SEK/MWh(el).
3.5 Environmental considerations In comparison with other possibilities for electricity generation, wind power may appear as environmentally benign. There is certainly a visual impact, but the landscape changes caused by construction of the wind power towers are certainly not irreversible. Noise can be a problem and this has caused the Environmental Protection Agency in Sweden to set a limit for how close to populated areas wind power generators can be built. The noise level considered acceptable is 40 dB(A). Depending
11

on the local conditions, the minimum distance from residential buildings may be 250 – 400 m. Disturbances for birds do not appear to be a serious problem. Some disturbances for aquatic life during construction of offshore wind parks is possible. The plans for construction of wind mills or wind parks do nevertheless often meet strong local opposition.
3.6 Possible future The Swedish Parliament has set a planning goal for 10 TWh(el) from wind power to be reached in 2015. Whether this will be reached or not is difficult to assess. The de-regulation of the Swedish electricity market makes it difficult for the government to control what types of power plants are built. The government can however promote or discourage certain investments by introducing taxes or subsidies. The green certificates is an example of such actions. Internationally, the expansion of wind power is expected to continue. 4. SOLAR ENERGY
4.1 Basic principles and features Direct utilisation of solar energy implies catching of the light radiation energy from the Sun that hits the Earth and conversion of this energy to an energy carrier like electricity or to an energy form for final use, often heat. As well known, the solar irradiation varies with time of the day, time of the year and the weather conditions. The first two variations are accurately predictable, but the variations due to cloudiness are more random. The seasonal variations at different latitudes are illustrated in figure 8. The data includes also the effects of variations of the weather. Figure 8. Variations of means daily solar radiation (in kWh/m ) 2
12

The radiation energy received is depending on the angle between the surface and the sun. The data in figure 8 refer to a horisontal surface. The seasonal variations of irradiated energy for surfaces, facing south but at different angles to the horisontal direction, in th Stockholm area are shown in figure 9. The seasonal variations increase towards the north, as also indicated by figure 8. Total annual solar radiation energy to horisontal surfaces in different parts of Sweden are shown in figure 10. Figure 9. Average insolation energy Figure 10. Annual insolation energy in per day in Stockholm region different parts of Sweden In all applications for direct solar energy, the variations of the energy supply will lead to requirements for some type of storage system that can be used to ensure that energy can be used when it is needed, independently of the incoming energy from the sun. In the following, three important applications for direct solar energy, namely Heat supply to buildings Photovoltaic electricity generation Thermal electricity generation will be discussed.
4.2 Sustainable potential The sun as energy source can be considered as truly sustainable within the definitions used in this course. The supply potential can be estimated from solar insolation data like those presented in section 4.1. Such data are available from meteorological statistics. This does not necessarily mean that accurate data are available for a particular site. When this is not the case, it may be necessary to collect site specific data.
13

4.3 Solar heat supply to buildings
4.3.1 Technological state of the art A distinction is usually made between passive and active solar heating of buildings. The two types of systems are illustrated in the somewhat confusing figure 11. The bottom part of the building uses passive solar heating. This means that thermal energy from the sun is collected and stored by the building structure. How much passive solar heating can contribute to the energy balance of a building depends on the design of the building, the location and orientation of the building and the presence of objects in the vicinity of the building that obstruct the solar radiation. Large front with large windows towards the south, no windows towards the north good insulation and high thermal inertia are favourable for passive solar heating. For Sweden, a contribution of 20% can generally be expected7. By design for optimum utilisation about 50% of the heating demand can be met with passive solar heating.
Figure 11. Different approaches to use of solar radiation for heating of a building
The upper part of the building shown in figure 11 uses active solar heating. This means that special collectors for the solar radiation is used and that the thermal energy is picked up by a circulating medium that is used to transfer heat to the building and often also for heating of tap water. Water with anti-freeze is normally used as the circulating medium. Figure 12 shows an example of a flat solar energy collector, used for active solar heating systems. Figure 12. Flat solar energy collector for active solar heating systems
7 Data for heating demands in buildings do seldom include this contribution.
14

Active systems without seasonal storage can cover 20-25% of the annual heating demand. A typical collector surface required for heating of tap water only for a family is 4 – 10 m2 (about 2 m2 for each member of the family). In order to achieve 20-25% reduction of the total heating demand a collector area of at least 16 m2 is needed. A typical installation in Sweden has a collector surface of about 10 m2 and a hot water accumulator of 0,75 m3. Active solar heating systems can be used also in combination with district heating systems. There are two major large scale solar heating applications; systems with short-term storage designed to cover 10-20 % of the annual requirements, i.e. mainly pre-heating (40-50 %) of domestic hot water, and systems with long-term storage (seasonal) capable of covering 50-80 % of the annual requirements, for space heating and domestic hot water heating in residential buildings. In both cases the common storage media is water. The design of the solar heating systems is basically similar in the two applications except for the storage itself. The following rules of thumb can be used in a feasibility study to get an idea about the required sizes. They are valid for a system with typical flat plate collectors in an average European climate (Copenhagen to Milano). Large-scale solar heating plants with short-term heat stores should preferably not be designed to meet more than the summer load and require 0.03-0.05 m² collector area per m² heated floor area(or ~0.3-0.5 m² collector area per annual MWh total load) and water storage volumes of the order of 50 l/m² of collector area. Plants with seasonal heat stores require 0.20-0.30 m² collector area per m² heated floor area (or ~2-3 m² collector area per annual MWh total load) and about 2 m³ of storage (water equivalents) per m² of collector area in order to cover 50-80 % of the total load in new buildings. The largest installations for solar heat input to district heating systems in Sweden are listed in table 7. Table 7. Largest ins allations for solar heat to district heating in Sweden t Location Installed
year Collector area m2 Storage volume m3 Storage type
Kungälv 2000 10000 1000 Day storage Nykvarn 1985 7500 1500 Day storage Falkenberg 1989 5500 1100 Day storage Lyckebo 1983 4320 100000 Season storage Fränsta 1999 1650 100 Day storage Bo 01 Malmö 2001 1400 no storage Säter 1992 1250 no storage
4.3.2 Economy The investment required for single family house systems for hot water heating only is 13000 – 20000 SEK. A typical larger system that contributes also to comfort heating may cost 40000 – 50000 SEK. For large scale installations the investment has been about 2000 SEK/m2 collector area for recent installations. The cost for the heat can be estimated to something between 500 and 1000 SEK/MWh(heat).
15

4.3.3 Environmental considerations There are no direct environmental impacts of passive solar heating systems or active systems with the collectors mounted on the roof of the building. Active systems placed beside the building occupy some land area, rughly the same as the collector area.
4.4 Photovoltaic electricity generation
4.4.1 Technological state of the art Photovoltaic electricity generation uses the energy of light radiation to move electrons between two layers of semi-conductors. The principle is illustrated in figure 13. The photovoltaic cell consists of two layers of semi-conductors: n-layer Si doped with phosphor P (excess electrons) p-layer Si doped with boron B (excess electron gaps) Each layer is connected to a conductor. Light energy (photones) with energy above a threshold value generates electron-hole pairs. Electrones diffuse from n-region to p-region and holes diffuse in the other direction. This results in a potential difference and if the conductors of each side are connected, an electrical current can be maintained. The current is conducted through “fingers” to a bus bar. The open circuit voltage is about 0,6 V
Figure 13. Principle of a photo-voltaic cell A complete system for electricity supply for lighting of an isolated house is shown in figure 14. An electric accumulator is needed for storage of the electric energy from day to night and a charge control unit is needed in order to avoid overcharging of the accumulator. Such a system will provide DC-current only and cannot be used for large power demands such as hot plates and electric irons. Complete kits are available on commercial conditions in most countries. The kits are used for lighting of buildings located away from the electric grid. In industrialised
16

countries this could be vacation houses. In developing countries, this type of solar home systems are found among the most affluent in villages or towns that are not supplied from the national electric grid. Larger systems of the same type are used in schools and dispensaries. Similar systems are used for about 100 light houses in the Swedish archipelago and 50 emergency communication systems in the mountain areas. An inverter will be needed if AC-current shall be produced with photo-voltaic cells. This is necessary if the solar system shall supply electricity to an AC-grid. A few such systems have been installed in Sweden, for instance a 60 kW system at IKEA in Älmhult and a 12 kW system in an apartment building in Kristianstad. A few large systems have been constructed in Germany, Switzerland , Netherlands, Italy and USA. Data for the installation in Springerville, eastern Arizona are given in table 8. Table 8. Data for grid connected PV-plant in Springerville, Arizona Annual solar insolation, kWh/m2 > 2100 DC rating, kW 3780 AC rating, kW 2824 Number of solar modules 32 280 Area occupied by solar field, ha 15,2 Expected net generation in 2004, MWh 6540 There are plans to expand the plant to generate 15000 MWh in 2012 A picture of the solar field is shown in figure 14. Figure 14. The grid connected 2,8 MW PV-plant I Springerville, Arizona
17

4.4.2 Economy A small solar home kit can be bought for between 8000 and 15000 SEK. The resulting energy cost will be of the order of 10 000 - 15 000 SEK/MWh. About 30% of this will be for replacement of the electric accumulator every 3 – 5 years. The system would be un-affordable if not used together with tube lights that give high light output with comparatively low input of electric energy. The generation cost for the large installations with an investment in the range 4000 USD/kWpeak and an annual generation of 2 MWh/kWpeak will be about 140 USD/MWh or about 1200 SEK/MWh.
4.4.3 Environmental considerations Photo-voltaic electricity generation as such does not lead to any environmental impacts in addition to the land use associated with solar panels that are placed on other places than roofs or fronts of buildings. Failure to re-circulate the lead in electric accumulators may be a problem in particular in developing countries where transport is difficult and where there are no systems for collection of old used accumulators.
4.5 Solar thermal electricity generation
4.5.1 Technological state of the art It is also possible to use the solar radiation as a heat source for a steam power plant. Various concepts have been studied and tried. Today the development appears to follow two main approaches schematically illustrated in figures 15 and 16. The "farm-system" shown in figure 15 uses distributed solar collectors which also include the heating of the process medium. . At least seven installations of the farm-type at power outputs up to 30 MW have been built in California. The steam pressure is 100 bar and the superheated steam temperature 371 oC.
Figure 15. Solar thermal power plant with farm system
18
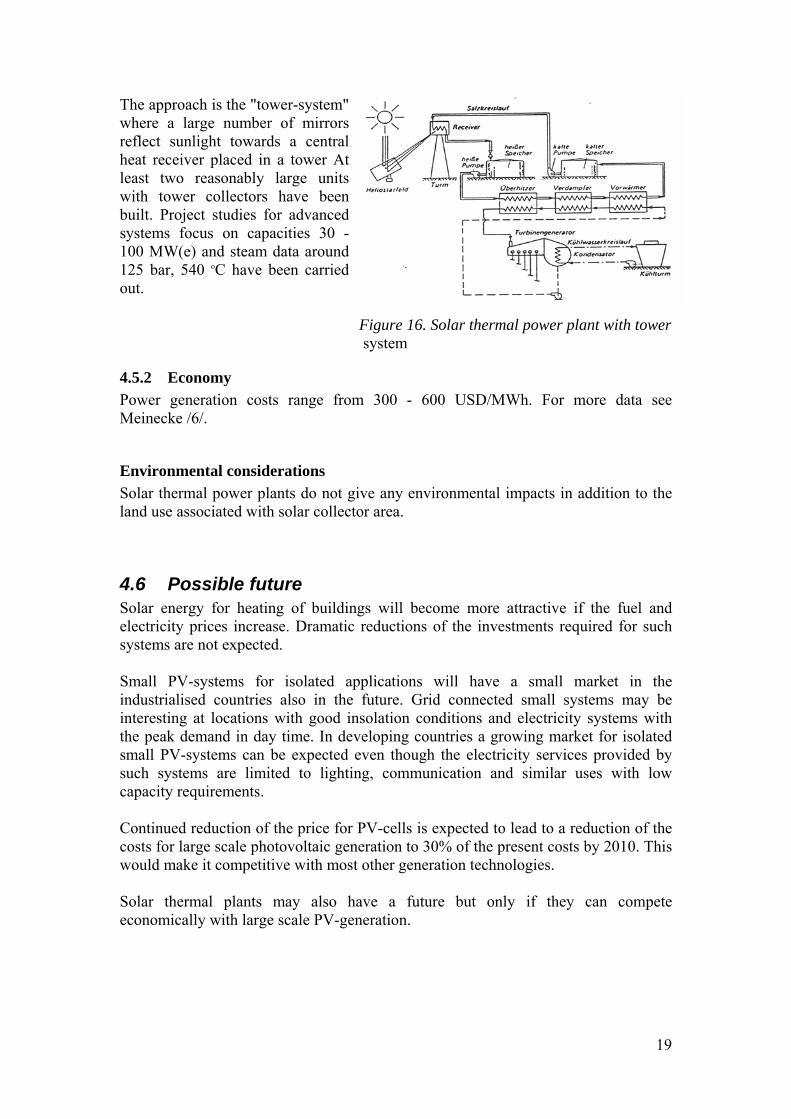
The approach is the "tower-system" where a large number of mirrors reflect sunlight towards a central heat receiver placed in a tower At least two reasonably large units with tower collectors have been built. Project studies for advanced systems focus on capacities 30 - 100 MW(e) and steam data around 125 bar, 540 oC have been carried out.
Figure 16. Solar thermal power plant with tower system
4.5.2 Economy Power generation costs range from 300 - 600 USD/MWh. For more data see Meinecke /6/.
Environmental considerations Solar thermal power plants do not give any environmental impacts in addition to the land use associated with solar collector area.
4.6 Possible future Solar energy for heating of buildings will become more attractive if the fuel and electricity prices increase. Dramatic reductions of the investments required for such systems are not expected. Small PV-systems for isolated applications will have a small market in the industrialised countries also in the future. Grid connected small systems may be interesting at locations with good insolation conditions and electricity systems with the peak demand in day time. In developing countries a growing market for isolated small PV-systems can be expected even though the electricity services provided by such systems are limited to lighting, communication and similar uses with low capacity requirements. Continued reduction of the price for PV-cells is expected to lead to a reduction of the costs for large scale photovoltaic generation to 30% of the present costs by 2010. This would make it competitive with most other generation technologies. Solar thermal plants may also have a future but only if they can compete economically with large scale PV-generation.
19

5. BIOMASS ENERGY
5.1 Basic principles and features Biomass fuels are produced from CO2 and H2O by means of solar energy (photosynthesis). The approximate chemical formula of biomass in plants is C10H14O6. Sustainable use of biomass fuels does not contribute to increasing CO2-content in the atmosphere. The photo-syntesis reaction can be written: 10 CO2 + 7 H2O + light energy → C10H14O6 + 10,5 O2 Combustion of the biomass gives the reaction: C10H14O6 + 10,5 O2 → 10 CO2 + 7 H2O + thermal energy The amount of CO2 released during complete combustion is exactly the same as that consumed when the plant or tree was growing. Biomass fuels can be divided into different categories with respect to the source of the fuel. The most important types are: − Forest fuels − Agricultural residue (straw, maize cobs, nut shells) − Agricultural products ( products grown for use as fuel) − Industrial residue (sawdust, black liquour, bagasse) − Municipal waste − Animal and human waste Biomass fuels can be used directly for large scale heat (and electricity) generation or be processed/converted into more easily used forms: − Dry homogeneous solids (pellets, briquettes, powder) for small scale heat
generation − Dry smoke-less solid fuel (charcoal) used for cooking in developing countries − Combustible gas (CH4, “gengas”) for electricity generation, transport fuel or well
controlled combustion − Liquid fuel (ethanol, methanol, bio-oil, synthetic diesel) for use as transport fuel Figure 17 illustrates the different conversion routes in a schematic way. Commercially proven conversion paths are indicated by solid lines. Conversion paths that require further research and development are indicated by dotted lines. The different conversion processes will be discussed below.
20

Figure 17. Conversion paths for biomass fuels
5.2 Sustainable potential As shown by figure 1 and table 2, the energy conversion in photo-synthesis uses about 400 PWh annually of the solar energy. The fraction of this that can be sustainably utilised on a global level is not known with great precision. The results of one attempt to estimate this8 is shown in table 9. According to this estimate, about 14% of the biomass produced by solar radiation could be made available for energy purposes on a sustainable basis. The largest potential is in residues and specially grown energy crops.
8 Larsson E D and Williams R H, UNDP Energy and Atmosphere Programme
21

Table 9. Estimated sustainable annual production of biomass fuels, PWh
2025 2050 Region forests residues crops total forests residues crops total
Africa 0,67 1,89 5,26 7,82 0,67 2,61 8,84 12,12 Latin America 0,44 3,03 8,97 12,45 0,44 3,78 13,78 17,99 S&E Asia 0,87 3,78 - 4,65 0,87 5,67 - 6,54 Central Asia 0,34 1,07 1,39 2,80 0,34 1,16 4,16 5,66 Japan - 0,25 - 0,25 - 0,26 - 0,26 Australia/N.Z. 0,005 0,32 - 0,32 0,005 0,39 - 0,39 USA 0,17 1,63 2,67 4,47 0,17 1,58 2,67 4,41 Canada 0,01 0,40 0,33 0,74 0,01 0,39 0,33 0,74 OECD Europe 0,09 1,35 2,50 3,94 0,09 1,35 2,50 3,94 E Europe 0,16 1,47 1,11 2,74 0,16 1,58 3,33 5,07 Middle East 0,005 0,05 - 0,05 0,005 0,06 - 0,06 Total 2,76 15,23 22,23 40,22 2,76 18,82 35,61 57,19 The present use of biomass fuels in Sweden and the estimated sustainable potential is shown in table 10. Table 10. Biomass energy use 2001 in Sweden and estimated sustainable potential Type of fuel Use 2001
TWh Application Estimated sustainable
potential TWh9
Forest fuels 40 Industry 16 TWh District heating10 13 TWh Single houses 11 TWh
Pellets, briquettes and powder
5 District heating9 4 TWh Single houses 1 TWh
125 - 130
Black liquor 35 Industry 34 District heating9 1 TWh
35
Municipal waste 6,5 District heating9 6,5 TWh 15 Peat11 3,5 District heating9 3,5 TWh 15 - 25 Energy crops12 0,2 District heating9 0,2 TWh 40 -55 Import 7 District heating9 7 TWh Total 97 230 - 260 It appears that a doubling of the biomass energy use in Sweden is possible also if peat is excluded.
5.3 Production and collection of solid biomass fuels
5.3.1 Technological state of the art Collection and use of industrial process residue like sawdust and black liquor has been practised since the introduction of the forest industry.
9 Bioenergikommissionen SOU 1992:90 10 Includes co-generation of heat and electricity 11 Peat is considered as renewable in Sweden but is not according to the European Commission 12 Salix and energy grass (Swedish Rörflen)
22
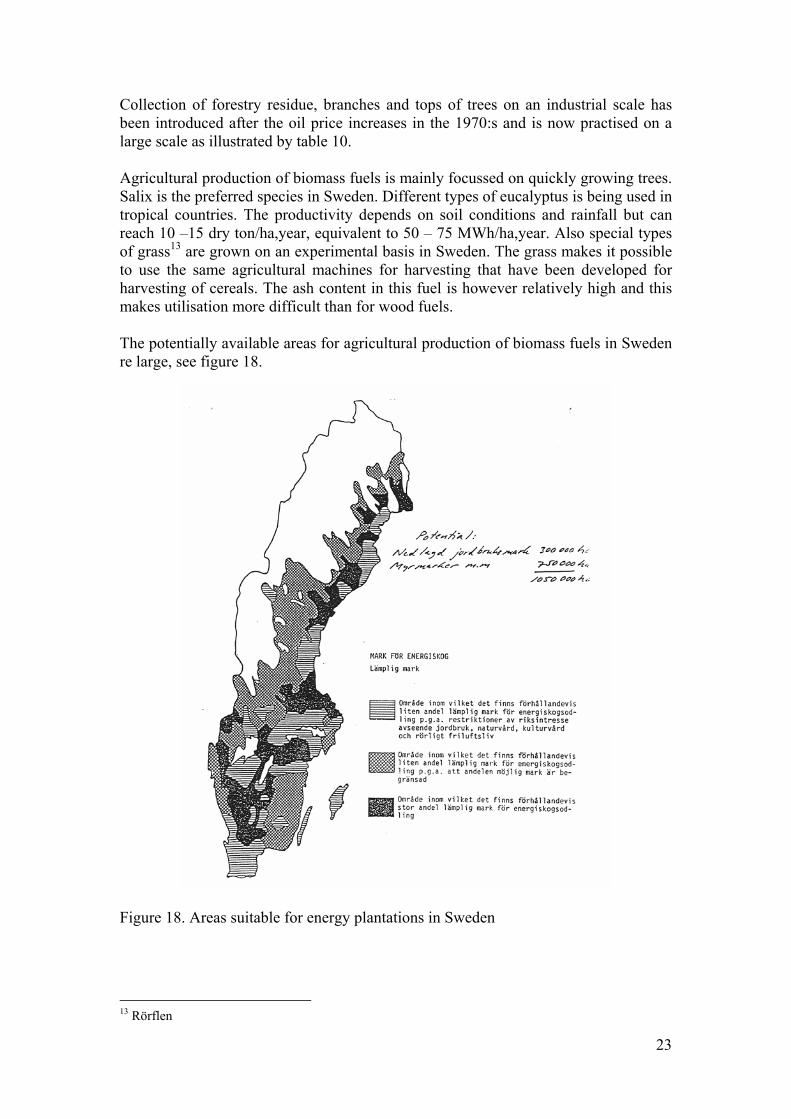
Collection of forestry residue, branches and tops of trees on an industrial scale has been introduced after the oil price increases in the 1970:s and is now practised on a large scale as illustrated by table 10. Agricultural production of biomass fuels is mainly focussed on quickly growing trees. Salix is the preferred species in Sweden. Different types of eucalyptus is being used in tropical countries. The productivity depends on soil conditions and rainfall but can reach 10 –15 dry ton/ha,year, equivalent to 50 – 75 MWh/ha,year. Also special types of grass13 are grown on an experimental basis in Sweden. The grass makes it possible to use the same agricultural machines for harvesting that have been developed for harvesting of cereals. The ash content in this fuel is however relatively high and this makes utilisation more difficult than for wood fuels. The potentially available areas for agricultural production of biomass fuels in Sweden re large, see figure 18.
Figure 18. Areas suitable for energy plantations in Sweden
13 Rörflen
23

5.3.2 Economy The cost for recovering of forest fuel and simple processing is in the range 90 – 115 SEK/MWh(fuel). Agricultural production of biomass fuel is somewhat more expensive. The cost is in the range 120 – 130 SEK/MWh(fuel)
5.3.3 Environmental considerations Collection of forestry residue can lead to depletion of essential elements like phosphor and potassium in the soil. Large scale and sustained utilisation of forest fuels may therefore require fertilising of the forests. Re-circulation of ashes from combustion is one approach that is being studied. Conversion of farm land to energy plantations with Salix will lead to significant changes of the landscape.
5.4 Combustion of solid biomass fuels
5.4.1 Technological state of the art Combustion of wood fuels in small scale for heating of single family houses is well established. Until recently, the combustion in small boilers was controlled by throttling of the combustion air. This results in large emissions of products of incomplete combustion. Modern installations therefore include an accumulator for hot water. The boiler is operated at full capacity, with good combustion conditions and charges the accumulator with hot water. The stored hot water is then used for heating of the house at the rate required for maintaining the desired indoor temperature and generation of hot tap water. Substantial reductions of the emissions of harmful VOC:s have been achieved by this approach, see lecture notes on Energy and Environment. Combustion of wood fuels on large scale for process heat generation in industry, for generation of hot water to district heating systems or for co-generation of electricity and heat is also commercially well established. There are at least 80 district heating plants in Sweden that use biomass fuels. Ten of these co-generate electricity and heat, see map figure 19. Figure 20 shows a sketch of a district heating boiler plant using a boiler with inclined grate.
5.4.2 Economy The investment required for large biomass boiler plants is two to three times that for an oil fired plant with the same capacity. The overall economy is nevertheless favourable for biomass combustion in Sweden because of the higher price that must be paid per fuel energy unit for the oil, a consequence of the Swedish tax system. This issue will be discussed in a subsequent lecture.
24
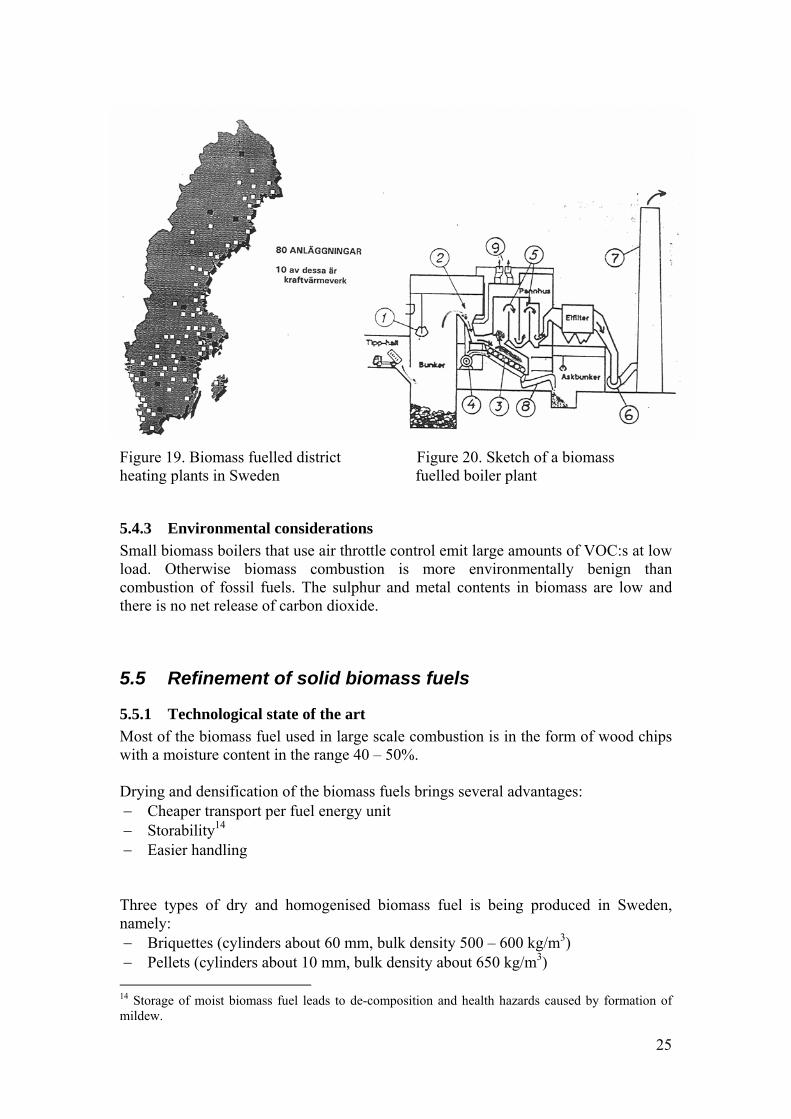
Figure 19. Biomass fuelled district Figure 20. Sketch of a biomass heating plants in Sweden fuelled boiler plant
5.4.3 Environmental considerations Small biomass boilers that use air throttle control emit large amounts of VOC:s at low load. Otherwise biomass combustion is more environmentally benign than combustion of fossil fuels. The sulphur and metal contents in biomass are low and there is no net release of carbon dioxide.
5.5 Refinement of solid biomass fuels
5.5.1 Technological state of the art Most of the biomass fuel used in large scale combustion is in the form of wood chips with a moisture content in the range 40 – 50%. Drying and densification of the biomass fuels brings several advantages: − Cheaper transport per fuel energy unit − Storability14 − Easier handling Three types of dry and homogenised biomass fuel is being produced in Sweden, namely: − Briquettes (cylinders about 60 mm, bulk density 500 – 600 kg/m3) − Pellets (cylinders about 10 mm, bulk density about 650 kg/m3) 14 Storage of moist biomass fuel leads to de-composition and health hazards caused by formation of mildew.
25

− Powder (size below 1 mm, bulk density about 250 kg/m3) There are at least 20 production facilities in Sweden. The raw material used is sawdust. Figure 21 illustrates the process for production of briquettes and pellets. Figure 21. Densification of biomass fuels
5.5.2 Economy Drying, grinding and densification costs about 50 -70 SEK/MWh(fuel)
5.5.3 Environmental considerations There are no significant environmental impacts associated with production of dry, homogenised biofuels.
5.6 Gasification of solid biomass fuels
5.6.1 Technological state of the art Solid biomass fuels can be burnt in boilers but cannot be used as fuels for reciprocating internal combustion engines or gas turbines. One possibility to utilise biomass fuels in such applications is to convert the solid fuel to a combustible gas. A gaseous fuel can be an advantage also when the application is heat generation in a boiler, because combustion of a gas is easier to control than combustion of a solid fuel. At least three approaches for conversion of solid biomass to a combustible gas are being used: − Thermo-chemical conversion with air(gives a mixture of CO, H2, CH4; CO2, H2O
and N2) − Thermo-chemical conversion with oxygen (gives a mixture of CO, H2, CH4; CO2
and H2O)
26

− Anaerobic digestion (gives a mixture of mainly CH4 and CO2) Thermo-chemical conversion with air is illustrated in figure 22. This is the “gengas” process used extensively in Sweden during the second World War for substitution of gasoline as engine fuel. This process gained considerable interest in developing countries immediately after the oil price increases in the 1970:s. The interest declined when oil prices fell again, but the process is still being considered as an interesting possibility for reduction of the dependence on imported oil. The applications would be small village power plants with capacities in the range 50 - 150 kW. Figure 22. System for small scale gasification of biomass for operation of an engine
Figure 23 shows a process scheme for a recent application of air gasification of biomass. This is a pilot plant for co-generation of electricity and heat with acombined gas turbine and steam turbine process. The biomass is gasified in a pressurised fluidised bed. The hot pressurised gas is cleaned from dust and vapourised salts (in particular potassium compounds) and is used as fuel for the gas turbine. The hot exhaust gases from the gas turbine are used for generation of steam to a steam turbine. A pilot plant of this type with an electric power output of 6 MW has been built in Värnamo and was successfully operated before it was closed down for economic reasons.
27

Figure 23. Combined cycle power plant with pressurised circulating fluidised bed gasifier Thermo-chemical conversion with pure oxygen gives a mixture of CO, H2, CH4; CO2 that can be used for conversion to a synthesis gas that may be used for instance for production of methanol, see section 5.7. Anaerobic digestion is particularly suitable for utilisation of very wet biomass. Figure 24 shows an example of a biogas digester used in developing countries. The product gas is a mixture of methane with carbon dioxide and some nitrogen. The same process is being used in Sweden for treatment of municipal waste water in some communities.
Figure 24. Digester of Chinese type for biogas production
28

Also solid municipal waste can be used as a feedstock for anaerobic fermentation. There are more than 70 waste deposits in Sweden that recover combustible gas from landfills. The process is illustrated in figure 25. The gas, consisting mainly of methane is used for combustion in a district heating boiler, for co-generation of electricity and heat using internal combustion engines or as transport fuel for buses.
5.6.2 Economy The investment required for gasification and gas cleaning equipment used for operation of an engine or a gas turbine will be in the range of 1500 – 3000 SEK/kW(fuel).
5.6.3 Environmental considerations Gasification of the biomass fuel before combustion will normally lead to less emissions to the environment because of better possibilities to control combustion. The high content of CO in “gengas” leads to safety problems. Carbon monoxide is very poisonous.
5.7 Production of liquid biomass fuels
5.7.1 Technological state of the art For substitution of oil fuels in the transport sector, a liquid biomass fuel would be the most convenient. Use of a gasifier for solid fuel that is carried on the vehicle is certainly a possibility, but the operation is inconvenient and there are large risks associated with the use of a very poisonous fuel gas, containing about 20% CO. Figure 26 illustrates different routes for production of a liquid fuel from solid biomass. Ethanol can be produced relatively simply by fermentation of sugar rich
29

crops. Starch and cellulose must be converted to fermentable sugars before fermentation. The emphasis in the Swedish research today is on use of softwood as feedstock. The conversion effciency to ethanol is then about 20%. Cellulosic material can also be used for production of methanol. This requires gasification of the biomass with oxygen followed by a synthesis step. The conversion efficiency from wood to methanol will be about 55%. Another approach for conversion of solid biomass to a liquid fuel is extremely rapid heating to a temperature of about 700oC. This will lead to a liquid, similar to tar that can be used as a boiler fuel and might be possible to convert to synthetic diesel oil. There has been a lot of research on this but so far without much success. Oil rich crops may be used to produce a diesel oil substitute for instance RME.
Figure 26. Routes for production of liquid fuels from biomass Table 11 shows a comparison between the different options from a user perspective.
30

Table 11. Biofuels for the transport sector Fuel Production process
Substitution of gasoline Substitution of diesel fuel
Wood gas Gas generated in gas producer carried on the vehicle Almost no use in Sweden today
100% substitution 2,3 kg dry wood/ltr Poisonous gas Cumbersome More maintenance
90% substitution 2,3 kg dry wood/ltr Poisonous gas Cumbersome More maintenance
Ethanol Produced by fermen-tation of sugars. Wood needs pre-treatment. Swedish production 50 000 m3/y (wheat) 13 000 m3/y (wood) Also import.
5% blend no modifications 85% blend in engines with modified fuel system. Cold start problems at 100%
10% blend successfully tested 100% requires ignition improving additive (PEG) Conversion to SI better option
Methanol Produced from synthesis gas. Large scale required for economy. Not used in Sweden today
Similar as for ethanol 100% requires ignition improving additive (PEG) Conversion to SI better option
RME Produced by reaction between rape seed oil and methanol About 5000 m3 used in Sweden
2-5 % blend in diesel, no problems 100% substitution problems under cold conditions
Synfuels Produced from synthesis gas. Large scale required for economy. No use in Sweden today
100% substitution Similar properties
100% substitution Similar properties
5.7.2 Economy The cost for production of liquid fuel from solid biomass is 350 – 1000 SEK/MWh(fuel). This can be compared to the import cost (without taxes) of oil fuels that are in the range 250 – 350 SEK/MWh(fuel)
5.7.3 Environmental considerations Use of liquid biomass fuel generally leads to less emissions than use of the oil fuels that are substituted.
5.8 Possible future Continued expansion of the use of biomass fuels all over the world is expected. The potential is large and most of the technologies required are commercially available. The main obstacle at present is the higher costs of the biofuels compared to the competing fossil fuels.
31

A rough evaluation of the costs for massive replacement of fossil fuels with biomass fuels is shown below: ARE BIOMASS FUELS AFFORDABLE? Fuel energy costs (without taxes): Transportation fuels: Gasoline and diesel oil 0,25 – 0,3 SEK/kWh Alcohols 0,35 – 1,00 SEK/kWh Replacement of 50 TWh transportation fuels gives additional cost 5*109 – 35*109 SEK 550–3900 SEK/cap, yeara)
Boiler fuels :
Fuel oil 0,1 SEK/kWh Coal 0,05 SEK/kWh Biomass fuels 0,1 – 0,2 SEK/kWh Replacement of 100 TWh boiler fuel gives additional cost about 10*109 SEK about 1100 SEK/cap,yeara)
Additional capital cost for replacement of oil or gas fired boilers ( 2000 SEK/kW) 5*109 SEK/year included.
32

6. GEOTHERMAL ENERGY
6.1 Basic principles and features Geothermal energy can be available as dry steam, boiling water (with steam) as hot water or brine15 or as dry hot rock. When steam can be tapped from the geothermal source, it might be used directly in a steam turbine. The superheating is small and mainly caused by throttling of the steam. In case boiling water or hot water is tapped, the pressure is reduced and steam that can be flashed off is used for power generation. An indirect system where the hot water or brine is used to raise steam in a heat exchanger can also be used. In particular when the water is highly corrosive, this solution can be the only practicable. Table 12 shows engineering data for some of the existing geothermal power plants. Table 12.. Engineering data for some commercial geothermal power plants Larderello Wairakei Geysers Ahuachapan Cerro Prieto Country Italy New Zealand USA El Salvador Mexico Start year 1904 1957 1960 1975 1972 Capacity MW(el) 440 180 908 60 150 Steam temp oC 140 – 190 260 172 - 240 250 167 Steam pressure bar 7 – 40 12 6,5 – 7,5 14,6 5 Type of source dry steam wet steam dry steam dry steam hot water Well depth m < 1000 171-1220 1200-3000 1100-1400 Hot water at lower temperatures may be used for district heating either directly, or if the temperature is below about 70 – 90oC, after increasing the temperature by means of a heat pump. Heat pumps installations that use water at about 20oC collected at a depth of several hundred meters are operated in Lund (47 MW) and Klintehamn (1 MW)
6.2 Sustainable potential On a global level, the sustainable potential for geothermal energy that can be utilised at competitive cost is not large. Geothermal energy can however be very important locally. A good example is Iceland where 50% of the primary energy supply and 87% of the heating of buildings is based on geothermal energy.
6.3 Technological state of the art The technologies needed for exploitation of geothermal resources are commercially available.
15 Brine is a solution of salts in water. The salt concentration in geothermal brines can be quite high, up to 30% by weight.
33

6.4 Economy The economy of exploitation of geothermal resources is strongly site dependant.
6.5 Environmental considerations Steam extracted from geothermal sources may carry sulphur compounds that will be emitted unless pre-cautions are taken to collect them. Geothermal water may carry salts that also must be taken care of .
6.6 Possible future The geothermal resources that remain un-exploited will probably be utilised when this appears as economic. No major break-throughs in technology are expected. 7. AQUATIC ENERGY Aquatic energy i.e. tidal energy and energy in waves, ocean currents, salt gradients and temperature gradients in the oceans is discussed in a supplement to these lecture notes. 8. CONCLUSIONS − Sustainable use of renewable energy will reduce emissions of greenhouse gases − Global sustainable exploitation of renewable energy allows considerable
expansion of the use, but the local variations of the potential are large − Existing technologies allow conversion of renewable energy to satisfy all forms
of end use − Better use of resources and improved convenience makes development of
technologies for efficient and small scale electricity generation and production of liquid engine fuels desirable
− Green house gas emissions are reduced when fossil fuels are replaced by biomass fuels. Other environmental impacts are not worse with biomass fuels, provided the best available technologies are used. Small scale combustion of biomass can however be a serious health problem.
− Renewable energy will often lead to higher cost for energy supply than the fossil fuels
− Fossil fuel substitution by biomass is more expensive if liquid transport fuels are replaced than if boiler fuels are replaced.
− Government interventions (taxes or subsidies) are therefore often required for promotion of renewable energy
− Introduction of new energy sources and technologies may be delayed or prevented by institutional barriers. This applies also for renewable energy. Government interventions can facilitate the transitions, but research support is not sufficient.
34