Potential way gas industry can contribute to the reduction ...

Potential ways the gas industry
can contribute to the reduction of
methane emissions
Report for the Madrid Forum (5 - 6 June 2019)

Potential ways the gas industry can contribute to the reduction of methane emissions Report for the Madrid Forum (5 - 6 June 2019)
2 / 146
CONTRIBUTORS
This report combines information and data on methane emissions provided by representatives
of the entire natural gas value chain, from production to utilisation, including biomethane
plants.
Methane Guiding Principles
ACKNOWLEDGMENTS: Throughout the coordination of this report, GIE and MARCOGAZ would
like to thank all representatives of organisations and companies for their support, engagement
and commitment with the development of this report, in particular to the small team that
coordinated the elaboration of the chapters. We appreciate the involvement and participation
during the workshops, including the representatives of non-EU companies and organisations.
GIE and MARCOGAZ are also grateful to the members of the peer review panel and to the
European Commission representatives, for their guidance and support to improve the content
of the report.
DISCLAIMER: This report has been developed by GIE and MARCOGAZ with contributions from
the industry.

Potential ways the gas industry can contribute to the reduction of methane emissions Report for the Madrid Forum (5 - 6 June 2019)
3 / 146
CONTENTS
1 Summary ............................................................................................................................... 4
Conclusions ...................................................................................................................... 4 Recommendations ........................................................................................................... 6
2 Introduction and scope of the report ................................................................................... 8
3 Overview and main findings ................................................................................................ 10
Current status of CH4 emissions in the gas sector in the EU (Q1) .................................. 11 Existing activities by the gas industry (Q2) .................................................................... 12 Ongoing initiatives and commitments. Identified challenges and future actions (Q3 &
Q4) 18 4 Technical background ......................................................................................................... 22
Current understanding and initiatives ........................................................................... 23 Gas industry potential for further reducing methane emissions ................................... 26 Increase transparency. Improve accuracy of collecting methane emissions data ........ 41 Advance strong performance across the gas value chain .............................................. 64 Ensure continued methane emissions reduction .......................................................... 70 Advocate sound policy and regulations on methane emissions .................................... 82 Annexes .......................................................................................................................... 88
5 Critical review statements ................................................................................................. 132
6 Glossary ............................................................................................................................. 137
7 List of acronyms ................................................................................................................ 139
8 References ......................................................................................................................... 141
Potential ways the gas industry can contribute to the reduction of methane emissions Report for the Madrid Forum (5 - 6 June 2019)
4 / 146
1 SUMMARY
The effort of the European Union (EU) to reduce the greenhouse gas (GHG) impact of its energy system is focused on mitigating carbon dioxide (CO2) emissions. However, regulation (EU) 2018/1999 on the Governance of the EU requires the European Commission (EC) to propose an EU strategic plan for methane, which will become an integral part of an EU long-term climate strategy aiming to achieve the 1.5°C target until 2050.
To this end, the Directorate General for Energy of the EC, at the 31st European Gas Regulatory Forum (Madrid Forum) held in October 2018, invited GIE and MARCOGAZ to investigate the potential ways that the gas industry can contribute to the reduction of methane emissions and to report their findings at the 32nd Madrid Forum in June 2019. Responding to the request, GIE and MARCOGAZ conducted an industry-wide study, with contributions from representatives of the entire gas value chain, from production to utilisation, including biomethane production, and all types of methane emissions.
This report provides an overview of the current status of CH4 emissions in the EU gas sector and the actions undertaken by the gas industry until now. The report contains also information on ongoing initiatives and a number of proposed commitments for future actions for the industry.
The gas sector is committed to remain the backbone of the low carbon energy system through environmental leadership. Increased knowledge, technology developments and a drive for continuous improvement will lead to further emission reductions in the gas sector as well as other economic segments such as agriculture, waste and industrial processes. Over two million kilometres of existing gas infrastructure will continue to provide competitive energy to EU industries and households.
Conclusions
Methane emissions management and reduction is a top priority for the European gas industry. Preventing and mitigating methane emissions makes good commercial sense and is a safety requirement. Moreover, the industry considers minimisation of methane emissions as an opportunity to actively contribute to short-term mitigation of climate change, to accelerate environmental commitments and further enhance the environmental value of natural gas.
The main conclusions from this report are:
Methane emissions occasioned by the EU gas sector operations1 account for a 0.6 % [1] of the total EU GHG emissions. Nonetheless, the gas industry is well aware of the importance of addressing methane emissions in order to ensure that gas and the gas infrastructure remains a significant component of the EU energy mix in the long-term.
The gas industry has made good progress related to the identification of all significant sources2 of methane emissions in the different segments of the gas value chain, from production to utilisation.
Quantification of methane emission is a complex task. Complementary approaches to quantify methane emissions through a combination of measurement, calculations and modelling to fit each situation have been developed. Two quantification approaches “bottom-up” and “top-down” are available and currently in use, showing significant gaps in macro figures. The EU gas industry mainly uses the so-called “bottom-up”
1 Data on utilisation is not available. 2 Detailed information in Table 1 (p.13).

Potential ways the gas industry can contribute to the reduction of methane emissions Report for the Madrid Forum (5 - 6 June 2019)
5 / 146
approach, based upon an inventory of emission sources to quantify methane emissions.
Considering the available publications and the experience of the EU gas industry, super-emitters3 in the gas sector have not been identified in the EU.
The gas industry has developed reporting methods to increase transparency and comparability associated to the reported data. In addition to the national inventory reports, a number of players report their own company emission inventories, including methane, through the associations’ report and/or via other reporting initiatives (i.e. CDP4).
It is necessary to improve the accuracy of the national inventory reports. Collaboration between national authorities and the gas industry should be enhanced to improve the quality of the data.
Verification and validation of the methane emissions contributes to increase transparency and reduce data uncertainty. A range of reference standards, methodologies and frameworks related to emission control currently exist (e.g. GHG Protocol, EN 15446, ISO 14064, ISO 14001).
Harmonisation of quantification and reporting methodologies (specific for the gas sector, covering all the different types of methane emissions and the entire gas value chain) is very important.
The best performers deploy a systematic approach to identify, detect, quantify, report and verify emissions. It is essential to close the current knowledge gap and it enables prioritisation and efficient allocation of capital and human resources to target and mitigate methane emissions at the lowest abatement cost.
There is a large number of best available techniques (BAT) to reduce methane emissions that the gas industry is already implementing on a voluntary basis.
Although the gas industry is making good progress in quantifying and reducing methane emissions, it is necessary to ensure that this is extended over all parts of the gas chain.
Innovation on technologies and methodologies (such as drones, satellites, etc.) is key to further detect and reduce methane emissions.
Many gas companies have set emission reduction targets for the next years. These targets are an example of the commitments and future efforts of the gas industry to achieve additional methane emissions reductions.
The lack of awareness and knowledge on the methane emissions topic of a part of the industry has been identified. Collaboration initiatives, cooperation among the gas industry players and training programs are important in sharing information, experiences and data.
Any future EU or national policy aimed at reducing methane emissions should be based upon source level quantification, transparent reporting and the stimulation of feasible reduction measures.
3 See definition in chapter 6 - Glossary (p.137). 4 Carbon Disclosure Project.

Potential ways the gas industry can contribute to the reduction of methane emissions Report for the Madrid Forum (5 - 6 June 2019)
6 / 146
The European gas industry supports development of efficient policy and regulatory frameworks that incentivise early action, drive performance improvements, facilitate proper enforcement, and stimulate innovation and the implementation of new technologies/practices, such as digitalisation.
Recommendations
These recommendations have been defined based on the identified list of challenges and gaps to reduce methane emissions along the EU gas value chain (see Table 3, p.19).
The main challenges are related to further harmonisation on methane emissions quantification and reporting. Dissemination of existing information, sharing data and knowledge are essential to facilitate the process of improving the data and accuracy and to understand the scale of the issue. Further awareness, transparency and incentives could motivate the setting of targets which will have an immediate impact on the quality of the reporting and on the reduction of the methane emissions.
Methane emissions management across the gas value chain should enable the role of natural gas in the future energy mix by (i) helping governments achieve their climate goals, (ii) instilling stakeholder confidence with respect to gas’ environmental value, (iii) providing long-term predictability that allow industrial planning and investment.
1) Ensure accuracy and harmonisation
The gas industry shall propose a set of harmonised definitions and standards for reporting methane emissions, as well as ensuring that the data is comparable for the different parts of the gas value chain. In this context, IPIECA glossary [6] and the template being developed by the Methane Guiding Principles and the Oil & Gas Climate Initiative could be used.
The gas industry shall contribute to the identification of reliable methodologies to quantify emissions for each part of the value chain.
The gas industry will also deploy good practices and best available techniques to reduce methane emissions. A number of guidance documents are already in place or under development, e.g. UNECE and Global Methane Initiative Best Practices in measuring, reporting and verification (MRV) of methane emissions along the gas value chain, Oil and Gas Methane Partnership MRV, the best available techniques guidance document on upstream hydrocarbon exploration and production.
It is necessary to ensure consistency and avoid overlapping legislation. There are already regulations in place that affect methane emissions, such as the Fuel Quality Directive, the Efforts Sharing Regulation, and the national legislation in some Member States.
Methane emissions shall be verified and validated in accordance with reference standards.
In order to improve national reporting, it is recommended that the EC carries out the detailed analysis of existing reporting systems across Member States and assess possibilities to align the reporting guidelines. National authorities should collaborate with the gas industry and incorporate its data while developing the national inventories.
2) Cost-effective and flexible policy development

Potential ways the gas industry can contribute to the reduction of methane emissions Report for the Madrid Forum (5 - 6 June 2019)
7 / 146
Industry should be engaged early and often in any new policy development to ensure that proposed measures are workable and effective.
Policies should be economically and administratively efficient – balancing regulation with market-based mechanisms. Cost-effectiveness tests should be applied to all proposed measures, ensuring that regulations have a net benefit.
Policies should encourage the industry to maximise the value of reductions, by allowing enough flexibility to identify opportunities for investment to achieve the highest reductions at the lowest cost.
3) Continuous improvement and stimulate innovation
To support and encourage innovation, development and implementation of new technologies and practices that prevent, monitor and mitigate emissions. The gas industry welcomes new tools, such as satellite measurements, digitalisation, etc. supporting quantification improvements.
Gas industry should exchange views and information on good practices, best available techniques and innovative technologies aimed at the reduction of methane emissions.
Policies should incentivise the early and continuous actions, while taking into account learning from previous efforts of the gas industry.
Co-fund with the industry R&D projects (e.g. public-private partnerships), particularly high risk / high reward through a dedicated technology fund.
The funds for the management of methane emissions can leverage from the existing mechanisms such as Horizon Europe or the InvestEU Programme.
4) Take a balanced and holistic approach, addressing all contributing sources of methane emissions across the economy.
Methane emissions associated to other primary energies like oil and coal should not be allocated to the gas value chain, unless this gas is commercialised.
Methane emission prevention and reduction measures, where economically viable, should cover both, new and existing facilities, taking into account that operational and economic conditions are different.
A fair distribution of the efforts across all industries should be considered.
5) Engage all sectors and non-EU stakeholders
A forum or platform bringing together different EU sector responsible for methane emissions, like agriculture and waste, should be created. Representatives of non-EU countries and companies, having an impact on the European economy should be involved.
Enhance cross sectoral opportunities to reduce total EU methane emissions (i.e. biomethane production).
The implementation of these recommendations should be integrated in a roadmap/action plan.

Potential ways the gas industry can contribute to the reduction of methane emissions Report for the Madrid Forum (5 - 6 June 2019)
8 / 146
2 INTRODUCTION AND SCOPE OF THE REPORT
GIE and MARCOGAZ invited5 the gas industry to participate in this process and have collated the input provided from gas organisations and companies representing the complete gas value chain.
Scope
This report includes consideration of methane emissions across the entire gas value chain, from production to utilisation, including biomethane plants, and all types of methane emissions6.
Figure 1: Gas value Chain
Source - IGU
Structure of report
The report contains two main parts:
Overview and main findings - chapter 3 (p.10 to p.21) - This part is structured taken into account the following four questions posed by the EC as a guidance and baseline of the assessment:
Q1 - What is the current status of CH4 emissions in the gas sector in the EU?
Q2 - What did the gas industry do until now?
Q3 - What are the ongoing initiatives and future commitments of the gas industry to further reduce methane emissions?
Q4 - What are the identified challenges and future actions?
5 See ANNEX I - Terms of Reference (p.88) 6 Methane emissions are categorised in this report as fugitive, venting and incomplete combustion. Table 1 (p. 13) shows the main sources for the different parts of the gas chain.

Potential ways the gas industry can contribute to the reduction of methane emissions Report for the Madrid Forum (5 - 6 June 2019)
9 / 146
Technical background - chapter 4 (p.22 to p.131) – Provides detailed technical information and case studies that support the main findings. This part is structured based on the five methane guiding principles [48].
Critical review
The present report was subject to a critical review by a panel of independent experts. The critical review statements can be found in chapter 5 (p.132). Members of the critical review panel comprise the Florence School of Regulation, the EC Joint Research Centre and the Sustainable Gas Institute (at Imperial College University, London).
Feedback and recommendations from the critical review panel were considered and incorporated in the report when possible. However, due to the short timeframe and in some cases due to the lack of information or data, it was not possible to accommodate some of the proposals. Nevertheless, they will be taken into account as future actions.

Potential ways the gas industry can contribute to the reduction of methane emissions Report for the Madrid Forum (5 - 6 June 2019)
10 / 146
3 OVERVIEW AND MAIN FINDINGS
CO2 is the largest contributor to anthropogenic greenhouse gas (GHG) emissions, followed by CH4
7. About 60% of total methane emissions are estimated to be from anthropogenic sources. [2]
CH4 is a more potent GHG than CO2, but it has a shorter atmospheric lifespan, on average 8-12 years compared to CO2 that persists in the atmosphere for centuries. Consequently, methane emissions have a much stronger climate impact in the short-term, than they do over the long term.
When combusted, natural gas - which comprises mostly methane - generates about half as much CO2 as from coal for the same quantity of energy generated. It is the most heat intensive and highly efficient fuel, particularly when used directly. However, excessive methane emissions along the value chain can reduce the climate benefits of natural gas. As demonstrated in Figure 2, considering the relative GHG intensity of gas and coal over a 100-year timeframe, if the emission intensity of gas is below 5.5 %, then gas has lower lifecycle emissions than coal8 [3, 4].
Figure 2: GHG emission intensity of natural gas compared with coal
Source – IEA [3]
The gas industry has three incentives to avoid methane emissions: first and foremost being the
safety and well-being of personnel and the public; second, the sustainable development of
natural resources and third commercial value.
Although the gas industry has been working for many years to improve transparency and to
reduce methane emissions through mandatory and voluntary programmes, there is still
potential to further reductions of methane emissions by improving reporting and implementing
mitigation measures.
7 Figure 3 shows the percentage of each EU GHG emission. 8 Also, according to the IEA estimate, in power generation, “a combined cycle gas turbine emits 350 grammes of CO2 per kilowatt hour, well under half of what a supercritical coal plant emits for the same amount of electricity.”

Potential ways the gas industry can contribute to the reduction of methane emissions Report for the Madrid Forum (5 - 6 June 2019)
11 / 146
Current status of CH4 emissions in the gas sector in the EU (Q1)
All EU Member States are required to monitor and report their methane emissions under the EU GHG monitoring mechanism, which sets the EU's own internal reporting rules on the basis of internationally agreed obligations (IPCC Guidelines).
The IPCC Guidelines distinguish between three methodological tiers for quantification of
emissions:
Tier 1: It is the simplest approach; it comprises the application of appropriate default
emissions factor to a representative activity factor (usually throughput). Default
emission factors for a set of activity data are listed in the IPCC Guidelines.
Tier 2: Similar to Tier 1 approach. However, instead of default emissions factors,
country-specific emission factors (developed from external studies, analysis
measurement campaigns) are used.
Tier 3: The most detailed approach based on a rigorous bottom-up assessment at the
facility level, involving identification of equipment-specific emission sources, equipment
inventory, measurement of emission rates per equipment type, etc.
Progressing from Tier 1 to Tier 3 represents a reduction in the uncertainty of GHG estimates. However, the ability to use a Tier 3 approach will depend on the availability of detailed production statistics and infrastructure data, which may require investments, and it may not be possible to apply it under all circumstances [102].
The EU GHG inventory (Tier 1) is prepared by the EC, closely assisted by the EEA every year. The EU inventory is a compilation of National Inventory Reports (NIR), based on the emissions reported under the EU GHG monitoring mechanism.
The accuracy of the NIRs have been questioned on several occasions due to, for instance, a lack of coordination between the industry and the authorities to verify reported data. Closing this gap is key to convert NIRs in credible and reliable sources of data.
Nevertheless, at this stage the GHG inventory report is the best available information on the EU level emissions. Based on that, methane emissions (in CO2-eq)9 accounted for 11 % of total EU GHG emissions in 2016. [1]
Figure 3: GHG emissions in 2016 for EU-28 and Iceland
Source: Elaborated by the authors based on EEA report [1]
9 The GWP100 used is 25.
CO2
81%
F-Gases3%
N2O5%
CH4
11%
CH4
gas sector

Potential ways the gas industry can contribute to the reduction of methane emissions Report for the Madrid Forum (5 - 6 June 2019)
12 / 146
Methane emissions from oil and natural gas, [1] including all emissions from exploration10,
production, processing, transport, and handling of oil and natural gas (excluding utilisation),
accounted for 1.3 % of the total GHG emissions in 2016. In the preceding period 1990-2016 the
EEA reported a 38 % decrease of GHG emissions in these sectors, mainly due to the reduction of
methane emissions from natural gas activities. Methane emissions from gas operations
represented 6 % of the total EU methane emissions, equivalent to 0.6 % of the total EU GHG
emissions in 2016 (see Figure 3). In the same period, gas consumption augmented by 25 % (from
360 to 449 bcm) as well as the length of the gas network having been increased. (Additional
information can be found in §4.3.3, p.49).
Next figure shows the CH4 emissions across the EU gas chain.
Figure 4: CH4 emissions from natural gas operations11 across the EU gas chain in 2016
Source: Elaborated by the authors based on EEA report [1]
It is also important to highlight that there is a wide dispersion of methane emission levels along the gas value chain and across regions, and the quality of available data should be improved [5] It is important for the industry to continue to work on improving data and transparency12.
There are numerous regulations in place that cover methane emissions, either indirectly or
directly. These regulations include, but are not limited to: The Fuel Quality Directive, the Efforts
Sharing Regulation, and also the national legislation in some Member States. In executing its
mandate, as stated in the EU Governance Regulation 2018/1999 (strategic plan for methane),
the EC must take these existing measures into account and ensure consistency to avoid
overlapping and duplicating efforts. (Additional information in §4.6, p.82).
Existing activities by the gas industry (Q2)
The industry has been routinely conducting identification, detection, quantification and
mitigation of methane emissions for a long time, as a safety requirement. However, in more
recent past, gas operators have further expanded such activities also for environmental reasons
- specifically in order to reduce the carbon footprint of natural gas.
10 Only emissions within the territory of the EU. 11 Based on the EEA GHG report data [1]. “Other” has not been represented as only Romania and Germany report methane emissions in this category. Emissions from utilization are not represented in this Figure. 12 Examples of ongoing initiatives to address this gap are provided in this report.
TRANSMISSION & STORAGE
(23% EMISSIONS)
PRODUCTION(16% EMISSIONS)
PROCESSING(2% EMISSIONS)
DISTRIBUTION(59% EMISSIONS)

Potential ways the gas industry can contribute to the reduction of methane emissions Report for the Madrid Forum (5 - 6 June 2019)
13 / 146
3.2.1 Identification
In order to effectively manage methane emissions, firstly the gas industry identifies the sources
of methane emissions through the development of detailed mapping. In this report, methane
emissions are categorised in the following types:
• Fugitive emissions result from methane that “leaks” unintentionally from equipment or
components. These emission types are the most challenging to quantify.
• Vented emissions are intentional releases of methane, due to safety considerations,
equipment design, or operational procedures.
• Incomplete combustion emissions are small amounts of un-combusted methane in the
exhaust of natural gas combustion equipment.
The table below illustrates how the gas industry players typically divide emissions by type and
source.
Table 1 – Categories of methane emissions
CATEGORIES OF METHANE EMISSIONS
FUGITIVES VENTING
INCOMPLETE COMBUSTION
MA
IN S
OU
RC
ES
OF
MET
HA
NE
EMIS
SIO
NS
FRO
M T
HE
GA
S
CH
AIN
Production Components (valves,
flanges, connectors, etc.)
Flaring Tank storage; Compressors; Maintenance;
Failure/Emergency; Glycol regeneration;
Produced water handling; Pneumatic controllers
Flaring13; Stationary combustion
devices (e.g. gas turbines, engines, boilers);
Turbo compressors
Liquefaction
Components (valves, flanges, connectors,
etc.) ; Compressor seals
Flaring Tank storage
Vessels and truck loading Maintenance
Failure/Emergency Start-up/shutdown
activities
Flaring; Stationary combustion devices (e.g. engines,
boilers)
LNG carriers Components (valves,
flanges, connectors, etc.)
Tanks; Compressors;
Gas freeing for dry-dock; Start & stops
Engines (e.g. Methane slips)
Biomethane production
Open digestate storage; Separator;
Storage of solid fraction; Biofilter;
Valves
Flaring Closed digestate storage;
Reactor Maintenance
Flaring; CHP
13 Emissions from a flare stack can be categorized differently depending upon the context. I.e. “incomplete combustion” in flares is different than “venting” from flares. In general methane emissions link to flaring are reported under incomplete combustion emissions. In some cases, flaring is reported separately with subcategories. Flaring emissions can be calculated or measured using different technologies.

Potential ways the gas industry can contribute to the reduction of methane emissions Report for the Madrid Forum (5 - 6 June 2019)
14 / 146
CATEGORIES OF METHANE EMISSIONS
FUGITIVES VENTING
INCOMPLETE COMBUSTION
Transmission & storage14
(includes compressor
stations, regulation and measurement stations, pipelines,
underground storage)
Components (valves, flanges, connectors, etc.)
Compressors; Maintenance;
Failure/Emergency; Pneumatic controllers; Devices for on-line gas
quality sampling
Stationary combustion devices (e.g. engines,
boilers) Engines/Turbines for gas
compression Flaring
Regasification Components (valves,
flanges, connectors, etc.)
Flaring Vessels and truck loading;
Vessels unloading; Maintenance;
Failure/Emergency; Pneumatic controllers
Stationary combustion devices (e.g. engines,
boilers); Vaporisers;
Flaring
Distribution Components (valves,
flanges, connectors, etc.); Permeability of materials
Maintenance; Failure/Emergency;
Operational
Stationary combustion devices (e.g. boilers)
Utilisation - Road transport
Devices; Connections
Start & stops Unburnt
Utilisation - Maritime transport
Devices; Connections
Start & stops; Failure
Unburnt
Utilisation - Power
generation
Devices; Connections
Start & stops; Maintenance;
Failure Unburnt
Utilisation - Chemical feedstock
Blending; Connections
-
Incomplete reaction
Utilisation - Industrial
Devices; Connections
Start & stops; Maintenance;
Failure Unburnt
Utilisation- Commercial
Devices; Connections
Start & stops Unburnt
Utilisation - Residential
- Start & stops Unburnt
Source: Elaborated by the authors based on the industry contributions
An additional dimension to the categories listed in this table is the concept of super-emitters –
these are specific points on the system that are responsible for disproportionately large volumes
of gas leakage during long periods of time (see chapter 6, p.137). In contrast to the U.S. [113],
super-emitters in the European gas sector have not been identified.
14 Only above ground installations.

Potential ways the gas industry can contribute to the reduction of methane emissions Report for the Madrid Forum (5 - 6 June 2019)
15 / 146
3.2.2 Detection
As shown in the previous table, equipment, such as valves, pumps, compressor seals, connectors
of various kinds could be a potential source of fugitive emissions.
Due to the unplanned nature of fugitive emissions, the methodologies utilised to identify and
detect these emissions differ from those utilised for venting and incomplete combustion, which
are clearly detected at the facility.
Emissions detection can take several forms. Larger leakages, i.e. those which may represent a
safety risk, are typically detected using stationary leak detectors, pressure monitoring, and in
some cases, personal gas monitors. For smaller leakages/fugitives, additional leak detection
methods and equipment may be required and may include regular inspection rounds where
hand-held detection equipment may be utilised.
Leak Detection and Repair (LDAR) is a detection and management concept, which consist of
monitoring plant elements, scheduling maintenance, repairing and controlling fugitive
emissions. A typical LDAR programme involves the comprehensive scanning of equipment and
components, from which fugitive gas emissions may occur. Individual equipment is scanned, in
order to detect leakages at the component level, using handheld “sniffers”, soap spray, or
increasingly common, Optical Gas Imaging (OGI, i.e. handheld IR cameras)15. (See 4.2.1, p.26).
Some case studies on LDAR programmes are reported in ANNEX V (p. 105). The technologies to
detect and quantify the methane emissions are included in ANNEX VI (p.115).
3.2.3 Quantification
Methane emission quantification is a complicated task. Nevertheless, the gas industry has
developed complementary approaches to quantify methane emissions. (See chapter 4.2.2,
p.28).
Two main quantification approaches, bottom-up and top-down, are currently used, showing
significant gaps between them (see §4.2.2.2, p.29). Several explanations have been given so far:
super-emitters’ impacts (see §4.2.2.3, p.32), temporal variations, uncertainties related to
emission activity allocation.
While top-down quantifications are based on an aggregate (often regional scale) assessment of
an area, such as through flying an aircraft upwind and downwind of a study area, the EU gas
industry uses a “bottom-up” approach to quantify methane emissions. This is because it is a
source-specific best available approach, which allows the quantification of emissions from each
individually identified source. As a basis for successful emission management, it is important
that emissions are quantified at the individual source level, since an understanding of sources-
specific emissions is a prerequisite for evaluating emission reduction opportunities.
To quantify the amount of methane emissions from an installation, they are either:
1) Measured
15 OGI is becoming an increasingly common way to detect fugitive emissions, as it allows the camera operators to not only “see” fugitive emissions, but also to scan multiple components relatively quickly

Potential ways the gas industry can contribute to the reduction of methane emissions Report for the Madrid Forum (5 - 6 June 2019)
16 / 146
Field data are measured via methane detectors (e.g. a flame ionisation detector (FID)),
hi flow sampler or bagging16 methods. Data can also be collected through
instrumentation like online connected flow meters or pressure meters.
2) Calculated
Field data are utilised to directly calculate the emissions of a given source, e.g. in case
of the vent of a pipe section, the level of methane emission can be accurately derived
from the pipe section volume and the pressure condition in that particular pipe section
during that event.
3) Modelled
Emissions are modelled using emission factor (EF) multiplied by activity factor (AF), i.e.
the number of the emitting components or the number of events.
EF describes a typical methane emission from a component or an emission event. EF can
be taken17 from the API Compendium, the IPCC Guidelines, academic publications, field
measurement campaigns, gas industry research and/or the equipment supplier data.
However, the methods to quantify methane emissions have not been implemented
homogeneously yet all over the gas chain (i.e. there is a diversity of practices at distribution and
final utilisation levels).
3.2.4 Reporting
The European gas industry reports methane emissions in a range of scenarios. Specifically,
methane emissions are reported via national inventory reports (to national authorities),
voluntary reporting initiatives (e.g. CDP), partnership and associations (e.g. CCAC OGMP, OGCI,
IOGP, IPIECA, MARCOGAZ), and via companies’ annual sustainability and carbon footprint
reports. The format for the reporting and the methodologies utilised (particularly related to
scope and boundaries) may vary depending upon the type of reporting. (See 4.3, p.41).
Reporting within NIR, which is used for the UNFCCC, is in many cases not transparent, and there
are large differences in methodologies and procedures between countries in the EU28.
The gas industry has developed its own reporting methods to improve the accuracy and
transparency of the data. However, these vary between companies and organisations, and are
difficult to combine.
Regarding biogas/biomethane plants, a European voluntary system for control of methane
emissions will be developed by EBA (see 4.3.5.3, p.60).
For the moment no reporting methodology is available concerning gas utilisation sectors.
Therefore additional work towards harmonisation of methodologies is required, ensuring that
they are specific for the gas sector, and the entire gas chain and all types of emissions are
covered.
16 Bagging refers to the isolation of a specific component or location to determine a fugitive or vented flow rate. 17 The decision on the EF to be used is taken at national level and in some cases at company level.

Potential ways the gas industry can contribute to the reduction of methane emissions Report for the Madrid Forum (5 - 6 June 2019)
17 / 146
3.2.5 Validation/verification of emissions
Methane emissions need to be assessed following general criteria from the most reliable standards, guidelines and frameworks. A range of them exits related to emission control.
An organisation can develop a methane emissions inventory, using the techniques describe in this report and through adopting a framework detailed in one of the standards.
Methane emission inventories can be assessed and verified by an external body to add credibility
to the reporting exercise.
Chapter 4.3.2 (p. 42) provides an overview of standards and methods, which includes agreed
procedures for collating emission data and intensity, whilst ensuring the integrity and
confidence of these data are replicable and verifiable by a third party. Several of these standards
and methods seek to identify all GHGs, not just limited to methane.
Currently a number of gas companies use existing recognised standards and guidelines to assess
and verify the methane emission inventories in order to improve accuracy and reduce
uncertainty in the data.
The most common ones in Europe are GHG Protocol, EN 15446 (to detect and quantify VOCs,
but not all types of methane emissions), ISO 14064 (to verify carbon footprint), the high level
ISO 14001 (environmental certification), ISO 50001 (energy efficiency) and ISAE 3000
(sustainability standards). However, some additional work is needed in order to identify and
quantify all different kind of methane emissions and to report them along the entire gas value
chain.
3.2.6 Mitigation of emissions
Through increased efforts to identify, quantify and report methane emissions, the industry is
continuously improving the management and reduction of methane emissions.
A large number of best available techniques (BAT) exist to reduce methane emissions and the
gas industry implements these on a voluntary basis. The BATs are related to engineering design,
commissioning and operation, including maintenance and repairs, and decommissioning.
Applying the BATs requires a case by case practical, economic, environmental and technical
consideration (see §4.4.1, p.65, and ANNEX XI, p.127).
For instance, an important BAT for reducing fugitive emissions is the mentioned LDAR
programmes.
Recently, the EC published the Best Available Techniques Guidance document on upstream
hydrocarbon exploration and production. [20]
3.2.7 Summary
The gas industry made good progress in identifying significant sources of methane emissions,
across the different segments of the gas value chain (company emission inventories). Despite
methane emissions quantification being a complicated task, the gas industry has developed
complementary approaches for quantification through a combination of measurement,
calculations and modelling to fit each situation. However, these approaches have not been
implemented homogeneously in all parts of the gas chain (e.g. diversity of practices at
distribution and final utilisation sectors).

Potential ways the gas industry can contribute to the reduction of methane emissions Report for the Madrid Forum (5 - 6 June 2019)
18 / 146
The following table summarises a range of activities undertaken by the gas industry to report
and mitigate the different types of methane emissions.
Table 2 – Summary of existing activities made by the gas industry per type of CH4 emission
Production, transmission,
LNG terminals, UGS and
distribution
Type of emission
Fugitive Venting Incomplete combustion
Identification / Detection
LDAR-type programmes
involving use of IR cameras, sniffers, etc.
Equipment/process mapping
Equipment/process mapping
Quantification Measured,
calculated and/or modelled
Measured, calculated
and/or modelled
Calculated and/or modelled
Mitigation LDAR
programmes Implementation of BAT
Reporting
- Sustainability and carbon footprint reports (based on company inventories) - National Inventory Reports (to national authorities) - Partnership and associations methodologies (e.g. CCAC OGMP, OGCI, IOGP, IPIECA, MARCOGAZ) - Reporting initiatives (e.g. CDP, EDF)
Validation / Verification
According to GHG Protocol, EN 15446, ISO 14064, ISO 14001, ISO 50001, ISAE 3000. Verification often done by a third party
Similar activities are being undertaken in the biomethane plants (see §4.2.2.4, p.33).
The decrease of methane emissions in the gas sector [1], for the period 1990 – 2016, can at least
in part be attributed to the efforts of the gas industry to manage methane emissions in recent
years.
Ongoing initiatives and commitments. Identified challenges and
future actions (Q3 & Q4)
The ongoing initiatives undertaken by the gas industry can be divided into three main categories,
focused on: (i) closing the knowledge gap in detection, quantification and mitigation of methane
emissions; (ii) decreasing the uncertainties linked to monitoring, reporting and verification; and
(iii) sharing and implementing best available techniques and practices.
There are several collaborative industry initiatives working to improve understanding the scale
of methane emissions, potential sources and opportunities for reductions. The most well-known
of these include: the American Natural Gas STAR Program, the World Bank Global Gas Flaring

Potential ways the gas industry can contribute to the reduction of methane emissions Report for the Madrid Forum (5 - 6 June 2019)
19 / 146
Reduction Program, the Global Methane Initiative, the Oil & Gas Climate Initiative, the Methane
Guiding Principles Coalition, the Climate and Clean Air Coalition – Oil and Gas Methane
Partnership (see ANNEX II, p.92). In some cases, these initiatives also involve
governments/authorities, NGOs and academia. Gas companies are joining these initiatives on a
voluntary basis and their voluntary nature allows for genuine commitment from a variety of
actors, covering a wider spectrum of the issue.
The following table outlines the identified challenges and gaps, together with the ongoing
initiatives, commitments and future actions to be performed and/or fostered by the gas
industry. The development of a roadmap/action plan by the gas industry is required, including
a monitoring of the gas industries’ actions after the publication of the present report and the
training programmes and workshops.
Table 3 – Identified challenges and gaps vs. actions
Challenges and gaps Actions (timing)
Awareness and knowledge on the methane emissions topic
- Educational toolkit under development by Methane Guiding Principles (by the end of 2019)
- Educational Outreach Programme under development by Methane Guiding Principles (by the end of 2019)
- OGCI outreach to national O&G companies (NOCs) on BAT implementation (ongoing)
- OGCI engagement in downstream activities (ongoing) - Dissemination activities and training programmes for EU
gas industry to share information on the main findings of the (present) GIE and MARCOGAZ report, ensuring involvement of all EU countries and utilisation (end of 2019 / beginning 2020)
- IPIECA Methane mapping tool (2019)
Fragmented initiatives along the gas value chain
- Gas operators seeking guidance to address methane emission reduction and urge the associations to take an active role in the global initiatives (ongoing)
Aggregation of methane emission data along the EU gas value chain
- EU gas associations to work jointly on a proposal, including units (TBD18)
Proper allocation of methane emissions to oil & gas chains
- Oil & gas producers to explore possible methodologies related to the allocation of methane emissions (TBD)
Harmonised definitions along the EU gas value chain
- EU gas associations to collaborate based on the IPIECA Glossary (TBD)
Reporting Harmonised reporting
- Methane common reporting template developed by Methane Guiding Principles (2019-2020)
- European voluntary system for control of methane emissions in the biogas/biomethane plants will be developed by EBA (TBD)
18 TBD – To be defined

Potential ways the gas industry can contribute to the reduction of methane emissions Report for the Madrid Forum (5 - 6 June 2019)
20 / 146
Challenges and gaps Actions (timing)
Improve accuracy and transparency of national inventories
- Coordination between the gas industry and national authorities to improve quality of data (TBD)
- To explore how NIR could be based on Tier 3 approach for the entire gas chain in the future (TBD)
Improvement of harmonised quantification methodologies and gathering measured data
- CCAC Methane Science Studies, in collaboration with UNECE, EDF and OGCI (ongoing)
- MARCOGAZ pre-standard for transmission and distribution related to identification and quantification (2019)
Reconciliation of bottom-up and top-down approaches
- Collaboration between NGOs, industry and academia will lead to further reduction of uncertainty between methodologies (some ongoing CCAC Methane Science Studies, but more work in this area is required) (TBD)
Improvement of companies’ inventory data
- Verification and validation of emissions according to reference standards (TBD)
Knowledge and data on utilisation
- Ongoing projects (2019 & 2020)
Mitigation
Limited financial and economic incentives (in some cases) to put in place mitigation measures
- Gas industry to do cost/benefit analysis - Incentives from Authorities
Establishment of methane emission reduction targets at company level
- Gas companies, who don’t have it yet, to consider the establishment of reduction targets (TBD)
Employees engagement on methane emission reduction
- Once gas companies establish reduction targets, to evaluate the possibility to set up incentives for the employees (TBD)
- Gas companies to establish a methane emissions reduction culture (TBD)
Dissemination of key BATs information
- Gas industry to take part of the outreach programmes and participate in GIE and MARCOGAZ workshops (TBD)
Innovation on technologies
- OGCI Climate Investment fund investment on technologies supporting “Towards zero methane emissions” (TBD)
Missing cross sectoral opportunities and exchange of views (i.e. innovative technologies, BATs) aimed at the reduction of methane emissions
- Creation of an industry/cross-sectoral Forum/Platform bringing together different EU sectors responsible for methane emissions and representatives of non-EU companies/organisations (TBD)
Methane emissions data of natural gas imports
- Enhance the collaboration with non-EU companies (suppliers) (TBD)

Potential ways the gas industry can contribute to the reduction of methane emissions Report for the Madrid Forum (5 - 6 June 2019)
21 / 146
Challenges and gaps Actions (timing)
Potential overlapping with existing EU and national regulation on methane emissions
- Analysis of EU and national regulation, including its impact (gas industry to support this action) (TBD)
In addition, a wide range of best practices and innovative technologies (such as satellites,
drones, etc.) have and are being developed across the gas value chain which is presented in
chapter 4.4 (p.64). These kinds of initiatives clearly showcase the commitment of the industry
to address methane emissions.
In the recent past, many gas companies have set voluntary reduction targets for their overall
GHG emissions (methane emissions are also considered) and in some cases specific on methane
emissions reduction. Table 13 (p.76) shows an overview of company-specific targets and
provides a summary of the information of the future efforts of the gas industry to achieve
additional methane emissions reductions:
The median of the absolute targets which specifically apply for methane emissions
reduction is 5.1 % per year.
The median of the absolute targets which apply for global GHG reduction is 2.3 % per
year.
In addition, in some parts of the value chain a global intensity target has been set. OGCI
companies have already set a voluntary target to reduce the collective average methane
intensity for their aggregated upstream, oil and gas operations. The target is equivalent
to a methane intensity reduction of 2.7 % annually (350,000 tCH4/year).
These values show the commitment of the companies and at the same time can be a reference
for other companies evaluating to set a target for the future. As long as the current situation
and the reduction potential is very different depending on the part of the gas chain and the
company, it is important for each company to evaluate its own abatement potential, and the
projects or BATs that they are planning reduce methane emissions.
In the meantime, setting intermediate targets for the European gas sector is positively perceived
by industry, but the conclusions from previous chapters show that from the methodology point
of view, it might be challenging to develop it. Before that, there is a need for improvement in
terms of standardisation for quantification, reporting and verification. These previous steps are
necessary in order to establish monitoring processes to periodically review and verify the
fulfilment of the pathways and targets.
At this stage, gas companies are encouraged to implement the existing BATs, to continue
innovating and developing new technologies and practices and to establish their own GHG or
methane emissions targets to strive towards net-zero emissions by 2050.

Potential ways the gas industry can contribute to the reduction of methane emissions Report for the Madrid Forum (5 - 6 June 2019)
22 / 146
4 TECHNICAL BACKGROUND
This chapter includes detailed information on the context of this report. The table of contents is
shown below:
Current understanding and initiatives ........................................................................... 23 4.1.1 Introduction to methane emissions: the role of natural gas .............................. 23 4.1.2 The key place of natural gas in the energy mix ................................................... 23 4.1.3 Methane emissions ............................................................................................. 23 4.1.4 Allocation of methane emissions to oil and gas chains ...................................... 25 Gas industry potential for further reducing methane emissions ................................... 26
4.2.1 Detection ............................................................................................................. 26 4.2.2 Quantification ...................................................................................................... 28 Increase transparency. Improve accuracy of collecting methane emissions data ........ 41
4.3.1 Transparency: Recommendations ....................................................................... 41 4.3.2 Standards, methods and frameworks to control emissions ............................... 42 4.3.3 National inventories ............................................................................................ 49 4.3.4 Data on CH4 emissions at corporate level ........................................................... 55 4.3.5 Data on CH4 emissions reported via industry initiatives ..................................... 56 4.3.6 Other reporting activities .................................................................................... 62 Advance strong performance across the gas value chain .............................................. 64
4.4.1 Examples of BAT to reduce methane emissions ................................................. 65 4.4.2 Focus on the innovation and the development of new technologies – Examples provided by the industry ..................................................................................................... 67 Ensure continued methane emissions reduction .......................................................... 70
4.5.1 Existing targets at oil and gas companies and associations ................................ 70 Advocate sound policy and regulations on methane emissions .................................... 82
4.6.1 EU level ................................................................................................................ 82 4.6.2 Member State level ............................................................................................. 83 4.6.3 Maritime transport - IMO targets ....................................................................... 83 4.6.4 Regulation and policies in non-EU countries ...................................................... 84 Annexes .......................................................................................................................... 88
ANNEX I - Terms of Reference ............................................................................................... 88 ANNEX II - Gas industry initiatives .......................................................................................... 92 ANNEX III - Examples of reduction of CH4 emissions following safety rules ......................... 100 ANNEX IV – Illustration of some quantification methods across the gas value chain ........... 102 ANNEX V - Gas operators experience with LDAR (Case studies) .......................................... 105 ANNEX VI – Detection and/or quantification technologies ................................................... 115 ANNEX VII - Examples of involvement of authorities, associations and operators in emission reporting for natural gas ........................................................................................................... 121 ANNEX VIII - Methods for determination of methane emissions of the gas distribution grid 123 ANNEX IX – List of additional Standards ................................................................................ 124 ANNEX X – Case studies on reporting ................................................................................... 125 ANNEX XI – Case studies on BATs .......................................................................................... 127 ANNEX XII – Case studies on innovative technologies ....................................................... 131

Potential ways the gas industry can contribute to the reduction of methane emissions Report for the Madrid Forum (5 - 6 June 2019)
23 / 146
Current understanding and initiatives
4.1.1 Introduction to methane emissions: the role of natural gas
Natural gas is a part of the solution to rapidly address the risks of climate change and other pressing global challenges. This is recognised in the International Energy Agency (IEA) Sustainable Development Scenario, in which natural gas becomes the largest single fossil fuel in the global energy mix, helping to deliver the EU and global goals of climate stabilisation, better air quality and affordable access to energy.
The role of natural gas in the future energy mix is crucial to ensure a lower carbon economy. Natural gas shows environmental and climate benefits in comparison to traditional fuels – even when methane (CH4) emissions are taken into account.
Cross sectoral opportunities should be further explored taking into account their added value, as the gas industry can contribute to the reduction of methane emissions in other sectors (for example recover methane from agricultures, landfills, etc.).
Natural gas has other important environmental benefits; during the combustion of natural gas, the emission of nitrogen oxides (NOX) are very low and it produces close to zero particulate matter (PM2.5) and sulphur dioxide (SO2) emissions [3].
Figure 5: Share of NG in the energy related emissions of air pollutants
Source – IEA [3]
4.1.2 The key place of natural gas in the energy mix
Natural gas supplies 22% of the primary energy [8] used worldwide and makes up nearly a quarter of electricity generation. Natural gas will continue to increase driven by the industry growing needs mainly in Asia and the Middle East.
According to EEA [9] natural gas represents 24% of the primary energy consumption in 2016 for EU28, and since 1990 gas consumption has increased by 30%, replacing mainly coal and oil.
4.1.3 Methane emissions
While CO2 remains the main focus of long-term climate change mitigation, addressing emissions of other greenhouse gases (GHG), such as methane, also deserves attention, in order to analyse

Potential ways the gas industry can contribute to the reduction of methane emissions Report for the Madrid Forum (5 - 6 June 2019)
24 / 146
the complete impact in which human activities affect global climate. Methane is emitted by both natural and man-made sources [2].
Figure 6: Global Methane Budget
Methane is one of the GHGs i.e. carbon dioxide (CO2), methane (CH4), nitrous oxide (N2O),
hydrofluorocarbons (HFCs), perfluorocarbons (PFCs), and sulphur hexafluoride (SF6), and is also
an ozone (O3) precursor. About 60% of total global methane emissions are thought to be from
anthropogenic sources. Emissions from production of fossil fuels, including petroleum, natural
gas, and coal are estimated to account for 32-34% of anthropogenic emissions.
Methane is a more potent GHG than CO2, but it has a shorter atmospheric lifespan, on average 8-12 years, whereas CO2 persists in the atmosphere for many centuries. Consequently, methane emissions have a much larger climate impact in the shorter term than the long term.
When combusted, natural gas - which is mostly methane - generates about half as much CO2 as coal for the same quantity of energy generated. However, excessive methane emissions along the value chain can reduce the climate benefits of natural gas.
Climate metrics are used to convert different GHG emissions into 'CO2 equivalent.' Climate metrics can be expressed in different time horizons, and there is neither a single climate factor, nor a single time horizon that is appropriate for all applications and situations. [10] Over the years, scientists have explored and formulated the advantages and disadvantages of the different metrics.
Global Warming Potential (GWP) 100 is the most well-known metric and is used widely [11] including for national and international emission reporting, such as the United Nations Framework Convention on Climate Change (UNFCCC). [12] Whilst it is accepted that there is no single correct metric, the consistent use of GWP100 at least allows comparisons. As per the Intergovernmental Panel on Climate Change (IPCC) Fifth Assessment Report (AR5), the GWP100 for methane is in the range 28-36 times that of CO2. This is higher than the previous assessment report. Given the range of values used across industry, governments and academia, it is important to be transparent in stipulating the CO2-eq value used when reporting methane emissions.
All EU Member States are required to monitor their methane emissions under the EU's GHG monitoring mechanism, which sets the EU's own internal reporting rules on the basis of internationally agreed obligations. The EU GHG inventory is prepared by the EC, closely assisted

Potential ways the gas industry can contribute to the reduction of methane emissions Report for the Madrid Forum (5 - 6 June 2019)
25 / 146
by the EEA every year. The EU inventory is a compilation of NIR, based on the emissions reported under the EU GHG monitoring mechanism.
The accuracy of the NIR have been questioned several times in past years due to different reasons, for instance lack of coordination between the industry and the authorities to report some verified data. It is key to reduce the uncertainty of the NIR and to convert them in to credible and reliable sources of data.
Nevertheless, the GHG inventory report is the best available information to have an idea on the emissions at EU level. Based on that, methane emissions (in CO2-eq) accounted for 11 % of total EU GHG emissions in 2016. Methane emissions from gas operations represented 6 % of the total methane emissions, equivalent to 0.6 % of the total EU GHG emissions in 2016. (Additional information can be found in chapter 4.3.3, p.49).
On the other hand, it is important to highlight that, according to the literature, there is a wide dispersion of methane emissions along the gas value chain and across regions and then it is key to reduce the uncertainty of the data and to increase the transparency.
Although the gas industry has worked to identify all sources of methane emissions in the different segments of the gas value chain, there is not a clear picture for Europe on the percentage of methane emissions from the different parts of the gas value chain. Therefore, further work is required in this area.
4.1.4 Allocation of methane emissions to oil and gas chains
Natural gas is primarily produced together with oil and condensate. Hence, it is important the
specific allocation of emissions to particular hydrocarbon products (“sellable” natural gas, oil
and natural gas liquids).
The most commonly used allocation methods are based on energy, mass, and economic value.
According to the paper “Allocating methane emissions to natural gas and oil production from
shale formations” [13] published in 2015, the results for the three allocation methods are
similar. However, the mass and energy allocation methods are preferred due to potential price
fluctuations and variability that would affect the economic value approach.
Currently, at EU level there is not a harmonised methane emissions allocation method and, in
some cases, due to different reasons, all emissions are allocated to the “sellable” natural gas.
Therefore, further work is required in this area.

Potential ways the gas industry can contribute to the reduction of methane emissions Report for the Madrid Forum (5 - 6 June 2019)
26 / 146
Gas industry potential for further reducing methane emissions
Detection, quantification and mitigation of methane emissions were done in the past mainly for
safety reasons. However, during the last years gas operators have started to do it for
environmental reasons in order to reduce the carbon footprint of natural gas (See ANNEX III,
p.100).
The implementation of tools to detect, quantify and reduce the methane emissions is done to
enable the sustainable development of the gas industry and not only based on costs and safety
criteria.
The gas industry is implementing best available techniques (see §4.4.1, p.65) to reduce
significantly methane emissions in the different parts of the gas chain. One of the tools is the
Leak Detection and Repair (LDAR) programme, which consists of monitoring plant elements,
scheduling maintenance, repairing and controlling fugitive emissions.
The gas industry has worked to identify all sources of methane emission in the different
segments of the gas value chain. For each emission source, the appropriate methodology can be
selected to accurately quantify methane emissions. This comprehensive approach enables gas
industry players to prioritise and allocate capital and human resources so as to efficiently target
the methane emissions with the lowest abatement costs. By applying a continuous
improvement methodology, the gas industry proactively addresses all methane emissions.
Methods of methane emissions quantification, including direct measurements, have to be
further standardised. At the point where the different emission sources for the different parts
of the value chain are identified, one can take a view on the best method to quantify emission
for that particular source.
The aim is to improve the quality of data and to ensure that industry players have the same
maturity in term of methane emission quantification process.
Two quantification approaches, bottom-up and top-down, are currently used, showing
significant gaps in macro figures, several explanations have been given so far: super-emitters’
impacts, temporal variations, uncertainties related to emission activity allocation. Lowering
uncertainties of both methodologies should allow to explain differences between them.
However, very few European studies are available and the results could differ from the U.S.
studies (mainly based on shale gas production basins). Therefore, further reconciliation studies
are needed.
Appliances such as gas turbines or gas engines have also been considered, showing low emission
intensity figures. Nevertheless, it is important to investigate further the emissions of methane
at the point of end use, and in segments where little or not enough is known.
4.2.1 Detection
Equipment, such as valves, pumps, compressors, connectors of various kinds could be a
potential source of fugitive emissions.
LDAR programmes are implemented in different sectors such as refining and chemical industries
and the natural gas value chain, in order to reduce fugitive emissions to the lowest possible level.

Potential ways the gas industry can contribute to the reduction of methane emissions Report for the Madrid Forum (5 - 6 June 2019)
27 / 146
Some case studies on LDAR are reported in ANNEX V (p.105). Some technologies to detect
methane emissions are included in ANNEX VI (p.115).
With respect to venting and incomplete combustion, these categories are clearly identified and
detected at the facility because:
Vented emissions are related to the volumes of natural gas released to atmosphere
through identified outlets (stacks, ports, etc.).
Incomplete combustion emissions are only related to the exhaust gases from gas
turbines, gas engines and combustion facilities.
There are several options and best practices to reduce these kinds of emission, as reported in chapter 4.4.1 (p.65).
LDAR programmes to reduce fugitive emissions
LDAR regulations were put into place in an effort to reduce fugitive emissions because of the
amount of VOCs (Volatile Organic Compounds - including methane) being emitted by industry.
Gas industry implemented LDAR in order to ensure good performance, to increase the safety
and due to environmental aspects.
A LDAR programme is the system of procedures used to identify and repair leaking components,
in order to minimise methane emissions. It includes normally:
Scheduling or systematic inspections;
Producing and tracking work orders when leaking components are discovered;
Training of personnel, who should be aware of the importance of emissions reduction;
Procedures for identifying leaking equipment, procedures for repairing and keeping track of leaking equipment;
Methods of verification which ensure that the LDAR programme is correctly conducted.
LDAR may relate to individual facilities or a group of them.
A typical LDAR approach consists of 5 phases:
1. Inventory of fugitive emission sources at the facility
Analysis of technical documentation of the facility (P&IDs, process diagrams, parameters, etc.);
Identification of potentially leaking elements at the facility (valves, connectors, open ended lines, flanges, pumps, compressors etc.);
Planning of the field activities (i.e. integrating LDAR process in maintenance activity).
2. Definition of leaks
Determination of a threshold limit value of methane. A leak is detected whenever the measured concentration of methane in surrounding environment exceeds the leak definition. Threshold limit value may be set differently for individual elements.

Potential ways the gas industry can contribute to the reduction of methane emissions Report for the Madrid Forum (5 - 6 June 2019)
28 / 146
3. Measurement programme
On-site monitoring and detection of methane leaks;
Detection of leaks according to leak definition;
Identification of emission sources;
Emission estimation, according to the concentration measured and equation of correlation or emissions measurement if appropriate measurement devices are available;
Classification of the leaks.
4. Maintenance and repair
Immediate repair of leaking elements wherever it is possible;
Development of the maintenance / repair plan;
Cost - effectiveness evaluation;
Prioritisation of the interventions;
Periodic checks.
5. Follow-up and traceability
Data base implementation with a clear identification of the leaking elements, instruments used, the date the leak was detected, the date the leak was repaired, the results of monitoring tests to determine if the repair was successful, and any further actions.
Specific procedures could be implemented to identify the leaking elements and to quantify the
emission.
It is very important to perform LDAR along the entire gas chain, in order to obtain a significant
reduction of methane emissions for the different parts. Additional detailed information on LDAR
strategy per part of the gas chain can be found in ANNEX V (p.105).
In addition, to expand the knowledge about emission locations and repair their sources on
regular basis is also really relevant.
One of the conditions of successful fugitive emission reduction is checking periodically the
effectiveness of repairs and also verifying the proper maintenance of the potential sources.
4.2.2 Quantification
The bottom-up approach
The gas industry uses the so-called “bottom-up” approach to quantify methane emissions. The
bottom-up approach is a source-specific quantification approach: the emissions from each
identified source are individually quantified. Total emissions on a given perimeter are calculated
by adding each type of emission source data. Methane emissions are either:
1) Measured

Potential ways the gas industry can contribute to the reduction of methane emissions Report for the Madrid Forum (5 - 6 June 2019)
29 / 146
Field data are measured via commonly used FID or bagging standardised methodologies.
Data can also be collected through instrumentation like online connected flow meters
or pressure meters.
2) Calculated
Field data are collected to directly calculate the emissions of a given source, e.g. in case
of the vent of a pipe section the level of methane emission can be accurately derived
from the pipe section volume and the pressure condition in that particular pipe section
during that event.
3) Modelled
Emissions are modelled using Emission Factor (EF) multiplied by Activity Factor (AF), i.e.
the number of the emitting components or the number of events.
EF describes a typical methane emission from a component or an emission event. EF can
be taken from the API Compendium, the IPCC Guidelines, academic publications, field
measurement campaigns, gas industry research and/or the equipment supplier data.
As the bottom-up quantification method is source specific, it is key to exhaustively take into
account each source. The use of emission factors is the adequate solution in a significant number
of cases, the accuracy of the emission factors is of a prime importance to ensure the consistency
of the macro figures. As shown in ANNEX IV (p.102), an important number of bottom-up
quantification methodologies are now used across the gas value chain. Some further
standardization works is needed and related studies are now ongoing to make sure that the
suitable quantification methods are used by stakeholders. There are still important gaps to fill
in the utilization part, to which end studies have now been launched.
Top-down versus bottom-up quantification
The bottom-up quantification approach is used by the industry to quantify and report its
emissions. As already stated, bottom-up methods allow to quantify the emissions of specific
sources, and these quantifications are aggregated to establish global figures.
The top-down approach is mostly using different ‘aerial-based’ techniques, e.g. techniques to
measure methane concentration in ambient air and calculate methane flux as a function of
meteorological conditions. Top-down approaches are used to estimate the global figure of a
geographical area; these approaches can provide valuable information in terms of (i) assessing
overall magnitude of emissions in that area (ii) identifying emission hotspots, and (iii)
characterising spatial emission distributions. Top-down approaches applied to oil and gas
emission sources have mainly relied on aircraft measurements, but can also include satellite
data and tower networks and go down to ground based (vehicles), area, facility or site downwind
measurements
One of the key challenges for top-down approaches is attributing methane emissions to fossil
sources and biogenic sources (e.g., agriculture, waste sector). Recent studies have used isotopes
and hydrocarbon ratios (i.e., methane to ethane ratio) to improve the attribution.
Establishing an accurate area-specific background concentration is also required for the top-
down approach.

Potential ways the gas industry can contribute to the reduction of methane emissions Report for the Madrid Forum (5 - 6 June 2019)
30 / 146
Both methodologies have their advantages and drawbacks. As stated in the American National
Academy of Sciences (NAS), consensus report study [14] improving characterisation of
anthropogenic methane emission in the US, “Both top-down and bottom-up measurements
used to estimate emissions can also be spatially and temporally sparse, leading to biases. For
example, when aircraft measurements are used to obtain data, the flights are typically limited
to just a few days, and the measurements are generally done in midday when the atmosphere
is well mixed. These measurements will therefore lead to information about emission sources
that is limited to midday hours, and these emissions may be different than at other times of day,
which limits direct comparisons with methane inventories”.
In June 2018, Science published an EDF-led collaboration with the U.S. academic institutions
synthesising the findings of 16 research studies on methane emissions from the U.S. natural gas
supply chain. The study found the U.S. oil and gas industry emits 13 million metric tons of
methane, which is nearly 60 % more than current official estimates. The authors concluded they
found agreement between methane emission estimates based on top-down approaches and
bottom-up approaches (see Figure 7). Reconciling top-down and bottom-up was accomplished
by more effectively accounting for the influence of large emission sources commonly known as
super-emitters [17].
Figure 7: Comparison of bottom-up estimates of methane emissions from oil and natural gas sources to top-down estimates in nine U.S. O&G production areas
Source - [17]
It has to be noted that the so called “bottom-up” approach primarily used in that study is a site
level downwind method. This is not a pure bottom-up source-specific quantification approach,
as, even if it is implemented at ground level with vehicles-based measurement devices, that
methodology is still based on an inverse dispersion modelling depending on meteorological
factors. It is not always clear if that methodology should be considered as a bottom-up, a top-
down one or something in between. As with the other methodologies can be biased by
temporality (time of day of sampling) factors.
A multi-agency research team led by Colorado State University [15] carried out a series of studies
addressing the various aspects of the methane emission reconciliation problem and aiming to
close the gap with bottom-up based on NIR data. The Basin Reconciliation Study compares
contemporaneous bottom-up to the top-down measurements made in Fayetteville Shale play
in Arkansas. This study [16] describes the details of the bottom-up model, including spatial and
temporal aspects, and the comparison to the top-down measurements taken concurrently. The

Potential ways the gas industry can contribute to the reduction of methane emissions Report for the Madrid Forum (5 - 6 June 2019)
31 / 146
following figure illustrates the hourly variability of methane emission in a basin over 48-hour
window together with two overlapping snapshots of aircraft based top-down measurements.
The study shows the importance of temporal variabilities when comparing top-down
measurements and the bottom-up approaches.
Figure 8: Hourly averaged methane emissions for the study in Fayetteville
Source – [16]
The following figure shows methane emissions from the top-down and the bottom-up model
for two consecutive days for the entire study area, as well as their uncertainties (95% confidence
intervals). The uncertainties appear to be larger for the methodology used in that case for top-
down than for bottom-up.
Figure 9: Methane emissions of the study in Fayetteville
Source - [16]
In Groningen in the Netherlands, a 2018-study [18] presented multi-scale methane emission
measurement campaigns, including ground and airborne-based estimates. As shown in Figure
10 top-down measurements, conducted on the Groningen gas field, give a 20 % (compared with
1.9 % in the NIR) share of fossil methane emissions with an uncertainty of +31/ -20. According
to the study, the large uncertainty in observed emissions attributed to fossil sources is driven by
the variability in ethane/methane ratios measured in aircraft flasks. Indeed, the presence of
ethane is here used to differentiate methane emissions associated to different sectors (fossil
fuels, agriculture, waste management, and natural sources).

Potential ways the gas industry can contribute to the reduction of methane emissions Report for the Madrid Forum (5 - 6 June 2019)
32 / 146
Figure 10: Methane emissions in The Groningen field 2018, Netherlands
Source – [18]
To conclude, the bottom-up approach is source specific, and will be effective only if sources are
exhaustively taken into account in order to avoid biased results in macro figures. Top-down
approach is global, but the right attribution of the emission activity sector origin and the need
to take into account the atmospheric conditions impact, is challenging and can lead to significant
uncertainties.
In both cases, temporality of the emissions has to be carefully considered (i.e. methane
emissions variation in time). However, when considering the strengths and weaknesses of both
methods (source specific vs global), it becomes obvious that they should be used in a
complementary manner, what has only been done if very few studies so far.
In Europe, ongoing studies aiming to further understand methane emission including
reconciliation of top-down and bottom-up methodologies are now launched.
Super-emitters
The definition of super-emitter is included in the glossary (Chapter 6, p.137).
The NAS consensus report [14] states the following when it comes to high emitting sources:
“A variety of terminology has been used to describe the subpopulations that dominate
emissions, including high emitting, super-emitters, and fat tails. The Committee chose to refer
to these subpopulations as “high-emitting sources”. High-emitting sources generally fall into the
following categories (Munnings and Krupnick, 2017):
1. Routine or “chronic” high-emitting sources: These are sources that always emit at higher
rates relative to “peers” in a sample. These may be large facilities (e.g. incomplete emissions
from a large compressor station, or flaring with incomplete combustion from a large petroleum
field) or large emissions caused by poor design or operational practices. These high-emitting
sources do not have temporal difference in their absolute emission or methane intensities.
2. Episodic high-emitting sources: These emission sources are typically large in nature and are
generally intentional releases from known maintenance events at a facility. The operator
typically is aware of the event and plans such maintenance activities during normal working
hours, and some of these emissions (e.g., blowdown of a known volume of pipe) can be readily
quantified. Examples of potential high-emitting episodic events include liquid unloadings and
compressor station or pipeline blowdowns. These high-emitting sources have very high methane
emission intensity over very short time periods (down to the level of minutes).
3. Malfunctioning high-emitting sources: These sources can occur due to malfunctions and poor
work practices. Examples include malfunctioning pneumatic controllers (Allen et al., 2015b;

Potential ways the gas industry can contribute to the reduction of methane emissions Report for the Madrid Forum (5 - 6 June 2019)
33 / 146
Thoma et al., 2017) or valves that isolate separators and liquid storage tanks that do not seal
(a.k.a. stuck dump valves). Although not routine, these malfunctions have the potential to cause
high emissions. These high-emitting sources, depending on the nature of the malfunction, may
have high emission rates for prolonged periods (until the malfunction is addressed), or may be
intermittent.
As already mentioned, in the recent Science paper [17] led by EDF, authors reconciliated top-
down and bottom-up approaches by more effectively accounting for the influence of super-
emitters, and claims that super-emitters can explain the gap found with American national
inventories. However, other explanations, such as temporal variation issues can be found.
Concerning super-emitters, in contrast to the U.S. [113], in Europe, emitters of methane
releasing massive amounts during long periods of time have not been identified.
However, the ongoing studies (CCAC Methane Science Studies), [19] now launched also in
Europe, should help to address that matter.
Quantification of methane emission in biogas/biomethane plants
The European Biogas Association (EBA) estimates that by 2030 the overall annual potential for
biogas in the EU, including gasification, will be at least 50 billion m³, thus potentially providing a
15-30 % share of today’s natural gas market.
Biogas can be produced by anaerobic digestion of most wet organic feedstock and is recognised
as an integrated process including for feedstock supply and pre-treatment, gas production,
treatment and utilisation as well as recovery, pre-treatment and use of digestate. Although
biogas and biomethane production and use are regarded as a very sustainable practice that can
guarantee GHG savings, special attention should be given to methane emissions within the
biogas production and utilisation chain.
The first step to a successful emission mitigation strategy for biogas and biomethane plants is
the identification, detection and quantification of emission sources. Emission sources have
specific characteristics, which determine the possible methodology for detection and
quantification of the source.
Identified sources, such as open digestate storage can be investigated directly, since the location
of the source is known. A plant analysis usually starts with the identification of known emission
sources based on technical and operational characteristics of the plant and continues with the
identification of other sources. These sources can be single sources or a sum of small sources. In
case of a detailed source analysis the significant sources have to be identified with priority and
then analysed individually. Small emissions sources are usually estimated.
A second distinction can be made between point and area sources. Point sources such as exhaust
of CHP unit or pressure relief valves (PRV) will require different measurements techniques as
compared to area sources such as open digestate storage tank, a biofilter surface or a substrate
heap.
The time dependency of the sources is important. There are near constant sources which can be
measured at any time and the emission rate can be easily transferred to long-term plant
operation (e.g. CHP exhaust). On the other hand, temporary sources with highly unpredictable
characteristics such as the release event of an overpressure valve or emissions from digestate

Potential ways the gas industry can contribute to the reduction of methane emissions Report for the Madrid Forum (5 - 6 June 2019)
34 / 146
storage need to be analysed by means of long-term measurements of either the specific
potential emission source (provided the source is known) or the overall plant.
Leakage detection on biogas and biomethane sites has been a topic of increasing interest since
the development of imaging infrared cameras, which allow the visualisation of emissions, and
make the process much easier. However, the equipment alone does not ensure sufficient plant
evaluation and, so far, no specific standard procedure for leakage detection for biogas and
biomethane plants has been defined. There are some approaches, from industrial
entrepreneurs, to define basic requirements for leakage detection of biogas and biomethane
facilities.
Figure 11 gives an overview on the potential methane emission sources from components and
processes applied within the biogas and biomethane system including production and
utilisation.
Biogas production based on manure reduces the methane impact of the farming sector.
Figure 11: Potential methane emission sources from biomethane
Source – IEA Bioenergy [112]
In 2015 a project on measurements of methane emissions from biogas production was carried
out [115]. The project had two main objectives. The first objective was a literature study to
gather existing data and knowledge, mainly in Europe, regarding methane emission
measurement methods and results. The second objective was a comparison of some more or
less established measurement methods during a joint comparative measurement campaign at a
Swedish biogas plant, Tekniska verken in Linköping. The main goal of the project was that the
results may serve as a basis for further projects, such as a common European standardization of
measurement procedures and data evaluation. The conclusions of this project regarding the
comparative measurements is that the general results from different methods and approaches
are comparable. The studied plant is large in size and the overall emissions are comparably low.

Potential ways the gas industry can contribute to the reduction of methane emissions Report for the Madrid Forum (5 - 6 June 2019)
35 / 146
There are high and unknown uncertainties in all measurement results and they are due to both
analytical uncertainties and time variation in emission sources.
Under the BIOSURF project19, one of the work packages aims to reduce the uncertainties related
to the calculation of GHG emissions for biomethane value chains in order to provide assistance
to economic operators in their day-to-day work. This work package has three deliverables: (1)
Recommendation for the adaptation of the RED GHG calculation methodology [116], focussing
on the methodological background and the proposition of a GHG calculation approach for
biomethane, (2) Assessment of GHG reduction potentials due to the use of animal excrements
and organic waste streams as biogas substrates and the replacement of industrial chemical
fertilisers by digestate [117], summarized emission factors and data to support GHG emission
calculations, and (3) Calculation of GHG emission caused by biomethane [118], demonstrating
the applicability of the methodology developed in (1) and the data and emission factors from
(2).
Quantification of methane emission in utilisation
Gas engines
Three sources of CH4 emission can be distinguished:
1) Start/stops of the engines
Engine manufacturers estimate that the fuel loss amounts to some 10 litres per MW of engine
capacity per start/stop. This converts to roughly 7 gram of CH4 per start/stop per MW engine
capacity. The number of starts and stops per annum heavily depends on the type of application.
Some engines in cogeneration installations start/stop only 20 times per year, while units applied
in electricity capacity markets might stop three times per day. When presuming on average one
start/stop per day, the total amount of methane emissions from start/stops of the 30 GW
installed capacity might equal:
1 start/stop * 365 days * 7 kg/GW * 30 GW = 76.7 tonnes of CH4 per annum
2) Starting failure or ignition failure during operation
Starting failure and especially ignition failure occur only sporadically. The fuel loss caused by
starting failure is roughly 20 litre per MW engine capacity. If the starting failure is estimated at
two percent of all the starts, this means that on average 7 starts per year will fail. That converts
to 140 litre of fuel per MW installed capacity per annum. Starting failure can be presumed to be
responsible for:
7 failures * (20 litre/MW * 0.7 g/l) * 30 GW= 2.9 tonnes of CH4 per annum.
3) Incomplete combustion
The averaged CH4 emission of the current generation of lean-burn spark-ignited gas engines is
about 350 g/GJ (fuel, LHV)20.
19 Biosurf Project http://www.biosurf.eu/en_GB/ 20 According to Euromot contribution.

Potential ways the gas industry can contribute to the reduction of methane emissions Report for the Madrid Forum (5 - 6 June 2019)
36 / 146
The estimated annual fuel consumption of all gas engines in the EU is 26 Gm3. The estimated
methane emission of all gas engines in the EU caused by incomplete combustion is therefore:
950 ∙ 106 GJ (fuel consumption) * 350 g/GJ (CH4 emission) = 333 kt.
= > The sector is still working hard on finding solutions for further reductions.
Gas turbines for power generation and compressor drive
Incomplete combustion emissions
The EU defines BAT for controlling emissions from combustion sources with a rated thermal
input ≥ 50 MWth. Combined Cycle Gas Turbine (CCGT) units within power stations typically have
an individual power output of circa 450 MWe and a generating efficiency of circa 60 %, with a
thermal input of 750 MWth. Smaller gas turbines, in Combined Heat and Power (CHP)
installations, typically generate about 40 MWe with an additional 40 MW thermal output, giving
an overall fuel utilisation efficiency of 80 % for a thermal input of 100 MWth. However, units
sizes vary substantially, especially for CHP applications.
Smaller gas turbines are often aeroderivative units with higher pressure ratios and generating
efficiencies but with smaller combustion chambers and lower residence times than industrial
gas turbines which can lead to higher emissions of carbon monoxide (CO) and unburned
hydrocarbons (UHC), including methane.
Best Available Techniques are not formally defined for controlling methane emissions from gas
turbines, within the Large Combustion Plant BAT Reference document (LCP BREF) [37]. Modern
gas turbines are fitted with Dry Low NOx (DLN) combustion systems which also maintain low CO
emissions across the normal operating range. To some extent, CO is a proxy for unburned
hydrocarbons (UHC) of which methane comprises about 80 %. BAT is defined as optimised
combustion and/or the use of oxidation catalysts for controlling CO emissions. However,
oxidation catalysts are relatively ineffective for methane reduction, as also noted in the LCP
BREF. BAT can therefore be considered to be combustion optimisation alone in relation to
methane emissions.
During normal operating conditions, when the gas turbine is operating in the Effective-DLN
mode [37], methane emissions are very low. Routine methane monitoring is not required and
therefore Emission Factors, based on historic plant measurements, are used for reporting mass
emissions to the European-Pollutant Release and Transfer Register (E-PRTR), for example.
An Emission Factor of 4 g/GJ (LHV) is used in many national inventory returns, as recommended
by the IPCC [38] and also by Eurelectric for the power sector [39]. This is based on an historic
U.S. EPA Emission Factor [40] which is, in turn, based on field trial measurements conducted in
the 1990s, mostly on gas turbines without DLN combustion systems.
The historic Emission Factor of 4 g/GJ (= 4 mg/MJ) equates to a flue gas concentration of circa 7
parts per million (ppm) at 15 % O2, dry flue gas, and this concentration represents a worst-case
for selected aeroderivative gas turbines operating at high load. However, this worst-case factor
is out of date and unrepresentative of gas turbines used for power generation.
A more recent Danish study of small gas turbines (< 25 MWe) recommended a lower average
Emission Factor of < 1.5 g/GJ [41]. Another critical review of published and measured Emission
Factors concluded that an Emission Factor of 1 g/GJ could be used for large gas turbines and
boilers in Finland. In fact, processes with complete combustion can be a sink for methane

Potential ways the gas industry can contribute to the reduction of methane emissions Report for the Madrid Forum (5 - 6 June 2019)
37 / 146
emissions which can be higher in the ambient air than in the flue gas [42]. There is therefore a
need for further study and standardisation of Emission Factors.
As an indication, 1 g/GJ methane is approximately equivalent to an energy loss of about 0.005%
(loss of thermal input) and a 0.05 % increase in GWP21 when compared with the overall CO2
emission. Nevertheless, due to the large volumes of flue gas released, the large CCGT described
in the earlier example, when operating at base load all year round and emitting at 1 g/GJ, would
have an associated annual methane emission of 23.7 tonnes.
The estimated annual natural gas consumption for power generation in the EU was
approximately 2.2*109 GJ in 2016 [119]. Conservatively assuming that only gas turbines are used
to generate power from natural gas, the estimated methane emission of all gas turbines in the
EU, caused by incomplete combustion, is therefore:
2.2 ∙ 109 GJ (fuel consumption) * 1 g/GJ (CH4 emission) / 109 (g/kt) = 2.2 kt
However, methane emissions also depend on the way that the gas turbine is operated. Whilst
high methane concentrations occur during start-up and shut-down, these transient peak
concentrations are taken into account within the emission factor adopted for periods of normal
operation. Even so, start-up and shut-down periods must be minimised, according to the LCP
BREF, and improvements in CCGT ramp rates across recent years have assisted with this.
However, gas turbines that are required to operate at very low load conditions for extended
periods should be subject to a separate assessment.
In general terms, methane emissions from incomplete combustion are trivially small when
compared with both the absolute CO2 emission and the reductions in CO2 afforded by efficiency
improvements (~ 20 % relative improvement in CCGT efficiency across the past 30 years). The
widening of the normal operating range of the gas turbine, whilst maintaining efficiency, has
also had a beneficial impact.
Fugitive Emissions
Gas turbines used for power generation are usually supplied from a high pressure gas
transmission system with low methane losses, quantified by the gas supplier and described
elsewhere in this report. On site, the Above Ground Installation (AGI), with associated fuel gas
meters and temperature/pressure measurements, is usually located out-of-doors and the
number of welded, flanged joints is minimised. These are leak checked every time the joint is
broken using conventional techniques only.
Additional assurance is provided by monitoring the methane concentration, for safety purposes,
at multiple points within the gas turbine enclosure which contains the largest number of flanged
pipework connections and control valves. Additional methane monitoring provisions are site
specific but may include line-of-sight or point sensors within the gas turbine hall and/or within
the AGI.
Vented Emissions
Gas turbine power plant are subject to greater intermittency of operation as renewables
become more dominant within the energy mix. Two-shifting operation, in which the plant
operates to meet the peak daily demand only, is becoming more common. Every time the gas
turbine shuts down, a small volume of natural gas is vented from the shut-off-valves (SOVs) that
21 GWP100 = 28

Potential ways the gas industry can contribute to the reduction of methane emissions Report for the Madrid Forum (5 - 6 June 2019)
38 / 146
isolate the combustion system from the gas supply. Valve internal volumes are minimised for
reasons of cost and practicality. The volume of pipework between the SOVs and the combustor
is also minimised for the same reasons. Upon shut-down, some of this downstream fuel is
combusted as the fuel line is vented into the flame. However, a proportion of the residual fuel
is vented through the gas turbine when the flame is extinguished. Normally, these vented
emissions are limited to about 1.5 to 2 kg of methane per shutdown event, depending on the
methane content of the natural gas. However, vented emissions will be considered in more
detail in a later case study.
Occasionally, venting of the local high pressure natural gas supply line is required for either
safety reasons or for planned maintenance. The small volume of methane vented can be easily
calculated from the pipe dimensions (volume), the operating pressure and the methane content
of the natural gas.
Domestic gas boilers
Although very small, the importance of methane emissions is recently recognised by the
industry. No global harmonised approved data is available yet and methane emission is not
covered, as such, in the European product standards. The gas heating appliances industry
recognises the relevance and is starting projects to evaluate/assess the quantification of
methane emissions. Some first measurements on new boilers are already performed.
Road transport sector
Turning to methane emissions generated as unburned hydrocarbons at the point of exhaust,
these have been considered in the different steps of the European emissions standard
regulation.
Today for PCV & LCV methane emission restriction through the emissions directive EURO 6d
with WLTP (Worldwide Harmonised Light Vehicle Test Procedure) and RDE (Real Driving
Emissions) testing procedure for every new model entering the European market; this regulation
addresses total unburned hydrocarbons (THC) and non-methane unburned hydrocarbons
(NMHC), so indirectly also methane emissions (as the difference between the two).
For HDVs there is a direct methane emission restriction through norm EURO VI with VECTO and
RDE testing procedure for every new model entering the European market. No vehicle can be
on the market without passing the emission norms set by these directives.
The measurement methods of hydrocarbons emissions from vehicles during homologation
according to UNECE regulation22. The graphs below show how EURO norm for passenger vehicles
have pushed total hydrocarbons down in the past 13 years - down 10 times from 1000 mg/km
THC to 100 mg/km. In addition, type-approval includes WLTP, durability and RDE testing before
a PCV is allowed to enter the European market. In-service conformity testing is also part of the
vehicle compliancy within the first 100,000 km or 5 years.
22 UNECE Regulation https://publications.europa.eu/en/publication-detail/-/publication/2f8f0ce5-66fb-4a38-ae68-558ae1b04a5f/language-en

Potential ways the gas industry can contribute to the reduction of methane emissions Report for the Madrid Forum (5 - 6 June 2019)
39 / 146
Figure 12: Euro norms for PCV with THC thresholds
Source - NGVA based on EC regulation on pollutant emission standards
For HDVs a similar procedure is also applied; homologation tests are run at the engine test bed.
Looking to the evolution of the standard, the specific CH4 threshold started with 1,600 mg/kWh
till now 500 mg/kWh to be demonstrated under WHTC (Worldwide Harmonised Transient
Cycle). Beside that type-approval includes durability and RDE testing before a HDV is allowed to
enter the European market. In-service conformity testing is performed according to the table
below:
Table 4: In-service conformity for heavy duty vehicles depended on weight
Source - NGVA based on EC regulation on pollutant emission standards

Potential ways the gas industry can contribute to the reduction of methane emissions Report for the Madrid Forum (5 - 6 June 2019)
40 / 146
Figure 13: Euro norms history for HDV sector including CH4 threshold
Source - NGVA based on EC regulation on pollutant emission standards

Potential ways the gas industry can contribute to the reduction of methane emissions Report for the Madrid Forum (5 - 6 June 2019)
41 / 146
Increase transparency. Improve accuracy of collecting methane
emissions data
Transparency of methane emissions is one of the five guiding principles [48] and is the
foundation for building trust, honesty and consistency within the oil and gas Industry. Ensuring
that the industry has accurately collated and reported methane emission data (and, where
possible, had them verified by an independent third party), will generate the engagement with
the value chain and stakeholders to deliver successful reduction initiatives.
Methane emissions need to be assessed following general criteria from the most reliable
standards and frameworks. A range of standards, methods and frameworks related to emissions
control exist. An organisation can develop a methane emission inventory using different
techniques and through adopting a framework detailed in one of the standards.
The gas industry reports methane emissions in support of a variety of objectives. Methane
emissions are reported to national authorities via national inventory reports, partnerships and
associations (e.g. CCAC OGMP, OGCI, IOGP, IPIECA, MARCOGAZ), reporting initiatives (e.g. CDP)
and via companies’ annual sustainability and carbon footprint reports. The format for the
reporting and the methodologies utilised (particularly related to scope and boundaries) vary
depending upon the type of reporting.
The UNFCCC provides the foundation for intergovernmental action to combat climate change
and its impacts on humanity and ecosystems. All parties are obliged to communicate to the
Conference of the Parties (COP) relevant information, including information on GHG emissions.
Reporting within NIR towards the UNFCCC is in many cases not transparent if we consider that
the minimal reporting requirements are very general prescribed, and no reference is made to
international standards. Thus, the reporting of the gas industry value chain is difficult to
interpret and there are large differences from country to country in the EU28.
To improve the reporting accuracy and transparency, the gas industry worked on several
reporting methods which are available now. The methods themselves mostly cover very specific
parts of the gas value chain, which makes them difficult to combine. (Some examples are given
in ANNEX VII (p.121), however the table there demonstrates that most initiatives are not
binding).
For the moment no reporting method is available concerning gas appliances and utilisation.
It is of critical importance that the identified methane emission inventories can be assessed and
verified by an external body, independent from the emitting company.
4.3.1 Transparency: Recommendations
The gas industry advocates for following improvements:
• Harmonisation of quantification and reporting methodologies (specific for the gas sector, covering all the different types of methane emissions and the entire gas value chain);
• Continue to improve data coverage and data consistency;

Potential ways the gas industry can contribute to the reduction of methane emissions Report for the Madrid Forum (5 - 6 June 2019)
42 / 146
• Differentiate methane emissions between the gas, oil and coal value chains and allocate them proportionately;
• Review, with the support of the industry, all EU28 NIR to check consistency by country.
4.3.2 Standards, methods and frameworks to control emissions
A range of standards, guidelines, methods and frameworks exist to control emissions, with many having guiding principle; to provide an agreed procedure for collating emission data and intensity, whilst ensuring the integrity and confidence of these data are replicable and verifiable by a third party. Several standards and methods seek to identify all GHGs, not only limited to methane.
The main recognised standards include:
General Frameworks
IPCC Guidelines for National Greenhouse Gas Inventories, 2006 (covers all GHGs)
o IPCC guidelines provide a common reference of methodologies for estimating GHG emissions with the aim to report at national level under the UNFCCC.
o Methodologies for quantifying emissions are reported for several sectors (in addition to energy, also industrial processes, waste, agriculture, forestry and land use, etc); within the energy sector, available methodologies include those for estimating methane emissions.
World Resources Institute (WRI) / World Business Council for Sustainable Development (WBCSD) / GHG Protocol (covers all GHGs)
o The Greenhouse Gas Protocol set the guidance to measure and manage emissions. Those are designed to provide a framework for businesses, governments, and other entities to measure and report their greenhouse gas emissions in ways that support their missions and goals.
The GHG Protocol corporate accounting and reporting guidance provides requirements and guidance for companies and other organizations preparing a corporate-level GHG emissions inventory. The protocol covers the accounting and reporting of seven greenhouse gases covered by the Kyoto Protocol – carbon dioxide (CO2), methane (CH4), nitrous oxide (N2O), hydrofluorocarbons (HFCs), perfluorocarbons (PCFs), sulphur hexafluoride (SF6) and nitrogen trifluoride (NF3). It is due to increase consistency and transparency in GHG accounting and reporting among companies. In 2016, 92% of Fortune 500 companies responding to the CDP used GHG Protocol directly or indirectly through a programme based on GHG Protocol.
Nevertheless, although this is a very useful and clear methodology for GHG emissions inventories preparation, it is also a very general methodology with no specific chapter regarding methane emissions and leakages. 23
ISO 14064 Standards (Carbon footprint) (Cover all GHGs)
23 The Greenhouse Gas Protocol – A Corporate Accounting and Reporting Standard

Potential ways the gas industry can contribute to the reduction of methane emissions Report for the Madrid Forum (5 - 6 June 2019)
43 / 146
o ISO 14064-1 and 14064-2 specify principles and requirements at the organisation level for quantification and reporting of greenhouse gas (GHG) emission and removal. It includes requirements for the design, development, management, reporting and verification of an organisation's GHG inventory [21] and at project level [22] (to estimate emission reductions or removal enhancements.
United States Environmental Protection Agency (U.S. EPA) Greenhouse Gas Reporting Program (GHGRP)24
o The GHGRP collects annual greenhouse gas information from the top-emitting sectors of the U.S. economy. The GHGRP is the U.S. EPA’s only dataset containing facility-level GHG emission data from major industrial sources across the United States.
o The GHGRP prescribes methodologies that must be used to determine GHG emissions from each source category. Reporters generally have the flexibility to choose among several methods to compute GHG emissions. They report their emissions for the previous year to U.S. EPA on March 31 each year; most of this data is available to the public on the U.S. EPA website each October.
o The U.S. EPA uses a multi-step data verification process, including automatic checks during data-entry, statistical analyses on completed reports, and staff review of the reported data. Based on the results of the verification process, the U.S. EPA follows up with facilities25 to resolve mistakes that may have occurred during the reporting period.
The GHGRP does not represent total U.S. GHG emissions, but provides facility-level data for large sources of direct emissions, thus including most U.S. GHG emissions. A facility in the Petroleum and Natural Gas Systems source category (Subpart W of the program) is required to submit annual reports if total emissions are 25,000 metric tons carbon dioxide equivalent (CO2-eq) or more. The GHGRP data collected from direct emitters represent about half of all U.S. emissions. When including greenhouse gas information reported by suppliers to the GHGRP, emission coverage reaches approximately 85 - 90 %. The regulation requires reporting from the following 10 industry segments: onshore production; offshore production; gathering and boosting; natural gas processing; natural gas transmission compression; natural gas transmission pipeline; underground natural gas storage; LNG import/export; LNG storage; and natural gas distribution.
Canada [23]
In Canada a “manual” giving a detailed reference guide for use by both management and practitioners is used. The manual describes the different types of sources to be considered, delineates the basic steps involved in listing the target emissions, highlights important quality control/quality assurance matters to be considered and provides practical information for designing an overall assessment strategy best suited to a company's particular needs and
24 For more information, see https://www.epa.gov/ghgreporting 25 It should be pointed out that a “facility” in the production and gathering segments are defined as all operations in that segment in a geographic basin. This is not a single fenceline facility. In addition, US inventories do correct upward for facilities falling below reporting thresholds.

Potential ways the gas industry can contribute to the reduction of methane emissions Report for the Madrid Forum (5 - 6 June 2019)
44 / 146
circumstances. Moreover, it establishes a general source classification scheme to facilitate easy aggregation/disaggregation of data for industry reporting initiatives. It is important to note that this “manual” is intended to provide guidance that provides companies with the tools to complete inventories of GHG and air emissions for their operations. It allows companies to apply alternative- or modified methodologies that are technically valid and that may better reflect company-specific circumstances
Russia
In Russia technological emissions of natural gas during transportation by the transmission pipelines are determined according to methodical recommendations adopted by the Ministry of Energy of the Russian Federation.
Norway
The updated guidelines for reporting of methane and other Oil and Gas Carbon Initiative Emissions, released in 2018, includes a section detailing estimation methodologies for various emission sources. Relatively strict rules on documentation of underlying activity data (flow rate, measurements, information from technology provider, other type of documentation) are required, although no third-party audit or verification standard is specified.
ANNEX X (p.125) includes some examples on reporting of methane emissions.
Industry specific frameworks
Technical guidance documents (CCAC OGMP)
Climate and Clean Air Coalition (CCAC) Oil and Gas Methane Partnership (OGMP) –
Technical Guidance Documents (TGDs) Series - provides technical guidance to
Partners of the CCAC OGMP. [24] It is a series of nine TGDs describing core sources
of methane emissions from oil and natural gas production operations26. The
guidance documents introduce suggested methodologies for quantifying methane
emissions from specific sources and describe established mitigation options that
Partners should reference when determining if the source is “mitigated”. Guidance
documents are available for the following components:
1. Natural gas driven pneumatic controllers and pumps;
2. Fugitive component and equipment leaks;
3. Centrifugal compressors with “wet” (oil) seals;
4. Reciprocating compressors rod seal/packing vents;
5. Glycol dehydrators;
6. Unstabilised hydrocarbons liquid storage tanks;
7. Well venting for liquids unloading;
26 Minimising methane emissions from upstream hydrocarbons production is also considered as one of five key global GHG mitigation opportunities by the IEA [25].

Potential ways the gas industry can contribute to the reduction of methane emissions Report for the Madrid Forum (5 - 6 June 2019)
45 / 146
8. Well venting/flaring during well completion for hydraulically fractured wells; and
9. Casing head gas venting27.
Others are under development as part of ongoing engagement between organisations within the CCAC OGMP.
IPIECA and IOGP reporting of GHG emissions
IPIECA and IOGP developed three documents devoted to the reporting of GHG emissions:
- The first document is the IPIECA/API/IOGP Petroleum Industry Guidelines for Reporting Greenhouse Gas Emissions (2nd edition), which builds on the WRI/WBCSD GHG Protocol, but adds specific details about sources, boundaries, and methodologies for the oil and gas industry, and also approaches to evaluating uncertainty. These guidelines cover the GHG listed in the Kyoto Protocol, which includes methane. These guidelines are consistent with the second document.
- The second document is the Oil and Gas Industry Guidance on Voluntary Sustainability Reporting (3rd edition). This document is a reference tool aimed at helping company sustainability managers, communications professionals and environmental, health and safety or socio-economic specialists to develop corporate level reporting for internal and external stakeholders. The voluntary sustainability reporting guidance covers a range of sustainability issues relevant to the oil and gas industry, based on industry consensus, together with input from an independent panel of stakeholders with expertise in the sector and sustainability reporting. It is applicable across the entire spectrum of the oil and gas industry’s activities, from extraction and transformation of natural resources to supply of energy and other essential products to customers globally.
- The third document is the IPIECA climate change reporting framework: Supplementary guidance for the oil and gas industry on voluntary sustainability reporting, which is designed as a voluntary reporting framework for oil and gas companies to publicly disclose this information in a simple, straight-forward and transparent manner, that offers a broad coverage of the issues and provides a consistent reporting methodology. As the title of the third document states clearly, this is intended as a supplement to the second document.
MARCOGAZ method for TSOs, LNG terminal operators, UGS operators and DSOs (covers only methane)
Gas operators can apply different methods for the calculation of the methane emissions.
MARCOGAZ publishes methods for TSOs, LNG terminal operators, UGS operators and DSOs to report their methane emissions [27]. The application of these reporting methods is on a voluntary basis since no regulation is in place.
27 Flaring, venting and fugitive emissions are widely recognised as a significant source of GHG emissions and air pollution. Methane
is a primary constituent of natural gas and is a GHG with global warming potential over 25 times that of carbon dioxide [26]. In terms of environmental impact, flaring is generally preferable to venting. Flaring is also preferred from a safety perspective as it removes the potential for unintended gas ignition. In addition, fugitive emissions comprise emissions of hydrocarbons, methane (CH4) and other than those released through combustion processes.

Potential ways the gas industry can contribute to the reduction of methane emissions Report for the Madrid Forum (5 - 6 June 2019)
46 / 146
EBA – Biogas/biomethane
In the ongoing EvEmBi project, national voluntary systems on emission mitigation in the biogas sector will be developed for Germany, Austria and Switzerland, in a way that is comparable to “The Swedish Voluntary system for control of methane emissions” or the recent “Danish Voluntary system for control of methane emissions”. The national biogas associations will consider how the voluntary system could exist along side the current regulations in the particular country. Using the minimum requirements formulated for the national systems, a European voluntary system will be developed by EBA, which can be used as model for national voluntary systems in other European countries.
Utilisation
No reporting methodology available for the time being.
Source Specific Methodologies
EN 15446 (Covers VOCs, but not all types of methane emissions)
o The standard is based on the measurement of the gas concentration at the interface of a leak. This concentration is measured with a portable instrument. It is converted to a mass emission rate by use of a set of correlations. The scope of this protocol includes the complete data processing, from the initial concentration measurement up to the generation of an emission report over a reporting period. [28]
EPA 21 (Covers VOCs)
o Applicable for the determination of VOC leaks from process equipment. These sources include, but are not limited to, valves, flanges and other connections, pumps and compressors, pressure relief devices, process drains, open-ended valves, pump and compressor seal system degassing vents, accumulator vessel vents, agitator seals, and access door seals.28
Table 5: Benefits and disadvantages of each Protocol
Protocol Pros Cons
EPA 21
Identifies the specific equipment and methodologies for detecting and quantifying emissions
Point source emission identification and quantification
Aimed at individual assets emissions; no framework for organisations.
No detail provided for verification
Minimal detail for quality control
EN 15446
Identifies the specific equipment and methodologies for detecting and quantifying emissions
Detailed methodology for report writing and data capture
Aimed at site or point source emission; doesn’t provide framework for organisation emissions inventory
Not necessarily verifiable but is supported by third party accreditation
28 US EPA Method 21 – Determination of VOC leaks

Potential ways the gas industry can contribute to the reduction of methane emissions Report for the Madrid Forum (5 - 6 June 2019)
47 / 146
Point source emission identification and quantification
American Petroleum Institute Compendium of
GHG Emissions Methodologies
Detailed methodologies for all relevant sources of the Oil and gas industry
Structure aligned with IPCC Guidelines for GHG inventories
Wide set of emission factors provided with different tiers
Emission factors are mainly derived by U.S. experience, and in some cases, they may not be fully representative of European installations
CCAC Technical Guidance
Provide source-specific methodologies for estimating methane emissions, including mitigation options
guidelines are methane-specific
Described sources refer mainly to the upstream sector, and may not cover additional sources typical of downstream gas chain
Manual Estimation of Air Emissions from the
Canadian Natural Gas Transmission, Storage and
Distribution System
The Methodology Manual is a general reference document that delineates reasonable options for assessing atmospheric emissions at gas transmission, storage and distribution facilities. Rather than trying to establish minimum standards and reporting formats, it provides the information needed for users to make their own informed decisions best suited to their circumstances and needs. The presented options include but are not limited to; use of emission factors through to more rigorous engineering calculations and direct measurement techniques.
Gas management systems
Gas management should include consideration of methods for, identifying, controlling and
reducing methane and carbon dioxide emissions in facility design and operations, and for
implementing maintenance initiatives such as LDAR programmes as part of ongoing
maintenance decisions around specific steps may make use of a risk-based approach to
determine key sources, their consequences and the subsequent management measures that
would deliver the most benefit. The Gas Management Plan should provide the technical,
commercial and environmental justification for the management of emissions, and should
consider facility characteristics.

Potential ways the gas industry can contribute to the reduction of methane emissions Report for the Madrid Forum (5 - 6 June 2019)
48 / 146
The high-level management structure of ISO 50001 and 14001 are very suitable for governing
gas management for methane emissions. Principles identify where are the most significant
issues, to spot the solutions giving the more efficient and quicker gains, allowing significant
enhancements of the environmental and energy efficiency performance.
This is applicable to methane emission management, which can be for example included in the
ISO 50001 or ISO 14001 certification process, to identify emission sources to deal with in priority
using the more efficient techniques.
The internal check process and certification reviews, are then used to feed the continuous
improvement loop and periodically redefine the priority axis.
Additionally, it will assure both that the necessary procedures are written and applied.
Verification Routes
An organisation may choose from several routes to validate the data collected through one of
the above standards or protocols. This will enable the organisation to provide visibility,
transparency and assurance that the data collected is an accurate reflection of the organisation’s
activities. Some standards and protocols (as mentioned above) will also provide assurance
around the process in which the data was collected.
Example of recognised verification standards or frameworks
o Sustainability accepted standards, e.g. ISAE 3000 - An organisation may use existing sustainability reporting routes to verify their emission data, provided it is captured through that reporting process. Often an organisation will be a member of an institute or contract accountants to provide forensic analysis of the data, to provide transparency and consistency.
o GHG specific standards, e.g. ISO 14064-3 or ISAE 3410 – The application of a GHG specific standard provides organisation with a more robust consistency and accuracy of the verified figures.
o Environmental Standards, e.g. ISO 14001 or 50001 are a good base to include methane direct emissions quantification and reporting procedures. It will assure both that the necessary procedures are written and applied. Continuous improvement on methane emission quantification and reporting should also be included.
Work in progress at EU level
The GERG “MEEM” project „Development of an Accurate and Consistent Method for Methane Emission Estimation of the Gas Distribution Grid”, initiated in October 2014, combines best practice approaches of individual countries (different methods given in ANNEX VIII (p. 123)) and should be the foundation of an Europe-wide trusted methane emission quantification method for DSOs. MEEM also helps DSOs to identify and to evaluate already achieved emission reductions, to control further measurments and to display further improvements.
Based on this research project, MARCOGAZ is establishing a pre-standardisation report, which will be ready in 2019, allowing CEN to receive a Standardisation Request to harmonise this all over Europe.
Transmission, LNG terminals, UGS will be inserted in this report allowing comparable reporting of methane emissions.

Potential ways the gas industry can contribute to the reduction of methane emissions Report for the Madrid Forum (5 - 6 June 2019)
49 / 146
4.3.3 National inventories
GHG Inventories
In accordance with Article 12 of the UNFCCC [29] members are required to create “a national
inventory of anthropogenic emissions by sources and removals by sinks of all greenhouse gases”
[30].
The same requirement exists in Article 5 of the Kyoto Protocol [30]. Following the framework
set out at the convention, the determination and publication of emissions is carried out via a
NIR29. Several institutions are involved in the creation of the NIR. The Figure 14 shows an
example on how data is collected for emission reporting. It is notable that the institutions
responsible for reporting to the UNFCCC often have no direct access to data and are, therefore,
dependent on co-operation with other bodies (e.g. associations of the gas industry), in order to
fulfil their obligations.
Figure 14: International Obligations to report Greenhouse Gas Emissions (UNFCCC Art. 12)
Source: DBI GUT: Analysing the Methods for Determination of Methane Emissions of the gas distribution grid. Management Summary, 2016.
Although the framework for reporting is fixed by the UNFCCC, the method of emission quantification can differ from country to country, and even between several data providers within one country, as long as this method can be scientifically justified. The quality of GHG inventories relies on the integrity of the methodologies used, the completeness of reporting and the procedures for compilation of data.
In accordance with the principle of common but differentiated responsibilities and respective
capabilities, the reporting requirements and the frequency for the submission of national
reports are different for Annex I Parties (developed countries) and non-Annex I Parties
(developing countries). Annex I Parties have to submit their NIRs on annual basis and are obliged
to follow standardised requirements specified in the 2006 IPCC Guidelines or National
Greenhouse Gas Inventories, whereas non-Annex I Parties report information less regularly. The
transparency framework under the Paris Agreement unifies the reporting rules, as of 2024 all
29 The preparation of NIRs is obligatory for Annex-I parties of the UNFCCC. For other members, the reporting can be done in a simplified form.
National Authority
Natural Gas
Gas Network Operators
International Obligation to Report
Greenhouse Gas Emissions
(UNFCCC Art. 12)
Knowledge of the activity data for the emission
reporting have the gas network operators (TSO & DSO)
Emission Data Collection from
Emission Data Collection for
Other Areas
(Agriculture, Solvents, …)
National Gas Industry
Associations
Literature Studies,
IPCC Guidelines, …
Emission Data Collection from

Potential ways the gas industry can contribute to the reduction of methane emissions Report for the Madrid Forum (5 - 6 June 2019)
50 / 146
Parties will be obliged to report NIRs regularly (at least every two years) and to follow the IPCC
Guidelines.
Under the UNFCCC reporting guidelines on annual inventories for Annex I Parties, inventory submissions are in two parts:
Common reporting format (CRF) tables: a series of standardised data tables containing mainly quantitative information;
National Inventory Report (NIR): a report containing transparent and detailed information on the inventory.
The IPCC Guidelines distinguish between three methodological tiers for quantification of
emissions:
Tier 1: It is the simplest approach; it comprises the application of appropriate default
emissions factor to a representative activity factor (usually throughput). Default
emission factors for a set of activities are listed in the IPCC Guidelines.
Tier 2: Similar to Tier 1 approach. However, instead of default emissions factors,
country-specific emission factors (developed from external studies, analysis
measurement campaigns) are used.
Tier 3: The most detailed approach based on a rigorous bottom-up assessment at the
facility level, involving identification of equipment-specific emission sources, equipment
inventory, measurement of emission rates per equipment type, etc.
Emission factors for conducting Tier 3 and Tier 2 assessments are not provided in the IPCC
Guidelines.
Progressing from Tier 1 to Tier 3 represents a reduction in the uncertainty of GHG estimates.
However, the ability to use a Tier 3 approach will depend on the availability of detailed
production statistics and infrastructure data, , which may require investments, and it may not
be possible to apply it under all circumstances [102].
Figure 15 provides a general decision tree for selecting the appropriate tier approach for a given
segment of the natural gas chain.

Potential ways the gas industry can contribute to the reduction of methane emissions Report for the Madrid Forum (5 - 6 June 2019)
51 / 146
Figure 15: Decision tree for natural gas systems
Source – IPCC [102]
The IPCC released in May 2019 an update to its methodology30 used by governments to estimate
their GHG emissions and removals, in order to improve the reporting process by ensuring that
the methodology used to determine these inventories is based on the latest science. The new
report, the 2019 Refinement to the 2006 IPCC Guidelines on National Greenhouse Gas
Inventories (2019 Refinement), provides supplementary methodologies to estimate sources that
produce emissions of greenhouse gases and sinks that absorb these gases. It also addresses gaps
in the science that were identified, new technologies and production processes have emerged,
or for sources and sinks that were not included in the 2006 IPCC Guidelines. It also provides
updated values of some EF. The 2019 Refinement is to be used in conjunction with the 2006
IPCC Guidelines.
30 https://www.ipcc.ch/2019/05/13/ipcc-2019-refinement/

Potential ways the gas industry can contribute to the reduction of methane emissions Report for the Madrid Forum (5 - 6 June 2019)
52 / 146
European Inventory Submissions 2018 (2016 data)
The EEA publishes on annual basis the EU GHG inventory report [1]. This report is the best publicly available information on methane emissions at EU level.
GHG Emissions
The most recent data regarding the annual inventory are related to 2016 (submission 2018)31. Total GHG emissions in the EU-28 plus Iceland amounted to 4,300 million tonnes CO2-eq. In 2016, total GHG emissions were 24 % (1,356 million tonnes CO2-eq)32 below 1990 levels. Emissions decreased by 0.6 % (-27 million tonnes CO2-eq) between 2015 and 2016.
The reduction in greenhouse gas emissions over the 26-year period was due to a variety of factors, including the growing share in the use of renewables, the use of less carbon intensive fuels and improvements in energy efficiency, as well as to structural changes in the economy and the economic recession.
Figure 16: EU-28 plus Iceland GHG Emissions (excluding LULUCF)
Source – EEA GHG report [1]
Methane emissions
According to the EEA report, methane emissions accounted for 11 % of total EU GHG emissions in 2016 and decreased by 37 % since 1990 to 457 Mt CO2-eq in 2016. In the EU, the two largest sources of methane emissions are enteric fermentation and anaerobic waste. Together, they accounted for 54 % of methane emissions in 2016. Methane emissions from gas operations represented 6 % of the total methane emissions, equivalent to 0.6 % of the total EU GHG emissions33.
31 https://unfccc.int/process/transparency-and-reporting/reporting-and-review-under-the-convention/greenhouse-gas-inventories-annex-i-parties/national-inventory-submissions-2018 32 The value of GWP100 used is 25 33 The level of uncertainty from aggregated for the category “1.B Fugitive emissions” is 18.4% according to the EEA report [1].

Potential ways the gas industry can contribute to the reduction of methane emissions Report for the Madrid Forum (5 - 6 June 2019)
53 / 146
Figure 17: CH4 emissions 1990 to 2016 in CO2-eq (Mt) for EU-28 and Iceland
Source – EEA GHG report [1]
Figure 18: CH4 emissions: Share of key source categories and all remaining categories in 2016 for EU-28 and Iceland
Source – EEA GHG report [1]
However, the NIR do not necessarily reflect real emissions because authorities can take
literature or default values and there is often no cooperation with the industry. This is illustrated
in the figure “International Obligations to report Greenhouse Gas Emissions (UNFCCC Art. 12)”.
Methane emissions from oil and natural gas, in accordance with the annual EU GHG inventory
includes all emissions from exploration, production, processing, transport, and handling of oil
and natural gas. They account for 1.3 % of the total GHG emissions in 2016 and decreased by 38

Potential ways the gas industry can contribute to the reduction of methane emissions Report for the Madrid Forum (5 - 6 June 2019)
54 / 146
% between 1990 and 2016. This trend was mainly due to the reduction of fugitive34 CH4
emissions from natural gas activities, which decreased by 51 % over that period.
Figure 19: Emissions data trend 1B2 in the EU (oil and gas)
Source – EEA report [1]
Fugitive emissions from natural gas operations correspond to emissions from sources associated
with the exploration, production, processing, transmission, storage and distribution of natural
gas.
In the same period, the gas consumption increased by 25 % (from 360 to 449 bcm), as in figure.
Figure 20: Natural gas consumption in the EU (bcm)
Source - Elaborated by the authors based on EEA report [1]
34 The definition of fugitive emissions in the EEA GHG report is not in line with the present report.

Potential ways the gas industry can contribute to the reduction of methane emissions Report for the Madrid Forum (5 - 6 June 2019)
55 / 146
Figure 21 and Figure 22 show the different total contribution vs. gas chain and countries.
Figure 21: CH4 emissions from natural gas operations physically within in the EU in 2016
Source - Elaborated by the authors based on EEA report [1]
Figure 22: CH4 emissions from natural gas operations in the EU in 2016 per country
Source - Elaborated by the authors based on EEA report [1]
4.3.4 Data on CH4 emissions at corporate level
Most oil and gas companies report methane emissions data to their stakeholders by means of their corporate website, annual reports, or even by publishing their carbon footprint report.

Potential ways the gas industry can contribute to the reduction of methane emissions Report for the Madrid Forum (5 - 6 June 2019)
56 / 146
The starting point of any possible report on emissions is the preparation of a GHG emissions inventory that shapes the company's carbon footprint. The inventory can be prepared following different methodologies (as GHG Protocol) and it is the company's choice to verify it by a third independent party in order to provide veracity and reliability to the information. Later, this information is commonly reported through the company's own channels, which are the annual report and the corporate website.
It is common for companies to create a section on climate change in their web pages showing main emissions KPIs and a link to the Annual Report or to the Carbon Footprint Report. The information to be published is voluntary and the degree of detail depends on the structure of those media and the prominence choose to be given.
4.3.5 Data on CH4 emissions reported via industry initiatives
Production operators - IOGP report
As part of its annual global report “Environmental performance Indicators” [7], IOGP reports the GHG emissions of the upstream Oil & Gas production on a worldwide perimeter. There is no available split of methane emissions between oil and gas production.
The IOGP report covers all methane emission types and defines the following classification:
Fugitive emissions: Unintentional losses to the atmosphere from leaking equipment as for example Valves, Flanges, or Fittings
Vented emissions: Intentional emissions related to the controlled release of gases directly into the atmosphere resulting from the process design, most typically through a vent pipe, seal or duct. Like:
- Pressure relief vents (i.e., those not directed to flare systems)
- Process vents (i.e., where not directed to flare systems), potentially including vent
gases from natural gas driven pneumatic controllers, natural gas driven pneumatic
pumps, compressor seals, dehydration units and gas separation units (e.g. amine
units for acid gas removal)
- Tank Storage (including flashing, loading and unloading, and breathing losses to
atmosphere)
- Produced water treatment
- Vessel and Truck/Railcar Loading
- Maintenance (compressor blowdowns, etc., if gases not directed to flare)
Flaring emissions: Consists of the methane content resulting from incomplete
combustion of flared gas (default unburned fraction is considered to be 2%)
Energy / Combustion emissions: Emissions generated through the consumption of fuel in
Turbines (e.g., driving compressors, generators, pumps, etc.), Internal Combustion
Engines, Heaters, or Boilers / Reboilers

Potential ways the gas industry can contribute to the reduction of methane emissions Report for the Madrid Forum (5 - 6 June 2019)
57 / 146
Others / Unspecified: Emissions related to events / incidents (e.g., pipeline leak or
rupture). Companies that cannot provide at this time a break down by category of their
emissions data for a given country should report their emissions in this category.
IOGP reports that 1.5 million tons of methane and also 273 million tons of CO2 were emitted in
2017. 44 out of IOGP’s 56 members operating companies covering operations in 80 countries
worldwide shared data. These represent 27 % of 2017 global production sales. Regional
coverage is uneven, ranging from 82 % of known production in Europe to 10 % in Russia &
Central Asia.
Methane intensity varies significantly by region from 0.1 to 1.7 tons of methane per kton of
hydrocarbon production. Europe has a methane intensity of 0.36 which is less than half of the
overall methane emission intensity of 0.75. There is a higher emission intensity from onshore
(1.65) compared to offshore (0.23).
IOGP data in Europe cover 82% of the total European O&G production of 372,074 Mtons. Total
European methane emissions in 2017 can be estimated at 134,000 ton of CH4. Europe represents
2.4% of global methane emissions from O&G production.
Figure 25: Methane emissions by source in Europe
Source -2017, IOGP [7]
IOGP is working to improve the level of accuracy of IOGP members’ reported35 methane data
into the IOGP annual Environmental Performance Indicator (EPI) reporting process, and to
provide IOGP members with practical operational guidance on acceptable quantification
35 The majority of IOGP members have their data verified by a third party. Although some members have undertaken a level of uncertainty evaluation, IOGP does not have consolidated numbers.
:
Figure 23: Methane emissions by hydrocarbon production by region
Source -2017, IOGP [7]
Figure 24: Methane emission split by emission Source -2017, IOGP [7]

Potential ways the gas industry can contribute to the reduction of methane emissions Report for the Madrid Forum (5 - 6 June 2019)
58 / 146
methodologies for different methane sources. In 2018, IOGP also worked on a study to compare
methane monitoring and reporting methodologies and emission factors proposed by different
regulators / countries including UK, Norway, Netherlands, US, Australia. This study enables to
better understand the gaps/variations in values of emission factors across countries as well as
also helps guide members where to focus on improving accuracy.
MARCOGAZ’ industry reporting
MARCOGAZ developed and published (2005) a methodology using all available knowledge
within the group of European gas infrastructure operators. The methodology allows a common
approach to the quantification of methane emissions and a consistent reporting at European
level.
Based on this methodology, MARCOGAZ performed in 2017 a technical study [31] to estimate
the methane emissions in EU28 from the transmission [33] and distribution [34] activities for
the year 2015. New emission data resulting from recent quantifications and evaluations were
used, with an enlarged scope to cover the methane emissions from LNG terminals [35] and from
underground gas storages [36] facilities.
For each part of the covered gas value chain, MARCOGAZ analysed the methane emissions of
industry players to define a “macro” EF for a relevant AF. These EFs can then be applied at the
global EU28 level.
Table 6: MARCOGAZ data on CH4 emissions
CH4 emissions
in 2015 …
… from the
EU28 grid
… expressed in
CO2-eq
… related to the
EU28 gas sales
… related to the total of
anthropogenic36 GHG
emissions in EU28
[tons CH4] [tons CO2-eq] [tons CH4 /tons NG sold] [tons CO2-eq / tons CO2-eq]
LNG Terminals 4,700 131,600 0.002 % 0.003 %
UGS37 38,000 1,064,000 0.01 % 0.02 %
Transmission 133,000 3,724,000 0.05 % 0.08 %
Distribution 339,00038 9,492,000 0.12 % 0.21 %
Total 514,700 14,411,600 0.18 % 0.32 %
Source – MARCOGAZ [31]
MARCOGAZ reports also the methane emission by source type on the value chain.
36 Anthropogenic emissions: emissions originating in human activity 37 Only above ground installations are considered. 38 553,000 with 95 % confidence level as mentioned in the 2017 technical study

Potential ways the gas industry can contribute to the reduction of methane emissions Report for the Madrid Forum (5 - 6 June 2019)
59 / 146
Figure 26: MARCOGAZ methane emission by source type on the value chain
LNG terminals 0.9% with 4,700 ton of CH4
Underground Storage 7.4% with 38,000 ton of CH4
Transport (>16 bar) 25.8% with 133,000 ton of CH4
Distribution (≤ 16 bar) 65.9% with 339,000 ton of CH4
Source – MARCOGAZ [31]
MARCOGAZ reporting versus National inventories
The transmission, underground gas storages and LNG terminals’ emission figure shows a high
level of correlation with the activity factor and the dataset gives a credible picture. Data
obtained for this part of the gas chain are lower (-16 %) but similar to those provided by National
Inventories. It shows that the data are consistent, but that some gaps still need to be filled in
National Inventories and MARCOGAZ reporting, which confirm the need for standardisation.
Table 7: Transmission, LNG terminals and storages methane emission comparison
CH4 emissions in 2015 … … from the EU28 grid ton of CH4
Transmission and Storage (National Inventory 2015) 210,000
Transmission, Underground Gas Storages, LNG Terminals
(MARCOGAZ estimation) 176,000
Source – Authors of this report
A similar analysis can be done for distribution but with less consistency in the data. The
MARCOGAZ study shows how it appears to be more difficult to obtain consistent EFs between
the different countries (which is a consequence of the different methods in place), e.g. for steel
pipelines which account for 40 % of the NG distribution grid. MARCOGAZ continues its work to
promote and develop its methodology among its members.
83%
6%6% 5%
Fugitive Pneumatic
Vents Combustion
57%17%
15%
8% 3%
Fugitive Vents Others
Pneumatic Combustion
40%
40%
20%
Fugitive Vents Pneumatic
50%
23%
17%
9% 1%
Steel Cast iron PEunknown PVC

Potential ways the gas industry can contribute to the reduction of methane emissions Report for the Madrid Forum (5 - 6 June 2019)
60 / 146
Biogas/biomethane plants
There is no official reporting methodology available for the time being. (A European voluntary
system for control of methane emissions will be developed by EBA, taking into account “the
Swedish voluntary system for control of methane emissions” and the “Danish voluntary system
for control of methane emissions”, as well as the ongoing and comparable EvEmBi project in
Germany, Austria and Switzerland).
Utilisation – Road transport sector
NGVA Europe published a natural gas emissions study in 2017, prepared by Thinkstep [43], showing the different sources of methane emissions from Well-To-Wheel (WTW). The study was critically reviewed by three independent experts in accordance with LCA ISO standard 14040/44.
This report shows that emissions from the well to tank (values of emissions from dispensing are excluded) for the natural gas and LNG pathways in Europe are 0.6 % of the CNG supplied and 0.8% of the LNG supplied.
Table 8: Methane Emissions - CNG supply – weight percentage (wt.%) related to CNG dispensed in tank
Source: NGVA report “GHG intensity of natural gas” [43]
Table 9: Methane Emissions - LNG supply – weight percentage (wt.%) related to LNG dispensed in tank
Source: NGVA report “GHG intensity of natural gas” [43]
The whole supply chain of gas was considered for the Well-To-Tank (WTT) evaluation. This shows that, for LNG, 5.4 gCO2-eq/MJ and, for CNG, 3.4 gCO2-eq/MJ is generated as methane emissions.
Looking to dispensing operations at the gas stations, 20 % is accounted over the whole WTT emissions for LNG and 9% for respectively. Considering the current fuel consumption from the road transport sector in Europe, equivalent to approximately 2 bcm natural gas, the corresponding total methane emissions from dispensing operations are around 1,0 kton/year.
Looking to the fuel utilisation (Tank-To-Wheel (TTW) side), unburned methane emissions from combustion process are part of the current emissions regulation at homologation phase and during the so called in-use compliance period.
Concerning LNG trucks, methane emissions can occur due to boil-off gas (BOG) venting when temperature and pressure in the LNG tanks on the trucks rises too high. TNO39 performed
39 https://publications.tno.nl/publication/34625802/QoDRSe/TNO-2017-R11336.pdf

Potential ways the gas industry can contribute to the reduction of methane emissions Report for the Madrid Forum (5 - 6 June 2019)
61 / 146
research on this and found that BOG represents 0.4 % of the total CO2-eq emissions from running a LNG truck. Development of the truck operations and the potential coming from logistic optimisation will lead these types of emissions close to zero.
The estimation of the annual methane emissions from the utilisation of the current NGV fleet (CNG+LNG) is around 1.65 kton/year.
Total methane emissions from dispensing operation and use result at 2.65 kton/year.
Utilisation - Maritime transport sector [44]
SEA\LNG and SGMF published a life cycle GHG emission study on the use of LNG as marine fuel in 2019, prepared by Thinkstep. The study was critically reviewed by four independent experts in accordance with ISO standard 14040/44. Methane emissions from the supply chains as well as methane released at the ship combustion process (methane slip) were carefully included.
Methane emissions are not always directly measured on the test-bed and are mostly part of UHC emissions. For LNG operation it is assumed that 90 % of UHC emissions are CH4 emissions. This value is based on the experience of the engine manufacturers and can vary between 80 and 95 % as it is highly dependent on the gas quality and hence the methane content of LNG.
Methane emissions can have a significant impact on the total Well-to-Wake GHG emissions of marine engines. For oil-based marine fuels, methane emissions are limited to the supply chain of the fuel. In LNG operation, the methane slip in the engine (combustion) plays an important role in addition to the emission from the supply chain. The following tables show an analysis along the life cycle of the fuel and the contribution of supply and combustion. GHG emissions resulting from methane account for around 3 % of the total GHG emissions of oil-based fuels (HFO2.5 and MGO0.1 in the following tables) and can be considered as insignificant whereas this goes up to 22 % for certain engines combusting LNG (to be considered as significant).
Methane emissions in the supply chain are mainly fugitive emissions. Methane emissions from the combustion of the fuel show a strong dependency upon the combustion cycle.
Due to the high gas injection pressure and the combustion in a Diesel cycle, methane emission in the combustion of the 2-stroke slow speed Diesel-DF engine are about 4 g CO2-eq/kWh representing less than 1 % of the total GHG emissions. The data of the 2-stroke slow speed Otto cycle engine shows that methane slip accounts for 63 g CO2-eq/kWh which is equal to 11 % of the total GHG emissions.
Table 10: Contribution of CH4 emissions to WtW GHG emissions of 2-stroke slow speed engines
Source: SEA\LNG and SGMF report [44]
The same characteristics apply for 4-stroke medium speed engines with the two engine technologies investigated using an Otto combustion cycle. The data indicates that pure gas engines (Otto-SI) are less sensitive to methane slip. It accounts for 10 % (60 g CO2-eq/kWh) of the

Potential ways the gas industry can contribute to the reduction of methane emissions Report for the Madrid Forum (5 - 6 June 2019)
62 / 146
total GHG emissions of the Otto-SI engine. The dual fuel engines covered in the study show GHG emissions resulting from methane slip of 115 g CO2-eq/kWh which is equal to 17 % of the total GHG emissions.
Table 11: Contribution of methane emissions to WtW GHG emissions of 4-stroke medium speed engines
Source: SEA\LNG and SGMF report [44]
In the report, scenarios of potential future developments and technical improvements are investigated, such as more efficient technologies which would reduce methane emissions.
Utilisation – Power generation, chemical feedstock, industrial, commercial and
residential
There is not an official reporting methodology available for the time being.
4.3.6 Other reporting activities
EDF Investor Guide on Methane – Engaging with Oil and Gas Companies to manage a rising risk (methane only)
This guide has as its purpose to provide to investors with some tools and key information to engage with companies; however, the guide can also be helpful for organisations in order to assess their performance in terms of quantification, reporting and reduction of methane emissions;
The guide provides some best management practices, as well as relevant methane metrics for external reporting.
Carbon Disclosure Project (CDP) - CDP is a not-for-profit charity that runs the global disclosure system for investors, companies, cities, states and regions to manage their environmental impacts. Among other issues like water and forests, CDP is particularly known for its work related to climate change disclosure. CDP requests information on climate risks and low carbon opportunities from the world’s largest companies on behalf of over 525 institutional investor signatories.
CDP’s standardized and globally recognized reporting system reduces the burden of collecting
and submitting climate change related data, making comparison easier. The CDP use companies
submissions to rank them to provide a league table of performance.

Potential ways the gas industry can contribute to the reduction of methane emissions Report for the Madrid Forum (5 - 6 June 2019)
63 / 146
CDP’s climate change questionnaire includes specific questions regarding methane emissions, in
particular companies are asked to disclose about quantitative data and reduction best practices,
target setting, etc.
Potential ways the gas industry can contribute to the reduction of methane emissions Report for the Madrid Forum (5 - 6 June 2019)
64 / 146
Advance strong performance across the gas value chain
There is a large number of best available techniques (BAT) in the field of detection, quantification and mitigation of methane emissions are already in place across the gas value chain that the gas industry is implementing on voluntary basis.
As defined by European Integrated Pollution Prevention and Control Directive/Industrial Emissions Directive (IPPCD/IED), “Best Available Techniques” means “the most effective and advanced stage in the development of activities and their methods of operation which indicates the practical suitability of particular techniques for providing the basis for emission limit values and other permit conditions designed to prevent and where that is not practicable, to reduce emissions and the impact on the environment as a whole.”
(a) “Techniques” includes both the technology used and the way in which the installation is designed, built, maintained, operated and decommissioned.
(b) “Available” means those techniques developed on a scale which allows an economic and technically viable implementation in the relevant sector, taking the costs and advantages into consideration. This is, independent of the Member State so long as they are reasonably accessible to the operators.
(c) “Best” means most effective in achieving a high general level of protection of the environment as a whole.
A number of documents concerning BATs have been published already or are almost finalised. Some examples:
CCAC: Technical guidance documents [24]
UNECE and GMI – Best practices in MRV of methane emissions along the gas value chain (pending publication)
Best Available Techniques Guidance Document on upstream hydrocarbon exploration and production [20]
Methane Guiding Principles – Reducing methane: Best Practices. Strengthening the environmental credibility of gas (pending publication)
EPA - Natural Gas STAR Program40
IPIECA: Exploring Methane Emissions [45]
API Environmental Partnership41
ONE Future42
Better exchanges about the BATs across the gas value chain could be beneficial.
Applying the BATs requires a case by case practical, economic, environmental and technical consideration.
The gas industry has a rich pipeline of innovation and development of new technologies working in open innovation with institutes, company R&D departments and start-ups. MARCOGAZ,
40 https://www.epa.gov/natural-gas-star-program/natural-gas-star-program 41 https://www.api.org/news-policy-and-issues/environment/the-environmental-partnership-website 42 https://onefuture.us/
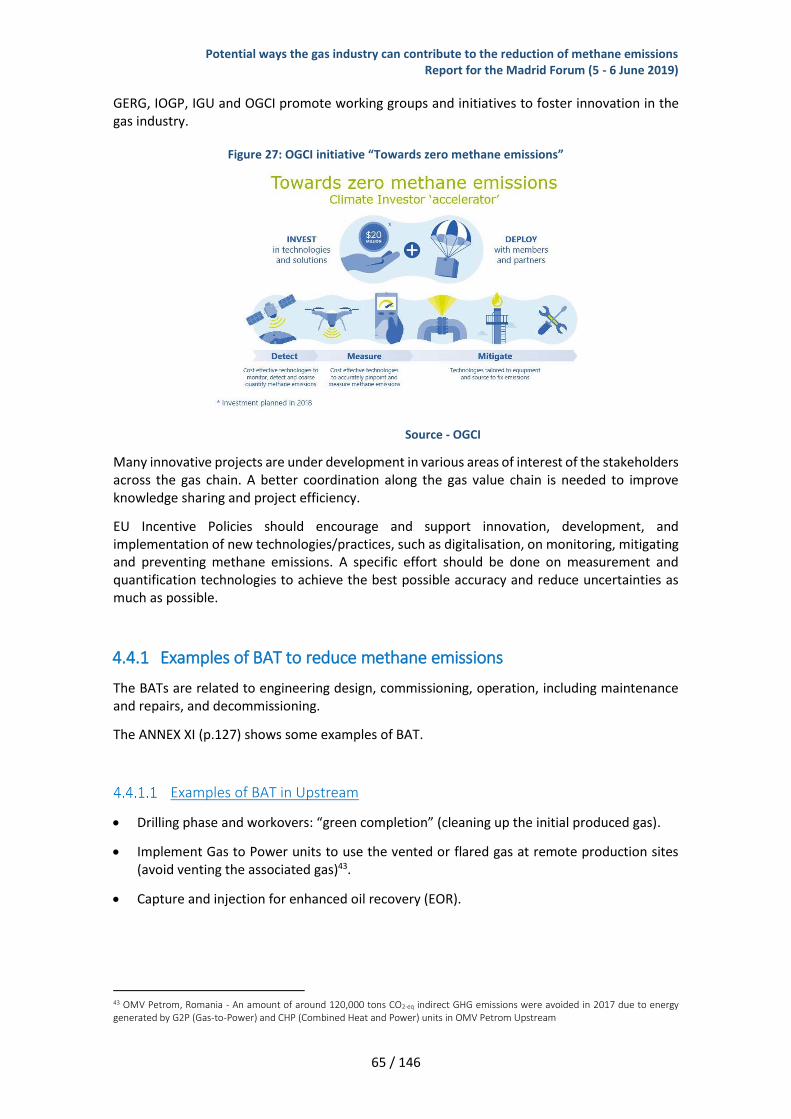
Potential ways the gas industry can contribute to the reduction of methane emissions Report for the Madrid Forum (5 - 6 June 2019)
65 / 146
GERG, IOGP, IGU and OGCI promote working groups and initiatives to foster innovation in the gas industry.
Figure 27: OGCI initiative “Towards zero methane emissions”
Source - OGCI
Many innovative projects are under development in various areas of interest of the stakeholders across the gas chain. A better coordination along the gas value chain is needed to improve knowledge sharing and project efficiency.
EU Incentive Policies should encourage and support innovation, development, and implementation of new technologies/practices, such as digitalisation, on monitoring, mitigating and preventing methane emissions. A specific effort should be done on measurement and quantification technologies to achieve the best possible accuracy and reduce uncertainties as much as possible.
4.4.1 Examples of BAT to reduce methane emissions
The BATs are related to engineering design, commissioning, operation, including maintenance and repairs, and decommissioning.
The ANNEX XI (p.127) shows some examples of BAT.
Examples of BAT in Upstream
Drilling phase and workovers: “green completion” (cleaning up the initial produced gas).
Implement Gas to Power units to use the vented or flared gas at remote production sites (avoid venting the associated gas)43.
Capture and injection for enhanced oil recovery (EOR).
43 OMV Petrom, Romania - An amount of around 120,000 tons CO2-eq indirect GHG emissions were avoided in 2017 due to energy generated by G2P (Gas-to-Power) and CHP (Combined Heat and Power) units in OMV Petrom Upstream

Potential ways the gas industry can contribute to the reduction of methane emissions Report for the Madrid Forum (5 - 6 June 2019)
66 / 146
Implementation of LDAR for monitoring fugitive emissions during operations, with leak screening techniques and/or direct measurement, which could include periodic facility inspections using detection equipment, flange management, etc..
Minimise venting of hydrocarbons from purges and pilots, without compromising safety, through measures including installation of purge gas reduction devices, flare gas recovery units and inert purge gas.
Minimise leakage by using “soft seal valves”.
Equipment upgrade to reduce incomplete burning.
Implement third parties’ prevention actions.
Reduce response time in case of third parties’ actions.
Operational repairs.
Examples of BAT in transmission, storage, LNG terminals and distribution
LDAR programmes.
Minimise venting of hydrocarbons from purges and pilots, without compromising safety, through measures including installation of purge gas reduction devices, flare gas recovery units and inert purge gas.
Replacing natural gas pneumatic valves with electric or air equipment or mechanical controls.
Implement minimising vents programmes.
Recompression instead venting.
Recover boil off gas during ship loading and eliminate – to the extent practicable – flaring.
Implement excess flow valve.
Use of vacuum pressure pumps during commissioning of distribution networks.
Replacing natural gas starters with electric engine starters at compressors, hence reducing operational venting.
Hot tapping techniques procedures.
Examples of BAT in utilisation44
Modern burners (including home appliance) with smart starters.
Smart detectors for shutting the valves in case of leakage.
For engines
In engine measures (reduced the hydrocarbon (HC) emissions by up to 50 %):
44 More research is required to identify additional BATs in the utilisation part, e.g. BAT for incomplete combustion for methane in a stationary combustion source.

Potential ways the gas industry can contribute to the reduction of methane emissions Report for the Madrid Forum (5 - 6 June 2019)
67 / 146
Reducing the crevice volume in the cylinder.
Scavenging carrying over of gas fuel.
Improving the combustion control systems (ignition stability, etc.).
For centrifugal compressor
Use of dry-gas seal (DGS).
Vent recovery system.
Transformation of methane emissions into CO2 before being released into the atmosphere.
4.4.2 Focus on the innovation and the development of new technologies – Examples provided by the industry
Examples in the upstream
Development of full system solutions LDAR for the upstream segment of the O&G industry. Technologies derive from academic research in the areas of laser sensing, turbulent plume dispersion, and integrated cloud-based analytics.
Several studies are or will be launched to compare methane emissions with bottom-up and top-down technologies (not only for upstream sector and not only in Europe)
As part of a voluntary methane emissions reduction programme, test of new low-emission designs using compressed air instead of natural gas to operate pneumatic equipment that helps regulate conditions such as level, flow, pressure and temperature. The results successfully demonstrated the feasibility of using similar designs for new and existing central tank batteries and satellites to further eliminate methane emissions.
The “Zero Routine Flaring by 2030” initiative [46], introduced by the World Bank, brings 95 participants together (governments, oil companies, and development institutions) which agree to cooperate to eliminate routine flaring no later than 2030 for a mitigation goal of 400 MtCO2-eq/y. New technologies are under development by the oil and gas industry to avoid flaring and new solutions such as reinjection of the produced gas, utilisation on-site or dispatch to a market.
For safety, prior to introducing natural gas into the plant processing systems, the plant pipelines must be purged of air. An Australian-based upstream oil and gas company, invested in a local nitrogen production plant in a gas processing plant to replace natural gas used as the purging agent.
Examples in transmission, storage and LNG terminals
In 2018, 6 TSO from 6 different EU countries have contracted in the frame of the European Gas Research Group (GERG) to define specific methods for the assessment of the amount of fugitive emissions from the NG transmission systems.
Development of an efficient leakage control method for natural gas pipeline networks and thus an alternative to the labour-intensive practice of conducting on-site inspections of the pipelines with gas detection devices. This is remote LDAR detection of methane from the air.

Potential ways the gas industry can contribute to the reduction of methane emissions Report for the Madrid Forum (5 - 6 June 2019)
68 / 146
Development of a new hi flow sampler technology for methane leakages. This technology should quantify leaks in a more reliable way and is able to quantify 17x smaller leaks (down the 5 L/hour) than the existing hi flow sampler systems.
Development of solutions that use unmanned aerial vehicles (drones) to accurately generate mass or volume leak rate data from equipment that has the propensity to leak.
New digital integrated platform to provide continuous and unmanned aerial vehicle (UAV) methane monitoring for oil and gas operators. This is a wireless ground-based and aerial drone-based methane detector that provides real-time cloud-based data and analytics.
Satellites providing continuous data and information on atmospheric composition in an operational mode. The products include analyses/re-analyses of the greenhouse gases (carbon dioxide, methane, and nitrous oxide) for recent years.
Development of proof of concept for a ground-based validation service for satellite-based methane emission measurement data products for local scale emissions. The validation capability will be based on accurately characterising and quantifying the emissions from an existing methane emitting source. This will enable the validation of a satellite-based system without additional methane emissions to atmosphere.
Another satellite project will provide by 2021 global, high-resolution coverage of methane emissions.
Development of specific methane emissions detection technology based on gas imaging (infra-red camera technology).
Figure 28: Methane leak
Source – Image provided by Enagás
Development of a technology (SRGG - Système de Récupération des Gaz Garnitures) which will enable to recompress gas compressors seal leaks into the grid.
Development of a system to collect methane emissions from compression sites to produce electricity with a Micro Combined Heat and Power (CHP) system, to be recompressed into the grid or to be burnt in a low emission burner based flaring system.
Development of control valves that can achieve the American Petroleum Institute (API) 641 certification for low fugitive emission performance.

Potential ways the gas industry can contribute to the reduction of methane emissions Report for the Madrid Forum (5 - 6 June 2019)
69 / 146
Examples in the distribution
Commissioning of a new distribution pipeline requires a certain amount of gas and air mixture to be vented, in order to achieve a safe concentration of NG. A technology has been developed to eliminate these vented emissions by using a vacuum pump to avoid the need to release any methane into the atmosphere.
Development of catalytic systems to oxidise into CO2 the methane normally released by the NG online analysers on the grid.
Employees engagement related innovations from the gas industry
Innovation is not only about new technology but also about company organization and culture to empower every employee to contribute to methane emission reduction. New initiatives are tested as:
Employee Engagement Programme that set financial incentives paid to employees for the highest reductions achieved by improvements in operations and technologies.
Executives’ remuneration linked to carbon emissions reduction.
Employee Engagement Programme which sets financial incentives for:
o Using natural gas at home
o Performing works to improve their housing energy efficiency
Example of midterm GHG emissions reduction target (2019-2021) to variable remuneration of employees, as well as in the last 3 years period (2016-2018). Moreover, annual energy consumption reduction target (link to emissions reduction) are also linked to yearly variable remuneration of employees.

Potential ways the gas industry can contribute to the reduction of methane emissions Report for the Madrid Forum (5 - 6 June 2019)
70 / 146
Ensure continued methane emissions reduction
As mentioned previously, a relevant step in Gas Emissions Management Systems is setting
reduction targets.
As long as the scope of this management systems are all GHG emissions, some companies in the
sector are setting reduction targets for their overall GHG emissions. This implies that methane
emissions have also been considered.
Below, some examples of GHG and methane emissions targets have been gathered.
4.5.1 Existing targets at oil and gas companies and associations
Upstream
OGCI
Target to reduce by 2025 the collective average methane intensity of its aggregated upstream
gas and oil operations by one fifth to below 0.25 %, with the ambition to achieve 0.20 %,
corresponding to a reduction by one third. Achieving this agreed intensity target would reduce
collective emissions by 350,000 tonnes of methane annually, compared to the baseline of 0.32
% in 2017. 45,46
Figure 29: OGCI methane emissions target
Source- OGCI
45https://oilandgasclimateinitiative.com/oil-and-gas-climate-initiative-sets-first-collective-methane-target-for-member-
companies/
46 https://oilandgasclimateinitiative.com/wp-content/uploads/2018/09/OGCI_Report_2018.pdf

Potential ways the gas industry can contribute to the reduction of methane emissions Report for the Madrid Forum (5 - 6 June 2019)
71 / 146
Complementary to the OGCI ambition, the member companies have fixed their own targets:
BP
BP is targeting a methane intensity of 0.2%. This refers to the amount of methane
emissions from BP’s upstream oil and gas operations as a percentage of the gas that
goes to market from those operations. Our methodology is aligned with the Oil and Gas
Climate Initiative’s (OGCI) methane intensity target. Additionally, BP has set a target of
3.5 million tonnes of sustainable GHG emissions reductions by 2025 which includes
actions to improve energy efficiency and reduce methane emissions and flaring. And, BP
will offset any net increase in emissions above baseline levels that’s not covered by
sustainable reductions activity out to 2025. 47
Chevron
Chevron said that by 2023, it will reduce its methane and flaring intensity by 25 % to 30
% from 2016 levels, and said the goal would be added to the scorecard that determines
incentive pay for around 45,000 employees.48
Eni
Eni has a target to reduce upstream fugitive methane emissions by 80 % in 2025,
compared to 2014 levels. By 2017, it had achieved a 66 % reduction. Specifically, sizeable
investment in gas infrastructure in remote areas has cut routine flaring volumes by 75
% since 2007, achieving further methane emission reductions.49
Equinor
The methane intensity from Equinor’s oil and gas operations is very low (methane
emissions are below 0.03 % of the gas sold to the market) and they are committed to
the OGCI ambition to move towards near zero methane emissions.50 Equinor also has a
CO2 intensity target of below 9 kgCO2/boe by 2020 and below 8 kgCO2/boe by 2030 (100
% operated oil and gas portfolio).
ExxonMobil
Exxon’s climate report includes a goal of reducing methane emissions from operations
by 15 % and flaring by 25 % by 2020 compared with 2016 levels.51,52
Pemex
47 https://www.bp.com/content/dam/bp/business-sites/en/global/corporate/pdfs/sustainability/group-reports/bp-sustainability-report-2018.pdf (page 14-15) 48 https://www.reuters.com/article/us-chevron-carbon/chevron-ties-executive-pay-to-methane-and-flaring-reduction-targets-idUSKCN1PW1V2 49 https://oilandgasclimateinitiative.com/wp-content/uploads/2018/09/OGCI_Report_2018.pdf 50 https://www.equinor.com/en/how-and-why/climate-change/methane.html 51 https://www.reuters.com/article/us-chevron-carbon/chevron-ties-executive-pay-to-methane-and-flaring-reduction-targets-idUSKCN1PW1V2 52 https://news.exxonmobil.com/press-release/exxonmobil-announces-greenhouse-gas-reduction-measures

Potential ways the gas industry can contribute to the reduction of methane emissions Report for the Madrid Forum (5 - 6 June 2019)
72 / 146
As part of the OGCI pledge, Pemex agreed to cap its methane releases at 0.2 to 0.25 %
of total marketed natural gas by 2025.53
Repsol
The target of our 2014-2020 emissions reduction plan is to cut back 2.1 million metric
tons of CO2-eq.54
Shell
Shell aims to reduce the Net Carbon Footprint of the energy products it sells, in step
with society’s progress towards meeting the Paris Agreement, by around half by 2050,
and by around 20 % by 2035.55
Shell has a target to maintain methane emissions intensity below 0.20 % by 2025. This
target covers all oil and gas assets for which Shell is the operator and complements
Shell’s Net Carbon Footprint ambition. In addition, early 2019, a Net Carbon Footprint
target was set for 2021 of 2 % to 3 % lower than the 2016 Net Carbon Footprint of 79
gCO2-eq/MJ.
Total
Its intention is to sustainably decrease and hold upstream methane emissions intensity
from operated upstream oil and gas production assets below 0.2 % of the volume of
natural gas production sold, by 2025. 56,57
NOGEPA
In 2018, the Netherlands Oil and Gas Exploration and Production Association (NOGEPA) initiated
an offshore methane emissions reduction programme. An independent party (MACH10) is
leading the programme, which was prepared in cooperation with Dutch authorities. The
programme is designed to deliver a methane emission reduction from offshore operations of
more than 50% in the period 2020-2024.
Gazprom
The methane intensity from Gazprom gas operations is very low (methane emissions are below
0.02 % of the total gas produced)58. Gazprom aims to reduce the Carbon Footprint of its energy
products by 6.6 % by 2020 against the 2014 baseline and to keep the achieved level59 in 2021-
2025.
53 https://www.edf.org/media/pemex-backs-strong-methane-goal-likely-meet-or-exceed-reductions-called-mexicos-draft-regs
54 https://www.repsol.com/en/sustainability/climate-change/our-climate-change-strategy/index.cshtml 55 https://www.shell.com/media/news-and-media-releases/2018/leading-investors-back-shells-climate-targets.html 56 https://www.sustainable-performance.total.com/en/climate 57 https://www.total.com/sites/default/files/atoms/files/total_climat_2018_en.pdf 58 http://www.gks.ru/wps/wcm/connect/rosstat_main/rosstat/ru/statistics/publications/catalog/5e901c0042cb5cc99b49bf307f2fa3f8 59 http://www.gazprom.ru/f/posts/97/653302/prir-passport-2018-2025.pdf

Potential ways the gas industry can contribute to the reduction of methane emissions Report for the Madrid Forum (5 - 6 June 2019)
73 / 146
OMV
OMV, the Austrian integrated oil and gas company, aim to reduce carbon intensity of operations
by 19 % until 2025 (vs. 2010) and the carbon intensity of OMV’s product portfolio by 4% until
2025 (vs. 2010).60
Transmission, UGS and LNG terminals
Enagás
Enagás has set a long-term emission reduction target of reducing 57% of its carbon footprint in
2030 (vs.2014). Additionally, in the midterm the company has set an emissions reduction target
of reducing emissions an average of 5% in the period 2019-2021 compared to 2018.
Detail of the long-term target:
Table 12: Enagás’ emissions reduction targets
Enagás Baseline year
Reference
year Target year
Baseline year selected 2014 2018 2030
Scope 1 and 2 emissions (tCO2e) 565.428 324.352 243.071
Global methane emissions (tCH4) 4.185 2.842 1.799
Venting* (tCH4) 1.919 1.128 825
Fugitive emissions (tCH4) 2.266 1.714 974
(*) Includes operation and maintenance vents, pneumatic valves vents and venting from analysers.
Snam
In 2016 Snam sets a voluntary target to reduce natural gas emissions of 10 % by 2021 compared
to 2016 levels (considered as base year).61 In 2018, Snam sets further reduction targets to 2022
(-15 %) and to 2025 (-25 %), both compared to the 2016 level.
Gasunie
The Gasunie ambitions for the CO2 footprint reduction are:
2020: A emission reduction that are a direct result of own business activities (scope 1 greenhouse protocol) by 20% compared to the 1990 reference year.
2030: Up to 2030 annually an average of 4% reduction in emissions that are a direct consequence of own business activities. The reduction is always compared with the emissions in the three previous years and will be achieved to a large extent by reducing our methane emissions.
2030: The methane emission in 2030 is a maximum of 50 kiloton CO2-eq
60 https://www.omv.com/en/carbon-efficiency-management 61 http://www.snam.it/en/Sustainability/strategy_and_commitments/snam_and_global_compact.html

Potential ways the gas industry can contribute to the reduction of methane emissions Report for the Madrid Forum (5 - 6 June 2019)
74 / 146
Energinet
The Energinet group has set a target to reduce methane emissions by 10 % in 2020 compared to
the 2015-2017 average.62
Teréga
Teréga has the ambitious target of reaching a neutral carbon footprint in 2020 and a positive
one in 2025.63
GRT-gaz
Methane emissions to be divided by 3 in 2020 based on 2016 figures.64
Fluxys Belgium
Fluxys Belgium will reduce its methane-emission with 50% by 2025, and is investigating
additional projects to further reduce his footprint after 2025. (ref-year 2017).
Gazprom
Corporate environmental target “methane emissions decrease” is permanently and annually set
for all Gazprom subsidiaries engaged in natural gas transportation65. The achievement of target
in 2017 against the 2014 baseline is down 5.03 %.
Distribution
GRDF
GRDF is currently working on the definition of the new CSR policy with a CO2 emissions reduction
target (including the contribution of methane emissions).
Gas Distribution Networks UK66
In 2016-17 (the last period for which the data has been published), all of the GB Gas Distribution
Networks hit their targets for leakage.
Other downstream: energy distribution and supply
Naturgy
Naturgy is an integrated gas and electricity company, leader in gas distribution (Nedgia) and
supply in Spain. The company has two main targets covering its corporate emissions at global
level (no only EU)67:
62 https://en.energinet.dk/About-our-reports/Reports/System-Plan-2018 (page 15) 63
https://www2.terega.fr/fileadmin/Nos_publications/Publications_institutionnelles/2018/TIGFA006001_RAPPORT_ANNUEL_2017_INTERIEUR_190x260_GB_PDF-mise_en_ligne.pdf (page 35)
64 http://www.grtgaz.com/fileadmin/plaquettes/en/2017/RADD-2016-EN.pdf (page 6) 65 http://www.gazprom.com/f/posts/60/709300/gazprom-environmental-report-2017.pdf 66 There are eight distribution networks throughout the British Isles which are owned by Cadent, Northern Gas Networks, SGN and
Wales & West Utilities 67 https://www.naturgy.com/en/files/CARBON_FOOTPRINT_REPORT.pdf

Potential ways the gas industry can contribute to the reduction of methane emissions Report for the Madrid Forum (5 - 6 June 2019)
75 / 146
Absolute emission target: Reduce absolute emissions, in scope 1 and 2, by 26 % by 2025
(according to the SBTI tool v.8) compared to the 2012 base year.
Average emission target: Reduce the average absolute emissions, in Scope 1 and 2, by
17.8 % for 2013-2030 compared to the 2012 base year.
Naturgy Baseline year Reference year Target year
Baseline year selected 2012 2017 2025
Scope 1 and 2 emissions (tCO2e) 26,123 21,848 19,369
Considering the relative importance of the emissions from power generation activities, it also
has specific absolute and average emissions from this activity (-33 % by 2025; -17.8 % between
2012-2030) compared to 2012 levels.
Naturgy has also set a target for reaching carbon neutrality in 2050. The target is applicable to
scopes 1, 2 and 3; applicable to all GHG, not just CO2; Applicable to all countries and sectors and
the decreases are calculated according to the UNFCCC methodologies for CDM projects.
Total GHG emissions (Scopes 1+2+3) 2017: 163.6 MtCO2-eq
Total GHG emissions avoided (Scopes 1+2+3) 2017: 132.4 MtCO2-eq
Objective fulfilment progress: 80.9%

Potential ways the gas industry can contribute to the reduction of methane emissions Report for the Madrid Forum (5 - 6 June 2019)
76 / 146
Table 13: Targets summary
Company GHG
absolute target
GHG intensity
target
Methane absolute
target
Methane intensity
target Target
Baseline year
Target year
Annual equivalent reduction
target (calculated)
BP
X
Decrease upstream methane emissions intensity from operated upstream oil and gas production assets below 0.2 % of the volume of natural gas production sold68
- 2025 -
X Reduce 3.5 million tonnes of sustainable GHG emissions and offset any net increase in emissions
- 2025 -
Chevron X Reduce methane and flaring intensity by 25 % to 30 %
2016 2023 -
Enagás
X 57 % GHG emissions reduction 2014 2030 3.6 %
X 5 % GHG emissions reduction 2018 av.
2019-2021
-
Energinet.dk X 10 % methane emissions reduction av.
2015-2017
2020 3.3 %
68 Includes methane emissions from operations where gas goes to market as a % of that gas – accounting for more than 90% of methane emissions from operated oil and gas assets

Potential way gas industry can contribute to the reduction of methane emissions Report for the Madrid Forum (5 - 6 June 2019)
77 / 146
Company GHG
absolute target
GHG intensity
target
Methane absolute
target
Methane intensity
target Target
Baseline year
Target year
Annual equivalent reduction
target (calculated)
Eni X 80 % upstream fugitive methane emissions reduction
2014 2025 7.3 %
Equinor X
Reduce CO2 emissions below 9 kCO2/boe by 2020 and below 8 kCO2/boe by 2030 in 100 % operated oil and gas portfolio.
Current methane intensity of own operations is at 0.03 %; with the ambition to maintain a low level.
- 2020 and
2030 -
ExxonMobil X 15 % methane emissions reduction from operations
2016 2020 3.8 %
Fluxys X 50 % methane emissions reduction 2017 2025 6.3 %
Gasunie
X 20 % scope 1 emissions reduction 1990 2020 0,7%
X Annually average reduction of 4 % in emissions that are a direct consequence of own business activities
3 previous
years
Up to 2030
4,0%
X Reach a maximum of 50 ktCO2-eq methane emissions
2030 -

Potential way gas industry can contribute to the reduction of methane emissions Report for the Madrid Forum (5 - 6 June 2019)
78 / 146
Company GHG
absolute target
GHG intensity
target
Methane absolute
target
Methane intensity
target Target
Baseline year
Target year
Annual equivalent reduction
target (calculated)
Gazprom X 6.6 % GHG emissions reduction 2014 2020 1.1 %
GRT-gaz X 67 % methane emissions reduction 2016 2020 16.8 %
NATURGY
x Reduce absolute emissions, in scope 1 and 2, by 26 % by 2025 (according to the SBTI tool v.8) compared to the 2012 base year
2012 2025 2.3%
x Reduce the average absolute emissions, in Scope 1 and 2, by 17.8 % for 2013-2030 compared to the 2012 base year
2012 Av 2013-2030
2.10%
x Reduce specific emissions by 33 % by 2025 (according to the SBTI tool v.8) compared to the 2012 base year
2012 2025 3.0%
x Reduce average specific emissions by 17.8 % for 2013-2030 compared to the 2012 base year
2012 Av 2013-2030
2.1%
NOGEPA X 50 % methane emissions reduction from offshore operations
2017 2020-2024
-
OGCI X X Reduce the collective average methane intensity of aggregated upstream oil and gas
2017 2025 2.7 %

Potential way gas industry can contribute to the reduction of methane emissions Report for the Madrid Forum (5 - 6 June 2019)
79 / 146
Company GHG
absolute target
GHG intensity
target
Methane absolute
target
Methane intensity
target Target
Baseline year
Target year
Annual equivalent reduction
target (calculated)
operations to below 0.25 %, with the ambition to achieve 0.20 %
(means reduce collective emissions by 350,000 tCH4/year, from a baseline of 0.32 % in 2017)
OMV X 19 % OMV Group carbon intensity reduction 2010 2023 -
Pemex 0.2 % - 0.25 % methane emissions vs total marketed natural gas
- 2025 -
Repsol X 2.1 million tCO2 reduction 2014 2020 -
Shell
X Ambition: 20 % reduction of its Net Carbon Footprint
2016 2035 -
X
Target: Early 2019, a Net Carbon Footprint target was set for 2021 of 2 % to 3 % lower than the 2016 Net Carbon Footprint of 79 gCO2-eq/MJ.
2016 2021 -
X Maintain methane emissions intensity below 0.20 % (oil and gas assets)
- 2025 -
Snam X 15 % natural gas emissions reduction 2016 2022 2.5 %

Potential way gas industry can contribute to the reduction of methane emissions Report for the Madrid Forum (5 - 6 June 2019)
80 / 146
Company GHG
absolute target
GHG intensity
target
Methane absolute
target
Methane intensity
target Target
Baseline year
Target year
Annual equivalent reduction
target (calculated)
X 25 % natural gas emissions reduction 2016 2025 2.8 %
Terega X Neutral carbon footprint - 2020 -
Total X
Decrease upstream methane emissions intensity from operated upstream oil and gas production assets below 0.2 % of the volume of natural gas production sold
- 2025 -

Potential ways the gas industry can contribute to the reduction of methane emissions Report for the Madrid Forum (5 - 6 June 2019)
81 / 146
The aimed of the information in the previous table is neither to establish a future global reduction for
methane emissions at EU level nor to benchmark or compare the targets between the different
companies. The main purpose of the table is to show that there is a huge commitment in gas sector
companies to continue in the future with the effort of achieving additional methane emissions
reductions:
The median of the absolute targets which specifically apply for methane emissions reduction
is 5.1 % per year.
The median of the absolute targets which apply for global GHG reduction is 2.3 % per year.
In addition, in some parts of the value chain a global intensity target has been set. OGCI
companies have already set a target to reduce the collective average methane intensity for
their aggregated, upstream oil and gas operations. The target is equivalent to a methane
intensity reduction of 2.7 % annually (350,000 tCH4/year).
A summary of these voluntary reduction targets is included in the following graph:
Figure 30: GHG and CH4 emissions existing voluntary reduction targets
Source: Elaborated by the authors
These targets show the commitment of the companies and at the same time can be a reference for
other companies that are now evaluating to set a target for the future. As long as the current situation
and the reduction potential is very different depending on the part of the gas chain and the company,
it is important for each company to evaluate their own abatement potential, and the projects or BATs
that they are planning to implement in order to set realistic targets.
Setting intermediate targets for the European gas sector is positively perceived by industry, but the
conclusions from previous chapters show that from the methodology point of view, it might be
challenging to develop it. Before that, there is a need for improvement in terms of standardisation
for quantification, reporting and verification. These previous steps are necessary in order to establish
monitoring processes to periodically review and verify the fulfillment of the pathways and targets.

Potential ways the gas industry can contribute to the reduction of methane emissions Report for the Madrid Forum (5 - 6 June 2019)
82 / 146
Advocate sound policy and regulations on methane emissions
Since the mid-1990s methane emissions have been decreasing, partly due to the adoption of the first
EU methane strategy published in 1996. However, the 1996 strategy was not a complete success, since
it failed to bring about the expected level of emission cuts [47].
The EU Governance Regulation 2018/1999 includes the mandate to the EC to work on the EU strategic
plan for methane (article 16):
Given the high global warming potential and relatively short atmospheric lifetime of methane, the
Commission shall analyse the implications for implementing policies and measures for the purpose of
reducing the short- and middle-term impact of methane emissions on Union greenhouse gas emissions.
Taking into account the circular economy objectives as appropriate, the Commission shall consider
policy options for rapidly addressing methane emissions and shall put forward a Union strategic plan
for methane as an integral part of the Union's long-term strategy referred to in Article 15.
However, there are already some European and national regulations in place affecting methane
emissions. For this reason, it is necessary to ensure consistency and avoid overlapping legislation.
4.6.1 EU level
At the end of 2018, the European Commission adopted a strategic long-term vision for a prosperous, modern, competitive and climate neutral economy by 2050 – A Clean Planet for all. The strategy shows how Europe can lead the way to climate neutrality by investing into realistic technological solutions, empowering citizens, and aligning action in key areas such as industrial policy, finance, or research – while ensuring social fairness for a just transition. The associated documents to the Strategy include many references to the reduction of methane emissions in key sectors, notably agriculture, waste and energy.
In addition, it indicates that the largest driver for methane emissions reduction in the energy sector are reductions in fossil fuel consumption itself and associated reductions in emissions from fossil fuel extraction and distribution in the EU. The faster this transition is, the faster the emissions will decrease. Nevertheless, the gas transmission and distribution system will continue to play a role in a low carbon economy, though rather based on clean gases such a biogas and e-gas. Thus, increased monitoring, detection and prevention, all fulfil an important function.
The other EU legislation affecting methane emissions are:
Efforts Sharing Decision/Regulation
Waste Framework Directive / EU Directive on the Landfill of waste (EU) 2018/850
Fuel Quality Directive - reduction of the GHG intensity of transport fuels by a minimum of 6 % by 2020
NEC Directive69 2016/2284
Energy and Climate Framework 2030: reduce GHG emissions by 40 % (base 1990)
o ETS: 43 % reduction in 2030 (base 2005)
69 Commission declaration to further assess the impact of methane emissions and consider measures. JRC report on methane emissions’ contribution to ozone.

Potential ways the gas industry can contribute to the reduction of methane emissions Report for the Madrid Forum (5 - 6 June 2019)
83 / 146
o Effort Sharing Regulation: 30 % reduction in 2030 (base 2005)
o Reporting–UNFCCC emission inventory
For the gas transport sector, the following EU regulations are already in place to ensure methane
emissions are measured of vehicles and are below set threshold.
PCV & LCV emissions norms EURO 6d, EC 715/2007; implemented and amended by EC
692/2008
WLTP & RDE for PCV & LCV, EC 1832/2018
HDV emissions norms EURO VI, EC 595/2009; implemented and amended by EC 582/2011 and
EC/64/2012
HDV VECTO tool, EC 2400/2017
4.6.2 Member State level
In order to gather information at European level a short questionnaire was circulated among IOGP,
GIE and Eurogas’ members:
Is there any regulation in place related to methane emissions in the E&P operations, gas
infrastructure: transmission, storage, LNG terminals, distribution?
Is your company obliged to report methane emissions to National Authorities? (Y/N)
Frequency?
Is your company obliged to carry out LDAR campaigns? (Y/N) Frequency?
Has your regulator set any incentives related to detection, quantification and mitigation of
methane emissions?
Answers from companies –E&P, transmission system operators, LNG terminal operators, underground
gas storage operators and distribution system operators - in 21 Member States were received.
As a summary of the answers:
Most of Member States have established regulations that affect methane emissions from some parts of the gas chain.
The majority of the companies are obliged to report annually their methane emissions.
LDAR campaigns are mandatory in a few Member States. However, in most of the cases it is part of normal maintenance programmes of the companies, but with different frequencies.
A few Member States have defined financial incentives (e.g. Great Britain, Belgium) affecting methane emissions directly from infrastructure. Depending on the Member State policy, financial incentives are allowed for detection, research and innovation or emissions mitigation/reduction.
4.6.3 Maritime transport - IMO targets
In 2018, the IMO Marine Environment Protection Committee (MEPC) approved the organisation’s first
GHG strategy, aimed at reducing emissions for international maritime shipping.

Potential ways the gas industry can contribute to the reduction of methane emissions Report for the Madrid Forum (5 - 6 June 2019)
84 / 146
The IMO GHG strategy establishes quantitative emissions reduction targets and carbon intensity
targets for shipping up to 2050. The targets are structured as follows:
Carbon intensity of new ships should decline through the implementation of further phases
of the energy efficiency design index (EEDI), first approved in 2011. This measure is subject to
the review of the MEPC.
The CO2 intensity of international maritime shipping should decline on average by at least 40%
by 2030, pursuing efforts towards 70% compared to 2008 levels.
GHG emissions from international shipping should peak and decline as soon as possible. Total
annual GHG emissions should decline by at least 50% by 2050 compared to 2008 levels, while
pursuing efforts to phase them out, in line with the Paris Agreement CO2 emissions reduction
targets and temperature goals.
4.6.4 Regulation and policies in non-EU countries
Some other jurisdictions have already established methane emissions regulation, and can provide
insight into regulatory principles and lessons learned. However, caution should be exercised with
regard to their transferability, due to significant regional differences in the technical characteristics of
natural gas infrastructure.
A summary of the main information per country is shown below:
Norway
Norwegian Oil and Gas recommended guidelines for discharge and emission reporting70 – Describes reporting and contains calculation methodologies to be used for the quantification of methane emissions from combustion processes (e.g. turbines, flares, etc.) and loading activities.
Direct methane emission sources are also described; all relevant direct emission sources and predefined calculation methods are mentioned.
The guidelines are mandatory for all the operators and part of the operating license award.
More detailed descriptions of the source-specific calculation methods for direct methane emission source are provided in the: “Handbook for quantifying direct methane and NMVOC emissions”. This handbook71 was developed based upon a project led by the Norwegian Environment Agency: ’Cold venting and fugitive emissions from Norwegian offshore oil and gas activities’. An English summary72 report has been prepared and contains a higher-level overview of sources, quantification methods, BAT conclusions, etc. described in more detail in the Norwegian sub-reports.
70 https://www.norskoljeoggass.no/contentassets/cd872e74e25a4aadac1a6e820e7f5f95/044---guidelines-for-discharge-and-emission-reporting.pdf 71 https://www.norskoljeoggass.no/contentassets/cd872e74e25a4aadac1a6e820e7f5f95/044---appendix-b-voc-emmissions-guidelineline.pdf 72 http://www.miljodirektoratet.no/no/Publikasjoner/2016/Juni-2016/Cold-venting-and-fugitive-emissions-from-Norwegian-offshore-oil-and-gas-activities--summary-report/

Potential ways the gas industry can contribute to the reduction of methane emissions Report for the Madrid Forum (5 - 6 June 2019)
85 / 146
• Main legislation73 on the CO2 taxation of petroleum activities in Norway - Lov om avgift på utslipp av CO₂ i petroleumsvirksomhet på kontinentalsokkelen with detailed requirements as to how to measure and report taxable CO2 and natural gas emissions74.
Greenhouse Gas Emission Trading Act75 (transposition of the EU ETS) - Designed to “limit emissions of greenhouse gases in a cost-effective manner by means of a system involving the duty to surrender greenhouse gas emission allowances and freely transferable emission allowances” for production.
Russia
Methane is considered not only as a GHG, but also as a toxic substance in accordance with Russian legislation76. Therefore, Russian regulation of methane emissions as toxic emissions means receiving permits, monitoring (including quantification), reporting and payments of the fees to the state budget.
Information on methane emissions is presented in annual environmental bulletins published by the Federal Statistics Service of the Russia77.
The Ministry of energy of the Russian Federation sets norms for gas losses for gas transportations78.
The Federal Agency of the technical regulation and metrology of the Russian Federation published Best Available Techniques Reference book for natural gas production79 with figures of permissible level of methane emissions (0.06 - 0.18% of produced gas). Best Available Techniques Reference book is a basis for permits.
Gazprom sets corporate target for methane emission reduction for subsidiaries80 and
develops methane saving programmes and corporate standards.
Canada
Environment and Climate Change Canada’s Greenhouse Gas Reporting Program, implemented pursuant to subsection 46(1) of the Canadian Environmental Protection Act81, 1999 (the Act). The program mandates reporting of GHGs for facilities that meet the annual reporting threshold. The program collects facility-level data for stationary combustion, industrial process, industrial production, methane emissions (venting, flaring and leakage), on-site transportation, waste and wastewater treatment.
Introduced in 2004, with an annual reporting threshold of 100,000 t CO2-eq, the reporting applies to “facilities” that meet the reporting threshold, which was subsequently lowered to 50,000 t CO2-eq, and that is now set at 10,000 t CO2-eq. “Facilities” defined under the regulation include integrated facilities, pipeline transportation system within a province, or offshore installations.
73 https://lovdata.no/dokument/NL/lov/1990-12-21-72?q=co2 74 https://lovdata.no/dokument/SF/forskrift/2001-11-01-1234 75 https://www.regjeringen.no/en/dokumenter/greenhouse-gas-emission-trading-act/id172242/ 76 http://static.government.ru/media/files/NQsLnpwkA9vtceGoj46TRcTSm6yxJXmH.pdf 77 http://www.gks.ru/wps/wcm/connect/rosstat_main/rosstat/ru/statistics/publications/catalog/5e901c0042cb5cc99b49bf307f2fa3f8 78 https://minenergo.gov.ru/system/download/523/92156 79 http://burondt.ru/NDT/NDTDocsDetail.php?UrlId=1114&etkstructure_id=1872 80 http://www.gazprom.com/f/posts/60/709300/gazprom-environmental-report-2017.pdf 81 https://www.canada.ca/en/environment-climate-change/services/canadian-environmental-protection-act-registry/related-documents.html

Potential ways the gas industry can contribute to the reduction of methane emissions Report for the Madrid Forum (5 - 6 June 2019)
86 / 146
Canadian Western Climate Initiative (WCI) provincial partners: British Columbia, Ontario, Quebec. Specific regulations apply for each jurisdiction, but these provinces have implemented reporting regulations that reference WCI quantification methodologies.
Regulations82 Respecting Reductions in the Release of Methane and Certain VOCs (Upstream Oil & Gas Sector, gas transmission pipelines and storage, but excludes distribution). Its objective is to reduce methane emissions by 40 to 45 % below 2012 levels by 2025 or 21 Mt CO2e. It applies to oil and gas facilities responsible for extraction, production, processing and transportation of oil and natural gas, including natural gas transmission pipelines and storage, but excludes distribution.
It sets facility and equipment (e.g. compressor venting, pneumatic devices) methane emissions limits and it mandates a comprehensive LDAR inspection three times per year at most upstream oil and gas facilities. Instrumentation for leak detection and repair timeframes are specified.
Australia
National Greenhouse and Energy Reporting Act83, 2007. Mandatory reporting of all six GHGs and energy produced and consumed for all facilities above 25kt CO2-eq (combustion of fuels for energy, fugitive emissions from the extraction of coal, crude oil and natural gas, industrial processes and waste management). Criminal and civil penalties may apply for providing false or misleading data.
Emission Reduction Fund - Carbon Credits (Carbon Farming Initiative) Act84, 2011. Provides incentives for organisations and individuals to adopt new practices and technologies to reduce their greenhouse emissions and store carbon.
Approval of project licence conditions - Applies additional methane monitoring requirements to new projects/facilities.
U.S.
Mandatory Greenhouse Gas Reporting Rule, Title 40 Code of Federal Regulations (CFR), Part 98, Subpart W – Petroleum and Natural Gas Systems. It requires annual reporting of methane emissions from facilities that emit 25,000 metric tons CO2-eq per year. Different provisions apply to production, gathering, processing, transmission pipeline blow downs, transmission compression, underground storage, LNG, and local natural gas distribution.
Oil and Natural Gas Sector: Emission Standards for New, Reconstructed, and Modified Sources Reconsideration. Requires various measures to reduce methane emissions focusing on mandatory LDAR to new facilities in oil production and natural gas operations upstream of gas distribution utilities. Additionally, 40 CFR Part 60 contains multiple requirements beyond just LDAR at new and modified oil and gas facilities.
Voluntary Programs:
o Methane Challenge85 - Sets challenging goals for Best Practices, provides transparent platform to report and recognise methane reductions
82 www.ec.gc.ca/lcpecepa/eng/regulations/detailReg.cfm?intReg=243
83 http://www.environment.gov.au/climate-change/climate-science-data/greenhouse-gas-measurement/nger 84 http://www.environment.gov.au/climate-change/government/emissions-reduction-fund http://www.cleanenergyregulator.gov.au/ERF/Want-to-participate-in-the-Emissions-Reduction-Fund 85 https://www.epa.gov/natural-gas-star-program/methane-challenge-program

Potential ways the gas industry can contribute to the reduction of methane emissions Report for the Madrid Forum (5 - 6 June 2019)
87 / 146
o Natural Gas Star Program86 - Information on specific projects and lessons learnt
o Global Methane Initiative and the U.S. EPA collaboration with CCAC Oil and OGMP – Technology transfer
Some States have set additional obligations – Implementation of BAT and LDAR campaigns.
Lessons learnt based on the experience of these countries
A summary of the main lessons learnt in those countries where regulation is already in place can be found below:
Regulations are more workable and effective if regulators/policy makers collaborate with industry transparently in development phase to ensure that it matches operational reality.
Incentives on innovation contribute to reducing methane emissions.
Mandatory reporting of methane emissions
o Starting with voluntary initiatives enables a robust well-balanced scheme
o Emissions have generally declined (additional efforts by the industry)
o Uncertainty band has been reduced
o Development of rigorous emission factors based on real data
o Administrative and reporting burden increased
Making LDAR mandatory contributes to reduce emissions while recapturing valuable product.
Voluntary programmes are a really good tool.
Continued support for science
86 https://www.epa.gov/natural-gas-star-program/natural-gas-star-program

Potential ways the gas industry can contribute to the reduction of methane emissions Report for the Madrid Forum (5 - 6 June 2019)
88 / 146
Annexes
ANNEX I - TERMS OF REFERENCE
Joint proposal on potential way industry can contribute to the reduction of
methane emissions
Background
During the last European Gas Regulatory Forum held in October 2018 in Madrid, the Forum invited
GIE and MARCOGAZ to co-lead, with the support of the gas industry, the development on the way
industry can contribute to the reduction of methane emissions in the gas sector.
Conclusion of 31st meeting of the European Gas Regulatory Forum, 16 – 17 October 2018, Madrid
The reduction of fugitive methane emissions in the energy sector is a prerequisite for the sustainable use of gases in the future energy mix. Therefore, the development of a common, robust measurement methodology and life-cycle based reporting of net methane emissions are necessary. The Forum invites GIE and MARCOGAZ to develop further on the potential way industry can contribute to these objectives and report back to the next Madrid Forum.
Over the last years the gas industry has recognised the importance of understanding methane
emissions along the gas value chain. Several initiatives and studies have been undertaken to better
understand the scale of losses, potential sources and opportunities for reductions.
In addition, the gas industry is striving to further reduce methane emissions from their gas
infrastructure, to implement good industry practices to achieve this goal and to improve transparency
of emissions data.
However, there is work to do to better understand losses in the gas value chain, standardise
methodologies and improve transparency. This is important to support the future role of gas in a
decarbonized future energy mix.
Objective
A report on current understanding within the gas industry to be presented during the next Madrid
Forum that will take place on 5th and 6th June 2019.
The entire gas chain (from production to utilisation) and all the types of methane emissions will be
covered.
The document will reflect the work done on this topic, the ongoing initiatives and projects (including
next steps and timeline) and the identified gaps (proposals and recommendations will be included
when possible) along the gas value chain.
The work will be divided in 2 parts:
Current understanding and initiatives
This first phase will describe the current situation of the gas sector, and particularly of the gas
industry, regarding methane emissions. This will include:
Introduction to methane emissions
o Summary of the main initiatives, business cases and developments carried out so far by the gas industry and relevant stakeholders.

Potential ways the gas industry can contribute to the reduction of methane emissions Report for the Madrid Forum (5 - 6 June 2019)
89 / 146
o Literature survey
Gas industry potential for further reducing methane emissions
Opportunities for further reductions of methane emissions in the gas value chain need to be
pursued to confirm that natural gas has a role in a decarbonised economy and provide a set
of measures and tools for the rest of the gas industry. The second part of the study will set the
main guiding principles for methane emissions reductions:
o Improve accuracy of methane emissions data
Detection (by carrying out LDAR campaigns)
Quantification
Analysis of measurement technologies and data acquisition
How to use bottom-up and top/down methods to detect and evaluate leaks
o Increase transparency:
Quantification methodology: calculation, estimation or measurement
Reporting methodology
National inventories
Data verification and validation in accordance with (current and future) reference standards
To evaluate the possibility to publish the aggregated methane emissions data for the gas industry
o Advance strong performance across the gas value chain
Examples of BAT to reduce methane emissions
Focus on the innovation and the development of new technologies – Examples provided by the industry
Recommendations of how to advance strong performance
o Ensure continued methane emissions reduction
Establish quantitative methane reduction targets and identify the previous efforts carried out by the industry/companies (Analysis)
Establish monitoring processes in order to periodically review the fulfilment of the pathways and target
Goals for implementation of BATs, LDAR, etc. (qualitative targets)
o Advocate sound policy and regulations on methane emissions
Methodology & Working Plan
The preparation of the report will be coordinated between GIE and MARCOGAZ, while ensuring that
representatives from the entire gas chain and main stakeholders are involved.
A joint Task Force between GIE and MARCOGAZ members will be created to carry out the work. For
this purpose, a call for participants in both organisations has been launched on 24th October. The kick-
off meeting has taken place on 8th November in Brussels.

Potential ways the gas industry can contribute to the reduction of methane emissions Report for the Madrid Forum (5 - 6 June 2019)
90 / 146
A table is circulated among the main gas organisations to gather proposals, ideas and “volunteers”
that want to contribute to the different tasks. Organisations are requested to send their feedback to
GIE and MARCOGAZ before 20th November COB.
A leader will be designated per task in order to ensure that all the stakeholders are involved and the
tasks are developed in the right manner and on time.
Two workshops will be organised in order to present the progress of the report and to involve the
main stakeholders:
• 17th January in Brussels
• 27th March in Geneva
The report will take into account the input received during the workshops.
After the second workshop, the draft report will be submitted to be peer reviewed.
The final version of the report will be ready by 20th May 2019.
Potential stakeholders to be involved
On the development of the report – Afecor, CCAC OGMP, CEDEC, CEFIC, COGEN, EASEE-gas, EBA, EHI,
EHPA, ENTSOG, EUGINE, Eurogas, EUROMOT, EUTurbines, GERG, GIIGNL, IFIEC, IGU, IOGP, IPIECA,
GEODE, GD4S, Methane Emissions Industry meeting participants, Methane Guiding Principles (MGPs),
NGVA, OGCI, SEA\LNG, SGMF, SIGTTO.
In addition, for the workshops - EC, JRC, ACER, CEER, FSR, IEA, UNECE, UNEP, NGOs, Academics, etc.

Potential ways the gas industry can contribute to the reduction of methane emissions Report for the Madrid Forum (5 - 6 June 2019)
91 / 146
Indicative Working Plan
22/1
0/2
018
29/1
0/2
018
05/1
1/2
018
12/1
1/2
018
19/1
1/2
018
26/1
1/2
018
03/1
2/2
018
10/1
2/2
018
17/1
2/2
018
24/1
2/2
018
31/1
2/2
018
07/0
1/2
019
14/0
1/2
019
21/0
1/2
019
28/0
1/2
019
04/0
2/2
019
11/0
2/2
019
18/0
2/2
019
25/0
2/2
019
04/0
3/2
019
11/0
3/2
019
18/0
3/2
019
25/0
3/2
019
01/0
4/2
019
08/0
4/2
019
15/0
4/2
019
22/0
4/2
019
29/0
4/2
019
06/0
5/2
019
13/0
5/2
019
20/0
5/2
019
27/0
5/2
019
03/0
6/2
019
Presentation of the draft ToR
Draft ToR to be circulated for comments
Creation of a joint Task Force - Call for
participantsKick-off meeting of the TF (8 November -
14:00-17:00)
Approval of the ToR (GIE&MARCOGAZ)
Structure and first version of the
document with the main contents
First workshop (17 January - Brussels)
Preparation of a second version of the
document based on the feedback received
Second workshop (27 March - Geneva)
Prepararation of the third version of the
document based on the feedback
Peer review
Approval of the document
Final document and presentation
Madrid Forum (5-6 June - Madrid)

Potential ways the gas industry can contribute to the reduction of methane emissions Report for the Madrid Forum (5 - 6 June 2019)
92 / 146
ANNEX II - GAS INDUSTRY INITIATIVES
METHANE REDUCING INITIATIVES
Climate and Clean Air Coalition (CCAC) Oil and Gas Methane Partnership (OGMP)
This partnership was launched at the United Nations Secretary General Climate Summit in September
2014. Key technical partners include the EDF, the U.S. EPA Natural Gas Star program, the Global
Methane Initiative and the World Bank Global Gas Flaring Reduction Initiative. The Partnership
benefits from the political support of key CCAC governments, including France, Netherlands, Nigeria,
Norway, the United Kingdom and the United States.
To date, the nine OGMP Partner companies have surveyed more than 65 assets in 15 countries.
The OGMP third-year report [50] has been published.
CCAC Oil and Gas Methane Science Studies
In June 2018, Science [51] published an EDF-led collaboration with U.S. academic institutions
synthesising the findings from ground-breaking series of 16 research studies87 on methane emissions
from the U.S. natural gas supply chain. The study found the U.S. oil and gas industry emits 13 million
metric tons of methane88, which is nearly 60 % more than current EPA estimates. This study marks a
significant milestone for the methane research work, which has spanned over half a decade, involved
hundreds of scientists, 50 industry partners, and resulted in three dozen peer-reviewed scientific
papers that were collectively co-authored by more than 140 researchers from over 40 institutions.
EDF-led studies have expanded to include measurements in Canada [49] and Europe (Groningen field
[18] ).
A set of international science studies89 have been recently launched. The CCAC, EDF and the OGCI
are working together on a series of peer-reviewed scientific studies to measure methane emissions in
the oil and gas sector. The data collected will help companies and governments prioritise actions and
policies to reduce methane emissions. This will support us all in thinking about gas supply being
imported into Europe, and the LNG and pipelines that deliver this, as well as gas production and
delivery infrastructure inside the Union. The OGCI CEO-led initiative includes European majors such as
BP, Shell, ENI, Total, Repsol and Equinor.
Global Methane Initiative
The GMI is an international public-private partnership composed of 45 partner countries and a project
network that reaches more than 1,200 members, including private companies, financial institutions,
universities, and other governmental and non-governmental organisations. The GMI also collaborates
with international partners focused on reducing methane, including the United Nations Economic
Commission for Europe (UNECE) and the Climate and Clean Air Coalition (CCAC).
GMI focuses on reducing methane emissions from several key sectors: oil and gas systems, coal mines,
and biogas (agriculture, municipal solid waste, and wastewater).
87 https://www.edf.org/climate/methane-studies 88 https://www.edf.org/methane-other-important-greenhouse-gas 89 http://ccacoalition.org/en/activity/oil-and-gas-methane-science-studies

Potential ways the gas industry can contribute to the reduction of methane emissions Report for the Madrid Forum (5 - 6 June 2019)
93 / 146
Methane Guiding Principles
In November 2017, eight companies signed up to Guiding Principles [48] for reducing methane
emissions along the natural gas value chain, from production to the final consumer. Since then, a
further ten companies have become signatories and there are ten supporting organisations. The
principles were developed collaboratively by a coalition of industry, international institutions, non-
governmental organisations and academics. The Principles are complementary to and mutually
reinforcing of other initiatives, including the OGCI and the CCAC Oil and Gas Methane Partnership.
Methane reducing measures are already adopted by many companies on a voluntary
basis. Complementary and supportive policy and regulation frameworks can ensure assertive and
proportional effort across the full value chain. The Methane Guiding Principles advocate for sound
methane policies and regulations that incentivise early action, drive performance improvements,
facilitate proper enforcement, and support flexibility and innovation.
The main activities under the umbrella of this initiative include:
• Methane Reducing Best Practices: practical guidelines to help companies reduce emissions;
designed for front line operators across the natural gas value chain and with the support of
leading academics.
• Policy and regulation: A methane policy framework will be used to encourage governments to
consider and establish sound policies and regulations for managing methane. Development of
a methane emissions portal.
• Common methane reporting template: to simplify and streamline current external reporting
systems, and encourage countries which are developing methane policies to adopt the same
framework reporting structure.
• Educational programmes for industry, governments and regulators.
OGCI
The Oil and Gas Climate Initiative (OGCI) is a voluntary CEO-led initiative taking practical actions on
climate change. OGCI members leverage our collective strength to lower carbon footprints of energy,
industry, transportation value chains via engagements, policies, investments and deployment.
Launched in 2014, it is currently made up of thirteen oil and gas companies (around 30% of global oil
and gas production) that collaborate to increase the ambition, speed and scale of initiatives they can

Potential ways the gas industry can contribute to the reduction of methane emissions Report for the Madrid Forum (5 - 6 June 2019)
94 / 146
undertake to reduce greenhouse gas emissions. It focuses on carbon capture, use and storage,
reduction of methane emissions, energy and transport efficiency and other low emission
opportunities.
Members companies share a will to collaborate, a support to the Paris Agreement, and a commitment
to work (direct engagement from the CEOs to drive the initiative, active participation in OGCI
program).
OGCI set a target in 2018 to reduce the collective average methane intensity of aggregate upstream
gas and oil operations by more than one-fifth to 0.25% by the end of 2025, with the ambition of
achieving 0.2%. The 2017 baseline is 0.32%. All members, including new ones, have agreed to report
progress annually and on the basis of transparent reporting rules, methodology and assumptions. The
intensity target has focused individual companies’ attention on tackling key methane emissions
sources through expanded leak detection and repair campaigns, better devices, reduced venting and
the elimination of routine flaring. At the OGCI level, that work is supplemented by initiatives to
facilitate methane science studies, invest and deploy novel technologies and encourage greater focus
on emissions in the downstream gas value chain and among joint venture partners.
ONE FUTURE
ONE Future is a group of natural gas companies working together to voluntarily reduce methane
emissions across the natural gas supply chain in U.S., with a goal to lower emissions to 1% by 2025.
Reports on methane emissions initiatives, information, data and some examples of activities are
published on their website90.
The Environmental Partnership
The Environmental Partnership91 is comprised of companies in the U.S. oil and natural gas industry
committed to continuously improve the industry’s environmental performance.
The Environmental Partnership has developed three separate Environmental Performance Programs
for participating companies to implement and phase into their operations beginning January 1, 2018.
These programs were selected based on EPA emissions data and are designed to further reduce
emissions of methane and VOCs, using proven cost-effective technologies.
Participants in The Environmental Partnership have committed to continuous learning about the latest
industry innovations and best practices that can further reduce their own environmental footprint
while safely and responsibly growing energy production.
The Environmental Partnership promotes information sharing to highlight individual company efforts
and technology. In addition, The Environmental Partnership will host workshops and conferences to
share ideas, learn from subject matter experts, and encourage improvement in operational practices
and technologies.
90 https://onefuture.us/ 91 https://theenvironmentalpartnership.org/

Potential ways the gas industry can contribute to the reduction of methane emissions Report for the Madrid Forum (5 - 6 June 2019)
95 / 146
ORGANISATIONS’ ACTIVITIES
GERG
GERG has been active for many years in developing a deeper understanding of methane emissions
from the gas chain, as well as in developing technical solutions for their identification, measurement
and mitigation.
Working closely with MARCOGAZ and other European and International stakeholders GERG aims to
identify needs and bring the players together to complete the necessary research actions. Most
recently GERG has completed a project to develop a standard methodology to estimate methane
emissions from gas distribution activities (MEEM DSO) [52]. A follow up project is underway to validate
this practically. A separate project is also underway to improve measurement methods for gas
transmission networks.
GERG is in a strong position, with its mix of gas network operators and research providers, to lead and
engage in private and public funded initiatives to deliver solutions to the challenges the industry is
facing.
GIE
GIE has a working group on methane emissions. In 2018 GIE published the document “Key messages
on methane emissions” [53]. On 15th October 2018, GIE and the Florence School of Regulation
organised a joint workshop92 “Towards “Net Zero” Methane Emissions in the Gas Sector – Challenges
and Opportunities”.
IGU – GEME (Group of Experts on Methane Emissions)
The International Gas Union has been proactive in encouraging and supporting industry actions
towards methane emissions reduction. The IGU was one of the first Supporting Organisations to join
the Methane Guiding Principles Coalition.
Reducing methane emissions is a priority for the industry as it represents an additional opportunity to
contribute to climate change mitigation.
The IGU acknowledges the importance of reducing methane emissions from the gas value chain and is working with the industry in a deliberate effort with the aim of:
• Improving confidence in the accuracy of measurement, quantification, and reporting of methane emissions through sharing of latest developments in field and academic research.
• Encouraging systematic reduction of methane emissions through operations management, including the sharing of the best approaches to enhanced measurement, quantification, reporting and reductions, within and across the value chain.
• Promoting the rapid advance, development, and commercial deployment of cost-effective methane detection, quantification, and reduction technologies.
• Encouraging scientific research into the sources of methane emissions and understanding of methane in the environment.
92 FSR & GIE Workshop - Towards “Net Zero” Methane Emissions in the Gas Sector – Challenges and Opportunities http://fsr.eui.eu/event/towards-net-zero-methane-emissions-in-the-gas-sector-challenges-and-opportunities/

Potential ways the gas industry can contribute to the reduction of methane emissions Report for the Madrid Forum (5 - 6 June 2019)
96 / 146
As the first step in implementing this commitment, the IGU created a specialised industry taskforce – the Group of Experts on Methane Emissions (GEME).
This group is composed of a distinguished team of global subject-matter experts, representing the
entire natural gas value chain across the globe.
GEME leads the IGU efforts on methane, meeting regularly to share the latest developments from
around the globe and ensure progress in its mandate of supporting the industry in tackling methane
emissions.
The group held several industry workshops sharing the latest developments, reports and approaches
taken to reduce methane emissions, including one that supported the IEA efforts in the completion of
the WEO 2017 methane chapter.
At the end of 2017 the IGU released two reports; a first of its kind methane emissions mitigation case
study report, gas industry’s Methane Emissions Challenge [54]; and a report on Understanding
Methane’s Impact on Climate Change [11].
Methane emissions will be an important strategic priority during 2019, and the IGU is currently
developing a plan of engagement for the year. We envision capacity building as an important focus
area, particularly aiming to bring in smaller players from the mid and downstream.
IOGP
The International Association of Oil and Gas Producers (IOGP) publishes every year the Annual
Environmental Performance Indicator Report. IOGP has collected environmental data from its
member companies every year since 1999. The objective of this programme has been to allow
member companies to compare their performance with other companies in the sector leading, it is
hoped, to improved and more efficient performance. The programme also contributes to industry’s
wish to be more transparent about its operations.
In January 2018, IOGP established a dedicated Methane Reporting Taskforce to:
• improve the level of accuracy and credibility of IOGP members’ reported methane data into
the IOGP annual EPI reporting process, and
• provide IOGP members with practical operational guidance about acceptable quantification
methodologies for different methane sources, together with a related level of confidence /
accuracy, that would provide improved clarity for the IOGP EPI reporting process.
The IOGP Methane Reporting Task Force has undertaken a study comparing the different methane
emissions measurement methodologies and emission factors for upstream oil and gas operations
proposed by different regulators/countries including UK, Norway, Netherlands, U.S. and Australia. The
objective is to better understand the gaps/variations in values of emission factors across countries.
This study could allow IOGP members to position themselves against other countries and would be
useful for advocacy for big differences. It could also help guide members where to focus on improving
accuracy.
IPIECA
IPIECA has been working on a mapping analysis of the many initiatives taking place in the area of
methane. The objective of this mapping exercise is to help with understanding synergies, gaps and
opportunities to advance oil and gas industry knowledge in this important area. This will help IPIECA
– and others – decide priority focus areas going forward.

Potential ways the gas industry can contribute to the reduction of methane emissions Report for the Madrid Forum (5 - 6 June 2019)
97 / 146
In scope of the study are workshops, published articles, studies, reports, assessments, data or any
activity related to detection, measurement and reduction of methane that is publicly available or
provided by relevant parties. Initiatives can be planned or completed and undertaken by various
bodies including initiatives such as the Methane Guiding Principles or CCAC OGMP; universities with
active and specific methane programmes; industry bodies; government research support
programmes; international institutions; or NGOs.
At the current time, 126 initiatives have been reviewed with an initial primary focus on
data/performance (61 in total), methane science (9) and technical application/good practice guidance
(27). Some effort has been taken to ensure these areas are as comprehensive as possible – although
no critique of the quality of the information has taken place. Other areas covered include advocacy
for gas, financial, innovation and technology and policy.
At the current stage, gaps have been observed in the following areas:
• Data: Measurement studies outside of onshore US; emission factors; verification standards.
• Technical: Industry best practice, although this is being addressed; abatement curves that are agreed by the oil and gas industry; non-US core sources, especially combustion.
• Science: Attribution and sinks.
• Technology: Summary of new and emerging technology and its applicability for reduction.
Note: whilst there has been some literature searching to complement the analysis the primary data
source is that provided by stakeholders.
MARCOGAZ
MARCOGAZ, the Technical Association of the European Natural Gas Industry, acknowledged the
importance to understand and quantify its emissions of methane (CH4) of European gas industry since
many years. Losses and leakages of gas from the European grids have long been recognised by
MARCOGAZ as a main subject of interest and technical solutions have been put in operation by the
Industry to mitigate its emissions of Greenhouse Gases along the gas value chain.
MARCOGAZ performed an evaluation on methane emissions of the European Transmission and
Distribution gas grids in 2015, using a “bottom-up” approach with network operational data from
2013. The MARCOGAZ network of technical experts is currently the most efficient way to collect
reliable technical data coming from the field and to perform an expert study based on these data at
European level.
In 2017, MARCOGAZ performed a second technical study to estimate the CH4 emissions from the 4
midstream activities. The initial study has been updated with emission data resulting from recent
measurements and evaluations and the scope has been enlarged to cover also the CH4 emissions from
LNG Terminals and from Underground Gas Storages facilities. The conclusion of the study is that
although its relatively low emissions of GHG, the gas industry continuously develops a proactive and
sustainable approach to manage adequately the gas infrastructure to provide its contribution to the
challenge of limiting climate change.
Methane emissions management is no longer exclusively a safety issue, but also became a
contribution to the climate policy.
MARCOGAZ identified a lack of harmonised guidelines and standards to identify, to quantify and to
report on the methane emissions. For this reason, MARCOGAZ is currently preparing a technical

Potential ways the gas industry can contribute to the reduction of methane emissions Report for the Madrid Forum (5 - 6 June 2019)
98 / 146
document, describing a simple method to assess and report the methane emissions of all European
Gas System Operators in a harmonised way. This document is expected to be ready in 2019 and could
be used by as technical base for a future CEN standard.
NGVA Europe
NGVA Europe has a “Zero Venting Target Policy” Working Group. The scope of the working group is to
collect information from Europe members regarding best practices, new solutions and technologies
to reduce venting operations at the gas fuelling stations and during vehicle operations. This also
includes comparison with current literature data. Fuel dispensing for CNG & LNG vehicles represent
respectively 9% and 20% of where methane emissions are being measured in the Well-to-Tank chain.
NOGEPA
On a quarterly basis NOGEPA meets with competent authorities to share expectations and initiatives.
To ensure for a critical external review and benchmark of the CH4 emission performance of the Dutch
offshore sector, NOGEPA/MACH10 engaged with EDF to exchange information on a regular basis. EDF
was also invited to provide input to the setup of the offshore CH4 measurement programme and to
join the research team during the experiments.
SEA\LNG & SGMF
In May 2018, SEA\LNG and SGMF commissioned a consultant to perform a comprehensive, industry-
wide Well-to-Wake (WtW) GHG emission analysis on the use of LNG as marine fuel. Special focus is
given to methane emissions. It is intended to be the definitive, reference study on the GHG emissions
associated with the use of LNG as a marine fuel – to this end it has involved the provision of primary
data from all major marine engine manufacturers and from the entire fuel supply chain. The study
was published in early April 2019. [44]
SIGTTO
SIGTTO is currently involved in a project93 with concerns methane emissions from LNG vessels. This
project aims to provide industry with the crucial measurement tools and the modelling necessary to
determine the impact which the LNG supply chain has on the environment. It will also help determine
the cost-effectiveness of methods to minimise emissions and reduce uncertainty across the supply
chain – with our focus clearly being on LNG shipping.
OTHER INITIATIVES
EDF - MethaneSAT
By 2021, EDF will launch MethaneSAT94, a satellite that can provide global, high-resolution coverage
of methane emissions from oil and gas facilities. By providing reliable, fully transparent data on a
worldwide scale, MethaneSAT will help transform a serious climate threat into a climate opportunity.
93 https://www.lngworldshipping.com/news/view,how-the-lng-industry-could-curb-its-methane-emissions_57185.htm 94 https://www.edf.org/climate/how-methanesat-is-different

Potential ways the gas industry can contribute to the reduction of methane emissions Report for the Madrid Forum (5 - 6 June 2019)
99 / 146
Figure 31: MethaneSAT
Source - EDF
Sentinel 5P
A precursor satellite mission, Sentinel-5P aims to fill in the data gap and provide data continuity
between the retirement of the Envisat satellite and NASA's Aura mission and the launch of Sentinel-
5. The mission will perform atmospheric monitoring and was launched in October 2017. The
operational lifespan is 7 years.
The mission objectives are to provide operational space-borne observations in support to the
operational monitoring of air quality, ozone and surface UV and climate.
Sentinel 5P provides measurements of ozone, NO2, SO2, formaldehyde, aerosol, carbonmonoxide, CH4
and clouds.
Copernicus
Copernicus is the European Union's Earth Observation Programme95, looking at our planet and its
environment for the ultimate benefit of all European citizens. It offers information services based
on satellite Earth Observation and in situ (non-space) data.
The Programme is coordinated and managed by the EC. It is implemented in partnership with the
Member States, the European Space Agency (ESA), the European Organisation for the Exploitation of
Meteorological Satellites (EUMETSAT), the European Centre for Medium-Range Weather Forecasts
(ECMWF), EU Agencies and Mercator Océan.
Vast amounts of global data from satellites and from ground-based, airborne and seaborne
measurement systems are being used to provide information to help service providers, public
authorities and other international organisations improve the quality of life for the citizens of Europe.
The main users of Copernicus services are policymakers and public authorities who need the
information to develop environmental legislation and policies or to take critical decisions in the event
of an emergency, such as a natural disaster or a humanitarian crisis.
In December 2017, the European Commission completed a large-scale study which analysed the
economic, societal and environmental benefits of the Copernicus programme depending on various
evolution scenarios. The study focussed on Europe only and covered the 2017 - 2035 period.
95 https://www.copernicus.eu/en

Potential ways the gas industry can contribute to the reduction of methane emissions Report for the Madrid Forum (5 - 6 June 2019)
100 / 146
ANNEX III - EXAMPLES OF REDUCTION OF CH4 EMISSIONS FOLLOWING
SAFETY RULES
Transmission
In Europe the performance of the gas industry to reduce leakages from e.g. steel pipelines above 15
bar given in the graph below96. In this graph it can be seen that primary failure frequency which reflects
the number of incidents per 1,000 km of pipelines decreases. The five-year moving average failure
frequency in 2016, which represents the average failure frequency over the past 5 years, equals 0.134
per year per 1,000 km.
Figure 32: Failures on transmission pipes (EGIG)
Source: EGIG [114]
Distribution
In Germany the rules are set by DVGW and included in the national regulation. These rules together form a holistic safety concept which has drastically reduced the amount of accidents and leaks, and therefore the emitted amount of methane.
The following quality requirements, among others, have been defined to reflect the high standards of the Set of Rules: Gas supply and gas application technologies. They are governed by stringent legal regulations such as the German Energy Industry Law (EnWG), the German High-Pressure Gas Pipeline Ordinance (GasHDrLtgV), the German Low Pressure Connection Ordinance (NDAV), and the German Model Building Regulations (MBO), in which observation of and compliance with the DVGW Set of Rules are anchored as generally recognised codes of practice and/or state-of-the-art technology.
The products used in gas engineering, service-providing companies, and the specialists/experts who are responsible for the technical acceptance tests are examined and certified. Only companies/individuals who have proved their expert qualifications are allowed to carry out construction, modification or maintenance work on gas pipelines and gas facilities. In addition, and for monitoring the compliance with the technical safety requirements stipulated by law and the Technical Rules, the DVGW provides the industry with guidance on practice-oriented Technical Safety Management (DVGW TSM).
Especially the following primary safety measures have proved to be successful:
• Pipeline design with a high safety factor (1.6);
96 EGIG website: https://www.egig.eu/
Potential ways the gas industry can contribute to the reduction of methane emissions Report for the Madrid Forum (5 - 6 June 2019)
101 / 146
• Installation of shut-off valves;
• 100 percent check of construction site weld seams;
• Hydrostatic tightness and strength tests of the pipe-line sections;
• Marking of the pipeline route with signposts;
• Passive and active corrosion protection;
• Checking of the protective sleeve by so-called intensive measurements;
• Short inspection intervals for surveillance on foot and by air;
• Inspection by modern pigging technologies;
• Tightness tests to determine the smallest of leakages.
The following additional safety measures, among others, are also applied:
Higher depth of cover;
Setting up of pipeline route warning tapes;
Hydrostatic stress tests.

Potential ways the gas industry can contribute to the reduction of methane emissions Report for the Madrid Forum (5 - 6 June 2019)
102 / 146
ANNEX IV – ILLUSTRATION OF SOME QUANTIFICATION METHODS ACROSS
THE GAS VALUE CHAIN
Upstream examples
Technical Guidance Documents (TGD) for methane emission quantification methods have been
established for each source of methane emissions by the gas industry thanks to global initiatives [24]
such as the CCAC OGMP.
TGD contains the various detection methods and quantification methods (calibrated vent bag, high-
volume sampler, vane anemometer, hotwire anemometer, turbine meter, acoustic leak detector). EF
values are also given, by type of equipment: valve, connector, open-ended line, pressure relief valve,
meter, and function to its use.
For well stimulation and fracking, the Guidance recommends direct measurement with a flowmeter
(vane anemometer, hotwire anemometer, turbine meter, orifice meter) and gives different EFs
depending on how the work is performed (with venting only, with flaring only, with reduced emission
completions).
Focus on Dutch Exploration and Production industry
In Netherlands, in 2017, the Netherlands Oil and Gas Exploration and Production Association
(NOGEPA) developed a methane emission reporting protocol, which is used by operators for formal
emission quantification and reporting, as part of the emission registration regime.
The protocol is based on the report “Cold venting and fugitive emissions from Norwegian offshore oil
and gas activities”, prepared for the Norwegian Environment Agency (2016) as well as a Dutch report
from Jacobs Engineering, prepared for the Dutch oil and gas sector (2001).
The protocol is as follows:
• Identification of all potential sources of methane emissions in the upstream O&G sector.
• Selection of relevant (potential) sources for each of their installations by operators.
• Identification of possible methods of quantification in order of preference depending on the
source, e.g. measurement, modelling, calculation based on emission factors. Where operators
use agreed emission factors, the protocol specifies the source of these factors.
• The methane flow routing is selected, e.g. flaring, venting, combustion in glycol regenerator,
exhaust etc.
With this protocol, methane emissions are quantified for each source and pulled together for
reporting.
Transmission and storage examples
To quantify methane emissions during natural gas transport and storage, measurements, calculations and estimations are used as in the following cases:
• Gas flow meters used to directly measure emissions from compressor dry gas seal vent.
• The methane released by the chromatographs calculated based on their sampling flow rate.

Potential ways the gas industry can contribute to the reduction of methane emissions Report for the Madrid Forum (5 - 6 June 2019)
103 / 146
• For pipeline vents during maintenance activities, methane emissions calculated using pipeline pressure at the beginning of the depressurisation, multiplied by the geometric volume of the pipeline considered.
• For maintenance purpose and in case of incident, a compressor may need to be depressurised. The methane emission volume is then equal (calculated) to the balancing pressure multiplied by the geometric volume of the pipelines related.
• For the compressor and associated pipeline system, a start-up venting must be performed. The gas emission is then equal to seven times the geometric volume of the vented pipeline system set by design.
• EF can be established by measuring emissions across a range of assets (flanges, valves…) during LDAR programmes. These on-site measurements are done in accordance with the international standard (method EN 15446 – FID) or, in some cases, by measuring the collected emitted methane gas (e.g. bagging method).
Distribution examples
On a methane distribution network, methane can be emitted by permeation, and operational and
incident emissions.
• Permeation emission: due to pressure conditions, natural gas migrates through strong
polymers of polyethylene films by a process of “dissolution diffusion”. EFs are pipe material
(polyethylene, steel, ductile iron…) and pressure specific. EFs are available in the scientific
literature [55] or calculated by sampling methods like leak flow capturing, suction, or pressure
decay. EFs are multiplied for example by the length of pipe, the pressure or the Standard
Dimension Ratio (SDR) of the pipelines.
• Operational emissions encompass network extension and renewal, service lines removal,
maintenance on pressure regulating stations. During operations on grids (lengthen,
renewal…), it is necessary to evacuate the natural gas contained in facilities before operation,
and after operation, to drive away air from the pipelines or facilities to replace it with natural
gas. The operator calculates typical volume of emissions relying on fluids mechanics equations
for each type of operation. It is then multiplied by a number of operations.
• Incident emissions: this category is divided into incidents from external responsibility (works
on water grids, malevolence…) and those entering in DSO responsibility (corrosion, scratch,
lighting). For incidental emissions, recording each incident with the key parameters, such as
time, pressure and hole size) allows to calculate the emissions of each event.
Focus on the full suction method: The full suction method is a quantitative leak flow measurement
technique, where the full methane release of a leak at a known location is captured and measured.
The method is typically used to capture the emission from a leak in a buried pipeline, e.g. by probes
which are put in the soil.
The method is suitable for measurement of small to medium size leaks in shallow buried pipelines
(typically less than 2 m depth) and of moderate to low pressure (typically 16 bar to 30 mbar).
Focus on a determination of NG flowrate in underground leakages detected by survey method
developed at distribution level

Potential ways the gas industry can contribute to the reduction of methane emissions Report for the Madrid Forum (5 - 6 June 2019)
104 / 146
Nedgia, the Spanish gas DSO, is currently conducting a test in collaboration with the University of
Zaragoza (Spain) to quantify the flowrate of the gas leaked in pipe sections where the existence of a
leak has been detected previously by LDAR methodology.
Once the leak is detected, the only available data is the methane concentration detected on surface.
But because of several variables like type of soil, weather and, wind, there is no precise correlation
between the concentration and flowrate of the natural gas leak.
The pipe sections with detected leaks are dug up and sent to LIFTEC laboratory (Area of Fluid
Mechanics of University of Zaragoza, Spain) where they are tested reproducing real conditions to
measure gas flow leakages. The number of tested samples could be representative for the emission
factors of the different elements of the network, considering material, diameter, operating pressure
and leaking element, (such as valve and welding).
This test aims to quantify the flowrate of natural gas on the pipe surface and specifically in the hole
that causes the leak, without taking into account the way that gas reaches the surface.
Results will be presented as a database that correlates a list of leaking elements with its properties
such as diameter and operating pressure, with a leakage flowrate average measured for samples that
fit with same properties/conditions.
In the future, once a leak is detected by survey, a more precise gas flowrate could be assigned by
means of this database based on similar measured and tested leaks.

Potential ways the gas industry can contribute to the reduction of methane emissions Report for the Madrid Forum (5 - 6 June 2019)
105 / 146
ANNEX V - GAS OPERATORS EXPERIENCE WITH LDAR (CASE STUDIES)
LDAR strategy for upstream operators
LDAR strategy implemented by upstream operators consists of their GHG emissions estimation
performed through a combination of approaches:
estimation based on sources inventory and application of emission factors;
field surveys to detect and quantify methane emissions.
While methane emissions from specific sources can be accurately estimated by measuring some
operational parameter (e.g. metering of flow rate and molar composition of fuel gas), to effectively
estimate and reduce leaks (fugitive emissions), field surveys are of paramount importance.
LDAR is the most efficient tool to manage fugitive emissions and can be implemented for a variety of
technical and operational solutions.
Most of LDAR practices in place are based on the use of devices able to detect methane emissions
(providing in some cases a concentration value, but without measuring directly a flow-rate); methane
emissions can then be calculated with specific emission factors linked with the specific detection
methodology used.
Companies may choose between different technologies for detecting methane emissions, however
the most widely used in the upstream chain are the following:
Optical Gas Imaging (OGI) campaigns based on the use of a handheld infrared camera able to
detect methane leaks above a set threshold; these inspections can be undertaken by a
dedicated gas thermography unit, or by third-party provider. IR-cameras play an increasingly
relevant and important role in complementing existing leak identification and control
methods; moreover, they allow to identify also big emitters potentially not easy to detect with
traditional devices (e.g. remote and not accessible equipment).
Portable leak detectors such as Flame Ionisation Detectors (FID) or organic vapour analyser
(OVA). These handheld instruments allow to measure very low concentrations of methane
leak in proximity of the equipment (valves, flanges, connectors, etc), that can be later
converted in a flow rate applying literature correlation equation or emission factors. This
methodology (EN15446 standard) can led to a more precise estimation but is more labour
intensive than OGI techniques.
Companies, according to a site-specific analysis, can set the frequency of the inspection (when not
dictated by regulator). OGI inspections are typically arranged with a higher frequency (e.g. annual)
than monitoring with handheld detectors. In addition, fixed detectors could be installed to monitor in
real-time the methane concentration within the plant.
However, companies can conduct, on a spot basis, facility-wide inspection campaigns not only to
identify fugitive emissions, but also measure the leak rate (represented in kg/year) using high-flow
sampling techniques. The results of these measurement activities can provide additional comfort
regarding the applicability/conservativeness of the OGI leak factors used for estimating methane
emissions.

Potential ways the gas industry can contribute to the reduction of methane emissions Report for the Madrid Forum (5 - 6 June 2019)
106 / 146
Norway
Leak detection and management in the context of offshore activities is an integrated component of
facilities design and operational philosophy.
Leak detection is carried out using a variety of technical and operational solutions, including e.g.
pressure monitoring in pressurised systems, stationary gas detection and regular inspection routines.
Stationary gas detection is typically implemented through the installation of IR detectors. Open path
/ line detectors are used to increase the detection probability of small leaks. Safety critical valves are
checked for leakages using nitrogen after actuation and shut downs.
At least once a week, routine safety inspections are performed onboard the installations, and this is
another opportunity to uncover deviations from normal situations, including gas leakages. Each
installation is required to define the interval for monitoring of fugitive hydrocarbon emissions,
maintaining a log for fugitive hydrocarbon emissions where leakages are described (e.g. % Lower
Explosive Limit (LEL), measured with handheld sniffers, leakage location, equipment tag numbers ...).
Necessary actions (corrective maintenance, limitation of nearby activities, shut-down, etc.) are
considered based on size and development of the leakage.
When the leakage has been repaired it is signed out of the log for fugitive emissions and tags are
removed. The log for fugitive hydrocarbon emissions is also updated after performed measurements.
Leakages above a specific threshold level are also registered and followed-up as safety incidents.
From a mitigation and control standpoint, leak detection is an integrated part of the facility design
and operating philosophy. In addition, installation-wide OGI (Optical Gas Imaging) inspections, are
now typically arranged on an annual-basis. These OGI inspections are undertaken by a dedicated gas
thermography unit, or by third-party providers procured via internal, specialist unit. OGI inspection
frequency (as a basis for emissions reporting) is dictated by the Norwegian regulator, and IR-cameras
play an increasingly relevant and important role in complementing existing leak identification and
control methods.
For onshore processing plants and refineries in Norway, leak detection, control and mitigation is also
paramount from a health and safety perspective, and many of the leak detection and reduction
tools/barriers described for offshore installations also apply at onshore facilities. In the last couple of
years, the use of IR cameras to support leak detection and repair has also been implemented for these
onshore facilities. Facility-wide inspection campaigns have been conducted by third-party specialists
to not only identify leakages, but also measure the leak rate (represented in kg/year) using high-flow
sampling techniques. This has allowed for comparisons to be made between calculated and measured
leakage volumes. The results of these measurement activities have provided additional comfort
regarding the applicability/conservativeness of the OGI leak factors used for reporting to the
environmental regulator.
Netherlands
Ultrasound detectors are used on the offshore platforms of oil and gas companies to detect small leaks
and immediately repair them. Small gas leaks generate a unique sound, much of which lies in the
ultrasonic spectrum.
By means of a specific detector, these small gas leaks can be detected from a relatively large distance
away (all gases can be detected, including natural gas, compressed air, nitrogen, etc.).

Potential ways the gas industry can contribute to the reduction of methane emissions Report for the Madrid Forum (5 - 6 June 2019)
107 / 146
Routine inspections of the site are carried out twice a year, and if possible, any detected (often
minimal) leaks are repaired immediately.
Furthermore, after every repair during which the gas system has been opened, a check is performed
on start-up to ensure that all connections are leak-free. In the event of a leak, immediate action is
taken. This frequently performed inspection method not only contributes to the safety of the
installations, but also minimises diffuse gas emissions, which results in a reduction in the emission of
greenhouse gases (in particular methane).
LDAR programmes are also in place at sites onshore, using infrared cameras to detect leaks and repair
them. This ensures compliance with the permit conditions.
LDAR strategy for gas transmission, LNG terminals and UGS
Depending on the maintenance program in place, the reduction of fugitive emissions with the
implementation of LDAR programmes may be significant97.
Leaks which exceed the concentration of the threshold limit value (that could also depend on permit
requirements) are detected and registered.
Gas companies usually use the SOCMI correlation factors (see EN 15446 “Fugitive and diffuse
emissions of common concern to industry sectors. Measurement of fugitive emission of vapours
generating from equipment and piping leaks”) to estimate and report its fugitive emissions because
of its’ a conservative approach.
Taking into account the complexity of the gas networks/facilities, (thousands of km, many gas stations
and other objects), gas companies which have implemented LDAR programme usually evaluate a part
of the gas network every year in order to complete the gas survey every 3-4 years (as an indicative
value).
Spain
Enagás has been carrying out LDAR campaigns since 2013 in its LNG terminals, underground storages,
compressor stations and the rest of the transmission facilities (regulation and metering stations and
valve positions). Since this year fugitive emissions have been reduced by 27%.
Figure 33: Enagás’ fugitive emissions (tCH4)
Source - Enagás
97 According to industry experience the fugitive emissions reduction could reach 40% in some situations (annex I – case studies).

Potential ways the gas industry can contribute to the reduction of methane emissions Report for the Madrid Forum (5 - 6 June 2019)
108 / 146
The analysis carried out with all data collected during these years showed that:
• Valves, which are also the most difficult to repair, are the main leaking components in LNG
terminals and underground storages. In LNG terminals leaking valves represent 40 % of
detected leaks and 58 % of detected emissions. Connectors are also components that are
likely to leak principally in compressor stations, regulation and metering stations and valve
positions. In compressor stations, 49 % of leaks were detected in connectors, while after
repairs the remaining leaks were higher in the components classified as "others" (mainly
flanges), as 99 % of leaks were repaired in connectors.
• The age of the installation is also an influencing variable. In general, there is an upward trend
for both emissions and number of leaks as the age increases, despite the fact that there are
some singularities in facilities under 5 years of age and in those built from 15-20 years ago.
• The frequency of the campaigns is also a determinant factor for reducing fugitive emission.
The more often measurements and repairs are made, the lower fugitive emissions will be
released. In this sense, LDAR campaigns have been internalised as part of the maintenance
programme of the company in order to increase campaign frequency and ensure continuous
improvement.
Poland
Surveys were carried out within four years on all compressor stations. During the surveys the
significance of fugitive emissions was realised. As it turned out, fugitive emissions can account for up
to 80% of overall compressor station methane emissions. The graph below shows distribution of the
largest emission sources of fugitive emissions from compressor stations.
Figure 34: Gaz-System largest emission sources of fugitive emissions from compressor stations
Source – Gaz-System

Potential ways the gas industry can contribute to the reduction of methane emissions Report for the Madrid Forum (5 - 6 June 2019)
109 / 146
The direct results of the LDAR campaigns were:
• Immediate reduction of emissions wherever it was possible;
• the change in the operational practice: time and number of compressors being in the hot reserve were reduced which helped to decrease fugitive emissions;
• the change in coefficients used for reporting emissions from compressor stations.
Emissions were measured mainly by the use of the Hi Flow Sampler device. As the next step in the continuous process of detecting and decreasing methane emissions an on-line method of detecting emissions is considered. Implementation of the on-line method may enable reporting more realistic emission levels as well as reducing the number of emission sources.
Italy
Gas network leak detection is carried out according to internal procedures that are applied during the commissioning of new pipelines / installations and during the operation of the existing assets, according to the maintenance plan adopted.
At the end of the pipeline commissioning a leak check of all above-ground components is performed using a gas detector and foaming liquid. Leaks are also checked in every vent of casing pipe using gas detectors. At the end of the pressurisation phase of new pipelines, a check of the stability of the pressure in the pipeline / plants is carried out. For new assets, within 3 months from commissioning, leak checks are carried out again, along the pipeline route with a wheeled detector and in the above ground installations and vent of casings using gas detectors.
During operations, on the occasion of each maintenance cycle carried out in above ground installations, leaks are checked with a portable gas detector or with a foaming liquid, and repaired.
Furthermore, leaks can be detected not only during the execution of the maintenance cycle, but also during the presence of the operators in the plant, as they are always equipped with gas detector; leaks will be detected and eliminated.
A LDAR programme is under implementation, with the following main specifications:
• Methane emission estimation with EN 15446 standard using appropriate correlation factors.
• Real measurement for significant emissions instead to use a fixed value (so called pegged value) independent from the real flow rate.
• Taking into account the complexity of the gas networks/facilities, (more than 30,000 km, several gas compressor stations, hundreds of reduction and regulation stations and many other gas facilities), as indicative value about 25% of the gas network is evaluated every year, in order to complete the survey every 4 years; this strategy is also applicable to all gas infrastructure including transmission network, compress stations, LNG terminals and gas storages sites.
LDAR strategy for gas distribution
The frequency of the LDAR programmes mainly depends on the gas pressure, even if additional parameters can be taken into consideration (e.g. number of leaks detected during precedent surveys in a certain section of the distribution network).

Potential ways the gas industry can contribute to the reduction of methane emissions Report for the Madrid Forum (5 - 6 June 2019)
110 / 146
Programming the leak survey to be carried out requires the choice of the most appropriate time periods and the selection of the areas to be surveyed, also the logistic should be considered, in order to optimise both the resources and the transfers from one area to another.
The most widely used technologies are:
As for vehicular leak detection, many technologies are used. Laser-based detectors constitute a widespread solution, also because they are selective to methane only and, thus, avoid false signals due to other gases. Alternatively flame ionisation and semiconductor detectors are employed.
Gas analysers based on cavity ring-down spectroscopy (CRDS) are an innovative option, with the advantage of allowing to measure even trace amounts of methane, to patrol at traffic speeds on the road, and to distinguish between piped methane and biogenic methane. As the vehicle is driven through an area acquired by an anemometer installed on the vehicle roof, provide information on the gas plume location. This allows to cover a detection area that can extend far away from the vehicle, thus measuring the gas leaks originating from the network components located in such area. The presence of wind is not a limitation if this technology is adopted.
Hand-held instruments are used in all the cases in which it is not possible to use a vehicle (e.g. narrow streets, pedestrian precincts, areas that vehicles cannot access, etc.). Such instruments are mainly flame ionisation, electrochemical or laser detectors. Also, in the case of the walking detection, the operator follows the pipe route along its axis as close as possible.
The successive phase, the leak pinpointing, is aimed at confirming the presence of the leak that has been detected and at accurately locating it. The operator measures methane concentrations in various spots, so as to be able to identify the leak origin. These measurements are conducted using the same hand-held instruments as for the walking detection.
Spain
Distribution network survey can be defined as the whole set of actions carried out by qualified staff,
using proper graphic information and means in order to detect and locate possible leaks on networks
and facilities, and, moreover, to make a visual checking on network surroundings to detect and assess
anomalies that could affect or damage grids and facilities. A layout of the network or delimited zone
that is being surveyed is required on digital files. Service lines are included. Detailed data of the
network is given, also accessories, depth and relevant distances.
Systematic leak survey will be performed on 100% of mains and service lines, according to the
periodicity shown in next table:
Table 14: Frequency to monitor leaks in distribution networks in Spain
PRESSURE CATEGORY FREQUENCY
MOP > 5 bar I 4 years
II 2 years
MOP 5 bar I - II 2 years
Category I: Rural or semi-rural zones Category II: Industrial, semi-urban or urban zones

Potential ways the gas industry can contribute to the reduction of methane emissions Report for the Madrid Forum (5 - 6 June 2019)
111 / 146
As exception, a higher frequency (every year) will apply to next cases:
• Sectors where a leak factor higher than 3 leaks/km has arisen during last survey.
• Grids within a sector made of a material with a leak factor higher than 5 leaks/km.
• Grids with MOP < 5 bar made of materials other than steel, PE or cast iron.
Leak detection is carried out in two stages. The first stage aims to locate approximately a possible leak. It is carried out by walking and taking samples of air on the surface. In the second stage, leaks are confirmed and accurately located. This can be done either immediately after location or within 10 working days. All approximate leak locations shall be confirmed accurately by means of drillings on surface, deep enough to pass through pavement and concrete base. The gas detector probe will be introduced into drillings in order to take samples.
In case of a leak, it will be classified depending on its location and the gas concentration detected.
• Level 1: leaks that require urgent repair: the ones that could lead to a dangerous scenario, due to either possible gas penetration into buildings or other confined spaces, caused by third party damages, or because of the possibility of causing intoxication, burning or explosion.
• Level 2: leaks with planned repair: the ones that are not dangerous and with a not so considerable leak rate (parameters below the ones for level 1).
• Level 3: Leaks with progress monitoring. Parameters below the ones for level 2.
Once a leak is classified as level 1, Control Centre has to be warned immediately. The survey staff that has detected the leak must remain in the leak location area. Civil and mechanical works will go on until the leak is put in safety. Leaks of level 2 will be planned and repaired before 3 months since detection. Leaks of level 3 will be monitored and repaired before 6 months since detection.
France
Systematic leakage survey by GRDF
In order to ensure industrial safety, the GRDF gas distribution network is monitored throughout the year by a systematic leakage search. This research is divided into two distinct methods: Pedestrian and Vehicular depending on the accessibility of the area by car. He periodicity depends on the sensitivity class assigned to each pipe and is defined from every 4 months to every 4 years. The annual planned monitored length is around 90,000 km (around 8,000 km for pedestrian survey and 82,000 km for vehicle survey) for a total GRDF network length of around 200,000 km.
When a leak is detected by the survey, and confirmed by the survey operator, an alert is sent to the operating office. The leak is classified in categories depending of the urgency to repair. In case of immediate action is needed, the emergency security office sends a specialised team for intervention. Every leak detected is reported in GRDF incident database with its characteristics (pressure, materials, under/over ground…) and is considered in GRDF methane emission evaluation.

Potential ways the gas industry can contribute to the reduction of methane emissions Report for the Madrid Forum (5 - 6 June 2019)
112 / 146
Figure 35: Example of a quantification methodology by a DSO (GRDF)
Source – GRDF [56]
Germany
All German DSOs should rely on the German Code of Practice G465-1, which states that all pipelines
should be monitored according to the frequencies indicated in the table below:
Table 15: Frequency to monitor leaks in distribution networks in Germany
Leak Frequency (per km) ≤ 0,1 ≤ 0,5 ≤ 1
Operating Pressure (bar) Monitoring Period in Years
≤ 0,1 6 4 2
> 0,1 bis ≤ 1 4 2 1
> 1 2 1 0,5
If DSOs find a leak, they should repair it according to the Code of Practice G465-3.
The classification of the leak depends on the distance from buildings. According to the class attributed to the leak, the repair time is determined. This varies between “immediately” and “according to repair plan”. Usually leaks are repaired before the winter.
Italy
Gas mains are periodically inspected in order to detect and repair the gas leaks, in compliance with the regulations issued by ARERA (the Italian National Regulator) and Guidelines No. 7 and 16 by CIG (national standardisation body for gas). According to such procedures, the survey must be carried out every 3 years on medium/high pressure networks (with a minimum of 30% of the network each year) and every 4 years on low pressure networks (p ≤ 40 mbar) (with a minimum of 20 % of the network

Potential ways the gas industry can contribute to the reduction of methane emissions Report for the Madrid Forum (5 - 6 June 2019)
113 / 146
each year). The survey can be carried out more frequently as a result of special agreements with the local administrations.
In 2018 Italgas Reti performed the leak survey on 83% of its total network (about 56,000 km).
The first step of the leak survey process, the leak detection, is conducted on gas mains with gas detectors either mounted on vehicles or hand-held.
As for vehicular leak detection, although Italgas Reti presently continues performing it using infrared diode laser technology and according to CIG Guidelines, a technological innovation has been recently introduced: cavity ring-down spectroscopy (CRDS).
Following the traditional procedures, the vehicles are equipped with an infrared laser cell on board, to which the air sample is conveyed by pumps through funnels located at the front bump of the vehicle. The operator must follow the pipe route along its length, not deviating much from its axis. A GPS (Global Positioning System) is installed on board, by means of which it is possible to record on the corporate digital maps the path and the instantaneous position of the vehicle and the locations of the gas leaks detected. Generally, leak detection must not be carried out if the road surface is wet, if snow, ice or frost is present and if the wind intensity is equal or greater than 4 Beaufort (moderate breeze).
As for the newly introduced CRDS technology, instead of strictly driving along the pipe routes, the operators must cover the whole area to be surveyed by driving, even more than once, in each street of the area. With CRDS wind does not hinder detection but, on the contrary, contributes to it.
Hand-held instruments are adopted in all the cases in which the vehicle cannot access the area. Such instruments are mainly electrochemical cell detectors.
The successive phase, the leak pinpointing, is carried out with a portable instrument, which measures methane concentration in the vicinity of the leak detected.
Classification of a leak is performed on the basis of the maximum methane concentration in the leak (% LEL) and on its distance from buildings and/or cavities. With the help of dedicated diagrams and tables published in CIG Guidelines, leaks are attributed to one of the following classes: A1, A2, B, C. According to its classification, a leak must be repaired before the following deadlines (starting from the pinpointing time):
• A1: within 24 hours;
• A2: within 7 days;
• B: within 30 days;
• C: within 6 months.
Anyway, immediate actions must be taken in order to eliminate any potential danger.
The number of leaks, classified by urgency of repair, are annually reported to the National Regulator.
The Netherlands
Every year, one-fifth of the entire gas distribution network is checked for leakages. Every pipeline is
therefore checked once every five years. This involves the use of a uniform leakage detection
procedure. The leaks found are divided into two categories:
• Class I: leakages with a high safety risk (larger leakages and all leakages close to the façade)
• Class II: leakages with a low safety risk (other leakages)

Potential ways the gas industry can contribute to the reduction of methane emissions Report for the Madrid Forum (5 - 6 June 2019)
114 / 146
Class I leakages are repaired as soon as possible. Class II leakages are scheduled for repair at a later
time in the year.
In the gas distribution, the replacement of old grey cast iron pipes contributes to the reduction of
methane emissions. There is a replacement programme for grey cast iron pipes (these have the
highest emissions factor).
Furthermore, there is a range of measures to keep the number of leakages in the gas distribution
network as low as possible. This varies from the application of standards (system, component,
material, competence) and certification to regulations for the prevention of excavation damage.

Potential ways the gas industry can contribute to the reduction of methane emissions Report for the Madrid Forum (5 - 6 June 2019)
115 / 146
ANNEX VI – DETECTION AND/OR QUANTIFICATION TECHNOLOGIES
The methane detectors, based on their application, can be divided into two main groups, portable and stationary. Regardless of the mentioned division,
detectors can vary due to the principle of operation. Different detectors have specific advantages and disadvantages that contribute to possibility and
justification of using them in different applications along the gas value chain.
The following table shows a description of technologies to detect and/or quantify methane emissions.
Table 16: Description of technologies to detect and/or quantify methane emissions
Device Description
Flame Ionisation Detectors (FID)
The operation of the FID type is based on the ionisation of the detected gas in the hydrogen flame that is generated inside the FID. It enables to detect the methane concentrations from very low levels (even 1 ppm), but on the other side reacts not only to methane, but to other hydrocarbons as well. These are the detectors prescribed by the EN 15446 standard.
Hi Flow Sampler (HFS)
The technique works by sucking in a large flow of air around the target component, if the flow is large enough all the methane that leaks out is also sucked in. The methane concentration in the airflow is determined by either catalytic oxidation or thermal conductivity depending on the concentration of methane. From the flow rate and the obtained data, the device calculates the methane leak rate for the component. The technique is highly suitable for investigating individual components. It is not usable for leaks with a large surface area such as landfills. The commercial device comes as a backpack and is easy to use.
Bagging Bagging refers to the isolation of a specific component or location to determine a fugitive or vented flow rate.
Infrared cameras
By using the infrared radiation, this type enables detection of the gas leaks from the distance (up to 100 meters, depending on the size of the leak). Hydrocarbon emissions absorb infrared (IR) light at a certain wavelength and an IR camera uses this characteristic to detect the presence of hydrocarbon gas emissions from equipment at an oil and gas facility. The IR camera operator scans the leak area in real time (user selectable for cold/hot temperature environments) and it is probably the fastest way to detect methane leaks within bottom-up approach.
Ultrasonic detectors
Ultrasonic detector detects the acoustic noise that is happening when leaks of gas exist. When using this type of detection, it is not possible to differentiate the type of the gas. However, this type of detectors should be quite independent from the ambient conditions (wind velocity, temperature). This technology works best in pipeline detection as in other process areas one could expect acoustic detection from sources other than leaks.

Potential ways the gas industry can contribute to the reduction of methane emissions Report for the Madrid Forum (5 - 6 June 2019)
116 / 146
Device Description
Laser detectors They enable selective methane detection from distance. The methane presence and concentration are realised by observing the absorption of the radiation (diode based) and there should be no impact from temperature and surrounding conditions
Catalytic bead sensors
When gas that is aimed to be detected goes through the catalyst it is combusted what heats up the catalyst and changes the resistance, which subsequently enables detecting of the searched gas. The catalyst poisoning may be an issue decreasing its reliability.
Semiconductor detectors
In the presence of the detected gas, the semiconductor’s resistance decreases due to the oxidation, or reduction, of the gas on the metal oxide surface. The method is not selective, as some other gases, such as ozone, VOC, may give false alarms.
Electrochemical detectors
Electrochemical detectors use the porous membrane through which the detected gas goes to the electrode on which it is either oxidised or reduced, resulting in the change of the electric current.
Cavity Ring Down Spectroscopy
Cavity Ring Down Spectroscopy is an optical laser-based method to quantify small amounts of gaseous species (here methane) in air. The air sample is placed between two mirrors and a laser pulse with the methane specific wavelength is introduced going between the mirrors. The decay time for the laser pulse depends on the methane concentration, and by measuring the decay the methane can be quantified. The methods come in different variations among the produces, but the method is generally very sensitive and capable of measuring methane down to the ppb level.
Radial plume mapping (RPM)
The system consists of a set of mirrors, a laser and a collection system. The mirrors are arranged in a computer determined pattern around the methane plume. For horizontal RPM the mirrors are all at the same height while for vertical RPM one or more mirrors are placed at a higher altitude. The laser is directed at the mirrors and the reflected beam is collected and analysed. The result of the analysis is a set of concentrations along the path of the laser. It is possible to calculate a concentration map with the data obtained through horizontal RPM. Vertical RPM is capable of calculating a methane flux with the extra data from mirrors at higher locations in combination with meteorological data.
Mobile gas chromatography (GC)
A GC works by injecting the sample and a carrier gas in a heated column. Compounds are separated by affinity column and at the end of the column the compounds are introduced to a detector. In the case of a flame ionisation detector (FID) the compound is ionised in a hydrogen flame and the ions are detected. The sensitivity of a GC-FID machine is around 0.1 ppm [57,58]. A thermal conductivity sensor (TCM) is also used as a sensor for GC machines. The TCM works by allowing the separated compounds to hit a heated surface, the change in temperature is detected and that is used to characterise the compounds [59, 60].
Chamber method/Flux box
The target area is divided in sub areas, a few of which are stochastically chosen. The actual measurement takes place in the chosen sub areas. A closed chamber with an outlet is placed on the subareas [61-64]. For the static flux box, the outlet is closed except for sample retrieval and methane is allowed to accumulate during the entire duration of the measurement. A sample is retrieved by taking a small amount of air via the outlet. The dynamic flux box has an open outlet, samples are taken from the outlet and the flowrate is determined. The collected air samples are sent to a lab for analysis. Static flux box is used when the flow rate is slow, if the gas accumulates too fast the static flux box method becomes unreliable since there is insufficient

Potential ways the gas industry can contribute to the reduction of methane emissions Report for the Madrid Forum (5 - 6 June 2019)
117 / 146
Device Description
time to obtain a good indication of the linear increase in methane concentration, under these conditions the dynamic flux box method should be used. The flux box method requires a large amount of measurements for better accuracy [61]. This method sees much use in studies that observe large areas such as agriculture studies.
Tracer gas release
One or more tracer gasses such as N2O and acetylene are released close to the methane leak. The methane concentration and the tracer gas concentrations are measured downwind of the plume. Sampling is generally done by driving along a road downstream of the release point and perpendicular to the wind direction with a vehicle equipped with an analysis system and an air collection system [65]. Another way of collecting and analysing samples is placing collection systems at strategic locations and analysing the contents afterwards in a lab. This is less accurate according to a previous study [66]. Under the right conditions the ratio of tracer gas and methane is the same as the ratio of tracer gas flux at the source versus methane flux at the source [65-68]. Using two tracer gases mitigates the problems arising from overlapping methane sources. Measuring at greater distances decreases the effect a misplaced tracer gas release has on the measurement [65-69]. Measurements on each side of the plume are used as the background methane concentration in the case of interfering methane sources in order to exclude the other methane sources [65-69]. A misplaced tracer gas can result in a significant increase of the deviation. The tracer flux method requires stable wind conditions as variations in wind speed also result in an increased deviation. Under good conditions the results that are reported have a deviation of less than 30% [65-71], with the best result only having a deviation of 2%. The worst result is an overestimation of a factor 3 and an uncertainty of 60% [66]. Several analysis systems have been used in combination with a tracer gas release. Used systems include cavity ring down spectroscopy (CRDS) tunable diode lasers (TDLAS), IR and quantum cascade lasers (QCL) [65-73].
Airborne matter measurement
This method uses an aircraft equipped with either a long-range laser spectroscopy system [74-76] or a sample collection system coupled to a detector [77-86]. The laser-based systems work by firing a laser at the target and collecting the radiation that is scattered by the ground and the air. The data is processed to obtain the average concentration of methane along the path of the laser. Generally, the limitation of these systems is that they only determine the concentrations. They are therefore mostly used to map concentrations and to find leaks. The air collection system coupled to an analysis system such as a CRDS64 relies on flying through a downwind plume and calculating the concentrations. The advantage over the sample collection and analysis system of the tracer flux method is that by analysing the air at different altitudes the accuracy can be increased. Unlike the laser method this system can give a flux for a methane leak. Averaged over several studies the deviation of the airborne matter measurement technique is 32%. The error of this technique is comparable to the tracer flux method.
Handheld laser measurement
A diode laser is shot back and forth through the measured area. The laser wavelength is tuned to the specific absorption of the target gas. From the absorption across the path length the concentration can be determined. In a static system this is done by a mirror, but it is also possible to use backscattering from the surroundings. In the second case, a rangefinder needs to be added to the system. Diffuse nature of backscattering by the environment does introduce an additional noise factor [88].
EPA 21 EPA-21 is a collection of four standard procedures for use in generating emission estimates. All of these techniques employ the bottom up method [89].

Potential ways the gas industry can contribute to the reduction of methane emissions Report for the Madrid Forum (5 - 6 June 2019)
118 / 146
Device Description
The approaches, in order of increasing refinement, are: Average Emission Factor Approach, Screening Ranges Approach, EPA Correlation Approach, and Unit-Specific Correlation Approach. More data is required for each subsequent procedure however the emission estimates for a process unit become more accurate. The average emission factor approach requires the least amount of information however it also gives the least accurate results. The required information is the amount of each type of component, what flows through it, how long it has been in service and the total organic compound (TOC) concentration of the stream. This information is used to find appropriate emission factors and the emission factors combined give the total emission of the facility. The inaccuracy of the method lies in the fact that no concentration data is known and the accuracy of the emission factors is unknown. The screening ranges approach requires the same information as the average emission factor approach but it also requires the concentration of methane per component in terms of above or below 10,000 ppmv. Below 10,000 ppmv the average emission factor approach is used however above 10,000 ppmv a different set of emission factors is used. The results are more accurate due to the possibility to differentiate components with a small leak rate and components with a large leak rate. The EPA correlation approach requires detailed concentration data in addition to the basic information required for other approaches. This approach no longer uses emission factors, instead it uses a set of equations with which it becomes possible to more accurately relate a measured concentration to a certain flux of methane. This technique is preferred over the screening ranges approach. The unit-specific correlation approach is the most complex method and it requires data on flow rates for a select number of components in addition to the data required by the EPA correlation approach. This flow data is used to make new correlation curves specific to the facility. These new correlation curves are then used to determine the flux per component in the facility in the same way as the EPA correlation approach.
Concentration data that is required is collected via handheld devices. The three most common detection principles used in these devices are ionisation, IR absorption or combustion. Flow rates are determined by enclosing a component in a bag with a small hole and the amount of gas that leaves the hole is measured [89] .
Full Suction Method
The full suction method is a quantitative leak flow measurement technique, where the full methane release of a leak at a known location is captured and measured. The method is typically used to capture the emission from a leak in a buried pipeline, e.g. by probes which are put in the soil. The method is suitable for measurement of small to medium size leaks in shallow buried pipelines (typically less than 2 m depth) and of moderate to low pressure (typically 16 bar to 30 mbar) [90-95].
Soap Bubble Screening
It is easy, quick and low cost to detect leaks with a soap solution. Soap bubble escreening consists to spray all the junctions with a mixture of water and soap (or with a specific commercial foaming product). All the junctions (even the junctions inserted in a coating) are targeted (the actuator of the valves, flanges, fitting, caps, insulating joints, …). It is necessary to stay a short time in front of each junction to watch the creation of bubble.

Potential ways the gas industry can contribute to the reduction of methane emissions Report for the Madrid Forum (5 - 6 June 2019)
119 / 146
Table 17: Technologies to detect and/or quantify methane emissions
Source – Elaborated by the authors

Potential ways the gas industry can contribute to the reduction of methane emissions Report for the Madrid Forum (5 - 6 June 2019)
120 / 146
Table 18: Illustration of technologies to detect and/or quantify methane emissions
Source - Danish Gas Technology Centre

Potential ways the gas industry can contribute to the reduction of methane emissions Report for the Madrid Forum (5 - 6 June 2019)
121 / 146
ANNEX VII - EXAMPLES OF INVOLVEMENT OF AUTHORITIES, ASSOCIATIONS AND OPERATORS IN EMISSION REPORTING
FOR NATURAL GAS
Region / Global Organisation / Initiative Brief Description
Global IOGP
Collecting environmental data from its member exploration and production (E&P) companies (every year since 1999). The objective of this programme is to allow member companies to compare their performance with other companies in the sector. The programme also contributes to the industry’s aim to be more transparent.
Global CCAC Oil Gas Methane Partnership (OGMP)
Technical Guidance Documents (TGDs) on each of the nine core emission sources covered by the Partnership. The guidance documents present suggested methodologies for quantifying methane emissions from each source and describe established mitigation options that Partners should reference when determining if the source is “mitigated.”
Global Methane Guiding Principles Methane Reducing Best Practices: practical guidelines to help companies reduce emissions; designed for front line operators across the natural gas value chain and with the support of leading academics.
Global Methane Guiding Principles Common methane reporting template: to simplify and streamline current external reporting systems, and encourage countries which are developing methane policies to adopt the same framework reporting structure.
Europe MARCOGAZ Best Practices for DSOs, TSOs, LNG terminal operators and underground gas storage operators to reduce methane emissions. Internal document for members only.
Europe GERG Development of an accurate and consistent method for methane emission estimation of the gas distribution grid to be used across all European Member States.
Europe GERG Evaluation of available methane measurement methods for TSOs.
Europe MARCOGAZ Development of European pre-standard for methane emissions assessment for DSOs/TSOs.

Potential ways the gas industry can contribute to the reduction of methane emissions Report for the Madrid Forum (5 - 6 June 2019)
122 / 146
Region / Global Organisation / Initiative Brief Description
Europe MARCOGAZ Methane emissions data collection, evaluation and reporting for DSOs, TSOs, LNG terminal operators and underground gas storage operators.
Europe EC / Hydrocarbons BREF
Best available techniques guidance document on upstream hydrocarbon exploration and production to manage the impact of released pollutants and best risk management techniques to manage risks of releases of substances for the purpose of protecting human health and the environment. Methane emissions are covered. Establish a list of best practices and so-called Best Available Technique Associated Emissions Level (BAT-AEL) for offshore/onshore installations.
EU National Emission Ceilings Directive (NECD)
A new National Emissions Ceilings (NEC) Directive (2016/2284/EU) entered into force on 31 December 2016. The National Emission Ceilings Directive sets national emission reduction commitments for 2020 and 2030 Member States and the EU for five important air pollutants: nitrogen oxides (NOx), non-methane volatile organic compounds (NMVOCs), sulphur dioxide (SO2), ammonia (NH3) and fine particulate matter (PM2.5), as well as a declaration by the Commission to further assess the impact of methane emissions and consider measures.
ECE Region The United Nations Economic Commission for Europe (UNECE)
Best practice guidance for methane management in the oil and gas sector.

Potential ways the gas industry can contribute to the reduction of methane emissions Report for the Madrid Forum (5 - 6 June 2019)
123 / 146
ANNEX VIII - METHODS FOR DETERMINATION OF METHANE EMISSIONS
OF THE GAS DISTRIBUTION GRID
Some methods for the calculation of methane emissions, applied by institutes, associations and companies in different countries.
Method of Battelle 1989/1994 [94-95]
Method of FH ISI 2000 [96]
Method of Stoller-DBI 2012 [97]
Method of British Gas / National Grid [98]
Method of GRDF/ENGIE98 [99]
Method applied by Naturgy99 [100]
Method of EPA [101]
Method of IGU 2000 / IPCC Guidelines 2006 [102]
Method per Sale of Natural Gas [103]
Method of MARCOGAZ 2005 [27]
Method of Ministry of Energy of the Russian Federation RD 153-39.4-079-01 determining gas consumption for technological needs for gas facilities and gas losses in gas distribution systems100 applied by the Russian Federation
It should be noted that the IPCC guidance is fairly broad and often less detailed than other reporting structures. For example, there are sometimes single methane emission estimates for operations based on throughput (i.e. fugitives, venting, and flaring emissions) in a single emission factor.
98 “GRDF/ENGIE is the ENGIE Group research and operational expertise centre dedicated to gas, new energy sources and emerging technologies.” [18] 99 Naturgy applies emission factors provided by Marcogaz and other studies. The only exception is for the polyethylene medium pressure networks, where emissions are estimated with emission factors determined by own measurements with pressure variation method (PVM). 100 Method applied by the Russian Federation http://gostrf.com/normadata/1/4294845/4294845315.pdf

Potential ways the gas industry can contribute to the reduction of methane emissions Report for the Madrid Forum (5 - 6 June 2019)
124 / 146
ANNEX IX – LIST OF ADDITIONAL STANDARDS
Other standards are available for use in particular countries/regions:
• A1000AS
• Advanced technologies promotion Subsidy Scheme with Emission reduction Target (ASSET)
• Airport Carbon Accreditation (ACA) des Airports Council International Europe
• Alberta Specified Gas Emitters Regulation (SGER)
• ASAE3000
• Attestation standards established by AICPA (AT101)
• Australian National GHG emission regulation (NGER)
• California Mandatory GHG Reporting Regulations (CARB)
• Canadian Institute of Chartered Accountants (CICA) Handbook: Assurance Section 5025
• CCX verification standard
• Certified emissions measurement and reduction scheme (CEMARS)
• Chicago Climate Exchange verification standard
• Compagnie Nationale des Commissaires aux Comptes (CNCC)
• Corporate GHG verification guidelines from ERT
• DNV Verification Protocol for Sustainability Reporting
• ERM GHG Performance Data Assurance Methodology
• European Union Emissions Trading System (EU ETS)
• ISAE 3000
• ISAE 3410
• ISO 14064-3
• Japan voluntary emissions trading scheme (JVETS) guideline for verification
• Korean GHG and energy target management system
• RevR6 procedure for assurance of sustainability report
• Saitama Prefecture Target-Setting Emissions Trading Program
• SGS Sustainability Report Assurance
• Spanish Institute of Registered Auditors (ICJCE)
• Standard 3410N Assurance engagements relating to sustainability reports of the Royal
Netherlands Institute of Registered Accountants
• State of Israel Ministry of Environmental Protection, Verification of GHG and emissions
reduction in Israel Guidance Document
• The Climate Registry's General Verification Protocol
• Tokyo cap-and-trade guideline for verification
• Verification as part of Carbon Trust standard certification
• Other: Code of Ethics for Professional Accountants, issued by the International Federation of
Accountants (IFAC)

Potential ways the gas industry can contribute to the reduction of methane emissions Report for the Madrid Forum (5 - 6 June 2019)
125 / 146
ANNEX X – CASE STUDIES ON REPORTING
US EPA Natural Gas STAR Methane Challenge Program
The Methane Challenge Program is a voluntary program founded in collaboration with U.S. oil and
natural gas companies. The program recognizes companies that make specific and transparent
commitments to reduce methane emissions. The program offers two commitment options (detailed
below); companies may join one or both commitment options.
The BMP commitment option focuses on implementing demonstrated, commercially available
emission-reducing technologies and best management practices (BMPs) across the partners’
operations within five years. Under this commitment option, partners commit to mitigate
methane emissions from one or more emission sources. Under these sources, partners select
one or more of the EPA-recommended BMPs to implement. The BMP option currently covers
13 emission sources from activities across the oil and natural gas value chain.
The ONE Future commitment option supports members of the Our Nation’s Energy Future
Coalition (ONE Future) partnership, who have agreed to segment-specific emissions intensity
targets that inform a collective goal of reducing methane emissions associated with the
production, processing, transmission, and distribution of the US onshore natural gas value
chain to 1% or less by 2025. This commitment option offers partner companies flexibility in
determining the most cost-effective pathway to achieve their respective segment emission
rate.
Annually, Methane Challenge partners report voluntary actions taken to reduce methane emissions
during the previous year. The Methane Challenge program uses calculation methodologies consistent
with Subpart W of the GHGRP and the US Greenhouse Gas Inventory. Methane Challenge partners
report electronically through US EPA’s GHGRP data system.
NOGEPA upstream gas reporting
The Dutch oil and gas sector have formal obligations to report methane (and other) emissions on an
annual basis. These obligations are specified in a covenant between authorities and the E&P industry.
The competent authority checks the implementation of emission registration systems by operators:
Operators use these emission registration systems to complete emission data in a web-based
reporting format, which are subsequently checked by this authority.
Following formal approval of the emission data by this authority, all data from the Dutch E&P
sector are transferred to the national authority, which compiles the national inventory reports.
These data are then also used for reporting to IPCC.
The methane emission reporting protocol is used for formal reporting to competent
authorities. NOGEPA published the protocol on its website, in order to increase the
transparency of methods applied by operators for CH4 reporting.
However, emission data reported by E&P operators to authorities are currently not accessible for the
public domain. This is caused by the structure and organization of the reporting mechanism. Although

Potential ways the gas industry can contribute to the reduction of methane emissions Report for the Madrid Forum (5 - 6 June 2019)
126 / 146
all CH4 data from the E&P sector is used as input for the national inventory report, that report does
not make a distinction between the oil and gas sector and other sectors – these data are reported with
other sectors under the heading “industry”. This led to an unintentional lack of transparency of
emission data from the E&P sector. Therefore, NOGEPA has decided to report environmental data
from the sector in an aggregated form on its website. The first publication is currently being prepared.

Potential ways the gas industry can contribute to the reduction of methane emissions Report for the Madrid Forum (5 - 6 June 2019)
127 / 146
ANNEX XI – CASE STUDIES ON BATS
Upstream
In its Communications on European energy security and on the exploration and production of Hydrocarbons (such as shale gas) using high volume hydraulic fracturing in the EU the Commission announced that it will organise an exchange of information to draw up a BAT reference document on Hydrocarbons exploration and extraction. Over the last three years, the representatives of Member States, NGOs and the industry have actively participated in the exchange of information. The Hydrocarbons BAT Guidance Document was published in April 2019. [20]
The techniques listed and described in the Guidance Document represent the best and most current techniques adopted in upstream oil and gas operations. The identification of best practice in the document is intended to serve as guidance for organisations engaged in hydrocarbons activities and for the regulatory/permitting authorities to draw upon when planning new facilities or carrying out modifications to existing facilities, planning changes and investments, as well as in permitting activities across the EU.
The Guidance Document outlines the BATs to address fugitive emissions. Among others, it is recommended that the Emissions Management Plan should provide the technical, commercial and environmental justification for the management of emissions, and should take into account reservoir characteristics including composition of fluids and likely variation over time (e.g. in water, H2S and gas-to-oil ratios). The level of detail of the Plan should be consistent with facility complexity, and may include the following elements:
Overarching goals for limiting flaring, venting and fugitive emissions during different operational phases operations, including exploration, appraisal, production and decommissioning;
Methodology for the assessment of methane, carbon dioxide and other facility emissions including baseload sources and non-routine sources, an estimation of these emissions, and justification for flaring limits requested from the Regulatory Authority through permits and consents;
Provision for assessment of flaring volumes during design, and reassessment of gas volumes throughout field life such that flaring targets can be continually reviewed and improved upon. For facilities which practice routine flaring, flare gas should be metered. For all facilities, including those which do not practice routine flaring, flare and vent gas should be measured/estimated.
Consideration of the type of flaring and venting design that provides the best environmental performance, and reduces emissions where possible, together with evidence demonstrating this.
For new facilities, the basis of design should be no routine flaring101. For all facilities, continuous flaring and venting for the disposal of associated gas should be avoided where viable alternatives exist. The Emissions Management Plan should include assessment of alternative uses of gas, such as:
Use for on-site energy needs;
Export to a neighbouring facility or to market;
101 This may not be possible to achieve in every case, e.g. reservoir uncertainties could materially change associated gas volumes, however it should be the starting point from a design perspective and operators should justify a deviation from this principle.

Potential ways the gas industry can contribute to the reduction of methane emissions Report for the Madrid Forum (5 - 6 June 2019)
128 / 146
Capture and injection for enhanced oil recovery (EOR); and/or
Carbon capture and storage (CCS).
Emissions Management Plan should include consideration of methods for controlling and reducing methane and carbon dioxide emissions in facility design and operations, and for implementing maintenance initiatives such as LDAR programmes as part of ongoing maintenance. Decisions around specific steps may make use of a risk-based approach to determine key sources, their consequences and the subsequent management measures that would deliver the most benefit.
GRDF (Gas Réseau Distribution France)
Excess flow valve is a valuable solution to improve security and to reduce methane emission for service
lines. In case of third-party aggression, the valve automatically stops the gas flow and the methane
emission.
Excess flow valves are installed by GRDF on new service lines since several years. In addition, they can
be installed to protect existing services lines in a very short time (around 30 minutes) and without any
excavation.
NEDGIA
Use of vacuum pressure pumps during commission of distribution networks.
The construction of a new network section and its commissioning releases methane during the process
of purging and pressurisation with gas. With the use of vacuum pressure pumps Nedgia completely
avoids methane emissions during the process of gas pressurisation in new sections of the distribution
network.
The main principle of the new methodology is to be able to purge air from inside of a new network
section without gas release.
Once the tightness test on a new network section is successfully ended, and before its commissioning,
the air is purged by using a vacuum pump. The pump extracts the air from the new section up to
absolute pressure less than 100 mbar (almost vacuum).
Then the valve connecting the new section to the operating network is opened. Pressurisation with
gas is performed without any gas release and commissioning is ready. Air content is less than 3 %, so
the mixture is totally safe.
This procedure is used or network commissioning aiming to avoid gas release to the atmosphere, thus
achieving following benefits:
To minimize environmental impact of the Distribution activity by reducing methane emissions
To reduce the hazard of commissioning during air purge by reducing the occurrence of a
flammable mixture.
EUROMOT
Primary, in-engine measures:
Since the beginning of the 1990´s, engine manufacturers have reduced the hydrocarbon (HC) emissions
substantially (by up to 50 %) through reducing the crevice volume in the cylinder, scavenging carrying
over of gas fuel and improving the combustion control systems (ignition stability, etc.) while
maintaining low NOx levels

Potential ways the gas industry can contribute to the reduction of methane emissions Report for the Madrid Forum (5 - 6 June 2019)
129 / 146
Secondary, after-treatment measures:
Secondary abatement techniques are needed for emission reductions beyond reach of primary
methods. As early as the mid of 1990´s, the stationary gas engine manufacturing industry started to
test and develop secondary CH4 abatement techniques. This on-going work has shown that many
technical problems still need to be solved before a feasible secondary CH4 abatement technique
suitable for all applications is available.
Oxidation catalysts:
Oxidation catalysts for removing methane from the exhaust gas of lean-burn gas engines suffer from
a poor reactivity due to the low exhaust temperature in combination with deactivation by sulphur in
the fuel gas.
Plasma process:
A pulse plasma generator in combination with a catalyst for simultaneous CH4 and NOx reduction in
exhaust gas from lean-burn reciprocating engines was tested at a research institute in the Netherlands
in 2009. The concept worked unsatisfactorily with a very low CH4 conversion at a price of a high
electrical efficiency reduction. In fact, the tests showed that overall more CO2eq emissions were
generated as CH4 destruction was not efficient enough. About 50 % extra CO2eq was emitted to remove
about 10 % CO2eq of CH4 due to the substantial decrease in electrical efficiency. Due to the poor test
results the project was stopped.
Afterburner:
In the year 2009 a research foundation in the Netherlands carried out tests with an afterburner to oxidize CH4 in the exhaust gas from a lean burn gas RICE. The test was done with a lean burn gas RICE with an output of 2.4 MWe and electrical efficiency of 43 %. The CH4 destruction in the tests was almost complete but the electrical efficiency penalty of the plant was in the order of 10 percentage points (43.5 % to 32.5 %) and calculations showed that more CO2-eq emissions (due to the extra fuel needed to heat up the flue gas) were produced than reduced by the CH4 destruction.
Recuperative thermal oxidizer
Several recuperative oxidisers are on the market. Some of them are originating from the painting
industry where these are used for VOC removal. The recuperative reactors are big in size (long heat up
time due to the large thermal inertia), heavy and expensive. Due to the high efficiency of modern lean
burn gas RICE, additional CH4 has to be added to the flue gas before the reactor. Alternatively, a burner
may have to be integrated into the reactor in order to maintain the heat balance. This results in high
operating costs. It is important to note that constant operation mode (base load) is required when
using a recuperative thermal oxidizer and thus it can be only used in certain applications. Thus these
systems are not suitable for interrupted operation mode applications such as peaking plants for firming
of volatile renewable electricity sources.
EUTURBINES
Use of Dry-gas seal (DGS): DGS is a technology for sealing centrifugal compressor rotating components
to reduce process gas leakage to the atmosphere, as compared to the commonly used wet seals. DGS
consists of three sealing systems: (1) the inboard seal provides the main process gas compressor seal;
(2) the outboard seal is identical to the first and provides emergency back-up if the inboard seal
becomes damaged; (3) seal in the cartridge – of a different type (labyrinth or carbon type) – and is
buffered with nitrogen or air to keep the cartridge free of oil contamination from the compressor

Potential ways the gas industry can contribute to the reduction of methane emissions Report for the Madrid Forum (5 - 6 June 2019)
130 / 146
lubricating oil system. Shaft seals are used to prevent process flow leakage to the atmosphere.
Additionally, compressor venting is not required during typical compressor shutdown of short
durations. Booster systems which maintain the “pressurise hold” condition of the compressor allow
for extended shutdown durations and minimise vented emissions
The fugitive emissions in centrifugal compressors are strongly affected by the size of the DGS, the
operating pressure, the operating speed and suppliers. The range of the leakages may vary from a
minimum of 10 Stdl/min to a max of 600 Stdl/min for centrifugal compressor casings in normal
operating conditions. For compressors used in gas pipelines, the typical range of fugitive emissions
would be from below 100 to 350 Stdl/min.
Vent recovery system: recovering otherwise vented methane from compressor stations and
recompressing it back into the pipeline or using it for other purposes by the operator.
Transformation of methane emissions into CO2: before being released into the atmosphere.
Maintenance activities: limiting vented emissions during pipeline or compressor station maintenance
activities.
Less commonly used/developmental solutions: for example, an Integrated Compressor Line system.
In that case, no wet or dry gas seals are used – and therefore no leakages – as it is based on a rotor
that is levitated by active magnetic bearings.

Potential ways the gas industry can contribute to the reduction of methane emissions Report for the Madrid Forum (5 - 6 June 2019)
131 / 146
ANNEX XII – CASE STUDIES ON INNOVATIVE TECHNOLOGIES
TOTAL
In early 2017, to measure concentrations of carbon dioxide and methane, Total has partnered with the French National Research Center (CNRS) to develop the Airborne Ultra-Light Spectrometer for Environmental Application, or AUSEA. This innovative device will allow to monitor facilities proactively and to minimize greenhouse gases emitted into the air around their various oil and gas sites
An Ultra-Efficient, Drone-Borne Miniature Sensor
AUSEA employs a miniaturized, diode laser-based sensor that is highly sensitive, reliable, accurate and fast. Compact and light — around two kilograms compared to 80 for conventional spectrometers — it will be adapted to be carried by a commercial drone. The airborne system will be able to assess emissions in real time, at very low thresholds, recording one measurement per second. It will be capable of measuring the two greenhouse gases, carbon dioxide (CO2) and methane (CH4), from time to time or regularly and of estimating their dispersion patterns. Researchers will be able to use the measurements to model gas dispersion in the immediate vicinity of a site.
A Model Scientific Partnership with the CNRS and a Cross-Functional Project at Total
To develop this ambitious four-year project launched in early 2017, Total is partnering with the CNRS (Centre National de la Recherche Scientifique) and its GSMA teams, a Reims University group specializing in molecular and atmospheric mass spectrometry.
The programme is also cross-functional at Total. It involves a dozen researchers who are experts in mechanical integration, optics, spectral analysis and atmospheric environmental modeling.
It’s a successful scientific partnership, which dedicated its first year to developing and field-testing the sensor to see how well it worked in a real-world setting.
A First Test Area in Lacq, France
A first round of testing was conducted in 2017 in Total’s facilities in Lacq, France, with a sensor installed initially on a tethered balloon and simulated leaks of various concentrations of gas. Further tests were performed in 2018 on a drone, to verify the aerodynamic impact of turbulence on the sensor. AUSEA will be tested at various oil and gas sites (refineries and oil and gas production platforms) prior to being deployed
Gazprom
Gazprom is constantly developing and implementing innovations for GHG emissions reduction for all
gas chain including downstream. For example, for conducting gas-dynamic testing and geophysical well
logging, without gas being released into the atmosphere Gazprom is widely putting to use a Mobile
Nitrogen Compressor Station (MNCS) for off-gas capture and disposal with the aid of inert gas during
the sweeping and pneumatic testing, the purging of process equipment, flare lines, process tanks,
pipeline repair works and operation, carrying out different process operations. The use of nitrogen
purge leads to gas consumption reduction for technical needs. The MNCS comes as container-type and
is suitable for operating in a variety of climatic conditions. In terms of design, the nitrogen station is a
self-contained unit mounted on the chassis or mobile base and consisting of the gas separation unit
based on hollow fiber membranes, a compressor and an air-preparation unit.

Potential ways the gas industry can contribute to the reduction of methane emissions Report for the Madrid Forum (5 - 6 June 2019)
132 / 146
5 CRITICAL REVIEW STATEMENTS
Florence School of Regulation - Andris Piebalgs
The report “Potential ways the gas industry can contribute to the reduction of methane emissions” is
an important contribution to aid in the understanding of the challenges of methane emissions
mitigation and how to address them within the gas industry. This is the first time gas companies across
the entire value chain combined data on methane emissions with insights from the industry. In
particular the report explored the ongoing and planned industry initiatives, experience with Leak
Detection and Repair campaigns, examples of Best Available Techniques and case studies on innovative
technologies.
Led by Gas Infrastructure Europe (GIE) and Marcogaz, this project was executed within a challenging
timeframe of roughly six months. The inclusion of information on the quantification of methane
emissions in biogas/biomethane plants is of great importance to the current discussions on the
decarbonisation of the gas sector. Moreover, we note that the authors of the report were open to
stakeholder feedback and undertook an effort to modify the text accordingly. However, we believe that
there is still room for improvement.
Firstly, the Executive summary in the current form fails to fully communicate the main messages of the
report, particularly the main measures on how the gas industry could contribute to the reduction of
methane emissions. Similarly, the estimates on the potential of future reductions are missing (what is
doable? at what cost?). Also, the table provides vague information on the industry’s future actions, in
particular, the objectives and deadlines for completion of these actions are missing. Furthermore, the
report explains the process of reporting of emissions at both EU and national levels very well but fails
to provide concrete information on the reporting of methane emissions at the corporate level. In
particular, reporting at the utilisation level covers only the transport sector, IOGP reporting covers both
oil and gas emissions without making any distinction, whereas the Marcogaz study covers less than
half of the EU’s distribution.
Secondly, we identified some gaps in the report: data on the emissions from utilisation part of the gas
value chain is missing, as is the data on the methane emissions stemming from the natural gas imports
and information on super-emitters could be more detailed. Emissions from flaring could also be
expounded on.
Thirdly, it would be helpful reflect on the impact of the current regulations at the EU level, as well as
the regulatory experience in other countries, which might be applicable in the EU.
We believe that the report is a promising start in presenting the industries actions in bringing down
methane emissions and it is important that the work be continued. It would be interesting to monitor
the industries’ actions after the publication of the report.
There are at least three areas where more reflection is needed. First, a significant part of methane
emission occurs before natural gas reaches the borders of the EU Member States and is consumed.
What impact can the EU make to minimise methane emissions occurring outside of its borders? Second,
the majority of methane emissions in the EU (around 2/3) stems from agriculture and waste. How could
the gas industry contribute to the mitigation of emissions from these sectors? Third, more work is
needed to better understand the emissions in utilisation.
In conclusion, we would like strongly emphasise the importance of the report in taking concrete action
to reduce GHG emissions.

Potential ways the gas industry can contribute to the reduction of methane emissions Report for the Madrid Forum (5 - 6 June 2019)
133 / 146
Sustainable Gas Institute - Paul Balcombe
Overall this report is an excellent contribution to our understanding of methane emissions from gas
supply chains, what is currently being done in industry and what should be the focus in the future. I also
find it to be a balanced reflection of the progress already made and an acknowledgement of how much
is left to do on this critical topic. I would classify this report as ‘nearly’ comprehensive, as there are a
few aspects that should be better emphasised, whereas there are several parts which could be
progressed further to add substantial value.
I have categorised my comments here based on: our understanding of methane emissions; measuring
and reporting; and reductions and targets. Note that this critique does not cover the presentation or
writing specifics, but on the content and its balanced representation.
Understanding
Whilst the report does a good job in detailing emissions as currently estimated, it should focus much
more on the uncertainty of our current estimates in Europe. It is clear that the current inventory is based
on variable and often insufficient estimation methodologies (e.g. using non-corroborated regional
emission factors), so the results of the emissions inventory must be described with this in mind. It must
be emphasised that the current inventory carries a high (and unknown) uncertainty, where emissions
could be substantially different from those presented here.
There is lots of focus on fugitive emissions, but less on venting and incomplete combustion. However,
these are vital and large contributors to total emissions. Whilst venting emissions may be estimated
simply, it should be noted that much work is required to determine the variability of flaring and
combustion efficiencies, which are the key drivers in methane emissions from incomplete combustion.
In the report, more emphasis could be made of the massive progress that has been made in
understanding and measuring methane over the last decade: great leaps have been made but the
industry is not uniformly progressing.
The description of top-down versus bottom-up methods could be more nuanced where top-down
methods now incorporate many scales, from source level, to facility, to large region. Bottom-up
methods are vital for emissions inventories whereas top-down methods could greatly help in
corroborating or improving bottom-up methods, especially with respect to identifying additional
potential sources.
Measuring and Reporting
The report does an excellent job of describing the different reporting actions currently being employed
in the industry. But I believe it is essential to describe more on what they involve, their public availability,
transparency and validation. With this information the reader is better able to judge what exists and
how we can improve on it.
If possible, the EU reporting estimation methodology should be explained further. You mention
criticisms, but what is the method and how could it be improved and validated? This would be
invaluable information again on how we can move forward, with better estimations and lower
uncertainties.
The key finding, that harmonisation is required for comprehensive estimation methodologies,
reporting, and validation, is vital. But which are the most appropriate methods that are currently used,
or is there an industry position on which methods are unacceptably poor methods? This report could
comment on whether any reporting methodologies cover effective estimation of all types of emission

Potential ways the gas industry can contribute to the reduction of methane emissions Report for the Madrid Forum (5 - 6 June 2019)
134 / 146
sources (i.e. vents, fugitives, incomplete combustion across all types of emission sources and supply
chain stages).
Reductions and Targets
Again, the report does an excellent job of synthesising the targets from industry. But some additional
analysis of these synthesised targets would be extremely useful in order to allow the reader to judge
how far they go or what their implications are. What would the targets mean in terms of the
environmental credentials of gas? This is perhaps too far for this report, but some additional analysis
of the aggregated targets would be useful. In particular, a graph of the targets against the timeline
would show the level of anticipated progression.
Whilst these targets and the efforts to reduce methane emissions are substantial, it is difficult to judge
how much of the gas industry within Europe that this actually represents. Clearly there is some variation
across the industry in different regions, as is already described, but how much? Are the companies and
targets described here just a small selection of ‘early adopters’ or is this the majority of the European
gas supply chain? This would be extremely useful in gaining an understanding of how the industry could
be brought in line with the best standards.
There is also little mention of the issue associated with imported gas and their associated embodied
emissions. Whilst Europe may control its methane emissions, what are the emissions associated with
imported gas, how are they controlled and how do we aim to avoid ‘carbon leakage’ via offshoring?
It is mentioned that there are several existing regulations that impact on methane emissions, but the
report does not explain this in any detail: it would be very useful to explain how these existing
regulations affect methane emissions from the gas supply chain to determine how additional measures
could fit.
Finally, there is an excellent brief description of methane reducing regulations across different non-EU
countries. In section 4.6.4, lessons learnt from existing regulation, this could be an extremely useful
commentary, but currently is very limited. This section should be added as a priority, given the useful
expertise and perspective of the authors.
Joint Research Centre – Ricardo Bolado
Before starting with a number of recommendations on how to improve the report, we would like to
acknowledge the impressive load of work taken by the authors, the huge collection of information done
and the synthesis work developed.
Recommendation on the content that should be adjusted, modified or further developed
We encourage the authors to clearly include the source of each figure/table in the report. In some cases
the source of the information shown is not clear. In case the figure/table has been elaborated by the
authors based on the data available in a literature reference, this should also be clearly explained.
Table 1 refers to types and sources of emissions. We find that the case of fugitive emissions for storages
could not be sufficiently developed. Storage facilities are located in complex geological formations that
may be affected by pressure changes, seismicity, etc. We think that some other sources of emissions
could be infrequent, but relevant, as for example preferential release paths (i.e.: fractures). This could
produce methane releases not so close to the location of the wells. It is not clear to us either how a
release related to a rupture in a pipeline (digging works, for example) is classified.

Potential ways the gas industry can contribute to the reduction of methane emissions Report for the Madrid Forum (5 - 6 June 2019)
135 / 146
Along the entire report the authors stress the magnitude and importance of uncertainties affecting
emissions reported. Nevertheless, with a few exceptions, such as Figure 6 on the global methane
budget, and section on top-down versus bottom-up quantification, actual uncertainties are hardly ever
reported. Reporting uncertainty ranges together with best estimate values as much as possible will
certainly help the reader to understand the actual magnitude of the uncertainties considered in each
case, and to put in the right context the best estimate provided (normally average or median). Figure 9
is a good example of the uncertainties reported in some scientific publications. The value given of
"observed fossil CH4 emissions" has an uncertainty range 2 ½ times the best estimate provided. Only
when uncertainties are quantified and reported, can its reduction be adequately estimated. We think
that adding uncertainty ranges (when available) to emissions reported in this document will improve
its quality.
Another issue we would like the authors to pay attention to is how representative presented data are.
In some cases this is done, indicating, for example, what fraction of the gas market has contributed to
the figures provided, but in other cases it cannot be deduced from the text. We would like to provide
two examples. The first one is related to the information reported on page 100 (ANNEX III). In this page
authors report about the effort done by the European industry to reduce leakages in steel pipelines
working at pressures above 15 bar. It would be convenient to mention explicitly either countries or
companies that are actually contributing to these periodic reports (EGIG). A significant fraction of EU
countries/companies do not contribute to it, thus conclusions about the trends on decreasing
frequencies of primary failures apply only to contributing entities. The same applies to the information
on table 6. Data are reported about LNG terminals, underground storage, transmission and
distribution. For example reference [36] indicates that the reported data corresponds to 34% of the
storage capacity of the EU. The problem is that the sample was not random or planned according to
some scheme; it was just the answer of the operators that filled-in the survey. It is important to keep in
mind that the type of storage (depleted gas field, aquifer or salt dome) may play a role. The same
applies to its age. If these factors are not taken into account, extrapolating results to other facilities
can be risky.
The glossary needs to be further developed. There are several terms that, if added, could improve the
comprehension of the report. Examples: Emission Factor is included in the glossary but Activity Factor
is not; the definition of GWP seems vague and the footnote 3 commenting the term GWP100 as well.
The definition found in IPIECA Methane glossary seems to be more complete and embrace both
definitions. A fast solution would be to refer to the IPIECA methane glossary as the reference glossary
to be used when reading this document and add only the few terms needed and not included in that
glossary.
The list of acronyms has also to be further developed. These are many terms used in the text that not
included in the list: EEA, IPCC, O&G, GRD, MOP, etc. I would also be convenient to add all units used in
the text.
The authors have done a huge effort of data and information collection. We are aware that they have
found information in very different reporting formats and using different metrics. Nevertheless, taking
into account the different background and perspective of the potential readers of this report, we think
it would be convenient to do the effort to provide selected emissions data, as much as possible, in two
different metrics: mass of methane (Gg?) emitted per unit of energy produced (typically MJ or GJ HHV),
and percentage of methane emitted (with respect to the total quantity involved in the process
addressed). We think this harmonisation wold help comparisons along the report. We are certainly
aware that this harmonisation has real limits.

Potential ways the gas industry can contribute to the reduction of methane emissions Report for the Madrid Forum (5 - 6 June 2019)
136 / 146
The available literature on methane emissions pays much attention to the importance of super-
emitters. Expressions such as 'a small x% of this type of facility contributes to a large y% of the total
emissions of this type of facilities' may be found in the literature (U.S., Canada, Russia, etc.). Super-
emitters are addressed formally in this report, but we have not found (or not been able to find) any
relevant information regarding the identification of actual super-emitters in the EU, even in aggregated
manner such as the expression used in the second sentence of this paragraph. Identifying efficiently
super-emitters and adopting adequate mitigation strategies would most likely be very efficient way of
reducing methane emissions. Has any relevant information on this issue for the EU (at least in
aggregated terms) been identified? Does the industry have any proposal on this issue?
Where the regulation and policies in non-EU countries are detailed, information about Algeria is
missing. In the Geneva workshop (March 27th), a presentation was given. If a real document was not
provided it would not be easy to provide a good summary, but if it was, it would make sense to report
on that information.
Recommendations on gaps and/or future action to be taken into account
Authors deliver a number of recommendations and conclusions as a result of the work developed. In
this area we would like to invite authors to think about
The issue of validation (not only harmonisation) of emissions identification and quantification
methodologies.
The more systematic combination of the bottom-up and top-down approaches to validate
methodologies.
The systematic reporting of uncertainties.

Potential ways the gas industry can contribute to the reduction of methane emissions Report for the Madrid Forum (5 - 6 June 2019)
137 / 146
6 GLOSSARY
Additional definitions can be found in the IPIECA methane glossary. [6]
Bottom-up emission estimate - Method of using ‘ground-based’ techniques to directly measure or estimate emissions at the facility level (e.g. well pad, compressor station) or the emissions source/activity level (e.g. compressor engine exhaust, storage tanks, equipment leaks). [6]
Detection Threshold - The minimum quantity or concentration of a gas (e.g. methane) which is detectable by detection equipment. [6]
Emissions factor - Factor relating activity data (e.g. tonnes of fuel consumed, tonnes of product produced, number of pneumatic controllers) to emissions. Emission factors generally take the form of the amount of emissions per activity unit, for example standard cubic feet of gas per hour (scf/hr) per pneumatic controller. Emission factors are typically developed based on a population of direct measurements of emission sources/activities. [6]
Equipment Leak Detection - The process of identifying emissions from equipment, components and other points by screening for, and detecting, fugitive emissions. A screening device may be used to screen a wide area to detect the presence of fugitive methane or vented methane, and a detection device can be used to identify a specific fugitive or vented source of leak. Note that most detection and screening instruments and devices (particularly handheld devices) do not quantify the volume or mass of the emissions. [6]
Flaring is the controlled burning of hydrocarbons produced during exploration and production operations. It includes the controlled and safe burning of gas that, for safety or technical reasons or for lack of export infrastructure, is not used or exported. [7]
Global Temperature Potential (GTP) - The ratio between the global mean surface temperature change at a given time horizon that is understood to follow an emission of an amount of gas relative to the same amount of carbon dioxide (CO2). [6]
• Global Warming Potential (GWP) - A factor which estimates the contribution to global warming of a given mass of a greenhouse gas species, relative to the same mass of CO2 over a particular time frame. [6]
• Infrared (IR) Camera - Refers to a device (camera) equipped with infrared sensors for detecting gases that have infrared absorption bands within the band-pass filter installed in the device. Includes Optical Gas Imaging (OGI) and forward-looking IR cameras. The camera can ‘see’ hydrocarbon-based equipment leaks as well as other compounds, e.g. steam. IR cameras detect leaks but do not quantify them. [6]
• Leak Detection and Repair (LDAR) - A programme to identify and repair the equipment or infrastructure that can be a source of fugitive emissions. While LDAR in certain jurisdictions can have a specific regulatory definition, it is more generally used to describe the processes and systems by which leaking equipment is identified, prioritized and then repaired. Within the LDAR programme, a variety of techniques can be employed such as the use of optical gas imaging cameras. [6]
• Measurement - The process of taking a reading of the methane concentration or methane emission rate within an air sample at a specific point in time. Typical units for a measurement would be parts per million (ppm), parts per billion (ppb) or kilograms per hour. [6]
• Methane emissions - A broad term to cover all releases of methane including planned and unplanned sources. [6] Types of methane emissions sources: Fugitive, vented and incomplete combustion.

Potential ways the gas industry can contribute to the reduction of methane emissions Report for the Madrid Forum (5 - 6 June 2019)
138 / 146
• Super-emitters - A term used to describe the concept that certain methane sources can represent a disproportionate amount of the total methane emissions released from all sources. The term ‘super-emitter’ can refer to malfunctioning equipment, particularly in unmanned installations where such equipment has the potential to exist for long periods of time. The determination of a super-emitter is best associated with emissions data from a given source and should not be viewed as an attribute of an entire site. Care should be taken when utilizing methodologies for identifying super-emitters to differentiate between episodic events (e.g. gas actuation events), erroneous measurements and/or malfunctioning equipment. The term ‘fat-tail’ is often used to describe the statistical representation of the data—a probability distribution that is highly skewed relative to a well-behaved distribution such as the normal or an exponential distribution. Having super-emitters at a few sites could skew significantly the distribution of emissions from a sample of sites. [6]
• Top-down emission estimate - Estimate made using different ‘aerial-based’ techniques to measure ambient air concentrations of methane, calculate methane flux based on atmospheric and meteorological conditions, and then attribute the emission portion due to different activities. Each measurement technique has different resolution capabilities, strengths and weaknesses. Methane emissions are allocated to the natural gas industry by: (a) using a ratio of methane to ethane or propane (longer chain aliphatics which do not occur from biogenic sources); (b) isotopic ratio analysis, using a co-located tracer (such as SF6 or C2H2); or (c) subtracting estimates of other sources of methane emissions such as, livestock, wetlands, agriculture, waste management, etc. together with background methane concentrations. [6]
• Quantification - Includes methods for determining the size of a methane emission source in terms of customary units of emissions rate, such as mass per time (e.g. kilograms per hour) or volume per time (e.g. standard cubic metres per hour). This can be accomplished by engineering estimations, direct measurement of the methane source, and from models that use ambient measurements and meteorological data to infer an emission rate. [6]

Potential ways the gas industry can contribute to the reduction of methane emissions Report for the Madrid Forum (5 - 6 June 2019)
139 / 146
7 LIST OF ACRONYMS
AF Activity Factor
AGI Above Ground Installation
BAT Best Available Techniques
BOG Boil-off gas
CCAC Climate and Clean Air Coalition
CCGT Combined Cycle Gas Turbine
CCS Carbon Capture and Storage
CDP Carbon Disclosure Project
CEN European Committee for Standardization
CH4 Methane
CHP Combined Heat and Power
CNG Compressed Natural Gas
CO Carbon monoxide
CO2 Carbon dioxide
CO2-eq Carbon dioxide equivalent
CRF Common reporting format
DSO Distribution System Operator
EC European Commission
EDF Environmental Defense Fund
EEA European Environment Agency
EF Emission Factor
EOR Enhanced Oil Recovery
EPA Environmental Protection Agency
EU European Union
FID Flame Ionization Detectors
GERG The European Gas Research Group
GHG Greenhouse gases
GIE Gas Infrastructure Europe
GMI Global Methane Initiative
GTP Global temperature change potential
GWP Global warming potential
HDV Heavy Duty vehicle
HFS Hi Flow Sampler
IEA International Energy Agency
IMO International Maritime Organization
IOGP International Association of Oil & Gas Producers
IPCC Intergovernmental Panel on Climate Change
IR Infrared
LCV Light commercial vehicle
LDAR Leak detection and repair
LNG Liquefied natural gas
MOP Maximum operating pressure
MRV Measuring, reporting and verification
NG Natural Gas
NGV Natural Gas Vehicle
NIR National Inventory Report
NOC National Oil & Gas Companies
OGCI Oil and Gas Climate Initiative

Potential ways the gas industry can contribute to the reduction of methane emissions Report for the Madrid Forum (5 - 6 June 2019)
140 / 146
OGI Optical gas imaging
OVA Organic vapour analyser
O&G Oil and gas
PCV Passenger Vehicle
PM Particulate matter
RDE Real Driving Emissions
REC Reduced emission completion
SDR Standard Dimension Ratio
SLCP Short-lived climate pollutants
SOV Shut-off valves
TSO Transmission System Operator
TTW Tank-To-Wheel
UGS Underground Gas Storage
UNECE The United Nations Economic Commission for Europe
UNFCCC United Nations Framework Convention on Climate Change
US EPA United States Environmental Protection Agency
VOC Volatile organic compounds
WLTP Worldwide Harmonised Light Vehicle Test Procedure
WTT Well-To-Tank
WTW Well-To-Wheel

Potential ways the gas industry can contribute to the reduction of methane emissions Report for the Madrid Forum (5 - 6 June 2019)
141 / 146
8 REFERENCES
[1] European Environmental Agency - Annual European Union greenhouse gas inventory 1990–2016 and inventory report 2018 (link); Trends and projections in Europe 2018 (link), Approximated EU GHG inventory: proxy GHG estimates for 2017 (link), Trends and projections in the EU ETS in 2018 and Recent trends and projections in EU greenhouse gas emissions (link)
[2] GCP MethaneBudget, 2016: methane emissions and sinks (link)
[3] IEA WEO 2017 - Commentary: The environmental case for natural gas (link)
[4] IEA WEO 2017 – Outlook for Natural Gas (link)
[5] SGI - Methane & CO2 emissions from the natural gas supply chain (link)
[6] IPIECA Methane glossary (link)
[7] IOGP Environmental Performance Indicators Report (link)
[8] IEA - Gas 2018 Analysis and forecasts to 2023 (link)
[9] EEA - Primary energy consumption by fuel (link)
[10] Methane emissions: choosing the right climate metric and time horizon. Paul Balcombe, Jamie F. Speirs, Nigel P. Brandon and Adam D. Hawkes (link)
[11] IGU – Understanding methane’s impact on climate change, 2017 (link)
[12] Modalities, procedures and guidelines for the transparency framework for action and support referred to in Article 13 of the Paris Agreement (link)
[13] Zavala-Araiza, D., Allen, D. T., Harrison, M., George, F. C. & Jersey, G. R. Allocating methane emissions to natural gas and oil production from shale formations. ACS Sustain. Chem. Eng. 3, 492498 (2015) (link)
[14] US National Academies of Sciences (NAS) Report - Improving Characterization of Anthropogenic
Methane Emissions in the United States
[15] Study Aims To ‘Reduce Uncertainties’ in Methane Emissions Measurements (link)
[16] Vaughn et al. (2018). Temporal variability largely explains top-down/bottom-up difference in
methane emission estimates from a natural gas production region, PNAS
[17] Alvarez et al. (2018). Assessment of methane emissions from the U.S. oil and gas supply chain,
Science
[18] Methane emissions in the Netherlands The Groningen field, 2018 - 308-5468-1-PB, Elementa
[19] Oil and Gas Methane Science Studies (link)
[20] Best available techniques guidance document on upstream hydrocarbon exploration and production, (9 April 2019) (link)
[21] Greenhouse gases - Part 1: Specification with guidance at the organization level for quantification
and reporting of greenhouse gas emissions and removals (ISO 14064-1:2006)
[22] Greenhouse gases - Part 2: Specification with guidance at the project level for quantification and
reporting of greenhouse gas emissions reductions or removals enhancements (ISO 14064-2:2006)
[23] Estimation of Air Emissions from the Canadian Natural Gas Transmission, Storage and Distribution
System, CANADIAN ENERGY PARTNERSHIP FOR ENVIRONMENTAL INNOVATION (CEPEI) Ontario,
Canada. Prepared by: Clearstone Engineering Ltd. 700, 900-6th Avenue S.W. Calgary, AB, T2P 3K2.

Potential ways the gas industry can contribute to the reduction of methane emissions Report for the Madrid Forum (5 - 6 June 2019)
142 / 146
[24] Oil and Gas Methane Partnership Technical Guidance Documents, CCAC and Oil & Gas Methane
Partnership (OGMP), 2016 (link)
[25] IEA (2013) World Energy Outlook Special Report: Redrawing the Energy -Climate Map and IEA
(2015) World Energy Outlook Special Report: Energy and Climate Change
[26] Intergovernmental Panel on Climate Change (IPCC), 2006. Direct Global Warming Potentials (Link)
[27] Eurogas-MARCOGAZ Joint Group Environment Health and Safety, „Methodology for Estimation of
Methane Emissions in the Gas Industry - Working Group on Methane Emissions, 2005
[28] Fugitive and diffuse emissions of common concern to industry sectors - Measurement of fugitive
emission of vapours generating from equipment and piping leaks (EN 15446)
[29] United Nations Framework Convention on Climate Change, 1992 (link)
[30] United Nations, 1998. Kyoto Protocol to the United Nations Framework Convention on Climate
Change (link)
[31] MARCOGAZ, Methane Emissions in the European Natural Gas midstream sectors (link), November
22, 2017.
[32] MARCOGAZ, Presentation "CH4 emissions report - Midstream - 2017" (Link)
[33] MARCOGAZ, Survey Methane Emissions for Gas Transmission in Europe (link), February 8, 2018
[34] MARCOGAZ, Survey Methane Emissions for Gas Distribution in Europe (link), February 8, 2018
[35] MARCOGAZ, Survey Methane Emissions for LNG Terminals in Europe (link), February 8, 2018
[36] MARCOGAZ, Survey Methane Emissions for Underground Gas Storage (UGS) facilities in Europe (link), February 8, 2018
[37] Lecomte T, de la Fuente FF, Neuwahl F, Canova M, Pinasseau A, Jankov I, Brinkmann T, Roudier S, Delgado Sancho L, Best Available Techniques (BAT) Reference Document for Large Combustion Plant Industrial Emissions Directive 2010/75/EU Integrated Pollution Prevention and control, European IPPC Bureau Joint Research Centre, JRC Science for Policy report, JRC107769, EUR 28836 EN, Dec 2017.
[38] Eggleston HS, Buendia L, Miwa K, Ngara T, Tanabe K (eds), 2006 IPCC Guidelines for National Greenhouse Gas Inventories, Prepared by the National Greenhouse Gas Inventories Programme, IGES, Japan, 2006.
[39] VGB/EURELECTRIC, European Wide Sector Specific Calculation Method for Reporting to the European Pollutant Release and Transfer Register, 2nd Edition, EURELECTRIC Report (Dépôt légal: D/2010/12.205/20), June 2010.
[40] United States Environmental Protection Agency, AP-42: Compilation of Air Emissions Factors, 5th edition, January 1995.
[41] Kristensen Per G, Jensen JK, Nielsen M, Illerup JB, Emission Factors for Gas Fired CHP Units < 25 MW, International Gas Research Conference, Vancouver, Canada, 2004.
[42] Tsupari E, Monni S, Pipatti R, Non-CO2 Greenhouse Gas Emissions from Boilers and Industrial Processes. Evaluation and Update of Emission Factors for the Finnish National Greenhouse Gas Inventory, VTT Research Notes 2321, 2005.
[43] Greenhouse Gas Intensity of Natural Gas Report, by Thinkstep for NGVA Europe, May 2017 (link)
[44] Life Cycle GHG Emission Study on the Use of LNG as Marine Fuel, by Thinkstep for SEA\LNG and SGMF (April 2019) (link)

Potential ways the gas industry can contribute to the reduction of methane emissions Report for the Madrid Forum (5 - 6 June 2019)
143 / 146
[45] IPIECA - Exploring methane emissions (link)
[46] Zero Routine Flaring by 2030 by The World Bank (link)
[47] FSR - How far should the new EU Methane Strategy go?, Maria Olczak and Andris Piebalgs (April 2019) (link)
[48] Guiding principles on Reducing methane emissions across the natural gas value chain (link)
[49] Comparisons of Airborne Measurements and Inventory Estimates of Methane Emissions in the Alberta Upstream Oil and Gas Sector, Matthew R. Johnson , David R. Tyner, Stephen Conley, Stefan Schwietzke and Daniel Zavala-Araiza, 2017 (link)
[50] Oil and Gas Methane Partnership (OGMP): Third-Year Report (link)
[51] Assessment of methane emissions from the U.S. oil and gas supply chain, Ramón A. Alvarez, Daniel Zavala-Araiza, David R. Lyon, David T. Allen, Zachary R. Barkley, Adam R. Brandt, Kenneth (link)
[52] Methane Emission Estimation Method for the Gas Distribution Grid (MEEM), 25-06-2018 (link)
[53] GIE, Key Messages on CH4 Emissions, 2018 (link)
[54] IGU, The Natural Gas Industry Methane Emissions Challenge, 2017 (link)
[55] Barroso et al. (2009). Evaluation of methane emissions from polyethylene gas distribution systems at medium pressure, Journal of Natural Gas Science and Engineering
[56] GRDF Quantification Papier for IGU in 2018 “DSO’s METHANE EMISSIONS CALCULATION METHODOLOGY”
[57] GC Analysis of Greenhouse Gases and Optional Headspace Automatic Sample Introduction, Shimadzu – accessed on 19 May 2016.
[58] System GC, Shimadzu – accessed on 19 May 2016.
[59] Thermal conductivity detector and gas chromatograph, Shimadzu – 30 September 2015.
[60] Microfabricated thermal conductivity detector for the micro-ChemLab™, 20 February 2007.
[61] Accuracy of vertical radial plume mapping technique in measuring lagoon gas emissions, 22 December 2014.
[62] Methane emissions from 20 landfills across the United States using vertical radial plume mapping, 14 December 2011.
[63] Evaluating the performance of the horizontal radial plume mapping technique for locating multiple plumes, 3 August 2012.
[64] Radial Plume Mapping: A US EPA Test Method for Area and Fugitive Source Emission Monitoring Using Optical Remote Sensing, 2008.
[65] Measurements of methane emissions from natural gas gathering facilities and processing plants: measurement methods, May 2015.
[66] Fugitive Methane Emissions from Landfills: Field, Comparison of Five Methods on a French Landfill, Antoine Babilotte; Thomas Lagier; Emmanuel Fiani; and Vincent Taramini, JOURNAL OF ENVIRONMENTAL ENGINEERING © ASCE / AUGUST 2010 / 777.
[67] Quantifying methane emission from fugitive sources by combining tracer release and downwind measurements – A sensitivity analysis based on multiple field surveys, 29 March 2014.

Potential ways the gas industry can contribute to the reduction of methane emissions Report for the Madrid Forum (5 - 6 June 2019)
144 / 146
[68] Quantification of multiple methane emission sources at landfills using a double tracer technique, 20 January 2011.
[69] Quantification of methane emissions from 15 Danish landfills using the mobile tracer dispersion method, 10 December 2014.
[70] Methane Emissions from Natural Gas Compressor Stations in the Transmission and Storage Sector: Measurements and Comparisons with the EPA Greenhouse Gas Reporting Program Protocol, 21 January 2015.
[71] Short-term landfill methane emissions dependency on wind, 8 February 2016.
[72] Measurements of Methane Emissions from Landfills Using a Time Correlation Tracer Method Based on FTIR Absorption Spectroscopy, 12 February 2000.
[73] Methane Emissions from Conventional and Unconventional Natural Gas Production Sites in the Marcellus Shale Basin, 29 January 2016.
[74] Picarro G2203 Analyzer, Picarro – accessed on 20 May 2016.
[75] Airborne measurements of atmospheric methane column abundance using a pulsed integrated-path differential absorption lidar, 11 October 2012.
[76] Airborne Raman lidar, 2 April 1996.
[77] Airborne Laser Infrared Absorption Spectrometer (ALIAS-II) for in situ atmospheric measurements of N2O, CH4, CO, HCL, and NO2 from balloon or remotely piloted aircraft platforms, 30 March 1999.
[78] The Tropical Forest and Fire Emissions Experiment: overview and airborne fire emission factor measurements, 22 September 2007.
[79] Aircraft-Based Measurements of the Carbon Footprint of Indianapolis, 22 August 2009.
[80] Airborne measurements indicate large methane emissions from the eastern Amazon basin, 25 May 2007.
[81] Airborne flux measurements of methane and volatile organic compounds over the Haynesville and Marcellus shale gas production regions, 2 June 2015.
[82] Aircraft-Based Estimate of Total Methane Emissions from the Barnett Shale Region, 10 April 2015
[83] High-accuracy continuous airborne measurements of greenhouse gases (CO2 and CH4) using the cavity ring-down spectroscopy (CRDS) technique, 17 March 2010.
[84] The IAGOS-CORE greenhouse gas package: A measurement system for continuous airborne observations of CO2, CH4, H2O and CO, 5 August 2015.
[85] Methane emissions estimate from airborne measurements over a western United States natural gas field, 23 July 2013.
[86] Using airborne technology to quantify and apportion emissions of CH4 and NH3 from feedlots, 23 November 2015.
[88] Standoff and Miniature Chemical Vapor Detectors Based on Tunable Diode Laser Absorption Spectroscopy, March 2010.
[89] EPA-21 24 - Protocol for emission leak estimates, EPA – November 1995.
[90] W.H.H. van Heugten, A.J. Kooiman, 2005: Kwantitatieve lekgrootte bepaling ondergrondse gasdistributie in Nederland.

Potential ways the gas industry can contribute to the reduction of methane emissions Report for the Madrid Forum (5 - 6 June 2019)
145 / 146
[91] Heyden, L van; W. Wessing, 1995: Methods to measure methane losses from distribution grids International Gas Research Conference, (1995).
[92] Weidener, H.: Leckmengenmessungan erdverlegten Rorhleitungender Ortsgasversorgung in den Niederlanden EEM GmbH, Dokumentation der Messergebnisse, (June 2005).
[93] B. Wikkerink, 2005: Kwantificering van methaanemissie bij aardgasdistributie in Nederland Kiwa report GT-050158.
[94] Schneider-Fresenius, W., et al., “Ermittlung der Methan-Freisetzung durch Stoffverluste bei der Erdgasversorgung der Bundesrepublik Deutschland-Beitrag des Methans zum Treibhauseffekt-”, Battelle Institut e.V., Frankfurt am Main, 1989.
[95] Giderakos, E., et al., “Methanfreisetzung bei der Erdgasnutzung in der Schweiz und Vergleich mit anderen Emittenten”, Battelle Ingenieurtechnik GmbH, Eschborn, 1994.
[96] Reichert, J., Schön, M., “Methanemissionen durch den Einsatz von Gas in Deutschland von 1990 bis 1997 mit einem Ausblick auf 2010”, Fraunhofer Institut für Systemtechnik und Innovationsforschung (FH ISI), Karlsruhe, 2000.
[97] Stoller Ingenieurtechnik, DBI, “Verbesserung der Treibhausgasemissionsberichterstattung im Bereich "Gas, Verteilung" durch Datenerhebung und Datenbereitstellung” Dresden, Leipzig, 2012.
[98] Boul, T. (National Grid), “Expert Interview”, 2015.
[99] Auchet, L. (Engie), “Expert Interview”, 2015.
[100] Barroso, J., Solis, J.M., Ballester, J., Pina, A., “Evaluation of methane emissions from polyethylene gas distribution systems at medium pressure”, Journal of Natural Gas Science and Engineering, pp. 144-153, 2009.
[101] U.S. Environmental Protection Agency, DRAFT Inventory of U.S. Greenhouse Gas 6 Emissions and Sinks: 1990 - 2013, Washington, DC, 2015.
[102] Picard, D., Ahmed, A.F.M., Gjerald, E., Nordrum, S., Yesserkepova, I., “2006 IPCC Guidelines for National Greenhouse Gas Inventories - Fugitive Emissions”, 2006 (link)
[103] National Centre for Emission Management (KOBiZE) at the Institute of Environmental Protection – National Research Institute, “Poland’s National Inventory Report”, Warschau, 2014.
[104] XTO Energy methane emissions reduction program, Sept. 6, 2018 (link)
[105] CHARM® – aerial leak tightness control (link)
[106] Reduction of methane emissions at measuring points in the natural gas grid, project Megan, DBI
communication, March 2018.
[107] Shell to set sector-leading emissions targets after investor pressure, Reuters, December 2018
(link)
[108] Greenhouse gas intensity of natural gas: Comparison of Additional Natural Gas Imports to Europe by Nord Stream 2 Pipeline and LNG Import Alternatives (link)
[109] GasNaturally, Factsheet on Methane Emissions (link)
[110] OIES, Methane Emissions: from blind spot to spotlight (link)
[111] EDF, Fueling a digital methane future (link)

Potential ways the gas industry can contribute to the reduction of methane emissions Report for the Madrid Forum (5 - 6 June 2019)
146 / 146
[112] Methane emissions from biogas plants, Methods for measurement, results and effect on greenhouse gas balance of electricity produced (link)
[113] Super-emitters in natural gas infrastructure are caused by abnormal process conditions; Daniel Zavala-Araiza, Ramón A Alvarez, David R. Lyon, David T. Allen, Anthony J. Marchese, Daniel J. Zimmerle and Steven P. Hamburg, 2017 (link)
[114] EGIG report; 10th EGIG report, March 2018 (link)
[115] Energiforsk report 2015, Measurements of methane emissions from biogas production – Data collection and comparison of measurement methods (link)
[116] BIOSURF, Recommendations for the adaptation of the RED GHG calculation methodology (link)
[117] BIOSURF, Assessment of GHG reduction potentials due to the use of animal excrements and organic waste streams as biogas substrates and the replacement of industrial chemical fertilisers by digestate (link)
[118] BIOSURF, Calculation of GHG emission caused by biomethane (link)
[119] Directorate General for Energy (European Commission), EU Energy in Figures – Statistical Pocketbook 2018, ISBN 978-92-79-88736-9, Sep 2018.