Potential of In-Motion Charging Buses for the ... 6_4_21.pdf · Potential of In-Motion Charging...
16
Journal of Earth Sciences and Geotechnical Engineering, vol.6, no. 4, 2016, 347-362 ISSN: 1792-9040 (print version), 1792-9660 (online) Scienpress Ltd, 2016 Potential of In-Motion Charging Buses for the Electrification of Urban Bus Lines Fabian Bergk 1 , Kirsten Biemann 1 , Udo Lambrecht 1 , Prof. Dr. Ralph Pütz 2 and Hubert Landinger 3 Abstract Electric buses can help to reduce energy consumption, greenhouse gas emissions, pollutants and noise. One possible electric bus concept is the in-motion charger. As a combination of a trolleybus and a battery electric bus, the in-motion charger is able to operate relevant stretches in battery mode and therefore the amount of installed catenary wires can be significantly reduced. As a part of the German ‘Mobility and Fuels Strategy’ [2], the aim of the article’s underlying work was to identify possible applications for the in-motion charger. This included a comparison of the environmental and economic performance of the different traction systems of urban buses (in-motion charger, opportunity charger, overnight charger, fuel cell hybrid and diesel buses). The analysis focused on an urban bus line, running with articulated buses and is covering the whole lifespan of vehicles and infrastructure. The analysis showed that in a lifetime perspective all electric systems can significantly reduce greenhouse gas emissions compared to buses fueled with fossil diesel. But even until 2025 the diesel bus will be the most economic bus technology under the assumed framework. In comparison with other electric buses, the in-motion charger is the most cost-effective bus system for high capacity lines. Keywords: electric mobility, buses, environmental impact, economic analysis. 1 ifeu – Institut für Energie- und Umweltforschung Heidelberg GmbH. 2 Department of mechanical engineering, HAW Landshut, Landshut. 3 Ludwig-Bölkow-Systemtechnik GmbH.
Transcript of Potential of In-Motion Charging Buses for the ... 6_4_21.pdf · Potential of In-Motion Charging...

Journal of Earth Sciences and Geotechnical Engineering, vol.6, no. 4, 2016, 347-362
ISSN: 1792-9040 (print version), 1792-9660 (online)
Scienpress Ltd, 2016
Potential of In-Motion Charging Buses for the
Electrification of Urban Bus Lines
Fabian Bergk1, Kirsten Biemann
1, Udo Lambrecht
1, Prof. Dr. Ralph Pütz
2
and Hubert Landinger3
Abstract
Electric buses can help to reduce energy consumption, greenhouse gas emissions,
pollutants and noise. One possible electric bus concept is the in-motion charger.
As a combination of a trolleybus and a battery electric bus, the in-motion charger
is able to operate relevant stretches in battery mode and therefore the amount of
installed catenary wires can be significantly reduced. As a part of the German
‘Mobility and Fuels Strategy’ [2], the aim of the article’s underlying work was to
identify possible applications for the in-motion charger. This included a
comparison of the environmental and economic performance of the different
traction systems of urban buses (in-motion charger, opportunity charger, overnight
charger, fuel cell hybrid and diesel buses). The analysis focused on an urban bus
line, running with articulated buses and is covering the whole lifespan of vehicles
and infrastructure. The analysis showed that in a lifetime perspective all electric
systems can significantly reduce greenhouse gas emissions compared to buses
fueled with fossil diesel. But even until 2025 the diesel bus will be the most
economic bus technology under the assumed framework. In comparison with other
electric buses, the in-motion charger is the most cost-effective bus system for high
capacity lines.
Keywords: electric mobility, buses, environmental impact, economic analysis.
1 ifeu – Institut für Energie- und Umweltforschung Heidelberg GmbH.
2 Department of mechanical engineering, HAW Landshut, Landshut.
3 Ludwig-Bölkow-Systemtechnik GmbH.

348 Fabian Bergk et al.
1 Introduction
Public transport buses play an important role in urban mobility. Already today
buses are reducing transport greenhouse gas emissions due to the shift from
private cars. But for the long term goal of a climate neutral economy also public
transport has to abandon fossil fuels and switch to renewables. The direct usage of
electricity is the most energy efficient way of using renewable power.
Therefore electric buses are again on the agenda of decision makers (e.g. reflected
in Hamburg’s goal to stop the purchase of conventional buses in 2020): They can
help reduce energy consumption, greenhouse gas emissions, pollutants and noise.
Furthermore, they can support the introduction and integration of renewable energy
sources and thus promote a diversification of energy sources. One possible
electrification option is the In-Motion Charger (IMC). In contrast to a conventional
trolleybus with electric auxiliary unit the battery of an IMC has a considerably
higher capacity. This allows the IMC to operate relevant stretches in battery mode.
Therefore the amount of installed catenary wires can significantly be reduced.
Goal of the study as part of the German ‘Mobility and Fuels Strategy’ [2] was to
identify possible applications of the IMC and the resulting IMC’s environmental
benefit. The main steps were an in-depth analysis of the environmental and
economic performance of the different electric bus systems (IMC, opportunity
charger, overnight charger, fuel cell battery hybrid and diesel buses) followed by
two workshops with stakeholders to identify usage and acceptance constraints.
2 Method
The comparison of the environmental performance is based on a detailed Life
Cycle Assessment (LCA) (see figure 2). The functional unit is a bus kilometre or a
passenger kilometre. The analysis focused on the production and the use phase of
the bus. The global warming potential (CO2-eq) is calculated including the
emissions of carbon dioxide, methane and nitrous oxide. The assessment of
pollutants is focusing on nitrogen oxide (NOx) and particle mass (PM) emissions,
which are currently most debated in respect to the compliance with European air
quality standards.

Potential of In-Motion Charging Buses for the… 349
Figure 1: Schematic of LCA approach [7]
2.1 Use case
The drivetrain concepts are compared for an articulated bus (length ~18 m) on an
urban line with an annual mileage of 60,000 km. These buses are widely used in
Germany, particularly on lines with high passenger demand. The characteristics of
the use case are chosen to represent an average German urban line with a length of
15 km in easy urban traffic (Standardised On-Road Test cycle (SORT) 2). Bus
intervals from 15 to 4 minutes are examined which leads to a line capacity from
560 to 2,100 passengers per hour and direction (pphd). The technical details of the
buses are shown in table 1:
Table 1. Technical parameters of compared electric bus concepts (articulated buses).
Power train parameter IMC OC ONC FC
Battery capacity kWh 70 150 400 30
Power (engine, power electronics) kW 250 250 250 250
Average charging power kW 250 80
Fuel cell power kW 160
Hydrogen storage kg 35
IMC = In-Motion Charger, OC = Opportunity Charger, ONC = Overnight
Charger, FC = Fuel Cell Hybrid
Electric bus systems need proper infrastructure, but economic (lean) infrastructure
and operational performance are often a trade-off. For this study, the infrastructure
has been dimensioned after intense discussions with technology suppliers and
public transport consultants.

350 Fabian Bergk et al.
Table 2. Energy supply infrastructure for different electric bus systems, example for 7.5
minute interval (15 buses/ line)
Infrastructure Scale Number
IMC Catenary (two-sided) 7.5 km
(50 % of the line)
Substation 750 kW 4
OC Fast charging point
(including substation)
300 kW 4
Charging point depot 25 kW 15
Substation depot 400 kW 1
ONC Charging point depot 100 kW 15
Substation depot 1.5 MW 1
FC Hydrogen refuelling
station
Middle sized
station
25 % degree of capacity
utilization
IMC = In-Motion Charger, OC = Opportunity Charger, ONC = Overnight
Charger, FC = Fuel Cell Hybrid
2.2 Energy consumption
The total consumption of the different power train concepts reflects the following
losses and consumers:
The energy of the engines to provide traction energy,
the energy for the operation of auxiliary equipment (e.g. heating),
the losses in the provision of energy (e.g. in charging infrastructure) and
the losses in the vehicle (e.g. charging and discharging of batteries, losses
in power electronics).
The energy consumption without heating/ air-conditioning was determined by
Belicon GmbH at HAW Landshut using extensive measurements on different
buses (see http://belicon-forschung.jimdo.com/). The consumption of heating or
air-conditioning of electric buses could not be determined from measurements as
this would have required year-long testing in different climatic conditions.
Moreover, the majority of the vehicles measured were equipped with chemical
auxiliary heaters, which are not part of the case study. Therefore, the consumption
for heating/ air-conditioning had to be modelled. Major data input for modelling
were:
The Test Reference Years (TRY) of the ‘Deutscher Wetterdienst’4;
The heating/ air-conditioning energy need of a bus as a function of the
temperature difference between outside and inside5;
the efficiency of a heating/ air-conditioning system consisting of a
combination of a heat pump and a heating resistor dependent on outside
temperature and heating/ cooling demand.
4 see http://www.dwd.de/DE/leistungen/testreferenzjahre/testreferenzjahre.html?nn=507312
5 www.spheros.de/Media/Documents/3680/ HVAC%20in%20E-Bussen.pdf

Potential of In-Motion Charging Buses for the… 351
2.3 Emission factors (exhaust and upstream emissions of energy carriers)
Tailpipe emissions of conventional buses are calculated using the ‘Handbook
Emission Factors for Road Transport (HBEFA, version 3.2)’ database. The use
phase emissions of electric buses are determined by the electricity production. The
electricity production mix is based on work of the AG Energiebilanzen6,
Bundesverband Erneuerbare Energien (German Renewable Energy Federation)7
and Fraunhofer Institut für Solare Energiesysteme (Fraunhofer Institute for Solar
Energy Systems)8. Future electricity mixes are based on the Leitstudie 2011’s
‘Scenario A’ [1]. The calculated emission factors for electricity production include
the emissions of power plants and the supply of the primary energy carriers.
Table 3. Upstream emissions for different energy carriers
CO2-eq [g/kWh] NO2 [g/kWh] PM10 [g/kWh]
Year Diesel El H2 Diesel El H2 Diesel El H2
2015 58 584 381 0.14 0.62 0.33 0.01 0.16 0.03
2025 62 355 175 0.14 0.44 0.14 0.01 0.08 0.01
EL = Electricity
2.4 Production emissions
To determine the environmental impact of bus production an LCA model for
buses with different power train concepts has been developed. For the comparison
of the different technologies the buses have been broken down into their essential
components, as shown in figure 3.
The component approach allows for individual accounting of vehicles with
different drive concepts. The LCA model contains detailed information for each
component in respect to material input, production energy and transportation
effort. The background data to for the material upstream-emissions is taken from
the ecoinvent database (version 3.1).
6 Working Group on Energy Balances, http://www.ag-energiebilanzen.de/4-1-Home.html
7 http://www.bee-ev.de/english/
8 https://www.ise.fraunhofer.de/en?set_language=en

352 Fabian Bergk et al.
Figure 2: Schematic representation of the LCA model for bus production
In this work the emissions of the infrastructure could only be estimated roughly, as
there is a lack of primary data on this topic. However, the available data show that
the emissions for the construction of electric bus infrastructure should not exceed
80 g CO2-eq/Bus-km [3].
2.5 Cost analysis
The Life Cycle Costs (LCC) of an urban bus line comprises vehicles,
infrastructure, replacement, drivers, energy as well as service and maintenance
costs. All costs are calculated with the annuity method and an interest rate of 5 %.
In the standard case, a 12 year service life and a 5 % residual value are considered.
The assumed vehicle costs are calculated from the component’s cost. Therefore,
the derived costs are independent of the current market situation. The projection of
future component costs is derived from learning curves, see table 4 for batteries
and fuel cells.
Table 4. Battery and fuel cell costs (nominal in €, 2015)
Source 2015 2020 2025 2030
Battery €/
kWh
2015: expert guess Prof. R. Pütz
Development 2015 – 2030: [6]
1,000 784 684 622
Fuel
cell
€/
kW
[4]:
‘Production-at-Scale’-Scenario
1,161 609 542 432
The infrastructure is depreciated of the whole lifespan and then has a residual
value of zero. Maintenance costs are assumed to be 2 % of the investment costs.
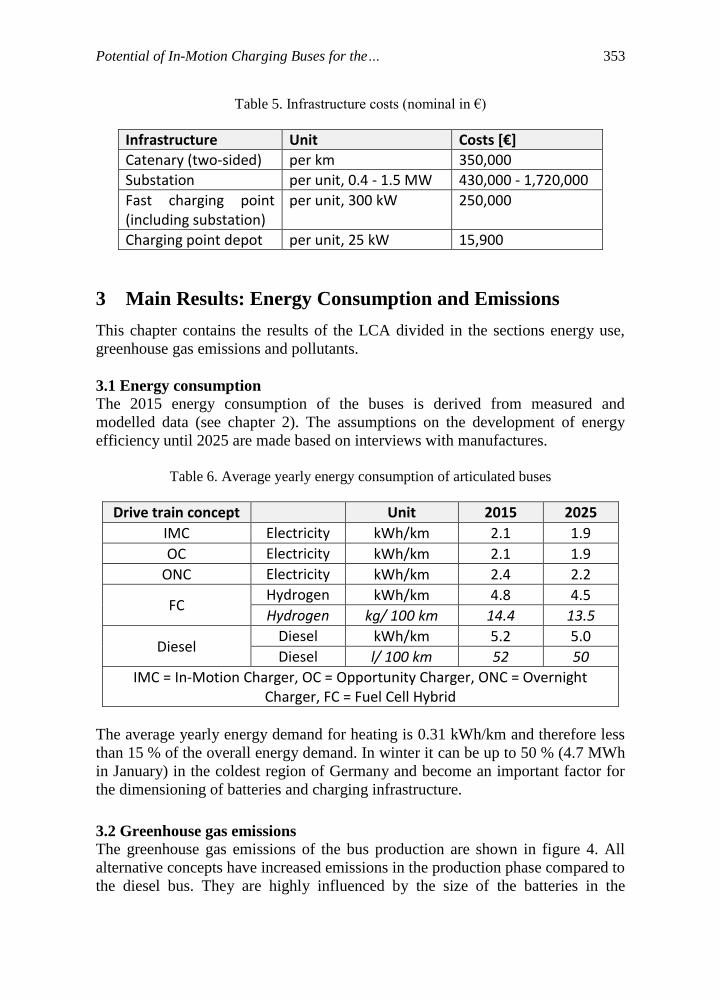
Potential of In-Motion Charging Buses for the… 353
Table 5. Infrastructure costs (nominal in €)
Infrastructure Unit Costs [€]
Catenary (two-sided) per km 350,000
Substation per unit, 0.4 - 1.5 MW 430,000 - 1,720,000
Fast charging point (including substation)
per unit, 300 kW 250,000
Charging point depot per unit, 25 kW 15,900
3 Main Results: Energy Consumption and Emissions
This chapter contains the results of the LCA divided in the sections energy use,
greenhouse gas emissions and pollutants.
3.1 Energy consumption
The 2015 energy consumption of the buses is derived from measured and
modelled data (see chapter 2). The assumptions on the development of energy
efficiency until 2025 are made based on interviews with manufactures.
Table 6. Average yearly energy consumption of articulated buses
Drive train concept Unit 2015 2025
IMC Electricity kWh/km 2.1 1.9
OC Electricity kWh/km 2.1 1.9
ONC Electricity kWh/km 2.4 2.2
FC Hydrogen kWh/km 4.8 4.5
Hydrogen kg/ 100 km 14.4 13.5
Diesel Diesel kWh/km 5.2 5.0
Diesel l/ 100 km 52 50
IMC = In-Motion Charger, OC = Opportunity Charger, ONC = Overnight Charger, FC = Fuel Cell Hybrid
The average yearly energy demand for heating is 0.31 kWh/km and therefore less
than 15 % of the overall energy demand. In winter it can be up to 50 % (4.7 MWh
in January) in the coldest region of Germany and become an important factor for
the dimensioning of batteries and charging infrastructure.
3.2 Greenhouse gas emissions
The greenhouse gas emissions of the bus production are shown in figure 4. All
alternative concepts have increased emissions in the production phase compared to
the diesel bus. They are highly influenced by the size of the batteries in the

354 Fabian Bergk et al.
respective electric bus concept. But also fuel cell hybrid buses have significant
higher emissions due to vehicle production. The higher emissions of the fuel cell
bus are mainly due to the Carbon-Fibre-Reinforced Polymer (CFRP) used in the
hydrogen tank and platinum used in the fuel cell. More efficient production
processes for CFRP, the use of electricity with a higher share of renewable energy
and a higher share of recycled platinum could reduce these environmental impacts
in the future.
Figure 3: Greenhouse gas emissions per produced bus in 2015; IMC = In-Motion Charger,
OC = Opportunity Charger, ONC = Overnight Charger, FC = Fuel Cell Hybrid
For the sum of production and use phase all electrified concepts have lower
greenhouse gas emissions than the diesel bus (see figure 5). With an increasing
share of renewable energy in the electricity mix, the use phase emissions’ benefit
will increase to almost 40 % for the IMC and the opportunity charger. Overnight
charger and fuel cell hybrid buses have significantly higher emissions due to
higher production emissions and lower efficiency. Infrastructure construction
emissions are negligible.

Potential of In-Motion Charging Buses for the… 355
Figure 4: Production and in-use greenhouse gas emissions of different bus concepts in
2015; IMC = In-Motion Charger, OC = Opportunity Charger, ONC = Overnight Charger,
FC = Fuel Cell Hybrid
Comparing the situation with newly registered buses in 2015, all 2025 buses can
increase their greenhouse gas advantage against the fossil fuelled diesel bus. This
is partly due to improved components (batteries and fuel cells), but mainly due to
the raising share of renewables in the energy mix. In contrast, the diesel bus has a
slight increase in emissions due to a raising share of unconventional oil.
Figure 5: Production and in-use greenhouse gas emissions of different bus concepts in
2025; IMC = In-Motion Charger, OC = Opportunity Charger, ONC = Overnight Charger,
FC = Fuel Cell Hybrid
3.3 Nitrogen oxide and particle mass emissions
It is expected that NOx and PM emissions of diesel buses will decrease with the
introduction of the Euro-6 standard, but electric buses are already local zero
emission vehicles. This is in particular relevant, as the EU air quality directive

356 Fabian Bergk et al.
(Directive 2008/50 / EC ‘Clean Air for Europe’) is violated in many cities in
Germany.
Figure 6: Nitrogen oxide emissions for different drivetrain concepts in urban buses;
IMC = In-Motion Charger, OC = Opportunity Charger, ONC = Overnight Charger,
FC = Fuel Cell Hybrid
But zero local emissions in total are overcompensated by higher upstream
emissions, which, however, mainly arise outside the urban areas. The electricity
production (particularly for the electric buses in the use phase) could still lead to
higher background pollution. Until 2025 the electricity mix is becoming cleaner
and the environmental impact of battery production is decreasing (see figure 8).
Figure 7: Particle emissions for different drivetrain concepts in urban buses; IMC =
In-Motion Charger, OC = Opportunity Charger, ONC = Overnight Charger, FC = Fuel
Cell Hybrid
Potential of In-Motion Charging Buses for the… 357
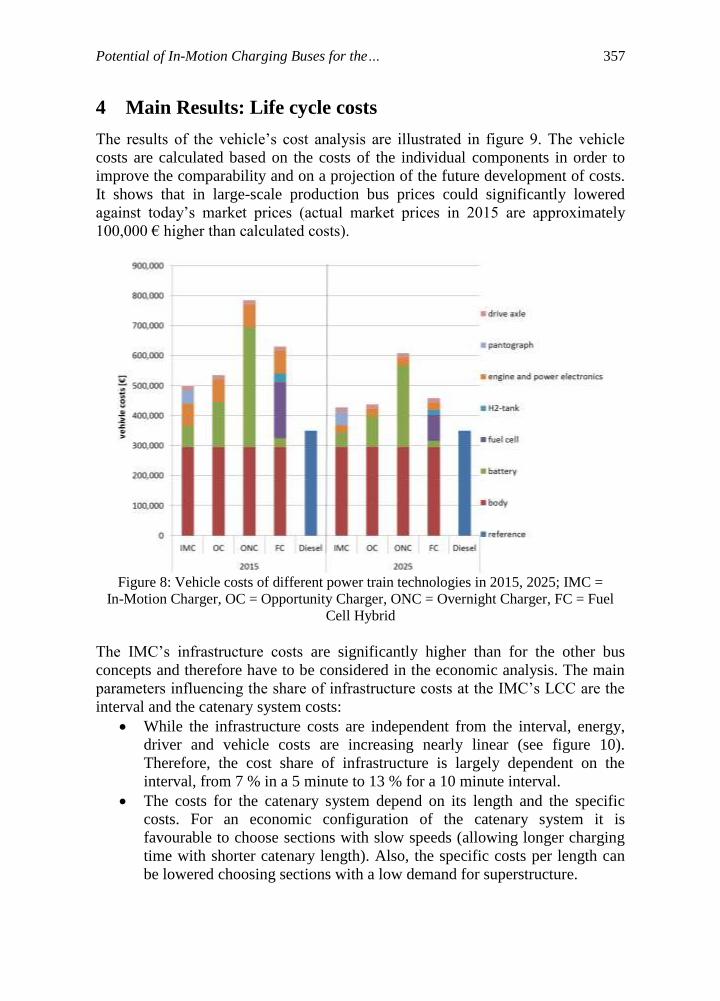
4 Main Results: Life cycle costs
The results of the vehicle’s cost analysis are illustrated in figure 9. The vehicle
costs are calculated based on the costs of the individual components in order to
improve the comparability and on a projection of the future development of costs.
It shows that in large-scale production bus prices could significantly lowered
against today’s market prices (actual market prices in 2015 are approximately
100,000 € higher than calculated costs).
Figure 8: Vehicle costs of different power train technologies in 2015, 2025; IMC =
In-Motion Charger, OC = Opportunity Charger, ONC = Overnight Charger, FC = Fuel
Cell Hybrid
The IMC’s infrastructure costs are significantly higher than for the other bus
concepts and therefore have to be considered in the economic analysis. The main
parameters influencing the share of infrastructure costs at the IMC’s LCC are the
interval and the catenary system costs:
While the infrastructure costs are independent from the interval, energy,
driver and vehicle costs are increasing nearly linear (see figure 10).
Therefore, the cost share of infrastructure is largely dependent on the
interval, from 7 % in a 5 minute to 13 % for a 10 minute interval.
The costs for the catenary system depend on its length and the specific
costs. For an economic configuration of the catenary system it is
favourable to choose sections with slow speeds (allowing longer charging
time with shorter catenary length). Also, the specific costs per length can
be lowered choosing sections with a low demand for superstructure.

358 Fabian Bergk et al.
Figure 9: Costs per IMC bus line in 2015, 2025 for different intervals
Today the IMC has additional costs compared to a diesel bus of about 495,000 €
per line and year for a ten minute interval (22 % cost difference per capacity).
Compared to other electric buses, it is the most economical bus for below ten
minute intervals (more than 1,100 pphd) (see figure 11).
Figure 10: Costs per capacity in 2015; IMC = In-Motion Charger, OC = Opportunity
Charger, ONC = Overnight Charger, FC = Fuel Cell Hybrid

Potential of In-Motion Charging Buses for the… 359
IMC’s higher infrastructure costs can be compensated through lower vehicle
demand and lower vehicle costs compared to overnight and opportunity chargers.
Higher vehicle demand in case of overnight and opportunity chargers derives from
following aspects:
The overnight charger’s higher battery mass is reducing the payload
leading to a lower capacity per bus. Therefore more vehicles and drivers
are needed. As the driver is the largest cost position in operating a line
with at least 39 % share of total costs, higher driver demand can
significantly lower economic performance. In 2015 the capacity costs for
the overnight charger are twice as high as for the IMC (10 minute interval/
92,000 pphd).
The opportunity charger requires sufficient turnaround time to ensure
minimum charging even under heavy traffic conditions. [5] shows that in
the example of the City of Münster for about 40 % of the lines this leads to
an increase in the scheduled turnaround time. This can lead to a higher
number of vehicles and drivers needed for a line (see figure 12). In
addition to the results shown in figure 12, three additional minutes
turnaround time could lead to additional costs compared to the IMC of
92,000 € per year in a ten minute interval in 2015.
Figure 11: Additional costs of the opportunity charger (OC) compared to the IMC
dependent on extra turnaround time for the OC in 2015 and 2025
With advances in battery technology (costs, energy density) until 2025 the LCC
per capacity for the different electric concepts is converging (see figure 13).

360 Fabian Bergk et al.
Technologies without trackside infrastructure (fuel cell hybrid, overnight charger)
are remaining more expensive than those concepts with trackside infrastructure
(IMC, opportunity charger). For a wide range of possible use cases, the costs of
IMC and opportunity charger are becoming almost equal. Urban design aspects
and operational performance are becoming more important. The IMC will stay the
most economical electric bus concept for high capacity until 2025.
Figure 12: Costs per capacity in 2025; IMC = In-Motion Charger, OC = Opportunity
Charger, ONC = Overnight Charger, FC = Fuel Cell Hybrid
5 Potential of In-Motion Charger Buses
In this chapter the results of the analysis are mirrored to the situation of public
transport in Germany. The chapter will give a short overview about mitigation
obstacles for the IMC and current trends in the public transport sector.
5.1 Economic situation
Funding for public transport is severely limited in Germany; especially the
municipalities are not in a position to transact larger investments. Therefore, local
public transport remains on the status quo, as long as investments are not funded
in large parts by the federal states and/ or the federal government. In almost all
counties there are already incentive programs for electric buses. For the economic
viability of the IMC the inclusion of the infrastructure in these programs is crucial.
The economics of IMC are much more attractive, if compared to a tram instead of
a diesel bus. This has to be seen in the light of the ongoing establishment of
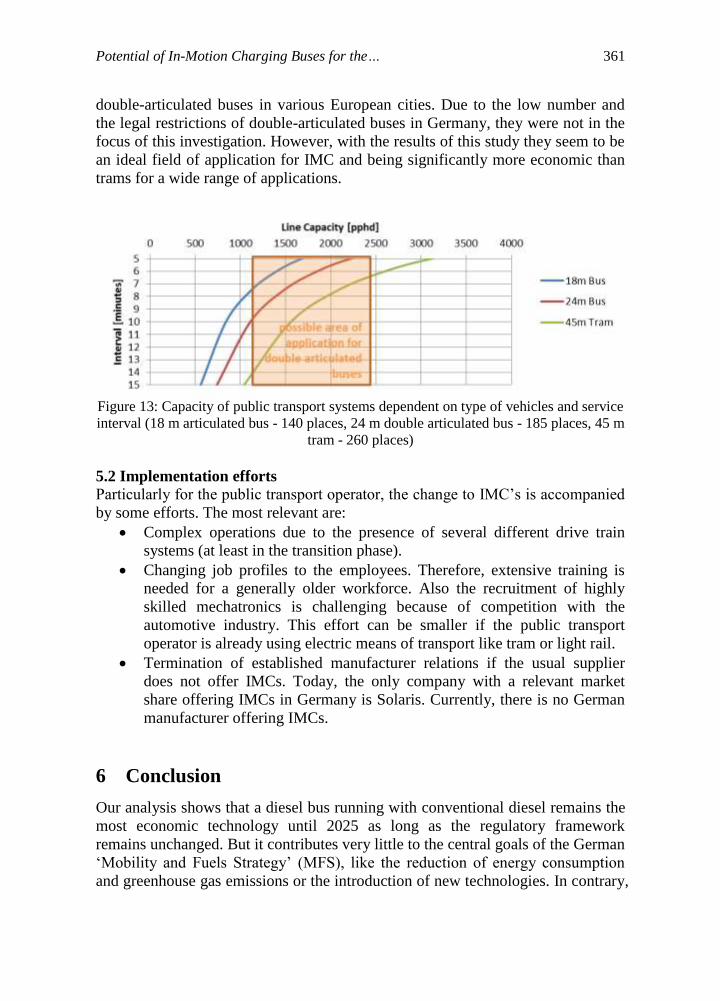
Potential of In-Motion Charging Buses for the… 361
double-articulated buses in various European cities. Due to the low number and
the legal restrictions of double-articulated buses in Germany, they were not in the
focus of this investigation. However, with the results of this study they seem to be
an ideal field of application for IMC and being significantly more economic than
trams for a wide range of applications.
Figure 13: Capacity of public transport systems dependent on type of vehicles and service
interval (18 m articulated bus - 140 places, 24 m double articulated bus - 185 places, 45 m
tram - 260 places)
5.2 Implementation efforts
Particularly for the public transport operator, the change to IMC’s is accompanied
by some efforts. The most relevant are:
Complex operations due to the presence of several different drive train
systems (at least in the transition phase).
Changing job profiles to the employees. Therefore, extensive training is
needed for a generally older workforce. Also the recruitment of highly
skilled mechatronics is challenging because of competition with the
automotive industry. This effort can be smaller if the public transport
operator is already using electric means of transport like tram or light rail.
Termination of established manufacturer relations if the usual supplier
does not offer IMCs. Today, the only company with a relevant market
share offering IMCs in Germany is Solaris. Currently, there is no German
manufacturer offering IMCs.
6 Conclusion
Our analysis shows that a diesel bus running with conventional diesel remains the
most economic technology until 2025 as long as the regulatory framework
remains unchanged. But it contributes very little to the central goals of the German
‘Mobility and Fuels Strategy’ (MFS), like the reduction of energy consumption
and greenhouse gas emissions or the introduction of new technologies. In contrary,
362 Fabian Bergk et al.
electric buses could significantly contribute to these goals. With progress in the
energy transition (‘Energiewende’) and the further development of battery
technology electric buses will become more beneficial, particularly from the
environmental point of view. For electric buses, the IMC is seen as the most
economical technology for high capacity lines (frequent service, high capacity
vehicles) or lines with a high energy demand. Therefore, the IMC is seen as an
essential part of an electrification strategy for urban public transport.
ACKNOWLEDGEMENTS. This work was funded by the German Federal
Ministry for Transport and Digital Infrastructure (BMVI).
References
[1] National aeronautics and space research centre (DLR), Fraunhofer Institute
for Wind Energy and Energy System Technology (IWES) & Ingenieurbüro
für neue Energien (IFNE), Leitstudie 2011 - Langfristszenarien und
Strategien für den Ausbau der Erneuerbaren Energien in Deutschland bei
Berücksichtigung der Entwicklung in Europa und global, Berlin, (2012).
[2] Federal Ministry of Transport and digital Infrastructure, The Mobility and
Fuels Strategy of the German Government (MFS), Berlin, (2013).
[3] Ebrahimi B. E., Life Cycle Assessment of High Speed Rail Electrification
Systems and Effects on Corridor Planning, Trondheim, (2014).
[4] FCH JU, Urban buses: alternative power trains for Europe. Fuel Cells and
Hydrogen Joint Undertaking, (2012).
[5] Rogge, M., S. Wollny, Sauer, D., Fast Charging Battery Buses for the
Electrification of Urban Public Transport - A Feasibility Study Focusing on
Charging Infrastructure and Energy Storage Requirements. Energies, 8(5),
(2015).
[6] Wietschel et al., Fraunhofer Institute for systems and innovation research
(ISE) Market evolution scenarios for electric vehicles, Karlsruhe, (2013)
[7] Jöhrens, J., H. Helms, H., How to Green Electric Vehicles: Analysis of Key
Factors for Reducing Climate Impacts of Electric Vehicles. Proceedings of
IEEE International Electric Vehicle Conference, ISBN 9781479960750,
Florence, (2014).