Potash A Vital Agricultural Nutrient Sourced from Geologic ... · Potash—A Vital Agricultural...
38
U.S. Department of the Interior U.S. Geological Survey Open File Report 2016–1167 Potash — A Vital Agricultural Nutrient Sourced from Geologic Deposits Open File Report 2016–1167 Potash —A Vital Agricultural Nutrient Sourced from Geologic Deposits U.S. Department of the Interior U.S. Geological Survey
-
Upload
phungkhuong -
Category
Documents
-
view
219 -
download
1
Transcript of Potash A Vital Agricultural Nutrient Sourced from Geologic ... · Potash—A Vital Agricultural...

U.S. Department of the InteriorU.S. Geological Survey
Open File Report 2016–1167
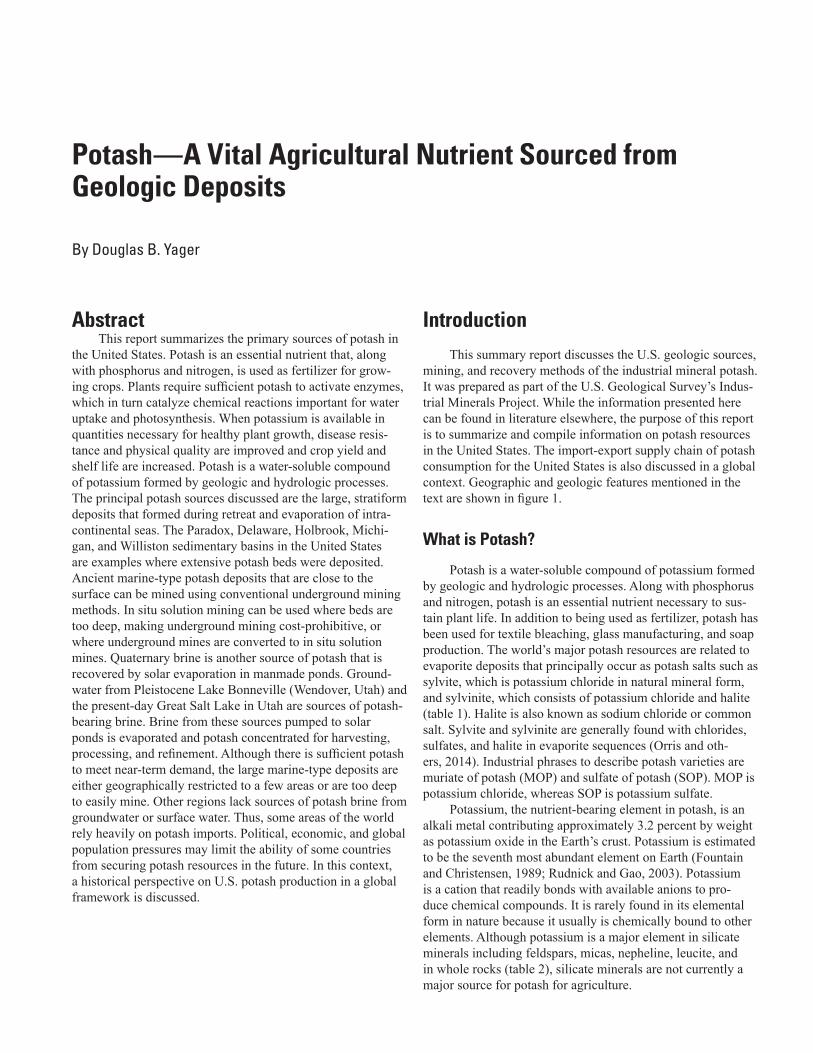
Potash—A Vital Agricultural Nutrient Sourced from Geologic Deposits
Open File Report 2016–1167
Potash—A Vital Agricultural Nutrient Sourced from Geologic Deposits
U.S. Department of the InteriorU.S. Geological Survey

Cover. Photos of underground mining operations, Carlsbad, New Mexico, Intrepid Potash Company, Carlsbad West Mine.

Potash—A Vital Agricultural Nutrient Sourced from Geologic Deposits
By Douglas B. Yager
Open File Report 2016–1167
U.S. Department of the InteriorU.S. Geological Survey

U.S. Department of the InteriorSALLY JEWELL, Secretary
U.S. Geological SurveySuzette M. Kimball, Director
U.S. Geological Survey, Reston, Virginia: 2016
For more information on the USGS—the Federal source for science about the Earth, its natural and living resources, natural hazards, and the environment—visit http://www.usgs.gov or call 1–888–ASK–USGS.
For an overview of USGS information products, including maps, imagery, and publications, visit http://store.usgs.gov/.
Any use of trade, firm, or product names is for descriptive purposes only and does not imply endorsement by the U.S. Government.
Although this information product, for the most part, is in the public domain, it also may contain copyrighted materials as noted in the text. Permission to reproduce copyrighted items must be secured from the copyright owner.
Suggested citation: Yager, D.B., 2016, Potash—A vital agricultural nutrient sourced from geologic deposits: U.S. Geological Survey Open-File Report 2016–1167, 28 p., https://doi.org/10.3133/ofr20161167.
ISSN 0196-1497 (print) ISSN 2331-1258 (online)ISBN 978-1-4113-4101-2

iii
Acknowledgments
The author wishes to thank Joseph Havasi of Compass Minerals for a surface tour of their Great Salt Lake operations. Eric Rogers, Intrepid Potash Company, provided a surface tour of the Wendover, Utah, site. Gregory Bruce and Ralph Ramstetter of Intrepid Potash Company provided an underground tour of the Carlsbad West Mine in Carlsbad, New Mexico. Background discus-sions with Dr. Raymond H. Johnson of Navarro Research and Engineering, Inc., were very help-ful. Peer reviews by Stephen Jasinski, Mary Ellen Benson, and Rhonda Driscoll, all of the U.S. Geological Survey, improved this report. The author thanks Sally Almeria of the U.S. Geological Survey for her technical edit. This report was made possible by support from the U.S. Geological Survey Central Mineral and Environmental Resources Science Center’s Industrial Mineral Project led by Anna Wilson.
Contents
Acknowledgments ........................................................................................................................................iiiIntroduction.....................................................................................................................................................1
What is Potash? ....................................................................................................................................1Potash as an Essential Nutrient .........................................................................................................4Early History of Potash .........................................................................................................................4
Geologic Setting and Geographic Distribution of Potash .......................................................................4Quaternary, Nonmarine Potash Sources ..........................................................................................4
Great Salt Lake, Utah ..................................................................................................................6Bonneville Salt Flats, Wendover, Utah .....................................................................................6Searles Lake in California ...........................................................................................................6
Paleozoic Marine-Type Potash Deposits ..........................................................................................7Delaware Basin, Southeast New Mexico ...............................................................................7Paradox Basin, Southeast Utah ................................................................................................7Holbrook Basin, East-Central Arizona ....................................................................................11Michigan Basin ..........................................................................................................................12Williston Basin, North Dakota .................................................................................................14
Nontraditional Potential Geologic Sources of Potassium for Fertilizer .....................................15Mining Methods for Potash........................................................................................................................15
Underground Mining Methods .........................................................................................................15Potash Recovery from Lacustrine and Groundwater Brines Through Solar Evaporation .....18Conversion of Underground Mining to In Situ Solution Mining ..................................................18Primary In Situ Leach Solution Mining ............................................................................................18
Past and Current Potash Production ........................................................................................................21Import-Export Supply Chain—Current and Projected Use ...................................................................21Summary........................................................................................................................................................26References ....................................................................................................................................................26

iv
Figures
1. Index map of features discussed in the text ............................................................................2 2. Paleogeographic reconstruction showing the Early Permian seaway where potash
was deposited in the Delaware Basin, New Mexico .............................................................8 3. Paleogeographic reconstruction showing the Middle Pennsylvanian seaway
where potash was deposited in the Paradox Basin, Utah .....................................................9 4. Photographs of a drill core from 1 Cane Creek, west of Moab, Utah ................................10 5. Paleogeographic reconstruction showing the Early Permian seaway where potash
was deposited in the Holbrook Basin, Arizona ......................................................................11 6. Conceptual model of marine-type evaporite deposition in a restricted seaway .............12 7. Paleogeographic reconstruction showing the late Silurian seaway where potash
was deposited in the Michigan Basin .....................................................................................13 8. Paleogeographic reconstruction showing the Middle Devonian seaway where
potash was deposited in the Williston Basin, North Dakota ...............................................14 9. Photographs of Intrepid Potash Company surface operations, Carlsbad,
New Mexico ................................................................................................................................16 10. Photographs of Intrepid Potash Company, Carlsbad West Mine underground
potash deposits and mining methods ......................................................................................17 11. Photographs of Compass Minerals, sulfate of potash surface evaporation and
brine transfer operations, Great Salt Lake, Utah ...................................................................19 12. Photographs of Intrepid Potash Company, groundwater brine transfer and
surface evaporation operations, Wendover, Utah ................................................................20 13. Photograph of Intrepid Potash Company, solar evaporation ponds at the in situ
solution mine west of Moab, Utah ...........................................................................................21 14. Graph showing U.S. potash production between 1915 and 2012 .......................................22 15. Graph showing a comparison of U.S. and world potash production between
1918 and 2011 ...............................................................................................................................22 16. Graph showing global potash production in 2012 and 2013 ................................................23 17. Graph showing global potash reserves ..................................................................................23 18. Graph showing U.S. potash imports between 1900 and 2012..............................................24 19. Graph showing the ratio of domestic to world potash production between
1919 and 2011 ...............................................................................................................................25 20. Graph showing the price of muriate of potash between 1960 and 2014 ...........................25

v
Conversion FactorsInternational System of Units to Inch/Pound
Multiply By To obtain
Lengthmeter (m) 3.281 foot (ft)kilometer (km) 0.6214 mile (mi)
Areasquare kilometer (km2) 247.1 acresquare kilometer (km2) 0.3861 square mile (mi2)
Volumecubic kilometer (km3) 0.2399 cubic mile (mi3)
Massmetric ton per day 1.102 ton per day (ton/d)metric ton per year 1.102 ton per year (ton/y)
Tables
1. Common, naturally occurring potash salts...............................................................................3 2. Selected rock-forming silicate minerals containing abundant potassium .........................3 3. Potash occurrence in the United States...................................................................................5

Potash—A Vital Agricultural Nutrient Sourced from Geologic Deposits
By Douglas B. Yager
AbstractThis report summarizes the primary sources of potash in
the United States. Potash is an essential nutrient that, along with phosphorus and nitrogen, is used as fertilizer for grow-ing crops. Plants require sufficient potash to activate enzymes, which in turn catalyze chemical reactions important for water uptake and photosynthesis. When potassium is available in quantities necessary for healthy plant growth, disease resis-tance and physical quality are improved and crop yield and shelf life are increased. Potash is a water-soluble compound of potassium formed by geologic and hydrologic processes. The principal potash sources discussed are the large, stratiform deposits that formed during retreat and evaporation of intra-continental seas. The Paradox, Delaware, Holbrook, Michi-gan, and Williston sedimentary basins in the United States are examples where extensive potash beds were deposited. Ancient marine-type potash deposits that are close to the surface can be mined using conventional underground mining methods. In situ solution mining can be used where beds are too deep, making underground mining cost-prohibitive, or where underground mines are converted to in situ solution mines. Quaternary brine is another source of potash that is recovered by solar evaporation in manmade ponds. Ground-water from Pleistocene Lake Bonneville (Wendover, Utah) and the present-day Great Salt Lake in Utah are sources of potash-bearing brine. Brine from these sources pumped to solar ponds is evaporated and potash concentrated for harvesting, processing, and refinement. Although there is sufficient potash to meet near-term demand, the large marine-type deposits are either geographically restricted to a few areas or are too deep to easily mine. Other regions lack sources of potash brine from groundwater or surface water. Thus, some areas of the world rely heavily on potash imports. Political, economic, and global population pressures may limit the ability of some countries from securing potash resources in the future. In this context, a historical perspective on U.S. potash production in a global framework is discussed.
IntroductionThis summary report discusses the U.S. geologic sources,
mining, and recovery methods of the industrial mineral potash. It was prepared as part of the U.S. Geological Survey’s Indus-trial Minerals Project. While the information presented here can be found in literature elsewhere, the purpose of this report is to summarize and compile information on potash resources in the United States. The import-export supply chain of potash consumption for the United States is also discussed in a global context. Geographic and geologic features mentioned in the text are shown in figure 1.
What is Potash?
Potash is a water-soluble compound of potassium formed by geologic and hydrologic processes. Along with phosphorus and nitrogen, potash is an essential nutrient necessary to sus-tain plant life. In addition to being used as fertilizer, potash has been used for textile bleaching, glass manufacturing, and soap production. The world’s major potash resources are related to evaporite deposits that principally occur as potash salts such as sylvite, which is potassium chloride in natural mineral form, and sylvinite, which consists of potassium chloride and halite (table 1). Halite is also known as sodium chloride or common salt. Sylvite and sylvinite are generally found with chlorides, sulfates, and halite in evaporite sequences (Orris and oth-ers, 2014). Industrial phrases to describe potash varieties are muriate of potash (MOP) and sulfate of potash (SOP). MOP is potassium chloride, whereas SOP is potassium sulfate.
Potassium, the nutrient-bearing element in potash, is an alkali metal contributing approximately 3.2 percent by weight as potassium oxide in the Earth’s crust. Potassium is estimated to be the seventh most abundant element on Earth (Fountain and Christensen, 1989; Rudnick and Gao, 2003). Potassium is a cation that readily bonds with available anions to pro-duce chemical compounds. It is rarely found in its elemental form in nature because it usually is chemically bound to other elements. Although potassium is a major element in silicate minerals including feldspars, micas, nepheline, leucite, and in whole rocks (table 2), silicate minerals are not currently a major source for potash for agriculture.

2
Potash—A Vital A
gricultural Nutrient Sourced from
Geologic D
eposits
GSL
W
SIM
LB
MR
MC
HB
-
Color shaded relief image from U.S. Geological Survey's National Elevation Dataset (2006) and constructed by John J. Kosovich, USGS, Denver, Colo.
GOM WM
B
LL
Z
UBSR
S
UP
PBM
MU
DSJD
HMColoradoPlateau
F HDU
C DBGM
DV
LM
AR
SMSLCH
AMDM CBP
WB
BD
BH SU
Great Basin
MB
KA
WA
FAAA
Wyoming
Colorado
New Mexico
Arizona
Nevada
California
Utah
Idaho
Michigan
SB SH
HE
CA

Introduction 3
Figure 1 (previous page). Index map of features discussed in the text. (Towns, squares: D, Durango, Colo.; C, Carlsbad, N.Mex.; H, Holbrook, Ariz.; F, Flagstaff, Ariz.; DV, Death Valley, Calif.; B, Bishop, Calif.; SB, Santa Barbara, Calif.; HE, Hersey, Mich.; W, Wendover, Utah; Z, Zenda, Idaho; and M, Moab, Utah. Large, western U.S. Pleistocene lakes, blue (labeled) filled areas: LL, Lake Lahontan; and LB, Lake Bonneville. Large, modern remnant of Lake Bonneville, light blue: GSL, Great Salt Lake. Small lakes, circles: CH, China Lake, Calif. (ancient, dry); and SL, Searles Lake, Calif. Black dotted lines, ancient potash evaporite basins: WB, Williston Basin; MB, Michigan Basin; DB, Delaware Basin; HB, Holbrook Basin; and PB, Paradox Basin. Dotted line, other sedimentary basin: UB, Uinta Basin. Uplifts and arches: BD, Bowdoin dome; MC, Miles City arch; BH, Black Hills uplift; SU, Sioux uplift; WA, Wisconsin arch; KA, Kankakee arch; FA, Findley arch; AA, Algonquin arch; CA, Cincinnati arch; DU, Defiance uplift; MU, Monument upwarp; UP, Uncompahgre Plateau; SJD, San Juan dome; and SRS, San Rafael Swell. Other structural features: CBP, Central basin platform; MR, Mogollon Rim; HM, Hogback monocline. Mountain ranges, triangles: AM, Apache; DM, Delaware; GM, Guadalupe; LM, Lava; SH, Spangler Hills; SM, Slate; AR, Argus; GOM, Goshute; SIM, Silver Island; and WM, Wasatch. Brown dashed line, border of the Great Basin; brown solid line, border of the Colorado Plateau)
Table 1. Common, naturally occurring potash salts. (Modified from Garrett, 1996)
Compound/mineral FormulaPotassium
oxide (percentage)
Potassium oxide K2O 100.00Sylvite KCl 100.00Sylvinite KCl+NaCl 63.17Langbeinite K2SO4•2MgSO4 22.70Carnallite KCl•MgCl2 6•H2O 16.95Kainite KCl•MgSO4•3H2O 18.92Leonite K2SO4 MgSO4 4H2O 25.69Hanksite Na22K(SO4)9(CO3)2Cl 3.00Polyhalite K2SO4•MgSO4•2CaSO4•2H2O 15.62
Table 2. Selected rock-forming silicate minerals containing abundant potassium. (Modified from Barker and others, 2008)
[wt. %, weight percentage; ND, not detected; NA, not applicable]
Mineral Family FormulaPotassium (K)
(wt. %)
Potassium oxide (K2O)
(wt. %)
Potassium feldspar Feldspar KAlSi3O8 14.0 16.9
Leucite Feldspathoid KAlSi2O6 17.9 21.6
Nepheline Feldspathoid Na3KAl4Si4O16 13.0 15.7
Kalsilite Feldspathoid KAlSiO4 24.7 29.8
Muscovite Mica KAl2(AlSi3O10)(F,OH)2 9.0 10.9
Biotite Mica K(Mg,Fe)3AlSi3O10(OH)2 7.6 9.2
Phlogopite Mica KMg3AlSi3O10(F,OH)2 9.4 11.3

4 Potash—A Vital Agricultural Nutrient Sourced from Geologic Deposits
Potash as an Essential Nutrient
Potash is an essential nutrient for food crops. It is obtained primarily from geologic environments. Feeding an ever-growing human population requires a constant supply of potash and other essential soil nutrients. The primary con-stituents in agricultural fertilizers are nitrogen (N), phospho-rus (P), and potassium (K). Fertilizers are sold with numeric N-P-K labels. A 10-10-10 label, for example, indicates that the fertilizer product contains 10 percent nitrogen, 10 percent phosphorus, and 10 percent potassium in the form of potash. The optimal proportion of nitrogen-phosphorus-potassium in a fertilizer varies between plant species because of differences in the efficiency of plant uptake (Baligar and others, 2001).
High crop yields and vital plant health depend on suffi-cient potash (Armstrong, 1998; Wang and others, 2013). Plants utilize potassium in many growth processes; principal among these is enzyme activity. The number of enzymes activated in plants depends on the quantity of available potassium and the rate at which potassium enters a plant cell. Enzymes, once activated, catalyze chemical reactions that regulate multiple plant functions. One such function, photosynthesis, which is essential for both sugar and starch production, is controlled by an enzyme requiring sufficient potassium. Another function dependent upon the potassium-enzyme interaction is a plant’s ability to transport water to its entire system by means of the opening and closing of stomata (Armstrong, 1998). Stomata are the micropores of plant leaves and stems that open when water is available and close during dry periods to prevent water loss. Efficient stomata function also helps to ward off microbial attack because microbes often enter a plant through stomata pores (Melotto and others, 2006). Soils enriched with potassium improve plant quality and reduce plant diseases. When potassium is available in quantities necessary for healthy plant growth, disease resistance and physical quality are improved and crop yield and shelf life are increased.
Early History of Potash
The term potash was first used to describe the evaporated residue from wood chips that had been leached in a pot of water. The evaporated residue contained “pot ashes” that were a source of potassium and used as a fertilizer for plants. The first U.S. patent granted to Samuel Hopkins in 1790 involved a new apparatus and process for making pot ash (Paynter, 1990). In the early 1900s, the United States obtained most large quantities of potash fertilizer from Germany (Turrentine and Shoaff, 1919). Due to a potash shortage and dependence on foreign potash imports during the early 1900s, the U.S. Con-gress authorized the U.S. Department of Agriculture (USDA) to research U.S. potash sources (Turrentine and Shoaff, 1919). USDA’s authority was expanded by Congress in 1916 to include evaluation of commercial potash production meth-ods. Recovery of potash from kelp was explored near Santa Barbara, California, and an experimental plant that was con-structed in 1917 was capable of processing 90.72 metric tons
of raw kelp per day (Turrentine and Shoaff, 1919). However, the early methods of potash extraction from wood chips and kelp were inadequate to meet fertilizer demand, and mining of large geologic sources of potash soon became the principal focus of the U.S. potash industry.
Geologic Setting and Geographic Distribution of Potash
Potash that is highly soluble and readily bioavailable to plants is derived from potash salts that were precipitated from ancient seas or are concentrated in modern surface water or groundwater brines. The term bioavailable in this paper is defined as the ability of a molecule to be absorbed by a plant for use in its healthy growth.
The largest mined U.S. potash deposits are marine in origin and located in areas that were inundated by Paleozoic intracontinental seas. These inland seas were calcium rich and generally sulfate poor (Warren, 2010). Less extensive U.S. sources of potash are associated with Quaternary continental interior lacustrine brines (Spencer and others, 1985). Interior lacustrine brines were formed in areas lacking basin outlets and freshwater recharge where brine would become concen-trated during evaporation. Tertiary basin-wide, marine-type potash deposits are uncommon in the geologic record.
The following sections review the geologic setting and geographic distribution of various U.S. potash deposits. Most current and past potash production in the United States has been concentrated in the West and Southwest. Other mapped, but largely unmined, potash reserves are located in the North-east and north-central United States (table 3).
Quaternary, Nonmarine Potash Sources
Brines that formed in intracratonic, nonmarine, closed basins with no or minimal outflow are economically important sources of potash in the United States (Orris, 2011). Brine is defined as saltwater that has a high concentration of sodium and chloride but can also contain calcium, magnesium, sulfate, potassium, iron, lithium, and bromine along with multiple other trace constituents (Domagalski and Eugster, 1990; Tripp, 2009). This report does not attempt to further subdivide these Quaternary U.S. brine sources by age. There was an attempt, however, to identify Quaternary brine sources that are extracted from groundwater reservoirs that possibly evolved from Pleistocene lakes (such as Lake Bonneville near Wendo-ver, Utah, and Searles Lake in California) and from modern-day surface water (such as the Great Salt Lake in Utah).
Quaternary brines have formed in the Great Basin sec-tion of the Basin and Range Province, encompassing an area of the western United States that includes northern Nevada and eastern California (Garrett, 1996). The Basin and Range is a vast expanse of broad depressions, or basins, with adjacent mountain ranges. The mountains vary in age, lithology, and composition.
Geologic Setting and Geographic Distribution of Potash
5
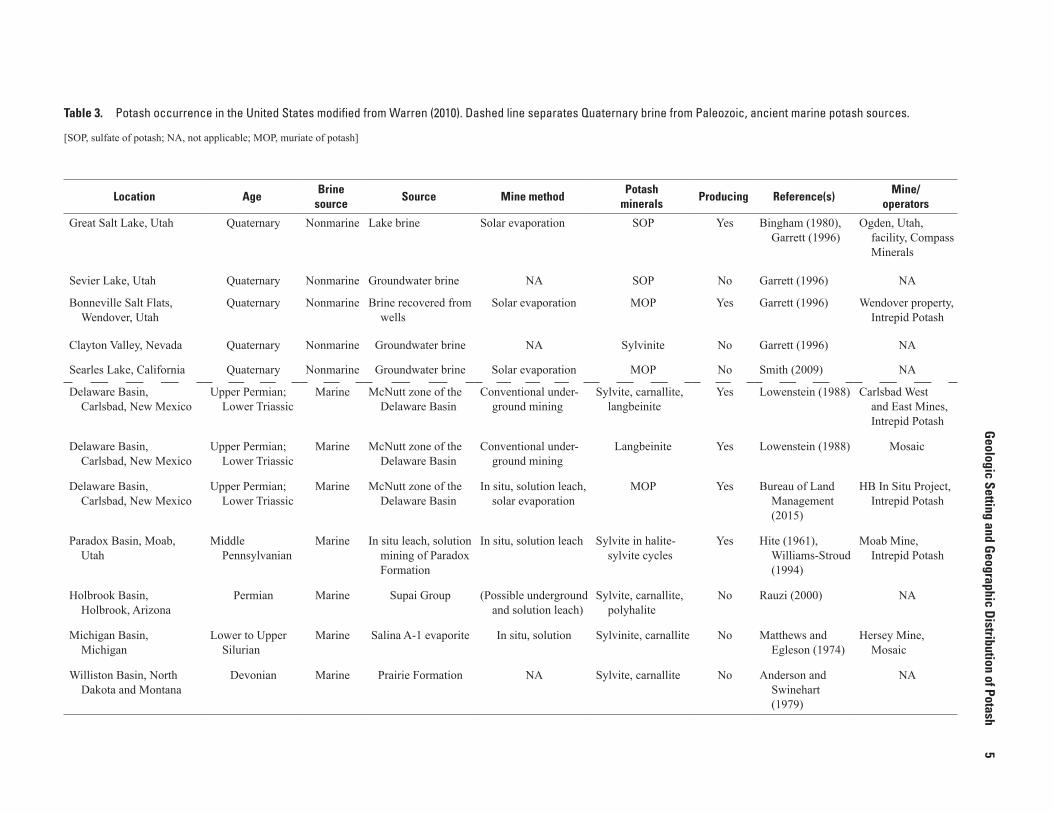
Table 3. Potash occurrence in the United States modified from Warren (2010). Dashed line separates Quaternary brine from Paleozoic, ancient marine potash sources.
[SOP, sulfate of potash; NA, not applicable; MOP, muriate of potash]
Location AgeBrine
sourceSource Mine method
Potash minerals
Producing Reference(s)Mine/
operators
Great Salt Lake, Utah Quaternary Nonmarine Lake brine Solar evaporation SOP Yes Bingham (1980), Garrett (1996)
Ogden, Utah, facility, Compass Minerals
Sevier Lake, Utah Quaternary Nonmarine Groundwater brine NA SOP No Garrett (1996) NA
Bonneville Salt Flats, Wendover, Utah
Quaternary Nonmarine Brine recovered from wells
Solar evaporation MOP Yes Garrett (1996) Wendover property, Intrepid Potash
Clayton Valley, Nevada Quaternary Nonmarine Groundwater brine NA Sylvinite No Garrett (1996) NA
Searles Lake, California Quaternary Nonmarine Groundwater brine Solar evaporation MOP No Smith (2009) NA
Delaware Basin, Carlsbad, New Mexico
Upper Permian; Lower Triassic
Marine McNutt zone of the Delaware Basin
Conventional under-ground mining
Sylvite, carnallite, langbeinite
Yes Lowenstein (1988) Carlsbad West and East Mines, Intrepid Potash
Delaware Basin, Carlsbad, New Mexico
Upper Permian; Lower Triassic
Marine McNutt zone of the Delaware Basin
Conventional under-ground mining
Langbeinite Yes Lowenstein (1988) Mosaic
Delaware Basin, Carlsbad, New Mexico
Upper Permian; Lower Triassic
Marine McNutt zone of the Delaware Basin
In situ, solution leach, solar evaporation
MOP Yes Bureau of Land Management (2015)
HB In Situ Project, Intrepid Potash
Paradox Basin, Moab, Utah
Middle Pennsylvanian
Marine In situ leach, solution mining of Paradox Formation
In situ, solution leach Sylvite in halite-sylvite cycles
Yes Hite (1961), Williams-Stroud (1994)
Moab Mine, Intrepid Potash
Holbrook Basin, Holbrook, Arizona
Permian Marine Supai Group (Possible underground and solution leach)
Sylvite, carnallite, polyhalite
No Rauzi (2000) NA
Michigan Basin, Michigan
Lower to Upper Silurian
Marine Salina A-1 evaporite In situ, solution Sylvinite, carnallite No Matthews and Egleson (1974)
Hersey Mine, Mosaic
Williston Basin, North Dakota and Montana
Devonian Marine Prairie Formation NA Sylvite, carnallite No Anderson and Swinehart (1979)
NA
6 Potash—A Vital Agricultural Nutrient Sourced from Geologic Deposits
Neogene extension and associated thinning of the continental lithosphere in the western United States caused many areas of the Great Basin to become topographically low. A series of lowland basins surrounded by relatively high mountain ranges developed over a broad region during crustal extension. The topographically low areas evolved into closed basins that lacked a hydrologic outlet. Badwater Basin in Death Valley National Park, with an elevation of 86 meters (m) below sea level, is an example of extreme subsidence within the Great Basin (Craig and others, 2012).
Closed-basin brines have formed in topographic depres-sions filled by lakes in several areas of the Great Basin. Surface water has evolved to brine compositions in continen-tal interior lakes where brine concentrations are not diluted by precipitation and inflow from surface water or upwelling from groundwater. Groundwater brine has also formed in areas formerly occupied by closed-basin brine lakes. Potash is extracted from closed-basin brine primarily through solar evaporation of lake water or groundwater that is pumped from wells that intersect porous evaporite layers (Garrett, 1996).
Great Salt Lake, Utah
Utah’s Great Salt Lake formed in the northeast part of the Great Basin along the western flank of the Wasatch Range. The Great Salt Lake is what remains of the much larger, freshwater Lake Bonneville that occupied the area from about 32,000 to 10,000 years B.P (Oviatt, 1987). Lake Bonneville sedimentary deposits contain evidence of freshwater species, including trout and ostracod fossils (Oviatt, 1987). A catastrophic outflow event about 15,000 years ago lowered the former Lake Bonneville water level by 114 m. The lake overtopped its rim at Red Rocks pass near Zenda, Idaho, and released an estimated 4,700 cubic kilome-ters of lake water down the Snake River (Jarrett and Malde, 1987). The Great Salt Lake began evolving toward a brine composition 15,000 years ago. The Wasatch Range borders the Great Salt Lake to the east and is geologically complex. The range comprises Precambrian schist, quartzite, and quartz monzonite, overlain by Paleozoic carbonates, Mesozoic sandstone, limestone and shale units, and Tertiary felsic volcanic rocks (Davis, 1983).
Potash is geochemically conservative in Great Salt Lake brine and becomes more concentrated with increasing chloride concentration (Spencer and others, 1985). Being geochemically conservative means that the potash tends to stay in solution until it is highly concentrated and eventually precipitated dur-ing evaporation. Potash that is sufficiently concentrated in lake brine can be harvested by solar evaporation. Differences in the chemical concentration of potassium in brine determines where harvesting by solar evaporation is advantageous. Changes in Great Salt Lake salinity have been caused, in part, by a railroad embankment that was constructed in 1959 that divides the lake into two segments. Potassium concentrations in brine are high-est in the northern arm of the lake. In contrast, the southern arm of Great Salt Lake can have potassium concentrations that are one-half of a percentage point less concentrated compared to the northern arm (Spencer and others, 1985).
Bonneville Salt Flats, Wendover, Utah
Groundwater beneath the Bonneville Salt Flats, a remnant of former Lake Bonneville, is the second oldest mined potash resource in the United States; Searles Lake in California is the oldest. Potash was initially produced from groundwater brine at Wendover, Utah, in 1917. Today, solar evaporation at the surface of potassium-rich groundwater pumped from beneath the Bonneville Salt Flats yields about 90,700 metric tons per year of MOP (Garrett, 1996; Intrepid Potash, 2013).
The Bonneville Salt Flats are bordered on the west by Middle Cambrian to Lower Triassic marine limestone, dolomite, and shale. Other rock units bordering the western edge of the Salt Flats include Jurassic to Miocene intrusive rocks, Tertiary sedimentary rocks, and Miocene rhyolite. Rhyolite is restricted to the Goshute Mountains of the Toano Range. To the north, the Salt Flats are bounded by the Silver Island Mountains of the Pilot Range, which are dominated by a 6,096-m-thick section of Paleozoic limestone, dolomite, quartzite, and siltstone. Granitic intrusive and tuffaceous rocks border the area to the north (Anderson, 1957; Schaeffer, 1960).
As with similar brine deposits of the Great Basin, the Bonneville Salt Flats lack an external drainage so water that has collected in the basin since the Pleistocene has evolved composi-tionally toward brine. The brine of the Salt Flats is similar to that of the Salar de Atacama, a closed basin, intracontinental brine located in the Atacama Desert of Chile. Brines of the Bonnev-ille Salt Flats and Salar de Atacama are saturated with sylvinite (Garrett, 1996). Brine wells of the Bonneville Salt Flats range in depth from just a few meters to 366 m at the top of what is inferred to be volcanic bedrocks (Turk and others, 1973).
Searles Lake in California
Searles Lake is a Holocene remnant of the larger Pleisto-cene Lake Lahontan that formed along the eastern margin of the Great Basin. It is bordered to the east by the Slate Moun-tains, which consist of schist, gneiss, and slate; to the south by the porphyritic andesite of the Lava Mountains; to the west by the Argus Mountains, which consist of Paleozoic limestone; and to the southwest by the Spangler Hills, which consist of quartz monzonite intrusive rocks crosscut by diorite dikes (Smith, 2009). Searles Lake formed about 150,000 years ago when China Lake, located to the west, overflowed and filled the Searles Lake depression. During the Pleistocene, Searles Lake was about 172 m deep (Giambastiani and Bullard, 2010). The present-day desert climate of this region, located near the southern margin of Death Valley, California, has very low precipitation and high evaporation rates.
The first U.S. potash production occurred at Searles Lake in 1916 and continued episodically until 1996 (Garrett, 1996). Three evaporite layers containing a varied combination of water-soluble salts are present under Searles Lake. The more complex salt mixtures are nearer the surface. The variety of salts deposited at Searles Lake may be attributed, in part, to discharge from thermal springs near Bishop, California (Garrett, 1996).

Geologic Setting and Geographic Distribution of Potash 7
Of the three evaporite layers, the bottommost layer is a simple mixture of sodium carbonate and halite (Smith and Haines, 1964). The upper and lower salt layers described in Smith and Haines (1964) contain mixtures of multiple soluble salts, including the potash mineral hanksite. Hanksite is most abundant in the upper layer. Brines containing sylvite, borax, sodium sulfate, halite, and water have historically been pumped from the highly porous upper and lower layers and processed in a series of evaporators that concentrate MOP and SOP (Garrett, 1996).
Paleozoic Marine-Type Potash Deposits
The principal potash sources are from the extensive, bedded deposits that formed during retreat and evaporation of intracontinental seas. Episodes of seaway transgression and regression occurred at multiple intervals throughout the Paleozoic. The Delaware, Holbrook, Michigan, and Williston sedimentary basins are examples where extensive potash beds were deposited. Paleogeographic reconstructions are used in this report to show those areas affected by seaway encroach-ment and potash deposition.
Delaware Basin, Southeast New MexicoThe Permian Delaware Basin in New Mexico is host to
extensive potash deposits. The Delaware Basin deposits were the principal source of U.S. potash beginning in 1931. These deposits continue to be mined today. When New Mexico pot-ash production was near its peak in 1966 and before the giant potash deposits of Canada were discovered, the Delaware Basin was the source of about 25 percent of the world’s potash (Jones and Madsen, 1968). In 2006, the Delaware Basin deposits supplied 19 percent of the potash for domestic use (Barker and others, 2008).
The Delaware Basin formed in what today is west Texas and southeast New Mexico. The basin is bordered on the east by the Central basin platform and on the west by the Gua-dalupe Mountains. Midland Basin, east of the Central basin platform, is not known for potash deposits. The Delaware and Apache Mountains border the basin on the southwest and south, respectively. The basin has a 9,144-m-thick accumula-tion of Cambrian to Quaternary sedimentary rocks. Potash formed in the 609-m-thick Salado Formation that is part of the Ochoa Series (Lowenstein, 1988). The Ochoa Series is a sequence of ocean-basin carbonate reef, shoal, shale, and turbidite sandstone deposits. The series formed when a Perm-ian seaway advanced into the area of what is today southern Arizona and New Mexico; northern Sonora, Mexico; and west-central Texas (fig. 2) (Hayes, 1964).
Salt evaporites that contain potash form stratiform beds that overlie the basin, reef, and shoal marine-carbonate deposits. The McNutt zone of the Salado Formation contains multiple potash beds that are interbedded primarily with halite and polyhalite but also contains minor siltstone and anhydrite (Lowenstein, 1988).
Paradox Basin, Southeast Utah
The Paradox Basin is a northwest-trending structural foreland basin formed during the Paleozoic because of downwarping and infilling by clastic sedimentary deposits, evaporite salts, and limestone. Basin deposits are com-posed of more than 6,096 m of Cambrian to Quaternary sedimentary rocks. Sedimentary units consist of 4,572 m of terrigenous clastic sediments shed along the Uncompah-gre uplift to the east during the Pennsylvanian to Perm-ian Period. A 1,219- to 1,829-m section of Pennsylvanian evaporites formed in the Paradox Basin during retreat of an intercontinental seaway that had inundated most of what is Utah (fig. 3).
The Paradox Basin is located mostly in southeast Utah and southwest Colorado, but it extends into northeast Arizona and northwest New Mexico. A carbonate platform in the south bordering the central Paradox Basin forms a constructional deposit of carbonaceous minerals with topo-graphic relief and is a remnant of a Paleozoic seaway. The evaporite salts that were deposited in the Middle Pennsyl-vanian are used to define the basin boundary. The basin is bordered on the northeast by a Precambrian-cored anticlinal uplift associated with the Uncompahgre Plateau (Nuccio and Condon, 2000). The San Juan dome, a Precambrian-cored uplift partly covered by Tertiary volcanic rocks, forms the eastern boundary of the basin. Cretaceous sedimentary rocks exposed along the Hogback monocline southwest of Durango, Colorado form the southeast border. The southern and southwest basin borders are not well defined structur-ally but are delineated mainly by the extent of Pennsylvanian evaporite deposits and by the Monument upwarp, a classic Colorado Plateau monoclinal fold (Nuccio and Condon, 2000). The San Rafael Swell, a Laramide dome that formed over uplifted Precambrian rocks, marks the northwest basin boundary. The Uinta Basin merges with the Paradox Basin along the northern margin of the Paradox Basin.
The Pennsylvanian Paradox Member of the Hermosa Formation is an economic source of potash currently mined near Moab, Utah. Potash deposition in the Paradox Basin was controlled over time by evolution of brine composi-tions with late-stage brines having a higher concentration of potassium. Potash in brine is highly soluble, and potassium minerals are among the last phases to precipitate. Common precipitation sequences for ocean brine are calcite-gypsum or anhydrite-halite-potash. Episodic transgressive (inunda-tion) and regressive (retreat) seaway events are recorded in a section of core collected near the active Cane Creek Mine, 14.5 kilometers (km) west of Moab, Utah. A 283-m section of continuous core shows four black shale and two limestone depositional intervals preceded by evapo-rite mineralization. Some shale intervals are hydrocarbon rich and have been investigated as source rocks for oil and gas in the Paradox Basin (Nuccio and Condon, 2000). The Cane Creek core can be viewed online at https://my.usgs.gov/crcwc/core/report/16647, or researchers may view the

8 Potash—A Vital Agricultural Nutrient Sourced from Geologic Deposits
Delaware Basin
Figure 2. Paleogeographic reconstruction of western North America for the Early Permian (Modified from Blakey, 2011). Location of present day Delaware Basin in New Mexico, and state boundaries shown for reference. Areas in light blue were inundated by the Permian seaway. (Copyright by Ron Blakey, Colorado Plateau Geosystems, used with permission.)

Geologic Setting and Geographic Distribution of Potash 9
Figure 3. Paleogeographic reconstruction of western North America for the Middle Pennsylvanian (Modified from Blakey, 2011). Location of present day Moab, Utah, along the northern Paradox Basin margin, and state boundaries shown for reference. Areas in light blue were inundated by the Pennsylvanian seaway. (Copyright by Ron Blakey, Colorado Plateau Geosystems, used with permission.)
MoabParadox
Basin

10 Potash—A Vital Agricultural Nutrient Sourced from Geologic Deposits
Figure 4. Cane Creek Well Number 1; USGS Core Research Center ID: F016. A, Interval 589.18 to 593.14 meters; banded, centimeter-scale gray to millimeter-scale black anhydrite overlying light brown to gray halite. B, Interval 802.54 to 806.35 meters; banded light- to dark-gray halite overlying dark-gray anhydrite. C, Interval 825.40 to 829.36 meters; potash layers are reddish-hued and are intergrown with light-gray to light-brown halite. White sections are Styrofoam that represents sections of missing core.
A
B
C
physical core by contacting personnel at the U.S. Geological Survey core library at http://geology.cr.usgs.gov/crc/index.html. Researchers have documented 28 separate evaporite mineralization events in the Paradox Basin during the Middle Pennsylvanian period, with 18 of the intervals containing potash (Garrett, 1996). Evaporite intervals of the Cane Creek Well Number 1 drill core contain mainly halite or intergrown halite-sylvite. These minerals indicate episodes of seawater
influx that diluted the brine such that it was no longer satu-rated with potash.
Evaporite minerals present in the Cane Creek core suggest that the brine evolved from a high sulfate and halite system (anhydrite-halite) into a low sulfate, concentrated potassium, sodium, chloride system (halite-sylvite). Figure 4A–C shows three core intervals that represent brine evolution and potash deposition.

Geologic Setting and Geographic Distribution of Potash 11
Holbrook Basin, East-Central ArizonaExploration drill-hole data collected in the mid-1960s
from the Pennsylvania- Permian-aged Holbrook Basin, located in eastern Arizona, identified a significant potash resource. The Holbrook Basin is a northwest-southeast oriented structural basin located east of Flagstaff, Arizona. This basin is bor-dered to the south by the Mogollon Rim and to the north and northeast by the Defiance uplift. The basin consists of about 1,829 m of sedimentary rocks that thin outward from Hol-brook, Arizona. Rocks in the central part of the basin consist of a 305- to 457-m-thick section of Triassic clastic sedimen-tary rocks (Blakey, 1979, 1990). These Triassic rocks contain red beds of the Moenkopi Formation that are composed of a shale-dominated sequence of interbedded mudstone, siltstone,
and sandstone. These rocks overlie the porous cross-bedded sandstone of the Coconino Sandstone. The Lower Permian Schnebly Hill Formation that underlies the Triassic red beds and sandstone is host to the evaporite deposits. The basal Schnebly Hill consists of sands, silts, and muds that transition to a thick section of bedded evaporites in the upper part of the formation. The evaporites formed during retreat of an Early Permian seaway (fig. 5). Devonian to Lower Pennsylvanian strata uncomformably overlie the Precambrian-floored basin (Rauzi, 2000).
Potash was deposited as a single layer overlying a halite layer in the Schnebly Hill Formation described in Blakey (1979, 1990). Potash thicknesses range from 1.5 to 9 m and extend across an area of 1,554 square kilometers (km2) (Rauzi, 2000). Some of the thickest potash zones occur beneath the
Figure 5. Paleogeographic reconstruction of western North America for the Early Permian (Modified from Blakey, 2011). Holbrook Basin evaporites formed during encroachment of an inland sea into east central Arizona during Late Pennsylvanian to Early Permian. (Copyright by Ron Blakey, Colorado Plateau Geosystems, used with permission.)
HolbrookBasin

12 Potash—A Vital Agricultural Nutrient Sourced from Geologic Deposits
current boundaries of the Petrified Forest National Park and an adjacent area proposed for park expansion. Potash depths range from 213 to 610 m and are accessible by either conven-tional underground or in situ solution mining. Recoverable potash resource estimates vary, but assuming a uniform 20 percent potassium oxide content, the Holbrook Basin potash resource ranges from 210 million to 1.75 billion metric tons (Rauzi, 2000, 2008).
Michigan BasinThe Michigan Basin contains extensive potash deposits
consisting of bedded sylvinite. Both shallow- and deep-precip-itation models have been proposed for potash formation in the Michigan Basin. Gill (1977) suggested that potash precipitated in the central part of the Michigan Basin during an episode of inland sea transgression and subsequent evaporite deposi-tion in a salt flats environment. An alternative, deep-water model for potash deposition was proposed by Schmalz (1969). His model suggests an environment where seawater became
stratified in dissolved oxygen with high concentrations at the surface and low concentrations at depth. The oxygenated conditions at the surface helped initiate crystallization with the most soluble phases precipitating last and at the top of the stratigraphic sequence. Deposition of potash in the deepest water indicates evaporation of potash near the former seaway surface, density separation, and accumulation at a depth where potash remained concentrated (Matthews, 1970). The main prerequisites for potash deposition are for the water to become sufficiently concentrated with respect to potash and for the water to remain undiluted by outflow from the depositional basin (Matthews, 1970). In the Michigan Basin, the greatest potash thicknesses occur in what were the deepest parts of the seaway. A conceptual model of evaporite formation from a closed or restricted ocean basin is shown in figure 6.
The evaporite deposit in the Michigan Basin covers an area of 33,670 km2 (Anderson and Egleson, 1970). The deposit is bordered on the northwest by the Wisconsin arch and on the southeast by the Cincinnati arch. The Findley and Algonquin arches form the northeast basin margin. During the middle
Evaporation
Calcite
Gypsum/anhydrite
Potash salts
Halite
Increasing solubility—Potash is last to precipitate
Figure 6. Conceptual model of brine formation from an epeiric seaway inundating a closed or restricted basin. Mineral precipitation sequence shown by straight arrow and described in Garrett (1996). First formed is calcite. Potash is the most soluble in this sequence, so it precipitates last. Potash (sylvite) is commonly intergrown with halite (see fig. 4).
Geologic Setting and Geographic Distribution of Potash 13
Silurian, the Kankakee arch developed across northeastern Illinois. Although it did not form a land barrier, it greatly restricted circulation of seawater within the Michigan Basin.
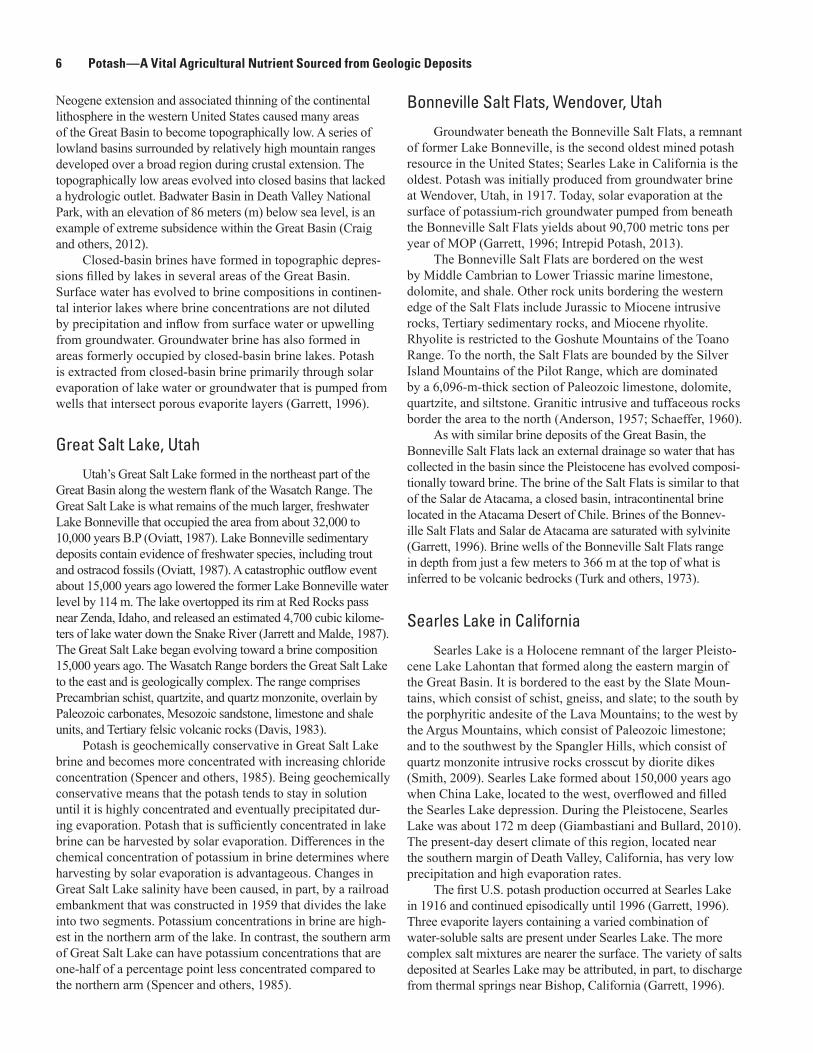
Potash deposits formed during retreat and evaporation of a Silurian inland sea (fig. 7). Wells drilled in the central part of the basin intersect potash-bearing rocks of the Silurian Salina Group at depths of between 2,134 and 2,743 m.
Potash salts can be distinguished from other salts using gamma ray technology. Salts without potassium lack a radioactive signature. The radioisotope 40K that is present in potash salts can be used to identify deposits. The potash-bearing zone of the Salina Group is estimated to be at a depth greater than 152 m and was measured using gamma ray and mechanical well logs (Anderson and Egleson, 1970;
Matthews, 1970). Gamma ray logs for the Salina Group and the A-1 evaporite, a term used locally to define the potash-bearing stratigraphy, show that the potash is in multiple intervals (Elowski, 1980). Because of the great depths of the potash strata, in situ solution mining is the only economi-cally feasible potash mining method in the Michigan Basin. The primary interval targeted for solution mining is the top of the A-1 evaporite known informally as the “Borgen Bed” occurring within the Salina Group stratigraphic sequence. Some layers of the “Borgen Bed” are reported to be of especially high purity containing 70 to 100 percent potas-sium chloride by volume. The potash deposit in the Michigan Basin is fortuitously located in the agricultural region of the United States where soy and corn are grown.
Figure 7. Paleogeographic reconstruction of western North America during the late Silurian (Modified from Blakey, 2011). Michigan Basin area and adjacent Great Lakes area were inundated by a Silurian inland sea. (Copyright by Ron Blakey, Colorado Plateau Geosystems, used with permission.)
Michigan Basin

14 Potash—A Vital Agricultural Nutrient Sourced from Geologic Deposits
Williston Basin, North DakotaPossibly the largest known but unexploited potash
resources in the United States are within the Devonian strata of the Williston Basin. The Williston Basin is the southern-most extension of the Canadian Elk Point Basin, which hosts some of the largest mined potash deposits in the world. The Williston Basin is an intracratonic basin characterized by slow and moderate subsidence (Xie and Heller, 2009). This gradual subsidence may have produced conditions more favorable for evaporation and brine concentration compared to basins that subsided more rapidly. The inflow of seawater into the basin was restricted by carbonate reefs that developed during the Middle Devonian and with reefs that formed over intra-basin structural highs; the restricted inflow, coupled with an arid climate, enhanced brine formation (Anderson and Swinehart, 1979) (fig. 8).
The Williston Basin is located in eastern Montana, western North Dakota, northern South Dakota, and southern Saskatchewan (Canada). The basin is bordered on the east by the Canadian Shield and to the southeast by the Sioux uplift. The western and southwestern parts of the basin are defined by the Black Hills uplift, the Miles City arch, and Bowdoin dome. Basin deposits consist of a 4,877-m sequence of Cambrian through Holocene sedimentary rocks. The potash that formed in the Devonian Prairie Formation ranges in thickness from 13 to 16.8 m. Five potash-bearing zones have been identified in the Prairie Formation using gamma ray logs (Kruger, 2014). Total potash resources throughout the Williston Basin are estimated to be 50 billion metric tons (Anderson and Swine-hart, 1979). Potash beds occur at depths between 1,707 m and greater than 3,810 m (Kruger, 2014); these great depths limit recovery of potash to in situ solution mining methods.
Figure 8. Paleogeographic reconstruction of western North America for the Middle Devonian (Modified from Blakey, 2011). Williston Basin in North Dakota is the southern extension of the potash deposits in the Elk Point Basin in Saskatchewan Province, Canada. (Copyright by Ron Blakey, Colorado Plateau Geosystems, used with permission.)
Williston Basin

Mining Methods for Potash 15
Nontraditional Potential Geologic Sources of Potassium for Fertilizer
Silicate rocks and minerals at or near the Earth’s surface are another, albeit non-traditional, source of potash. Early in the 20th century, a report by Schulz and Cross (1912) sug-gested the possible use of nepheline-bearing rocks that are high in potassium as a source of fertilizer. Nepheline is a relatively rare, rock-forming mineral that is found in large quantities in only a few U.S. localities (Schulz and Cross, 1912). The Schulz and Cross (1912) report identified the chal-lenges the United States faced at that time for obtaining potash from overseas sources. The Schulz and Cross (1912) report was written prior to the discovery of the potash-bearing saline lake deposits at Searles Lake and the Bonneville Salt Flats, and New Mexico’s 1925 Delaware Basin find. The report, however, demonstrated how eagerly scientists were searching for domestic sources of a vitally important industrial mineral. Since the discovery of massive potash deposits in the western United States and the Saskatchewan Province of Canada, the United States has not experienced a potash shortage. Other countries are not so fortunate, however. According to Orris and others (2014), much of Africa, Australia, and India lack either natural deposits or the ability to purchase potash from supplier countries.
Currently, the potash deficit is particularly severe in Africa, which has few developed naturally occurring potash salt resources. In addition, the high cost of potash fertilizer prevents poor regions in Africa from acquiring sufficient potash for agricultural applications (Sheldrick and others, 2002). Newly discovered deposits in Eritrea may soon help to alleviate the potash deficit in parts of Africa (Al Rawashdeh and others, 2016). Nonetheless, if potash derived from silicate minerals is found to be an effective alternative fertilizer to augment or replace traditional forms of potash salts, the economic burden on countries now required to import potash to sustain their agricultural industry could be lessened (Ciceri and others, 2015).
Studies in the early 21st century have been conducted to determine if accessible potassium-silicate deposits may be suitable for agricultural applications. Selected studies have shown that crop yields respond favorably when crushed potassium-bearing minerals are applied. Soils treated with the silicate mineral biotite were as productive as soils treated with potash (Mohammed and others, 2014). Soils amended with the mineral nepheline were slightly less productive and released potassium more slowly (Mohammed and others, 2014). Field trial results of potassium-bearing silicate miner-als in agricultural environments have been inconsistent and are not well documented. Standardized, well-documented field and laboratory tests are needed so that experimental results can be compared. Standardized field trials will aid in assessing the solubility and bioavailability of potassium derived from silicate minerals (Kristiansen and others, 2006; Manning, 2010).
Mining Methods for PotashPotash can be mined or harvested using several under-
ground and surface methods. Mining methods discussed in this report are (1) traditional underground mining of potash-bearing strata, (2) solar evaporation in surface ponds of brine sourced from groundwater or saline lakes, and (3) in situ solu-tion mining of underground potash strata followed by solar evaporation in surface ponds.
Underground Mining Methods
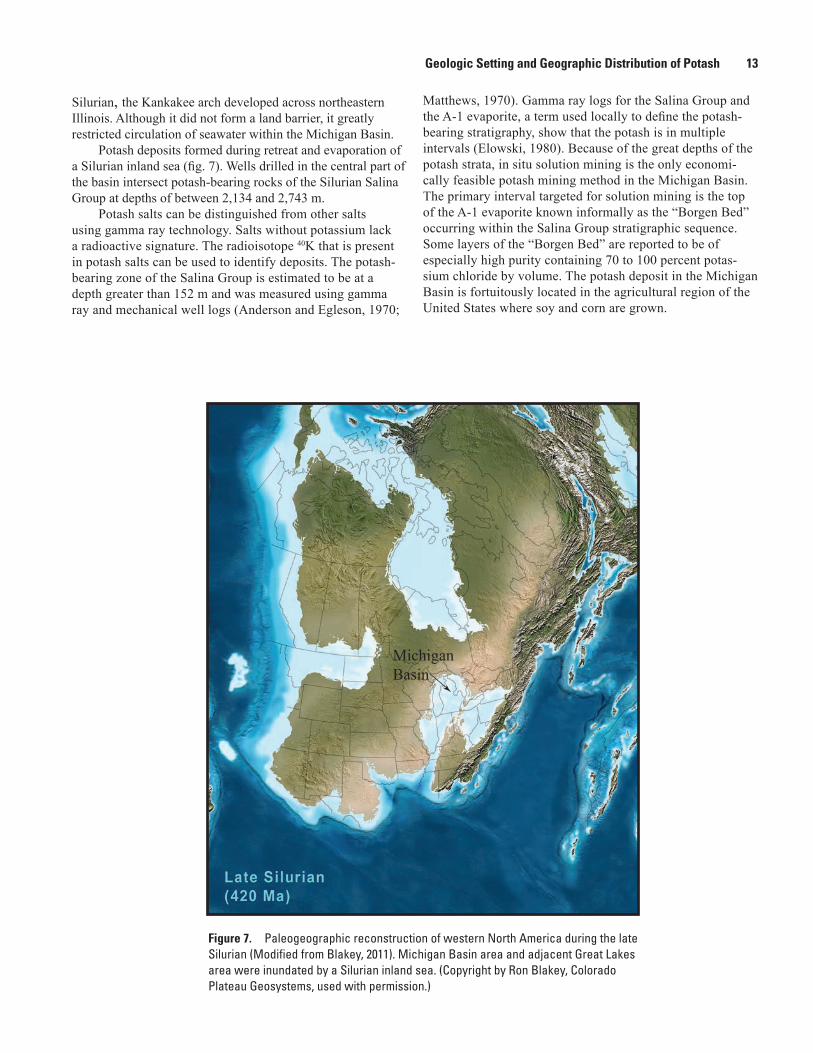
The Carlsbad, New Mexico, potash deposits are at depths amenable to underground mining and accessed by vertical shafts between 198 and 533 m below the surface (Austin, 1980) (fig. 9A).
The Carlsbad deposits that are considered mineable contain a minimum of 10 percent potassium oxide in sylvite, or 4 percent potassium oxide in langbeinite. The Moab, Utah, potash deposit was mined by the underground method in the 1960s, but the Carlsbad deposits are the only U.S. potash deposits currently mined underground.
A 75-year mining legacy at the Carlsbad potash mine has generated significant mine waste at the surface (fig. 9B). A primary geoenvironmental issue related to potash mining is the weathering of mine waste. Weathering of potash waste produces brine that may migrate from the waste site to nearby streams and soils and can be toxic to vegetation and aquatic life. A relatively dry climate near Carlsbad helps to mitigate waste weathering and reduce brine mobility.
The Carlsbad potash deposits differ from the non-stratiform potash-bearing salts of Moab, Utah. The potash at Carlsbad is in multiple, nearly flat, continuous beds that can be mined using a continuous mining machine. Continuous miners can extract sylvite-rich, gently dipping strata along miles of strike (fig. 10A–E). A two-person crew operating a remotely controlled continuous mining machine and a loading car (fig. 10E) can mine as much as 600 to 1,000 metric tons of ore per 12-hour shift. Due to the precision of the mining equipment and skill of the operator, the continuous miner can avoid impure layers containing clay, salt, or dolomite and extract only high purity ore. Underground mining of potash is still profitable in the Carlsbad region today, making this one of the longest operating underground potash mines in the United States.
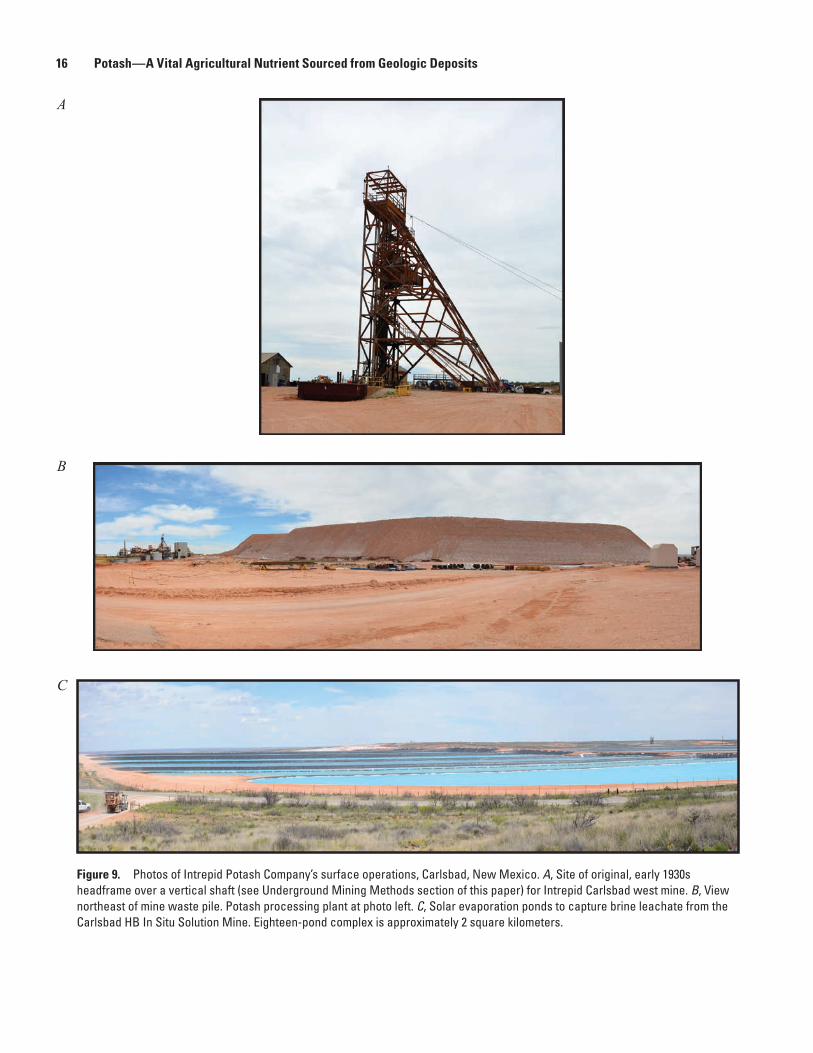
16 Potash—A Vital Agricultural Nutrient Sourced from Geologic Deposits
A
B
C
Figure 9. Photos of Intrepid Potash Company’s surface operations, Carlsbad, New Mexico. A, Site of original, early 1930s headframe over a vertical shaft (see Underground Mining Methods section of this paper) for Intrepid Carlsbad west mine. B, View northeast of mine waste pile. Potash processing plant at photo left. C, Solar evaporation ponds to capture brine leachate from the Carlsbad HB In Situ Solution Mine. Eighteen-pond complex is approximately 2 square kilometers.

Mining Methods for Potash 17
Figure 10. Photos of underground mining operations, Carlsbad, New Mexico, Intrepid Potash Company, Carlsbad West Mine. A, Carbide steel-tipped drum on front of continuous miner. B, Active mining of potash layer by drum at mine face. C, Ore conveyor transfer system as part of continuous miner. D, Sylvite ore pillar (approximately 2.4 meters tall). Sylvite reddish to pink; gray bands are impurities formed during deposition. E, Loading vehicle (left) receiving ore from conveyor while ore face is being mined (far right). Grooves on mine back from continuous miner drum nibs.
A B
C D
E

18 Potash—A Vital Agricultural Nutrient Sourced from Geologic Deposits
Potash Recovery from Lacustrine and Groundwater Brines Through Solar Evaporation
Solar evaporation is used today to concentrate and har-vest potash from Great Salt Lake brines. Sequential evapora-tion of Great Salt Lake brine in multiple manmade ponds concentrates halite first. Once halite has precipitated, the remaining brine becomes concentrated in the potassium salts kainite and carnallite. Kainite is a source of potassium sulfate. Potassium sulfate, referred to as SOP, is important for use as a fertilizer for chloride-intolerant crops including some fruit and nut varieties. The Compass Minerals Great Salt Lake opera-tion supplies most of the U.S. domestic SOP and about 20 percent of global exports (Joseph Havasi, Compass Minerals, oral commun., 2015).
The Compass Minerals solar evaporation ponds are strategically located for optimal potash recovery. Conditions favorable for concentration of potash are due, in part, to the physical separation of the lake water that occurred when the 1904 Southern Pacific railroad trestle was replaced with a new solid fill railroad embankment in 1959. The new embankment, constructed of rock and earthen fill, bisects the lake into north and south arms and prevents mixing between the two arms so the north arm has become more saline. Compass Minerals has constructed more than 200 km2 of manmade ponds near the northern arm of the Great Salt Lake to collect and evaporate brine (fig. 11A).
A geoengineered hydraulic feature known as the Beh-rens trench (named after former Great Salt Lake Minerals’ vice chairperson, Peter Behren) was constructed parallel to and north of the railroad embankment. Behrens trench was designed to transport higher density brine from Compass Min-erals’ northwest ponds to solar evaporation ponds and a pro-cessing plant located near the northeast lake margin (fig. 11A). Pond water from the northwestern evaporation pond complex is transferred through a pump station to the trench (fig.11 B, C, and D). The Behrens trench allows the higher density brine to flow by gravity from west to east, even when lower density brine lake water overlies the hydraulic trench.
Solar evaporation is also used to recover potash from high-salinity groundwater that is pumped to the surface. At the Bonneville Salt Flats (fig. 12A), Intrepid Potash pumps brine from shallow and deep groundwater wells to a primary canal (fig. 12B and C). Water from the primary canal is transferred to a series of solar evaporation reservoirs (fig. 12D and E). When potassium in the first evaporative reservoir reaches a specific level of concentration, the water is transferred to a second reservoir. The evaporative process continues through a series of water transfers with each transfer producing a higher potassium concentration. When water achieves potas-sium saturation in a final-stage “ripening” reservoir, and prior to magnesium chloride precipitation, water is transferred to a potassium-harvesting reservoir. The harvesting reservoir is subsequently drained and the precipitate allowed to dry.
Solar evaporation to recover potash is favored by cool, wet winters and hot, dry summers with high solar evaporation
rates. The entire cycle from pumping to transport to sequential solar evaporation can take more than one year (Eric Rogers, Intrepid Potash, oral commun., 2015). Relatively fresh water, derived from groundwater originating beneath the Silver Island Mountains to the north, serves as rinse water for brine transfer ponds and ditches.
A series of processing steps involving flotation-cell con-centration, centrifugation, kiln drying, and sieving are used to make multiple products suitable for use as fertilizer for home- and agricultural-scale use. Producing high-grade potash is a slow and precise process.
Conversion of Underground Mining to In Situ Solution Mining
The Cane Creek Mine, west of Moab, Utah, is operated as an in situ solution mine by Intrepid Potash, Inc. The Cane Creek Mine was initially operated in the 1960s as a traditional underground mine. However, since the Cane Creek potash beds formed in a salt dome, they are discontinuous and contorted so the mine operator converted the Cane Creek property to a more suitable in situ solution mine. A water-based brine solution is injected into the potash-bearing beds through intersecting drill holes. The injected solution leaches the soluble potash and the leachate is pumped to solar evaporation ponds at the surface using recovery drill holes. Potassium is concentrated in a series of solar evaporation ponds until an optimal potassium concen-tration is achieved prior to harvesting (fig. 13).
Typical potash deposits that are leached at Cane Creek are shown in figure 4C. The evaporated potash is shipped directly from the mine site by rail car to the midwestern United States for agricultural use.
Traditional underground mining of potash does not extract all of the available resource since underground pillars containing high-grade ore must be left as infrastructure to sta-bilize the mine workings. Solution mining is used to recover the ore left behind as pillars and to leach potash from unmined strata. Today, Intrepid Potash has converted the traditional underground workings of the former Eddy Potash Mine to an in situ solution mining operation (Berg, 2012; Bureau of Land Management, 2015). The renamed HB In Situ Solution Mine is located 32.18 kilometers northeast of Carlsbad, New Mexico, only a few kilometers from the Carlsbad underground potash workings (fig. 9A–C).
Primary In Situ Leach Solution Mining
When the cost of underground mining is prohibitive, in situ solution mining may be an economical alternative. An in situ mine is located in Hersey, Michigan. Until November 2013, this deposit was in situ solution mined by The Mosaic Company. At this locality, geologic units containing potash are exposed at or near the Michigan Basin margins where in situ wells have been installed. As with the Cane Creek Mine in Utah, injection wells serve as conduits for brine solutions

Mining Methods for Potash 19
Figure 11. Photos of Compass Minerals Company, Great Salt Lake west ponds, potash solution transfer, and conveyance system. A, View north of west pond (approximately 11.3 kilometers wide); arrow is location of photos B and C. B, Pump system for transfer of west pond water to Behrens trench. C, View southeast of Behrens trench. D, View north of Behrens trench with dashed arrow showing trend of trench. Solid arrow is location of photos B and C. Trench continues eastward toward east ponds.
A
B C
D

20 Potash—A Vital Agricultural Nutrient Sourced from Geologic Deposits
Figure 12. Photos of solar evaporation operations for potash recovery at the Intrepid Potash Company, Wendover, Utah, site. A, View north of Bonneville Salt Flats under which groundwater brine is sourced (Silver Island Mountains in distance). B, View north of approximately 3.2 kilometer-long central canal where groundwater brine is collected. C, Pump station for groundwater brine transfer from central canal. D, Transfer pipes from central canal. E, Transfer of brine to Pond 1 for start of solar evaporation and potash concentration. Pond 1 is about 2.4 kilometers wide by 1.8 kilometers long and is one of multiple ponds constructed onsite.
A
B
C
D E
Import-Export Supply Chain—Current and Projected Use 21
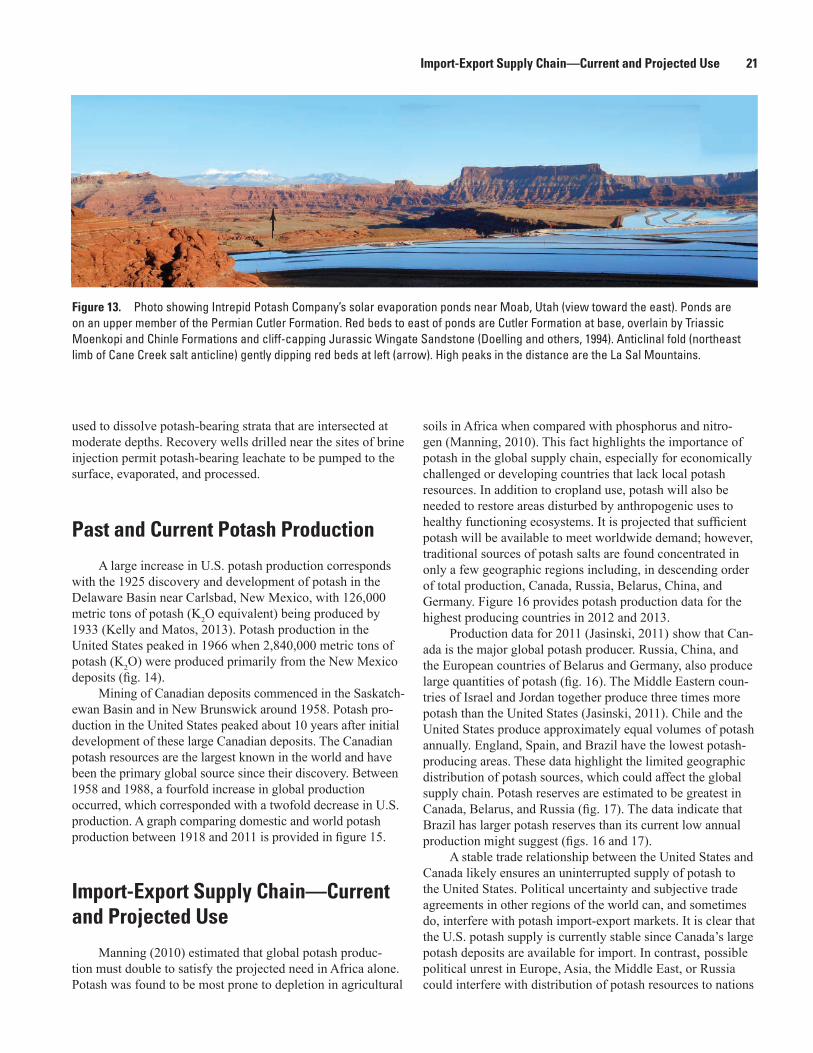
Figure 13. Photo showing Intrepid Potash Company’s solar evaporation ponds near Moab, Utah (view toward the east). Ponds are on an upper member of the Permian Cutler Formation. Red beds to east of ponds are Cutler Formation at base, overlain by Triassic Moenkopi and Chinle Formations and cliff-capping Jurassic Wingate Sandstone (Doelling and others, 1994). Anticlinal fold (northeast limb of Cane Creek salt anticline) gently dipping red beds at left (arrow). High peaks in the distance are the La Sal Mountains.
used to dissolve potash-bearing strata that are intersected at moderate depths. Recovery wells drilled near the sites of brine injection permit potash-bearing leachate to be pumped to the surface, evaporated, and processed.
Past and Current Potash Production
A large increase in U.S. potash production corresponds with the 1925 discovery and development of potash in the Delaware Basin near Carlsbad, New Mexico, with 126,000 metric tons of potash (K2O equivalent) being produced by 1933 (Kelly and Matos, 2013). Potash production in the United States peaked in 1966 when 2,840,000 metric tons of potash (K2O) were produced primarily from the New Mexico deposits (fig. 14).
Mining of Canadian deposits commenced in the Saskatch-ewan Basin and in New Brunswick around 1958. Potash pro-duction in the United States peaked about 10 years after initial development of these large Canadian deposits. The Canadian potash resources are the largest known in the world and have been the primary global source since their discovery. Between 1958 and 1988, a fourfold increase in global production occurred, which corresponded with a twofold decrease in U.S. production. A graph comparing domestic and world potash production between 1918 and 2011 is provided in figure 15.
Import-Export Supply Chain—Current and Projected Use
Manning (2010) estimated that global potash produc-tion must double to satisfy the projected need in Africa alone. Potash was found to be most prone to depletion in agricultural
soils in Africa when compared with phosphorus and nitro-gen (Manning, 2010). This fact highlights the importance of potash in the global supply chain, especially for economically challenged or developing countries that lack local potash resources. In addition to cropland use, potash will also be needed to restore areas disturbed by anthropogenic uses to healthy functioning ecosystems. It is projected that sufficient potash will be available to meet worldwide demand; however, traditional sources of potash salts are found concentrated in only a few geographic regions including, in descending order of total production, Canada, Russia, Belarus, China, and Germany. Figure 16 provides potash production data for the highest producing countries in 2012 and 2013.
Production data for 2011 (Jasinski, 2011) show that Can-ada is the major global potash producer. Russia, China, and the European countries of Belarus and Germany, also produce large quantities of potash (fig. 16). The Middle Eastern coun-tries of Israel and Jordan together produce three times more potash than the United States (Jasinski, 2011). Chile and the United States produce approximately equal volumes of potash annually. England, Spain, and Brazil have the lowest potash-producing areas. These data highlight the limited geographic distribution of potash sources, which could affect the global supply chain. Potash reserves are estimated to be greatest in Canada, Belarus, and Russia (fig. 17). The data indicate that Brazil has larger potash reserves than its current low annual production might suggest (figs. 16 and 17).
A stable trade relationship between the United States and Canada likely ensures an uninterrupted supply of potash to the United States. Political uncertainty and subjective trade agreements in other regions of the world can, and sometimes do, interfere with potash import-export markets. It is clear that the U.S. potash supply is currently stable since Canada’s large potash deposits are available for import. In contrast, possible political unrest in Europe, Asia, the Middle East, or Russia could interfere with distribution of potash resources to nations

22 Potash—A Vital Agricultural Nutrient Sourced from Geologic Deposits
0
0.5
1.0
1.5
2.0
2.5
3.0
3.5
1912 1932 1952 1972 1992 2012Year
U.S.
pot
ash
prod
uctio
n (m
illio
ns o
f met
ric to
ns K
2O)
Figure 14. Graph showing U.S. potash production between 1915 and 2012. Production peaked in 1966 at 2.84 millions of metric tons potassium oxide (K2O). (Kelly and Matos, 2013).
Figure 15. Graph comparing U.S. (black solid line) and world potash production (blue dashed line) between 1918 and 2011. Data are reported in millions of metric tons potassium oxide (K2O) equivalent (Kelly and Matos, 2013).
Year1915
40
35
30
25
20
15
10
5
01935 1955
Domestic
World
1975 1995 2015
Pota
sh p
rodu
ctio
n (m
illio
ns o
f met
ric to
ns, K
2O)

Import-Export Supply Chain—Current and Projected Use 23
0
2
4
6
8
10
12
Pota
sh p
rodu
ctio
n (m
illio
ns o
f met
ric to
ns K
2O)
2012
2013
BelarusBrazil
CanadaChile
China
Germany
Israel
JordanRuss
iaSpain
United Kingdom
United States
Figure 16. Graph showing global potash production for 2012 and 2013 reported as potassium oxide (K2O) (U.S. Geological Survey, 2015).
Figure 17. Graph showing global potash reserves in potassium oxide (K2O) equivalent (U.S. Geological Survey, 2015).
0
200
400
600
800
1,000
1,200
Pota
sh re
serv
es (m
illio
ns o
f met
ric to
ns K
2O)
BelarusBrazil
CanadaChile
China
Germany
Israel
JordanRuss
iaSpain
United Kingdom
United States
Other countrie
s

24 Potash—A Vital Agricultural Nutrient Sourced from Geologic Deposits
that depend on these potash sources. Potash is but one of many examples of how the geographically limited occurrence of a mined commodity can be a contributing factor to the availabil-ity of a commodity.
Periods of global economic downturn or recession have been mirrored by a decrease in global potash production. For example, global decreases in potash production were observed during the 1991–1993 and 2009 global recessions. In 2009, U.S. potash imports declined by more than half compared to the previous year (fig. 18).
The ratio of U.S. domestic to world production shows a slight increase in domestic production in 1992 followed by a gradual decline as economic recovery continued to be sluggish through the remainder of the decade (fig. 19).
Overall, the domestic to world production ratio of potash illustrates the abrupt decrease in U.S. production when the Canadian deposits were discovered in 1958. Canada replaced the United States as the world’s main supplier of potash during this time. In addition, figure 16 illustrates the world domina-tion of potash production compared to that of the United States (U.S. Geological Survey, 2015).
Estimates of global reserves indicate that there is suf-ficient supply to meet current and future global demand (U.S. Geological Survey, 2015). Although there is no foreseeable shortage of potash, not all countries can afford to buy or distribute the commodity. It can be challenging for countries to pay $500 per metric ton, the calculated five-year average cost, for potash. According to USDA data charts, one U.S. acre
of wheat tillage requires 9.5 kg of potash and one U.S. acre of soybean tillage needs about 34 kg of potash (http://www.ers.usda.gov). Due to the irregular distribution of potash deposits and business organizations that have controlled the price of potash on global markets, potash prices peaked at historically high levels in February 2009 at $875 per metric ton (fig. 20). The 52-week price range as of August 2014 ranged from $287 to $393 per metric ton.
The global distribution of potash deposits can be a limit-ing factor in a country’s ability to have adequate fertilizer sup-plies. Many countries in Africa, for example, lack sufficient potash resources to meet projected demand for agricultural applications (Manning, 2010). Other factors that may make it difficult for African countries to obtain adequate supplies of potash are the price of the commodity and the global distribu-tion of potash reserves. Even if countries can afford the com-modity, they may lack the infrastructure or mechanism for its distribution (Manning, 2010). Therefore, even though potash may be abundant, it may still be unavailable to much of the world. Many African nations are economically poor and lack resources to purchase potash, especially when the market price is high. Large potash deposits of the marine type only occur in a few areas of the world. Any commodity that has such an uneven distribution is subject to socio-political unrest if demand exceeds or pressures the supply. For example, the cur-rent political situation in Ukraine possibly makes the potash deposits there less readily available for distribution locally and on the global market.
0
1
2
3
4
5
6
7
1900 1920 1940 1960 1980 2000
P
otas
h im
ports
(mill
ions
of m
etric
tons
, K2O
)
Year
Figure 18. Graph showing U.S. potash imports between 1900 and 2012 reported as potassium oxide (K2O) (Kelly and Matos, 2015).

Import-Export Supply Chain—Current and Projected Use 25
0
0.05
0.1
0.15
0.2
0.25
0.3
0.35
0.4
0.45
1918 1928 1938 1948 1958 1968 1978 1988 1998 2008
Ratio
of U
.S. t
o w
orld
pot
ash
prod
uctio
n
Year
0
100
200
300
400
500
600
700
800
900
1,000
1960
1961
1962
1963
1964
1965
1966
1967
1968
1969
1970
1971
1972
1973
1974
1975
1976
1977
1978
1979
1980
1981
1982
1983
1984
1985
1986
1987
1988
1989
1990
1991
1992
1993
1994
1995
1996
1997
1998
1999
2000
2001
2002
2003
2004
2005
2006
2007
2008
2009
2010
2011
2012
2013
2014
Pric
e of
mur
iate
of p
otas
h in
U.S
. dol
lars
per
met
ric to
n
Production year
Figure 19. Graph showing ratio of U.S. to world potash production between 1919 and 2011 (Kelly and Matos, 2015).
Figure 20. Graph showing price of muriate of potash between 1960 and 2014. Solid black line is actual price; dotted black line is 12-month yearly average adjusted to 2010 U.S. dollars. (Modified from World Bank, 2016).

26 Potash—A Vital Agricultural Nutrient Sourced from Geologic Deposits
SummaryPotash is a geologically sourced essential nutrient. While
silicate minerals have shown promise as an alternative source of potash for agricultural use, potash salts remain the pri-mary commodity for this purpose in the foreseeable future. The distribution of large, Paleozoic-age potash salt deposits is controlled by global seas that encroached on the interior North American continent. Seaway retreat, restriction from inflow or outflow of seawater, and evaporation resulted in the formation of extensive potash deposits. The Delaware Basin of New Mexico, Michigan Basin, Paradox Basin of Utah, and Williston Basin of North Dakota are examples of marine-type deposits. Marine-type deposits are primarily mined as a source of muriate of potash. Quaternary brine derived from continental interior lakes such as the Great Salt Lake in Utah is an important source of sulfate of potash that is used as a soil amendment for chloride-intolerant crops. Groundwater brine that is a remnant of the large Pleistocene Lake Bonneville continues to be an important U.S. source of potash at Wen-dover, Utah. In situ solution mines that have been converted from underground mines, such as the HB In Situ Solution Mine project in Carlsbad, New Mexico, and the Cane Creek Mine in Grand County, Utah, are viable potash operations that are producing today. Known, extensive potash reserves that are too deep for conventional underground mining (such as those in the Michigan and Williston Basins) are potential sources of potash that could be mined using the in situ solu-tion mining method. While current estimated potash reserves can supply all the global demands for the foreseeable future, potash reserves are geographically limited to specific regions. The limited geographic distribution of potash salts, the price of the commodity, a government’s infrastructure and ability to distribute potash, and political unrest can all affect a country’s ability to obtain and use this essential nutrient.
References
Al Rawashdeh, R., Xavier-Oliveira, Emanuel, and Maxwell, Philip, 2016, The potash market and its future prospects: Resources Policy, v. 47, p. 154–163.
Anderson, R.J., and Egleson, G.C., 1970, Discovery of potash in the A-1 Salina salt in Michigan, in Kneller, W.A., ed., Miscellany 1, Papers Presented at the Sixth Forum on Geol-ogy of Industrial Rocks and Minerals: Lansing, Michigan, State of Michigan Department of Natural Resources, p. 9–12.
Anderson, S.B., and Swinehart, R.P., 1979, Potash salts in the Williston Basin, U.S.A.: Economic Geology, v. 74, no. 2, p. 358–376.
Anderson, W.L., 1957, Geology of the northern Silver Island Mountains, Box Elder and Tooele Counties, Utah: Univer-sity of Utah , Department of Geology, M.S. Thesis, 131 p.
Armstrong, D.L., ed., 1998, Potassium for agriculture: Better Crops With Plant Food, v. 82, no. 3, 39 p.
Austin, G.S., 1980, Potash in New Mexico: New Mexico Geology, v. 2, p. 7–9.
Baligar, V.C., Fageria, N.K., and He, Z.L., 2001, Nutrient use efficiency in plants: Communications in Soil Science and Plant Analysis, v. 32, no. 7–8, p. 921–950.
Barker, J.M., Gundiler, Ibrahaim, and Walsh, Patrick, 2008, New Mexico potash—Past, present, and future: New Mex-ico Bureau of Mines and Bureau of Geology and Mineral Resources, New Mexico Earth Matters, v. 8, no. 2, 6 p.
Berg, W. R., 2012, Regional geology—Geology and miner-als issues related to the proposed HB in-situ solution mine project, in HB In-Situ Solution Mine Project Final Environ-mental Impact Statement, 2012: Bureau of Land Manage-ment, DOI–BLM–NM–P020–2011–498–EIS, accessed November 13, 2014 at http://www.nm.blm.gov/cfo/HBIS/finalEIS.html.
Bingham, C.P., 1980, Solar production of potash from the brines of the Bonneville Salt Flats: Utah Geological and Mineral Survey Bulletin 116, p. 229–242.
Blakey, R.C., 1979, Lower Permian stratigraphy of the southern Colorado Plateau, in Baars, D.L., ed., Permian-land—Four Corners Geological Society Field Conference, 9th: Durango, Colorado, Four Corners Geological Society, p. 115–129.
Blakey, R.C., 1990, Stratigraphy and geologic history of Pennsylvanian and Permian rocks, Mogollon Rim region, central Arizona and vicinity: Geological Society of America Bulletin v. 102, no. 9, p. 1189–1217.
Blakey, R.C., 2011, Paleogeography of Western North America: Colorado Plateau Geosystems, Inc., Western North America series, 1 CD-ROM, accessed July 1, 2016, at https://www2.nau.edu/rcb7/RCB.html.
Bureau of Land Management, 2015, HB in-situ project envi-ronmental impact statement: U.S. Bureau of Land Manage-ment, accessed July 15, 2015, at http://www.nm.blm.gov/cfo/HBIS/overview.html.
Ciceri, D., Manning, D.A.C., and Allanore, A., 2015, Histori-cal and technical developments of potassium resources: Science of the Total Environment, v. 502, p. 590–601.
Craig, M.S., Jol, H.M., Teitler, Lora, and Warnke, D.A., 2012, Geophysical surveys of a pluvial lake barrier deposit, Beatty Junction, Death Valley, California, USA: Sedimentary Geol-ogy, v. 269–270, p. 28–36.

References 27
Davis, F.D., comp., 1983, Geologic map of the southern Wasatch Front, Utah: Utah Geological and Mineral Survey Map 55–A, 2 sheets, scale 1:100,000.
Domagalski, J.L., and Eugster, H.P., 1990, Trace metal geo-chemistry of Walker, Mono, and Great Salt Lakes: The Geo-chemical Society, Special Publication No. 2, p. 315–353.
Elowski, R.C., 1980, Potassium salts (potassium) of the Salina A–1 evaporite in the Michigan Basin: Michigan Department of Natural Resources, Report of Investigation 25, 14 p.
Fountain, D.M., and Christensen, N.I., 1989, Composition of the continental crust and upper mantle—A review: Geologi-cal Society of America Memoirs 172, p. 711–742.
Garrett, D.E., 1996, Potash deposits, processing, properties, and uses: London, Chapman and Hall, 734 p.
Giambastiani, M., and Bullard, T.F., 2010, Terminal Pleisto-cene—Early Holocene adaptations on the eastern shore of China Lake, California, in Kaldenberg, R.L., ed., Archaeol-ogy of Naval Air Weapons Station, China Lake, California: Pacific Coast Archaeological Society Quarterly, v. 43, no. 1–2, p. 50–70.
Gill, Dan, 1977, Salina A–1 sabkha cycles and the late Silurian paleogeography of the Michigan Basin: Journal of Petrol-ogy, v. 47, no. 3, p. 979–1017.
Hayes, P.T., 1964, Geology of the Guadalupe Mountains, New Mexico: U.S. Geological Survey Professional Paper 446, 69 p.
Hite, R.J., 1961, Potash-bearing evaporite cycles in the salt anticlines of the Paradox Basin, Colorado and Utah in Short paper in hydrologic and geologic sciences: USGS Profes-sional Paper 424-D, p. D135–D138.
Intrepid Potash, 2013, Annual Report, Form 10–K: Washington, D.C., United States Securities and Exchange Commission.
Jarrett, R.D., and Malde, H.E., 1987, Paleodischarge of the late Pleistocene Bonneville flood, Snake River, Idaho, com-puted from new evidence: Geological Society of America Bulletin, v. 99, p. 127–134.
Jasinski, S.M., 2011 [2013], Potash, in U.S. Geological Survey Minerals Yearbook—2011: U.S. Geological Survey, p. 58.1–58.5, accessed April 23, 2015, at http://minerals.usgs.gov/minerals/pubs/commodity/potash/myb1-2011-potas.pdf.
Jones, C.L., and Madsen, B.M., 1968, Evaporite geology of the fifth ore zone Carlsbad district, southeastern New Mexico: U.S. Geological Survey Bulletin 1252–B, 21 p.
Kelly, T.D., and Matos, G.R., comps., 2013, Historical sta-tistics for mineral and material commodities in the United States (2013 version): U.S. Geological Survey Data Series 140, accessed July 15, 2015, at http://minerals.usgs.gov/minerals/pubs/historical-statistics/.
Kristiansen, Paul, Taji, Acram, and Reganold, J.P., eds., 2006, Organic agriculture—A global perspective: Australia, CSIRO publishing, 480 p.
Kruger, Ned, 2014, The potash members of the Prairie Forma-tion in North Dakota: North Dakota Geological Survey Report of Investigations no. 113, 39 p.
Lowenstein, T.K., 1988, Origin of depositional cycles in a Permian “saline giant”—the Salado (McNutt zone) evapo-rates of New Mexico and Texas: Geological Society of America Bulletin v. 100, p. 592–608.
Manning, D.C., 2010, Mineral sources of potassium for plant nutrition—A review: Agronomy for Sustainable Develop-ment, v. 30, p. 281–294.
Matthews, D.R., 1970, The distribution of Silurian potash in the Michigan Basin, in Kneller, W. A., ed., Miscellany 1, Papers presented at the Sixth Forum on Geology of Indus-trial Rocks and Minerals: State of Michigan Department of Natural Resources, Lansing, Michigan, p. 9–12.
Matthews, R.D., and Egleson, G.C., 1974, Origin and impli-cations of a mid-basin potash facies in the Salina Salt of Michigan, in Coogan, A.H., ed.: Fourth International Symposium on Salt, v. 1, Northern Ohio Geological Society, p. 15–34.
Melotto, M., Underwood, W., Koczan, J., Nomura, K., and He, S.Y., 2006, Plant stomata function in innate immunity against bacterial invasion: Cell, v. 126, no. 5, p. 969–980.
Mohammed, S.M.O., Brandt, K., Gray, N.D., White, M.L., and Manning, D.A.C., 2014, Comparison of silicate minerals as sources of potassium for plant nutrition in sandy soil: Euro-pean Journal of Soil Science, v. 65, p. 653–662.
Nuccio, V.F., and Condon, S.M., 2000, Burial and thermal history of the Paradox Basin, Utah and Colorado, and petroleum potential of the Middle Pennsylvanian Paradox Formation: U.S. Geological Survey Bulletin 2000–O, 41 p.
Orris, G.J., 2011, Deposit model for closed-basin potash-bearing brines: U.S. Geological Survey Open-File Report 2011–1283.
Orris, G.J., Cocker, M.D., Dunlap, P., Wynn, Jeff, Spanski, G.T., Briggs, D.A., and Gass, L., with contributions from Bliss, J.D., Bolm, K.S., Yang, C., Lipin, B.R., Ludington, S., Miller, R.J., and Slowakiewicz, M., 2014, Potash—A global overview of evaporite-related potash resources, including spatial databases of deposits, occurrences, and permissive tracts: U.S. Geological Survey Scientific Investigations Report 2010–5090–S, 76 p., and spatial data, accessed July 1, 2016 at http://dx.doi.org/10.3133/sir20105090S.
28 Potash—A Vital Agricultural Nutrient Sourced from Geologic Deposits
Oviatt, C.G., 1987, Lake Bonneville stratigraphy at the Old River Bed, Utah: American Journal of Science, v. 287, p. 383–398.
Paynter, H.M., 1990, The first U.S. patent: American Heritage of Invention & Technology, v. 5, no. 3, p. 18–22.
Rauzi, S.L., 2000, Permian salt in the Holbrook Basin, Ari-zona: Arizona Geological Survey Open-File Report 00–03, 20 p.
Rauzi, S.L., 2008, Arizona has potash: Arizona Geological Survey, v. 38, no. 2, p. 1–4.
Rudnick, R. L., and Gao, S., 2003, Composition of the con-tinental crust, in Rudnick, R.L., ed., The Crust: Treatise in Geochemistry, v. 3, p. 1–64.
Schaeffer, F.E., 1960, Geology of the Silver Island Mountains: Utah Geological Society Guidebook 15, p. 169–175.
Schmalz, R.F., 1969, Deep-water evaporite deposition—A genetic model: The American Association of Petroleum Geologists Bulletin, v. 53, no. 4, p. 798–823.
Schulz, A.R., and Cross, Whitman, 1912, Potash-bearing rocks of the Leucite Hills, Sweetwater County, Wyoming: U.S. Geological Survey Bulletin 512, 39 p.
Sheldrick, W.F., Syers, J.K., and Lingard, J., 2002, A con-ceptual model for conducting nutrient audits at national, regional and global scales—Nutrient cycling: Agroecosys-tems, v. 62, p. 61–67.
Smith, G.I., 2009, Late Cenozoic geology and lacustrine history of Searles Valley, Inyo and San Bernardino Coun-ties, California: U.S. Geological Survey Professional Paper 1727, 115 p.
Smith, G.I., and Haines, D.V., 1964, Character and distribution of nonclastic minerals in the Searles Lake evaporite deposit, California: U.S. Geological Survey Bulletin 1181–P, 59 p.
Spencer, R.J., Eugster, H.P., Jones, B.F., and Rettig, S.L., 1985, Geochemistry of Great Salt Lake, Utah I—Hydro-chemistry since 1850: Geochimica Cosmochimica Acta, v. 49, no. 3, p. 727–737.
Tripp, T.G., 2009, Production of magnesium from the Great Salt Lake, Utah, USA: Natural Resources and Environmen-tal Issues, v. 15, article 10, p. 55–61, accessed April 13, 2015, at http://digitalcommons.usu.edu/nrei/vol15/iss1/10.
Turk, L.J., Davis, S.N., and Bingham, C.P., 1973, Hydrogeol-ogy of lacustrine sediments, Bonneville Salt Flats, Utah: Economic Geology, v. 68, no. 1, p. 65–78.
Turrentine, J.W., and Shoaff, P.S., 1919, Potash from kelp—The experimental plant of the United States Department of Agriculture, preliminary paper: Industrial and Engineering Chemistry, v. 11, p. 864–874.
U.S. Geological Survey, 2015, Mineral commodity summa-ries: U.S. Geological Survey, accessed July 15, 2015, at http://minerals.usgs.gov/minerals/pubs/commodity/potash/.
Wang, M., Zheng, Q., Shen, Q., and Guo, S., 2013, The criti-cal role of potassium in plant stress response: International Journal of Molecular Sciences, v. 14, p. 7370–7390.
Warren, J.K., 2010, Evaporites through time—Tectonics, climatic and eustatic controls in marine and nonmarine deposits: Earth Science Reviews, v. 98, p. 217–268.
Williams-Stroud, S.C., 1994, The evolution of an inland sea of marine origin to a non-marine saline lake: the Pennsyl-vanian Paradox salt, in Renault, R.W., and Last, W.M., eds., Sedimentology and geochemistry of modern and ancient saline lakes: Tulsa, Okla., Society for Sedimentary Geology, Special Publication 50, p. 293–306.
World Bank, 2016, Global Economic Monitor (GEM) commodities: The World Bank Group, accessed July 1, 2016, at http://databank.worldbank.org/data/reports.aspx?source=global-economic-monitor-(gem)-commodities#.
Xie, X., and Heller, P.L., 2009, Plate tectonics and basin subsidence history: Geological Society of America Bulletin, v. 121, 55–64.
Publishing support provided by: Denver Publishing Service CenterFor more information concerning this publication, contact:Center Director, USGS Central Mineral and Environmental Resources
Science CenterBox 25046, Mail Stop 973Denver, CO 80225(303) 236-1562Or visit the Central Mineral and Environmental Resources Science
Center Web site at:http://minerals.cr.usgs.gov/


Yager—Potash—
A Vital Agricultural N
utrient Sourced from G
eologic Deposits—
Open File Report 2016–1167Yager—
Potash—A Vital A
gricultural Nutrient Sourced from
Geologic D
eposits—Open File Report 2016–1167
ISSN 0196-1497 (print) ISSN 2331-1258 (online)http://dx.doi.org/10.3133/ofr20161167