Postsecondary Institutions and Price of Attendance in the ...
49
U.S. DEPARTMENT OF EDUCATION NCES 2010-161 Postsecondary Institutions and Price of Attendance in the United States: Fall 2009, Degrees and Other Awards Conferred: 2008–09, and 12-Month Enrollment: 2008–09 First Look
Transcript of Postsecondary Institutions and Price of Attendance in the ...
U.S. DEPARTMENT OF EDUCATIONNCES 2010-161
Postsecondary Institutions and Price of Attendance in the United States: Fall 2009, Degrees and Other Awards Conferred: 2008–09, and 12-Month Enrollment: 2008–09First Look
NCES 2010-161U.S. DEPARTMENT OF EDUCATION
Postsecondary Institutions and Price of Attendance in the United States: Fall 2009, Degrees and Other Awards Conferred: 2008–09, and 12-Month Enrollment: 2008–09
First Look
AUGUST 2010
Laura G. Knapp Janice E. Kelly-ReidScott A. Ginder RTI International
U.S. Department of EducationArne DuncanSecretary
Institute of Education SciencesJohn Q. EastonDirector
National Center for Education StatisticsStuart KerachskyActing Commissioner
The National Center for Education Statistics (NCES) is the primary federal entity for collecting, analyzing, and reporting data related to education in the United States and other nations. It fulfills a congressional mandate to collect, collate, analyze, and report full and complete statistics on the condition of education in the United States; conduct and publish reports and specialized analyses of the meaning and significance of such statistics; assist state and local education agencies in improving their statistical systems; and review and report on education activities in foreign countries.
NCES activities are designed to address high-priority education data needs; provide consistent, reliable, complete, and accurate indicators of education status and trends; and report timely, useful, and high-quality data to the U.S. Department of Education, the Congress, the states, other education policymakers, practitioners, data users, and the general public. Unless specifically noted, all information contained herein is in the public domain.
We strive to make our products available in a variety of formats and in language that is appropriate to a variety of audiences. You, as our customer, are the best judge of our success in communicating information effectively. If you have any comments or suggestions about this or any other NCES product or report, we would like to hear from you. Please direct your comments to
National Center for Education Statistics Institute of Education Sciences U.S. Department of Education 1990 K Street NW Washington, DC 20006-5651
August 2010
The NCES World Wide Web Home Page address is http://nces.ed.gov.The NCES World Wide Web Electronic Catalog address is http://nces.ed.gov/pubsearch.
This publication is only available online. To download, view, and print the report as a PDF file, go to the NCES World Wide Web Electronic Catalog address shown above.
Suggested CitationKnapp, L.G., Kelly-Reid, J.E., and Ginder, S.A. (2010). Postsecondary Institutions and Price of Attendance in the United States: Fall 2009, Degrees and Other Awards Conferred: 2008–09, and 12-Month Enrollment: 2008–09 (NCES 2010-161). U.S. Department of Education. Washington, DC: National Center for Education Statistics. Retrieved [date] from http://nces.ed.gov/pubsearch.
Content ContactAurora D’Amico(202) [email protected]

Foreword
This First Look presents findings from the Integrated Postsecondary Education Data System (IPEDS) fall 2009 data collection, which included three survey components: Institutional Characteristics for the 2009-10 academic year, Completions covering the period July 1, 2008, through June 30, 2009, and 12-Month Enrollment covering academic year 2008-09.
The data on which this report is based are available to researchers and the public through the IPEDS Data Center and the College Navigator. Both of these sources can be found at http://nces.ed.gov/ipeds. This First Look report is based on the collection of data from more than 6,700 postsecondary education institutions that participate in Title IV federal student financial aid programs.
The purpose of this report is to introduce new data through the presentation of tables containing descriptive information. As a result, only selected findings are presented. These findings have been chosen to demonstrate the range of information available when using the IPEDS data rather than to discuss all of the observed differences, and they are not meant to emphasize any particular issue.
We hope that the information provided in the report will be useful to a wide range of readers. Further, we hope that the results reported here will encourage researchers and others to make full use of the IPEDS data for analysis, peer comparisons, or to help answer questions about postsecondary education institutions.
Thomas Weko Associate Commissioner
Postsecondary, Adult, and Career Education Division
iii

This page intentionally left blank.

Acknowledgments
The information presented in this publication was provided by either state coordinators for the Integrated Postsecondary Education Data System (IPEDS) or officials at individual institutions. In addition, these persons provided assistance in resolving questions about the data, which resulted in more accurate information. Their assistance was invaluable and is much appreciated.
The U.S. Department of Education, National Center for Education Statistics (NCES), and the Office for Civil Rights, with the approval of the Office of Management and Budget, cooperate in the collection of racial/ethnic and gender information from all postsecondary institutions that participate in the Enrollment and Completions components of the IPEDS survey. In this collaboration, data provided by postsecondary institutions are designated as Compliance Reports pursuant to the Civil Rights Act of 1964 (34 CFR 100.6(b)).
v

This page intentionally left blank.

Contents
Page
Foreword ....................................................................................................................................... iii
Acknowledgments ..........................................................................................................................v
List of Tables .............................................................................................................................. viii
Introduction ....................................................................................................................................1 IPEDS 2009-10 .............................................................................................................................1 Institutional Characteristics, Price of Attendance, and Tuition and Fees .....................................1 Completions ..................................................................................................................................2 12-Month Enrollment ...................................................................................................................2 Changes in Reporting Categories .................................................................................................2 Focus of This Report.....................................................................................................................3
Selected Findings ............................................................................................................................4 Institutional Characteristics of Title IV Institutions .....................................................................4 Tuition and Fees Charged to Full-Time Undergraduate Students at Title IV Institutions in the United States ...........................................................................................................................4 Price of Attendance for Full-Time, First-Time Degree/Certificate-Seeking Undergraduate Students at Title IV Institutions in the United States ...................................................................4 Completions at Title IV Institutions in the United States During 2008-09 ..................................5 12-Month Enrollment at Title IV Institutions in the United States During 2008-09 ....................5
Appendix A: Survey Methodology .......................................................................................... A-1 Overview .................................................................................................................................. A-1 Universe, Institutions Surveyed, and Response Rates ............................................................. A-1 Inflation Adjustments .............................................................................................................. A-5 Survey Components ................................................................................................................. A-5 Changes in Reporting Categories ............................................................................................ A-6 Survey Procedures ................................................................................................................... A-7 Edit Procedures ........................................................................................................................ A-8 Imputation Procedures ........................................................................................................... A-10
Appendix B: Glossary of IPEDS Terms..................................................................................B-1
vii

List of Tables
Table Page
1.
................................................................................................................................6
Number and percentage distribution of Title IV institutions, by control of institution, level of institution, and region: United States and other jurisdictions, academic year 2009-10
2.
................................................................................................................................7
Number and percentage distribution of Title IV institutions, by control of institution, degree-granting status, and highest level of offering: United States, academic year 2009-10
3.
....................8
Average, median, and number of institutions reporting academic year tuition and required fees for full-time students at Title IV institutions, by control of institution, student level, and level of institution: United States, academic year 2009-10
4.
..................................................9
Average and median tuition and required fees, percentage change in average and median tuition and required fees, and number of institutions reporting academic year tuition and required fees, measured in constant 2009-10 dollars, for full-time students at Title IV institutions, by student level, sector, and residency: United States, academic years 2000-01, 2003-04, 2006-07, and 2009-10
5.
........................................................11
Average components of academic year price of attendance and percentage change in average components of price of attendance, measured in constant 2009-10 dollars, for full-time, first-time degree/certificate-seeking undergraduates at Title IV institutions, by level and control of institution, residency, and student housing: United States, academic years 2007-08 and 2009-10
6.
.........................................................................................................12
Average academic year price of attendance and percentage change in average price of attendance, measured in constant 2009-10 dollars, for full-time, first-time degree/certificate-seeking undergraduates at Title IV institutions, by level and control of institution, student housing, and residency: United States, academic years 2007-08 and 2009-10
7.
...............................................................................13
Number and percentage distribution of degrees conferred at Title IV institutions, by control of institution, level of institution, gender, race/ethnicity, and degree level: United States, academic year 2008-09
8. ..................................................................15
Awards conferred by Title IV institutions, by race/ethnicity, level of award, and gender: United States, academic year 2008-09
9. .............16
The 10 largest programs of study for men and women at 4-year Title IV institutions, by level of degree and program of study: United States, academic year 2008-09
10.
..............................................................................................................................18
12-month unduplicated headcount enrollment at Title IV institutions, by student level, institution sector, race/ethnicity, and gender: United States, academic year 2008-09
11. ...........................................19
12-month full-time-equivalent enrollment at Title IV institutions, by student level and institution sector: United States, academic year 2008-09
viii

ix
A-1.
............................ A-3
Number and percentage of Title IV institutions and administrative offices responding to the IPEDS fall 2009 data collection, by component, degree-granting status, and level and control of institution: United States and other jurisdictions
A-1a.
................................................................. A-4
Number and percentage of Title IV institutions and administrative offices responding to the IPEDS fall 2009 data collection, by component, degree-granting status, and level and control of institution: United States

This page intentionally left blank.

Introduction
The Integrated Postsecondary Education Data System (IPEDS) collects institution-level data from postsecondary institutions in the United States (the 50 states and the District of Columbia) and other jurisdictions.1 For IPEDS, a postsecondary institution is defined as an organization that is open to the public and has as its primary mission the provision of postsecondary education, that is, formal instructional programs with a curriculum designed primarily for students who are beyond the compulsory age for high school. This definition includes academic, vocational, and continuing professional education programs and excludes institutions that offer only avocational (leisure) and adult basic education programs.
IPEDS 2009-10
Participation in IPEDS was required for institutions and administrative offices that participated in Title IV federal student financial aid programs such as Pell Grants or Stafford Loans during the 2009-10 academic year.2 Title IV institutions include 4-year colleges and universities, 2-year institutions, and non-degree-granting institutions (such as schools of cosmetology), among others. Accordingly, 6,896 institutions and 83 administrative offices (central or system offices) in the United States and other jurisdictions were expected to participate in the fall collection. Four of the U.S. service academies are included in the IPEDS universe as if they were Title IV institutions.3 Other institutions that do not participate in Title IV programs may participate in the IPEDS data collection on a voluntary basis.
During fall 2009, institutions provided data on institutional characteristics, price of attendance, and tuition and fees for the 2009-10 academic year, completions data (degrees, certificates, and other formal awards conferred) for the 2008-09 academic year, and 12-month enrollment data for the 2008-09 academic year. Information regarding IPEDS survey procedures and response rates is available in appendix A. Detailed definitions of terms used in this report are available in appendix B.
Institutional Characteristics, Price of Attendance, and Tuition and Fees
The Institutional Characteristics (IC) component of IPEDS collects and maintains information used to classify postsecondary institutions based on a variety of characteristics. Data on level (4-year, 2-year, less-than-2-year), control (public, private not-for-profit, private for-profit), and sector (level crossed with control) allow classification within general categories. More specific categories of institutions can be defined by using additional data, such as types of programs 1 The other jurisdictions surveyed in IPEDS are American Samoa, the Federated States of Micronesia, Guam, the Marshall Islands, the Northern Marianas, Palau, Puerto Rico, and the Virgin Islands. 2 Institutions participating in Title IV programs are accredited by an agency or organization recognized by the Secretary of the U.S. Department of Education, have a program of more than 300 clock hours or 8 credit hours, have been in business for at least 2 years, and have a signed Program Participation Agreement with the Office of Postsecondary Education, U.S. Department of Education. 3 The four U.S. service academies that are not Title IV–eligible are the U.S. Naval Academy, the U.S. Military Academy, the U.S. Coast Guard Academy, and the U.S. Air Force Academy. One academy, the U.S. Merchant Marine Academy, is Title IV–eligible. Data for all five institutions are included in the tables and counts of institutions unless otherwise indicated.
1
offered, levels of degrees and awards, calendar system, admission requirements, student charges, and basic enrollment information.
In addition, the IC component collects data on tuition and fees (by level of program: undergraduate and graduate) and room and board charges. Price of attendance is also collected for full-time, first-time degree/certificate-seeking undergraduate students.
Price of attendance is the total amount institutions estimate that undergraduate-level full-time, first-time degree-seeking students will pay to attend before financial aid is considered. This price includes tuition and fees, books and supplies, room and board, and certain other designated expenses such as transportation. These estimates are the average amounts used by the financial aid office to determine a student’s financial aid.
Completions
The Completions component collects data annually on recognized program completions4 in postsecondary education programs by level of degree (associate’s, bachelor’s, master’s, doctor’s, and first-professional) and on other formal awards by length of program. Data are collected on the race/ethnicity and gender of recipients and their fields of study. In addition, completions data on the number of students with multiple majors are collected by field of study, degree level, race/ethnicity, and gender from those schools that award degrees with multiple majors. The data from this component reflect all formal awards (i.e., degrees, diplomas, certificates) conferred between July 1, 2008, and June 30, 2009.
12-Month Enrollment
The 12-Month Enrollment component collects unduplicated headcount enrollment and instructional activity data at each institution for the academic year. The unduplicated headcount part of this component collects race/ethnicity, gender, and level of study (undergraduate, graduate, or first-professional) for each individual enrolled during the reporting period. The instructional activity portion of this component collects the number of contact or credit hours attempted by undergraduate and graduate students enrolled for credit. Activity data is classified as undergraduate or graduate level by course, not by student level of study. Credit and contact hours are not collected for first-professional students.
Changes in Reporting Categories
Beginning in fall 2008, several changes began to take effect regarding reporting of data (1) by race/ethnicity and (2) by level of study/level of award.5 These changes are being phased in over several IPEDS collections. As a result of the optional reporting categories in use during the adoption period, caution should be exercised when drawing conclusions from the data presented in this First Look. Data presented in this report on students of two or more races are based on only those institutions that reported using the optional new race/ethnicity categories and are not representative of all students who could be classified into two or more races. Also, data in this First Look regarding first-professional students are based solely on those institutions that 4 Recognized program completions are those where an award has officially been conferred. This does not include completions where the requirements for the award have been satisfied, but the award has not yet been conferred. 5 For more information, see http://nces.ed.gov/ipeds/submit_data/changes0809.asp.
2

3
reported using the old level of student categories and cannot be considered representative of all students enrolled in programs that were formerly classified as first-professional. Comparisons between data from prior IPEDS collections and the data presented in this First Look should be undertaken with caution for these same reasons. Please see the Changes in Reporting Categories section of appendix A for details.
Focus of This Report
Tabulations in this report focus on selected data items collected in fall 2009 from 6,822 Title IV institutions and administrative offices in the United States. Table 1 also includes the 154 Title IV institutions in the other jurisdictions. Since table 1 only pertains to institutions, the 3 administrative offices located in the other jurisdictions are not included in the table. Unless otherwise indicated, imputed data were included in the tabulations in place of missing data for institutions that did not report values for the necessary items. The selected items in this report, as well as the other items collected in fall 2009, are available through the IPEDS Data Center.6
Several tables in this First Look display trends over time. In table 4, the time points displayed were chosen to demonstrate the range of data available from IPEDS for trend analysis, not to emphasize any particular period of change. In tables 5 and 6, the time period of three years was chosen to reflect the same period as the College Affordability Index (CAI). The CAI, which is calculated over a three year period, is the ratio of the percentage change in tuition and required fees for full-time, first-time undergraduate students to the percentage change in the Consumer Price Index. No comparison of tables 5 and 6 to the CAI is intended. Instead, tables 5 and 6 provide an additional, complementary source of information on the change in the price of attendance for full-time, first-time undergraduate students.
6 See http://nces.ed.gov/ipeds.

4
Selected Findings
Institutional Characteristics of Title IV Institutions • In 2009-10, there were 6,896 institutions in the United States and other jurisdictions; 2,853
were classified as 4-year institutions, 2,259 were 2-year institutions, and the remaining 1,784 were less-than-2-year institutions (table 1).
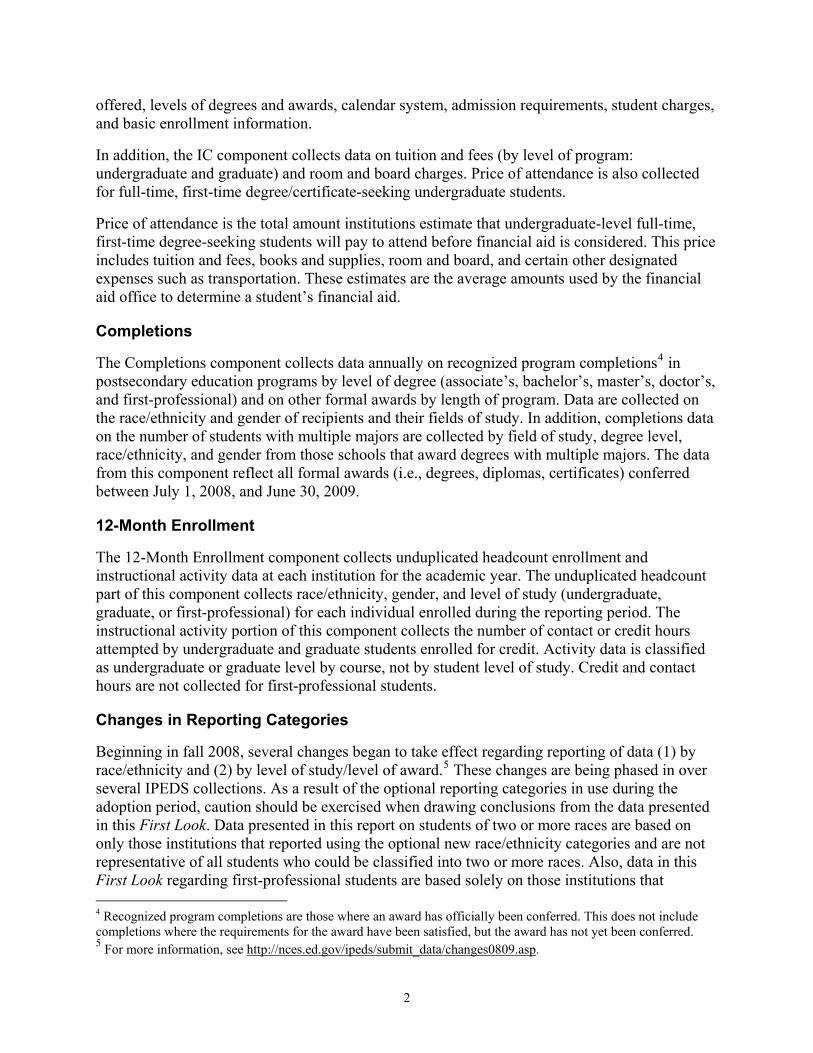
• In the United States, 29 percent of institutions reported offering a program higher than a bachelor’s degree as their highest offering, 12 percent of institutions reported offering a bachelor’s degree as their highest offering, 33 percent reported offering an associate’s degree or an award of at least 2 but less than 4 years as their highest offering, and 25 percent reported offering an award of less than 2 years as their highest offering (table 2).
Tuition and Fees Charged to Full-Time Undergraduate Students at Title IV Institutions in the United States • During 2009-10, 4-year public institutions reported average tuition and required fees7 of
approximately $6,400 for in-state students and about $15,100 for out-of-state students (table 3). Four-year private not-for-profit institutions8 reported charging approximately $21,100, on average, and private for-profit institutions reported charging an average of about $15,700.
• Between 2000-01 and 2009-10, 4-year public institutions reported a 46 percent increase in average inflation-adjusted in-state tuition and required fees and a 34 percent increase in average inflation-adjusted out-of-state tuition and required fees (table 4). Over the same 10-year period, 4-year private not-for-profit institutions reported a 31 percent increase and private for-profit institutions reported a 20 percent increase in average inflation-adjusted tuition and required fees.
Price of Attendance for Full-Time, First-Time Degree/Certificate-Seeking Undergraduate Students at Title IV Institutions in the United States • Between 2007-08 and 2009-10, public institutions reported a 9.1 percent increase in average
inflation-adjusted in-state tuition and required fees and a 7.5 percent increase in average inflation-adjusted out-of-state tuition and required fees (table 5). Over the same period, private not-for-profit institutions reported a 6.6 percent increase and private for-profit institutions reported a 5.2 percent increase in average inflation-adjusted tuition and required fees.
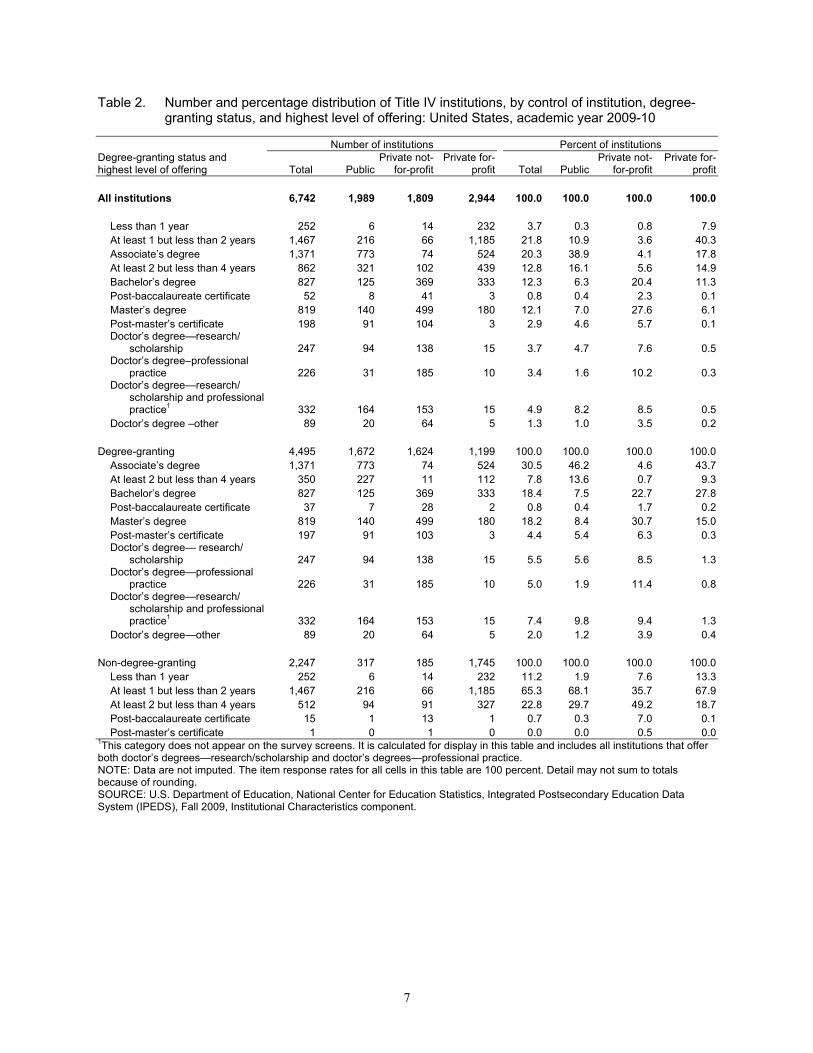
• Among 4-year institutions, private for-profit institutions reported the highest average price of attendance during 2009-10 for students living on campus (approximately $36,700), slightly higher than the average for private not-for-profit institutions (about $34,200) (table 6). Public institutions reported an average price of attendance of approximately $18,600 for in-state students living on campus and $27,700 for out-of-state students living on campus.
7 Tuition and required fees are average institutional charges for all full-time students at the institution as reported by the institution, not average amounts paid by students (i.e., charges are not weighted by enrollment). 8 Figures provided for private institutions are based on out-of-state residency only. Tuition and fees at nine private institutions (four 4-year not-for-profit institutions, four 2-year not-for-profit institutions, and one 2-year for-profit institution) varied by residency.

5
Completions at Title IV Institutions in the United States During 2008-09 • Of the 2.6 million degrees awarded by 4-year institutions, 42 percent were awarded to men
and 58 percent to women (table 7). Of the almost 574,000 degrees awarded by 2-year institutions, 38 percent were awarded to men and 62 percent to women.
• Institutions reported conferring about 4.1 million postsecondary awards (degrees or certificates) (table 8). About 769,000 were less than 2 year certificates, 824,000 were associate’s degrees or at least 2 but less than 4 year certificates, 1.6 million were bachelor’s degrees, and 863,000 were graduate degrees and certificates.
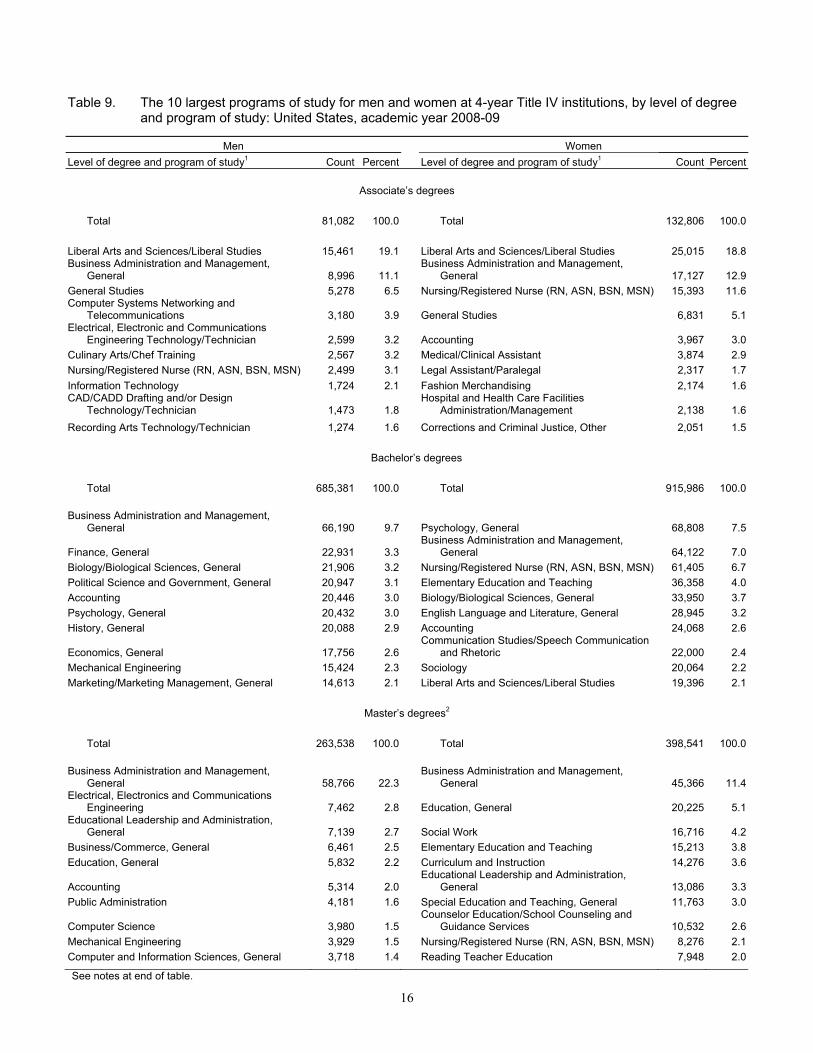
• At 4-year institutions, the largest program of study for bachelor’s degree recipients for men was Business Administration and Management (10 percent of the approximately 690,000 degrees); the largest for women was Psychology (8 percent of the approximately 920,000 degrees), followed closely by Business Administration and Management (7 percent) (table 9). Business Administration and Management was also the largest program of study for master’s degree recipients for both men (22 percent of the approximately 260,000 degrees) and women (11 percent of the approximately 400,000 degrees). Law was the largest program of study for both men and women who earned doctor’s degrees9 (32 percent of the approximately 80,000 degrees awarded to men and 26 percent of the approximately 80,000 degrees awarded to women).
12-Month Enrollment at Title IV Institutions in the United States During 2008-09 • Institutions reported a 12-month unduplicated headcount enrollment totaling 27.4 million
individual students (table 10). Of these, 23.7 million were undergraduates, 3.5 million were graduate students, and 197,000 were first-professional students.
• Institutions reported full-time-equivalent enrollment of 16.5 million graduate and undergraduate students10 (table 11).
9 Doctoral level degrees reported as first-professional degrees by institutions not utilizing the optional new levels of award were included when calculating the largest doctoral program of study. 10 Full-time-equivalent enrollment does not represent first-professional students for the 247 institutions still utilizing that reporting category since credit hour activity is not collected for first-professional students.

6
Table 1. Number and percentage distribution of Title IV institutions, by control of institution, level of institution, and region: United States and other jurisdictions, academic year 2009-10
Level of institution and region
Number of institutions Percent of institutions
Total PublicPrivate not-
for-profitPrivate for-
profit Total Public Private not-
for-profit Private for-
profit
Total institutions 6,896 2,015 1,865 3,016 100.0 100.0 100.0 100.0 Total U.S. institutions 6,742 1,989 1,809 2,944 97.8 98.7 97.0 97.6 Level of institution
4-year 2,853 690 1,592 571 41.4 34.2 85.4 18.9U.S. 2,790 673 1,553 564 40.5 33.4 83.3 18.7Other jurisdictions 63 17 39 7 0.9 0.8 2.1 0.2
2-year 2,259 1,103 182 974 32.8 54.7 9.8 32.3U.S. 2,233 1,094 176 963 32.4 54.3 9.4 31.9Other jurisdictions 26 9 6 11 0.4 0.4 0.3 0.4
Less-than-2-year 1,784 222 91 1,471 25.9 11.0 4.9 48.8U.S. 1,719 222 80 1,417 24.9 11.0 4.3 47.0Other jurisdictions 65 0 11 54 0.9 0.0 0.6 1.8
Region
New England 409 93 170 146 5.9 4.6 9.1 4.8Mid East 1,103 272 427 404 16.0 13.5 22.9 13.4Great Lakes 1,052 278 308 466 15.3 13.8 16.5 15.5Plains 624 195 199 230 9.0 9.7 10.7 7.6Southeast 1,658 576 364 718 24.0 28.6 19.5 23.8Southwest 700 239 89 372 10.2 11.9 4.8 12.3Rocky Mountains 253 81 28 144 3.7 4.0 1.5 4.8Far West 938 250 224 464 13.6 12.4 12.0 15.4U.S. service academies 5 5 0 0 0.1 0.2 0.0 0.0Other jurisdictions 154 26 56 72 2.2 1.3 3.0 2.4
NOTE: Data are not imputed. The item response rates for all cells in this table are 100 percent. The New England region includes Connecticut, Maine, Massachusetts, New Hampshire, Rhode Island, and Vermont. The Mid East region includes Delaware, the District of Columbia, Maryland, New Jersey, New York, and Pennsylvania. The Great Lakes region includes Illinois, Indiana, Michigan, Ohio, and Wisconsin. The Plains region includes Iowa, Kansas, Minnesota, Missouri, Nebraska, North Dakota, and South Dakota. The Southeast region includes Alabama, Arkansas, Florida, Georgia, Kentucky, Louisiana, Mississippi, North Carolina, South Carolina, Tennessee, Virginia, and West Virginia. The Southwest region includes Arizona, New Mexico, Oklahoma, and Texas. The Rocky Mountains region includes Colorado, Idaho, Montana, Utah, and Wyoming. The Far West region includes Alaska, California, Hawaii, Nevada, Oregon, and Washington. The other jurisdictions include American Samoa, the Federated States of Micronesia, Guam, the Marshall Islands, the Northern Marianas, Palau, Puerto Rico, and the Virgin Islands. Detail may not sum to totals because of rounding. SOURCE: U.S. Department of Education, National Center for Education Statistics, Integrated Postsecondary Education Data System (IPEDS), Fall 2009, Institutional Characteristics component.
7
Table 2. Number and percentage distribution of Title IV institutions, by control of institution, degree-
granting status, and highest level of offering: United States, academic year 2009-10
Degree-granting status and highest level of offering
Number of institutions Percent of institutions
Total PublicPrivate not-
for-profitPrivate for-
profit Total Public Private not-
for-profit Private for-
profit
All institutions 6,742 1,989 1,809 2,944 100.0 100.0 100.0 100.0
Less than 1 year 252 6 14 232 3.7 0.3 0.8 7.9At least 1 but less than 2 years 1,467 216 66 1,185 21.8 10.9 3.6 40.3Associate’s degree 1,371 773 74 524 20.3 38.9 4.1 17.8At least 2 but less than 4 years 862 321 102 439 12.8 16.1 5.6 14.9Bachelor’s degree 827 125 369 333 12.3 6.3 20.4 11.3Post-baccalaureate certificate 52 8 41 3 0.8 0.4 2.3 0.1Master’s degree 819 140 499 180 12.1 7.0 27.6 6.1Post-master’s certificate 198 91 104 3 2.9 4.6 5.7 0.1Doctor’s degree—research/
scholarship 247 94 138 15 3.7 4.7 7.6 0.5Doctor’s degree–professional
practice 226 31 185 10 3.4 1.6 10.2 0.3Doctor’s degree—research/
scholarship and professional practice1 332 164 153 15 4.9 8.2 8.5 0.5
Doctor’s degree –other 89 20 64 5 1.3 1.0 3.5 0.2 Degree-granting 4,495 1,672 1,624 1,199 100.0 100.0 100.0 100.0
Associate’s degree 1,371 773 74 524 30.5 46.2 4.6 43.7At least 2 but less than 4 years 350 227 11 112 7.8 13.6 0.7 9.3Bachelor’s degree 827 125 369 333 18.4 7.5 22.7 27.8Post-baccalaureate certificate 37 7 28 2 0.8 0.4 1.7 0.2Master’s degree 819 140 499 180 18.2 8.4 30.7 15.0Post-master’s certificate 197 91 103 3 4.4 5.4 6.3 0.3Doctor’s degree— research/
scholarship 247 94 138 15 5.5 5.6 8.5 1.3Doctor’s degree—professional
practice 226 31 185 10 5.0 1.9 11.4 0.8Doctor’s degree—research/
scholarship and professional practice1 332 164 153 15 7.4 9.8 9.4 1.3
Doctor’s degree—other 89 20 64 5 2.0 1.2 3.9 0.4 Non-degree-granting 2,247 317 185 1,745 100.0 100.0 100.0 100.0
Less than 1 year 252 6 14 232 11.2 1.9 7.6 13.3At least 1 but less than 2 years 1,467 216 66 1,185 65.3 68.1 35.7 67.9At least 2 but less than 4 years 512 94 91 327 22.8 29.7 49.2 18.7Post-baccalaureate certificate 15 1 13 1 0.7 0.3 7.0 0.1Post-master’s certificate 1 0 1 0 0.0 0.0 0.5 0.0
1This category does not appear on the survey screens. It is calculated for display in this table and includes all institutions that offer both doctor’s degrees—research/scholarship and doctor’s degrees—professional practice. NOTE: Data are not imputed. The item response rates for all cells in this table are 100 percent. Detail may not sum to totals because of rounding. SOURCE: U.S. Department of Education, National Center for Education Statistics, Integrated Postsecondary Education Data System (IPEDS), Fall 2009, Institutional Characteristics component.

8
Table 3. Average, median, and number of institutions reporting academic year
tuition and required fees for full-time students at Title IV institutions, by control of institution, student level, and level of institution: United States, academic year 2009-10
Student level and level of institution Public Private not-
for-profit1 Private for-
profit1In-state Out-of-state
Average tuition and required fees
Undergraduate 4-year $6,393 $15,078 $21,050 $15,715 2-year 2,970 6,187 10,266 14,280 Less-than-2-year 5,106 5,584 8,982 12,807
Graduate2 7,943 15,762 14,984 14,687
Median tuition and required fees
Undergraduate 4-year 6,033 14,648 21,120 14,800 2-year 2,834 5,850 9,158 13,200 Less-than-2-year 4,760 4,760 8,710 13,259
Graduate2 7,238 15,430 12,625 12,990
Number of institutions reporting tuition and required fees
Undergraduate 4-year 652 652 1,297 513 2-year 1,006 1,006 140 436 Less-than-2-year 44 44 15 68
Graduate2 561 561 1,116 218 1Out-of-state average and median tuition and required fees were used for private institutions that reported varying tuitions by residency. 2Tuition and fee charges for graduate students do not include charges for programs designated as doctor’s degrees—professional practice. NOTE: Tuition and required fees are average institutional charges for all full-time students at the institution as reported by the institution, not average amounts paid by students (i.e., charges are not weighted by enrollment). These figures for undergraduates differ from the pricing data in table 5 that apply only to full-time, first-time degree/certificate-seeking undergraduates. The 2,269 institutions with academic calendars that differ by program or allow continuous enrollment are not included. U.S. service academies are not included. Medians were calculated using SAS, Version 9, Proc Univariate. SOURCE: U.S. Department of Education, National Center for Education Statistics, Integrated Postsecondary Education Data System (IPEDS), Fall 2009, Institutional Characteristics component.

9
Table 4. Average and median tuition and required fees, percentage change in average and
median tuition and required fees, and number of institutions reporting academic year tuition and required fees, measured in constant 2009-10 dollars, for full-time students at Title IV institutions, by student level, sector, and residency: United States, academic years 2000-01, 2003-04, 2006-07, and 2009-10
Student level, sector, and residency
Academic year Percent change 2000-01 to
2009-102000-01 2003-04 2006-07 2009-10
Average tuition and required fees1
Undergraduate Public 4-year
In-state $4,376 $5,292 $5,848 $6,393 46.1Out-of-state 11,223 13,137 13,974 15,078 34.3
Public 2-year In-state 2,230 2,612 2,814 2,970 33.2Out-of-state 5,387 5,936 6,114 6,187 14.8
Public less-than-2-year In-state 5,020 5,703 5,998 5,106 1.7Out-of-state 5,518 6,395 6,387 5,584 1.2
Private not-for-profit 4-year 16,094 17,629 19,094 21,050 30.8Private not-for-profit 2-year 8,264 9,010 9,644 10,266 24.2Private not-for-profit less-than-2-year 8,177 10,358 8,863 8,982 9.8Private for-profit 4-year 13,100 14,027 15,176 15,715 20.0Private for-profit 2-year 11,291 12,720 12,728 14,280 26.5Private for-profit less-than-2-year 9,780 11,287 11,945 12,807 31.0
Graduate2 Public 4-year
In-state 4,943 6,203 7,012 7,943 60.7Out-of-state 11,317 13,409 14,487 15,762 39.3
Private not-for-profit 4-year 12,531 13,218 14,065 14,984 19.6Private for-profit 4-year 15,016 14,145 14,711 14,687 -2.2
Median tuition and required fees1
Undergraduate
Public 4-year In-state $4,055 $4,876 $5,514 $6,033 48.8Out-of-state 11,075 12,647 13,781 14,648 32.3
Public 2-year In-state 1,900 2,434 2,630 2,834 49.2Out-of-state 5,062 5,703 5,784 5,850 15.6
Public less-than-2-year In-state 4,119 4,917 5,214 4,760 15.6Out-of-state 4,361 5,646 5,321 4,760 9.1
Private not-for-profit 4-year 15,970 17,613 19,002 21,120 32.2Private not-for-profit 2-year 8,411 8,967 9,507 9,158 8.9Private not-for-profit Less-than-2-year 7,080 9,681 8,306 8,710 23.0Private for-profit 4-year 12,912 12,740 14,185 14,800 14.6Private for-profit 2-year 10,396 11,537 11,861 13,200 27.0Private for-profit less-than-2-year 9,205 10,710 11,955 13,259 44.0
Graduate2 Public 4-year
In-state 4,503 5,562 6,404 7,238 60.7Out-of-state 10,728 12,567 14,084 15,430 43.8
Private not-for-profit 4-year 10,684 11,226 11,938 12,625 18.2Private for-profit 4-year 16,039 11,333 13,281 12,990 -19.0
See notes at end of table.

10
Table 4. Average and median tuition and required fees, percentage change in average and
median tuition and required fees, and number of institutions reporting academic year tuition and required fees, measured in constant 2009-10 dollars, for full-time students at Title IV institutions, by student level, sector, and residency: United States, academic years 2000-01, 2003-04, 2006-07, and 2009-10—Continued
Student level, sector, and residency
Academic year Percent change 2000-01 to
2009-102000-01 2003-04 2006-07 2009-10
Number of institutions reporting tuition and required fees
Undergraduate Public 4-year
In-state 595 608 619 652 9.6Out-of-state 595 608 619 652 9.6
Public 2-year In-state 1,112 1,105 1,063 1,006 -9.5Out-of-state 1,113 1,106 1,063 1,006 -9.6
Public less-than-2-year In-state 89 88 49 44 -50.6Out-of-state 89 87 49 44 -50.6
Private not-for-profit 4-year 1,258 1,300 1,294 1,297 3.1Private not-for-profit 2-year 214 204 179 140 -34.6Private not-for-profit Less-than-2-year 20 28 12 15 -25.0Private for-profit 4-year 161 310 413 513 218.6Private for-profit 2-year 363 401 382 436 20.1Private for-profit less-than-2-year 101 133 88 68 -32.7
Graduate2 Public 4-year
In-state 516 543 554 561 8.7Out-of-state 516 544 554 561 8.7
Private not-for-profit 4-year 933 1,011 1,058 1,116 19.6Private for-profit 4-year 97 162 188 218 124.7
1Out-of-state average and median tuition and required fees were used for private institutions that reported varying tuitions by residency. 2Tuition and fee charges for graduate students do not include charges for programs designated as doctor’s degrees—professional practice. NOTE: Tuition and required fees are average institutional charges for all full-time students at the institution as reported by the institution, not average amounts paid by students (i.e., charges are not weighted by enrollment). The time points displayed in this table were chosen to demonstrate the range of data available from IPEDS for trend analysis, not to emphasize any particular period of change. Data for years included in the range of this table, but not specifically displayed in the table, are available via the IPEDS Data Center. These figures for undergraduates differ from the pricing data in table 5 that apply only to full-time, first-time degree/certificate-seeking undergraduates. Institutions with academic calendars that differ by program or allow continuous enrollment (2,269 in fall 2009, 2,141 in fall 2006, 1,929 in fall 2003, and 1,836 in fall 2000) are not included. U.S. service academies are not included. All amounts from prior years were converted to 2009-10 dollars using the average Consumer Price Index values for the 12-month period ending in October of the academic year the data represent (e.g., October 2000) and the CPI value for the 12-month period ending in October 2009. Medians were calculated using SAS, Version 9, Proc Univariate. SOURCE: U.S. Department of Education, National Center for Education Statistics, Integrated Postsecondary Education Data System (IPEDS), Fall 2000, Fall2003, Fall2006, and Fall 2009, Institutional Characteristics component.

11
Table 5. Average components of academic year price of attendance and percentage change in
average components of price of attendance, measured in constant 2009-10 dollars, for full-time, first-time degree/certificate-seeking undergraduates at Title IV institutions, by level and control of institution, residency, and student housing: United States, academic years 2007-08 and 2009-10
Component of price, control of institution, residency, and student housing
4-year 2-year Less-than-2-year
2007-08 2009-10Percent change 2007-08 2009-10
Percent change 2007-08 2009-10
Percent change
Tuition and required fees
Public In-district1 $5,862 $6,394 9.1 $2,366 $2,527 6.8 $4,862 $5,124 5.4In-state 5,865 6,397 9.1 2,789 2,979 6.8 4,887 5,148 5.3Out-of-state 14,006 15,062 7.5 6,077 6,223 2.4 5,368 5,638 5.0
Private not-for-profit 20,009 21,324 6.6 10,630 11,413 7.4 9,474 10,098 6.6Private for-profit 14,885 15,661 5.2 13,315 14,344 7.7 11,801 12,916 9.5
Books and supplies Public 1,112 1,171 5.3 1,136 1,212 6.7 1,011 1,030 1.8Private not-for-profit 1,045 1,105 5.7 1,157 1,272 10.0 883 986 11.6Private for-profit 1,253 1,364 8.9 1,450 1,649 13.7 936 1,036 10.6
Room and board Public
On campus 7,179 7,686 7.1 4,746 5,103 7.5 † † †Off campus (not with family) 8,025 8,543 6.4 6,959 7,289 4.7 6,522 6,671 2.3
Private not-for-profit On campus 7,634 8,047 5.4 5,864 6,303 7.5 2,984 2,975 -0.3Off campus (not with family) 8,023 8,336 3.9 8,297 8,582 3.4 8,611 8,779 1.9
Private for-profit On campus 9,004 9,416 4.6 7,754 8,040 3.7 3,108 3,300 6.2Off campus (not with family) 9,045 9,210 1.8 7,768 7,896 1.6 7,354 7,742 5.3
Other expenses
Public On campus 3,021 3,144 4.1 2,754 2,882 4.7 † † †Off campus (not with family) 3,692 3,854 4.4 3,409 3,643 6.9 3,130 3,188 1.9Off campus (with family) 3,651 3,848 5.4 3,497 3,729 6.6 3,330 3,419 2.7
Private not-for-profit On campus 2,423 2,544 5.0 2,657 2,889 8.7 5,449 5,550 1.9Off campus (not with family) 3,184 3,344 5.0 3,758 3,936 4.7 2,748 2,850 3.7Off campus (with family) 3,443 3,593 4.3 3,772 3,974 5.4 4,282 4,338 1.3
Private for-profit On campus 4,139 4,477 8.1 3,859 4,031 4.4 4,670 7,500 60.6Off campus (not with family) 5,203 5,533 6.3 3,728 3,984 6.9 3,598 3,904 8.5Off campus (with family) 5,810 6,165 6.1 3,939 4,192 6.4 3,181 3,447 8.4
† Not applicable. 1For public institutions, “in district” refers to the charges paid by a student who lives in the locality surrounding the institution, such as county. NOTE: Amounts are institutional averages as reported by the institution, not average amounts paid by students (i.e., charges are not weighted by enrollment). The time period of the percentage change in this table was chosen to reflect the same period as the College Affordability Index. The College Affordability Index, which is calculated over a three year period, is the ratio of the percentage change in tuition and required fees for full-time, first-time undergraduate students to the percentage change in the Consumer Price Index (CPI). Out-of-state average tuition and required fees were used for private institutions that reported varying tuitions by residency. These figures may differ from the tuition and required fee charges in table 3 and table 4 that apply to all full-time undergraduates. The average components of academic year price of attendance in this table may not sum to the corresponding average price of attendance in table 6 because not all institutions report all components of academic year price of attendance separately (e.g., an institution may report a comprehensive fee in lieu of the individual components). The 2,226 institutions with academic calendars that differ by program or allow continuous enrollment are not included. U.S. service academies are not included. All amounts from 2007-08 were converted to 2009-10 dollars using the average CPI values for the 12-month periods ending in October 2007 and October 2009. SOURCE: U.S. Department of Education, National Center for Education Statistics, Integrated Postsecondary Education Data System (IPEDS), Fall 2009, Institutional Characteristics component.
12
Table 6. Average academic year price of attendance and percentage change in average price of
attendance, measured in constant 2009-10 dollars, for full-time, first-time degree/certificate-seeking undergraduates at Title IV institutions, by level and control of institution, student housing, and residency: United States, academic years 2007-08 and 2009-10
Control of institution, student housing, and residency
4-year 2-year Less-than-2-year
2007-08 2009-10Percent change 2007-08 2009-10
Percent change 2007-08 2009-10
Percent change
Public
On campus1 In-district2 $17,183 $18,598 8.2 $10,945 $11,880 8.5 $† $† †In-state 17,185 18,599 8.2 11,171 12,115 8.5 † † †Out-of-state 25,694 27,687 7.8 13,639 14,436 5.8 † † †
Off campus (not with family)3
In-district2 18,608 19,902 7.0 13,849 14,652 5.8 15,478 15,964 3.1In-state 18,612 19,906 7.0 14,276 15,109 5.8 15,503 15,988 3.1Out-of-state 26,798 28,620 6.8 17,552 18,337 4.5 15,984 16,478 3.1
Off campus (with family)3 In-district2 10,541 11,353 7.7 6,977 7,450 6.8 9,156 9,525 4.0In-state 10,545 11,357 7.7 7,404 7,906 6.8 9,181 9,548 4.0Out-of-state 18,731 20,071 7.2 10,680 11,134 4.3 9,662 10,038 3.9
Private not-for-profit
On campus1 32,159 34,160 6.2 22,207 23,834 7.3 20,068 20,597 2.6Off campus (not with family)3 29,987 31,708 5.7 23,550 24,859 5.6 21,429 22,460 4.8Off campus (with family)3 22,238 23,636 6.3 15,267 16,316 6.9 14,351 15,168 5.7
Private for-profit On campus1 34,548 36,665 6.1 27,648 29,544 6.9 31,962 38,250 19.7Off campus (not with family)3 29,992 31,322 4.4 25,964 27,488 5.9 23,437 25,309 8.0Off campus (with family)3 21,572 22,761 5.5 18,407 19,801 7.6 15,665 17,110 9.2
† Not applicable. 1On-campus average price is based on those institutions that offer on-campus housing and/or meal service. 2For public institutions, “in district” refers to the charges paid by a student who lives in the locality surrounding the institution, such as county. 3Off-campus average price is based on those institutions that do not require full-time, first-time students to live on campus. NOTE: Price of attendance includes tuition and required fees, books and supplies, room and board charges, and other expenses. Amounts are institutional averages as reported by the institution, not average amounts paid by students (i.e., charges are not weighted by enrollment). The time period of the percentage change was chosen to reflect the same period as the College Affordability Index. The College Affordability Index, which is calculated over a three year period, is the ratio of the percentage change in tuition and required fees for full-time, first-time undergraduate students to the percentage change in the Consumer Price Index (CPI). Out-of-state average tuition and required fees were used for private institutions that reported varying tuitions by residency. The average components of academic year price of attendance in table 5 may not sum to the corresponding average price of attendance in this table because not all institutions report all components of academic year price of attendance separately (e.g., an institution may report a comprehensive fee in lieu of the individual components). The 2,226 institutions with academic calendars that differ by program or allow continuous enrollment are not included. U.S. service academies are not included. All amounts from 2007-08 were converted to 2009-10 dollars using the average Consumer Price Index values for the 12-month periods ending in October 2007 and October 2009. SOURCE: U.S. Department of Education, National Center for Education Statistics, Integrated Postsecondary Education Data System (IPEDS), Fall 2009, Institutional Characteristics component.

13
Table 7. Number and percentage distribution of degrees conferred at Title IV institutions, by control of
institution, level of institution, gender, race/ethnicity, and degree level: United States, academic year 2008-09
Level of institution,1 gender, race/ethnicity, and degree level
All institutions Public Private not-for profit Private for-profit
NumberPercent of total Number
Percent of total Number
Percent of total Number
Percent of total
4-year institutions
Total degrees 2,631,759 100.0 1,493,193 100.0 900,665 100.0 237,901 100.0 Gender
Men 1,105,640 42.0 639,180 42.8 373,763 41.5 92,697 39.0Women 1,526,119 58.0 854,013 57.2 526,902 58.5 145,204 61.0
Race/ethnicity
American Indian or Alaska Native 17,915 0.7 11,804 0.8 4,233 0.5 1,878 0.8Asian, Native Hawaiian, or Pacific
Islander 161,992 6.2 100,536 6.7 51,554 5.7 9,902 4.2Black or African American 247,460 9.4 126,857 8.5 78,880 8.8 41,723 17.5Hispanic or Latino 186,290 7.1 114,932 7.7 50,232 5.6 21,126 8.9White 1,662,102 63.2 984,471 65.9 569,105 63.2 108,526 45.6Two or more races2 2,730 0.1 1,088 0.1 911 0.1 731 0.3Race/ethnicity unknown 204,822 7.8 72,269 4.8 85,079 9.4 47,474 20.0Nonresident alien 148,448 5.6 81,236 5.4 60,671 6.7 6,541 2.7
Degree level
Associate’s degrees 213,888 8.1 87,284 5.8 40,566 4.5 86,038 36.2Bachelor’s degrees 1,601,367 60.8 1,020,435 68.3 496,260 55.1 84,672 35.6Master’s degrees3 662,079 25.2 308,206 20.6 290,393 32.2 63,480 26.7Doctor’s degrees4 154,425 5.9 77,268 5.2 73,446 8.2 3,711 1.6
2-year institutions
Total degrees 573,557 100.0 508,823 100.0 6,363 100.0 58,371 100.0 Gender
Men 217,166 37.9 191,405 37.6 1,911 30.0 23,850 40.9Women 356,391 62.1 317,418 62.4 4,452 70.0 34,521 59.1
Race/ethnicity
American Indian or Alaska Native 5,938 1.0 5,327 1.0 157 2.5 454 0.8Asian, Native Hawaiian, or Pacific
Islander 30,758 5.4 27,629 5.4 327 5.1 2,802 4.8Black or African American 64,250 11.2 52,138 10.2 1,113 17.5 10,999 18.8Hispanic or Latino 67,154 11.7 58,097 11.4 343 5.4 8,714 14.9White 363,534 63.4 329,763 64.8 4,088 64.2 29,683 50.9Two or more races2 746 0.1 340 0.1 17 0.3 389 0.7Race/ethnicity unknown 30,163 5.3 24,998 4.9 129 2.0 5,036 8.6Nonresident alien 11,014 1.9 10,531 2.1 189 3.0 294 0.5
See notes at end of table.

14
Table 7. Number and percentage distribution of degrees conferred at Title IV institutions, by control of institution, level of institution, gender, race/ethnicity, and degree level: United States, academic year 2008-09—Continued
Level of institution,1 gender, race/ethnicity, and degree level
All institutions Public Private not-for profit Private for-profit
NumberPercent of total Number
Percent of total Number
Percent of total Number
Percent of total
2-year institutions—Continued Degree level
Associate’s degrees5 573,556 100.0 508,823 100.0 6,363 100.0 58,370 100.0Bachelor’s degrees6 1 # 0 0.0 0 0.0 1 #
# Rounds to zero. 1Institutions are classified as 4-year or 2-year based on the highest level of awards offered in the collection year. 2Two or more races was an optional reporting category in IPEDS 2009-10, and 424 institutions reported awarding degrees using this option. The figures reported here should not be considered representative of all completions awarded to individuals who could be classified into two or more races. 3Includes 2,812 degrees reported as first-professional degrees by 84 institutions. 4Includes 44,930 degrees reported as doctor’s degrees–professional practice by 285 institutions, and 47,189 degrees reported as first-professional degrees by 184 institutions. 5Includes 119 associate’s degrees awarded by four 2-year institutions that were classified as non-degree-granting in the collection year (2009-10). 6Includes one bachelor’s degree awarded by one institution that was a 2-year institution in the collection year (2009-10). NOTE: Awards to individuals of Hispanic or Latino ethnicity are included in the Hispanic or Latino category regardless of race. One institution that was a less-than-2-year institution in the collection year (2009-10) reported awarding 22 associate’s degrees in the reporting year (2008-09); these 22 degrees are not included in this table. Detail may not sum to totals because of rounding. SOURCE: U.S. Department of Education, National Center for Education Statistics, Integrated Postsecondary Education Data System (IPEDS), Fall 2009, Completions component.

15
Table 8. Awards conferred by Title IV institutions, by race/ethnicity, level of award, and gender: United
States, academic year 2008-09
Level of award and gender Total
Awards
AmericanIndian or
AlaskaNative
Asian, Native
Hawaiian, or Pacific
Islander
Black or African
American Hispanic or Latino White
Two or more
races1
Race/ ethnicity
unknownNonresident
alien
Total awards 4,057,501 32,958 230,014 467,010 384,860 2,475,312 5,671 292,684 168,992 Men 1,641,280 12,629 99,905 151,442 141,933 1,022,693 1,928 120,855 89,895Women 2,416,221 20,329 130,109 315,568 242,927 1,452,619 3,743 171,829 79,097
Less than 1 year 429,640 4,261 19,737 86,053 69,961 215,897 926 29,386 3,419Men 170,424 1,734 7,559 30,362 23,528 94,801 236 10,963 1,241Women 259,216 2,527 12,178 55,691 46,433 121,096 690 18,423 2,178
At least 1 but less than 2 years 339,163 4,261 13,723 60,861 55,339 180,801 1,046 20,090 3,042
Men 113,926 1,710 4,934 17,922 18,548 62,010 245 7,353 1,204Women 225,237 2,551 8,789 42,939 36,791 118,791 801 12,737 1,838
Associate’s degrees2 787,466 8,234 38,085 94,409 91,147 487,541 1,227 51,639 15,184Men 298,252 2,857 15,935 29,715 34,112 188,805 435 20,301 6,092Women 489,214 5,377 22,150 64,694 57,035 298,736 792 31,338 9,092
At least 2 but less than 4 years3 36,952 339 1,763 4,099 3,707 23,862 171 2,642 369
Men 18,265 155 839 1,982 2,361 10,930 71 1,765 162Women 18,687 184 924 2,117 1,346 12,932 100 877 207
Bachelor’s degrees4 1,601,368 11,407 104,938 145,834 120,722 1,068,983 1,759 101,842 45,883Men 685,382 4,515 47,288 49,729 47,096 469,137 742 44,542 22,333Women 915,986 6,892 57,650 96,105 73,626 599,846 1,017 57,300 23,550
Post-baccalaureate certificates 28,141 170 1,462 1,979 1,789 17,607 43 3,742 1,349
Men 9,914 46 552 601 609 6,089 13 1,365 639Women 18,227 124 910 1,378 1,180 11,518 30 2,377 710
Master’s degrees5 662,079 3,318 35,181 62,169 34,760 376,628 418 69,872 79,733Men 263,538 1,171 16,222 17,495 12,440 141,925 161 28,152 45,972Women 398,541 2,147 18,959 44,674 22,320 234,703 257 41,720 33,761
Post-master’s certificates6 18,267 74 575 2,306 613 11,501 9 1,838 1,351Men 5,940 21 231 429 171 3,718 1 618 751Women 12,327 53 344 1,877 442 7,783 8 1,220 600
Doctor’s degrees7 154,425 894 14,550 9,300 6,822 92,492 72 11,633 18,662Men 75,639 420 6,345 3,207 3,068 45,278 24 5,796 11,501Women 78,786 474 8,205 6,093 3,754 47,214 48 5,837 7,161
1Two or more races was an optional reporting category in IPEDS 2009-10, and a total of 771 institutions reported awarding degrees or certificates using this option. The figures reported here should not be considered representative of all completions awarded to individuals who could be classified into two or more races. 2Includes 22 associate’s degrees awarded by one institution that was a less-than-2-year institution in the collection year (2009-10) and 119 associate’s degrees awarded by four 2-year institutions that were classified as non-degree-granting in the collection year (2009-10). 3Includes 247 certificates of at least 2 but less than 4 years awarded by eight institutions that were less-than-2-year institutions in the collection year (2009-10). 4Includes one bachelor’s degree awarded by one institution that was a 2-year institution in the collection year (2009-10). 5Includes 2,812 degrees reported as first-professional degrees by 84 institutions. 6Includes 527 certificates reported as first-professional certificates by 28 institutions. 7Includes 44,930 degrees reported as doctor’s degrees–professional practice by 285 institutions, and 47,189 degrees reported as first-professional degrees by 184 institutions. NOTE: Awards to individuals of Hispanic or Latino ethnicity are included in the Hispanic or Latino category regardless of race. SOURCE: U.S. Department of Education, National Center for Education Statistics, Integrated Postsecondary Education Data System (IPEDS), Fall 2009, Completions component.
16
Table 9. The 10 largest programs of study for men and women at 4-year Title IV institutions, by level of degree
and program of study: United States, academic year 2008-09
Men Women Level of degree and program of study1 Count Percent Level of degree and program of study1 Count Percent
Associate’s degrees
Total 81,082 100.0 Total 132,806 100.0
Liberal Arts and Sciences/Liberal Studies 15,461 19.1 Liberal Arts and Sciences/Liberal Studies 25,015 18.8Business Administration and Management,
General 8,996 11.1 Business Administration and Management,
General 17,127 12.9General Studies 5,278 6.5 Nursing/Registered Nurse (RN, ASN, BSN, MSN) 15,393 11.6Computer Systems Networking and
Telecommunications 3,180 3.9 General Studies 6,831 5.1Electrical, Electronic and Communications
Engineering Technology/Technician 2,599 3.2 Accounting 3,967 3.0Culinary Arts/Chef Training 2,567 3.2 Medical/Clinical Assistant 3,874 2.9Nursing/Registered Nurse (RN, ASN, BSN, MSN) 2,499 3.1 Legal Assistant/Paralegal 2,317 1.7Information Technology 1,724 2.1 Fashion Merchandising 2,174 1.6CAD/CADD Drafting and/or Design
Technology/Technician 1,473 1.8 Hospital and Health Care Facilities
Administration/Management 2,138 1.6Recording Arts Technology/Technician 1,274 1.6 Corrections and Criminal Justice, Other 2,051 1.5
Bachelor’s degrees
Total 685,381 100.0 Total 915,986 100.0
Business Administration and Management, General 66,190 9.7 Psychology, General 68,808 7.5
Finance, General 22,931 3.3 Business Administration and Management,
General 64,122 7.0Biology/Biological Sciences, General 21,906 3.2 Nursing/Registered Nurse (RN, ASN, BSN, MSN) 61,405 6.7Political Science and Government, General 20,947 3.1 Elementary Education and Teaching 36,358 4.0Accounting 20,446 3.0 Biology/Biological Sciences, General 33,950 3.7Psychology, General 20,432 3.0 English Language and Literature, General 28,945 3.2History, General 20,088 2.9 Accounting 24,068 2.6
Economics, General 17,756 2.6 Communication Studies/Speech Communication
and Rhetoric 22,000 2.4Mechanical Engineering 15,424 2.3 Sociology 20,064 2.2Marketing/Marketing Management, General 14,613 2.1 Liberal Arts and Sciences/Liberal Studies 19,396 2.1
Master’s degrees2
Total 263,538 100.0 Total 398,541 100.0
Business Administration and Management, General 58,766 22.3
Business Administration and Management, General 45,366 11.4
Electrical, Electronics and Communications Engineering 7,462 2.8 Education, General 20,225 5.1
Educational Leadership and Administration, General 7,139 2.7 Social Work 16,716 4.2
Business/Commerce, General 6,461 2.5 Elementary Education and Teaching 15,213 3.8Education, General 5,832 2.2 Curriculum and Instruction 14,276 3.6
Accounting 5,314 2.0 Educational Leadership and Administration,
General 13,086 3.3Public Administration 4,181 1.6 Special Education and Teaching, General 11,763 3.0
Computer Science 3,980 1.5 Counselor Education/School Counseling and
Guidance Services 10,532 2.6Mechanical Engineering 3,929 1.5 Nursing/Registered Nurse (RN, ASN, BSN, MSN) 8,276 2.1Computer and Information Sciences, General 3,718 1.4 Reading Teacher Education 7,948 2.0
See notes at end of table.

17
Table 9. The 10 largest programs of study for men and women at 4-year Title IV institutions, by gender, level of
degree, and program of study: United States, academic year 2008-09—Continued
Men Women Level of degree and program of study1 Count Percent Level of degree and program of study1 Count Percent
Doctor’s degrees3
Total 75,639 100.0 Total 78,786 100.0
Law (LL.B., J.D.) 23,860 31.5 Law (LL.B., J.D.) 20,185 25.6Medicine (MD) 8,164 10.8 Medicine (MD) 7,823 9.9Pharmacy (PharmD [USA], PharmD or
BS/BPharm [Canada]) 4,011 5.3 Pharmacy (PharmD [USA], PharmD or
BS/BPharm [Canada]) 7,280 9.2Dentistry (DDS, DMD) 2,637 3.5 Physical Therapy/Therapist 5,106 6.5Physical Therapy/Therapist 2,086 2.8 Dentistry (DDS, DMD) 2,281 2.9
Osteopathic Medicine/Osteopathy (DO) 1,798 2.4 Educational Leadership and Administration,
General 2,163 2.7Chiropractic (DC) 1,584 2.1 Osteopathic Medicine/Osteopathy (DO) 1,867 2.4Electrical, Electronics and Communications
Engineering 1,519 2.0 Veterinary Medicine (DVM) 1,851 2.3Chemistry, General 1,501 2.0 Clinical Psychology 1,767 2.2Educational Leadership and Administration,
General 1,176 1.6 Psychology, General 1,085 1.41Degrees by program of study (6-digit Classification of Instructional Programs [CIP] level) are based on the 2000 version of the ClPs. 2A total of 2,812 degrees reported as first-professional degrees by 84 institutions were included when determining the 10 largest programs of study. 3A total of 44,930 degrees reported as doctor’s degrees–professional practice by 285 institutions, and 47,189 degrees reported as first-professional degrees by 184 institutions, were included when determining the 10 largest programs of study. NOTE: Largest program of study is based on the first major for degrees awarded with multiple majors. SOURCE: U.S. Department of Education, National Center for Education Statistics, Integrated Postsecondary Education Data System (IPEDS), Fall 2009, Completions component.

18
Table 10. 12-month unduplicated headcount enrollment at Title IV institutions, by student
level, institution sector, race/ethnicity, and gender: United States, academic year 2008-09
Institution sector, race/ethnicity, and gender Total Undergraduate Graduate1 First-professional
Total students 27,369,242 23,668,037 3,504,144 197,061
Sector
Public 4-year 9,050,563 7,237,615 1,723,544 89,404Public 2-year2 10,452,884 10,452,789 95 0Public less-than-2-year 106,468 106,468 0 0Private not-for-profit 4-year 4,460,007 2,948,610 1,405,323 106,074Private not-for-profit 2-year 59,253 59,253 0 0Private not-for-profit less-than-2-year 23,888 23,888 0 0Private for-profit 4-year 2,076,225 1,699,460 375,182 1,583Private for-profit 2-year 673,785 673,785 0 0Private for-profit less-than-2-year 466,169 466,169 0 0
Race/ethnicity American Indian or Alaska Native 267,067 245,814 19,870 1,383Asian, Native Hawaiian, or Pacific
Islander 1,596,893 1,395,806 176,250 24,837Black or African American 3,661,296 3,279,696 367,011 14,589Hispanic or Latino 3,147,176 2,949,832 186,605 10,739White 15,283,861 13,214,408 1,950,592 118,861Two or more races3 36,200 33,286 2,792 122Race/ethnicity unknown 2,554,679 2,080,269 453,728 20,682Nonresident alien 822,070 468,926 347,296 5,848
Gender Male 11,604,365 10,145,229 1,359,540 99,596Female 15,764,877 13,522,808 2,144,604 97,465
1A total of 305 institutions reported unduplicated headcount enrollment using the optional revised levels of study that eliminated the first-professional category. For these institutions, students formerly classified as first-professional students are now classified as graduate students. 2One 2-year institution reported students enrolled in graduate-level courses. 3Two or more races was an optional reporting category in IPEDS 2009-10, and a total of 1,351 institutions reported unduplicated headcount enrollment using this option. The figures reported here should not be considered representative of the unduplicated headcount enrollment of all individuals that could be classified into two or more races. NOTE: Students of Hispanic or Latino ethnicity are included in the Hispanic or Latino category regardless of race. SOURCE: U.S. Department of Education, National Center for Education Statistics, Integrated Postsecondary Education Data System (IPEDS), Fall 2009, 12-Month Enrollment component.

19
Table 11. 12-month full-time-equivalent enrollment at Title IV institutions, by student level
and institution sector: United States, academic year 2008-09
Institution sector Total Undergraduate Graduate1
Total students 16,545,130 14,463,838 2,081,292
Public 4-year 6,425,725 5,425,560 1,000,165Public 2-year2 4,495,065 4,495,026 39Public less-than-2-year 62,528 62,528 0Private not-for-profit 4-year 3,233,360 2,369,536 863,824Private not-for-profit 2-year 44,691 44,691 0Private not-for-profit less-than-2-year 17,172 17,172 0Private for-profit 4-year 1,225,408 1,008,144 217,264Private for-profit 2-year 527,616 527,616 0Private for-profit less-than-2-year 513,565 513,565 01A total of 305 institutions reported full-time-equivalent enrollment using the optional revised levels of study that eliminated the first-professional category. For these institutions, students formerly classified as first-professional students are now classified as graduate students and are included in this table. Students reported as first-professional by 247 institutions are not included in this table. 2One 2-year institution reported full-time-equivalent enrollment in graduate-level courses. NOTE: The full-time equivalent (FTE) enrollment displayed in this table is calculated from institutions’ instructional activity over a 12-month period. For institutions following a quarter calendar system, 45 undergraduate credit hours is considered 1 undergraduate FTE and 36 graduate credit hours is considered 1 graduate FTE. For institutions following a semester, trimester, 4-1-4, or other academic year calendar system, 30 undergraduate credit hours is considered 1 undergraduate FTE and 24 graduate credit hours is considered 1 graduate FTE. For all calendar systems (both academic year-based systems and continuous enrollment systems), 900 undergraduate contact hours is considered 1 undergraduate FTE. SOURCE: U.S. Department of Education, National Center for Education Statistics, Integrated Postsecondary Education Data System (IPEDS), Fall 2009, 12-Month Enrollment component.

This page intentionally left blank.

Appendix A: Survey Methodology
Overview
The Integrated Postsecondary Education Data System (IPEDS) defines a postsecondary institution as an organization that is open to the public and has a primary mission of providing education or training beyond the high school level. The primary focus of the IPEDS fall 2009 data collection was to collect data from Title IV institutions. These institutions have Program Participation Agreements (PPAs) with the Office of Postsecondary Education (OPE) within the U.S. Department of Education and thus are eligible to participate in Title IV student financial aid programs. There were 6,979 Title IV institutions1 and administrative offices located in the United States and the other jurisdictions of the United States, such as Puerto Rico,2 in the 2009-10 academic year.
The fall 2009 data collection was entirely web-based. Institutions in the universe were asked to enter their survey responses using the IPEDS data collection website. The fall 2009 IPEDS data were collected between September 2, 2009, and October 14, 2009. The collection had three components: Institutional Characteristics (IC), Completions (C), and 12-Month Enrollment (E12).
Universe, Institutions Surveyed, and Response Rates
The IPEDS universe is established during the fall collection period. For 2009-10, 56 postsecondary institutions and 1 administrative office included in prior IPEDS data collections were determined to be outside the scope of IPEDS because they were closed or were merged with another institution. Additionally, 251 postsecondary institutions were reported exclusively by a parent institution3 and are not included in the universe counts; also, 252 postsecondary institutions were added to the universe. These added schools were identified from several sources, including a universe review by state coordinators, a review of the data file maintained by OPE, and information provided by the institutions themselves.
The full set of 6,979 Title IV entities was validated by matching the IPEDS universe file with OPE’s Postsecondary Education Participation System (PEPS) file. Because most of the studies that use IPEDS data concentrate on the Title IV institutions, this group is the main focus of IPEDS. Also, according to Section 490 of the Higher Education Amendments of 1992 (P.L. 102- 325), IPEDS is mandatory for any institutions that participate in or are applicants for participation in any federal financial assistance program authorized by Title IV of the Higher Education Act of 1965, as amended (20 USC 1094(a)(17)).
1 Includes 6,896 institutions and 83 administrative (central or system) offices. The central and system offices are required to complete the Institutional Characteristics component in the fall, the Human Resources component in the winter, and the Finance component in the spring (if they have their own separate budget). 2 The other jurisdictions include American Samoa, the Federated States of Micronesia, Guam, the Marshall Islands, the Northern Marianas, Palau, Puerto Rico, and the Virgin Islands. 3 A parent institution reports data for another institution, known as the child institution.
A-1
The IPEDS database includes institutions that do not participate in Title IV financial aid programs. These institutions are invited to participate in the IPEDS program, and if they voluntarily respond to the surveys, the institutions are included in the College Navigator (http://nces.ed.gov/collegenavigator). The College Navigator is designed to help college students, prospective students, and their parents learn about admission requirements, degrees offered, costs, graduation rates, and other characteristics of institutions that they may find helpful in selecting among postsecondary institutions. For fall 2009, 151 non–Title IV institutions and administrative offices responded voluntarily (150 to IC, 150 to C, and 145 to E12).
Table A-1 provides the number of Title IV institutions and administrative offices and the component response rates by degree-granting status and by level and control of institution for the United States and other jurisdictions for the three fall components. Because Title IV institutions are the primary focus of IPEDS and they are required to respond, response rates for Title IV institutions in the fall 2009 IPEDS collection were high. Response rates for the Institutional Characteristics component are based on 6,896 institutions and 83 administrative offices (central and system offices). The IC component response rate among all Title IV entities was approximately 100.0 percent (6,976 of the 6,979 Title IV entities responded). The response rate for the C component was 99.9 percent; 6,891 out of 6,895 eligible institutions responded. The response rate for the E12 component was about 100.0 percent; 6,877 out of 6,879 eligible institutions responded.
Table A-1a provides the number of Title IV institutions and administrative offices and the survey response rates by degree-granting status and by level and control of institution for those institutions located in the United States only (excluding any other jurisdictions).
NCES statistical standards require that the potential for nonresponse bias for all institutions (including those in other jurisdictions) be analyzed for sectors for which the response rate is less than 90 percent. As shown in table A-1, no sectors required this analysis.
A-2

Table A-1. Number and percentage of Title IV institutions and administrative offices responding to the IPEDS fall 2009 data collection, by component, degree-granting status, and level and control of institution: United States and other jurisdictions
Degree-granting status and level and control of institution
Institutional Characteristics Completions 12-Month Enrollment Final
universe Number
responded Response
rate (%)Final
universeNumber
respondedResponse
rate (%)Final
universe Number
respondedResponse
rate (%)
All institutions 6,979 6,976 100.0 6,895 6,891 99.9 6,879 6,877 100.0Public 2,086 2,086 100.0 2,014 2,013 100.0 2,013 2,013 100.0Private not-for-profit 1,871 1,870 99.9 1,865 1,864 99.9 1,864 1,864 100.0Private for-profit 3,022 3,020 99.9 3,016 3,014 99.9 3,002 3,000 99.9 4-year 2,901 2,900 100.0 2,852 2,851 100.0 2,847 2,847 100.0 Public 730 730 100.0 689 689 100.0 689 689 100.0 Private not-for-profit 1,597 1,596 99.9 1,592 1,591 99.9 1,592 1,592 100.0 Private for-profit 574 574 100.0 571 571 100.0 566 566 100.0 2-year 2,292 2,292 100.0 2,259 2,259 100.0 2,254 2,254 100.0 Public 1,134 1,134 100.0 1,103 1,103 100.0 1,103 1,103 100.0 Private not-for-profit 182 182 100.0 182 182 100.0 182 182 100.0 Private for-profit 976 976 100.0 974 974 100.0 969 969 100.0 Less-than-2-year 1,786 1,784 99.9 1,784 1,781 99.8 1,778 1,776 99.9 Public 222 222 100.0 222 221 99.5 221 221 100.0 Private not-for-profit 92 92 100.0 91 91 100.0 90 90 100.0 Private for-profit 1,472 1,470 99.9 1,471 1,469 99.9 1,467 1,465 99.9 Degree-granting 4,662 4,661 100.0 4,580 4,579 100.0 4,570 4,570 100.0 4-year 2,885 2,884 100.0 2,836 2,835 100.0 2,831 2,831 100.0 Public 729 729 100.0 688 688 100.0 688 688 100.0 Private not-for-profit 1,583 1,582 99.9 1,578 1,577 99.9 1,578 1,578 100.0 Private for-profit 573 573 100.0 570 570 100.0 565 565 100.0 2-year 1,777 1,777 100.0 1,744 1,744 100.0 1,739 1,739 100.0 Public 1,039 1,039 100.0 1,008 1,008 100.0 1,008 1,008 100.0 Private not-for-profit 91 91 100.0 91 91 100.0 91 91 100.0 Private for-profit 647 647 100.0 645 645 100.0 640 640 100.0 Non-degree-granting 2,317 2,315 99.9 2,315 2,312 99.9 2,309 2,307 99.9 4-year1 16 16 100.0 16 16 100.0 16 16 100.0 Public 1 1 100.0 1 1 100.0 1 1 100.0 Private not-for-profit 14 14 100.0 14 14 100.0 14 14 100.0 Private for-profit 1 1 100.0 1 1 100.0 1 1 100.0 2-year 515 515 100.0 515 515 100.0 515 515 100.0 Public 95 95 100.0 95 95 100.0 95 95 100.0 Private not-for-profit 91 91 100.0 91 91 100.0 91 91 100.0 Private for-profit 329 329 100.0 329 329 100.0 329 329 100.0 Less-than-2-year 1,786 1,784 99.9 1,784 1,781 99.8 1,778 1,776 99.9 Public 222 222 100.0 222 221 99.5 221 221 100.0 Private not-for-profit 92 92 100.0 91 91 100.0 90 90 100.0 Private for-profit 1,472 1,470 99.9 1,471 1,469 99.9 1,467 1,465 99.91These institutions grant certificates only at the post-baccalaureate, post-master’s, and post-doctorate levels. NOTE: For the Institutional Characteristics (IC) response rates, administrative offices (central and system offices) are included in the counts according to the highest level of the institution(s) they serve because they complete the IC component. Sixteen institutions new to IPEDS were not required to respond to the 12-Month Enrollment component, but did respond to the Completions component. Data were imputed for all nonresponding institutions; however, the set of items subject to imputation varied by component. For the IC component, only data from part D (student charges) were subject to imputation. For the Completions and 12-Month Enrollment components, all data elements were subject to imputation. The other jurisdictions include American Samoa, the Federated States of Micronesia, Guam, the Marshall Islands, the Northern Marianas, Palau, Puerto Rico, and the Virgin Islands. SOURCE: U.S. Department of Education, National Center for Education Statistics, Integrated Postsecondary Education Data System (IPEDS), Fall 2009.
A-3

Table A-1a. Number and percentage of Title IV institutions and administrative offices responding to the IPEDS
fall 2009 data collection, by component, degree-granting status, and level and control of institution: United States
Degree-granting status and level and control of institution
Institutional Characteristics Completions 12-Month Enrollment Final
universe Number
responded Response
rate (%)Final
universeNumber
respondedResponse
rate (%)Final
universe Number
respondedResponse
rate (%)
All institutions 6,822 6,819 100.0 6,741 6,737 99.9 6,725 6,723 100.0Public 2,059 2,059 100.0 1,988 1,987 99.9 1,987 1,987 100.0Private not-for-profit 1,813 1,812 99.9 1,809 1,808 99.9 1,808 1,808 100.0Private for-profit 2,950 2,948 99.9 2,944 2,942 99.9 2,930 2,928 99.9 4-year 2,835 2,834 100.0 2,789 2,788 100.0 2,784 2,784 100.0 Public 712 712 100.0 672 672 100.0 672 672 100.0 Private not-for-profit 1,556 1,555 99.9 1,553 1,552 99.9 1,553 1,553 100.0 Private for-profit 567 567 100.0 564 564 100.0 559 559 100.0 2-year 2,266 2,266 100.0 2,233 2,233 100.0 2,228 2,228 100.0 Public 1,125 1,125 100.0 1,094 1,094 100.0 1,094 1,094 100.0 Private not-for-profit 176 176 100.0 176 176 100.0 176 176 100.0 Private for-profit 965 965 100.0 963 963 100.0 958 958 100.0 Less-than-2-year 1,721 1,719 99.9 1,719 1,716 99.8 1,713 1,711 99.9 Public 222 222 100.0 222 221 99.5 221 221 100.0 Private not-for-profit 81 81 100.0 80 80 100.0 79 79 100.0 Private for-profit 1,418 1,416 99.9 1,417 1,415 99.9 1,413 1,411 99.9 Degree-granting 4,573 4,572 100.0 4,494 4,493 100.0 4,484 4,484 100.0 4-year 2,819 2,818 100.0 2,773 2,772 100.0 2,768 2,768 100.0 Public 711 711 100.0 671 671 100.0 671 671 100.0 Private not-for-profit 1,542 1,541 99.9 1,539 1,538 99.9 1,539 1,539 100.0 Private for-profit 566 566 100.0 563 563 100.0 558 558 100.0 2-year 1,754 1,754 100.0 1,721 1,721 100.0 1,716 1,716 100.0 Public 1,031 1,031 100.0 1,000 1,000 100.0 1,000 1,000 100.0 Private not-for-profit 85 85 100.0 85 85 100.0 85 85 100.0 Private for-profit 638 638 100.0 636 636 100.0 631 631 100.0 Non-degree-granting 2,249 2,247 99.9 2,247 2,244 99.9 2,241 2,239 99.9 4-year1 16 16 100.0 16 16 100.0 16 16 100.0 Public 1 1 100.0 1 1 100.0 1 1 100.0 Private not-for-profit 14 14 100.0 14 14 100.0 14 14 100.0 Private for-profit 1 1 100.0 1 1 100.0 1 1 100.0 2-year 512 512 100.0 512 512 100.0 512 512 100.0 Public 94 94 100.0 94 94 100.0 94 94 100.0 Private not-for-profit 91 91 100.0 91 91 100.0 91 91 100.0 Private for-profit 327 327 100.0 327 327 100.0 327 327 100.0 Less-than-2-year 1,721 1,719 99.9 1,719 1,716 99.8 1,713 1,711 99.9 Public 222 222 100.0 222 221 99.5 221 221 100.0 Private not-for-profit 81 81 100.0 80 80 100.0 79 79 100.0 Private for-profit 1,418 1,416 99.9 1,417 1,415 99.9 1,413 1,411 99.91These institutions grant certificates only at the post-baccalaureate, post-master’s, and post-doctorate levels. NOTE: For the Institutional Characteristics (IC) response rates, administrative offices (central and system offices) are included in the counts according to the highest level of the institution(s) they serve because they complete the IC component. Sixteen institutions new to IPEDS were not required to respond to the 12-Month Enrollment component, but did respond to the Completions component. Data were imputed for all nonresponding institutions; however, the set of items subject to imputation varied by component. For the IC component, only data from part D (student charges) were subject to imputation. For the Completions and 12-Month Enrollment components, all data elements were subject to imputation. SOURCE: U.S. Department of Education, National Center for Education Statistics, Integrated Postsecondary Education Data System (IPEDS), Fall 2009.
A-4

Inflation Adjustments
Tables 4, 5, and 6 in this report are reported in constant 2009-10 dollars. To convert the previous years’ tuition, required fees, books and supplies, room and board, and other expenses data to 2009-10 dollar amounts, the average Consumer Price Index (CPI) for All Urban Consumers values for the 12-month period ending in October of the academic year the data represent were used. The ratio of the average CPI for the 12-month period ending in October 2009 to the average CPI ending in October of the appropriate prior year was multiplied by the data from the prior year to calculate the constant 2009-10 dollar amounts. These amounts were then used in the calculations shown in the table. Percentage changes in these tables reflect changes over and above changes due to inflation.
Survey Components
Institutional Characteristics—This component of the web-based survey collects basic data on each institution, such as institution name, location, educational offerings, control or affiliation, admission requirements, estimated fall enrollment, and student services. In addition, data were collected on student charges for academic year 2009-10 for each level of enrollment (undergraduate and graduate) or for the institution’s six largest programs (if programs are primarily occupational/vocational). Finally, price of attendance for full-time, first-time degree- or certificate-seeking (undergraduate) students is requested, which includes tuition and fees, books and supplies, room and board, and other expenses (such as transportation, laundry, and entertainment). Price data are those used by the institutions’ financial aid offices to determine student aid. Student charges data for undergraduates, which are the average for all full-time students, may differ from institutional pricing data, which include published tuition and fees for full-time, first-time degree/certificate-seeking students.
Completions—This component of the web-based survey collects detailed data on the number of degrees or other formal awards conferred in academic year 2008-09—by degree level, race/ ethnicity, gender, and 6-digit Classification of Instructional Program (CIP) code. Completions data on the number of students with multiple majors are collected by 6-digit CIP code, degree level, race/ethnicity, and gender from institutions that award degrees with multiple majors. Summaries by degree level, race/ethnicity, and gender based on the first two digits of the CIP code are generated by the data collection system. CIP code information is based on the 2000 version of the CIP codes.
12-Month Enrollment—This component collects enrollment data for a 12-month reporting period. Institutions indicate whether they are reporting for either July 1, 2008 through June 30, 2009, or September 1, 2008 through August 31, 2009. Total unduplicated student counts by race/ethnicity, gender, and level of student for those students enrolled during the reporting period is collected. Students who attend at different levels within the 12-month period are reported at the highest level in which the student was enrolled. Data on instructional activity for the reported students is collected and the full-time equivalent (FTE) undergraduate student enrollment and FTE graduate student enrollment are calculated. Activity data for students currently classified as first-professional are not collected, hence no first-professional FTE is calculated. Students formerly classified as first-professional who are now reported as graduate students are included
A-5

in the graduate activity data, and consequently are represented in the graduate FTE that is calculated in this component.
Changes in Reporting Categories
Beginning in fall 2008, several changes began to take effect regarding reporting of data (1) by race/ethnicity and (2) by level of study/level of award.4 These changes are being phased in over several IPEDS collections.
Regarding the changes to race/ethnicity reporting, institutions can report via the historical categories, with seven race/ethnicity categories; the new categories, with nine race/ethnicity categories; or a combination of the old and new categories. The seven historic categories are American Indian or Alaska Native; Asian, Native Hawaiian, or Pacific Islander; Black or African American; Hispanic or Latino; White; race/ethnicity unknown; and nonresident alien. The nine new categories are American Indian or Alaska Native; Asian; Black or African American; Hispanic/Latino; Native Hawaiian or other Pacific Islander; White; two or more races; race/ethnicity unknown; and nonresident alien. During the phase-in period, data reported separately in the new Asian and new Native Hawaiian or other Pacific Islander categories will be combined to correspond to the historic category of Asian, Native Hawaiian, or Pacific Islander when analyzed, discussed in findings, and displayed in tables. The Completions and 12-Month Enrollment components are both affected by these race/ethnicity reporting options.
The use of the two or more races category may decrease aggregate counts in the other race/ ethnicity categories because students classified into the two or more races category may have previously been classified into one of the other categories. For the academic year 2008-09 Completions component, 771 institutions utilized the two or more races category, reporting approximately 458,000 degree and certificate completions. Of the 458,000 completions at these institutions, about 6,000 (1 percent) were classified into the two or more races category. In total, the 458,000 completions reported at these institutions make up 11 percent of the approximately 4.1 million completions reported at all Title IV institutions. For the 12-Month Enrollment component, 1,351 institutions utilized the two or more races category, reporting a total unduplicated headcount enrollment of about 3.5 million students. Of these students, approximately 36,000 (1 percent) were classified into the two or more races category, and in total, these 3.5 million students make up 13 percent of the 27.4 million students reported at all Title IV institutions.
Changes to level of study/level of award affect the IC, Completions, and 12-Month Enrollment components. For the Completions component, institutions can continue to use the categories from previous years and report data on first-professional programs and awards, or they can report programs and awards previously classified as first-professional as master’s degrees, if appropriate, or under one of three types of doctor’s degrees: doctor’s—research/scholarship; doctor’s—professional practice; or doctor’s—other. For institutions reporting using the new categories, degrees formerly classified into a single doctor’s degrees category are now classified into one of the three types of doctor’s degrees. For the tabulations presented in this report, the three types of doctor’s degrees are combined and displayed with the doctor’s degrees of institutions using the reporting categories of previous years. Also for the tabulations presented in 4 For more information, see http://nces.ed.gov/ipeds/submit_data/changes0809.asp.
A-6

this report, degrees reported in the first-professional category were allocated to master’s or doctor’s degrees depending on the discipline in which the degree was awarded. First-professional degrees in Theology (M.Div., M.H.L., B.D., or Ordination) are included with master’s degrees; first-professional degrees in Chiropractic (D.C. or D.C.M.), Osteopathic medicine (D.O.), Dentistry (D.D.S. or D.M.D.), Pharmacy (Pharm.D.), Law (L.L.B. or J.D.), Podiatry (D.P.M., D.P., or Pod.D.), Medicine (M.D.), Optometry (O.D.), and Veterinary Medicine (D.V.M.) are included with doctor’s degrees. Certificates reported in the first-professional category were categorized as post-master’s certificates.
In the 12-Month Enrollment component, institutions can identify students as first-professional students using the old classification scheme or can classify students previously classified as first-professional as graduate students using the new categories. If institutions choose to classify these students as graduate students, then these students are included in the graduate unduplicated headcount enrollment, the graduate instructional activity data, and the graduate full-time equivalent (FTE) enrollment. For each component, the institution selects one set of categories to be used; no option to mix the categories within a component was provided. For the 2009-10 collection, use of the new categories was required for the IC component.
Reporting using the new categories that eliminate the first-professional designation impacts the aggregate counts of graduate and first-professional students. For the Completions component, 461 institutions chose to report degree and certificate completions using the new level of award categories. These institutions reported about 305,000 graduate-level awards, which is 35 percent of the approximately 863,000 total graduate level awards reported by all Title IV institutions. For the 12-Month Enrollment component, 305 institutions chose to report students formerly classified as first-professional students as graduate students. These institutions reported an unduplicated headcount of about 823,000 graduate students, which is 23 percent of the approximately 3.5 million graduate student unduplicated headcount enrollment reported by all Title IV institutions.
The lengths of the optional reporting periods for these changes differ by component and by the type of change. For the 2010-11 IPEDS collection, the first-professional designation will no longer be available for the Completions and 12-Month Enrollment components; and for the 2011-12 IPEDS collection, the use of the new race/ethnicity categories will become mandatory for the Completions and 12-Month Enrollment components.
Survey Procedures
The fall 2009 IPEDS data collection was a web-based data collection. Each institution appointed a keyholder who was responsible for ensuring that survey data submitted by the institution were correct and complete. The keyholder could generate UserIDs and passwords for up to six additional survey respondents who could also enter or review data. For many institutions, keyholders were also required to edit and “lock” the data; locking the data submits the completed data to NCES.
Many states or systems have one or more IPEDS coordinators who take responsibility for a specified group of institutions to ensure that all data are entered correctly. Some coordinators may be responsible for a system of institutions (e.g., SUNY—the State University of New York); others may coordinate all or some institutions in a state. Also, coordinators may elect to provide
A-7

different levels of review. For example, some may only view data provided by their institutions, while others may upload data from state databases, review, and/or lock data for their institutions.
In early August, letters were sent to chief executive officers (CEOs) at institutions without preexisting keyholders requesting that they appoint a keyholder for the 2009-10 collection year. The package included a letter for the keyholder and a registration certificate with the institution’s UserID and password for the entire 2009-10 collection year. Additionally, in early August, e-mail messages were sent to keyholders and coordinators who were continuing in their respective roles, providing them with their new UserID and password and requesting that they update or confirm their registration information beginning August 5, 2009. As with previous IPEDS studies, follow-ups for nonresponse were conducted. Follow-up activities began August 26, 2009, with a letter to CEOs of institutions whose keyholder had not registered. Additional follow-ups were conducted via mail, e-mail, and telephone throughout the collection period with CEOs, coordinators, and keyholders.
The web-based survey instruments offered many features to improve the quality and timeliness of the data. As indicated above, survey respondents were required to register before entering 2009-10 data to provide a point of contact between NCES/IPEDS and the institution.
Online data entry forms were tailored to each institution based on characteristics such as institutional control (public, private not-for-profit, private for-profit), level of institution (4-year, 2-year, and less-than-2-year), and calendar system (standard academic terms vs. enrollment by program).
When data from previous years were available for an institution, they were preloaded on the customized forms for easy reference and comparison purposes. Once the 2009-10 data were entered, either manually or through file upload, the keyholders were required to run edit checks and resolve all errors before they were able to lock (submit) their data. Once data were locked, they were considered submitted, regardless of whether or not a coordinator had reviewed the submission.
Once the data were complete and all locks were applied, IPEDS help desk staff conducted a final review. If any additional problems were detected, the help desk staff contacted the institutions or their coordinator to resolve any remaining questions. When all problems were resolved, the final data were migrated to the IPEDS Data Center, where they were available to other responding institutions for comparison purposes.
Edit Procedures
Edit checks are built into the web-based instrument to detect major reporting errors. The system automatically generates percentages and totals for each collection component, and compares current responses to data reported the previous year. Edit checks can be run at any time during the collection. As edit checks were executed, survey respondents were allowed to correct any errors detected by the system. If data were entered correctly but failed the edit checks, the survey respondents were asked either to confirm the data were entered correctly or to explain why the data appeared to be out of the expected data range. All edit checks had to be resolved (confirmed or explained) before each survey was permitted to be locked. In some cases, edit failures could not be confirmed or explained by the respondents, in which case they were required to contact
A-8

the IPEDS Help Desk for edit overrides. Survey respondents were also provided with one or more context boxes on each survey component and were encouraged to use this area to explain any special circumstances that might not be evident in their reported data. In addition, the data were manually reviewed for additional errors by the IPEDS help desk staff. When necessary, keyholders were contacted to verify the accuracy of the data.
For the Completions component of the collection, CIP codes previously reported were preloaded using the 2000 edition of the CIP. All institutions were required to use CIP:2000 for reporting Completions data. Award levels reported for each CIP code were checked against a predetermined list (of valid award levels for each 6-digit CIP code) developed by subject matter experts. Award levels also were checked against those indicated on the prior year’s Institutional Characteristics component. CIP codes and award levels were compared to the prior year’s data for consistency. For each award level except first-professional,5 the gender totals for each two-digit CIP were compared to the information from the prior year. The first-professional categories were compared to the prior year’s response at the six-digit CIP level, by gender. For large current year and prior year values, the absolute relative percent difference of current year values versus prior year values was not expected to be more than 50 percent. Small values, numbers less than 20 for both years, were not subjected to comparisons. Also, the number of awards for each race/ethnicity and gender combination, within each award level, was compared to the corresponding value from the prior year. Finally, the total number of awards was expected to be less than the total enrollment reported on the fall 2008 Enrollment component, by level of enrollment (undergraduate, graduate, and first-professional) and by gender. Data that failed any of these checks triggered a required confirmation or explanation.
Edits were also applied to the Institutional Characteristics component of the collection. The types of educational offerings (occupational, academic, continuing professional, avocational, adult basic, or secondary) were checked to determine whether the institution qualified as primarily postsecondary and thus should be considered in scope for IPEDS. All levels of offering and levels of awards, admission requirements, application fees, tuition and fees, and room and board charges were compared to the prior year’s data for consistency. Large changes in the student charges section were flagged for follow-up; for example, the percentage increase or decrease of current year versus prior year data were not expected to exceed 50 percent for application fees, 30 percent for tuition and fees, and 40 percent for room and board charges.
The 12-Month Enrollment survey also had several automated edit checks. Student counts, by level, were compared to prior year counts to ensure consistency. For undergraduate and graduate student levels, instructional activity hours were checked to ensure that hours were reported if students were reported at these levels. Total instructional activity was also compared to the unduplicated headcount, for each student level, to ensure that the reported activity was appropriate for the number of students reported. That is, the contact and credit hours reported were expected to fall in a specific range defined by the institution’s calendar system and unduplicated headcount enrollment. Any discrepancies or data reported outside the expected ranges had to be explained.
5 First-professional degrees are awarded after completion of the academic requirements to begin practice in the following professions: chiropractic (D.C. or D.C.M.); dentistry (D.D.S. or D.M.D.); law (L.L.B. or J.D.); medicine (M.D.); optometry (O.D.); osteopathic medicine (D.O.); pharmacy (Pharm.D.); podiatry (D.P.M., D.P., or Pod.D.); theology (M.Div., M.H.L., B.D., or Ordination); or veterinary medicine (D.V.M.).
A-9

Inconsistencies noted: Four institutions classified in the IPEDS universe as “non-degree-granting” based on their levels of offering as reported in the Institutional Characteristics component reported a total of 119 associate’s degrees in the Completions component (for the 2008-09 academic year). The associate’s degrees granted by these institutions are not included in table rows restricted to institutions classified as “degree-granting.” Another institution that indicated it is a 2-year institution reported awarding one bachelor’s degree. The bachelor’s degree granted by this institution is not included in table rows restricted to 4-year institutions. A less-than-2-year institution, by definition classified as “non-degree-granting,” reported awarding 22 associates degrees; these degrees are not included in table rows that exclude less-than-2-year institutions, and are not included in table rows restricted to institutions classified as “degree-granting.” Finally, eight institutions that indicated they are less-than-2-year institutions reported awarding 247 certificates of at least 2 but less than 4 years. These 247 certificates are not included in table rows that exclude less-than-2-year institutions.
Imputation Procedures
Institutional Characteristics—Part D (student charges) of the Institutional Characteristics (IC) component was subject to imputation for nonresponse, both institutional nonresponse and item nonresponse. In addition, the imputation base was restricted to institutions satisfying the following conditions:
• The institution must participate in Title IV student financial aid programs.
• The institution must be currently active6 in IPEDS.
• The institution must not be an administrative office.
For Part D, 25 imputation groups were formed primarily based on institutional sector and levels of offering. Then, the following imputation method was used within imputation groups to impute missing data:
• Carry Forward—Reported 2008-09 institutional characteristics data were carried forward to the current year. A year-to-year adjustment factor was applied to tuition and fee variables.
Three institutions in the United States were imputed for institutional nonresponse. For two of the three institutions, data on student charges by program were imputed. For the remaining institution, data on academic year student charges were imputed. No imputation was necessary for institutions in other jurisdictions.
Completions—The completions data were subject to imputation for nonresponse—both institutional nonresponse and item nonresponse—but no institutions required item imputation. In addition, the imputation base was restricted to institutions satisfying the following conditions:
• The institution must participate in Title IV student financial aid programs.
• The institution must be currently active in IPEDS.
• The institution must not be an administrative office.
6 Institutions that did not respond were verified as currently active (open for business) prior to imputation through telephone calls and/or e-mail.
A-10
• The institution must not be a child institution (a child institution’s data are reported by another institution, referred to as the “parent”).
• The institution must not be new to the IPEDS universe.
For the Completions component, 61 imputation groups were formed primarily based on institutional sector and levels of offering. Then the following imputation method was used to impute missing data:
• Carry Forward—Reported 2007-08 (or 2006-07) completions data, including race/ethnicity and 6-digit CIP codes, were carried forward to the current year. The number of awards base value was then multiplied by the ratio of current year mean completions to past year mean completions within the imputation group to adjust for year-to-year change.
Completions data were imputed for four nonrespondent institutions in the United States. No imputation was necessary for institutions in other jurisdictions.
Item nonresponse is determined by comparison with the existing past data. It was determined that there were no institutions with item nonresponse.
12-Month Enrollment—The unduplicated headcount and instructional activity data were subject to imputation for nonresponse—both institutional nonresponse and item nonresponse. In addition, the imputation base was restricted to institutions satisfying the following conditions:
• The institution must participate in Title IV student financial aid programs.
• The institution must be currently active in IPEDS.
• The institution must not be an administrative office.
• The institution must not be a child institution (a child institution’s data are reported by another institution, referred to as the “parent”).
• The institution must not be new to the IPEDS universe.
For the 12-Month Enrollment component, 81 imputation groups were formed primarily based on institutional sector and levels of offering. Then the following imputation methods were used to impute missing data:
• Carry Forward—Reported 2007-08 (or 2006-07) enrollment data, including race/ethnicity and level of study, were carried forward to the current year. The imputed values were then adjusted by the ratio of current year enrollment to prior year enrollment by level of study, within imputation group.
• Ratio Adjustment Based on Part A Data—First, each institution in the imputation group was assigned a pseudo-FTE, a calculated value based on the current year’s reported unduplicated headcount used as a proxy for FTE enrollment. The pseudo-FTE was equal to an institution’s full-time students plus one-third of its part-time students. This formula for the pseudo-FTE was developed from data collected in the Higher Education General Information System (HEGIS) from1967-1986. The factors vary by sector, ranging from approximately one-third to two-fifths. One-third was used uniformly for the pseudo-FTE for simplicity and to be conservative. The unduplicated headcount was split into full- and part-time using the imputation group’s full- and part-time student distribution in the 2008 fall enrollment data.
A-11

A-12
Then three ratios were computed for each responding institution in the imputation group: number of contact hours to undergraduate pseudo-FTE, number of undergraduate credit hours to undergraduate pseudo-FTE, and number of graduate credit hours to graduate pseudo-FTE. The median of each of these three ratios over the imputation group was determined, and these median ratios were then multiplied by the imputee’s appropriate pseudo-FTE to obtain the imputed activity data. For institutions that had undergraduate offerings, the institution’s calendar year indicator determined whether the imputed activity data were assigned to contact or credit hours.
Data for 12-Month Enrollment were imputed for two institutional nonrespondents in the United States. In addition, three institutions received item imputation; one for first-professional unduplicated headcount and two for instructional activity. No imputation was necessary for institutions in other jurisdictions.

Appendix B: Glossary of IPEDS Terms
academic program: An instructional program leading toward an associate’s, bachelor’s, master’s, doctor’s, or first-professional degree or resulting in credits that can be applied to one of these degrees.
academic year: The period of time generally extending from September of one calendar year to June of the following year; usually equated to 2 semesters or trimesters, 3 quarters, or the period covered by a 4-1-4 calendar system.
associate’s degree: An award that normally requires at least 2 but less than 4 years of full-time-equivalent college work.
bachelor’s degree: An award (baccalaureate or equivalent degree, as determined by the Secretary, U.S. Department of Education) that normally requires at least 4 but not more than 5 years of full-time-equivalent college-level work. This includes all bachelor’s degrees conferred in a 5-year cooperative (work-study) program. A cooperative plan provides for alternate class attendance and employment in business, industry, or government; thus, it allows students to combine actual work experience with their college studies. This also includes bachelor’s degrees in which the normal 4 years of work are completed in 3 years.
board charges: Charges assessed students for an academic year for meals.
certificate: A formal award certifying the satisfactory completion of a postsecondary education program.
child institution: An institution that has its data reported by another institution, known as the parent institution.
Classification of Instructional Programs (CIP): A taxonomic coding scheme for secondary and postsecondary instructional programs. It is intended to facilitate the organization, collection, and reporting of program data using classifications that capture the majority of reportable data. The CIP is the accepted Federal Government statistical standard on instructional program classifications and is used in a variety of education information surveys and databases.
collection year: The academic year in which IPEDS data were collected. Most Institutional Characteristics, Salaries, Fall Staff, Fall Enrollment, and Employees by Assigned Position data are collected for the current year; Completions, 12-Month Enrollment, Student Financial Aid, and Finance data collections cover the prior year.
Completions: This annual component of IPEDS collects number of degrees and other formal awards (certificates) conferred. These data are reported by level (associate’s, bachelor’s, master’s, doctor’s, and first-professional), as well as by length of program for some. Both are reported by race/ethnicity and gender of recipient, and the field of study, using the Classification of Instructional Programs (CIP) code. Institutions report all degrees and other awards conferred during an entire academic year, from July 1 of one calendar year through June 30 of the following year. Completions data by race/ethnicity at the 2-digit CIP level became an annual collection in 1990; since the 1995 collection, race/ethnicity is collected at the 6-digit CIP level. In 2001, IPEDS began collecting completers of double majors by level, 6-digit CIP code, and race/ethnicity and gender of recipient.
B-1

control (of institution): A classification of whether an institution is operated by publicly elected or appointed officials (public control) or by privately elected or appointed officials and derives its major source of funds from private sources (private, not-for profit or private, for-profit control).
coordinator: The person responsible for Integrated Postsecondary Education Data System (IPEDS) survey related coordination activities for a specified group of schools within a state. This person may have certain viewing, verifying, and locking privileges on the data collection system.
degree: An award conferred by a college, university, or other postsecondary education institution as official recognition for the successful completion of an undergraduate or graduate program of studies.
degree-granting institution: An institution offering an associate’s, bachelor’s, master’s, doctor’s, or first-professional degree.
doctor’s degree: The highest award a student can earn for graduate study. The doctor’s degree classification includes such degrees as Doctor of Education, Doctor of Juridical Science, Doctor of Public Health, and the Doctor of Philosophy degree in any field such as agronomy, food technology, education, engineering, public administration, ophthalmology, or radiology.
doctor’s degree–other: A doctor’s degree that does not meet the definition of a doctor’s degree–research/scholarship or a doctor’s degree–professional practice.
doctor’s degree–professional practice: A doctor’s degree that is conferred upon completion of a program providing the knowledge and skills for the recognition, credential, or license required for professional practice. The degree is awarded after a period of study such that the total time to the degree, including both preprofessional and professional preparation, equals at least 6 full-time-equivalent academic years. Some of these degrees were formerly classified as “first-professional” and may include chiropractic (D.C. or D.C.M.), dentistry (D.D.S. or D.M.D.), law (L.L.B. or J.D.), medicine (M.D.), optometry (O.D.), osteopathic medicine (D.O.), pharmacy (Pharm.D.), podiatry (D.P.M., Pod.D., D.P.), veterinary medicine (D.V.M.), and others, as designated by the awarding institution.
doctor’s degree—research/scholarship: A Ph.D. or other doctor’s degree that requires advanced work beyond the master’s level, including the preparation and defense of a dissertation based on original research, or the planning and execution of an original project demonstrating substantial artistic or scholarly achievement. Some examples of this type of degree may include Ed.D., D.M.A., D.B.A., D.Sc., D.A., and D.M., as well as others designated by the awarding institution.
donor: A responding institution whose values are assigned to the imputee.
first-professional certificate (post-degree): An award that requires completion of an organized program of study designed for persons who have completed the first-professional degree. Examples could be refresher courses or additional units of study in a specialty or subspecialty.
first-professional degree: An award that requires completion of a program that meets all of the following criteria: (1) completion of the academic requirements to begin practice in the profession; (2) at least 2 years of college work prior to entering the program; and (3) a total of at least 6 academic years of college work to complete the degree program, including prior required college work plus the length of the professional program itself. First-professional degrees may be awarded in the following 10 fields:
B-2
Chiropractic (D.C. or D.C.M.) Osteopathic medicine (D.O.) Dentistry (D.D.S. or D.M.D.) Pharmacy (Pharm.D.) Law (L.L.B. or J.D.) Podiatry (D.P.M., D.P., or Pod.D.) Medicine (M.D.) Theology (M.Div., M.H.L., B.D., or Ordination) Optometry (O.D.) Veterinary medicine (D.V.M.)
full-time equivalent (students): The full-time equivalent (FTE) of students is a single value providing a meaningful combination of full-time and part-time students. The number of FTE students is calculated based on (1) the credit and/or contact hours reported by the institution in the instructional activity portion of the12-month Enrollment component and (2) the institution’s calendar system as reported on the Institutional Characteristics component. For institutions following a quarter calendar system, 45 undergraduate credit hours is considered 1 undergraduate FTE and 36 graduate credit hours is considered 1 graduate FTE. For institutions following a semester, trimester, 4-1-4, or other academic year calendar system, 30 undergraduate credit hours is considered 1 undergraduate FTE and 24 graduate credit hours is considered 1 graduate FTE. For all calendar systems (both academic year-based systems and continuous enrollment systems), 900 undergraduate contact hours is considered 1 undergraduate FTE.
imputee: A nonresponding institution that has its values imputed.
institutional affiliation: A classification that indicates whether a private not-for-profit institution is associated with a religious group or denomination. Private not-for-profit institutions may be either independent or religiously affiliated.
Institutional Characteristics: This annual component is the core of the IPEDS system and is required of all currently operating Title IV postsecondary institutions in the United States and its outlying areas. As the control file for the entire IPEDS system, IC constitutes the sampling frame for all other NCES surveys of postsecondary institutions. It also helps determine the specific IPEDS screens that are shown to each institution. This component collects the basic institutional data that are necessary to sort and analyze not only the IC database, but also all other IPEDS databases. IC data are collected for the academic year, which generally extends from September of one calendar year to June of the following year. Specific data elements currently collected for each institution include institution name, address, telephone number, control or affiliation, calendar system, levels of degrees and awards offered, types of programs, application information, student services, and accreditation. The IC component also collects pricing information including tuition and required fees, room and board charges, books and supplies, and other expenses for release on College Navigator.
keyholder: The person designated by an official institutional representative to have in their possession the necessary UserID and password to gain access to the Integrated Postsecondary Education Data System (IPEDS) data collection system to complete the survey. The keyholder is responsible for entering data and locking the site by each survey completion date.
less-than-2-year institution: A postsecondary institution that offers programs of less than 2 years’ duration below the baccalaureate level. Includes occupational and vocational schools with programs that do not exceed 1,800 contact hours.
level (of institution): A classification of whether an institution’s programs are 4 years or higher (4-year), at least 2 but less than 4 years (2-year), or less than 2 years (less-than-2-year).
master’s degree: An award that requires the successful completion of a program of study of generally one or two full-time-equivalent academic years of work beyond the bachelor’s degree. Some of these degrees, such as those in Theology (M.Div., M.H.L./Rav) that were formerly
B-3

classified as “first-professional” may require more than 2 full-time-equivalent academic years of work.
non-degree-granting institution: An institution offering only postbaccalaureate, post-master’s, or first-professional certificates, or certificates or diplomas of 4 years or less.
OPE (Office of Postsecondary Education): OPE formulates federal postsecondary education policy and administers programs that address critical national needs in support of its mission to increase access to quality postsecondary education.
other expenses: The amount of money (estimated by the financial aid office) needed by a student to cover expenses such as laundry, transportation, and entertainment.
parent institution: An institution that reports data for another institution, known as the child institution.
PEPS (Postsecondary Education Participation System): Database used by OPE to track all institutions eligible for Title IV federal student financial aid programs.
postsecondary institution: An institution which has as its sole purpose, or one of its primary missions, the provision of postsecondary education. Postsecondary education is the provision of a formal instructional program whose curriculum is designed primarily for students beyond the compulsory age for high school. This includes programs whose purpose is academic, vocational, and continuing professional education, and excludes avocational and adult basic education programs. For IPEDS, these institutions must be open to the public.
Program Participation Agreement (PPA): A written agreement between a postsecondary institution and the Secretary of Education. This agreement allows institutions to participate in any of the Title IV student assistance programs other than the State Student Incentive Grant (SSIG) and the National Early Intervention Scholarship and Partnership (NEISP) programs. The PPA conditions the initial and continued participation of an eligible institution in any Title IV program upon compliance with the General Provisions regulations, the individual program regulations, and any additional conditions specified in the program participation agreement that the Department of Education requires the institution to meet. Institutions with such an agreement are referred to as Title IV institutions.
price of attendance: The amount of tuition and fees, room and board, books and supplies, and other expenses that a full-time, first-time degree/certificate-seeking student can expect to pay to go to college. Prices reported by the institutions are those amounts used by the financial aid office to determine student financial need.
race/ethnicity (old definition): Categories used to describe groups to which individuals belong, identify with, or belong in the eyes of the community. The categories do not denote scientific definitions of anthropological origins. A person may be counted in only one group. The groups used to categorize U.S. citizens, resident aliens, and other eligible noncitizens are as follows: American Indian/Alaska Native; Asian/Pacific Islander; Black, non-Hispanic; Hispanic; White, non-Hispanic.
race/ethnicity (new definition): Categories developed in 1997 by the Office of Management and Budget that are used to describe groups to which individuals belong, identify with, or belong in the eyes of the community. The categories do not denote scientific definitions of anthropological origins. The designations are used to categorize U.S. citizens, resident aliens, and other eligible noncitizens.
B-4

Individuals are asked to first designate ethnicity as
• Hispanic or Latino; or • Not Hispanic or Latino.
Second, individuals are asked to indicate all races that apply among the following:
• American Indian or Alaska Native; • Asian; • Black or African American; • Native Hawaiian or Other Pacific Islander; and • White.
required fees: Fixed sum charged to students for items not covered by tuition and required of such a large proportion of all students that the student who does not pay the charge is an exception.
room charges: The charges for an academic year for rooming accommodations for a typical student sharing a room with one other student.
sector: One of nine institutional categories resulting from dividing the universe according to control and level. Control categories are public, private not-for-profit, and private for-profit. Level categories are 4 years and higher (4-year), at least 2 but less than 4 years (2-year), and less than 2 years (less-than-2-year). For example: public 4-year institutions.
student charges: Average amount for tuition and fees, room, and board charged to all students by the institution. Tuition and fees may vary by the level of student (undergraduate, graduate, or first-professional).
Title IV institution: An institution that has a written agreement with the Secretary of Education that allows the institution to participate in any of the Title IV federal student financial assistance programs (other than the State Student Incentive Grant [SSIG] and the National Early Intervention Scholarship and Partnership [NEISP] programs).
tuition: Amount of money charged to students for instructional services. Tuition may be charged per term, per course, or per credit.
UserID: A series of numbers possibly with an alpha prefix that is created for a specific user to be able to access a system. For security purposes, each user is required to have a UserID and a password in order to access the Integrated Postsecondary Education Data System (IPEDS) data collection system.
4-year institution: A postsecondary institution that offers programs of at least 4 years’ duration or one that offers programs at or above the baccalaureate level. Includes schools that offer postbaccalaureate certificates only or those that offer graduate programs only. Also includes free-standing medical, law, or other first-professional schools.
12-Month Enrollment: This annual component of IPEDS collects the number of students enrolled in a 12-month reporting period in the previous year. Institutions report an unduplicated head count for the total number of students by gender, race/ethnicity, and level (undergraduate, graduate, first-professional) enrolled throughout the reporting period. Students included are those enrolled in any courses leading to a degree or other formal award, as well as those enrolled in courses that are part of a terminal vocational or occupational program. Institutions also report the total instructional activity for the same 12-month period for both undergraduate and graduate programs. Instructional activity
B-5

B-6
data are reported in units of contact hours (sometimes referred to as clock hours) or credit hours. Prior to the 2008 IPEDS, these data were collected as part of the Enrollment component, which collects the number of students enrolled as of the institution’s official fall reporting date.
2-year institution: A postsecondary institution that offers programs of at least 2 but less than 4 years’ duration. Includes occupational and vocational schools with programs of at least 1,800 hours and academic institutions with programs of less than 4 years. Does not include bachelor’s-degree-granting institutions where the baccalaureate program can be completed in 3 years.