PostnatalCraniofacialSkeletal · PDF filedata documents the complex and differential changes...
18
ORIGINAL RESEARCH published: 14 September 2017 doi: 10.3389/fphys.2017.00697 Frontiers in Physiology | www.frontiersin.org 1 September 2017 | Volume 8 | Article 697 Edited by: Ariane Berdal, UMRS 1138 INSERM University Paris-Diderot Team POM, France Reviewed by: Abigail Saffron Tucker, King’s College London, United Kingdom Kaj Fried, Karolinska Institute (KI), Sweden *Correspondence: Min Hu [email protected] Fei Liu [email protected] Specialty section: This article was submitted to Craniofacial Biology and Dental Research, a section of the journal Frontiers in Physiology Received: 02 June 2017 Accepted: 30 August 2017 Published: 14 September 2017 Citation: Wei X, Thomas N, Hatch NE, Hu M and Liu F (2017) Postnatal Craniofacial Skeletal Development of Female C57BL/6NCrl Mice. Front. Physiol. 8:697. doi: 10.3389/fphys.2017.00697 Postnatal Craniofacial Skeletal Development of Female C57BL/6NCrl Mice Xiaoxi Wei 1, 2 , Neil Thomas 2 , Nan E. Hatch 3 , Min Hu 1 * and Fei Liu 2 * 1 Department of Orthodontics, Jilin University School and Hospital of Stomatology, Changchun, China, 2 Department of Biologic and Materials Sciences and Division of Prosthodontics, University of Michigan School of Dentistry, Ann Arbor, MI, United States, 3 Department of Orthodontics and Pediatric Dentistry, University of Michigan School of Dentistry, Ann Arbor, MI, United States The craniofacial skeleton is a complex and unique structure. The perturbation of its development can lead to craniofacial dysmorphology and associated morbidities. Our ability to prevent or mitigate craniofacial skeletal anomalies is at least partly dependent on our understanding of the unique physiological development of the craniofacial skeleton. Mouse models are critical tools for the study of craniofacial developmental abnormalities. However, there is a lack of detailed normative data of mouse craniofacial skeletal development in the literature. In this report, we employed high-resolution micro-computed tomography (μCT) in combination with morphometric measurements to analyze the postnatal craniofacial skeletal development from day 7 (P7) through day 390 (P390) of female C57BL/6NCrl mice, a widely used mouse strain. Our data demonstrates a unique craniofacial skeletal development pattern in female C57BL/6NCrl mice, and differentiates the early vs. late craniofacial growth patterns. Additionally, our data documents the complex and differential changes in bone parameters (thickness, bone volume, bone volume/tissue volume, bone mineral density, and tissue mineral density) of various craniofacial bones with different embryonic origins and ossification mechanisms during postnatal growth, which underscores the complexity of craniofacial bone development and provides a reference standard for future quantitative analysis of craniofacial bones. Keywords: cranial base, synchondroses, postnatal, craniofacial, mouse, bone, μCT, C57BL/6NCrl INTRODUCTION The craniofacial skeleton is distinct from the body skeleton in the complexity of its organization, its embryonic origin, and the molecular mechanisms inducing skeletogenesis. Craniofacial skeletal malformations represent one of the largest classes of birth defects (Warman et al., 2011). They compromise not only the esthetics and function, but also the mental wellbeing of the affected individual. However, most of our information about skeletal development comes from analyses of the postcranial skeleton. A thorough understanding of normal craniofacial skeletal development is required for a better understanding and treatment of defective craniofacial skeletal development. The craniofacial skeleton is formed through two distinct ossification mechanisms (Kronenberg, 2003). Most of the craniofacial bones such as the calvaria, some facial bones, and mandible are formed through intramembranous ossification. On the other hand, the cranial base, a
Transcript of PostnatalCraniofacialSkeletal · PDF filedata documents the complex and differential changes...

ORIGINAL RESEARCHpublished: 14 September 2017doi: 10.3389/fphys.2017.00697
Frontiers in Physiology | www.frontiersin.org 1 September 2017 | Volume 8 | Article 697
Edited by:
Ariane Berdal,
UMRS 1138 INSERM University
Paris-Diderot Team POM, France
Reviewed by:
Abigail Saffron Tucker,
King’s College London,
United Kingdom
Kaj Fried,
Karolinska Institute (KI), Sweden
*Correspondence:
Min Hu
Fei Liu
Specialty section:
This article was submitted to
Craniofacial Biology and Dental
Research,
a section of the journal
Frontiers in Physiology
Received: 02 June 2017
Accepted: 30 August 2017
Published: 14 September 2017
Citation:
Wei X, Thomas N, Hatch NE, Hu M
and Liu F (2017) Postnatal Craniofacial
Skeletal Development of Female
C57BL/6NCrl Mice.
Front. Physiol. 8:697.
doi: 10.3389/fphys.2017.00697
Postnatal Craniofacial SkeletalDevelopment of Female C57BL/6NCrlMiceXiaoxi Wei 1, 2, Neil Thomas 2, Nan E. Hatch 3, Min Hu 1* and Fei Liu 2*
1Department of Orthodontics, Jilin University School and Hospital of Stomatology, Changchun, China, 2Department of
Biologic and Materials Sciences and Division of Prosthodontics, University of Michigan School of Dentistry, Ann Arbor, MI,
United States, 3Department of Orthodontics and Pediatric Dentistry, University of Michigan School of Dentistry, Ann Arbor,
MI, United States
The craniofacial skeleton is a complex and unique structure. The perturbation of its
development can lead to craniofacial dysmorphology and associated morbidities. Our
ability to prevent or mitigate craniofacial skeletal anomalies is at least partly dependent
on our understanding of the unique physiological development of the craniofacial
skeleton. Mouse models are critical tools for the study of craniofacial developmental
abnormalities. However, there is a lack of detailed normative data of mouse craniofacial
skeletal development in the literature. In this report, we employed high-resolution
micro-computed tomography (µCT) in combination with morphometric measurements
to analyze the postnatal craniofacial skeletal development from day 7 (P7) through
day 390 (P390) of female C57BL/6NCrl mice, a widely used mouse strain. Our data
demonstrates a unique craniofacial skeletal development pattern in female C57BL/6NCrl
mice, and differentiates the early vs. late craniofacial growth patterns. Additionally, our
data documents the complex and differential changes in bone parameters (thickness,
bone volume, bone volume/tissue volume, bone mineral density, and tissue mineral
density) of various craniofacial bones with different embryonic origins and ossification
mechanisms during postnatal growth, which underscores the complexity of craniofacial
bone development and provides a reference standard for future quantitative analysis of
craniofacial bones.
Keywords: cranial base, synchondroses, postnatal, craniofacial, mouse, bone, µCT, C57BL/6NCrl
INTRODUCTION
The craniofacial skeleton is distinct from the body skeleton in the complexity of its organization,its embryonic origin, and the molecular mechanisms inducing skeletogenesis. Craniofacial skeletalmalformations represent one of the largest classes of birth defects (Warman et al., 2011). Theycompromise not only the esthetics and function, but also the mental wellbeing of the affectedindividual. However, most of our information about skeletal development comes from analysesof the postcranial skeleton. A thorough understanding of normal craniofacial skeletal developmentis required for a better understanding and treatment of defective craniofacial skeletal development.
The craniofacial skeleton is formed through two distinct ossification mechanisms (Kronenberg,2003). Most of the craniofacial bones such as the calvaria, some facial bones, and mandibleare formed through intramembranous ossification. On the other hand, the cranial base, a

Wei et al. Postnatal Craniofacial Skeletal Development in Mice
supporting platform for the development of the brain, is formedthrough endochondral ossification similar to that seen in theappendicular and axial skeletons. The cranial base containsmultiple growth centers called synchondroses, which are thecounterpart of growth plates in long bones. Synchondroses arecomprised of mirror-image growth plates with a central restingzone surrounded by proliferative and hypertrophic zones at bothsides (Wei et al., 2016). The spheno-occipital synchondrosis(SOS) joins the basi-sphenoid and occipital bones, and theintersphenoid synchondrosis (ISS) joins the pre-sphenoid andbasi-sphenoid bones in cranial base. The ISS and SOS contributesignificantly to the growth of both the cranium and the upperface (Wei et al., 2016). The premature fusion of either the ISS orthe SOS can result in midface hypoplasia as seen in patients withsyndromic craniosynostosis (Goldstein et al., 2014).
Craniofacial skeletons have two embryonic origins (Chaiet al., 2000; Jiang et al., 2002). The majority of the craniofacialbones, including all facial bones, most cranial bones such asthe frontal bones, temporal bones, and ethmoid bone, arederived from neural crest. In contrast, the parietal bone of thecalvaria and the occipital bone are derived from mesoderm.It is known that embryonic origin has significant impact onosteoblast proliferation and differentiation. Neural crest-derivedcalvarial osteoblasts from the frontal bone have superior intrinsicosteogenic potential and tissue regeneration ability comparedto mesoderm-derived calvarial osteoblasts from parietal bone(Quarto et al., 2010). Our previous studies suggested that thereis increased bone volume and density in mesoderm derivedparietal bone compared to neural crest derived frontal boneat early postnatal stage in both BALB/c congenic mice at 1month of age (Liu et al., 2013) and 50% C57BL/6-50%129SF2/Jmice at 2 weeks of age (Liu et al., 2015). However, a thoroughknowledge of quantitative differences in bone parameters duringpostnatal development between neural crest-derived skull boneand mesoderm-derived skull bone is lacking.
The mouse model plays critical roles in unraveling themechanisms of skeletal and craniofacial development anddysmorphology. Various mouse models have been availablefor craniofacial study for decades, and more models arebeing generated (Murray, 2011). Because key craniofacialdevelopmental processes are similar across mice and humans(Martinez-Abadias et al., 2012), mouse models are great toolsto study the pathological processes of craniofacial development.Importantly, the efficient and meaningful utilization of variousmouse models depends on the thorough understanding of thenormal craniofacial development of mice. However, detailed dataon the postnatal craniofacial skeletal development of differentmouse strains remains largely unavailable. C57BL/6NCrl miceare one of the most commonly used inbred mouse strains.A recent report elegantly documented the postnatal three-dimensional metrics of the skull in male C57BL/6J mice (Voraet al., 2016), which provided a reference standard for quantitativeanalysis up to nearly 4 months of age. It is known that genderhas a significant impact on skeletal development (Gilsanz et al.,1997) and orofacial measurements (Nascimento et al., 2013).Thus, it is necessary to have the counterpart knowledge offemale C57BL/6NCrl mice. Additionally, age related and bone
specific changes in craniofacial bone parameters such as bonevolume, bone volume/tissue volume, bone mineral density,and tissue mineral density in normal mouse development islacking. Furthermore, while most mouse strains reach peak bodybone mass around 4–6 months of age, there can be additionalbone mass accrual between 6 and 12 months of age (Jilka,2013). Importantly, human craniofacial skeleton has significantchanges during adulthood (Israel, 1977; Pecora et al., 2008).Thus, it is necessary to characterize the dynamic changes incraniofacial skeletal development in adult mice. In this study, weemployed high-resolution micro-computed tomography (µCT)to analyze in detail the craniofacial skeletal development offemale C57BL/6NCrl mice up to 13months of age. These analysesincluded three-dimensional skull metrics and individual boneparameters of neural crest-derived and mesoderm-derived, aswell as intramembranous and endochondral craniofacial bones.The data demonstrates the unique and complex morphologicaland structural characteristics of the craniofacial skeleton ofC57BL/6NCrl female mice during postnatal development. Thisinformation can serve as a reference standard for studies usingthis mouse strain to model abnormalities in craniofacial skeletaldevelopment as well as for the comparison with other mousestrains of different genetic background.
MATERIALS AND METHODS
AnimalsC57BL/6NCrl (strain code 027; Charles River, MA) mice wereused in this study. Mice were raised in an optimal andcontrolled environment with standard temperature and humidityat the University of Michigan School Of Dentistry. All animalhandling protocols were approved by IACUC at the Universityof Michigan. The breeders were fed with pelleted rodent dietsoptimal for breeding units (LabDiet 5008). Pups were weanedat postnatal day P21 and fed with pelleted stock diet (LabDiet5LOD). Mice were euthanized at designated postnatal ages (P0,P7, P14, P21, P30, P60, P90, P120, P180, P390, n = 4 in eachage group) via CO2 exposure (older than P10) or decapitation(younger than P10). Age groups of P0, P7, P14, P21, P30, P60,P120 and number of mice per age group were selected based on asimilar study using male C57BL/6J mice (Vora et al., 2016). P180and P390 age groups were selected to include the adult mice afterskeletal maturation.
µCT Scanning, Reconstruction,Orientation, and Landmark PlacementFixed mouse skulls were scanned in water using cone beamcomputed tomography (eXplore Locus SP, GE Healthcare Pre-Clinical Imaging, London, ON, Canada). Scan parametersincluded a 0.5◦ increment angle, 200 degree, 4 frames averaged,1,600 ms exposure time, 2 × 2 detecting binning, an 80 kVp,6.4 W power and 80 µA X-ray source with a 0.508 mm Alfilter to reduce beam hardening artifacts, and a beam flatteneraround the specimen holder (Meganck et al., 2009). All imageswere reconstructed at an 18 µm isotropic voxel size andcalibrated once daily to a calibration phantom of air, waterand hydroxyapatite (1.69 mg/cc). Images were oriented and
Frontiers in Physiology | www.frontiersin.org 2 September 2017 | Volume 8 | Article 697
Wei et al. Postnatal Craniofacial Skeletal Development in Mice
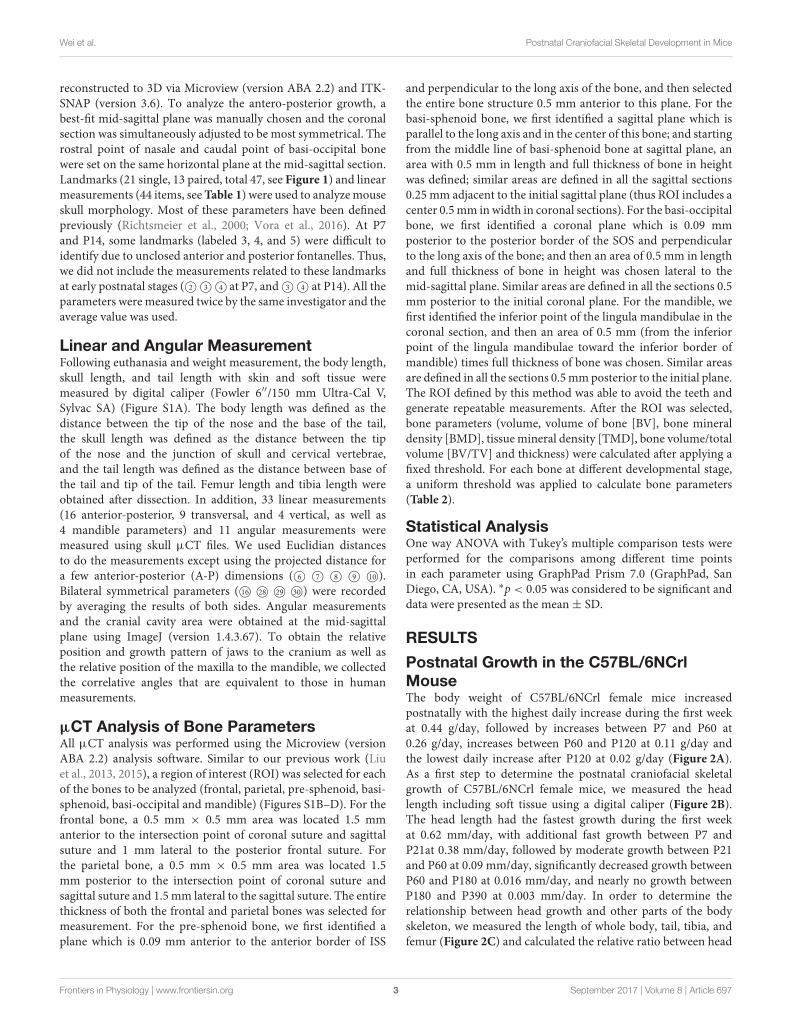
reconstructed to 3D via Microview (version ABA 2.2) and ITK-SNAP (version 3.6). To analyze the antero-posterior growth, abest-fit mid-sagittal plane was manually chosen and the coronalsection was simultaneously adjusted to be most symmetrical. Therostral point of nasale and caudal point of basi-occipital bonewere set on the same horizontal plane at the mid-sagittal section.Landmarks (21 single, 13 paired, total 47, see Figure 1) and linearmeasurements (44 items, seeTable 1) were used to analyzemouseskull morphology. Most of these parameters have been definedpreviously (Richtsmeier et al., 2000; Vora et al., 2016). At P7and P14, some landmarks (labeled 3, 4, and 5) were difficult toidentify due to unclosed anterior and posterior fontanelles. Thus,we did not include the measurements related to these landmarksat early postnatal stages (©2 ©3 ©4 at P7, and©3 ©4 at P14). All theparameters were measured twice by the same investigator and theaverage value was used.
Linear and Angular MeasurementFollowing euthanasia and weight measurement, the body length,skull length, and tail length with skin and soft tissue weremeasured by digital caliper (Fowler 6′′/150 mm Ultra-Cal V,Sylvac SA) (Figure S1A). The body length was defined as thedistance between the tip of the nose and the base of the tail,the skull length was defined as the distance between the tipof the nose and the junction of skull and cervical vertebrae,and the tail length was defined as the distance between base ofthe tail and tip of the tail. Femur length and tibia length wereobtained after dissection. In addition, 33 linear measurements(16 anterior-posterior, 9 transversal, and 4 vertical, as well as4 mandible parameters) and 11 angular measurements weremeasured using skull µCT files. We used Euclidian distancesto do the measurements except using the projected distance fora few anterior-posterior (A-P) dimensions (©6 ©7 ©8 ©9 ©10 ).Bilateral symmetrical parameters (©16 ©28 ©29 ©30 ) were recordedby averaging the results of both sides. Angular measurementsand the cranial cavity area were obtained at the mid-sagittalplane using ImageJ (version 1.4.3.67). To obtain the relativeposition and growth pattern of jaws to the cranium as well asthe relative position of the maxilla to the mandible, we collectedthe correlative angles that are equivalent to those in humanmeasurements.
µCT Analysis of Bone ParametersAll µCT analysis was performed using the Microview (versionABA 2.2) analysis software. Similar to our previous work (Liuet al., 2013, 2015), a region of interest (ROI) was selected for eachof the bones to be analyzed (frontal, parietal, pre-sphenoid, basi-sphenoid, basi-occipital and mandible) (Figures S1B–D). For thefrontal bone, a 0.5 mm × 0.5 mm area was located 1.5 mmanterior to the intersection point of coronal suture and sagittalsuture and 1 mm lateral to the posterior frontal suture. Forthe parietal bone, a 0.5 mm × 0.5 mm area was located 1.5mm posterior to the intersection point of coronal suture andsagittal suture and 1.5 mm lateral to the sagittal suture. The entirethickness of both the frontal and parietal bones was selected formeasurement. For the pre-sphenoid bone, we first identified aplane which is 0.09 mm anterior to the anterior border of ISS
and perpendicular to the long axis of the bone, and then selectedthe entire bone structure 0.5 mm anterior to this plane. For thebasi-sphenoid bone, we first identified a sagittal plane which isparallel to the long axis and in the center of this bone; and startingfrom the middle line of basi-sphenoid bone at sagittal plane, anarea with 0.5 mm in length and full thickness of bone in heightwas defined; similar areas are defined in all the sagittal sections0.25 mm adjacent to the initial sagittal plane (thus ROI includes acenter 0.5mm inwidth in coronal sections). For the basi-occipitalbone, we first identified a coronal plane which is 0.09 mmposterior to the posterior border of the SOS and perpendicularto the long axis of the bone; and then an area of 0.5 mm in lengthand full thickness of bone in height was chosen lateral to themid-sagittal plane. Similar areas are defined in all the sections 0.5mm posterior to the initial coronal plane. For the mandible, wefirst identified the inferior point of the lingula mandibulae in thecoronal section, and then an area of 0.5 mm (from the inferiorpoint of the lingula mandibulae toward the inferior border ofmandible) times full thickness of bone was chosen. Similar areasare defined in all the sections 0.5mmposterior to the initial plane.The ROI defined by this method was able to avoid the teeth andgenerate repeatable measurements. After the ROI was selected,bone parameters (volume, volume of bone [BV], bone mineraldensity [BMD], tissuemineral density [TMD], bone volume/totalvolume [BV/TV] and thickness) were calculated after applying afixed threshold. For each bone at different developmental stage,a uniform threshold was applied to calculate bone parameters(Table 2).
Statistical AnalysisOne way ANOVA with Tukey’s multiple comparison tests wereperformed for the comparisons among different time pointsin each parameter using GraphPad Prism 7.0 (GraphPad, SanDiego, CA, USA). ∗p < 0.05 was considered to be significant anddata were presented as the mean± SD.
RESULTS
Postnatal Growth in the C57BL/6NCrlMouseThe body weight of C57BL/6NCrl female mice increasedpostnatally with the highest daily increase during the first weekat 0.44 g/day, followed by increases between P7 and P60 at0.26 g/day, increases between P60 and P120 at 0.11 g/day andthe lowest daily increase after P120 at 0.02 g/day (Figure 2A).As a first step to determine the postnatal craniofacial skeletalgrowth of C57BL/6NCrl female mice, we measured the headlength including soft tissue using a digital caliper (Figure 2B).The head length had the fastest growth during the first weekat 0.62 mm/day, with additional fast growth between P7 andP21at 0.38 mm/day, followed by moderate growth between P21and P60 at 0.09 mm/day, significantly decreased growth betweenP60 and P180 at 0.016 mm/day, and nearly no growth betweenP180 and P390 at 0.003 mm/day. In order to determine therelationship between head growth and other parts of the bodyskeleton, we measured the length of whole body, tail, tibia, andfemur (Figure 2C) and calculated the relative ratio between head
Frontiers in Physiology | www.frontiersin.org 3 September 2017 | Volume 8 | Article 697

Wei et al. Postnatal Craniofacial Skeletal Development in Mice
FIGURE 1 | Diagrammatic mouse skull landmarks and descriptions.
length and these parts at P0, P7, P14, P21, P30, P60, P90, P180,and P390 (Figure 2D). Similar to the head, the length of wholebody, tail, tibia, and femur had the greatest growth during the
first 3 weeks after birth, whereas growth after 2 months of agewas very slow (Figure 2C). Interestingly, the ratio between thelength of the head and other parts of the skeleton was greatest at
Frontiers in Physiology | www.frontiersin.org 4 September 2017 | Volume 8 | Article 697

Wei et al. Postnatal Craniofacial Skeletal Development in Mice
TABLE 1 | List of linear and angle measurements used in this study.
Type Label Landmarks Description
Anterior-posterior ©1 1-2 Length of nasal bone
©2 2-3 Length of frontal bone
©3 3-4 Length of parietal bone
©4 4-5 Length of interparietal bone
©5 5-6 Length of occipital bone
©6 1-6 Skull length
©7 2-6 Cranial length
©8 1-25 Facial length
©9 2-15 Anterior cranial base length
©10 15-20 Posterior cranial base length
©11 15-16 Length of pre-sphenoid bone
©12 17-18 Length of basi-sphenoid bone
©13 19-20 Length of basi-occipital bone
©14 16-17 Length of ISS
©15 18-19 Length of SOS
©16 12-23 Length of upper jaw
Transversal ©17 7(L)-7(R) Nasal width
©18 8(L)-8(R) Anterior zygomatic width (facial
width)
©19 9(L)-9(R) Inter-orbital width
©20 10(L)-10(R) Inter-zygomatic arches width
©21 11(L)-11(R) Frontal width
©22 13(L)-13(R) Anterior zygomatic width (skull width)
©23 14(L)-14(R) Interparietal width
©24 26-27 Width of ISS
©25 28-29 Width of SOS
Vertical ©26 2-24 Facial height
©27 3-21 Anterior-cranial height
©28 4-22 Mid-cranial height (skull height)
©29 5-20 Posterior-cranial height
Mandible ©30 30-31 Upper mandibular length
©31 33-34 Lower mandibular length
©32 30-34 Mandibular height
©33 34(L)-34(R) Mandibular width
Angular ©34 21-2-3 Rostral angle of cranium cavity
©35 2-3-4 Anterior-middle cranial vault angle
©36 3-4-5 Mid-posterior cranial vault angle
©37 4-5-6 Posterior cranial vault angle
©38 5-6-20 Caudal angle of cranium cavity
©39 6-20-21 Cranial vault-cranial base angle
©40 20-21-2 Cranial base angle
©41 25-2-1 Snout angle
©42 21-2-23 Cranium-maxilla angle
©43 21-2-31 Cranium-mandible angle
©44 23-2-31 Maxilla-mandible angle
birth. This ratio then greatly decreased until P30, and plateauedafter P90 (Figure 2D), indicating relatively greater growth of theskull before birth, but faster growth of other parts of the bodyduring the first postnatal month, and then proportionate growthof whole body and head afterwards, which is similar to humangrowth (Huelke, 1998; Proffit et al., 2007).
Postnatal Craniofacial Skeletal Growth inthe C57BL/6NCrl Mouse
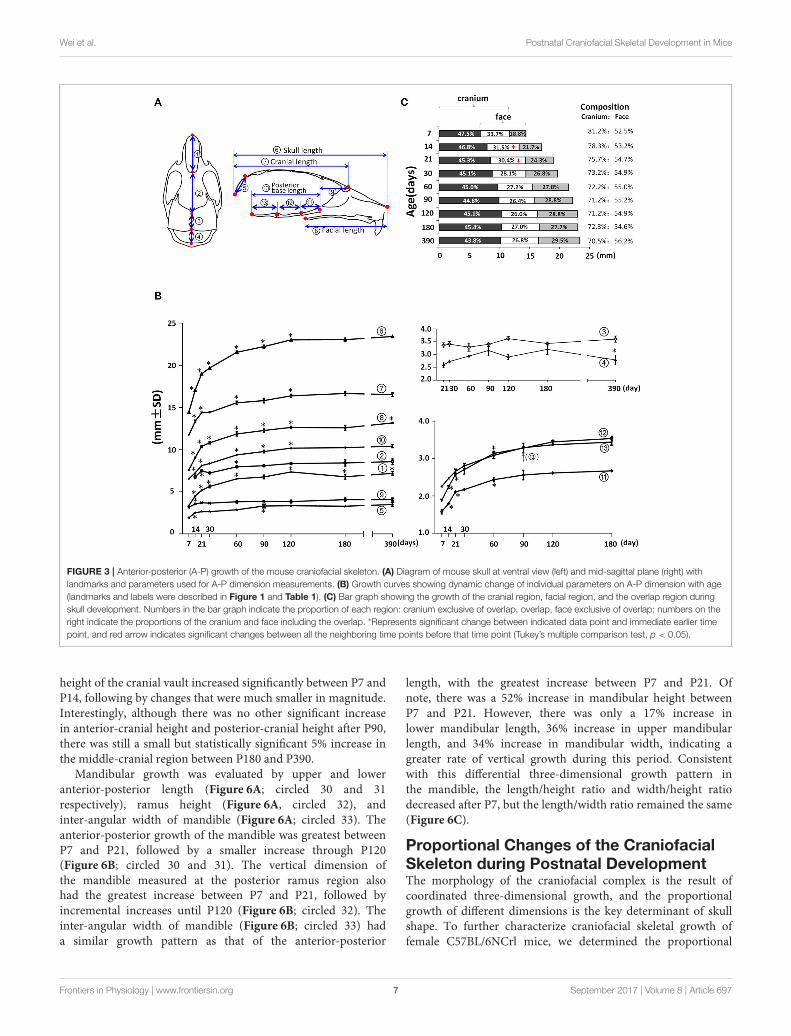
In the mid-sagittal plane of reconstructed mouse skull µCTimages, the overall A-P length as well as the contained cranialand facial regions demonstrated a continuous increase untilP120 (Figures 3A,B; circled 6, 7, and 8 respectively). The nasalbone, frontal bone, parietal bone, interparietal bone, and occipitalbones contributed to the overall A-P length of the skull. Thelength of nasal bone (Figures 3A,B; circled 1) had the fastestpostnatal growth before 1month of age and continued to increaseuntil P120. Interestingly there was an 8% decrease between P120and P180 and a 6% increase between P180 and P390 in the nasalbone length, suggesting continuous remodeling of the nasal boneat a later developmental stage. The length of the frontal bone(Figures 3A,B; circled 2) had the fastest increase before 3 weeksof age; there was continuous incremental increase until P390with a 6% increase from P90 to P390 (p < 0.05). The length ofthe parietal bone (Figures 3A,B; circled 3) remained relativelyconstant at early postnatal stage until a 10% increase betweenP60 and P120 (p < 0.05). The growth curve of the interparietalbone (Figures 3A,B; circled 4) was complementary to that of theparietal bone; it had a 16% increase between P30 and P90 anda 13% decrease between P180 and P390 (p < 0.05). The lengthof the occipital bone (Figures 3A,B; circled 5) had the fastestincrease before 2 weeks of age and continued to increase untilP90. The middle-sagittal overall A-P length can be divided intocranial and facial regions (Figure 3A; circled 7 and 8). Noticeably,there was a small but statistically significant 4% increase in faciallength (Figure 3B; circled 8) between p180 and P390, which waslikely due to growth in the nasal-maxilla complex during thisperiod. The length of the anterior cranial base (Figures 3A,B;circled 9) had an increase only between P7 and P14. The lengthof the posterior cranial base (Figures 3A,B; circled 10) continuedto increase until P120 with similar contributions from the threeindividual bones of the posterior cranial base: the pre-sphenoid,basi-sphenoid and basi-occipital bones (Figures 3A,B; circled11, 12, and 13 respectively). The antero-posterior dimensionof the skull is increased through growth of facial, cranial andoverlapping regions (Figures 3A,C), and the composition of thisdimension has a dynamic change during age progression. At P7,the cranial region (including the overlap) constituted 81.2% ofthe total A-P dimension, gradually decreased to 72.2% at P60 andremained until P180, and further decreased to 70.5% at P390.In contrast, the facial region (including the overlapping region)constituted 52.5% of the total A-P dimension at P7, increased to55.0% at P60 and remained until P180, and there was a furtherslight increase to 56.2% at P390. The overlap region contributedto 33.7% of the A-P dimension at P7, gradually decreasing to26.4% at P90. Thus, during postnatal development, the facialregion had a greater increase in A-P length compared to thecranial region, and this different growth pattern even occurredat very late development stages, such as between P180 and P390.
The width of the facial region was quantified by nasal width,
facial width (anterior zygomatic width), inter-orbital width,
and inter-zygomatic arch width (Figure 4; circled 17, 18, 19,
and 20 respectively). The nasal width (Figure 4; circled 17)
Frontiers in Physiology | www.frontiersin.org 5 September 2017 | Volume 8 | Article 697

Wei et al. Postnatal Craniofacial Skeletal Development in Mice
TABLE 2 | Threshold for each bone at different developmental stages (Hounsfield Units).
P14 P21 P30 P60 P90 P120 P180 P390
Frontal 1,000 1,600 1,800 1,800 1,800 1,800 1,800 1,600
Parietal 1,000 1,800 1,800 2,000 1,800 1,800 1,800 1,600
Pre-sphenoid 800 1,000 1,000 1,200 1,400 1,400 1,400 1,200
Basi-sphenoid 800 1,000 1,000 1,200 1,200 1,400 1,400 1,400
Basi-occipital 600 1,000 1,000 1,400 1,400 1,400 1,400 1,400
Mandible 1,000 2,000 2,000 2,400 2,400 2,400 2,400 2,400
FIGURE 2 | Postnatal skeletal growth in female C57BL/6NCrl mice. (A) Body weight. (B) Head length (circled A). (C) Body length, tail length, tibia length, and femur
length (circled B, C, D, E, respectively). (D) Ratio between the length of head and other parts of the body. *Represents significant change between indicated data point
and immediate earlier time point, and red arrows indicate significant changes between all the neighboring time points before that time point (Tukey’s multiple
comparison test, p < 0.05).
demonstrated a continuous, very small incremental increasewith age after P7 until P120. The facial width (Figure 4;circled 18) showed a similar pattern, but with a slightly largermagnitude and a peak at P180. More posteriorly, the inter-orbitalwidth (Figure 4; circled 19) and the inter-zygomatic arch width(Figure 4; circled 20) showed a similar trend of continuouslyincreasing growth with age, but at a larger magnitude. Together,these data suggest that the width of the facial region continuesto increase with age steadily, and that there was bigger increasein the posterior facial region than in the anterior region afterP7. This indicates that the width of the anterior facial region isestablished mainly before P7. The width of the cranial regionwas quantified by the frontal width, inter-posterior zygomaticwidth, and interparietal width (Figure 4; circled 21, 22, and 23respectively). The frontal width had no significant difference atthe examined time points, suggesting that the width of anterior
cranial region is established before P7. In contrast, the posteriorzygomatic width and interparietal width had the most significantincrease during the first 3 weeks after birth, with very minorchanges afterwards. Altogether, these data suggest that transversedimensions of the posterior facial and cranial regions havea continuous increase after birth with age. In contrast, thetransverse dimensions of the anterior facial and cranial regionsare established before 1 week of age in the female C57BL/6NCrlmice.
Vertical measurements were made using the mid-sagittallandmarks in the facial and cranial regions (Figure 5). Thefacial height (Figure 5; circled 26) had the fastest increase (37%)between P7 and P21, followed by a 23% increase betweenP30 and P120. The height of the vault was quantified by theanterior-cranial height, middle-cranial height, and posterior-cranial height (Figure 5, circled 27, 28, and 29 respectively). The
Frontiers in Physiology | www.frontiersin.org 6 September 2017 | Volume 8 | Article 697
Wei et al. Postnatal Craniofacial Skeletal Development in Mice
FIGURE 3 | Anterior-posterior (A-P) growth of the mouse craniofacial skeleton. (A) Diagram of mouse skull at ventral view (left) and mid-sagittal plane (right) with
landmarks and parameters used for A-P dimension measurements. (B) Growth curves showing dynamic change of individual parameters on A-P dimension with age
(landmarks and labels were described in Figure 1 and Table 1). (C) Bar graph showing the growth of the cranial region, facial region, and the overlap region during
skull development. Numbers in the bar graph indicate the proportion of each region: cranium exclusive of overlap, overlap, face exclusive of overlap; numbers on the
right indicate the proportions of the cranium and face including the overlap. *Represents significant change between indicated data point and immediate earlier time
point, and red arrow indicates significant changes between all the neighboring time points before that time point (Tukey’s multiple comparison test, p < 0.05).
height of the cranial vault increased significantly between P7 andP14, following by changes that were much smaller in magnitude.Interestingly, although there was no other significant increasein anterior-cranial height and posterior-cranial height after P90,there was still a small but statistically significant 5% increase inthe middle-cranial region between P180 and P390.
Mandibular growth was evaluated by upper and loweranterior-posterior length (Figure 6A; circled 30 and 31respectively), ramus height (Figure 6A, circled 32), andinter-angular width of mandible (Figure 6A; circled 33). Theanterior-posterior growth of the mandible was greatest betweenP7 and P21, followed by a smaller increase through P120(Figure 6B; circled 30 and 31). The vertical dimension ofthe mandible measured at the posterior ramus region alsohad the greatest increase between P7 and P21, followed byincremental increases until P120 (Figure 6B; circled 32). Theinter-angular width of mandible (Figure 6B; circled 33) hada similar growth pattern as that of the anterior-posterior
length, with the greatest increase between P7 and P21. Ofnote, there was a 52% increase in mandibular height betweenP7 and P21. However, there was only a 17% increase inlower mandibular length, 36% increase in upper mandibularlength, and 34% increase in mandibular width, indicating agreater rate of vertical growth during this period. Consistentwith this differential three-dimensional growth pattern inthe mandible, the length/height ratio and width/height ratiodecreased after P7, but the length/width ratio remained the same(Figure 6C).
Proportional Changes of the CraniofacialSkeleton during Postnatal DevelopmentThe morphology of the craniofacial complex is the result ofcoordinated three-dimensional growth, and the proportionalgrowth of different dimensions is the key determinant of skullshape. To further characterize craniofacial skeletal growth offemale C57BL/6NCrl mice, we determined the proportional
Frontiers in Physiology | www.frontiersin.org 7 September 2017 | Volume 8 | Article 697

Wei et al. Postnatal Craniofacial Skeletal Development in Mice
FIGURE 4 | Transverse growth of the mouse craniofacial skeleton. (A) Diagram of mouse skull at ventral view with landmarks and parameters used for transverse
dimension measurements. (B) Growth curves showing changes in transverse dimension with age (landmarks and labels were described in Figure 1 and Table 1),
including 4 parameters in facial region (upper) and 3 parameters in cranial region (lower). *Represents significant change between indicated data point and immediate
earlier time point, and red arrows indicate significant changes between all the neighboring time points before that time point (Tukey’s multiple comparison test, p <
0.05). NS indicates that there was no statistical significance among the data points.
FIGURE 5 | Vertical growth of the mouse craniofacial skeleton. (A) Diagram of mouse skull at mid-sagittal plane with landmarks and parameters used for vertical
dimension measurements. (B) Growth curves showing dynamic change of individual parameters on vertical dimension with age (landmarks and labels were described
in Figure 1 and Table 1). *Represents significant change between indicated data point and immediate earlier time point (Tukey’s multiple comparison test, p < 0.05).
growth change among different portions of the craniofacialbones.
First, we analyzed the proportional growth of the maxillaand mandible by comparing the relative length of maxilla(Figure 7A; circled 16) and mandible (Figure 7A; circled 30).The mandible grew continuously until P120 but the maxilla keptgrowing afterwards (Figure 7B). The maxilla/mandible ratio wasrelatively constant from P7 to P30 except for a very small butstatistically significant decrease from P7 to P14, followed bya slight increase after P60 (Figure 7B). Both the maxilla andmandible showed the greatest growth velocity during the first21 days, and a sharp drop afterwards, reaching nearly zero byP120 (Figure 7C). The maxilla had a greater growth velocity thanthe mandible at all intervals before P90. The accumulated effectof this differential growth velocity likely explains the increase inmaxilla/mandible ratio and more anterior position of the maxillaand mandible relative to the cranium at later time points.
The skull grows three-dimensionally in length, height, andwidth. In the cranial region, the length/height ratio was lowestat P7 and continued to increase until p180, indicating fastergrowth in cranial length compared to height postnatally. Thelength/width ratio remained the same from P7 to P30 withbigger values at P60 and afterwards, indicating proportionalgrowth in cranial length and width during the first month afterbirth, followed by greater increases in length afterwards. Thewidth/height ratio had an incremental increase from P21 to P60,reflecting faster growth in width compared to height duringthat period of development (Figure 8A). In the facial region,the length/height ratio had no significant change over time,indicating balanced postnatal growth in facial length and height.The facial length/width ratio had a gradual increase from P7 toP60, indicating faster growth in length compared to width. Incontrast, the width/height ratio had a gradual decrease from P7to P60, indicating slower growth in width compared to height
Frontiers in Physiology | www.frontiersin.org 8 September 2017 | Volume 8 | Article 697

Wei et al. Postnatal Craniofacial Skeletal Development in Mice
FIGURE 6 | Postnatal growth of the mandible in three dimensions. (A)
Diagrammatic lateral and inferior view of mouse mandible with landmarks and
parameters used for mandible measurements. (B) Growth curves showing
dynamic change of individual mandible parameters with age (landmarks and
labels were described in Figure 1 and Table 1). (C) Ratio of mandibular
growth in three dimensions. *Represents significant change between indicated
data point and immediate earlier time point (Tukey’s multiple comparison test,
p < 0.05).
(Figure 8B). Thus, in the cranial region, the order of earlypostnatal dimensional increases were length > width > height,while in the facial region, the order was length= height > width.
The skull is composed of cranial and facial regions withcoordinated growth. The cranial/facial ratio in length, width,and height was always >1 (Figure 8C). The cranial/facial ratioin length continued to decrease from P7 to P30 and plateauedafterwards, indicating faster facial than cranial length growthat early postnatal stage. The cranial/facial ratio in width hadan increase from P7 to P21 and a decrease from P60 toP120, indicating that width growth in facial region was slowerin the first 3 weeks after birth but increased after P60. Thecranial/facial ratio in height continued to decrease from P7 toP60, indicating relatively faster postnatal facial height growthduring that developmental stage. Hence, the facial region hadfaster growth in both length and height compared to the cranial
region during the first 2 months of age, but the width growth inthe facial region was slower at early stage but faster at later stage.
Angular Changes of the CraniofacialSkeleton during Postnatal DevelopmentTo assess changes to the skull shape during development, weevaluated the changes in angles between landmarks at the mid-sagittal plane. The cranial vault became flatter postnatally, asevidenced by a continuous increase in the mid-cranial angles(Figure 9; circled 35, 36) from P7 until P90 as well as an increasein the posterior-cranial angle (Figure 9; circled 37) from P7 toP21. In contrast, the cranial base became deeper, as evidenced bya decrease in two cranial base angles (Figure 9; circled 39, 40)from P7 to P21. The angle in the most anterior (Figure 9; circled34) and most posterior (Figure 9; circled 38) regions becamesmaller from P7 to P30, indicating that the cranial cavity becamemore fusiform. A cumulative effect of skull shape change, thecranial cavity area had a continuous increase from P7 to P90,with the fastest increase between P7 and P14 (Figure 9D). Theangle between the cranial base and maxilla (Figure 9; circled 42)as well as the angle between the mandible and maxilla (Figure 9;circled 44) gradually increased from P7 until P60, indicatingmore forward growth of maxilla relative to the cranial baseand mandible. The facial angle (Figure 9; circled 41) showedno significant change during postnatal development and thecranium-mandible angle (Figure 9; circled 43) had some smallbut statistically significant changes during the first 2 months ofage. Together, the data suggested that A-P growth of maxilla isthe most prominent of the facial region postnatally in femaleC57BL/6NCrl mice.
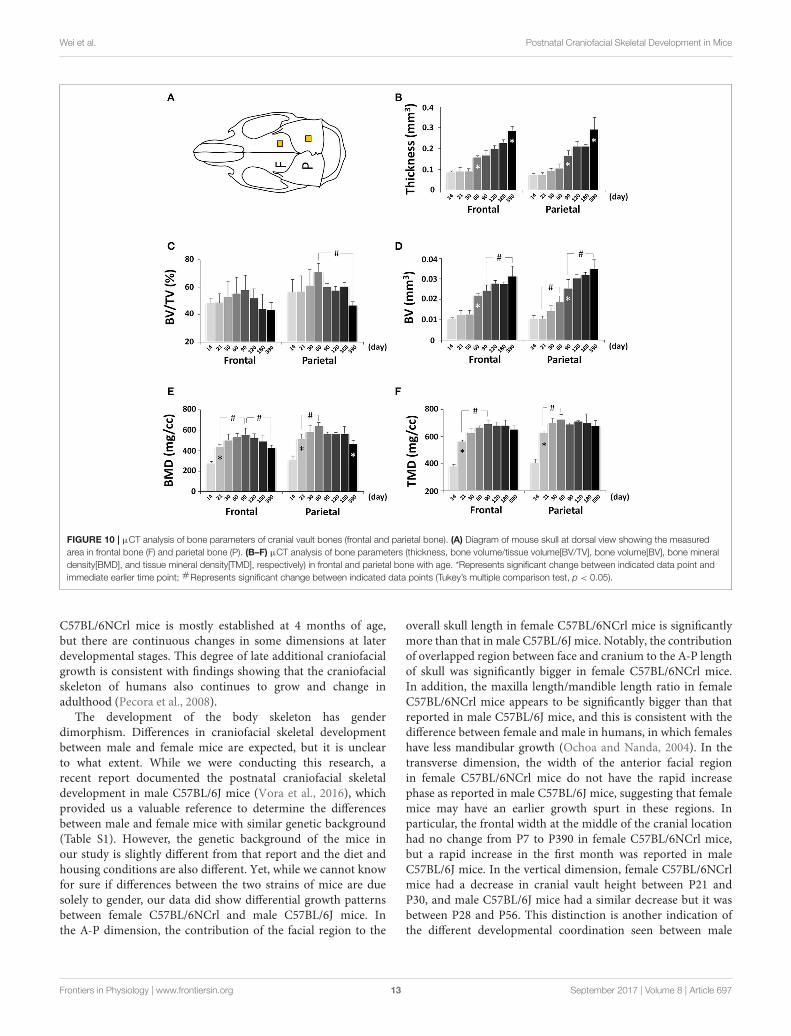
Postnatal Craniofacial Bone DevelopmentCraniofacial bone development can be altered in pathologicalconditions and mouse models are frequently used to determinethe underlying mechanisms (Damazo et al., 2007; Liu et al.,2014; Fang et al., 2015a,b); however, there is lacking detailedknowledge of normative mouse craniofacial bone development.To determine the dynamic bone growth patterns in the cranialvault during postnatal development of C57BL/6NCrl mice, boneparameters of frontal and parietal bones were analyzed by µCT(Figure 10A; Figure S1A). In neural crest-derived frontal bone,the thickness remained at a similar value from P14 to P30 butcontinuously increased afterwards, with the quickest increasebetween P30 and P60 (Figure 10B); bone volume/tissue volume(BV/TV) peaked at P90 and subsequently decreased continuously(Figure 10C); bone volume (BV) had similar change pattern asthickness (Figure 10D); bone mineral density (BMD) peakedat P90 and decreased continuously afterwards (Figure 10E);tissue mineral density (TMD) peaked at P90 and decreasedat P390 (Figure 10F). In mesoderm-derived parietal bone, thebone development dynamic was different from frontal bone.The quickest thickness increase occurred between P60 and P90and there was no change between P120 and P180 (Figure 10B);BV/TV in parietal bone was significantly higher than that offrontal bone although the difference between two bones at eachindividual data point was not statistically significant; it peaked atP60 and significantly decreased at P390 (Figure 10C); the change
Frontiers in Physiology | www.frontiersin.org 9 September 2017 | Volume 8 | Article 697

Wei et al. Postnatal Craniofacial Skeletal Development in Mice
FIGURE 7 | Coordinated growth of the maxilla and mandible during postnatal development. (A) Diagram of lateral view of mouse skull with landmarks and parameters
used for the measurement of maxilla and mandible. (B) Changes in length of maxilla and mandible with age and the ratio between them. (C) Growth rate of maxilla
and mandible between each designated age intervals. *Represents significant change between indicated data point and immediate earlier time point (Tukey’s multiple
comparison test, p < 0.05).
in BV mirrored the change in thickness (Figure 10D); BMDpeaked at P60 and significantly decreased at P390 (Figure 10E);TMD had the biggest increase from P14 to P21 and peaked at P60(Figure 10F).
Next, we determined changes in bone parameters inthe mandible of the C57BL/6NCrl mice during postnataldevelopment. A defined area was employed to perform thequantitative mandibular micro CT measurements (Figure 11A,Figure S1D). The thickness of the mandible was decreasingover time but the changes were not statistically significant(Figure 11B). The BV/TV had a significant increase until P90and then stabilized (Figure 11C). As a result, BV also had asignificant increase until P90 (Figure 11D). BMD (Figure 11E),and TMD (Figure 11F) had the similar change pattern as BV.Interestingly, the time to reach the peak value of bone parametersin the mandible was the same as the frontal bone but differentfrom parietal bone. Of note, both the frontal bone and mandibleare neural crest-derived, but parietal bone is mesoderm-derived,and this may contribute to the similarity and difference amongthese bones.
Postnatal Cranial Base DevelopmentThe cranial base is a supporting platform for brain developmentand contains multiple growth centers to drive both cranial and
facial anterior-posterior growth (Thorogood, 1988). The ISS andSOS are two synchondroses located at the center of cranial baseand are important centers of longitudinal growth in the skull,playing critical roles in upper face and cranial vault development.The cranial base of C57BL/6NCrl mice were evaluated by µCT toassess the dynamic morphological changes and fusion of the ISSand SOS as well as the bone parameter changes of pre-sphenoid,basi-sphenoid, and basi-occipital bones which are separated bythe ISS and SOS.
First, we determined the developmental dynamics of cranialbase synchondroses. The ISS remained patent up to P60; however,small radiopaque areas can be seen within the central region ofthe ISS in 75% of the mice (Figure 12A and Figure S2). By P90,all animals had bony bridging between the caudal and rostral
margins of the ISS. These incidences of bony bridging became
more and more pronounced as mice aged, and the ISS was
completely fused sometime between P180 and P390 (Figure 12A
and Figure S2). Between P21 and P30, there was a 13% increase in
the width of the ISS followed by a small but statistically significant
5% decrease at P60 compared to P30 (Figure 12B; circled 24).The A-P length of the ISS had a nearly 50% decrease from P7
to P21 and remained constant afterwards prior to its complete
fusion (Figure 12B; circled 14). The SOS remained patent up toP30 and a small radiopaque area can be seen within the central
Frontiers in Physiology | www.frontiersin.org 10 September 2017 | Volume 8 | Article 697

Wei et al. Postnatal Craniofacial Skeletal Development in Mice
FIGURE 8 | Proportional changes of craniofacial skeletal growth during
postnatal development. (A) Ratio of three dimensions in cranial region. (B)
Ratio of three dimensions in facial region. (C) Ratio between cranium and face
in length, width, and height. *Represents significant change between indicated
data point and immediate earlier time point; #Represents significant change
between indicated data points (Tukey’s multiple comparison test, p < 0.05).
region of the SOS in all mice at P21 (Figure 12A and Figure S2).By P60, all animals had bony bridging between the caudal androstral margins of the SOS. These incidences of bridging becamemore and more pronounced over time and the SOS structurecompletely disappeared at P390 (Figure 12A and Figure S2). TheSOS is 64–80% wider than the ISS. There was a 10% increasebetween P7 and P14, a 4% increase between P30 and P60, and a5% decrease between P90 and P120 in SOS width (Figure 12B;circled 25). The A-P length of the SOS is comparable to thatof the ISS. Similar to the ISS, there was a 40% decrease in theSOS length between P7 and P21 and the SOS length remainedconstant afterwards until its complete fusion (Figure 12B; circled15). The exooccipital-basioccipital synchondrosis was patent atP7, but the bony bridging started to appear at P14 in most mice.The bony bridging became more evident at P21 and 100% of the
exooccipital-basioccipital synchondrosis completely fused at P30(Figure 12A and Figure S2).
Next, we performed quantitative µCT analysis of boneparameters of pre-sphenoid, basi-sphenoid, and basi-occipitalbones (Figure 13A and Figure S1B). Cranial base bones areformed through endochondral ossification, which is differentfrom the calvaria, face and mandible that are formed throughintramembranous ossification. The total volume (size) of the pre-sphenoid bone, which is derived from neural crest, was smallestat P90 and continuously increased afterwards (Figure 13B),reflecting a unique remodeling pattern. The BV/TV of the pre-sphenoid continued to increase until it plateaued from P90to P180, with a drop at P390 (Figure 13C). As a result ofthe increase in BV/TV, the bone volume of the pre-sphenoidbone continued to increase (Figure 13D). The BMD of thepre-sphenoid bone followed a similar pattern to that of theBV/TV (Figure 13E). The TMDof the pre-sphenoid, a parameterreflecting thematerial density of bone itself, continued to increaseuntil it peaked at P90, but it decreased significantly at P390(Figure 13F). The basi-sphenoid is a bone of dual origin andthe site chosen for measurement is of neural crest origin.The basi-sphenoid had a very different dynamic change involume (size) compared to the pre-sphenoid, and it continuedto increase (Figure 13B). The bone volume (Figure 13D), BMD(Figure 13E), and TMD (Figure 13F) of the basi-sphenoid allpeaked at P120. However, the BV/TV of the basi-sphenoid bonehad a gradual decrease from P14 to P60, and a significantdecrease from P180 to P390 (Figure 13C). Noticeably, theBV, BV/TV, BMD, and TMD of the basi-sphenoid started thedecline after P180. At P390, the basi-sphenoid had a 36%decrease in bone volume compared to a peak value at P120,which was contributed to by a 42% decrease in BV/TV anda 5% decrease in TMD. The decrease in bone volume of thebasi-sphenoid after C57BL/6 female mice reached adulthoodis most significant among all examined craniofacial bones.Mesoderm-derived basi-occipital bone had a steady increasein tissue volume during first month of age (Figure 13B), acontinuous increase in BV/TV (Figure 13C), BV (Figure 13D),BMD (Figure 13E), and TMD (Figure 13F) until they peaked atP90 or P120.
DISCUSSION
Cranial skeletogenesis is a unique process from that in the restof the body. The development of craniofacial bones and skullshape is a coordinated process. Our data showed that duringthe first month after birth, the head, body, tail, femur, and tibiahad the fastest growth in length. Interestingly, the ratio betweenthe length of the head and other parts of the body had thegreatest decrease during this period of time, indicating that thehead grows less in the anterior-posterior dimension than otherparts of the body in length at early postnatal stages of femaleC57BL/6NCrl mice. The head of female C57BL/6NCrl mice is∼38% of the total body length at birth and ∼28% at P90, andremained at a similar value afterwards. This trend is very similarto humans, in which the head is ∼25% of the total body length
Frontiers in Physiology | www.frontiersin.org 11 September 2017 | Volume 8 | Article 697

Wei et al. Postnatal Craniofacial Skeletal Development in Mice
FIGURE 9 | Angular changes during postnatal craniofacial growth. (A) Diagram of mouse skull at lateral view showing labels and parameters used for angular
measurement and cranial cavity area measurement (gray area). (B) Angular changes of parameters in cranial region. (C) Angular changes of parameters in facial
region. (D) Cranial cavity area measured at mid-sagittal plane with age. *Represents significant change between indicated data point and immediate earlier time point,
and red arrow indicates significant changes between all the neighboring time points before that time point (Tukey’s multiple comparison test, p < 0.05). NS indicates
that there was no statistical significance among the data points.
at birth and ∼15% in adults (Huelke, 1998). Conceptually, therelative ratio in length can be a simple index to identify andquantify craniofacial developmental abnormalities using otherparts of the body such as the total body length as an internalreference.
Our data showed that the greatest growth in A-P, transverse,and vertical dimensions in craniofacial regions of femaleC57BL/6NCrl mice occurred during the first 3 weeks after birth.The growth continued after 3 weeks of age with much slowervelocity. Despite the continuous increase in body weight, thelength of both the femur and tibia of female C57BL/6NCrlmice had no further increase after P120, indicating that they
stopped linear skeletal growth at P120. Similar to limb bones,most of the linear measurements in the craniofacial region hadno change after P120, but there are indeed some changes atlater developmental stages. In the A-P dimension, the faciallength had a 4% increase in association with a 6% increase innasal bone length between P180 and P390 (Figure 3); occipitalbone, intraparietal bone, and frontal bone also had small A-P dimension change after P120; the cranial length/facial lengthratio peaked at P390. In vertical dimension, the middle-cranialheight (Figure 5; circled 28) had a 5% increase in an associationwith a 4% increase in cranial cavity area (Figure 9) betweenP120 and P390. Thus, the craniofacial morphology in female
Frontiers in Physiology | www.frontiersin.org 12 September 2017 | Volume 8 | Article 697
Wei et al. Postnatal Craniofacial Skeletal Development in Mice
FIGURE 10 | µCT analysis of bone parameters of cranial vault bones (frontal and parietal bone). (A) Diagram of mouse skull at dorsal view showing the measured
area in frontal bone (F) and parietal bone (P). (B–F) µCT analysis of bone parameters (thickness, bone volume/tissue volume[BV/TV], bone volume[BV], bone mineral
density[BMD], and tissue mineral density[TMD], respectively) in frontal and parietal bone with age. *Represents significant change between indicated data point and
immediate earlier time point; #Represents significant change between indicated data points (Tukey’s multiple comparison test, p < 0.05).
C57BL/6NCrl mice is mostly established at 4 months of age,but there are continuous changes in some dimensions at laterdevelopmental stages. This degree of late additional craniofacialgrowth is consistent with findings showing that the craniofacialskeleton of humans also continues to grow and change inadulthood (Pecora et al., 2008).
The development of the body skeleton has genderdimorphism. Differences in craniofacial skeletal developmentbetween male and female mice are expected, but it is unclearto what extent. While we were conducting this research, arecent report documented the postnatal craniofacial skeletaldevelopment in male C57BL/6J mice (Vora et al., 2016), whichprovided us a valuable reference to determine the differencesbetween male and female mice with similar genetic background(Table S1). However, the genetic background of the mice inour study is slightly different from that report and the diet andhousing conditions are also different. Yet, while we cannot knowfor sure if differences between the two strains of mice are duesolely to gender, our data did show differential growth patternsbetween female C57BL/6NCrl and male C57BL/6J mice. Inthe A-P dimension, the contribution of the facial region to the
overall skull length in female C57BL/6NCrl mice is significantlymore than that in male C57BL/6J mice. Notably, the contributionof overlapped region between face and cranium to the A-P lengthof skull was significantly bigger in female C57BL/6NCrl mice.In addition, the maxilla length/mandible length ratio in femaleC57BL/6NCrl mice appears to be significantly bigger than thatreported in male C57BL/6J mice, and this is consistent with thedifference between female and male in humans, in which femaleshave less mandibular growth (Ochoa and Nanda, 2004). In thetransverse dimension, the width of the anterior facial regionin female C57BL/6NCrl mice do not have the rapid increasephase as reported in male C57BL/6J mice, suggesting that femalemice may have an earlier growth spurt in these regions. Inparticular, the frontal width at the middle of the cranial locationhad no change from P7 to P390 in female C57BL/6NCrl mice,but a rapid increase in the first month was reported in maleC57BL/6J mice. In the vertical dimension, female C57BL/6NCrlmice had a decrease in cranial vault height between P21 andP30, and male C57BL/6J mice had a similar decrease but it wasbetween P28 and P56. This distinction is another indication ofthe different developmental coordination seen between male
Frontiers in Physiology | www.frontiersin.org 13 September 2017 | Volume 8 | Article 697

Wei et al. Postnatal Craniofacial Skeletal Development in Mice
FIGURE 11 | µCT analysis of bone parameters of mandible. (A) Diagram of mandible at lateral view showing the measured area. (B–F) µCT analysis of bone
parameters (thickness, bone volume/tissue volume[BV/TV], bone volume[BV], bone mineral density[BMD], and tissue mineral density[TMD], respectively) in mandible
with age. *Represents significant change between indicated data point and immediate earlier time point; #Represents significant change between indicated data
points (Tukey’s multiple comparison test, p < 0.05).
and female mice. Altogether, our data indicate that femaleC57BL/6NCrl mice have generally a very similar craniofacialgrowth pattern compared to male C57BL/6J mice, but also havesome unique features including a bigger contribution of thefacial region to A-P dimension and a bigger maxilla/mandiblelength ratio. Greater facial convexity in females than maleshas also been reported for humans (Anic-Milosevic et al.,2008).
In contrast to the linear measurement of individual bones,the bone parameters of craniofacial bones had a continuouschange over the time. The thickness of calvaria kept increasingbetween P120 and P390, but the BV/TV of these bones hadopposite change. Compared to its peak tissue mineral densityat P90, tissue mineral density of the frontal bone, a neuralcrest-derived bone, had a 6% decrease at P390. Similarly,tissue mineral density of parietal bone, a mesoderm-derivedbone, had a 7% decrease at P390 compared to its peakvalue at P60. Thus, the bone quality of the calvaria may becompromised with aging despite an increase in bone volume.Similar to the frontal bone, the mandible is a neural crest-derived bone. Compared to the calvaria, the mandible hasunique morphology and function and is subject to stress due
to the mandibular movement and mastication. Interestingly,the thickness of the mandible decreased with age. However,the BV/TV was comparable at P390 compared to P60-P180,which is in contrast with a significant decrease in calvaria.Similarly, the tissue mineral density of the mandible at P390was comparable to P120–P180. It is known that mechanicalloading is an anabolic signal to bone (Robling and Turner, 2009;Barndt et al., 2015). The ability of the mandible to maintainBV/TV and tissue mineral density during later adulthood maybe due to the beneficiary effect of mechanical loading due to itsunique function in the oral cavity. Cranial base bones are formedthrough endochondral ossification (Nie, 2005). In contrast tocalvarial bones, three cranial base bones in the midline haddifferent dynamic changes in bone parameters, but all of themhad stable BV/TV between P90 and P180 and a significantdecrease in BV/TV at P390. The peak tissue mineral density incranial base bones appeared later than in cranial vault bones andmandible. The significant differences in bone parameters amongvarious craniofacial bones add to the remarkable topological andfunctional complexity of this region. Our data demonstratedthe dynamic changes of craniofacial bone parameters duringdevelopment; however, due to the limited sample size of this
Frontiers in Physiology | www.frontiersin.org 14 September 2017 | Volume 8 | Article 697

Wei et al. Postnatal Craniofacial Skeletal Development in Mice
FIGURE 12 | Postnatal changes of synchondroses in cranial base. (A) Representative µCT images of synchondroses in the cranial base in 3-D reconstruction and
2-D sections. Green arrows point to the radiopaque areas; green arrow heads point to the bony bridges; dashed green arrows point to the completely fused
synchondroses. (B) Linear measurement (length and width) of inter-sphenoid synchondrosis (ISS) and sphenoid-occipital synchondrosis (SOS). *Represents
significant change between indicated data point and immediate earlier time point and red arrows indicate significant changes between all the neighboring time points
before that time point (Tukey’s multiple comparison test, p < 0.05). (C) Postnatal growth rate of pre-sphenoid, basi-sphenoid, and basi-occipital bone during the
designated age intervals.
study, many changes in bone parameters were not yet statisticallysignificant.
The cranial base has a major role in driving postnataloverall craniofacial growth (Parsons et al., 2015). Expansion ofthe cranial base occurs at the synchondroses, which are thecounterpart of growth plate in long bones (Wei et al., 2016).The posterior cranial base is composed of the pre-sphenoid, basi-sphenoid, and basi-occipital bones which are separated by the ISS
and SOS. At P7, the length of the posterior cranial base reachedmore than 60% of its length at P120, indicating an importantrole of early development. After the first week of age, there wasstill nearly 40% growth in the A-P dimension of the cranialbase with the quickest growth between P7 and P21, followedby much slower growth afterwards and complete stop afterP120. Unsurprisingly, the individual cranial base bones sharedthe similar growth trend as posterior cranial base (Figure 12C).
Frontiers in Physiology | www.frontiersin.org 15 September 2017 | Volume 8 | Article 697

Wei et al. Postnatal Craniofacial Skeletal Development in Mice
FIGURE 13 | µCT analysis of bone parameters of cranial base bones. (A)
Diagram of mouse skull at lateral view showing the measured area in
pre-sphenoid (PS), basi-sphenoid (BS), and basi-occipital bone (BO). (B–F)
µCT analysis of bone parameters (thickness, bone volume/tissue volume,
bone volume, bone mineral density, and tissue mineral density, respectively) in
cranial base bones with age. *Represents significant change between
indicated data point and immediate earlier time point; #Represents significant
change between indicated data points (Tukey’s multiple comparison test,
p < 0.05).
The growth rate of the pre-sphenoid and basi-sphenoid bonesbetween P7 and P14 in female C57BL/6NCrl mice studied here(∼30–50 µm/day) is very similar to male C57BL/6J mice (∼30–70 µm/day). Interestingly, in both male and female mice, thegrowth rate of the pre-sphenoid bone is higher between P14
and P21 than between P7 and P14. Similar to the decrease ingrowth rate of cranial base length, there was a fast decrease inthe A-P length of the ISS and SOS during the first 3 weeks afterbirth, and they maintained the same length until the completedisappearance of the structure. Early postnatal cranial basegrowth is also an important component of human craniofacialdevelopment (Cendekiawan et al., 2010).
Similar to others, we found a radiopaque structure in themiddle of the SOS at P21. This radiopaque region was termed“tethers” both in the growth plate of long bone (Chen et al., 2009;Lee et al., 2011) and the SOS (Lee et al., 2011). Histologicallythe tether in the SOS was shown to have an altered cellularmorphology with mineralizing chondrocyte matrix (Vora et al.,2016). In female C57BL/6NCrl mice, we also observed thistether structure in the ISS at 2 months of age, which was notreported in the other study using male C57BL/6J mice (Voraet al., 2016). It is unknown whether this is due to gender ormouse strain differences. However, the tether structure in thesynchondroses appears not to stop the growth of the cranial basesince there was still considerable growth after its appearance. Theelongation of the basi-occipital bone is contributed mainly bythe SOS according to its location, and it still has more than 20%growth after the appearance of the tether structure. The exactrole of these tether structures in synchondroses requires furtherstudies.
Prior to the availability of the µCT-based craniofacialmeasurement, radiograph-based two-dimensional cephalometriclinear and angular analysis of murine skulls has been developedlong ago (Spence, 1940; Jolly and Moore, 1975; Engstromet al., 1982). Radiograph-based cephalometry used in murineskulls is very similar to that used in human, which haspractical and successful clinical applications. Although it wasreported that certain landmarks are difficult to identify on two-dimensional radiograph of mouse skull (Bloom et al., 2006),radiograph-based cephalometry has been used successfully toidentify morphometric changes in transgenic mice (Chunget al., 1997; McAlarney et al., 2001; Yagasaki et al., 2003;Simon et al., 2014; Badri et al., 2016). Thus, radiograph-based cephalometric analysis is an alternative to µCT-basedcraniofacial morphological measurement when the landmarkscan be clearly identified. On the other hand, µCT-basedcraniofacial measurement has the advantage of high resolutionand the ability to determine themorphology, quantity and qualityof each individual bone.
In summary, we thoroughly documented the normativedata of postnatal craniofacial skeletal development of femaleC57BL/6NCrl mice. The A-P length, width, and height of skullhad the quickest growth in the first 3 weeks after birth and someparameters had continuous changes until postnatal day 390. Thegrowth pattern of female C57BL/6NCrl mice is very similar tothat of reported male C57BL/6J mice (Vora et al., 2016) butthere are also differences (Table S1). Most of the bone parametershad the dynamic change throughout the whole developmentstages and many bone parameters such as calvarial thickness andBV/TV had the bigger increase after 3–4 weeks of age. These datacan serve as reference standard for future quantitative work usingthis mouse strain.
Frontiers in Physiology | www.frontiersin.org 16 September 2017 | Volume 8 | Article 697

Wei et al. Postnatal Craniofacial Skeletal Development in Mice
ETHICS STATEMENT
All experimental procedures were carried out with the approvalof the Institutional Animal Care and Use Committee at theUniversity of Michigan (approval number: PRO00006354). Allmeasures were taken to minimize the number of animals used.
AUTHOR CONTRIBUTIONS
XW, NT, NH, MH, and FL conceived the study, XW and NTperformed analyses, XW, NT, NH, MH, and FL contributed todata interpretation, XW and FL wrote the manuscript with NT,NH and MH contributing to critical revising.
ACKNOWLEDGMENTS
We would like to thank Basma Khoury and Andrea Clarkfor the assistance in µCT scanning, Dr. Jin Liu for the
assistance in calvaria µCT analysis. This work is supportedin part by NIAMS grant R01AR062030 (FL), BOOST fundfrom Department of Biologic and Material Sciences andDivision of Prosthodontics at University of Michigan School ofDentistry (FL), MCubed fund from University of Michigan (FL),NIDCR grant R0DE025827 (NH), and National Natural ScienceFoundation of China grant 81470764 (MH). NT is supportedby research pathway fund for dental students at University ofMichigan School of Dentistry.µCTwork was partly supported byP30 Core Center award to University of Michigan from NIAMS(AR 69620).
SUPPLEMENTARY MATERIAL
The Supplementary Material for this article can be foundonline at: http://journal.frontiersin.org/article/10.3389/fphys.2017.00697/full#supplementary-material
REFERENCES
Anic-Milosevic, S., Lapter-Varga, M., and Slaj, M. (2008). Analysis of the soft tissue
facial profile by means of angular measurements. Eur. J. Orthod. 30, 135–140.
doi: 10.1093/ejo/cjm116
Badri, M. K., Zhang, H., Ohyama, Y., Venkitapathi, S., Kamiya, N., Takeda, H.,
et al. (2016). Ellis Van Creveld2 is required for postnatal craniofacial bone
development. Anat. Rec. (Hoboken) 299, 1110–1120. doi: 10.1002/ar.23353
Barndt, P., Zhang, H., and Liu, F. (2015). Immediate loading: from biology to
biomechanics. Report of the committee on research in fixed prosthodontics of
the American Academy of fixed prosthodontics. J. Prosthet. Dent. 113, 96–107.
doi: 10.1016/j.prosdent.2014.08.011
Bloom, M. W., Murakami, S., Cody, D., Montufar-Solis, D., and Duke, P. J.
(2006). Aspects of achondroplasia in the skulls of dwarf transgenic mice: a
cephalometric study. Anat. Rec. A Discov. Mol. Cell. Evol. Biol. 288, 316–322.
doi: 10.1002/ar.a.20308
Cendekiawan, T., Wong, R., and Rabie, A. (2010). Relationships between cranial
base synchondroses and craniofacial development: a review. Open Anat. J. 2,
67–75. doi: 10.2174/1877609401002010067
Chai, Y., Jiang, X., Ito, Y., Bringas, P. Jr., Han, J., Rowitch, D. H., et al. (2000).
Fate of the mammalian cranial neural crest during tooth and mandibular
morphogenesis. Development 127, 1671–1679.
Chen, J., Lee, C. S., Coleman, R. M., Yoon, J. Y., Lohmann, C. H., Zustin, J., et al.
(2009). Formation of tethers linking the epiphysis and metaphysis is regulated
by vitamin d receptor-mediated signaling. Calcif. Tissue Int. 85, 134–145.
doi: 10.1007/s00223-009-9259-1
Chung, K. S., Jacenko, O., Boyle, P., Olsen, B. R., and Nishimura, I. (1997).
Craniofacial abnormalities in mice carrying a dominant interference mutation
in type X collagen. Dev. Dyn. 208, 544–552. doi: 10.1002/(SICI)1097-
0177(199704)208:4<544::AID-AJA10>3.0.CO;2-X
Damazo, A. S., Moradi-Bidhendi, N., Oliani, S. M., and Flower, R. J. (2007).
Role of annexin 1 gene expression in mouse craniofacial bone development.
Birth Defects Res. A Clin. Mol. Teratol. 79, 524–532. doi: 10.1002/bdra.
20368
Engstrom, C., Linde, A., and Thilander, B. (1982). Craniofacial morphology and
growth in the rat. Cephalometric analysis of the effects of a low calcium and
vitamin D-deficient diet. J. Anat. 134, 299–314.
Fang, F., Sun, S., Wang, L., Guan, J. L., Giovannini, M., Zhu, Y., et al. (2015a).
Neural crest-specific tsc1 deletion in mice leads to sclerotic craniofacial bone
lesion. J. Bone Miner. Res. 30, 1195–1205. doi: 10.1002/jbmr.2447
Fang, F., Wei, X., Hu, M., and Liu, F. (2015b). A mouse model of craniofacial
bone lesion of tuberous sclerosis complex. Musculoskelet. Regen. 1:e814.
doi: 10.14800/mr.814
Gilsanz, V., Kovanlikaya, A., Costin, G., Roe, T. F., Sayre, J., and Kaufman,
F. (1997). Differential effect of gender on the sizes of the bones in the
axial and appendicular skeletons. J. Clin. Endocrinol. Metab. 82, 1603–1607.
doi: 10.1210/jc.82.5.1603
Goldstein, J. A., Paliga, J. T., Wink, J. D., Bartlett, S. P., Nah, H. D., and
Taylor, J. A. (2014). Earlier evidence of spheno-occipital synchondrosis
fusion correlates with severity of midface hypoplasia in patients
with syndromic craniosynostosis. Plast. Reconstr. Surg. 134, 504–510.
doi: 10.1097/PRS.0000000000000419
Huelke, D. F. (1998). An overview of anatomical considerations of infants and
children in the adult world of automobile safety design. Annu. Proc. Assoc. Adv.
Automot. Med. 42, 93–113.
Israel, H. (1977). The dichotomous pattern of craniofacial expansion during aging.
Am. J. Phys. Anthropol. 47, 47–51. doi: 10.1002/ajpa.1330470110
Jiang, X., Iseki, S., Maxson, R. E., Sucov, H. M., and Morriss-Kay, G. M. (2002).
Tissue origins and interactions in the mammalian skull vault. Dev. Biol. 241,
106–116. doi: 10.1006/dbio.2001.0487
Jilka, R. L. (2013). The relevance of mouse models for investigating age-related
bone loss in humans. J. Gerontol. A Biol. Sci. Med. Sci. 68, 1209–1217.
doi: 10.1093/gerona/glt046
Jolly, R. J., and Moore, W. J. (1975). Skull growth in achondroplasic (cn) mice; a
craniometric study. J. Embryol. Exp. Morphol. 33, 1013–1022.
Kronenberg, H. M. (2003). Developmental regulation of the growth plate. Nature
423, 332–336. doi: 10.1038/nature01657
Lee, C. S., Chen, J., Wang, Y., Williams, J. K., Ranly, D. M., Schwartz, Z.,
et al. (2011). Coordinated tether formation in anatomically distinct mice
growth centers is dependent on a functional vitamin D receptor and is
tightly linked to three-dimensional tissue morphology. Bone 49, 419–427.
doi: 10.1016/j.bone.2011.05.004
Liu, J., Campbell, C., Nam, H. K., Caron, A., Yadav, M. C., Millan, J. L., et al. (2015).
Enzyme replacement for craniofacial skeletal defects and craniosynostosis in
murine hypophosphatasia. Bone 78, 203–211. doi: 10.1016/j.bone.2015.05.005
Liu, J., Nam, H. K., Campbell, C., Gasque, K. C., Millan, J. L., and Hatch, N.
E. (2014). Tissue-nonspecific alkaline phosphatase deficiency causes abnormal
craniofacial bone development in the Alpl(-/-) mouse model of infantile
hypophosphatasia. Bone 67, 81–94. doi: 10.1016/j.bone.2014.06.040
Liu, J., Nam, H. K., Wang, E., and Hatch, N. E. (2013). Further analysis of the
Crouzon mouse: effects of the FGFR2(C342Y) mutation are cranial bone-
dependent. Calcif. Tissue Int. 92, 451–466. doi: 10.1007/s00223-013-9701-2
Martinez-Abadias, N., Mitteroecker, P., Parsons, T. E., Esparza, M., Sjovold,
T., Rolian, C., et al. (2012). The developmental basis of quantitative
craniofacial variation in humans and mice. Evol. Biol. 39, 554–567.
doi: 10.1007/s11692-012-9210-7
Frontiers in Physiology | www.frontiersin.org 17 September 2017 | Volume 8 | Article 697

Wei et al. Postnatal Craniofacial Skeletal Development in Mice
McAlarney, M. E., Rizos, M., Rocca, E. G., Nicolay, O. F., and Efstratiadis,
S. (2001). The quantitative and qualitative analysis of the craniofacial
skeleton of mice lacking the IGF-I gene. Clin. Orthod. Res. 4, 206–219.
doi: 10.1034/j.1600-0544.2001.40405.x
Meganck, J. A., Kozloff, K. M., Thornton, M. M., Broski, S. M., and Goldstein, S.
A. (2009). Beam hardening artifacts in micro-computed tomography scanning
can be reduced by X-ray beam filtration and the resulting images can be used to
accurately measure BMD. Bone 45, 1104–1116. doi: 10.1016/j.bone.2009.07.078
Murray, S. A. (2011). Mouse resources for craniofacial research. Genesis 49,
190–199. doi: 10.1002/dvg.20722
Nascimento, W. V., Cassiani Rde, A., and Dantas, R. O. (2013). Effect of
gender, height and race on orofacial measurements. Codas 25, 149–153.
doi: 10.1590/S2317-17822013000200010
Nie, X. (2005). Cranial base in craniofacial development: developmental features,
influence on facial growth, anomaly, and molecular basis. Acta Odontol. Scand.
63, 127–135. doi: 10.1080/00016350510019847
Ochoa, B. K., and Nanda, R. S. (2004). Comparison of maxillary and
mandibular growth. Am. J. Orthod. Dentofacial Orthop. 125, 148–159.
doi: 10.1016/j.ajodo.2003.03.008
Parsons, T. E., Downey, C. M., Jirik, F. R., Hallgrimsson, B., and Jamniczky, H.
A. (2015). Mind the gap: genetic manipulation of basicranial growth within
synchondroses modulates calvarial and facial shape in mice through epigenetic
interactions. PLoS ONE 10:e0118355. doi: 10.1371/journal.pone.0118355
Pecora, N. G., Baccetti, T., and McNamara, J. A. Jr. (2008). The aging
craniofacial complex: a longitudinal cephalometric study from late adolescence
to late adulthood. Am. J. Orthod. Dentofacial Orthop. 134, 496–505.
doi: 10.1016/j.ajodo.2006.11.022
Proffit, W. R., Fields, H. W., and Sarver, D. M. (2007). Contemporary Orthodontics,
4th Edn. St. Louis, MO: Mosby Elsevier.
Quarto, N., Wan, D. C., Kwan, M. D., Panetta, N. J., Li, S., and Longaker,
M. T. (2010). Origin matters: differences in embryonic tissue origin and
Wnt signaling determine the osteogenic potential and healing capacity of
frontal and parietal calvarial bones. J. Bone Miner. Res. 25, 1680–1694.
doi: 10.1359/jbmr.091116
Richtsmeier, J. T., Baxter, L. L., and Reeves, R. H. (2000). Parallels of
craniofacial maldevelopment in Down syndrome and Ts65Dn mice. Dev.
Dyn. 217, 137–145. doi: 10.1002/(SICI)1097-0177(200002)217:2<137::AID-
DVDY1>3.0.CO;2-N
Robling, A. G., and Turner, C. H. (2009). Mechanical signaling for bone
modeling and remodeling. Crit. Rev. Eukaryot. Gene Expr. 19, 319–338.
doi: 10.1615/CritRevEukarGeneExpr.v19.i4.50
Simon, Y., Marchadier, A., Riviere, M. K., Vandamme, K., Koenig, F., Lezot, F.,
et al. (2014). Cephalometric assessment of craniofacial dysmorphologies in
relation with Msx2 mutations in mouse. Orthod. Craniofac. Res. 17, 92–105.
doi: 10.1111/ocr.12035
Spence, J. (1940). Methods of studying the skull development of the living rat by
serial cephalometric roentgenograms. Am. J. Orthod. 10, 127–139.
Thorogood, P. (1988). The developmental specification of the vertebrate skull.
Development 103(Suppl.), 141–153.
Vora, S. R., Camci, E. D., and Cox, T. C. (2016). Postnatal ontogeny of the cranial
base and craniofacial skeleton in male C57BL/6J mice: a reference standard for
quantitative analysis. Front. Physiol. 6:417. doi: 10.3389/fphys.2015.00417
Warman, M. L., Cormier-Daire, V., Hall, C., Krakow, D., Lachman, R., Lemerrer,
M., et al. (2011). Nosology and classification of genetic skeletal disorders: 2010
revision. Am. J. Med. Genet. A 155A, 943–968. doi: 10.1002/ajmg.a.33909
Wei, X., Hu, M., Mishina, Y., and Liu, F. (2016). Developmental regulation
of the growth plate and cranial synchondrosis. J. Dent. Res. 95, 1221–1229.
doi: 10.1177/0022034516651823
Yagasaki, Y., Yamaguchi, T., Watahiki, J., Konishi, M., Katoh, H., and Maki, K.
(2003). The role of craniofacial growth in leptin deficient (ob/ob) mice.Orthod.
Craniofac. Res. 6, 233–241. doi: 10.1034/j.1600-0544.2003.00260.x
Conflict of Interest Statement: The authors declare that the research was
conducted in the absence of any commercial or financial relationships that could
be construed as a potential conflict of interest.
Copyright © 2017 Wei, Thomas, Hatch, Hu and Liu. This is an open-access article
distributed under the terms of the Creative Commons Attribution License (CC BY).
The use, distribution or reproduction in other forums is permitted, provided the
original author(s) or licensor are credited and that the original publication in this
journal is cited, in accordance with accepted academic practice. No use, distribution
or reproduction is permitted which does not comply with these terms.
Frontiers in Physiology | www.frontiersin.org 18 September 2017 | Volume 8 | Article 697