Postharvest Quality Considerations for Caneberries ...
34
Postharvest Quality Considerations for Caneberries--Blackberries O Overview Berry Composition & Quality CDFA Berry Irrigation Project Postharvest reminders & information Marita Cantwell, UC Davis Postharvest Specialist Vegetables [email protected] Caneberry Production Meeting April 11, 2014, UC Hansen Ag Center, Ventura
Transcript of Postharvest Quality Considerations for Caneberries ...

Postharvest Quality Considerations
for Caneberries--Blackberries O
Overview Berry Composition & Quality
CDFA Berry Irrigation Project
Postharvest reminders & information
Marita Cantwell, UC Davis
Postharvest Specialist Vegetables
Caneberry Production Meeting April 11, 2014, UC Hansen Ag Center, Ventura

Fruit Composition & Flavor
High Sugar
Low Acid High Acid
Low Sugar
TART
SWEET HIGH FLAVOR
BLAND
Sugars, Acids, Aroma Volatiles = Flavor

Measuring Sugar Concentrations Both °Brix and % soluble solids can be measured by a
refractometer
°Brix is a measurement of solids in a pure sucrose solution
% soluble solids is an estimate of sugars because a juice solution contains sugars, but also other soluble constituents: organic acids, amino acids, soluble pectins and other soluble compounds.
A fruit juice sample is composed of various sugars and soluble components; therefore “% soluble solids” should be used.
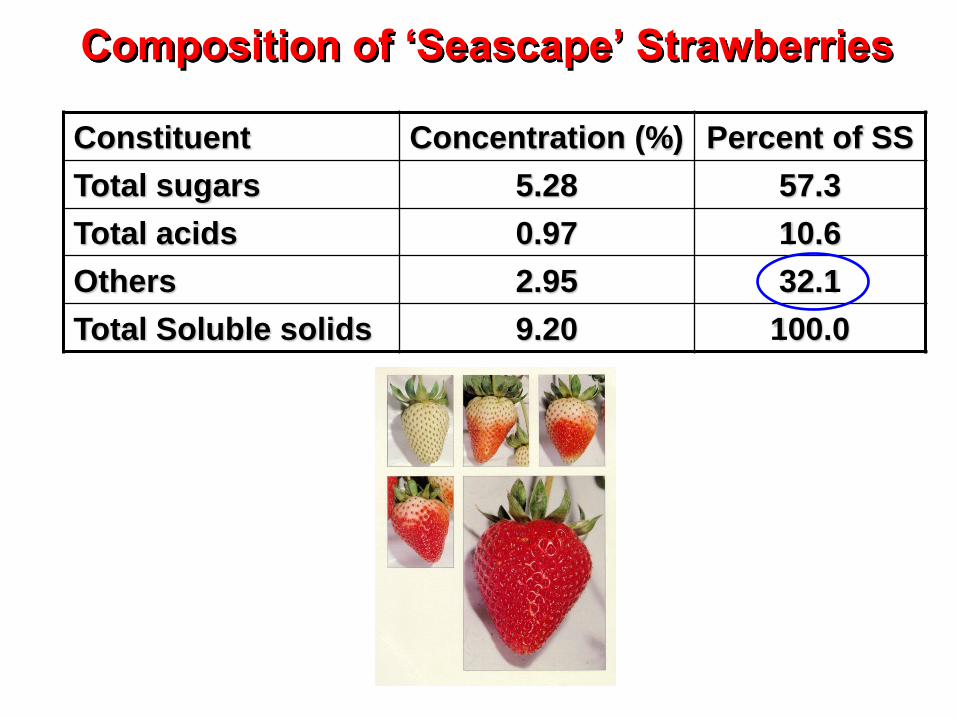
Composition of ‘Seascape’ Strawberries
Constituent Concentration (%) Percent of SS
Total sugars 5.28 57.3
Total acids 0.97 10.6
Others 2.95 32.1
Total Soluble solids 9.20 100.0

What are the Other Constituents?
Constituent Contribution to
refractometer reading % of TSS
Anthocyanins 1.95 21.2
Soluble pectins 0.60 6.5
Ascorbic acid 0.21 2.3
Phenolics 0.19 2.1
Total 2.95 32.1
A. Kader and colleagues, UC Davis
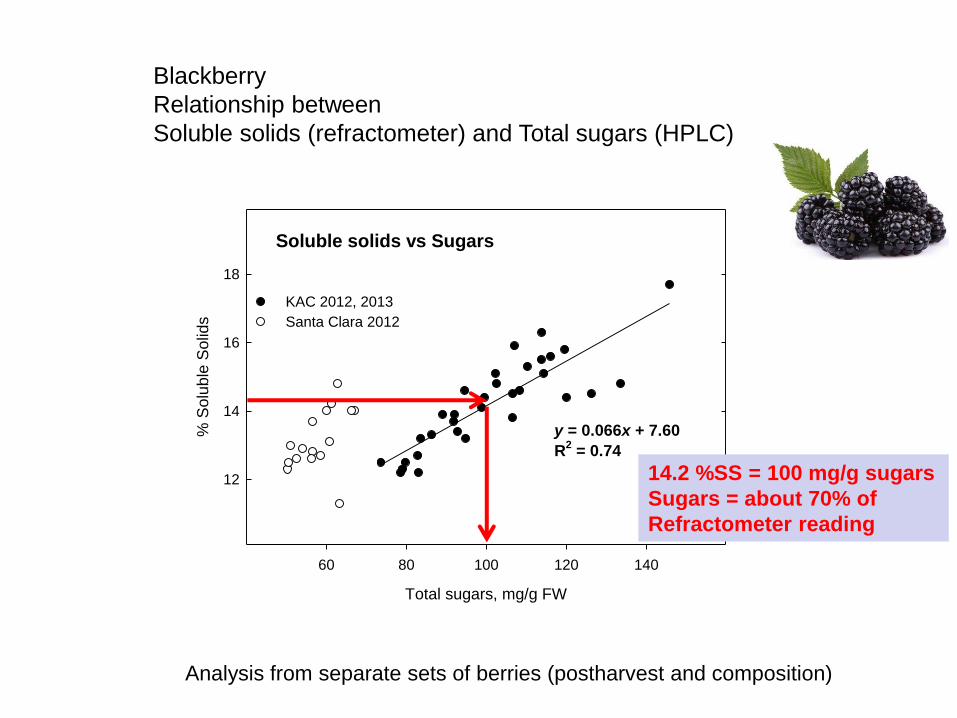
Total sugars, mg/g FW
60 80 100 120 140
% S
olu
ble
Solid
s
12
14
16
18
y = 0.066x + 7.60
R2 = 0.74
KAC 2012, 2013
Santa Clara 2012
Soluble solids vs Sugars
Blackberry
Relationship between
Soluble solids (refractometer) and Total sugars (HPLC)
Analysis from separate sets of berries (postharvest and composition)
14.2 %SS = 100 mg/g sugars
Sugars = about 70% of
Refractometer reading

Relative Sweetness of Sugars
• 15% solutions
• Sucrose = 100
• Fructose = 150-160
• Glucose = 70-80
Pancoast & Junk. 1980. Handbook of sugars. AVI

Sucrose
(%) Glucose
(%) Fructose
(%) ⁰Brix
Total Solids (%)
Strawberry
0.1-2.3 1.0-2.7 1.2-4.2 5.8-13.1 3.8-13.8
Raspberry
0.2 2.6 3.0 9.3-10.5 14.2-18.0
Blackberry
0.1-0.3 1.6-2.6 2.1-3.4 10.8-11.4 8.2-13.6
Blueberry
0.1-1.1 3.3-3.9 3.3-3.9 10.9-15.8 15.7-17.2
Range of reported composition of 4 berries
(compiled from Talcott, 2007; Spanos, 1987; Cantwell Berry Irrigation project, 2013; Bremer et al., 2008)
Cultivar
Climate and production conditions
Stage ripeness

Fruit Ascorbic
acid (mg/100g)
Citric acid (%)
Malic acid (%)
pH Titratable acidity (%)
Strawberry 37-104 0.1-2.0 0.1-0.5 3.18-3.70 0.53-1.72
Raspberry 21-31 1.3-1.8 0.1-0.2 2.65-3.88 1.67-2.38
Blackberry 13-39 0.1-0.4 0.1-1.1 2.55-4.28 0.16-4.22
Blueberry 14-16 0.2-0.5 0.1-1.1 ₋ 0.27-1.00
(compiled from Talcott, 2007; Spanos, 1987; Cantwell Berry Irrigation project, 2013; Bremer et al., 2008)
Range of reported composition of 4 berries
Cultivar
Climate and production conditions
Stage ripeness

Vitamin C and Antioxidant Activity
• Vitamin C – a specific vitamin required by humans – Active forms are sum of ascorbic acid and dehydroascorbic acid – 90% of Vitamin C comes from fruits and vegetable – needed for cell repair; protects against oxidative stress – Is a labile vitamin (degrades easily) – Often measured in storage studies of fruits and vegetables
• Antioxidant activity – With aging, there is increase in oxidative damage – Antioxidants can reverse early stages of oxidation – In fruits and vegetables, many constituents provide antioxidant activity
(phenolics, Vitamin C, Vitamin E, carotenoids and others – Various assays can estimate total activity of antioxidant compounds in
fruits and vegetables
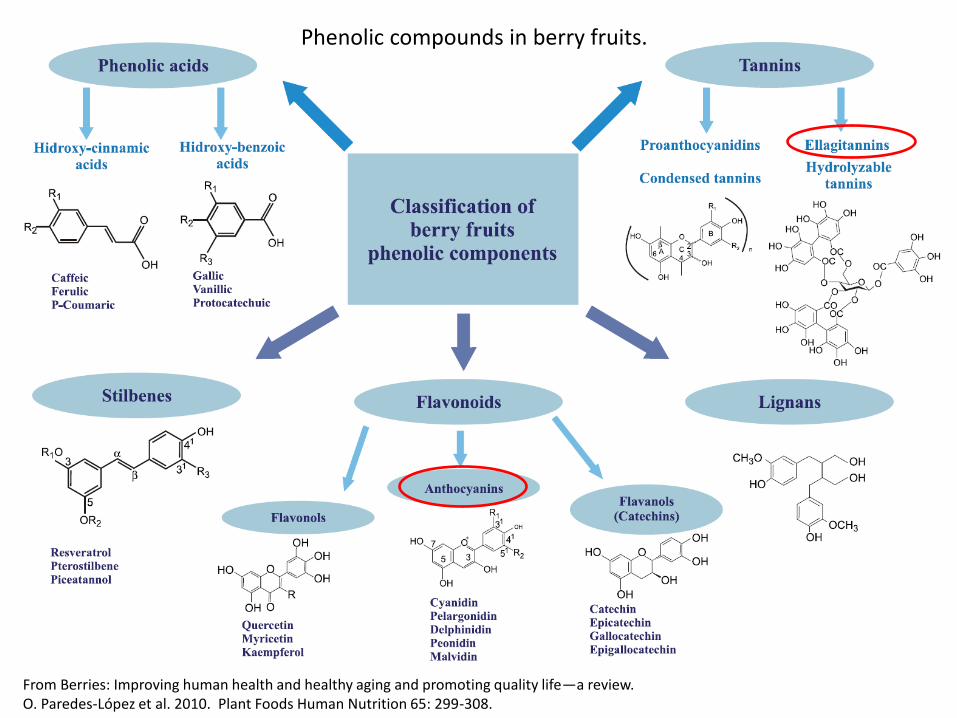
Phenolic compounds in berry fruits.
From Berries: Improving human health and healthy aging and promoting quality life—a review. O. Paredes-López et al. 2010. Plant Foods Human Nutrition 65: 299-308.

Phenolics, mg/100g FW
200 300 400 500 600
AO
(F
RA
P)
mm
ole
/100g F
W
3
4
5
6
7
8
9
Antioxidant Activity vs Phenolics
BlackberryBlueberryStrawberry
Data from Berry Irrigation Project, 2012 and 2013

California Berry Crops: Improving Water-Use
Efficiency While Maintaining Crop Quality
• 2011-2014, Blackberry, blueberry, strawberry
• 4 irrigation regimes, 50, 75, 100, 125% CIMIS ET
• Field performance and yields, marketable quality, composition,
postharvest quality, consumer sensory
• Shermain Hardesty PI, UCCE Ag Econ Nat. Res. UC Davis
• Larry Schwankl, UCCE Irrigation specialist, KAC
• Aziz Baameur, UCCE Santa Clara County
• Mark Gaskell, UCCE Santa Barbara County
• Manuel Jimenez, UCCE Tulare County
• Ramiro Lobo, UCCE San Diego County
• Beth Mitcham, UCCE Postharvest specialist, UC Davis
• Marita Cantwell, UCCE Postharvest specialist, UC Davis
• Cooperating growers

Irrigation Project
Composition of Berries
• Soluble solids (refractometer)
• pH and titratable acidity (pH meter, titration)
• Sugars (individual sugars by HPLC)
• Acids (individual acids by HPLC)
• Vitamin C (ascorbic + DHAA by HPLC)
• Anthocyanins (total by spectrophotometry)
• Phenolics (total by spectrophotometry)
• Antioxidant Activity (FRAP, spectrophotometric assay)
Berries harvested during peak of production
Berries harvested at typical commercial maturity
Berries were of marketable quality, no defects

Blackberry Irrigation Project
2012 and 2013 Samples
Fruit weight, % Dry weight
Table 1. Berry weight and percent dry weight of 2012 and 2013 ‘Ouchita’ blackberries grown under 4 irrigation regimes. For each trial, data are averages from 4 field replicates of marketable quality fruit.
Irrigation Treatment
Weight per berry, g Dry weight, %
KAC 2012
Jimenez
Santa Clara 2012
Baameur
KAC 2013
Jimenez
SLO 2013
Gaskell
KAC 2012
Jimenez
Santa Clara 2012
Baameur
KAC 2013
Jimenez
SLO 2013
Gaskell
50% ET 7.04 4.95 7.12 ND 20.18 22.31 17.11 ND
75% ET 6.96 5.76 7.12 ND 19.52 21.17 17.26 ND
100% ET 8.29 5.39 7.32 ND 19.91 20.00 16.88 ND
125% ET 7.69 6.11 6.89 ND 18.88 19.50 17.71 ND
Average 7.50 5.55 7.11 19.62 20.74 17.24
LSD.05 ns ns ns ns 1.60 ns

Table 2. Total sugar and total acid concentrations of 2012 and 2013 ‘Ouchita’ blackberries grown under 4 irrigation regimes. For each trial, data are averages from 4 field replicates of marketable quality fruit.
Irrigation Treatment
Total Sugars, mg/g FW Total acids, mg/g FW
KAC 2012
Jimenez
Santa Clara 2012
Baameur
KAC 2013
Jimenez
SLO 2013
Gaskell
KAC 2012
Jimenez
Santa Clara 2012
Baameur
KAC 2013
Jimenez
SLO 2013
Gaskell
50% ET 129.9 61.22 82.52 77.82 7.82 10.27 8.70 12.26
75% ET 112.3 54.46 89.26 76.36 7.65 10.69 8.10 11.66
100% ET 108.2 59.15 86.58 77.96 6.84 11.05 8.44 11.70
125% ET 110.6 57.15 92.43 77.14 7.32 11.36 7.55 11.22
Average 115.25 58.00 87.70 77.32 7.41 10.84 8.20 11.71
LSD.05 13.5 ns ns ns 0.71 ns ns ns
Blackberry Irrigation Project
2012 and 2013 Samples
Sugars and Acids
In blackberry, sugars are about 50% glucose, 50% fructose
In blackberry, acids are 40% citric, 30% malic and 30% tartaric
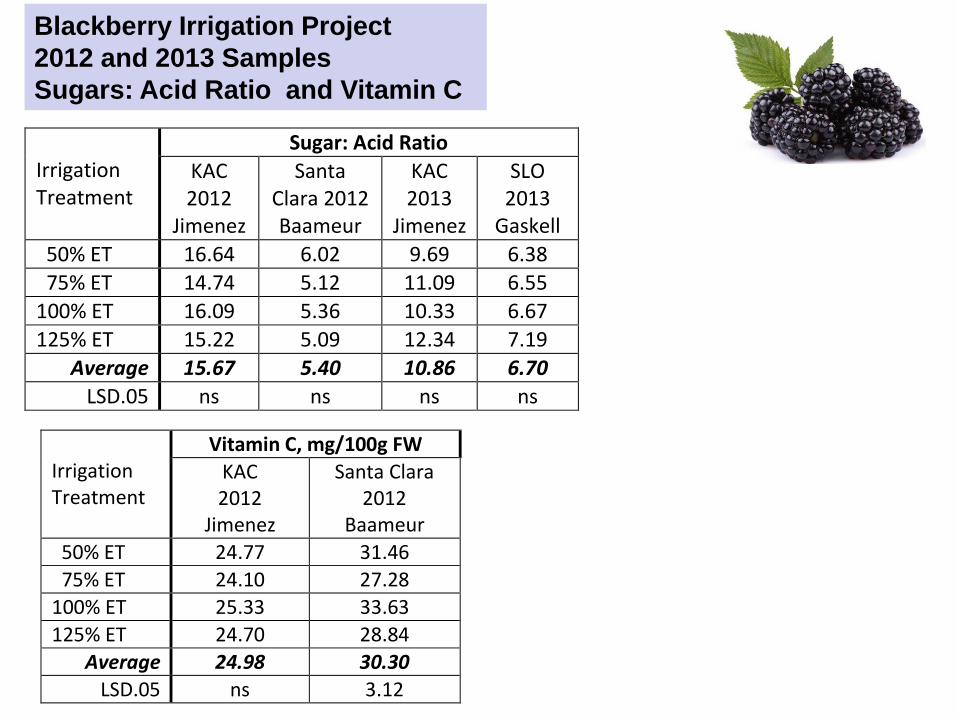
Irrigation Treatment
Sugar: Acid Ratio
KAC 2012
Jimenez
Santa Clara 2012 Baameur
KAC 2013
Jimenez
SLO 2013
Gaskell
50% ET 16.64 6.02 9.69 6.38
75% ET 14.74 5.12 11.09 6.55
100% ET 16.09 5.36 10.33 6.67
125% ET 15.22 5.09 12.34 7.19
Average 15.67 5.40 10.86 6.70
LSD.05 ns ns ns ns
Irrigation Treatment
Vitamin C, mg/100g FW
KAC 2012
Jimenez
Santa Clara 2012
Baameur
50% ET 24.77 31.46
75% ET 24.10 27.28
100% ET 25.33 33.63
125% ET 24.70 28.84
Average 24.98 30.30
LSD.05 ns 3.12
Blackberry Irrigation Project
2012 and 2013 Samples
Sugars: Acid Ratio and Vitamin C

Table 4. Anthocyanin and phenolic concentrations of 2012 and 2013 ‘Ouchita’ blackberries grown under 4 irrigation regimes. For each trial, data are averages from 4 field replicates of marketable quality fruit.
Irrigation Treatment
Anthocyanins, mg/100g FW Phenolics, mg/100g FW
KAC 2012
Jimenez
Santa Clara 2012
Baameur
KAC 2013
Jimenez
SLO 2013
Gaskell
KAC 2012
Jimenez
Santa Clara 2012
Baameur
KAC 2013
Jimenez
SLO 2013
Gaskell
50% ET 173.1 132.9 177.4 ND 576.7 578.0 456.2 ND
75% ET 209.7 133.4 173.7 ND 529.9 557.3 460.9 ND
100% ET 211.2 134.7 184.9 ND 545.2 508.3 472.9 ND
125% ET 237.9 130.1 184.2 ND 498.2 496.5 452.5 ND
Average 208.0 132.8 180.1 537.3 535.0 460.6
LSD.05 23.1 ns ns ns ns ns
Blackberry Irrigation Project
2012 and 2013 Samples
Anthocyanins and Phenolics

Sensory Attributes and Fruit Composition
All fruit components (sugars, acids, volatiles, etc…) combine to generate a unique sensory experience for the consumer
Physical-chemical methods give accurate measurements of fruit composition
It is difficult to relate these measurements to fruit quality without information about sensory perceptions
Mary Lu Arpaia

Berry Irrigation Project Consumer Sensory Evaluation
Consumers evaluated the following sensory parameters: Appearance, Flavor and Texture
Consumers indicated price they would pay for clamshell of their preferred irrigation treatment 6 oz. for blackberries and blueberries 1 lb. for strawberries
We recorded consumer’s age, gender, how
often they consumed the specific berry, and their preference among irrigation treatments

Davis Farmer’s Market 6-29-12

Blackberry from Kearney, CA Davis Farmer’s Market
6-29-12
FLAVOR ranked #1 as most important factor for quality
How much would pay for preferred if others cost $2.00?
Ave. $2.91 Min. $2.25 Max. $5.00
Preferred Irrigation Treatment
Pe
rce
nta
ge o
f P
eo
ple
(%
)
Irrigation Treatments

Postharvest Quality Measurements
Overall Quality: Visual appearance of clamshells rated Scale: 1=Excellent, 2=Good, 3=Fair, 4=Poor/Unmarketable
Shrival/Calyx Browning: Scale: 1=None, 2=Slight, 3=Moderate, 4=Severe
Diseases: Number of fruit with diseases in clamshell
Postharvest Quality Measurements

Black
50% ET and 75% ET consistently had higher
firmness initially and throughout storage
50% ET displayed poorest overall quality and
the most decay after 10-12 days of storage
100% ET and 125% ET displayed best
quality and least decay after 10-12 days of
storage
Blackberry Postharvest Conclusions (1 storage test)

• Berry weight not affected by irrigation regimes
• Sugars and acids were affected by irrigation
treatments only in 1 of 4 blackberry trials
• Variation from location to location much greater
than variation due to irrigation
• 1 consumer sensory test showed no trend in
preference due to irrigation treatment
• Higher irrigation rates resulted in less decay
(1 storage test)
• More information in 2014
Berry Irrigation Project
Conclusions to date--Blackberries

Causes of Quality & Postharvest Losses
Berry Fruits
Blackberry
Blueberry
Cranberry
Currants
Loganberries
Raspberry
Strawberry
Mechanical damage
Maturity, immature, overmature
Poor ripening, conditioning
Softening, texture loss
Changes in composition
Water loss
Microbial growth

1) Harvest at correct maturity
2) Reduce physical handling
3) Protect product from sun
4) Keep packingline or area simple and
clean; ensure good worker hygiene
5) Select, classify, and pack carefully
6) Align cartons, strap pallet
7) Cool as soon as possible
8) Know market and product requirements
9) Coordinate efficient & rapid handling
10)Train and compensate workers adequately
10 Basic Postharvest Principles

Postharvest Handling of Berries Forced-Air Cooling is Standard for Berries
• Cool fruit to 0C as quickly as possible
– Cool within 2 hours of harvest
• When cooled, 90 – 95% RH
– Reduce water loss
– Reduce decay
– Reduce respiration rate and extend
postharvest life
• Maximum postharvest life
– Strawberry – 2 weeks
– Raspberry and blackberry – 1 week
– Blueberry – 4 weeks

From EJ Mitcham, UC Davis
Higher respiration rates are generally correlated with shorter postharvest life
Respiration rates, mg/kg-h

Storage temperature, °F
28 32 36 40 44 48 52 56 60 64 68
Sh
elf-life
, d
ays
0
2
4
6
8
10
12 120
100
80
60
40
20
Raspberries and Storage Temperature
Shelf-life, days
Respiration rate, mg/kg-h
-2 0 2.5 4 6.7 9 11 13.3 15.6 17.8 20°C
Temperature affects shelf-life by controlling metabolism and decay
from data of Perkins-Veazie, Raspberries, USDA Agric Hdbk66
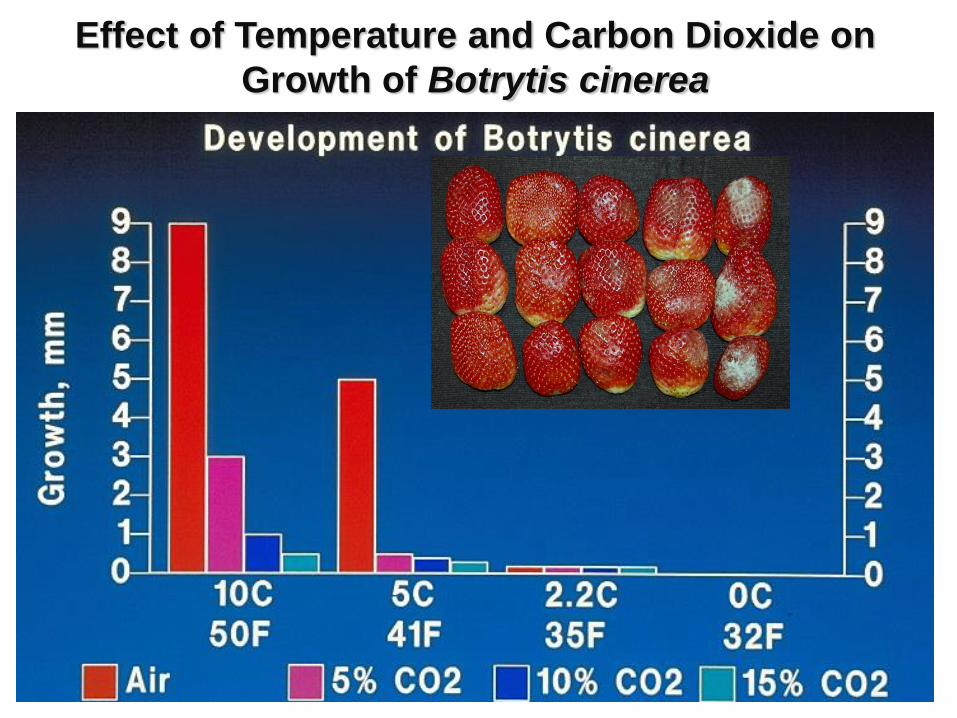
Effect of Temperature and Carbon Dioxide on
Growth of Botrytis cinerea

Berry Quality Resources • UC Postharvest website
http://postharvest.ucdavis.edu/libraries/publications/
Produce facts for bushberries and strawberries
http://postharvest.ucdavis.edu/PFfruits/Bushberries/
http://postharvest.ucdavis.edu/PFfruits/Strawberry/
• USDA Handbook 66, The Commercial Storage of Fruits,
Vegetables, and Florist and Nursery Stocks
http://www.ba.ars.usda.gov/hb66/contents.html
• Berry Fruit. Value-added Products for Health Promotion. Ed. Y.
Zhao. 2007. CRC Press.
• Soft Fruit by L.A. Terry. 2012. In: Crop Postharvest Science and
Technology, Wiley Publisher.
• Bioactive Compounds and Health-Promoting Properties of Berry
Fruits: A Review. 2008. A. Szajdek, E.J. Borowska. Plant Foods
Human Nutrition 63: 147-156.

Produce Facts
• Harvest indices
• Quality indices
• Temperature and RH
• Freezing point/damage
• Respiration rates
• Ethylene production
• Effects of ethylene
• Effects of modified atmospheres
• Physiological disorders
• Postharvest diseases
• Mechanical injury
• Photos
140
Fruits
Vegetables
Flowers
http://postharvest.ucdavis.edu
English, Spanish, French, Arabic Free, content-rich website averages over 3 million views annually,
And encompasses more than 640 pages and 1750 pdf documents.

Thank you!