POSTERS - uni-leipzig.de€¦ · POSTERS 1. Nuclear magnetic relaxation and diffusion of gas in...
116
POSTERS 1
Transcript of POSTERS - uni-leipzig.de€¦ · POSTERS 1. Nuclear magnetic relaxation and diffusion of gas in...

POSTERS
1
Nuclear magnetic relaxation and diffusion of gas in partially
water saturated natural soil
R. P. Choudhurya and S. Stapf
b
aInstitute for Technical and Macromolecular Chemistry, RWTH Aachen, Germany, bDept. of
Technical Physics II, Institute of Physics, TU Ilmenau, Germany
Nuclear magnetic resonance (NMR) of fluids has proven to be a very sensitive tool for the characterization of porous systems. In general, nuclear magnetic relaxation and the restricted diffusion of water molecules obtained from water saturated porous systems can provide a wealth of information including the pore surface-area-to-volume ratio, the average pore size in systems and the visualization of fluid transport under flow. However this approach is usually limited to probing length scales ∼20 µm, because spin relaxation quenches the NMR signal before molecules can diffuse across longer distances. For this reason, liquid phase NMR has been unable to give information about the long-range properties of porous media, e.g. interconnectivity and tortuosity of the pore space1. In contrast, NMR techniques based on an imbibed inert gas has some advantages, e.g., gas diffusion coefficients are typically orders of magnitude larger than those of water, and the weak interaction of inert gas molecules with pore surface leads to long NMR lifetime. In addition, the diffusion coefficients of the gases can be altered by varying pressure, which significantly expands the range of distances that can be probed in comparison to liquid NMR.
NMR spectroscopy of noble gases has been used for years to probe physical properties of porous media. Particularly 129Xe NMR has become popular because of its exceptional sensitivity to local environmental effects. The inherent disadvantage of low spin density of Xe is overcome by high-pressure set-ups and hyperpolarizing techniques . Despite this, it has been observed that F NMR of the multinuclear fluorinated gases possess great potential for transport and material studies since they are relatively inert, of high density, and have short relaxation times that can be used in fast imaging and lead to image qualities not much inferior to those obtained with liquids .
129 2
19
3
Here we have studied the nuclear magnetic relaxation times and the diffusion properties of the fluorinated gases (SF6, CF4 and C4F8) in dry and partially water saturated natural soils to characterise the soil pore space as well as water distribution and transport in soils, which depends on a variety of parameters. The most important ones are 1) the pore structure, i.e., the pore size distribution and pore connectivity, 2) the wetting properties, and 3) the directional water supply by unsaturated water fluxes. The spin-spin relaxation times and the diffusion coefficients of those gases are changed in presence of the soils. This indicates that the dynamics of the gas molecules are affected by the pores of soils. To get more detailed information about the pore space and the long-range connectivity of soil, spin lattice relaxation and time dependent diffusion experiments at different gas pressures have been done and the observed results are compared to known soil properties4.
References:
1. M. D. Hurlimann, K. G. Helmer, L. L. Latour and C. H. Sotak, J. Magn. Reson. A 111 (1994) 169.
2. R. P Wang, M. S. Rosen, D. Candela and R. W. Mair, Magn. Reson. Imaging. 23 (2005) 203 3. D. O. Kuethe, R. Montaño and T. Pietraβ, J. Magn. Reson. 186 (2007) 243. 4. A. Pohlmeier. S. Haber-Pohlmeier, and S. Stapf, Vadouse Zones. J. submitted.
2

Time-dependent diffusion coefficient of fluids in partially filled porous media
Carlos Mattea, and Siegfried Stapf.
Department of Technical Physics II, TU Ilmenau, Germany.
Diffusion of water and organic solvents partially filling porous media is measured as a function of time in the stray magnetic field of a single side NMR_MOUSE device. The stimulated spin echo sequence [1] with constant magnetic field gradient (in the order of 10 T/m) is used. The liquids are confined in porous silica glasses with mean nominal pore sizes of 1 µm and 10 µm, and porosity of 43% and 36%, respectively.
In completely filled pore spaces, the transport properties are predominantly affected by the geometrical restrictions, i.e., the tortuosity. The time-dependent diffusion coefficient D(t) then exhibits a reduction from the molecular diffusion coefficient D0 in bulk when increasing the diffusion time. When the porous media are non-saturated, the effective diffusion coefficient is modified due to the presence of the vapor phase and the reduction in the volume of the liquid fraction. Exchange between liquid and its vapor phase can produce an enhancement in the diffusion process [2]. But in the general case, D(t) has opposite tendencies upon reducing the filling fraction (enhancement or reduction) depending of several parameters like nature of the solvent, pore size or pore structure [3,4]. A general two-phase exchange model recently published (see Ref. [3]) accounts for these features. At the diffusion times used in those studies (200 and 300 milliseconds), fast molecular exchange between the liquid and vapor phase was observed in the case of nanometer length-scale confinement. However, the fast exchange regime is not valid anymore when the pore size is in the order of micrometers. This is evidenced in the attenuation of the stimulated echo versus the square of the wave number which is not exponential. That deviation depends on the mean residence time of molecules in the liquid phase.
In the present contribution the diffusion studies are performed in partially filled porous media for different diffusion times. The length scale of the pore diameter is extended to the order of tenths of micrometers. The molecular exchange model of reference [3] for the vapor and liquid phases is applied. It is found that the average residence time in the liquid phase at low filling factors is in the order of milliseconds for porous samples with ten micrometers pore size. The influence of spin-lattice relaxation, T1, at long diffusion times is also discussed in particular at low filling factors.
References:1. M. Hürlimann, J. Mag. Res. 148 (2001) 367. 2. F. D’Orazio, S. Bhattacharja and W. Halperin, Phys. Rev. Lett. 63 (1989) 43. 3. I. Ardelean, C. Mattea, G. Farrher, S. Wonorahardjo and R. Kimmich, J. Chem. Phys. 119
(2003) 10358, I. Ardelean, G. Farrher, C. Mattea and R. Kimmich, J. Chem. Phys. 120(2004) 9809.
4. G. Farrher, I. Ardelean and R. Kimmich, Mag. Res. Imag. 25 (2007) 453.
3

Poly(dimethyl siloxane) films adsorbed in porous media
S. Ayalur-Karunakarana, S. Stapf
b
aInstitute for Technical and Macromolecular Chemistry, RWTH Aachen, Germany,
bDept. of
Technical Physics II, Institute of Physics, TU Ilmenau, Germany
The dynamics of polymer thin (i.e. nm-scale) films is becoming of growing interest
both from an experimental as well as theoretical point of view; its investigation with NMR
methods is still a rather new field and usually requires the existence of a large surface area as
is given in porous media. Under these circumstances, the actual spatial distribution and
molecular conformation of polymers at very small amounts remains an open question; the
assumption of equally thick films must break down at a particular amount of polymer that
depends on the interaction parameters with the surface, but certainly below the value required
for generating a complete coverage (monolayer). In the present study, this aspect is addressed
by investigating the molecular dynamics of a linear flexible polymer, poly(dimethyl siloxane)
(PDMS), confined at amounts corresponding to a few to less than one monolayer inside
microporous alumina membranes of well-defined pore shapes using NMR techniques.
Employing Fast Field Cycling (FFC) NMR provides information about motion in the kHz to
MHz range of frequencies which can be compared with the established models observed for
bulk1 and completely confined polymer chains
2 while transverse relaxation and Double
Quantum (DQ) NMR have been used to study slow dynamic processes and ordering.
Using FFC, is can be shown that the dynamics gradually slows down in films of all
thicknesses, while there is a qualitative deviation from bulk behavior for the lowest polymer
coverages, equivalent to one monolayer or less. The effect of temperature on relaxation is
likewise less pronounced for decreasing polymer amounts. Transverse relaxation decays of
these systems were found to be multiexponential in all cases, unlike the much simpler
behaviour of the bulk melts; data are discussed in terms of Inverse Laplace Transforms of the
decay curves and were compared to a simplified biexponential fit.
103
104
105
106
107
108
10-2
10-1
100
298 K
PDMS (Mw=30000 g/mol) bulkThin films in 200 nm pores
4.50 nm layer 2.10 nm layer 1.25 nm layer
ν [Hz]
T1
/m
s
1 2 3 4 5
1
10
100
T2
Long
T2
Short
T2,e
ff / m
s
Layer Thickness / nm
PDMS Thin layers
1 2 3 4 5200
300
400
500
600
700
800
900
PDMS Thin layers Residual Dipolar
coupling constants
RD
C / H
z
Layer Thickness / nm
Fig. 1: Relaxation behavior of PDMS (Mw=30000 g/mol) films inside alumina pores of size 200 nm. (Left)
FFC relaxation profile, (center) T2,eff times and (right) RDC constant of films with varying nominal thickness.
By applying DQ NMR, the existence of dynamic heterogeneities in these films is
confirmed, and the values of the Residual Dipolar Coupling (RDC) constants indicate an
increase of order with decreasing nominal film thickness. PDMS of different molecular
weights has been studied in two different geometries and was compared to other types of
polymers, allowing to draw conclusions leading to a tentative pictorial model of the actual
spatial distribution of polymer molecules on internal surfaces of porous media.
References:
1. P.J. Rouse, J. Chem. Phys. 21 (1972) 1272.
2. P.G. de Gennes, J. Chem. Phys. 55, (1971) 572.
4

Fast Field Cycling Relaxometry: From Saturated to Unsaturated
Natural Soils
S. Haber-Pohlmeier
a, S. Stapf
b
aDepartment of Macromolecular Chemistry, RWTH-Aachen University, Germany,
bDepartment of Technical Physics II, TU Ilmenau, Germany
Soils as natural porous media exhibit the important ability of water retention and
transport. Both properties are mainly controlled by the pore size distribution, which is
furthermore related to NMR relaxation times of water molecules. In this study the
longitudinal relaxation time T1 is determined by fast field
cycling relaxometry (FFC) at low fields corresponding to
Larmor frequencies between 5 kHz and 20 MHz.
In this work1 we investigated three natural soils (Sand FH31,
Kaldenkirchen and Merzenhausen) which cover a broad range
with respect to their texture, i.e. from fine sand to silt loam. In
addition we decreased the water contents from saturation of
100% down to 6% corresponding to naturally occurring
conditions.
The results of T1- relaxation time distributions are obtained
by the analysis of the T1 relaxation curves by means of the
inverse Laplace transformation2,3
. For example Kaldenkirchen
soil shows relatively broad bimodal distribution functions D(T1)
in contrast to sand FH31 with an narrower unimodal behavior
(Fig.1,see lower case). Using the Brownstein-Tarr model4 for
NMR relaxation in porous media we get first information about
the pore size distribution which reflects the T1 relaxation
behavior scaled by the surface relaxivity. In fine sand nearly all
water is present in macropores with characteristic T1 of about
1000 ms. The opposite is found for Merzenhausen silt-loam, i.e. T1 is about 2 ms
corresponding to the major water fraction present in micropores. Kaldenkirchen with more
than 10 % of silt and clay represents an intermediate case.
With decreasing water content we observed a considerable decrease of T1 relaxation by
factors of five to ten (e.g. fine sand in Fig. 1).
Independent of the exact texture of the soils a
general trend is conceivable, where first macro-
pores desiccate leading to thin water films and
residual water at grain contact points (Fig. 2).
References: 1. A.Pohlmeier, S. Haber-Pohlmeier and S. Stapf, Vadose Zone Journal (2008), submitted.
2. S.W. Provencher, Comp. Phys. Comm. 27 (1982) 213.
3. Y.-Q. Song, L. Venkataramanan, M.D. Hürlimann, M.Flaum. P.Frulla and C. Straley,
J. Magn. Res. 154 (2002) 261.
4. K.R. Brownstein and C.E. Tarr, J. Magn. Res. 26 (1977) 17.
10 100 1000
0
1
2
3
4
5
rel. water content
100 %
50 %
23 %
12 %
6 %
D(T
1),
a.u
. sh
ifte
d
T1 (ms)
Fig. 1: T1 distribution func-
tions of fine sand at a Larmor
frequency of 20 MHz.
Fig. 2: Model for desiccation of fine sand.
5

Low Field NMR of Water in Soils. A Case Study.
Oscar Elías Sucre1, Federico Casanova
1, Andreas Pohlmeier
2, and Bernhard Blümich
1
1ITMC, RWTH Aachen University, Aachen, Germany
2Forschungszentrum Jülich, Jülich, Germany
The evolution of water in soils is a physical phenomenum of importance in soil science and
climatology. While most investigations of soil moisture are performed inside large
superconducting magnets in the laboratory, this eventually needs to be studied by mobile
NMR equipment in the field. As a part of a DFG-funded interdisciplinary project (TR32), this
work establishes preliminary results from the use of mobile NMR to measure moisture in
soils. To demonstrate the ability of the NMR technique to follow the drying process of water
in soils, daily moisture measurements were performed with a mobile NMR endoscope on
three different types of soil (silt, sand, and a natural soil sample). The soils were packed in
columns approximately 1 meter high. The NMR measurements were cross-validated by
repetitive measurements of the mass drift due to the drying process. The NMR-endoscope
exhibits a cylindrical geometry incorporating the principle of the u-shaped NMR-MOUSE. It
could be raised and lowered inside a plastic tube in the soil column similar to a wire-line
logging tool. For the purpose of modelling, a simulation of the water evolution (described by
the Darcy Equation) was executed with the Hydrus1D Program for comparison with the
experimental results. The optimization of the endoscope, the measurements, and the
simulations are discussed as well as, the statistical uncertainty and the noise shielding.
6

Monitoring Water Fluxes in Porous Media by Magnetic Reso-
nance Imaging using D2O as a tracer
A. Pohlmeier, D. van Dusschoten, L. Weihermüller, H. Vereecken, and U. Schurr,
ICG, Forschungszentrum Jülich, 52425 Jülich, Germany
Soil functions like water and nutrient supply for food production are strongly con-trolled by water fluxes in these unsaturated natural porous media. As well known, MRI is a very powerful method for non invasive monitoring of such flow processes. But for that pur-pose the usage of tracer substances is essential since flow velocities are relatively slow (i.e << mm/s). In the past most prominent tracers were paramagnetic ions (1,2). However, their major drawback is possible sorption at the solid-liquid interface which may cause considera-bly slower, apparent transport velocities than the liquid flow that is of interest. From this per-spective D2O seems to be an ideal tracer due to its high chemical similarity to H2O. In this study (3) we first investigated the behaviour of D2O as tracer in an unsaturated, heterogeneous model soil composed of fine sand and a built-in cylindrical obstacle in order to force the flux around it. Water was purged in steady state through the column at a constant water potential of 39 cm (corresponding to a negative pressure of 3.8 kPa) applied at the lower boundary. Tracer pulses of 55% (w/w) D2O and for comparison of 0.01 M NiCl2 were repeatedly applied with infiltration water. The motion of the tracer plumes were monitored by MRI using a fast spin echo sequence over a period of 20 minutes with mean pore water ve-locities between 0.21 and 0.82 cm min-1. The most important result is that the motion of the D2O-pulse is not retarded and moves with the water flux combined with smearing by disper-sion. Furthermore, the motion of the Ni2+ tracer as reference under known, non-adsorbing conditions (pH = 5) corresponds to that of D2O. In order to validate the experimental results we compared the observed motion with an inde-pendent simulation based on the Richards and van-Genuchten equations for water flux in unsaturated porous media and the convection-dispersion equa-tion for tracer transport as implemented in the model HYDRUS2D (4). Fig. 1 compares the posi-tion of the tracer cloud 7 minutes after injection with the corresponding simulated scenario. The agreement proves that D2O really behaves as con-servative tracer and thus opens up a new field of applications.
References:
1. K.-H. Herrmann; A. Pohlmeier, S. Wiese, N.J. Shah, O. Nitzsche, and H. Vereecken, J. Env. Qual. 31, 506-514 (2002)
2 H. van As and D. van Dusschoten, Geoderma 80: 389-403 3. A. Pohlmeier, D. van Dusschoten, L. Weihermüller, H. Vereecken, and U. Schurr, Magn.
Res. Imag. (2008), submitted. 4. J. Šimunek J, M. Sejna, and M.T. van Genuchten MT. The HYDRUS-2D software pack-
age, Version 2.0, IGWMC - 1999
Fig. 1. Left: D2O tracer cloud 7 minutes after injection, right: simulated tracer cloud for the same time point
7

Molecular motion and glass transition for ethylene glycol
adsorbed in zeolites
Oezlen F. Erdema,b
, Pavel Sedykha, Dieter Michel
a,
aFakultät für Physik und Geowissenschaften, Universität Leipzig, Linnéstrasse 5,
04103 Leipzig, Germany, [email protected], bMax-Planck-Institut für Bioanorganische Chemie, Stiftstraße 34-36, 45470 Mülheim an der
Ruhr, Germany
Structure and mobility of molecules adsorbed in restricted geometry like zeolites has
been widely investigated by means of NMR spectroscopy [1-3] by using rare nuclei (like e.g. 13
C and 15
N), where a sufficient spectral resolution could be achieved. In case of proton NMR
spectroscopy, however, the applicability of NMR spectroscopy to molecules adsorbed on
surfaces is often limited due to the poor resolution. A notable enhancement in resolution of
the spectra may be achieved when the susceptibility broadening is averaged out by the
application of MAS techniques. In all these studies the definite preparation of the MAS
samples in vacuo plays a decisive role. It will be shown how these special measurements
could successfully be realized.
Furthermore, we will discuss how the information on thermal mobility derived from
the side-band analysis in 1H MAS NMR experiments can be combined with the study of
proton spin-lattice relaxation over a wider temperature range. The results obtained will be
also compared with of broadband dielectric measurements. The results will be compared with
extensive dielectric studies by Kremer et al. [4-5] on comparable systems. The main question
is whether the adsorbed species show a so called single-molecule behavior characterized by
an Arrhenius type temperature dependence of the respective dielectric relaxation times. In
contrast, a Vogel-Fulcher-Tammann (VFT) type temperature dependence of the (mean)
dielectric relaxation rate points to collective motions and is typical for the appearance of a
glass-transition. We will discuss how this transition depends on the filling factor of the
zeolites, on the geometry of the internal voids in our porous materials and the competition
between molecule-to-molecule and molecule-to-surface-interactions. The importance of the
choice of the matrix system will be shown for the case of the NaX zeolites with well-defined
dimensions of the supercages. To get further insights in the complex dynamics of confined
molecules, 2H NMR line shape and spin-lattice relaxation measurements over a wide range of
temperatures were also included.
References:
1. G. Engelhardt, D. Michel, High-Resolution Solid-States NMR of Silicates and Zeolites,
John Wiley & Sons: Chichester, 1987.
2. U. Schwerk, D. Michel, M. Pruski, J. Magn. Reson. 119 (1996) 157.
3. J. Roland, D. Michel, Magn. Reson. Chem. 38 (2000) 587.
4. F. Kremer, A. Huwe, M. Arndt, P. Behrens, W. Schwieger, J. Phys. Cond. Mat. 11 (1999)
A175.
5. A. Huwe, F. Kremer, J. Kärger, P. Behrens, W. Schwieger, G. Ihlein, Ö. Weiss, F.
Schueth, J. Mol. Liquids 86 (2000) 173.
8

Studies of barium titanate embedded into mesoporous sieves and
isolated barium titanate fine particles
P. Sedykha, J. Haase
a, D. Michel
a, E. V. Charnaya
b
aUniversity of Leipzig, Faculty of Physics and Geosciences, Linnéstrasse 5, 04103 Leipzig,
Germany bSt. Petersburg State University, Faculty of Physics, Petrodvorets, St. Petersburg 198504,
Russia
Phase transition temperatures, electrical polarization, coercive field, and other
properties potentially depend on the particle size. In order to study size effects in barium
titanate (BaTiO3) it was embedded into MCM-41 mesoporous materials and the behaviour of
the samples was studied in comparison to the bulk barium titanate and very fine BaTiO3
powders. The MCM materials used possess effective diameters of channels of about 3.7 nm.
The filling of the small pores was controlled by nitrogen adsorption isotherm measurements
on empty mesoporous sieves and those filled with BaTiO3. The ultrafine BaTiO3 powders
were prepared from a monomeric metallo-organic precursor through combined-solid state
polymerization and pyrolysis (CPP method) [1]. The particle diameter varied in the range
between 15 and 155 nm and the powders were carefully characterized by FT-Raman, XRD,
and other methods.
Dielectric measurements were carried out for the MCM-41 molecular sieves filled
with barium titanate. In contrast to the large dielectric constants (d. c.) measured for the bulk
BaTiO3 in the tetragonal phase, the d. c. values of the BaTiO3/MCM-41 materials practically
did not differ from those measured for the empty MCM-41 rods. The behavior shows that the
materials do not have the ferroelectric properties. To prove this conclusion further
measurements on SBA 15 samples are in progress.
The conclusion derived from the MCM-41 samples is consistent with the critical
diameters estimated for very fine BaTiO3 powders. The influence of the grain size on
properties of the ultrafine barium titanate powders was also investigated by 137
Ba NMR.
NMR spectra were measured for central transitions. The line shape was calculated assuming a
dominant influence of the quadrupole coupling and the validity of the second order
perturbation theory. These suggestions were verified by measuring the spectra at different
magnetic fields (9 and 17.6 T). Temperature dependencies were measured within a large
temperature interval in the ferroelectric tetragonal phase including also the 1st order phase
transition from the tetragonal to the cubic phase. The complex NMR lines were deconvoluted
into two lines [2] which revealed two different structures for the fine particles. The line shape
parameters estimated for both of the contributions will be measured over a broad range of
temperatures including the phase transition from the cubic to the tetragonal phase for the bulk
material. This analysis allowed us to derive detailed conclusions about confinement effects.
The results will be also analyzed in comparison to the results obtained in previous ESR
measurements on nanoparticles [3].
References:
1. H.-J. Gläsel, E. Hartmann, D. Hirsch, R. Böttcher, C. Klimm, D. Michel, H.-C.
Semmelhack, J. Hormes, H. Rumpf, J.Mater.Sci. 34 (1999) 2319.
2. P. Sedykh, J. Haase, D. Michel, E. V. Charnaya, Ferroelectrics in press, May 26, 2008.
3. R. Boettcher, C. Klimm, D. Michel, H.-C. Semmelhack, G. Völkel, H.-J. Gläsel, E.
Hartmann, Phys. Rev. B. 62 (2000) 2085.
9

Mixture diffusion in porous media studied by MAS PFG NMR
M. Fernández , J. Kärger, D. Freude
Abteilung Grenzflächenphysik, Universität Leipzig, Germany
One novel combination of MAS NMR and PFG NMR techniques was applied to
study the diffusion properties of molecular mixtures absorbed in nanoporous materials. MAS
PFG NMR provides high resolved spectra and allows the performance of selective diffusion
measurements in mixtures [1].
Diffusivity in binary mixtures of n-butane and isobutane adsorbed in zeolite MFI
silicalite-1 were studied in dependence of temperature and partial concentration [2].
The diffusivity of both n-butane and isobutane absorbed in MFI differ in more than one order
of magnitude. The diffusion coefficient of n-butane in mixture presents a strong dependence
with the partial concentration, see Fig. 1. It was found that n-butane diffusivity decreases
with increasing amount of isobutane, and presents one strong drop or discontinuity at about
0.5 n-butane molecules per channel intersection. Further on, with decreasing content of n-
butane (increasing content of isobutane) the diffusivity of n-butane drops exponentially, with
the value extrapolated to zero loading of n-butane coinciding with the pure isobutane
diffusivity. Molecular simulations are in good agreement with these experimental results.
CBMC simulations show that n-butane can locate along either straight or zig-zag channels of
MFI and isobutane locates preferentially at the intersections. Molecular simulation has shown
that at 0.5 isobutane molecule per intersection, the molecular traffic of n-butane is brought to
a virtual stand-still because of blocking of the intersection sites by isobutane molecules.
0.0 0.2 0.4 0.6 0.8 1.0 10
−12
10−11
10−10
10−9
10−8
r / n-butane molecules per intersction
T = 363 K
n-butane
isobutane
D /
m2 s
−1
Diffusion in liquid mixtures of acetone with different alkanes in porous glasses (4 nm
and 10 nm pore diameter) was also studied [3]. In the narrow pores one dependence of
acetone diffusivity with the odd or even number of carbons in the alkane chain was found [4].
This oscillation effect in the acetone diffusion coefficient by increasing n-alkane length
depends on the intermolecular interaction between the different alkanes and suggests the
formation of complexes under strong confinement.
References:
1. A. Pampel, M. Fernandez, D. Freude, J. Kärger, Chem. Phys. Lett. 407 (2005) 53.
2. M. Fernandez, J. Kärger, D. Freude, A. Pampel, J.M. van Baten, R. Krishna, Microporous
Mesoporous Mater. 105 (2007) 124.
3. M. Fernandez, A. Pampel, R. Takahashi, S. Sato, D. Freude, J. Kärger, Phys. Chem. Chem. Phys.
submitted.
4. R. Takahashi, S. Sato, T. Sodesawa, T. Ikeda, Phys. Chem. Chem. Phys. 5 (2003) 2476.
Fig. 1 Experimental data on self-diffusion
coefficients of nC4 in nC4/iC4 mixtures in
MFI at 363 K as a function of the loading of
nC4 in the mixture. Also shown is the self-
diffusivity of pure iC4.
10

MAS PFG NMR diffusion studies of liquid crystals and liquid
mixtures confined in porous glasses
E. E. Romanova, F. Grinberg, J. Kärger, D. Freude
Abteilung Grenzflächenphysik, Universität Leipzig, Germany
The pulsed-field gradient nuclear magnetic resonance (PFG NMR) technique is a direct and
non-invasive method for measuring self-diffusion coefficients. It has proven to be an indispensable
tool of studying isotropic liquids [1] and molecules in confined geometries [2]. However, if dipole-
dipole interactions are not completely averaged out by molecular motions, the NMR signals are
very broad, and the free induction signals decays is very fast [3]. This limits the time available for
the application of gradient pulses [4] and makes impossible measuring diffusion in liquid crystals
without special line-narrowing techniques [5]. In the case of liquid mixtures confined in nanoporous
materials [6] dipolar broadening deteriorates the resolution in the chemical shift scale necessary for
selective diffusion measurements of mixture components. This kind of problems can be overcome
by combining magic-angle spinning (MAS) with pulsed field gradients. This relatively new
technique is referred to as MAS PFG NMR, see e. g. [7]. MAS implies the orientation of the
spinning axes with respect to the external magnetic field at the angle of θm ≈ 54.7°. In comparison
with other techniques [5] this type of measurements has considerable advantages. First, the
increased resolution in the ppm scale permits one to observe separately each individual group with
identical electronic surroundings. Second, the longer transverse relaxation time upon MAS allows
for sufficient time for the application of pulsed magnetic field gradients.
Dynamic properties of the confined nematic liquid crystal 5CB has been studied by several
techniques including the Dipolar Correlation Effect [8] and Field Cycling Relaxometry [9, 10].
However, no NMR diffusion measurements were performed so far. In this work we apply for the
first time the MAS PFG NMR technique to liquid crystals. The nematic liquid crystal 5CB confined
in Bioran glass was studied. It was shown, that the diffusion coefficient of 5CB confined in Bioran
glasses exhibit an Arrhenius-like temperature dependence with an apparent activation energy Ea
iso =
26.7±2.7 kJ mol−1
close to that in the isotropic phase. A minor discontinuity at the phase transition
was observed in agreement with the results of other techniques [8-10]. The measured diffusivities
however do not differ significantly from the values in bulk 5CB. It is shown that diffusion studies
of confined liquid crystals permit one to get a deeper insight into aspects of anisotropic molecular
interactions and the effects of confinements.
Measurements of methanol / cyclohexane-mixtures in porous glass with 7.5 nm diameter
(CPG7.5) yield the self-diffusion coefficients for both compounds. A comparison with the values
obtained for single-component adsorption shows that the diffusivity of methanol is by factor of 2
smaller in the confined binary mixture than in the system methanol + CPG7.5. At the same time
cyclohexane has the same self-diffusion coefficient in the confined mixture and in the single
component system cyclohexane + CPG7.5.
References:
1. Price, W.S., Concepts in Magnetic Resonance, 1997. 9(5): p. 299-336.
2. Kärger, J. and D.M. Ruthven, 1992, New York: Wiley & Sons.
3. Romanova, E.E., et al., Solid State Nucl. Magn. Reson., 2008. in print.
4. Kruger, G.J., Physics Reports-Review Section of Physics Letters, 1982. 82(4): p. 229-269.
5. Dvinskikh, S.V. and I. Furo,. Journal of Chemical Physics, 2001. 115(4): p. 1946-1950.
6. Fernandez, M., et al., Phys. Chem. Chem. Phys., 2008. submitted.
7. Pampel, A., et al., Microporous and Mesoporous Materials, 2006. 90(1-3): p. 271-277.
8. Grinberg, F., et al., Journal of Chemical Physics, 1996. 105(21): p. 9657-9665.
9. Grinberg, F.,. Magnetic Resonance Imaging, 2007. 25(4): p. 485-488.
10. Grinberg, F., in Diffusion Fundamentals ΙΙ,. 2007.
11

Diffusion in mesopores during melting and freezing processes
R. Valiullin, M. Dvoyashkin, A. Khokhlov, J. Kärger
Department of Interface Physics, University of Leipzig, Leipzig, Germany
Phase transitions of fluids confined to mesopores often exhibit pore size-dependent
shifts in the transitions. Moreover, transition pairs, like freezing and melting considered in
this work, in most cases do not coincide with each other giving thus rise to a hysteresis
phenomenon. The microscopic mechanisms leading to such behavior are still under
discussion, and additional information about the growth process of a new phase along both
transitions may appreciably contribute to a further understanding of this phenomenon.
Molecular diffusivity is a sensitive probe of the geometrical characteristics of the space in
which it takes place. Melting and freezing processes, occurring in pores, modify the pore-
space characteristics, in turn modifying the diffusion behavior of the liquid molecules. Hence,
it may be used to monitor the character of the structural changes during these transitions.
In this work, we present the study of freezing and melting behavior of nitrobenzene in
mesoporous silicon (PS) with one-dimensional channels with an artificially superimposed
variation of the pore size along the pore axis. The combined experiments using NMR
cryoporometry [1] and pulsed field gradient NMR allowed us to correlate the amount of
frozen nitrobenzene in the pores and the molecular diffusivities. In mesoporous silicon
prepared to provide structural correlations [2], the diffusivities measured as a function of
temperature clearly shown the effect of the correlated distribution of pores with different pore
sizes. These findings have been further used to understand and analyze the data for material
with a random distribution of the pores. Most remarkably, there is a well-pronounced
difference in the diffusivities measured along the heating and cooling branches, revealing
different distributions of the frozen domains during melting and freezing. It is also discussed
that the used experimental procedure may reveal very important information on the
interconnectivity of the pore space, alternatively to the approach suggested in [3].
References:
1. J. H. Strange, M. Rahman, E. G. Smith, Phys. Rev. Lett. 71 (1993) 3589.
2. A. Khokhlov, R. Valiullin, J. Kärger, F. Steinbach, A. Feldhoff, New J. Phys. 9 (2007)
272.
3. K. E. Washburn, P. T. Callaghan, Phys. Rev. Lett. 97 (2006) 175502.
12

Probing the meso- and microstructural heterogeneity of low dense
networks with dendrimer probes and NMR/MRI diffusometry
Gert-Jan W. Goudappel
a, Magnus Nydén
b, John P.M. van Duynhoven
a
aUnilever Food and Health Research Centre, Unilever R&D, PO Box 114, 3130 AC
Vlaardingen, The Netherlands, b
Applied Surface Chemistry, Chalmers University of
Technology, SE-412 96 Göteborg, Sweden
The functionality of most food materials is determined by their meso- and microstructure.
Structural characterisation at these length scales is challenging and requires the deployment of
complementary microscopic and spectroscopic techniques. For porous materials with dense
networks, probing the diffusion behaviour of water by NMR and MRI is an established approach
for obtaining descriptive meso- and microstructural parameters.
For low dense networks, however, water is not a suitable probe, hence recently the use of
macromolecular probes has been proposed. So far this approach was only demonstrated for
homogeneous low dense networks. Thus we embarked on a feasibility study to explore whether
this approach could also be applied to systems which display meso- and microstructural
heterogeneity. As a model system we used alginate networks, which can be prepared as
homogeneous gels, as well as beads which display a radial crosslink density gradient. First, a
homogeneous alginate gel was prepared and characterised by probing the diffusion behaviour of
dendrimer probes by NMR. By monitoring the diffusion behaviour of the dendrimer probe with a
range of sizes, the mesostructural heterogeneity of alginate networks could be established.
Subsequently, the diffusion behaviour of dendrimers in heterogeneous alginate beads was
probed.
13

Quantitative imaging of moisture ingress in cereal crackers: an
SPI study
C. Windta, M. Witek
a, F. Vergeldt
a, E. Gerkema
a, J. van Duynhoven
b, H. Van As
a
aLaboratory of Biophysics, Wageningen University, Wageningen, the Netherlands.;
b
Unilever Food and Health Research Institute, Unilever R&D, Vlaardingen, the Netherlands.
Shelf life in multi-component foods with texture contrast (e.g., crispy crackers with
moist filling) depends largely on texture stability. Because of differences in water activity,
Aw, migration of moisture from wet to dry components will occur. This is undesirable. A
number of processes can play a role in the transmission of moisture through cereal
materials: gas phase wetting (moist air); capillary transport of liquid water over the surface;
and diffusion of liquid water through the cereal matrix. It is not well understood which of
these mechanisms dominate under what conditions.
To image water ingress in materials with low water contents, conventional imaging
methods do not suffice: the T2’s are too short. In crackers the transition from crispy to soggy
occurs at an Aw of ~0.5. 1H relaxometry revealed that in this transition the largest changes
are visible at a T2 of 125 µs. The only readily available methods, suitable to image very
short T2 components, are based on Single Point Imaging (1). SPI was sensitive enough to
observe changes of water content: Crackers at Aw’s from 0.15 to 1 were successfully
imaged at a TD of 125 µs; contrast was sufficient to follow the transition from crisp to
soggy. SPI thus provides a tool to observe changes in texture stability.
We carried out moisture ingress experiments on cube-shaped pieces of dry crackers
which were exposed to humid air (Aw = 0.85). Quantitative moisture content profiles could
be obtained with adequate time-resolution, and this allowed monitoring of the transition
from the crispy to the soggy state in a real time manner. The quantitative profiles, which
were obtained for crackers with different porosity and geometries, matched with our
theoretical expectations.
References:
1. B.J. Balcom et al, J. Magn. Reson. A 123 (1996) 131
14

Anomalous diffusion expressed through fractional order
differential operators in the Bloch-Torrey equation
B.S. Akpaa, O. Abdullah
b, R.L. Magin
b
aDepartment of Chemical Engineering, University of Illinois at Chicago,
bDepartment of
Bioengineering, University of Illinois at Chicago
We report the use of PGSE NMR to characterize heterogeneity in the structure of
Sephadex gels and an oil-in-water emulsion. We demonstrate the application of fractional
order models to describe the restricted diffusion characteristic of such systems. Several
recent studies1,2 have investigated the so-called anomalous diffusion stretched exponential
model – exp[-(bD)α], where α is a measure of structural complexity that can be derived from
fractal models. In this paper we propose an alternative derivation for the stretched
exponential model using fractional order space derivatives. We consider the case where the
spatial Laplacian in the Bloch–Torrey equation is generalized to incorporate a fractional order
Brownian model of diffusivity3. This treatment reverts to the classical result for integer order
operations. The fractional order dynamics derived were observed to fit the signal attenuation
in diffusion-weighted images obtained from Sephadex gels. We have further investigated the
extent to which the fractional order model can describe restricted diffusion in an emulsion.
0 1 2 3 4
x 1011
10-2
10-1
100
b (s/m2)
S/S
0
data
Stejskal Tanner
biexponential
Karger
Magin
stretched
b (s/m2)b (s/mm2)
S/S0
Fig. 1: (A) Normalized signal intensity plotted versus b (b = (γδg)
2∆ ) for selected regions of interest in samples
of distilled water and Sephadex G-25, G-50, and G-100. Experimental data were fit to the fractional order
model. The inset shows a T2-weighted spin echo image of the sample. (B) Normalized signal intensity plotted
versus b for an oil-in-water emulsion. Five different models were used to fit the data. For this sample and
observation time (∆=15 s), the fractional order model yields the best fit.
References:
(1) K.M. Bennett et al., Magn. Res. Med. 50 (2003) 727.
(2) K.M. Bennett et al., Magn. Res. Med. 56 (2006) 235.
(3) R.L. Magin et al., J. Magn. Reson. 190 (2008) 255.
(A) (B)
15

Pore-Water Interactions in Hydrated Cement Pastes by NMR
V. Rodina, A. Valori
a, P.J. McDonald
a,
aDepartment of Physics, University of Surrey, GU2 7XH, UK.
Although cement based materials are ages old, and although they are now ubiquitous across
the world, a detailed understanding of their CSH microstructure and of pore water interactions
within this structure still remains elusive. To obtain this understanding is important because,
without it, predictive refinement and improvement of cement properties is not possible.
In recent years, NMR relaxometry has begun to challenge the long established picture of a
network of interconnected gel (∼nm) and capillary (µm) pores. NMR 2D relaxometry has shown
exchange of water between two reservoirs of different gel pores, has allowed measurement of the
water exchange rate between them (∼ms-1
) and has revealed a surprising lack of capillary pore
water reservoir1. Increasingly the NMR picture is supported by numerical modelling and
statistical analysis of high resolution micrographs2.
Notwithstanding, however, the NMR results have raised a series of further questions
concerning interpretation and detailed analysis of “NMR mass balance”:
• Current opinion suggests that the two dominant diagonal peaks seen in 2D exchange
relaxometry are associated with different size gel pores between CSH bricks of different packing
density in different environments. However an alternative explanation is that rather than different
pore sizes, the reservoirs can be associated with pores of similar size in regions with different
Fe3+
impurity densities leading to different surface relaxivities. Can this alternative picture be
proved or discounted?
• If the reservoirs are associated with gel porosity, then can experiments be performed to
quantify the intra-CSH layer water and the bound water fraction so as to complete a detailed
“NMR mass balance” and confirm the “two types of gel pore hypothesis”?
• Can the slow exchange rate (∼ms-1
) be rationally explained if it is recognized that this
corresponds to a distance of the order of microns across a nano-scale structure?
• Why can exchange not be observed in old ( >months) samples?
It is the purpose of this paper to address the first two of these questions and speculate on the
others. We describe a series of relaxation studies of “tailored” grey and D2O exchanged cements
to address the first question and a variable temperature double quantum filter NMR study of
hydrated pastes to address the second.
References:
1. L. Monteilhet, J.-P. Korb et al., Phys. Rev. E 74 (2006) 061404-9.
2. NANOCEM Workshop, CEA, Paris, 11th
March 2008. (www.nanocem.org)
16

Why you can’t use water to make Cryoporometric measurements of the pore size distributions in meteorites
- or in high iron content clays, rocks or concrete.
J. Beau W. Webbera,c,d, Philip Blandb, John H. Strangec, Ross Andersona, Bahman Tohidia
aInstitute of Petroleum Engineering, Heriot-Watt University, Edinburgh, EH14 4AS, UK; bImperial College London, South Kensington Campus, London SW7 2AZ, UK;
cSchool of Physical Sciences, University of Kent, Canterbury, Kent, CT2 7NH, UK; dLab-Tools Ltd., G19 Canterbury Enterprise Hub, University of Kent, CT2 7NJ, UK.
Many porous materials have high susceptibility magnetic gradients in the pores, due to the presence of iron or other magnetic materials. Thus if probe liquids are placed in the pores they exhibit fast decaying signals with a short T2
*. Usually the actual T2 of the liquids is also reduced, due the presence of paramagnetic ions in the pore walls. The usual solution in NMR is to measure an echo (or echo train) at short times. However recent work (Ref. 1.) has shown that water/ice systems near a pore wall form rotator phase plastic ice, with T2 relaxation times in the region of 100 to 200 ms. Thus if a NMR Cryoporometric measurement is attempted with a measurement time significantly less than 1 or 2 milli-seconds, the result is make a measurement based on the phase properties of the brittle to plastic ice phase transition, not that of the brittle ice to water phase transition. This gives rise to artefacts of small pore sizes that may not actually be present. This work successfully uses a-polar liquids instead.
0.01
0.1
1
Por
osity
µl
.Å-1
.g-1
Pore Diameter100Å 1000Å 1µm
Meteorites:AllendeACFER094ALH77307
Fig. 1: NMR Spin-Echo from an a-polar liquid in a Meteorite sample ALH77307. Due to susceptibility
gradients, the echo has a decay time HWHM of 2.5 µs.
Fig. 2: Pore size distributions for 3 Meteorite samples, as measured by NMR Cryoporometry,
using an a-polar liquid.
References:
1. Plastic ice in confined geometry: The evidence from neutron diffraction and NMR relaxation. J. Beau W. Webber, John C Dore, John H. Strange, Ross Anderson, Bahman Tohidi. J. Phys.: Condens. Matter 19, 415117, (12pp), 2007, Special Issue: Proceedings of The International Workshop On Current Challenges in Liquid and Glass Science .
2001000
0.3
0.2
0.1
0
Time µs
Sig
nal A
mpl
itude
V
High metal content in meteoritesgives rise to high suseptibilitymagnetic gradients, and henceshort T2* times.
This sample exhibits an echo witha HWHM decay time of 2.5 µs,with B 0 = 0.5 T, yet good NMRcryoporometry results are obtainableusing an a-polar liquid, but not water.
17

1H and
23Na Imaging of Sodium Sulfate Crystallization in a Drying
Porous Core
F. Maricaa, B. MacMillan
a, A. Hamilton
b, C. Hall
b and B. J. Balcom
a
aMRI Centre, Dept. of Physics, University of New Brunswick, Fredericton, Canada
bCentre for Materials Science and Engineering, The University of Edinburgh, Scotland, UK
Salt crystallization in the pore space of building materials and public works of art, such as
statues and monuments, is a common precursor to cracking and subsequent decay. We have chosen sodium sulfate as our model salt to study this phenomenon because of debate in the literature about the salt form [1] which precipitates, and the practical importance of this salt in the decay of porous materials.
Sodium sulfate is an attractive salt for MRI studies because of the possibility of undertaking both 23Na and 1H studies to identify and discriminate the various forms of crystalline sodium sulfate, from solution. In the case of 1H, we rely on the large volume fraction of water incorporated into the hydrated salts at room temperature solubilities, yielding solid like 1H signals. The three crystalline forms of sodium sulfate are Na2SO4.10H2O (mirabilite), anhydrous Na2SO4 (thenardite), and Na2SO4.7H2O (heptahydrate). The hydrated salts yield transverse 23Na lifetimes, which are less than 75 μsec at 7 Tesla, short lived, but still possible to visualize in a SPRITE experiment.
The hydrated salts yield 1H transverse lifetimes, which are similarly short lived at 2.4 Tesla, but with a Sinc-Gaussian lineshape for the mirabilite. Quantification of the solution and solid component signals relies on fitting the solid and liquid decay terms, spatially resolved, for both the 23Na and 1H experiments with a variable encoding time in a centric scan SPRITE profile experiment. The minimum encoding time was 11 μsec.
One-dimensional experiments on a partially sealed core of calcium silicate, saturated with a solution of sodium sulfate, were undertaken with controlled drying in a temperature and humidity controlled drying chamber. The 1H and 23Na experiments show increased crystal deposition near the drying face. The imaging results are temperature dependent, since changes in solubility with temperature are readily revealed in the local solid/liquid ratio. References: 1. A. Hamilton and C. Hall, Sodium sulfate heptahydrate: a synchrotron energy-dispersive diffraction study of an elusive metastable hydrated salt, J. Anal. At. Spectrom. (2008). 2. L. A. Rijniers, H. P. Huinink, L. Pel and K. Kopinga, Experimental evidence of crystallization pressure inside porous media, Physical Review Letters 94 (2005) 075503.
18

Time dependent diffusion studies in partially filled nanometric
and micrometric pores
Germán Farrhera, Ioan Ardelean
b, Rainer Kimmich
a
a University of Ulm, Sektion Kernresonanzspektroskopie, 89069 Ulm, Germany;
b Technical
University of Cluj Napoca, Physics Department, 400020 Cluj-Napoca, Romania
Provided that some conditions are fulfilled, diffusion measurements of liquids partially
filling porous media have indicated an enhanced self-diffusion coefficient relative to the bulk
phase [1, 2]. The reason for such observations is
the molecular exchange process between two
phases: liquid and saturated vapor. Molecular
exchange means that the solvent molecules are
intermittently subject to diffusion features in
either phase. Translational displacements in the
vapor phase are much faster than in the liquid
phase and contribute to the enhancement of the
effective diffusion coefficient.
In our previous studies [2] the
contribution of the vapor phase to molecular
diffusion in silica glasses with nanometer and
micrometer pores partially filled with
cyclohexane (non-polar) or water (polar) was
investigated for a given diffusion time (300 ms)
with the aid of pulsed field-gradient NMR
diffusometry. In the present investigations we
are focused on time dependent diffusion
coefficients. Experimental diffusion times
ranging between 100 sμ and 1 were probed using two unconventional NMR diffusometry
techniques [3]. The experimental data were compared with Monte Carlo simulations (see
Fig.1) on model structures showing a qualitatively equivalent behavior in the common time
window. On this basis we could conclude that the vapor phase contribution to the effective
diffusivity is particularly efficient on a diffusion time scale corresponding to root mean
squared displacements of the order of pores dimension.
s
10-5
10-4
10-3
10-2
10-1
100
101
102
103
104
105
106
0
10
20
f=
0.04
0.10
1.00
0.1
0.2
De
ff
(10
-9 m
2/s
)
time (µs)
10-5
10-4
10-3
10-2
10-1
100
101
102
103
104
105
106
0
10
20
f=
0.04
0.10
1.00
0.1
0.2
De
ff
(10
-9 m
2/s
)
time (µs)
Fig.1: Measured (dots) and simulated (lines)
effective (= overall averaged) diffusion
coefficient versus diffusion time for different
filling factors.
This work was financed by the Alexander von Humboldt Foundation, the Deutsche
Forschungsgemeinschaft, and the Romanian MEC (CNCSIS 1292/2006).
References:
[1]. F.D’Orazio, S.Bhattacharja, P.Halperin, and R.Gerhardt, Phys.Rev.Lett. 63, 43(1989).
[2]. I. Ardelean, G. Farrher, C. Mattea, R. Kimmich, Magn. Reson. Imag. 23, 285(2005);
[3]. G. Farrher, I. Ardelean, and R. Kimmich, J. Magn. Reson. 182, 215 (2006).
19

Magnetic field strength dependence of correlated Internal
Gradient-relaxation time distributions in Heterogeneous
Materials K.E. Washburn
a,c, C.D. Eccles
b, P.T. Callaghan
a
aVictoria University of Wellington,
bMagritek Limited,
cReservoir Laboratories AS
When there exists a magnetic susceptibility difference between two materials placed
in an applied magnetic field, local field gradients will develop at their interfaces. These
inhomogeneities in the magnetic field are referred to as “internal gradients”. The internal
gradients can have detrimental effects upon experiments, leading to distorted images and
inaccurate diffusion and T2 measurements. At the same time, the dependence of internal
gradients upon pore characteristics means they can provide useful information about the pore
space.
Previous research has correlated T2 with internal gradients1. To better understand the
behaviour of internal gradients, we present here a novel NMR technique to correlate T1
relation with internal gradients. In contrast with T2 or the restricted diffusion coefficient,
measurement of T1 relaxation is not susceptible to the presence of internal gradients. This
makes it ideal for use at high and ultra-high fields where internal gradients could potentially
be significant. We observe how the distribution of T1-internal gradient correlations in tight-
packed quartz sand and Mt. Gambier limestone change at 12 MHz, 200 MHz, 400 MHz, and
900 MHz. Surprisingly, even at the ultra-high field of 900MHz there exists signal at
relatively low internal gradients.
The results of the correlations provide experimental evidence to support the theory2
that the effective internal gradients present in a sample can scale as B0 while maximum
observable gradients can scale at up to B0
3/2. Our results also show that it is possible to
reliably perform experiments on even highly heterogeneous samples at ultra high fields and
that advantages come at these high fields.
References:
1. B. Sun, K.J. Dunn Phys. Rev. E. 65 (2002) 051309
2. M.D. Hurlimann, J. Magn. Reson. 131 (1998) 232
20

Monitoring of hydrocarbon uptake in highly conductive porous
media using a unilateral NMR instrument
H. Adriaensena, M. Bencsik
a, S. Brewer
b
aSchool of Science and Technology, Nottingham Trent University, Clifton Lane, Nottingham,
NG11 8NS, UK, bDSTL, Porton Down, Salisbury, Wiltshire, SP4 0JQ, UK
Studies of adsorption on porous media are of a great interest to the industry. Some of its characteristics can be determined by several methods such as volumetric and gravimetric measurements. A more sophisticated technique like calorimetry can be used[1] and gives information about chemical or physical adsorption. Furthermore, Magic Angle Spinning (MAS) Nuclear Magnetic Resonance (NMR) spectroscopy is one of the best techniques for studying adsorption on porous material at a molecular level[2].
However, using MAS spectroscopy requires that the porous solid has already experienced adsorption prior to the real experiment. Here we show that we can monitor the time course of the uptake of an adsorbant, using a unilateral NMR instrument.
Heptane (1.5 mL) was placed in a small (i.d. 1.8 cm, L 0.9 cm) cylindrical PTFE well, on top of which a monolithic cylinder of activated carbon (see photo) was placed. The profile
NMR MOUSE®[3] and its lift were flipped upside-down so as to monitor the NMR signal at the top of the monolith, in a slice (~400 µm x 20 mm x 20mm) 2 mm away from the instrument, overlapping with the edge of the sample.
The heptane pool evaporates within approximately two hours, whilst the NMR was monitored over more than 7 hours, allowing both adsorption and desorption to be detected.
The spin echoes were processed so as to show the time course of the effective relaxation rate (R2
eff) and the NMR amplitude (see figure). A similar experiment was repeated with a less dense ‘composite’ of activated carbon, and with an activated carbon cloth. We only show here the results for the monolithic activated carbon.
This work demonstrates that the uptake process of an organic compound (heptane) in an activated carbon can be
successfully monitored with the MR MOUSE®, in spite of the low resistivity (565 Ω.m-1) of the porous material. Different NMR signatures of the uptake and desorption are seen in the three different samples, and these will be discussed.
We are currently actively focusing in trying to quantitate the signal in terms of adsorbed heptane.
References:
1. T. A. Centeno, F. Stoeckli, recent advances in adsorption processes for environmental protection and security, pp: 9-18, Sep 09-12, 2006 Kiev ukraine
2. R. K. Harris, T.V. Thompson, P. Forshaw, N. Foley, K.M. Thomas, P.R. Norman and C.Pottage, Carbon Vol. 34, No. 10, pp. 1275-1279, (1996)
3. J.Perlo, journal of magnetic resonance 176 (1): pp. 64-70 Sep (2005)
21

MICROSCOPIC WETTABILITY OF CARBONATE ROCKS :A PROTON FIELD CYCLING NMR APPROACH
G. Freimana, J.-P. Korba, B. Nicotb, P. Ligneulb
aLaboratoire de Physique de la Matière Condensée, Ecole Polytechnique, CNRS, 91128 Palaiseau, France bSchlumberger SDCR, PO Box 2836, 31952 Al Khobar, Saudi Arabia
Nuclear Magnetic relaxation dispersion (NMRD) is strongly sensitive to the microscopic wettability of oil and brine bearing carbonate rocks. Exploring a very large range of low frequency enables isolating the typical NMRD dispersion features, 1/T1Surf, associated to the different processes of molecular surface dynamics. This allows an experimental separation of the surface and bulk microdynamics of oil and water even for a diphasic saturation of petroleum rocks. Several surface dynamical parameters such as translational correlation time, time of residence, surface affinity were determined and related to the concept of microscopic wettability of oil and water in porous media. We show our last results for diphasic mixtures (dodecane/water-brine) saturating carbonate rocks of different porosities and permeabilities when irreducible saturation of water is reached.
22

BLOCH-SIEGERT EFFECT IN MAGNETIC-RESONANCE
SOUNDING OF AQUIFERS
Oleg A. Shushakov1, 2, 3
1Baker Atlas Russian Science Center, Novosibirsk, Russia,
2Institute of Chemical Kinetics and
Combustion SB RAS, Novosibirsk, Russia. 3Novosibirsk State University
The magnetic resonance basic idea consists in reorientation of spin magnetization caused
by a weak-amplitude radiofrequency field when its frequency is in resonance with the frequency
with which the magnetization precesses in a strong static field. The special case of a weak field
rotating around the strong field is usually used in the magnetic resonance applications while it is
easily treated. F. Bloch and A. Siegert [1] studied more general case of the magnetic resonance
with elliptic polarization of the radiofrequency field in particular the commonly used case of
simple linear oscillation.
The magnetic resonance sounding (MRS) is a particular case of the magnetic resonance
in the Earth’s magnetic field as a static field BBo that is quite weak (of the order of 5•10 T).
Whereas the radiofrequency-field B1
-5
B produced by the surface antenna is linearly polarized and
can be compatible with the geomagnetic field amplitude, therefore the effect of strong
nonrotating radiofrequency field BB1 can take place in the MRS. Fig. 1 exemplify a good
agreement between measured data and calculated taking into account the Bloch-Siegert effect at
the Ob reservoir near Novosibirsk used as a model of aquifer with known free water content
(100%), depth (from 1 to 11 m under ice), and some other parameters.
0 4000 8000 12000 16000 20000
Pulse moment (A*ms)
0
1000
2000
3000
4000
MR
S a
mpli
tud
e (
nV
)
Ob reservoir
0-1m - ice
1-11m - water
40 ms pulse duration measured
40 ms pulse duration calculated
80 ms pulse duration measured
80 ms pulse duration calculated
No Bloch-Siegert effect
Fig. 1: The MRS amplitude vs pulse moment at 40ms and 80ms pulse durations measured
(circles) and calculated (lines). Dashed line – calculated without the Bloch-Siegert effect.
Conclusion
New physical model of MRS has been developed taking into account non secular effects
of spin Hamiltonian with strong and linearly polarized radiofrequency field, its experimental
proof has been carried out for subice water at the Ob reservoir (modeling an aquifer).
Reference
1. F. Bloch and A. Siegert. Magnetic resonance for nonrotating fields. Phys.Rev. 57 (1940)
522
23

Internal Magnetic Field Gradients: Experimental Study
A.R. Mutina and V.D. Skirda.
Kazan state university.
Russia, 420008, Kazan, Kremlevskaya str., 18.
Nuclear magnetic resonance is one of the most powerful techniques for the investigation of
porous media. When the sample is placed in a uniform external field, the magnetic
susceptibility difference between the porous material and the diffusing fluid leads to the
appearance of non-uniform internal magnetic fields in the porous media. The
inhomogeneities depend on many factors, including H0, value, pore morphology and
geometry. On one hand, these internal fields introduce ambiguity in the classical
interpretation of NMR experimental data. On the other hand, the internal magnetic fields and
their gradient distributions are determined by the porous media properties and can be used to
obtain information about the porous media, the fluid condition and the localization in it [1,2].
In the present work, internal magnetic fields and their gradient distribution functions were
studied by different NMR techniques, including the “tau-scanning” experiment [2]. Model
(glass beads, Vycor) and natural (sand, quartz sand) porous media, fully and partially filled
by different hydrocarbons, were studied. The dependences of internal field properties and
their gradient distributions on different factors (pore size, diffusant molecular mobility, pore
filling) were examined.
References
[1] Song, Y.-Q. Using internal magnetic fields to obtain the pore size distributions of porous
media, Concepts in Magnetic Resonance, 2003, V.18A, No2, P. 97 – 110.
[2] A.R Mutina, V.D. Skirda Porous media characterization by PFG and IMFG NMR, J.
Magn. Reson., 2007, V.188, No1, P.122 – 128.
Acknowledgements
The work was supported by RFBR No 07-03-01004 and Schlumberger Moscow.
24

ν=2.5 KHz (BEarth)
0.1
1
10
100
10 100 1000 10000d (µm)
R1 (
s-1)
Glass SpheresSea SandOregon, IL SandOttawa, IL SandWater
The 1H NMR R1 of Some Hydrated Synthetic and Natural Sands
C.L. Bray,a R.G. Bryant,
b M.J. Cox,
a G. Ferrante,
c Y. Goddard,
b S. Sur,
d and J.P. Hornak
a
aRIT, Rochester, NY;
bUniversity of Virginia, Charlottesville, VA;
cStelar s.r.l., 27035 Meade
(PV), Italy; dUniversity of Rochester, Rochester, NY
The 1H NMR R1 of hydrated sands is important in determining the poroscity of aquifers
using magnetic resonance sounding. Large R1 variations have been reported in laboratory
measurements of hydrated sands.[1]
We believe these variations are attributable to the
differences in the resonance frequency (ν) and mineralogy. To test this hypothesis, we
measured the R1 of fully-hydrated quartz (Sea, Ottawa, and Oregon) and synthetic
(borosilicate glass spheres) sands as a function of grain diameter (d) and ν using a field
cycling (Stelar FFC-2000) and 7 T high resolution (Bruker DRX-300) NMRs. Samples were
cleaned, dried at 200 ºC, sieved, placed in NMR tubes, and hydrated with 18 MΩ·cm water.
R1 data for all 28 samples displayed monoexponential behavior. R1 values increased
with both decreasing d and ν. Between 0.01 < ν < 30 MHz, samples displayed a linear
relationship between R1 and log(ν), and a power law relationship between R1 and d. The two
smallest diameter sieved Ottawa sands (84 & 117 µm) displayed an order of magnitude faster
R1. EDXM (JEOL JSM-6400V) analysis revealed the presence of pyrite, probably dislodged
by mechanical abrasion during the sieving and stopped by the smallest sieves. In the glass
spheres and the Ottawa 84 and 117 µm samples there is a dispersion between 30 and 300
MHz caused by electron spin flips associated with the larger amount of paramagnetic
material in glass and the Ottawa 84 and 117 µm samples.
Extrapolation of the R1 vs. log(ν) relationship allows prediction of R1 at ν = 2.5 kHz or
BEarth. (Fig. 1.) Measurable R1 differences were observed between the three natural quartz
sands and glass beads. These differences can not be attributed to the geometric
characteristics of the grains and porosity differences, as these were identical within
experimental uncertainty. The three quartz sands had different quantities of trace
paramagnetic impurities in the grains as determined by ESR (Bruker ESP-300,), which may
explain the different slopes in Fig. 1.
We conclude that literature variations in R1 are attributable to the differences in the ν of
the measurements and paramagnetic impurities in the sand grains.
References:
1. M. Müller, S. Kooman, U. Yaramanci, Near Surf Geophys, 3:275-285 (2005).
2. C.L. Bray, et al., J. Env. & Eng. Geophys. 11:1-8 (2006).
Figure 1. Predicted 1H R1 as a function of
particle diameter at ν=2.5 kHz for fully
hydrated, random-packed natural and
synthetic sands. Solid lines are a power law
fit to the data. The dashed line represents the
R1 value for bulk water. Error bars in d
represent ±1σ in the range of d values for the
sample. The flattening of the glass sphere
data at large d values is attributed to a beak
down in the packing efficiency when d
approaches the diameter of the sample tube
(dTube). Both the Bray[2]
data at dTube = 4.5
mm and our data at dTube = 7.7 mm display
this at d > 0.22dTube.
25

129Xe NMR of Xenon Trapped in Fully Dehydrated
Mesoporous Silica referred to Molecular Sieves 5A and 13X Mineyuki Hattori
a*, Kikuko Hayamizu
a, and Nobuhiro Hata
b
aPhotonics Research Institute,
bAdvanced Semiconductor Research Center,
National Institute of Advanced Industrial Science and Technology.
129Xe NMR techniques have been applied to probe porosity of mesoporous silica and
the pore size is known to relate with the chemical shift. Since the Van der Waals radius of Xe
is known to be 0.216 nm, the possible pore size to adsorb xenon should be larger than 0.4 nm
in diameter. Then the mean pore diameters ranging from 0.4 to 300 nm are the possible target
to show the relationship experimentally. We have developed an apparatus to produce the laser
induced hyperpolarized (HP) Xe gas[1] and tried to apply it to a self-assembled porous silica
sample (Lowk1), which is known as a candidate of low-dielectric constant materials for
interconnects in future ultra-large scale integrated circuits (ULSIs)[2].
The temperature dependent 129
Xe NMR spectra were measured at the frequency of
74.7 MHz from 168 to 373 K. Since the pore size is small and the diameter is about 2 nm, the
comparison was focused on materials having small pore sizes of commercial available
molecular sieves 5A (0.5 nm) and 13X (1 nm). When the HP xenon gas was introduced into
the samples at room temperature, the 129
Xe NMR signal always moved a little to the lower
field side to reach an equilibrium state and the life-time of the HP xenon was shorter in 5A
and 13X compared with Lowk1. The broad signal in the initial stage moved to the lower field
with narrowing to approach equilibrium states, accompanied by the gradual decrease of
signal intensity and the HP 129
Xe signal disappeared. After a little while, at the same position
the 129
Xe signal came out and gradually the intensity increased in the opposite phase to
approach to equilibrium states in intensity. Waiting about 10 min, the 129
Xe shift values were
obtained as shown in Fig. 1. The changes in the line widths are plotted versus temperature in
Fig. 2. The 129
Xe NMR spectra for mesoporous materials measure the averages of the
residence times or numbers of xenon atoms in the mesopores under adsorbed and gas phase
equilibrium at each temperature. The residence times or numbers in the mesopores vary
depending on temperature and pressure, which influences the 129
Xe chemical shift.
Fig. 1: 129
Xe shifts of 5A, 13X and Lowk1. Fig. 2: 129
Xe full line width at half height.
A 129
Xe NMR study on mesoporous materials under atmospheric pressure has
established. Combination of UHV treatment of the sample and the hyperpolarized 129
Xe
NMR techniques at atmospheric pressure indicate that estimation of the size and distribution
of pore by measurements of both chemical shift and line width.
References:
1. M. Hattori, Engineering Materials 52 (2004) 86.; N. Ohtake, M. Murayama, T. Hiraga, M.
Hattori, K. Homma, Japanese Patent 2003-4304.
2. N. Hata, C. Negoro, K. Yamada, and T. Kikkawa, Jpn. J. Appl. Phys. 43 (2004) 1323.
26

Spin-lattice relaxation of SF6 in heterogeneous porous materials
Juhani Lounila, Henri Tervonen, Jukka Jokisaari
NMR Research Group, Department of Physical Sciences, University of Oulu, P.O. Box 3000, FIN-90014 University of Oulu, Finland
The spin-lattice relaxation times (T1) of fluorine nuclei in gases such as CF4 and C2F6
are known to increase considerably when the gases are confined to small pores [1]. Such behavior is expected for collisionally interrupted intramolecular interactions in the limit of extreme narrowing. As a matter of fact, the dominant relaxation mechanism for these gases is the modulation of the spin-rotation interaction by molecular collisions. In the bulk gas, T1 is proportional to the density, as the correlation time of molecular angular momentum is determined only by the molecule-molecule collisions. In porous materials, the collision frequency is increased by the presence of molecule-wall collisions. Hence, the increase of the relaxation time may be attributed to the increase of the collision frequency [1].
A method for measuring the surface/volume ratio of porous materials by measuring how T1 of CF4 gas changes with confinement has recently been introduced [2]. The applicability of the method was demonstrated by analyzing samples of fumed silica (SiO2). This material is an ultrafine powder with a high air content and very little particle-particle contact, and its surface/volume ratio can be changed by compression.
However, in most practical applications the studied material is granular. Then the analysis is complicated by the presence of voids where the gas molecules can reside. In the present work, we look for a generalization of the method to macroscopically inhomogeneous materials. To this end, we have studied the 19F spin-lattice relaxation time of sulfur hexafluoride gas (SF6) adsorbed in different types of granular porous materials.
References: 1. M. J. Lizak, M. S. Conradi and C. G. Fry, J. Magn. Reson. 95 (1991) 548. 2. D. O. Kuethe, R. Montano and T. Pietrass, J. Magn. Reson. 186 (2007) 243.
27

Imbibition delay in porous media owing to thin low permeability surface layers
V. Bortolottia, M. Gombiab, A. Campagnolia, M. Camaitic, R.J.S. Brownd, P. Fantazzinib
aDICMA, University of Bologna, Via Terracini 28, 40131 Bologna, Italy
bDepartment of Physics, University of Bologna, Viale Berti Pichat 6/2, 40127 Bologna, Italy cICVBC, CNR, Via Madonna del Piano 10, 50019 Sesto Fiorentino (FI), Italy
d953 W Bonita Ave, Claremont CA 91711-4193, USA
Coatings are gaining an ever-increasing importance in many technological materials, as well as in the study of the mechanisms for the ingress of water inside these materials. In a previous paper1, fluid imbibition in rocks has been studied by Magnetic Resonance Imaging (MRI), before and after treatments to artificially change capillary and surface properties.
Using MRI, the presence of water inside each sample could be visualized and the height z(t) reached by the wetting front as a function of time during experiments of capillary absorption before and after treatment could be quantified. Very good fits to the data were obtained with theoretical and empirical models of absorption kinetics, starting from the Washburn model for capillary rise, adapted to porous media instead of capillary tubes. In some cases, the model had to be modified for application to a sample having a thin low-permeability layer as a result of a treatment process. In those cases we observed some delay in the absorption for both z(t) and mass absorbed, as shown in Fig. 1a and 1b, respectively. A mechanism to explain this behaviour may be the presence of a thin layer of very low permeability at the absorbing surface, and good fits to these data were obtained by introducing a delay parameter into the absorption equation. In this paper, that model has been checked on model porous media made of two rock samples of different permeabilities.
Fig. 1: Height reached by the wetting front during imbibition process (a) and total mass of absorbed water (b) as functions of square root of time for two samples. Circles and solid lines refer to an about 100 mm high sandstone sample; squares and dotted lines refer to a model porous medium constituted by the previous sample and a small, about 1 mm high, low permeability layer made of calcareous rock.
References: 1. M. Gombia, V. Bortolotti, R.J.S. Brown, M. Camaiti, P. Fantazzini, Models of water imbibition in untreated and treated porous media validated by quantitative Magnetic Resonance Imaging, J. Appl. Phys., in press 2008.
a b
28

Desalination of historical objects as studied by NMR
L. Pel, V. Voronina, K. Kopinga
Group Transport in Permeable Media,
Department of Applied Physics, Eindhoven University of Technology,
Eindhoven 5600 MB, The Nederlands
ABSTRACT
Salt crystallization is one of the most important reasons for the decay of historical
objects. A well known example is the historical city of Venice in which there is a lot salt
decay. Reducing salt contamination is important for conservation of old historic buildings.
Therefore often desalination treatments are done. The desalination of non-movable objects,
like buildings, is usually made through application of so-called poultices. That is a moistened
absorbent material is put on the surface of masonry. Water will than penetrate and desolve the
soluble salt present. By subsequent drying the ions will be transport fror the substrate into the
tpoultice. The removal of water-soluble salts sounds easy, but it can prove difficult in
practice. To achieve a better poultice performance, knowledge about salt transport in the
combination poultice/substrates is needed. We have studied the moisture and ion transport for
various desalination systems by NMR. Based on these measurements one can categorize
poultices according to their working principle of salt extraction and indicate the effectiveness
for various desalination methods.
29

Spontaneous crystallization of meta stable sodium sulfate as observed by NMR
T. Saidov , L. Pel
Group Transport in Permeable Media,
Department of Applied Physics, Eindhoven University of Technology, Eindhoven 5600 MB, The Nederlands
Salt crystallized in pores can give rise to damage of porous materials due to
existence of surface tension between pores and formed crystals. Sodium sulfate is one of the most damaging salts, but there are still many questions about its crystallization and damaging mechanisms. Especially which form of crystal will crystallize out firstly in porous media. In our experiments we have investigated the crystallization of sodium sulfate in porous building materials like fired-clay brick and in sandstone. In these experiments the crystallization was introduced by changing the temperature as the solubility of sodium sulfate is strongly temperature dependent.
Using NMR we have measured non destructively the Na concentration in these materials during crystallization. These experiments show the formation of meta stable heptahydrate form of sodium sulfate. Moreover these experiments indicate the existence of a spontaneous crystallization line. That is during cooling there is a maximum super saturation which can be reached. It was found that the type of porous material has no influence on the spontaneous crystallization line. This proves that crystallization process in these cases is caused only by the internal properties of solution. This behavior of sodium sulfate opens new questions in the understanding of crystallization damage.
30

High resolution MRI to probe
drying and barrier properties of coatings
S.J.F. Erich*+, L. Pel*, H.P. Huinink*, V. Baukh* and O.C.G. Adan
+
* Department of Applied Physics, Eindhoven University of Technology,
P.O. Box 513, 5600 MB Eindhoven, The Netherlands +
Built environment and geosciences, TNO, P.O. Box 49, 2600 AA Delft
In the last twenty years the environmental concerns regarding chemicals used by the
coating industry has been growing rapidly. More and more coatings are reformulated and
turned into waterborne systems. Still many problems concerning waterborne systems remain
and new investigations and measurements techniques are required. Since the use of
waterborne coatings is significantly increasing and waterborne coatings are sensitive to water
it is important to investigate the connection between water transport and degradation of such
coatings. In addition recently, the carcinogenicity of cobalt based catalyst was reported.
Therefore alternative catalyst systems are studied for application in alkyd coatings, based on
Mn or Fe. So techniques able to monitor drying of coatings and moisture transport in coatings
are needed.
At present, spatial resolution nuclear magnetic (NMR) imaging is the only technique
that can measure moisture transport and drying processes in coatings in-situ non-destructively
with sufficient high resolution (~ 5 μm) [1]. The principle of NMR is based on the resonance
of nuclei at a specific frequency that is proportional to the magnitude of the magnetic field. If
this field is inhomogeneous, nuclei in different positions will resonate with different
frequencies enabling imaging. By following the so-called GARfield approach (a specific
design of the magnet poles) [2], the desired field gradient (in our case 36.4 T/m) and spatial
resolution is obtained.
MRI probes the cross linking of the coating film by changes in polymer mobility,
which decreases with increased cross linking. The results of studies on alkyd coatings indicate
that the drying dynamics with cobalt as a catalyst is different from those with manganese
based catalyst. In case of cobalt a cross linking front movement proportional to √t was
observed [3], whereas this was not observed in case of the manganese based catalysts, not
even at high concentrations.
In addition studies have been made in which high resolution MRI shows the
absorption of a solvent borne coating by an underlying porous substrate. For solvent borne
coating the absorption is higher than in case of a waterborne coating, in which only the water
is absorbed. Also, NMR imaging is able to distinguish different layers, measure moisture
transport, measure swelling and/or shrinkage, and fluorine distribution [4].
References:
1. S.J.F. Erich, J. Laven, L. Pel, H.P. Huinink and K. Kopinga, Comparison of NMR and confocal Raman
microscopy as coatings research tools, Prog Org Coat 52 (2005), p. 210.
2. P.M. Glover, P.S. Aptaker, J.R. Bowler, E. Ciampi and P.J. McDonald, A novel high-gradient permanent
magnet for the profiling of planar films and coatings, J. Mag. Res. 139 (1999) (1), pp. 90–97.
3. S.J.F. Erich, J. Laven, L. Pel, H.P. Huinink, K. Kopinga, Dynamics of cross-linking fronts in alkyd coatings,
Appl. Phys. Letters 86 (2005) 134105
4. Diki, T.; Erich, S.J.F.; Ming, W.; Huinink, H.P.; Thune ,P.C.; van Benthem, R.A.T.M.; de With, G,
Fluorine depth profiling by high-resolution 1D magnetic resonance imaging, Polymer 48 (14) (2007), 4063
31

The formation of meta-stable sodium sulfate heptahydrate during drying in porous media as studied by NMR
T. Saidov , L. Pel
Group Transport in Permeable Media,
Department of Applied Physics, Eindhoven University of Technology, Eindhoven 5600 MB, The Nederlands
Salt weathering is a major cause of deterioration of porous building materials. Of
the salts responsible in practice, especially sodium sulfate is seen as very damaging. However many questions arise concerning which sodium sulfate phase will crystallize out during salt weathering. In this study we focused on the crystallization during isothermal drying of a sample saturated with a sodium sulfate solution. As the material is drying moisture will leave and hence the salt concentration will rise until the maximum solubility is reached. From that point on crystals will be formed. Using NMR we have measured quasi simultaneously both the moisture and Na profiles during drying. These experiments have been performed at various temperatures and concentrations. In our NMR experiments we observe the formation of a metastable phase of sodium sulfate, the heptahydrate crystals.
32

Impact of multi-scale moisture transport
on durability of hardened cement pastes
H. Chemmia,b
, D. Petita, P. Levitz
a, J.-P. Korb
a. C. Tourné-Péteilh
c, J-M Devoisselle
c.
aLaboratoire de Physique de la Matière Condensée, Ecole Polytechnique, CNRS, Palaiseau
91128, France. bATILH, 7 Place de La Défense - 92974 Paris La Défense Cedex, France.
cLaboratoire de Matériaux Catalytiques et Catalyse en Chimie Organique UMR
5618/ENSCM/Université Montpellier 1 8 rue de l’Ecole Normale, 34296 Montpellier Cedex
5, France.
Improving sustainibility and performance of cements is a key point to limit CO2 emission.
Long term durability is closely related to unsaturated moisture transport at different length
scales of these materials. In our study, hardened cement pastes exhibit threefold hierarchy:
intra-CSH (hydraulic binder) nanopore, mesopore structure at a scale ranging from 3nm to 20
nm and capillary pore network above 100 nm. The moisture transport at different water
filling controlled by temperature and relative humidity ratio is followed by a proton NMR
multi-scale approach using PFG diffusometry, field cycled relaxometry and spectroscopy
correlated with T1, T2 and T1ρ measurements. In parallel, a similar study is conducted in three
types of reference pore network, having nano, meso and macro pore network MCM41, vycor,
and controlled pore glass CPG respectively. The role and the efficiency of the three scales on
the moisture transport are reported.
33

Molecular dynamics of ionic liquids confined in solid silica matrix for lithium batteries
D. Petita, J.-P. Korba, P. Levitza, J. Le Bideaub, A. Vioux b, D. Brevetb
aLaboratoire de Physique de la Matière Condensée, Ecole Polytechnique, CNRS, Palaiseau 91128, France bInstitut Charles Gerhardt, Université Montpellier 2, CNRS, 34095 Montpellier, France
Ionic liquids are known for their high ionic conductivity and their wide electrochemical potentialities. They have recently been used as electrolytes in solar and fuel cells [1, 2] and lithium batteries [3]. For such applications, these ionic liquids have been immobilized in a solid matrix [4, 5]. However, the molecular dynamics of these liquid-like ions within a disordered solid matrix is still unknown. Here, we choose the (1-butyl-3-methylimidazolium bis(trifluoromethylsulfonyl)imide) [BMI][TFSI] as an anion-cation pair of ionic liquid confined within a silica-like mesoporous matrices made by a sol-gel route from hydrophobic methyl groups precursors (ionogels made from tetramethoxysilane, methyltrimethoxysilane ; lithium salt Li TFSI was added). In a first step, we have measured the proton nuclear magnetic relaxation dispersion (NMRD) of the confined proton-bearing cation [BMI]. The frequency dependence of 1/T1 behaves as a power law, 1/T1~ω-1/2, over more than three orders of magnitude. This suggests a very slow decay of the intramolecular dipolar fluctuations of this confined cation at proximity of the pore surface. Such a power law remains over a very large range of temperature (10°C-70°C). This suggests a translational diffusion process at proximity of the pore surface. Several dynamical parameters have been determined from these proton NMRD such as: translational correlation time, activation energy as well as a surface diffusion coefficient that is similar to the one determined by quasi-elastic neutron scattering [6]. Moreover, we have observed a modification of the diffusive regime above 300K in conformity to recent conductivity measurements [5]. An estimation of the length of persistence associated to an average radius of curvature of the pores has been reached from the cross-over to a frequency independence of 1/T1 observed at low frequency. Last, we show the 19F NMRD of the proton-free anion [TFSI] and obtained a power-law behaviour almost similar to the protons. This is in favour of a very-correlated dynamical motion of the anion-cation pair at room temperature within the solid and disordered silica matrix. Both the methods and the theories presented here can be applied more widely to other conducting porous media.
This work is supported by the Agence National de la Recherche ANR-06-NANO-003
[1] B. O’Reagan and M. Graetzel, Nature 353, 737-740 (1991). [2] H. Nakamoto and M. Watanabe, Chem. Commun. 2339-2541 (2007). [3] M. Diaw, A. Chagnes, B. Carre, P. Wilmann and D. Lemordant, J. Power sources 146,
682-684 (2005). [4] J. Le Bideau, P. Gaveau, S. Bellayer, M.A. Néouze and A. Vioux, Phys. Chem. Chem.
Phys. 9, 5419-5422 (2007). [5] M.-A. Neouze, J. Le Bideau, P. Gaveau, S. Bellayer and A. Vioux, Chem. Mater., 2006,
18, 3931–3936. [6] S. Mitra, J.-M. Zanotti, M.-A. Néouze, S. Bellayer, A. Vioux and J. Le Bideau,
submitted.
34

Surface Diffusion in Catalysts Probed by APGSTE NMR
D. Weber, M.D. Mantle, A.J. Sederman and L.F. Gladden
Department of Chemical Engineering, University of Cambridge, Cambridge CB2 3RA, UK
The performance of heterogeneous catalytic processes is closely linked to the access
of reactant molecules to active catalytic centres on the surface. It therefore follows that the
successful operation of catalytic processes relies on a fundamental understanding of
molecular diffusion in heterogeneous catalysts. We have recently developed the experimental
protocol to measure chemically-specific surface diffusion coefficients using Pulsed Field
Gradient (PFG) Nuclear Magnetic Resonance (NMR) techniques. While the study of
diffusion phenomena with PFG NMR techniques evolved in the 1960s and is nowadays part
of the standard NMR toolbox, our approach allows us to quantify both the self-diffusion
coefficients of molecules in a surface layer and the bulk pore liquid of a porous medium
using the 13-interval APGSTE pulse sequence as outlined by Cotts [1]. For this it is
necessary to acquire signal with a large number of scans at high gradient strengths of up to
1200 G cm-1
to assess the surface layer diffusion coefficient which is typically one to two
orders of magnitude slower than the corresponding bulk liquid diffusion coefficient.
We have used this method to study solvent effects in the hydrogenation of methyl ethyl
ketone (MEK) in porous 1 wt% Pd/Al2O3 catalyst trilobes and 1 wt% Ru/SiO2 catalyst
pellets. Water has been reported to have a significant impact on reaction rates during
carbonyl hydrogenations [2-4]. Consequently we have assessed surface layer and bulk pore
liquid diffusion coefficients of MEK in mixtures with two solvents – water and isopropyl
alcohol (IPA) – across the entire concentration range (0-100 mol% water) under non-reacting
conditions. The comparison of these results with the reaction rates of MEK at these ternary
mixture compositions will be presented. The data will be used to suggest hypotheses for the
role of the solvents in this hydrogenation reaction.
References:
1. R. M. Cotts, M. J. R. Hoch, T. Sun, and J. T. Markert, J. Magn. Reson. 82 (1989) 252.
2. P. Kluson, L. Cerveny, Appl. Cat. A 128 (1995) 13.
3. A. Drelinkiewicz, R. Laitinen, R. Kangas, J. Pursiainen, Appl. Cat. A 284 (2005) 59.
4. B. S. Akpa, L.F. Gladden, K. Hindle, M. Neurock, D.W. Rooney, N. Sinha, E.H. Stitt,
D. Weber, ISCRE19, Potsdam, Germany (2006).
35

Kinetics and Microstructure of Hydrating Plasters
K. M. Song and L. F. Gladden
Department of Chemical Engineering, Pembroke Street, University of Cambridge,
Cambridge CB2 3RA, UK
Gypsum (CaSO4·2H2O) is widely used in the construction industry; it can be pre-
fabricated into wallboards for interior wall and ceiling applications, and is sold as
“plasterboard.” There are two varieties of plaster, α and β, produced by wet or dry methods
respectively, which can be hydrated to form solid gypsum products. The two forms of plaster
differ in their reactivity with water and in the mechanical properties of the hydrated products
[1]. 1H NMR provides non-destructive methods of probing the microstructure of construction
materials (e.g., cement [2]) continuously during hydration. This work is part of a broader
study investigating improvements to the mechanical properties of set plaster under conditions
of high relative humidity.
We present a comparative study of the two different types of plaster using various
NMR techniques. Only the β form has been investigated in depth previously [3, 4]. NMR T2
relaxation and imaging are used to compare the hydration kinetics and microstructural
changes that occur during the hydration of the two different types of plasters. We observe a
distinct difference in the hydration kinetics, as illustrated in Fig. 1, for the α- and β-plasters
with a water-to-plaster ratio of w/p = 1. The α-plaster starts hydrating immediately following
the addition of water, whereas the hydration of β-plaster is characterised by a long induction
period. The β-plaster hydrates much faster, although the time required for both plasters to
reach the same residual water content is similar.
We have also examined the hydration kinetics, microstructure and morphology of the
gypsum crystals as a function of w/p ratio and inclusion of additives. The NMR study is
supported by X-ray Microtomography data, which will also be presented.
0.7
0.8
0.9
1
0 10 20 30 40 50Hydration time (min)
Sig
na
l in
ten
sit
y (
a.u
.)
α-plaster (w/p=1.0)
β-plaster (w/p=1.0)
Hydration period for β
Hydration period for α
Fig. 1: Variation of average signal intensity from 1D profiles of two
different plasters during the hydration.
References: 1. N. B. Singh and B. Middendorf, Prog. Cryst. Growth. Character. Mater. 53 (2007) 57.
2. J. -P. Korb, Magn. Reson. Imaging. 25 (2007) 466.
3. H. Jaffel et al., J. Phys, Chem. B 110 (2006) 7385.
4. E. Badens et al., J. Cryst. Growth. 198/199 (1999) 704.
36

Understanding T2 relaxation times in hardening cement pastes using
the NMR exchange and the Powers’ hydration models
F. Stallmach, K. Friedemann
Faculty of Physics and Earth Sciences, University of Leipzig, Leipzig, Germany
Transverse relaxation times (T2) of physically bound water in cement pastes decrease
monotonously from values of about 10 ms to 20 ms observed in freshly mixed glutinous cement
pastes down to less than 1 ms in the hardened cements [1-3]. These T2 changes occur during the
first day(s) of cement hydration and are qualitatively rationalized by the decreasing pore sizes
due to the growth of solid calcium silicate hydrate (CSH) phases.
The Powers’ model of cement hydration [4] assumes that changes of macroscopic
properties of the cement pastes due to hydration may be described by interrelated changes of the
volume fractions of the unreacted cement, the capillary water, the solid hydration products and
the gel water. Among these volume fractions, the capillary and gel water can be observed by
low-field 1H NMR relaxometry. However, CPMG NMR studies with ordinary white and
Portland cement pastes show only one peak in the T2 relaxation time distribution, which means
that it is not possible to distinguish between the gel and capillary bound water fractions using
expected differences in their T2 relaxation times. Thus, there must be a fast exchange between
both water fractions on a microscopic scale, which allows one to observe only an effective,
averaged relaxation time in CPMG NMR.
The NMR two-site fast exchange model allowed us to predict the effective relaxation rate
(1/T2) from the relaxation rates of the gel (1/T2,gw) and the capillary (1/T2,cw) bound water
fractions and their relative amounts in the cement paste. Using the Powers’ model, the required
relative amounts can be replaced by the initial water-to-cement (wc) ratio and the degree of
cement hydration (α) yielding:
This equation is found to be in excellent agreement with experimentally determined
relaxation times measured in hydrating white and Portland cement pastes of different wc ratios
over a period of two days after cement paste preparation. Since the NMR measurements are also
used to determine the degree of hydration (α), the relaxation rates of the gel (1/T2,gw) and the
capillary (1/T2,cw) water fractions are the only adjustable parameter in this approach. Thus, they
may be used in future NMR studies to characterize different cement mixtures and the cement
hydration under the influence of additives changing, e.g., the water available during the
hydration reaction.
( )
1
23.0
19.023.01
23.0
19.01
,2,22 cwgw Twc
wc
TwcT αα
αα
⋅−⋅+−
+⋅−
⋅=
References:
1. K. Friedemann, F. Stallmach, J. Kärger, Cement and Concrete Research 36 (2006) 817.
2. N. Nestle, C. Zimmermann, M. Dakkouri and J. Kärger, J. Phys. D: Appl. Phys. 35 (2002)
166.
3. A. Plassais, M.P. Pomies, N. Lequeux, P. Boch; J.P. Korb, D. Petit, F. Barberon, Magnetic
Resonance Imaging 21 (2003) 369.
4. O. M. Jensen, P. F. Hansen, Cement and Concrete Research 31 (2001) 647.
37

Analysis of a Novel Ceramic Pore Structure using PGSE NMR
TR Brostena, KV Romanenko
c, SL Codd
a, JD Seymour
b and SW Sophie
a
a Department of Mechanical and Industrial Engineering, Montana State Universityb Department of Chemical and Biological Engineering, Montana State University
cMRI Centre, Department of Physics, University of New Brunswick
Ceramic pore structures produced by a novel tape casting method suggest the opportunity to
optimize porous transport properties for application in a variety of industrial sectors; e.g. fuel
cells, filtration, etc. [1]. Magnetic Resonance Microscopy techniques have been used to
probe the nature of these ceramic pore structures. Spatially resolved pulsed gradient spin
echo (PGSE) techniques were used to obtain displacement propagators of pressure driven
octane flowing through a tape cast ceramic sample. The displacement distributions suggest
anomalous (non-Gaussian) transport of octane through the ceramic structure. In addition,
spatially resolved PGSE techniques were used to observe the pore structure induced restricted
diffusion of no-flow octane. The impact of restricted diffusion on the signal attenuation
clearly demonstrates both the one dimensional affine scaling of the average pore dimensions
and the quasi-elliptical transverse pore shape, see Figs. 1 & 2.
C
A
B
A
C B
x
y
z
C
A
B
C
A
B
A
C B
x
y
z
x
y
z
z
Fig. 1: SEM image of tape cast ceramic, bar=400 m
E( )E( )
Fig. 2: PGSE signal attenuation of stationary octane saturating a
tape cast ceramic as a function of longitudinal position and gradient
vector orientation, constant q
References:
1. S.W. Sofie, Fabrication of functionally graded and aligned porosity in thin ceramic
substrates with the novel freeze-tape casting process, (2007) J. Amer. Ceram. Soc., 90
[7]
2.25mm
38

Ion and polymer mobility in swelling hydrogels
J. Martinsa, T. Mang
b, S. Stapf
c
aInstitute for Technical and Macromolecular Chemistry, RWTH Aachen University,
bInstitute for Applied Polymer Science, Aachen University for Applied Science,
cDepartment of Technical Physics II, TU Ilmenau
The possibility for applying hydrogels as sensors and actuators is to a large degree
dependent on the feasibility to generate fast responses to a range of different external stimuli;
these can be temperature, pH value, or ion concentration in a solvent. The response is
commonly expressed in swelling or shrinking of the gel, where volume changes of two or
three orders of magnitude have been observed. Such hydrogels can then be used e.g. as drug
release carriers, valves, filters or mechanical switches. In most cases, hydrogels represent a
porous mesh constructed of chemically cross-linked polymer chains, but additional
macroscopic porosity can be superimposed into the gel matrix.
The fast swelling response in ionic
hydrogels, of which poly(Na acrylate) is a
prominent example, is due to the osmotic
pressure difference caused by the concentration
of ions inside and outside the hydrogel matrix.
In the presence of water the carboxylic groups
of the polymer backbone will dissociate, adding
a supplementary swelling force by repelling
each other. The swelling parameters can be
controlled by the crosslinker concentration and
the charge density which both influence the
mechanical properties. Hydrogels with a small
amount of crosslinker possess an increased
mobility of the polymer backbone and are able to imbibe large volumes of water.
Furthermore, foreign ions like calcium, magnesium and aluminum will replace the sodium
ions present near the carboxylic groups. Because of the bivalency character of these ions,
they restrict the mobility of the polymer backbone, while the osmotic equilibrium is partially
destroyed affecting the swelling properties. The dynamics and concurrence reactions between
the sodium and the foreign ions inside and outside the hydrogel matrix are not sufficiently
understood. This understanding is fundamental to control the swelling parameters.
In order to investigate the swelling response and the polymeric and ionic dynamics, a
series of polyacrylate hydrogels partially neutralized with sodium hydroxide and dried over a
lyophilized process were prepared. The concentrations of the crosslinker as well as of the
ions in solution were varied systematically, and 1H and
23Na relaxation, diffusion and
imaging experiments were carried out. In this work we report on the dependence of the
sodium dynamics within the pore space of the hydrogel, and provide real-time 23
Na
microscopic images during the swelling and drying processes that allow quantification of the
spatially dependent backbone and ion mobility as a function of external stimuli.
23Na Hydrogel
Fig. 1: 23
Na Spin-density MRI of Poly-
(Na acrylate) Hydrogel
39

Time evolution of the “Solid” and “Liquid” 1H signals duri ng cement paste hydration
V. Bortolottia, R.J.S. Brownb, A. Campagnolia, P. Fantazzinic, M. Gombiac, F. Peddisa
aDICMA, University of Bologna, Via Terracini 28, 40131 Bologna, Italy
b953 W Bonita Ave, Claremont CA 91711-4193, USA cDepartment of Physics, University of Bologna, Viale Berti Pichat 6/2, 40127 Bologna, Italy
NMR Relaxometry of 1H nuclei has been widely applied to cement pastes during hydration, and models have been presented to interpret the experimental data. In this study we used a particular kind of data computation, to follow the changes of freshly prepared cement pastes, starting from the beginning up to many hours and days after the preparation. The method consists in the quasi-continuous T1 distribution analysis of proton signals, after “Solid” and ”Li quid” signal separation, as described below.
As well known, many sample materials give both “Solid” signal components, from protons of low mobility, and also “Liquid” components, from protons with higher molecular mobility. The “Solid” gives a very fast FID decay that in a log-signal plot is initially quadratic in time (initially approximately Gaussian), while the “Liquid” gives initially exponential decay. In the course of time we settled on an algorithm (T1-Filter) to filter the FIDs obtained at different Inversion Recovery times in IR experiments able to give estimates of four parameters: Tg, the time constant of a Gaussian with the same initial log-FID curvature, X2, its corresponding extrapolated amplitude, T2_FID, the T2 corresponding to the initial slope of the “Liquid” component, and X1, its corresponding extrapolated amplitude. The Solid/Liquid amplitude ratio, X2/X1, is also calculated. Special attention has been devoted to avoiding the introduction of excessive scatter in the computed results, by forming stacks of FIDs on which computation were made, and to take into account the eventual changes in the FID slopes of the “Liquid” component with Recovery time, due to possible T2 multi-exponential decays. In such a way we were able to get separate files for input to our multi-exponential inversion software (UPENWin)1 for both “Solid” and “Liquid”, with an accurate determination of the two signal amplitudes at each Inversion Recovery time. We have observed the two components (“Solid” and “Liquid”) in many biological samples, bone, wood, cartilage, collagen. Also cement pastes during hydration show the two components, that we have studied by using the four parameters described above and by quasi-continuous T1 distributions of both components.
The distributions vary very quickly and are clear markers of the rapid changes of the cement pastes in the first few hours after preparation. As a new result, we found that the parameter X2/X1 changes drastically in the first hours and takes days to reach a plateau.
References: 1. V. Bortolotti, R. J .S. Brown, P. Fantazzini, UPENWin, a software for multi-exponential inversion decay, exploited by University of Bologna, 2008.
40
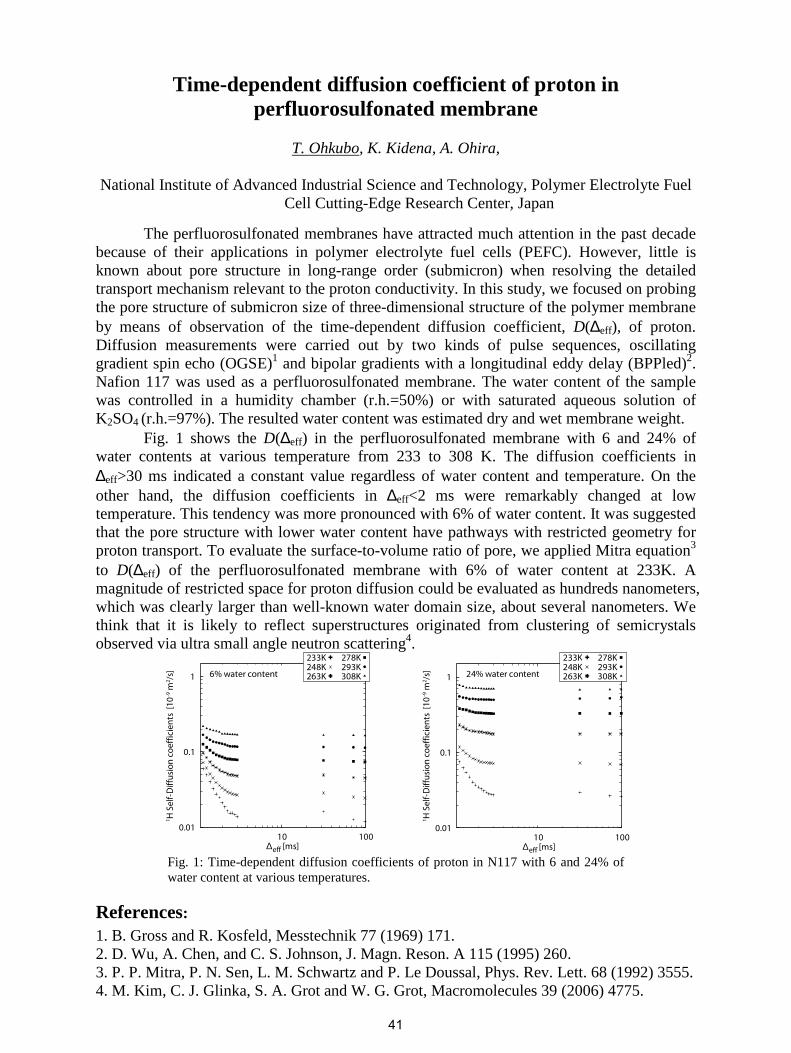
Time-dependent diffusion coefficient of proton in perfluorosulfonated membrane
T. Ohkubo, K. Kidena, A. Ohira,
National Institute of Advanced Industrial Science and Technology, Polymer Electrolyte Fuel
Cell Cutting-Edge Research Center, Japan
The perfluorosulfonated membranes have attracted much attention in the past decade because of their applications in polymer electrolyte fuel cells (PEFC). However, little is known about pore structure in long-range order (submicron) when resolving the detailed transport mechanism relevant to the proton conductivity. In this study, we focused on probing the pore structure of submicron size of three-dimensional structure of the polymer membrane by means of observation of the time-dependent diffusion coefficient, D(∆eff), of proton. Diffusion measurements were carried out by two kinds of pulse sequences, oscillating gradient spin echo (OGSE)1 and bipolar gradients with a longitudinal eddy delay (BPPled)2. Nafion 117 was used as a perfluorosulfonated membrane. The water content of the sample was controlled in a humidity chamber (r.h.=50%) or with saturated aqueous solution of K2SO4 (r.h.=97%). The resulted water content was estimated dry and wet membrane weight.
Fig. 1 shows the D(∆eff) in the perfluorosulfonated membrane with 6 and 24% of water contents at various temperature from 233 to 308 K. The diffusion coefficients in ∆eff>30 ms indicated a constant value regardless of water content and temperature. On the other hand, the diffusion coefficients in ∆eff<2 ms were remarkably changed at low temperature. This tendency was more pronounced with 6% of water content. It was suggested that the pore structure with lower water content have pathways with restricted geometry for proton transport. To evaluate the surface-to-volume ratio of pore, we applied Mitra equation3 to D(∆eff) of the perfluorosulfonated membrane with 6% of water content at 233K. A magnitude of restricted space for proton diffusion could be evaluated as hundreds nanometers, which was clearly larger than well-known water domain size, about several nanometers. We think that it is likely to reflect superstructures originated from clustering of semicrystals observed via ultra small angle neutron scattering4.
0.01
0.1
1
10 100
1H Self-Diffusion coefficients [10-9 m
2/s]
1H Self-Diffusion coefficients [10-9 m
2/s]
∆eff [m s]
0.01
0.1
1
10 100∆eff [m s]
278K293K308K
233K248K263K
278K293K308K
233K248K263K6% w ater content 24% w ater content
Fig. 1: Time-dependent diffusion coefficients of proton in N117 with 6 and 24% of water content at various temperatures.
References: 1. B. Gross and R. Kosfeld, Messtechnik 77 (1969) 171. 2. D. Wu, A. Chen, and C. S. Johnson, J. Magn. Reson. A 115 (1995) 260. 3. P. P. Mitra, P. N. Sen, L. M. Schwartz and P. Le Doussal, Phys. Rev. Lett. 68 (1992) 3555. 4. M. Kim, C. J. Glinka, S. A. Grot and W. G. Grot, Macromolecules 39 (2006) 4775.
41

Liquid Crystals Constrained in Thin Film Capillary Investigated by DHK Spin Echo SPI Measurements
Jing Zhang, Rod MacGregor, Bruce J. Balcom
Physics Department, University of New Brunswick, Canada
Liquid crystals are anisotropic fluids and it is well known that self-diffusion behavior can
provide valuable information on the molecular assemblage in liquid crystal phases [1]. Nuclear magnetic resonance is a well-established technique to study orientational order and dynamics of liquid crystals in porous media [2]. In this work we present a study of liquid crystal properties in constrained thin film capillary (thickness ~ 200 µm) at different temperatures. The liquid crystal under study is the common N-(p-methoxybenzylidene)–p –n –butylaniline (MBBA). Its nematic phase extends from 20°C to 43°C in bulk. Translational self-diffusion measurements have been performed in the mesophases of MBBA liquid crystal by means of pulsed field gradient approach as a function of temperature in the nematic and isotropic phases. We found that in the isotropic phase the diffusion coefficient is not a simple scalar quantity and it has orientational dependence due to the constraint of the capillary wall (Dzz/Dyy≈7.3). To characterize the diffusion distribution of liquid crystals within the thin film, a double half k (DHK) spin echo single point mapping (SPI) diffusion mapping experiment was performed using a parallel plate RF probe. The method provides accurate diffusion tensor measurements with pixel resolution of 4µm.
References: 1. G. J. Kruger, Phys. Rep.-Rev. Sec. Phys. Lett., 82 (1982), 229. 2. M. Vilfan, T. Apih, A. Gregorovic, B. Zalar, G. Lahajnar, S. Zumer, G. Hinze, R. Bohmer,
G. Alhofff, Magn. Reson. Imag., 19 (2001) 433.
42
Application of low field and solid-state NMR spectroscopy to
study the liquid/liquid interface in porous space of clay minerals
and shales
A. Borysenkoa, B. Clennell
b, I. Burgar
c, D. Dewhurst
b, R. Sedev
a, J. Ralston
a
aIan Wark Research Institute UniSA - Adelaide Australia,
bCSIRO Petroleum - Perth
Australia, cCSIRO Materials Science and Engineering - Melbourne Australia
The study of complex multi-component systems such as liquid/liquid/mineral
interactions in porous space of clays and shales is a challenging task. In petroleum research
understanding displacement, redistribution, adsorption of oil and water plays an important
role in considering: (i) oil production (ii) the problem of reservoir top seal, and (iii)
environmental considerations.
The samples, minerals, clays and shales, were prepared in the form of powder to
simplify the process of liquid saturation and crude oil treatment. The preliminary screening of
the samples using optical/fluorescence and scanning electron microscopy and XPS revealed
differences in wetting behaviour of the samples. Several NMR methods were applied to
characterise these systems: oil and water phases competing for mineral surfaces. The
liquid/liquid displacements and distribution within porous medium as studied with the
“Maran Ultra-2”, T2 were up to 10000 ms. The oil interaction with the mineral surfaces does
affect the oil mobility, T2, values only up to 100 ms. Using a combination of Bruker NMR
Surface Analyser MOUSE (15 MHz proton resonance), NMR Minispec (20 MHz), and the
solid-state NMR (300MHz) we were able to investigate surface-adsorbed hydrocarbons.
The detailed NMR analysis shows that the process of liquid/liquid displacement can
be characterised and analysed considering the relaxation times and signal amplitudes. The
results from low field NMR measurements are in good correlation with the solid-state data,
where the changes of oil dynamics in the solid matrix were correlated to the different crude
oils and different shale composition – variable hydrophobicity. All in all the NMR results
were found to correlate well with other data and they have been consistent so we could
consider a combination of low and high-field NMR spectroscopy as a tool of choice for
investigating shale and clay wettability.
43

PFG-NMR and Goldman-Shen study of water diffusion and cross-
relaxation in Polyelectrolyte Multilayers
C. Wende, M. Schönhoff
Institute of Physical Chemistry, University of Münster, Germany
The self-assembly of polyelectrolytes of alternating charge from aqueous solutions onto charged
surfaces leads to the formation of multilayered films. Their permeation properties for different
types of molecules and their porosity are of general interest[1-3], since the multilayers can act as
separation membranes or colloidal hollow carriers. A direct determination of diffusion
coefficients of small molecules within and through the multilayers is attractive, but hard to
achieve for nanometer thin films.
Here, we study free-standing films, which are densely stacked to achive a high filling factor, and
subsequently equilibrated at different relative humidities. We investigate the diffusion of water
molecules in a film of poly(styrene sulfonate)/poly(diallyldimethyl ammoniumchoride) by means
of Pulsed-Field-Gradient-NMR. A non-Gaussian diffusion behaviour is found, which strongly
depends on the relative humidity. Furthermore, a pronounced dependence of the PFG echo decay
on the diffusion time is observed, which might suggest restricted diffusion in a porous structure.
However, an evaluation in a model of restricted diffusion does not lead to conclusive results.
Therefore, a potential influence of cross-relaxation between water and polymer 1H spins is
investigated by a Goldman-Shen pulse sequence. The data are analysed in a model established
for cross-relaxation in polymer hydrogels[4,5], which yields cross relaxation rates. These are of an
order of magnitude relevant in the interpretation of diffusion echo decays, which leads to a re-
interpretation of the diffusion data.
From both the diffusion and cross relaxation experiments it can be concluded that the dynamic
behavior of water in polyelectrolyte multilayers is highly dependent on the water content.
References:
[1] A. Jin, A. Toutianoush, and B. Tieke, Appl. Surf. Sci. 246 (2005) 444.
[2] X. Liu and M. L. Bruening, Chem. Mater. 16 (2004) 351.
[3] F. Vaca Chávez and M. Schönhoff, J. Chem. Phys. 126 (2007) 104705.
[4] L.J.C. Peschier, J. A. Bouwstra, J. de Bleyzer, H. E. Junginger, J. C. Leyte, J. Magn. Reson.
B 110 (1996) 150.
[5] D. Topgaard, O. Söderman, Langmuir 17 (2001) 2694.
44

Time dependent NMR spectroscopy on ionic ferrofluids
D. Heinricha, A.R. Goñi
b, L. Cerioni
c,d, T. Osán
d, D.J. Pusiol
c,d, C. Thomsen
a
a Institut für Festkörperphysik, Technische Universität Berlin, Hardenbergstraße 36,
10623Berlin, Germany, bICREA, Institut de Ciència de Materials de Barcelona, Esfera UAB,
08193 Bellaterra, Spain, cCONICET, Argentina,
dSpinlock S.R.L, Av. Padre Viera 255, X5186KSE, Alta Gracia, Córdoba, Argentina
Magnetic nanoparticles colloidally suspended in a ferrofluid exhibit a tendency to form
clusters and chain-like structures under the influence of an external magnetic field [1-7]. Its
behavior resembles a liquid in a porous media. Recently we used Raman spectroscopy to monitor
the metastable cluster formation and its dynamics in surfacted and ionic ferrofluids [5-7]. In this
work we present results of a complementary study of the magnetic-field induced behavior of a
water-based ionic ferrofluid (IFF) with a concentration of 1 vol.% using nuclear magnetic
resonance (NMR) spectroscopy. For the measurements we used a low-resolution NMR
spectrometer working at room temperature with a homogenous magnetic field of 400 mT.
In the experiments, an electrostatically stabilized ferrofluid which has not been exposed
previously to any magnetic field is placed at 300 K in the bore of the NMR spectrometer. The
NMR spectrum displays an asymmetric feature which is composed by two peaks of different
intensity (Fig.1). The main peak is blue-shifted by approximately 17 kHz from the resonance
frequency of “pure and free” water molecules [8]. The less intense peak appears to be centered at
around 3 kHz above the pure water frequency. Both peaks are attributed to two different dynamic
environments of water molecules in the ferrofluid [8].
Figure 2 shows the time evolution of the peak amplitude of both peaks in a time scale of
more than one hour. The amplitude of the NMR signal of the 17 kHz feature exhibits a slight
increase in the first 300 s followed by a strong reduction in intensity, reaching its minimum after
approximately 15 min. Simultaneously, the amplitude of the 3 kHz peak corresponding to the
NMR signal stemming from water molecules far from the magnetic nanoparticles increases
monotonically, saturating at times longer than one hour. This contrasting behavior of both NMR
signals is readily understood by considering the dynamical processes within the ferrofluid
triggered by an external magnetic field, as revealed by Raman spectroscopy [7].
Fig.1 NMR spectra of an ionic ferrofluid at
different times in a magnetic field of 400 mT.
Fig.2 Time evolution of the amplitude of the
17 kHz (solid points) and the 3 kHz (open
symbols) NMR peaks. Lines are fits using
simple exponential functions.
45

TD-NMR investigation of the effect of curing-temperature on the
hydration and porous microstructure development in cement
S. Ghosh, Z.Harry Xie
The minispec Division, Bruker Optics, Inc. The Woodlands, TX – 77381, USA
Time-domain NMR experiments can be implemented using an instrument with low-
field magnet. This makes implementation of fast quantitative material characterization
combined with portability, possible. The hydration and porous microstructure development in
cement during curing is key to its structural attributes. How the ambient temperature during
the curing process of cement, of various types, affects these processes, is investigated in this
work through time-domain NMR. Variable temperature NMR relaxation and diffusion
measurements were utilized to look into the hydration kinetics and the evolution of
microstructure during the curing process. All these measurements were done with probes
tuned to the Hydrogen nucleus, and thus looking at the change in mobility and diffusion
characteristics of water molecules present in the curing cement system. The NMR data will
also be supported by IR-imaging results. This research work will be helpful in non-invasive,
fast, and quantitative assessment of proper curing conditions (e.g. temperature) for a specific
type of cement, as well as predictive mathematical model development of the process.
46

withdrawn
47

withdrawn
48

Methodical aspects of 2D NMR spectroscopy under conditions of ultra-high pulsed field gradients
M. Gratz, C. Horch, S. Schlayer, P. Galvosas
Universität Leipzig, Fakultät für Physik und Geowissenschaften, Germany
Multidimensional NMR correlation experiments based on an inverse Laplace transformation (see e.g. [1]) have been established as a powerful tool for the investigation of material structure and properties within the last few years. We successfully combined these recent methods with ultra-high pulsed magnetic field gradients of up to 35 T/m [2], which allows us to correlate molecular displacements in the order of 100 nm with NMR parameters, such as relaxation time T2.
Basic concepts for the handling of ultra-high pulsed field gradients were adapted accordingly. This concerns in particular the introduction of a read gradient at suitable positions of the pulse sequences as well as the development of a script automating the steps taken during the experiment. The software interface controlling the NMR experiment ensures the detection of mismatched pulsed field gradients and their subsequent correction as proposed in [2].
However, an additional requirement for experiments involving the inverse Laplace transformation for data processing is to attenuate the NMR signal down to a signal-to-noise ratio of about one. This demand tends to let the aforementioned detection of gradient mismatches fail for evanescent signals. We overcame this challenge by the introduction of a termination condition. Hence, the NMR measurement is terminated, if the signal is attenuated below a predefined signal-to-noise ratio and/or if the pulsed field gradient matching procedure returns unreasonable values.
First experiments were successfully applied to several lubrication oil samples with distributions of diffusion coefficients and NMR relaxation times (fig. 1). Please note the small diffusivities and short T2 which indeed require short and ultra-high pulsed field gradients.
Fig. 1: Diffusion-Relaxation correlation experiment with lubricating oil at T=340 K
References:
1. M. D. Hürlimann and L. Venkataramanan, J. Magn. Reson., 157 (2002) 31–42.2. P. Galvosas, F. Stallmach, G. Seiffert, J. Kärger, U. Kaess and G. Majer, J. Magn. Reson.,
151 (2001) 260–268.
(a) NMR signal map (b) Inverse Laplace transformation of (a)
49

Two–dimensional Laplace inversions applied to multi–component T2–T2 exchange experiments
R. Fechetea, D. Moldovana, D. E. Demcoa,b and B. Blümichc,
a Departments of Physics, Technical University of Cluj-Napoca, Romania
bDWI an der RWTH-Aachen, Germany c Institute of Technical and Macromolecular Chemistry, RWTH-Aachen University, Germany
The two-dimensional (2D) T2-T2 molecular exchange NMR experiments with a period of
magnetization storage between the two T2 relaxation encoding periods [1] are presented. A CPMG pulse sequence with variable echo number is used to encode the signal amplitude in the indirect dimension and the magnetization decay is recorded by a CPMG sequence in the directly detected dimension. The two-dimensional time map was inverted using a fast Laplace algorithm [2, 3] to obtain the T2–T2 exchange map. The relaxation exchange from the fast relaxing nuclei in molecules associated with pore surfaces or superficial liquid shell and the more slowly relaxing nuclei associated with molecules in the bulk liquid filling the materials pores can be observed as cross–peaks in the T2–T2 exchange maps. T2–MZ(store)–T2 2D 1H NMR spectra, recorded at high and low homogeneous magnetic fields of water and oil in sand, air bubbles in water and foams, exchange of liquid–foam and liquid–saturated vapors of chloroform, are presented. Systematic studies as a function of the mixing time were performed. Interesting and at the same time challenging results, from the interpretation point of view, are reported for a mixing time comparable to or smaller than the maximum duration of the CPMG pulse sequence. In the majority of cases only unidirectional exchanges, from low to high or from high to low relaxation times are observed. A clear bidirectional exchange was observed for water, the superficial liquid shell, and foam. The 2D Laplace inversion method of T2–T2 exchange NMR is a valuable tool to observe the motion of molecules in heterogeneous environments. Nevertheless, a quantitative interpretation of the T2–T2 exchange maps in the fast exchange limit is possible only using numerical simulations. The preliminary T2–T2 exchange NMR experiments, shows that the investigations of heterogeneous processes, like catalysis in small chemical reactors, can successfully be investigated.
References: 1. L. Monteilhet, J.-P. Korb, J. Mitchell, and P. J. McDonald, Observation of exchange of
micropore water in cement pastes by two-dimensional T2-T2 nuclear magnetic resonance relaxometry, Phys. Rev. E 74, 061404 (2006).
2. L. Venkataramanan, Y. Q. Song, M. D. Hürlimann, Solving Fredholm Integrals of the First Kind With Tensor Product Structure in 2 and 2.5 Dimensions, IEEE Trans. Sig. Process. 50, 1017-1026 (2002).
3. Y. Q. Song, L. Venkataramanan, M. D. Hürlimann, M. Flaum, P. Frulla, and C. Straley, T1-T2 Correlation Spectra Obtained Using a Fast Two-Dimensional Laplace Inversion, J. Magn. Reson., 154, 261-268, (2002).
50

Monte Carlo simulations of the two-dimensional NMR T2-T2 exchange of fluids in porous media
D. Moldovana, R. Fechetea, D. E. Demcoa,b, E. Culeaa, and B. Blümichc,
a Departments of Physics, Technical University of Cluj-Napoca, Romania
bDWI an der RWTH-Aachen, Germany c Institute of Technical and Macromolecular Chemistry, RWTH-Aachen University, Germany
Classical two-dimensional (2D) NMR T2-T2 exchange experiments with a period of
magnetization storage between the two T2 relaxation encoding periods T2–MZ(store)–T2 [1] assumes that the molecular exchange processes take place during the store period. Fast NMR experiments use the CPMG pulse sequence to stroboscopically encode the T2 relaxation time in the indirect and the directly observed dimensions. There are numerous samples, characterized by long T2 relaxation times, for which the relevant exchange time, associated with the storage period, is comparable to or less than the duration of CPMG echo train decay. In these cases, dynamic processes during the preparation and exchange periods can have a direct influence on the decoding of T2 relaxation via a second CPMG sequence. In the fast exchange limit, the simplest CPMG decay can be affected by molecular exchange. The interpretation of results in the presence of rapidly exchanging relaxation is not trivial and can be done correctly only by numerical simulation of molecular dynamics. The effect of molecular exchange processes on the one-dimensional (1D) T2 and two-dimensional (2D) NMR T2-T2 Laplace distributions [2, 3] were studied by Monte–Carlo simulations. A homogeneous static magnetic field is assumed, and no disturbing effects like the pore surface magnetic susceptibility is considered. A systematic study is conducted as a function of NMR pulse sequences parameters, transverse relaxation rates, time, and distribution of exchange rates. A system from free random walk molecules and excluded volume bulk molecules was considered. The difference in the dynamic behavior inside saturated and unsaturated pore is highlighted. Systems in dynamical equilibrium and non-equilibrium were also under investigation. The geometrical factor is studied for unidirectional flow, single pore bulk-to-surface shell exchange, and systems with connected pores. Particular molecular dynamics including exchange phenomena lead to particular features in 1D and 2D data. Matching the experimental data with simulated ones can be developed into a useful tool for the characterization of complex materials. For example the knowledge of fast exchange rate can provide a powerful means of characterizing the pore surface-to-volume ratio.
References: 1. L. Monteilhet, J.-P. Korb, J. Mitchell, and P. J. McDonald, Observation of exchange of
micropore water in cement pastes by two-dimensional T2-T2 nuclear magnetic resonance relaxometry, Phys. Rev. E 74, 061404 (2006).
2. Y. Q. Song, L. Venkataramanan, M. D. Hürlimann, M. Flaum, P. Frulla, and C. Straley, T1-T2 Correlation Spectra Obtained Using a Fast Two-Dimensional Laplace Inversion, J. Magn. Reson. 154, 261-268, (2002).
3. L. Venkataramanan, Y. Q. Song, M. D. Hürlimann, Solving Fredholm Integrals of the First Kind With Tensor Product Structure in 2 and 2.5 Dimensions, IEEE Trans. Sig. Process. 50, 1017-1026 (2002).
51
Using 2D Inverse Fourier Transformation to Observe Internal
Magnetic Fields and Internal Magnetic Field Gradients
Lauren Burcaw and Paul T. Callaghan
MacDiarmid Institute for Advanced Materials and Nanotechnology, School of Chemical and
Physical Sciences, Victoria University of Wellington, New Zealand.
Multidimensional NMR measurements, including inverse Fourier transformation (IFT), and
more recently, inverse Laplace transformation (ILT), are frequently used in separation,
correlation, and exchange experiments [1]. Often these experiments allow us to obtain
knowledge about a system that is otherwise difficult to attain with a one dimensional
experiment.
It is well known that porous media in an applied magnetic field will experience internal
magnetic field inhomogeneities due to susceptibility differences from its various components.
This was first discovered by Brown [2] using ferromagnetic grains suspended in water with
5% carboxy-methylcellulose, and expanded upon by Drain [3]who examined the broadening
of magnetic resonance lines in powdered samples. More recently, the internal field has been
studied in more depth by Audoly [4] using a finney pack of non-penetrating spheres.
We study these internal magnetic field inhomogeneities using exchange spectroscopy with
various sized soda glass bead packs in distilled water. Our experiment involves an
acquisition and evolution domain each consisting of a free induction decay so that the two
Fourier domains correspond to the spectral distribution of local fields. By performing the
exchange experiment over several different mixing times, twe obtain 2D data from which we
study the effects of changes in location of a diffusing water molecule in the presence of these
internal magnetic field, using 2D IFT. We show that exchange in the internal magnetic field
can be seen in a 2D IFT by peak broadening. This is potentially useful for studying the
internal magnetic field gradients in more complicated systems such as sandstones or other
porous media. We anticipate the extension to 2D correlation experiments involving the
Fourier domain of local field and an Inverse Laplace domain [5] of internal magnetic field
gradient.
References:
[1] P.T. Callaghan, C.H. Arns, P. Galvosas, M.W. Hunter, Y. Qiao, and K.E. Washburn,
Magn. Reson. Imaging 25, 441-444 (2007)
[2] R.J. Brown, Phys. Rev. 121, 1379-1382 (1961)
[3] L.E. Drain, Proc. Phys .Soc. 80, 1380-1382 (1962)
[4] B. Audoly, P.N. Sen, S. Ryu, and Y.-Q. Song, J. Magn. Reson. 164, 154-159 (2003)
[5] J.G. Seland, K.E. Washburn, H.W. Anthonsen, J. Krane, Phys. Rev. E., 70, 051305
(2004).
52

Two-dimensional NMR of Diffusion Systems Yi-Qiao Song, Lukasz Zielinski, and S. Ryu
Schlumberger-Doll Research, Cambridge MA 02139
2D NMR of relaxation and diffusion is a significant advance in the study of porous materials. There have been many applications of 2D NMR as a way to distinguish signals from different phases e.g. oil, water and gases, and different geometries. 2D NMR has also been used to probe water diffusion from one pore to another. The analogy to such experiments is the conventional NOESY, the 2D NMR in frequency domain. Such experiments offer the potential to probe the connectivity of pore structures and permeability of membranes.
We show that the diffusion system itself, even within a single, shows a whole range of behaviors in 2D NMR, including the appearance of off-diagonal peaks in T1-T2 experiments (see top panels in the Figure) which have been interpreted as arising from exchange. We confirm, however, that under certain circumstances, the off-diagonal peaks become significantly enhanced by diffusive coupling between pores (see bottom panels in the Figure) and could, in principle, be used as a signature of connectivity. We study these effects within the general framework of the Torrey-Bloch formulation, which becomes the diffusion equation,
, and ,
for the evolution of longitudinal magnetization. Here m is the magnetization deviation from its equilibrium, and and are the eigenfunctions and eigenvalues, respectively.
The spectroscopy of such an eigen system characterizes the pore space. In fact, with different surface relaxivity for longitudinal and transverse magnetization decays, two sets of eigenfunctions and eigenvalues are relevant, the longitudinal L-modes and the transverse T-modes. Each is a complete set of functions, mutually orthogonal within the set. The overlap between the L-modes and T-modes depends on the surface relaxivity. This overlap is critical for the variety of behavior of the 2D NMR results, including the appearance and intensity of the off-diagonal peaks. Though our present results are limited to one-dimensional coupled pores, our approach based on the Torrey-Bloch equation allows numerical simulations of 2D NMR for arbitrary 3D pore geometry.
Single pore, T1-T2 and T2-T2 experiments
Two coupled pores T1-T2 experiments, from strongest coupling (left panel) to weakest (right panel)
53

Spatially Resolved Two-Dimensional T2-D MRI in Porous Media
L. Li,a O. Petrov,a B. Balcoma
aMRI Centre, Department of Physics, University of New Brunswick
Discrimination of water and oil in petroleum reservoir exploration is a critical measurement for down-hole NMR. The most robust and successful measurements have been developed by Schlumberger and feature a 2D inverse Laplace transform to resolve the T2 distribution, which largely depends on the pore structure and pore size distribution, from the diffusion coefficient distribution which largely depends on molecular mobility. Neither suffices in isolation to fully characterize the fluids or the medium.
In our laboratory studies of fluids in porous media, frequently reservoir core plugs, we seek a similar ability to characterize the fluids and matrix - but spatially resolved. Spatial resolution is critical for heterogeneous samples and for examination of processes that introduce a heterogeneous fluid distribution – such as core flooding.
In this work we explore a new version of the stimulated echo PFG T2-diffusion experiment. Diffusive attenuation is modified by changing the PFG gradient amplitudes, not the stimulated echo evolution time. We add pure phase encode spatial encoding gradients in linear combination with the PFG diffusion gradients for spatial resolution of the experiment.
This simple modification of the experiment is remarkably successful, and robust, yet seems not previously to have been reported in the literature. We limit spatial resolution in core plug samples to 1 dimension in order to ensure reasonable acquisition times for the overall experiment.
Fig. 1: Single pixel T2-Diffusion spectrum from a one dimensional phantom. Inverse Laplace transformation was undertaken with Magritek software.
We ensure short echo times and accurate gradient switching through the use of a magnetic field gradient measurement and adjustment method outlined in a separate abstract.
References: 1. M. Hürlimann and L. Venkataramanan, J. Magn. Reson., 157, 2002, 31-42.
Fitting value: T2 = 91 ms Bulk measurement, T2 = 95 ms
Fitting value: D= 1.71E-009 m2/s Bulk value: D= 1.9E-009 m2/s
54
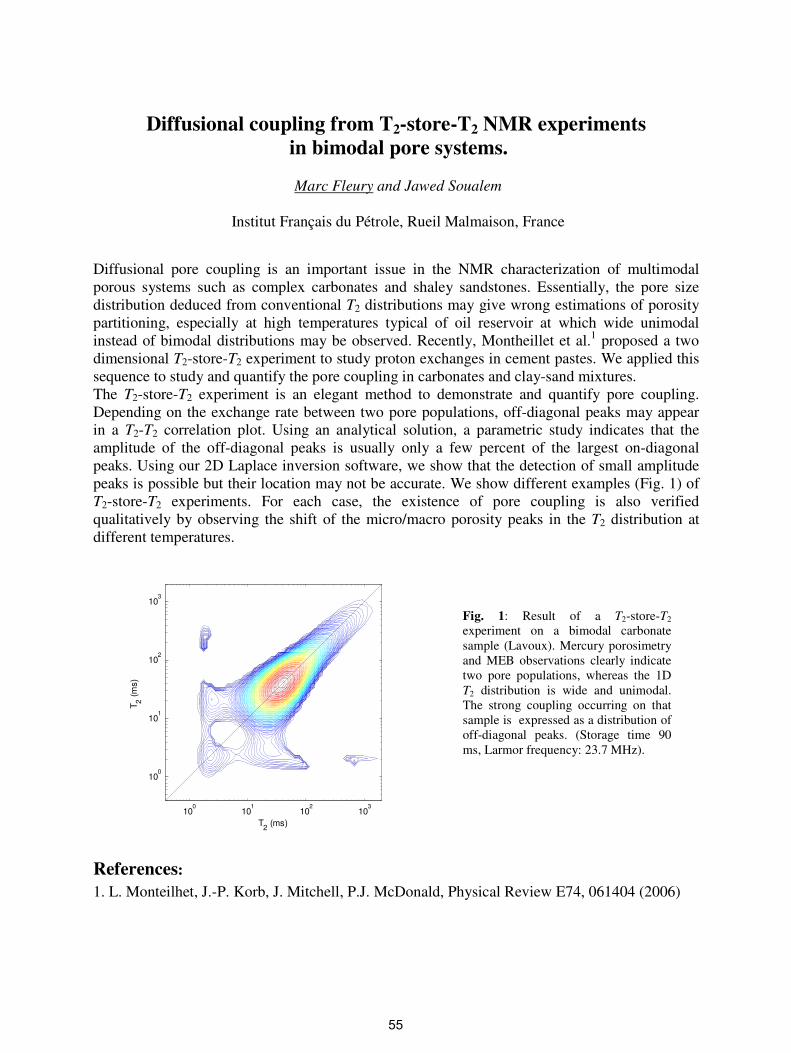
Diffusional coupling from T2-store-T2 NMR experiments in bimodal pore systems.
Marc Fleury and Jawed Soualem
Institut Français du Pétrole, Rueil Malmaison, France
Diffusional pore coupling is an important issue in the NMR characterization of multimodal porous systems such as complex carbonates and shaley sandstones. Essentially, the pore size distribution deduced from conventional T2 distributions may give wrong estimations of porosity partitioning, especially at high temperatures typical of oil reservoir at which wide unimodal instead of bimodal distributions may be observed. Recently, Montheillet et al.1 proposed a two dimensional T2-store-T2 experiment to study proton exchanges in cement pastes. We applied this sequence to study and quantify the pore coupling in carbonates and clay-sand mixtures. The T2-store-T2 experiment is an elegant method to demonstrate and quantify pore coupling. Depending on the exchange rate between two pore populations, off-diagonal peaks may appear in a T2-T2 correlation plot. Using an analytical solution, a parametric study indicates that the amplitude of the off-diagonal peaks is usually only a few percent of the largest on-diagonal peaks. Using our 2D Laplace inversion software, we show that the detection of small amplitude peaks is possible but their location may not be accurate. We show different examples (Fig. 1) of T2-store-T2 experiments. For each case, the existence of pore coupling is also verified qualitatively by observing the shift of the micro/macro porosity peaks in the T2 distribution at different temperatures.
T2 (ms)
T 2 (ms)
100
101
102
103
100
101
102
103
Fig. 1: Result of a T2-store-T2 experiment on a bimodal carbonate sample (Lavoux). Mercury porosimetry and MEB observations clearly indicate two pore populations, whereas the 1D T2 distribution is wide and unimodal. The strong coupling occurring on that sample is expressed as a distribution of off-diagonal peaks. (Storage time 90 ms, Larmor frequency: 23.7 MHz).
References: 1. L. Monteilhet, J.-P. Korb, J. Mitchell, P.J. McDonald, Physical Review E74, 061404 (2006)
55

Method and Experimental Study of 2-D NMR Logging
Guangzhi LIAO, Lizhi XIAO, Ranhong XIE, Shaoqing FU, Huijun Yu
State Key Laboratory of Petroleum Resources and Prospecting, China University of Petroleum, Beijing, 102249
Abstract As the signal of reservoir fluids, such as oil, gas and water, always overlap in the T2
distribution of nuclear magnetic resonance (NMR). It is difficult to identify fluid types effectively
by 1-D NMR logging. Considering the characteristic of transverse relaxation (T2), longitudinal
relaxation (T1), diffusion coefficient (D) synthetically, we can perform the measurement of
two-dimension NMR (2D-NMR), which has provided the foundation for qualitative identifying
and quantitative evaluation of the reservoir-fluids. Three methods of 2D-NMR logging were
proposed and several forward models were designed accordingly. And 2D information of (T2, D),
(T2, G) and (T2, T1) was acquired by measuring multiple CPMG pulse sequence with variable
echo spacing (TE) and waiting times (TW) respectively. Then we had got the 2D proton density
distribution through multi-exponential inversion method. At last, in order to prove the measuring
and data processing methods, the experiments of 2D-NMR with some man-made rocks and natural
core samples are performed. It had identified fluid types clearly, calculated fluid-saturation exactly,
and detected the distribution of internal field gradients of core samples which contain
paramagnetic minerals.
Keywords 2D-NMR logging, Transverse-Relaxation, Longitudinal-Relaxation,
Diffusion-Coefficient, Gradient Fields
56
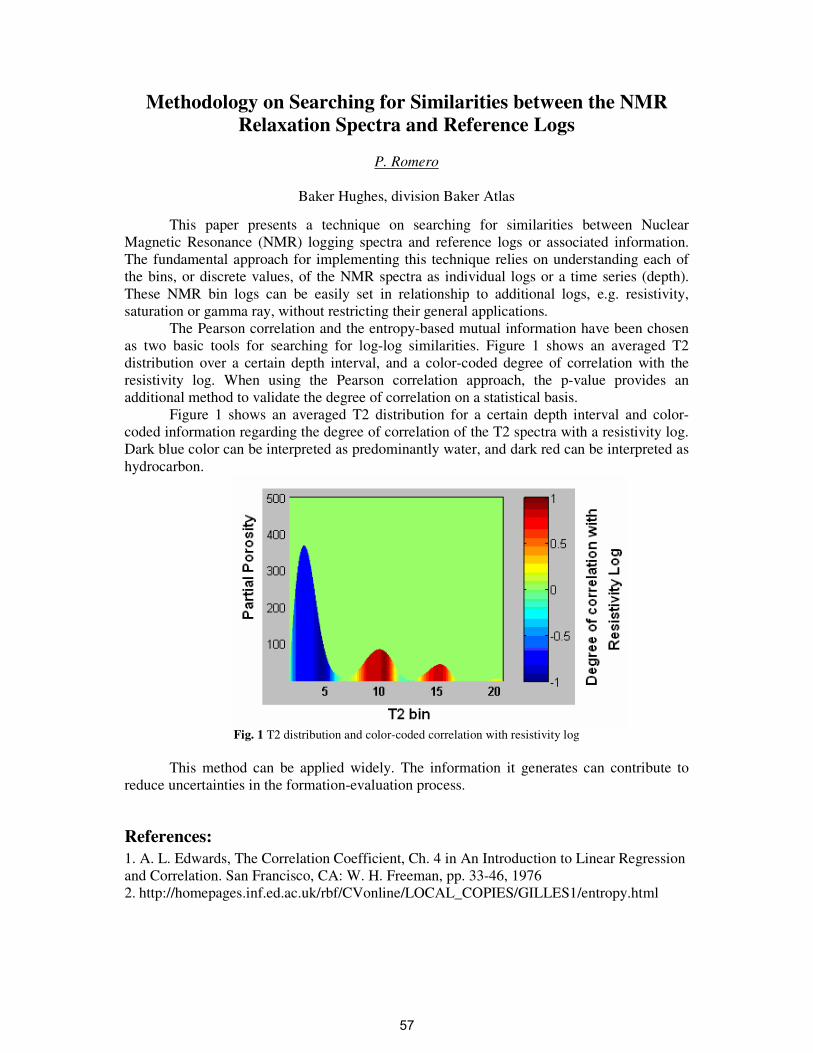
Methodology on Searching for Similarities between the NMR
Relaxation Spectra and Reference Logs
P. Romero
Baker Hughes, division Baker Atlas
This paper presents a technique on searching for similarities between Nuclear
Magnetic Resonance (NMR) logging spectra and reference logs or associated information.
The fundamental approach for implementing this technique relies on understanding each of
the bins, or discrete values, of the NMR spectra as individual logs or a time series (depth).
These NMR bin logs can be easily set in relationship to additional logs, e.g. resistivity,
saturation or gamma ray, without restricting their general applications.
The Pearson correlation and the entropy-based mutual information have been chosen
as two basic tools for searching for log-log similarities. Figure 1 shows an averaged T2
distribution over a certain depth interval, and a color-coded degree of correlation with the
resistivity log. When using the Pearson correlation approach, the p-value provides an
additional method to validate the degree of correlation on a statistical basis.
Figure 1 shows an averaged T2 distribution for a certain depth interval and color-
coded information regarding the degree of correlation of the T2 spectra with a resistivity log.
Dark blue color can be interpreted as predominantly water, and dark red can be interpreted as
hydrocarbon.
Fig. 1 T2 distribution and color-coded correlation with resistivity log
This method can be applied widely. The information it generates can contribute to
reduce uncertainties in the formation-evaluation process.
References:
1. A. L. Edwards, The Correlation Coefficient, Ch. 4 in An Introduction to Linear Regression
and Correlation. San Francisco, CA: W. H. Freeman, pp. 33-46, 1976
2. http://homepages.inf.ed.ac.uk/rbf/CVonline/LOCAL_COPIES/GILLES1/entropy.html
57

On the use of two dimensional inverse Laplace routines on NMR data
Geir Humborstad Sørlanda, Åsmund Ukkelbergb, Hege C. Widerøec
aAnvendt Teknologi AS, Norway, bUniversity of Oslo, Norway, cStatoilHydro Research Centre, Norway Keywords. Inverse Laplace, relaxation, diffusion, porous media When applied to NMR data arising from relaxation time and diffusion experiments, either in combination (two dimensional) or as single experiments, the use of Inverse Laplace routines has become a crucial tool in NMR data analysis.
After working with numerous rock core plugs at different saturation states over a period of five years we have concluded that it is impossible to draw good conclusions from the NMR data when applying well known algorithm which estimates continuous distributions of the inverse Laplace transform. A typical problem with the routines currently in use, is the fundamental error that is produced when defining the grid as an input to the numerical routines. As the responses from any fluid confined a porous rock may locate peaks off from the grid points, the resulting distributions will be wrong. In particular we have found that the current routines fail to fit the estimates of the total NMR signal. One may of course adjust the grid so that one achieves as good a fit as possible, but that relies on the brave assumption that any multimodal distribution may be fitted to that set of grid points. In practical life this is the exception not the rule, i.e. it is not possible to fit all peaks to the grid points available once having defined the grid. The underlying problem is that estimating an inverse Laplace transform with continuous distributions is an attempt at forcing too much information out of experimental data. When using the ANAHESS algorithm, the situation is different. No grid is defined, and the numerical routine fits the NMR data to the peak values that yield the best fit. When comparing the residuals from the two routines we find the ANAHESS overwhelmingly superior.
PDF laget med uregistrert versjon av pdfFactory www.westsoft.no
58

A Fast Monte Carlo Sampler for NMR T2 Inversion
M. Prange
Schlumberger-Doll Research
The inversion of noisy NMR T2 echo data a T2 spectrum is widely recognized as an
inherently non-unique process [1]. One approach to quantifying this uncertainty is to use
Monte Carlo sampling. Measurement noise is well described by an uncorrelated normal
distribution. When combined with the non-negativity constraint on T2 spectral values, this leads to spectral values following a non-negative normal distribution. There are published
samplers for truncated normal distributions [2], of which non-negative normal samples are a
subset, but I show that these converge very slowly for the highly ill-conditioned covariance
matrices that are present in NMR T2 spectral inversion. The reason for this is that they are based on Gibbs’ samplers that update the spectral estimate just one T2 component at a time.
When all of the spectral elements are fixed but one, that one has little room for change
without violating the noise constraints on the data. This means that each spectral sample can
only be slightly different from the preceding sample, indicating a high degree of statistical correlation and thus slow convergence. I resolve this by simultaneously updating two
neighboring spectral components at a time, allowing changes due to one spectral component
to be offset by changes in its neighbor. Core to this improvement is a fast 2D sampler for
non-negative normal distributions. I demonstrate that this improves convergence by more than two orders of magnitude. Such speedup allows routine Monte Carlo inversion of 1D
NMR spectra, and opens the door for the inversion of 2D NMR spectra.
References:
1. R. Parker, Y-Q Song, Assigning uncertainties in the inversion of NMR relaxation data, J. Mag. Res. 174 (2005) 314-324.
2. G. Rodriguez-Yam et al., Efficient Gibbs sampling of truncated multivariate normal
with application to constrained linear regression, Technical Report, Colorado State
University (2004).
59

Signal Optimization in Inhomogeneous Fields: Application of
Optimal Control Theory to NMR Oil-Well Logging
T. Bornemana, D. Cory
a, M. Hürlimann
b
aDepartment of Nuclear Science and Engineering, Massachusetts Institute of Technology
bSchlumberger-Doll Research
Nuclear Magnetic Resonance (NMR) techniques are especially useful in well logging to
characterize hydrocarbon bearing geological formations surrounding a bore hole. The Carr-
Purcell-Meiboom-Gill (CPMG) sequence forms a key element is all measurements that
determine the relaxation and diffusion properties (see Ref. 1). Our ability to accurately perform
these measurements, however, is severely limited by environmental constraints. The necessity of
designing a magnetic resonance tool to be placed inside a drilled well leads to gross in-
homogeneity of the applied static and RF fields. Being a resonance phenomenon, NMR requires
the Larmor precession frequencies of nuclear spins in a static field to be close to the frequency of
the applied RF field. Field in-homogeneity leads to a spatial variation of Larmor frequencies and
the effective RF field strength a spin experiences. Thus, the obtainable signal is limited by the
number of spins excited and refocused uniformly by the pulses in the CPMG sequence. We
demonstrate the use of Optimal Control Theory (OCT) techniques to design complex amplitude
and frequency modulated pulses that extend the effective bandwidth of uniform control to a
range well beyond that achievable via conventional ‘hard’ pulse techniques. OCT techniques
have previously been used in the design of NMR pulses, (see e.g. ref. 2), but this is the first time
that it has been used to the study of Carr-Purcell dynamics in inhomogeneous fields. We find that
these advanced techniques allow us to maximize the signal over a significantly wider dispersion
of Larmor frequencies. Compared to standard hard pulses, the excitation/refocusing bandwidth
for OCT pulses can be increased at least four-fold. The pulses also have the convenient property
that they are phase-distortionless. They can therefore be directly substituted into any sequence to
enhance performance without further need for modification, making the pulses appropriate for a
wealth of applications beyond what we have considered in this study. Additionally, analysis of
the asymptotic echo amplitude and phase created by directly substituting our pulses into the
Carr-Purcell sequence demonstrates stability in the absence of T2-relaxation and diffusion
consistent with the Meiboom-Gill correction. This indicates that the CPMG sequence using
directly substituted OCT pulses will significantly enhance the signal-to-noise ratio of diffusion
and relaxation measurements in oil-well logging.
References: 1. M. D. Hürlimann and D. D. Griffin, Spin Dynamics of Carr-Purcell-Meiboom-Gill-like
Sequences in Grossly Inhomogeneous B0 and B1 Fields and Application to NMR Well
Logging, J. Magn. Res. 143 (2000) 120-135.
2. T. E. Skinner, et al. Application of optimal control theory to the design of broadband
excitation pulses for high-resolution NMR, J. Magn. Res. 163 (2003) 8-15.
60

Split-180o Sequences
D. E. Freed a, U. M Scheven
b, and M. D. Hürlimann
a
aSchlumberger-Doll Research,
bDepartment of Chemistry, FCT-Unversidade Nova de Lisboa
In applications of NMR in inhomogeneous fields, sequences based on the Carr-
Purcell-Meiboom-Gill (CPMG) sequence play a central role. The standard CPMG sequence
consists of an initial 90o excitation pulse, followed by a long string of 180
o refocusing pulses.
This creates a series of echoes that decay with a characteristic relaxation time T2eff.
Here we present a modified sequence, the so-called Split-180o sequence that
specifically takes advantage of grossly inhomogeneous fields. In its simplest implementation,
the 180o refocusing pulse of the CPMG sequence is split into two separate pulses. This
sequence, which can be viewed as a modification of the CPMG sequence, simultaneously
generates two types of signal that can be separately detected. One is a CPMG-like signal that
decays with the expected relaxation time T2eff. In addition, a second type of signal builds up
and approaches a steady-state. The amplitude of this dynamic equilibrium depends on the
ratio of the longitudinal to the transverse relaxation times, T1/T2.
We present experimental results and a new theory that describes both signals in a
unified manner.
Fig. 1: Experimental results of the split-180o sequence on a
sample of doped water with a relaxation time T1 = T2 of 100
ms. The left panel shows the amplitudes of the CPMG-like
signal that decay towards zero with T2, whereas the right panel
displays the amplitudes of the dynamic equilibrium signal that
rise towards a constant amplitude.
Fig. 2. Echo shape of the CPMG-like signal (left) and the
dynamic equilibrium signal (right). The CPMG-like and the
dynamic equilibrium signals form out of phase to each other.
61

Measurements of diffusion, T1 and T2 in one-shot by MMME
X.-H.Rena, H. Cho
b, and Y. -Q.Song
c,
a Schlumberger Reservoir Completions, Rosharon, TX 77583
b Memorial Sloan-Kettering Cancer Center, New York, NY 10065
c Schlumberger-Doll Research, Cambridge, MA 02139
In the presence of a constant gradient field, a sequence of n hard RF pulses will allow
multiple coherence pathways (q) to produce multiple signals. This class of sequences is called
multiple modulation multiple echoes (MMME)[1-4]. Different q creates different spatial
phase modulation and yields echo signal at different time. Consequently, in one scan of the
sequence, different modulations can be acquired. By setting the time period appropriately, the
4-pulse MMME sequence can give well separated 13 echoes for acquisition. The
magnetization of each echo coherence pathway (i.e. each echo q) is a product of three factors:
the RF pulses ( ), the diffusion (D), and the relaxations (T1, T2). It can be written as:
=2
2
1
1
0exp)exp()(
T
c
T
cDbfMM
qqq,
where M0 is the initial total magnetization, the coherence pathway q. The symbols
21, qqq ccb are sequence dependent diffusion, T1, and T2 weighting factors, respectively.
In practice, for two measurements with same RF flip angles, but different time delays, the
ratio of the corresponding echo magnitudes will eliminate fq( ). The amplitude ratios S1/S2
and weighting factors of the corresponding 13 echoes give sufficient data to uniquely
determine D, T1 and T2 simultaneously.
Different echo spacing and gradient strength will result in different diffusion and
relaxation weightings for each coherence pathway, thus offer a mechanism for optimization.
For the sequence with the optimized parameters, synthetic data were generated by giving a
random error of 3% on each echo signal, and the standard deviation of T1, T2 and D were
calculated for different T1, T2 in the range of 20 - 2000 ms (T1 T2) with a constant D value.
It can be seen, that using giving sequences, the error propagators in D, T1 and T2 are
controlled within 10% (Fig.1). Experimentally, the MMME obtained values showed a good
agreement with those from standard Pulsed Filed Gradient (PFG), Inversion Recovery (IR),
and CPMG measurements.
Fig. 1: Calculated standard deviation of D, T1, T2 for optimized MMME sequences with a random
error of 3% on each echo signal.
References:
1 Y. -Q. Song and X. Tang., J. Magn. Reson. 170 (2004) 136.
2 Y. -Q.Song et al., J. Magn. Reson. 172 (2005) 31.
3 H. Cho, L. Chavez, E.E.Sigmund, D.P.Madio, Y.-Q.Song, J. Magn. Reson. 180 (2006) 18.
4 H. Cho, X.-H.Ren, E.E.Sigmund, Y.-Q.Song, J. Chem. Phys. 126 (2007) 154501
62

Double-PFG Diffusion-Diffraction in Ellipsoidal Pores
E. Özarslana, C. G. Koay
a, P. J. Basser
a
aSection on Tissue Biophysics and Biomimetics, NICHD, NIH.
Repeated application of diffusion gradient pulse pairs [1] in a pulsed field gradient
(PFG) experiment provides important insights into pore microstructure. For example, the dimensions and eccentricity of yeast cells were measured from the fourth order term of the double-PFG signal attenuation when the mixing time between the two encoding blocks is long [2]. In this abstract, we propose an alternative double-PFG technique to address the same problem, which exploits the diffusion-diffraction phenomenon [3] in double-PFG experiments [4]. In our approach, all diffusion gradients in a single acquisition are applied along the same direction with a mixing time of 0. The experiment is subsequently repeated with diffusion gradients applied along different directions.
Fig. 1: The double-PFG pulse sequence considered in this work. The duration of the diffusion gradients (δ) are assumed to be very short. q=γδG/2π, where γ is the gyromagnetic ratio and G is the gradient strength. The separation between subsequent pulses (Δ) is assumed to be long enough so that a spin can probe the largest dimension within the pore.
As demonstrated in [4], the expected signal for this pulse sequence is given by ( ) ( )∗qq 2~~ 2 ρρ , where ( )qρ~ is the Fourier transform of the pore shape function. This
expression for the NMR signal attenuation leads to two interesting observations: (i) the first signal minimum occurs at exactly half the q-value necessary to observe nonmonotonicity in a single-PFG experiment; (ii) the diffraction minima are replaced by zero-crossings making the diffraction pattern robust to the heterogeneity of the specimen. We calculated the NMR signal attenuation from ellipsoidal pores with different eccentricities using the expressions in [5].
=00
=900
=600
=900
Fig. 2: The continuous and the dashed portions of each curve correspond to the positive and negative signal values, respectively. Black and red curves are computed for coherently oriented, axially symmetric ellipsoids whose ratio of major to minor axes was 4. The black curve is expected when the gradients are applied along the major axis, whereas the red curve is expected when the gradients are in the transverse plane. The blue curve shows the signal from ellipsoids whose axes are uniformly distributed over a spherical cap between the polar angles θ=00 and θ=600. The green curve is predicted forisotropically distributed pores.
The proposed method makes it possible to observe diffusion-diffraction phenomenon in anisotropic pores even when the pore orientations are randomly distributed. The first zero-crossings of the diffraction patterns with gradients applied along different directions can be used to quantify the compartment size as well as the pore shape anisotropy using double-PFG acquisitions with 0 mixing times, hence mitigating the effect of relaxation-related signal loss.
References:
1. D. G. Cory, A. N. Garroway and J. B. Miller, Polym. Preprints. 31 (1990) 149. 2. Y. Cheng and D. G. Cory, J. Am. Chem. Soc. 121 (1999) 7935. 3. P. T. Callaghan, A. Coy, D. MacGowan, et al., Nature 351(1991) 467. 4. E. Özarslan and P.J. Basser, J. Magn. Reson. 188 (2007) 285. 5. C. G. Koay, J. E. Sarlls and E. Özarslan, Magn. Reson. Med. 58 (2007) 430. This research was supported by the intramural research program of NICHD.
63

Accurate RTOP Estimation from PFG-NMR Signal
E. Özarslana, C. G. Koay
a, P. J. Basser
a
aSection on Tissue Biophysics and Biomimetics, NICHD, NIH.
The return to the origin probability (RTOP) for diffusing molecules is a valuable
indicator of porous media microstructure [1-2]. For example, in isolated pores with non-
relaxing walls, the pore volume is related to the RTOP at long diffusion times. Similarly, in
disordered media, the temporal scaling of the RTOP is necessary in the estimation of the
fractal dimension of the medium [3]. However, the RTOP is related to the pulsed field
gradient (PFG) NMR signal via an integration over the entire q-space. The unavailibility of
data at large wavevectors is a serious problem particularly in restricted domains where the
NMR signal does not attenuate significantly even at relatively large wavenumbers.
In principle, the extrapolation of the signal values can be performed by model fitting
to data. However, very different signal profiles are possible depending on the particular
specimen under examination whose structure is not known a priori. Another alternative is the
cumulant expansion, which may fail to converge to the true signal attenuation. Fig. 1a shows
the failure of both the cumulant expansion and sometimes used biexponential fitting in
describing the theoretical signal attenuation from rectangular pores at long diffusion times.
In this work, we propose to represent the PFG-NMR signal in terms of a complete set
of Hermite functions. The basis possesses many interesting properties relevant to q-space
NMR, such as the ability to represent both the signal and its Fourier transform. Unlike the
previously employed methods, this approach is linear and capable of reproducing
complicated signal profiles, e.g., those exhibiting diffraction peaks. The estimation of the
coefficients is fast and accurate while the representation lends itself to a direct reconstruction
of ensemble average propagators as well as calculation of useful descriptors of it, such as the
RTOP and its moments.
extrapolationregion
10 orderth
30 orderth
60 orderth
Fig. 2: PFG-NMR signal attenuation curves from rectangular pores at long diffusion times. (a) Cumulant
expansion of and biexponential fit to simulated data. (b) The performance of the proposed approach with the
same data. (c) Propagator reconstructed from the basis functions whose value at x=0 is the RTOP.
We performed simulations to assess the performance of the RTOP estimations for
one-, two- and three-dimensional, isotropic, restricted media as well as mono- and bi-
exponential decays and even the presence of flow was considered. RTOP values in 1-, 2- and
3- dimensions all yielded very accurate results (<6% error in restricted geometries, <1% in
others). The proposed approach is expected to improve the accuracy of RTOP estimates and
parameters deduced from it.
References:
1. M. D. Hürlimann, L. M. Schwartz, P. N. Sen, Phys. Rev. B. 51 (1995) 14936.
2. L. M. Schwartz, M. D. Hürlimann, K. Dunn, et al., Phys. Rev. E. 55 (1997) 4225.
3. E. Özarslan, P. J. Basser, T. M. Shepherd et al., J. Magn. Reson. 188 (2007) 285.
This research was supported by the intramural research program of NICHD.
64
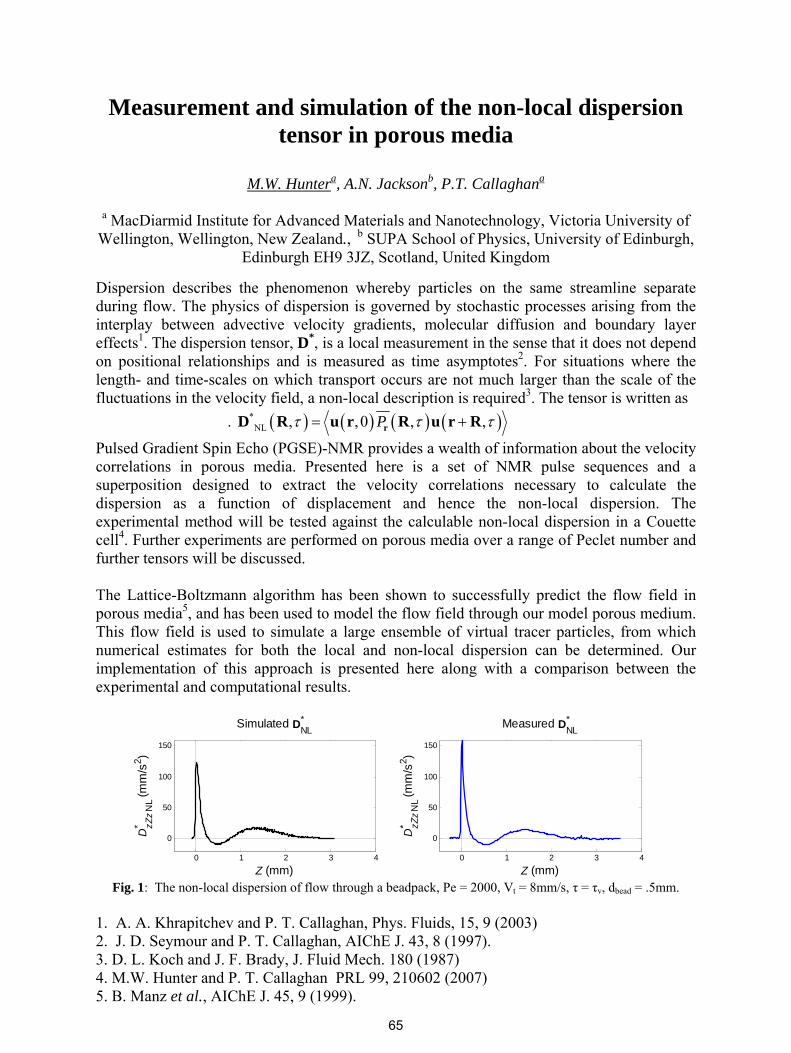
Measurement and simulation of the non-local dispersion
tensor in porous media
M.W. Huntera, A.N. Jackson
b, P.T. Callaghan
a
a MacDiarmid Institute for Advanced Materials and Nanotechnology, Victoria University of
Wellington, Wellington, New Zealand., b SUPA School of Physics, University of Edinburgh, Edinburgh EH9 3JZ, Scotland, United Kingdom
Dispersion describes the phenomenon whereby particles on the same streamline separate during flow. The physics of dispersion is governed by stochastic processes arising from the interplay between advective velocity gradients, molecular diffusion and boundary layer effects1. The dispersion tensor, D*, is a local measurement in the sense that it does not depend on positional relationships and is measured as time asymptotes2. For situations where the length- and time-scales on which transport occurs are not much larger than the scale of the fluctuations in the velocity field, a non-local description is required3. The tensor is written as
. ( ) ( ) ( ) ( )*NL , ,0 ,P ,τ τ τ= +rD R u r R u r R
Pulsed Gradient Spin Echo (PGSE)-NMR provides a wealth of information about the velocity correlations in porous media. Presented here is a set of NMR pulse sequences and a superposition designed to extract the velocity correlations necessary to calculate the dispersion as a function of displacement and hence the non-local dispersion. The experimental method will be tested against the calculable non-local dispersion in a Couette cell4. Further experiments are performed on porous media over a range of Peclet number and further tensors will be discussed. The Lattice-Boltzmann algorithm has been shown to successfully predict the flow field in porous media5, and has been used to model the flow field through our model porous medium. This flow field is used to simulate a large ensemble of virtual tracer particles, from which numerical estimates for both the local and non-local dispersion can be determined. Our implementation of this approach is presented here along with a comparison between the experimental and computational results.
0 1 2 3 4
0
50
100
150
Simulated D*
NL
Z (mm)
D* zZ
z NL (
mm
/s2)
0 1 2 3 4
0
50
100
150
Measured D*
NL
Z (mm)
D* zZ
z NL (
mm
/s2)
Fig. 1: The non-local dispersion of flow through a beadpack, Pe = 2000, Vt = 8mm/s, τ = τv, dbead = .5mm.
1. A. A. Khrapitchev and P. T. Callaghan, Phys. Fluids, 15, 9 (2003) 2. J. D. Seymour and P. T. Callaghan, AIChE J. 43, 8 (1997). 3. D. L. Koch and J. F. Brady, J. Fluid Mech. 180 (1987) 4. M.W. Hunter and P. T. Callaghan PRL 99, 210602 (2007) 5. B. Manz et al., AIChE J. 45, 9 (1999).
65

Restricted self-diffusion in pure water measured by NMR
J. Stepišnika,b, I. Seršab, A. Mohoriča
aUniversity of Ljubljana, FMF, Physics Dept., bInstitute J. Stefan, Ljubljana Slovenia
The current thinking, influenced greatly by molecular modeling simulations1, is that on a very short pico-second time scale, water is more like a "gel" consisting of a single, huge hydrogen-bonded cluster. Rotations and other thermal motions cause individual hydrogen bonds to break and re-form in new configurations, inducing ever-changing local discontinuities whose extent and influence depends on the temperature and pressure. Over very small volumes, localized (H2O)n polymeric clusters may have a fleeting existence, and many theoretical calculations have been made showing that some combinations are stable enough to prolong their lifetimes. But it is considered that they does not remain intact long enough to be observed in ordinary bulk water at normal pressures.
Fig. 1: Molecular velocity autocorrelation spectra of pure water at different temperatures as measured by modulated gradient spin echo method. The constant spectrum value of non polar ethanol emphasizes the role of hydrogen bonding at the diffusion of water molecules
Thus, the measurements of the pure water self-diffusion by a new modulated gradient
spin echo method2 came as surprise giving the frequency dependence of the water velocity autocorrelation spectrum. The spectrum decrease in the low frequency range with almost linear dependence on ( )νD versus
ν1 plot resembles the restricted molecular motion.
Constant spectrum value of nonpolar ethanol in the low frequency range, as shown in Fig. 1., gives an indication about the water diffusion constrained by the hydrogen bond interaction.
.
References:
1. B. Chen, I. Ivanov, M.L. Klein, M. Parrinello, Hydrogen Bonding in Water, Phys. Rev, Letters 91.215503 (2003).
2. J. Stepišnik, S. Lasič, A. Mohorič, I. Serša, A. Sepe. Spectral characterization of diffusion in porous media by the modulated gradient spin echo with CPMG sequence. J. Magn. Reson., 182, 195-199 (2006)6.
66

0
3
6
9
12
15
0 15 30 45 60 75 90angle between fibers and B0 [°]
∆R
2 [
1/s
]
glass fiber
Dyneema
Nylon
0
0.1
0.2
0.3
0.4
0.5
0.6
0 0.2 0.4 0.6 0.8Fiber Density (FD)
fracti
on
al
an
iso
tro
py
(F
A)
.
simulation glass fibersimulation Dyneemasimulation Nylonglass fiberDyneemaNylon
0
1
2
3
4
5
6
7
8
0 0.2 0.4 0.6 0.8Fiber Density (FD)
R2
[s]
glass fiber
Dyneema
Nylon
Fig. 1: Fiber phantom: longitudinal
view (a) ,transversal view (b), fiber
tracking results (c), color-encoded
FA-map (d).
a
c d
b
Design of anisotropic fiber phantoms for the validation of diffusion
weighted magnetic resonance imaging
E.Fieremansa, Y.De Deene
a,b, S.Baete
a,b, I.Lemahieu
a
aMEDISIP, Ghent University-IBBT-IBiTech,
bQMRI, Ghent University Hospital, Belgium.
A gold standard for the validation of diffusion weighted
magnetic resonance imaging (DW-MRI) is essential for clinical
purposes but still not available. Anisotropic diffusion fiber
phantoms (Fig. 1) have been proposed recently for this purpose
[1]. A crucial question is how the different material properties
and size of the fiber phantoms influence the outcome of the DW-
MRI experiment.
Three potential fiber materials for constructing fiber phantom
were studied: Dyneema (∅ 16 µm), Nylon (∅ 64 µm) and glass
fiber (∅ 7 µm). Besides the fractional ansitropy (FA), the T2-
relaxation time and proton density of the fiber phantoms were
evaluated since they define the signal-to-noise ratio (SNR).
The fiber phantoms can be considered as two dimensional porous media with a matrix consisting
of parallel randomly packed cylinders and the theory for diffusion [2] and R2-relaxation [3] in
porous media was used as a model. In addition, the diffusion inside the fiber phantoms and the
effect of surface relaxation has been simulated using Monte Carlo simulations of random walk
and verified against experimental FA and R2-values. The fiber density and fiber diameter turned
out to be the major factors determining the FA (Fig. 2), while for the R2, the surface relaxation
(Fig. 3) and the magnetic susceptibility of the fiber (Fig. 4) are the most determinant. The most
appropriate fiber phantoms for the quantitative validation of DW-MRI are densely packed fiber
phantoms made from a hydrophobic material with a magnetic susceptibility close to water.
References:
1. E. Fieremans et Al., J. Magn. Reson. 190(2008) 189.
2. P.P. Mitra et Al., Phys. Rev. B Cond.Matt. 47(1993) 8565.
3. W.F. Slijkerman and J.P Hofman, Mag. Reson. Imag. 16 (1998) 541.
Fig. 2: Comparison between the
measured and simulated FA-values.
FA increases with increasing fiber
density and decreasing diameter.
Glass fiber and Dyneema have the
highest FA.
Fig. 3: R2 rates depend differently
on the fiber density due to the
different fiber surface relaxivities.
Dyneema has the lowest surface
relaxation (0.13 µm/s).
Fig. 4: The increase in R2 when
changing the angle between the
fibers and B0 depends on the
susceptibility of each fiber
materials. Nylon has the closest
susceptibility to water.
67
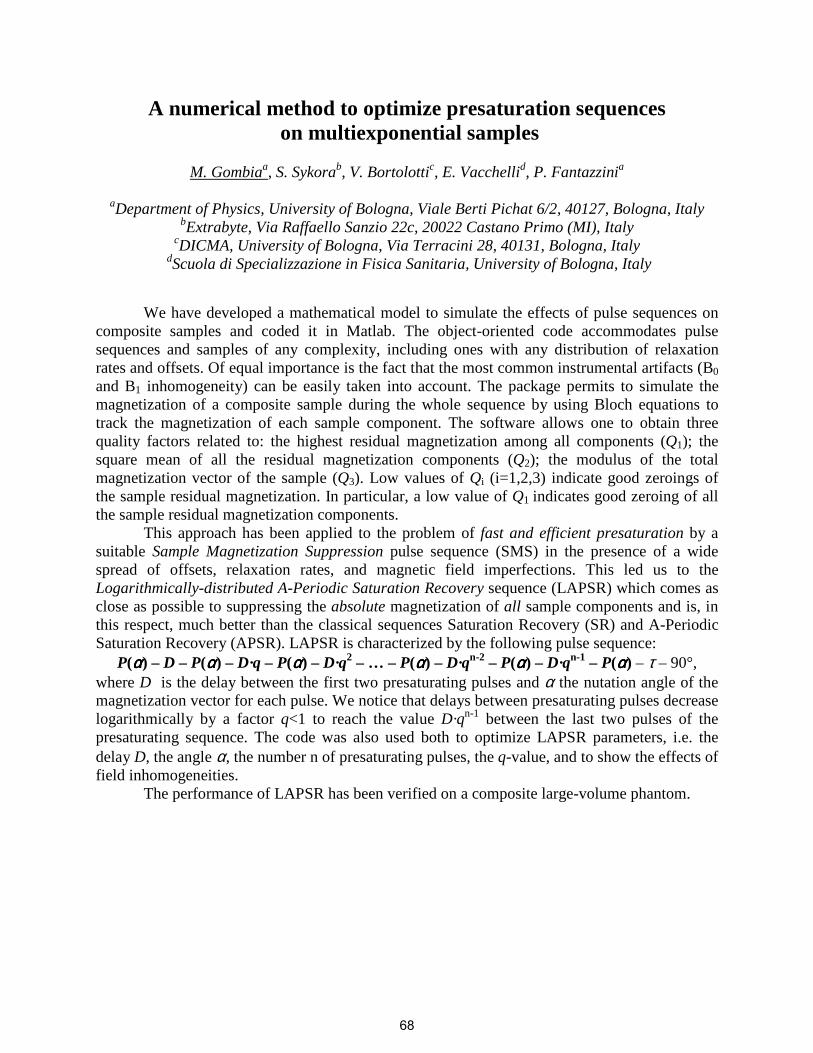
A numerical method to optimize presaturation sequences on multiexponential samples
M. Gombiaa, S. Sykorab, V. Bortolottic, E. Vacchellid, P. Fantazzinia
aDepartment of Physics, University of Bologna, Viale Berti Pichat 6/2, 40127, Bologna, Italy
bExtrabyte, Via Raffaello Sanzio 22c, 20022 Castano Primo (MI), Italy cDICMA, University of Bologna, Via Terracini 28, 40131, Bologna, Italy
dScuola di Specializzazione in Fisica Sanitaria, University of Bologna, Italy
We have developed a mathematical model to simulate the effects of pulse sequences on composite samples and coded it in Matlab. The object-oriented code accommodates pulse sequences and samples of any complexity, including ones with any distribution of relaxation rates and offsets. Of equal importance is the fact that the most common instrumental artifacts (B0 and B1 inhomogeneity) can be easily taken into account. The package permits to simulate the magnetization of a composite sample during the whole sequence by using Bloch equations to track the magnetization of each sample component. The software allows one to obtain three quality factors related to: the highest residual magnetization among all components (Q1); the square mean of all the residual magnetization components (Q2); the modulus of the total magnetization vector of the sample (Q3). Low values of Qi (i=1,2,3) indicate good zeroings of the sample residual magnetization. In particular, a low value of Q1 indicates good zeroing of all the sample residual magnetization components.
This approach has been applied to the problem of fast and efficient presaturation by a suitable Sample Magnetization Suppression pulse sequence (SMS) in the presence of a wide spread of offsets, relaxation rates, and magnetic field imperfections. This led us to the Logarithmically-distributed A-Periodic Saturation Recovery sequence (LAPSR) which comes as close as possible to suppressing the absolute magnetization of all sample components and is, in this respect, much better than the classical sequences Saturation Recovery (SR) and A-Periodic Saturation Recovery (APSR). LAPSR is characterized by the following pulse sequence:
P(αααα) – D – P(αααα) – D·q – P(αααα) – D·q2 – … – P(αααα) – D·qn-2 – P(αααα) – D·qn-1 – P(αααα) – τ – 90°, where D is the delay between the first two presaturating pulses and α the nutation angle of the magnetization vector for each pulse. We notice that delays between presaturating pulses decrease logarithmically by a factor q<1 to reach the value D·qn-1 between the last two pulses of the presaturating sequence. The code was also used both to optimize LAPSR parameters, i.e. the delay D, the angle α, the number n of presaturating pulses, the q-value, and to show the effects of field inhomogeneities.
The performance of LAPSR has been verified on a composite large-volume phantom.
68

Study of water permeability and dynamics in micelle, vesicle and
lipid bilayer systems using Dynamic Nuclear Polarization
Ravinath Kausik, Hongjun liang, Evan R. McCarney, Galen Stucky, Songi Han
Department of Chemistry and Biochemistry, University of California Santa Barbara, CA 93106
Materials Research Laboratory, University of California Santa Barbara, CA 93106
In nature water dynamics and content play a key role in the characteristics and functions
of micelle-vesicle and lipid bilayer systems. Experimentally these are difficult parameters to
access because the internal or bound water is difficult to discern from bulk water by conventional
spectroscopic methods. We use dynamic nuclear polarization (DNP) to amplify the 1H NMR
signal via electron spins that are in dynamic dipolar interaction with the 1H nuclei of water. Thus,
DNP detects amplified 1H NMR signal through polarization transfer from the spin label’s
unpaired electron giving us information about local water dynamics, while electron spin
resonance (ESR) directly detects the spin label’s signature and reports on the rotational diffusion
of the spin labeled molecular segment. Here we show how 1H DNP and ESR can give
complimentary information on water permeability, dynamics and chain mobility in vesicle
structures formed by Fatty acids (oleate) or cationic and anionic lipids respectively. Lipid bilayer
model systems with and without membrane protein Proteorhodopsin incorporated, or with DNA
spacers have also been investigated, by means spin labeles at head (16-PC Tempo) and tail (16-
PC Doxyl) groups.
Fig 1. The DNP (maximum enhancement) values show us how hydrated cationic and anionic vesicle systems are in
comparison with oleate vesicles. The rotational correlation times obtained by fitting the Cw X-band ESR spectra
give us an idea of the mobility of the chain segment in the vesicles.
References 1. Evan R. McCarney, Songi Han “Dynamic Nuclear Polarization Enhanced magnetic resonance
analysis as a unique tool to study local water dynamics in Micelle and Vesicle systems”
Langmuir submitted.
2. Hongjun Liang, Gregg Whited, Chi Nguyen, and Galen D. Stucky, Proc. Natl Acad. Sci. USA 104
(20), 8212-8217 (2007).
69

Enhanced Overhauser contrast in low field images of a gelling
process
Wilson Barros1
1 Harvard-Smithsonian Center for Astrophysics, Cambridge, MA, USA.
Magnetic Resonance Imaging (MRI) is a useful tool in material science applications. By
looking at the image profiles it is possible to assess aspects of the structure, the underlying
mechanisms of transport and chemical kinetics of processes. In MRI the signal amplitude
detected from the magnetized sample is known to be proportional to the polarizing magnetic
field. However, the MR signal can be enhanced by methods other than by increasing the field.
One example is dynamic nuclear polarization (DNP), in particular the electronic Overhauser
effect, whereby the polarization of a pool of unpaired electrons (a nontoxic free radical
dissolved in water) is transferred, via saturation of the electronic transition, to the water
molecules in the sample. It turns out that, in addition to the improved signal-to-noise ratio, for
systems exhibiting changes in water mobility there is a remarkable enhancement in the
contrast compared to that obtained by conventional T2-weighted imaging [1]. This
methodology offers accessibility to potential new effects [2] while using magnet design and
cost much more affordable.
T = 120 min. T = 128 min.
T = 15 min. T = 23 min.
Aqueous solution of sodium alginate
(3 % w/v )
Aqueous solution of CaCl2
(60 mM)
Semipermeable membrane
Fig.2 Gelling process of a sodium alginate
solution in the presence of calcium ions crossing
a semi-permeable membrane. Left column shows
images obtained via PEDRI for two different
gelling periods. The right column shows similar
intervals where the contrast originates only from
T2- weighting.
Fig.1 Sketch of the experiment: A cylindrical vial
containing a semi-permeable (permeable only to small
ions) dialysis membrane. The membrane contains a
dilute solution of sodium alginate that is immersed
into the vial containing CaCl2. When the CaCl2
crossed the membrane it reacts with the alginate
forming the gel.
Although gels exhibit solid-like characteristics on a macroscopic level, microscopically they
behave in a liquid-like fashion suitable for MRI investigation. Indeed, a considerable
variation in water mobility is expected during the formation of gel systems. In order to
demonstrate the enhanced mobility-contrast sensitivity generated via the Overhauser effect,
we compare images of the formation process of alginate hydrogels obtained under the same
experimental conditions by a technique named Proton-Electron Double-Resonance Imaging
(PEDRI) [3] and by conventional T2-weighted imaging.
1. W. Barros and M. Engelsberg, J. Magn. Reson 184, 101 (2006).
2. W. Barros and M. Engelsberg, Phys. Rev. E 67, 021905 (2003).
3 D. J. Lurie et al., J. Magn. Reson. 76, 336 (1988).
70

MRI with Hyperpolarized 3He and
129Xe at Very-Low-Field
Ross W. Mair1, Wilson Barros
1, Rachel Scheidegger
1,2, Daniel Chonde
1,2,
Matthew S. Rosen1,3
, Ronald L. Walsworth1, 3
1 Harvard-Smithsonian Center for Astrophysics, Cambridge, MA, USA.
2 Harvard-MIT Division of Health Sciences and Technology, Cambridge, MA, USA.
3 Department of Physics, Harvard University, Cambridge, MA, USA.
Studies employing hyperpolarized spin samples offer the possibility of high-sensitivity NMR
and MRI at very low fields. Benefits include significantly reduced effects from
susceptibility-induced background field gradients, often resulting in significantly longer T2
*;
and a greater skin depth that allows imaging inside conductors [1]. Without hyperpolarized
samples, studies have been performed in the earth’s field, partly for some of the above
reasons [2,3]. For lossy samples, such as human subjects, additional benefits can be
recognized. We have designed and built an open-access, very-low-field human MRI system
that allows the study of pulmonary function with subjects in a variety of postures, an
important advance in lung physiology. Despite the lower B0 of our system, certain
measurements that rely on accurate knowledge of B1 homogeneity and RF flip-angle
uniformity are simplified by operation at very-low-field.
T2
* Contribution B0 = 1.5 T B0 = 6.5 mT
T2 (s) 10 10
T2, inhomogeneity (s) 0.143 0.016
T2, susceptibility (s) 0.0046 1.10
T2, diffusion (s) 0.031 1672
T2, gradients (s) 0.512 3.6
T2
* (ms) 3.8 15.6
Fig 1: Measured SWR as a function of
frequency for our human chest coil built for 3He
imaging at 210 kHz, when unloaded, and loaded
by two different human subjects. The coil
resonance shifts slightly, but coil Q is unaffected
by subject loading.
Table 1: A comparison of T2
* contributions at 1.5 T and
6.5 mT, along with the typical total value of T2
*. A value
of T2 = 10 s is used in both cases [4], while T2,inh 0.143
s is used for 1.5 T [5]. All other terms are calculated
from known values. 3He T2
* is based on our measured
B0 0.4 G, and 0.1 G for a 1.5 T scanner [6].
Operation below the “sample-noise dominance” regime means that our RF coil loads
negligibly and reproducibly, regardless of subject. Coil Q is unaffected (Fig. 1). Therefore,
the excitation flip-angle can be calibrated in advance, rather than being incorporated into
every functional human lung study, as is done at high fields. Additionally, our calculations
show that T2
* contributions from susceptibility differences and diffusion through
inhomogeneous background fields are negligible, and these effects combine to produce a T2
*
significantly longer than measured at high field (Table 1). As hyperpolarized liquid species
gain popularity, similar benefits could be realized in many biomedical and materials studies.
1. C.-H. Tseng et al, Low-field MRI of laser polarized noble gas. Phys Rev Lett, 81, 3785 (1998).
2. P. T. Callaghan et al, An earth’s field nuclear magnetic resonance apparatus suitable for pulsed gradient spin
echo measurements of self-diffusion under Antarctic conditions, Rev Sci Instrum, 68, 4263 (1997).
3. A. Mohoric et al, Self-Diffusion Imaging by Spin Echo in Earth’s Magnetic Field, J Mag Res, 136, 22 (1999).
4. L. Darrasse et al, Low-field He-3 nuclear magnetic resonance in human lungs. CR Acad Sci, 324, 691 (1997).
5. J. Parra-Robles et al, Theoretical signal-to-noise ratio and spatial resolution dependence on the magnetic field
strength for hyperpolarized noble gas magnetic resonance imaging of human lungs. Med Phys, 32, 221 (2005).
6. L. Tsai et al, Posture-Dependent Human 3He Lung Imaging in an Open Access MRI System: Initial Results,
Acad Radiol, in press (2008).
71

Accumulation of NMR Data in Polar Coordinates and Numerical Methods to minimize Systematic Errors
Gianni Ferrante1, Paolo Golzi2, Davide Canina1
Giuseppe Martini2, Carla Vacchi2
1 Stelar s.r.l., Via Enrico Fermi 4, Mede (PV), Italy 2 Department of Electronics, University of Pavia, Via Ferrata 1, 27100 Pavia, Italy
Abstract: In this work we present new instrumental concepts and new NMR methods based on the acquisition and the accumulation of the signal magnitude. The method has been developed to overcome field stability limits and allow the acquisition of Hahn echo decays in Fast Field Cycling Technique
Nevertheless the accumulation of signal magnitudes of NMR data in low signal-to-noise ratio (SNR) regimes produces signal-dependent noise bias that reduces the accuracy of the measurements. This is particularly important for T1 and T2 measurements when the relaxation curve are fitted by a multi-exponential acquisition from polar coordinates. In fact the white noise, with a Gaussian distribution, that affect the NMR signal, become a Rician noise, characterized from the Rayleight distribution, on the accumulated signal magnitudes resulting in a systematic error.
We have developed the correction scheme on a reconfigurable digital hardware architecture, to apply the factor directly over the data-flow on our acquisition channel
Further developments are focused on the improved hardware implementation of numerical methods used to calculate the correction factor. We have also proposed a different technique in order to better evaluate SNR dependencies and extract the real signal intensity from noisy magnitude MNR signals. This alternative technique presumes the possibility of measuring the power of the noisy signals.
Several numerical approaches have been proposed in literature to de-noising NMR signals including a non-linear and wavelet transform. These methods are suitable to be use in a post-processing data evaluation. Used in conjunction with our hardware correction technique, become a complete tool to compensate and/or remove noise from digitalized NMR signals.
1. Cheng Guan Koay, Peter J. Basser, Journal of Magnetic Resonance 179 (2006) 317-322. 2. S.O. Rice, Bell System Technical Journal - Mathematical Analysis of Random Noise 23-24 (1944).
72

Delayed Focus-Pulses in Projection Reconstruction
Joshua Varner, Benedict Newling
MRI Center, Departments of Physics, University of New Brunswick, Fredericton, NB, Canada
With the advent of newer and more robust MRI techniques, Projection
Reconstruction (PR) has become a somewhat retired method due to the probe dead time plaguing the gross structure of its images. In fact, virtually all FID experiments suffer from the same dead time, which effectively ignores the first few microseconds of any signal, the first few crucial k-space data points likewise in MRI. Dead time aside, the ability to rapidly sample an FID signal on a polar k-space raster while monitoring its progress makes Projection Reconstruction in principle a very worthy contender for imaging short T2* species, including porous media and fluid flow measurements. In this talk, the Delayed-Focus Pulse [1] (DFP) will be introduced as a potential cure to the dead time plague. The DFP is so-called due to its phase-refocusing property that causes the signal to achieve phase coherence at a time tf after the initial pulse based entirely on the customizable shape of the pulse itself. Combining the concepts of PR and the DFP, a new imaging sequence will be discussed and compared with other well-practiced techniques such as the Double-Half k, RARE and SPRITE. Understanding where this new method stands will be a step forward in hopes that its uniqueness has a place in materials MRI.
References: [1] X.-L. Wu, P. Xu, R. Freeman, Delayed-Focus Pulses for Magnetic Resonance Imaging: An Evolutionary Approach, M. R. Med 20, (1991) 165-170
Fig: A collection of four Delayed-Focus Pulses whose delay
times tf are listed in the legend below.
73

Optimal k-space Sampling for Single Point Imaging of Transient
Systems
P. Parasoglou1, A.J. Sederman
1, J. Rasburn
2 and H. Powell
2 and M.L. Johns
1
1MRRC, Department of Chemical Engineering, University of Cambridge, Cambridge, UK
2Nestlé Product Technology Centre, York, UK
Magnetic Resonance Imaging has been used to visualise moisture absorption from humidified
air, and subsequent diffusion of this absorbed water, in initially dry samples of food wafer.
Due to the high porosity of the wafer (typically 80 – 90 %) and the typically low moisture
content (of the order of 2-7 wt %), this is particularly challenging. The wafer also exhibits
very short spin-spin relaxation constants, T2* (typically of the order of 50 µs) and T2.
Consequently conventional frequency encode techniques are precluded due to the
unfavourable signal relaxation properties. Thus Single Point Imaging (SPI) [1; 2] is the main
MRI technique used in the current study.
To overcome the main drawback of SPI, its relatively long acquisition time, a novel approach
or trajectory for sampling k-space is presented (the relatively long T1 of the absorbed moisture
excludes the use of SPRITE [3]). The sequence is optimised with respect to the achievable
Signal-to-Noise ratio (SNR) over a given time interval via selective sparse k-space sampling,
the trajectory of which is dictated by prior knowledge of the overall object shape. Further
modest improvements in image quality are also shown via the use of complete sampling of k-
space at the start or end of the series of imaging experiments (when imaging time is not
limited by system dynamics), followed by subsequent use of this data for un-sampled k-space
points for intermediate images, as opposed to zero filling. This technique was successfully
applied to follow the moisture absorption process by the wafer. Good image reproduction
was achieved with significant under-sampling of k-space. Error is shown to be significantly
reduced relative to alternative sampling trajectories.
References:
[1] S. Emid, Ultra high-resolution multiple quantum spectroscopy in solids. Physica B & C
128 (1985) 79-80.
[2] S. Emid, and J.H.N. Creyghton, High-resolution imaging in solids. Physica B & C 128
(1985) 81-83.
[3] B.J. Balcom, R.P. MacGregor, S.D. Beyea, D.P. Green, R.L. Armstrong, and T.W.
Bremner, Single-point ramped imaging with T-1 enhancement (SPRITE). Journal of
Magnetic Resonance Series A 123 (1996) 131-134.
74

A new theoretical insight on time-dependent diffusion coefficient
D. S. Grebenkov
LPMC, CNRS – Ecole Polytechnique, F-91128 Palaiseau, France
In NMR, measuring the time-dependent diffusion coefficient D(t) is an efficient tool to probe the geometry of porous media1,2,3. Although the diffusive motion is well understood in single-scale domains (slab, cylinder, and sphere)4, many issues remain unclear for multi-scale porous structures like sedimentary rocks, cements, or biological tissues. To get a better theoretical insight onto restricted diffusion in multi-scale geometries, we study the spin-echo signal attenuation due to diffusion in circular and spherical layers, x∈Rd : L–l<|x|<L, presenting two geometrical lengths, the radius L and the thickness l. Since the Laplace operator eigenbasis is known explicitly, many analytical results can be derived, in particular, the closed form for the time-dependent diffusion coefficient,
D(t)/D = ∑k=0∞ λ1kB
200,1k w(D t λ1k/L
2), where D is the free diffusion coefficient, λnk the Laplace operator eigenvalues (here, only λnk with n=1 are involved), λ1kB
200,1k the explicit weighting coefficients5. The function w(p) is
determined by the temporal profile (or waveform) of the applied magnetic field gradient, e.g., w(p) = (1/p2 – (exp(-p) – 4exp(-p/2) + 3)/p3)/12
for the simple bipolar gradient (two rectangular pulses of duration δ=t/2). For thin layers (l << L), a perturbative analysis gives surprisingly accurate results, e.g. λ10 ≈ 1 and λ1k ≈ π2k2(L/l)2 for circular layers. The “gap” between λ10 and λ11 is bigger for larger separation between two geometrical lengths L and l. A new, intermediate diffusion regime emerges for l << (2Dt)1/2 << L, when the echo time t is long enough for particles to travel between two boundaries, but still insufficient for exploring the whole domain. This diffusion time t appears as an experimental “yardstick” for probing geometrical lengths of the confinement. This intermediate regime resembles the tortuosity regime in porous media.
. In conclusion, we considered restricted diffusion in model two-scale geometries. In a
single mathematical frame, we observed the transition from the slow diffusion to a new intermediate regime (analogous to the tortuosity regime in porous media), and then to the fast diffusion. These features should appear and be relevant for natural multi-scale structures.
References: 1. P. N. Sen, Concepts Magn. Reson. 23 A, 1-21 (2004). 2. P. P. Mitra, P. N. Sen, L. M. Schwartz, P. Le Doussal, Phys. Rev. Lett. 68, 3555 (1992). 3. T. M. de Swiet, P. N. Sen, J. Chem. Phys. 104, 206 (1996). 4. D. S. Grebenkov, Rev. Mod. Phys. 79, 1077-1137 (2007). 5. D. S. Grebenkov, J. Chem. Phys. (2008, in print).
Fig. 1: Time-dependent diffusion coefficient D(t) for thick (l/L = 0.5, dashed blue line) and thin (l/L=0.1, solid red line) circular layers. For thick layer, the scale window 0.25 << Dt/L2 << 1 (shown by vertical dotted lines) is too narrow, so that a mere transition between slow and fast diffusion is observed, as for the disk. For thin layer, the scale window 0.01 << Dt/L2 << 1 is large enough to reveal the new intermediate regime. At this time and length scales, restricted diffusion in a two-dimensional thin layer is effectively one-dimensional so that the apparent diffusion coefficient is reduced by factor 2, a kind of “tortuosity” of the thin layer.
75

Quantitative NMR microscopy of iron transport in methanogenic
aggregates
F. Vergeldta, J. Bartacek
b, E. Gerkema
a, M. Osuna
c, J. Philippi
a, P. Lens
b,d and H. Van As
a
aLaboratory of Biophysics and Wageningen NMR Centre, and
bSub-department of
Environmental Technology, Wageningen University, The Netherlands, cChemical and
Environmental Engineering Department, University of Basque, Bilbao, Spain, dPollution
Prevention and Control core, UNESCO-IHE, Delft, The Netherlands
Up-flow Anaerobic Sludge Bed (UASB) reactors are the most widely applied type of
anaerobic waste water treatment reactors. The actual purification process takes place in
methanogenic granular sludge that consist of rigid, well settling microbial aggregates that
developed by the mutual attachment of bacterial cells in the absence of a carrier material. Heavy
metal transport into these inhomogeneous, spherical biofilms is an important process both from
the point of view of toxicity and bioavailability. Detailed experimental data on metal transport
and biosorption within biofilm matrices is lacking due to the absence of adequate, non-invasive
analytical tools, hindering refined modelling of these complex processes.
In this study 3D spatially resolved concentration mapping of iron as an environmental
relevant, paramagnetic model metal is aimed for under strict requirements for spatial and
temporal resolution. Although 3D T1 mapping would be the most direct method, this approach
does not fulfil these requirements. Mohoric et al. demonstrated the application of centred-out 3D
RARE imaging to follow the highly dynamic process of cooking of a single rice kernel in a
spatially and temporal well resolved manner (1). This technique was combined with the approach
demonstrated by Nestle et al. to use image contrast to map metal concentration in alginate gels
(2). Due to the short effective echo-time contrast is based on changes in T1 as a function of metal
concentration. Recently Graf von der Schulenburg et al. presented a less sensitive 2D approach
using T2 contrast to map cobalt concentrations in a model biofilm reactor (3).
The reaction-diffusion process of iron in two types of methanogenic granules from
different UASB reactors was investigated. The inner structure of the different granule types
revealed by 3D T2 maps varied from a homogeneous matrix to a heterogeneous structure with
voids and cracks. Detailed analysis of the 3D RARE datasets resulted in quantitative
concentration profiles of iron inside the granules with a radial resolution of 200 µm and a time
resolution of 11 minutes. Although iron transport into the granules is facilitated by presence of
channels, the actual iron penetration into the matrix is mainly determined by the overall water
content and diffusivity of the matrix.
References:
1. Mohoric, A., Vergeldt, F., Gerkema, E., de Jager, A., van Duynhoven, J., van Dalen, G. and
Van As, H., Magnetic resonance imaging of single rice kernels during cooking. J. Magn.
Reson. 171 (2004) 157.
2. Nestle, N. and Kimmich, R., NMR microscopy of heavy metal absorption in calcium alginate
beads. Appl. Biochem. Biotechnol. 56 (1996) 9.
3. Graf von der Schulenburg, D., Holland, D., Paterson-Beedle, M., Macaskie, L., Gladden, L.
and Johns M., Spatially resolved quantification of metal ion concentration in a biofilm-
mediated ion exchanger. Biotechnol. Bioeng. 99 (2008) 821.
76

Asphaltene aggregation in crude oil studied by low field
relaxation and diffusion measurements L. Zielinski
a, D. Freed
a, M. D. Hürlimann
a, I. Saha
a,b
aSchlumberger-Doll Research, 1 Hampshire Street, Cambridge, MA 01239
bSouthern Illinois University, Department of Chemistry and Biochemistry,
Carbondale, IL 62901
We used low-field NMR bulk relaxation and diffusion experiments to study
aggregation properties of asphaltenes in crude oils. Asphaltenes are of particular interest in
the oil industry, where their precipitation may clog up permeable pores and pipelines, causing
huge losses at various production stages. Though many methods exist to study asphaltene
properties, NMR has the potential to measure the asphaltenes in situ, downhole in their native
environment, at the earliest stages of oil exploration.
We studied three sets of samples with varying asphaltene concentration at
temperatures ranging from 45ºC to 92ºC and at Larmor frequencies of 1.7 MHz and 5 MHz.
Asphaltene was first removed from the crude oil by heptane precipitation and then mixed
back in different proportions, resulting in concentration range from 0% to 11%. Increasing
asphaltene contents enhanced the relaxation, Fig.1(a), while leaving diffusion properties
largely unchanged. T2 relaxation was affected more strongly than T1, consistent with the
presence of large asphaltene clusters and resulting slowed correlation times. We found that
only maltene (deasphalted crude) protons were observed, as asphaltene relaxed faster than
our detection window. All the extra relaxation seen in Fig. 1(a) comes from maltene
interactions with asphaltene clusters. Asphaltene, therefore, acts as a contrast agent with
respect to the solvent maltene, and its effects are related to its aggregation state.
Fig. 1: (a) CPMG for seven samples with the same base oil and
asphaltene concentrations from 0% (sample #1) to 11% (sample #7).
(b) The same samples with time axis rescaled by constant ξ2’s (see
legend). Inset shows the range from panel (a) for easy comparison.
Remarkably, the data for different asphaltene concentrations, both for T2 (see Fig. 1(b)) and
for T1 relaxation (not shown), collapses onto a single decay curve upon rescaling the time
domain. This is a highly nontrivial phenomenon, given the multi exponential nature of the
relaxation. We have developed a simple model, based on interactions between asphaltene
clusters and maltene chains, that relates the scaling coefficients ξ2 and ξ1 (corresponding to
T2 and T1 relaxation, respectively) to the size of asphaltene clusters. Applying our formulas
to the present data yielded cluster sizes of the order of 4 nm, consistent with other methods
for assessing asphaltene aggregate sizes.
77

Chemical Resolution in T1-T2 correlations
T. C. Chandrasekeraa, J. Mitchell
a, E. J. Fordham
b, L. F. Gladden
a, and M. L. Johns
a.
a Department of Chemical Engineering, University of Cambridge, Pembroke Street, Cambridge,
CB2 3RA, UK. b
Schlumberger Cambridge Research, High Cross, Madingley Road, Cambridge, CB3 0HG, UK.
T1-T2 correlations are useful for determining the ratio T1/T2 as a characteristic parameter
for permeable rocks [1]. However, the presence of both oil and water can complicate the
analysis. Sedimentary rocks are therefore analyzed with D-T2 correlations at low magnetic fields
because of the distinct difference in diffusion coefficient D of the two liquids [2]. Here we
present a novel T2-T1-δ correlation [3] where the chemical shifts δ allow the water and oil
fractions to be identified; see Fig. 1.
Fig. 1. Chemically resolved T2-T1 correlations reveal the water and oil fractions within
a sandstone rock core.
The T2-T1-δ correlation is acquired in the same experimental time as a conventional T1-T2
correlation. This is achieved through the use of a “double-shot” measurement of T1 [4], so-called
because it requires the spin ensemble to be stored “up” and “down” in successive scans [5]. In
this way the longitudinal relaxation information is encoded in an exponential decay (rather than a
recovery). Since this T1 measurement is based on the acquisition of multiple FIDs, chemical shift
information can be extracted.
Furthermore, we propose a novel T1-T1 exchange measurement and demonstrate this by
determining exchange between cellulose fibers at high magnetic fields where the susceptibility
induced field gradients distort the traditional T2-T2 exchange measurements.
References:
1. Y. Q. Song, et al., J. Magn. Reson. 154 (2002) 261.
2. M. D. Hürlimann, et al., J. Magn. Reson. 157 (2002) 31.
3. T. C. Chandrasekera, et al., J. Magn. Reson. To be submitted.
4. J. J. Hsu and I. J. Lowe, J. Magn. Reson. 169 (2004) 270.
5. E. E. Sigmund, et al., Solid State Nucl. Magn. Reson. 29 (2006) 232.
78

withdrawn
79

NMR diffusion and relaxation studies of molecules confined
inside core-shell polymeric capsules
I. Ardeleana, M. Bogdan
b, C. Badea
a, A. Parnau
b
aTechnical University from Cluj-Napoca, Department of Physics,
400020 Cluj–Napoca, Romania; bNational R&D Institute for Isotopic and Molecular
Technologies, 400293 Cluj–Napoca, Romania
Understanding the surface effects on dynamics of molecules confined in nanocapsules
is important both for obtaining of theoretical scientific knowledge and for designing of new
nanocapsules to be used in controlled drug delivery [1]. Obtaining of information about the
surface effects on confined molecules and the molecular exchange through capsules
membrane can be favorably accomplished using nuclear magnetic resonance diffusometry
and relaxometry techniques [2]. Surface interactions give rise to orientational order near the
surface with the molecules diffusing from the isotropic bulk region to the ordered surface
layer and vice versa. At each return the molecules orientation is controlled by the interaction
with the surface. Consequently, de dipolar correlation function is characterized by a slowly
decaying part owing to the repeated returns of molecules to the surface. This mechanism of
relaxation that is based on “reorientations mediated by translational displacements” (RMTD)
[3] is the subject of our investigations.
In our contribution we will report diffusion and relaxation studies performed on
miglyol and hexadecane molecules encapsulated in polymeric nanocapsules of different
dimension. The core-shell polymeric capsules were prepared by two different methods based
on emulsification – diffusion technique [4]. The diffusion experimental data obtained with a
high field instrument (9.4T) using the fringe field stimulated echo (FFStE) technique [5] were
compared with those obtained with a low field instrument (0.47 T) by using the well known
pulsed field gradient stimulated echo (PFGStE) technique. The proton relaxation data were
obtained at 20 MHz using the CPMG technique. The apparent diffusion coefficient extracted
from the first part of echoes decay allowed us to evaluate the capsules dimension. The
coincidence with the dimension observed from electron micrograph is remarkable. In order to
obtain a correct interpretation of the experimental data these were also compared with Monte
Carlo simulations.
This work was financed by the CEEX – MATNANTECH 58/2006 project. We thank Prof.
Rainer Kimmich from Ulm University for allowing us to perform the FFStE measurements.
References:
[1]. V.R. Kumar, J.Pharm. Pharmaceut Sci. 3, 234(2000)
[2]. C. Mayer, Prog. Nucl. Magn. Reson. Spectroscopy, 40, 307(2002)
[3]. T. Zavada and R. Kimmich, J. Chem. Phys. 109, 6929(1998)
[4]. D.Quintanar, H.Fessi, E.Allemann, and E.Doelker, Int.J.Pharm.143, 133(1996)
[5]. G. Farrher, I. Ardelean, and R. Kimmich, J. Magn. Reson. 182, 215 (2006)
80

MRI Evaluation of the Effectiveness of Colloidal Dispersion Gels for Enhanced Oil Recovery
B. Babalola,a L. Li,b L. Romero-Zeron,a B. Balcom, b
aDepartment of Chemical Engineering, University of New Brunswick, bDepartment of
Physics, University of New Brunswick
Sweep efficiency in mature or marginal conventional oil fields is significantly affected by fluid channeling through rock cracks, fractures, and high permeability “thief zones”. Colloidal dispersion gels (CDG) have been proposed as an enhanced oil recovery (EOR) method to block deleterious fluid channeling in petroleum reservoir formations. Controversy exists in the literature however about the effectiveness of CDG.
Centric-scan SPRITE was employed to visualize the behavior of CDG in controlling fluid channeling in laboratory studies with core plug samples. The Centric-scan SPRITE method provides quantitative fluid density images in porous media that are difficult to image by conventional MRI techniques due to short transverse signal lifetimes and multi- exponential T1, T2 behavior.
The experimental results showed CDG is an effective technique for controlling conformance problems in porous media. Centric-scan SPRITE MRI permitted accurate monitoring of displacement fronts between displaced and displacing fluids through the porous matrix and high permeability channel.
81

Characterisation of pulsing flow in trickle-bed reactors
using ultra-fast MRI
T. T. M. Nguyen, A. J. Sederman, L. F. Gladden,
Departments of Chemical Engineering, University of Cambridge, Pembroke Street,
Cambridge CB2 3RA, UK
Trickle-bed reactors (TBRs) are widely used in petroleum refining and throughout the
chemical industry. TBRs take the form of columns packed with solid porous catalyst pellets.
The most common mode of operation is with concurrent down-flow of liquid and gas
reactants. TBRs can therefore be thought of as porous systems on two different length-
scales; a macro-pore structure formed by the void space between the catalyst particles, which
interacts with the micro-pore system of the catalyst pore structure. It has been suggested that
operation of TBRs at high liquid and gas flow rates in the so-called pulsing regime, can
improve the reactor performance in terms of mass, heat transfer rates and better catalyst
utilisation [1, 2]. However, an understanding of the hydrodynamics within the reactor
operating under these conditions has not yet been achieved. In this work, we use ultra-fast
MRI techniques to characterise hydrodynamics during pulsing flow and compare these results
with those obtained using conductance measurements – a technique well established for this
application within the chemical engineering community [3].
This paper presents the results of ultra-fast one-dimensional (1-D) Fast Low Angle
SHot (FLASH) MRI to characterise the liquid pulses in TBRs. 1H MRI experiments were
performed at 200 MHz on a 4.7 T magnet. 1-D liquid holdup profiles along the flow
direction were acquired at spatial and temporal resolutions of 352 µm pixel-1
and 3.3 ms,
respectively. It is demonstrated that properties such as pulse velocity, duration and frequency,
obtained with MRI are in good agreement with the conductance data. MRI is shown to have
three advantages compared to the traditional conductance measurement approach:
• Individual pulses are tracked and therefore the pulse velocity measured with MRI is
more accurate when only part of TBR is pulsing.
• The distribution of pulse velocities is obtained as opposed to a time-averaged
measurement.
• Since individual pulses are tracked, splitting of a single stream into two, and merging
of two streams into one are imaged directly. Such information cannot be obtained
using the conductance approach.
References:
1. Y. Lemay, G. Pineault, J.A. Ruether. Ind. Eng. Chem. Proc. Des. Dev. 14 (1975) 280.
2. N. A. Tsochatzidis, A. J. Karabelas. J. Appl. Electrochem. 24 (1994) 670.
3. J. G. Boelhouwer, H.W. Piepers, A. A. H. Drinkenburg. Chem. Eng. Sci. 57 (2002) 4865.
82

Study of Miscible and Immiscible Flows in a Microchannel Using
Magnetic Resonance Imaging
B.S. Akpaa, S.M. Matthews
b, A.J. Sederman
b, K. Yunus
b, A.C. Fisher
b,
M.L. Johnsb, and Lynn F. Gladden
b
aDepartment of Chemical Engineering, University of Illinois at Chicago,
bDepartment of
Chemical Engineering, University of Cambridge
Microfluidic devices have attracted much interest in the fields of biology,
biotechnology, and analytical and synthetic chemistry with applications as varied as protein
crystallization, analyte diagnostics, cytometry, and combinatorial chemistry. These
miniaturized fluidic systems have many advantages over their macroscale equivalents and
have made feasible the integration of multiple processes on one device – the so-called lab on
a chip or micro total analysis system. Many attempts have been made to characterize mixing
performance in microfluidic systems with a view to optimizing their design and operation.
Both flow and concentration mapping have typically been achieved by using optical methods.
Despite the achievements of workers using optical techniques, there remain some inherent
limitations of these methods. For example, the applicability of optical methods is limited to
systems that have been fabricated and sealed with optically transparent materials. Optical
methods are also often limited with respect to the type of device geometry that can be
studied. More recently, researchers have begun to explore MRI as a tool for the study of
microscale systems1,2,3
.
In this work, MRI has been used for the first time to obtain both cross-sectional
velocity and concentration maps of flow through an optically opaque Y-shaped microfluidic
sensor. Images of 23 µm × 23 µm resolution were obtained for a channel of rectangular cross
section (250 µm × 500 µm) fed by two square inlets (250 µm × 250 µm). Both miscible and
immiscible liquid systems have been studied. These include a system in which the coupling
of flow and mass transfer has been observed, as the diffusion of the analyte perturbs local
hydrodynamics. Our motivation for
developing MRI tools for the study of
microchannels extends beyond
experimental visualization of mixing
performance. The data thereby obtained
can be used in the validation of
numerical codes for simulating
micromixing processes. Such codes
will play a key role in the design and
optimization of microfluidic systems.
Images presented in this work have
been used by Sullivan et al.4 to validate
a lattice-Boltzmann code capable of
simulating coupled diffusive mass
transfer and hydrodynamics in 3D.
References:
(1) C. Hilty et al. Proc. Natl. Acad. Sci. U.S.A. 2005, 102, 14960. (2) E. Harel et al. Phys.
Rev. Lett. 2007, 98, 017601. (3) S. Ahola et al. Lab Chip 2006, 6, 90. (4) S.P. Sullivan et al.
Sens. Actuators, B: Chem. 2007, 123, 1142.
(A)
(B)
Low
Intensity
High
Intensity 0 43 mm s-10 43 mm s-1
Velocity
(C)
(D)
Fig. 1: Images of multiphase, immiscible flow
through the microchannel. Selective saturation was
used to image either the aqueous or organic phase
independently. (A) Organic phase. (B) Aqueous
phase. (C), (D) Velocity maps of the organic and
aqueous phases respectively.
83

Velocity and diffusivity mapping of water flow in a bead
pack by a purely phase-encoded MRI method Zhi Yang, Olusegun Adegbite, Joshua Varner, Ben Newling
MRI Center, Departments of Physics, University of New Brunswick,
Fredericton, NB, Canada
In the past years, magnetic resonance imaging (MRI) has been proved to be a valuable method for measuring flow properties. In this talk, we present a motion sensitized version of the MRI method SPRITE (Single Point Imaging with T1 Enhancement [1]) measuring fast, mechanically dispersed water flow in a pack of large glass beads (Velocity 20 ~40cm/s, Reynolds number up to 2000, Average bead size 1.6cm). This method is quantitative, three dimensional and has potential time saving over traditional pointwise techniques for measuring fluid flow. Use of a purely phase-encoded method means that the encoding interval can be kept very short, allowing greater control of intravoxel phase dispersion than many frequency-encoded techniques. The SPRITE family of techniques is essentially immune to artifacts caused by material boundaries in magnetic susceptibility. The mean velocity and turbulent diffusivity of water flow were mapped. SPRITE has great potential for future study in dispersed fluid flow and CFD (Computational Fluid Dynamics) software validation.
References:
[1] B. Newling, C.C. Poirier, Y. Zhi, J.A. Rioux, A.J. Coristine, D. Roach, B.J. Balcom, Velocity imaging of highly turbulent gas flow, Phys. Rev. Lett. 93 (2004) 154503.
Fig: 2D slice of 3D spin density image of the bead pack, spatial resolution 64 by 64 pixels
84

Touching-Vug velocity and exchange with matrix pores in models and samples from the Biscayne aquifer
L. Floreaa, S. Altobellib, K. Cunninghama
aU.S. Geological Survey, Ft. Lauderdale FL, bNew Mexico Resonance, Albuquerque, NM
We used stimulated-echo based velocimetry to measure three-dimensional steady velocity fields in the centimeter scale vugs and short echo-time spin warp imaging to study the washout of D2O from the porous matrix. Washout experiments were done under static and flowing conditions.
The Biscayne aquifer in southeast Florida is one of the most permeable aquifers in the world.1 The large scale macroporosity is due in part to shrimp burrows.2 As part of a combined experimental and computational effort aimed at modeling the aquifer on many scales, we investigated the feasibility of some simple MR techniques. Figure 1 is an example that shows the almost immediate washout of D2O from the macropores and the exchange that occurs with the water in the rock matrix over a longer time scale.
The experiments were done in a 1.89T horizontal bore system controlled by a Tecmag (Houston, TX) Libra. The 3d model used in the velocity measurements was constructed by a rapid-protoyping 3d epoxy printer. The evolution time in the stimulated echo experiments was approximately 1s, T1 was 2.7s, flow rates were set to match the superficial velocity in the aquifer, resulting in average velocities of 0.045 cm/s and 0.025 cm/s. The higher flow rate was used in the washout experiment shown in Figure 1.
Our results show that MR imaging is a promising technique for studying flow fields and transport properties pertinent to the Biscayne aquifer.
Fig. 1: MR images, FOV 8x8 cm, taken periodically show the incursion of water into an initially D2O saturated carbonate rock (ML-3) from an outcrop near Biscayne Bay.
References:
1. Fish, J. E. and Stewart, M., USGS Water-Resources Report 90-4108, 19912. Cunningham, K. J. and Curran, H. A. Int. Ichnofabrics Workshop IX, 2007
85

withdrawn
86
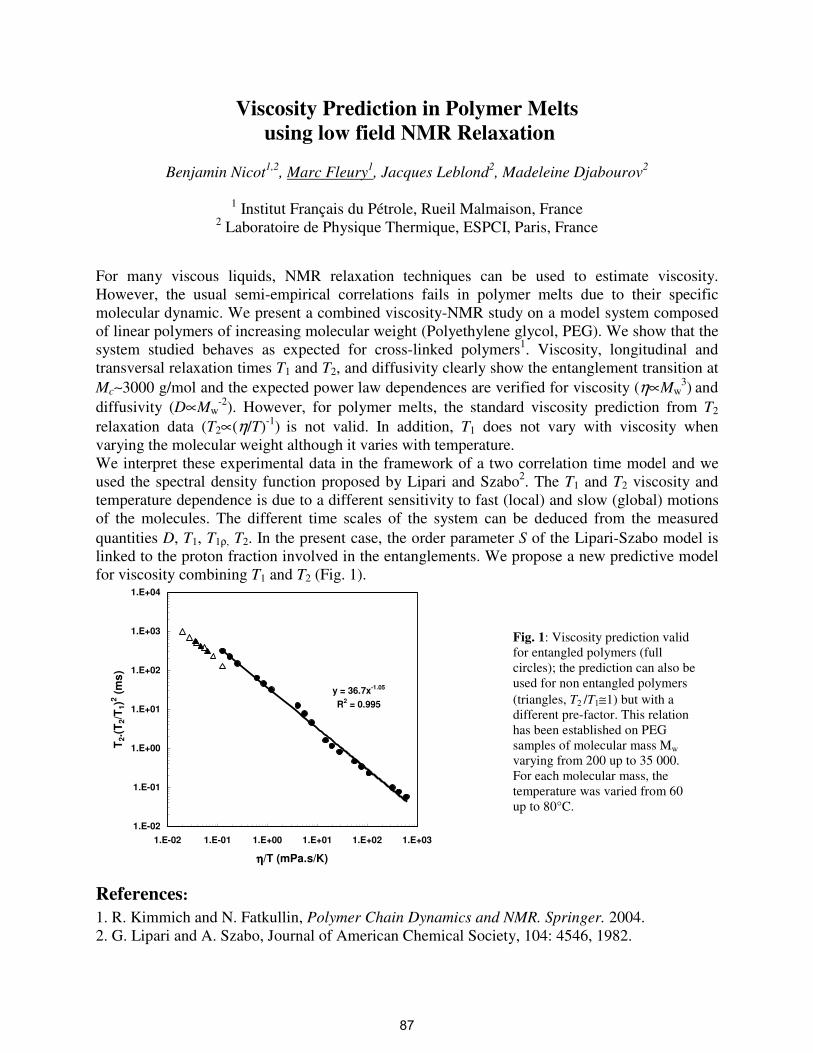
Viscosity Prediction in Polymer Melts using low field NMR Relaxation
Benjamin Nicot1,2, Marc Fleury1, Jacques Leblond2, Madeleine Djabourov2
1 Institut Français du Pétrole, Rueil Malmaison, France 2 Laboratoire de Physique Thermique, ESPCI, Paris, France
For many viscous liquids, NMR relaxation techniques can be used to estimate viscosity. However, the usual semi-empirical correlations fails in polymer melts due to their specific molecular dynamic. We present a combined viscosity-NMR study on a model system composed of linear polymers of increasing molecular weight (Polyethylene glycol, PEG). We show that the system studied behaves as expected for cross-linked polymers1. Viscosity, longitudinal and transversal relaxation times T1 and T2, and diffusivity clearly show the entanglement transition at Mc∼3000 g/mol and the expected power law dependences are verified for viscosity (η∝Mw
3) and diffusivity (D∝Mw
-2). However, for polymer melts, the standard viscosity prediction from T2 relaxation data (T2∝(η/T)-1) is not valid. In addition, T1 does not vary with viscosity when varying the molecular weight although it varies with temperature. We interpret these experimental data in the framework of a two correlation time model and we used the spectral density function proposed by Lipari and Szabo2. The T1 and T2 viscosity and temperature dependence is due to a different sensitivity to fast (local) and slow (global) motions of the molecules. The different time scales of the system can be deduced from the measured quantities D, T1, T1ρ, T2. In the present case, the order parameter S of the Lipari-Szabo model is linked to the proton fraction involved in the entanglements. We propose a new predictive model for viscosity combining T1 and T2 (Fig. 1).
y = 36.7x-1.05
R2 = 0.995
1.E-02
1.E-01
1.E+00
1.E+01
1.E+02
1.E+03
1.E+04
1.E-02 1.E-01 1.E+00 1.E+01 1.E+02 1.E+03
ηηηη/T (mPa.s/K)
T 2.(T
2/T 1
)2 (ms)
Fig. 1: Viscosity prediction valid for entangled polymers (full circles); the prediction can also be used for non entangled polymers (triangles, T2 /T1≅1) but with a different pre-factor. This relation has been established on PEG samples of molecular mass Mw varying from 200 up to 35 000. For each molecular mass, the temperature was varied from 60 up to 80°C.
References: 1. R. Kimmich and N. Fatkullin, Polymer Chain Dynamics and NMR. Springer. 2004. 2. G. Lipari and A. Szabo, Journal of American Chemical Society, 104: 4546, 1982.
87

Diffusion tensor micro-imaging of articular cartilage as a probe of
tissue microstructure
S.K. de Vissera, J. C. Bowden
a, R.M. Wellard
a, K. Momot
a,b and J.M. Pope
a,b
aSchool of Physical & Chemical Sciences and
bInstitute of Health and Biomedical Innovation
Queensland University of Technology, Brisbane, Australia
Osteoarthritis is a disease of articular cartilage that affects an estimated 20% of the
population, but the early stages of osteoarthritis are difficult to diagnose and the progression of
the disease is poorly understood. Articular cartilage covers the ends of the bones in joints,
providing a smooth low friction surface that absorbs shocks and distributes load to the
subchondral bone. Healthy adult human cartilage is 2-4 mm thick and has a complex
composition and structure. It contains collagen (15−20%), proteoglycans (PG, 3−10%), lipids
(1−5%), chondrocyte cells, and water (65-80%). The collagen forms a cross-linked network, in
which three zones of alignment are usually distinguished: the fibres at the articular surface are
aligned parallel to the surface and become increasingly aligned normal to the surface at greater
depth. Collagen is primarily responsible for the compressive stiffness of cartilage, while the PG's
are responsible for maintaining osmotic equilibrium.
Cartilage is invisible on plane x-rays and its thickness can only be inferred from the
separation of the subchondral bone surfaces. The surface of the cartilage can be viewed using
arthroscopy, but this is invasive and provides no information on changes in structure and
morphology of the cartilage beneath the articular surface. In conventional clinical MRI the
appearance of cartilage is complicated by the presence of bands of high and low signal intensity
that depend on the orientation of the normal to the articular surface with respect to the applied
static magnetic field. These bright and dark bands reflect the orientation dependence of the spin-
spin relaxation time T2, which is determined by constraints on the mobility of water protons
imposed by the underlying structural anisotropy of the collagen fiber matrix. Thus, while the
complex nature of contrast observed in clinical MRI of cartilage has to date been seen as a
complicating factor for diagnosis, MRI has the potential to provide information on changes in
molecular structure of cartilage that could assist in the early diagnosis of disease and in
monitoring response to therapy.
In studies of bovine cartilage in vitro1,2
we have shown that diffusion tensor imaging
(DTI) can be used to monitor the orientation of the collagen fibers as a function of depth from
the articular surface and to measure changes in fiber orientation produced by both enzymatic
degradation and mechanical compression. Results were correlated with data from polarized light
microscopy (PLM)3 and polarized Fourier transform infra-red spectroscopy (FTIR). We are
currently modeling the orientation dependent relaxation of protons on water molecules bound to
collagen fibers with a view to correlating T2 anisotropy with molecular sub-structure in cartilage.
References:
1. R. Meder, S.K. de Visser and J. M. Pope, Osteoarthritis and Cartilage 14, 875-881 (2006).
2. S. K. de Visser, R. W. Crawford and J. M. Pope, Osteoarthritis and Cartilage 16, 83-89 (2008).
3. S. K. de Visser, J. C. Bowden, L. Rintoul, E. Wentrup-Byrne, T. Bostrom, J. M. Pope and K. I.
Momot, Osteoarthritis and Cartilage (in press).
88

Role inversion in magnetization exchange between water and macromolecular protons in articular cartilage components
at different hydration levels
P. Fantazzinia, M. Gombiaa, R.J.S. Brownb, F. Vitturc
aDipartimento di Fisica, University of Bologna, Viale Berti Pichat 6/2, 40127, Bologna, Italy
b953 W Bonita Ave, Claremont CA 91711-4193, USA cDipartimento di Scienze della Vita, University of Trieste, Via Giorgieri 1, 34127 Trieste, Italy
NMR techniques are acquiring an ever-increasing importance both in basic science and
clinical studies of articular cartilage, a connective tissue that can be considered, for many aspects, as a porous medium. NMR is unique as it furnishes non-destructive tools to evaluate the changes occurring in the cartilage due to pathologies and ageing, both in vitro and in vivo. In particular, MRI can be repeatedly used to monitor changes of articular cartilage of the human joints, without radiation damages. One of the most relevant MRI parameters is the magnetization transfer rate, that has been related to the concentration of the collagen fibres.
We studied the exchange of magnetization between water and macromolecular protons both ex vivo in native cartilage, and in its purified components, collagen and proteoglycans, at different water content. All the free induction decays could be fit by the sum of an exponential (liquid-like) and a Gaussian or modified Gaussian (solid-like) signal. The “solid-like” component is due to macromolecular 1H of restricted mobility, the “liquid-like” to water. When quasi-continuous distributions of longitudinal relaxation time were computed without imposing the usual non negativity constraint, the effect of the magnetization exchange between macromolecular and water 1H was evident. Data could be formally fit by a simple two-site exchange model, already used by us for a study of hydration in seasoned woods1, where the Solid-to-Liquid exchange times were found to be of the order of few tens of ms. An inversion of the Solid-Liquid roles in the magnetization exchange was observed with changing the hydration level of the macromolecules. Such an inversion has been seen to occur at the hydration level 20-26% (w/w) in a model system (Sephadex G10)2.
References:
1. P. Fantazzini, A. Maccotta, M. Gombia, C. Garavaglia, R.J.S. Brown, M. Brai, Solid-Liquid NMR relaxation and signal amplitude relationships with ranking of seasoned softwoods and hardwoods, J Appl Phys 100: 0749071-7 (2006). 2. P. Fantazzini, L. Lendinara, 1H-NMR relaxation in hydrated Sephadex system, in Physics in environmental and Biomedical Research, S.Onori, E. Tabet Editors, pp. 263-266, World Scientific Publishing Co., 1986.
89

GARField NMR profiling studies of
human stratum corneum and viable epidermis in vivo
P. J. McDonalda, S. Pitts
a, E. Ciampi
b, M. van Ginkel
b and S. Singleton
b
aDepartment of Physics, University of Surrey, Guildford, Surrey, GU2 7XH, UK
bMeasurement Science, Unilever, Colworth Science Park, Sharnbrook, Bedford, MK44 1LQ, UK
In a series of recent papers1 describing a limited number of trials, we have shown how
GARField magnetic resonance profiling is an ideal tool to study small molecule transport in
human skin stratum corneum and viable epidermis both in-vitro and in-vivo. This is possible
because, with GARField, the resolution (pixel size) is better than 10 μm with a first echo time as
short as 150 μs. In this previous work, there was indication that profiling of magnetic relaxation
parameters can access the qualitative parameter that is often dubbed “skin-moisturisation”: this
being a reflection of skin suppleness rather than true hydration. The current work described here
goes forward with two objectives.
In one set of experiments, a 5 pulse sequence (P90 - (τ-δ)/2 - P180 - (τ+δ)/2 – P90 - Δ -
(τ+δ)/2 - P90 - (τ-δ)/2 – P180 - echo) has been used to measure self-diffusivities in stratum
corneum and viable epidermis in vivo under the constant gradient conditions of GARField2. This
sequence allows simple diffusion of a single species to be measured independent of relaxation
weighting using constant τ and Δ intervals. By sampling the full 3 dimensional parameter space,
δ, τ, and Δ measurements of more complex diffusion scenarios with different characteristic
length scales as a function of time are possible. On human stratum corneum and viable epidermis
these experiments reveal (for the first time and in vivo) diffusion of water in a spatially and
temporarily defined manner showing different characteristic behaviours.
In other experiments, we quantitatively compare changes in stratum corneum and viable
epidermis relaxation rates occurring as a result of the application to the skin of materials typical
of model skin care formulation systems, with changes in the more standard measurement of
trans-epidermal water loss and with corneometer testing. Excellent correlation between the
results of the different methods is found. In one particular study, the volunteer ate a light meal
and took moderate exercise during the trial. These activities are known to affect core body
temperature and skin hydration and are faithfully echoed in the data sets. Single-point signal-to-
noise ratio and bio-reproducibility are comparable between the different methods. However, the
GARField MR alone provides depth resolution within the skin layers and has allowed a simple
qualitative model of skin swelling and moisturisation to be inferred.
References: 1 P. J. McDonald, A. Akhmerov, L. J. Backhouse, S. Pitts, J. Pharm Sci. 94 (2005)1850.
2 R. Kimmich, NMR - Tomography, Diffusometry, Relaxometry, Springer-Verlag, Berlin, 1997.
90

MRI VISUALISATION OF THE MOISTURE INGRESS INTO
POROUS TISSUE OF THE DECAYED TEETH
Władysław P. WĘGLARZ*, Marta M. TANASIEWICZ**, Tomasz W. KUPKA**,
Marco L.H. GRUWEL***, Boguslaw TOMANEK***
*Department of Magnetic Resonance Imaging, H. Niewodniczański Institute of Nuclear Physics Polish
Academy of Sciences, Kraków, Poland
**Department of Propaedeutics in Dentistry, Medical University of Silesia, Bytom, Poland
***NRC Institute for Biodiagnostics, Winnipeg, Canada
Introduction: During last decade MRI has been used in the research of the healthy and decayed teeth for
visualization of the dental surface geometry as well as for distinction between soft tissue (pulp) and
mineralized tissue (enamel, dentine and root cement) in the extracted teeth [1-3].
The aim of this work was to asses applicability of different MRI techniques for detection and
visualisation of the water ingress into porous structure of the decayed teeth in vitro.
Materials and Methods: Five extracted human teeth with different level of decay were used for 3D
Spin Echo (SE) MR Imaging done in MR Tomography Lab INP, Krakow, Poland, using 4.7 T research
MRI system. 3D (512x128x128) images of the teeth with resolution of 30x120x180 µm3 were obtained.
Single Point Imaging (SPI) [5] were performed using 11.7 T, vertical bore Bruker MRI system,
in IBD, Winnipeg, Canada. In this case resolution of 315x315x940 µm3 was achieved.
MR data were visualized and analyzed using home developed IDL based software and ImageJ
software.
Results
a b c d
Fig.1 The photo image (a), corresponding cross-sections through 3D SE MR image (b) and the pseudo
3D reconstruction (c) of the water in porous tissue of decayed tooth, obtained from 3D SE MR data. In
fig (d) 2D cross-section from 3D SPI data of tooth with decay comparable to that for SE images is
shown.
Discussion & Conclusions: Spin-echo based MR imaging methods allow for high resolution
visualization of the moisture entering into heavily decayed tooth, which are paths for microorganisms
causing further damage of the tissue. With this methods it is not possible to see any details in mineralized
tooth’s tissue, especially gradual decrease in tissue density in early stages of the caries development.
With this respect, the SPI method which allow for visualization of the mineralized tissue is more
promising.
References: 1. Lloyd CH, Scrimgeour SN, Chudek JA, HunterG, MacKay RL, Quintessence Int. 1997, 28(5), 349.
2. Lloyd CH. et.al. Caries Res 2000, 34, 53.
3. Węglarz WP, Tanasiewicz M, Kupka T, Skórka T, Sułek Z, Jasiński A, Solid State NMR, 2004,25, 84.
4. Latta P, Gruwel MLH, Edie E, Sramek M, Tomanek B, J. Magn. Reson. 2004, 170, 177.
91

Correlated analysis of the diffusion and T2 relaxation of water in multi-compartmental tissue of the spinal cord of a
rat
W.P. Węglarz, P. Rosicka, T. Banasik, U. Tyrankiewicz,
Dept. of Magnetic Resonance Imaging, Institute of Nuclear Physics, Polish Academy of Sciences, Kraków, Poland, [email protected]
Introduction: Present understanding of water diffusion in nervous tissue is based on assumption of three water compartment: intra-cellular, myelin and extra-cellular, with different diffusion and relaxation characteristics. There is still lot of debating concerning details of the diffusion model which includes all three compartments. To clarify this, proper characterization of all compartments is necessary. Especially myelin water is difficult to detect due to short T2. The aim of this work was to set up protocol for combined diffusion/relaxation characterization of all three compartments. Subject and Method: The male Wister rats used for measurements were anaesthetised using halothane in oxygene. MR measurements were performed on the 4.7 T research tomograph equipped with Maran DRX (Resonance Instruments Ltd.) console and the home built gradient coils and the surface coils. ECG and breath triggered 3D spin echo (SE) sequence without slice selection was used to measure diffusion for b-values up to 30000 s/mm2 and for different echo times (TE) in range from 10 ms to 400 ms. Results: The diffusion weighted MR images (128x128) of the spinal cord as a function of b-values were obtained for range of TE values. Dependence of signal amplitudes on TE and b-values for directions perpendicular and parallel to the spinal cord axis for white matter and gray matter were assessed and described in terms of multi-exponential as well as continuous 2D distribution of the T2/diffusion decays.
Fig.1. (a) MR images of the spinal cord of a rat in vivo with diffusion gradients oriented in direction perpendicular (top) and parallel (bottom) to spinal cord axis, for b equal to: 650, 1300, 1800, 2300, 2800, 3300 s/mm2; (b) T2 decays in white matter for the diffusion gradients perpendicular to the axis of the spinal cord. Diffusion decays in direction along spinal cord are close to mono-exponential, especially in WM. Diffusion in direction perpendicular to spinal cord axis deviates substantially from mono-exponential (Fig 1b). Discussion/Conclusions: 3D Spin Echo based sequence was found useful in characterisation of diffusion in different water compartments in nervous tissue, due to possibility of measurements with short TE. Observed dependence of diffusion/relaxation decays on TE was attributed to compartmentalisation of the water within nervous tissue. Acknowledgments: This work was partially supported by research grant no. 1 P03B 009 28 from Ministry of Science and Informatisation of Poland and European Reintegration Grant no. 46386.
92

In vivo imaging of DDIF contrast in the Human Knee
E. E Sigmunda, R. Regatte
a,M. Schweitzer
a, H. Cho
b, Y.-Q. Song
c
aNew York University Radiology Department, New York, NY
bMemorial-Sloan Kettering
Cancer Center, New York, NY cSchlumberger-Doll Research, Cambridge, MA
Trabecular bone (TB)
is a porous structure found in
load-bearing skeletal regions
and joints (vertebrae, radius,
femur, calcaneus), and is
monitored to determine risk
of fracture or osteoporosis.
However, the clinical
densitometry standard fails to
account for half of fragility
variations, and diagnostics
that incorporate architectural
“bone quality” information
are in high demand(1).
Recent in vitro work
has applied an MR structural contrast—decay from diffusion in the internal field (DDIF)—to
trabecular bone, including both bulk measurements(2) and microimaging(3) over a wide
range of structure and strength. This work showed that DDIF probes the projected surface-
to-volume ratio along the applied field. The present study extended this technique to the first
in vivo DDIF contrast results in healthy human volunteer knee joints.
Imaging was performed in a full body 3 T Siemens Trio scanner with a single channel
CP knee coil. Four healthy volunteers were scanned with an imaging protocol including a
FLASH-3D scan for high resolution anatomical reference (0.3 x 0.3 x 1.5 mm), gradient echo
imaging at variable echo time for T2* mapping, inversion recovery prepared turbo spin echo
imaging at variable inversion time TI for T1 mapping, and a stimulated echo prepared
BURST imaging at variable mixing time tD for DDIF mapping. The parametric maps were
acquired at 1.2 x 1.2 x 3 mm resolution. T2* and TDDIF maps were generated by single
exponential fitting, and T1 maps by single exponential recovery fitting.
Figure 1 shows a comparison of the short decay time limits of T2* and TDDIF maps in
an axial slice through the condyles of the distal femur. Both show high contrast in the
intercondylar notch, where trabecular density and mechanical stresses are high. Beyond this
commonality the two spatial patterns are similar but not identical. Higher precision (e.g.
higher SNR sequence) will be required to explore the unique sensitivity of DDIF. However,
this pilot study confirms that DDIF probes trabecular structure in vivo.
References:
1. Wehrli FW, et. al. Quantitative MRI for the assessment of bone structure and function.
Nmr in Biomedicine 2006;19(7):731-764.
2. Sigmund EE,et.al.Diffusion-based MR methods for bone structure and evolution. Magnetic
Resonance in Medicine 2008;59(1):28-39.
3. Sigmund EE, et.al. High resolution MRI of internal field diffusion-weighting in trabecular
bone. Nmr in Biomedicine 2008;submitted.
Figure 1: T2* and TDDIF (te = 40 ms) contrast in an axial slice of a
healthy volunteer distal femur at 3 T. Windowed parameter maps
are overlaid on a high resolution FLASH image.
86420
T2* (ms)
340320300280260
T_DD
IF (ms)
T* DDIFT2
93

Helium Diffusion Kurtosis MRI of the Lungs
G. Johnson, R. Trampel, J. Jensen,
Department of Radiology, New York University School of Medicine
Diffusion MRI of hyperpolarized 3He is a promising method of characterizing the
small airspaces (1). Diffusion is restricted by lung structures and hence measured diffusion
coefficients reflect airspace size. However, with typical diffusion times of a few milliseconds
(limited by the short T2* of helium) diffusion measurements largely reflect alveolar size and
are insensitive to changes in the bronchioles. Diffusion kurtosis imaging (DKI) measures the
degree to which diffusion is non-Gaussian and is particularly sensitive to diffusion over
larger distance scales (2). Including the kurtosis term MR signal intensity is
⎟⎠⎞
⎜⎝⎛ +−= KDbDbSS 22
0
6
1exp
where S0 is the signal intensity without diffusion weighting, b is the diffusion weighting
constant, D is the diffusion coefficient and K is kurtosis (2). Kurtosis can thus be measured
with conventional diffusion imaging sequences with at least three b-values.
DKI was performed on five normal controls and three firefighters involved in the
rescue attempts at the World Trade Center. The firefighters suffered from symptoms
including cough, wheezing, shortness of breath, chest pain, and dyspnea. Gradient-echo
diffusion images were acquired on a 1.5T scanner (flip-angle 4°; matrix 80×128; slice
thickness 15mm; FOV 330×380mm; TE 11ms; TR 14ms; b= 0,3,6,9,12 and 15s/cm2).
Fig. 1. Coronal images of a normal control (top) and
firefighter (bottom) with evidence of small airway
disease. Left: ventilation images. Middle: Diffusion
coefficient maps (range 0.0 – 0.6). Right: Diffusion
kurtosis maps (range 0.0 – 1.0). Diffusion is similar in
both subjects but kurtosis is reduced and less
heterogeneous in the firefighter.
Measured parameters were: firefighters D=0.263±0.049, K= 0.213±0.022; controls
D=0.337±0.038, K=0.212±0.024. Although there was no statistically significant difference in
the D (p=0.95), the firefighters had a substantially reduced K with a p value approaching
significance (p=0.098).
Decreased kurtosis in combination with normal diffusion coefficients suggests
bronchiolar constriction in the firefighters, an interpretation supported by the finding of air
trapping demonstrated by CT.
DKI may provide information that is complementary to that provided by conventional
diffusion imaging.
References:
1. X.J. Chen et al. Magn. Reson. Med. 42 (1999) 721; B. Saam et al. Magn. Reson. Med. 44
(2000) 174; D.A. Yablonskiy et al. Proc. Natl. Acad. Sci. USA 99 (2002) 3111.
2. J.H. Jensen et al. Magn. Reson. Med. 53 (2005) 1432; R. Trampel et al. Magn. Reson.
Med. 56 (2006) 733.
94

Toward accurate and precise S/V measurements of lung airspaces using noble-gas diffusion NMR
G. Wilson Millera, Michael Carlb, Gordon D. Cates Jr.ba, and John P. Mugler IIIa,
aDepartment of Radiology, bDepartment of Physics, University of Virginia, Charlottesville, Virginia USA
In-vivo diffusion measurements can be made in lung airspaces using gaseous NMR
signal sources such as hyperpolarized 3He or 129Xe. Whereas the relatively large self-diffusivity of these noble gases is an advantage for accessing long length scales corresponding to the tortuosity limit in porous solids, it a disadvantage for accessing short length scales corresponding to the surface-to-volume ratio (S/V) of lung airspaces [1]. For noble-gas diffusion in normal human lung, extracting S/V values from the short-time-scale limit of the time-dependent diffusivity curve requires that the curve be sampled at diffusion times much less than a millisecond [2]. This requirement generally precludes the use of refocusing RF pulses between individual lobes of the diffusion-sensitizing gradient, and also makes it impractical to generate measurable NMR signal attenuation using narrow gradient pulses. Although quantitative corrections can be applied that compensate for systematic errors resulting from the use of wide gradient pulses [3,2], it is nonetheless difficult to make clean diffusivity measurements subject to these constraints.
We recently developed a new gradient-echo-based pulse sequence for measuring noble-gas diffusion, which provides improved measurement accuracy and precision at sub-millisecond diffusion times [4]. These advantages were demonstrated using both Monte-Carlo simulations and phantom measurements in simple pore geometries. We are currently exploring the ability of our technique to quantify S/V in the pore space between loosely packed microspheres, using 129Xe gas at atmospheric pressure. A significant component of this effort is to characterize the effects of susceptibility-induced background gradients on the measured diffusivities. Taken as a whole, these developments represent a significant step toward establishing the feasibility of making reliable in-vivo lung S/V measurements using NMR of noble-gas diffusion.
This research was supported by NIH grants R01-HL079077 and R21-HL089525, and by Siemens Medical Solutions.
References: 1. R. W. Mair, G. P. Wong, D. Hoffmann, M. D. Hürlimann, S. Patz, L. M. Schwartz, and R.
L. Walsworth, Probing Porous Media with Gas Diffusion NMR, Phys. Rev. Lett. 83 (1999) 3324.
2. G. W. Miller, M. Carl, J. F. Mata, G. D. Cates Jr., and J. P. Mugler III, Simulations of short-time diffusivity in lung airspaces and implications for S/V measurements using hyperpolarized-gas MRI, IEEE Trans. Med. Imaging 26 (2007) 1456.
3. L. J. Zielinski and P. N. Sen, Effects of finite-width pulses in the pulsed-field gradient measurement of the diffusion coefficient in connected porous media, J. Magn. Reson. 165 (2003) 153.
4. M. Carl, G. W. Miller, J. P. Mugler III, S. Rohrbaugh, W. A. Tobias, and G. D. Cates Jr., Measurement of hyperpolarized gas diffusion at very short time scales, J. Magn. Reson. 189 (2007) 228.
95

Human Pulmonary Function with Hyperpolarized 129
Xe
S. Patza, I. Muradyan
a, M.I. Hrovat
b, F.W. Hersman
c, J.P. Butler
d
aBrigham and Women’s Hospital & Harvard Medical School, Boston, MA, bMirtech Inc, Brockton, MA, cUniversity of New Hampshire and Xemed, LLC, Durham, NH, dHarvard
School of Public Health, Boston, MA The function of the lung is gas exchange; avelolar oxygen diffuses into blood and CO2 diffuses in the opposite direction. This is accomplished by the lung’s large surface area (~100m2) due to its fine porous structure together with a thin septal barrier separating alveolar gas and capillary blood. Here, we describe a noninvasive method to determine three functional components of the lung: alveolar surface area per unit volume of gas (S/V), which decreases in emphysematous disease; septal thickness h, which increases in interstitial disease; and capillary transit time τ, important for vascular diseases.
S/V regime
Saturation
Figure 1. Example of human CSSR data.
√t (s0.5)
Blood Flow
The spectrum of 129Xe in the lung exhibits a gas peak at 0ppm and dissolved state peaks at ~+200ppm. A chemical shift saturation recovery (CSSR) pulse technique is used to first saturate the dissolved phase 129Xe magnetization and then observe its recovery1 due to diffusion of magnetized 129Xe from the gas spaces to the septa. The fraction F of the dissolved state signal at time t after the saturation pulse relative to the initial gas phase signal is measured. The data is fit to an analytical form obtained from the solution of a 1D diffusion geometry and includes a constant velocity blood flow term. Input parameters to the model are the diffusivity of 129Xe in tissue and the Ostwald solubility. Fitted parameters are pulmonary S/V, h, and τ. Figure 1 shows sample data from a healthy human subject after inhalation of 1L of 86% enriched 129Xe polarized to ~50%. The field strength is 0.2T. Data (green points) are acquired in a 10s breath-hold. The fitted curve is shown in blue. A red curve, calculated by setting τ→∞, shows septal saturation in the absence of blood flow, where the saturation value depends on h. The early time behavior is ~√t and allows determination of S/V
2.
(a) (b) (c) (d)
Figure 2. Example of single breath XTC for t=62ms. (a-c) serially acquired gradient echo images (d) calculated F(t) map.
To obtain this type of information regionally, we modified the XTC method3 to a single breath-method2; each experiment produces a map of F at a single t. Figure 2 shows 3 gradient echo images serially acquired (a-c). Signal attenuation between images is due to (r1) RF depletion of the nonrenewable hyperpolarization, (r2) T1 decay due to oxygen, and (r3) interphase diffusion. Attenuation between (a) and (b) allows determination of r1r2. Between (b) and (c), attenuation = r1r2r3 where r3 is enhanced due to multiple applications of [180o
dissolved – t] between the two images. Determination of r3 allows calculation of F (Fig 2d). A separate breath of ~1L of hyperpolarized 129Xe is required for each time point to acquire data similar to Figure 1 for each voxel. This work was supported by NIH RO1 HL073632.
References:
1. Butler et al, J Phys: Cond
Matter, 14, L297-L304 (2002). 2. Patz et al, Eur J Rad, 2007. 3. Ruppert et al., Magn Reson Med. 44, 349–357 (2000).
96

Magnetic Resonance Microscopy application to Biofouling in
Porous Media
Jennifer A. Hornemanna,b
, Sarah L. Coddb,c
, Joseph D. Seymoura,b
, and Konstantin
Romanenkoc
aDepartment of Chemical and Biological Engineering, Montana State University
bCenter for Biofilm Engineering, Montana State University
cDepartment of Mechanical and Industrial Engineering, Montana State University
From water service utilities to pharmaceutical processing, biofilms either create
havoc or are crucial to the system function in almost every water-based industrial
process. In subsurface bioremediation, biofilm establishment and maintenance is crucial
to many processes intended to degrade or contain contaminants. Many of these situations
in which biofilm growth needs to be understood involve water transport in a growth
medium that can be interpreted as a porous media. Thus, there is an urgent need to better
understand the structure and transport changes that occur in biofouled porous media.
Magnetic Resonance Microscopy (MRM) techniques have been used to study the
effective change in pore structure and pore connectivity due to biofilm growth and the
impact this growth has on transport phenomena. The porous media used in this study are
model beadpacks constructed from various glass and plastic spheres with diameters
between 100-300 m.
97

MR spectral characterization of diffusion with chemical shift resolution: study of highly concentrated emulsions
S. Lasica,b, I. Åslunda, N. Arteagaa, D. Topgaarda
aLund University, Physical Chemistry 1, Sweden, bUniversity of Ljubljana, Faculty for Mathematics and Physics, Slovenia
Emulsions are important for many technological applications for example in
pharmacy as drug delivery systems and in food or cosmetic products. Diffusiometry is a well-established approach to study morphology of porous materials and emulsions. Self-diffusion of different substances in highly concentrated water-in-oil emulsions have been studied by the pulsed gradient technique [1]. In the case of fairly mono-dispersed emulsions the diffraction pattern of signal intensity vs. phase factor q can reveal the information about droplet size. The effects of finite length gradient pulses in characterising emulsions have been thoroughly examined [2].
The finite gradient pulse effects are not relevant to the modulated gradient spin-echo method (MGSE) [3,4]. It provides information about molecular diffusion in frequency domain. Instead of using gradient pulses it employs harmonically oscillating gradients. This results in spin-echo attenuation, which is proportional to the spectrum of velocity autocorrelation function of the spin-bearing particles. The effect of spin de-phasing, due to diffusion, is accumulated over many gradient oscillation cycles, giving rise to adequate diffusive attenuation on a shorter time scale compared to the pulsed field gradient method.
We present an application of the MGSE method, which uses sinusoidaly shaped gradient pulses separated by 180-degree RF pulses. This produces an apodized cosine gradient modulation waveform, similar to the one employed by Parsons et al. in combination with imaging [5]. The RF pulses used in the presented technique efficiently refocus chemical shifts and de-phasing due to susceptibility differences, resulting in undistorted, high-resolution diffusion weighed spectra. This allows for simultaneous study of several molecular components with different chemical shifts.
The method was used to study highly concentrated water-in-oil emulsion, which consists of 95 wt% 0.2 M tetramethyl ammonium chloride (TMACl) in Millipore water as aqueous phase, 3.5 wt% heptane as oil phase and 1.5 wt% Brij 92 as surfactant. The droplet size is fairly mono-dispersed around 3.3 µm. In the range between 1-20 ms we observe the transition from restricted to free diffusive behavior of water and TMACl, while oil diffusion is occluded but Gaussian.
References: 1. C. Malmborg, D. Topgaard, O. Söderman, J. Colloid Interface Sci. 263 (2003) 270. 2. C. Malmborg, D. Topgaard, O. Söderman, J. Magn. Reson. 169 (2004) 85. 3. J. Stepisnik, Prog. Nucl. Magn. Reson. Spectrosc. 17 (1985) 187. 4. P.T. Callaghan, J. Stepisnik, J. Magn. Reson. A 117 (1995) 118. 5. E. C. Parsons, M. D. Does, J. C. Gore, Magn. Reson. Imaging 21 (2003) 279.
98

Pore surface of cellulose as studied by Low-Resolution NMR
E. Nikolskayaa, Y. Grunin
a, D. Karasev
a, John C. Edwards
b, L. Grunin
a
aMary State Technical University, Lenin sq. 3, Yoshkar-Ola, Mari El, 424000, Russia,
bProcess NMR Associates LLC, 87A Sand Pit Rd, Danbury, CT 06810 USA
Polysaccharides are frequently considered as sorbents since they possess good absorbent ability due to branchy porous structure. The question of saccharides supermolecular organization is controversial so far, so the conception of its porous structure is not absolutely clear. Supramolecular organizations of polysaccharides is normally considered as a combination of crystalline part with well-ordered, highly oriented and densely packed macromolecules and amorphous part which is presented as a less ordered and the most reactive region. Further on we suggest that so-called “surface” region of the sample consists of atoms of glucopyranose ring which are situated on the surface of crystallites and they form nearly all the amorphous part. “Internal” regions of polysaccharides are densely packed areas with crystal-like behaviour. Surface between crystallites constitutes pores which have mainly fissured form. So it could be supposed that amorphous part organizes porous structure of polysaccharide.
Due to last tendencies NMR relaxation is very convenient method for investigation of polysaccharides sorption ability and our study basically oriented to exploit this method.
Acquired for cellulose decay contains quickly falling component, which corresponds to crystallites and slowly falling component which is referred to amorphous phase of polysaccharide. FID data potentially could be used for determination of cellulose crystallinity extent and for its porosity evaluation. But the difficult task of the FID data interpretation is caused by impossibility of satisfactory fitting of the decay.
The Fourier transformation of FID signal measured on the shift from resonance frequency offers more informative data. Doublet line width ∆ωdoubl is referred to rigid lattice protons of ordered regions with low mobility. Central peak, which is narrower (∆ωCP) comprises contributions of reorienting parts of macromolecules in amorphous phase and adsorped water signal.
The central peak of cellulose spectrum has a complicated form. There are two wide lines, which are observed in condition of high magnetic field stability and large number of scans. The explanation of this fact requires additional scientific investigations. In our work different types of cellulose were treated with heating processing at the range of temperatures from 106ºC to 136ºC. Crystallinity extent, which is the most prevalent and the most studied characteristic of polysaccharides structure, finds good correlation with the height of central peak. While the temperature of treatment increasing the amplitude of central peak is decreasing.
Time of spin-lattice relaxation is the characteristic of structural order. It flows from the crystallites, where it goes slowly, to flow-out centers of magnetization located on the surface. So the longitudinal relaxation T1 is bound up with crystallinity extent. Our investigations show obvious dependence the relaxation time T1 on crystallinity extent. The higher crystallinity extent the greater T1 value.
Crystallinity extent and the dimensions of crystallites determine the porosity of cellulose. The overall amount of pores is reduced with crystallites dimensions rise. There is a possibility to predict both the sorption ability and pore volume of cellulose and its crystallinity extent.
Thus proton magnetic longitudinal and transverse relaxation measurements turn to be a promising tool to determination of porous structure of natural sorbents like polysaccharides.
99

Spatial Microheterogeneity of Polyelectrolyte-Protein Coacervates
revealed by 1H Pulsed Field Gradient NMR Diffusion Study
Amrish R. Menjoge1, A. Basak Kayitmazer
2#, Paul L. Dubin
2 and Sergey Vasenkov
1
1 Department of Chemical Engineering, University of Florida, Gainesville, FL 32611
2 Department of Chemistry, University of Massachusetts Amherst, MA 01003
# Present address: Biomedical Engineering, Northwestern University, Evanston, IL 60208
Polyelectrolyte-protein coacervates are dense macromolecular solutions composed of a protein
and an oppositely charged polyelectrolyte. Coacervates can be used in such applications as
micro-encapsulation of active food components, active drug ingredients or enzymes, since all
essential properties of proteins remain preserved in the coacervate environment. Understanding
the structure of coacervates on the submicrometer length scale is of importance for using
coacervation to its fullest potential. Here, we report the results of pulsed field gradient (PFG)
NMR studies of diffusion in coacervates formed from a globular protein (Bovine Serum
Albumin) and poly(diallyldimethlyammoniumchloride), a narrow weight distribution cationic
polymer. High magnetic field gradients (up to 30 T/m) were used for the observation of
polyelectrolyte diffusion in coacervates on the length scale as small as 100 nm. Diffusion
properties of polyelectrolyte in coacervates formed at different pH and ionic strengths have been
investigated. Our results indicate the presence of dense domains with sizes in the range of 100
nm and larger formed by the protein and the polyelectrolyte. These domains were observed to be
in a process of constant formation and breakup on a time scale of milliseconds. The domains are
surrounded by a continuous dilute phase, which is characterized by a lower concentration of both
species. These results represent a significant step towards understanding the structural and
dynamic properties of coacervates on the nanoscale.
100

Pore Opening and Closing in Biodegradable Polymers and its
Effect on Mass Transport Studied by NMR Cryodiffusometry
E .L. Perkinsa, S. P. Rigby
a,*, K. J. Edler
b, J. P. Lowe
b
Departments of aChemical Engineering and
bChemistry, University of Bath, Claverton
Down, Bath, BA2 7AY, UK.
NMR cryodiffusometry has been used to study the structural evolution of poly(lactic-
co-glycolic acid) (PLGA) microspheres prepared by a double emulsion (w/o/w) technique.
The mass transport of water within the polymer matrix was studied as a proxy for the
mobility of small drug molecules entrapped for controlled release. Over time, it was found
that the matrix ‘pores’ open and close as a result of water ingress between the polymer chains
constricting pores and forcing water into new spaces. In cryoporometry, the freezing curve is
often neglected due to a lack of clear understanding of hysteresis mechanisms. However, in
our previous work [1], we have shown that this curve can provide information on pore neck
sizes. Figure 1 shows the temporal evolution of the bimodal neck size distribution following
immersion of microspheres. The neck size for the major peak first shrinks and then grows,
while the minor peak grows in intensity but remains at a constant neck size. It is likely that
the evolution of the neck sizes for the matrix pores controls the mobility of drug molecules
within the matrix, and therefore influences the drug release profile [2]. The melting curve
pore size distribution remains unchanged over the same period (not shown).
0
0.1
0.2
0.3
0.4
0.5
0.6
0.7
0.8
0.9
1
1 1.5 2 2.5
Nominal pore neck diameter/nm
dI/dD /arbitrary units
Day 1
Day 10
Day 20
Day 27
Day 34
Day 42
Fig. 1: Temporal evolution of the nominal diameter (D) pore necks of the PLGA
matrix.
Results from cryodiffusometry experiments for molten aqueous phase solely within
the polymer matrix gave rise to curved log-attenuation plots, suggesting a heterogeneous
system, which fitted well to a two-component model. Hence, two distinct diffusive
environments exist for water within the polymer matrix pores. Currently the drug release
mechanism from PLGA microsphere systems is not fully understood, but with the additional
use of cryodiffusometry, a rich data set can be found to enhance the understanding of these
complex systems to improve the design of controlled drug delivery systems.
References:
1. E.L Perkins, J.P. Lowe, K. J. Edler, N. Tanko, S. P. Rigby, Chem. Eng. Sci. 2008,
doi:10.1016/j.ces.2007.12.022.
2. Kang, J.C. and S.P. Schwendeman, Molecular Pharmaceutics, 2007. 4(1) 104-118.
101

Temporal correlation function around spheres and cylinders
C. H. Ziener1, T. Kampf1, V. Herold1, P. M. Jakob1, W. R. Bauer2, W. Nadler3
1Experimentelle Physik 5, Universitat Wurzburg, Wurzburg, Germany2Medizinische Klinik and Poliklinik I, Universitat Wurzburg, Wurzburg, Germany3John von Neumann Institute for Computing, Forschungszentrum Julich, Germany
Introduction: Signal attenuation in NMR is partly due to incoherent dephasing of nuclearspins. This could be caused by independent stochastic motion of nuclear spins in inhomoge-neous local magnetic fields, e.g. created by magnetized objects or voids inside magnetizedbulk materials. If the magnetization time decay is not monoexponential the description withthe transverse relaxation time T ∗
2as single parameter will poorly describe the signal and the
underlying geometry of the magnetic field.Another way to describe the effects of diffusion is in terms of a correlation function [1].
Since it was demonstrated recently that the frequency correlation function of nuclear spinscan be measured directly in NMR experiments [2], a theoretical analysis of such functions isof paramount interest.Methods and Results: In this work we provide a numerically exact analysis of that cor-relation function K(t) for restricted diffusion in the inhomogeneous field around cylindersand spheres (cf e.g. Fig. a). With the local larmor frequency ω(r) and the probabilitydensity p(r, r0, t) to find a spin after time t at position r if it started at r0 K(t) is given as
K(t) =1
V
∫V
d3r
∫V
d3r0 ω(r) p(r, r0, t) ω(r0) .
V is the diffusion volume. K(t) is solved in terms of a spectral expansion of p(r, r0, t).The functional form may exhibit 3 regimes: after an initial transient an algebraic regime
with a t−d/2 time dependence - d being the space dimension - may form followed by an expo-nential cutoff due to finite system size effects. The main parameter controlling the formationand range of the regimes is the volume fraction of the magnetic inhomogeneities. Comparingthe algebraic regime with the case of long time behavior in unrestricted diffusion equal timebehavior is found and can be used at this time scale. The results obtained in this work mayhave implications on data analysis and interpreting results and could help choosing a properfit function for better parameter estimation.
RS
ϕ
θR
r
B0
a) b)
Fig. a) Scheme of a spherical inho-mogeneity inside a spherical voxel b)Scheme of a double logarithmic plot ofa correlation function for this geometry(K exact, Ka short time limit from un-restricted diffusion, Kb long time limitfrom unrestricted diffusion, Kc expo-nential cut off from restricted diffusion,τS correlation time, a, b and c denotesthe different regimes)
References[1] J. H. Jensen, R. Chandra, Magn. Reson. Med. 44, 144 (2000).
[2] J. H. Jensen et al., Magn. Reson. Med. 55, 1350 (2006).
102

ANAHESS, a new second order inverse
Laplace transform algorithm
Åsmund Ukkelberga, Geir Humborstad Sørland
b, Eddy Walter Hansen
a and Hege C.
Widerøec
aThe University of Oslo (UiO), Norway,
bAnvendt Teknologi AS, Harstad, Norway,
cStatoilHydro Research Centre, Trondheim, Norway
Keywords: inverse Laplace, Hessian, discrete solution, analytical expressions
The operation known as the Inverse Laplace Transform (ILT) is frequently applied in
the numerical analysis of nuclear magnetic resonance experiments. Estimates of properties
such as pore size distribution are frequently made on the basis of numerical ILT operations.
Good ILT algorithms are therefore essential when extracting physical information from NMR
experiments.
The ILT is the decomposition of a response curve in the first order case (1D-ILT) or a
response surface in the second order case (2D-ILT) into a sum of exponentials. It is well
known that this problem is ill conditioned, and that interpretation of the results should be
considered with caution.
The aim of our research was to develop an algorithm which performs 2D-ILT with
minimal assumptions, and produces models that are as simple as possible. We have
constructed an inverse Hessian (or Gauss-Newton) algorithm with analytical expressions for
the gradient and the Hessian matrix. Non-negative constraints are implemented by defining
ILT parameters as squares of the working variables in the minimization problem.
We propose a new algorithm called ANAHESS which computes 2D-ILT with a
specified number of discrete exponential components. Comparative studies show that the
sum of squared errors gets lower with a fewer number of components when using ANAHESS
than with a state of the art continuous distributions algorithm.
Given the premise that the ILT is ill conditioned, our conclusion is that numerical
solutions to ILT problems should be as simple as possible, with discrete components rather
than estimates of continuous distributions.
103

Uncertainties in the Assignments of Rock Porosities Obtained from
Laplace Inversion of NMR Relaxation Logs
Indrajit Saha1, 2, John Franck1, 3, Tim Hopper1, Boqin Sun4, Yi-Qiao Song 1
1Schlumberger-Doll Research, Cambridge, MA 02139
2Department of Chemistry and Biochemistry, Southern Illinois University Carbondale, IL 62901 3Department of Chemistry, University of California Berkeley, CA 94720 4Chevron Texaco Energy Technology Company, San Ramon, CA 94583
Abstract: Calculation of uncertainties from the Laplace inversion of NMR data used in the determination of oil field rock porosity is an important and under-valued area. An improved technique for calculating the uncertainty of NMR data has been developed. This method, denoted as A10 uses a constraint based on the means of the first 10 echoes in addition to the χ2 constraint used in the Parker et. al. method [4,5]. The Parker method is sensitive to the characterization of noise in the raw data and as a result the bounds can vary significantly. This new method produces much tighter, more realistic values for the porosity bounds. Using advanced processing algorithms and multi level processing platforms, we were able to reduce the calculation time down to minutes.
Figure-1: Left panel: The upper and lower bounds of rock porosities using A10 (green) and original Parker (blue) method. Right Panel: The relative widths of the ranges as determined by both methods. The inset highlights the differences between the methods. [1] Kleinberg et al.: The Log Analyst: 37(6), 20 (1996) [2] Song et al.: J. Chem. Phys.: 122, 104104 (2005). [3] Skilling et al.: Kluwer Academic: 45–52 (1989) [4] Parker et al.: J. Magn. Reson.: 174(2), 314 (2005) [5] Song et al.: Magn. Reson. Imaging: 25; 445 (2007)
104

Numerical modeling of the carbonate and the sandstone formations
Seungoh Ryu
Schlumberger Doll Research, Cambridge, MA, USA
It is of critical interest in the well-logging to make a reliable estimation of permeability of the formation via more accessible properties such as the length scale derived from NMR response. When the pore geometry is simple (quasi-periodic glass bead packs or clean sandstones), there are working empirical models that correlate the porosity and the length scale to the permeability. For heterogeneous carbonate rocks, such laws, based essentially on the notion of tortuous pipes of an effective hydraulic diameter and simplified interpretation of the NMR data, fail to give a consistent prediction and require an ad-hoc modification specific to the formation. The presence of ramified channels of varying capacity in these systems brings in a transport behavior qualitatively distinct from that of a quasi-periodic system. Heterogeneity and diffusive coupling further undermine the validity of the MR interpretation in extracting the controlling length scale parameter. Using the parallel Lattice Boltzmann and random walk simulations, we study transport and diffusion properties in various types of pore geometry, from simple 2D micro-fluidic mazes, 3D glass-bead packs and sandstones to more complex carbonates. In this work, we focus on the distinction between the sandstones and the carbonates as manifested in the numerically observed flow profile and diffusive/relaxation properties and try to develop a sound interpretational framework for complex porous media beyond the glass bead packs and sandstones. The author would like to thank colleagues at SDR and SCR for providing me with tomograms of carbonate rocks.
105
Spin Dynamics Simulations of Multiple Echo Spacing Pulse
Sequences in Grossly Inhomogeneous Fields
R. Heidlera, H. N. Bachman
a, Y. Johansen
a
aSchlumberger Oilfield Services, Sugar Land, TX 77478
Pulse sequences with multiple lengths of echo spacings are used in oilfield NMR
logging for diffusion-based NMR applications such as rock and fluid characterization. One
specific implementation is the so-called diffusion editing sequence comprising two long echo
spacings followed by a standard CPMG at a shorter echo spacing1. The echoes in the CPMG
portion contain signal from both the direct and stimulated echoes.
Modern oilfield NMR logging tools are designed for continuous depth logging of
earth formations by projecting both the static (B0) and dynamic (B1) fields into the formation.
Both B0 and B1 profiles are grossly inhomogeneous which results in non-steady-state
behavior in the early echoes. The spin dynamics effects present a challenge for processing the
echo amplitudes to measure porosity (amplitude extrapolated to zero time) and attenuations
for fluid or pore size characterization.
In this work we describe a calculation of the spin dynamics of the diffusion editing
sequence with two long echo spacings. Quantitative understanding of the early echoes allows
for improved characterization of heavy oil, gas, and other applications. The calculation takes
into account full B1 and B0 field maps, and comparisons will be made for sensors and
parameters typical of oilfield logging tools and environments.
References:
1. Hürlimann et al., Journal of Magnetic Resonance 157, 31–42 (2002).
106

A numerical analysis of NMR pore-pore exchange measurements using Xray-μCT techniques
C. H. Arnsa, Y. Meleana, K.E. Washburnb, and P.T. Callaghanb
aAustralian National University, bVictoria University of Wellington
Pore-pore exchange experiments are a recent development1 and hold great promise to spectrally derive length scales relevant for transport in porous media. In particular, NMR Laplace techniques like relaxation or exchange spectroscopy reach a spectral length scale resolution much higher than available from μCT images, but provide no spatial resolution. A combination of both techniques can lead to better models for regions of unresolved porosity in μCT images, implying increased accuracy for transport calculations based on such images.
In this study we carry out numerical NMR pore-pore exchange experiments on selected Xray-CT images of sandstones and carbonate rock, while at the same time tracking information about the geometry and topology of the pore space. In particular, we use random walk techniques and observe the radius of gyration for random walks in each encoding or diffusion interval as well as measuring local diffusion averaged relaxation rates in a forward modeling approach, including the effect of internal fields. Diffusion averaged internal field distributions and relaxation time distributions are in good agreement with experiment. We use pore partitioning techniques and geometric distance fields to relate the pore-pore exchange and relaxation spectra to underlying structural quantities, namely pore size, initial distance to a relaxing surface, and travelled distance. In addition to the concept of ‘pores’ and ‘throats’, e.g. convex/simple objects within the pore space connected by narrow constrictions, we use a diffusion averaged local surface to volume ratio to compare simulation data with experimental measurements.
References: 1. K. E. Washburn and P.T. Callaghan, Phys. Rev. Lett. 97 (2006) 175502.
107

Relaxation-relaxation exchange experiments with portable
Halbach-Magnets
A. Haber,a R. Fechete,
b J. Perlo,
a F. Casanova
,a E. Danieli,
a D. E. Demco,
a B. Blümich
a
aInstitute of Technical and Macromolecular Chemistry, RWTH Aachen University, Germany, bDepartment of Physics, Faculty of Material Science and Engineering, Technical University
Cluj-Napoca, Romania.
Relaxation-relaxation exchange experiments were performed on two-phase gas-liquid
systems. To conduct such experiments at low field with mobile NMR under the extraction
hood, new Halbach-Magnets were designed and built. One is characterized by maximum
simplicity, the other by an improved homogeneous magnetic field and a maximum accessible
sensitive volume. The construction of the magnets and their performance are described and
the results of first experiments are reported. We anticipate that this and related 2D NMR
experiments will be of great use to monitor multi-phase reactions on line.
References:
1. H. Raich, P. Blümler, Design and construction of a dipolar Halbach array with a
homogeneous field from identical bar magnets: NMR Mandhalas, Concepts in Magnetic
Resonance 23B (2004) 16-25.
2. S. Anferova, V. Anferova, J. Arnold, E. Talnishnikha, M. A. Voda, K. Kupferschläger, P.
Blümler, C. Clauser, B. Blümich, Improved Halbach sensor for NMR scanning of drill
cores, Magnetic Resonance Imaging 25 (2007) 474-480.
108

Non-invasive NMR profiling of painting layers
Federica Presciutti,1 Juan Perlo,2 Federico Casanova,2 Stefan Glöggler,2 Costanza Miliani,1 Marika
Spring,3 Bernhard Blümich,2 Brunetto G. Brunetti,1 Antonio Sgamellotti1
1 Centre of Excellence SMAArt and ISTM-CNR c/o Chemistry Department of University of Perugia,
Via Elce di Sotto 8, Perugia 06123 Italy.
2 Institute of Technical and Macromolecular Chemistry, RWTH Aachen University, D-52056 Aachen, Germany.3 Science Department of National Gallery of London, Trafalgar Square London, WC2, UK.
Restoration and conservation of paintings requires in-depth knowledge of the materials used, their properties as function of time, the environmental exposure and the distribution of materials in artwork. As moving paintings for analysis is connected with great effort or not possible at all, it is advantageous to move non-invasive diagnostic equipment to the paintings. Common non-invasive methods of analysis are restricted to surface layers, and lower layers cannot be accessed non-destructively. This is why we investigated the use of single-sided NMR sensors as an alternative method. With the Profile NMR-MOUSE, deeper layers can be accessed non-invasively to collect information about the stratigraphy of paintings and their support.This work reports results obtained by the Profile NMR-MOUSE. Binder aging and the thickness of proton-rich layers in paintings were characterized in situ without contact to the surface. The suitability and accuracy of this method were tested on two easel painting models consisting of copper acetate and cobalt blue in comparison to optical and electron microscopy. Depth profiles were measured that revealed amplitude variations consistent with the different layers of the paintings. The accuracy of thickness values determined non-destructively by NMR was conformed by destructive optical microscopy of painting models to be of the order of 20 µm. Different Italian Renaissance paintings were analyzed by the NMR-MOUSE in the National Gallery of Umbria in Perugia. My measuring NMR depth profiles at contingent spots of a painting, it is possible to build a 3D map of the statigraphy. Furthermore, the nature of the binder and its aging characteristics can be studied by their T1 and T2 relaxation signature. Artificially aged and naturally aged tempera binders can at least in the cases studied be differentiated. This makes it possible to identify recently restored sections in a painting and raises the hope to potentially identify forged tempera paintings.
109

Single-shot depth profiling with a single-sided NMR sensor:
application to skin measurements
Ernesto Danieli, Juan Perlo, Federico Casanova, and Bernhard Blümich
Institut für Makromolekulare Chemie, RWTH-Aachen University, Germany
Portable open NMR probes built from permanent magnets like the NMR-MOUSE offer several
advantages over conventional NMR systems. They are small in size, low in cost and robust.
However, associated with the open geometry of the magnets are a number of challenging
limitations. The strong stray field gradient of such sensors limits the thickness of the sensitive
slice to be much below one millimeter, imposing an important restriction to the experimental
time required to profile large depth ranges into the sample [1]. In this work we exploit the
concept of field shimming by means of a shim unit based on permanent magnet blocks [2] to
strongly reduce the magnetic field gradient along the depth direction while keeping the lateral
components under control. Under these conditions depth profiles over a range of some
millimeters can be measured with a resolution of 50 µm in a single-shot as the Fourier transform
of the echo signal acquired in the presence of a static gradient of about 1 T/m. The increment in
the thickness of the sensitive volume eliminates the need for repositioning the sensor with respect
to the object allowing us to cover the whole depth range in a single measurement. An important
advantage of this new magnet design is that by proper design of the shim unit, the reduction in
the static gradient is not achieved at expenses of a strong reduction in the magnitude of the
average field, a price usually paid in conventional designs. The field of the first prototype is
about 0.3 T, which is comparable to the field generated by a previous sensor of the same size [3].
References 1. J. Perlo, F. Casanova, and B. Blümich, Profiles with microscopic resolution by single-sided
NMR, J. Magn. Reson. 176, 64 (2005).
2. J. Perlo, F. Casanova, and B. Blümich, Ex Situ NMR in Highly Homogeneous Fields: 1H
Spectroscopy, Science 315, 1110 (2007).
3. J. Perlo, F. Casanova, and B. Blümich, 3D imaging with a single-sided sensor: an open
tomograph, J. Magn. Reson. 166, 228 (2004).
110

Magnetic Field Gradient Monitor (MFGM)
Hui Han, Bruce J. Balcom
MRI Centre, Department of Physics, University of New Brunswick, Fredericton, N.B, E3B
5A3 Canada
Porous media are of considerable interest in a very diverse range of activities. Pore
diameters range from subnanometer to macroscopic dimensions. Frequently their use or
importance is intimately connected with their transport properties. Diffusion and flow
measurements in porous systems are therefore of practical relevance.
Pulsed-field-gradient NMR (PFG NMR) has proven valuable for the study of both
diffusive and coherent molecular motions. Accurate PFG NMR studies of motions of large
molecules are, however, at present still difficult. For large, slowly moving species the
required gradient pulses must have large amplitudes, and the resulting eddy current fields can
cause errors in the phase encoding [1-2]. Restricted diffusion of smaller molecules in porous
media encounters similar difficulties.
Despite continued advances in NMR hardware, imperfections in the magnetic field
evolution during measurements still hamper numerous MR procedures. Large and fast
gradient switching provokes undesired dynamic field perturbations by various mechanisms
such as eddy currents, limited gradient bandwidth or heating effects. Reproducible field
perturbations can be determined approximately by existing measurements [3-5].
In this work we will present a novel method, related to but significantly different from
our previous methods [6]. We will compare our new method to other recent advances in
magnetic field gradient waveform/k-space trajectory measurement. Our new method
significantly improves applications, which either require high gradient waveform fidelity
and/or suffer from eddy current distortions (i.e. diffusion, flow, and phase contrast imaging).
References:
1. E.V. Meerwall, M. Kamat, J. Magn. Reson. 83 (1989) 309-323
2. S.J. Gibbs, C.S.Johnson, , J. Magn. Reson. 93 (1991) 395-402
3. G. Mason et al. Magn Reson Med. 38 (1997) 492-496
4. Duyn et al. J. Magn. Reson. 132 (1998) 150-153
5. Pruessmann et al., ISMRM 2005, p.681
6. D.J. Goodyear, M. Shea, B.J. Balcom, J. Magn. Reson. 163 (2003) 1-7
111

Compositional analysis of materials with unilateral NMR
Oleg V. Petrova , Igor V. Mastikhin
a, Bruce J. Balcom
a
aMRI Centre, Department of Physics, University of New Brunswick, Fredericton, Canada
We were interested in developing experimental protocols that enable the
discrimination between different sorts of liquid (e.g. oil and water) on the basis of their
molecular mobility, using unilateral (open-access) magnets. Because of the field
inhomogeneity inherent to unilateral magnets, our study was bounded by spin echo
experiments, particularly by those based on the Carr-Purcell-Meiboom-Gill (CPMG)
sequence. Here we present two ways to utilize CPMG for our purpose. First is to employ a
difference in relaxation times (T2) of the constituents, which is manifested in a multi-
exponential decay of a CPMG signal. To know how much of each T2 component is present in
the signal, we performed a multivariate regression of the decays, using a classical least-
square algorithm. A performance of the method is demonstrated on model food samples,
made of water and cod oil mixture stabilized by agar, as well as on a series of bitumen sands.
The prediction accuracy is strongly dependent of whether the calibration samples had
characteristic T2 similar to those in the test samples. Thereby, a proper choice of calibration
samples is the main factor of accuracy.
The second way is to perform a diffusion-weighted CPMG experiment, where
constituents are discriminated through a difference in their diffusivity rather than T2. The
diffusion delay that is needed for efficient suppression of a ‘faster’ constituent (water)
depends on the magnetic field gradient, hence the method includes a respective calibration
procedure. Once an appropriate diffusion delay is found, the amount of a ‘slow’ constituent is
proportional to the CPMG amplitude. This method is insensible to the T2 variation over the
samples, as we demonstrate here on example of commercial beef samples, but requires for
slower and faster diffusing components to have comparable T2.
112

Design methodology of a unilateral NMR apparatus
S. Utsuzawaa, E. Fukushimab, Y. Nakashimac
aNew Mexico Resonance, Albuquerque, NM, bABQMR, Albuquerque, NM, cAIST, JAPAN
Unilateral NMR apparatus using a barrel magnet, which was originally introduced by
Fukushima and Jackson [1], was found to be useful for investigating away from the apparatus
due to the large sample volume [2]. However, it was pointed out that there is a non-negligible
contribution from the regions with large magnetic field gradients. This problem is similar to
the one already known for the CMR (Combinable Magnetic Resonance) by Schlumberger [3].
In the presence of magnetic field gradients, diffusive motion leads to a signal decay that will
augment the normal T2 decay. Due to the complex pattern of the field gradients of the barrel
magnet, it is not straightforward to extract the intrinsic T2 value. Therefore, it is desired to
reduce the contribution from such regions.
Local sensitivity is defined by B0 and B1 distributions, both of which show complex
patterns on a unilateral NMR apparatus. Thus, it is not straightforward to obtain the optimum
setup just by improving the homogeneity of one of the magnetic fields. Therefore, we try to
accomplish our goal by using a sensitivity map for evaluation. The voltage induced in the coil
from a uniform sample in grossly inhomogeneous fields can be written as [3]
drtrmrFI
rrBtV yxyx ,
,0
12
0,. (1)
Here, F(Δω0) is the frequency response of the detection system, including the coil response
and any hardware or software filters. The quantity mx,y(r, t) is the transverse magnetization at
point r and time t, which depends on both hardware properties and pulse sequence. Figure 1
shows a sensitivity map calculated for the current apparatus with a barrel magnet and double-
D shaped rf coil. Radially extending lines correspond to the regions with large field gradients.
In order to obtain a coil design that only excites the region with a small field gradient,
Δω0 distribution weighted by sensitivity at each point was calculated from Eq. (1) with
changing the position and length of the straight wires composing a double-D coil. Figure 2
shows a sensitivity map with improved Δω0 distribution, which was obtained as a result of
brute-force procedure in a relatively small search space. By using an appropriate optimization
algorithm, it is expected to extend the search space that may lead to a better solution.
Reference 1. E. Fukushima and J. A. Jackson, U.S.Patent No. 6,489,872.
2. S. Utsuzawa and E. Fukushima, 9th
ICMRM, Aachen, Germany (2007).
3. M.D. Hülimann and D.D. Griffin, J. Magn. Reson. 143 (2000) 120-135.
Fig. 1. Sensitivity map for the current apparatus.
Surface of the apparatus is located at the bottom of
the figure. Radially extending legs correspond to the
regions with large field gradients.
Fig. 2. Sensitivity map for the new coil design.
Contribution from the radially extending legs is
reduced from Fig. 1.
113

Strategies and New Technologies for Improved Production of
Hyperpolarized 3He and
129Xe
Daniel Chonde1, Wilson Barros
1, Chih-Hao Li
1,2; Matthew S. Rosen
1,2; Michael Barlow
3;
Ross W. Mair1; Ronald L. Walsworth
1, 2
1 Harvard-Smithsonian Center for Astrophysics, Cambridge, MA, USA. 2 Department of Physics, Harvard University, Cambridge, MA, USA.
3 Sir Peter Mansfield Magnetic Resonance Centre, Univ. of Nottingham, Nottingham, UK.
NMR and MRI with hyperpolarized noble gases have a myriad of applications in medicine
and material science, including porous and granular media. In our experiments, nuclear-spin
polarized 129
Xe or 3He gases are produced by optically pumped spin-exchange with Rb
atoms. Signal-to-noise efficiency is generally limited by either low polarization or slow
production rates. One key technical problem in optimizing 129
Xe or 3He polarization levels is
the amount of obtainable resonant laser light from the current generation of Laser Diode
Arrays (LDA), which have broad optical spectra (see Fig.1). A recent solution has been the
development of Volume Holographic Gratings (VHG) that self-seed the laser to provide a
tunable narrow resonant line output with only minimal laser power reduction [1]. We have
recently employed novel, prototype-commercial VHG-narrowed lasers for spin-exchange
optical pumping of noble gases for the first time [2].
Fig 1: Laser line-shape from a
typical LDA. The pink line is
the measured LDA output; the
green line is the laser spectrum
after traversing the optical
pumping cell. The blue line is
the calculated absorption by Rb
during 129
Xe spin exchange.
Fig 2: Laser line-shape from a
commercial VHG-line-narrowed 30W
laser. The spectra were taken after the
light has traversed the 3He optical
pumping cell. Notice that the line-
width of the laser is ~ 0.2 nm and all
the laser power is absorbed when the
cell temperature is at 190°C.
Fig 3: Simulated magnetic field
plots, and contours showing the
calculated 3He T1 due to diffusion
in field gradients. The Helmholtz
pair previously used to provide
the holding field for optical
pumping (left), and the modified
three-coil design (right).
For hyperpolarized 3He in particular, the time required to polarize a suitable volume of gas (~
15-20 hours for ~ 0.5 L) has also been a major obstacle. To address this problem, we have
designed four storage cells to hold the hyperpolarized 3He gas in our system for 30-40 hours
with minimal polarization loss. This design required a much more homogeneous magnetic
field region than had been used for optical pumping alone. Adding another coil at the center
of the polarizer, in addition to the previous Helmholtz pair, has increased the working volume
by a factor of 6 as shown in Fig. 3 [3]. The storage cells will then be coupled with a switch to
Rb/K hybrid spin-exchange [4], which can enhance 3He production rates by a factor of 4.
1. F. Havermeyer et al., Volume holographic grating-based continuously tunable optical filter, Opt. Eng., 43,
2017 (2004).
2. R. Mair et al., Towards Posture-Dependent Human Pulmonary O2 Mapping using Hyperpolarized 3He and an
Open-Access MRI System, in Magnetic Resonance Microscopy, J. Seymour, S. Codd eds., in press (2008).
3. J. Wang et al., An improved Helmholtz coil and analysis of its magnetic field homogeneity, Rev. Sci.
Instrum., 73, 2175 (2002).
4. E. Babcock et al., Hybrid Spin-Exchange Optical Pumping of 3He, Phys. Rev. Lett., 91, 123003 (2003).
114

Low cost CE-NMR with microcoils for chemical detection Julie L. Herberg
1, Kristl Adams
1, Greg Klunder
1, Vasiliki Demas
1, Vince Malba
1,
Anthony Bernhardt1, Lee Evan
1, Chris Harvey
1, and Robert Maxwell
1,
1Lawrence Livermore National Laboratory, 7000 East Ave, Livermore, CA 94550
Understanding speciation in solids and solutions is important for environmental and
toxicological purposes. Capillary electrophoresis (CE) is a simple rapid separation
method that can be used to identify species in solution. One of the challenges with CE is
obtaining a method of direct detection that can provide speciation information. Nuclear
magnetic resonance (NMR) has been used to identify chemical species in aqueous
solutions and has also been coupled to CE. We are developing separation protocols to
determine the speciation of chemical complexes in solutions with minimal perturbation to
the original sample equilibrium. On-line NMR measurements will be made downstream
of the UV detector. We will discuss our development of a low-cost microcoil CE-NMR
system for in situ characterization of samples of interest.
Prepared by LLNL under Contract DE-AC52-07NA27344.
115

A new spin exchange optical pumping (SEOP) modality for
hyperpolarized 129
Xe production and use in porous media
M. J. Barlowa, N. Whiting
b, P. Nikolaou
b, N. Eschmann
b, R. Mair
c & B. M. Goodson
b
aSir Peter Mansfield Magnetic Resonance Centre, Univ. of Nottingham, Nottingham, UK
bDept of Chemistry and Biochemistry, Southern Illinois University, Carbondale, IL, USA
c Harvard-Smithsonian Center for Astrophysics, Cambridge, MA, USA
Recent studies using hyperpolarized 129
Xe as the fluidizing gas to probe exchange
measurements in this system were subject to extreme temporal averaging due to the very low 129
Xe polarization – see Fig. 1 [1]. The requirements of a continuous flow of hyperpolarized 129
Xe and that it not be diluted with another gas of high diffusivity severely limits the
polarization that can be achieved by conventional continuous flow spin exchange optical
pumping (SEOP). The low polarization is a combination of short residence time of the xenon
in the optical pumping cell and the high partial fraction of xenon leading to higher electronic
Rubidium spin destruction. In an attempt to improve SEOP efficiency and thus xenon
polarization we used a frequency narrowed laser based on Volume Bragg Grating (VBG)
techniques developed by our team [2]. Preliminary results in a continuous flow cell using a
90% Xe, 10% Nitrogen mix showed a tripling of polarization levels compared to pumping
with a conventional broad-band laser diode source [3]. Best 129
Xe polarization was achieved
with the narrowed laser pumping on the wings of the Rb absorption profile [3]. Further
investigation of pumping with a VBG laser both in continuous flow and stop-flow modalities
has lead to the discovery that the achievable 129
Xe polarization is sensitive to the
interdependence of the optimal cell temperature and the Xe density [4]. We report here for
the first time record high levels of 129
Xe polarization at high partial fraction of xenon within
the SEOP cell – see Fig. 2. The levels achievable will have profound impact on experiments
in porous and granular media allowing non-averaged single shot NMR spectra to be recorded.
This method will also enable stop-flow production for 129
Xe clinical lung MRI [4].
References:
1. T. Pavlin et al., Appl. Magn. Res. 32 (2007) 93.
2. M.J. Barlow et al., Proc. 46th ENC Providence RI USA (2005).
3. R.W. Mair et al., Magn. Reson. Imaging. 25 (2007) 549
4. N. Whiting et al., Proc. 49th
ENC Pacific Grove CA USA (2008).
−10 −5 0 5 10 15 20 25 30 350
5
10
15
20
25
Frequency (kHz)
Arb
itrar
y U
nit
1525
3545
5565
7585
95105
125 SCCM
12−8 −6 −4 −2 0 2 4 6 8 10
00.10.20.30.40.50.60.70.80.9
45 SCCM
Fig. 1: Plot of Xe spectra for range of
flow rates through the bed. Inset is for
case of 45 SCCM
Fig. 2: Xenon polarization as a function of cell
temperature and partial fraction of xenon within a
2000 Torr mix. Balance of mix is Nitrogen. All
results were taken with a 30W VBG laser module.
116