Poster Layout
18
Errors in Viking Lander Atmospheric Profiles Discovered Using MOLA Topography Withers, Lorenz, and Neumann LPSC 2002 Abstract #1294 Abstract’s Abstract: Each Viking lander measured a topographic profile during entry. Comparing to MOLA, we find a vertical error of 1 – 2 km in the Viking trajectory. This introduces a systematic error of 10- 20% in the Viking densities and pressures at a given altitude.
-
Upload
blair-cain -
Category
Documents
-
view
38 -
download
0
description
Errors in Viking Lander Atmospheric Profiles Discovered Using MOLA Topography Withers, Lorenz, and Neumann LPSC 2002 Abstract #1294. - PowerPoint PPT Presentation
Transcript of Poster Layout
Errors in Viking Lander Atmospheric Profiles Discovered
Using MOLA Topography
Withers, Lorenz, and Neumann
LPSC 2002Abstract #1294
Abstract’s Abstract: Each Viking lander measured a topographic profile during entry. Comparing to MOLA, we find a vertical error of 1 – 2 km in the Viking trajectory. This introduces a systematic error of 10-20% in the Viking densities and pressures at a given altitude.
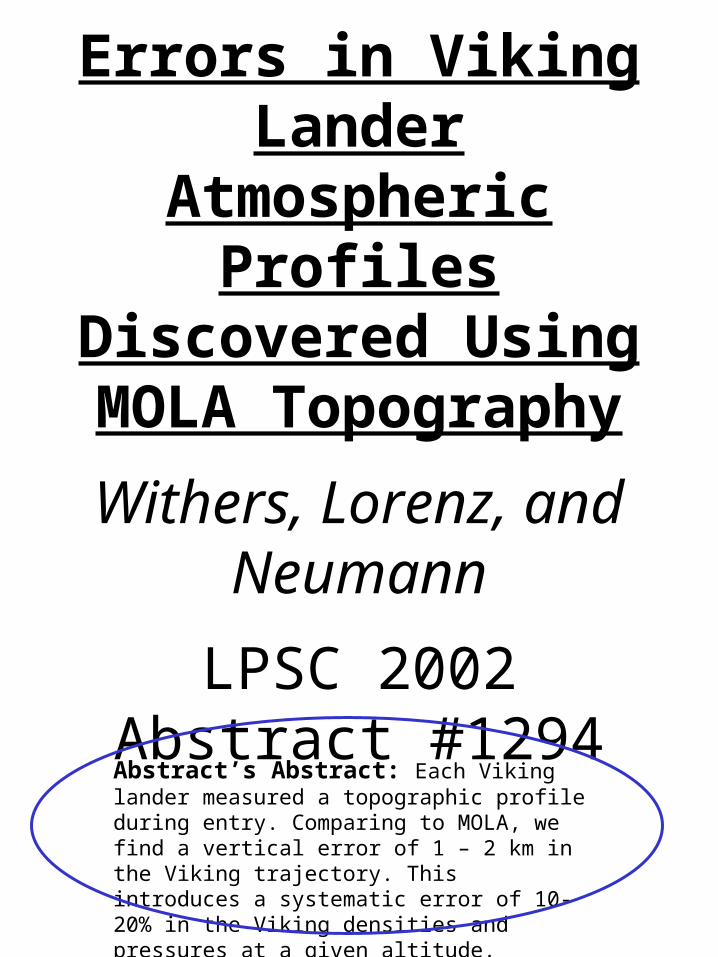
Poster Layout
• 1st column– Viking’s Radar Altimeter
• 2nd column– Topographic Profile from Viking
Entry
• 3rd column– Comparison of Viking Profile to
MOLA Data
• 4th column– Implications for Viking
Atmospheric Profiles
• 5th column– Closing Remarks
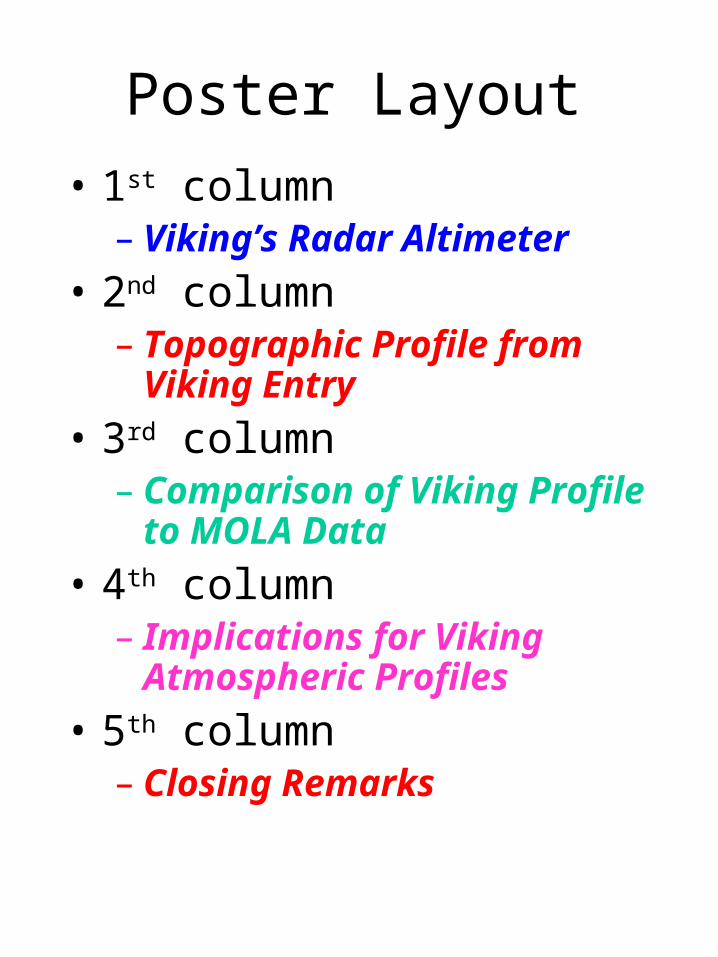
Viking Lander Schematic• Radar Altimeter located on
base of lander
From Soffen (1977)

Viking Lander Topographic Profiles
• During descent, a radar altimeter ranged from the lander to the surface below.
• The lander’s trajectory is known from the integration of acceleration data.
• Combine trajectory and surface ranging to obtain a topographic profile along the ground track of the lander.
• Altitude resolution for ranging ~ 100 m
• Sample interval ~ 0.2 s
• Maximum range ~ 130 km

VL1 Topographic Profile
• Actually a profile of radial distance above landing site, not topographic height above an equipotential surface.
• 5 km change in altitude over 500 km long portion of ground track
• 640 km distance, 16o N, -57oE• 140 km distance, 21oN, -50oE• Sloping down from Tharsis into Chryse
Planitia
From Seiff (1993)

Hunting for the data• We have only this figure for VL1 – where
are the tabulated results for VL1 and anything for VL2?
• Seiff (1993) references Seiff and Kirk, Viking Lander Altimeter Update, in Minutes of the second meeting of the Viking Mars Physical Properties Working Group, assembled by JW Meredith, pp26-30, JPL, 1977.
• We cannot locate this reference, nor have we found any other mention of this dataset in the literature.
• Where can we find out more about the Viking Lander topographic profiles?

Quick Test on VL1 Profile
• VL1 profile has topography 6 km above landing site 600 km away, but MOLA 1 degree planetary radius dataset shows that there is no topography 6km above landing site closer than 1000 km away.
• Error in VL1 profile apparent in coarsest MOLA data.
• MOLA 1 degree planetary radius contour map, referenced to VL1 landing site, with landing site and ground track for VL1 profile shown.Title:
Graphics produced by IDLCreator:IDL Version 5.1 (sunos sparc)Preview:This EPS picture was not savedwith a preview included in it.Comment:This EPS picture will print to aPostScript printer, but not toother types of printers.

Deriving Corresponding MOLA Profile
• Viking 1 landing site is 22.272 +/- 0.002 oN, 47.94 +/- 0.2 oW in Viking-era areocentric coordinates (Mayo et al, 1977).
• Spacecraft trajectory (altitude, latitude and west longitude pairs as a function of time) is archived with the PDS as dataset PSPA-00269 in same coordinate system.
• Subtract the west longitudes from east longitudes to convert them to east longitudes, then subtract an additional 0.2 degrees to convert into MGS-era east longitudes (Smith et al, 1998).
• Use MOLA 1/16 degree planetary radius dataset to obtain MOLA values for planetary radius relative to landing site as a function of latitude and longitude.
• Convert latitude/longitude pairs into distance from the VL1 landing site for comparison with the profile in Seiff’s figure.

Context Image• MOLA topography with landing site and
ground track for VL1 profile shown.

Comparison of MOLA and VL1 Topographic
Profiles
Title:Graphics produced by IDLCreator:IDL Version 5.1 (sunos sparc)Preview:This EPS picture was not savedwith a preview included in it.Comment:This EPS picture will print to aPostScript printer, but not toother types of printers.
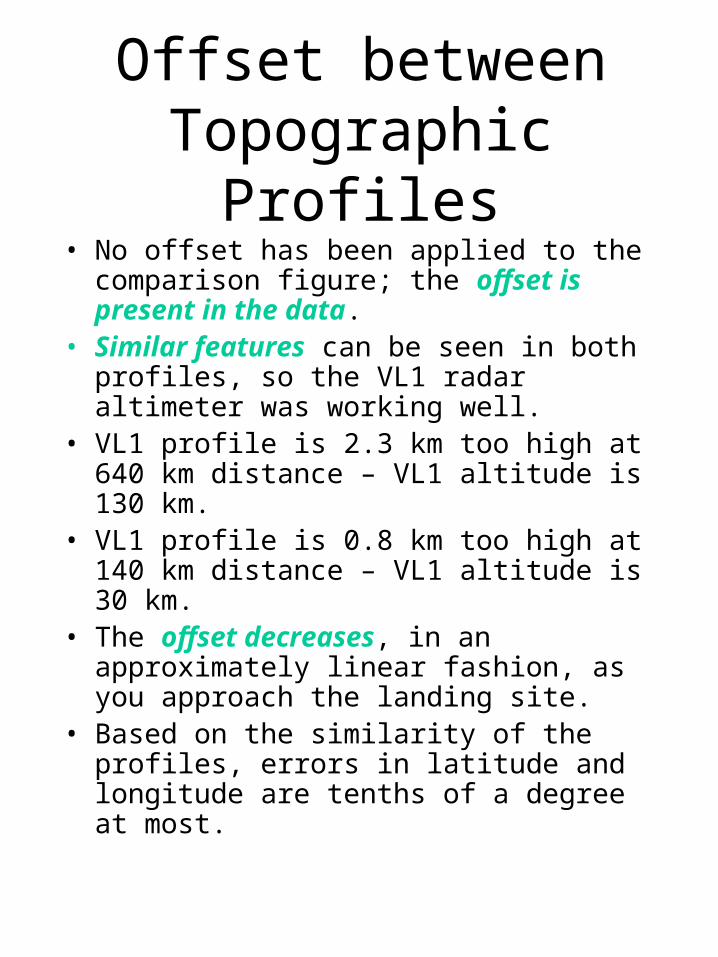
Offset between Topographic Profiles
• No offset has been applied to the comparison figure; the offset is present in the data.
• Similar features can be seen in both profiles, so the VL1 radar altimeter was working well.
• VL1 profile is 2.3 km too high at 640 km distance – VL1 altitude is 130 km.
• VL1 profile is 0.8 km too high at 140 km distance – VL1 altitude is 30 km.
• The offset decreases, in an approximately linear fashion, as you approach the landing site.
• Based on the similarity of the profiles, errors in latitude and longitude are tenths of a degree at most.
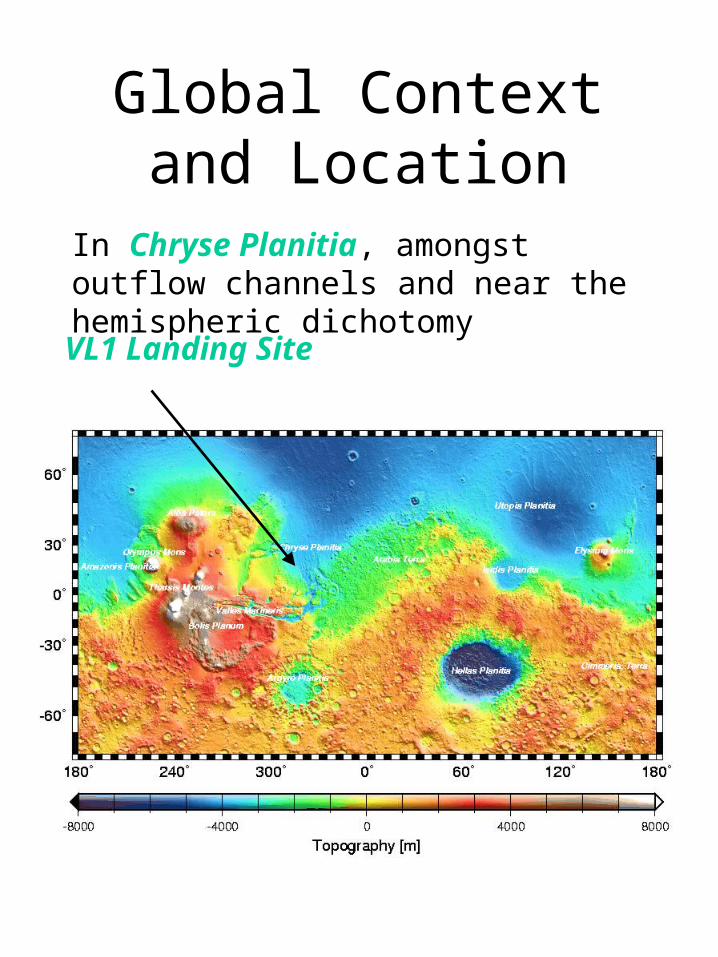
VL1 Landing Site
Global Context and Location
In Chryse Planitia, amongst outflow channels and near the hemispheric dichotomy

VL1 Atmospheric Profiles
• Measurements of accelerations during descent, together with an initial spacecraft position and velocity, are integrated to give the spacecraft’s trajectory down to the surface.
• Accumulation of errors is controlled by using radar ranging data as additional constraints.
• Acceleration data also yield profiles of atmospheric density, , pressure, p, and temperature, T, along spacecraft’s trajectory.
• These profiles are used to plan future atmospheric entries and are an important component of the Mars Reference Atmosphere.

Errors in VL1 Atmospheric Profiles
• The radar altimeter data used to generate the VL1 topographic profile is referenced to the spacecraft’s trajectory.
• The offset between MOLA and VL1 topography shows that the altitude of the spacecraft trajectory is systematically in error by 1 –2 km.
• A published , p, or T measurement at a given altitude is actually relevant at an altitude 1 – 2 km away. Hence the accepted profiles of , p, and T as a function of altitude are incorrect.
• Using a scale height of 10 km, published densities and pressures at a given altitude are systematically in error by 10 – 20%, but published temperatures are not significantly affected.

How to Correct the Atmospheric Profiles
• Simple approach – Calculate error in VL1 altitude scale as a function of altitude by matching up VL1 and MOLA topographic profiles, then shift , p, and T measurements from the incorrect altitude scale to the correct altitude scale.
• Better approach – Rederive VL1 entry trajectory using additional constraint of MOLA topography together with radar altimeter data, then rederive atmospheric profiles using new trajectory.
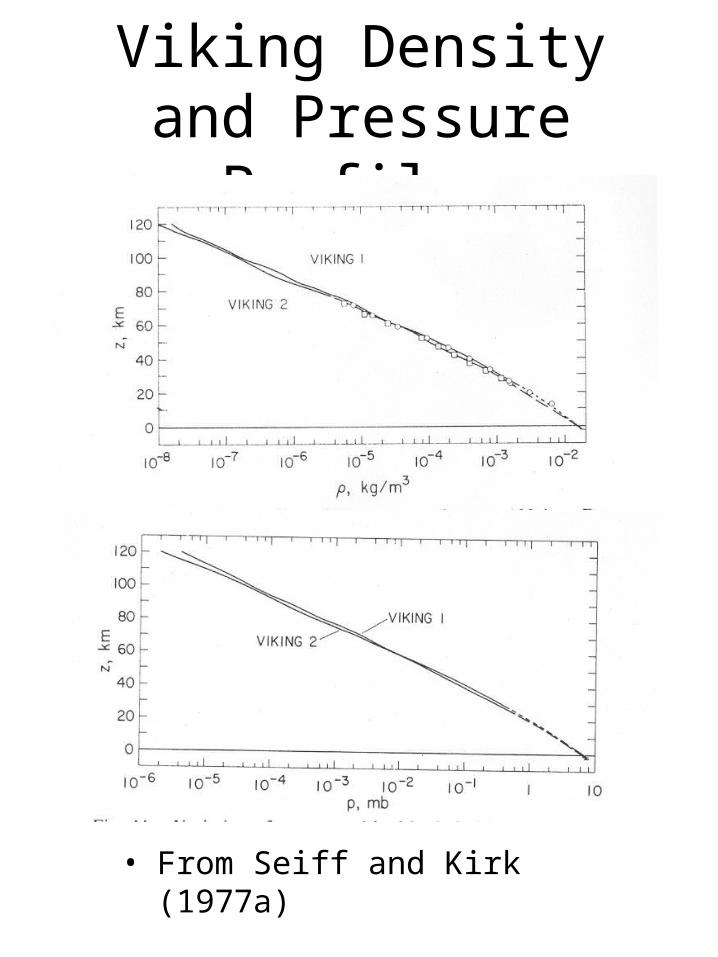
Viking Density and Pressure Profiles
• From Seiff and Kirk (1977a)
References
• Mayo et al, 1977, JGR, v82, pp4297-4303
• Seiff and Kirk, 1977a, JGR, v82, pp4364-4378
• Seiff and Kirk, 1977b, Viking Lander Altimeter Update, in Minutes of the second meeting of the Viking Mars Physical Properties Working Group, assembled by JW Meredith, pp26-30, JPL – Have you seen this?
• Seiff, 1993, JGR, v98, pp7461-7474
• Smith et al, 1998, Science, v279, pp1686-1692
• Soffen, 1977, JGR, v82, pp3959-3970
• Acknowledgements – Dave Smith, Maria Zuber, and the MOLA Science Team

Viking LanderEntry Sequence
From Soffen (1977)