Postal development report 2018 - Universal Postal Union
36
Berne, Switzerland – April 2018 Postal development report 2018 Benchmarking a critical infrastructure for sustainable development
Transcript of Postal development report 2018 - Universal Postal Union
Berne, Switzerland – April 2018
Postaldevelopment report 2018
Benchmarking a critical infrastructurefor sustainable development

DIRCAB.STRAT April 2018
Postal development report 2018
Benchmarking a critical infrastructure for sustainable development
DIRCAB.STRAT April 2018
Postal development report 2018
Benchmarking a critical infrastructure for sustainable development
Copyright © 2018 Universal Postal Union – All rights reserved Except as otherwise indicated, the copyright in this publication is owned by the Universal Postal Union. Reproduction is authorized for non-commercial purposes, subject to proper acknowledgement of the source. This authorization does not extend to any material identified in this publication as being the copyright of a third party. Authorization to reproduce such third-party materials must be obtained from the copyright holders concerned. DISCLAIMER: This publication by the UPU constitutes research in progress of an informational character for which no guarantees or assurances are provided; in this regard, it shall not be deemed to represent the official position or opinions of the UPU or its staff members, or of UPU member countries. Moreover, the depiction and use of boundaries, geographic names and related data shown on maps and included in lists, tables, documents and databases are not warranted to be error-free nor do they necessarily imply official endorsement or acceptance by the UPU. Authors: Mauro Boffa, Fernão De Borba and Lukasz Piotrowski
3
Table of contents Page
EXECUTIVE SUMMARY 5
INTRODUCTION 7
POSTAL DEVELOPMENT: DEFINITIONS AND TOOLS 7 INTEGRATED INDEX FOR POSTAL DEVELOPMENT 7
I. GLOBAL AND REGIONAL PERFORMANCE 11
OVERVIEW 11 TOP 3 PERFORMERS 15 INDUSTRIALIZED COUNTRIES 16 EASTERN EUROPE AND CIS 16 ASIA-PACIFIC 16 ARAB REGION 17 LATIN AMERICA AND THE CARIBBEAN 17 AFRICA 17
II. FROM POSTAL DEVELOPMENT TO THE ACHIEVEMENT OF THE SDGS 18
BACKGROUND 18 MEASUREMENT FRAMEWORK 19 DECENT WORK AND ECONOMIC GROWTH (GOAL 8) 20 INDUSTRY, INNOVATION AND INFRASTRUCTURE (GOAL 9) 22 SUSTAINABLE CITIES AND COMMUNITIES (GOAL 11) 24 PARTNERSHIPS FOR THE GOALS (GOAL 17) 25
CONCLUDING REMARKS 28
ANNEX 29
ADDITIONAL TABLES 29
NOTES 32
4
Figures and tables Figure 1 – Distribution of 2IPD scores by region 14 Figure 2 – Postal sector performance compared with other infrastructure 14 Figure 3 – Postal revenues vs GDP growth (PPP, 1996 = 100) 15 Figure 4 – The 17 Sustainable Development Goals 18 Figure 5 – Correlation between SDG indicator 8.10.2 and 2IPD score 20 Figure 6 – Contribution of different 2IPD sub-indices to SDG indicator 8.10.2 21 Figure 7 – Correlation between SDG indicator 9.B.1 and 2IPD score 23 Figure 8 – Contribution of different 2IPD sub-indices to SDG indicator 9.B.1 23 Figure 9 – Correlation between SDG indicator 11.5.2.b, 2IPD and LPI 24 Figure 10 – Correlation between SDG indicator 17.8.1 and 2IPD score 26 Figure 11 – Contribution of different 2IPD sub-indices to SDG indicator 17.8.1 26 Table 1 – Integrated Index for Postal Development (2IPD) – 2018 global ranking 12 Table 2 – Global and regional average scores across the four dimensions of postal development 15 Table 3 – SDGs linked to postal development 19 Table 4 – Goal 8 indicators and postal development 29 Table 5 – Goal 9 indicators and postal development 30 Table 6 – Goal 11 indicators and postal development 30 Table 7 – Goal 17 indicators and postal development 31
5
Executive summary
The postal sector is changing
The rise of digitalization coupled with other long-term social and macroeconomic transformations has prompted Posts to expand their services well beyond the mere delivery of letters. In this context, the meaning of postal development needs to be refined and further aligned with the United Nations’ 2030 Agenda, embodied by the Sustainable Development Goals (SDGs). Examining postal development through the lens of sustainable development matters for both the prosperity of the postal sector and the well-being of societies around the world. Indeed, with a global network of over 677,000 post offices, 5.3 million staff and physical infrastructure covering 192 countries, Posts play a critical socio-economic role.
Yet, measuring the multiple facets of development is no small task. To overcome this challenge, the UPU has been leveraging a wealth of big data in order to analyze the performance of national postal services around the world. One of the outcomes of these efforts was the creation of the Integrated Index for Postal Development, or 2IPD. A composite index, the 2IPD measures the performance of countries across four key dimensions of postal development: reliability, reach, relevance and resilience.
Consolidating big data and traditional statistics, the 2IPD captures the multiple facets of postal development
The 2IPD draws on three main types of UPU data: postal big data, statistics and surveys. Postal big data is used mainly to compute indicators associated with quality of service, transactions, volumes and connectivity. Statistics are applied to the measurement of revenue streams and economies of scale. Surveys feed into more qualitative considerations, namely, inclusiveness and integration. A total of 173 countries were assessed for the production of the 2018 global ranking (which is based on full-year data for 2017). Switzerland, the Netherlands and Japan top the list, followed by Germany and France. These countries owe their high scores to a consistently balanced performance across the four dimensions of the 2IPD: they have all managed to build reliable, well-connected, relevant and resilient postal services. However, the situation of the top 5 does not reflect the global trend for the sector, which is being affected by growing gaps in postal development between and within regions. Moreover, comparable benchmarks tend to indicate that Posts are underperforming in comparison with other elements of national infrastructure. In spite of these challenges, within the various regions, some countries have achieved encouraging results, for example, Poland (score of 78.3, ranked 6th worldwide), Singapore (score of 78.2, ranked 7th), Nigeria (score of 50.9, ranked 51st), Brazil (score of 54.0, ranked 44th), and Tunisia (score of 51.9, ranked 49th).
The 2IPD sheds light on the synergies between postal development and sustainable development
The quantitative nature of the 2IPD makes it an ideal tool to study the postal sector’s contribution to the achievement of the UN SDGs. Using an innovative measurement framework, UPU research has revealed that the sector has a potentially high impact on Goals 8, 9, 11 and 17 of the SDGs.
The postal sector contributes to the achievement of Goal 8 through the promotion of financial inclusion. For Goal 9, the impact is achieved through the promotion of more robust global value chains. For both of these goals, postal interconnectedness (reach) is the key underlying factor. When it comes to Goal 11, the contribution is expressed through the sector’s greater resilience to natural disasters, when compared with other elements of the wider logistical infrastructure. For Goal 17, Posts work as promoters of greater Internet connectivity, leveraging all underlying dimensions (reliability, reach, relevance

6
and resilience). The statistical findings that lead to these conclusions are all corroborated by studies and examples of projects in the field. The main takeaway from this report is that the postal sector continues to be a key vehicle of socio-economic development. This should encourage governments, regulators and any other players with a stake in the sector to step up investments and draft level-playing-field regulations and policies to boost this critical element of national infrastructure.

7
Introduction
Postal development: definitions and tools
The activities of Posts have been expanding beyond the mere delivery of letters
Although the general public may instinctively link Posts to letters and stamps, their span of activities is in fact much wider. Beyond the mere delivery of letters, many postal operators throughout the world have been building substantial business capabilities in areas as diverse as parcels and logistics, financial services, and even e-government, healthcare and other public services. In its traditional form, the postal sector has been driven on the supply side by three main stakeholders: governments, regulators and designated postal operators. The first two define the basic policies and rules governing postal services, while the third have the legal obligation of ensuring the delivery of basic postal services to all citizens within a given territory – the so-called “universal service obligation”.
Hence the need to redefine postal development
In this context, the concept of postal development needs to be defined in a comprehensive manner. It must encompass more than purely operational aspects associated with delivery; it must also cover the need to ensure (international) connectivity, to offer products and services which are deemed relevant by the population, and to respond to changes in citizen needs and demands from society as a whole. With a wide network of over 677,000 post offices around the world, 5.32 million staff and physical infrastructure covering 192 countries, the postal sector does indeed play a critical socio-economic role. That is why postal development matters.1 The vision adopted by the Universal Postal Union (UPU) for its 2017–2020 strategy is fully geared towards postal development, seeking to ensure that the postal sector is seen as an enabler of inclusive development and an essential component of the global economy. In the same vein, the mission of the organization, enshrined in its Constitution, stipulates that the UPU is to “stimulate the lasting development of efficient and accessible universal postal services of quality in order to facilitate communication between the inhabitants of the world”. Yet, measuring postal development is not an easy task. The UPU has a key role to play in addressing this major challenge, leveraging its position as the sole intergovernmental agency of the United Nations system in charge of overseeing the postal sector. Drawing on a wide range of information, such as official postal statistics, surveys and tracking data, the UPU can show how countries around the world are faring in maintaining the critical part of national infrastructure that the postal sector represents. The UPU has also begun publishing the Integrated Index for Postal Development, or 2IPD – the greatest data integration ever conducted to measure the development of postal services on a global scale. This work gave new impetus to a series of research materials released by the organization in recent years.
Integrated Index for Postal Development History and purpose The Integrated Index for Postal Development originated in 2013 as an attempt
to produce indicators for cooperation and development purposes. As part of
8
the work conducted by the UPU Council of Administration, a methodology for the index was developed and approved in 2014. The following year, the first application of this methodology was launched. The 2016 Istanbul Congress then gave a mandate to update and release the 2IPD results on a regular basis. The corresponding report is now being officially published for the second year in a row. In spite of its young existence, this index has already drawn considerable attention from a wide range of key stakeholders in the postal sector and beyond. Indeed, governments can draw on the 2IPD results in developing strategies to enhance the contribution of postal services to the economic and social infrastructure of their countries. Regulators can use the 2IPD to better identify the development challenges that postal services are facing and benefit from meaningful international comparisons. Postal operators can leverage the data to benchmark their relative operational and business model strengths and weaknesses across different levels of economic development and geographies, so as to improve their performance. Moreover, in an age of rapid digitalization, the need for accurate data to measure the various facets of e-commerce has never been greater. Other international organizations have therefore been stepping up their interest in the data collected and processed by the UPU. For instance, UNCTAD uses one of the components of the 2IPD to compute its own B2C e-commerce index.
Key components and data sources
As a composite index, the 2IPD flows from sub-indices, which reflect more detailed performance in specific areas. On the basis of this sub-index input, an algorithm is then used to generate an overall score of between 0 and 100 for each assessed country. The four sub-indices that flow into the general score are: – the reliability score, which reflects performance in terms of speed and
predictability of delivery, across all the key segments of physical postal services;
– the reach score, which synthesizes global connectivity as indicated by the number of partner networks and the volumes of international exchanges, again across all the key segments of physical postal services;
– the relevance score, which measures the intensity of demand for the full portfolio of postal services relative to the best performers in each category of postal activity, also taking into account elements such as the number of international transactions;
– the resilience score, which indicates the level of diversification of revenue streams and the capacity to innovate, deliver inclusive postal services and integrate sustainable development targets into postal business operations.
The purpose of the reliability score is to measure operational efficiency of postal services, while reach captures the level of internationalization of these operations. When it comes to relevance, the key goal is to evaluate the competitiveness of postal services in all key segments, and in particular the potential to generate higher volumes. Regarding the resilience score, the intent is to assess the ability of postal services to withstand external shocks through adaptable business models. Overall, these four pillars are aimed at providing a balanced view of postal development, without solely focusing on operational (e.g. delivery), strategic (e.g. business portfolio management) or societal (e.g. financial inclusion) matters. This enables the final general score to comprehensively reflect (while succinctly expressing) the situation of postal services in any given geography.

9
The 2IPD draws on three main types of UPU data: – UPU postal big data (over 5.1 billion records in 2017); – Official UPU postal statistics (more than 100 indicators available in
2016); – Key UPU surveys. The first type is used mainly to compute indicators associated with quality of service, transactions, volumes and connectivity. The second is applied to the measurement of revenue streams and economies of scale. The third feeds into more qualitative considerations, namely, inclusiveness and integration.
How to read the results The best postal development performer obtains a normalized score of 100, while the worst gets a minimum of 0 and the intermediate 50. Thus, all normalized scores can be read as the distance of any given country compared with the best (score of 100), intermediate (score of 50) or worst (score of 0) global performer. This enables a country to assess whether it is closer to the best, intermediate or worst absolute performer. Overall, scores can be interpreted as follows: – A score above 75 shows that a country’s postal development is relatively
closer to the best absolute performer than to the intermediate one; – A score between 50 and 75 shows a more intermediate level of
performance in the high range, or “upper middle performers”; – A score between 25 and 50 shows a more intermediate level of
performance in the low range, or “lower middle performers”; – A score below 25 shows that a country’s postal development is relatively
closer to the worst absolute performer than to the intermediate one. When reading the scores, it is also necessary to consider two main elements. First, the scores are always the reflection of a relative position in the entire span of countries covered by the analysis. If a given country makes absolute progress on a specific dimension of the 2IPD, this will only translate into a higher rank if others do not make even greater gains in performance. Second, the position of a country in the global ranking should preferably be considered in conjunction with the regional standing of the same country, for this brings further contextualization into the analysis.
Figure 1 – Overview of the key components and data sources of the 2IPD

10
Two main sections focusing on postal and sustainable development
This report is structured in two main sections. The first presents an analysis of the key 2IPD results across the world, with explanations for standout performance in the latest ranking. The second section puts postal development in perspective by expanding on the role of the sector in contributing to the achievement of the UN Sustainable Development Goals. In the general conclusion, a number of key takeaways and recommendations are put forward.

11
I. Global and regional performance
Overview
The latest ranking spans more than 170 countries
The 2018 ranking of the Integrated Index for Postal Development covers a total of 173 countries (see table 1 below). The global average score in the index stands at 37.24 (against 39 in 2017).2 Switzerland, the Netherlands and Japan top the list, followed by Germany and France. These countries owe their high scores to a consistently balanced performance across the four dimensions of the 2IPD: they have all managed to build reliable, well-connected, relevant and resilient postal services.
There are many disparities between and within regions
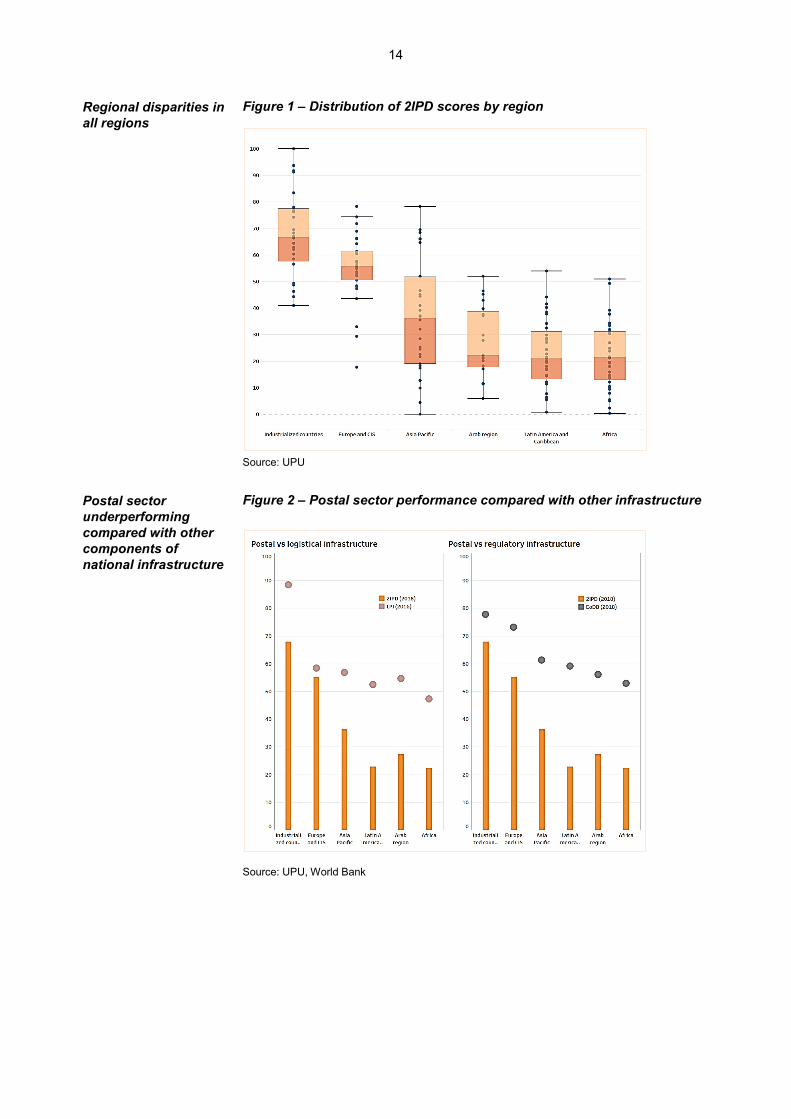
However, the situation of the top 5 does not reflect the global trend for the sector, which is being affected by growing gaps in postal development between and within regions. As shown in figure 1 below, industrialized countries have the highest average 2IPD score (67.92), followed by countries in Eastern Europe and the CIS (55.22), Asia-Pacific (36.34), the Arab region (27.29), Latin America and the Caribbean (22.81), and Africa (22.37). Moreover, comparable benchmarks tend to indicate that Posts are underperforming compared with other elements of national infrastructure (see figure 2). For instance, in the World Bank’s Logistics Performance Index (LPI) and Ease of Doing Business Index (EoDB), the global average scores stand at 59.05 and 62.74 respectively,3 against 37.24 in the 2IPD. This underperformance compared with benchmarks is perceptible across all regions, thus corroborating the phenomenon of “postal–GDP decoupling” already highlighted in past UPU research.4 Indeed, figure 3 below shows that postal revenues have been growing at a much lower rate than global gross domestic product (GDP). Disparities between regions would tend to indicate that postal development is a function of wider socio-economic factors. However, the wide spread of scores within regions suggests that other factors are at play; hence the need to also analyze the results through the perspective of the four key dimensions of postal development, i.e. reliability, reach, relevance and resilience (the four Rs). Table 2 below shows the average global and regional scores across these four dimensions. Reliability, reach and resilience remain at an intermediate level for the postal sector worldwide, with scores between 41 and 51. However, relevance is very low, averaging less than 10 points globally.
Yet, there are also numerous success stories
In spite of these challenges, within the various regions, some countries have achieved encouraging results, for example, Poland (score of 78.3, ranked 6th worldwide); Singapore (score of 78.2, ranked 7th), Nigeria (score of 50.9, ranked 51st), Brazil (score of 54.0, ranked 44th), and Tunisia (score of 51.9, ranked 49th). The examples of these regional champions show that gaps in postal development are by no means insurmountable. By pursuing balanced and diversified strategies, it is possible to raise the performance of national Posts.

12
Table 1 – Integrated Index for Postal Development (2IPD) – 2018 global ranking
Rank Country 2IPD score Change
1 Switzerland
2 Netherlands
3 Japan
4 Germany
5 France
6 Poland
7 Singapore
8 United States of America
9 United Kingdom
10 Austria
11 Slovenia
12 New Zealand
13 Estonia
14 Canada
15 China (People's Rep.)
16 Slovakia
17 Thailand
18 Ireland
19 Sweden
20 Finland
21 Czech Rep.
22 Lithuania
23 India
24 Korea (Rep.)
25 Malaysia
26 Australia
27 Moldova
28 Italy
29 Belgium
30 Hungary
31 Croatia
32 Belarus
33 Ukraine
34 Norway
35 Israel
36 Cyprus
37 Russian Federation
38 Greece
39 Bulgaria (Rep.)
40 Bosnia and Herzegovina
41 Serbia
42 Turkey
43 Latvia
44 Brazil
+0.00100.0
-0.1493.7
-2.4891.6
-0.6191.3
-11.4183.3
-6.6678.3
-5.5778.2
+3.7177.9
-9.6876.8
-0.6976.3
+0.8174.3
-0.0874.2
+1.0371.7
-4.6169.5
-9.2669.5
+0.1168.9
+2.3368.4
-1.8768.3
+8.0567.1
-6.2866.3
-4.3966.2
+3.3066.1
-5.9966.1
-9.4965.9
-1.3764.6
+0.9164.4
+7.2764.2
-2.4462.9
+0.6162.1
+1.9261.3
-0.2161.1
+0.0960.9
+2.3860.4
-0.4860.3
+0.6358.5
-0.5857.6
-1.8057.0
-2.4956.5
+5.7656.1
-1.9855.8
-3.9055.5
+1.5855.2
-3.0954.8
-1.0054.0
Rank Country 2IPD score Change
45 Georgia
46 Kazakhstan
47 Malta
48 Iran (Islamic Rep.)
49 Tunisia
50 Viet Nam
51 Nigeria
52 Azerbaijan
53 Spain
54 Mauritius
55 Iceland
56 Armenia
57 Romania
58 FYR of Macedonia
59 Indonesia
60 United Arab Emirates
61 Luxembourg
62 Morocco
63 Lao People's Dem. Rep.
64 Philippines
65 Denmark
66 Colombia
67 Albania
68 Lebanon
69 Jamaica
70 Mongolia
71 Portugal
72 Chile
73 Saudi Arabia
74 Ghana
75 Pakistan
76 Mexico
77 Cameroon
78 El Salvador
79 Uganda
80 Qatar
81 Jordan
82 Tonga
83 Sri Lanka
84 Bangladesh
85 Togo
86 Barbados
87 Kenya
88 South Africa
+9.7553.56
-10.5852.86
-2.8752.17
+0.5951.92
+5.9351.90
+3.8851.73
-1.3650.86
+3.6150.50
-5.7349.25
-10.9349.17
-0.7448.60
+6.7248.32
-2.3248.01
47.35
-2.9346.47
-4.2246.36
-18.8746.25
+0.2245.10
+3.6745.06
+10.4644.35
-4.2944.19
-0.0844.11
+1.9643.50
+2.7642.96
+1.7641.49
+1.4740.89
-6.9840.87
-3.9340.21
-1.2339.66
+7.2239.14
+9.5139.12
+8.9438.45
-4.4637.72
-5.9637.71
-3.4737.64
+11.3637.64
+2.3737.23
36.95
-2.7036.67
-3.9335.54
-7.4934.25
+1.3534.22
-1.9433.71
-9.6533.34

13
Rank Country 2IPD score Change
89 Uzbekistan
90 Costa Rica
91 Myanmar
92 Tanzania (United Rep.)
93 Namibia
94 Madagascar
95 Seychelles
96 Cape Verde
97 Senegal
98 Sudan
99 Peru
100 Montenegro
101 Argentina
102 Maldives
103 Trinidad and Tobago
104 Egypt
105 Dominican Republic
106 Rwanda
107 Ethiopia
108 Fiji
109 Malawi
110 Swaziland
111 Vanuatu
112 Belize
113 Botswana
114 Honduras (Rep.)
115 Bhutan
116 Djibouti
117 Burkina Faso
118 Afghanistan
119 Panama (Rep.)
120 Oman
121 Angola
122 Mauritania
123 Paraguay
124 Algeria
125 Uruguay
126 Zimbabwe
127 Ecuador
128 Benin
129 Burundi
130 Cambodia
131 Nepal
132 Bahrain (Kingdom Of)
+8.9132.95
-4.8432.47
+11.5531.96
+2.9131.81
-10.0231.28
-7.1030.96
-1.7730.68
-6.1230.59
-6.0130.44
+9.6529.82
+1.5429.78
-3.4129.33
+3.6928.52
-0.5728.35
-11.9228.13
+0.1527.81
+3.9027.02
-7.6526.91
-1.9226.85
-1.4425.31
+2.3424.78
+3.8924.73
-2.7624.43
+2.3524.29
-0.9823.72
-6.1822.68
+9.4022.52
+5.4122.15
-0.2221.59
+10.4221.58
+4.1921.48
-2.3121.38
-5.6821.22
+2.9921.04
+1.4021.00
-6.6020.06
-10.5519.93
-4.4519.53
-6.8319.51
-2.2219.43
+2.2819.21
-0.6219.11
-9.9318.25
18.19
Rank Country 2IPD score Change
133 Mali
134 Cuba
135 Kyrgyzstan
136 Brunei Darussalam
137 Antigua and Barbuda
138 Kuwait
139 Aruba, Curaçao & St Maarten
140 Congo (Rep.)
141 Dem. Republic of the Congo
142 Sierra Leone
143 Suriname
144 Bahamas
145 Lesotho
146 Gambia
147 Solomon Islands
148 Kiribati
149 Guyana
150 Côte d'Ivoire (Rep.)
151 Venezuela (Bolivarian Rep.)
152 Syrian Arab Rep.
153 Libya (State Of)
154 St Kitts and Nevis
155 Comoros
156 Eritrea
157 Gabon
158 Niger
159 Papua New Guinea
160 Chad
161 Zambia
162 Saint Lucia
163 Nicaragua
164 Iraq
165 Dominica
166 Guinea
167 St Vincent & the Grenadines
168 Mozambique
169 Samoa
170 Liberia
171 Haiti
172 Sao Tome and Principe
173 Tuvalu
-1.2117.96
-1.3417.92
-2.1817.72
-6.2717.45
+2.0017.10
+1.9917.09
-11.5316.81
-3.7515.89
15.87
-5.6214.63
-0.9714.62
-8.8314.31
-0.2914.09
-3.3113.61
-0.2312.75
+2.8512.71
-1.4012.12
-12.3312.07
-0.9011.84
-3.3411.51
-6.7611.46
-14.7011.31
-3.7311.29
-3.3910.46
+1.1510.35
-0.139.91
-5.459.81
+0.339.33
-0.107.83
-3.657.73
+0.336.43
-9.655.84
-1.855.73
-4.135.52
-0.435.45
-2.484.95
-2.684.41
-0.982.25
-7.320.74
+0.360.36
0.00
14
Regional disparities in all regions
Figure 1 – Distribution of 2IPD scores by region
Source: UPU
Postal sector underperforming compared with other components of national infrastructure
Figure 2 – Postal sector performance compared with other infrastructure
Source: UPU, World Bank
15
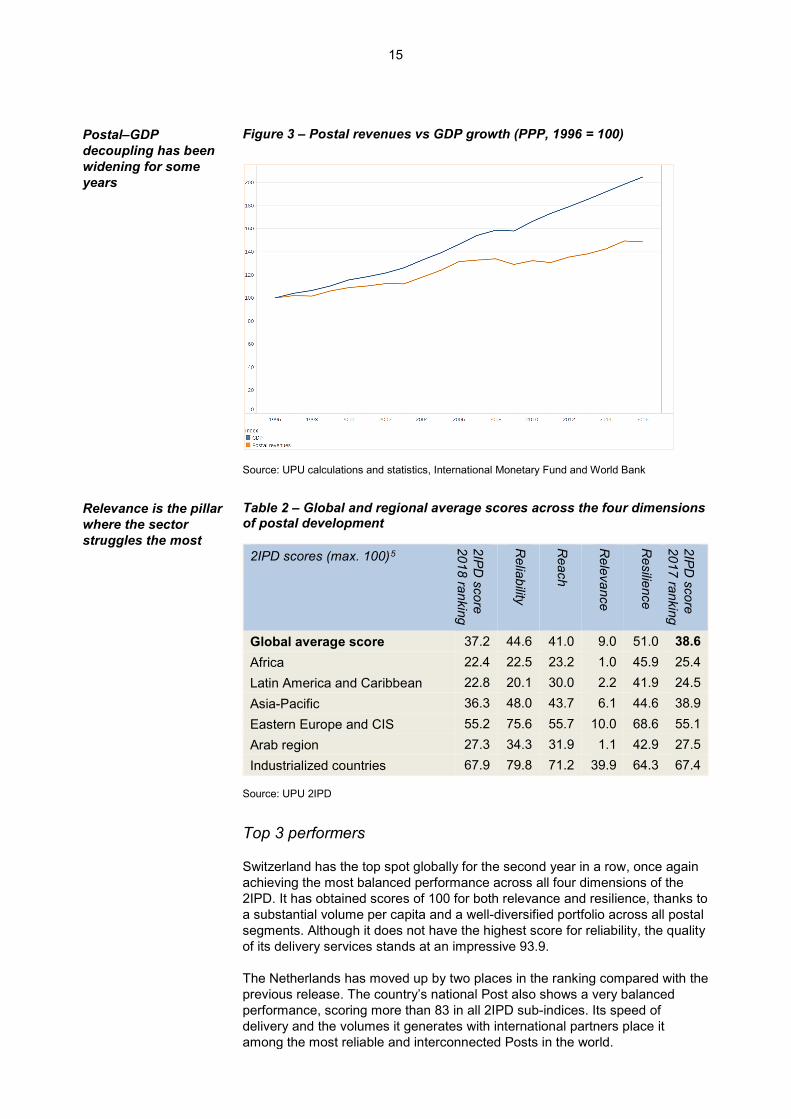
Postal–GDP decoupling has been widening for some years
Figure 3 – Postal revenues vs GDP growth (PPP, 1996 = 100)
Source: UPU calculations and statistics, International Monetary Fund and World Bank
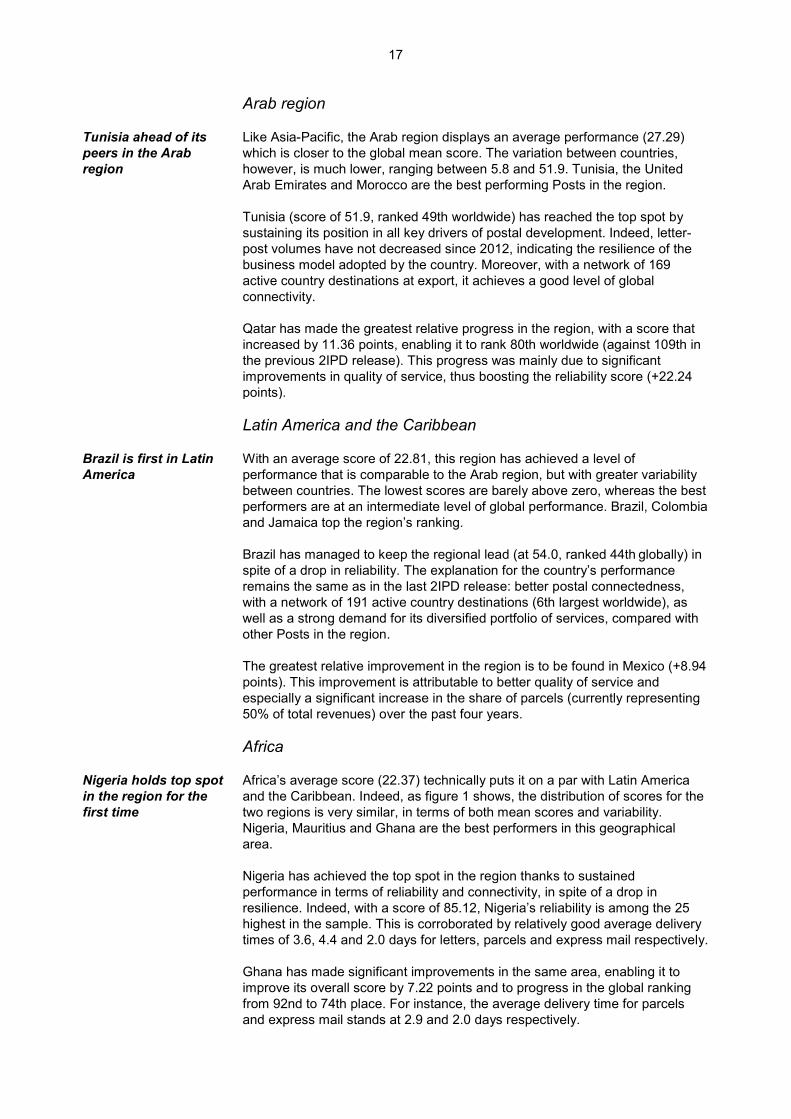
Relevance is the pillar where the sector struggles the most
Table 2 – Global and regional average scores across the four dimensions of postal development
2IPD scores (max. 100)5
2IPD
score 2018 ranking
Reliability
Reach
Relevance
Resilience
2IPD
score 2017 ranking
Global average score 37.2 44.6 41.0 9.0 51.0 38.6 Africa 22.4 22.5 23.2 1.0 45.9 25.4 Latin America and Caribbean 22.8 20.1 30.0 2.2 41.9 24.5 Asia-Pacific 36.3 48.0 43.7 6.1 44.6 38.9 Eastern Europe and CIS 55.2 75.6 55.7 10.0 68.6 55.1 Arab region 27.3 34.3 31.9 1.1 42.9 27.5 Industrialized countries 67.9 79.8 71.2 39.9 64.3 67.4
Source: UPU 2IPD Top 3 performers
Switzerland has the top spot globally for the second year in a row, once again
achieving the most balanced performance across all four dimensions of the 2IPD. It has obtained scores of 100 for both relevance and resilience, thanks to a substantial volume per capita and a well-diversified portfolio across all postal segments. Although it does not have the highest score for reliability, the quality of its delivery services stands at an impressive 93.9. The Netherlands has moved up by two places in the ranking compared with the previous release. The country’s national Post also shows a very balanced performance, scoring more than 83 in all 2IPD sub-indices. Its speed of delivery and the volumes it generates with international partners place it among the most reliable and interconnected Posts in the world.

16
Japan has retained the third place. In spite of a drop in the reliability score over the previous ranking (84.2 against 96.8 in 2017), it still outperforms many of its regional peers in terms of quality of service. The demand for its services, especially financial, also remains strong, enabling it to obtain a score of 100 in relevance, on a par with Switzerland.
Industrialized countries
Switzerland, Netherlands and Japan at the top 3 globally and in the region
With an average score of 67.92, industrialized countries represent the bulk of the best performers worldwide (80% of the top 10 and over 50% of the top 30 belong to this regional grouping). As a result, the champions in this region are all global leaders in postal development. The reasons for their success are as outlined above. Sweden is the country that has registered the greatest relative improvement in this region, moving up by 8.05 points, mainly owing to improved resilience. This was made possible by a diversified business model that includes a relatively strong position in the parcels segment, which represents over 40% of total revenues.
Eastern Europe and CIS
Poland as a champion in Eastern Europe
The region has a rather intermediate average score of 55.22, but the countries tend to be relatively homogeneous in terms of postal development. With the exception of a few outliers, scores range between 43 and 74. Regional champions include Poland, Slovenia and Estonia, which are all among the global top 15. The performance of the regional leader, Poland (6th worldwide with a score of 78.3), is attributable to its outstanding connectivity, with 183 active country destinations at export. Over the past year, the country has also registered an increase in letter-mail traffic, thus boosting its resilience score (from 78.1 to 92.09, the fifth highest worldwide). The greatest improvement in the region is to be found in Georgia, whose overall score jumped up 9.75 points compared with 2017, reaching 53.6 and enabling the country to be ranked 45th (up from 64th in the previous ranking). The significant improvement in reliability (with a sub-index score of 95.9) was the key driver behind this development.
Asia-Pacific
Singapore outperforming in Asia
As figure 1 above shows, Asia-Pacific displays a very high variability in performance within the region. Although the average stands at 36.34, countries’ scores range between 78.2 for the best performer and 0 for those with the most acute challenges. Regional champions include Singapore, China and Thailand. As one of the global top 10, Singapore’s achievement (score of 78.2, ranked 7th worldwide) can be explained through its balanced performance across the four dimensions of postal development. Its greatest strength, however, lies in a shrewd combination of outstanding reliability (99.8 – the 3rd highest globally) and reach (85.1). Myanmar is the country with the biggest relative improvement both in the region and worldwide (+11.55 points, +35 positions, ranked 91st globally). Efforts related to quality of service and significant increases in volumes were the two main reasons for this improvement.
17
Arab region
Tunisia ahead of its peers in the Arab region
Like Asia-Pacific, the Arab region displays an average performance (27.29) which is closer to the global mean score. The variation between countries, however, is much lower, ranging between 5.8 and 51.9. Tunisia, the United Arab Emirates and Morocco are the best performing Posts in the region. Tunisia (score of 51.9, ranked 49th worldwide) has reached the top spot by sustaining its position in all key drivers of postal development. Indeed, letter-post volumes have not decreased since 2012, indicating the resilience of the business model adopted by the country. Moreover, with a network of 169 active country destinations at export, it achieves a good level of global connectivity. Qatar has made the greatest relative progress in the region, with a score that increased by 11.36 points, enabling it to rank 80th worldwide (against 109th in the previous 2IPD release). This progress was mainly due to significant improvements in quality of service, thus boosting the reliability score (+22.24 points).
Latin America and the Caribbean
Brazil is first in Latin America
With an average score of 22.81, this region has achieved a level of performance that is comparable to the Arab region, but with greater variability between countries. The lowest scores are barely above zero, whereas the best performers are at an intermediate level of global performance. Brazil, Colombia and Jamaica top the region’s ranking. Brazil has managed to keep the regional lead (at 54.0, ranked 44th globally) in spite of a drop in reliability. The explanation for the country’s performance remains the same as in the last 2IPD release: better postal connectedness, with a network of 191 active country destinations (6th largest worldwide), as well as a strong demand for its diversified portfolio of services, compared with other Posts in the region. The greatest relative improvement in the region is to be found in Mexico (+8.94 points). This improvement is attributable to better quality of service and especially a significant increase in the share of parcels (currently representing 50% of total revenues) over the past four years.
Africa
Nigeria holds top spot in the region for the first time
Africa’s average score (22.37) technically puts it on a par with Latin America and the Caribbean. Indeed, as figure 1 shows, the distribution of scores for the two regions is very similar, in terms of both mean scores and variability. Nigeria, Mauritius and Ghana are the best performers in this geographical area. Nigeria has achieved the top spot in the region thanks to sustained performance in terms of reliability and connectivity, in spite of a drop in resilience. Indeed, with a score of 85.12, Nigeria’s reliability is among the 25 highest in the sample. This is corroborated by relatively good average delivery times of 3.6, 4.4 and 2.0 days for letters, parcels and express mail respectively. Ghana has made significant improvements in the same area, enabling it to improve its overall score by 7.22 points and to progress in the global ranking from 92nd to 74th place. For instance, the average delivery time for parcels and express mail stands at 2.9 and 2.0 days respectively.

18
II. From postal development to the
achievement of the SDGs
Background
The achievement of the SDGs is the ultimate goal of the 2030 UN Agenda
The United Nations Sustainable Development Goals have become a core driver for targeted action within the UN system. Approved in January 2016, the SDGs are the embodiment of the 2030 Agenda for Sustainable Development, adopted by world leaders in September 2015 at a historic UN summit. Building on the success of the Millennium Development Goals, the SDGs constitute a framework "to mobilize efforts to end all forms of poverty, fight inequalities and tackle climate change, while ensuring that no one is left behind". The 2030 Agenda for Sustainable Development is not legally binding, but governments are expected to take ownership, establish national frameworks, and follow up on and review progress made in implementing the SDGs.
Figure 4 – The 17 Sustainable Development Goals
Source: United Nations SDGs
The 17 UN SDGs (see figure 4) are further broken down into 169 targets and
244 indicators.6 The targets lay the groundwork for the tasks that contribute to the achievement of the goal. For instance, Goal 9 (Build resilient infrastructure, promote inclusive and sustainable industrialization and foster innovation) comprises 8 targets to be measured by 12 indicators. Assessing progress on achieving the UN SDGs is therefore a considerable undertaking, which requires resources, good data and effective measurement mechanisms in order to be meaningful – an area in which intergovernmental organizations such as the UPU have a key role to play in supporting govern-ments. Indeed, as a specialized agency of the UN system, the UPU is expected to support its member countries in efforts to implement the SDGs. It does so, among other things, by analyzing the contributions made by the postal sector to the achievement of the goals.7
19
Measurement framework
From establishing principles to measuring impacts
Thanks to their data-oriented design, the SDG indicators provide a concrete statistical measure on the progress of the 2030 Agenda. They can thus be used to estimate the contributions of the postal sector to the achievement of this agenda.8 Past research by the UPU and other peers has already shown that postal indicators can constitute very reliable proxies for national well-being,9 but does postal development actually facilitate progress in any of the SDGs? In order to provide answers to this question, the UPU’s research team followed a four-step approach. First, a qualitative analysis was made of all 244 SDG indicators, in order to single out those that could reasonably be impacted, at least indirectly, by the activities of the postal sector. Second, a statistical analysis of the 2IPD and the selected SDG indicators was performed, so as to identify high correlations, which would in turn signal areas of high potential impact. Any relationships that were not statistically significant were discarded. Third, each of the four pillars of the 2IPD was compared to the selected SDG indicators, thus revealing the relative contribution of each factor of postal development to wider socio-economic welfare. Fourth, in order to support findings from the previous steps, concrete SDG-relevant projects undertaken by postal operators worldwide were reviewed and reported upon.
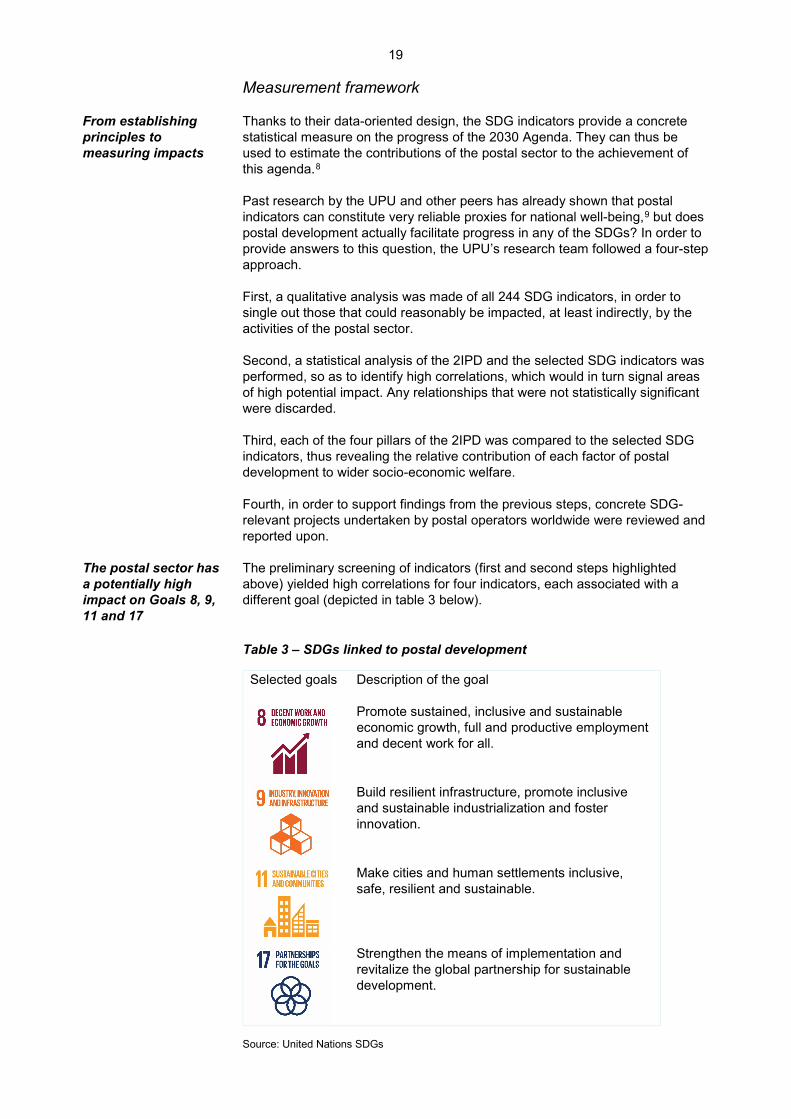
The postal sector has a potentially high impact on Goals 8, 9, 11 and 17
The preliminary screening of indicators (first and second steps highlighted above) yielded high correlations for four indicators, each associated with a different goal (depicted in table 3 below).
Table 3 – SDGs linked to postal development
Selected goals Description of the goal
Promote sustained, inclusive and sustainable economic growth, full and productive employment and decent work for all.
Build resilient infrastructure, promote inclusive and sustainable industrialization and foster innovation.
Make cities and human settlements inclusive, safe, resilient and sustainable.
Strengthen the means of implementation and revitalize the global partnership for sustainable development.
Source: United Nations SDGs

20
Decent work and economic growth (Goal 8)
The postal sector contributes to the achievement of Goal 8 through the promotion of financial inclusion
Goal 8 of the SDGs seeks to promote inclusive growth and productive employment. The direct and indirect contribution of the postal sector to this goal is twofold. First, in 2016, designated postal operators employed around 5.32 million staff members worldwide, a number that is comparable to the population of Norway.10 By fulfilling their mission, these operators are therefore supporting inclusion and well-being in societies across the globe. Second, by serving more than 10,000 people per post office, they provide businesses and consumers alike with access to a vast logistical, financial and communication network. The use of the network translates into positive spillover effects, thus revealing the role of the postal sector as a growth facilitator for businesses.11 To test the correlation between postal development and the targets of Goal 8, the 2IPD results were compared to a selection of SDG indicators,12 using a multivariate regression analysis.13 The highest potential impact on Goal 8 is in relation to indicator 8.10.2: Proportion of adults (15 years and older) with an account at a bank or other financial institution or with a mobile-money-service provider. This indicator falls under target 8.10 (Strengthen the capacity of domestic financial institutions to encourage and expand access to banking, insurance and financial services for all) and is associated with the imperative of financial inclusion. As shown in figure 5, there is indeed a strong positive relationship between the 2IPD and SDG indicator 8.10.2.14 In other words, countries with a high level of postal development have, on average, a large percentage of adults possessing a bank account, which is a proxy for financial inclusion.15
Figure 5 – Correlation between SDG indicator 8.10.2 and 2IPD score
Source: UPU and SDG Indicators Global Database
The figure also shows how countries compare to the trend. The scattered dots
above the trend line represent countries that are performing above the average given their level of postal development. In turn, dots below the trend line represent countries for which there is potential for higher performance in the postal sector.

21
The lower-left quadrant of the diagram shows countries in which both postal development and financial inclusion are low. In such an environment, there is high potential for postal operators to contribute to the SDG target of financial inclusion – for two reasons. First, with a large proportion of adults with no bank account, the competition in the sector consists in providing the first service to the client – taking advantage of the large market share available. Second, many postal operators in the lower-left quadrant appear to be below the trend, suggesting that improvements in their level of postal development would be sufficiently sustainable to support a rapid expansion in financial services.
Reach appears to be the factor of postal development that has the greatest impact on financial inclusion
In addition to recognizing a positive relationship between these variables, it is useful to determine which of the four Rs (reliability, reach, relevance and resilience) has the greatest impact on financial inclusion. As shown in figure 6 below,16 reach appears to be the factor of postal development that has the greatest impact on financial inclusion. This is not surprising as financial inclusion is often eased by the existence of large international networks. By contrast, reliability and relevance are half as important, and resilience does not have a statistically significant impact.
Figure 6 – Contribution of different 2IPD sub-indices to SDG indicator
8.10.2
Source: UPU and SDG Indicators Global Database
The statistical findings are corroborated by many studies and examples of projects in the field
The statistical findings are corroborated by a number of studies conducted by the UPU in recent years, which have highlighted the key role that the postal sector plays in promoting financial inclusion.17
Indeed, substantial qualitative evidence shows that postal operators have an essential role to play in this area. Their mandate to provide universal service potentially positions them to offer financial services in remote, scarcely populated and rural areas that private banks might disregard for profitability reasons. Around the globe, there are examples of postal operators in action. The Bangladesh Post Office has been contributing to the country's Vision 2021 to lift millions of Bangladeshis out of poverty. In particular, it has issued over 11 million mobile money orders, worth 7 million USD, and the Postal Cash Card service has built a customer base of 52,000 cardholders, many of whom live in rural areas. India, which has the largest postal network in the world, covers around 90% of post offices in rural areas. In addition to existing insurance, remittance and savings solutions, India Post established the India Post Payments Bank in 2016. The goal is to have 650 unique branches to drive financial inclusion in 155,000 villages, and to train 300,000 postal workers to take on the additional
22
payment bank correspondent role. India Post has been providing insurance services since 1884 and currently insures more than 23.5 million citizens in rural areas. Indonesia's 245 million inhabitants are scattered across 17,000 islands, and the financial inclusion rate stands at 36% compared with the regional average of 69%. The national operator, PT Pos Indonesia, has taken a number of steps to boost its contributions in this area. Indeed, although it has less than 5,000 self-operated post offices to serve the entire territory, it has built a large network of 30,000 agents to distribute its products and services. This allows it to have a much larger presence throughout the country, and at a lower cost than if it were operating its own network of post offices. This solution also leads to shorter queues, and agents’ branches have more flexible opening hours than regular post offices. In Morocco, Al Barid Bank (ABB), which is fully owned by Poste Maroc, was officially launched as a bank in 2010. The primary mandate of this entity was to improve financial inclusion, particularly in rural areas. This has led to an increase in the percentage of Moroccan citizens with access to banking services: from 34% in 2010 to around 70% in 2016. Starting from a base of some 4 million customers in 2010, ABB has opened around 500,000 new accounts each year and now has more than 6.4 million accounts, meaning that around 18% of the population banks with ABB.
Industry, innovation and infrastructure (Goal 9)
The postal sector contributes to the achievement of Goal 9 through the promotion of more robust global value chains…
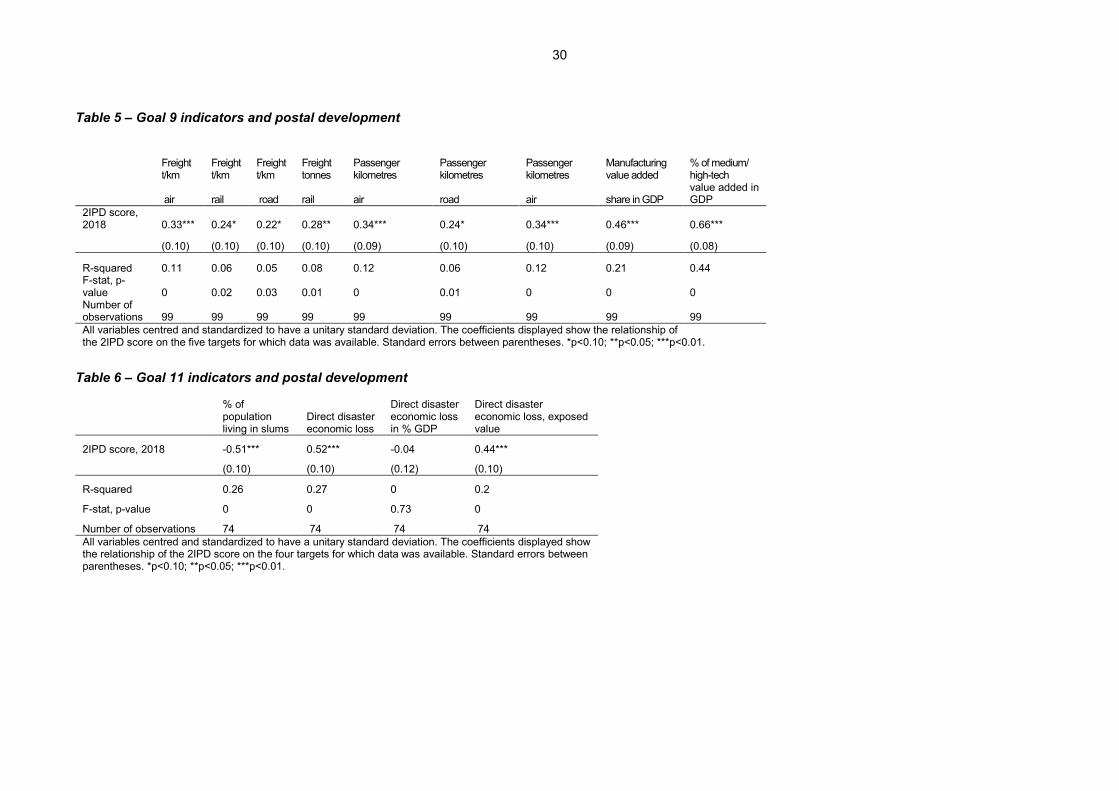
Goal 9 of the SDGs focuses on building resilient infrastructure and promoting sustainable industrialization. It encompasses a variety of targets focusing mainly on upgrading the existing infrastructure and promoting manufacturing, industrialization and connectivity in a sustainable manner. The role of the postal sector in achieving this goal is rooted in its ability to increase connectivity and allow the flow of business-to-consumer (B2C) products. As the sector itself transitions into higher-value-added activities, the contribution of postal operators to Goal 9 might occur on several levels. First, Goal 9 contains indicators on freight and passenger traffic by mode of transit (air, rail and road), which is indeed correlated with postal volumes as they share infrastructure. Second, by focusing on high-tech manufacturing value added, Goal 9 is strongly linked to improvements in global value chains. Owing to its international network, the postal sector can reinforce global value chains, by enabling the timely delivery of documents and goods. In this context, the strongest correlation was found under indicator 9.B.1 (Proportion of medium and high-tech industry value added in total value added), which is geared towards promoting technological development as a means of increasing economic value added.18 Figure 7 offers a visual representation of the findings. There is a positive relationship between indicator 9.B.1 and the 2IPD. In other words, as the level of postal development increases, it correlates with a higher share of medium and high-tech industry value added in total value added.19

23
Figure 7 – Correlation between SDG indicator 9.B.1 and 2IPD score
Source: UPU and SDG Indicators Global Database
…and postal interconnectedness is the key factor in this regard
The increasing slope of this figure might suggest that a highly developed postal network is one of the pre-conditions for having more robust global value chains. Indeed, by decomposing the impact of postal development along the four pillars (figure 8), reach appears to be the most important component, followed by relevance. Therefore, the role of postal development in promoting international connectedness might support the development of global value chains.
Figure 8 – Contribution of different 2IPD sub-indices to SDG indicator 9.B.1
Source: UPU and SDG Indicators Global Database
Examples abound of countries that have reaped the benefits of such postal connectivity
Specific examples of how postal operators have been promoting the sustainable development of infrastructure and industrial projects support the above findings. In Botswana, the local designated operator has reported that the provision of Internet access and various communication services in post offices through knowledge centres has increased the revenue of the connected post offices by an average of 25% and provided local communities with a full range of electronic services. In addition, the national operator provides a mobile application through which customers can pay utility bills. This allows both postal operators and their customers to focus their resources on higher-value-added activities.

24
In Brazil, the national postal operator has implemented an easy export programme, helping 10,000 MSMEs to internationalize their activities and thus potentially connect to global value chains. The initiative promotes industrial diversification and the valorization of domestic products in international markets. Concrete examples of initiatives that corroborate the use of postal development to promote the use of new technologies include the partnership between Japan Post Group, IBM and Apple. This initiative was aimed at improving the quality of life of Japanese senior citizens by delivering iPads with IBM-developed apps and analytics to connect millions of senior citizens to services, healthcare, community and their families. Japan Post Group is expanding the service in stages, with the target of 4 to 5 million customers in Japan by 2020. In another interesting example, Poste Maroc is allowed to use its physical network of post offices to issue electronic identities on behalf of national authorities (Barid e-Gov service). A similar approach has been adopted in Lebanon, where the Post has become a one-stop shop for government services throughout the country, with over 1 million unique visitors in 2014.
Sustainable cities and communities (Goal 11)
As a critical element of national infrastructure, the postal sector is impacted by natural disasters
Goal 11, which aims to increase the safety of infrastructure and make cities more sustainable, is strongly linked to postal development. In fact, the resilience of the postal sector is often higher than with other types of infrastructure. Because postal services are labour intensive, they are highly adaptable to changing conditions and unexpected natural disasters. A strongly developed postal sector might thus help a country react to a natural disaster (for instance, by providing information and delivering humanitarian help through its network). It can also increase national resilience thanks to the modularity of tasks performed by postal operators. In this context, SDG indicator 11.5.2 was the one that showed the highest level of correlation with postal development, as shown in figure 9. In addition, the figure plots the disaster economic loss against the Logistics Performance Index, which reflects the infrastructure capabilities of a country.20
However, it shows greater resilience than the wider logistical infrastructure, thus contributing to the achievement of Goal 11
These figures (and the underlying regressions shown in table 6 of the annex) show that the postal sector’s infrastructure and the other components of national physical infrastructure are highly exposed to losses associated with natural disasters. However, the lower slope in the 2IPD graph in figure 9 indicates that the postal infrastructure is relatively more resilient than the traditional physical infrastructure. Indeed, following a natural disaster, the postal network might be able to reboot faster than electricity grids or telecommunication towers.
Figure 9 – Correlation between SDG indicator 11.5.2.b, 2IPD and LPI
Source: UPU and SDG Indicators Global Database

25
In a number of countries, the postal sector has enabled a quicker recovery in the aftermath of natural disasters
In 2010 an 8.8-magnitude earthquake devastated Chile, affecting 80% of its population and taking 524 lives. Despite the extent of the world's fifth biggest earthquake in modern times, CorreosChile was able to resume 100% of its business operations just one week after the event. The Post played a key role in the recovery phase alongside other government entities, and in the awareness/preparedness phase for educating the population, with a campaign titled "Yo me preparo; Chile se prepara" (I am prepared; Chile is prepared). The evidence extends to other countries such as Cuba, where Correos de Cuba is a part of the Cuban civil defence system against disasters. In 2017, it cooperated with other governmental councils to ensure restoration of vital systems after Hurricane Irma. It also took measures to ensure the provision of basic postal services to citizens. Furthermore, it prioritized the distribution of newspapers to remote territories lacking electricity (and therefore without access to other media, such as television or radio). For example, 700,000 copies of a national newspaper were circulated (200,000 more than its traditional circulation) as part of the effort to bring updated information to affected areas. Typhoon Haiyan, which hit the Philippines in late 2013, severely affected 37 post offices as well as the islands of Samar and Leyte. Buildings were damaged and many were destroyed, with material losses in terms of postal vehicles. In order to overcome this major disaster, PHLPost partnered with the national Department of Social Welfare and Development through Land Bank of the Philippines to bring cash grants to about 18,000 beneficiaries of the United Nations World Food Programme in Leyte and Samar. PHLPost also served areas where Land Bank automated teller machines were unavailable. Japan has shown its ability to leverage the postal infrastructure in a context of major disasters. The 9.0-magnitude earthquake that hit the country in 2011 is a case in point. Close to 16,000 lives were lost and 1.2 million properties were severely damaged. Sixty-two postal employees were among the dead; 583 post offices were forced to close temporarily. In the immediate aftermath of the disaster, Japan Post ensured continuity in mail services (including setting up mobile and temporary post offices, alternative delivery points and temporary post office boxes for affected families). This highlighted the importance of establishing and maintaining collaboration with local and national entities during and after a disaster. The United States of America also displays outstanding performance in the area of resilience. A concrete example is the work of the United States Postal Service (USPS) in the aftermath of Hurricane Katrina, which severely affected a very large area of the country in 2005. The top priority was to account for all employees and determine the operating capability of the postal and local civil infrastructure. Steps were taken to ensure that the displaced population received their postal items through mobile post offices, arrangements with shelters, and special change-of-address procedures processed for more than 520,000 households. Additionally, USPS participated in the overall response by delivering flyers from the civil protection agency to citizens and providing other support.
Partnerships for the goals (Goal 17)
The postal sector contributes to Goal 17 by acting as a promoter of greater Internet connectivity
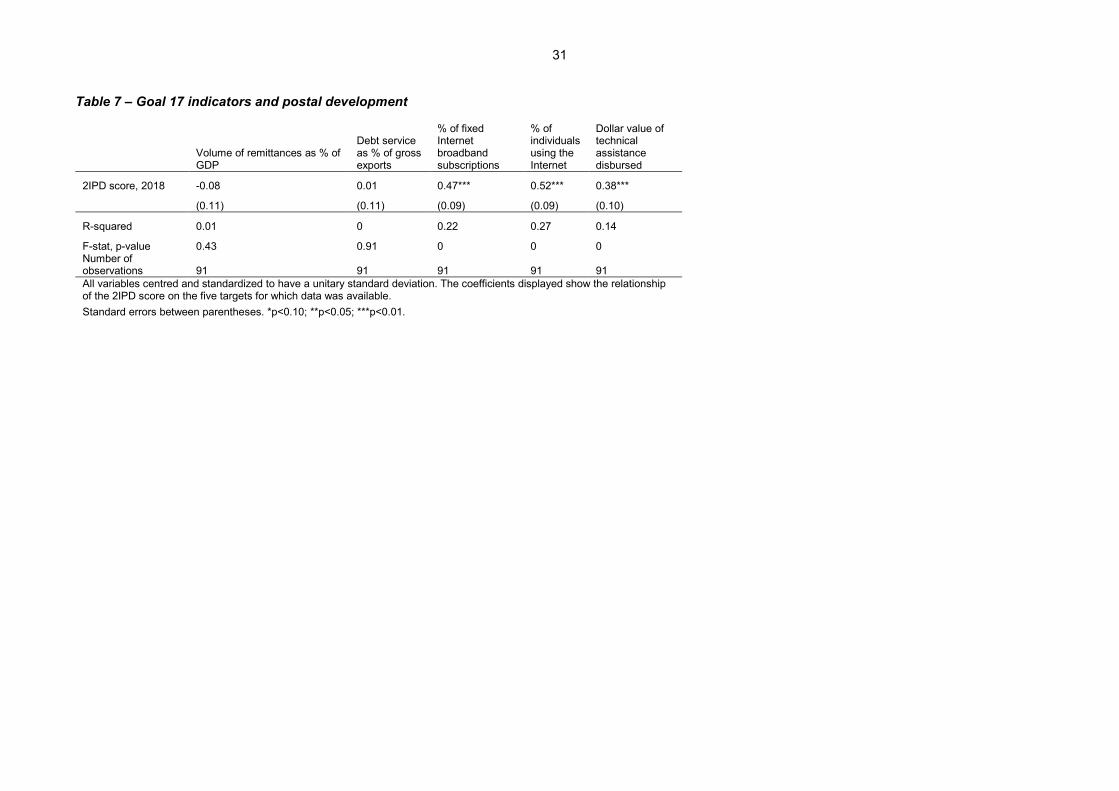
Goal 17, which aims to “strengthen the means of implementation and revitalize the global partnership for sustainable development”, is arguably the goal that most intuitively correlates with postal development. At their core, postal operators act as universal service providers for communication services and, more and more often, for a wide range of multi-layer services.

26
Among the five indicators for which there is comparable data, the one that has the strongest link is the percentage of individuals using the Internet (indicator 17.8.1).21 At first, the link might appear spurious, as the development of the Internet also triggers mail substitution, eroding revenues in the letter-post segment of traditional operators. However, as the Internet boosts the demand for new products and services through e-commerce, the need for a trusted and reliable intermediary to deliver orders also increases. The relationship between the percentage of individuals using the Internet and the 2IPD index is presented in figure 10. While the variability of the relationship is large, there is a clear positive correlation between the two variables. Thus, Internet connectivity might act as a complement of postal development, with the factors reinforcing each other. The emergence of the Internet forces innovation in the postal sector, which in turn contributes to expanding e-commerce, by making hitherto impractical transactions finally possible.
Figure 10 – Correlation between SDG indicator 17.8.1 and 2IPD score
Source: UPU and SDG Indicators Global Database
All factors of postal development are at work in this area
For this SDG indicator, the four pillars of postal development all positively contribute to the overall effect (figure 11). Most significant is reach, followed by reliability, relevance and resilience, with the latter three more or less tied. The result suggests that, in order to adapt to pervasive digitalization, the postal sector has to evolve in all its dimensions.
Figure 11 – Contribution of different 2IPD sub-indices to SDG indicator
17.8.1
Source: UPU and SDG Indicators Global Database
Indeed, this postal transformation appears to happen on many fronts. For
example, Tanzania Post Corporation has 36 Internet cafés, which may well

27
promote Internet connectivity. As part of its service offering, the operator also has six post offices featuring Community Information Centres, as well as e-learning services. Similarly, Poste Maroc has branched out into e-government, acting for instance as a certification authority to issue electronic identities on behalf of national authorities (Barid e-Gov service).

28
Concluding remarks
Although the rise of digitalization has brought unprecedented challenges to the
sector, it has also yielded new opportunities. True, postal services need to become more agile, responsive and proactive in adapting to the burgeoning demand for delivery capacity in the age of e-commerce. Organizations that have struggled to transform have been paying a high price, as revealed by the results of the 2IPD, and in particular the reliability scores. As this report has shown, the sector is more than just a channel for delivering letters. It underpins every nation’s physical infrastructure, serving citizens, businesses and authorities across territories, in both urban and rural areas. It provides previously excluded populations with access to financial services, helping to build more cohesive and wealthy societies. It strengthens global value chains and helps boost physical and digital connectivity, thus fulfilling a 150-year-old mission of fostering communication between the inhabitants of the world. It provides a critical mass of infrastructure, allowing societies to recover more rapidly from disasters – a vital role in this age of climate change. In other words, the postal sector continues to be a key vehicle of socio-economic development. As such, it is an important instrument for the achievement of the UN Sustainable Development Goals. Yet, as any element of physical infrastructure, it cannot thrive without a comprehensive and coherent framework that is fully linked to a nation’s global agenda. Therefore, governments, regulators and market players would gain from stepping up investments and drafting level-playing-field regulations and policies to boost this critical element of national infrastructure. In this journey, as the sole intergovernmental agency of the United Nations system in charge of overseeing the postal sector, the UPU is ready to support countries in their future transformations.

29
Annex Additional tables Table 4 – Goal 8 indicators and postal development
Growth rate of real GDP per capita
Growth rate of real GDP per employed person
No. of commercial bank branches per 100,000 adults
No. of commercial ATMs per 100,000 adults
% of adults with a bank account
2IPD score, 2018 -0.08 -0.04 0.59*** 0.33*** 0.73*** (0.09) (0.09) (0.07) (0.09) (0.06)
R-squared 0.01 0 0.35 0.11 0.53 F-stat, p-value 0.37 0.66 0 0 0 Number of observations 120 120 120 120 120 All variables centred and standardized to have a unitary standard deviation. The coefficients displayed show the relationship of the 2IPD score on the five targets for which data was available. Standard errors between parentheses. *p<0.10; **p<0.05; ***p<0.01.
30
Table 5 – Goal 9 indicators and postal development
Freight t/km
Freight t/km
Freight t/km
Freight tonnes
Passenger kilometres
Passenger kilometres
Passenger kilometres
Manufacturing value added
% of medium/ high-tech
air rail road rail air road air share in GDP value added in GDP
2IPD score, 2018 0.33*** 0.24* 0.22* 0.28** 0.34*** 0.24* 0.34*** 0.46*** 0.66***
(0.10) (0.10) (0.10) (0.10) (0.09) (0.10) (0.10) (0.09) (0.08)
R-squared 0.11 0.06 0.05 0.08 0.12 0.06 0.12 0.21 0.44 F-stat, p-value 0 0.02 0.03 0.01 0 0.01 0 0 0 Number of observations 99 99 99 99 99 99 99 99 99 All variables centred and standardized to have a unitary standard deviation. The coefficients displayed show the relationship of the 2IPD score on the five targets for which data was available. Standard errors between parentheses. *p<0.10; **p<0.05; ***p<0.01.
Table 6 – Goal 11 indicators and postal development
% of population living in slums
Direct disaster economic loss
Direct disaster economic loss in % GDP
Direct disaster economic loss, exposed value
2IPD score, 2018 -0.51*** 0.52*** -0.04 0.44***
(0.10) (0.10) (0.12) (0.10)
R-squared 0.26 0.27 0 0.2
F-stat, p-value 0 0 0.73 0
Number of observations 74 74 74 74 All variables centred and standardized to have a unitary standard deviation. The coefficients displayed show the relationship of the 2IPD score on the four targets for which data was available. Standard errors between parentheses. *p<0.10; **p<0.05; ***p<0.01.
31
Table 7 – Goal 17 indicators and postal development
Volume of remittances as % of GDP
Debt service as % of gross exports
% of fixed Internet broadband subscriptions
% of individuals using the Internet
Dollar value of technical assistance disbursed
2IPD score, 2018 -0.08 0.01 0.47*** 0.52*** 0.38***
(0.11) (0.11) (0.09) (0.09) (0.10)
R-squared 0.01 0 0.22 0.27 0.14
F-stat, p-value 0.43 0.91 0 0 0 Number of observations 91 91 91 91 91 All variables centred and standardized to have a unitary standard deviation. The coefficients displayed show the relationship of the 2IPD score on the five targets for which data was available. Standard errors between parentheses. *p<0.10; **p<0.05; ***p<0.01.

32
Notes 1 UPU (2018), “Postal Economic Outlook”. 2 The previous 2IPD ranking was published in UPU (2016), “Integrated Index for Postal Development”. 3 These are the averages obtained by applying the same sample of countries as those included in the 2IPD. 4 For more information on this, please refer to Ansón, De Borba and Piotrowski (2018), “Postal Economic Outlook 2018”,
UPU publications; or Universal Postal Union (2014), “Development strategies for the postal sector: an economic perspective”, Delft: Eburon Academic Publishers.
5 These averages are based on the list of countries covered by the ranking in any given year. This list may vary owing to new countries entering or exiting the ranking.
6 The UN Statistics Division is in charge of consolidating, publishing and updating the indicators (https://unstats.un.org/sdgs/indicators/database/).
7 This is in line with the objectives in the Istanbul World Postal Strategy. In fact, all the UPU's key strategic goals for the 2017–2020 cycle are aligned with one or more SDGs.
8 ITU (2017), “Fast-forward progress: Leveraging tech to achieve the global goals”. 9 UN Global Pulse (2016), "Building Proxy Indicators of National Wellbeing with Postal Data", Project Series, No. 22. 10 “Postal Economic Outlook 2018”, UPU. 11 UPU and ILO (2016), “Advancing financial inclusion through access to insurance: the role of postal networks”; and
Ansón, J., Berthaud, A., Klapper, L. F., & Singer, D. (2013), “Financial inclusion and the role of the post office”, World Bank Policy Research Working Paper, No. 6630.
12 The indicators were (a) growth rate of real GDP per capita, (b) growth rate of real GDP per employed person, (c) No. of commercial bank branches per 100,000 adults, (d) No. of commercial ATMs per 100,000 adults, and (e) % of adults with a bank account.
13 The model estimated had the SDG indicators as a dependent variable regressed on the 2IPD indicator. To make the results comparable, we normalized all the variables to have zero mean and unitary standard deviation. Results for the regression appear in the annex (table 4).
14 On the horizontal axis, there is the 2IPD score, on the vertical axis, the percentage of adults with a bank account. The red line indicates the best fist between the two variables, taking into account that both variables are always strictly positive and cannot be greater than 100%.
15 Taking the average of the distribution as the reference point shows that an increase of 1 standard deviation of the 2IPD is correlated with a 0.73 standard deviation increase of the variable “proportion of adults with a bank account”. Such an increase would be equivalent to a 2IPD increase of 22 points coupled with a 24-percentage-point increase of the proportion of adults with a bank account.
16 In order to obtain the results reported in this figure, SDG indicator 8.10.2 was regressed on the four 2IPD sub-indices (reliability, reach, relevance and resilience).
17 UPU (2016), “Global Panorama on Financial Inclusion”. 18 The results of the multivariate regressions are in table 5 of the annex. 19 If we focus on average effects, an increase of 1 standard deviation of the 2IPD is correlated with less than a 0.66
standard deviation increase of the percentage of medium/high-tech value added in total value added. This means that increasing the 2IPD by 22 percentage points is correlated with an 11-percentage-point increase in the percentage of medium/high-tech value added in total value added.
20 Full regression results are given in the annex (table 6). 21 Full regression details are given in the annex (table 7).

© U
nive
rsal
Pos
tal U
nion
– A
pril
2018
UNIVERSAL POSTAL UNIONInternational BureauWeltpoststrasse 4P.O. Box 3123000 BERNE 15SWITZERLAND
Tel: +41 31 350 31 11E-mail: [email protected]
Des
ign
– D
IRC
AB.
STR
AT