Post-test Inspection of NASA’s Evolutionary Xenon ... · Post-test Inspection of NASA’s...
20
American Institute of Aeronautics and Astronautics 1 Post-test Inspection of NASA’s Evolutionary Xenon Thruster Long-Duration Test Hardware: Discharge and Neutralizer Cathodes Rohit Shastry 1 and George C. Soulas 2 NASA Glenn Research Center, Cleveland, Ohio, 44135 The NEXT Long-Duration Test is part of a comprehensive thruster service life assessment intended to demonstrate overall throughput capability, validate service life models, quantify wear rates as a function of time and operating condition, and identify any unknown life- limiting mechanisms. The test was voluntarily terminated in February 2014 after demonstrating 51,184 hours of high-voltage operation, 918 kg of propellant throughput, and 35.5 MN-s of total impulse. The post-test inspection of the thruster hardware began shortly afterwards with a combination of non-destructive and destructive analysis techniques, and is presently nearing completion. This paper presents relevant results of the post-test inspection for both discharge and neutralizer cathodes. Discharge keeper erosion was found to be significantly reduced from what was observed in the NEXT 2 kh wear test and NSTAR Extended Life Test, providing adequate protection of vital cathode components throughout the test with ample lifetime remaining. The area of the discharge cathode orifice plate that was exposed by the keeper orifice exhibited net erosion, leading to cathode plate material building up in the cathode-keeper gap and causing a thermally-induced electrical short observed during the test. Significant erosion of the neutralizer cathode orifice was also found and is believed to be the root cause of an observed loss in flow margin. Deposition within the neutralizer keeper orifice as well as on the downstream surface was thicker than expected, potentially resulting in a facility-induced impact on the measured flow margin from plume mode. Neutralizer keeper wall erosion on the beam side was found to be significantly lower compared to the NEXT 2 kh wear test, likely due to the reduction in beam extraction diameter of the ion optics that resulted in decreased ion impingement. Results from the post-test inspection have led to some minor thruster design improvements. Nomenclature BSE = Backscattered Electron DCA = Discharge Cathode Assembly EDS = Energy Dispersive x-ray Spectroscopy ELT = Extended Life Test GRC = Glenn Research Center IPS = Ion Propulsion System JB = beam current, A LDT = Long-Duration Test LVPI = Low Voltage Propellant Isolator NCA = Neutralizer Cathode Assembly NEXT = NASA’s Evolutionary Xenon Thruster NEXT-C = NASA’s Evolutionary Xenon Thruster – Commercial NEXT LDT = NASA’s Evolutionary Xenon Thruster Long-Duration Test NSTAR = NASA’s Solar Electric Propulsion Technology Application Readiness NSTAR LDT = NASA’s Solar Electric Propulsion Technology Application Readiness Life Demonstration Test PPU = Power Processor Unit 1 Research Engineer, Electric Propulsion Systems Branch, 21000 Brookpark Road, MS 301-3, AIAA member. 2 Aerospace Engineer, Electric Propulsion Systems Branch, 21000 Brookpark Road, MS 301-3, AIAA member. https://ntrs.nasa.gov/search.jsp?R=20170000955 2018-08-18T00:52:44+00:00Z
Transcript of Post-test Inspection of NASA’s Evolutionary Xenon ... · Post-test Inspection of NASA’s...
American Institute of Aeronautics and Astronautics
1
Post-test Inspection of NASA’s Evolutionary Xenon Thruster
Long-Duration Test Hardware: Discharge and Neutralizer
Cathodes
Rohit Shastry1 and George C. Soulas2
NASA Glenn Research Center, Cleveland, Ohio, 44135
The NEXT Long-Duration Test is part of a comprehensive thruster service life assessment
intended to demonstrate overall throughput capability, validate service life models, quantify
wear rates as a function of time and operating condition, and identify any unknown life-
limiting mechanisms. The test was voluntarily terminated in February 2014 after
demonstrating 51,184 hours of high-voltage operation, 918 kg of propellant throughput, and
35.5 MN-s of total impulse. The post-test inspection of the thruster hardware began shortly
afterwards with a combination of non-destructive and destructive analysis techniques, and is
presently nearing completion. This paper presents relevant results of the post-test inspection
for both discharge and neutralizer cathodes. Discharge keeper erosion was found to be
significantly reduced from what was observed in the NEXT 2 kh wear test and NSTAR
Extended Life Test, providing adequate protection of vital cathode components throughout
the test with ample lifetime remaining. The area of the discharge cathode orifice plate that
was exposed by the keeper orifice exhibited net erosion, leading to cathode plate material
building up in the cathode-keeper gap and causing a thermally-induced electrical short
observed during the test. Significant erosion of the neutralizer cathode orifice was also found
and is believed to be the root cause of an observed loss in flow margin. Deposition within the
neutralizer keeper orifice as well as on the downstream surface was thicker than expected,
potentially resulting in a facility-induced impact on the measured flow margin from plume
mode. Neutralizer keeper wall erosion on the beam side was found to be significantly lower
compared to the NEXT 2 kh wear test, likely due to the reduction in beam extraction diameter
of the ion optics that resulted in decreased ion impingement. Results from the post-test
inspection have led to some minor thruster design improvements.
Nomenclature
BSE = Backscattered Electron
DCA = Discharge Cathode Assembly
EDS = Energy Dispersive x-ray Spectroscopy
ELT = Extended Life Test
GRC = Glenn Research Center
IPS = Ion Propulsion System
JB = beam current, A
LDT = Long-Duration Test
LVPI = Low Voltage Propellant Isolator
NCA = Neutralizer Cathode Assembly
NEXT = NASA’s Evolutionary Xenon Thruster
NEXT-C = NASA’s Evolutionary Xenon Thruster – Commercial
NEXT LDT = NASA’s Evolutionary Xenon Thruster Long-Duration Test
NSTAR = NASA’s Solar Electric Propulsion Technology Application Readiness
NSTAR LDT = NASA’s Solar Electric Propulsion Technology Application Readiness Life Demonstration Test
PPU = Power Processor Unit
1 Research Engineer, Electric Propulsion Systems Branch, 21000 Brookpark Road, MS 301-3, AIAA member. 2 Aerospace Engineer, Electric Propulsion Systems Branch, 21000 Brookpark Road, MS 301-3, AIAA member.
https://ntrs.nasa.gov/search.jsp?R=20170000955 2018-08-18T00:52:44+00:00Z

American Institute of Aeronautics and Astronautics
2
QCM = Quartz Crystal Microbalance
SEM = Scanning Electron Microscopy
VB = beam power supply voltage, V
I. Introduction
ASA has identified the need for a higher-power, higher-specific impulse, higher-thrust, and higher-throughput
capable ion propulsion system (IPS) beyond the state-of-the-art NASA Solar Electric Propulsion Technology
Application Readiness (NSTAR) IPS employed on the Deep Space 1 and Dawn Missions.1-4 To fill this need, the
NASA’s Evolutionary Xenon Thruster (NEXT) IPS development, led by the NASA Glenn Research Center (GRC),
was competitively selected in 2002. The NEXT IPS advanced technology was developed under the sponsorship of
NASA’s In-Space Propulsion Technology Program, with Phase 2 close-out of the NEXT IPS development occurring
in 2012. The highest fidelity NEXT hardware planned was built by the government/industry NEXT team and includes:
an engineering model (referred to as prototype model) thruster, an engineering model power processor unit (PPU),
engineering model propellant management assemblies, a prototype gimbal, and control unit simulators.5 Each of the
units underwent extensive component-level testing, completed environmental testing (with the exception of the PPU),
and was tested together in system integration testing.6-9 Results from IPS component testing and integration testing
can be found in Refs. 7-17.
The NEXT thruster service life capability is being assessed through a comprehensive service life validation scheme
that utilizes a combination of testing and analyses. Since the NEXT thruster is an evolution of the NSTAR thruster
design, insights into the operation and erosion processes gained from NSTAR’s development project apply to the
NEXT thruster. The NEXT thruster, as a second-generation deep-space gridded ion thruster, made use of over 70,000
hours of ground and flight test experience (not including the accumulated hours from the NSTAR IPS on the ongoing
Dawn mission) in both the design of the NEXT thruster and evaluation of thruster wear-out failure modes. A NEXT
service life assessment was conducted at NASA GRC, employing several models to evaluate all known failure modes
with high confidence based upon the substantial amount of ion thruster testing dating back to the early 1960s.18, 19 The
NEXT service life assessment also incorporated results from the NEXT 2 kh wear test conducted on a NEXT
laboratory model (referred to as engineering model) thruster operating at full power (6.9 kW).18, 20 The transparency
between the engineering model and prototype model thruster wear characteristics was demonstrated by a short-
duration prototype model wear test.21 The references for the NEXT service life assessment explain the thruster
performance and erosion modeling analyses.18, 19
The NEXT Long-Duration Test (LDT) was initiated in June 2005 as part of the comprehensive thruster service
life assessment. The goals of the test were to demonstrate the initial project qualification propellant throughput
requirement of 450 kg, validate the thruster service life model’s predictions, quantify thruster performance and erosion
as a function of thruster wear and throttle level, and identify any unknown life-limiting mechanisms. In December
2009, after successfully demonstrating the original qualification throughput requirement of 450 kg, the first listed goal
was redefined to test to failure of the thruster or until decision to terminate the test voluntarily.
A decision to voluntarily terminate the test was made in April 2013 due to budget constraints. After a
comprehensive end-of-test performance characterization was completed,22 the thruster was vented to atmospheric
conditions in April 2014. At the end of the test, the thruster had accumulated 51,184 hours of high-voltage operation,
processed 918 kg of xenon propellant, and delivered 35.5 MN-s of total impulse, setting numerous records for the
most demonstrated lifetime of an electric propulsion device. Post-test inspection of the hardware was initiated soon
after removal of the thruster from the vacuum facility. The results of this inspection for both the discharge and
neutralizer cathodes are the subject of this paper. Results for other thruster components, including the ion optics and
discharge chamber, and covered in companion publications.23, 24
In April 2015, Aerojet Rocketdyne (with subcontractor ZIN Technologies) was competitively selected for the
NASA’s Evolutionary Xenon Thruster – Commercial (NEXT-C) contract. The objectives of this contract are two-
fold: 1) To deliver two flight thrusters and two flight PPUs for use in future NASA missions, and 2) take steps to
transition NEXT into a commercially available, off-the-shelf IPS for use by NASA as well as other interested parties.
While the LDT was initiated as part of the Phase 2 effort under NASA’s In-Space Propulsion Technology Program,
the post-test inspection of the LDT thruster hardware has now fallen under the NEXT-C contract to be performed as
an in-house task by GRC. The results of the LDT will then be relayed to Aerojet Rocketdyne along with any
recommended design improvements to be made to the thruster flight design.
The paper is organized as follows: Section II covers the background for the NEXT LDT, including details of the
test article as well as the throttling profile used over the course of the test. Section III describes the post-test inspection
objectives, as well as the overall approach that was taken. Section IV includes major results of the post-test inspection
N
American Institute of Aeronautics and Astronautics
3
for the discharge and neutralizer cathodes, including resolution of several issues encountered during the test. Section
V then summarizes key findings and briefly describes remaining future work.
II. NEXT Long-Duration Test Background
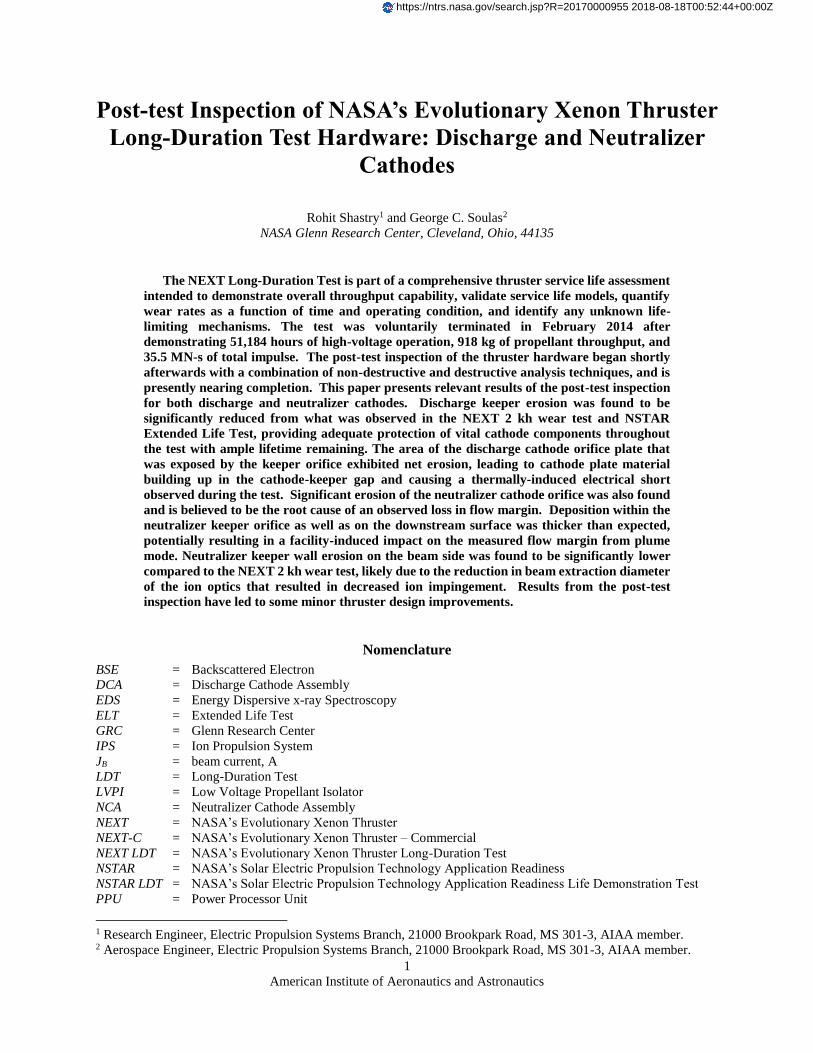
The NEXT LDT was conducted within Vacuum Facility 16 at
NASA GRC. The test article is a modified version of an engineering
model (designated EM3), shown firing in Fig. 1. To obtain a flight-
representative configuration, prototype-model ion optics were
incorporated, provided by industry partner Aerojet Corporation (now
Aerojet Rocketdyne). A graphite discharge cathode keeper electrode
was also incorporated into EM3.25 The NEXT thruster is nominally a
0.5 – 6.9 kW input power xenon thruster utilizing 2-grid dished-out ion
optics, capable of producing thrust levels of 25 – 235 mN and specific
impulses of 1400 – 4160 seconds. The technical approach for NEXT
continues the derating philosophy used for the NSTAR ion thruster. A
beam extraction area of 1.6X that of NSTAR allows for higher thruster
input power while maintaining low discharge voltages and ion current
densities, thus maintaining thruster longevity. Additional descriptions
of the hardware, including the NEXT EM3 design and vacuum facility,
can be found in Refs. 2, 26, and 27-31.
Various diagnostics were utilized to characterize the performance
and wear of the thruster during the LDT. These include: three staggered planar probes on a single-axis motion table
to monitor ion current density distributions and beam divergence, a quartz crystal microbalance (QCM) to monitor
backsputtered efflux from the facility, and an E × B probe to monitor the charge-state signature of the thruster plume.
A data acquisition and control system was also used to monitor the thruster telemetry at 15 Hz and permit autonomous
operation. A set of six in situ, charge-coupled device cameras were placed on the single-axis motion table to monitor
wear rates of critical components on the thruster. These cameras imaged the downstream neutralizer keeper and
cathode orifice plates, the discharge keeper and cathode orifice plates, accelerator grid apertures at various radials
locations from centerline, and the cold grid gap of the ion optics. Additional details of the testing and facility
diagnostics can be found in Refs. 29 and 32.
The NEXT IPS was designed for solar electric propulsion applications that experience variable input power as the
available solar flux changes with distance from the sun throughout the mission. For the LDT, the EM3 thruster was
operated in a mission-representative profile comprised of discrete segments at various power levels shown in Table 1
and described in detail in Ref. 33. The thruster was operated at each of these segments for sufficient duration to
characterize the performance and wear rates, and to validate the thruster service life models. The throttle profile was
completed in May 2010 and the thruster was then operated at full power until the end of the test in February 2014.
For the majority of the test, detailed performance characterizations were carried out at 11 of the 40 operating conditions
in the NEXT throttle table. These characterizations included overall thruster performance as well as component
performance of the discharge chamber, neutralizer cathode, and ion optics. A comprehensive performance
characterization was also performed at the end of the test that included all 40 operating conditions in the NEXT throttle
table. Details of performance measurements as well as in situ images taken during the test can be found in Refs. 22,
28, 29, and 32-40.
Table 1. NEXT Long-Duration Test mission-representative throttling profile.
Throttle
Segment
Throttle
Level
Input Power,
kW
Operating Condition
(JB, VB)
Segment Duration,
kh
End of Segment
Date
1 TL40 6.9 3.52 A, 1800 V 13.0 11/17/2007
2 TL37 4.7 3.52 A, 1179 V 6.5 12/23/2008
3 TL05 1.1 1.20 A, 679 V 3.4 06/24/2009
4 TL01 0.5 1.00 A, 275 V 3.2 12/15/2009
5 TL12 2.4 1.20 A, 1800 V 3.1 05/05/2010
6 TL40 6.9 3.52 A, 1800 V 21.9 02/28/2014
Figure 1. Photograph of NEXT EM3 firing
within Vacuum Facility 16 at GRC.

American Institute of Aeronautics and Astronautics
4
III. Post-test Inspection Objectives and Approach
The post-test inspection for the NEXT LDT largely followed the same approach and processes as what was
employed for the inspection of the NSTAR Extended Life Test (ELT) thruster hardware.41 The primary objectives of
the post-test inspection are to: measure critical thruster wear rates that can induce thruster failure, to verify both in situ
measurements and the service life model predictions; resolve any thruster-related issues encountered during the NEXT
LDT; verify that thruster design changes made as a result of prior wear test findings had the desired impacts; and
identify any unanticipated life-limiting phenomena. The thruster components were first inspected non-destructively
in order to preserve the hardware for potential future testing. It was originally thought that resolution of issues
encountered during the test or further characterization of the state of the hardware may require additional operation of
individual components or the thruster as a whole. However, after reviewing results from the non-destructive
inspection, it was determined that resolution of many open issues and questions required destructive inspection of
various thruster components.
Particular attention was paid to failure modes that were identified during the initial lifetime assessment and service
life modeling for the NEXT thruster.18 For the cathodes, these failure modes included: insert barium depletion resulting
in excessive cathode temperatures or inability to ignite; excessive wear of the keeper orifice plate (discharge cathode)
or keeper tube (neutralizer cathode) resulting in exposure of the cathode orifice plate and heater; excessive wear of
the cathode orifice plate; heater mechanical failure from cyclic operation; and neutralizer cathode orifice clogging
preventing proper cathode operation.
Each hollow cathode contains an electron emitter impregnated with barium oxide, calcium oxide, and aluminum
oxide. Migration of barium and barium oxide to the surface reduces the surface work function, allowing the necessary
electron emission to occur at reduced temperatures. Barium at the surface is lost through evaporation and eventually
becomes depleted at the downstream end of the cathode, forcing the reaction front to move further upstream. If
sufficient barium loss occurs, the surface work function increases and required cathode operating temperatures rise.
If the cathode heater can no longer produce the necessary temperatures, the cathode will no longer be able to ignite.
Characterization of the barium depletion within each cathode insert for the LDT is presently ongoing, with results to
be presented at a later date. However, given the typical ignition times that were observed throughout the test, excessive
barium depletion in either cathode is not expected.
Erosion of the downstream face of the keeper orifice plate on the discharge cathode occurs from sputter erosion
by ions formed downstream of the cathode. This erosion was so severe during the NSTAR ELT that the keeper orifice
plate had completely eroded away by the end of the test. Because the primary purpose of the discharge keeper in
NSTAR is to protect the cathode orifice plate and heater coil from ion bombardment, the excessive erosion of the
keeper also led to sputter erosion of the cathode orifice plate, heater coil, and radiation shield.41 Erosion of the keeper
orifice plate was also found to be higher than expected during the NEXT 2 kh wear test.20 To increase cathode lifetime,
the keeper material was changed from a refractory metal to a carbon-based material with a significantly lower sputter
yield. This change was made to the EM3 hardware that was tested during the NEXT LDT.
While the downstream face of the keeper orifice plate on the neutralizer cathode has not been found to erode in
past NSTAR and NEXT life tests, the side of the keeper tube facing the ion beam is vulnerable to sputter erosion.
Excessive erosion of this surface was found during the NEXT 2 kh wear test.20 While wear through the keeper tube
thickness does not cause cathode failure, in order to increase cathode lifetime the keeper tube thickness was increased
by 50%; however, this design change was not implemented on the EM3 hardware. Due to excessive erosion of outer
radius apertures on the accelerator grid observed during the NEXT 2 kh wear test, the ion extraction diameter was
reduced from 40 cm to 36 cm. This change, employed on the EM3 prototype-model ion optics, should reduce the
wear rate on the beam side of the neutralizer keeper tube.
If excessive erosion of the keeper electrode occurs, it may expose areas of the cathode orifice plate to ion
bombardment. Furthermore, the downstream portion of the cathode orifice plate exposed by the keeper orifice is
immediately vulnerable to sputter erosion by ions. Erosion of the cathode orifice plate could either result in structural
failure, or inability to operate due to significant changes to the geometry of the orifice (e.g. enlargement).
Heater coils are used to heat the cathode and emitter to sufficient temperatures required for ignition. Once ignited,
the discharge provides sufficient heating to keep the cathode ignited and the heater may be turned off. After a certain
number of these cycles, heaters can mechanically fail, preventing them from conducting the required current to heat
the cathode. For the NEXT (and NEXT-C) projects, heaters are cyclically tested separately in order to quantify their
lifetime. Ignition times are typically no longer than six minutes, and heaters made for the NEXT project in the past
have demonstrated in excess of 6,000 cycles.13 Because the NEXT LDT had approximately 350 ignitions over the
course of the test, heater damage due to excessive cycling is not expected.

American Institute of Aeronautics and Astronautics
5
Neutralizer cathode orifice clogging was observed during low power (i.e. low beam current) operation in the
NSTAR ELT.41 Unfortunately, the material causing the clogging was removed during subsequent operation at full
power, preventing investigation of the cause during post-test inspection. Excessive clogging of the orifice may prevent
proper cathode operation. However, such clogging was not observed during the NEXT 2 kh wear test or the NEXT
LDT, and given that the orifice diameter on the NEXT neutralizer is nearly twice that of the orifice diameter on the
NSTAR neutralizer, orifice clogging on NEXT is unlikely.18, 20, 22
Apart from verification of the increased component lifetime gained from the design changes described above, the
post-test inspection of the hardware was needed to resolve a number of issues encountered during the test. In particular,
causes needed to be determined (or verified) for: an observed cathode-to-keeper electrical short and heater open circuit
in the discharge cathode; a low impedance between the neutralizer and facility ground; and a loss of neutralizer
performance (flow margin from plume mode operation) over the course of the test. These issues and their resolution,
as well as other pertinent results, are described in the next section.
IV. Results and Discussion
A. Discharge Cathode
1. General Inspection
The discharge cathode assembly (DCA) was visually inspected
after removal of the ion optics from the thruster. Figure 2 shows a
photograph of the discharge cathode prior to removal from the
discharge chamber. The discharge keeper, whose primary purpose in
NEXT is to protect internal cathode components from the discharge
plasma, appeared intact with little erosion, even after 51.7 kh of
cathode operation. The exposed portion of the cathode orifice plate
had a highly textured appearance, exhibiting a bowl-like shape that
indicates significant erosion. Substantial deposition was also found
within the gap between keeper and cathode plate surfaces, at a
location coincident with the keeper orifice circumference. All of
these features are discussed in more detail in the sections below.
Geometric and magnetic field measurements in the vicinity of the
cathode indicated that the DCA did not shift during the test and was
still properly positioned within the magnetic field of the discharge
chamber. All electrical connections were checked and found to be
secure, and no issues were found with any of the electrical insulators.
Lastly, the discharge cathode flow line (including all fittings) was
checked for leaks and none were found.
2. Discharge Cathode Keeper
To characterize the final geometry of the discharge keeper from the NEXT LDT, it was axially cross-sectioned
through the center and inspected with an optical microscope. Non-contact profilometry of the downstream surface
was first performed across four diameters. The orifice plate was then mounted in epoxy to ensure that any deposition
was minimally disturbed during the sectioning process. Figure 3 shows a photograph of one side of the keeper orifice
plate cross section, with a dashed lined indicating the nominal pretest profile for reference. It is evident from the
figure that erosion had occurred across the entire downstream face as well as within the keeper orifice. The eroded
downstream profile exhibits a shape very similar to that found during the NSTAR Life Demonstration Test (LDT) and
the NEXT 2 kh wear test.20, 42 However, the maximum eroded depth is only 15.8% of the pretest thickness, occurring
at a location of 39% of the total radius. There was no observable erosion or deposition on the cathode keeper tube
wall. These results are remarkably similar to those found in the NEXT 2 kh wear test, with a maximum eroded depth
of 17% of the thickness at a location of 40% of the total radius. This indicates that the keeper material change has
successfully provided a substantial increase in the lifetime over what was observed in the NSTAR LDT, NSTAR
ELT, and NEXT 2 kh wear tests.
Figure 2. Photograph of the discharge cathode
within EM3 shortly after the ion optics were
removed.

American Institute of Aeronautics and Astronautics
6
Figure 3. Cross section of the discharge keeper orifice plate from the NEXT LDT. The top corresponds to the downstream
surface, with the dashed line indicating the nominal pretest profile.
Figure 4 shows a close-up photograph of the keeper orifice. It
is evident from this figure and Fig. 3 that the orifice has enlarged
throughout nearly the entire plate thickness. However, a
deposition layer approximately 2 µm thick was found on the
upstream portion of the orifice barrel, covering 20% of the original
keeper thickness. This layer indicates that the upstream part of the
orifice was not continually eroding throughout the test. The
minimum diameter within the orifice was measured using a non-
contact method to be within 0.4% of the pretest diameter. For
comparison, the in situ measurement of the keeper orifice diameter
taken at the end of the test indicated a decrease of 3%, which is in
agreement with the post-test value within the measurement
uncertainty.
Deposition on the upstream surface of the keeper orifice plate
is also evident from Fig. 4. This deposition reached a maximum
thickness of 4.2% of the pretest keeper orifice plate thickness. This
excludes the deposition “hanging” from the upstream corner of the
keeper orifice. It is unknown if that deposition, which is 12.9% of the pretest keeper plate thickness, was disturbed
during the post-test inspection. However, it is likely that what is shown in Fig. 4 resembles the true geometry because
the orifice plate was mounted in epoxy prior to sectioning, and the deposition was found to be tightly adhered to the
substrate. Energy dispersive x-ray spectroscopy (EDS) indicated that this deposition was material from the cathode
orifice plate. This deposition is believed to have been responsible for the intermittent cathode-to-keeper electrical
short observed during the test. This is discussed in further detail in Section IV-A-4.
3. Discharge Cathode Orifice Plate and Tube
The discharge cathode orifice plate and tube were
visually inspected after the keeper was removed from the
DCA. Figure 5 shows a photograph of a face-on view of
the discharge cathode orifice plate with the keeper
removed. The area that was exposed to the discharge
plasma by the keeper orifice has a textured appearance
and is a region of net erosion. Near the perimeter of this
area, roughly coincident with the diameter of the keeper
orifice, there is a ridge of deposition flaring outward from
the orifice plate surface. This deposition was found to be
highly fragile, and was only loosely bound to the cathode
orifice plate. Outside of the region of net erosion, there is
no visual wear due to operation. In fact, machining marks
on the surface are still visible. This is a significant
improvement over the erosion observed in the NSTAR
ELT, where the outer edge of the plate was only 28% of
the pretest plate thickness and was only attached to the
cathode tube by a 20-50 µm wide fused area. The cathode
orifice plate was completely exposed to the discharge
plasma during the NSTAR ELT due to excessive keeper plate erosion.41
Figure 4. Close-up view of the discharge keeper
orifice cross section. The entire orifice shows net
erosion, and deposits were found on the upstream
side of the orifice plate.
Figure 5. Face-on view of the discharge cathode orifice plate
after the keeper was removed from the assembly. The area
exposed by the keeper orifice exhibits net erosion, with a
distinct deposition ridge near the perimeter.

American Institute of Aeronautics and Astronautics
7
Non-contact profilometry was performed on the downstream surface across four diameters. Afterwards, the
cathode orifice plate and tube were mounted in epoxy (to prevent disturbing deposition material) and sectioned through
the tube centerline. Material from the deposition ridge on one side was preserved prior to the mounting and sectioning
process. Figure 6 shows the cross section of the discharge cathode orifice plate, with the nominal pretest geometry
provided for reference. Much of the original chamfer as well as portions of the downstream surface exposed by the
keeper had been eroded. However, the cylindrical portion of the orifice shows significant net deposition. Based on
EDS analysis, this material either came from the cathode insert or the orifice plate itself. However, no insert
impregnate material (i.e. barium, calcium or aluminum) was found in the deposition, so it is more likely that the source
was eroded products from cathode plate surfaces further downstream.
Figure 6. Discharge orifice plate cross section through centerline. The dashed lines correspond to the nominal pretest plate
geometry. Net deposition was observed within the upstream orifice barrel.
A non-contact measurement technique performed prior to sectioning indicated that the minimum cathode orifice
diameter had decreased by 13% compared to the pretest diameter. In situ measurements taken at the end of the test
prior to venting the facility indicated that the orifice diameter reduced by 5 ± 3.5%. The discrepancy, even after
accounting for measurement uncertainty, is presently unknown. It is possible the in situ camera for the DCA either
did not have the resolution to fully define the cathode orifice edge as it eroded or had insufficient lighting to see
through the entire thickness of the plate. A reduction in the minimum cathode orifice diameter was not entirely
unexpected, as similar reductions were found during the NEXT 2 kh wear test and NSTAR LDT, measuring 3% and
5% less than pretest diameters, respectively. However, for these tests the source of deposits appear to have come from
the keeper and insert.20, 42, 43 The cathode orifice chamfer diameter was also measured with in situ cameras throughout
the test. However, as seen in Fig. 6, the outer edge of the chamfer is no longer well-defined. Comparison of in situ
images to those taken during the post-test inspection indicate that the boundary being tracked as the chamfer diameter
later in the test was likely the inner edge of the deposition ridge.22
Based on Figs. 5 and 6, the deposition ridge is positioned within the eroded zone, and not on the outside perimeter.
This indicates that the deposition ridge had formed on the cathode surface after the substrate had eroded, at least to a
degree. There also appears to be an inflection point in the eroded chamfer of the cathode orifice plate in the vicinity
of the deposition ridge, possibly caused by the deposition shadowing the orifice plate at larger radii, preventing further
erosion. This provides insight into the way this deposition developed, which is believed to be responsible for the
observed cathode-to-keeper electrical short during the test. This topic is discussed in more detail in Section IV-A-4.
Trace amounts of deposition were found on the downstream surface of the cathode orifice plate as well as within
the cathode tube. Analysis using EDS indicates that these deposits were composed of either cathode orifice plate
material and/or material from the cathode insert. Insert material within the cathode tube is not surprising given that
the insert tube is in close proximity with most of the surface. Unfortunately, it appears that much of this material was
very loosely adhered to the surface, and flowed freely while the cathode tube was being mounted in epoxy (the material
used for mounting is a liquid that then sets and cures). An artifact of this mounting technique can be seen in Fig. 6
within the cathode orifice, where a liquid “front” can be seen emanating from the upstream surface of the orifice plate
into the middle of the orifice. While it is unfortunate that not all of the deposits could be preserved by mounting the
piece in epoxy, the structure of the deposits within the orifice and of the deposition ridge were able to be captured
with this technique.

American Institute of Aeronautics and Astronautics
8
4. Discharge Cathode-Keeper Electrical Short
An electrical short between the discharge cathode and keeper was observed during the NEXT LDT. This short
began as a thermally-induced short, beginning to manifest during ignitions around 13 kh. Around 48 kh, the short
developed from being thermally-induced to a more consistent short present even at room temperature.40 This shorting
was not entirely unexpected given results from similar discharge cathodes in the NEXT 2 kh and High Power Electric
Propulsion 2 kh wear tests at GRC, which showed deposits on the upstream surface of the keeper orifice plate.43, 44
Cathode-to-keeper shorting was also observed during the NSTAR ELT between approximately 6 – 9 kh. It was
presumed that the short had cleared afterwards due to sufficient keeper orifice erosion.41
Post-test inspection of the discharge cathode revealed
significant deposits in the gap between the cathode and keeper
orifice plates (see Fig. 7). Once the keeper electrode was
removed from the cathode assembly, high impedance (~ 52
GΩ at maximum operating voltage) was measured between
keeper and cathode common. This indicates that the bridging
material, not other components such as the wiring or electrical
insulators further upstream, was responsible for the electrical
short observed during the test. Analysis of these deposits with
EDS revealed they had come from the cathode orifice plate. It
is speculated that erosion of the exposed surface of the cathode
orifice plate deposited material on the upstream surface of the
keeper orifice plate. Over the course of the test, this material
thickness grew until it made contact with the cathode orifice
plate during ignitions. The deposits then subsequently “tore”
and left behind material that had bonded to the downstream surface of the cathode orifice plate. This explanation is
supported by the observation that the deposition on the keeper was tightly adhered while the deposition on the cathode
orifice plate was loosely bound. Furthermore, the deposition was bonded in a region of the cathode orifice plate
exhibiting erosion, indicating that it likely did not begin accumulating on that surface.
Given that the material originated from the cathode orifice plate, this short is expected to develop in flight. During
the test, the presence of the cathode-keeper short appeared to increase cathode ignition times.22 This is expected to be
the only significant effect of the short on thruster performance or lifetime. In order to better quantify the impact the
short had on ignitions, conditions for each of the 350 ignitions from the test were characterized in order to isolate the
effect of the cathode-keeper short. It was found that additional factors, such as facility regenerations and the presence
of a heater open circuit, had contributed to increased ignition times and tended to obfuscate the true impact of the
short.
Figure 8 provides histograms of ignition times for “nominal” ignitions where no issues were present (also excludes
ignitions performed directly after a facility regeneration), as well as ignitions where a cathode-keeper short was the
only issue present (excludes post-regeneration ignitions, ignitions where the heater went open-circuit, and ignitions
considered “atypical” due to factors such as operator error). For nominal ignitions, 185 ignitions took place with an
average ignition time of 3 minutes 44 seconds and a maximum of 8 minutes and 53 seconds. For ignitions where the
keeper was shorted to cathode, 50 ignitions took place with an average ignition time of 6 minutes 5 seconds and a
maximum of 28 minutes. These data indicate that the short does increase ignition time, but by an average of ~ 2.5
minutes. An ongoing ignition study is presently being performed on engineering model NEXT hardware to provide
additional data that characterizes the impact of a cathode-keeper short on ignition time. The preliminary results of
this study also indicate that the presence of an electrical short increases ignition times by ~ 2 minutes on average.45
Figure 7. Photograph of the discharge cathode-keeper
gap, revealing significant deposits originating from the
cathode orifice plate.

American Institute of Aeronautics and Astronautics
9
Figure 8. Histograms of discharge ignition times from the NEXT LDT. a) Ignition time distribution of nominal ignitions
with no issues present. Average ignition time was 3 minutes 44 seconds. b) Ignition time distribution with the cathode-
keeper short being the only issue. Average ignition time was 6 minutes 5 seconds.
It is worth noting that during both the NEXT LDT and this additional study, long electrical line lengths between
the thruster and power supplies had attenuated the ignitor voltage pulse by nearly a factor of two. This could have a
significant effect on ignition times, especially when the keeper is shorted to the cathode. Additional studies are
currently planned to deliver the nominal ignition pulse voltage to the thruster and determine if the impact of the short
on ignition times is reduced.
As mentioned previously, a short between the discharge cathode and keeper was observed during the NSTAR
ELT. This short had disappeared after 9 kh, presumably due to enlargement of the keeper orifice. However, due to
the excessive erosion of the discharge keeper observed during the NSTAR ELT, the keeper material was changed to
one with a much lower sputter yield for thrusters on the Dawn mission. While this change would significantly increase
keeper lifetime on the NSTAR thruster, it is more likely that cathode-keeper shorts would develop and persist in flight.
Unfortunately, such a measurement is not available on the Dawn spacecraft so it is unknown whether a cathode-keeper
short has occurred. However, to-date there have been 653 thruster starts across three thrusters, will all ignitions
occurring within one second of commanding the ignitor voltage pulse.46 This indicates that even if a cathode-keeper
short is present, it may not have an impact on ignition times in flight.
5. Discharge Cathode Radiation Shield and Heater
The exposed cathode heater and radiation shield were visually inspected after the keeper was removed from the
DCA. Figure 9 shows photographs of these two components during post-test inspection. The radiation shield was
found to be in remarkably good condition, with no visual indications of any wear. The heater coil was also in excellent
condition, with both heater terminations intact. Post-test measurements of the heater coil resistance (prior to removal
from the cathode assembly) using a milliohmeter yielded an average value of 0.452 Ω, which is only 1.5% lower than
the pretest value of 0.459 Ω and within the measurement variation. This lack of observable wear is not surprising.
Given the minimal amount of erosion found on the discharge keeper, it had adequately protected the cathode orifice
plate, heater coil and radiation shield from the discharge plasma during thruster operation for over 51 kh. This is a
marked improvement over what was observed in the NSTAR ELT, which had significant damage to these components
due to excessive keeper erosion and subsequent exposure to the discharge plasma.41

American Institute of Aeronautics and Astronautics
10
Figure 9. Photographs of a) the DCA heater radiation shield and b) the heater coil after removal from the cathode tube. No
visible wear or defects were found to be caused by cathode operation.
During the NEXT LDT, an intermittent, thermally-induced discharge heater open circuit was observed during
cathode ignitions from ~ 13 – 29 kh. This open circuit typically caused increased cathode ignition times. It had been
speculated that this open circuit was caused by poor contact between the heater sheath and the cathode tube. For the
engineering model cathode, a “friction fit” contact between the heater coil and the downstream end of the cathode
tube was used as the only return path for heater current.32 It was speculated that initial thermal expansion of the heater
coil during the ignition procedure had caused the heater to momentarily separate from the cathode tube, resulting in
the open circuit. As heat is transferred to the cathode tube, it expands as well until contact with the heater is
reestablished.
Visual inspection of the interface between the heater coil and the cathode tube could not verify the presence of any
gap (although this was only done at room temperature). However, comprehensive measurements of the resistance
across various components in the heater circuit on the cathode indicated that all connections were secure and
resistances were repeatable except for the one between the heater sheath and cathode tube, which was highly variable
and sometimes exceeded 20 Ω at room temperature. This large variation indicates poor contact between the heater
sheath and cathode tube, supporting the speculated cause for the open circuit behavior observed during the test.
Furthermore, during destructive disassembly the heater coil was easily removed from the cathode tube with little to
no force, also indicating a loose or poor contact between the two components.
While the lack of a positive return path is an issue for the engineering model discharge cathodes, it is not expected
to occur for the NEXT flight cathodes. The present flight design incorporates a more reliable, secure connection
between the cathode tube and heater sheath, and Aerojet Rocketdyne is working to ensure such a connection is
adequate in preventing heater open circuits during ignitions and cathode conditioning sequences.
B. Neutralizer Cathode
1. General Inspection
The neutralizer cathode assembly (NCA) was inspected prior to removal from the thruster. Most of the exposed
keeper surface was coated with deposition, including the downstream face of the orifice plate (see Fig. 10). Spalling
of deposition films was also evident on the downstream face of the neutralizer enclosure. These films were comprised
of backsputtered material from the facility walls, and are therefore not expected in flight. Deposition on the keeper
was expected, as the majority of the neutralizer keeper has not been a site of significant erosion.18, 20, 41 The exception
is the side of the keeper facing the ion beam, which can be susceptible to direct ion beam impingement. Figure 10b
shows the region of the beam-side of the keeper tube that exhibited net erosion. Furthermore, the downstream edge
of the tube from 3 o’clock to 9 ‘clock (bottom half facing the thruster beam) exhibited a roughened appearance. This
was determined to be the deposition on the downstream face fragmenting as it transitions to the region of net erosion
on the beam-side of the tube. The exposed part of the neutralizer cathode orifice plate also exhibited a heavily textured
appearance, with noticeable erosion occurring in the chamfer region of the orifice. All of these features are discussed
in more detail in the corresponding sections below.

American Institute of Aeronautics and Astronautics
11
Figure 10. Photographs of the NCA during the post-test inspection prior to disassembly. a) Front view of the neutralizer,
showing deposition on most of the keeper surface. The thruster would be at the bottom of the image. b) Side view of the
neutralizer keeper tube facing the ion beam, showing a region of net erosion near the orifice plate.
All electrical connections and wiring were inspected and no issues were found. This was important to verify due
to the observed low impedance between neutralizer common and facility ground during the test. The mass flow line
was also checked and no significant leaks were found. This was also important as a leak in the flow line could explain
the loss in performance (decrease in flow margin from plume mode) that was observed during the test, so this was
eliminated as a possibility. These issues and their resolution are discussed in further detail in the sections below.
2. Neutralizer Cathode Keeper
The neutralizer keeper was removed from the
assembly and sectioned axially through the center to
determine its final geometry. The section was mounted
in epoxy prior to polishing in order to preserve the
deposition present on most surfaces. Prior to sectioning,
the minimum diameter of the keeper orifice was
measured using a non-contact technique, indicating that
the keeper diameter had decreased by 6%. This is
inconsistent with in situ measurements taken at the end
of the test prior to venting the facility, which had
indicated that the diameter had increased by 1%
(essentially no change given the measurement
uncertainty). The reason for this discrepancy is presently
unknown.
Figure 11 shows a cross section of the neutralizer
keeper near the orifice. It is evident from the photograph
that deposition is present on all surfaces. The deposition
layer on the downstream face of the orifice plate,
determined by EDS analysis to be primarily carbon from
the facility, was measured to be approximately 27% of the pretest keeper thickness. This is significantly higher than
the estimated deposition thickness using QCM data taken during the test.22 The reason for this discrepancy is presently
unknown. While the calculated thickness from the QCM data assumes that carbon is deposited at the maximum
theoretical density, the deposition observed on the downstream face of the keeper does not appear to be porous.
Deposition films sampled away from the thruster, such as on the facility endcap behind the thruster, have overall
thicknesses consistent with the calculated thickness from QCM data. Therefore, it is possible that plasma conditions
in the vicinity of the cathode enable a higher deposition rate than what is measured by the QCM placed at the side of
the thruster. However, the deposition thickness observed on the downstream face of the neutralizer in the NSTAR
ELT was consistent with the calculated thickness from a QCM.41
Figure 11. Cross section of the neutralizer keeper orifice
plate near centerline. The orifice is to the left, while the
downstream face is at the top. Deposition was observed on
all surfaces.

American Institute of Aeronautics and Astronautics
12
Deposition within the orifice, seen in Fig. 11, was verified to be
responsible for the measured decrease in orifice diameter prior to
sectioning. This deposition, determined using EDS to be a mixture
of backsputtered carbon from the facility as well as material from
the cathode orifice plate, was also found on the upstream side of the
keeper orifice plate. The maximum thickness on the upstream side
was found to be 6% of the pretest keeper thickness, and tapers off
rapidly with increasing radial distance from the orifice. Figure 12
shows a backscattered electron (BSE) photomicrograph of the
deposition within the keeper orifice. The overall deposition exhibits
a jagged appearance that is qualitatively similar to what was
observed in the NSTAR ELT.41 As a BSE image, lighter areas in
Fig. 12 correspond to heavier elements (i.e. material from the
cathode orifice plate) while darker areas correspond to lighter
elements (i.e. backsputtered carbon from the facility). The
deposition within the orifice exhibits a layering that is similar to
what was observed on the screen and accelerator grids from the
NEXT LDT.23 This layered appearance was correlated to the
throttling of the thruster over the course of the test. The relative
amounts of heavy and light elements in each layer are dependent
upon the thruster erosion rates and facility backsputter rates. Given
the composition of the deposition in each layer, it is likely that the
highest level of cathode orifice plate erosion rates occurred at a beam
current of 3.52 A during the first 19.5 kh of operation. This is consistent with performance and in situ camera data,
which show the largest changes in neutralizer performance and orifice chamfer dimensions occurring during this
time.22 The overall changes to the dimensions of the keeper orifice plate due to deposition were higher than
anticipated. The increase in effective keeper thickness and decrease in effective keeper diameter and keeper-to-
cathode gap could improve neutralizer performance and partially mask the loss in performance observed during the
test. Thus, this deposition may be partially responsible for the relatively constant neutralizer performance observed
during the last 10-15 kh of the test. Because much of this deposition is a facility effect and will not be present in
flight, its impact on the measured performance loss during the LDT will need to be assessed.
One of the potential failure modes listed in Section III was erosion of the neutralizer keeper tube, exposing the
cathode orifice plate and heater. General inspection of the keeper indicated a net erosion zone on the beam side of the
keeper tube. Figure 13 shows a cross section of this region, illustrating the thinning of the keeper tube wall due to ion
impingement. A photograph of the opposite side is provided for comparison, which shows no thinning and slight
deposition. Also evident in the figure is the breaking of the deposition layer on the downstream face of the keeper
orifice plate as it transitions into the net erosion region on the beam side of the tube. To quantify the level of erosion,
the radial distance from the outer surface to a reference plane (taken as the inner surface of the tube wall) was measured
as a function of distance from the downstream face of the keeper orifice plate substrate (see Fig. 14).
Figure 13. Cross section photographs of the downstream end of the neutralizer keeper tube. a) Beam side of the keeper,
showing net erosion of the tube wall. b) Opposite side of the keeper shown for comparison, displaying deposition.
Figure 12. Backscattered electron image of the
deposition found within the neutralizer keeper
orifice.

American Institute of Aeronautics and Astronautics
13
Based on the measurements at the furthest downstream location, approximately 24% of the tube wall thickness
had been eroded by the end of the test. However, these measurements were taken in the area of the weld between the
orifice plate and the tube, which is downstream of the cathode orifice plate and heater. Upstream of the keeper orifice
plate, the maximum eroded depth was approximately 17% of the pretest tube thickness, with erosion observed up to
2.5 plate thicknesses upstream of the downstream face of the keeper orifice plate. By comparison, the maximum
erosion observed during the NEXT 2 kh wear test was 7.5% of the pretest tube thickness, with erosion observed up to
6.7 plate thicknesses upstream. Thus, there is a significant reduction in the extent of erosion observed in the NEXT
LDT. The primary factor responsible for this difference is likely the reduced beam extraction diameter between the
engineering model optics (used in the NEXT 2 kh wear test) and prototype model optics (used in the NEXT LDT).
This effectively decreased the keeper tube area exposed to the ion beam, as well as reduced the overall ion flux to the
surface. Furthermore, the flight design of the keeper incorporates a tube wall that is 50% thicker than what was tested
in the NEXT LDT. This change, coupled with the reduced erosion rates observed during the NEXT LDT, indicates
that keeper wear through should not be a life limiter for the thruster.
Figure 14. Extent of erosion of the beam-side of the keeper tube wall as a function of upstream axial distance. The location
of the upstream surface of the orifice plate is provided for reference.
Other than the net erosion region observed
near the downstream end of the keeper tube,
deposition was found on the tube surface. A
relatively uniform thin layer that was
approximately 12% of the keeper tube
thickness was found on the keeper tube wall,
and was determined by EDS analysis to be
primarily backsputtered carbon from the
facility. However, the deposition on the beam
side of the keeper exhibited a slightly different
structure. Figure 15 shows a BSE image of the
deposition, illustrating a thin layer of material
in the middle with a distinctly different
composition. While most of the deposition was
found to be composed of backsputtered carbon
from the facility, the thin layer was determined
to have a high concentration of grid material.
Given its location within the deposition
thickness, this layer is likely the result of
throttling the thruster to an operating condition
Figure 15. Backscattered electron photomicrograph of the deposition
layer on the beam side of the neutralizer keeper. A thin layer of grid-
rich deposition was found within the primarily carbon-rich layer that
had originated from the facility.
American Institute of Aeronautics and Astronautics
14
with a higher degree of accelerator grid aperture erosion and a lower facility backsputter rate. While this deposition
is not expected to cause any issues, it indicates that the keeper tube surface facing the beam will likely collect
deposition from the grid in flight.
3. Neutralizer Cathode Orifice Plate and Tube
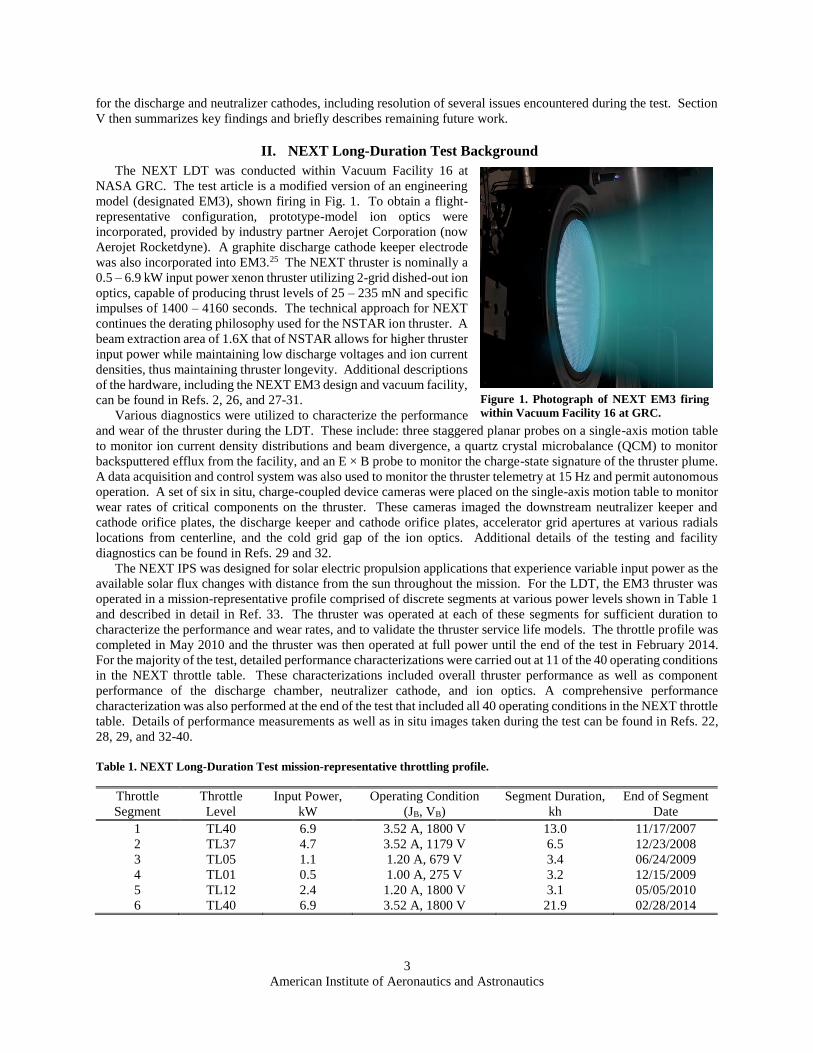
After the keeper was removed from the NCA, the cathode orifice plate and tube were visually inspected. Texturing
of the orifice plate was observed, especially on the side closer to the ion beam. A closer inspection of this surface
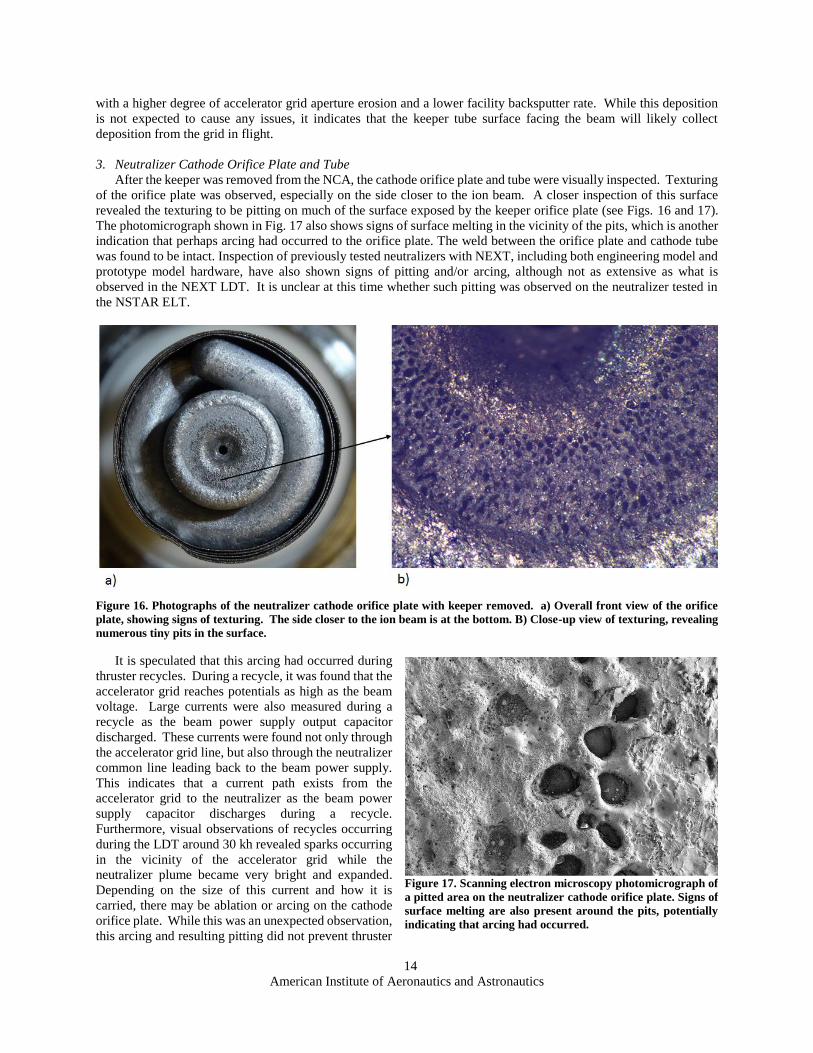
revealed the texturing to be pitting on much of the surface exposed by the keeper orifice plate (see Figs. 16 and 17).
The photomicrograph shown in Fig. 17 also shows signs of surface melting in the vicinity of the pits, which is another
indication that perhaps arcing had occurred to the orifice plate. The weld between the orifice plate and cathode tube
was found to be intact. Inspection of previously tested neutralizers with NEXT, including both engineering model and
prototype model hardware, have also shown signs of pitting and/or arcing, although not as extensive as what is
observed in the NEXT LDT. It is unclear at this time whether such pitting was observed on the neutralizer tested in
the NSTAR ELT.
Figure 16. Photographs of the neutralizer cathode orifice plate with keeper removed. a) Overall front view of the orifice
plate, showing signs of texturing. The side closer to the ion beam is at the bottom. B) Close-up view of texturing, revealing
numerous tiny pits in the surface.
It is speculated that this arcing had occurred during
thruster recycles. During a recycle, it was found that the
accelerator grid reaches potentials as high as the beam
voltage. Large currents were also measured during a
recycle as the beam power supply output capacitor
discharged. These currents were found not only through
the accelerator grid line, but also through the neutralizer
common line leading back to the beam power supply.
This indicates that a current path exists from the
accelerator grid to the neutralizer as the beam power
supply capacitor discharges during a recycle.
Furthermore, visual observations of recycles occurring
during the LDT around 30 kh revealed sparks occurring
in the vicinity of the accelerator grid while the
neutralizer plume became very bright and expanded.
Depending on the size of this current and how it is
carried, there may be ablation or arcing on the cathode
orifice plate. While this was an unexpected observation,
this arcing and resulting pitting did not prevent thruster
Figure 17. Scanning electron microscopy photomicrograph of
a pitted area on the neutralizer cathode orifice plate. Signs of
surface melting are also present around the pits, potentially
indicating that arcing had occurred.
American Institute of Aeronautics and Astronautics
15
operation or cause any issues regarding performance or lifetime. Furthermore, it is shown below that the pitting is
highly superficial and did not significantly reduce the thickness of the orifice plate.
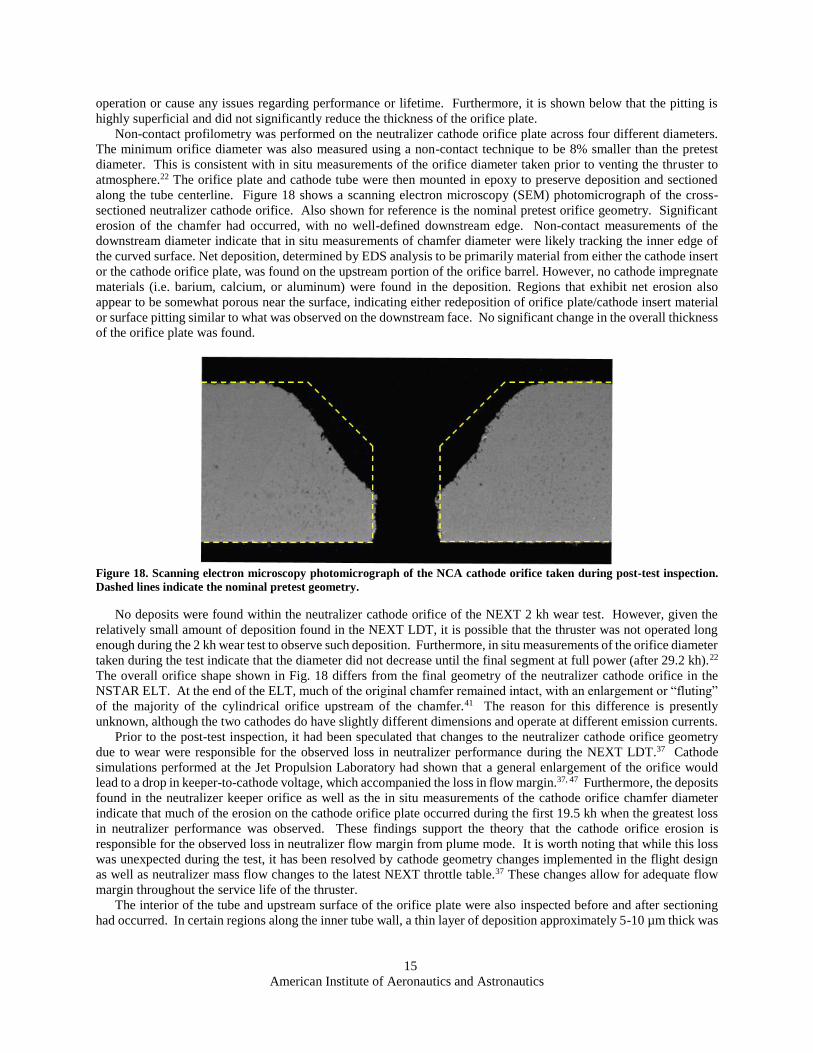
Non-contact profilometry was performed on the neutralizer cathode orifice plate across four different diameters.
The minimum orifice diameter was also measured using a non-contact technique to be 8% smaller than the pretest
diameter. This is consistent with in situ measurements of the orifice diameter taken prior to venting the thruster to
atmosphere.22 The orifice plate and cathode tube were then mounted in epoxy to preserve deposition and sectioned
along the tube centerline. Figure 18 shows a scanning electron microscopy (SEM) photomicrograph of the cross-
sectioned neutralizer cathode orifice. Also shown for reference is the nominal pretest orifice geometry. Significant
erosion of the chamfer had occurred, with no well-defined downstream edge. Non-contact measurements of the
downstream diameter indicate that in situ measurements of chamfer diameter were likely tracking the inner edge of
the curved surface. Net deposition, determined by EDS analysis to be primarily material from either the cathode insert
or the cathode orifice plate, was found on the upstream portion of the orifice barrel. However, no cathode impregnate
materials (i.e. barium, calcium, or aluminum) were found in the deposition. Regions that exhibit net erosion also
appear to be somewhat porous near the surface, indicating either redeposition of orifice plate/cathode insert material
or surface pitting similar to what was observed on the downstream face. No significant change in the overall thickness
of the orifice plate was found.
Figure 18. Scanning electron microscopy photomicrograph of the NCA cathode orifice taken during post-test inspection.
Dashed lines indicate the nominal pretest geometry.
No deposits were found within the neutralizer cathode orifice of the NEXT 2 kh wear test. However, given the
relatively small amount of deposition found in the NEXT LDT, it is possible that the thruster was not operated long
enough during the 2 kh wear test to observe such deposition. Furthermore, in situ measurements of the orifice diameter
taken during the test indicate that the diameter did not decrease until the final segment at full power (after 29.2 kh).22
The overall orifice shape shown in Fig. 18 differs from the final geometry of the neutralizer cathode orifice in the
NSTAR ELT. At the end of the ELT, much of the original chamfer remained intact, with an enlargement or “fluting”
of the majority of the cylindrical orifice upstream of the chamfer.41 The reason for this difference is presently
unknown, although the two cathodes do have slightly different dimensions and operate at different emission currents.
Prior to the post-test inspection, it had been speculated that changes to the neutralizer cathode orifice geometry
due to wear were responsible for the observed loss in neutralizer performance during the NEXT LDT.37 Cathode
simulations performed at the Jet Propulsion Laboratory had shown that a general enlargement of the orifice would
lead to a drop in keeper-to-cathode voltage, which accompanied the loss in flow margin.37, 47 Furthermore, the deposits
found in the neutralizer keeper orifice as well as the in situ measurements of the cathode orifice chamfer diameter
indicate that much of the erosion on the cathode orifice plate occurred during the first 19.5 kh when the greatest loss
in neutralizer performance was observed. These findings support the theory that the cathode orifice erosion is
responsible for the observed loss in neutralizer flow margin from plume mode. It is worth noting that while this loss
was unexpected during the test, it has been resolved by cathode geometry changes implemented in the flight design
as well as neutralizer mass flow changes to the latest NEXT throttle table.37 These changes allow for adequate flow
margin throughout the service life of the thruster.
The interior of the tube and upstream surface of the orifice plate were also inspected before and after sectioning
had occurred. In certain regions along the inner tube wall, a thin layer of deposition approximately 5-10 µm thick was

American Institute of Aeronautics and Astronautics
16
found, determined by EDS analysis to be composed of material from the cathode tube and insert. This was not
unexpected given the proximity between the tube and the cathode insert in this region.
4. Neutralizer Cathode Radiation Shield and Heater
The neutralizer heater and radiation shield were also inspected after the keeper was removed from the assembly.
The majority of the radiation shield was found to be excellent condition. However, signs of arcing were found near
the downstream edge of the shield (see Fig. 19). These arc tracks were limited to the outermost surface of the radiation
shield. Furthermore, texturing of the downstream edge itself was observed (see Fig. 16a). These features are likely
correlated with the pitting observed on the downstream surface of the cathode orifice plate (see the previous section).
Inspection of the radiation shield from the NEXT 2 kh wear test revealed similar arcing had occurred near the
downstream edge, although to a much less degree likely due to the significantly lower run time. As with the pitting,
it is unclear at this time whether these signs of arcing were observed on the NSTAR ELT hardware.
Figure 19. Photographs of the heater radiation shield taken after the neutralizer keeper was removed. a) Overall view of
the radiation shield, showing that the majority of the outer surface is in excellent condition. b) Close-up view of the
downstream area that shows signs of arcing.
Inspection of the heater also revealed texturing on
the downstream face (see Fig. 16a). Aside from this,
an inspection of the heater coil indicated it is in
excellent condition (see Fig. 20), with both heater
terminations remaining intact. Post-test
measurements of the heater resistance yielded an
average value of 0.260 Ω, which is an 8.6% increase
from the pretest average measurement of 0.240 Ω.
This increase is surprising given that the neutralizer
was only ignited 348 times during the test, and the
heater voltage increased by at most a few percent
during that time. It is possible that contact resistances
in the circuit had artificially increased the overall
measured resistance, even though the resistance of the
measurement leads were accounted for. Indeed, the cathode heater resistance during initial inspection and disassembly
(at the ends of long thruster electrical lines) was found to increase with time. Regardless, no issues with the heater
were observed during ignitions over the course of the test. The friction fit connecting the heater sheath to the cathode
tube was secure, and removing the heater required some force. This is in contrast to the discharge cathode heater,
which was easily removed from the tube and had exhibited intermittent heater open circuit behavior during the NEXT
LDT.
Figure 20. Photograph of the heater coil after removal from the
neutralizer cathode tube. Aside from texturing on the downstream
face, the coil was found to be in excellent condition.
American Institute of Aeronautics and Astronautics
17
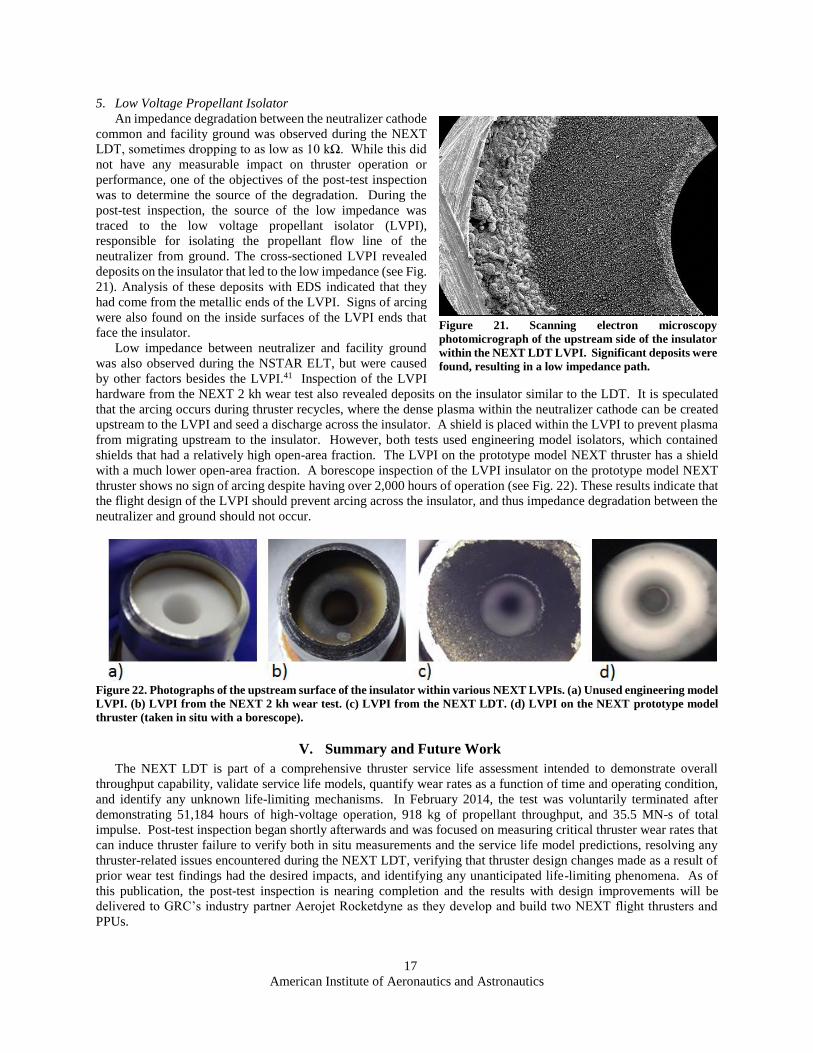
5. Low Voltage Propellant Isolator
An impedance degradation between the neutralizer cathode
common and facility ground was observed during the NEXT
LDT, sometimes dropping to as low as 10 kΩ. While this did
not have any measurable impact on thruster operation or
performance, one of the objectives of the post-test inspection
was to determine the source of the degradation. During the
post-test inspection, the source of the low impedance was
traced to the low voltage propellant isolator (LVPI),
responsible for isolating the propellant flow line of the
neutralizer from ground. The cross-sectioned LVPI revealed
deposits on the insulator that led to the low impedance (see Fig.
21). Analysis of these deposits with EDS indicated that they
had come from the metallic ends of the LVPI. Signs of arcing
were also found on the inside surfaces of the LVPI ends that
face the insulator.
Low impedance between neutralizer and facility ground
was also observed during the NSTAR ELT, but were caused
by other factors besides the LVPI.41 Inspection of the LVPI
hardware from the NEXT 2 kh wear test also revealed deposits on the insulator similar to the LDT. It is speculated
that the arcing occurs during thruster recycles, where the dense plasma within the neutralizer cathode can be created
upstream to the LVPI and seed a discharge across the insulator. A shield is placed within the LVPI to prevent plasma
from migrating upstream to the insulator. However, both tests used engineering model isolators, which contained
shields that had a relatively high open-area fraction. The LVPI on the prototype model NEXT thruster has a shield
with a much lower open-area fraction. A borescope inspection of the LVPI insulator on the prototype model NEXT
thruster shows no sign of arcing despite having over 2,000 hours of operation (see Fig. 22). These results indicate that
the flight design of the LVPI should prevent arcing across the insulator, and thus impedance degradation between the
neutralizer and ground should not occur.
Figure 22. Photographs of the upstream surface of the insulator within various NEXT LVPIs. (a) Unused engineering model
LVPI. (b) LVPI from the NEXT 2 kh wear test. (c) LVPI from the NEXT LDT. (d) LVPI on the NEXT prototype model
thruster (taken in situ with a borescope).
V. Summary and Future Work
The NEXT LDT is part of a comprehensive thruster service life assessment intended to demonstrate overall
throughput capability, validate service life models, quantify wear rates as a function of time and operating condition,
and identify any unknown life-limiting mechanisms. In February 2014, the test was voluntarily terminated after
demonstrating 51,184 hours of high-voltage operation, 918 kg of propellant throughput, and 35.5 MN-s of total
impulse. Post-test inspection began shortly afterwards and was focused on measuring critical thruster wear rates that
can induce thruster failure to verify both in situ measurements and the service life model predictions, resolving any
thruster-related issues encountered during the NEXT LDT, verifying that thruster design changes made as a result of
prior wear test findings had the desired impacts, and identifying any unanticipated life-limiting phenomena. As of
this publication, the post-test inspection is nearing completion and the results with design improvements will be
delivered to GRC’s industry partner Aerojet Rocketdyne as they develop and build two NEXT flight thrusters and
PPUs.
Figure 21. Scanning electron microscopy
photomicrograph of the upstream side of the insulator
within the NEXT LDT LVPI. Significant deposits were
found, resulting in a low impedance path.

American Institute of Aeronautics and Astronautics
18
Both discharge and neutralizer cathodes were thoroughly inspected using non-destructive and destructive
techniques. For the discharge cathode, a maximum keeper erosion depth of only 16% of the orifice plate thickness
was found, indicating ample remaining lifetime and a marked improvement over wear rates observed during the NEXT
2 kh wear test and the NSTAR ELT. The downstream surface of the cathode orifice plate exposed to the plasma
exhibited significant erosion, but all other cathode components including the rest of the orifice plate, heater, and
radiation shield were found to be in remarkably good condition. This is a consequence of the observed low erosion
rates of the keeper, which had adequately protected vital cathode components throughout the 51 kh life test. Eroded
products from the cathode orifice plate were found in the inter-electrode gap that were responsible for the observed
keeper-to-cathode electrical short during the test. Data indicate that the only significant impact of this short is a ~ 2
minute increase in typical cathode ignition times, although this impact may be reduced with a flight-like ignitor pulse
and environment. The observed discharge heater open circuit during the test is attributed to poor contact between the
heater sheath and cathode tube during ignitions, which is being addressed in the cathode flight design.
For the neutralizer cathode, erosion of the beam side of the keeper tube was significantly reduced compared to the
results from the NEXT 2 kh wear test. This has been attributed to the reduced beam extraction diameter, which
decreases the ion beam flux to the neutralizer keeper surface. Significant deposition was observed within the keeper
orifice as well as the downstream face, which may have affected the measured flow margin from plume mode during
the test. Because this deposition was primarily facility-induced, its impact on the measurements will need to be
assessed. Significant erosion of the neutralizer cathode orifice was found, with the shape of the orifice differing from
what was observed in the NSTAR ELT. Despite this difference, strong evidence remains that the enlargement of the
orifice is responsible for the loss in neutralizer performance observed during the test. This loss has been mitigated by
geometric changes to the neutralizer flight design, as well as neutralizer flow rate changes in the latest NEXT throttle
table. Evidence of arcing at the neutralizer was found on the cathode orifice plate as well as near the downstream
edge of the heater radiation shield. This arcing is believed to occur during thruster recycles, when the accelerator grid
can reach the beam voltage and current was measured to flow between the neutralizer and the accelerator grid. The
resulting pitting and arc tracks were superficial and not expected to be an issue. Lastly, an observed low impedance
between neutralizer and facility ground was determined to be caused by arcing within the low voltage propellant
isolator. A design change between the isolator used in the LDT and the flight-like model used in the prototype thruster
appears to have solved this issue and is therefore not a concern.
A few tasks remain to be completed for the post-test inspection of the cathodes. In particular, the cathode inserts
must be inspected for barium depletion as well as any tungstate formation. Also, further inspection of both heaters is
being considered. This will either entail sectioning the heaters and inspecting the cross sections of each coil, or
operating them in a cyclic heater life test to quantify their remaining lifetime. Finally, all these data will be used to
validate and update the thruster service life models, which will complete the service life assessment for the NEXT
thruster.
Acknowledgments
The authors would like to thank and acknowledge Kevin McCormick and Jim Sovey for their invaluable aid
throughout the post-test inspection process. The authors would also like to thank and acknowledge Pete Bonacuse,
Terry McCue, and Joy Buehler of the Analytical Science Group at GRC for their outstanding work involving mounting
and polishing samples, SEM imaging, and putting up with our sometimes unreasonable demands on the fidelity of
results. Lastly, the authors would like to thank Rob Thomas and Mike Patterson for conducting the additional discharge
cathode ignition study mentioned in the paper. This work was funded by the NEXT-C project, which is led by NASA
GRC under NASA’s Science Mission Directorate.
References
1Brophy, J. R., et al., "Development and Testing of the Dawn Ion Propulsion System", 42nd AIAA/ASME/SAE/ASEE Joint
Propulsion Conference and Exhibit, AIAA-2006-4319, Sacramento, CA, July 9-12, 2006. 2Patterson, M. J. and Benson, S. W., "NEXT Ion Propulsion System Development Status and Performance", 43rd
AIAA/ASME/SAE/ASEE Joint Propulsion Conference and Exhibit, AIAA-2007-5199, Cincinnati, OH, July 8-11, 2007. 3Polk, J. E., et al., "Demonstration of the NSTAR Ion Propulsion System on the Deep Space One Mission", 27th International
Electric Propulsion Conference, IEPC-2001-075, Pasadena, CA, October 15-19, 2001. 4Rayman, M. D., "The Successful Conclusion of the Deep Space 1 Mission: Important Results Without a Flashy Title", Space
Technology, Vol. 23, No. 2-3, 2003, pp. 185-196. 5Benson, S. W. and Patterson, M. J., "NASA's Evolutionary Xenon Thruster (NEXT) Ion Propulsion Technology Development
Status in 2009", 31st International Electric Propulsion Conference, IEPC-2009-150, Ann Arbor, MI, September 20-24, 2009.

American Institute of Aeronautics and Astronautics
19
6Hoskins, W. A., Aadland, R. S., Meckel, N. J., Talerico, L. A., and Monheiser, J. M., "NEXT Ion Propulsion System Production
Readiness", 43rd AIAA/ASME/SAE/ASEE Joint Propulsion Conference and Exhibit, AIAA-2007-5856, Cincinnati, OH, July 8-11,
2007. 7Patterson, M. J., et al., "NEXT Multi-Thruster Array Test - Engineering Demonstration", 42nd AIAA/ASME/SAE/ASEE Joint
Propulsion Conference and Exhibit, AIAA-2006-5180, Sacramento, CA, July 9-12, 2006. 8Snyder, J. S., Anderson, J. R., Van Noord, J. L., and Soulas, G. C., "Environmental Testing of the NEXT PM1 Ion Engine", 43rd
AIAA/ASME/SAE/ASEE Joint Propulsion Conference and Exhibit, AIAA-2007-5275, Cincinnati, OH, July 8-11, 2007. 9Soulas, G. C., Patterson, M. J., Pinero, L., Herman, D. A., and Snyder, J. S., "NEXT Single String Integration Test Results", 45th
AIAA/ASME/SAE/ASEE Joint Propulsion Conference and Exhibit, AIAA-2009-4816, Denver, CO, August 2-5, 2009. 10Aadland, R. S., Frederick, H., Benson, S. W., and Malone, S. P., "Development Results of the NEXT Propellant Management
System", JANNAF 2nd Liquid Propulsion Subcommittee and 1st Spacecraft Propulsion Subcommittee Joint Meeting, JANNAF
2005-0356DW, Monterey, CA, December 5-8, 2005. 11Crofton, M. W., et al., "Characterization of the NASA NEXT Thruster", 45th AIAA/ASME/SAE/ASEE Joint Propulsion
Conference and Exhibit, AIAA-2009-4815, Denver, CO, August 2-5, 2009. 12Diamant, K. D., Pollard, J. E., Crofton, M. W., Patterson, M. J., and Soulas, G. C., "Thrust Stand Characterization of the NASA
NEXT Thruster", 46th AIAA/ASME/SAE/ASEE Joint Propulsion Conference & Exhibit, AIAA-2010-6701, Nashville, TN, July 25
- 28, 2010. 13Herman, D. A., Pinero, L. R., and Sovey, J. S., "NASA's Evolutionary Xenon Thruster (NEXT) Component Verification Testing",
44th AIAA/ASME/SAE/ASEE Joint Propulsion Conference and Exhibit, AIAA-2008-4812, Hartford, CT, July 21-23, 2008. 14Herman, D. A., Soulas, G. C., and Patterson, M. J., "Performance Evaluation of the Prototype-Model NEXT Ion Thruster", 43rd
AIAA/ASME/SAE/ASEE Joint Propulsion Conference and Exhibit, AIAA-2007-5212, Cincinnati, OH, July 8-11, 2007. 15Pinero, L. R., Hopson, M., Todd, P. C., and Wong, B., "Performance of the NEXT Engineering Model Power Processing Unit",
43rd AIAA/ASME/SAE/ASEE Joint Propulsion Conference and Exhibit, AIAA-2007-5214, Cincinnati, OH, July 8-11, 2007. 16Pollard, J. E., Diamant, K. D., Crofton, M. W., Patterson, M. J., and Soulas, G. C., "Spatially-Resolved Beam Current and Charge-
State Distributions for the NEXT Ion Engine", 46th AIAA/ASME/SAE/ASEE Joint Propulsion Conference and Exhibit, AIAA-
2010-6779, Nashville, TN, July 25-28, 2010. 17Snyder, J. S., et al., "Vibration Test of a Breadboard Gimbal for the NEXT Ion Engine", 42nd AIAA/ASME/SAE/ASEE Joint
Propulsion Conference and Exhibit, AIAA-2006-4665, Sacramento, CA, July 9-12, 2006. 18Van Noord, J. L., "Lifetime Assessment of the NEXT Ion Thruster", 43rd AIAA/ASME/SAE/ASEE Joint Propulsion Conference
and Exhibit, AIAA-2007-5274, Cincinnati, OH, July 8-11, 2007. 19Van Noord, J. L. and Herman, D. A., "Application of the NEXT Ion Thruster Lifetime Assessment to Thruster Throttling", 44th
AIAA/ASME/SAE/ASEE Joint Propulsion Conference and Exhibit, AIAA-2008-4526, Hartford, CT, July 21-23, 2008. 20Soulas, G. C., Kamhawi, H., Patterson, M. J., Britton, M. A., and Frandina, M. M., "NEXT Ion Engine 2000 Hour Wear Test
Results", 40th AIAA/ASME/SAE/ASEE Joint Propulsion Conference and Exhibit, AIAA-2004-3791, Fort Lauderdale, FL, July 11-
14, 2004. 21Van Noord, J. L., Soulas, G. C., and Sovey, J. S., "NEXT PM1R Ion Thruster and Propellant Management System Wear Test
Results", 31st International Electric Propulsion Conference, IEPC-2009-163, Ann Arbor, MI, September 20-24, 2009. 22Shastry, R., Herman, D. A., Soulas, G. C., and Patterson, M. J., "End-of-test Performance and Wear Characterization of NASA's
Evolutionary Xenon Thruster (NEXT) Long-Duration Test", 50th AIAA/ASME/SAE/ASEE Joint Propulsion Conference, AIAA-
2014-3617, Cleveland, OH, July 28-30, 2014. 23Soulas, G. C. and Shastry, R., "Post-test Inspection of NASA's Evolutionary Xenon Thruster Long Duration Test Hardware: Ion
Optics", 52nd AIAA/SAE/ASEE Joint Propulsion Conference, Salt Lake City, UT, July 25 - 27, 2016 (to be published). 24Shastry, R. and Soulas, G. C., "Post-test Inspection of NASA's Evolutionary Xenon Thruster Long-Duration Test Hardware:
Discharge Chamber", 52nd AIAA/SAE/ASEE Joint Propulsion Conference, Salt Lake City, UT, July 25 - 27, 2016 (to be published). 25Hoskins, W. A., et al., "Development of a Prototype Model Ion Thruster for the NEXT System", 40th AIAA/ASME/SAE/ASEE
Joint Propulsion Conference and Exhibit, AIAA-2004-4111, Fort Lauderdale, FL, July 11-14, 2004. 26Soulas, G. C. and Patterson, M. J., "NEXT Ion Thruster Performance Dispersion Analyses", 43rd AIAA/ASME/SAE/ASEE Joint
Propulsion Conference and Exhibit, AIAA-2007-5213, Cincinnati, OH, July 8-11, 2007. 27Frandina, M. M., Arrington, L. A., Soulas, G. C., Hickman, T. A., and Patterson, M. J., "Status of the NEXT Ion Thruster Long
Duration Test", 41st AIAA/ASME/SAE/ASEE Joint Propulsion Conference and Exhibit, AIAA-2005-4065, Tucson, AZ, July 10-
13, 2005. 28Herman, D. A., Soulas, G. C., and Patterson, M. J., "Performance Characteristics of the NEXT Long-Duration Test after 16,550
h and 337 kg of Xenon Processed", 44th AIAA/ASME/SAE/ASEE Joint Propulsion Conference and Exhibit, AIAA-2008-4527,
Hartford, CT, July 21-23, 2008. 29Herman, D. A., Soulas, G. C., and Patterson, M. J., "NEXT Long-Duration Test Plume and Wear Characteristics after 16,550 h
of Operation and 337 kg of Xenon Processed", 44th AIAA/ASME/SAE/ASEE Joint Propulsion Conference and Exhibit, AIAA-
2008-4919, Hartford, CT, July 21-23, 2008. 30Patterson, M. J., et al., "NEXT: NASA's Evolutionary Xenon Thruster", 38th AIAA/ASME/SAE/ASEE Joint Propulsion
Conference and Exhibit, AIAA-2002-3832, Indianapolis, IN, July 7-10, 2002. 31Soulas, G. C., Domonkos, M. T., and Patterson, M. J., "Performance Evaluation of the NEXT Ion Engine", 39th
AIAA/ASME/SAE/ASEE Joint Propulsion Conference and Exhibit, AIAA-2003-5278, Huntsville, AL, July 20-23, 2003.

American Institute of Aeronautics and Astronautics
20
32Herman, D. A., Soulas, G. C., and Patterson, M. J., "Status of the NEXT Long-Duration Test after 23,300 Hours of Operation",
45th AIAA/ASME/SAE/ASEE Joint Propulsion Conference and Exhibit, AIAA-2009-4917, Denver, CO, August 2-5, 2009. 33Herman, D. A., "Status of the NASA's Evolutionary Xenon Thruster (NEXT) Long-Duration Test after 30,352 Hours of
Operation", 46th AIAA/ASME/SAE/ASEE Joint Propulsion Conference and Exhibit, AIAA-2010-7112, Nashville, TN, July 25 -
28, 2010. 34Herman, D. A., "NASA's Evolutionary Xenon Thruster (NEXT) Project Qualification Propellant Throughput Milestone:
Performance, Erosion, and Thruster Service Life Prediction after 450 kg", JANNAF 7th Modeling and Simulation, 5th Liquid
Propulsion, and 4th Spacecraft Propulsion Joint Subcommittee Meeting, CPIAC JSC 2010-0015EH and NASA TM-2010-216816,
Colorado Springs, CO, May 3-7, 2010. 35Herman, D. A., "Review of the NASA's Evolutionary Xenon Thruster (NEXT) Long-Duration Test as of 632 kg of Propellant
Throughput", 47th AIAA/ASME/SAE/ASEE Joint Propulsion Conference and Exhibit, AIAA-2011-5658, San Diego, CA, July 31
- August 3, 2011. 36Herman, D. A., Soulas, G. C., and Patterson, M. J., "Status of the NEXT Ion Thruster Long-Duration Test after 10,100 h and 207
kg Demonstrated", 43rd AIAA/ASME/SAE/ASEE Joint Propulsion Conference and Exhibit, AIAA-2007-5272, Cincinnati, OH, July
8-11, 2007. 37Herman, D. A., Soulas, G. C., and Patterson, M. J., "NEXT Long-Duration Test Neutralizer Performance and Erosion
Characteristics", 31st International Electric Propulsion Conference, IEPC-2009-154, Ann Arbor, MI, September 20-24, 2009. 38Herman, D. A., Soulas, G. C., Van Noord, J. L., and Patterson, M. J., "NASA's Evolutionary Xenon Thruster Long-Duration Test
Results", Journal of Propulsion and Power, Vol. 28, No. 3, May - June, 2012, pp. 625-635. 39Shastry, R., Herman, D. A., Soulas, G. C., and Patterson, M. J., "NASA's Evolutionary Xenon Thruster (NEXT) Long-Duration
Test as of 736 kg of Propellant Throughput", 48th AIAA/ASME/SAE/ASEE Joint Propulsion Conference and Exhibit, AIAA-2012-
4023, Atlanta, GA, July 29 - August 1, 2012. 40Shastry, R., Herman, D. A., Soulas, G. C., and Patterson, M. J., "Status of NASA's Evolutionary Xenon Thruster (NEXT) Long-
Duration Test as of 50,000 h and 900 kg Throughput", 33rd International Electric Propulsion Conference, IEPC-2013-121,
Washington D.C., October 6 - 10, 2013. 41Sengupta, A., et al., "The 30,000-Hour Extended-Life Test of the Deep Space 1 Flight Spare Ion Thruster," NASA/TP 2004-
213391, March, 2005. 42Polk, J. E., et al., "An Overview of the Results from an 8200 Hour Wear Test of the NSTAR Ion Thruster", 35th
AIAA/ASME/SAE/ASEE Joint Propulsion Conference and Exhibit, AIAA-1999-2446, Los Angeles, CA, June 20-24, 1999. 43Britton, M., Soulas, G. C., Kamhawi, H., and Snyder, A., "Destructive Analysis of the NEXT 2000-Hour Wear Test Hollow
Cathode Assemblies," NASA/TM-2005-213387, July, 2005. 44Williams, G. J., et al., "Results of the 2000 hr Wear Test of the HiPEP Ion Thruster with Pyrolytic Graphite Ion Optics", 42nd
AIAA/ASME/SAE/ASEE Joint Propulsion Conference and Exhibit, AIAA-2006-4668, Sacramento, CA, July 9-12, 2006. 45Thomas, R. E., Personal Communication. 2016: Glenn Research Center. 46Garner, C. E. and Rayman, M. D., "In-Flight Operation of the Dawn Ion Propulsion System Through Survey Science Orbit at
Ceres", 51st AIAA/SAE/ASEE Joint Propulsion Conference, AIAA-2015-3717, Orlando, FL, July 27 - 29, 2015. 47Mikellides, I. G., Snyder, J. S., Goebel, D. M., Katz, I., and Herman, D. A., "Neutralizer Hollow Cathode Simulations and
Comparisons with Ground Test Data", 31st International Electric Propulsion Conference, IEPC-2009-20, Ann Arbor, MI,
September 20-24, 2009.