Post evaluation of a decade of experience with Jakarta’s...
15
Australasian Transport Research Forum 2015 Proceedings 30 September - 2 October 2015, Sydney, Australia Publication website: http://www.atrf.info/papers/index.aspx 1 Post evaluation of a decade of experience with Jakarta’s Transjakarta Bus Rapid Transit System Philip Sayeg 1 Email address: [email protected] Abstract Modern rapid transit is needed as part of the public transport systems in the fast growing cities of Asia. Given the extent of the need, Bus Rapid Transit (BRT), is put forward as an economical form of rapid transit suitable in many cities. This paper highlights the actual experience of Jakarta’s 200 km BRT system, the world’s largest, after a decade of operation. When introduced in 2004 the first line of Jakarta’s now 12 corridor BRT system represented a breakthrough in how public transport services were to be regulated and operated in Jakarta, Indonesia’s capital. The aim was to create an integrated system of 14 BRT corridors and services, and improve the travel experience of a million passengers per day by separating buses from Jakarta’s notorious traffic jams and providing services through a gross cost contracting arrangement. Did Transjakarta live up to its potential? A detailed post evaluation was conducted in 2014 by a team led by the author for the United Nation’s Environment Programme (UNEP) of their six year support to Transjakarta from 2006 to 2012, using a grant provided by the Global Environment Facility (GEF). The paper describes selected aspects of the post evaluation, which reflect the climate-focus of the GEF: (i) patronage, passenger benefits, impact on modal shares and passenger attitudes; and (ii) associated Greenhouse gas emissions and methodological issues. Key words: evaluation, Bus Rapid Transit, Greenhouse Gas emissions 1 Director, Policy Appraisal Services Pty. Ltd, P.O. Box 139, Paddington, Brisbane, 4064. He was the Team Leader of the evaluation described in the paper and wrote the evaluation report. The work of Professor Harun al-Rasyid Lubis in contributing to the design of the surveys described in the paper, and arranging their implementation, facilitation of interviews, and the analysis of media sources though not reported here, is acknowledged. Professor al-Rasyid Lubis is affiliated with the Transportation Research Group, Faculty of Civil and Environmental Engineering, Institut Teknologi Bandung, Bandung, 40132, Indonesia.
Transcript of Post evaluation of a decade of experience with Jakarta’s...

Australasian Transport Research Forum 2015 Proceedings 30 September - 2 October 2015, Sydney, Australia
Publication website: http://www.atrf.info/papers/index.aspx
1
Post evaluation of a decade of experience with Jakarta’s Transjakarta Bus Rapid Transit System
Philip Sayeg1
Email address: [email protected]
Abstract
Modern rapid transit is needed as part of the public transport systems in the fast growing cities of Asia. Given the extent of the need, Bus Rapid Transit (BRT), is put forward as an economical form of rapid transit suitable in many cities. This paper highlights the actual experience of Jakarta’s 200 km BRT system, the world’s largest, after a decade of operation.
When introduced in 2004 the first line of Jakarta’s now 12 corridor BRT system represented a breakthrough in how public transport services were to be regulated and operated in Jakarta, Indonesia’s capital. The aim was to create an integrated system of 14 BRT corridors and services, and improve the travel experience of a million passengers per day by separating buses from Jakarta’s notorious traffic jams and providing services through a gross cost contracting arrangement.
Did Transjakarta live up to its potential? A detailed post evaluation was conducted in 2014 by a team led by the author for the United Nation’s Environment Programme (UNEP) of their six year support to Transjakarta from 2006 to 2012, using a grant provided by the Global Environment Facility (GEF). The paper describes selected aspects of the post evaluation, which reflect the climate-focus of the GEF: (i) patronage, passenger benefits, impact on modal shares and passenger attitudes; and (ii) associated Greenhouse gas emissions and methodological issues.
Key words: evaluation, Bus Rapid Transit, Greenhouse Gas emissions
1 Director, Policy Appraisal Services Pty. Ltd, P.O. Box 139, Paddington, Brisbane, 4064. He was the Team Leader of the evaluation described in the paper and wrote the evaluation report. The work of Professor Harun al-Rasyid Lubis in contributing to the design of the surveys described in the paper, and arranging their implementation, facilitation of interviews, and the analysis of media sources though not reported here, is acknowledged. Professor al-Rasyid Lubis is affiliated with the Transportation Research Group, Faculty of Civil and Environmental Engineering, Institut Teknologi Bandung, Bandung, 40132, Indonesia.
2
1. Introduction
In the early 2000s, Jakarta’s already extensive traffic congestion was deteriorating. Motorisation was rapidly increasing2 and the productivity of bus services, the main means of travel for the poor, was deteriorating. At the time, Jakarta’s 34 million daily motorised person-trips (Steer, Davies and Gleave, p. 36) generated about half the city’s particulate matter pollution with ambient concentrations consistently above the World Health Organisation’s guideline limits (World Bank, 1998, page 15). Greenhouse gas emissions (GHG) from land transport grew by 24% from 2000 to 20083.
Jakarta’s 12 corridor, 200 km long Bus Rapid Transit (BRT) system4 was initiated by the Governor of Jakarta in 2003, to improve travel for Jakarta’s then 8.3 million citizens that represented 40% of the metropolitan population5. BRT corridor 1, the first in South East Asia, was completed from commercial hub Blok M in the south of the central city to Kota, the old city, in the north in January, 2004. Corridors 2 and 3 were opened in January 2006. Rapid implementation meant that significant institutional, physical and operational matters had not been properly resolved in advance. The BRT system known as Transjakarta is operated by an agency of the Government of Jakarta with the same name although infrastructure and buses are procured by its Transportation Department. Other relevant business services are provided by internal agencies (footpaths) and external agencies (police for enforcement).
The United Nations Environment Programme (UNEP), with funding provided by the Global Environment Facility (GEF), implemented the “Bus Rapid Transit and Pedestrian Improvements in Jakarta” project from December 2006 to December 2012. The project aimed to increase the effectiveness of BRT, expand modal shift impacts and reduce GHG emissions through technical assistance provided by their project consultants. By the close of the UNEP-GEF project, 11 BRT corridors with a total length of 180 km had been implemented at an investment cost of USD 640 million (in historical prices). The 12th corridor of 24 km opened in January 2013 one month after completion of the project. Two additional corridors are planned. Table 1 sets out a chronology of BRT corridor development and patronage growth.
The UNEP-GEF project’s Global Environmental Objective (GEO) was “…to reduce greenhouse gas (GHG) emissions from urban transportation” Jakarta-wide in the long term. The project design targeted an end of project incremental reduction of 263,000 tonnes of GHG per annum and an increase of 600,000 passengers per day compared to the initial three BRT corridors. The project was organised into two main project goals: (i) improve BRT performance; and (ii) utilise BRT to build the image of BRT, and improve pedestrian, travel demand management (TDM), non motorised transport (NMT) and land use. Nine outputs were specified with associated outcomes at the start of the project, as shown in Table 2. During project implementation, two additional outputs (numbered 2.b and 3.b) were added.
2 Private car and motorcycle ownership grew by an annual compound growth rate of 19.6% per annum and 8.6% per annum from 2000 to 2008 respectively (SDG 2011, p. 35). 3 Source: http://www.internationaltransportforum.org/jtrc/environment/CO2/Indonesia.pdf (accessed 18 May 2015) using International Energy Agency data. 4 At-grade, with one lane in each direction, mainly located in the centre of existing roads. Quality of the BRT corridors was assessed by the Institute of Transportation and Development Policy. Three were rated as Bronze and the rest as Basic according to a scale where Gold is highest, Silver is 2nd highest, and Bronze, is the 3rd highest. A rating of Basic means the BRT corridor did not rate at Bronze or higher and the system quality is fairly poor. Refer [https://www.itdp.org/library/standards-and-guides/the-bus-rapid-transit-standard/] accessed 6 August 2015. 5 Currently, the Jakarta metropolitan area, called JABODETABEK after the names of its constituent provinces (Jakarta, Bogor, Depok, Tangerang, and Bekasi) is one of the world’s largest mega-cities with an estimated 28 million inhabitants. The Province of Jakarta is also known as also known as the City of Jakarta.

Post evaluation of a decade of experience with Jakarta’s Transjakarta Bus Rapid Transit System
3
Due to its mandate, UNEP’s Evaluation Office undertakes an independent post-evaluation (described as a terminal evaluation) of every UNEP project to assess performance in terms of relevance, effectiveness and efficiency, and determine outcomes and impacts (actual and potential) stemming from the project, including their sustainability. This paper describes some of the key findings of the UNEP-GEF post evaluation and is based on the Terminal Evaluation Report prepared by Sayeg et al. (2014).
2. The evaluation framework
The UNEP evaluation system is similar to that used by the Multi-Lateral Development Banks (MDBs) such as the World Bank and Asian Development Bank, as well as Australia’s Aid programme administered by the Department of Foreign Affairs and Trade. The approach of these international agencies to post evaluation when applied consistently offers a practical means of strengthening Benefits Realisation frameworks that are of interest to Australia’s government agencies (Department of Finance and Regulation, 2012).
Table 1: Chronology of BRT corridor implementation Year No. Corridor Length (km) Date opened Average annual
weekday patronage (Jan-
Dec)
2004 1 Kota – Blok M 13.6 Jan. 2004 52,400
2005 Nil new 0 68,400
2006 2 Harmoni –Pulogudang 13.3 Jan. 2006 104,600 3 Ps Baru – Kalideres 15.4 Jan. 2006
2007 4 Pulogadung – Dukuh Atas 11.9 Jan. 2007 202,000
5 Ancol – Kp. Melayu 11.9 Jan. 2007
6 Dukuh Atas – Ragunan 14.0 Jan. 2007
7 Kp. Melayu – Kp. Rambutan 13.4 Jan. 2007
2008 Nil new 0 245,000
2009 8 Harmoni – Lebak Bulus 26.0 Feb. 2009 271,000
2010 9 Pluit – Pinang Ranti 28.8 Dec. 2010 286,000
10 PGC Cililitan – Tanjung Priok
19.4 Dec. 2010
2011 11 Kp. Me¬layu – Pulo Gebang 11.4 Dec. 2011 378,000
2012 Nil new 0 366,000
2013 12 Pluit – Tanjung Priok 23.8 Feb. 2013 370,000
2014 Nil new 368,000
Total 202.9
Source: Sayeg et al. (2014), Table A1.1, pp. 42-43, plus Transjakarta for 2013 and 2014 patronage
UNEP’s evaluation system differs slightly from others in three respects6. First, independent evaluations are carried out for all projects by its Evaluation Office whereas most agencies only do independent evaluations of a sample of projects. However, the ‘project owners’ in each agency do their own evaluations and completion reports for all projects. Second, the UNEP evaluation guidelines require a reconstruction of a project’s intervention logic with a re-
6 The UNEP/GEF terminology was somewhat unusual. For example, the two project goals were set at a lower level than the GEO. A goal would normally be set at a higher level than an objective.

4
examination of the linking of end of project outcomes, through use of the Theory of Change7 to the desired long term goal, referred to as the GEO. Third, in contrast to the MDBs, UNEP’s project appraisal and evaluation procedures do not require economic evaluation to be carried out or associated travel time changes to be quantified.
Six main criteria were evaluated in detail using a six point scale8: (i) strategic relevance; (ii) achievement of outputs; (iii) effectiveness – attainment of project objectives and outcomes; (iv) sustainability and replication; (v) efficiency; and (vi) factors affecting project performance. There were 18 sub-criteria. An overall evaluation rating was required.
Table 2: Goals, Outputs and Expected Outcomes Goals Outputs Expected Outcomes
Go
al A
: Im
pro
ve
Perf
orm
ance
of
the
Ja
ka
rta
BR
T
1. Develop BRT corridors 4-14 BRT implemented on corridors 4-14 with routes optimized
2a. Optimize fare system for corridors 1-14
Integrated fare system with controls stops fare leakage. Competitive contracting implemented for BRT bus operation, reducing costs
2b. Improve Transjakarta Transjakarta is established as a fully functioning capable company
3a. Improve intersection performance for BRT
Intersection conflicts reduced to acceptable levels. BRT average speed increases to 25km/hr; improved political support for BRT by reducing impacts on mixed traffic
3b. Provide adequate supply and quality of CNG for BRT
Supply, pricing and refuelling time adequate
4. Optimize busway operation Increased average speed of BRT, 5% reduction of fleet downtime, reduced operating costs; 8% reduction in fuel consumption
Go
al B
: U
tiliz
e B
RT
to
build
im
ag
e o
f p
ublic
tra
nsp
ort
an
d im
pro
ve p
ede
str
ian
, T
DM
, N
MT
,
an
d la
nd
use o
ptio
ns
5. Improve public information on BRT & public transport
Public understanding of BRT and optimal use of public road space increased. Web and SMS based routing information system available to potential passengers.
6. Rationalize non-BRT bus routes
Increase of passenger from bus feeder system from 5% to13% of BRT passengers; of which 32 % are new passengers and 32 % shifted from private motor vehicle feeder, reducing P private motor vehicle feeder trips and increasing total BRT passengers
7. Evaluate and implement Transport Demand Management measures to reduce private motor vehicle use
TDM measure implemented so that cost of private motor vehicle use is greater than BRT fare
8. Improve pedestrian and NMT facilities in centre and along corridors
Convenient NMT and pedestrian facilities; increased feeder trips by bicycle
9. Dissemination and outreach to other cities
Full BRT implemented in 1 of target cities; BRT draws some passengers from private motor vehicles. Or increased number of students walking and biking to school / increased use of bicycle for short trips
Source: UNEP/ GEF (2006, Annexes, pages 4-8), plus later modifications
Overall, the post evaluation rated the achievement of direct outcomes as ‘Moderately Satisfactory’ with the details by individual outcome shown in Table A.1 of Appendix A. For example, 12 of the 14 planned BRT corridors were implemented although they were of poor quality. A ticketing system was implemented after the UNEP-GEF project closed but with slow transaction times, and other constraints, is unsuitable for the BRT system. A key concern was the achievement of the GEO by “reducing GHG from urban transportation”. Achievement of the GEO and goals were rated ‘Moderately Satisfactory.’
Three matters were identified in the evaluation as central to realising a substantial achievement of the GEO: (i) continuous improvement of public transport to provide high quality service to captive bus users thus providing an attractive alternative to private vehicle users; (ii)
7 As described by Funnell and Rogers (2011). 8 The six point rating scale is shown in Appendix A. It ranges from Highly Unsatisfactory to Highly Satisfactory.

Post evaluation of a decade of experience with Jakarta’s Transjakarta Bus Rapid Transit System
5
conversion of Transjakarta to a competent company with full control over the delivery of its services and direct influence on the infrastructure and business services it needed from other agencies, to realise the former; and (iii) creation of a virtuous circle of increasing patronage supported by political, legal and financial reforms.
Patronage performance and achievement of targeted GHG reductions are described in subsequent sections. The patronage and GHG targets that were set during the project design are compared to those for the original three corridors (the situation that existed at the time of project design). However, details of the project’s estimates of GHG emissions and relevant methodological aspects, described in Section 4, are compared to a dynamic Business as Usual (BAU) scenario, the situation without the UNEP-GEF project assistance.
3. Patronage impacts
3.1 Patronage trends
Trends in daily patronage from 2004 to 2014 are shown in Figure 1, along with cumulative BRT length and an index measuring real fares (that have remained at Rupiah 3,5009 in nominal terms to date). At project close in 2012, the BRT system was 180 km in length with patronage of 370,000 pax/day (2,060 pax/km) compared to 105,000 pax/day (or 2,500 pax/km) in 2006. Patronage during the project had increased by 240% although productivity measured in terms of pax/km declined by 18%10. Compared to Bogota’s TransMilenio BRT, the model for Transjakarta, its productivity was less than a quarter.11
Figure 1: Trends in patronage, BRT length and real fares 2003-2014
Source: Author
The actual increase in patronage from 2006 to 2012 was less than half of the planned increase of 600,000 pax/day. By 2012, growth in patronage had begun to stagnate declining first by 3% in 2012, and then stabilising over 2013 to 2014, due to poor performance despite a halving of the real value of fares from 2004 to 2013 and the addition of a new corridor in 2013.
9 Equivalent to about USD 0.25 in 2003 (USD 0.35 in December 2012). Real fares were estimated by applying the relevant Consumer Price Index to deflate nominal prices. 10 In 2011, patronage on corridor 1 represented more than 80,000 pax/day or 30% of daily ticket sales but other corridors had much lower patronage in the range 17,000 to 36,000 pax/day (SDG 2011, page 50). 11 At July 2013, Bogota’s TransMilenio BRT was 105km long and carried over 1.6 million pax/day (including on feeders) likely representing at least 1 million passengers per day on the BRT itself or 9,500 pax/km or almost 400% higher than Transjakarta at the close of the project. Refer [http://www.worldbrt.net/en/cities/bogota.aspx] accessed 26 May 2015.
13.6 13.642.3
92.6 92.6118.6
166.8 178.2 178.2202.0 202.0
5268
105
202
245271
286
378 366 370 368
100 94 8075 71 64 62 58 56 54 50 46
0
50
100
150
200
250
300
350
400
2003 2004 2005 2006 2007 2008 2009 2010 2011 2012 2013 2014
Length (km) Daily patronage ('000) Real Fare Index (end year)

6
3.2 Sources of BRT patronage
The UNEP-GEF post evaluation team’s surveys found that without BRT the stated alternative use of modes would have been: (i) 71.9% ordinary bus; (ii) 2.7% car driver; (iii) 2.6% car passenger; (iv) 11.7% taxi/ojek/bajaj12; (v) 6.8% motorcycle driver; (vi) 1.9% motorcycle passenger; (vii) 0.3% walk; (viii) 0.3% bicycle; and (ix) 1.8% of trips would not have been made, as shown in Figure 2. On this basis 14% of the 370,000 daily BRT passengers, half of whom were female, were former car or motorcycle occupants indicating that approximately 52,000 additional public transport trips were made per day at the end of the project in 2012 compared to the BAU. If trips made by taxi, ojek and bajaj, are treated as private modes, the increase in public transport trips per day would have been higher at 95,000 trips per day.
The 2012 calculations of GHG reduction by the project consultants presented in their annual progress report of December 2012 (described below), assumed that 35% of BRT riders switched from car or motorcycle. These figures were taken from annual surveys of Jakarta’s Transport Department that reported increasing switch from private modes from year to year. For example, in 2008, the surveys showed that 25.4% of BRT users would have switched from car or motorcycles much lower than reported in 2012. These results appear improbable in view of the recent stagnation in patronage and current poor passenger attitudes described below. It was concluded that there is some doubt about the quality of the annual surveys. As shown above, the UNEP-GEF post evaluation team’s surveys found in contrast that 14% of BRT passengers would be drawn from car or motorcycle, with most of the balance drawn from ordinary conventional bus services as shown in Figure 2. The quantify of modal shift surveyed by the post evaluation team’s surveys is more in keeping with experience of similar BRT’s in the developing world.13
Figure 2: Stated alternative modes w/o BRT
Source: Sayeg et al. (2014), p. 84
3.3 Passenger attitudes
Passenger attitudes assessed at the close of the project by Transjakarta found that passengers rated the following attributes of BRT as generally poor with details as follows: drivers (poor); officers (very poor); infrastructure (very poor); buses (very poor); operations
12 Ojek is a motorcycle taxi and bajaj, a motorised 3 wheeler providing taxi-like services. SDG (2011, p. 38), in their modelling report, appear to define bajaj as ‘public transport’ however it is not clear how ojek and motorcycle taxi were defined. 13 For example, 7% from cars for Metrobus, Mexico City (Schipper et al. 2009, p. 66); 1.4% from cars for TransMilenio, Bogota, Columbia in 2006 (Grütter 2007, pp. 18 and 23); and 1.4% from private vehicles and 3% from taxis in Guangzhou, China (ITDP 2011, p. 22).
71.9%
2.7% 2.6%
11.7%6.8%
1.9% 0.3% 0.3% 1.8%
0.0%
10.0%
20.0%
30.0%
40.0%
50.0%
60.0%
70.0%
80.0%

Post evaluation of a decade of experience with Jakarta’s Transjakarta Bus Rapid Transit System
7
(good)14; and ticketing (poor). The UNEP-GEF post evaluation team’s surveys undertaken in January 2014 found that a key attribute that BRT passengers as a whole preferred about the service was its low fare but 48% considered waiting times to be ‘very long’ or ‘long’ indicating problems with BRT service regularity and reliability. Twenty nine percent of BRT users rated the service as ‘fast’, 57% rated the service as of ‘moderate’ speed, and 14% rated it ‘slow’. Overall, 43% of users said they were ‘satisfied’ with the service, 39% said it was ‘adequate’ and 17% said they were ‘dissatisfied’ (Sayeg et al. 2014, pp. 85-89). The generally poor attitudes of BRT passengers to the services they receive underlines the significant challenges facing Transjakarta in its future efforts to improve performance, increase patronage and achieve the GEO.
3.4 Motivations for choice passengers to use BRT
Those who stated they would have used car or motorcycle in the absence of BRT are typically known as ‘choice’ passengers. Both car and motorcycle groups gave similar responses for why they used BRT with the top two responses being ‘faster’ and ‘more economical.’ (Sayeg et al., 2014, p. 85). Refer Figure 3.
Figure 3: Stated reasons for using BRT – car owners
Source: Sayeg et al. (2014), p. 85
3.5 Travel time savings
The design of the project by UNEP-GEF put emphasis on improving services through reducing intersection delays, addressing constraints and design of direct services, though not in a systematic way. However, due to UNEP’s focus on the environmental impacts, time savings to BRT passengers were not required to be estimated. Passenger journey time reductions are a key driver of welfare improvement through improved access to jobs and community services. Schipper et al. (2009, p. 27) showed that even when putting a high value on GHG savings the travel time reductions of users would usually be the main monetized benefit in an economic evaluation of a BRT project.
The project’s aim of reducing GHG emissions would in fact rely on the project effecting significant changes in traveller behaviour due to the travel time advantages provided by BRT. No reliable sources of savings in travel time of the BRT were identified. A simplified economic evaluation conducted independently of the project assumed average travel time savings were 20 minutes per passenger (Sutomo et al. 2012, p. 199). The post evaluation team made a crude estimate of the average travel time reduction for a former bus passenger that can use a BRT service between the same origin and destination. The estimate was made for the average end of project BRT passenger trip length of 13.2 km. Average on road bus speeds were
14 This is a surprising rating but may reflect the ability to travel to desired destinations despite irregular service.

8
observed as 16 kph in November 2010 by the feeder bus study (Steer Davies and Gleave, 2011, p. 77). End of project BRT speeds were observed at 20 kph. On this basis the average time savings per passenger trip would be about 10 minutes15.
3.6 Effect on city-wide modal split
In 2002, of the 34 million daily person trips in metropolitan Jakarta, 20.4 million or 60% were made by public transport that included bus, mini-buses, regional rail and other road-based public transport provided by smaller vehicles. By 2010, in the BAU, of the forecast 46.5 million daily person trips, 25.5 million or 55% were forecast to be made by public transport (Steer Davies and Gleave 2011, p. 36). Hence, the project’s maximum contribution of 95,000 person trips described in Section 3.2 would have represented an increase of about 0.4% in daily trips made by public transport in the period 2010-2012.
4.0 GHG impacts
4.1 Reported GHG emission reductions
Excluding construction-related emissions, the project’s estimated GHG direct emissions reduction was 54,000 tonnes or 0.15 tonnes (reduced annually) per daily BRT passenger in 2012. This figure is lower though consistent with experience of the TransMilenio and Mexico City Metrobus BRTs that estimated that direct GHG emission reductions would be 0.28 tonnes in 2006 and 0.2 tonnes in 2009 per daily BRT rider respectively (Grütter 2007, p. 23; Schipper et al. 2009, p. 62). Hence, prima facie, the GHG emission estimates appeared conservative compared to other relevant experience. Using their methodology described below, the project consultants assisting Transjakarta estimated that the composition of the 54,000 tonnes of GHG reduced in 2012 was as shown in Table 3.
Table 3: Estimated GHG emissions 2012 Impact Est. GHG tonnes % due to modal switch
Increase due to BRT motive emissions 71,000 NA
Direct reduction due to Modal Switch
From car 24,000 19.2%
From motorcycle 33,000 26.4%
From taxi 40,000 32.0%
From ordinary bus 28,000 22.4%
Sub-total reduction due to modal switch 125,000 100.0%
Net reduction by Transjakarta 54,000 tonnes NA
Source: Project Consultant’s Spreadsheet 2012
The principal question asked by the post evaluation team’s survey of BRT users to quantify modal shift is the same as in the methodologies approved by the United Nations Framework Convention on Climate Change (UNFCCC), under the Clean Development Mechanism (CDM) for the TransMilenio BRT and Metrobus BRTs. The question asks “assuming that the rapid transit line you are currently using would not exist, how would you have made the same trip you are doing now?”(UNFCCC et al. 2006, p. 45 for TransMilenio; UNFCCC et al. (2009), p. 56, for Metrobus).
The use of this form of question was a practical choice since the majority of BRT corridors had been in operation for seven years or longer at the time of the post evaluation team’s survey. However, this form of question risks over-estimation of emission savings through some exaggeration of the quantity of car and higher emission public transport travel in the BAU. For example, a BRT passenger surveyed some three years after the BRT opens may have used an ordinary bus service in the BAU but the bus service was discontinued after the BRT opened so the passenger switched to using a motorcycle. Subsequently, a bus service feeding to BRT
15 [13.28 x (1/20-1/16) x 60] = 9.9 minutes.

Post evaluation of a decade of experience with Jakarta’s Transjakarta Bus Rapid Transit System
9
is introduced that the passenger uses to access the BRT. The current question asked during a brief passenger survey is unlikely to identify that the passenger would use a bus in the BAU.
Compared to the end of project targets of an incremental, 600,000 passengers per day and reduction of 263,000 tonnes of GHG per annum, the actual project achievement was an increase in demand of 265,000 pax/day and reduction of GHGs of 40,000 tonnes/annum respectively, well short of the targeted values. These estimated quantities are based on using the project’s method of estimating GHG reductions, and their assumptions on mode switch, that are likely to have been optimistic.
4.2 Critique of the methodology for estimating GHG Emissions
Apart from assumptions on modal switch, several other factors also impact on the quality of the GHG estimates as described below.
4.2.1 Relevant methodologies
The GEF and other international climate funds have wrestled with finding a balance between detailed complex methodologies that are time consuming to apply and other simpler methods that can be applied rapidly but provide consistent results across a range of projects. The most complex methodologies designed to be used for post implementation monitoring are the TransMilenio and Metrobus methods under the CDM. They are comprehensive as they attempt to account for: (i) construction and maintenance emissions; (ii) upstream fuel emissions (i.e. ‘well to tank’); (iii) changes in load factors of cars, buses and taxis, including impacts due to use of motorised modes to access the BRT, (iv) reduction in car, motorcycle, taxi and bus due to modal switch; (v) freer travel and reduced emissions for remaining road traffic; (vi) induced travel through increased trip frequency, changes in time of travel or new trips; and (vii) effect of ‘rebound’ due to reduced congestion. These effects are listed in Table 4.
GEF endorsed a series of simpler methodologies in 2010 in its manual for GHG estimation from transportation projects to be mainly used for ex-ante assessment (The Scientific and Technical Advisory Panel, 2010). The GEF Manual proposes calculation of direct emission reductions from modal shift in the same way as the CDM methods, but is less data-intensive since it does not consider the effect of changes in GHG emissions due to rebound16 and other leakage effects summarised in Table 4.
While the GEF Manual considers the effect of smoother traffic flow for road traffic remaining after switch to BRT, and says the effect could be substantial for reducing GHG emissions, it also recognises the difficultly in quantification. The Manual does not mention the important offsetting impact due to rebound made in response to the improved road conditions due to less congestion. Both CDM methodologies allow for calculation of this source of rebound, although the assumption that rebound only occurs in response to reduced congestion following switch to BRT, appears simplistic as does the use of the assumed elasticity of -0.1 applied to improved travel times to calculate rebound. As described below, vehicle availability at the household level is likely to be an influential factor on the potential for rebound, but is not considered at all by the CDM and GEF methodologies. The GEF Manual, (p. 23), recognises that in the long term there may be other positive induced effects such as enhanced development densities and form that are also not usually accounted for.
16 Rebound was defined by the TransMilenio methodology as induced demand in an economic sense where “...if prices decline, consumption usually increases...” it also may include any sort of trip making that was formerly suppressed in the BAU but is able to be ‘released’ since traffic congestion is reduced due to the BRT.

10
4.2.2 Overall assessment of the project’s GHG emission reduction estimates
The method adopted by the project consultants adopted the core approach of the CDM and GEF methodologies, which is the calculation of direct emission reductions from modal switch from cars, motorcycles, taxis and similar non-fixed route vehicles, and buses. GHG emissions due to BRT construction were not estimated but they are typically assumed to be “…not that significant17” (Scientific and Technical Advisory Panel of GEF 2010, p. 10). An assessment of the impact of several key assumptions used in the project consultant’s analysis of the estimated GHG emissions for the BRT is set out in Table 4 with reference to the full range of effects that could be considered based on those addressed by the two CDM methodologies. The overall assessment is that the estimated GHG emissions reductions made using the project consultants’ assumptions and methodology were moderately overstated.
Table 4: Comments on robustness of estimates of GHG emission reductions Effect considered in TransMilenio and Metrobus methodologies, but not in the evaluation by the project consultants
Likely impact on the project’s GHG emission reduction estimates
Construction & maintenance emissions not calculated
-ve if included. Could represent up to two years of direct emission reductions for BRT.
Upstream fuel emissions (i.e. ‘well to tank’) not accounted for
+ve, since net fuel saving is the cause of direct GHG reductions.
Load factors of cars, buses and taxis do not change +ve if included. Up to 10% positive impact if buses are better utilised although this is unlikely here. The opposite effect of bus and taxi drivers increasing VKT to compensate for lost revenue is likely minor.
Access modes not accounted for -ve since project’s estimates did not directly account for how a mode switcher arrives at BRT stations. 20% of BRT users accessed and egressed stations by non BRT bus and 5% by other motorised modes.
Reduction in car and motorcycle travel is assumed to occur in proportion to observed vehicle occupancies
-ve, for their assumptions on modal shift (that appear overly optimistic), the project consultants assumed that private vehicle passengers and drivers are equally likely to switch which is not borne out by studies of driver and passenger behaviour. Refer text. Overall impact, without taking into account a more realistic assessment of modal shift, is up to a 30% overestimate.
Induced travel not assumed to occur due to BRT Neutral, since very little new travel was induced.
Freer travel and reduced emissions for continuing road traffic
+ve, as much as for modal switch as estimated for Mexico City Metrobus (Schipper et al. 2010, p. 61)
Effect of rebound due to ‘vehicle left at home’ or due to reduced congestion
-ve, since where congestion is severe rebound/ induced trips would be expected (changes in trip frequency and time of travel). Where household vehicle ownership is low, additional rebound may be incurred. Refer text.
Mode shift from buses results in reduced bus fleet – buses are assumed to be redeployed and to offset BAU bus needs
Neutral – effect accounted for.
Land use impacts +ve, in the long term land use intensification may occur and if so would be expected to reduce emissions compared to the BAU.
Overall assessment compared to current estimate of GHG reduction
Moderately overstated – actual likely to be lower
Source: Author
17 Possibly representing 1-2 years of direct emission reductions.
Post evaluation of a decade of experience with Jakarta’s Transjakarta Bus Rapid Transit System
11
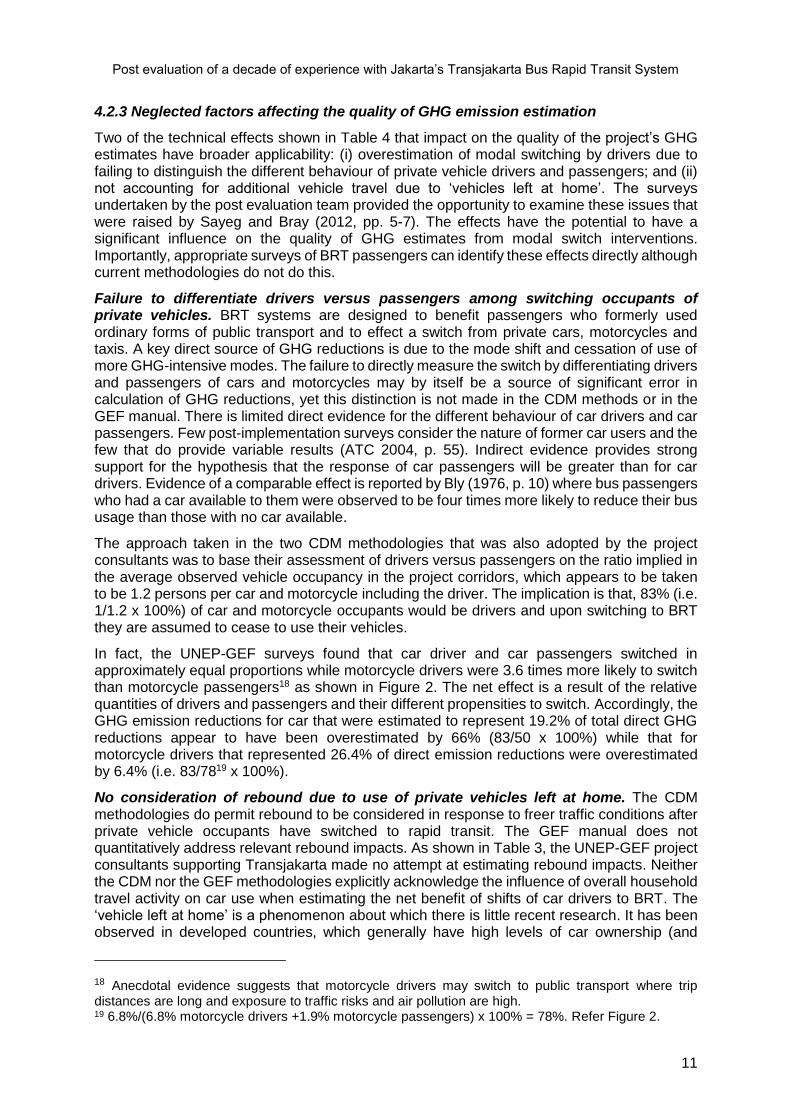
4.2.3 Neglected factors affecting the quality of GHG emission estimation
Two of the technical effects shown in Table 4 that impact on the quality of the project’s GHG estimates have broader applicability: (i) overestimation of modal switching by drivers due to failing to distinguish the different behaviour of private vehicle drivers and passengers; and (ii) not accounting for additional vehicle travel due to ‘vehicles left at home’. The surveys undertaken by the post evaluation team provided the opportunity to examine these issues that were raised by Sayeg and Bray (2012, pp. 5-7). The effects have the potential to have a significant influence on the quality of GHG estimates from modal switch interventions. Importantly, appropriate surveys of BRT passengers can identify these effects directly although current methodologies do not do this.
Failure to differentiate drivers versus passengers among switching occupants of private vehicles. BRT systems are designed to benefit passengers who formerly used ordinary forms of public transport and to effect a switch from private cars, motorcycles and taxis. A key direct source of GHG reductions is due to the mode shift and cessation of use of more GHG-intensive modes. The failure to directly measure the switch by differentiating drivers and passengers of cars and motorcycles may by itself be a source of significant error in calculation of GHG reductions, yet this distinction is not made in the CDM methods or in the GEF manual. There is limited direct evidence for the different behaviour of car drivers and car passengers. Few post-implementation surveys consider the nature of former car users and the few that do provide variable results (ATC 2004, p. 55). Indirect evidence provides strong support for the hypothesis that the response of car passengers will be greater than for car drivers. Evidence of a comparable effect is reported by Bly (1976, p. 10) where bus passengers who had a car available to them were observed to be four times more likely to reduce their bus usage than those with no car available.
The approach taken in the two CDM methodologies that was also adopted by the project consultants was to base their assessment of drivers versus passengers on the ratio implied in the average observed vehicle occupancy in the project corridors, which appears to be taken to be 1.2 persons per car and motorcycle including the driver. The implication is that, 83% (i.e. 1/1.2 x 100%) of car and motorcycle occupants would be drivers and upon switching to BRT they are assumed to cease to use their vehicles.
In fact, the UNEP-GEF surveys found that car driver and car passengers switched in approximately equal proportions while motorcycle drivers were 3.6 times more likely to switch than motorcycle passengers18 as shown in Figure 2. The net effect is a result of the relative quantities of drivers and passengers and their different propensities to switch. Accordingly, the GHG emission reductions for car that were estimated to represent 19.2% of total direct GHG reductions appear to have been overestimated by 66% (83/50 x 100%) while that for motorcycle drivers that represented 26.4% of direct emission reductions were overestimated by 6.4% (i.e. 83/7819 x 100%).
No consideration of rebound due to use of private vehicles left at home. The CDM methodologies do permit rebound to be considered in response to freer traffic conditions after private vehicle occupants have switched to rapid transit. The GEF manual does not quantitatively address relevant rebound impacts. As shown in Table 3, the UNEP-GEF project consultants supporting Transjakarta made no attempt at estimating rebound impacts. Neither the CDM nor the GEF methodologies explicitly acknowledge the influence of overall household travel activity on car use when estimating the net benefit of shifts of car drivers to BRT. The ‘vehicle left at home’ is a phenomenon about which there is little recent research. It has been observed in developed countries, which generally have high levels of car ownership (and
18 Anecdotal evidence suggests that motorcycle drivers may switch to public transport where trip distances are long and exposure to traffic risks and air pollution are high. 19 6.8%/(6.8% motorcycle drivers +1.9% motorcycle passengers) x 100% = 78%. Refer Figure 2.

12
hence for which the impact may be expected to be lower than for lower income countries). For example, a 1996 study in the Netherlands showed that that 20% of cars left at home were used by other household members. The study found that re-use is higher in larger households where the number of persons with drivers’ licences, and the number of workers exceeds the available vehicles (Hemmen et al. 2002, p. 402). In the field of telecommuting, the possibility of increased household car travel due to a car being left at home by the teleworker has been recognised. In at least one case where it has been measured there was no observed statistical increase in household car travel but this was attributable to telecommuting households having nearly one vehicle available per licensed driver (Mokhtarian et al 1995, p. 293).
The post evaluation team’s surveys found that, in the absence of the BRT, 52% of BRT users who said they would drive a car and 44% who said they would drive a motorcycle belonged to households20 that owned only one car or motorcycle respectively (Sayeg et al. 2014, page 85). Approximately 60% of those who said they would drive a car or motorcycle, irrespective of how many vehicles were owned by their families, stated the vehicles ‘left at home’ would be used by other family members. In developing and developed cities with low average car ownership this neglected source of rebound could substantially reduce the travel and environmental benefits that result from the transfer of car and motorcycle drivers to BRT. The matter becomes further complicated if the car left at home substitutes for a planned vehicle purchase.
5. Conclusions
The large shortfall in end of project targeted patronage and GHG emission savings, (shown to be a probable overestimate), plus the remaining challenges going forward, puts in doubt the achievement of the project’s GEO. Taking into account all factors, the post evaluation team’s overall rating of project performance was ‘Moderately Satisfactory’. Although the project design was focused on addressing problems with the initial BRT corridors, the Jakarta Transportation Agency continued to expand the number of corridors that were generally of poor quality.
The key lessons derived from the post evaluation were: (i) project design must be realistic and appropriate for the institutional environment and the technical capacity of prevailing agencies; (ii) creation of appropriate institutions is no guarantee that they will automatically perform as anticipated; and (iii) improved project performance, including substantial achievement of the GEO, would likely result from a greater focus on current and potential BRT passengers (or customers). Attention to better meeting travel needs of existing and potential bus users would have likely resulted in increased GHG reductions but more importantly resulted in improved welfare outcomes for Jakarta’s travellers through reduced travel times and improved trip time reliability (Sayeg et al. 2014, p. 40).
Given the array of problems currently facing Transjakarta, careful prioritisation of new investment in infrastructure, versus optimisation of existing corridors, possibly using economic evaluation taking into account life-cycle costs, travel time impacts by patronage market segment, safety impacts and GHGs and other externalities (e.g. air pollution), appears to also have value. Further research on existing BRT, or other rapid transit projects, focusing on collecting travel data on rapid transit users and their households shortly after a project opens, distinguishing drivers and passengers when considering shifts from private modes, and identifying their household vehicle availability, seems likely to improve the quality of estimation of GHG emissions.
20 A 2010 travel survey found that average household size was 4.35 persons in the Jakarta municipality (Nobel et al, 2013).

Post evaluation of a decade of experience with Jakarta’s Transjakarta Bus Rapid Transit System
13
Appendix A: Post Evaluation Ratings of direct project outcomes
Table A.1: Ratings for achievement of direct outcomes and justification Planned direct outcomes (as modified at Mid Term Review)
Outcome rating (*)
Justification/ summary of assessment
A.1 BRT implemented on corridors 4-14 with routes optimized
S 12 corridors implemented. Quality generally 'basic' using project consultant’s rating system.
A.2a Integrated fare system with controls stops fare leakage. Competitive contracting implemented for BRT bus operation, reducing costs
U Partial ticket system implemented but not according to project consultant’s recommendation. System is too slow for transit operation & likely not sustainable.
A.2.b Transjakarta is established as a fully functioning capable company
MS BUMD, a government owned company, was established in January 2014, much later than intended, and questions remain about its efficacy given incomplete use of potential of earlier organisation structures. Nevertheless, it is a very positive step.
A.3.a Intersection conflicts reduced to acceptable levels
U Little attempt at shortening signal cycle times to reduce delays has been attempted although the new Intelligent Transportation Systems centre may offer potential.
A.3.b. CNG supply, pricing and refuelling time adequate
S Access to CNG stations has greatly improved but losses in bus revenue-earning time of 2 hours/ day still exist.
A.4 Rationalize non-BRT bus routes
U Services are poorly managed by bus operators and Transjakarta does not show any obvious signs of trying to rectify the situation. The result is irregular crowded buses with long waiting times for passengers. Bus control centre has not been implemented as planned.
B.5 Information/awareness on BRT & other PT is enhanced
MU Static passenger information exists. BRT stations are visible. BRT routes are comprehensible to the public. But the quality of information is deteriorating with little attempt shown by Transjakarta to maintain a common signature.
B.6 Feeder services to BRT operated in all corridors
MU Bus services that existed before BRT were not completely withdrawn due to the project's efforts. New direct feeder services were introduced but not according to the project consultant’s recommendations.
B.7 Travel demand management is implemented
MS Parking legislation was prepared and partially implemented. National legal authority for road pricing was established but local enabling legislation has yet to be promulgated.
B.8 Pedestrian/NMT facilities improved in Jakarta/ other cities
MS A good attempt at improving pedestrian access to BRT stations in Jakarta was made with the project's assistance. But prevailing physical constraints limited the impact. Some attempts at improving pedestrian facilities in Pekanbaru and other cities was made.
B.9 Outreach & dissemination result in commitment to implement BRT/ NMT in 1 city
S Outreach to Pekanbaru was fairly successful with a second BRT corridor implemented with project support.
Note on ratings: HS = highly satisfactory; S = satisfactory; MS = moderately satisfactory; MU = moderately
unsatisfactory; U = unsatisfactory; and HU = highly unsatisfactory.
Source: Sayeg et al. (2014), Table 3, pp. 14-15.

14
References
Asian Development Bank (2010) Methodology for Transport Emissions Evaluation Model for
Projects. Reference Number: EKB: REG 2010-16 Evaluation Knowledge Brief.
Australian Transport Council (2006) National guidelines for Transport System Management
in Australia – Volume 4: (Urban Transport). Canberra, Commonwealth of Australia, 2006.
Bly PH (1976) The effect of fares on bus patronage. Transport and Road Research
Laboratory Report 733, UK, 1976.
Department of Finance and Regulation (2012) Assurance Review Process – lessons learned: benefits realisation management. July.
Funnell, SC & PJ Rogers (2011) Purposeful theory of change: effective use of theories of
change and logic models. John Wiley and Sons, San Francisco, USA.
Grütter J (2007) The CDM in the transport sector. Module 5d of Sustainable Transport: A
Sourcebook for Policy Makers. German Technical Agency, Eschborn.
Hemmen L, Perdok J (1996) The car that stays at home. European Transport Conference.
Institute for Transportation and Development Policy (2011) Guangzhou: China Bus Rapid
Transit – emissions impact analysis. May.
Mokhtarian P, Handy S, Salomon I (1995) Methodological issues in the estimation of the travel,
energy, and air quality impacts of telecommuting. Institute of Transportation Studies, University
of California, Davis.
Nobel D, Sadayuki Y, Kawaguchi H (2013) Recent transition in transportation environment in
Jakarta Metropolitan Area over years, Proceedings EASTS, Vol.9, 2013.
The Scientific and Technical Advisory Panel advising the Global Environment Facility (2010) Manual for calculating Greenhouse Gas benefits of Global Environmental Facility transportation projects. Sayeg P and Bray D (2012) Estimating changes in emissions from bus rapid transit: making
best use of transport sector experience. WIREs Energy Environment. doi: 10.1002/wene.27.
Sayeg P and al-Rasyid Lubis H (2014) Terminal Evaluation of the UNEP/ GEF Project “Bus
Rapid and Pedestrian Improvements Project in Jakarta.” Prepared for the UNEP Evaluation
Office, May. Downloadable from:
[http://www.unep.org/eou/Portals/52/Reports/2954_2014_TE_UNEP_REGIONAL_CC_FSP_
Jakarta_BRT_May_2014.pdf].
Schipper L, Deakin E, McAndrews C, Scholl L, Frick KT (2009) Considering climate change in Latin American and Caribbean urban transportation: concepts, applications and cases: Final Report. Prepared by Center for Global Metropolitan Studies, University of California: Berkeley, CA: Center for Global Metropolitan Studies, University of California. Steer Davies and Gleave (2011) Jakarta Feeder Bus Study: base year transport model report. February.

Post evaluation of a decade of experience with Jakarta’s Transjakarta Bus Rapid Transit System
15
Sutomo, H, Romero, J, and Zusman, (2012), The co-benefits of Jakarta’s Bus Rapid Transit. Published in the Institute of Global Environmental Studies’ publication Low Carbon Transport in Asia – Strategies for Optimizing Co-benefits. UNEP/ GEF (2006) Project Document and Annexes. UNFCCC/ CCNUCC (2006) Approved Baseline Methodology AM0031: Baseline methodology for Bus Rapid Transit Projects, Ver 01/ Sectoral Scope: 07.
UNFCCC/ CCNUCC (2009) Approved consolidated baseline and monitoring methodology ACM0016: Baseline Methodology for Mass Rapid Transit Projects, Ver 01/ Sectoral Scope: 07.
World Bank (1998) Urban air quality management strategy in Asia: Jakarta Report, Technical Paper 379.