A Minskian Analysis of Financial Crisis in Developing Countries

i The Growth Report: Strategies for Accelerating and Sustaining High Growth
Post-Crisis Growth in Developing Countries
A Special Report of the Commission on Growth and Development on the Implications
of the 2008 Financial Crisis
Pub
lic D
iscl
osur
e A
utho
rized
Pub
lic D
iscl
osur
e A
utho
rized
Pub
lic D
iscl
osur
e A
utho
rized
Pub
lic D
iscl
osur
e A
utho
rized


Post-Crisis Growthin Developing Countries
A Special Report of the Commission on Growth and Development on the
Implications of the 2008 Financial Crisis


Post-Crisis Growth in Developing Countries
A Special Report of the Commission on Growth and Development on the
Implications of the 2008 Financial Crisis
COMMISSION ON GROWTH AND DEVELOPMENT

Members of the Commission on Growth and Development
Montek Singh Ahluwalia, Deputy Chairman, Planning Commission, IndiaEdmar Bacha, Director, Casa Das Garças Institute for Economic Policy Studies, and Senior
Adviser, Banco Itaú BBA; former Senior Adviser to the Minister of Finance in the implementation of the “Plano Real,” and former President of the National Development Bank (BNDES), Brazil
Dr. Boediono, Vice President of Indonesia, former Governor of the Bank of Indonesia; former Coordinating Minister for Economic Affairs; Professor of Economics, Gajah Mada University, Indonesia
Lord John Browne, Managing Director, Riverstone Europe LLP; former CEO of British Petroleum p.l.c., United Kingdom
Kemal Dervis, Vice President and Director, Global Economy and Development, The Brookings Institution; former Head of the UNDP, United States
Alejandro Foxley, President, Center for Latin American Economic Research (CIEPLAN); former Minister of Foreign Affairs, Chile; Senior Associate at the Carnegie Endowment for International Peace, United States
Goh Chok Tong, Senior Minister in Cabinet and Chairman, Monetary Authority of Singapore; former Prime Minister, Singapore
Han Duck-soo, Ambassador of the Republic of Korea to the United States; former Prime Minister, former Deputy Prime Minister, and former Minister of Finance and Economy, the Republic of Korea
Danuta Hübner, Member of the European ParliamentCarin Jämtin, former Minister for International Development Cooperation, SwedenPedro-Pablo Kuczynski, former Prime Minister and former Minister of Economy and Finance,
PeruDanny Leipziger, Professor, Department of International Business, Graduate School of
Business, George Washington University; former Vice President and Head of Network, World Bank, United States; Commission Vice-Chair
Trevor Manuel, Minister in The Presidency, Planning; former Minister of Finance, South Africa
Mahmoud Mohieldin, Minister of Investment, Arab Republic of EgyptNgozi N. Okonjo-Iweala, Managing Director, the World Bank Group, United States; former
Minister of Finance and Foreign Affairs, NigeriaRobert Rubin, Co-Chairman, Council on Foreign Relations; former Secretary of the Treasury,
United StatesRobert Solow, Nobel Laureate in Economics; Institute Professor Emeritus, Massachusetts
Institute of Technology, United StatesMichael Spence, Nobel Laureate in Economics; Professor Emeritus, Stanford University,
United States; Commission Chair Sir K. Dwight Venner, Governor, Eastern Caribbean Central Bank, St. Kitts and NevisHiroshi Watanabe, President and CEO of the Japan Bank for International Cooperation
(JBIC)Ernesto Zedillo, former President of Mexico; Director, Yale Center for the Study of
Globalization, United StatesZhou Xiaochuan, Governor, People’s Bank of China

MONTEK SINGH AHLUWALIA
EDMAR BACHA
DR. BOEDIONO
LORD JOHN BROWNE
KEMAL DERVIS
ALEJANDRO FOXLEY
GOH CHOK TONG
HAN DUCK-SOO
DANUTA HÜBNER
CARIN JÄMTIN
PEDRO-PABLO KUCZYNSKI
DANNY LEIPZIGER
MAHMOUD MOHIELDIN
TREVOR MANUEL
NGOZI N. OKONJO-IWEALA
ROBERT RUBIN
ROBERT SOLOW
MICHAEL SPENCE
SIR K. DWIGHT VENNER
ERNESTO ZEDILLO
ZHOU XIAOCHUAN
HIROSHI WATANABE

© 2010 The International Bank for Reconstruction and Development / The World BankOn behalf of the Commission on Growth and Development1818 H Street NWWashington, DC 20433Telephone: 202-473-1000Internet: www.worldbank.org www.growthcommission.orgE-mail: [email protected] [email protected]
All rights reserved
1 2 3 4 5 12 11 10 09
This report is a product of the Commission on Growth and Development, which is sponsored by the following organizations:
Australian Agency for International Development (AusAID)Dutch Ministry of Foreign AffairsSwedish International Development Cooperation Agency (SIDA)U.K. Department for International Development (DFID)The William and Flora Hewlett FoundationThe World Bank Group
The fi ndings, interpretations, and conclusions expressed herein do not necessarily refl ect the views of the sponsoring organizations or the governments they represent.
The sponsoring organizations do not guarantee the accuracy of the data included in this work. The boundaries, colors, denominations, and other information shown on any map in this work do not imply any judgment on the part of the sponsoring organizations concerning the legal status of any territory or the endorsement or acceptance of such boundaries.
All queries on rights and licenses, including subsidiary rights, should be addressed to the Offi ce of the Publisher, The World Bank, 1818 H Street NW, Washington, DC 20433, USA; fax: 202-522-2422; e-mail: [email protected].
ISBN: 978-0-8213-8165-6eISBN: 978-0-8213-8166-3DOI: 10.1596/978-0-8213-8165-6
Library of Congress Cataloging-in-Publication data has been requested.
Cover design: Naylor Design

Contents vii
Contents
Members of the Commission on Growth and Development ivWorkshop Participants ixPreface xiiiAbbreviations xvii
PART 1Introduction 1
The Purpose of This Special Report 2
PART 2The Crisis 5
Response to the Crisis 7The Post-Crisis Global Economy 8
PART 3Questioning the Growth Strategies 15
What Failed and What Did Not Fail? 15Openness 17Strategies and Outcomes 18
PART 4Openness and Financial Development 21
Global Imbalances: Protectionism and Fiscal Defi cits 21Defi cit Spending, Sustainability, and the U.S. Dollar as a
Reserve Currency 23Financial Sector Development 24
PART 5Resilience 29
Countercyclical Policies 30Distributional Issues 31

viii Contents
International Agenda 32The Poorer Developing Countries 33Bad Ideas: Part 2 34
Concluding Thoughts 37
Statistical Appendix 39
1. The Heart Attack 392. Underlying Condition for the Crisis 523. The Emergency Room 614. The Real Economy Impact 655. The Crises of 1929 and 2008 73

Workshop Participants ix
Workshop Participants
Commissioners
Ahluwalia, Montek, Deputy Chairman, Planning Commission, Government of India
Bacha, Edmar, Director, Casa Das Garças Institute for Economic Policy Studies, Brazil
Boediono, Dr., former Governor, Central Bank of IndonesiaDerviŞ, Kemal, former Head of the UNDP; Vice President and Director,
Global Economy and Development, The Brookings Institution, United States
Han Duck-soo, Ambassador of the Republic of Korea to the United StatesLeipziger, Danny, Professor of International Management, George
Washington University’s Graduate School of Business, United States; former Vice President and Head of Network, PREM, the World Bank Group; Commission Vice-Chair
Mohieldin, Mahmoud, Minister of Investment, Arab Republic of EgyptOkonjo-Iweala, Ngozi, Managing Director, the World Bank GroupSolow, Robert, Professor Emeritus, Massachusetts Institute of Technology;
Nobel Laureate in EconomicsSpence, Michael, Professor Emeritus, Stanford University; Nobel Laureate in
Economics; Commission ChairVenner, Sir Dwight, Governor, Eastern Caribbean Central Bank, St. Kitts and
NevisWatanabe, Hiroshi, President and CEO, Japan Bank for International
Cooperation

x Workshop Participants
Participants
Acemoglu, Daron, Professor of Applied Economics, Massachusetts Institute of Technology
Acharya, Viral, Professor, Stern School of Business, New York UniversityAghion, Philippe, Professor of Economics, Harvard UniversityAkerlof, George, Nobel Laureate in Economics; Professor of Economics,
University of California, BerkeleyAthayde, Christopher, Head of Development Policy Unit, International
Development and Climate Change Team, UK TreasuryAziz, Jahangir, Chief Economist, J.P. Morgan, Mumbai, IndiaBanerjee, Abhijit, Professor of Economics, Massachusetts Institute of
TechnologyBates, Jennifer, Economic Counselor, British Embassy, Washington, DCBlejer, Mario, former Governor, Central Bank of Argentina; Executive
Director, MAG (Macroeconomic Advisory Group) Brahmbhatt, Milan, Economic Adviser, World BankBrunnermeier, Markus, Professor of Economics, Princeton UniversityCalomiris, Charles, Professor of Financial Institution, Graduate School of
Business, Columbia University Canuto, Otaviano, Vice President and Head of Network, World BankCooper, Richard, Professor of International Economics, Harvard UniversityCox, Simon, South Asia Business Correspondent, The EconomistCran, William, Producer, Writer and Director, PITV Productions, Ltd.,
United KingdomFeldstein, Martin, Professor, Harvard UniversityFrankel, Jeffrey, Professor of Capital Formation and Growth, Harvard
UniversityGoldfajn, Ilan, Professor, Department of Economics, Pontifi cal Catholic
University of Rio de Janeiro (PUC-Rio), Chief Economist Itau/UnibancoGiugale, Marcelo, Sector Director, World BankHausmann, Ricardo, Professor of the Practice of Economic Development,
Director of the Center for International Development, John F. Kennedy School of Government, Harvard University
Ito, Takatoshi, Professor, Graduate School of Economics, University of TokyoJohnson, Robert, former Chief Economist for the Senate Banking and Budget
Committees, United StatesKanbur, Ravi, International Professor of Applied Economics and
Management, Professor of Economics, Cornell UniversityKenen, Peter, Professor of Economics and International Finance Emeritus,
Princeton UniversityKhalaf-Hunaidi, Rima, former Assistant Secretary General and Director of the
Regional Bureau for Arab States at UNDP; former Deputy Prime Minister of Jordan

Workshop Participants xi
Kharas, Homi, Visiting Fellow, Wolfensohn Center for Development, The Brookings Institution
Lee Kwang suk, Second Secretary, Embassy of the Republic of Korea, Washington, DC
Lewis, Jeffrey, Senior Adviser, World BankLim, Edwin, Director, China Economic Research and Advisory ProgrammeLin, Justin, Chief Economist and Senior Vice President, World BankLoewald, Christopher, Ministry of Finance, South AfricaMahovsky, Madeleine, European CommissionMalan, Pedro, former Minister of Finance, BrazilMarchal, Wijnand, First Secretary, Royal Netherlands Embassy,
Washington, DCMiller, Callum, Department for International Development (DfID), Growth
and Investment Group, United KingdomMonfort, Philippe, European CommissionNankani, Gobind, Executive Director, International Growth Center, United
KingdomO’Neill, Jim, Head of Global Economic Research, the Goldman Sachs Group, Inc.Oya, Shin, Japan Bank for International CooperationPinto, Brian, Adviser, World BankPortes, Richard, Professor of Economics, London School of EconomicsRichardson, Matthew, Stern School of Business, New York UniversityRodrik, Dani, Professor of International Political Economy, John F. Kennedy
School of Government, Harvard UniversityRomer, Paul, Senior Fellow, Stanford Center for International Development
(SCID) and the Stanford Institute for Economic Policy Research (SIEPR)Rostom, Ahmed, Ministry of Investment, Arab Republic of EgyptScholes, Myron, Nobel Laureate in Economics, Professor of Finance
Emeritus, Stanford UniversityServen, Luis, Research Manager, World BankShah, Ajay, Senior Fellow, National Institute for Public Finance and Policy,
IndiaSheel, Alok, Secretary, Economic Advisory Council to the Prime Minister, IndiaSheng, Andrew, Chief Adviser to the China Banking Regulatory CommissionSöderbäck, Mikael, Advisor, Financial Systems Development, Swedish
International Development Cooperation Agency (SIDA)Steer, Cynthia, Managing Director, Chief Research Strategist, RogerscaseyThompson, Sue Lena, Senior Associate, Cambridge Energy Research
Associates; Independent Producer and ConsultantThunell, Lars, Executive Vice President and CEO, International Finance
Corporation, the World Bank GroupWolfson, Mark, Graduate School of Business, Stanford UniversityZappala, Cara, Special Assistant, World Bank

xii Workshop Participants
Growth Commission Secretariat
Brahmam, Maya, Senior Communications Offi cerDarlington, Muriel, Program AssistantNowak, Dorota, Senior Program Offi cer Singh, Pavneet, ConsultantZagha, Roberto, Country Director for India, World Bank, and Secretary to
the Commission

Preface xiii
Preface
The Commission on Growth and Development brings together 20 leaders, mostly from developing countries, and two academics, Bob Solow and me. The leaders carry with them decades of accumulated experience in the chal-lenging work of making policies that infl uence millions of people’s lives.
In May 2008, the Commission released The Growth Report: Strategies for Sustained Growth and Inclusive Development. At that time, the fi nan-cial systems of the United States and Europe were under stress. Commodity prices were also spiking, posing particular diffi culties for developing coun-tries because of the impact on the poor and on potential future infl ation.
But no one foresaw the full magnitude of the crisis that erupted in the fall of 2008, more than a year ago. The crisis was a destructive malfunction of the fi nancial sectors of the advanced economies, which spread rapidly to the real economy and to the rest of the globe. Even countries far from the source of the crisis had to cope with capital volatility, tight credit, and rapidly falling trade.
At the request of several members of the Commission, we held a work-shop on the crisis and its implications for developing countries. We followed our standard procedure of asking for help and insight from a distinguished group of scholars, analysts, and practitioners. The results of that workshop will be published as working papers, on the Commission website, and in a separate volume.
This report is an outgrowth of that process. It is an attempt to look at the crisis and its aftermath from the point of view of developing countries.

xiv Preface
We wanted to assess the impact of these events, and determine if the growth strategies we recommended needed major revision, or some adaptive fi ne-tuning. We also wanted to think more carefully about resilience, and what it might mean for successful sustained growth.
The report that follows is a summary of our thinking on these and related questions.
Since this is likely to be the fi nal report from the Commission itself, I would like to repeat what I said at the time of the publication of The Growth Report. It has been an honor for me to serve with the Commis-sioners and also a high-speed learning process. I suspect we would all agree that the experience of the past 14 months could be described in similar terms. I hope we are successful in sharing the Commissioners’ experience and insights through this report. I also hope readers will benefi t from the papers, workshop proceedings, and case studies that go along with it. These additional publications present the views and fi ndings of a dedicated com-munity of academics and practitioners who played a prominent role in deepening the Commission’s understanding.
As we speak, major developing countries are recovering rapidly from the crisis. There is reason for optimism. But there is also reason for concern about the poorer, more fragile countries whose capacity to shield them-selves from a crisis of this magnitude is limited. In The Growth Report we underscored the importance of national inclusiveness as part of a success-ful growth strategy. The same thing may be said of the global economy. It needs to enhance its ability to respond quickly to protect the more vulner-able people who occupy the same planet.
As was true of the original Growth Report, this follow-up publication tackles diffi cult areas of policy, about which thoughtful people disagree or remain uncertain. Some of that diversity of thought and insight is refl ected in the Commission. We have done our best to identify these areas of dis-agreement or uncertainty as we encounter them, to suggest the range of opinion, and to sum up the benefi ts and costs of various approaches and choices. I think it is fair to say that we have gone out of our way to make sure that any variance of opinions, assessments, or priorities has not been hidden from view.
The work has been rendered possible by the engagement and commit-ment of a large number of individuals. The Commission and I have relied on a working group—I should say a hard-working group: Homi Kharas, Danny Leipziger, Edwin Lim, Paul Romer, Bob Solow, and Roberto Zagha. Together we have tried to assimilate a vast amount of material; organize and review the work prepared for the workshops; and decide on principal themes for the report.
Our editor, Simon Cox, again played a particularly important role. Sel-dom does one fi nd an editor who so deeply and thoroughly understands the

Preface xv
logic and structure of the argument, and then expresses it with simplicity, clarity, and vividness.
A dedicated group of staff at the World Bank—Muriel Darlington, Maria Amparo Gamboa, Diana Manevskaya, Dorota Nowak, and Pavneet Singh organized the workshop, the outreach strategy, and publication of the spe-cial report, related working papers, and proceedings. I thank them again for their dedication, effi ciency, and grace under intense pressure.
I would also like to thank Manu Sharma, who under the guidance of Milan Brahmbhatt, worked with us on many reiterations of the statistical appendix. Our publications team—Aziz Gökdemir, Stephen McGroarty, and Denise Bergeron—were immensely helpful (and patient) in working with us to prepare this report for publication.
As we conclude our work, I want to express our deep appreciation again to our sponsors: the governments of Australia, Sweden, the Netherlands, and the United Kingdom; the William and Flora Hewlett Foundation; and the World Bank Group for their interest and support.
I want to thank again the Vice Chair of the Commission, Danny Leipziger. He has since retired from the World Bank and embarked on a number of projects that are consistent with his long years of commitment to develop-ment and poverty reduction.
Roberto Zagha, the secretary to the Commission, continues to hold the title of the heart of the operation. Though committed to his new role as country director in India with the World Bank, he managed to keep us all together and functioning one more time. His range of knowledge of the rel-evant work in development, his respect for, and his personal relationships with, leaders in academia and in practice have been the essential ingredients in this enterprise. I have enjoyed immensely working with him and will miss that in the future.
Michael SpenceDecember 2009


Abbreviations xvii
Abbreviations
ABS Asset Backed SecuritiesBRICs Brazil, Russia, India, and ChinaCDO Collateralized Debt ObligationFDIC Federal Deposit Insurance CorporationFed U.S. Federal ReserveGDP Gross Domestic ProductIMF International Monetary FundLIBOR London Interbank Offered Rate LIBOR-OIS London Interbank Offered Rate-Overnight Index SwapsMBS OAS Mortgage Backed Security-Option Adjusted SpreadNTSB National Transportation Safety BoardOAS Option Adjusted SpreadOECD Organisation for Economic Co-operation and
Development S&L Savings and LoanSEC Securities and Exchange CommissionSIVs Structured Investment Vehicles TED T-Bill and EurodollarT-Bills U.S. Treasury Bills


PART 1
Part 1: Introduction 1
Introduction
In May 2008, the Commission on Growth and Development released its fl agship report, distilling the results of a two-year inquiry into the causes of poverty and progress. The Growth Report: Strategies for Sustained Growth and Inclusive Development drew inspiration from economies that had sus-tained growth of 7 percent or more, for 25 years or longer, quintupling in size in the space of a generation. It attempted to demystify these economic “miracles,” identifying characteristics they all shared. Five of these com-mon features are described below.
1. They fully exploited the world economy. They imported ideas, know-how, and technology from the rest of the world. At the same time, they produced goods that met global demand, allowing them to specialize and expand rapidly without saturating the market.
2. They maintained macroeconomic stability. They kept a grip on infl ation and did not stray down unsustainable fi scal paths.
3. They mustered high rates of investment, including public investment, fi nanced by equally impressive rates of domestic saving.
4. In allocating resources, these economies paid due respect to market sig-nals. This deference to the market was not absolute: in some cases, govern-ments bent the law of comparative advantage, by favoring some industries over others. But even in these cases, the favored industries had to pass a market test by successfully exporting their products to foreign customers

2 Post-Crisis Growth in Developing Countries
who did not have to buy them. And when the market gave its verdict, these economies were able to respond. Labor was relatively mobile, and stagnant industries were allowed to fail, creating space for more promis-ing rival ventures. Governments recognized their duty to protect laid-off workers from economic misfortune. But they felt no obligation to preserve unviable industries, companies, or jobs.
5. As a complement to these functioning markets, the successful economies also had committed, credible, and capable governments. While market incentives and entrepreneurial dynamism are the proximate drivers of growth, governments cannot be written out of the script. Their macro-economic strategies and microeconomic regulations provide the setting in which market dynamics can work. Governments must also furnish a range of public goods, such as schooling and infant nutrition, that the market may under-provide. In the successful countries, governments showed great perseverance in their pursuit of growth, experimenting with different coun-try-specifi c growth strategies, and abandoning strategies that had outlived their usefulness, despite the upheaval this often entailed. They offered a credible vision of the future that justifi ed sacrifi ces today in the expecta-tion of rewards tomorrow. And they tried to distribute these rewards quite widely. They promoted equal opportunities as far as possible and nar-rowed unequal outcomes, not least because gross inequality can threaten the legitimacy of a growth strategy. The somewhat chaotic microeconom-ics of structural transformation can create hardship and a skewed pattern of burdens and rewards. In successful growth strategies, the government works hard to ameliorate both.
These characteristics are relatively easy to identify. It is harder to know how to replicate them in new places and new circumstances. The Growth Report laid out a number of reforms, policies, and other ingredients of a successful growth strategy, but warned that the specifi c “recipe” that weighs and mixes these ingredients will differ from country to country, as well as evolving over time. Economic development is a decades-long pro-cess, which requires a long time horizon and a measure of persistence to circumvent the roadblocks that inevitably emerge along the way.
The Purpose of This Special Report
At the time The Growth Report was published in May 2008, the Western fi nancial system was in some distress. But we did not anticipate the terrify-ing mayhem that followed in September. The crisis started with a spectacu-lar failure of the most sophisticated fi nancial systems in the world. It then spread far beyond its origins, wreaking havoc on developing economies, which were abruptly deprived of foreign capital and foreign custom.

Part 1: Introduction 3
The crisis delegitimized an infl uential school of thought, which held that many fi nancial markets could be left to their own devices, because the self-interest of participants would limit the risks they took. The Commission had never subscribed to that philosophy. In the original Growth Report, it warned of the fi nancial system’s susceptibility to “shocks and crises,” not-ing the devastating consequences of these confl agrations for growth.
But the crisis was nonetheless a humbling experience for anyone who seeks to understand and explain the world economy. It demonstrated the limits of brain power, knowledge, and policy experience. The magnitude of the crisis surprised the Commission and the numerous distinguished academics and practitioners in the many workshops that helped the Commission catch up with the state of the art in economic thinking. At a huge cost, it taught us an unforgettable lesson about how fi nancial systems really work.
For those intent on picking up the pieces and fi xing the system, the prin-cipal focus of attention is the Western fi nancial system, the epicenter of the crisis. That is as it should be. But the mandate of the Commission does not lie in this area. Our focus continues to be sustained growth and poverty reduction in developing countries. The crisis has, however, raised a number of questions about the best strategies for achieving these ends.
• Was the failure of the fi nancial system also a broader failure of market-oriented capitalist systems?
• Is the lightly regulated Western model of fi nance no longer a model to follow?
• Has the emergency response to the crisis, which entailed a dramatic loos-ening of monetary and fi scal policies, raised infl ationary risks or fi scal dan-gers for developing countries?
• Do the risks posed by exposure to the global economy now outweigh the rewards?
• Are the growth strategies that worked in the past still valid in the post-crisis world? Were these strategies always fl awed, vulnerable to “tail risks” that failed to materialize until now? Or to put it another way: were we just lucky for 20 years, as risky growth strategies seemed to pay off?
The events of the past year have fundamentally altered the global fi nancial system and our understanding of it. They have changed facts and minds. In light of this experience, we wanted to revisit the recom-mendations of the original Growth Report, to determine whether any of its conclusions should be amended or withdrawn. After providinga concise account of the ongoing crisis, this Special Report will assess its longer-term impact on developing countries (Part 2). It will ask whether the original Growth Report got anything signifi cantly wrong, or left anything signifi cant out (Parts 3 and 4). It will explain how developing countries can make themselves more resilient in

4 Post-Crisis Growth in Developing Countries
the face of such blows, and examine what international institutions and forums, such as the G20, can do to help (Part 5). In two brief asides, this Special Report will also refl ect on one prominent theory of fi nancial crises and one proposal for sifting the evidence these disasters leave behind.
To explore some of these issues, we held a two-day workshop at Harvard University’s Kennedy School of Government in April 2009, followed by a meeting of the Commission. To preview our conclusions: we believe the crisis was a failure of the fi nancial system, not the market per se. The crisis will raise the threat of protectionism, but we expect an open trading system to survive. It follows from these two conclusions that an outward-look-ing, market-friendly strategy, as suggested in the original Growth Report, remains broadly valid. It should be amended, but not abandoned.
Although that strategy remains better than any of the alternatives, it may not be as rewarding as it was in the years before the crisis. The world economy that emerges from the recent upheaval may be marked by slower trade, costlier capital, and a more inhibited American consumer. Devel-oping countries may also choose to sacrifi ce some growth for the sake of stability (that is, a reduced probability of shocks) and resilience (that is, a better capacity to respond to shocks). Moreover, the success of this growth strategy will depend not only on domestic choices. It will also depend on the decisions of foreign policy makers, especially in systemically signifi cant countries. These policy makers must stabilize their own economies, rebuild their fi nancial systems on fi rmer ground, resist protectionist pressure, and give the international fi nancial and development institutions the resources and legitimacy they need to respond to the crisis and to do their jobs in the post-crisis world.

PART 2
Part 2: The Crisis 5
The Crisis
At the time the Commission’s report was written, clouds were gathering on the fi nancial horizon. U.S. house prices had peaked in 2006 and adjustable mortgage rates had risen, damaging the balance sheets of highly indebted households and undermining faith in mortgage-backed securities. It became evident that a variety of securitized assets, some quite highly leveraged, were far riskier than advertised. Nevertheless, the Commission was not alone in failing to anticipate the sudden ruptures of September 2008.
Prior to that month, global aggregate demand had remained robust. Trade was not in rapid decline. The biggest problem facing many develop-ing countries was the spike in commodity prices in the previous 18 months, peaking in the spring and summer of 2008. But when the crisis struck, the U.S. economy quickly descended into a double downward spiral. Thanks to the damage to their balance sheets, fi nancial institutions restricted credit and households curtailed their spending. Declines in investment, employ-ment, and trade followed soon after. These declines in the real economy then infl icted further damage on the balance sheets of banks and consum-ers, starting another turn in the spiral.
The size and speed of the collapse created a situation of extreme uncer-tainty. That led to highly conservative, risk-averse behavior on the part of investors and consumers. That, of course, caused further deterioration. The global automobile industry, for example, shrank dramatically, because the purchase of cars and other consumer durables can be postponed in times of uncertainty or distress.

6 Post-Crisis Growth in Developing Countries
The crisis spread to the developing countries through a number of chan-nels. The fastest channel was fi nancial. Credit tightened everywhere, as cap-ital infl ows reversed abruptly. At the time, this was described as a “fl ight to safety.” But the exodus owed more to losses in advanced countries than to worries about emerging markets. Financial institutions had to sell whatever they could to shore up their balance sheets. The capital reversal was imme-diately refl ected in large falls in the currencies of developing countries, even those with large stocks of foreign-exchange reserves. The big exception was China.1
After they had collected themselves, policy makers mustered a response. They offset the reversal of capital fl ows by spending foreign-exchange reserves and taking other measures to ease credit, such as rate cuts. More than a year into the crisis, private capital fl ows are beginning to stabilize and credit spreads, while still high, are coming down.
The IMF entered the crisis with about $250 billion in hand to stabilize volatile capital fl ows. This was not anywhere near enough. In addition, some East Asian countries are still reluctant to deal with the IMF, because of painful memories of the Asian fi nancial crisis over 10 years ago. Some countries benefi ted instead from swap facilities with China, worth about $95 billion, and Japan, which offered a similar arrangement in May 2009. Others enjoyed a swap line with the Federal Reserve. As a result of the G20 summit in April, IMF resources will be expanded to about $750 billion.
The second channel involved the real economy. As the advanced econo-mies contracted, trade fell off a cliff. It is still not clear why trade declined so much more than economic activity. The reasons may include the well documented drying up of trade fi nance, the greater cyclicality of tradable goods, especially consumer durables, and protectionist responses to eco-nomic distress. Regardless of the cause of the breakdown in trade, the effect was very powerful.
The combined impact of tighter credit and vanishing external demand created a recessionary spiral, with declines in investment, employment, and consumer spending reinforcing each other. Asset prices were also hit. Stock markets fell by over 50 percent on average in the developing countries, even underperforming markets in the advanced countries where the crisis origi-
1 China was less vulnerable to mobile investment funds, because of its capital controls. FDI infl ows declined but not by much. China’s high savings rate means it is not quantitatively dependent on for-eign capital. Its huge reserves (on the order of $2 trillion) also give it control over the currency. China used this control to stabilize the dollar-yuan exchange rate. The net effect was a de facto appreciation of the yuan relative to most countries except Japan. As in 1997-98, this put China at a competitive disadvantage, and it responded with a rapid and large stimulus package in November 2008. China could undertake such a fi scal response without jeopardizing its creditworthiness, thanks to its budget surplus on the eve of the crisis and its low public debt. In many ways China’s response to this crisis was a repeat of its response to the Asian fi nancial crisis in 1997-98, but on a much larger scale.

Part 2: The Crisis 7
nated.2 As in the advanced countries, there was great uncertainty about where and when a bottom would be found. This contributed to conserva-tive behavior by consumers, businesses, and fi nancial investors. Developing countries did what they could to counter the drop in demand with a variety of stimulus packages.
To some extent, developing countries suffered the same double down-ward spiral as the advanced economies. In both the fi nancial sector and the real economy, declines in assets and incomes fed on each other. There were, however, important differences. Households were not as indebted. And fi nancial institutions in developing countries were not debilitated by large holdings of toxic assets. This made it somewhat easier to respond to the withdrawal of external fi nancing than would otherwise have been the case. The exceptions were in emerging Europe, where several countries suf-fered from currency mismatches that were toxic in their own way. Banks, companies and mortgage-holders held liabilities denominated in euros or Swiss francs. They fell afoul of the same dangerous combination of fi xed exchange rates and open capital accounts that wreaked havoc during the Asian fi nancial crisis a decade before.
Response to the Crisis
In fi ghting this fi nancial fi re, the government, including the central bank, has several roles. One is to prevent a complete failure of the fi nancial sys-tem and to replace essential functions like credit provision until the nor-mal channels reappear. That has been done quickly and aggressively in the advanced countries, with central banks playing a prominent part. The authorities injected capital into banks, furnished liquidity, and purchased a wide range of assets on a large scale.3 These interventions likely averted a far worse outcome, akin to a depression, in which banks and businesses fail in large numbers, for no other reason than a shortage of credit.
A second role is to try to prop up economic activity and asset prices by fi lling the gap left by sidelined consumers and investors. In performing both these functions, the government’s role temporarily expands. It becomes a player as well as a referee on a much broader front. If successful, coordinated government action will mitigate the damage, even if it cannot eliminate it.
2 In many developing countries, equity prices have since rebounded strongly. Whether this recovery persists remains to be seen.
3 The balance sheets of the advanced country central banks expanded dramatically in responding to the crisis. The Federal Reserve, for example, expanded from $900 billion to over $2 trillion, taking on commercial paper and a wide and unprecedented array of assets as collateral for loans to restore liquidity and capital to the system. A post-crisis challenge is to unwind this expansion in a non-disruptive manner over time.

8 Post-Crisis Growth in Developing Countries
As normal economic activity returns, the government withdraws.4 The aim is not to prevent the recession and the decline in asset prices but rather to prevent a destructive overshoot. Government action helps to resolve a costly co-ordination failure, in which private-sector efforts to delever-age thwart each other. Individual households, fi rms and banks know their cutbacks will hurt everyone else, but they also know that if they do not retrench, when everyone else does, they will go under. As a result, everyone retrenches, which is socially disastrous, even if it is privately rational.
The government must, then, act as a “circuit-breaker”, interrupting the transmission of shocks from one part of the economy to the other. Fis-cal stimulus reduces declines in the real economy, boosting employment, income and credit quality. Restoring credit increases the bang a government gets for its stimulus buck. Interventions in the fi nancial economy and the real economy are more effective in combination than in isolation.
The Post-Crisis Global Economy
What can we expect as the world’s economy emerges from its most seri-ous downturn in seventy years? No one knows with certainty but the most likely outcome is what is sometimes called a “new normal,” with slower growth, somewhat reduced openness in the global economy, and a more regulated, more stable core fi nancial system. The U.S. consumer will become the U.S. saver in an effort to repair the damage to household balance sheets. The world will also face a set of additional challenges (energy, climate, and demographic imbalances, to name a few) with varying time horizons that will test our collective capacity to steer the global economy.
This slump is sometimes referred to as a balance-sheet recession. It was caused by an overexpansion of the balance sheets of households and fi nan-cial institutions, and it will not be resolved until those balance sheets are repaired. In the run up to the crisis, American households and fi nancial institutions held overpriced assets on one side of their ledger and unsustain-able liabilities on the other.
Regulators and central banks failed to appreciate the full dangers of this fi nancial fragility. In the future, they cannot afford a narrow focus on consumer prices and employment, leaving asset prices and balance sheets to their own devices. Someone in the regulatory system will have to take responsibility for the stability and sustainability of asset prices, leverage, and balance sheets. If this task falls to central bankers, they will need addi-tional instruments to match the additional objectives. They cannot hope to control infl ation, manage growth, check overstretched balance sheets, and
4 See “Government’s Role in the Financial Crisis” by A. Michael Spence. PIMCO working paper. March 2009.

Part 2: The Crisis 9
ward off related sources of instability by manipulating short-term interest rates alone. Even with the right tools, it will not be easy for the authorities to judge when balance sheets or asset markets are getting out of hand. Some members of the Commission suspect it may be impossible. But the alterna-tive, which is to go back to the pre-crisis status quo, is neither economically nor politically acceptable.
In one sense, both the fragility of the fi nancial system and the severity of its collapse are ultimately traceable to excessive leverage. Borrowing was allowed to increase to destabilizing levels due to a widespread failure to “see” the rising systemic risk it entailed, as well as a failure to react to it. We lack widely accepted measures of systemic risk. Leverage is diffi cult to gauge, because it can be smuggled into the derivative instruments insti-tutions buy. As a result, many distinguished regulators, economists, and bankers saw part of the problem, but not the whole. Some of them put too much faith in self-regulation, assuming that fi nancial institutions would take all necessary precautions to protect their shareholders. But the self-regulatory brakes that would normally restrain fi nancial institutions were not applied.
New fi nancial instruments have knitted fi nancial institutions into a com-plex network. This generates systemic risk (even as it may dilute the idio-syncratic risks faced by individual fi rms) because distress in one institution may be swiftly transmitted far and wide. It also hides this risk, because the indirect links between institutions are disguised by several degrees of separation, and the data available to track the interconnections are far from complete. This evolving network is poorly understood, even by those par-ticipating in it. Because they are now painfully aware of this fact, they are likely to tread more carefully for a period of time.
This natural conservatism will be reinforced by tighter regulation. As this crisis has reminded us, fi nancial instability has negative external effects. Vulnerabilities in the fi nancial sector represent contingent liabilities for the government and the rest of the economy. The government therefore has a legitimate reason to intervene to see that the taxpayers’ interests are safeguarded.
Financial re-regulation should and will emphasize capital, reserve, and margin requirements, seeking to limit the buildup of systemic risk by con-straining leverage, insofar as it can be measured. Policy makers should also fi ll the gaps in regulation, which is both incomplete and fragmented. This should curb regulatory arbitrage, at least within a country’s borders. But as long as governments resist international harmonization of their approaches, fi nancial institutions will continue to shop across borders for the friendliest regime. It is also possible that regulators will isolate and further constrain a portion of the banking system, so that the channels of credit intermediation are less prone to complete and simultaneous breakdown.

10 Post-Crisis Growth in Developing Countries
Relative to the recent past, the cost of capital will increase, debt will be more expensive and less ubiquitous, and risk spreads will not return to the compressed levels that prevailed before the crisis. Asset bubbles will not disappear, but it is less likely that they will be turbocharged by very high leverage. All of this will raise borrowing costs for households and busi-nesses in the advanced economies, especially in America. There are grounds to hope it will have less of an effect on the availability of capital in emerging economies. Prior to the crisis, after all, emerging economies had to compete for foreign capital with over-engineered fi nancial products promising risk-less returns. Those products are now discredited. As a result, investors may now look more kindly on emerging economies, where the risks are better known and better compensated by the rewards.
Financial markets are now recovering, but labor markets are still dete-riorating. After the typical fi nancial crisis, according to research by the IMF, it takes over a year for output to stop falling, but another 18 months for unemployment to stop rising. Thus joblessness in the advanced economies may not peak until late into 2010. Unemployment may remain high for some time thereafter, which will act as a lingering drain on economic demand.
There are countervailing forces. Some of the fundamental determinants of growth are relatively crisis-proof: demography, for example, or human ingenuity. Wealth has been destroyed, but the stock of knowhow from which developing countries can learn is undiminished. In principle, the potential for “catch-up” growth depends mainly on the gap between the develop-ing country and the technological frontier. What matters is the technology, knowhow, and productivity refl ected in the income levels of the advanced countries, not the growth rate of income or its underlying determinants.
The high-growth emerging economies, such as China and India, now account for a larger share of world GDP. That alone will tend to elevate global growth over time (assuming these countries sustain growth after the crisis passes) compared to the past when the mature, industrial countries accounted for the bulk of world output.
On the other hand, these big emerging economies tend to have higher trade barriers on average than the mature, industrial countries. Thus aver-age rates of protectionism in the world economy, weighted by GDP, will increase as these economies grow in prominence, whether or not individual countries raise tariffs.
The growing weight of emerging economies is now making itself felt politically. Responsibility for overseeing the global economy is passing rap-idly from the G7/8 to the G20. The G20 accounts for 90 percent of global GDP and two-thirds of the world’s population. Its new prominence is highly desirable—indeed, essential. It must remain committed to maintaining as open a trading system as possible, since without this openness, none of the new economic powers would have emerged nearly as quickly.

Part 2: The Crisis 11
There is no magic bullet for getting out of the current crisis. The econ-omy should gradually right itself, as fi nancial markets stabilize and the real economy follows, pulling the sea anchor of extended deleveraging along with it. This process will add up to a recession of unusual depth and length, with variations across countries and regions. There are tail risks in this scenario. One potential worry is a disorderly collapse of the dollar, if the holders of U.S. debt lose faith in its commitment to price stability. Another serious danger is broad-based defl ation or declining nominal prices. The likelihood of defl ation is declining as confi dence starts to come back, asset prices stabilize, balance sheets become legible, and various credit and asset markets restart. But the negative consequences are large. Policies are there-fore likely to err on the side of running a short-run infl ation risk, rather than the reverse.
The best course is to make pragmatic, steady progress at the national and international levels to improve regulations and avoid self-defeating behavior, such as fi scal free-riding or beggar-thy-neighbor protectionism. It is the course we are on. But for now, it is a journey without a clearly defi ned and widely accepted endpoint.
Created in 1967, the National Transportation Safety
Board (NTSB) has become a highly respected agency,
credited with making fl ying safer in the United States
and the world. In testimony before Congress in Novem-
ber 2008, Professor Andy Lo of the Massachusetts
Institute of Technology argued that the fi nancial sys-
tem might benefi t from a safety board of its own. His
proposal was endorsed by Professor Paul Romer, an
adviser to the Growth Commission, during the delib-
erations for this report.
The NTSB is an independent Federal agency,
charged with investigating every civil aviation accident
in the United States, as well as signifi cant accidents
in other modes of transport—railroad, highway, marine,
and pipeline. It also issues safety recommendations
aimed at preventing future accidents. But its primary
mission is backward looking, to assess the causes of
accidents. Over its 40 years of existence, the NTSB has
investigated more than 124,000 aviation accidents.
The NTSB does not regulate airlines or equipment
makers. It does not initiate punishments for negligence.
Nor can it give instructions to the regulatory agencies.
Its function is confi ned to providing knowledge: impar-
tial assessments of the causes of accidents. It has
therefore been free to focus on the purely technical
aspects of its work. However, because of its reputation
for impartiality and thoroughness, it is hugely infl uen-
tial. More than 82 percent of its recommendations have
been adopted.
Many safety features incorporated into airplanes,
automobiles, trains, pipelines, and marine vessels had
their origins in NTSB recommendations. These recom-
mendations span everything from mechanical improve-
ments to better pilot training. In recent years, the NTSB
has started investigating accidents that were avoided,
giving it a new and important source of information as
an input to improving safety regulations.
Would it be useful to have a similar agency to inves-
tigate “accidents,” and near accidents, in the fi nancial
Box 1: A National Transportation Safety Board for Finance?
(Box continues on next page.)

12 Post-Crisis Growth in Developing Countries
system, domestic and global? In the same way that the
Security and Exchange Commission was established
following the Great Crash of 1929, a “National Financial
Safety Board” might be a useful institutional response
to the fi nancial crisis of 2008. At present, no agency
has as its main mission investigating “accidents” in the
fi nancial sector. As a result, learning is not systematic
and many of the lessons of experience risk being lost.
In addition, the agencies most knowledgeable about
the fi nancial system also have regulatory duties, over-
sight powers, and some responsibility for fi nancial
stability. This creates potential confl icts of interest. In
investigating a crisis they are partly investigating them-
selves. And their fi ndings may also be colored by the
knowledge that they will have to implement whatever
fi xes they recommend.
A “National Financial Safety Board” would have
paid close attention to the causes of previous fi nancial
crises and near misses. That information and analysis
would have been available in the present case to help
assess systemic risk in the period prior to 2007. It might
perhaps have helped avert the grand implosion of 2008.
There were a number of warnings issued over the years
leading up to the crisis. But they were not based on
a systematic accumulation of knowledge based on
past experience, knowledge that is then made widely
available to participants, regulators, and the public. As
a result these warnings were viewed as outliers and
tended to be ignored.
It is important to reiterate that an NFSB, by analogy
with the NTSB model, would not have a regulatory func-
tion. Nor would it have a macro-prudential mission of
monitoring fi nancial stability and proposing responses
to instability.
Clearly the infl uence of such an institution would
depend on its credibility, and this credibility would have
to be earned over time. But we believe that the idea
of having such an institution, with a mission confi ned
to analysis and assessment, is worth considering and
debating. In a sense, the recently re-tasked Financial
Stability Board is a move in this direction. But it is popu-
lated by distinguished members who have other senior
positions in major fi nancial and regulatory institutions.
The Board therefore fails to cleanly separate analysis of
the past from action and responsibility for the present
and future.
The reliable information generated by the NTSB in
the United States offers signifi cant external benefi ts to
the rest of the world. A fi nancial equivalent should also
be of wide benefi t. It would be one symbolic way for
the advanced countries to make recompense for the
damage done to the rest of the world by the crisis origi-
nating within their borders.
Those who have considered the idea within and out-
side the Commission have varying views about the mer-
its of such an institution in the context of the fi nancial
sector. Some are quite skeptical, others enthusiastic.
Such an institution is untested in the fi nancial sphere,
so there is little historical evidence to go on. The pro-
posal will likely be debated and discussed as part of
the ongoing process of creating a revised set of regula-
tory structures. We discuss it briefl y here because it is
relevant to a challenge (that is widely accepted to be
important) of improving our understanding of the ori-
gins of fi nancial crises and instability.
Box 1 (continued)

Part 2: The Crisis 13
Financial crises have been the inseparable and costly
companion of market economies for much of their his-
tory. There is little reason to believe the future will be
different. The 1990s and early years of this decade are
remembered for the frequency and severity of crises
that shook developing and industrialized countries alike:
the United States in the early 1990s, in the wake of the
Savings and Loans (S&L) debacle; Japan and Sweden
in 1992; Mexico in 1994; Hong Kong, China, Indonesia,
Malaysia, the Philippines, and Thailand in 1997–98; Bra-
zil and the Russian Federation in 1999; Turkey in 2000;
and Argentina and Uruguay in 2002. The fi scal costs of
these crises were simply staggering: about 3 percent
of GDP in the case of America’s S&L crisis, which was
an important cause of the ensuing 1990–91 recession.
The costs of bank restructuring reached 50 percent of
GDP in Indonesia, 25 percent of GDP in Japan, and one-
third of GDP in Thailand and Korea.
The 2008 crisis was largely unforeseen and sur-
prised most observers. It brought the world economy
to a halt, and undermined several pillars of the world
fi nancial system. It even engendered discussions of the
“end of capitalism.”
Notwithstanding some unique characteristics, the
2008 crisis follows a pattern seen many times before.
The pattern is captured in a fi ve-part model developed
by Hyman Minsky. He begins with Keynes’s dichotomy
between “enterprise” and “speculation.” Enterprise,
Keynes defi ned as the “activity of forecasting the pro-
spective yield of assets over their whole life.” Specula-
tion, on the other hand, was “the activity of forecasting
the psychology of the market.”
“In a successful capitalist economy,” according
to Minsky, “the fi nancial structure abets enterprise.”
When instead “fi nance fosters speculation the perfor-
mance of a capitalist economy falters.”1 Keynes made
the same point more poetically. “Speculators do no
harm as bubbles on a sea of enterprise. But the posi-
tion is serious when enterprise becomes the bubble on
a whirlpool of speculation. When the capital develop-
1 AEA meeting January 1992.
ment of a country becomes the by-product of the activi-
ties of a casino, the job is likely to be ill done.”
In the second part of the Minsky model, some exog-
enous event improves the prospects for profi ts, justify-
ing speculative bets. The 1992 crisis in Japan came in
the wake of fi nancial liberalization in the 1980s and the
appreciation of the yen. Financial liberalization was also
behind the euphoria preceding Sweden’s 1992 crisis.
In the 1990s in the United States a productivity boom
together with a decline in fi scal defi cits prompted the
Federal Reserve to keep interest rates low in the face of
economic expansion. And preceding the 2008 fi nancial
crisis there was a signifi cant increase in asset prices,
fueled by leverage, low interest rates, and the percep-
tion that fi nancial innovation had tamed fi nancial risk.
In the third part of Minsky’s model, expectations
take off, losing touch with reality. This is possibly the
most diffi cult part of any crisis to explain: the moment at
which genuinely good news in the real economy feeds
expectations that any hard-headed analyst would rec-
ognize are impossible to fulfi ll. “Euphoria,” “optimism,”
“irrational exuberance,” “manias,” “bubbles,” “blind-
ness to risk,” and “animal spirits” are various ways to
describe the psychological forces at work.
Rationality is not always absent. JP Morgan analysts
decided to exit the market for sub-prime mortgage-
backed securities in 2005 once it became evident that
the correlation between risks could not be calculated.
Nouriel Roubini had for years highlighted the risks inher-
ent in the U.S. “shadow banking system.” Robert Shiller,
both in his books and his widely known housing index,
has called attention to unsustainable levels of housing
prices for almost a decade. Raghuram Rajan endured
some criticism from his peers at the Jackson Hole sym-
posium hosted by the Kansas City Fed in 2005, when
he asked whether fi nancial development had made the
world riskier, not least because bankers’ pay schemes
gave them perverse incentives.
In their recent book Animal Spirits: How Human
Psychology Drives the Economy and Why it Matters for
Global Capitalism, George Akerlof and Shiller explore
Box 2: The 2008 Financial Crisis: Unprecedented?
(Box continues on next page.)

14 Post-Crisis Growth in Developing Countries
the spectrum of psychological forces that motivate
investors and entrepreneurs. These animal spirits lead
entrepreneurs to take socially valuable risks in the face
of uncertainty, thus enabling the extraordinary prosper-
ity brought about by a market system. But at some
point, these psychological forces also lead to perverse
behaviors of the kind witnessed in Enron in the early
2000s, or in Wall Street more recently.
Their book explores the boundaries between eco-
nomic rationality and non-economic motivations of
economic behavior. It looks at how trust infl uences the
functioning of a market economy; how fairness guides
what policy actions are taken; and how human imagi-
nation leads to different interpretations, and hence
responses, to the reality at hand. These psychological
phenomena are now prominent in economics, even
if they are not yet understood defi nitively enough to
guide policy discussion. They are also at the heart of
Minsky’s view of economic crises.
The fourth part of the Minsky model is the credit sys-
tem. Credit permits highly leveraged investments in the
pursuit of socially valuable goals. But it also enables the
pursuit of short-term capital gains in real estate, com-
modities, or fi nancial assets. Borrowers tend to prog-
ress through Minsky’s well-known trilogy, from hedge
fi nance (where the yield on an asset is suffi cient to pay
the interest and principal of the loan that fi nanced it) to
speculative fi nance (where it is suffi cient to pay only
interest) to Ponzi fi nance, where the borrower is wholly
dependent on capital gains.
In the fi fth and fi nal part of the model, a negative
event triggers a reversal in the cycle. The greater the
leverage, the more violent the downward journey.
Prices fall and leveraged borrowers are unable to honor
their debt. Their distress sales push prices down fur-
ther, prompting another wave of defaults. The triggers
for such a reversal can be many: investors deciding to
leave the market after making signifi cant speculative
profi ts, adverse real economy shocks, growing aware-
ness of unsustainable trends, or just gravitational limits
to the climb of some asset prices.
According to Kenneth Rogoff and Carmen Reinhart,
fi nancial crises are “hardy perennials.” Their review of
eight centuries of crises (including external defaults,
domestic defaults, exchange rate crashes, banking cri-
ses, and infl ation outbursts) shows that it is generally
a mistake to assume that “this time is different.”2 The
2008 crisis has highlighted many exotic and novel fea-
tures of the fi nancial system (“jingle mail”, NINJA loans,
CDO-squared products, SIVs, SPIVs, and conduits). It
is also distinctive in its global reach. But it nonetheless
shares important common features with previous fi nan-
cial crises. Perhaps the most striking similarity was the
widespread belief, as the credit boom progressed, that
this time was different, when the only thing that made
it different was how badly it turned out.
2 Ken Rogoff and Carmen Reinhart, “This Time Is Different: A Panoramic View of Eight Centuries of Financial Crises,” April 2008. NBER Working Paper No. 13882.
Box 2 (continued)

Part 3: Questioning Growth Strategies 15
Questioning Growth Strategies
PART 3
After a shock of this magnitude, there is a natural and healthy inclination to re-examine old certainties and revisit long-held assumptions. It is therefore not surprising that some people are questioning the premises of economic models and growth strategies that have served countries well in the past but have not escaped this crisis unscathed. We ourselves have discussed these issues extensively with each other and with experts in academia, policy making, and the private sector.
The outcome of this period of refl ection will have fundamental conse-quences for the economic strategies countries pursue and the results they achieve. While a crisis is an opportunity for learning, adjustment, and some-times accelerated reform, it is also an opportunity to make mistakes. The early evidence is that policy makers in emerging economies have resisted hasty reversals of policy. But it is not inconceivable that the baby will be thrown out with the bath water.
What Failed and What Did Not Fail?
No issue in development is more controversial than the proper role of gov-ernment in economic life. Successful economies have generally found a for-mula that includes a dynamic and innovative private sector supported by

16 Post-Crisis Growth in Developing Countries
government investment in public goods, effective regulation, and redistri-bution to protect the most vulnerable. That balance varies across countries. It will also typically shift over time as the economy evolves and the private sector grows strong enough to take on new tasks. What is at stake, as Presi-dent Obama said in his inauguration speech, is not the size of government but its effectiveness.
In the wake of the crisis, many people argue that the line between the market and the state should be redrawn. Some of this advocacy is oppor-tunistic, but much of it is motivated by genuine concerns. Regardless of the origins of this sentiment, it is a political fact of life and needs to be dealt with by leaders and citizens alike.
The nature of this crisis has strengthened the hands of those who prefer a more expansive role for the state. Properly channeled that is not neces-sarily a bad outcome. But there are ample opportunities to make mistakes or to go too far.
Our conclusion is that the crisis represents a major failure of the fi nancial systems in the advanced countries. In particular, the lightly and incompletely regulated model that was infl uential in many Western economies is funda-mentally fl awed and in need of change. However, we have not found any evidence of a more broad-based failure of the market and capitalist econo-mies. While the real economy has been damaged globally, generally, private sector responses have been appropriate to the diminished circumstances.
In our view, the policy debate should be focused where it mainly belongs: on the fi nancial sector’s stability and performance, rather than on a more sweeping condemnation of the whole market-based system. To expand gov-ernment substantially into the broader economy might disrupt the private dynamism that has contributed to all the successful high-growth cases that we know of. That would be a serious mistake.
The government should however do more to protect people in the face of extreme economic turbulence. These safety nets are indispensable to main-tain public confi dence and support for market-led outcomes. They would complement efforts to achieve greater economic and fi nancial stability.
In response to the crisis, the state has expanded its role, especially in the advanced economies. Quantitative easing, capital injections into the fi nan-cial sector, bail-outs in a number of other industries, and fi scal stimulus pro-grams have all added to the government’s scope and infl uence. Proponents of dirigisme may see an opportunity to turn these emergency expedients into a longer-term expansion of the state’s role. Fiscal stimulus programs, for example, can easily lose their temporary status, becoming entrenched. In our view, this would be a mistake. Budget defi cits, if left unaddressed, will eventually raise long-term interest rates, making debts even harder to sustain. Governments may be tempted to infl ate away the public debt the crisis bequeaths. Such an expedient would be both hugely damaging and

Part 3: Questioning Growth Strategies 17
largely futile, since bond yields would rise in anticipation of the threat. It would also undermine the independence of central banks, squandering the credibility they have painstakingly acquired.
In our view, the state’s expansion needs to be reversed as the crisis sub-sides. Fiscal stimulus packages need to be replaced by medium-term pro-grams to restore fi scal balance, based on realistic (and perhaps diminished) estimates of future growth. Central bank credit needs to be withdrawn as private credit channels return—and the central bank needs to retain the independence to do it. The expanded central bank balance sheets need to shrink through the sale of assets over time to the private sector. This will require patience and good timing. If they show both, the authorities may be able to make a profi t from the sales, thereby minimizing the longer-term burden on the public purse.
Governments in developing countries did not have the same freedom to expand their role during the crisis. Few if any of their central banks could double their balance sheets without undermining the currency, and few states in emerging economies can run a double-digit fi scal defi cit without upsetting their creditors. Where governments have borrowed heavily, their creditors have often been the international fi nancial institutions, such as the World Bank or the Asian Development Bank, which have been anxious to fi ll the gap left by foreign capital as it turned tail. In developing economies, the state does not, now, have to retrace the emergency steps it took after the crisis. The bigger danger is that governments will abandon worthwhile reforms set in train before the crisis struck. The early signs, however, are encouraging. Policy makers seem to want to understand the full implica-tions of the crisis, before they draw hasty conclusions about their long-term response to it.
Openness
When the global economy is reasonably stable and open, it is the princi-pal enabler of sustained high growth in developing countries. They can assimilate ideas from the rest of the world and import capital. They can also exploit economies of scale in production, by specializing in what they do best, and importing the rest. The crisis has infl icted dramatic damage on international trade and capital fl ows. It has also raised the threat of protec-tionism: a number of governments have added protectionist provisions to their fi nancial rescues and fi scal interventions.
We do not know how long this setback to globalization will last, or how serious it will prove to be. But if protectionism were to grow or persist even after the crisis has subsided, it would hobble an essential driver of growth. It is the openness of the global economy that permits developing

18 Post-Crisis Growth in Developing Countries
countries to close the gap with advanced countries over several decades. With the exception of the very poorest countries, openness dwarfs aid in its economic impact.
Policy makers appear to understand this. The G20 has twice committed itself to reversing protectionism after the crisis passes. Making good on this pledge will be a political challenge given how hard it is for leaders to reach collective decisions about the world economy. But we expect them to suc-ceed eventually.
Strategies and Outcomes
Events do sometimes embarrass theories. Some crises reveal hidden strengths in previously unfashionable economies, while exposing fl aws in countries previously lauded as models for others to follow. In the 1990s, for example, Japan and the United States traded places as leader and laggard. But we see no reason to retreat from the model outlined in The Growth Report and exemplifi ed by the post-war success stories. The virtues we highlighted in the original report have not become vices. The shared characteristics of the high-growth economies remain worth emulating. There is no known cred-ible alternative with a track record of success.
The crisis does, however, provide an occasion to review some of the pol-icy ingredients countries may include in their growth strategies. In Part 4 we will review the two ingredients that require the most rethinking: fi nancial reform and export promotion. In light of the fi nancial failures in the West, what kind of fi nancial structure should developing countries cultivate? And if countries can no longer count on America to serve as a buyer of last resort, can the domestic economy provide incremental sources of demand? Having reviewed these amendments to the growth strategy, we will in Part 5 consider some additions. In particular, we will explore how countries can strengthen their resilience to external shocks.
The growth model offered in the original report may still be the best strategy to follow, but that does not mean it will be as rewarding as it was in the recent past. Global growth may be slower in the coming years and the cost of capital may be higher. There may also be a period during which there is a shortfall in global aggregate demand as a result of higher household saving in the United States.5 And the global economy may suffer further episodes of volatility such as last year’s spike in commodity prices.
For several years, then, developing countries may reap lower returns from even the best growth strategies, recording a slower expansion of out-
5 We do not yet know whether higher U.S. saving will be offset by lower saving in countries running big current-account surpluses. We discuss this forward-looking version of global imbalances in more detail below.

Part 3: Questioning Growth Strategies 19
put and a smaller reduction in poverty. We hope the global economy defi es this prediction, bouncing back quickly. But although we believe the world will eventually return to a sustainable pattern of respectable growth, we do not know how long it will take. A best guess would be several years, largely because of slower growth in the advanced economies.


Part 4: Openness and Financial Development 21
Openness and Financial Development
PART 4
Global Imbalances: Protectionism and Fiscal Defi cits
Prior to the crisis, many economists fretted about the unbalanced pattern of demand in the world economy. The United States, and other countries such as Britain, were “living beyond their means,” running large current-account defi cits, while countries such as China, several other Asian countries, Ger-many, and the Gulf oil exporters ran correspondingly large surpluses.
The crisis has, however, severely dented the American consumer’s appe-tites. The drop in house prices and share prices has wrecked household bal-ance sheets. (In Europe households held less debt. They were more likely to qualify for defi ned benefi t pensions that transfer asset-price risk to govern-ments or companies. They also benefi ted from more generous social security and welfare programs.) In response, American consumers are very likely to spend less and save more for an extended period, abandoning the pattern of the last few years. This rise in the household saving rate is one reason why the crisis will not be a mean-reverting event, at least in the medium term. The result could be a shortfall in global aggregate demand, on the order of $700 billion or more, relative to the world economy’s productive potential. Over time, this shortfall should be fi lled by an increase in domestic demand

22 Post-Crisis Growth in Developing Countries
in surplus countries. But the longer it takes to fi ll this gap, the greater the incentive to capture a share of global demand by protectionist means.6
These imbalances could be resolved by coordinated efforts to expand demand in surplus countries. If this effort is undertaken jointly, it will remove the temptation to resort to protectionism. It would also make it easier for countries to withdraw their fi scal stimulus and stanch the red ink left behind by the crisis. Put another way, the rapid restoration of global demand will ease defl ationary risks, hasten infl ationary pressure, and there-fore reduce the desirability of defi cit spending.
Many developing countries have prospered by serving the global mar-ket. They have benefi ted in particular from America’s willingness to act as a consumer of last resort. If America is no longer prepared to sustain a large trade defi cit, will developing countries have to rethink their growth strategies?7
To grow rapidly, countries must reallocate resources from traditional, low-productivity activities, such as agriculture, to new industries, which allow for rapid gains in productivity that often spill over to the wider econ-omy. These new industries often make tradable goods. Thus as countries make economic progress, their production of tradable goods tends to rise rapidly. Some countries will run trade surpluses, producing more traded goods than they buy.
However, a bumper trade surplus is not the mark of a successful growth strategy. As the original Growth Report pointed out, “The goal of an export-led strategy is not to increase reserves or to run a trade surplus.” As countries grow, exports will increase as a percentage of GDP. “But that is only one side of the ledger. On the other side, imports can and should also increase.”
There is no necessary connection between increasing the share of trad-able goods in GDP and running a trade surplus. The two can go together, but they do not have to. In a paper presented at the April workshop, Dani Rodrik of Harvard’s Kennedy School of Government showed that trade surpluses do not have any independent, positive effect on growth, once you control for the share of industry in GDP. The share of “industry” cap-tures the importance of non-traditional, high-productivity activities in a country’s economy. Countries grow by promoting these activities, not by promoting trade surpluses per se.
6 There has been a tendency, particularly in discussions involving the advanced countries and China, to focus on the exchange rate as the key variable governing the excess of savings over investment. It is important to recognize that the exchange rate is one of many variables and policies that can be used to bring savings and investment into line. To restore global aggregate demand, the focus should be on the surpluses and not on one of many instruments that infl uence it. The exchange rate is a strategic variable for developing countries, and the choice of an exchange-rate regime is a complex and contro-versial topic. For a fuller discussion, see The Growth Report.
7 This important question was posed by Professor Dani Rodrik in his paper on “Growth after the Crisis,” which was presented at the April 2009 Growth Commission workshop at Harvard University. Available at: www.growthcommission.org/storage/cgdev/documents/fi nancial_crisis/rodrikafterthecrisis.pdf.

Part 4: Openness and Financial Development 23
Thus the outward-looking strategy advocated in the original Growth Report is still feasible in the “new normal.” It is compatible with a narrower American trade defi cit and a more balanced global pattern of demand.
Nonetheless, given the slowdown in world trade and the sharp contrac-tion in American imports, developing countries should not neglect alterna-tive sources of demand. At the margin, the home market may be worth cultivating as an incremental source of growth.
Domestic demand is not a perfect substitute for global demand. In serv-ing world markets, countries can specialize in a narrow range of prod-ucts, reaping economies of scale. But if they must cater more to domestic demand, countries will need to produce a broader range of products, so as not to saturate any particular local market niche. Therefore the limits to specialization are tighter and depend on the evolving composition of domestic demand.
Nonetheless, countries should not ignore or suppress the domestic mar-ket. At the margin, it can provide a useful incremental addition to demand. The point holds most strongly for the larger and richer developing econo-mies, which offer a deep and varied market. China’s policy makers appear to recognize this. In February, President Hu Jintao called for “more power-ful and effi cient measures to increase domestic demand, consumer demand in particular.”
In some countries internal integration is as urgent as global integration. Goods, services, capital, and labor do not always fl ow smoothly within national economies, let alone between them. The fragmentation of the internal market can refl ect diffi cult geography or burdensome regulation, especially within large, federal countries. Overcoming these obstacles is one powerful and effi cient measure to increase domestic demand.
Defi cit Spending, Sustainability, and the U.S. Dollar as a Reserve Currency
For the moment, the United States is more worried about its jobs defi cit than its trade defi cit. To revive demand it is undertaking a bold fi scal expansion. This fi scal stimulus benefi ts the United States’ trading partners, but also raises some qualms among its creditors. There is a growing concern that America’s defi cits, on the order of 12 percent of GDP in 2009, will be maintained for too long, without a credible plan to restore fi scal temperance. Whether this turns out to be a major issue is too soon to know. According to knowledge-able analysts, the bond markets have recently signaled some degree of con-cern about U.S. defi cits and the longer-term infl ationary outlook.
America’s red ink represents a signifi cant global risk because of the status of the U.S. dollar as a reserve currency. If U.S. creditors lose faith in its fi scal resolve, they may conclude that the United States will try to dilute its obli-

24 Post-Crisis Growth in Developing Countries
gations through high infl ation. That in turn could provoke an exodus from the dollar by the major holders of foreign-exchange reserves. If this exodus were to occur rapidly, the dollar would depreciate sharply and longer-term interest rates would rise quickly. Asset prices more broadly would fall, dam-aging balance sheets and reversing any progress in their repair. Depending on when it happened, it could make a deep recession worse.
To mitigate these risks, the United States should lay out a credible plan to restore fi scal balance without compromising price stability—sooner rather than later.
Financial Sector Development
Because the crisis had its origins in advanced country fi nancial systems, these systems are now subject to the severest scrutiny and most searching reappraisal. But what lessons does the crisis hold for fi nancial systems in developing countries?
In The Growth Report, we laid out the contributions the fi nancial system makes to growth. It provides a vehicle for saving; perhaps best described as safe savings channels. It broadens access to credit. And it directs capital to its best uses. Ideally, the fi nancial system should co-evolve with the “real,” non-fi nancial economy, growing in response to the economy’s needs, and not getting too far ahead of them.
But because the fi nancial system is so interwoven with the rest of the economy, when fi nance fails, it can bring down the rest of the economy with it. This is a lesson we tend to learn and forget with some regular-ity. The crisis showed that fi nancial institutions sometimes neglect to take full account of the risks they shoulder themselves, let alone the risks they impose on the rest of the economy. Financial sector regulation should place a very high emphasis on stability and resilience in the face of external and internal shocks. Having the whole system fail at the same time, as happened in the advanced countries in this crisis, has a very high cost.
There remains the question of what the fi nancial sector should look like in a developing country. Before the Asian fi nancial crises of 1997–98, advanced countries told their developing-country counterparts, in effect, “You should look like us.” The Asian fi nancial crisis made the case for gradualism. The new advice was, therefore, “You should look like us, even-tually.” Countries should not remove capital controls precipitously. They should be judicious in introducing foreign competition and sophisticated fi nancial products. But even if countries plotted a slow and cautious route to fi nancial development, their destination was always fairly clear: they would converge on some version of the advanced country fi nancial system with open capital accounts, a fl oating exchange rate, and a sophisticated set of instruments to price risk and redistribute it.

Part 4: Openness and Financial Development 25
The fi nancial models of the advanced countries are now in some dis-repute. What will replace them is still up for grabs. For poorer countries, seeking to develop their fi nancial systems, that means the destination is no longer clear and will not be for some time. That anchor has been removed and will not be replaced until a new system is in place and has functioned for long enough to earn confi dence.
While we do not know at this point what the “new” advanced-country fi nancial systems will look like, many believe they should end up with a dif-ferent composition. Deep, wide, and liquid fi nancial markets are desirable to promote savings and investment. But it is not clear that the growing trad-ing superstructure adds enough social value (other than to its participants) to justify its costs and dangers. The balance probably needs to shift back toward the essential functions of the fi nancial system: safe savings channels, credit provision to various sectors of the economy, and a means to spread risk to those best placed to bear it.
In some ways, the less sophisticated fi nancial systems in developing coun-tries weathered the crisis better than their more elaborate counterparts in the West. Developing countries do not have shadow banking systems of any size.8 Their banks did not hold complex, toxic assets. This was partly due to self-restraint—domestic banks eschewed products they did not trust or understand. But it was also due to regulatory constraints, which restricted the assets domestic institutions could hold, and the products foreign entrants could sell. Several countries, including Brazil, India, and China, make heavy use of regulatory restrictions to dampen their banks’ enthusiasm. China imposes different restrictions depending on the kind of assets banks hold, thereby infl uencing the direction of credit as well as its quantity.
In the advanced countries, almost all the channels for intermediating credit failed simultaneously, a scenario for a depression.9 It was prevented by rapid and massive intervention by central banks, which created liquidity and established alternative emergency channels for credit provision. Such a rescue effort may be beyond most developing countries, because it would run the risk of destabilizing the fi nances of the central bank and the govern-ment. Their best defense, therefore, is prevention.
To this end, the Commission weighed the merits of a “utility model” of banking. Under this model, a portion of the banking system is segregated and heavily regulated. Utility banks offer a limited range of services, such as deposit and savings accounts, and hold a restricted range of safe assets.
8 The shadow banking system is a set of markets and institutions through which credit is provided without bank intermediation. Generally tradable assets are issued by borrowers as in the case of com-mercial paper, or assets are securitized and then sold. This system in the United States accounted for about half the fl ow of credit. Much of this system simply shut down at the start of the crisis.
9 The reason is that all the major banks, investment banks, and a few insurance companies suffered massive balance sheet damage, putting their solvency into question. Interbank lending dried up and the payments system started to fail to operate.

26 Post-Crisis Growth in Developing Countries
This creates a bulwark in the fi nancial system, ensuring that at least some channels of credit remain open, even if the rest of the system goes under.
The utility model is worth considering, although it did not command a consensus within the Commission. Utility banks do not have to be natural monopolies, nor do they have to be government-owned, although in many developing countries, large state-owned banks already operate in much the same way. These state-owned banks often lag behind their private com-petitors in boom times, but come into their own during bad times. They provide a layer of reassurance, which might even encourage more liberal regulation of the rest of the system.
Developing countries should also ensure that some banks remain domes-tically owned, even if they are not owned by the state. In crises, the gov-ernment becomes a major participant in the fi nancial system, as well as a regulator and referee. It supplies capital and acquires a considerable say in what the private-sector institutions do. Private banks become the govern-ment’s working partners in dealing with the crisis. The government’s focus is quite understandably on the domestic economy. But foreign entities will have divided loyalties at best. Some may be wholly preoccupied with events in their home countries. Therefore a country needs major domestic players, which can participate in implementing a crisis response.
Developing countries should also curb fi nancial products they may be ill equipped to handle. It is useful to remember that in the present crisis, some securities were poorly understood by even the most sophisticated banks. Regulators also failed to see the systemic risk these products created. If this kind of under-estimation of risk can occur in the fi nancial centers of advanced countries it can also occur in those of developing countries.
There are, of course, many details to work through in safeguarding fi nan-cial stability. Policy makers must pick a sensible combination of regulation, government guarantees and, in some cases, government ownership. Their choices will have trade-offs: conservative regulation limits the chances of a crisis, but also increases the cost of capital and retards growth. Like-wise, government ownership ensures that credit is available at all times, but it also tends to restrict competition and innovation. Heavy-handed state ownership risks directing credit to the politically powerful instead of the entrepreneurially minded.
The original Growth Report argued that countries should deepen their domestic capital markets before they throw open the doors to global fi nance. Some countries are also pursuing regional initiatives as a halfway-house between the national and the global. The Asian Bond Market Initia-tive, for example, aims to promote debt markets in the region. It hopes to avoid the maturity and currency mismatches that contributed to the Asian fi nancial crisis. These markets should help mobilize the region’s abundant savings and channel them to long-term projects, including infrastructure, without any detour through Wall Street or the City of London.

Part 4: Openness and Financial Development 27
None of this is inconsistent with the presumption that over time, as fi nancial markets deepen, countries can ease capital controls and relax con-straints on some fi nancial products. For example, securitization, despite the recent excesses, is a very useful instrument for allocating capital and reallo-cating risk. Properly regulated, it is quite likely to become a part of develop-ing country fi nancial systems as they mature. But it takes time to build the infrastructure to support these markets, including origination capability, legal support, regulatory standards, and disclosure requirements.10
To summarize, fi nancial instability imposes large costs on the real econ-omy. Regulators should, therefore, lean towards conservatism. They should also retain substantial domestic ownership of fi nancial intermediaries, if only so that the government has someone to work with when fi ghting a cri-sis. A utility model of banking is worth considering, but should not impede the development over time of properly regulated markets in securitized assets and derivatives. Policy makers should also see what emerges from the re-regulation debate in the advanced countries. A number of developing countries are now members of the Financial Stability Board, which recently replaced the Financial Stability Forum. From that perch, they are actively participating in the global effort to rethink fi nancial regulation. A lot will be learned from this debate and the subsequent experience.
Finally, fi nancial regulators need to take a panoramic view, rather than focusing on subsets of variables. They must oversee the stability of the whole system, not just infl ation or growth or capital requirements. Since we do not at this stage have a widely accepted theory that tells us when a fi nancial system is out of balance or becoming unstable, we will have to exercise judgment. Using judgment implies sometimes making mistakes. This is an unfamiliar notion in the advanced countries, where policy mak-ers have put too much faith in effi cient markets and simple policy rules. But in developing countries, policy makers are quite familiar with the necessity of exercising judgment, even when it is fallible.
10 In their annual publication “Mapping Global Capital Markets,” the McKinsey Global Institute shows that as per capita income rises, the role of banking diminishes, and capital is increasingly allocated through markets, including markets for securitized assets.


Part 5: Resilience 29
PART 5
Resilience
Developing countries could do little to prevent the fi nancial crisis, which had its origins far from their shores. But they can better prepare them-selves to withstand such shocks and to minimize the damage they infl ict on households. This resilience should be woven into a growth strategy. With the benefi t of hindsight, it should have been a more prominent feature of The Growth Report.
Resilience is not a free good. It will have to be purchased at some cost. An analogy may help. Highly effi cient systems like networks lack redun-dancy. But systems with redundancy are more resilient in the face of failures in subcomponents. Redundancy is acquired at a cost. The same is true of resilience in growth and development. It may entail higher capital require-ments in banking, even though some of that capital cushion may appear “redundant.” It may entail tighter fi scal policy in good times, even though the budget surpluses may seem excessive. And it may require countries to set aside a sizeable stock of foreign-exchange reserves, despite the opportu-nity costs involved.
One can think of these costs as an insurance premium, which one pays to mitigate the more catastrophic costs of a crisis. How much insurance one wants to buy depends on the risks. The crisis has raised most assessments of the risks in the global economy. This suggests that policy makers will amend their growth strategies to place a higher priority on confi guring the economy to withstand shocks.

30 Post-Crisis Growth in Developing Countries
Countercyclical Policies
Resilience is partly a question of macroeconomic policy. The crisis was a severe test of countries’ foreign-exchange cover, fi scal strength, and mon-etary refl exes.
When a crisis strikes, countries holding ample foreign-exchange reserves can offset the effects of the reversal of capital fl ows.11 Countries that have kept their fi scal power dry, carrying a low burden of public debt, can also undertake countercyclical stimulus measures without jeopardizing the pub-lic fi nances. Credible central banks, backed by a sound fi scal policy, can also expand their balance sheets to offset a tightening of credit.
Timing matters. Countries need to relieve credit constraints quickly, oth-erwise viable businesses will fail. Some of this damage is irreversible. An unanticipated, extended credit lock-up is the fi nancial equivalent of closing food-stores for weeks without prior warning.
Fiscal expansion is meant to limit the drop in aggregate demand and employment, partly by restoring confi dence, so that the collective fears of consumers do not become a self-fulfi lling prophecy. Here again the speed of the response matters. Governments need the resources, of course, but also the ability to spend them quickly, without too many political impediments. Indeed, countercyclical fi scal policies ask a lot of a country’s political sys-tem. Governments must have the self-discipline to resist dipping into budget surpluses during economic upswings. They must also have the credibility to convince their creditors that the defi cits they run during downturns will be reversed when the economy recovers.12
The crisis has reminded emerging economies that foreign capital can be fi ckle, withdrawing for reasons beyond their control. Since many devel-oping countries cannot borrow abroad in their own currency, raising for-eign fi nance also exposes them to currency mismatches. Resilient countries, therefore, tend to have high levels of saving, which allows them to fi nance investment from domestic sources. This spares a country from the risks of a “sudden stop” of foreign capital. The Growth Report pointed out that “there is no case of a sustained high investment path not backed up by high domestic savings.” It recommended that countries open up to foreign capi-tal “only in step with their fi nancial-market maturity.” The experience of the crisis does not suggest any modifi cation of this prescription.
To position themselves to withstand shocks, therefore, countries should have low public debt (both internal and external), ample foreign-exchange reserves, and high domestic savings. In times of stability and relatively high
11 Allowing a depreciation to occur is not inconsistent given the real economy trade challenges. 12 Many developing countries acquire a credible central bank before they build a credible fi scal frame-
work. That is one reason why they should normally rely on monetary policy to stabilize the economy. But monetary policy loses traction when economies suffer from some variant of a liquidity trap.

Part 5: Resilience 31
growth, policy should lean in the countercyclical direction. This macro-economic prudence may weigh on growth in more normal times. But it is compatible with speedy development. After all, among the developing countries, China probably came closest to having this ideal confi guration.
Distributional Issues
The pain infl icted by the crisis was not distributed evenly. Job losses, for example, were concentrated on certain industries, such as homebuilding in Spain, electronics assembly in China, or diamond polishing in India. The commodity price-shock that preceded the fi nancial crisis also had malign distributional effects, because the poor devote such a large share of their budgets to food.
It falls to the state to provide social safety nets that can offer some social insurance against these economic misfortunes. The crisis lends new urgency to measures advocated in the original Growth Report, which argued that policy makers should endeavor to protect people, even as they resist calls to protect industries, fi rms, or jobs. The report pointed out that the best protections a government can provide are education, which makes it easier to pick up new skills, and a strong rate of job creation, which makes it easy to fi nd new employment. Beyond that, it argued, governments should also establish social safety nets, which provide a source of income to people between jobs. The exact form of these safety nets must vary from coun-try to country depending on their levels of income, the strength of their public administration, their tax-raising powers, and the extent of poverty. In advanced social democracies, a wide array of programs help cushion individuals from economic shocks by redistributing the costs among the population or inter-temporally through the fi scal system. Examples include unemployment insurance, wage subsidies paid to employers to offset cyclical downturns in hiring, and extensive public works, often on infrastructure.
In developing countries, the challenge is greater. Social safety nets are patchy at best, and the poor can draw on only meager savings to offset falls in their income. Often, all they can hope for is some temporary, emergency relief from the government. But some countries have shown that it is possi-ble to devise more permanent programs that can serve the economy both in good times and bad, expanding during crises to meet sudden spikes in need. In Brazil and Mexico, for example, existing conditional cash transfers to families can be made more generous relatively easily when needed. In India, the government has increased the resources devoted to its national employ-ment guarantee act, without having to create a whole new program.
In theory, given limited resources, these programs should be fi nely targeted to those in need. However, the narrower the coverage of these

32 Post-Crisis Growth in Developing Countries
programs, the less political support they earn. Distinguished economists, including Larry Summers and Ravi Kanbur, have argued that there are advantages to “leaky” safety nets, in that their “leakiness” buys political support. Broader coverage may be the political price we have to pay for a well-supported safety net.
It takes time to weave new safety nets. By the time a crisis arrives, it is already a little late. In response to rising food prices, for example, countries resorted to blunt measures, such as controlling prices and banning food exports, because they had no prebuilt mechanisms in place to cope with the problem. Hastily arranged public works are also unlikely to produce assets of lasting value. Therefore, countries should prepare an inventory of well-designed projects that can be taken “off the shelf” when the need arises.
International Agenda
The international response to the fi nancial crisis was somewhat tardy com-pared with the domestic interventions. At the onset of the crisis, the world lacked the institutional wherewithal to co-ordinate a swift global response. The IMF, for example, was short of both resources and legitimacy. It did not have enough funds to help every country that might have benefi ted from a loan. At the same time, many countries that might have benefi ted from its help remained deeply reluctant to seek it.
The world economy needs standing arrangements to cope with fi nancial crises of this kind. These international lines of defense might include IMF facilities, such as the new Flexible Credit Line, which provides substantial sums to well-run countries that qualify in advance, with no further strings attached. But these defenses need not all fall under the IMF’s purview. The Federal Reserve’s swap lines with Korea and Mexico, for example, were also valuable efforts to bolster confi dence in those countries. What matters is the effi cacy of these defenses, not the institution that houses them.
The G20 has now agreed to bolster the IMF’s funds, but only after a 9-month delay. In the future, the IMF’s resources must be equal to the crises it faces, as and when they occur. And the lingering doubts about the Fund’s governance need to be resolved so that the institution can act authorita-tively and speedily. Resources and reform go hand in hand. Developing countries should be given a greater say in the institution, commensurate with their new prominence in the world economy. The members of the euro area should participate as a unit with a weight equal to the bloc’s eco-nomic size. In the future, a country’s share of the IMF’s votes should adjust periodically and automatically to refl ect its changing weight in the world economy. No one doubts the diffi culties of reforming a multilateral organi-zation like the IMF, with over 180 sovereign members. The bigger question

Part 5: Resilience 33
is whether fi xing the IMF is harder than creating alternative arrangements from scratch.
On the fi scal side, the best response to the crisis would have been a joint fi scal expansion, free of protectionist measures, so that each country ben-efi ted from its neighbors’ policies, even as its neighbors benefi ted from its efforts. Unfortunately, such coordination is nearly impossible to achieve. Some countries would rather free ride on their trading partners’ stimulus spending, enjoying the boost to their exports without incurring the extra public debt. But this makes it harder for policy makers to justify spending liberally, because the benefi ts “leak” overseas.
This free-riding is diffi cult to police. Given the differences between coun-tries, it is hard to say whether a government is “doing its bit” to restore global aggregate demand. In Europe, for example, generous welfare systems provide some countercyclical demand, quite apart from any discretionary stimulus the government of the day might decree. European countries also spend a larger share of their income on imports, often from other European countries, than America does. Their stimulus spending is therefore more likely to leak abroad, squandered on foreign rather than domestic produc-tion. The end result is a set of stimulus packages with some additional pro-tectionist measures to minimize these “leakages.” This can be thought of as a second-best response that is still better than no action at all.
The Poorer Developing Countries
The G20 represents over 90 percent of the world’s GDP and about two-thirds of its population. If you add a few countries that will likely join the group in the next few years, like Nigeria and Egypt, you have most of the mass of the global economy. But the group still leaves out numerous small countries, many of them poor, with a combined population of about 2.2 billion people.
These countries are often at a particular disadvantage in responding to the crisis. Generally speaking, they lack the savings required to fund high-growth investment, leaving them somewhat dependent on foreign fi nancing. They do not have a cushion of foreign-exchange reserves. Their “quotas” at the IMF are small, limiting the amount they can borrow easily from the Fund. They are inescapably dependent on international trade, because the domestic market is not big enough, or varied enough, to compensate for external demand. There is, therefore, little they can do to cushion the blows of the crisis. Such countries need outside help in dealing with a shock of this magnitude.
The eight members of the Eastern Caribbean currency union, for exam-ple, have suffered dramatic declines in tourist arrivals and a steep fall in for-

34 Post-Crisis Growth in Developing Countries
eign-direct investment, especially in the second homes that Americans and Britons used to enjoy. They have also suffered declines in the remittances on which many families rely. These problems arrived hard on the heels of the dramatic increase in the prices of food, fuel, and building materials in 2007 and 2008, which strained the members’ balance of payments even before the fi nancial crisis struck with full force.
Some of the world’s poorer countries have only recently adopted fl edg-ling growth-oriented policies. The consensus in favor of these policies was somewhat fragile going into the crisis and may break down as a result of it. If so, then it may be the poorer, small countries that suffer the most lasting consequences of the crisis.
Their future depends greatly on developments beyond their borders, on how quickly foreign fi nancing returns, and how soon their export markets revive. It would be morally unacceptable to leave these countries stranded by a crisis that was caused elsewhere.
The Growth Report of May 2008 argued strongly that inclusiveness (in its several dimensions) is an integral part of a growth strategy, and not sim-ply an ethically attractive add-on. The absence of inclusiveness may derail the growth process, by undermining political support or even jeopardizing social order.
Similar considerations apply globally. An international system that can-not protect the most vulnerable people and countries will be challenged by those it excludes. Surely one of the lessons of the crisis is that the global system needs a well-developed set of insurance systems and safety nets that are crisis-ready and do not have to be built from scratch each time. Building these systems should be high on the G20’s agenda.
Bad Ideas: Part 2
The Commission’s original Growth Report contained a list of “Bad Ideas” that policy makers should avoid (see The Growth Report, pp. 68–69). This was one of the most read sections of the report. Here we add to the list.
1. Assume the crisis is a “mean–reverting” event and that we will return to a pre-crisis pattern of growth, capital costs, trade, and capital fl ows.
2. Interpret the need for better regulation and government oversight of the fi nancial sector as a reason for micromanagement of the fi nancial sector.
3. Abandon the outward-looking, market-driven growth strategy because of fi nancial failures in the advanced countries.
4. Allow medium-term worries about the public debt to inhibit a short-term fi scal response to the crisis.

Part 5: Resilience 35
5. Adopt counter-cyclical fi scal policies without concern for the returns on public spending, and without a plan to restore the public fi nances to a sustainable path over time, once the crisis is past.
6. Ignore the need for more equitable distribution of gains and losses in periods of prosperity as well as in crisis.
7. Continue with energy subsidies on the assumption that commodity prices will not rebound after the crisis.
8. Treat the fi nancial industry like any other, ignoring its external effects on the rest of the economy.
9. Focus monetary policy on “fl ow” variables like infl ation, job creation, and growth, ignoring potential sources of instability from the balance sheet (asset prices, leverage, derivatives exposure).
10. Buy assets whose risk characteristics are hard to understand. The high returns are likely to refl ect higher risk even though the latter may be hid-den from view. In a crisis, they will saleable, if at all, only at distressed prices. Things that seem too good to be true, probably are.


Concluding Thoughts 37
Concluding Thoughts
The crisis that we are probably exiting originated in the fi nancial systems of the advanced countries. But it ended up infl icting a huge blow to the global economy. It will have long-lasting effects, and it could have been much worse. Rapid, large-scale, and unconventional responses by central banks and Treasuries, sometimes with and often without broad-based political backing, averted a global depression. It is important to remember the risks the world ran, even if the worst outcomes did not materialize, and to sus-tain the momentum for reform.
In keeping with the spirit of this report, we collectively need to deepen our knowledge of the crisis, and then strengthen our response to it. We need to improve our understanding of the sources of instability in the fi nan-cial sector, disentangling the combination of informational gaps, perverse incentives, and regulatory lapses that contributed to the meltdown.
And then we need to take action, both within countries and in the inter-national system. We need to act on several fronts, all of them important. One is to reform regulation so as to reduce the likelihood of destructive fi nancial instability. To this end, responsibility for oversight of the system needs to be assigned clearly to institutions that have the information and the tools they need. Regulators must also fi nd ways to protect the criti-cal fi nancial functions of providing safe savings channels, extending credit, allocating capital to its best uses, and effi ciently spreading risk. On a sec-

38 Post-Crisis Growth in Developing Countries
ond front, we must recognize that volatility (if not on this scale) is likely to recur. It follows that we should increase the resilience of our economies so that they can withstand shocks. One crucial part of this is to attend to the distributional effects of the crisis.
Financial breakdown infl icts a large amount of collateral damage on the rest of the economy, domestically and globally. Ultimately, the costs often fall on the taxpayer. This damage must be contained. Taking on risk is an inherent part of any well-functioning fi nancial system, but it should not extend to gambling with other peoples’ money.
Responding to these challenges will not be easy. But it is important. The global economy has provided opportunities for advancement for vast numbers of people all over the world. Learning how to manage an open economy, so as to retain the benefi ts and limit the downside risks, is the task ahead in the post-crisis world.

Statistical Appendix 39
1. THE HEART ATTACK
On September 15, 2008, the day Lehman Brothers collapsed, the world fi nancial system suffered a heart attack. A mortgage crisis circumscribed in scope and size morphed into a credit freeze that spread from the United States and the United Kingdom to the rest of the world. It destroyed the balance sheets of some of the world’s most venerable fi nancial institutions, threatened payments systems, and infl icted damage on the real economy from which the world has yet to recover.
Figures 1.1, 1.2, and 1.3 decompose short-term interest rates into the “risk-free” rate and the premium, or spread, lenders require to compensate them for the perceived risk of default. The TED spread in Figure 1.1 measures the spread between 90-day U.S. Treasury Bills, which are free of default risk, and the 90-day LIBOR, one standard measure of the interest rates that banks are charging each other. It is an indicator of the perceived risk in the general economy. From a moderate level at the beginning of the 2000s, the spread declined throughout the middle of the decade. It then rose abruptly from 2006 onwards to peak in September 2008 at an unprecedented level. The spread has declined since then, but remains elevated by historical standards.
Statistical Appendix

40 Post-Crisis Growth in Developing Countries
Figure 1.2 provides another measure of risk: the spread between yields on a three-month U.S. Treasury Repo and a three-month U.S. Treasury Bill. It provides an indication of the counterparty risk in the banking system. The spread reached 80 basis points in the immediate aftermath of the Dot Com bust. For the next seven years, it remained below 50 basis points but started rising after 2006 as fears of default intensifi ed. It also reached an unprecedented level in 2008.
0
0.5
1
1.5
2
2.5
2000 2001 2002 2003 2004 2005 2006 2007 2008 2009
sp
read
(p
erc
en
tag
e p
oin
ts)
year
Figure 1.1 United States: TED Spread between LIBOR and 3-Month T-Bill Rates
Source: Haver Analytics.
year–20
0
20
40
60
80
100
Jan. 2009Jan. 2008Jan. 2007Jan. 2006Jan. 2005Jan. 2004Jan. 2003Jan. 2002Jan. 2001Jan. 2000
sp
read
(b
asis
po
ints
)
Figure 1.2 Spread between Yields on 3-Month U.S. Treasury Repo and 3-Month U.S. Treasury Bill
Source: Global Financial Stability Report, IMF (April 2009).

Statistical Appendix 41
Another indicator of fi nancial market conditions is the spread between AAA-rated commercial paper and the U.S. three-month Treasury Bill, given in Figure 1.3. The spread measures the perceived risk of default by investment-grade companies in the United States. It started rising from 2007, to peak at 270 basis points at the height of the crisis.
year–50
0
50
100
150
200
250
300
sp
read
(b
asis
po
ints
)
Jan. 2009Jan. 2008Jan. 2007Jan. 2006Jan. 2005Jan. 2004Jan. 2003Jan. 2002Jan. 2001Jan. 2000
Figure 1.3 Spread between Yields on 90-day Investment-Grade Commercial Paper and the 3-Month U.S. Treasury Bill
Source: Global Financial Stability Report, IMF (April 2009).
Finally, Figure 1.4 shows the evolution of the spread on asset-backed securities (ABS). It was at relatively low levels for most of the decade, hence contributing to the overvaluation of securities. The exponential rise in the ABS spread in the aftermath of the crisis refl ects the extent of this undervaluation of risk.
sp
read
(b
asis
po
ints
)
0
100
200
300
400
500
600
700
800
year
Jan. 2009Jan. 2008Jan. 2007Jan. 2006Jan. 2005Jan. 2004Jan. 2003Jan. 2002Jan. 2001Jan. 2000
Figure 1.4 ABS Spread
Source: Global Financial Stability Report, IMF (April 2009).

42 Post-Crisis Growth in Developing Countries
As credit dried up, fi nancial institutions withdrew funds from developing countries to shore up their balance sheets at home. Table 1.5a shows sharp slowdowns or outright reversals in the fl ow of portfolio capital to all major developing countries except China, where infl ows continued to rise. Foreign direct investment (Table 1.5b) is less liquid and more diffi cult to reverse.
Table 1.5a Net Capital Infl ows: Select Developing Countries (Portfolio Investment in US$ Billion)
Years Brazil Korea, Rep. of India China South Africa Turkey
1997 10.1 14.4 2.6 6.9 6.7 1.6
1998 18.4 –1.2 –0.6 –3.7 4.3 –6.7
1999 3.8 9.2 2.3 –11.2 8.7 3.4
2000 7.0 12.2 2.4 –4.0 –1.9 1.0
2001 0.1 6.7 2.9 –19.4 –8.3 –4.5
2002 –5.1 0.4 1.0 –10.3 –0.4 –0.6
2003 5.3 18.3 8.2 11.4 0.7 2.5
2004 –4.8 8.5 9.0 19.7 6.4 8.0
2005 4.9 0.0 12.1 –4.9 4.8 13.4
2006 9.6 –18.9 9.6 –67.6 19.6 7.4
2007 48.4 –24.6 35.0 18.7 10.2 0.7
2008 1.1 –15.4 –2.0 39.0 –14.0 –4.8
Source: International Finance Statistics, IMF.
Table 1.5b Net Capital Infl ows: Select Developing Countries (Direct Investment in US$ Billion)
Years Brazil Korea, Rep. of India China South Africa Turkey
1997 18.6 –1.6 3.5 41.7 1.5 0.6
1998 29.2 0.7 2.6 41.1 –1.1 0.6
1999 26.9 5.1 2.1 37.0 –0.1 0.1
2000 30.5 4.3 3.1 37.5 0.7 0.1
2001 24.7 1.1 4.1 37.4 10.8 2.9
2002 14.1 –0.2 4.0 46.8 1.9 1.0
2003 9.9 0.1 2.4 47.2 0.2 1.3
2004 8.7 4.6 3.6 53.1 –0.6 2.0
2005 12.6 2.0 4.2 67.8 5.6 9.0
2006 –9.4 –4.5 7.8 56.9 –6.1 19.1
2007 27.5 –13.7 8.0 121.4 2.8 20.1
2008 24.6 –10.6 20.0 173.0 11.9 15.6
Source: International Finance Statistics, IMF.

Statistical Appendix 43
Capital outfl ows from developing countries put downward pressure on their exchange rates (Figures 1.6a-d) and slowed, or reversed, their accumulation of reserves (Figure 1.7). Once again, China is the exception in that its exchange rate appreciated slightly—thereby contributing to real devaluations elsewhere and to global stability. Developing countries in general managed the situation remarkably well. In most cases, they did not defend their exchange rates, letting them gradually depreciate. This was rendered easier by large stocks of foreign-exchange reserves built over the years, which helped ensure soft landings for their currencies. In a few cases, emergency support from the International Monetary Fund and currency-swap arrangements with the U.S. Federal Reserve provided additional help.
year
0
1
2
3
4
5
6
7
8
9
local cu
rren
cy u
nit
/US
$
Jan. 2009Jan. 2008Jan. 2007Jan. 2006Jan. 2005Jan. 2004Jan. 2003Jan. 2002Jan. 2001Jan. 2000
Figure 1.6a Exchange Rate: Chinese Yuan
Source: Global Economic Monitor, World Bank.
year
local cu
rren
cy u
nit
/US
$
0
10
20
30
40
50
60
Jan. 2009Jan. 2008Jan. 2007Jan. 2006Jan. 2005Jan. 2004Jan. 2003Jan. 2002Jan. 2001Jan. 2000
Figure 1.6b Exchange Rate: Indian Rupee
Source: Global Economic Monitor, World Bank.

44 Post-Crisis Growth in Developing Countries
year
local cu
rren
cy u
nit
/US
$
0
5
10
15
20
25
30
35
40
Jan. 2009Jan. 2008Jan. 2007Jan. 2006Jan. 2005Jan. 2004Jan. 2003Jan. 2002Jan. 2001Jan. 2000
Figure 1.6c Exchange Rate: Russian Ruble
Source: Global Economic Monitor, World Bank.
year
local cu
rren
cy u
nit
/US
$
0
0.5
1
1.5
2
2.5
3
3.5
4
Jan. 2009Jan. 2008Jan. 2007Jan. 2006Jan. 2005Jan. 2004Jan. 2003Jan. 2002Jan. 2001Jan. 2000
Figure 1.6d Exchange Rate: Brazilian Real
Source: Global Economic Monitor, World Bank.

Statistical Appendix 45
As was the case in industrialized countries, however, credit did dry up (Figure 1.8) causing interbank rates to increase in the major developing countries, followed by declines as central banks injected liquidity to moderate these increases (Figure 1.9). Again in this case, China is the exception in that the initial increases in interest rates were modest.
year
0
500
1,000
1,500
2,000
2,500
2000Q1 2001Q1 2002Q1 2003Q1 2004Q1 2005Q1 2006Q1 2007Q1 2008Q1 2009Q1
US
$ b
illio
ns
China India Russian Federation Brazil
Figure 1.7 Total Foreign-Exchange Reserves in the BRICs (minus gold)
Source: International Finance Statistics, IMF, and People’s Bank of China.
year
0
5
10
15
20
25
30
inte
rest
rate
s
India/MIBOR Brazil/SELIC China Russian Federation
2000Q1 2001Q1 2002Q1 2003Q1 2004Q1 2005Q1 2006Q1 2007Q1 2008Q1 2009Q1
Figure 1.8 Select Interbank Rates for BRIC Nations
Source: Haver Analytics/ National Stock Exchange India.

46 Post-Crisis Growth in Developing Countries
More recently, lending conditions remain delicately poised, despite a perceptible thaw since the worst months of the crisis. In the United States and Europe there has been a decline in the LIBOR-OIS spread although lending surveys continue to indicate a relatively tight credit market. In the United States, there has also been a narrowing of option-adjusted spreads (OAS) on high-quality corporate bonds and those mortgage-backed securities issued by Fannie Mae and other government-sponsored agencies.
In parallel with frozen credit markets, stock markets declined abruptly across the G7 industrialized economies. The falls were all the more painful because they were preceded by massive rallies. Many indices had touched all-time highs, generating infl ated asset valuations for fi nancial institutions. In many economies, stock indices trebled from their trough early in the decade to their pre-crisis peaks. The BRICs saw phenomenal gains. In retrospect, it is clear there was an undervaluation of underlying systemic risk. This tale of world-wide rise and collapse is eloquently told in Figures 1.11 to 1.17.
year
0
5
10
15
20
25
polic
y ra
tes
in p
erce
ntag
e
China India Russian Federation Brazil
Jan. 2009Jan. 2008Jan. 2007Jan. 2006Jan. 2005Jan. 2004Jan. 2003Jan. 2002Jan. 2001Jan. 2000
Figure 1.9 Interest Rates in Developing Nations: Policy Rates
Source: Global Economic Monitor, World Bank.

Statistical Appendix 47
Table 1.10 Credit Conditions
2007Q1 2008Q4 Mar. 2009 Sep. 2009
United States
Three-month LIBOR-OIS spread (basis points) 8 123 99 15
Commercial paper issuance (billions of U.S. dollars) 2,005 1,612 1,422 1,159
Lending survey (percent tightening) 11 70 61
Investment-grade corporate OAS (basis points) 90 604 545
Agency-backed MBS OAS (basis points) 68 120 80
Euro Area
Three-month LIBOR-OIS spread (basis points) 6 160 82 36
Commercial paper issuance (billions of U.S. dollars) 756 647 687
Lending survey (percent tightening) 0 65 64
Investment-grade corporate OAS (basis points) 47 397 413
United Kingdom
Three-month LIBOR-OIS spread (basis points) 11 165 120 31
Commercial paper issuance (billions of U.S. dollars) 132 158 167 36
Lending survey (percent tightening) 2 –28 8
Investment-grade corporate OAS (basis points) 78 492 570
Japan
Three-month LIBOR-OIS spread (basis points) 16 73 49 39
Commercial paper issuance (billions of U.S. dollars) 164 825 348
Lending survey (percent tightening) 9 43 13
Investment-grade corporate OAS (basis points) 20 86 104
Source: GFSR April 2009 and Central Banks.
http://www.federalreserve.gov/releases/h15/Current/.
http://www.reuters.com/article/usDollarRpt/idUSL763418820090910.
United States fi gures from U.S. Federal Reserve Statistics.
United Kingdom fi gures from Thomson datastream.
Japan fi gures from Bank of Japan releases.
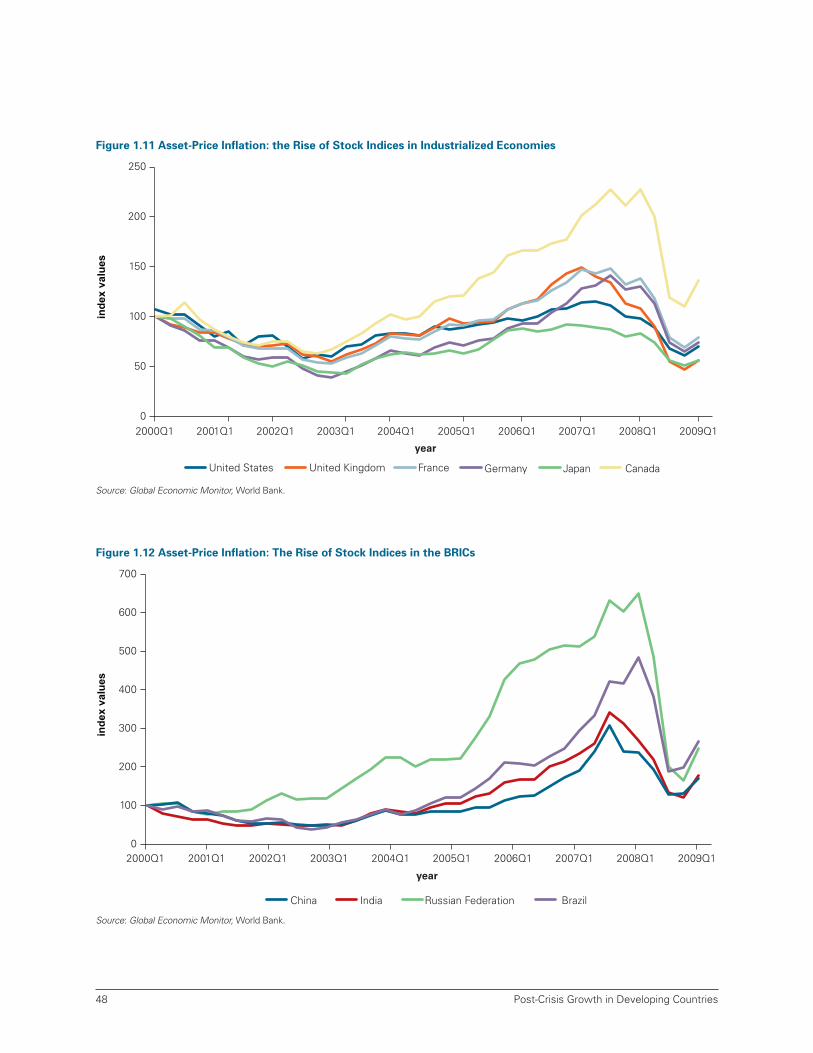
48 Post-Crisis Growth in Developing Countries
year
0
50
100
150
200
250
inde
x va
lues
United States United Kingdom France Germany Japan Canada
2000Q1 2001Q1 2002Q1 2003Q1 2004Q1 2005Q1 2006Q1 2007Q1 2008Q1 2009Q1
Figure 1.11 Asset-Price Infl ation: the Rise of Stock Indices in Industrialized Economies
Source: Global Economic Monitor, World Bank.
year
China India Russian Federation Brazil
0
100
200
300
400
500
600
700
inde
x va
lues
2000Q1 2001Q1 2002Q1 2003Q1 2004Q1 2005Q1 2006Q1 2007Q1 2008Q1 2009Q1
Figure 1.12 Asset-Price Infl ation: The Rise of Stock Indices in the BRICs
Source: Global Economic Monitor, World Bank.

Statistical Appendix 49
Do
w J
on
es G
lob
al 150
year
500
0
1,000
1,500
2,000
2,500
3,000
3,500
Jan. 2009Jan. 2008Jan. 2007Jan. 2006Jan. 2005Jan. 2004Jan. 2003Jan. 2002Jan. 2001Jan. 2000
Figure 1.13 Dow Jones Global 150
Source: Dow Jones Index Services.
Do
w J
on
es In
du
str
ial A
vera
ge
year
0
2,000
4,000
6,000
8,000
10,000
12,000
14,000
16,000
Mar. 2009Mar. 2008Mar. 2007Mar. 2006Mar. 2005Mar. 2004Mar. 2003Mar. 2002Mar. 2001Mar. 2000
Figure 1.14 Dow Jones Industrial Average
Source: Dow Jones Index Services.

50 Post-Crisis Growth in Developing Countries
S&
P E
uro
In
dex
year
0
200
400
600
800
1,000
1,200
1,400
1,600
1,800
2,000
2000Q1 2001Q1 2002Q1 2003Q1 2004Q1 2005Q1 2006Q1 2007Q1 2008Q1 2009Q1
Figure 1.15 S&P Euro Index
Source: Standard and Poor’s Index Services.
Ru
ssia
n T
rad
ing
Syste
m: R
TS
In
dex
0
500
1,000
1,500
2,000
2,500
3,000
year
Jan. 2009Jan. 2008Jan. 2007Jan. 2006Jan. 2005Jan. 2004Jan. 2003Jan. 2002Jan. 2001Jan. 2000
Figure 1.16 Russian Trading System: RTS Index
Source: Russian Trading System (RTS) Indices.

Statistical Appendix 51
Ru
ssia
n T
rad
ing
Syste
m: R
TS
In
dex
0
500
1,000
1,500
2,000
2,500
3,000
year
Jan. 2009Jan. 2008Jan. 2007Jan. 2006Jan. 2005Jan. 2004Jan. 2003Jan. 2002Jan. 2001Jan. 2000
Figure 1.17 S&P Nifty-India
Source: National Stock Exchange (NSE) India.

52 Post-Crisis Growth in Developing Countries
2. UNDERLYING CONDITION FOR THE CRISIS
The crisis did not arrive out of a clear blue sky. Clouds had accumulated for several years, but warning voices were either silenced or unheard. All the main elements preceding previous crises were present in this one as well. A sustained credit boom led to infl ation of asset prices, aided and abetted by leveraged fi nancial institutions. Once the collapse of the housing market shook the system, it led to a vicious circle of falling asset prices, margin calls, distress sales, and further asset-price declines. If there was a difference from previous crises, it was in the complexity of the instruments involved and the tangled web of exposures that made institutions vulnerable to each other. For example, banks were exposed to fi nancial conduits, like structured investment vehicles (SIVs), which were not refl ected on the banks’ balance sheets, and complex fi nancial instruments were traded over the counter, rather than on organized exchanges. This complexity is one reason why what started out as a housing market collapse abruptly became a systemic crisis.
Severe macro imbalances in the United States preceded the crisis (Figure 2.1). The U.S. current-account defi cit prompted extensive discussions in academia and policy circles about its origins and implications. Were American imbalances the counterpart of China’s high saving rates (the “saving glut,” see Figure 2.2), or the result of U.S. fi scal profl igacy? Were they a matter of concern, or a tribute to U.S. fi nancial sophistication, which attracted savings from countries that could not fruitfully invest them at home? Would their resolution be orderly or chaotic? While many saw in these imbalances the portent of a severe crisis, others thought a soft landing was likely. Academics will continue debating this issue for several years to come. But it seems unlikely that imbalances alone caused the 2008 crisis. Less leverage, more disclosure, and more adequate capital to back up exotic fi nancial instruments would surely have generated a very different outcome.
year
0
5
10
15
20
25
perc
en
tag
e p
oin
ts
capital formation as % of GDP savings as a % of GDP deficit between savings and capital formation
2000Q1 2001Q1 2002Q1 2003Q1 2004Q1 2005Q1 2006Q1 2007Q1 2008Q1 2009Q1
Figure 2.1 Rising U.S. Investment-Savings Imbalances
Source: International Finance Statistics, IMF.

Statistical Appendix 53
The risks taken in the fi nancial sector may have been exacerbated by the expansion in liquidity. Figures 2.3 and 2.4 show the growth rates of liquidity in the years preceding the crisis. The availability of credit helped the rise in housing prices (Figure 2.5), which in turn helped indebtedness to rise (Figure 2.6).
–1,500
–1,000
–500
0
500
1,000
1,500
2,000 19
90
1991
1992
1993
1994
1995
1996
1997
1998
1999
2000
2001
2002
2003
2004
2005
2006
2007
2008
2009
US
$ b
illio
n
Other Industrialized Nations Central and Eastern Europe Euro Area Fuel Exporters Japan United States China Other Asia Latin America
Figure 2.2 Current Account Positions (1990-2009; annual data, in $US billion)
Source: World Economic Outlook 2009, IMF.
year
0
5
10
15
20
25
1998 1999 2000 2001 2002 2003 2004 2005 2006 2007 2008
mo
ney s
up
ply
gro
wth
rate
(p
erc
en
t)
United States United Kingdom China
Figure 2.3 Liquidity: M2 Money Supply Growth Rates for Selected Countries
Source: International Finance Statistics, IMF.

54 Post-Crisis Growth in Developing Countries
year
19981997 1999 2000 2001 2002 2003 2004 2005 2006 2007 2008
United States United Kingdom Japan–15
–10
–5
0
5
10
15
20
gro
wth
rate
(p
erc
en
t)
Figure 2.4 Liquidity: Credit Growth in Select Countries (Annual)
Source: International Finance Statistics, IMF.
year
0
50
100
150
200
250
ind
ex v
alu
es
Jan. 2009Jan. 2008Jan. 2007Jan. 2006Jan. 2005Jan. 2004Jan. 2003Jan. 2002Jan. 2001Jan. 2000
Figure 2.5 Asset-Price Infl ation: Case-Shiller Composite 10-City Housing Price Index
Source: Standard and Poor’s Index Services.

Statistical Appendix 55
Table 2.7 gives another indication of rising indebtedness. Collateralized Debt Obligations (CDOs) tripled between 1999 and 2006. And asset-backed securities in the category “other” rose at an extremely high rate as well.
year
0
50
100
150
200
250
300
350
perc
en
tag
e o
f G
DP
government households financial institutions nonfinancial corporations
Mar. 2000 Mar. 2001 Mar. 2002 Mar. 2003 Mar. 2004 Mar. 2005 Mar. 2006 Mar. 2007 Mar. 2008 Mar. 2009
Figure 2.6 Ratio of Debt to GDP among Select Advanced Economies
Source: Global Financial Stability Report, IMF (April 2009).
Table 2.7 United States: Asset Backed Securities, Total Amount Outstanding (in billions of U.S. dollars)
Year Automobile Credit card Home equity Student loan CBO/CDO Other
1995 59.5 153.1 33.1 3.7 1.2 65.7
1996 71.4 180.7 51.6 10.1 1.4 89.2
1997 77.0 214.5 90.2 18.3 19.0 116.8
1998 86.9 236.7 124.2 25.0 47.6 211.1
1999 114.1 257.9 141.9 36.4 84.6 265.9
2000 133.1 306.3 151.5 41.1 124.5 315.3
2001 187.9 361.9 185.1 60.2 167.1 319.0
2002 221.7 397.9 286.5 74.4 234.5 328.2
2003 234.5 401.9 346.0 99.2 250.9 361.2
2004 232.1 390.7 454.0 115.2 264.9 370.9
2005 219.7 356.7 551.1 153.2 289.5 385.0
2006 202.4 339.9 581.2 183.6 296.9 526.4
2007 198.5 347.8 585.6 243.9 .. 1,096.6
2008 137.7 314.1 395.5 239.5 .. 1,585.0
2009 Q2 132.0 307.5 354.7 241.5 .. 1,497.9
Source: Global Financial Stability Report, IMF (October 2009).

56 Post-Crisis Growth in Developing Countries
The growth of fi nancial derivatives was also striking. Derivative holdings rose from $0.3 trillion in Q1 2000 to $16.1 trillion in Q3 2008 (Figure 2.8), according to the Offi ce of the Comptroller of the Currency’s quarterly reports. From 2007, there was a dramatic rise in the risk of counterparty defaults by banks on these derivatives, as measured by Net Current Credit Exposure (Figure 2.9).
year
0
2
4
6
8
10
12
14
16
18
2000 2001 2002 2003 2004 2005 2006 2007 2008 2009
US
$ t
rillio
ns
Figure 2.8 Increase in Derivatives
Source: United States, Offi ce of the Comptroller of the Currency, Quarterly Reports on Bank Derivatives Activities.
0
100
200
300
400
500
600
700
800
900
US
$ b
illio
ns
year
2000 2001 2002 2003 2004 2005 2006 2007 2008 2009
Figure 2.9 Huge Rise in Netted Current Credit Exposure (Counterparty Risk) for
Stock of Derivatives with Commercial Banks
Source: United States, Offi ce of the Comptroller of the Currency, Quarterly Reports on Bank Derivatives Activities.

Statistical Appendix 57
As credit expanded at high rates, quality deteriorated. U.S. mortgage delinquency rates for single families started to rise in 2006 (Figure 2.10). As Table 2.11 shows, the deterioration in credit quality was at fi rst confi ned to mortgages and to the United States. Elsewhere, poor performing loans remained at modest levels. But as a liquidity crisis morphed into an economic crisis, balance sheets were destroyed. The IMF estimated in its Global Financial Stability Report of April 2009 that U.S. and European banks will see their charge-offs and writedowns exceed their (pre-provision) earnings until 2010. The total writedowns by the U.S. and European banking industry for the year 2008 were $845 billion and the total estimated writedowns for the time period 2008–10 are $2,600 billion—a staggering $2.6 trillion over 3 years. Figures 2.12 to 2.14 illustrate this.
0
1
2
3
4
5
6
7
8
9
10
delin
qu
en
cy r
ate
year
2000Q1 2001Q1 2002Q1 2003Q1 2004Q1 2005Q1 2006Q1 2007Q1 2008Q1 2009Q1
Figure 2.10 United States: Delinquency Rates on One-Family Residential
Mortgages
Source: U.S. Federal Reserve.

58 Post-Crisis Growth in Developing Countries
Table 2.11. Bank Nonperforming Loans to Total Loans (in percent)
Country 2003 2004 2005 2006 2007 2008 2009 Latest
Western Europe
Austria 3.0 2.7 2.6 2.1 2.2 2.0 2.2 March
Belgium 2.6 2.3 2.0 1.7 1.1 1.7 2.1 June
Denmark 0.8 0.7 0.4 0.3 0.3 … … December
Finland 0.5 0.4 0.3 0.3 0.3 0.4 … June
France 4.8 4.2 3.5 3.0 2.7 2.8 … December
Germany 5.2 4.9 4.0 3.4 2.7 … … December
Greece 7.0 7.0 6.3 5.4 4.5 5.0 … December
Iceland 2.1 0.9 1.1 0.8 … … … December
Ireland 0.9 0.8 0.7 0.7 0.8 2.6 3.7 March
Italy 6.7 6.6 5.3 4.9 4.6 4.9 5.5 March
Luxembourg 0.5 0.3 0.2 0.2 0.2 … … December
Malta … 6.5 3.9 2.8 1.8 1.6 … December
Netherlands 2.0 1.5 1.2 0.8 … … … December
Norway 1.6 1.0 0.7 0.6 0.5 0.8 1.1 June
Portugal 2.4 2.0 1.5 1.2 1.3 2.0 … December
Spain 1.0 0.8 0.8 0.7 0.9 3.4 4.6 June
Sweden 1.9 1.1 0.8 0.8 0.6 1.0 … December
Switzerland 1.3 0.9 0.5 0.3 0.3 0.5 … December
United Kingdom 2.5 1.9 1.0 0.9 0.9 1.6 … December
Asia
Bangladesh 22.1 17.5 13.2 12.8 14.5 11.2 … June
China 20.4 13.2 8.6 7.1 6.2 2.4 1.8 June
Hong Kong, China 3.9 2.3 1.4 1.1 0.8 0.9 … June
India 8.8 7.2 5.2 3.3 2.5 2.3 … March
Indonesia 6.8 4.5 7.6 6.1 4.1 3.2 4.1 April
Korea, Rep. of 2.6 1.9 1.2 0.8 0.7 1.1 1.5 March
Malaysia 13.9 11.7 9.6 8.5 6.5 4.8 4.6 April
Philippines 16.1 14.4 10.3 7.5 5.8 4.5 4.7 March
Singapore 6.7 5.0 3.8 2.8 1.5 1.4 … September
Thailand 13.5 11.9 9.1 8.4 7.9 5.7 … December
Other
Australia 0.3 0.2 0.2 0.2 0.2 0.5 1 March
Canada 1.2 0.7 0.5 0.4 0.7 1.1 0.9 March
Japan 5.2 2.9 1.8 1.5 1.4 1.7 … March
United States 1.1 0.8 0.7 0.8 1.4 3.0 3.8 March
Source: Global Financial Stability Report, IMF (October 2009).

Statistical Appendix 59
0
0.5
1
1.5
2
2.5
3
3.5
4
4.5
5
Apr. 2008 Oct. 2008 Jan. 2009 Apr. 2009
US
$ t
rillio
ns (
scale
fo
r w
rite
do
wn
s)
an
d %
ch
an
ge (
scale
fo
r g
row
th)
global growth U.S. growth writedowns
year
Figure 2.12 Estimates of Economic Growth and Financial-Sector Writedowns
Source: Global Financial Stability Report, IMF (April 2009).
–400
–200
0
200
400
600
800
1,000
2008 2009 2010 2011 2012 2013 2014
US
$ b
illio
ns
retained earnings earnings before charge-offs total charge-offs and writedowns
year
Figure 2.13 U.S. and European Bank Earnings and Writedowns
Source: Global Financial Stability Report, IMF (April 2009).

60 Post-Crisis Growth in Developing Countries
0
500
1,000
1,500
2,000
2,500
3,000
3,500
4,000
2007Q4 2008Q4 2007Q4 2008Q4
US
$ b
illio
ns (
en
d o
f p
eri
od
)
market capitalization writedowns capital infusions
banks insurersyear
Figure 2.14 Market Capitalization, Writedowns, and Capital Infusions in U.S. and
European Banking and Insurance
Source: Global Financial Stability Report, IMF (April 2009).

Statistical Appendix 61
3. THE EMERGENCY ROOM
Perhaps the most remarkable feature of the government responses to the 2008 crisis has been pragmatism. Policy makers made extraordinary efforts to avoid the costly experience of the 1930s by preventing the collapse of the banking system and the money supply. The lessons of history, it seems, had been heeded. Led by the U.S. Federal Reserve (the Fed), there was an extraordinary injection of liquidity by central banks around the world. Central-bank balance sheets grew rapidly as a result. The U.S. Fed’s assets of $900 billion in August 2007 became $1 trillion in August 2008 and exceeded $3 trillion one year later. Fiscal responses were more modest. The fi gures in this section describe this evolution.
year
0
500,000
1,000000
1,500,000
2,000,000
2,500,000
Aug. 2007 Nov. 2007 Feb. 2008 May. 2008 Aug. 2008 Nov. 2008 Feb. 2009 May. 2009
US
$ m
illio
ns
total assets securities held outright all liquidity facilities
Figure 3.1 Selected Assets of U.S. Federal Reserve
Source: U.S. Federal Reserve.

62 Post-Crisis Growth in Developing Countries
year
0
100
200
300
400
500
600
700
US
$ bi
llion
s
China Brazil Russian Federation India
Jan. 2007 May 2007 Sep. 2007 Jan. 2008 May 2008 Jan. 2009 May 2009Sep. 2008
Figure 3.2 BRIC Central Banks: Total Assets
Source: People’s Bank of China, IMF, Central Bank of Russia, and Central Bank of Brazil.
year
Aug. 2007 Nov. 2007 Feb. 2008 May 2008 Aug. 2008 Nov. 2008 Feb. 2009 May 20090
200,000
400,000
600,000
800,000
1,000,000
1,200,000
1,400,000
1,600,000
1,800,000
US
$ m
illio
ns
all liquidity facilities term auction credit commercial paper funding facility central bank liquidity swaps
Figure 3.3 U.S. Federal Reserve: Liquidity Facilities
Source: U.S. Federal Reserve.

Statistical Appendix 63
year–16
–14
–12
–10
–8
–6
–4
–2
0
2
4 19
80
1981
1982
1983
1984
1985
1986
1987
1988
1989
1990
1991
1992
1993
1994
1995
1996
1997
1998
1999
2000
2001
2002
2003
2004
2005
2006
2007
2008
2009
2010
de
ficit
as p
erc
en
tag
e o
f G
DP
Figure 3.4 U.S. General Government Balance
Source: World Economic Outlook 2009, IMF.
year–12
–10
–8
–6
–4
–2
0
2
4
1980
1981
1982
1983
1984
1985
1986
1987
1988
1989
1990
1991
1992
1993
1994
1995
1996
1997
1998
1999
2000
2001
2002
2003
2004
2005
2006
2007
2008
2009
2010
defic
it as
a p
erce
ntag
e of
GD
P
United Kingdom France Germany Australia Japan
Figure 3.5 Select OECD Economies General Government Balance
Source: World Economic Outlook 2009, IMF.

64 Post-Crisis Growth in Developing Countries
0 2 4 6 8 10 12 14 16 18 20
ArgentinaBrazilChinaIndia
IndonesiaKorea, Rep. of
MexicoRussian Federation
Saudi ArabiaSouth Africa
Turkey
AustraliaCanadaFrance
GermanyItaly
JapanUnited Kingdom
United States
discretionary fiscal expansion in 2009 a financial sector support b
percent
Figure 3.6 Fiscal Stimulus and Financial Sector Support
Source: World Bank and IMF staff.
a. Percent of 2009 GDP. Excludes below-the-line operations that involve acquisition of assets.
b. As of April 15, 2009, in percent of 2008 GDP. Consists of capital injection, purchase of assets and lending by Treasury, and central bank support provided with Treasury backing.

Statistical Appendix 65
4. THE REAL ECONOMY IMPACT
The fi nancial crisis in the United States, the United Kingdom, and the rest of the industrialized world quickly spilled over to the real economy. Having grown by 5 percent in 2006 and 2007, the world economy is now expected to contract by 1.3 percent in 2009—the most severe contraction since WWII. The G7 economies are expected to shrink by 4 percent whereas growth in emerging economies will fall from 8 percent in 2007 to 4 percent in 2009.
year–6
–4
–2
0
2
4
6
8
10
1980 1983 1986 1989 1992 1995 1998 2001 2004 2007 2010 2013
gro
wth
rate
s in
perc
en
tag
e
world advanced economies G7 emerging and developing countries
Figure 4.1 World Growth Prospects
Source: World Economic Outlook 2009, IMF.
year
1980 1983 1986 1989 1992 1995 1998 2001 2004 2007 2010 2013
–10
–5
0
5
10
15
20
past
an
d p
roje
cte
d G
DP
gro
wth
in
perc
en
tag
e
United States United Kingdom China Japan India
Figure 4.2 Growth in Select Major Economies
Source: World Economic Outlook 2009, IMF.

66 Post-Crisis Growth in Developing Countries
Unemployment rates have followed different paths in the countries of the G20. Germany, France, and Brazil, for example, saw a relatively modest rise in unemployment after persistent declines since the mid 2000s. In the United States, on the other hand, almost a decade of relatively low unemployment rates of 4–6 percent has given way to a sudden and steep rise in joblessness from late 2008 onwards. Similarly, Japan, Canada, and Italy have seen a rise in their unemployment rates after a period of relatively stable or declining rates for the past four years. Turkey has had a particularly steep rise in its unemployment rate. In Mexico, the rise in unemployment is large when compared with historical trends although the rise has been much more gradual than in the United States.
0
2
4
6
8
10
12
14
16
un
em
plo
ym
en
t ra
te (
%)
Brazil Russian Federation United States France Germany
year
2000Q1 2001Q1 2002Q1 2003Q1 2004Q1 2005Q1 2006Q1 2007Q1 2008Q1 2009Q1
Figure 4.3 Unemployment Rates: Select G20 Countries
Source: International Finance Statistics, IMF.
un
em
plo
ym
en
t ra
te (
%)
year
0
2
4
6
8
10
12
14
16
Italy Japan Canada Turkey Mexico
2000Q1 2001Q1 2002Q1 2003Q1 2004Q1 2005Q1 2006Q1 2007Q1 2008Q1 2009Q1
Figure 4.4 Unemployment Rates: Select G20 Countries
Source: International Finance Statistics, IMF.

Statistical Appendix 67
All countries suffered falls in exports after September 2008. Exports from the United Kingdom and United States displayed a partial recovery in early 2009, although they are the exception among the G20. The exporters hardest hit are in the fast-growing emerging markets of Asia like India, China,a and Korea. With corresponding declines in imports, the volume of global trade will probably decline by more than 10 percent in 2009, after a decade of rapid growth.
year–25
–20
–15
–10
–5
0
5
10
15
Jan. 2007 Jan. 2009May 2007 Sep. 2007 Jan. 2008 May 2008 Sep. 2008
gro
wth
(%
)
United States United Kingdom France Germany
Figure 4.5 Real Exports
Source: Global Economic Monitor, World Bank.
China Korea, Rep. ofIndia
–40
–30
–20
–10
0
10
20
30
40
50
60
gro
wth
(%
)
Jan. 2007 Jan. 2009May 2007 Sep. 2007 Jan. 2008 May 2008 Sep. 2008
year
Figure 4.6 Real Exports
Source: Global Economic Monitor, World Bank.

68 Post-Crisis Growth in Developing Countries
year
Jan. 2007 Jan. 2009May 2007 Sep. 2007 Jan. 2008 May. 2008 Sep. 2008
gro
wth
(%
)
United States United Kingdom –25
–20
–15
–10
-5
0
5
10
15
20
Korea, Rep. of France Germany
Figure 4.7 Real Imports
Source: Global Economic Monitor, World Bank.
year
–15
–10
–5
0
5
10
15
1986 1989 1992 1995 1998 2001 2004 2007 2010
an
nu
al p
erc
en
tag
e o
f ch
an
ge
trade volume of goods and services import volume of goods and services
export volume of goods and services
Figure 4.8 World Trade Volume
Source: Global Economic Monitor, World Bank.
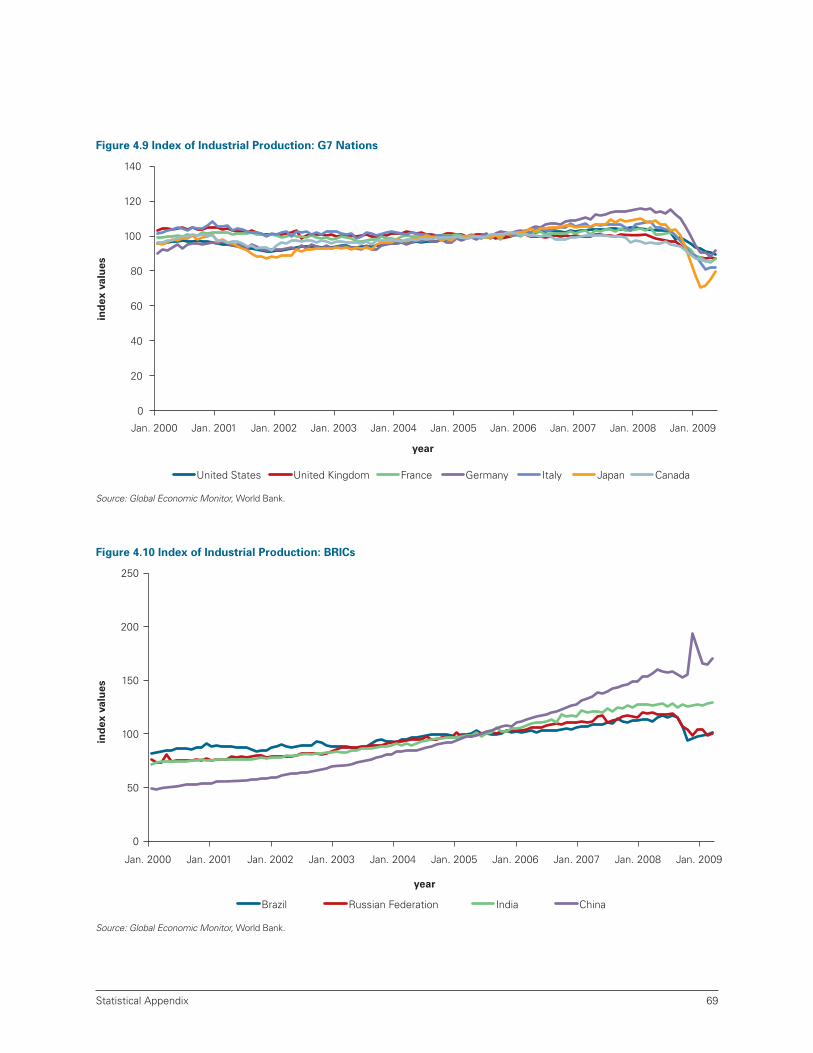
Statistical Appendix 69
year
0
20
40
60
80
100
120
140
ind
ex v
alu
es
United States United Kingdom France Germany Italy Japan Canada
Jan. 2009Jan. 2008Jan. 2007Jan. 2006Jan. 2005Jan. 2004Jan. 2003Jan. 2002Jan. 2001Jan. 2000
Figure 4.9 Index of Industrial Production: G7 Nations
Source: Global Economic Monitor, World Bank.
year
ind
ex v
alu
es
0
50
100
150
200
250
Brazil Russian Federation India China
Jan. 2009Jan. 2008Jan. 2007Jan. 2006Jan. 2005Jan. 2004Jan. 2003Jan. 2002Jan. 2001Jan. 2000
Figure 4.10 Index of Industrial Production: BRICs
Source: Global Economic Monitor, World Bank.

70 Post-Crisis Growth in Developing Countries
It took some time for the world to become aware of the severity of the crisis that was to unfold. Already in the spring of 2007 there was widespread realization of the subprime problem. But there was no awareness of the nature and extent of major fi nancial institutions’ exposure to instruments built on subprime mortgages. As a result, mainstream forecasts did not anticipate the broader economic consequences. Forecasts lagged behind events as shown in the fi gures below.
Table 4.11a World Economic Growth Estimates
Quarters Apr. 2007 Oct. 2007 Oct. 2008 Apr. 2009
2007Q1 4.95 5.05 4.57 4.73
2007Q2 4.74 5.15 4.62 4.76
2007Q3 4.74 5.17 4.92 5.04
2007Q4 4.48 4.86 4.71 4.86
2008Q1 4.63 5.01 4.47 4.50
2008Q2 4.77 4.80 3.85 3.85
2008Q3 4.85 4.77 3.12 2.82
2008Q4 4.88 4.55 2.76 0.24
2009Q1 2.41 –1.84
2009Q2 2.42 –2.38
2009Q3 2.64 –2.37
2009Q4 3.09 –0.65
2010Q1 0.78
2010Q2 1.36
2010Q3 1.92
2010Q4 2.58
Source: World Economic Outlook Reports, IMF.
year–3
–2
–1
0
1
2
3
4
5
6
2007Q1 2007Q3 2008Q1 2008Q3 2009Q1 2009Q3 2010Q1 2010Q3
qu
art
erl
y g
row
th r
ate
(%
)
WEO: Apr. 2007 WEO: Oct. 2007 WEO: Oct. 2008 WEO: Apr. 2009
Figure 4.11b World Economic Growth: Declining Estimates
Source: World Economic Outlook Reports, IMF.

Statistical Appendix 71
year
qu
art
erl
y g
row
th r
ate
(%
)
–5
–4
–3
–2
–1
0
1
2
3
4
WEO: Apr. 2009
2007Q1 2007Q3 2008Q1 2008Q3 2009Q1 2009Q3 2010Q1 2010Q3
WEO: Apr. 2007 WEO: Oct. 2007 WEO: Apr. 2008 WEO: Oct. 2008
Figure 4.12b Industrialized Economies: Declining Growth Estimates
Source: World Economic Outlook Reports, IMF.
Table 4.12a Industrialized Countries Growth Estimates
Quarters Apr. 2007 Oct. 2007 Apr. 2008 Oct. 2008 Apr. 2009
2007Q1 2.45 2.39 2.41 2.35 2.54
2007Q2 2.28 2.25 2.20 2.23 2.51
2007Q3 2.37 2.52 2.72 2.69 2.95
2007Q4 2.23 2.26 2.40 2.28 2.66
2008Q1 2.37 2.31 1.96 2.16 2.52
2008Q2 2.49 2.18 1.46 1.61 1.80
2008Q3 2.58 2.20 0.63 0.85 0.63
2008Q4 2.63 2.33 0.30 0.54 –1.72
2009Q1 0.40 0.08 –3.96
2009Q2 0.78 0.04 –4.40
2009Q3 1.22 0.20 –4.30
2009Q4 1.77 0.64 –2.60
2010Q1 –0.85
2010Q2 –0.25
2010Q3 0.28
2010Q4 0.98
Source: World Economic Outlook Reports, IMF..

72 Post-Crisis Growth in Developing Countries
Figure 4.13a Developing Countries Economic Growth Estimates
Quarters Apr. 2007 Oct. 2007 Apr. 2008 Oct. 2008 Apr. 2009
2007Q1 7.86 8.18 7.77 7.88 8.70
2007Q2 7.58 8.51 7.98 8.14 8.80
2007Q3 7.45 8.21 8.04 8.17 8.75
2007Q4 7.02 7.80 8.07 8.20 8.72
2008Q1 7.16 8.03 7.68 7.75 7.93
2008Q2 7.28 7.70 6.86 7.00 7.34
2008Q3 7.34 7.60 6.29 6.27 6.53
2008Q4 7.32 6.94 5.63 5.81 3.50
2009Q1 5.62 5.58 1.62
2009Q2 6.06 5.61 0.89
2009Q3 6.69 5.90 0.71
2009Q4 7.36 6.32 2.42
2010Q1 3.32
2010Q2 3.83
2010Q3 4.40
2010Q4 4.97
Source: World Economic Outlook Reports, IMF.
year
0
1
2
3
4
5
6
7
8
9
10
qu
art
erl
y g
row
th e
sti
mate
s (
%)
WEO: Apr. 2009 WEO: Apr. 2007 WEO: Oct. 2007 WEO: Apr. 2008 WEO: Oct. 2008
2007Q1 2007Q3 2008Q1 2008Q3 2009Q1 2009Q3 2010Q1 2010Q3
Figure 4.13b Emerging Economies: Declining Growth Estimates
Source: World Economic Outlook Reports, IMF.

Statistical Appendix 73
5. THE CRISES OF 1929 AND 2008
Many economists and policy makers have compared the crises of 1929 and 2008, hoping to stop the latter repeating the catastrophic trajectory of the former. Barry Eichengreen and Kevin O’Rourke have undertaken an interesting comparison of the two crises in “A Tale of Two Depressions”. 1 They plot the evolution of key macro indicators on a month-by-month basis since the beginning of each crisis. The fi gures below show that the two crises follow a remarkably similar pattern, with one exception: monetary aggregates did not collapse in the 2008 crisis as they had in the 1929 one. The World Industrial Output indices for the Great Depression of the 1930s and current crisis follow similar trajectories, except that the drop in industrial production following the 2008 crisis was slightly steeper than the corresponding drop during the Great Depression.
1. B. Eichengreen and K. O’Rourke, “A Tale of Two Depressions,” VoxEU 2009; online at www.VoxEU.org.
0
20
40
60
80
100
120
0
20
40
60
80
100
120
1 5 9 13 17 21 25 29 33 37 41 45 49
1 5 9 13 17 21 25 29 33 37 41 45 49
months since peak months since peak
World 1929 World 2008
perc
en
tp
erc
en
t
perc
en
tp
erc
en
t
0
1
2
3
4
5
6
June 1929=100 April 2008=100
months since peak
June 1929=100 April 2008=100
months since peak
June 1929=100 April 2008=100
0
20
40
60
80
100
120
1 5 9 13 17 21 25 29 33 37 41 45 49
1 5 9 13 17 21 25 29 33 37 41 45 49
Figure 5.1 World Industrial Production,
Then and Now
5.3 World Stock Markets,
Then and Now
Figure 5.2 Central Bank Discount Rates,
Then and Now
5.4 Volume of World Trade,
Then and Now
Source: B. Eichengreen and K. O’Rourke, “A Tale of Two Depressions,” VoxEU 2009; online at www.VoxEU.org.

74 Post-Crisis Growth in Developing Countries
Figure 5.5 Industrial Output, Four Big Europeans, Then and Now
Source: B. Eichengreen and K. O’Rourke, “A Tale of Two Depressions,” VoxEU 2009; online at www.VoxEU.org.
perc
en
tp
erc
en
t
perc
en
tp
erc
en
t
months since peak
June 1929=100 April 2008=100
months since peak
June 1929=100 April 2008=100
months since peak
June 1929=100 April 2008=100
months since peak
June 1929=100 April 2008=100
0
20
40
60
80
100
120 France
0
20
40
60
80
100
120 Germany
0
20
40
60
80
100
120 Italy
0
20
40
60
80
100
120 United Kingdom
1 5 9 13 17 21 25 29 33 37 41 45 49 1 5 9 13 17 21 25 29 33 37 41 45 49
1 5 9 13 17 21 25 29 33 37 41 45 49 1 5 9 13 17 21 25 29 33 37 41 45 49

Statistical Appendix 75
5.6 Industrial Output, Four Non-Europeans, Then and Now
Source: B. Eichengreen and K. O’Rourke, “A Tale of Two Depressions,” VoxEU 2009; online at www.VoxEU.org.
perc
en
tp
erc
en
t
perc
en
t
0
20
40
60
80
100
120
140 Japan
months since peak
June 1929=100 April 2008=100
months since peak
June 1929=100 April 2008=100
months since peak
June 1929=100 April 2008=100
perc
en
t
months since peak
June 1929=100 April 2008=100
0
20
40
60
80
100
120
Chile
0
20
40
60
80
100
120 Canada
0
20
40
60
80
100
120 United States
1 5 9 13 17 21 25 29 33 37 41 45 49 1 5 9 13 17 21 25 29 33 37 41 45 49
1 5 9 13 17 21 25 29 33 37 41 45 49 1 5 9 13 17 21 25 29 33 37 41 45 49

76 Post-Crisis Growth in Developing Countries
Figure 5.7 Industrial Output, Four Small Europeans, Then and Now
perc
en
tp
erc
en
t
perc
en
t
months since peak months since peak
June 1929=100 April 2008=100
0
20
40
60
80
100
120
months since peak
June 1929=100 April 2008=100
perc
en
t
months since peak
June 1929=100 April 2008=100
Belgium
0
20
40
60
80
100
120 Czechoslovakia
June 1929=100 April 2008=100 (Czech Rep.) April 2008=100 (Slovak Rep.)
0
20
40
60
80
100
120 Poland
0
20
40
60
80
100
120
140 Sweden
1 5 9 13 17 21 25 29 33 37 41 45 49 1 5 9 13 17 21 25 29 33 37 41 45 49
1 5 9 13 17 21 25 29 33 37 41 45 49 1 5 9 13 17 21 25 29 33 37 41 45 49
Source: B. Eichengreen and K. O’Rourke, “A Tale of Two Depressions,” VOXEU 2009; online at www.VoxEU.org.


E C O - A U D I T
Environmental Benefi ts Statement
The World Bank is committed to preserving endangered forests and natural resources. The Offi ce of the Publisher has chosen to print Post-Crisis Growth in Developing Countries: A Special Report of the Commission on Growth and Development on the Implications of the 2008 Financial Crisis on recycled paper with 25 percent post-consumer waste, in accordance with the recommended standards for paper usage set by Green Press Initiative—a nonprofi t program supporting publishers in using fi ber that is not sourced from endangered forests. For more informa-tion, visit www.greenpressinitiative.org.
Saved:
• 2 trees
• 2 million British thermal units of energy
• 211 pounds of solid waste
• 3,480 gallons of wastewater
• 732 pounds of net greenhouse gases (CO2 equivalent)


Commission on Growth and Development
Montek Singh AhluwaliaEdmar BachaDr. BoedionoLord John BrowneKemal DervisAlejandro FoxleyGoh Chok TongHan Duck-sooDanuta HübnerCarin JämtinPedro-Pablo KuczynskiDanny Leipziger, Vice ChairTrevor ManuelMahmoud MohieldinNgozi N. Okonjo-IwealaRobert RubinRobert SolowMichael Spence, ChairSir K. Dwight VennerHiroshi WatanabeErnesto ZedilloZhou Xiaochuan
Roberto Zagha (Secretary) The mandate of the Commission on Growthand Development is togather the best understandingthere is about the policiesand strategies that underlierapid economic growth andpoverty reduction.
The Commission’s audienceis the leaders of developingcountries. The Commission issupported by the governmentsof Australia, Sweden, theNetherlands, and the UnitedKingdom, The William andFlora Hewlett Foundation,and The World Bank Group.
www.growthcommission.org
• How has the economic landscape changed in the wake of the fi nancial crisis of 2008?
• What factors contributed to the onset of the fi nancial crisis and its transmission from advanced to developing countries?
• Should the crisis be interpreted as a failure of fi nancial-sector regula-tion or as a broader failure of market-based systems?
• What effects will the fi nancial crisis have on the prospects for econom-ic growth in developing countries?
• How will the crisis impact the formulation of developing country growth strategies going forward?
• What is the outlook for free trade and a growth model that capitalizes on the global economy?
• How do actions by the advanced economies in response to the crisis affect the choices of policy makers in the developing world?
• What is the appropriate role of government in the post-crisis economy? • How will the lessons of the crisis affect strategies for fi nancial-sector
development in developing countries?• What are the prospects for improved international oversight of global
fi nance and cross-border fi nancial fl ows?
In light of the fi nancial crisis, the 22-member Commission on Growth and Development reconvened to issue this special report on Post-Crisis Growth in Developing Countries. The report revisits the recommenda-tions of The Growth Report, released in May 2008, prior to the unfolding of the fi nancial crisis. It fi nds that the crisis was not a failure of market-oriented systems, and that an outward-looking strategy remains broadly valid. This strategy, however, may not be as rewarding as it was in the years before the crisis, as the world economy that emerges from the up-heaval may be marked by slower growth in trade, costlier capital, and a more inhibited American consumer.
ISBN 978-0-8213-8165-6
SKU 18165