Post-COVID Transportation Planning
28
Post-COVID Transportation Planning March 18, 2021 Regional Economic Models, Inc. Ryan Saul, Associate David Casazza, Business Development Representative Naveen Kammar, Economic Analyst
Transcript of Post-COVID Transportation Planning

Post-COVID Transportation Planning
March 18, 2021
Regional Economic Models, Inc.
Ryan Saul, Associate
David Casazza, Business Development Representative
Naveen Kammar, Economic Analyst

Overview
• COVID-19’s Impacts on Transportation and Long-Range Planning
• The New Normal
• About REMI and TranSight
• Model Demonstration
• Q&A

What is a Long-Range Plan?
The primary purpose of a Long-Range Transportation Plan (LRTP) is to provide strategic direction for the development of the state and/or regional transportation system.
• Provide planning framework to achieve objectives
• Coordinate investments over a long-range period
• Focus funding resources on the highest priority and highest impact assets
• Understand demographic trends and shifts
Source: REMI TranSight modeling applications

Challenges Faced by DOTs and MPOs
• Health Crisis• Logistical response to need for medical supplies
• Crucial to vaccine distribution
• Economic Crisis• Continued flow of workers, goods and services within regions
and between regions critical during economic crises
• Transportation ensures that communities can access needed goods and services
• Transportation agencies must still provide these services while facing labor, supply, and funding challenges

Cities, COVID, Mobility
• The pandemic may shift perceptions of how cities should serve its residents
• Less centralized as previously downtown workers have the option to work from home
• Cities and towns are:
• Repurposing roadways for bus, bike, and pedestrian use
• Sales of children’s and adult leisure bicycles have increased by 56% and 121% from March 2019, respectively
• Boston is making protected bike lanes permanent and expanding bus lanes in the absence of normal car traffic
• Allowing businesses (restaurants) to repurpose outside space (car parking, sidewalks) for extra seating
• Waltham, MA Closed down Moody Street to car traffic supports the small businesses and restaurants that, otherwise, would not be open for business

Business Travel
https://bfi.uchicago.edu/key-economic-facts-about-covid-19/#post-pandemic-travel
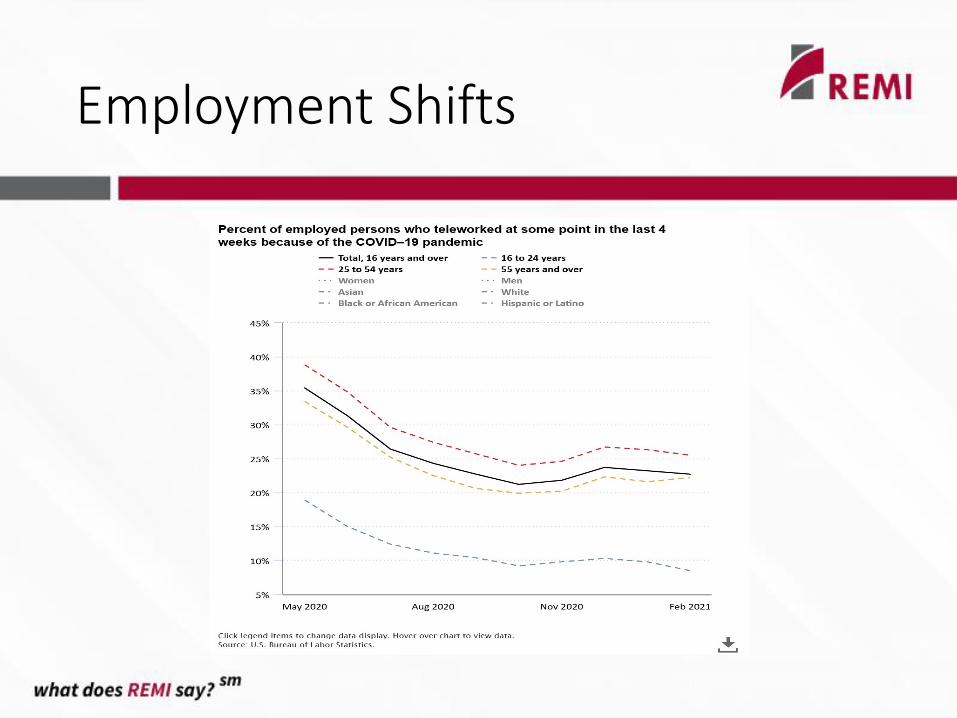
Employment Shifts

Traveler Confidence
The National Academies of Sciences, Engineering, and Medicine

Transit Ridership
The National Academies of Sciences, Engineering, and Medicine

Commercial Trends
The National Academies of Sciences, Engineering, and Medicine

COVID Effects on Total Trips
Bureau of Transportation Statistics
Bureau of Transportation Statistics

COVID Effects on Commercial Flights
Bureau of Transportation Statistics

COVID Effects on Commercial Aviation Employment
Bureau of Transportation Statistics

COVID Effects on Transit and Ground transportation Employment
Bureau of Transportation Statistics

COVID Effects on Public Transit
Bureau of Transportation Statistics

Financial Impacts
• Reduced travel and ridership has meant reduced revenues
• Reduced budgets and capital plans
• Delay or postponement of projects due to COVID-19
• Increasing gas taxes

American Rescue Plan and Transportation
We want these decisions to be driven as much as possible from the ground up rather than coming from Washington… A lot of our transit agencies took a gut punch in terms of the ability to provide service. They’ve had to look at cutting routes or laying off employees because their revenue collapsed last year. This rescue plan has much-needed dollars to shore up those transit agencies.” –U.S. Secretary of Transportation Pete Buttigieg
• $8 billion for airports
• $6.4 billion for primary, $100 million non-primary, $800 million airport concessions
• $3 billion for airport employee payroll
• $1.5 billion to Amtrak, with $820 million to Northeast Corridor
• Additional $329 million to states to avoid and offset Amtrak payments
• $30 billion for payroll expenses, operating costs, administrative leave
• $26 billion to urban transit areas

Biden Infrastructure Bill
President Biden’s “Build Back Better Plan”: $2 Trillion
• Provide every American city with 100,000 or more residents with public transportation options by 2030
• High-quality, zero-emissions systems
• Light rail networks, improving existing bus & transit lines
• Providing access to public transportation in areas that have never had access before – 45% of Americans
https://infrastructurereportcard.org/

The New Normal
• What is the new normal?
• Planning in uncertainty
• Alternatives and scenarios
• Accounting for different possible outcomes
• Anticipating disruptions and responses
• Improving resiliency: network and financing
“It’s too soon to know for sure, but I think it’s safe to say that our old patterns of life… our 9 to 5, Monday through Friday commuting patterns are not going to be exactly the same,” U.S. Secretary of Transportation Pete Buttigieg

Regional Economic Models, Inc. (REMI) was founded in 1980 on a transformative idea:
government decision-makers should test the economic effects of their policies
before they’re implemented. We are the nation’s leader in dynamic local, state and national
policy modeling. Our clients use REMI models to perform rigorous economic analysis that
critically influences local, state and national policies.
OUR CLIENTS:
AECOM • Michigan Department of Transportation • Cambridge Systematics, Inc.
Illinois Department of Transportation • Atlanta Regional Commission (ARC)
Houston-Galveston Area Council (H-GAC) • Southern California Association of Governments (SCAG)
New York State Department of Transportation • United States Army Corps of Engineers Great Lakes District
About REMI

What is TranSight
TranSight is the premier software solution for comprehensive evaluations of the total economic effects of transportation policy.
Decision makers depend on TranSight to demonstrate the economic contributions of transportation investments.
TranSight is also constructed with extensive data on:
→ Income → Employment → Demographics → Output

Understanding Your Needs
TranSight depicts the effects of transportation improvementson employment and economic development.
Our users rely on TranSight to validate their:
• Long-range Planning
• Project Prioritization
• Economic Impact Analysis
• Transportation Financing
• TIP and STIP Planning

TranSight Applications
California: Southern California Association of Governments employment and demographic analysis
Arizona: Interstate 11 environmental and economic impact analysis
Louisiana: Louisiana Highway 1 (LA1) economic vitality analysis
Illinois: O’Hare Intl. Airport expansion analysis
North Dakota: Upper Great Plains Transportation Institute impact analysis
New York: Amtrak’sGateway Program
Michigan: Five year transportation plan

Model Methodology
Input-Output
General Equilibrium
Econometrics
Economic Geography
Integrated REMI economic
modelling approach
REMI’s 35-year history of rigorous academic research and software development has led to the development of the
industry standard in macroeconomic research methodology:

Static vs. Dynamic Analysis
• Construction spending• O&M spending
• Construction spending• O&M spending• Travel time savings• Emissions savings• Safety improvements• Population changes• Fuel expenditures• Non-fuel VOCs• Network speed improvements• Access to labor• Access to intermediate inputs
FHWA: TranSight is among the “best equipped to estimate productivity impacts”*
*https://ops.fhwa.dot.gov/publications/fhwahop15034/ch5.htm
Static Dynamic

Model Demonstration
• Increase in commuting costs• Lack of ridership, decreased revenues
• Reduction in transportation costs• More work from home• Less commuting and congestion• More efficient network

Thank you forattending!
CONTACT USEmail: [email protected]
Phone: 413-549-1169
[email protected]@remi.com