POSITIVE DISRUPTION
62
POSITIVE DISRUPTION BY MARSHALL ABRAMCZYK, MARTHA CAMPBELL, AMAN CHITKARA, MIRANDA DIAWARA, AILEEN LERCH, JAMES NEWCOMB R O C K Y MO U N T A I N I N S T I T U T E LIMITING GLOBAL TEMPERATURE RISE TO WELL BELOW 2 Cº
Transcript of POSITIVE DISRUPTION

POSITIVE DISRUPTION BY MARSHALL ABRAMCZYK, MARTHA CAMPBELL, AMAN CHITKARA, MIRANDA DIAWARA, AILEEN LERCH, JAMES NEWCOMB
ROCKY MOUNTAIN
INSTIT UTE
LIMITING GLOBAL TEMPERATURE RISE TO WELL BELOW 2 Cº

AUTHORS & ACKNOWLEDGMENTS
ACKNOWLEDGMENTS The authors acknowledge Thomas Dinwoodie, a member of RMI’s Board of Trustees, whose original idea, generous support, and valuable insights made this report possible. The authors thank Lori Siegel, Drew Jones, and the rest of the Climate Interactive team for their insights and help in translating RMI’s emissions scenarios into temperature and concentration outcomes using the C-ROADS simulator. The authors thank the following individuals and organizations for offering their insights and perspectives on this work. Guillaume Bazouin, BONE Structure Mary Cameron, Stanford University Paul Denholm, National Renewable Energy Laboratory Rupert Edwards, Forest Trends Alex Hillbrand, Natural Resources Defense Council Rick Hollander, SLM Partners Mark Jacobson, Stanford University Jules Kortenhorst, Rocky Mountain Institute Michael Lazarus, Stockholm Environment Institute Amory Lovins, Rocky Mountain Institute Treiu Mai, National Renewable Energy Laboratory Jim Mason, All Power Labs Emily McGlynn, The Earth Partners LP Carlota Perez, Researcher and International Consultant Ben Sigrin, National Renewable Energy Laboratory Charlotte Streck, Climate Focus Jon Walker, Lyft
AUTHORS Marshall Abramczyk, Martha Campbell, Aman Chitkara, Mia Diawara, Aileen Lerch, James Newcomb *Authors listed alphabetically. All authors are from Rocky Mountain Institute unless otherwise noted.
CONTACTS James Newcomb, [email protected] Aman Chitkara, [email protected] Martha Campbell, [email protected]
SUGGESTED CITATION Abramczyk, Marshall, Martha Campbell, Aman Chitkara, Mia Diawara, Aileen Lerch, and James Newcomb. Positive Disruption: Limiting Global Temperature Rise to Well Below 2 Cº. Rocky Mountain Institute, 2017. http://www.rmi.org/insights/reports/positive_disruption_limiting_global_temperature_rise
ABOUT ROCKY MOUNTAIN INSTITUTE Rocky Mountain Institute (RMI)—an independent nonprofit founded in 1982—transforms global energy use to create a clean, prosperous, and secure low-carbon future. It engages businesses, communities, institutions, and entrepreneurs to accelerate the adoption of market-based solutions that cost-effectively shift from fossil fuels to efficiency and renewables. RMI has offices in Basalt and Boulder, Colorado; New York City; Washington, D.C.; and Beijing.
POSITIVE DISRUPTION: LIMITING GLOBAL TEMERATURE RISE TO WELL BELOW 2 C° 2
CREATING A CLEAN, PROSPEROUS, AND SECURE LOW-CARBON FUTURE
RO
CKY MOUNTAIN
INSTIT UTE
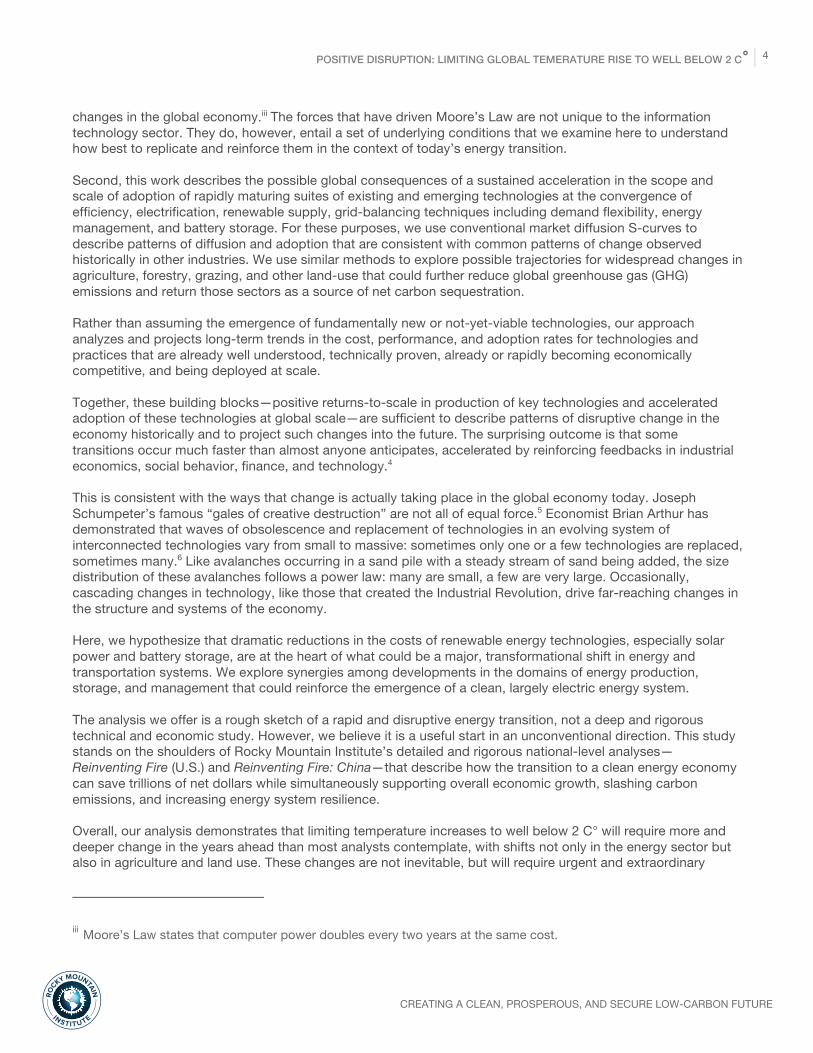
TABLE OF CONTENTS
Introduction ............................................................................................................................... 3
Developing a new vision: approach and methodology ......................................................... 6 Energy ................................................................................................................................................... 7
Energy transitions: the mainstream view ........................................................................................... 8 Key factors in rapid energy transitions ............................................................................................ 11
Agriculture, Forestry and Other Land Use .......................................................................................... 18 S-curve transitions in agriculture have occurred regularly in history .............................................. 18 Ecosystem services and the components of ecosystem value streams ........................................ 20
Analysis Framework ............................................................................................................................ 23
Business-as-usual: a baseline emissions scenario ............................................................. 24 Approach ............................................................................................................................................ 24 Climate Implications ............................................................................................................................ 26
Transforming the energy economy ....................................................................................... 27 Demand—Diverse technologies can reduce and electrify energy demand ........................................ 27 Supply—Market diffusion dynamics will continue to lead to a rapid uptake of renewables .............. 29 Energy System Scenarios ................................................................................................................... 31
Transforming agriculture and land-use practices ............................................................... 34 Demand Trends .................................................................................................................................. 34
Growth in Food Consumption ......................................................................................................... 34 Growth in Meat Consumption ......................................................................................................... 34 Growth in Sustainable Forestry and Organics Demand .................................................................. 35
Supply ................................................................................................................................................. 35 New land management techniques ................................................................................................. 35 Trends in sustainable land management practices ......................................................................... 36
Requirements to accelerate a land management transformation ....................................................... 37 Demand ........................................................................................................................................... 37 Supply ............................................................................................................................................. 37
Agriculture and Land Use Scenarios .................................................................................................. 39
Pathway to a sustainable future ............................................................................................ 42 A Call to Action ................................................................................................................................... 44 The Need for Urgent Action ................................................................................................................ 47
Appendix .................................................................................................................................. 48
Endnotes .................................................................................................................................. 51

POSITIVE DISRUPTION: LIMITING GLOBAL TEMERATURE RISE TO WELL BELOW 2 C° 3
CREATING A CLEAN, PROSPEROUS, AND SECURE LOW-CARBON FUTURE
RO
CKY MOUNTAIN
INSTIT UTE
INTRODUCTION The news about climate change is increasingly bleak. Already, deep and consequential changes in the earth’s systems, including the oceans, forests, and atmosphere, are occurring as a consequence of fossil fuel emissions. Looking ahead, scientists warn that the window of opportunity is rapidly closing for taking actions that could keep global average temperature increase to less than 2 Celsius degrees (C°) above the preindustrial era.i According to the latest UN Emissions Gap Report, even if all signatories met the emissions reductions pledges in the Paris Agreement, the world would still be heading for a temperature rise of 2.9–3.4 C° by the end of this century.1 Scientists concur that consequences of global average temperature rise greater than 2 C° are potentially very grave. An analysis in 2016 indicates that even warming of around 2 C° could trigger feedbacks that would cause multi-meter sea level rise within as little as 50–100 years, as well as very significant increases in extreme weather events and dramatic changes in the ocean currents and circulation patterns around which human civilization has evolved.2 In such a scenario, human societies and the global economy could face forces of disruption so great that dealing with the root causes of climate change would become impossible.ii President Trump’s decision to pull the United States out of the Paris Climate Agreement further undermines global efforts to reduce global emissions and meet the climate goals espoused in the agreement.3 This shift in policy stance not only lends uncertainty to the U.S. greenhouse gas emissions trajectory, but also may jeopardize international governance structures built to address the threat of global climate change. Today, many experts doubt that energy systems can decarbonize fast enough to prevent this scenario. But this belief is both dangerous and wrong—dangerous because despair undercuts the will to act; and wrong because this view does not take into account events already taking place that indicate a possible pathway to a rapid energy transition. This paper describes scenarios for transitions in energy, agriculture, and land use that together are sufficient to limit global average temperature increase to 1.5–2 C°. Unlike conventional modeling approaches, these scenarios entail patterns of disruption, innovation, and nonlinear change, harnessed at global scale, that mirror the episodic and disruptive ways that individual industries and the economy as a whole have changed historically. The great transitions in the economy, such as the Industrial Revolution, have been driven by such self-reinforcing patterns of change. The signs are all around us.
The Makings of Rapid Transitions The scenarios developed here entail assumptions about the pace of the possible transitions that are radically different than those used in most conventional approaches to energy and climate systems modeling. First, rather than long and slow transitions constrained by slow capital turnover, our scenarios describe transitions in which the pace of technological improvement gains momentum as it moves forward, that disrupt and revolutionize today’s conventional business models, and that diffuse rapidly throughout the global economy. Under the right conditions, positive feedbacks in the economy drive sustained, exponential improvements in technologies and rapid diffusion of new products and services, just as Moore’s Law has driven far-reaching i While most people are familiar with the expression “degrees Celsius” (°C), that expression signifies an absolute temperature that represents the coolness or warmth of something. The expression “Celsius degrees” (C°) refers to an interval between two measured temperatures, which in this paper denotes temperature rise above preindustrial levels. ii James Hansen and colleagues conclude that: “Social disruption and economic consequences of such large sea level rise, and the attendant increases in storms and climate extremes, could be devastating. It is not difficult to imagine that conflicts arising from forced migrations and economic collapse might make the planet ungovernable, threatening the fabric of civilization.” See Hansen, "Ice melt, sea level rise and superstorms.”
POSITIVE DISRUPTION: LIMITING GLOBAL TEMERATURE RISE TO WELL BELOW 2 C° 4
CREATING A CLEAN, PROSPEROUS, AND SECURE LOW-CARBON FUTURE
RO
CKY MOUNTAIN
INSTIT UTE
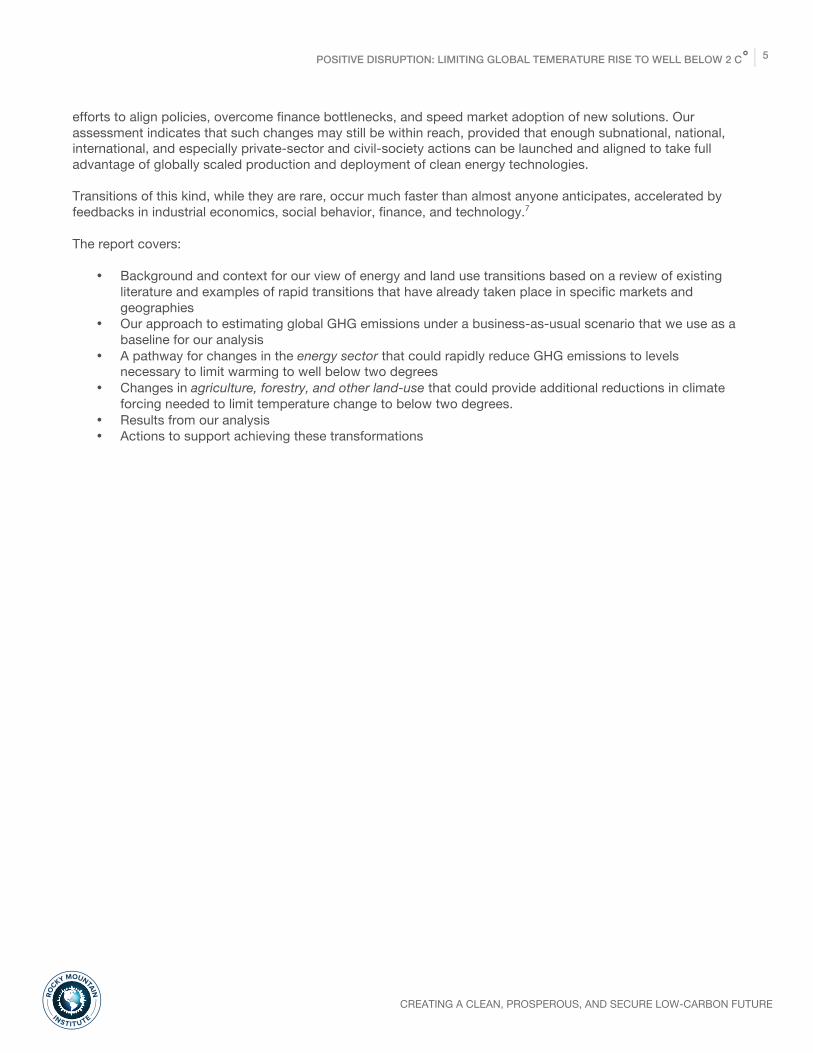
changes in the global economy.iii The forces that have driven Moore’s Law are not unique to the information technology sector. They do, however, entail a set of underlying conditions that we examine here to understand how best to replicate and reinforce them in the context of today’s energy transition. Second, this work describes the possible global consequences of a sustained acceleration in the scope and scale of adoption of rapidly maturing suites of existing and emerging technologies at the convergence of efficiency, electrification, renewable supply, grid-balancing techniques including demand flexibility, energy management, and battery storage. For these purposes, we use conventional market diffusion S-curves to describe patterns of diffusion and adoption that are consistent with common patterns of change observed historically in other industries. We use similar methods to explore possible trajectories for widespread changes in agriculture, forestry, grazing, and other land-use that could further reduce global greenhouse gas (GHG) emissions and return those sectors as a source of net carbon sequestration. Rather than assuming the emergence of fundamentally new or not-yet-viable technologies, our approach analyzes and projects long-term trends in the cost, performance, and adoption rates for technologies and practices that are already well understood, technically proven, already or rapidly becoming economically competitive, and being deployed at scale. Together, these building blocks—positive returns-to-scale in production of key technologies and accelerated adoption of these technologies at global scale—are sufficient to describe patterns of disruptive change in the economy historically and to project such changes into the future. The surprising outcome is that some transitions occur much faster than almost anyone anticipates, accelerated by reinforcing feedbacks in industrial economics, social behavior, finance, and technology.4 This is consistent with the ways that change is actually taking place in the global economy today. Joseph Schumpeter’s famous “gales of creative destruction” are not all of equal force.5 Economist Brian Arthur has demonstrated that waves of obsolescence and replacement of technologies in an evolving system of interconnected technologies vary from small to massive: sometimes only one or a few technologies are replaced, sometimes many.6 Like avalanches occurring in a sand pile with a steady stream of sand being added, the size distribution of these avalanches follows a power law: many are small, a few are very large. Occasionally, cascading changes in technology, like those that created the Industrial Revolution, drive far-reaching changes in the structure and systems of the economy. Here, we hypothesize that dramatic reductions in the costs of renewable energy technologies, especially solar power and battery storage, are at the heart of what could be a major, transformational shift in energy and transportation systems. We explore synergies among developments in the domains of energy production, storage, and management that could reinforce the emergence of a clean, largely electric energy system. The analysis we offer is a rough sketch of a rapid and disruptive energy transition, not a deep and rigorous technical and economic study. However, we believe it is a useful start in an unconventional direction. This study stands on the shoulders of Rocky Mountain Institute’s detailed and rigorous national-level analyses—Reinventing Fire (U.S.) and Reinventing Fire: China—that describe how the transition to a clean energy economy can save trillions of net dollars while simultaneously supporting overall economic growth, slashing carbon emissions, and increasing energy system resilience. Overall, our analysis demonstrates that limiting temperature increases to well below 2 C° will require more and deeper change in the years ahead than most analysts contemplate, with shifts not only in the energy sector but also in agriculture and land use. These changes are not inevitable, but will require urgent and extraordinary
iii Moore’s Law states that computer power doubles every two years at the same cost.
POSITIVE DISRUPTION: LIMITING GLOBAL TEMERATURE RISE TO WELL BELOW 2 C° 5
CREATING A CLEAN, PROSPEROUS, AND SECURE LOW-CARBON FUTURE
RO
CKY MOUNTAIN
INSTIT UTE
efforts to align policies, overcome finance bottlenecks, and speed market adoption of new solutions. Our assessment indicates that such changes may still be within reach, provided that enough subnational, national, international, and especially private-sector and civil-society actions can be launched and aligned to take full advantage of globally scaled production and deployment of clean energy technologies. Transitions of this kind, while they are rare, occur much faster than almost anyone anticipates, accelerated by feedbacks in industrial economics, social behavior, finance, and technology.7 The report covers:
• Background and context for our view of energy and land use transitions based on a review of existing literature and examples of rapid transitions that have already taken place in specific markets and geographies
• Our approach to estimating global GHG emissions under a business-as-usual scenario that we use as a baseline for our analysis
• A pathway for changes in the energy sector that could rapidly reduce GHG emissions to levels necessary to limit warming to well below two degrees
• Changes in agriculture, forestry, and other land-use that could provide additional reductions in climate forcing needed to limit temperature change to below two degrees.
• Results from our analysis • Actions to support achieving these transformations
POSITIVE DISRUPTION: LIMITING GLOBAL TEMERATURE RISE TO WELL BELOW 2 C° 6
CREATING A CLEAN, PROSPEROUS, AND SECURE LOW-CARBON FUTURE
RO
CKY MOUNTAIN
INSTIT UTE
DEVELOPING A NEW VISION: APPROACH AND METHODOLOGY Thomas Friedman describes our time as an age of accelerations. Accelerations include several defining characteristics according to Friedman, including cascading technological diffusion resulting in disruptive market transformations. In this report we outline a set of phenomena occurring in the energy and land-use sectors that provide context for the broader market transformations necessary to keep global average temperatures below 2 C°.
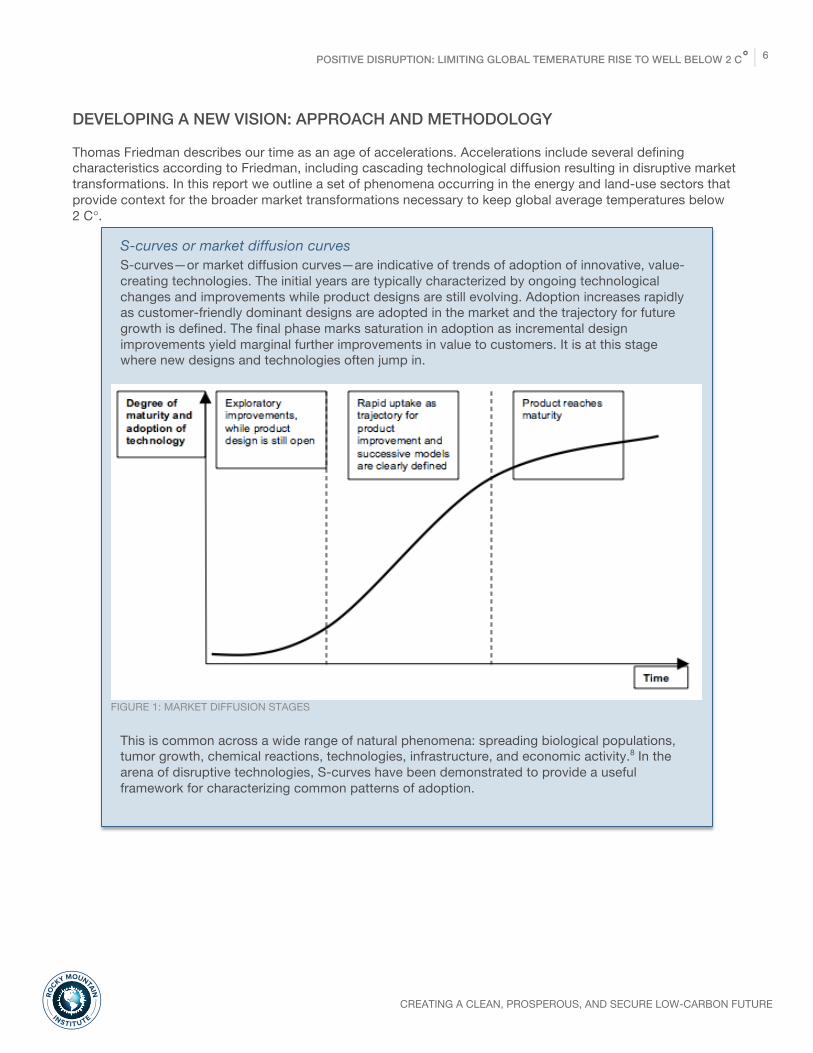
S-curves or market diffusion curves S-curves—or market diffusion curves—are indicative of trends of adoption of innovative, value-creating technologies. The initial years are typically characterized by ongoing technological changes and improvements while product designs are still evolving. Adoption increases rapidly as customer-friendly dominant designs are adopted in the market and the trajectory for future growth is defined. The final phase marks saturation in adoption as incremental design improvements yield marginal further improvements in value to customers. It is at this stage where new designs and technologies often jump in.
FIGURE 1: MARKET DIFFUSION STAGES
This is common across a wide range of natural phenomena: spreading biological populations, tumor growth, chemical reactions, technologies, infrastructure, and economic activity.8 In the arena of disruptive technologies, S-curves have been demonstrated to provide a useful framework for characterizing common patterns of adoption.

POSITIVE DISRUPTION: LIMITING GLOBAL TEMERATURE RISE TO WELL BELOW 2 C° 7
CREATING A CLEAN, PROSPEROUS, AND SECURE LOW-CARBON FUTURE
RO
CKY MOUNTAIN
INSTIT UTE
FIGURE 2: PAST TRENDS IN HOUSEHOLD ADOPTION OF TECHNOLOGY One such example is that of the automobile. In the early 1900s, the providers of horse and buggy equipment and services did not anticipate the quick rise of the automobile. But Henry Ford’s Model T was able to compete on price and performance, reducing cost by over 60 percent in 13 years while providing reliable, clean, and faster modes of transportation, and inducing complementary innovations in several related industries, including finance. Car-owning households soared from 8 percent in 1918 to 60 percent by 1928, with three-fourths of purchasers using car loans, an innovation pioneered by GM and other companies to overcome the high initial cost of car ownership. For comparison, the price of PV modules recently fell 80 percent in five years (vs. the Model T’s 62 percent in 13 years), and about three-fourths of U.S. rooftop PV installations are innovatively financed. Over time, the changes initiated by the advent of the automobile had sweeping consequences across many sectors of the economy. This is similar to what happened with the television. New tools for communication and information distribution led to radical new ways of production and advertising. In these and other examples, entirely new products and services followed in the wake of an initial “big-bang” innovation, spurring more activity and innovation farther down the line. In energy as well as in many other fields, experts often underestimate the speed of transition. For example, in 1980, AT&T commissioned McKinsey & Company to predict cell phone usage by 2000 for the United States market. The consulting group argued that cellular telephony would be a niche market with about 900,000 subscribers. In fact, McKinsey’s estimate was less than 1 percent of the actual 2000 figure: 109 million. Today the planet has more cell phones than people.
Energy Our approach to understanding pathways for rapid transformation of the energy system is based on understanding the variables necessary for rapid market diffusion of transformational technologies, combined with an analysis of historical patterns of change in energy and other sectors. This informs our forward-looking perspective on the pace and scope of technological change in today’s global economy.
POSITIVE DISRUPTION: LIMITING GLOBAL TEMERATURE RISE TO WELL BELOW 2 C° 8
CREATING A CLEAN, PROSPEROUS, AND SECURE LOW-CARBON FUTURE
RO
CKY MOUNTAIN
INSTIT UTE
In this section, we will:
• Review the mainstream view of energy transitions • Assess empirical evidence of rapid energy transitions that contradicts the mainstream view • Describe the key factors that characterize fast transitions in energy technology and systems
Energy transitions: the mainstream view The mainstream view of energy transitions, reflected widely in academic and policy literature and in energy industry analyses, is that major shifts in the energy system require decades. The standard argument is that even when new technologies offer significant performance and cost advantages, the pace of change is constrained by such forces as 1) the vast scale and complexity of major energy transitions, 2) the slow rate of capital turnover, 3) the resistance caused by “lock in” or “path dependency” of existing energy systems, and 4) the active resistance of incumbent actors working to contain or subvert the transition. Such studies naturally shape perceptions that can make incumbents’ slow-change prophecies self-fulfilling. According to Professor Benjamin Sovacool, “The idea that energy transitions will take a substantial amount of time is embedded in no less than four major academic theories or approaches—each with their own different foci, units of analysis, and concepts.”9 Indeed, dozens of researchers looking back on the history of energy transitions have come to similar conclusions about the prospects for future energy transitions.10 Gert Jan Kramer and Martin Haigh, for example, argue in a paper published in Nature in 2009 that physical limits on the rate at which new energy technologies can be deployed constrain the speed of a major shift in global energy supply.11 “Unlike with consumer goods,” they assert, “there are robust empirical ‘laws’ that limit the build rate of new and existing energy technologies and thereby the potential to deliver much of the hoped for transition [to renewables] by 2050.” Based on historical data for oil, nuclear, natural gas, biofuels, solar, and wind, Kramer and Haigh observe that new energy technologies typically go through several decades of exponential growth before they are widely available. After reaching “materiality,” defined as delivering about 1 percent of the world’s energy mix, the growth rates for these technologies become linear until the technology captures its final market share. The authors have based their conclusions on two primary factors: 1) the pace of scaling-up new technologies is largely based on the slow pace of learning and deployment of novel technologies, and an equally slow ramp-up of production capabilities, and 2) turnover of existing capital in energy systems is fairly slow. Accordingly, the authors bleakly conclude that, “The best we could reasonably hope to achieve for new energy deployment” would be a scenario in which two-thirds of world energy supply still comes from fossil fuels in 2050 and CO2 concentrations stabilize at around 550 ppm.12 Noted energy expert Vaclav Smil shares this opinion, arguing that it will take “50 to 60 years for a widespread shift from one dominant fuel to another”13—an estimate based on previous transitions, including that from wood to coal in the latter half of the nineteenth century. The facts on the ground, however, are already contradicting these forecasts. The growth in global renewable energy supply has already crossed the supposed 1 percent threshold and is continuing to grow at exponential rates with steeply falling costs. Modern renewables (excluding hydropower) contribute nearly 7.9 percent to the global electricity mix and roughly 2.4 percent of global final energy consumption.14 The chorus of doubt from mainstream analysts about the possibility of a rapid energy transition to low-carbon resources could be a force in itself to undermine the determination of policymakers, businesses, and consumers to take actions to reduce their emissions. But the reality is that the entrepreneurial force behind the energy transition already underway around the world is likely to defy the naysayers, just as the pace of renewable

POSITIVE DISRUPTION: LIMITING GLOBAL TEMERATURE RISE TO WELL BELOW 2 C° 9
CREATING A CLEAN, PROSPEROUS, AND SECURE LOW-CARBON FUTURE
RO
CKY MOUNTAIN
INSTIT UTE
energy development has repeatedly eclipsed even the most optimistic mainstream forecasts in recent years (see Figure 3). Increasingly, renewable energy is emerging as the mainstay of many countries’ energy supply. Currently, renewable energy contributes roughly 32 percent of total inland electricity consumption in Germany, up from 16 percent in 2010.15 For Austria, Denmark, and Spain, renewable energy share in electricity generation is at 70 percent, 51 percent, and 37 percent respectively. Wind power in Iowa has grown to 36 percent of that state’s electricity needs and is expected to grow even further in the coming years.16 In 2016, investments in renewable energy in the developed and the developing world were quite comparable. China led this trend with total investments of US$78.3 billion in 2016, which accounted for nearly 32 percent of the global total—an investment larger than any other country.17 In the first half of 2017, China installed more than 24 gigawatts of solar PV, adding more than 13 gigawatts in the month of June alone. India’s solar capacity has quadrupled in the past three years and is expected to double in 2017.18 India has redoubled its commitment to combat global climate change, improve energy security, and reduce local air pollution. It has also announced a transition to a highly electrified passenger mobility system that is estimated to save nearly 900 million tonnes of petrol and diesel and 1 gigatonne of CO2 between 2017 and 2030.19 Yet the argument that renewables will inevitably be constrained to linear growth still persists. There is mounting empirical evidence to demonstrate that under the right conditions, rapid transitions in energy technologies and systems can and are being achieved, at substantial scale, around the world (see text box: Evidence of rapid energy transitions).
FIGURE 3: FORECASTS HAVE CONSISTENTLY UNDERESTIMATED THE UPTAKE OF GLOBAL WIND AND SOLAR
Source: IEA WEO, BNEF (forecast from June 2015); slide inspired by Michael Liebreich’s 2016 BNEF Summit keynote
2000 2005 2010 2015 2020 2025 2030 2035 2040
Cum
ulat
ive
GW
Inst
alle
d
3,000
2,500
2,000
1,500
1,000
500
0
WIND
5X UPWARD REVISION SINCE 2000
2000 2005 2010 2015 2020 2025 2030 2035 2040
4,000
3,500
3,000
2,500
2,000
1,500
1,000
500
0
SOLAR
19X UPWARD REVISION SINCE 2000
WEO 2002
WEO 2004
WEO 2006
WEO 2008
WEO 2010
WEO 2012
WEO 2014
WEO 2015
WEO 2016
Actual
BNEF forecast
POSITIVE DISRUPTION: LIMITING GLOBAL TEMERATURE RISE TO WELL BELOW 2 C° 10
CREATING A CLEAN, PROSPEROUS, AND SECURE LOW-CARBON FUTURE
RO
CKY MOUNTAIN
INSTIT UTE
Why did the International Energy Agency’s capable analysts continually and dramatically underestimate actual wind and solar power growth? Partly because conventional forecasting models (historically rooted in the economics of land, minerals, and other scarce resources) assume diminishing returns and do not incorporate the market reality that as we build more renewables, they get cheaper, so we buy more, so they get cheaper. The resulting expanding returns to renewables’ scaling and learning reflect not resource depletion but the now-familiar economics of mass manufacturing and mass deployment, such as for consumer electronics.
Evidence of rapid energy transitions Contrary to the view that energy transitions are uniformly and unalterably slow, researchers have documented numerous rapid transitions in energy systems and end-use devices. Professor Benjamin Sovacool documented no fewer than ten quick energy transitions, including examples of transitions in both energy end-use technology and national-scale energy supply that, collectively, directly affected the lives of nearly one billion people.20 Examples of rapid energy transitions offered by Sovacool and others, include: ● Light emitting diode (LED) lighting (global). According to a research report from Goldman
Sachs, “The rapid evolution of LEDs in lighting marks one of the fastest technology shifts in human history.”21 LED prices have declined sharply in the last few years—over 80 percent between 2012 and 2016, kicking off a steep increase in sales and market share worldwide.22 Whereas LEDs claimed just 1 percent of the global lighting market as recently as 2010, they are projected to account for 95 percent of the market by 2025. Goldman Sachs projects that LEDs will account for 69 percent of light bulbs sold and over 60 percent of the installed global base by 2020. In each decade, white LEDs have become 30 times more efficient, 20 times brighter, and 10 times cheaper. Thus the speed of this transition is largely explained by the cost and performance advantages of LED lighting, which offer ultra-low lifecycle costs, longer product lifetimes, and reduced maintenance costs. The transition to LED lighting has also been accelerated by policies adopted by many major countries including, for several, the mandatory phase-out of inefficient incandescent lights.
● Improved cookstoves (China). From 1983 to 1998, China’s Ministry of Agriculture implemented a National Improved Stove Program (NISP) to support the development, manufacture, and deployment of improved cookstoves for people in rural provinces. The program used a distributed approach to encourage rural people to invent, distribute, and care for energy-efficient cookstoves locally through pilot programs in hundreds of local provinces. NISP boosted the penetration of improved stoves from less than one percent of the Chinese market in 1982 to more than 80 percent by 1998, reaching approximately 600 million people. As a result, Chinese energy use per capita declined in rural areas at an annual rate of 5.6 percent from 1983 to 1990.
● Liquefied petroleum gas stoves (Indonesia). Indonesia ran a large household energy program focusing on the conversion of kerosene stoves to liquefied petroleum gas (LPG) stoves to improve air quality. Under the so-called “LPG Megaproject,” the government offered households the opportunity to receive free LPG stove kits, while simultaneously reducing kerosene subsidies and building out LPG terminals and distribution hubs. In just three years, from 2007 to 2009, the number of LPG stoves in the country jumped from 3 to 43 million so that by the end of the period they served almost 65 million households or about 216 million people.
● Flex-fuel vehicles (Brazil). Brazil created its PróÁlcool program in 1975, in the aftermath of the first oil price shock, to substitute ethanol for gasoline in conventional vehicles. In 1981, just six years later, 90 percent of all new vehicles sold in Brazil could run on ethanol. Subsequently, in 2003, the government began incentivizing flex fuel vehicles, capable of running on any blend of ethanol, from 0–100 percent. Flex fuel vehicles first entered the
POSITIVE DISRUPTION: LIMITING GLOBAL TEMERATURE RISE TO WELL BELOW 2 C° 11
CREATING A CLEAN, PROSPEROUS, AND SECURE LOW-CARBON FUTURE
RO
CKY MOUNTAIN
INSTIT UTE
market in 2004, when they accounted for 17 percent of new car sales, but they rose to 90 percent of the market by 2009. Their complete fuel flexibility exerted salutary price discipline on providers of both ethanol and gasoline by eliminating captive customers and maximizing competition.
● Natural gas (Netherlands). Development of natural gas in the Netherlands proceeded rapidly following the discovery and development of the massive Groningen natural gas field in 1959. Natural gas served just 2 percent of the Netherlands primary energy in 1959, increasing to 5 percent by 1965 and 50 percent by 1971. The government decided in 1965 to abandon all coal mining in the Limburg province within a decade, doing away with 75,000 jobs and affecting more than 200,000 people. To speed this transition, the government implemented measures to subsidize new businesses, relocate government industries to areas hit hardest by mine closures, and offer common shares in ownership of the Groningen field.
While these examples span a wide range of circumstances and technologies, all demonstrate remarkably rapid energy transitions. In most of these cases, energy policies helped to set the direction for change and facilitated rapid scaling. The speed of the transition, however, ultimately depended on the capacity of industry to deploy workable, cost-effective solutions to meet market needs within diverse sociopolitical contexts.
Key factors in rapid energy transitions Importantly, the emerging future now looks different and is not centralized, large, and slow moving; it is decentralized, distributed, and rapidly changing, with small incremental capital assets, shorter deployment and payback periods, and competitors with fast-scaling new business models. Those who forecast the failure of efforts to arrest climate change tend to ignore four key factors: 1) the exponential improvement of core technologies; 2) S-curves in market diffusion of disruptive technologies; 3) cascading systemic effects from converging changes across technologies; and 4) the opportunity represented by new energy infrastructure still to be installed in developing countries. We note that while technology, business models, and global scaling of production are at the heart of this story, we do not believe that the transformative changes we hypothesize will happen on their own without the alignment and commitment of actors across the spectrum from customers to communities to nation states, including the assurance of free-functioning energy markets in market economies, and solving for lowest-cost energy solutions within planned economies. Accordingly, we identify key leverage points that may help to trigger exponential improvement in the cost and performance of low-carbon technologies.
Exponential improvements in technology Over the past five decades, Moore’s Law has described the sustained exponential improvement in the performance of microprocessor chips, whose processing power (roughly measured by the number of transistors on a chip) has doubled every two years or so with a cumulative gain of roughly a billion-fold since they were first introduced in the early 1970s, with extraordinary implications for the global economy.23 Moore’s Law is not a law of nature; it is the outcome of the concerted efforts of chipmakers to keep up with the ever-increasing demands of customers and product manufacturers. Mitchell Waldrop, writing in Nature, notes that, “Since the 1990s, the semiconductor industry has released a roadmap every two years to coordinate what its manufacturers and suppliers are doing to stay in step with [Moore’s Law]—a strategy sometimes called More Moore.”24 Is the kind of exponential technological progress demonstrated by the semiconductor industry a rare exception? Or is it something that we can learn from more generally as we think about the future of the energy sector and the economy more widely? To answer this question empirically, researchers at the Santa Fe Institute built a dataset of 62 different technologies to test hypotheses about how cost and performance of technologies improve over time and in

POSITIVE DISRUPTION: LIMITING GLOBAL TEMERATURE RISE TO WELL BELOW 2 C° 12
CREATING A CLEAN, PROSPEROUS, AND SECURE LOW-CARBON FUTURE
RO
CKY MOUNTAIN
INSTIT UTE
relation to cumulative production volumes. The conclusion: all the technologies studied—from information technologies to airplanes to beer production to gas pipelines—exhibited sustained exponential improvement, albeit at varying rates.25 This evidence refutes the diminishing returns assumptions built into most energy/climate economic models and into most energy and climate analysts’ mindsets. In fact, the Santa Fe Institute’s study found that the Moore’s Law relationship for microprocessors, doubling performance every two years, was better described as a relationship between performance and the cumulative production of microprocessors (Wright’s Law). If production increases exponentially, Moore’s Law and Wright’s Law are indistinguishable. But Wright’s Law, first proposed in 1936, is the most successful general formulation describing technological progress, and is the standard description used in experience-curve analysis that Boston Consulting Group and others have applied to hundreds of technologies. For our purposes, the key conclusion from the Santa Fe Institute’s research is that technological progress is forecastable.26 The core technologies at the heart of the current energy transition—solar PV, wind turbines, batteries, and electric vehicles—all have demonstrated the potential for sustained exponential growth in capacity and energy production in the years ahead, especially in the context of a coordinated global transition to clean energy. These products can be produced at vast scale for deployment and integration into energy systems around the world, especially in rapidly growing and ambitious societies such as India and China. While we cannot predict the specifics of the technology advances that might lie ahead for these technologies, we can look for the basic preconditions that have underpinned the sustained progress in microchip manufacturing to see how to replicate these conditions.
What do solar PV, LED bulbs, and batteries have in common with computer chips? The technologies at the heart of today’s clean energy transition, including solar PV, LED bulbs, and batteries are ones that, like microchips, have the prospect of sustained and rapid improvement in performance and cost. While we cannot predict the specifics of the technology advances that might lie ahead for these technologies, we can look for the basic preconditions that have underpinned the sustained progress in microchip manufacturing to see how these conditions might be replicated. Very large market potential. The remarkable history of Moore’s Law is not just a story of technological progress over time, but also one that describes the advance of technology in conjunction with exponentially increasing production volumes. Globally, production of semiconductor units has increased more than 26-fold from 1978 until today, with 2017 volumes exceeding one trillion units.27 The steady increase in demand for microprocessor chips is an aspect of the story that gets less attention, but it is this increase that has enabled the huge investments in research and development that have sustained the progress of chip manufacturers. The self-reinforcing cycle is one that has allowed manufacturers to invest massively in chip fabrication plants while still dropping prices, spurring further increases in demand.28 Where increasing production volumes drive lower cost, a so-called “learning rate” describes how fast costs are falling. This is typically measured as the average percentage decline in costs that occurs for every doubling of cumulative production. As Figure 5 illustrates, this trend, true for semiconductors, is also obvious for the critical renewables technologies.29 Solar PV module

POSITIVE DISRUPTION: LIMITING GLOBAL TEMERATURE RISE TO WELL BELOW 2 C° 13
CREATING A CLEAN, PROSPEROUS, AND SECURE LOW-CARBON FUTURE
RO
CKY MOUNTAIN
INSTIT UTE
costs have come down by roughly 22.5 percent every time the cumulative production doubles.iv For wind power, this number is between 10.5 percent and 18.6 percent,30 and for Li-ion batteries, the learning rate is emerging to be between 14 percent and 22 percent.31
FIGURE 4: SOLAR PRICES AS A FUNCTION OF CUMULATIVE PV SHIPMENTS32 Coordinated industry action to support scaling of production. By the early 1990s, sustaining the high-tech industry’s progress required a high degree of coordination among an increasingly complex network of materials suppliers and equipment makers. To address these challenges, U.S. manufacturers launched a technology road-mapping process in 1991, engaging hundreds of engineers from different companies to develop plans that could meet the industry’s needs. In 1998, this process evolved further into the International Technology Roadmap for Semiconductors, bringing together the efforts of hundreds of companies globally.33 Along the same lines, the U.S. Department of Energy’s SunShot Initiative aims to help the solar industry achieve similar progress through cooperative and coordinated action. Launched in 2011, this initiative set a goal to bring solar energy costs to parity with traditional sources of power generation by 2020. But SunShot exceeded its own targets by achieving 90 percent progress toward its 2020 utility-scale goals by November 2016. Buoyed by this success, SunShot has set even more ambitious goals, targeting roughly 50 percent further cost reduction between 2020 and 2030. For batteries and EV technologies, while systematic industry coordination has not yet emerged, Tesla’s 2014 decision to share intellectual property with other companies explicitly derived from similar types of considerations to those that inspired chip manufacturers to collaborate: the rewards from making the market grow faster exceed those from tightly protecting intellectual
iv Other estimates by Bloomberg New Energy Finance (BNEF) indicate that the learning rate for solar PV modules is closer to 26.5 percent. According to BNEF, global average PV module prices at the end of 2016 were around $0.41/W compared with $3.88/W in 2008. See Zindler, Sustainable Energy In America: Factbook 2017.
Aver
age
Mod
ule
Sale
s Pr
ice
(US$
201
6/W
P)
Cumulative PV Module Shipments (MW)
10-1 100 101 102 103 104 105 106 107
100
10
1
0.1
100
10
1
0.1
10-1 100 101 102 103 104 105 106 107
HISTORIC PRICE DATALR 22.5%
2011
12 / 2016
2012
ITRPV 2017
300 GWP
POSITIVE DISRUPTION: LIMITING GLOBAL TEMERATURE RISE TO WELL BELOW 2 C° 14
CREATING A CLEAN, PROSPEROUS, AND SECURE LOW-CARBON FUTURE
RO
CKY MOUNTAIN
INSTIT UTE
property. Tesla’s open-patent announcement stated: “We believe that Tesla, other companies making electric cars, and the world would all benefit from a common, rapidly-evolving technology platform.”34 The degree of coordination that might emerge among manufacturers in the key sectors focused on in our analysis is still unknown, but there are signals that recognition of the size of the prize will strengthen coordination and scaling in these industries. In India, manufacturers of electric vehicles, including automobiles and two- and three-wheelers, are taking steps to coordinate scaled production of common components to speed the scaling up of the industry there (including smart, swappable, modular batteries), with the ambition of achieving a fully electric passenger mobility sector as early as 2030.35 Battery production, a key part of the transition to a clean energy system, is showing all the signs of a Moore’s Law-like self-reinforcing pattern of rapid scaling and cost decline. Already in 2017, companies have announced plans for 10 new battery gigafactories, and Tesla is expected to announce another four gigafactories of its own soon.36 Overall, global battery-making capacity is projected to more than double by 2021, while average costs are projected to fall precipitously from $273 per kilowatt-hour in 2016 to below $100 by 2030.37 Diverse and deep science and technology opportunities. Chipmakers have been able to discover and exploit diverse opportunities to improve performance through advances in product engineering, materials science, and manufacturing technology. On the applications side, an important new class of chip-based machines, from mainframe computers to laptops to smartphones, has emerged about once per decade. From a technology perspective, experts see abundant opportunities for further advances in the performance of core clean energy technologies. For solar PV, for example, advances in materials science promise significant further improvements in module efficiency. And taking into consideration opportunities that have already been discovered but not yet deployed, new approaches to manufacturing and several-fold streamlining of the even larger, non-module systems costs can be expected to produce additional and larger cost reductions.
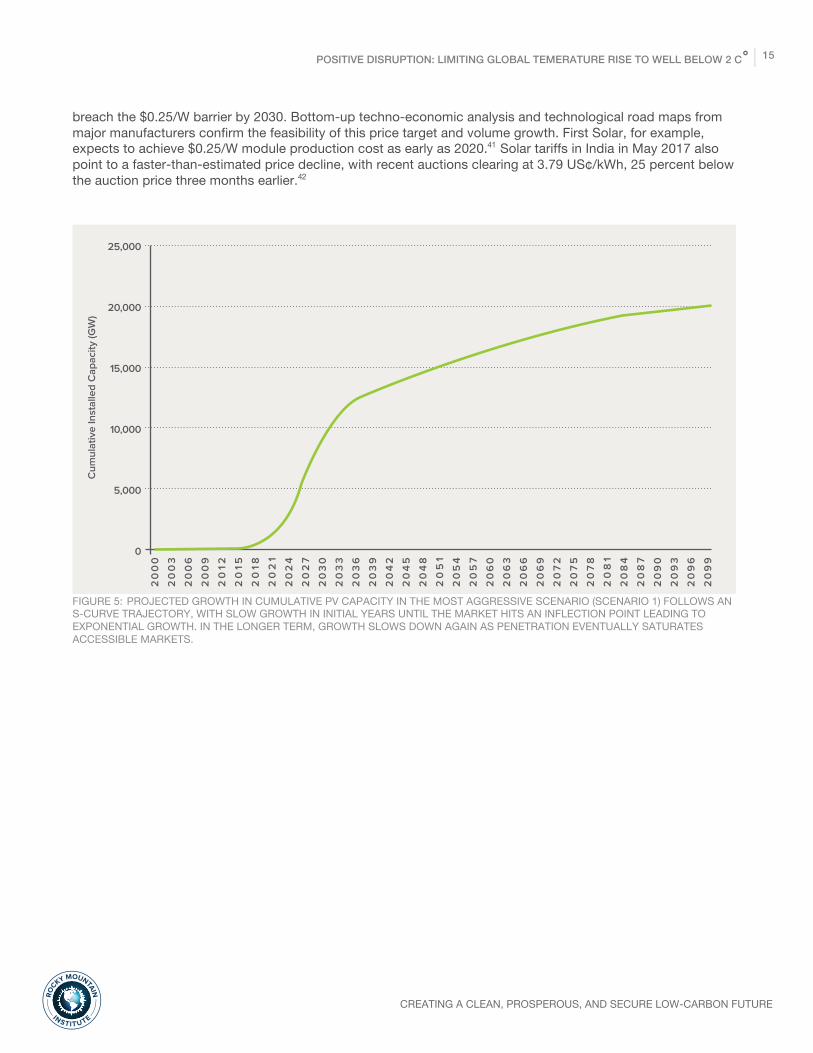
S-curves in market diffusion of disruptive technologies The core technologies that provide the backbone for the energy transition each share or potentially share the attributes described above. Solar PV manufacturing volumes could potentially sustain rapid exponential growth for decades as a result of the same self-reinforcing production-scaling dynamic that drove Moore’s Law. In our most aggressive scenario,v for example, annual solar PV installations increase from 73 GW in 2015 to 1,500 GW by 2059. This figure may seem astonishing, but in the context of a fundamental transition in the economy akin to the Industrial Revolution, it is not unreasonable to expect that it could be achieved. In 2007, IEA analysts predicted that by 2020, cumulative global PV capacity would be about 200 GW.38 But, with exponential growth, PV capacity exceeded that 2020 forecast by 2015, when it had already reached about 227 GW.39 A recent paper published in Science by a group of leading experts shows the potential for future price reduction for solar PV based on extrapolating historical learning curves.40 Superimposing this learning curve with expected cumulative PV installations in our most aggressive scenario (Scenario 1) suggests that solar module prices could v See appendix for details on our scenarios.
POSITIVE DISRUPTION: LIMITING GLOBAL TEMERATURE RISE TO WELL BELOW 2 C° 15
CREATING A CLEAN, PROSPEROUS, AND SECURE LOW-CARBON FUTURE
RO
CKY MOUNTAIN
INSTIT UTE
breach the $0.25/W barrier by 2030. Bottom-up techno-economic analysis and technological road maps from major manufacturers confirm the feasibility of this price target and volume growth. First Solar, for example, expects to achieve $0.25/W module production cost as early as 2020.41 Solar tariffs in India in May 2017 also point to a faster-than-estimated price decline, with recent auctions clearing at 3.79 US¢/kWh, 25 percent below the auction price three months earlier.42
FIGURE 5: PROJECTED GROWTH IN CUMULATIVE PV CAPACITY IN THE MOST AGGRESSIVE SCENARIO (SCENARIO 1) FOLLOWS AN S-CURVE TRAJECTORY, WITH SLOW GROWTH IN INITIAL YEARS UNTIL THE MARKET HITS AN INFLECTION POINT LEADING TO EXPONENTIAL GROWTH. IN THE LONGER TERM, GROWTH SLOWS DOWN AGAIN AS PENETRATION EVENTUALLY SATURATES ACCESSIBLE MARKETS.
20
00
20
03
20
06
20
09
20
122
015
20
182
02
12
02
42
02
72
03
02
03
32
03
62
03
92
04
22
04
52
04
82
05
12
05
42
05
72
06
02
06
32
06
62
06
92
07
22
07
52
07
82
08
12
08
42
08
72
09
02
09
32
09
62
09
9
Cum
ulat
ive
Inst
alle
d C
apac
ity (G
W)
25,000
20,000
15,000
10,000
5,000
0

POSITIVE DISRUPTION: LIMITING GLOBAL TEMERATURE RISE TO WELL BELOW 2 C° 16
CREATING A CLEAN, PROSPEROUS, AND SECURE LOW-CARBON FUTURE
RO
CKY MOUNTAIN
INSTIT UTE
FIGURE 6: CUMULATIVE INSTALLED PV CAPACITY AND ESTIMATED MODULE PRICE FOR MOST AGGRESSIVE SCENARIO (SCENARIO 1) Thierry Lepercq, head of research, technology, and innovation at the French company Engie SA, projects that the unsubsidized cost of solar electricity in the sunniest climates will fall from today’s less-than 3¢/kWh to 1¢/kWh by 2025. Lepercq believes, “Solar, battery storage, electrical and hydrogen vehicles, and connected devices are in a ‘J’ curve of upward growth potential.”43 He adds, “The promise of quasi-infinite and free energy is here.”
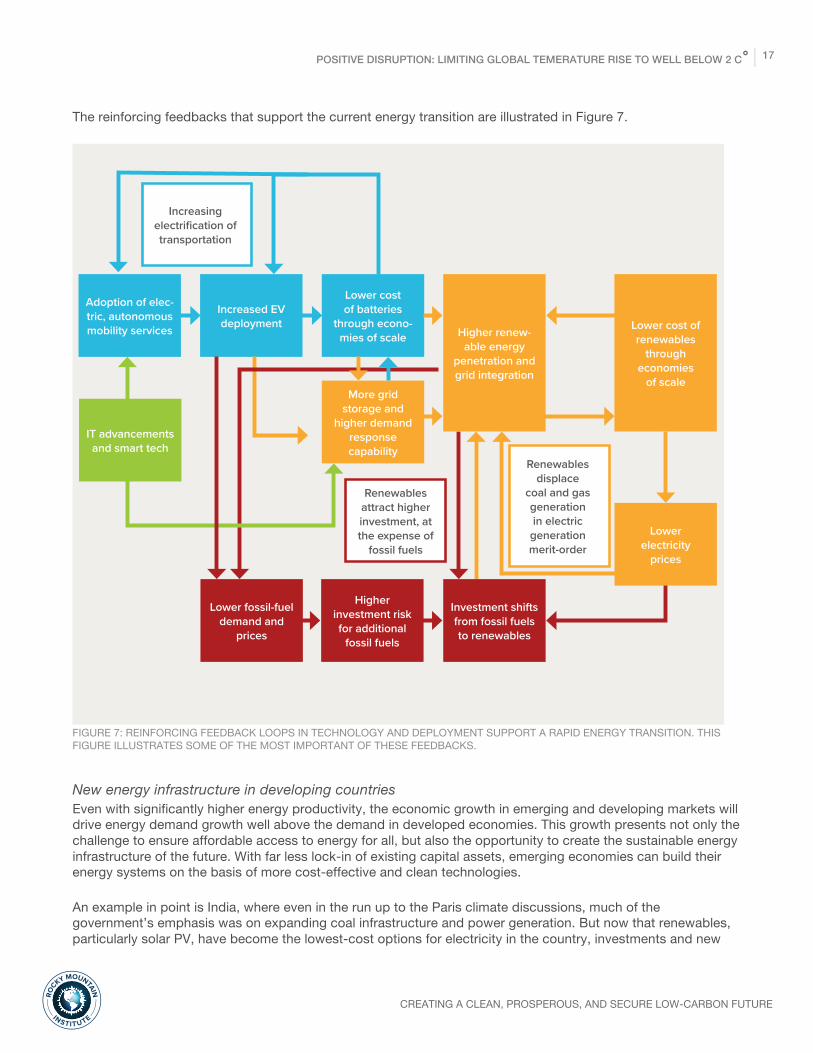
Cascading systemic effects from convergent changes in technology In the case of climate change, it’s not just new technologies, such as S-curve growth in the deployment of solar PV, that could profoundly change the energy system, but also the coming together of renewable energy, a revolution in mobility, and a transition to smart and efficient energy demand that together have the power to transform. For example, the falling cost of batteries simultaneously encourages faster electric vehicle deployment, increases renewable energy penetration on the grid, and allows greater flexibility in energy use. In turn, more electric vehicles mean cheaper batteries, implying distributed solar everywhere, faster coal and nuclear power displacement, and a distressed natural-gas industry. Improvements in the cost and performance of the information technologies in EVs also contribute to better functioning and faster deployment. These advances, and their integration, are further supported by improvements in the cost and performance of information technologies that improve the control and integration of devices. The compounding effects of simultaneous changes in multiple sectors of the economy are the drivers of economic and industrial revolutions.44 Advances in information technology, payment systems, and new business models will speed the transition to an all-electric, highly transactive energy system. Blockchain technology, with its potential to enable peer-to-peer transactions, could serve to integrate distributed energy and storage devices at high saturation levels based on unsubsidized market-based transactions.45
1.E-01 1.E+00 1.E+01 1.E+02 1.E+03 1.E+04 1.E+05
Sola
r Mod
ule
Pric
e ($
/W)
10.00
1.00
0.10
Cumuative Installed PV Capacity (GW)
$0.25/W ~ 11 TW in 2034
$0.5/W ~ 1 TW in 2021
POSITIVE DISRUPTION: LIMITING GLOBAL TEMERATURE RISE TO WELL BELOW 2 C° 17
CREATING A CLEAN, PROSPEROUS, AND SECURE LOW-CARBON FUTURE
RO
CKY MOUNTAIN
INSTIT UTE
The reinforcing feedbacks that support the current energy transition are illustrated in Figure 7.
FIGURE 7: REINFORCING FEEDBACK LOOPS IN TECHNOLOGY AND DEPLOYMENT SUPPORT A RAPID ENERGY TRANSITION. THIS FIGURE ILLUSTRATES SOME OF THE MOST IMPORTANT OF THESE FEEDBACKS.
New energy infrastructure in developing countries Even with significantly higher energy productivity, the economic growth in emerging and developing markets will drive energy demand growth well above the demand in developed economies. This growth presents not only the challenge to ensure affordable access to energy for all, but also the opportunity to create the sustainable energy infrastructure of the future. With far less lock-in of existing capital assets, emerging economies can build their energy systems on the basis of more cost-effective and clean technologies. An example in point is India, where even in the run up to the Paris climate discussions, much of the government’s emphasis was on expanding coal infrastructure and power generation. But now that renewables, particularly solar PV, have become the lowest-cost options for electricity in the country, investments and new
Lower fossil-fuel demand and
prices
Higher investment risk for additional
fossil fuels
Renewables attract higher investment, at the expense of
fossil fuels
Adoption of elec-tric, autonomous mobility services
Increased EV deployment
Lower cost of batteries
through econo-mies of scale
Increasing electrification of transportation
Lower electricity
prices
Renewables displace
coal and gas generation in electric
generation merit-order
Higher renew-able energy
penetration and grid integration
Lower cost of renewables
through economies
of scaleMore grid
storage and higher demand
response capability
Investment shifts from fossil fuels to renewables
IT advancements and smart tech
POSITIVE DISRUPTION: LIMITING GLOBAL TEMERATURE RISE TO WELL BELOW 2 C° 18
CREATING A CLEAN, PROSPEROUS, AND SECURE LOW-CARBON FUTURE
RO
CKY MOUNTAIN
INSTIT UTE
capacity additions are rapidly shifting in that direction. In 2016–17, India added 11.2 GW of renewable capacity—at par with thermal capacity addition46—and in 2016 for the first time, IEA found that electricity assets worldwide had won more investment than all fossil-fuel supplies did. Similarly, the Energy Transitions Commission has shown that energy consumption for new buildings can be reduced by two to six times, dramatically reducing the forecast for increased energy demand.47 In mobility, India recently released a blueprint for transformative change that would leapfrog the traditional development pathways in favor of shared, electric, and connected mobility services. This vision, developed with support from RMI, describes a fast-track transition to a cleaner, energy-secure, and more cost-effective future transportation system.48
Agriculture, Forestry and Other Land Use Our approach to understanding pathways for accelerated land use transitions builds off of the previous section’s discussion of market diffusion dynamics as they relate to the agriculture, forestry, and other land use sectors (AFOLU). This informs our forward-looking perspective on the pace and the ability to transform land use systems in order to address the climate crisis. In this section, we will:
● Identify historical examples of rapid agrarian market transformations ● Discuss a useful framework for thinking about ecosystems and the services they provide to go beyond
the traditional view of land productivity, which will be necessary to unlock new approaches to land management
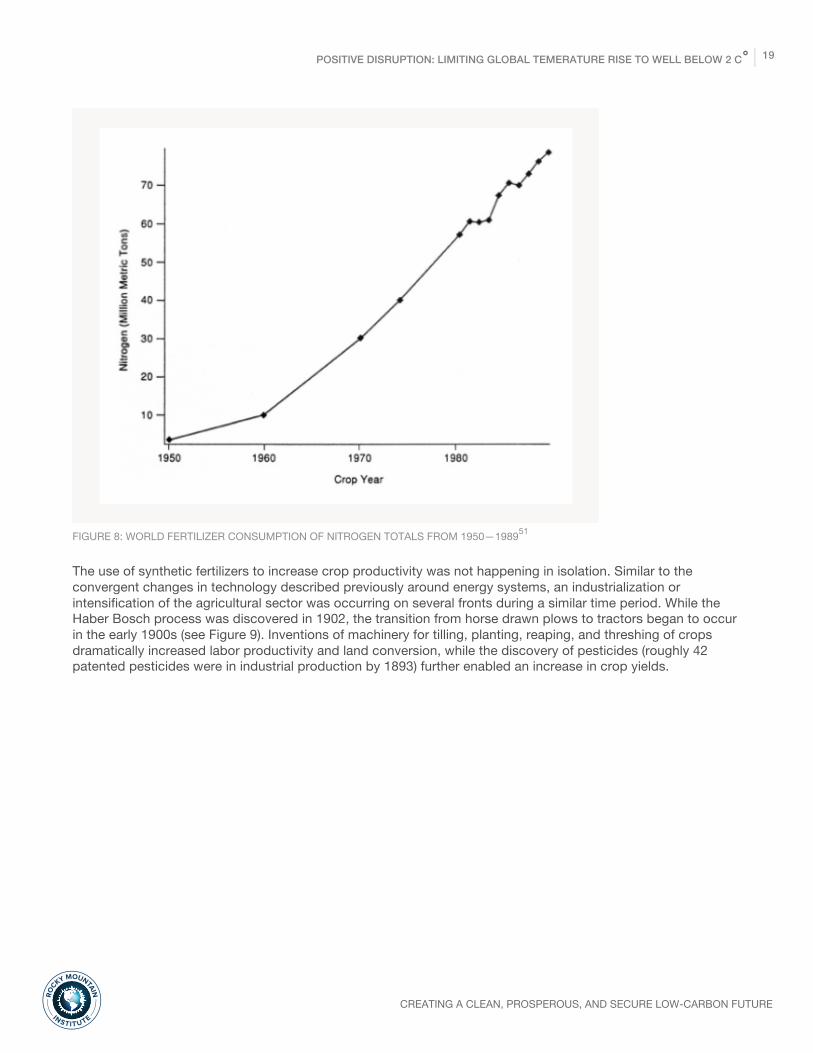
S-curve transitions in agriculture have occurred regularly in history While there have been many technological revolutions in agrarian history—for example the transition from a hunter-gatherer to a predominantly agrarian society, or the transition from the ox to the horse, and innovations in water transport and tilling practices during the Roman era—those that have transpired during the late nineteenth and twentieth centuries continue to build on this concept of accelerations in market transformation. Rapid land use transitions can best be exemplified in recent history by three major innovations: the use of fixed nitrogen for agricultural fertilization purposes, the transition from the horse to the tractor, and the use of bioengineering to increase crop resiliency and therefore yields. Synthetic fertilizers, produced through a process know as nitrogen-fixing using the Haber-Bosch process, have changed terrestrial and marine ecosystems as well as human carrying capacity of the planet. Without the fixation of nitrogen, it is purported we would be unable to produce roughly half of today’s food supply.49 Another way to think about this is if the Haber-Bosch process had not been discovered, two out of five people on the planet would not exist today.50 The transition to using synthetic fertilizers occurred in a matter of decades (see Figure 8).
POSITIVE DISRUPTION: LIMITING GLOBAL TEMERATURE RISE TO WELL BELOW 2 C° 19
CREATING A CLEAN, PROSPEROUS, AND SECURE LOW-CARBON FUTURE
RO
CKY MOUNTAIN
INSTIT UTE
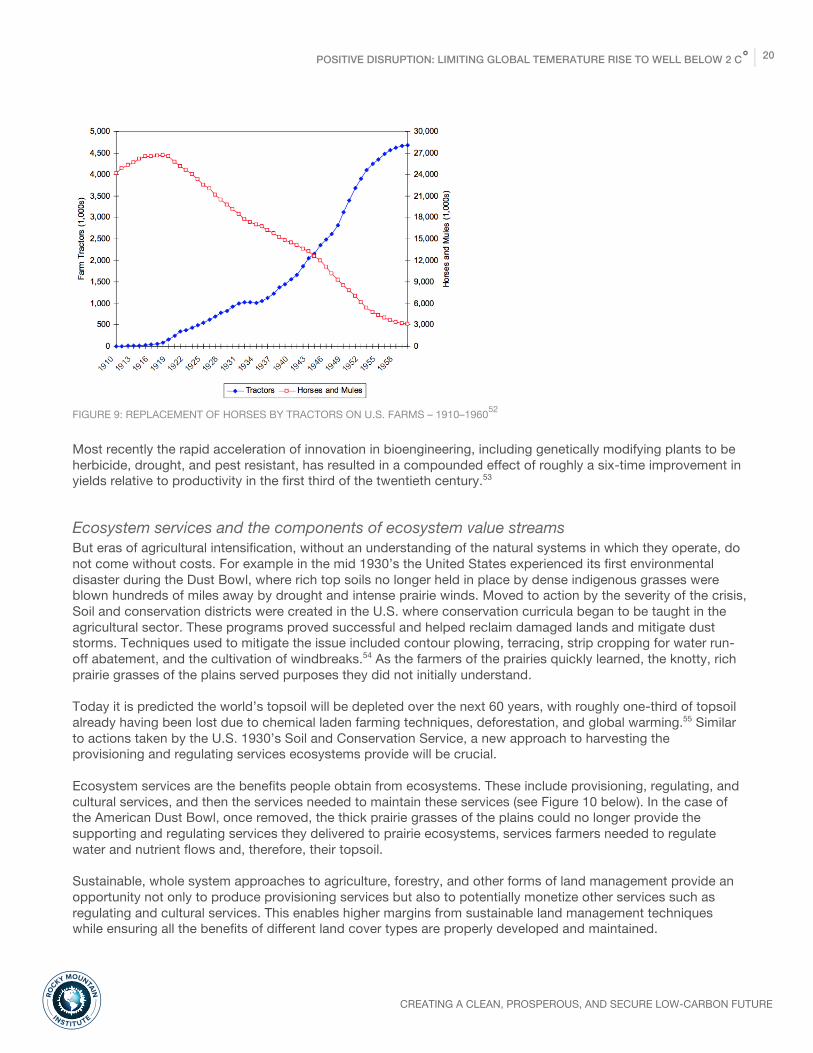
FIGURE 8: WORLD FERTILIZER CONSUMPTION OF NITROGEN TOTALS FROM 1950—198951 The use of synthetic fertilizers to increase crop productivity was not happening in isolation. Similar to the convergent changes in technology described previously around energy systems, an industrialization or intensification of the agricultural sector was occurring on several fronts during a similar time period. While the Haber Bosch process was discovered in 1902, the transition from horse drawn plows to tractors began to occur in the early 1900s (see Figure 9). Inventions of machinery for tilling, planting, reaping, and threshing of crops dramatically increased labor productivity and land conversion, while the discovery of pesticides (roughly 42 patented pesticides were in industrial production by 1893) further enabled an increase in crop yields.
POSITIVE DISRUPTION: LIMITING GLOBAL TEMERATURE RISE TO WELL BELOW 2 C° 20
CREATING A CLEAN, PROSPEROUS, AND SECURE LOW-CARBON FUTURE
RO
CKY MOUNTAIN
INSTIT UTE
FIGURE 9: REPLACEMENT OF HORSES BY TRACTORS ON U.S. FARMS – 1910–196052 Most recently the rapid acceleration of innovation in bioengineering, including genetically modifying plants to be herbicide, drought, and pest resistant, has resulted in a compounded effect of roughly a six-time improvement in yields relative to productivity in the first third of the twentieth century.53
Ecosystem services and the components of ecosystem value streams But eras of agricultural intensification, without an understanding of the natural systems in which they operate, do not come without costs. For example in the mid 1930’s the United States experienced its first environmental disaster during the Dust Bowl, where rich top soils no longer held in place by dense indigenous grasses were blown hundreds of miles away by drought and intense prairie winds. Moved to action by the severity of the crisis, Soil and conservation districts were created in the U.S. where conservation curricula began to be taught in the agricultural sector. These programs proved successful and helped reclaim damaged lands and mitigate dust storms. Techniques used to mitigate the issue included contour plowing, terracing, strip cropping for water run-off abatement, and the cultivation of windbreaks.54 As the farmers of the prairies quickly learned, the knotty, rich prairie grasses of the plains served purposes they did not initially understand. Today it is predicted the world’s topsoil will be depleted over the next 60 years, with roughly one-third of topsoil already having been lost due to chemical laden farming techniques, deforestation, and global warming.55 Similar to actions taken by the U.S. 1930’s Soil and Conservation Service, a new approach to harvesting the provisioning and regulating services ecosystems provide will be crucial. Ecosystem services are the benefits people obtain from ecosystems. These include provisioning, regulating, and cultural services, and then the services needed to maintain these services (see Figure 10 below). In the case of the American Dust Bowl, once removed, the thick prairie grasses of the plains could no longer provide the supporting and regulating services they delivered to prairie ecosystems, services farmers needed to regulate water and nutrient flows and, therefore, their topsoil. Sustainable, whole system approaches to agriculture, forestry, and other forms of land management provide an opportunity not only to produce provisioning services but also to potentially monetize other services such as regulating and cultural services. This enables higher margins from sustainable land management techniques while ensuring all the benefits of different land cover types are properly developed and maintained.

POSITIVE DISRUPTION: LIMITING GLOBAL TEMERATURE RISE TO WELL BELOW 2 C° 21
CREATING A CLEAN, PROSPEROUS, AND SECURE LOW-CARBON FUTURE
RO
CKY MOUNTAIN
INSTIT UTE
FIGURE 10: ECOSYSTEM SERVICES56
How market actors are capturing the multiple values of improved land management
The Catskills—New York City’s Water Treatment Facility57 One of the most famous examples of identifying, monetizing, and protecting a valuable ecosystem service is New York City’s watershed management program. For hundreds of years New York City has relied on a network of reservoirs and ducking systems along its watershed to provide it with one of world’s largest supplies of unfiltered water. New York tap water was once considered the purest in the nation. During the late 1990s as suburban growth boomed, these developments in its watershed began to put pressure on the city’s water supply. When the federal Safe Drinking Water Act came into effect the City was suddenly responsible for either building a water treatment facility to protect water quality or developing a plan for protection of the watershed producing that water. In 1997, when the City’s Department of Environmental Protection ran the numbers, the economics for protecting and managing the watershed were too hard to ignore. It predicted the City would spend roughly $1.5 billion (2006 dollars) in protecting its upstream resources as opposed to roughly $8 billion (2006 dollars) to construct and operate a water treatment facility. By 2006 the City was spending roughly $170 million dollars annually on watershed protection and management as opposed to the initial $6 billion in construction and $250 million of annual operational costs it would have had to pay to develop a water treatment facility. Simultaneously, farmers were offered new revenue streams for better managing their lands, while communities received resources and program direction to improve their own local water and waste water management systems.
Conservation Agriculture in Australia Conservation agriculture—a set of soil management practices that minimizes disruption to soil structure, composition, and biota in order to prevent soil erosion and lost productivity—has grown to roughly 90 percent of the Australian winter crop market since the 1960s, when experimentation in this form of land management began.58 This was achieved both through innovations in land management practices and technology and through the development of specific institutions to drive farmer adoption and innovation. Conservation agricultural practices generally include no tilling, with significantly reduced agrochemical applications so as to minimize the level of ionized compounds applied to soil that result in severe nutrient loss when

POSITIVE DISRUPTION: LIMITING GLOBAL TEMERATURE RISE TO WELL BELOW 2 C° 22
CREATING A CLEAN, PROSPEROUS, AND SECURE LOW-CARBON FUTURE
RO
CKY MOUNTAIN
INSTIT UTE
combined with water runoff. Conservation agriculture also lends itself to “stacking,” or the introduction of multiple revenue streams per agricultural acre, relative to traditional monoculture crops including through crop-livestock integration.
Polyface Farm and Stacking Now a popular case published by Harvard Business Review and studied by MBAs across the world, Polyface Farm, based in rural Virginia, demonstrates how farmers can leverage natural systems to reduce their input costs while increasing their revenues. Polyface uses an ecosystems-based approach to producing and managing organic nutrients and pests on-site, which includes a system of pastures, forests, bioswales, and ponds, combined with synergistic rearing of cattle, poultry, and swine. This approach creates multiple revenue streams per acre of land under cultivation, also known as stacking, while reducing input costs. As ecosystem markets continue to develop, this approach to agriculture can also generate other revenue streams from credits for things like wetlands mitigation banking, carbon markets, watershed payments for ecosystem services, pollinator habitat, and nutrient trading.
The Potential of Regenerative Organic Agriculture Increasing adoption of regenerative organic agriculture vis-à-vis conventional agriculture could not only reduce global greenhouse emissions but also improve soil-based sequestration of carbon while building soil health.vi, 59 A study by the Rodale Institute extrapolated that if certain regenerative organic agricultural practices including cover crops, compost, reduced tillage, and crop rotations were applied to certain crops, agricultural land could shift from a source of greenhouse gas pollution to a carbon sink.60 Extrapolating from various farming system trials conducted around the world, it found the carbon sequestration potential for the following crop categories listed in Table 1 below.
TABLE 1: REPORTED CARBON SEQUESTRATION FROM TRIALS AROUND THE WORLD At a global scale, growth in the organic food market is expected to continue at a compound annual growth rate (CAGR) of approximately 16 percent through 2020, reaching a market size of roughly $211 billion and demonstrating dramatic opportunity in the sequestration potential of such land management approaches.61
vi Emissionreductionandsequestrationbenefitsoforganicagriculturearehighlyvariableanduncertain.ThoughFAOhasinitiatedworkrelatingtotheseareas,furtherresearchisneededtoestimatetheirfullpotential.Forthisreason,wehavenotincludedorganicagricultureasavector.
POSITIVE DISRUPTION: LIMITING GLOBAL TEMERATURE RISE TO WELL BELOW 2 C° 23
CREATING A CLEAN, PROSPEROUS, AND SECURE LOW-CARBON FUTURE
RO
CKY MOUNTAIN
INSTIT UTE
Growth of the plant-based meat industry Continued growth of the plant-based meat industry as a substitute for red meat could also help reduce growth in direct emissions from the agricultural sector and avoid additional emissions from deforestation for new pastures and for soy production as cattle feed. Recent trends estimate that the plant-based meat industry could grow at roughly 6.6 percent annually to reach $6 billion by 2022.62 This growth again is driven largely by changing consumer preferences coupled with educational and marketing campaigns. What is needed today are agrarian revolutions realized over similar time horizons to those achieved during the late nineteenth and twentieth centuries, but using techniques and technologies that leverage natural systems as opposed to compromising them, and maintain a variety of ecosystem services. Over millennia, agricultural revolutions have shaped social organization and economic systems. Certain scholars even attribute the acceleration of industrial revolutions to the availability of affordable food and the agricultural revolutions that enabled a redirection of capital to the means of industrial production.63 While we do not seek to explore whether these agricultural innovations made society better or worse off, we wish to remind policymakers and private sector actors that their occurrence is not unprecedented and can occur rapidly. These events serve as a proxy for how new land management techniques can transform current agricultural practices in order to optimize various ecosystem services. Optimizing across these various outcomes facilitates the emergence of new revenue streams for agriculturalists and land managers.
Analysis Framework RMI undertook detailed modeling work to assess the climate implications of alternative pathways for energy demand and supply as well as for the agriculture, forestry, and other land use (AFOLU). These pathways produce greenhouse gas and temperature scenarios that differ significantly from a business-as-usual forecast. Our five scenarios show very different adoption levels for different technologies and somewhat different temperature changes relative to preindustrial temperatures. Similar to other recent analysis, each of these scenarios entails global carbon emissions peaking around 2020, and decreasing exponentially thereafter.64 (For specific scenario comparisons, see the scenario comparison table in the appendix.)

POSITIVE DISRUPTION: LIMITING GLOBAL TEMERATURE RISE TO WELL BELOW 2 C° 24
CREATING A CLEAN, PROSPEROUS, AND SECURE LOW-CARBON FUTURE
RO
CKY MOUNTAIN
INSTIT UTE
BUSINESS-AS-USUAL: A BASELINE EMISSIONS SCENARIO To model the impact of disruptive technologies and practices, we first developed a comprehensive business-as-usual (BAU), or baseline, emissions scenario assuming continuation of today’s policies, practices, and behaviors together with continued population, economic, and consumption growth globally. To this BAU scenario we then apply new technologies and practices to quantify the impact of a low-carbon and resource-efficient future that achieves the same growth outcomes but decouples them from energy and carbon while reducing the private internal cost of energy services—a proxy for ultimate competitive victory in the marketplace.
Approach We created the BAU emissions scenario, depicted in Figure 11, using a bottom-up approach to estimate emissions from:
● Energy use ● Agriculture, forestry, and other land use ● Clinker production (cement), fluorinated gases (F-gases), and waste
We derive historical and projected baseline data for energy demand, electricity supply mix, and emissions factors from the International Energy Association’s World Energy Outlook: Current Policies Scenario.65 Our baseline AFOLU emissions are taken from scenarios developed by the United Nations Food and Agriculture Organization.66 While emissions from the energy sector, agriculture and land-use sectors, and cement production were calculated explicitly, F-gas emissions used in the model were based on results from other benchmark modeling exercises.vii
vii Fluorinated gases (F-gases) in the modeling runs are equivalent to Intergovernmental Panel on Climate Change (IPCC) Representative Concentration Pathway (RCP) 8.5 projections. F-gases shown in this report are an approximation (for visualization purposes) using average global warming potential (GWP) values calculated by aggregating F-gases by type (hydrofluorocarbons, perfluorcarbons, and sulfur hexafluoride).

POSITIVE DISRUPTION: LIMITING GLOBAL TEMERATURE RISE TO WELL BELOW 2 C° 25
CREATING A CLEAN, PROSPEROUS, AND SECURE LOW-CARBON FUTURE
RO
CKY MOUNTAIN
INSTIT UTE
FIGURE 11: ANNUAL EMISSIONS (CARBON DIOXIDE EQUIVALENT (CO2E)) FROM ALL SECTORS UNDER BUSINESS AS USUALviii
FIGURE 12: CUMULATIVE EMISSIONS (CO2E) FROM ALL SECTORS UNDER BUSINESS AS USUALix
viii CO2e is used for comparison of different GHGs in graphs. Methane (CH4) and nitrous oxide (N2O) are converted to CO2e using GWP values of 21 and 310 respectively. All model inputs and outputs are in the respective gases. ix CH
4 and N
2O are converted to CO2e using GWP values of 21 and 310 respectively. All model inputs and outputs are
in the respective gases.
-
10
20
30
40
50
60
70
80
90
100
2015 2030 2050 2070 2100
Annual CO2e Emissions—BAU
Energy AFOLU Other F-gases
-
1,000
2,000
3,000
4,000
5,000
6,000
7,000
2015 2020 2025 2030 2035 2040 2045 2050 2055 2060 2065 2070 2075 2080 2085 2090 2095 2100
Cumulative Emissions CO2e—BAU
Energy AFOLU Other F-gases

POSITIVE DISRUPTION: LIMITING GLOBAL TEMERATURE RISE TO WELL BELOW 2 C° 26
CREATING A CLEAN, PROSPEROUS, AND SECURE LOW-CARBON FUTURE
RO
CKY MOUNTAIN
INSTIT UTE
Under business as usual, annual emissions continue to grow in all sectors through 2100. The vast majority of emissions are from fossil fuel use in the energy sector, driven by growing energy demand. The majority of the demand growth is expected to be in developing nations due to increases in population, gross domestic product (GDP), and energy access.
Climate Implications We estimated temperature changes relative to preindustrial averages using Climate Interactive’s Climate-Rapid Overview and Decisions Support Simulator (C-ROADS). C-ROADS is an integrated assessment model designed to estimate global mean surface temperature by modeling CO2 and other GHGs in the atmosphere. The business-as-usual emissions scenario leads to a steady increase in global temperatures relative to preindustrial averages, with temperature increases of approximately 3.7 C° by 2100. The 1.5 C° and 2 C° thresholds are breached in 2033 and 2049, respectively.
FIGURE 13: PROJECTION OF FUTURE TEMPERATURE CHANGE (C°) FOR THE BAU EMISSIONS SCENARIO
0.0
0.5
1.0
1.5
2.0
2.5
3.0
3.5
4.0
2015 2035 2055 2075 2095
Tem
pera
ture
incr
ease
abo
ve p
re-
indu
stri
al a
vera
ge (C
°)
Temperature Increase from Pre-Industrial (1870)
BAU
1.5 C°
2 C°

POSITIVE DISRUPTION: LIMITING GLOBAL TEMERATURE RISE TO WELL BELOW 2 C° 27
CREATING A CLEAN, PROSPEROUS, AND SECURE LOW-CARBON FUTURE
RO
CKY MOUNTAIN
INSTIT UTE
TRANSFORMING THE ENERGY ECONOMY To describe an alternative pathway, we focus on a few key vectors with the potential to drive major shifts in energy demand and supply. We chose these vectors based on market analyses, expert interviews, and technical potential to reduce emissions. In our alternative scenarios, efficiency measures reduce energy demand by approximately 60 percent and virtually all remaining energy demand is electrified. On the supply side, a rapid uptake in renewables provides clean energy supplies to meet remaining demand.
FIGURE 14: ESSENTIAL TECHNOLOGIES FOR AN ENERGY TRANSFORMATION
Demand—Diverse technologies can reduce and electrify energy demand A convergence of efficiency technologies combined with electrification of energy demand offer the greatest potential for transforming the energy economy. This transformation revolves around four core elements: 1) implementing efficiency measures in buildings, 2) improving efficiency in industrial heating processes 3) accelerating fuel consumption demand reductions through transportation systems design and efficiencies, and 4) electrifying vehicle fleets.x
Buildings In the buildings sector (both residential and commercial), technological improvements include end-use efficiency improvements, fuel switching, smart controls, and integrative design.67
x The measures are an aggregate of numerous design improvements and use practices derived from Reinventing Fire and Reinventing Fire: China.

POSITIVE DISRUPTION: LIMITING GLOBAL TEMERATURE RISE TO WELL BELOW 2 C° 28
CREATING A CLEAN, PROSPEROUS, AND SECURE LOW-CARBON FUTURE
RO
CKY MOUNTAIN
INSTIT UTE
Transportation The transportation sector would be transformed through end-use efficiency caused by demand reduction and vehicular design changes. Better urban planning and route optimization would reduce total driving needs while advanced materials would produce lighter vehicles needing smaller engines.
Electrification Heat pumps and electric vehicles (EVs) drive the transition to a more electrified energy system, with increased electricity demand being met by renewable energy resources. To date, heat pumps have experienced slow market penetration, but they present a mature technology with a large potential to meet heating and cooling demand in both the retrofit and new construction markets. Recently, EV uptake and therefore contribution to emissions reductions, has seen a boost from dramatic improvements in technology, infrastructure, and costs, along with government efforts to promote electrification of light duty vehicles (LDV). When combined, new demand-side technologies and better use practices result in a 56 percent decrease in total energy required in 2100 compared with business as usual. The graph below summarizes the contribution of various sectors in reducing the business-as-usual energy demand in our most aggressive scenario.
FIGURE 15: CHANGE IN ENERGY CONSUMPTION, 2015–2100
250,000
200,000
150,000
100,000
50,000
-Total energy consumption
(2015)
Ener
gy R
equi
rem
ent (
TWh)
Total energy consumption -
BAU (2100)
Change in transportation
demand - design improvements + efficiency + automation + electrification
Change in energy
consumption in buildings - efficiency +
electrification of heating
Change in energy
consumption in industry - efficiency +
electrification of heating
Total energy consumption -
Scenario 1 (2100)
97,746
38,000
47,691
41,625 224,147
96,830

POSITIVE DISRUPTION: LIMITING GLOBAL TEMERATURE RISE TO WELL BELOW 2 C° 29
CREATING A CLEAN, PROSPEROUS, AND SECURE LOW-CARBON FUTURE
RO
CKY MOUNTAIN
INSTIT UTE
Efficiency may be the least-cost approach, but transforming supply cannot be overlooked Demand-side efficiency improvements are the least-cost option available to utilities and planners. Multiple studies over the years have confirmed that efficiency is the cheapest resource available to utilities at an average of between $0.02–$0.04 per saved kWh, which is substantially less than the cost of adding new power plants.68 Although convenient to focus on demand-side changes, their contribution to reducing emissions is only part of the equation and in several cases smaller than switching supply to renewables. To minimize global temperature increase, emissions reductions associated with the supply-side adoption of renewable energy sources must be incorporated.
Supply—Market diffusion dynamics will continue to lead to a rapid uptake of renewables
There are several powerful synergistic and complementary feedback loops occurring in the market Renewable energy experienced rapid uptake in the past decade, with both solar and wind exhibiting exponential growth (Figures 15 and 16). In 2015, renewable energy added 148 GW of electricity—over half of the world’s new electric generating capacity—and 26 GW of renewable heat supply.69 In 2016, renewables met more than half of global growth in electricity demand, and in that single year, prices fell 37 percent for the lowest Mexican solar-power bids and 43 percent for Europe’s best offshore wind bids.70 More than 19 percent of the world’s 2015 total final energy consumption came from renewables. That growth is nibbling away at the 78 percent from fossil fuels—but unevenly, depending on the use. Several factors are driving this persistent uptake of renewables including reinforcing feedback loops in the market as shown previously in Figure 7. These factors include continued industry coordinated reductions in the prices of wind and solar, and service stacking from distributed energy storage combined with rapid price reductions, further enabling greater market penetration of renewables.71 We expect that these forces will continue to drive this transformation beyond current projections, which we describe below.
FIGURE 16: GLOBAL SOLAR CAPACITY AND ANNUAL INSTALLED CAPACITY72

POSITIVE DISRUPTION: LIMITING GLOBAL TEMERATURE RISE TO WELL BELOW 2 C° 30
CREATING A CLEAN, PROSPEROUS, AND SECURE LOW-CARBON FUTURE
RO
CKY MOUNTAIN
INSTIT UTE
FIGURE 17: GLOBAL WIND CAPACITY AND ANNUAL INSTALLED CAPACITY73
Renewables are increasingly competitive Reinforcing these synergistic market trends, costs of renewables continue to decline. In the solar and wind arena, the development and scaling of these disruptive technologies since the 1980s has led to a dramatic reduction in their costs. Prices of renewables continue to fall worldwide. In the U.S. alone, power purchase agreement (PPA) prices fell by 83 percent for PV and 71 percent for wind between 2008 and 2016, greatly increasing installation of these technologies.74 In 2015 the world saw its highest level of global investment in renewable capacity, outstripping that in fossil fuels by nearly double, at US$265.8 billion (excluding hydro-electric), with the most capacity added by solar and wind (118 GW)—making up a majority of all newly installed capacity in 2015 (see Figure 17).
FIGURE 18: NET POWER GENERATING CAPACITY ADDED IN 2016 BY VARIOUS TECHNOLOGIES, GW. SOURCE: BLOOMBERG NEW ENERGY FINANCE/UNEP GLOBAL TRENDS IN RENEWABLE ENERGY INVESTMENT 2017.75

POSITIVE DISRUPTION: LIMITING GLOBAL TEMERATURE RISE TO WELL BELOW 2 C° 31
CREATING A CLEAN, PROSPEROUS, AND SECURE LOW-CARBON FUTURE
RO
CKY MOUNTAIN
INSTIT UTE
Currently, in the United Kingdom, Germany, Texas, and Chile, wind is cheaper than fossil fuel-generated electricity.76 Solar photovoltaic plants elsewhere, such as in Hawaii, Mexico, Peru, and Chile, are contracting at prices that are cheaper than the levelized cost of a natural gas plant.77 The economics are expected to continue to improve, especially as coal is further regulated and already efficient gas approaches an asymptote of maximum efficiency.78 By 2040, utility-scale solar prices are projected to drop 60 percent and onshore wind 41 percent, with estimates placing new solar and wind as cheaper than existing coal and gas generators well before 2030.79
Renewables are being deployed globally Most renewable energy technologies, especially solar, wind, and biomass pyrolysis are scalable to different levels and therefore deployable in many regions, with varying levels of grid infrastructure. Various national, state, and city governments have set aggressive targets that are supported by mechanisms including regulatory measures, fiscal incentives, public financing options, and carbon prices to accelerate scale-up of renewable energy. As of 2015, renewable energy targets were established in 173 countries at the national or sub-national level.80 Developing countries are responsible for a large share of the global deployment, with China, India, and Brazil all showing growth in renewables in 2015.81
Energy System Scenarios Using S-curves, we project scenarios of clean technology adoption between 2015 and 2100. Our most aggressive scenario (1) results in electricity supply met entirely by renewables by 2031. Instances of 100 percent renewable supply exist today (see sidebar page 32). This scenario achieves the same or better reliability than today by integrating load balancing methods such as bigger and smarter markets, diversified supply portfolios, flexible demand, thermal and EV integration, and storage. Fossil fuel use in transportation is roughly half of 2013 values by 2046, decreasing to one-thirtieth of 2013 values by 2069 and slowly declining through 2100; long-run heavy trucks, ships, and aircraft use advanced biofuels or hydrogen. Heat demand, primarily industrial heat that is not electrified, becomes the main remaining consumer of fossil fuels, chiefly for making steel and cement, but could also be largely or wholly replaced by hydrogen made from then-cheap surplus renewable electricity. In our least aggressive scenario (3) solar surpasses fossil fuel electricity generation in 2043 with fossil fuel use for electricity generation decreasing to one-third of the 2013 value by 2046, and one-tenth of 2013 levels by 2068. Lower EV deployment means there is higher demand for fossil fuels and biofuels. As with our most aggressive scenario, industrial process heat demand remains the main consumer of fossil fuels. Figure 19 shows the supply side breakdown by source following changes in demand for the aforementioned scenarios.

POSITIVE DISRUPTION: LIMITING GLOBAL TEMERATURE RISE TO WELL BELOW 2 C° 32
CREATING A CLEAN, PROSPEROUS, AND SECURE LOW-CARBON FUTURE
RO
CKY MOUNTAIN
INSTIT UTE
Most Aggressive Scenario (1) Least Aggressive Scenario (3)
Renewable
Heat
Transport
FIGURE 19: ENERGY SUPPLY BREAKDOWN BY SOURCE AND END USE AFTER DEMAND SIDE CHANGES

POSITIVE DISRUPTION: LIMITING GLOBAL TEMERATURE RISE TO WELL BELOW 2 C° 33
CREATING A CLEAN, PROSPEROUS, AND SECURE LOW-CARBON FUTURE
RO
CKY MOUNTAIN
INSTIT UTE
Transforming electricity generation and transportation is critical because they emit most GHGs.82 However, limiting temperature increase to well below 2 C° will be daunting. A recent report from the United Nations Environment Programme (UNEP) indicates current pledges to reduce emissions will not keep us below 2 C° in 2030.83 To reach these goals, we must look beyond the energy sector, and as we propose, to the agriculture, forestry, and other land-use sectors.
100 Percent Renewable Several cities and communities have been leading the charge in deploying 100 percent renewable energy. In fact, Greensburg, Kansas, and Burlington, Vermont, already source all of their electricity from renewable resources. Costa Rica, which currently gets 99 percent of its electricity from renewable sources, aims to get all of its electricity from renewable sources by 2021. Other countries and regions with such ambitious targets include Denmark, Dominica, Fiji, Samoa, Tuvalu, Scotland, Tasmania, and Hawaii.
FIGURE 20: CALIFORNIA MODELED RENEWABLE POWER FOR A JULY DAY IN 2020—A DIVERSE PORTFOLIO OF RENEWABLE ENERGY SOURCES CAN MEET ALL DEMANDi Source: Mark Jacobson and Mark Delucchi, “Wind, Water and Solar Technologies Can Provide 100 Percent of the World’s Energy, Eliminating All Fossil Fuels. Here’s How,” Scientific American Journal (2009): 58–65.

POSITIVE DISRUPTION: LIMITING GLOBAL TEMERATURE RISE TO WELL BELOW 2 C° 34
CREATING A CLEAN, PROSPEROUS, AND SECURE LOW-CARBON FUTURE
RO
CKY MOUNTAIN
INSTIT UTE
TRANSFORMING AGRICULTURE AND LAND-USE PRACTICES A whole suite of technologies core to modern agriculture—mechanization, artificial nitrogen fixation, biocides, etc.—were deployed over a few decades, with a full agricultural transition completed in roughly half a century. It is not unreasonable to aspire to a similar transition for a new and at least comparably advantageous suite of techniques.
Demand Trends While global growth trends will continue to put greater pressure on food production systems, there are points for optimism in agricultural and silvicultural markets, indicating a preference by consumers for sustainably produced food and fiber products.
Growth in Food Consumption The Food and Agriculture Organization of the United Nations (FAO) projects global growth through 2050 in population, reaching 9.15 billion people in a medium-growth scenario, and GDP increasing 2.1 percent per annum globally and 3.6 percent per annum in developing nations. Coinciding with these growth patterns is the expected increase in both per capita food consumption and a higher share of calories met by livestock products and vegetable oils.84 As consumption increases, both for food and other products, driving expansion for agricultural lands, projections show increases in agriculture and land-use-related GHG emissions, further decreasing the emissions budget required to keep global warming below 2 C°. Additional consequences abound as natural ecosystems are converted to agricultural land, including decreased CO2 sequestration potential along with impacts on environmental health, such as degraded soils, habitat loss, and lower biodiversity.
Growth in Meat Consumption With this increase in population, wealth, and food consumption, meat consumption is predicted to continue to increase.85 Livestock is currently the largest land user, either for grazing or production of feedstock.86 The growing demand for livestock can have several negative impacts, including environmental degradation due to practices such as deforestation and over-grazing, point source pollutants from industrial scale livestock production, and GHG emissions of potent CH4 and N2O from ruminant enteric fermentation.87 There are a number of opportunities for reducing environmental and climate impacts from livestock such as increasing grazing rotations and intensity, which some research indicates can increase soil carbon and grassland health while also reducing the amount of land required for grazing; adjusting livestock diets and developing feed additives to reduce enteric fermentation emissions; and using biodigesters to generate renewable energy and avoid methane emissions from manure.88 Avoiding, but not eliminating meat consumption can also help reduce impacts from livestock. China has recently updated its dietary guidelines, encouraging consumers to eat less meat—in 2030 the guidelines suggest consuming 14–27 kg of meat per person per year; greater than a 70 percent reduction from BAU projections of 93 kg per person per year.89 In our analysis we modeled a shift in demand for traditionally raised beef as well as a reduction of demand for beef of 80 percent relative to business-as-usual projections for beef demand in 2100, or roughly a 50 percent reduction from current levels of beef production.xi
xi While this may sound like a radical shift from today’s dietary preferences, such a future could reflect the potential for plant-based alternatives to provide a much lower cost and tastier substitute for real meat, allowing for this transition to be enabled entirely through consumer choice.

POSITIVE DISRUPTION: LIMITING GLOBAL TEMERATURE RISE TO WELL BELOW 2 C° 35
CREATING A CLEAN, PROSPEROUS, AND SECURE LOW-CARBON FUTURE
RO
CKY MOUNTAIN
INSTIT UTE
Growth in Sustainable Forestry and Organics Demand Sustainable Forestry Global deforestation is proceeding at an alarming rate—net forest loss from 2000–2010, driven primarily by agricultural expansion, was roughly 7 million hectares (Mha) per year.90 As demand for wood products grows—projections indicate a 40 percent increase relative to 2010 by 2020—there is growing concern that without proper management techniques, the remaining forests may be unable to meet these demands.91 Fortunately, a shift is occurring to managed, sustainable forests that can both maintain biodiversity and ecosystem health while providing both products and services for society.92 For example, Chile has established over 1 Mha of planted forest since 1990 while increasing food security.93 Globally, sustainable forestry has increased by 4.3 Mha yearly since 1990 and is projected to grow from 264 Mha (2010) to 300 Mha by 2020.94 And this trend is being driven by markets. For example, the Forest Stewardship Council (FSC), a standards and oversight body for sustainably harvested timber, saw a 33 percent increase in Forest Management certificates from 2010 to 2015 as well as a roughly 80 percent increase in its Chain of Custody certificates—those who provide the link between sustainable production and consumption of FSC-certified products—over the same time period.95 This case highlights the rapid acceleration of sustainable business models in the land-use sector, though it must be noted that sustainable forestry standards have little to no relationship with carbon storage. Also, carbon storage may occasionally have trade-offs with more natural forests—industrial forests (e.g., in the U.S. southeast) are some of the most carbon dense in the world, and the largest source of the U.S. carbon sink.
Organics Additionally, improving the manner in which agricultural products are produced can reduce environmental impacts and lower GHG emissions. The increase in consumption of organic foods over the past decade is another example of changing land management practices that have been driven by consumer demand.96 At a global scale, growth in the organic food market is expected to continue at a compound annual growth rate (CAGR) of approximately 15.7 percent reaching a market size of roughly $211 billion through 2020.97 Yet even with a 300 percent growth in U.S. organic operations since 2002, U.S. domestic supply cannot keep up with demand, leading to large imports from Europe.98 In later sections we will discuss the market dynamics that are limiting a growth in supply and methods to ameliorate this issue.
Supply Today we recognize a limit to traditional approaches to agricultural intensification at the expense of our soil systems, forests, and atmosphere, but that must still fulfill an increasing demand for food as global populations continue to rise. Meeting these demands requires new forms of land management.
New land management techniques Many methods exist today for decreasing land-use-related GHG emissions and increasing carbon sequestration. These practices include everything from no-till farming, to permaculture, to wetland management, to rotational grazing techniques that amplify soil carbon sequestration, to biomass pyrolysis that produces energy and sequesters carbon. In our analysis, on the supply side, we look at several vectors for mitigating carbon emissions and increasing sequestration.
Cropland and Grazing Management Soil management practices are implemented to minimize soil degradation, increase carbon content of biomass and soil, and improve the long-term health of the soil and financial sustainability of farming.99 Practices adopted include improved:

POSITIVE DISRUPTION: LIMITING GLOBAL TEMERATURE RISE TO WELL BELOW 2 C° 36
CREATING A CLEAN, PROSPEROUS, AND SECURE LOW-CARBON FUTURE
RO
CKY MOUNTAIN
INSTIT UTE
● Agronomy: Planting improved crop varieties, extending crop rotations, reducing fallow land, less intensive cropping systems, temporary vegetative cover between agricultural crops
● Nutrient and water management: Precise fertilizer application (placement, quantity, and timing), use of slow-release fertilizers, effective irrigation
● Tillage/residue management: Employ minimal or no tillage methods, avoid burning/off-site disposal of crop residues
● Agroforestry: Woody plants (trees, shrubs, etc.) grown on land also used for livestock or crop production
Land Restoration Land restoration converts land that has been degraded through disturbance or erosion to a previous and/or more natural state through such activities as planting vegetation or by reducing disturbance such as tillage.100 Examples of this process include conversion of cropland to native vegetation cover.
Biomass Pyrolysis Biomass pyrolysis is the heating of biomass in the absence of oxygen. This process produces biochar, a recalcitrant form of carbon that decays at a slower rate than the natural decay of the initial fuel source, thereby sequestering carbon.101 Co-benefits include energy generation and improved agricultural productivity—as a soil applicant, biochar can increase the retention of water and nutrients.102 Conversion of land to forest In our modeling, as consumption of beef decreases, land no longer required for feedstock production or grazing is converted to forest. Some land is kept as cropland to produce a varied supply of plant-based calories to replace meat calories as beef consumption decreases. The 2016 United States Mid-Century Strategy For Deep Carbonization reviewed a similar set of vectors, estimating that 30–50 percent of U.S. economy-wide emissions, or ~1,200 million tonnes of CO2e, can be sequestered by the land and bioenergy sectors with carbon capture and storage (BECCS).103 Excluding CO2 removal technologies (e.g., BECCS), similar potentials were found at ~900 million tonnes of CO2e. The study shows a much more visionary pathway toward supporting biological-systems-based sequestration methods but still has points for further optimism. The study did not attempt to model improvements in soil carbon storage due to uncertainty and modeling constraints. The adoption of better management techniques for storing soil-carbon on 70 percent of U.S. cropland (not pasture or rangeland) by 2050 is estimated to increase the carbon sink by 270 million tonnes of CO2e per year.104
Trends in sustainable land management practices While comprehensive data on total acreage under management using sustainable techniques versus business-as-usual high emissions techniques is not readily available there are several data points for hope. Forest-Trends—an organization dedicated to providing transparency on ecosystem values, finance, and markets—has produced several reports on the state of different aspects of the sustainable land management industry. Its recent reports on private investment in conservation and investment in green infrastructure provide a sense of the capital flows beginning to occur into such forms of land management. Its State of Private Investment in Conservation 2016 report showed that a cumulative of roughly $8.2 billion since 2004 had been committed by the private sector to measurable environmental benefits that also sought financial return—the majority of this investment going into sustainable food and fiber.105 Roughly $6 billion has been committed to aiding in abating deforestation through the UN’s Reducing Emissions from Deforestation and Forest Degradation (REDD+) program.106 Trumping both of these levels of investment were investments in green infrastructure, made by governments, companies, local communities, and water utilities. In 2015 alone, roughly $25 billion was spent on green infrastructure making a cumulative of $82 billion since 2012.

POSITIVE DISRUPTION: LIMITING GLOBAL TEMERATURE RISE TO WELL BELOW 2 C° 37
CREATING A CLEAN, PROSPEROUS, AND SECURE LOW-CARBON FUTURE
RO
CKY MOUNTAIN
INSTIT UTE
To bring this into perspective it is helpful to compare this level of investment to the level proposed by McKinsey’s Pathways to a Low-Carbon Economy: Version 2 of the Global Greenhouse Gas Abatement Cost Curve.107 It found that roughly $15 billion of abatement investment (capital and operating expense) was needed annually between 2011 and 2015, increasing to $50 billion annually starting in 2026 for AFOLU-based vectors. This analysis is based on aggressively deploying levers costing less than €60 (US$72) tCO2e. While additional but more costly levers and behavioral changes can be implemented, only estimates of their potential impact, not cost, are included in the report. We have a long way to go in realizing the full potential that terrestrial systems hold for abating emissions—some studies put organic farmland as making up just 1 percent of total farmable land worldwide (2011)—the remaining 99 percent of farmable land could be reducing emissions and potentially even sequestering more carbon using organic and more sustainable land management practices.108
Requirements to accelerate a land management transformation
Demand Demand for conventionally raised beef and palm oil will need to drop significantly On the consumer demand side of the equation, the world will need to see a sustained decline in demand for traditionally raised beef, as feeding an additional 3 billion people traditionally raised beef will have deleterious impacts on global ecosystems and the climate. Land-use change attributable to land conversion for the cultivation of beef is continuing to drive a massive release of carbon into the atmosphere while simultaneously destroying functioning carbon sinks. New norms around the consumption of meat and especially beef must be tackled. In our modeling, BAU meat and beef production (proxy for consumption) respectively increase from 298 to 678 and 69 to 158 million tonnes from 2015–2100. With our reduced consumption vector, meat and beef production respectively change from 291 to 552 and 63 to 32 million tonnes from 2015–2100. The remaining beef production is switched to new management practices. While we did not model the impacts for reduced palm oil demand, similarly the demand for palm oil is driving massive forest conversions in the tropics and must be addressed.
Supply In order to realize the full benefits of these new land management practices, a massive transition away from business-as-usual agricultural practices will be required. Different market actors can accelerate this transition through several mechanisms including greater land conversion to new practices, an infusion of capital into the sector to support new business models and practices, knowledge transfer of sustainable practices, supply chain reform, and government policies that incent versus ignore sustainable agriculture and land management.
More transparency will be required for capital to better flow into sustainable land management practices There is an incredible amount of uncertainty around emissions trajectories from agriculture, forestry, and other land use. One study to assess policy impacts on U.S. greenhouse gas emissions has uncertainty bands for land use, land-use change, and forestry that double those of energy price uncertainty.109 The implications of this are that emissions from improperly managed terrestrial systems could significantly counteract the benefits renewables can provide in solving the climate crisis. Therefore, more research needs to be conducted in a systemic and holistic way on the benefits sustainable land management practices can provide while tracking the current status of land under management and the rate of conversion necessary to abate and sequester the highest levels of carbon and other possible emissions. From here, land converted to sustainable practices across a variety of techniques must be tracked alongside the level of emissions. This will serve as a compass for
POSITIVE DISRUPTION: LIMITING GLOBAL TEMERATURE RISE TO WELL BELOW 2 C° 38
CREATING A CLEAN, PROSPEROUS, AND SECURE LOW-CARBON FUTURE
RO
CKY MOUNTAIN
INSTIT UTE
governments, impact investors, and private equity players to gauge the ongoing market potential for a variety of ecosystem services and the pace at which investment will need to occur.
Large buyers should exert influence through their supply chains Actors with buying power can exert considerable influence on their suppliers. Examples of this occurring in food and forestry markets are growing. Walmart, for example, has committed to working with 15 of its largest suppliers to optimize fertilizer and tilling practices for corn and soy crop rotations.110 It has also committed to sustainably source key food commodities including palm oil, beef, and seafood.111 Starbucks reformed its own coffee procurement process in order to protect endangered habitats while improving the wellbeing of small farmers in the developing world.112 This involved establishing new distribution channels and cooperatives for small-scale farmers in rural Africa and Latin America.113 This served the dual function of enabling small farmers access to global commodities markets while increasing their access to technical know-how and capital.114 Unilever is embarking on a similar journey in an attempt to procure sustainable palm oil. It is presently working with three small and remote Indonesian villages and 600 farmers to develop a replicable, sustainable palm oil model and designate the area as the first certified sustainable palm-oil village. Unilever has committed to a 2019 goal of procuring 100 percent certified sustainable palm oil and seeks to do so through districts and regions that are designated as such as opposed to thousands of individually certified farmers.115
Certifications must be made more accessible and affordable Inertia in the current industrial agricultural system that includes massive subsidization and institutional support for industrialized farming, with power and influence concentrated in a few large corporate players, is preventing conversion of lands to new and innovative land-use practices. Current agricultural regulations have an inherent bias toward the status quo and are ill equipped to oversee production characteristics of smaller-lot, more-seasonal, less-uniform, alternative agricultural models. Margins for alternative agriculture crops, at the moment, are significantly higher than traditional commodity cash crops. Markets are demanding products of this nature (e.g., organic, non-genetically modified, humanely raised meats, etc.) at record levels, while food processors and distributors are struggling to procure inputs for such goods,116 showing that the market is prime for disruption. Many farmers or ranchers may wish to adopt such practices but the barriers to entry may be too great, or the learning curve unknown for them to make such changes. For example, achieving organic certification takes three years and during this transition period, products cannot be sold at organic market prices and operating expenses may increase. Thus, many farmers often revert to traditional practices, as they cannot survive the transition financially.117 Funding is available to assist farmers in certification costs, but only after making the transition.118 The financial burden is often compounded by additional barriers, such as a decrease in yields during the transition period and inconsistencies in both product and yield. Increasing financial mechanisms designed to aid farmers from the start of the transition can ideally increase success rates by reducing financial burden and providing a contextualized roadmap for the transition. Case studies to emulate may include how FSC-certified wood has been able to grow to roughly 17 percent of the global industrial roundwood market whereas organic foods still make up roughly 2 percent of the U.S. food market.119
Sustainable agriculture and land management educational programs will need to be independently established from status quo training programs Simultaneously establishing knowledge transfer programs for cutting edge farming techniques will be critical. Certain studies have shown that for sustainable agricultural practices to take hold coordination must occur at the community and local level to implement new practices.120 For example, one study argues that during the British agricultural revolution of the sixteenth and seventeenth centuries, innovative technologies and techniques were shared with other farmers through tours, farm groups, open days, and publications. These techniques were then adapted to local conditions through rigorous experimentation.121 In Australia this very same approach has proven instrumental to transitioning roughly 90 percent of Australian winter crops to conservation agriculture. With the

POSITIVE DISRUPTION: LIMITING GLOBAL TEMERATURE RISE TO WELL BELOW 2 C° 39
CREATING A CLEAN, PROSPEROUS, AND SECURE LOW-CARBON FUTURE
RO
CKY MOUNTAIN
INSTIT UTE
establishment of the Crop Science Society and Rural Research and Development Corporations, a forum for continued innovation, testing, and knowledge sharing is alive and well in the Australian conservation agriculture realm.122
Government polices should support agricultural markets Lastly, a carbon price that values existing forest cover and penalizes forest degradation and deforestation can dramatically shape how land is managed. Governments from the national to the local level should eliminate policies that incentivize high emissions-producing forms of agriculture while redirecting and providing adequate support to enable farmers and ranchers to transition to new, more sustainable forms of agriculture and land management. Examples of governments intervening to accelerate such a transition exist today. For example, the state government of Kerala in India made it a requirement for all growers to grow organically by 2020—this decision was propelled by health and environmental issues in traditional agriculture and the economic malaise of local farmers who were in severe debt from the purchase of seeds and petrochemicals.123 A grassroots movement led the government to establish such requirements.
Agriculture and Land Use Scenarios A rapid transition in energy production and demand alone is unlikely to keep warming well below 2 C°. The world will also need to address the balance of greenhouse gas emissions and sequestration associated with agriculture, forestry, and other land use (AFOLU). Today we recognize a limit to traditional approaches to agricultural intensification at the expense of soil systems and an increasing demand for food as global populations continue to rise. To meet these demands, new forms of land management will be required that will decrease emissions related to land use, increase natural carbon sequestration, and improve ecosystem health. Such practices include, for example, increasing forest cover and avoiding conversion of forests to other land uses, integrating trees into farming, farming without disturbing the soil through tillage, adopting permaculture principles, managing wetlands, and using rotational grazing techniques that amplify soil carbon sequestration. A number of studies indicate biomass paired with carbon capture and storage (BECCS) could provide a scalable opportunity for “negative emissions” energy, though the net carbon effects depend on the source of biomass and sustainable land management.124 Additionally, biomass pyrolysis, the heating of biomass in the absence of oxygen, can generate energy (offsetting fossil-fuel use) from agricultural or forestry residues (no competition with food-producing crops), sequester carbon,xii and improve soil health when the byproduct, biochar, is applied to soils.125 The 2016 United States Mid-Century Strategy for Deep Carbonization found that U.S. ecosystems could sequester 30 to 50 percent of remaining economy-wide GHG emissions by 2050, under a scenario in which economy-wide emissions are reduced by 80 percent or more.126 Because there is a scarcity of potential data on carbon sequestration at the proper scale for our analysis, we interviewed experts and conducted our own research in order to identify four major mitigation vectors. We found that these vectors alone could mitigate almost 8.5 gigatonnes of CO2 equivalents per year by 2050 and almost 16 gigatonnes of CO2 equivalents per year by 2100. At this rate, by the mid-2040s, the agriculture, forestry, and land-use sector would be a net-neutral contributor to CO2 equivalent emissions because it would be sequestering enough atmospheric carbon to offset all of its emissions. Beyond 2046, this sector could be a net sink of atmospheric carbon emissions. xii This process produces biochar, a form of carbon that decays at a slower rate than the natural decay of the initial fuel source, thereby sequestering carbon. The total lifecycle carbon emissions or sequestration from biochar depends on the source of the biomass, potential alternative uses of the biomass, and soil management following biochar application.

POSITIVE DISRUPTION: LIMITING GLOBAL TEMERATURE RISE TO WELL BELOW 2 C° 40
CREATING A CLEAN, PROSPEROUS, AND SECURE LOW-CARBON FUTURE
RO
CKY MOUNTAIN
INSTIT UTE
Vector Emissions Mitigated (Gt CO2e/y)xiii
2030 2050 2100
Reduced consumption of beef from unsustainable practices (reduced methane from livestock and avoided conversion of forest to pasture)
0.4 0.7 1.5
Conservation agriculture, grazing management, and land restoration that provide a sink for carbon emissions
0.3 1.1 3.6
Biomass pyrolysis that increases carbon retention in soil and replaces fossil fuels for heat and power generation
1.5 4.2 4.8
Land conversion to forest (underutilized pasture and agricultural land is converted to forest) that provides a natural sink for carbon emissions
1.2 2.5 5.9
Total 3.4 8.5 15.8 TABLE 2: MITIGATION POTENTIAL OF VARIOUS AFOLU VECTORS These numbers reflect a set of stylized scenarios and should be interpreted in the context of substantial future uncertainty around population growth, dietary preferences and trends, diverse soils, and ecological zones types paired with variable land management strategies, the business-as-usual case, and other factors. Global projections for potential AFOLU mitigation range from 12.5 Gt CO2e by 2030 as forecasted by McKinsey and Company, and up to 87 Gt CO2e by 2050 as IPCC predicts.127 Paustian et al. estimates enhanced soil management practices could sequester 8 Gt CO2e/year globally.128 These estimates reflect maximum technical and/or economic potential, and likely mitigation activity could be much lower. Ambitious policy frameworks will be key to incentivize land management strategies that have positive carbon impacts. Although the energy sector has the potential to exhibit virtuous cycles of technology deployment and cost reduction, this dynamic could be suppressed in the land-use sector without a substantial change in market forces and consumption patterns influencing land management. Carbon-based incentives can support the large amounts of capital that will be needed for conservation easements, organic certification program and carbon protocol implementation, and the purchase and installation of advanced field equipment, precision agriculture software, and sensors. Preservation of high-carbon landscapes like natural grasslands, old-growth forests, and wetlands will be critical to avoiding carbon loss. The good news is that signs indicate this transition is already starting to take shape. Reforestation is gaining ground and global deforestation rates are slowing. The increase in consumption of organic foods over the past decade is one example of how changes in standard farming practices and consumer behavior have driven changes in land-management practices. Increasing adoption of organic agriculture vis-à-vis conventional agriculture could not only reduce global greenhouse emissions but also improve soil-based sequestration of carbon.129 At a global scale, growth in the organic food market is expected to continue at a compound annual growth rate (CAGR) of approximately 16 percent through 2020, reaching a market size of roughly $211 billion.130 xiii A detailed explanation of the AFOLU modeling approach can be found in the supplementary technical materials for the paper.
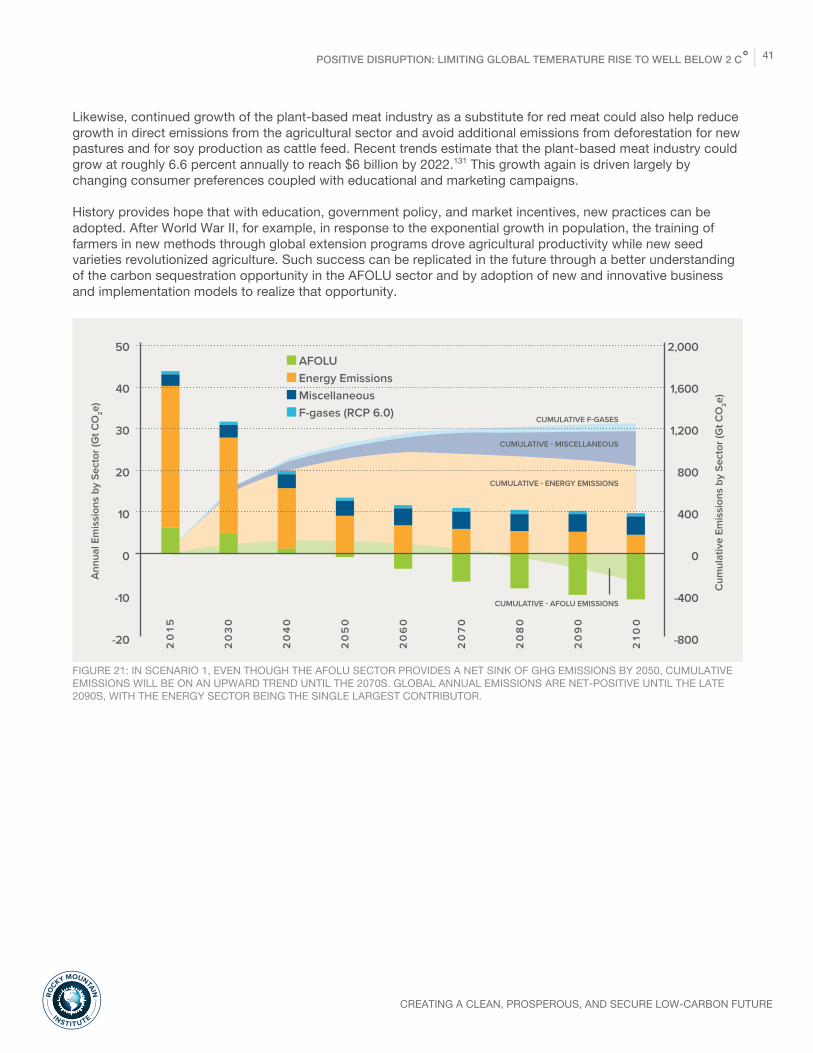
POSITIVE DISRUPTION: LIMITING GLOBAL TEMERATURE RISE TO WELL BELOW 2 C° 41
CREATING A CLEAN, PROSPEROUS, AND SECURE LOW-CARBON FUTURE
RO
CKY MOUNTAIN
INSTIT UTE
Likewise, continued growth of the plant-based meat industry as a substitute for red meat could also help reduce growth in direct emissions from the agricultural sector and avoid additional emissions from deforestation for new pastures and for soy production as cattle feed. Recent trends estimate that the plant-based meat industry could grow at roughly 6.6 percent annually to reach $6 billion by 2022.131 This growth again is driven largely by changing consumer preferences coupled with educational and marketing campaigns. History provides hope that with education, government policy, and market incentives, new practices can be adopted. After World War II, for example, in response to the exponential growth in population, the training of farmers in new methods through global extension programs drove agricultural productivity while new seed varieties revolutionized agriculture. Such success can be replicated in the future through a better understanding of the carbon sequestration opportunity in the AFOLU sector and by adoption of new and innovative business and implementation models to realize that opportunity.
FIGURE 21: IN SCENARIO 1, EVEN THOUGH THE AFOLU SECTOR PROVIDES A NET SINK OF GHG EMISSIONS BY 2050, CUMULATIVE EMISSIONS WILL BE ON AN UPWARD TREND UNTIL THE 2070S. GLOBAL ANNUAL EMISSIONS ARE NET-POSITIVE UNTIL THE LATE 2090S, WITH THE ENERGY SECTOR BEING THE SINGLE LARGEST CONTRIBUTOR.
50
40
30
20
10
0
-10
-20
Ann
ual E
mis
sion
s by
Sec
tor (
Gt C
O2e
)
2,000
1,600
1,200
800
400
0
-400
-800
Cum
ulat
ive
Emis
sion
s by
Sec
tor (
Gt C
O2e
)
AFOLU Energy Emissions Miscellaneous F-gases (RCP 6.0)
20
15
20
30
20
40
20
50
20
60
20
70
20
80
20
90
210
0
CUMULATIVE F-GASES
CUMULATIVE - MISCELLANEOUS
CUMULATIVE - ENERGY EMISSIONS
CUMULATIVE - AFOLU EMISSIONS

POSITIVE DISRUPTION: LIMITING GLOBAL TEMERATURE RISE TO WELL BELOW 2 C° 42
CREATING A CLEAN, PROSPEROUS, AND SECURE LOW-CARBON FUTURE
RO
CKY MOUNTAIN
INSTIT UTE
PATHWAY TO A SUSTAINABLE FUTURE Although our five scenarios show very different adoption levels for different technologies and somewhat different temperature changes relative to preindustrial temperatures, the important conclusion is that from the most conservative to the most aggressive, all five scenarios get us to the “well below 2 C°” goal. The most aggressive scenario—Scenario 1, which addresses growing F-gas emissions as well—limits global temperature change to 1.47 C° by the end of the century.
FIGURE 22: GLOBAL AVERAGE TEMPERATURE CHANGE ABOVE PREINDUSTRIAL ERA UNDER DIFFERENT SCENARIOS
FIGURE 23: ATMOSPHERIC CO2E CONCENTRATION UNDER DIFFERENT SCENARIOS
2015 2020 2025 2030 2035 2040 2045 2050 2055 2060 2065 2070 2075 2080 2085 2090 2095 2100
Tem
pera
ture
Incr
ease
Abo
ve P
rein
dust
rial A
vera
ge (C
°)
4.00
3.50
3.00
2.50
2.00
1.50
1.00
0.50
0.00
BAU Scenario 1 Scenario 2 Scenario 3 Scenario 4 Scenario 5
3.62
1.47
1.77
2015 2020 2025 2030 2035 2040 2045 2050 2055 2060 2065 2070 2075 2080 2085 2090 2095 2100
CO
2e C
once
ntra
tion
in th
e At
mos
pher
e (p
pm)
900
800
700
600
500
400
300
200
100
0
BAU Scenario 1 Scenario 2 Scenario 3 Scenario 4 Scenario 5
757
461
423
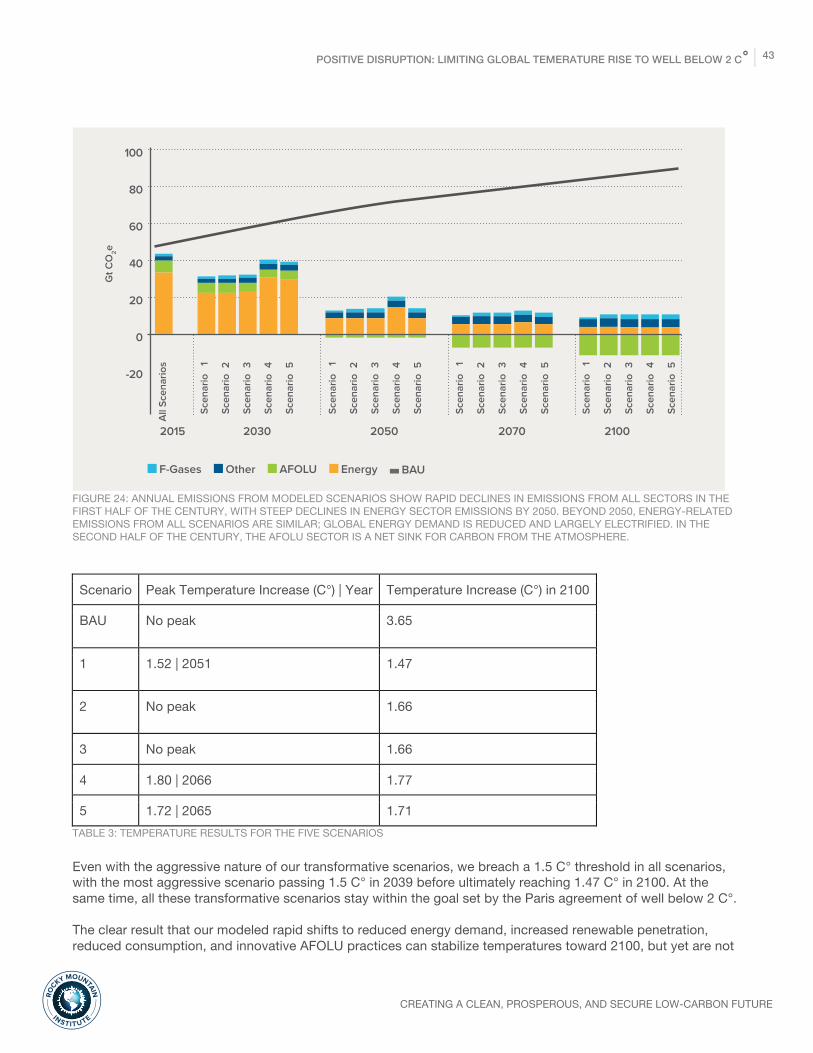
POSITIVE DISRUPTION: LIMITING GLOBAL TEMERATURE RISE TO WELL BELOW 2 C° 43
CREATING A CLEAN, PROSPEROUS, AND SECURE LOW-CARBON FUTURE
RO
CKY MOUNTAIN
INSTIT UTE
FIGURE 24: ANNUAL EMISSIONS FROM MODELED SCENARIOS SHOW RAPID DECLINES IN EMISSIONS FROM ALL SECTORS IN THE FIRST HALF OF THE CENTURY, WITH STEEP DECLINES IN ENERGY SECTOR EMISSIONS BY 2050. BEYOND 2050, ENERGY-RELATED EMISSIONS FROM ALL SCENARIOS ARE SIMILAR; GLOBAL ENERGY DEMAND IS REDUCED AND LARGELY ELECTRIFIED. IN THE SECOND HALF OF THE CENTURY, THE AFOLU SECTOR IS A NET SINK FOR CARBON FROM THE ATMOSPHERE.
Scenario Peak Temperature Increase (C°) | Year Temperature Increase (C°) in 2100
BAU No peak 3.65
1 1.52 | 2051 1.47
2 No peak 1.66
3 No peak 1.66
4 1.80 | 2066 1.77
5 1.72 | 2065 1.71 TABLE 3: TEMPERATURE RESULTS FOR THE FIVE SCENARIOS Even with the aggressive nature of our transformative scenarios, we breach a 1.5 C° threshold in all scenarios, with the most aggressive scenario passing 1.5 C° in 2039 before ultimately reaching 1.47 C° in 2100. At the same time, all these transformative scenarios stay within the goal set by the Paris agreement of well below 2 C°. The clear result that our modeled rapid shifts to reduced energy demand, increased renewable penetration, reduced consumption, and innovative AFOLU practices can stabilize temperatures toward 2100, but yet are not
F-Gases Other AFOLU Energy BAU
Scen
ario
1
Scen
ario
2
Scen
ario
3
Scen
ario
4
Scen
ario
5
2015
Gt C
O2e
100
80
60
40
20
0
-20
2030 2050 2070 2100
Scen
ario
1
Scen
ario
2
Scen
ario
3
Scen
ario
4
Scen
ario
5
All
Scen
ario
s
Scen
ario
1
Scen
ario
2
Scen
ario
3
Scen
ario
4
Scen
ario
5
Scen
ario
1
Scen
ario
2
Scen
ario
3
Scen
ario
4
Scen
ario
5

POSITIVE DISRUPTION: LIMITING GLOBAL TEMERATURE RISE TO WELL BELOW 2 C° 44
CREATING A CLEAN, PROSPEROUS, AND SECURE LOW-CARBON FUTURE
RO
CKY MOUNTAIN
INSTIT UTE
sufficient to keep increases in global temperature below 1.5 C°, reinforces the necessity of immediate, concerted, and significant action to combat emissions.
A Call to Action An unprecedented, market-driven and technology-enabled clean energy transition is underway globally. At current trends, growth in renewable energy and energy efficiency, coupled with concerted action on agricultural and land-use emissions could set us on a pathway where global temperature change can be limited to well below 2 C°. President Obama echoed this sentiment in a piece in Science, arguing that the changing political environment will have little impact on the clean energy transition that is already underway globally.132 He suggested that decoupling emissions and economic growth, strong business incentives for emission reductions, improvement in renewable energy economics, and a strong global consensus around climate change ensures that this transition is now on an irreversible path. Similar pronouncements that extol a transition to clean energy sources purely based on market forces have reverberated through the investment community and independent analysts.133 The power of markets to drive radical transformation can’t be underestimated. Yet it is important to reiterate that rapid and sustained technological revolutions also rely on other preconditions including:
● Accelerating improvement in technologies in conjunction with rapidly scaling mass production ● S-curves of market diffusion for disruptive technologies ● Cascading systemic effects from convergent changes in technology
Several actions—by governments, businesses, and civil society—could ensure that these factors are fully enabled to accelerate the energy transition.
Increase investment in research and development (R&D) Investment in R&D must continue to improve renewable energy technologies by reducing capital costs and increasing efficiency. Further coordination among businesses and research labs, and sharing of intellectual property, will allow the industry to realize technological improvements that mirror Moore’s law in the semiconductor industry. Such efforts are already underway globally. Mission Innovation, a global initiative of 22 countries and the European Union seeks to dramatically accelerate global clean energy innovation. Participating countries have committed to double their governments’ clean energy R&D investment over five years, while working with private sector investors to take technologies from the lab to the market.134 The Breakthrough Energy Coalition, a partnership between private sector actors and 20 governments globally, has committed to deploying US$1 billion toward breakthrough energy technologies across the electricity, transportation, agriculture, manufacturing, and building sectors.135
Create stable markets for renewable energy Apart from R&D, renewable energy growth will need to be anchored by sustained demand. While Germany and Denmark were the first adopters, large developing countries such as China and India will continue to drive demand for renewable energy far into the future. India’s ambitious target to install a cumulative capacity of 175 GW of renewable energy by 2022 provides the much-needed investment and policy certainty to manufacturers and market makers.136 It is on the back of such strong political and business leadership that in 2015 alone, year-on-year growth rates for solar photovoltaics (PV) in China and India were approximately 300 percent and 137 percent, respectively. Government policies enabling market creation elsewhere will help spur investment in renewables by improving the global outlook for a low-carbon future. Policies can help reduce risk for investors in clean energy, thereby driving rapid scale-up. The Paris Agreement and the International Solar Alliance are such policy forums that should aid the market penetration of renewable energy.

POSITIVE DISRUPTION: LIMITING GLOBAL TEMERATURE RISE TO WELL BELOW 2 C° 45
CREATING A CLEAN, PROSPEROUS, AND SECURE LOW-CARBON FUTURE
RO
CKY MOUNTAIN
INSTIT UTE
Focusing on markets where energy infrastructure does not exist will enable energy technology leapfrogging, with limited entrenched interest resistance to a clean energy transition. Additional financing to help such countries deploy renewable energy will be critical in helping solve this global problem. As the United Nations Environmental Program notes, annual emissions could drop by nearly one billion tonnes if developed countries were to deliver on their commitments to provide US$100 billion in annual climate financing.137 But the Green Climate Fund—created within the United Nations Framework Convention on Climate Change to assist developing countries in adapting to and mitigating the effects of climate change, and funded with a total of roughly US$10 billion so far—will require much higher levels of private sector capital to achieve its goals.
Adopt new and innovative business models to encourage uptake of disruptive technologies and land management practices Business and revenue models such as those developed at SolarCity, Tesla Motors, Renovate America, Nest, and others must continue to evolve and increase their current market footprint and capacity. While many market players are fixated on new technologies to solve the climate crisis, those that already exist are proven to meet the challenge and simply need to be better capitalized and supported in increasing their market share. As stated previously, the pace of adoption of most technologies today is much faster than ever before. At the same time, businesses must learn to adapt or recreate business models for emerging economies. Different social, cultural, and capital norms require businesses to create new offerings that may be radically different from those in the West. Leasing and micro-financing models such as those in Bangladesh and Rwanda could be considered as models for wide-scale adoption.138 The same level of market momentum needs to be replicated on the agriculture and land use side. Many players have entered the market with innovative ways to increase yields and reduce or sequester emissions. Intentionally propagating these business models and approaches will enable a much more rapid and vibrant transition to sustainable land management practices.
Eliminate fossil fuel subsidies In an attempt to recalibrate investors’ risk perception, in 2013 the Carbon Tracker Initiative found that “60–80 percent of coal, oil, and gas reserves of publicly listed companies are ‘unburnable’ if the world is to have a chance of not exceeding global warming of [2 C°].” This did not even take into consideration the fact that these fuels will likely cease to be economically competitive with renewables in the future as their costs continue to decline. Despite such large reserves, global spend on fossil fuel exploration and production in 2012 exceeded $674 billion globally. Other studies estimate that global fossil fuel subsidies vary between $490 billion and $1 trillion annually, with more than $100 billion spent on subsidizing production activities.139 On the other hand, global subsidies for renewable energy for 2014 were much lower at $112 billion, in addition to another $23 billion for biofuel subsidies.140 This disparity discourages renewable energy adoption at the expense of ever increasing fossil fuel consumption. Despite vows from the G20—an international forum of the world’s 19 largest economies plus the European Union—to end fossil fuel subsidies in the medium term, there is little progress to show, and the U.S. Administration apparently aims to re-advantage fossil fuels. Studies suggest that eliminating fossil fuel subsidies alone could reduce national emissions by 11 percent. If a third of the savings from fossil fuel subsidy reduction were to be reinvested into renewable energy and energy efficiency projects, emissions could be “reduced further to an average of 18 percent by 2020.”141
POSITIVE DISRUPTION: LIMITING GLOBAL TEMERATURE RISE TO WELL BELOW 2 C° 46
CREATING A CLEAN, PROSPEROUS, AND SECURE LOW-CARBON FUTURE
RO
CKY MOUNTAIN
INSTIT UTE
Place a price on carbon Putting a price on carbon emissions commensurate to the economic damages it causes is the most economically efficient way to shrink emissions. Economists have long advocated this measure as it is relatively easy to enforce and gives a direct market signal to all consumers. Revenue raised from this policy could be recycled and used to lower taxes, as well as to invest in R&D in renewable energy, carbon sequestration, and climate change. At present, there is significant debate around the value of or the mechanism of implementation of this carbon price. Yet, there is ample consensus that putting a price on upstream sources of carbon emissions could be the most effective tool to steer our economy away from carbon-intensive services and goods, and incentivize sustainable ways of production and consumption.142
Better understand and track emission sources and mitigation potential from the AFOLU sectors Emissions from land use change make up roughly a quarter of all annual GHG emissions globally yet emissions from the AFOLU sector are poorly prioritized and managed. This is partly due to a lack of high-resolution data on crop production and piecemeal research around soil systems and forest degradation. The mitigation potential and business models of sustainable and somewhat “boutique” agricultural and silvicultural practices needs to be better understood and aggressively propagated to the mainstream market. Further research will help identify specific high priority target areas and high impact policies to lower AFOLU emissions. Resources will be required to retool the sector and to transition lands managed using unsustainable practices to more cutting-edge and climate-positive land management techniques.
Better understand and account for global temperature variations from natural systems Longer-term, background temperature shifts, or oscillations, from such phenomena as the Interdecadal Pacific Oscillation may lead to warming in the near future, passing temperature targets set at the Paris Accords several years earlier than expected.143 Continued research of natural systems and an improved understanding of how they contribute to global temperature change will better inform policy makers of the required emission reductions necessary to achieve temperature targets.
Encourage behavior change to combat climate change Aside from technological and business solutions, we cannot and must not ignore the importance of social and cultural change to combat climate change. Holistic solutions for climate change involve significant changes in consumption behavior and models. Business models reliant on higher consumption will continue to demand ever more natural capital. Instead, reducing consumption, without adversely affecting consumers’ utility and quality of life will result in lower-cost pathways. Replacing commodity-driven economic structures with those based on services and a sharing economy will result in higher productivity and reduce the impact on our natural environment while simultaneously creating many new jobs.144 This will likely align provider and customer incentives so both make money the same way, by doing more and better with less for longer, shifting consumption from an ownership to a user-ship model, which could rest on a marketplace model where prices of products could be based on their use history. Not only will this bring higher quality, luxury products at the entry level, this will also encourage producers to incorporate sustainable design elements such that parts can be reused or recycled at the end of the products’ lifestyle. This entire framework rests on the promotion and espousal of a “green is good life” that is built on “healthy lives, with a high proportion of intangibles in consumption and creativity.”145

POSITIVE DISRUPTION: LIMITING GLOBAL TEMERATURE RISE TO WELL BELOW 2 C° 47
CREATING A CLEAN, PROSPEROUS, AND SECURE LOW-CARBON FUTURE
RO
CKY MOUNTAIN
INSTIT UTE
The Need for Urgent Action An energy transformation big enough and fast enough to hold the global average temperature rise to well below 2 C°, although daunting, is both practical and possible. Such a conclusion against despair relies not simply on mandates or hoped-for inventions but on current capabilities implemented by business-led, market-driven, and often highly profitable solutions. Despite the shift in U.S. federal policies, new subnational coalitions are starting to emerge. Nine states including New York, Washington, and California; 218 cities; 310 universities; and more than 1,500 businesses are preparing a plan to fill the void left in the wake of U.S. withdrawal from the Paris Agreement.146 Elsewhere, multiple nations, including China, India, Germany, France, and Italy, have reaffirmed their commitment to the Paris Agreement.147 Similarly, reforms in farming, forests, grazing, and other land-use practices can move enough carbon from air to soil to achieve a world well below 2 C°. Business leadership and engaged consumers can together deliver a world with the same or better energy services and food production at a cost trillions of dollars lower than business as usual while providing significant non-energy benefits for health, development, prosperity, equity, and security. Trends indicate that this transition is not only profitable but can generate millions of new jobs. Making this future happen will be an enormous challenge—but not an impossible one. And although the power of markets to drive such a radical transformation is potentially great, both the energy sector transition and the AFOLU transformation will require robust market and policy frameworks to succeed at the necessary scale and speed. In order to arrest global climate change with urgency and efficiency, we need all hands on deck and above all, applied hope in the face of the most challenging task humanity has ever undertaken.

POSITIVE DISRUPTION: LIMITING GLOBAL TEMERATURE RISE TO WELL BELOW 2 C° 48
CREATING A CLEAN, PROSPEROUS, AND SECURE LOW-CARBON FUTURE
RO
CKY MOUNTAIN
INSTIT UTE
APPENDIX Scenario Comparison Table
Energy Supply† Energy Demand† Agriculture, Forestry, and Land Use
F-Gases and Other Forcings
SolarPV Wind Buildings Efficiency (% reduction below BAU)
Light-Duty Vehicle Electrification (% LDV-kilometers [eVKTs] electrified)
Business as Usual
Based on IEA Current Policies Scenario to 2040. GCAM 3.0 Baseline Limited Technology Scenario is used to extend projections from 2040 to 2100.
GHG emissions data from the Food and Agriculture Organization of the United Nations (FAO) FAOSTAT database used for projections to 2040. Values extrapolated to 2100 using curve-fitting population growth estimates.
RCP 8.5 trajectory (same trajectory for BAU and scenarios 2, 3, 4, 5)
Scenario 1: Most Aggressive
High S-curve growth anticipated for solar PV. Penetration of solar in global supply portfolio eventually saturates at 60%.∆
High S-curve growth anticipated for wind. Extrapolating from Reinventing Fire and Reinventing Fire: China 2050 values, penetration of wind in supply portfolio saturates at 39% for OECD countries and at 25% for non-OECD countries*
High For OECD, based on Reinventing Fire’s Scenario 3 Electricity 2050 – 51% 2100 – 73% Heat 2050 – 53% 2100 – 77% For non- OECD, based on Reinventing Fire: China Electricity 2050 – 30% 2100 – 48% Heat 2050 – 33% 2100 – 54%
High For OECD, based on IEA Global EV Outlook 2016: 2030 – 10%, 2050 – 40%* For non- OECD, based on UNEP EV scenarios and road map for India, and recent plans to target 100% EV sales for India by 2030: 2030 – 35% *
Modeled emission reduction vectors: • Reduced consumption of beef • Conservation agriculture, grazing management, and land restoration • Biomass pyrolysis • Land conversion to forest In all scenarios, the rate of emission reduction was the same. For more details, please read the technical appendix.
RCP 6.0 trajectory
Scenario 2: Aggressive
High S-curve growth anticipated for solar PV. Penetration of solar in global supply portfolio eventually saturates at 60%.Δ
High S-curve growth anticipated for wind. Extrapolating from Reinventing Fire and Reinventing Fire: China 2050 values, penetration of wind in supply portfolio saturates at 39% for OECD countries and at 25% for non-OECD countries.*
High For OECD, based on Reinventing Fire’s Scenario 3 Electricity 2050 – 51% 2100 – 73% Heat 2050 – 53% 2100 – 77% For non- OECD, based on Reinventing Fire: China Electricity 2050 – 30% 2100 – 48% Heat 2050 – 33% 2100 – 54%
High For OECD, based on IEA Global EV Outlook 2016: 2030 – 10%, 2050 – 40%* For non- OECD, based on UNEP EV scenarios and road map for India, and recent plans to target 100% EV sales for India by 2030: 2030 – 35% *
Modeled emission reduction vectors: • Reduced consumption of beef • Conservation agriculture, grazing management, and land restoration • Biomass pyrolysis • Land conversion to forest In all scenarios, the rate of emission reduction was the same. For more details, please read the technical appendix.
RCP 8.5 trajectory (same trajectory for BAU and scenarios 2, 3, 4, 5)
Scenario 3: Aggressive
High S-curve growth anticipated for solar PV. Penetration
High S-curve growth anticipated for wind. Extrapolating
Low For OECD, percent reduction below BAU based on
HighForOECD,
basedonIEAGlobalEVOutlook2016:2030–10%,
Modeledemissionreduction
vectors:
•Reducedconsumption
ofbeef
•Conservationagriculture,
grazingmanagement,
RCP8.5
trajectory
(same
trajectory
forBAU
and
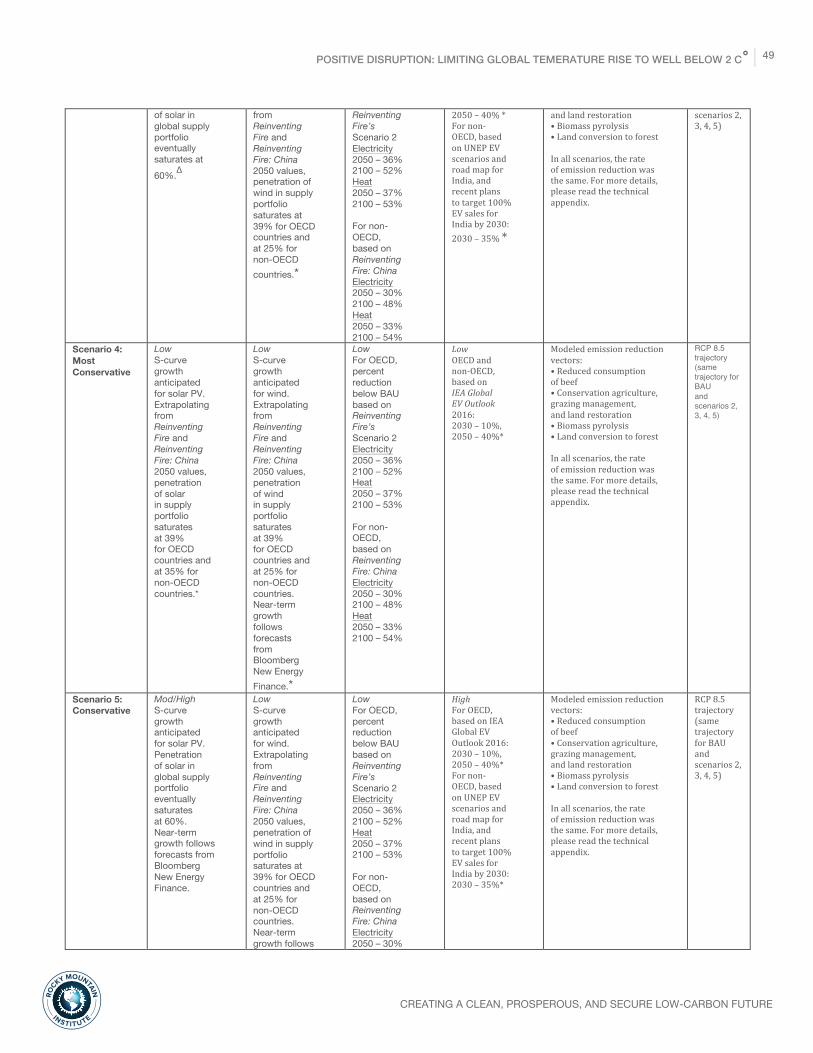
POSITIVE DISRUPTION: LIMITING GLOBAL TEMERATURE RISE TO WELL BELOW 2 C° 49
CREATING A CLEAN, PROSPEROUS, AND SECURE LOW-CARBON FUTURE
RO
CKY MOUNTAIN
INSTIT UTE
of solar in global supply portfolio eventually saturates at 60%.Δ
from Reinventing Fire and Reinventing Fire: China 2050 values, penetration of wind in supply portfolio saturates at 39% for OECD countries and at 25% for non-OECD countries.*
Reinventing Fire’s Scenario 2 Electricity 2050 – 36% 2100 – 52% Heat 2050 – 37% 2100 – 53% For non- OECD, based on Reinventing Fire: China Electricity 2050 – 30% 2100 – 48% Heat 2050 – 33% 2100 – 54%
2050–40%*
Fornon-
OECD,based
onUNEPEV
scenariosand
roadmapfor
India,and
recentplans
totarget100%
EVsalesfor
Indiaby2030:
2030–35%*
andlandrestoration
•Biomasspyrolysis
•Landconversiontoforest
Inallscenarios,therate
ofemissionreductionwas
thesame.Formoredetails,
pleasereadthetechnical
appendix.
scenarios2,
3,4,5)
Scenario 4: Most Conservative
Low S-curve growth anticipated for solar PV. Extrapolating from Reinventing Fire and Reinventing Fire: China 2050 values, penetration of solar in supply portfolio saturates at 39% for OECD countries and at 35% for non-OECD countries.*
Low S-curve growth anticipated for wind. Extrapolating from Reinventing Fire and Reinventing Fire: China 2050 values, penetration of wind in supply portfolio saturates at 39% for OECD countries and at 25% for non-OECD countries. Near-term growth follows forecasts from Bloomberg New Energy Finance.*
Low For OECD, percent reduction below BAU based on Reinventing Fire’s Scenario 2 Electricity 2050 – 36% 2100 – 52% Heat 2050 – 37% 2100 – 53% For non- OECD, based on Reinventing Fire: China Electricity 2050 – 30% 2100 – 48% Heat 2050 – 33% 2100 – 54%
LowOECDand
non-OECD,
basedon
IEAGlobalEVOutlook2016:
2030–10%,
2050–40%*
Modeledemissionreduction
vectors:
•Reducedconsumption
ofbeef
•Conservationagriculture,
grazingmanagement,
andlandrestoration
•Biomasspyrolysis
•Landconversiontoforest
Inallscenarios,therate
ofemissionreductionwas
thesame.Formoredetails,
pleasereadthetechnical
appendix.
RCP 8.5 trajectory (same trajectory for BAU and scenarios 2, 3, 4, 5)
Scenario 5: Conservative
Mod/High S-curve growth anticipated for solar PV. Penetration of solar in global supply portfolio eventually saturates at 60%. Near-term growth follows forecasts from Bloomberg New Energy Finance.
Low S-curve growth anticipated for wind. Extrapolating from Reinventing Fire and Reinventing Fire: China 2050 values, penetration of wind in supply portfolio saturates at 39% for OECD countries and at 25% for non-OECD countries. Near-term growth follows
Low For OECD, percent reduction below BAU based on Reinventing Fire’s Scenario 2 Electricity 2050 – 36% 2100 – 52% Heat 2050 – 37% 2100 – 53% For non- OECD, based on Reinventing Fire: China Electricity 2050 – 30%
HighForOECD,
basedonIEA
GlobalEV
Outlook2016:
2030–10%,
2050–40%*
Fornon-
OECD,based
onUNEPEV
scenariosand
roadmapfor
India,and
recentplans
totarget100%
EVsalesfor
Indiaby2030:
2030–35%*
Modeledemissionreduction
vectors:
•Reducedconsumption
ofbeef
•Conservationagriculture,
grazingmanagement,
andlandrestoration
•Biomasspyrolysis
•Landconversiontoforest
Inallscenarios,therate
ofemissionreductionwas
thesame.Formoredetails,
pleasereadthetechnical
appendix.
RCP8.5
trajectory
(same
trajectory
forBAU
and
scenarios2,
3,4,5)

POSITIVE DISRUPTION: LIMITING GLOBAL TEMERATURE RISE TO WELL BELOW 2 C° 50
CREATING A CLEAN, PROSPEROUS, AND SECURE LOW-CARBON FUTURE
RO
CKY MOUNTAIN
INSTIT UTE
forecasts from Bloomberg New Energy Finance.*
2100 – 48% Heat 2050 – 33% 2100 – 54%
† This table includes only those variables that change across the four scenarios. To know about the methodology employed to calculate other variables, please read the supplementary technical materials. * 2100 or 2050 values in these cases were determined by curve-fitting methods. For details, please read the supplementary technical materials. Δ These values represent a hypothetical what-if scenario for global solar growth. The year in which saturation of penetration levels of solar or wind occurs are not specified in this formulation but are implicitly calculated in the log-linear functions used. For details, please read the supplementary technical materials.

POSITIVE DISRUPTION: LIMITING GLOBAL TEMERATURE RISE TO WELL BELOW 2 C° 51
CREATING A CLEAN, PROSPEROUS, AND SECURE LOW-CARBON FUTURE
RO
CKY MOUNTAIN
INSTIT UTE
ENDNOTES 1 The Emissions Gap Report 2016: A UNEP Synthesis Report, United Nations Environment Program, November 2016, http://wedocs.unep.org/bitstream/handle/20.500.11822/10016/emission_gap_report_2016.pdf. 2 James Hansen et al., “Ice Melt, Sea Level Rise and Superstorms: Evidence from Paleoclimate Data, Climate Modeling, and Modern Observations that 2 °C Global Warming Could Be Dangerous,” Atmospheric Chemistry and Physics 16, no. 6 (2016): 3761-3812. 3 “Statement by President Trump on the Paris Climate Accord,” The White House, Office of the Press Secretary, June 1, 2017, https://www.whitehouse.gov/the-press-office/2017/06/01/statement-president-trump-paris-climate-accord. 4 Carlota Perez, Technological Revolutions and Financial Capital: The Dynamics of Bubbles and Golden Ages, (Cheltenham: Edward Elgar Publishing, 2014). 5 Joseph A. Schumpter, Capitalism, Socialism and Democracy, (New York: Harper & Brothers, 1942). 6 W. Brian Arthur, Complexity and the Economy, (New York, NY: Oxford University Press, 2015). 7 Carlota Perez, Technological Revolutions and Financial Capital: The Dynamics of Bubbles and Golden Ages (Cheltenham: Edward Elgar Publishing, 2014). 8 A. Bejan and S. Lorente, “The Constructal Law Origin of the Logistics S-curve,” Journal of Applied Physics 110 (2011). 9 Benjamin K. Sovacool, “How Long Will It Take: Conceptualizing the Temporal Dynamics of Energy Transitions,” Energy Research and Social Science 13 (2016): 202-215. 10 Vaclav Smil, “A Skeptic Looks at Alternative Energy,” IEEE Spectrum, June 28, 2012, http://spectrum.ieee.org/energy/renewables/a-skeptic-looks-at-alternative-energy; Phillip Killeen, “Moving Beyond the Generation Fixation: Grid Transformation Key to Delivering on Paris,” WorldWatch Institute (blog), last modified August 17, 2016, http://blogs.worldwatch.org/grid-transformation-paris/; William D. Nordhaus, “Projections and Uncertainties about Climate Change in an Era of Minimal Climate Policies,” Yale University, http://cowles.yale.edu/sites/default/files/files/pub/d20/d2057.pdf. 11 Gert Jan Kramer and Martin Haigh, “No Quick Switch to Low-Carbon Energy,” Nature 462, no. 7273 (2009): 568-569. 12 Ibid. 13 Pilita Clark, “The Big Green Bang: How Renewable Energy Became Unstoppable,” Financial Times, May 18, 2017, https://www.ft.com/content/44ed7e90-3960-11e7-ac89-b01cc67cfeec. 14 Janet L. Sawin, Kristin Seyboth, and Freyr Sverrisson, Renewables 2017–Global Status Report, Renewable Energy Policy Network for the 21st Century, June 2016, http://www.ren21.net/wp-content/uploads/2017/06/17-8399_GSR_2017_Full_Report_0621_Opt.pdf. 15 Sawin, Renewables 2017—Global Status Report; Rainer Quitzow, Sybille Roehrkasten, and Martin Jaenicke, “The German Energy Transition in International Perspective,” Potsdam, Germany: Institute for Advanced Sustainability Studies, March 2016, http://www.iass-potsdam.de/sites/default/files/files/iass_study_thegermanenergytransition_ininternationalperspective_en.pdf.
POSITIVE DISRUPTION: LIMITING GLOBAL TEMERATURE RISE TO WELL BELOW 2 C° 52
CREATING A CLEAN, PROSPEROUS, AND SECURE LOW-CARBON FUTURE
RO
CKY MOUNTAIN
INSTIT UTE
16 “Iowa Wind Energy,” American Wind Energy Association, http://awea.files.cms-plus.com/FileDownloads/pdfs/Iowa.pdf. 17 Sawin, Renewables 2017—Global Status Report 18 “A Record Year for India Forecasted with Approximately 10 GW of Solar Installations in 2017,” Mercom Capital Group, http://mercomcapital.com/a-record-year-for-india-forecasted-with-approximately-10-gw-of-solar-installations-in-2017. 19 India Leaps Ahead: Transformative Mobility Solutions for All, NITI Aayog and Rocky Mountain Institute, May 2017, https://www.rmi.org/insights/reports/transformative_mobility_solutions_india 20 Benjamin K. Sovacool, “How Long Will It Take: Conceptualizing the Temporal Dynamics of Energy Transitions,” Energy Research and Social Science 13 (2016): 202-215. 21 “The Low Carbon Economy,” Goldman Sachs, last modified November 30, 2015, http://www.goldmansachs.com/our-thinking/pages/new-energy-landscape-folder/report-the-low-carbon-economy/report.pdf. 22 Michael Scholand, “Fast Learning Curves – LED Lighting’s Rapid Reduction in Price,” CLASP Europe, http://clasp.ngo/~/media/Files/LEDs/CLASP-LED-Lamp-Pricing%20Memo-Global-and-five-EU-countries.pdf. 23 M. Mitchell Waldrop, “The Chips are Down for Moore’s Law,” Nature 530 (2016): 144-147. 24 Ibid. 25 Bela Nagy, J. Doyne Farmer, Quan M. Bui, and Jessika E. Trancik, “Statistical Basis for Predicting Technological Progress,” PloS one 8, no. 2 (2013). 26 Ibid. 27 Brian Matas, “Semiconductor Shipments Dominated by Opto-Sensor-Discrete Devices,” IC Insights, March 9, 2017, http://www.icinsights.com/data/articles/documents/961.pdf. 28 Waldrop, “The Chips Are Down for Moore’s law.” 29 International Technology Roadmap for Photovoltaic (ITRPV) 2016 Results, Eighth Edition, March 2017, http://www.itrpv.net/.cm4all/iproc.php/ITRPV%20Eighth%20Edition%202017.pdf. 30 Ryan Wiser, Karen Jenni, Joachim Seel, Erin Baker, Maureen Hand, Eric Lantz, and Aaron Smith, Forecasting Wind Energy Costs and Cost Drivers: The Views of the World’s Leading Experts, Lawrence Berkeley National Laboratory; National Renewable Energy Laboratory, IEA Wind, June 2016, https://emp.lbl.gov/sites/all/files/lbnl-1005717.pdf. 31 “Batteries Storing Power Seen as Big as Rooftop Solar in 12 Years,” Bloomberg.com, June 13, 2016, https://www.bloomberg.com/news/articles/2016-06-13/batteries-storing-power-seen-as-big-as-rooftop-solar-in-12-years. 32 International Technology Roadmap for Photovoltaic (ITRPV) 2016 Results, Eighth Edition, March 2017, http://www.itrpv.net/.cm4all/iproc.php/ITRPV%20Eighth%20Edition%202017.pdf.
POSITIVE DISRUPTION: LIMITING GLOBAL TEMERATURE RISE TO WELL BELOW 2 C° 53
CREATING A CLEAN, PROSPEROUS, AND SECURE LOW-CARBON FUTURE
RO
CKY MOUNTAIN
INSTIT UTE
33 M. Mitchell Waldrop, “More than Moore,” Nature 530, no. 7589 (2016): 144. 34 Elon Musk, “All Our Patent Are Belong To You,” Tesla, June 12, 2014, https://www.tesla.com/blog/all-our-patent-are-belong-you. 35 India Leaps Ahead, RMI 36 Jason Deign, “10 Battery Gigafactories Are Now in the Works. And Elon Musk May Add 4 More,” Greentech Media, June 29, 2017, https://www.greentechmedia.com/articles/read/10-battery-gigafactories-are-now-in-progress-and-musk-may-add-4-more. 37 Eric Wesoff. “How Soon Can Tesla Get Battery Cell Costs Below $100 per Kilowatt-Hour?,” Greentech Media, March 15, 2016, https://www.greentechmedia.com/articles/read/How-Soon-Can-Tesla-Get-Battery-Cell-Cost-Below-100-per-Kilowatt-Hour; and Ethan Zindler, Colleen Regan, Rachel Jiang, et al., “Sustainable Energy in America: Factbook 2017,” Bloomberg New Energy Finance, July 17, 2017, http://www.bcse.org/wp-content/uploads/2017-Sustainable-Energy-in-America-Factbook-Slideshow.pdf. 38 Paolo Frankl, Technology Roadmap - Solar Photovoltaic Energy, International Energy Agency, 2010, https://www.iea.org/publications/freepublications/publication/pv_roadmap.pdf. 39 Sawin, Renewables 2017—Global Status Report. 40 Nancy M. Haegel, et al., “Terawatt-Scale Photovoltaics: Trajectories and Challenges,” Science 356, no. 6334 (2017): 141-143. Supplementary Materials. 41 Ibid. 42 “Indian Solar Tariffs Fall 25% in Three Months,” Bridge to India, May 15, 2017, http://www.bridgetoindia.com/indian-solar-tariffs-fall-25-three-months/. 43 John Fitzgerald Weaver, “Solar Power at 1¢/kWh By 2025 – ‘The Promise of Quasi-Infinite and Free Energy is Here,’” Elektrek.co., last modified December 28, 2016, https://electrek.co/2016/12/28/solar-power-at-1%C2%A2kwh-by-2025-the-promise-of-quasi-infinite-and-free-energy-is-here/. 44 Carlota Perez, Technological Revolutions and Financial Capital: The Dynamics of Bubbles and Golden Ages, (Cheltenham: Edward Elgar Publishing, 2014). 45 Christoph Burger, Andreas Kuhlmann, Philipp Richard, and Jens Weinmann, Blockchain in the Energy Transition – A Survey among Decision-Makers in the German Energy Industry, Deutsche Energie-Agentur GmbH (dena) - German; ESMT European School of Management and Technology GmbH Energy Agency, November 2016, https://www.esmt.org/system/files_force/dena_esmt_studie_blockchain_english.pdf?download=1. 46 “Renewable Capacity Addition Catches Up with Thermal Power in India,” Bridge to India, April 10, 2017, http://www.bridgetoindia.com/renewable-capacity-addition-catches-thermal- power-india/. 47 Adair Turner, et al., Better Energy, Greater Prosperity: Achievable Pathways to Low-Carbon Energy Systems, The Energy Transitions Commission, April 2017, http://energy- transitions.org/sites/default/files/BetterEnergy_fullReport_DIGITAL.PDF. 48 India Leaps Ahead, RMI.
POSITIVE DISRUPTION: LIMITING GLOBAL TEMERATURE RISE TO WELL BELOW 2 C° 54
CREATING A CLEAN, PROSPEROUS, AND SECURE LOW-CARBON FUTURE
RO
CKY MOUNTAIN
INSTIT UTE
49 Vaclav Smil, “Nitrogen Cycle and World Food Production,” World Agriculture 2 (2011). 50 Michael Pollan, The Omnivore’s Dilemma: A Natural History of Four Meals (New York: Penguin, 2008). 51 Ralph W.F. Hardy, Biological Nitrogen Fixation: Research Challenges – A Review of Research Grants Funded by the U.S. Agency for International Development (Washington, D.C.: National Academy Press, 1994). 52 Richard H. Steckel and William J. White, “Engines of Growth: Farm Tractors and Twentieth-century U.S. Economic Welfare,” National Bureau of Economic Research, http://www.nber.org/papers/w17879.pdf. 53 Michael D. Edgerton, “Increasing Crop Productivity to Meet Global Needs for Feed, Food, and Fuel,” Plant Physiology 149 (2009): 7–12. 54 Nancy Trautmann, Keith Porter, and Robert Wagenet, “Modern Agriculture: Its Effects on the Environment,” Cornell University: Cooperative Extension, accessed November 2016, http://psep.cce.cornell.edu/facts-slides-self/facts/mod-ag-grw85.aspx. 55 Chris Arsenault, “Only 60 Years of Farming Left if Soil Degradation Continues,” Scientific American, accessed November 2016, https://www.scientificamerican.com/article/only-60-years-of-farming-left-if-soil-degradation-continues/#. 56 Joseph Alcamo and Elena Bennett, Ecosystems and Human Well-being: A Framework for Assessment (Washington, D.C.: Island Press, 2003). 57 Alice Kenny, “Ecosystem Services in New York City Watershed,” Ecosystem Marketplace: A Forest Trends Initiative, http://www.ecosystemmarketplace.com/articles/ecosystem-services-in-the-new-york-city-watershed-1969-12-31/. 58 B. Bellotti and J.F. Rochecouste, “The Development of Conservation Agriculture in Australia—Farmers as innovators,” International Soil and Water Conservation Research 2 (2014): 21-34. 59 Organic Agriculture and Climate Change Mitigation - A Report of the Roundtable on Organic Agriculture and Climate Change, Food and Agriculture Organization of the United Nations, http://www.fao.org/docrep/015/i2537e/i2537e00.pdf. 60 “Regenerative Organic Agriculture and Climate Change,” Rodale Institute, https://rodaleinstitute.org/assets/WhitePaper.pdf. 61 Global Organic Foods & Beverages Market | Industry Report, 2014-2025, Grand View Research, http://www.grandviewresearch.com/industry-analysis/organic-foods-beverages-market. 62 “Meat Substitutes Market by Type (Tofu & Tofu Ingredients, Tempeh, Textured Vegetable Protein, Seitan, Quorn), Source (Soy-Based, Wheat-Based, Mycoprotein), Category (Frozen, Refrigerated), and Region – Global Forecast to 2022.” Research and Markets, http://www.researchandmarkets.com/reports/4012515/meat-substitutes-market-by-type-tofu-and-tofu. 63 Jason Moore, “The End of the Road? Agricultural Revolutions in the Capitalist World-Ecology, 1450–2010,” Journal of Agrarian Change 10 (2010): 389–413. 64 Christiana Figueres, Hans J. Schellnhuber, Gail Whiteman, Anthony Hobley, and Stefan Rahmstorf, “Three Years to Safeguard Our Climate,” Nature 546, no. 7660 (2017): 593-595.

POSITIVE DISRUPTION: LIMITING GLOBAL TEMERATURE RISE TO WELL BELOW 2 C° 55
CREATING A CLEAN, PROSPEROUS, AND SECURE LOW-CARBON FUTURE
RO
CKY MOUNTAIN
INSTIT UTE
65 World Energy Outlook 2015, International Energy Agency, https://www.iea.org/Textbase/npsum/WEO2015SUM.pdf. 66 “EMF-27 Scenario Database Version 0.8: EMF27 GCAM3.0 Base-LimTech,” International Institute for Applied Systems Analysis, accessed June 2016, https://tntcat.iiasa.ac.at/EMF27DB/dsd?Action=htmlpage&page=about. 67 Real Prospects for Energy Efficiency in the United States, National Research Council (National Academies Press, 2010). 68 “How Much Does Energy Efficiency Cost?,” American Council for an Energy-Efficient Economy, http://aceee.org/sites/default/files/cost-of-ee.pdf; Frank Ackerman, Pan Knight, and Bruce Biewald, “Estimating the Cost of Saved Energy,” December 2016, http://www.synapse-energy.com/sites/default/files/COSE-EIA-861-Database-66-017.pdf. 69 Janet L. Sawin et al., Renewables 2016 - Global Status Report, Renewable Energy Policy Network for the 21st Century. http://www.ren21.net/wp-content/uploads/2016/10/REN21_GSR2016_FullReport_en_11.pdf. 70 “IEA Finds CO
2 Emissions Flat for a Third Straight Year Even as Global Economy Grew in 2016,” International Energy
Agency, last modified March 17, 2017, https://www.iea.org/newsroom/news/2017/march/iea-finds-co2-emissions-flat-for-third-straight-year-even-as-global-economy-grew.html. 71 Ryan Wiser et al., “Expert Elicitation Survey on Future Wind Energy Costs,” Nature Energy 135 (2016); “SunShot Vision Study,” U.S. Department of Energy, https://www1.eere.energy.gov/solar/pdfs/47927.pdf; http://www.rmi.org/simple; Garrett Fitzgerald, James Mandel, Jesse Morris, and Hervé Touati, The Economics of Battery Energy Storage, Rocky Mountain Institute, https://www.rmi.org/wp-content/uploads/2017/03/RMI-TheEconomicsOfBatteryEnergyStorage-FullReport-FINAL.pdf; The Economics of Grid Defection: When and Where Distributed Solar Generation Plus Storage Competes with Traditional Utility Service, Rocky Mountain Institute, https://rmi.org/insights/reports/economics-grid-defection/. 72 Janet L. Sawin et al., Renewables 2016 - Global Status Report, Renewable Energy Policy Network for the 21st Century. http://www.ren21.net/wp-content/uploads/2016/10/REN21_GSR2016_FullReport_en_11.pdf. 73 Ibid. 74 Michael Liebreich, “Bloomberg New Energy Finance Summit,” Bloomberg, https://data.bloomberglp.com/bnef/sites/14/2017/04/2017-04-25-Michael-Liebreich-BNEFSummit-Keynote.pdf. 75 “Global Trends in Renewable Energy Investment 2016,” United Nations Environment Program and Bloomberg New Energy Finance, http://fs-unep-centre.org/sites/default/files/publications/globaltrendsinrenewableenergyinvestment2016lowres_0.pdf. 76 Katie Fehrenbacher, “Wind Now Competes with Fossil Fuels. Solar Almost Does,” Fortune, October 6, 2015, http://fortune.com/2015/10/06/wind-cheap-coal-gas/. 77 “Global Trends in Renewable Energy Investment 2016,” United Nations Environment Program and Bloomberg New Energy Finance, http://fs-unep-centre.org/sites/default/files/publications/globaltrendsinrenewableenergyinvestment2016lowres_0.pdf. 78 Wendy Koch, “Why Solar and Wind Are Thriving Despite Cheap Fossil Fuels,” National Geographic, June 22, 2016, http://news.nationalgeographic.com/energy/2016/01/160122-why-solar-and-wind-thrive-despite-cheap-oil-and-gas/.

POSITIVE DISRUPTION: LIMITING GLOBAL TEMERATURE RISE TO WELL BELOW 2 C° 56
CREATING A CLEAN, PROSPEROUS, AND SECURE LOW-CARBON FUTURE
RO
CKY MOUNTAIN
INSTIT UTE
79 “New Energy Outlook 2016,” Bloomberg New Energy Finance, http://first.bloomberglp.com/documents/694813008_BNEF_NEO2016_ExecutiveSummary.pdf?elqTrackId. 80 Global Trends in Renewable Energy Investment 2016,” United Nations Environment Program and Bloomberg New Energy Finance, http://fs-unep-centre.org/sites/default/files/publications/globaltrendsinrenewableenergyinvestment2016lowres_0.pdf. 81 Ibid. 82 “Global Greenhouse Gas Emissions Data,” U.S. Environmental Protection Agency, accessed July 2016, https://www.epa.gov/ghgemissions/global-greenhouse-gas-emissions-data. 83 The Emissions Gap Report 2016: A UNEP Synthesis Report, United Nations Environment Program, https://uneplive.unep.org/media/docs/theme/13/Emissions_Gap_Report_2016.pdf. 84 Nikos Alexandratos and Jelle Bruinsma, “World Agriculture Towards 2030/2050: The 2012 Revision,” Food and Agriculture Organization of the United Nations, http://www.fao.org/docrep/016/ap106e/ap106e.pdf. 85 Ibid. 86 Ibid. 87 Ibid. 88 Bosch, Darrell J. "Effects of rotational grazing on carbon dioxide emissions and greenhouse gas credits." Journal of Soil and Water Conservation 63, no. 2 (2008): 51A; Oates, Lawrence G., and Randall D. Jackson. "Livestock management strategy affects net ecosystem carbon balance of subhumid pasture." Rangeland ecology & management 67, no. 1 (2014): 19-29.; Eagle, A., Olander, L., Henry, H., Haugen-Kozyra, K., Miller, N., & Robertson, G. P. (2012). Greenhouse gas mitigation potential of agricultural land management in the United States: A synthesis of the literature. Technical Working Group on Agricultural Greenhouse Gases Report. 89 “Statement: Official Version of ‘Chinese Residents Balanced Diet Pagoda (2016)’,” The Chinese Dietary Guidelines, accessed May 20, 2017, http://dg.cnsoc.org/article/04/8a2389fd54b964c80154c1d781d90197.html; Oliver Milman and Stuart Leavenworth, “China’s Plan to Cut Meat Consumption 50% Cheered by Climate Campaigners, The Guardian, June 20, 2016, https://www.theguardian.com/world/2016/jun/20/chinas-meat-consumption-climate-change 90 “2016: State of the World’s Forests,” Food and Agriculture Organization of the United Nations, http://www.fao.org/3/a-i5588e.pdf. 91 “The State of the World’s Forest Genetic Resources,” Food and Agriculture Organization of the United Nations, http://www.fao.org/3/a-i3825e.pdf; “Global Forest Resources Assessment 2010: Main Report,” Food and Agriculture Organization of the United Nations, http://www.fao.org/docrep/013/i1757e/i1757e.pdf. 92 Ibid. 93 “Global Forest Resources Assessment 2010: Main Report,” Food and Agriculture Organization of the United Nations, http://www.fao.org/docrep/013/i1757e/i1757e.pdf. 94 Ibid. 95 “Market Info Pack 2015,” FSC, https://ic.fsc.org/pre-download.2015-fsc-market-info-pack.2437.htm.
POSITIVE DISRUPTION: LIMITING GLOBAL TEMERATURE RISE TO WELL BELOW 2 C° 57
CREATING A CLEAN, PROSPEROUS, AND SECURE LOW-CARBON FUTURE
RO
CKY MOUNTAIN
INSTIT UTE
96 Scott Faber, “Demand for Organic Food is Growing Faster than Domestic Supply,” Bay Journal, last modified March 1, 2006, http://www.bayjournal.com/article/demand_for_organic_food_growing_faster_than_domestic_supply. 97 “Organic Food and Beverage Market Size Worth $320.5 Billion by 2025,” Grand View Research, http://www.grandviewresearch.com/press-release/global-organic-food-beverages-market; “Organic Food and Beverage Market Size Projected to Reach $211.44 Billion by 2020,” Grand View Research, http://www.marketwired.com/press-release/organic-food-beverage-market-size-projected-reach-21144-billion-2020-grand-view-research-2127306.htm. 98 “USDA Reports Record Growth in U.S. Organic Producers,” U.S. Department of Agriculture, April 2016, https://www.usda.gov/media/press-releases/2016/04/04/usda-reports-record-growth-us-organic-producers. 99 “Why Conservation Agriculture?,” Cornell University, accessed June 2016, http://conservationagriculture.mannlib.cornell.edu/; Pete Smith et al., “Greenhouse Gas Mitigation in Agriculture,” Philosophical Transaction of the Royal Society B 363 (2007): 780–813. 100 Pete Smith et al., “Greenhouse Gas Mitigation in Agriculture,” Philosophical Transaction of the Royal Society B 363 (2007): 780–813; “Pathways to a Low-Carbon Economy: Version 2 of the Global Greenhouse Gas Abatement Cost Curve,” McKinsey and Company, September 2013, http://www.mckinsey.com/business-functions/sustainability-and-resource-productivity/our-insights/pathways-to-a-low-carbon-economy. 101 Dominic Woolf et al., “Sustainable Biochar to Mitigate Global Climate Change,” Nature Communications 1 (2010). 102 “What is Biochar?,” International Biochar Initiative, accessed July, 2016, http://www.biochar-international.org/biochar. 103 “United States Mid-Century Strategy For Deep Carbonization,” https://obamawhitehouse.archives.gov/sites/default/files/docs/mid_century_strategy_report-final.pdf. 104 Ibid. 105 “State of Private Investment in Conservation 2008,” Forest Trends, last modified January 11, 2017, http://forest-trends.org/releases/p/sopic2016. 106 “The Geography of REDD+ Finance,” Forest Trends, last modified August 11, 2016, http://forest-trends.org/releases/p/geography_redd_finance. 107 “Pathways to a Low-Carbon Economy: Version 2 of the Global Greenhouse Gas Abatement Cost Curve, McKinsey and Company, September 2013, http://www.mckinsey.com/business-functions/sustainability-and-resource-productivity/our-insights/pathways-to-a-low-carbon-economy. 108 “Organic Foods And Beverages Market Analysis By Product (Fruits & Vegetables, Meat, Fish & Poultry, Dairy Products, Frozen & Processed Food), Organic Beverages (Non-Dairy, Coffee & Tea, Beer & Wine)), And Segment Forecasts, 2014 - 2025,” Grand View Research, last modified April 2017, http://www.grandviewresearch.com/industry-analysis/organic-foods-beverages-market. 109.USDA, “USDA Integrated Projections for Agriculture and Forest Sector Land Use, Land-Use Change, and GHG Emissions and Removals: 2015 to 2060”, January 19, 2016.

POSITIVE DISRUPTION: LIMITING GLOBAL TEMERATURE RISE TO WELL BELOW 2 C° 58
CREATING A CLEAN, PROSPEROUS, AND SECURE LOW-CARBON FUTURE
RO
CKY MOUNTAIN
INSTIT UTE
110 “Sustainable Food,” Walmart, accessed March 2017, http://corporate.walmart.com/global-responsibility/environment-sustainability/sustainable-agriculture. 111 Ibid. 112 James E. Austin and Cate Reavis, “Starbucks and Conservation International,” Harvard Business Review, October 2, 2002, https://hbr.org/product/starbucks-and-conservation-international/303055-PDF-ENG. 113 Ibid. 114 Ibid. 115 Steve Zwick, “Suits, Greens, and Governments Use International Day of Forests to Forge Green Supply Chains,” Forest Trends (blog), last modified March 21, 2017, http://forest-trends.org/blog/2017/03/21/suits-greens-and-govs-use-intl-day-of-forests-to-forge-green-supply-chains/. 116 Richard Hollander (SLM Partners), interview by Martha Campbell and Marshall Abramczyk, June 2016. 117 Carol Ryan Dumas, “How Conventional Farmers Make the Transition to Organic,” Capital Press, last modified October 15, 2016, http://www.capitalpress.com/Organic/20151015/how-conventional-farmers-make-the-transition-to-organic; “Can Organic Farming Feed us All?,” Worldwatch Institute: Vision for a Sustainable World, May/June 206, http://www.worldwatch.org/node/4060. 118 Ibid. 119 “The Global Volume and Market Share of FSC-Certified Timber,” FSC, last modified August 28, 2015, https://ic.fsc.org/en/news/id/1234; Scott Faber, “Demand for Organic Food is Growing Faster than Domestic Supply,” Bay Journal, last modified March 1, 2006, http://www.bayjournal.com/article/demand_for_organic_food_growing_faster_than_domestic_supply. 120 Jules Pretty, Regenerating Agriculture: Policies and Practice for Sustainability and Self-Reliance (London: Earthscan Publ., 1999). 121 Jules Pretty, “Farmers’ Extension Practice and Technology Adaptation: Agricultural Revolution in 17–19th Century Britain,” Agriculture and Human Values 8 (1991): 132–148. 122 B. Bellotti and J.F. Rochecouste, “The Development of Conservation Agriculture in Australia—Farmers as innovators,” International Soil and Water Conservation Research 2 (2014): 21–34. 123 Sapna Thottathil, India’s Organic Farming Revolution: What it Means for Our Global Food System, (Iowa City: University of Iowa Press, 2014). 124 O. Edenhofer, et al., “Summary for Policymakers,” Climate Change 2014: Mitigation of Climate Change, Contribution of Working Group III to the Fifth Assessment Report of the Intergovernmental Panel on Climate Change, July 17, 2017, http://www.ipcc.ch/pdf/assessment-report/ar5/wg3/ipcc_wg3_ar5_summary-for-policymakers.pdf; and Leon C. Clarke, Allen A. Fawcett, John P. Weyant, James McFarland, Vaibhav Chaturvedi, and Yuyu Zhou, “Technology and U.S. Emissions Reductions Goals: Results of the EMF 24 Modeling Exercise,” The Energy Journal 35 (2014): 9-21; and Daniel L. Sanchez, James H. Nelson, Josiah Johnston, Ana Mileva, and Daniel M. Kammen, “Biomass Enables the Transition to a Carbon-Negative Power System across Western North America,” Nature Climate Change 5, no. 3 (2015): 230-234.

POSITIVE DISRUPTION: LIMITING GLOBAL TEMERATURE RISE TO WELL BELOW 2 C° 59
CREATING A CLEAN, PROSPEROUS, AND SECURE LOW-CARBON FUTURE
RO
CKY MOUNTAIN
INSTIT UTE
125 Dominic Woolf, James E. Amonette, F. Alayne Street-Perrott, Johannes Lehmann, and Stephen Joseph, “Sustainable Biochar to Mitigate Global Climate Change,” Nature Communications 1 (2010): 56. 126 “United States Mid-Century Strategy for Deep Decarbonization,” November 2016, https://obamawhitehouse.archives.gov/sites/default/files/docs/mid_century_strategy_report-final.pdf. 127 McKinsey and Company. Pathways to a Low-Carbon Economy: Version 2 of the Global Greenhouse Gas Abatement Cost Curve, 2013; and Pekka Kauppi and Roger Sedjo, “Technological and Economic Potential of Options to Enhance, Maintain, and Manage Biological Carbon Reservoirs and Geo-engineering,” Climate Change 2001: Mitigation: Contribution of Working Group III to the Third Assessment Report of the Intergovernmental Panel on Climate Change 3 (2001): 301. 128 Keith Paustian, Johannes Lehmann, Stephen Ogle, David Reay, G. Philip Robertson, and Pete Smith, “Climate-Smart Soils,” Nature 532, no. 7597 (2016): 49-57. 129 Organic Agriculture and Climate Change Mitigation—A Report of the Roundtable on Organic Agriculture and Climate Change, Natural Resources Management and Environment Department of the Food and Agriculture Organization of the United Nations, December 2011, http://www.fao.org/fileadmin/templates/organicag/pdf/11_12_2_RTOACC_23_webfiles.pdf. 130 Organic Foods and Beverages Market Analysis by Product (Fruits & Vegetables, Meat, Fish & Poultry, Dairy Products, Frozen & Processed Food), Organic Beverages (Non-Dairy, Coffee & Tea, Beer & Wine), and Segment Forecasts, 2014–2025, Grand View Research, April 2017, http://www.grandviewresearch.com/industry-analysis/organic-foods-beverages-market. 131 Meat Substitutes Market by Type (Tofu & Tofu Ingredients, Tempeh, Textured Vegetable Protein, Seitan, Quorn), Source (Soy-Based, Wheat-Based, Mycoprotein), Category (Frozen, Refrigerated), and Region – Global Forecast to 2022, Research and Markets, December 2016, http://www.researchandmarkets.com/reports/4012515/meat-substitutes-market-by-type-tofu-and-tofu. 132 Barack Obama, "The Irreversible Momentum of Clean Energy, " Science (2017). 133 Paul Sullivan, “Trump May Not Like Alternative Energy, but Investors Should,” New York Times, January 6, 2017, https://www.nytimes.com/2017/01/06/your-money/trump-may-not-like-alternative-energy-but-investors-should.html?_r=1; Hal Harvey, “Science and Economics – Not Politics – Will Strand Fossil Fuels,” Energy Innovation, last modified December 8, 2016, http://energyinnovation.org/2016/12/08/science-economics-not-politics-will-strand-fossil-fuels/. 134 “Mission Innovation,” Mission Innovation, accessed March 2017, http://mission-innovation.net/about/. 135 “Reliable, Affordable Energy for the World: Investing in a Carbonless Future,” Breakthrough Energy, accessed March 2017, http://www.b-t.energy/. 136 Tentative State-Wise Break-Up of Renewable Power Target to be Achieved by the Year 2022 So That Cumulative Achievement is 1,75,000 MW,” Ministry of New and Renewable Energy, http://mnre.gov.in/file-manager/UserFiles/Tentative-State-wise-break-up-of-Renewable-Power-by-2022.pdf. 137 “Developing Countries Can Slash Emissions By One Gigatonne If International Community Lives Up To Commitments,” United Nations Environment Program, http://www.unep.org/emissionsgap/.
POSITIVE DISRUPTION: LIMITING GLOBAL TEMERATURE RISE TO WELL BELOW 2 C° 60
CREATING A CLEAN, PROSPEROUS, AND SECURE LOW-CARBON FUTURE
RO
CKY MOUNTAIN
INSTIT UTE
138 “Financial Mechanisms and Investment Frameworks for Renewables in Developing Countries,” International Renewable Energy Agency, http://irena.org/Finance_RE_Developing_Countries.pdf; “Financing Renewable Energy: Options For Developing Financing Instruments Using Public Funds,” The World Bank, http://siteresources.worldbank.org/EXTENERGY2/Resources/SREP_financing_instruments_sk_clean2_FINAL_FOR_PRINTING.pdf. 139 “Unburnable Carbon 2013: Wasted Capital and Stranded Assets,” Carbon Tracker, last modified April 2013, http://www.carbontracker.org/report/unburnable-carbon-wasted-capital-and-stranded-assets/; David Turnbull, “$1 TRILLION in Global Fossil Fuel Subsidies & the Urgent Need for Transparency,” Oil Change International, last modified June 13, 2012, http://priceofoil.org/2012/06/13/1-trillion-in-global-fossil-fuel-subsidies-the-urgent-need-for-transparency/; Michael Kavanagh, “A World Map of Subsidies for Renewable Energy and Fossil Fuels,” Financial Times, July 25, 2016, https://www.ft.com/content/fb264f96-5088-11e6-8172-e39ecd3b86fc. 140 Michael Kavanagh, “A World Map of Subsidies for Renewable Energy and Fossil Fuels,” Financial Times, July 25, 2016, https://www.ft.com/content/fb264f96-5088-11e6-8172-e39ecd3b86fc. 141 “Tackling Fossil Fuel Subsidies and Climate Change: Leveling the Energy Playing Field,” International Institute for Sustainable Development, last modified November 5, 2015, https://www.iisd.org/gsi/levelling-energy-playing-field. 142 “Options and Consideration for a Federal Carbon Tax,” Center for Climate and Energy Solutions, https://www.c2es.org/publications/options-considerations-federal-carbon-tax. 143 Benjamin Henley and Andrew King, “Trajectories Toward 1.5°C Paris Target: Modulation by the Interdecadal Pacific Oscillation,” Geophysical Research Letters 44 (2017): 4256–4262. 144 Carlota Perez, “A New Age of Technological Progress,” in Owning the Future, ed. Chuka Umunna (London: Rowman & Littlefield International, 2014), 19–31. 145 Ibid. 146 “We Are Still In,” accessed June 30, 2017, http://www.wearestillin.com. 147 Somini Sengupta, Melissa Eddy, Chris Buckley, and Alissa J. Rubin, “As Trump Exits Paris Agreement, Other Nations Are Defiant,” The New York Times, June 1, 2017, sec. Europe, June 1, 2017, https://www.nytimes.com/2017/06/01/world/europe/climate-paris-agreement-trump-china.html.
22830 Two Rivers Road
Basalt, CO 81621
www.rmi.org
© 2017 RMI. All rights reserved. Rocky Mountain Institute® and RMI® are registered trademarks.
ROCKY MOUNTAIN
INSTIT UTE