Positive and negative ion sublimation from transition ... · Positive and Negative Ion Sublimation...
7
JOURNAL OF RESEARCH of the Notional Bureau of Standar ds- A. Ph ys ics and Chemis tr y Vol. 74A, No.1 , January- February 1970 Positive and Negative Ion Sublimation from Transition Metal Surfaces: A Review of Some Recent Results Milton D. Scheer Institute for Materials Research, National Bureau of Standards, Washington, D.C. 20234 (September 8, 1969) Singly charged, positive and negativ e, at omic ions have bee n observed to sublime fr eely from 4d and 5d tran sition metal s urfaces in the 1800 to 2600 K tempe ratur e range. The rates of sublimat io n were found to be about equal to those whi ch would be ob se rved under conditions of th er mal equilib- rium. Ion sublima ti on energies were obta in ed from the temperature dependence of th ese subli ma ti on rat es. Th e energies were found to be consiste nt with c urr ently acc ept ed values for the atom su b- limation energy, electron work func ti on, and first ion ization potentials of the eleme nt s investigated. Th e elec tr on affiniti es of th ese me tal. at oms were determined from an isothermal meas ur ement of the ratio of positive to negative ion sublimation rat es. Th e results were c ompared with some rece nt th eoretical es timat es of this quantity for those '3d transition metals who se valence elec tron configura- tions ar e analogous to the 4d and 5d elements considered here. Key words: Mass sp ec trome tr y; positive and negative ions; sublimation; tran sition metals. An at omically cle an me tal surfa ce may be char- acterized by the energies a ss ociat ed with th e s ublima- tion processes : cp , the el ec tron work function l o, the atom sublimation energy ( 3) Mi l; l+, th e positive ion sublimation energy ( 4) L, th en egative ion sublimation e ner gy. At te mp e ratur es less than about t of th e melting point , th e energies associated with th ese processes may be s tron gly influenc ed by the geometric arran ge- me nt of the s urface atoms. The ob se rved differen ce in work func tion between differe nt crystalline fac es is an example of su ch anisotropi c behavior. At high te mp e ratur es th e ge ometri c struc tur e and s ymmetry characteristics of th e surfa ce be come less important as a r es ult of rapid s urface migration and lar ge s ub- limation rates. In f ac t, in th e neighborhood of the melting point th e s urface c an be thought of as a two- dimensional liquid whose properties tend to be uni- form in contrast to the conside rable anisotropy exhibited at lower te mperature s_ Process (3) h as b ee n observed for a number of refractory transition metals [1-8, 10).1 Early attempts at a reliable meas ure ment of l + were limited by primi- ] Figures in brackets in dicate the lit eratur e references at the end of this paper. tive vac uum conditions a nd the pr ese n ce of eas ily i on ized alkali atom impuriti es. Process (4) can be obse rved when A (M) , the elect ron affinity of M, is ' positive (Mil is sta bl e). It has bee n reporte d for gr ap hit e, tun gsten, rh enium, molybde num , and ta n- talum [7 , 8, 9, 10]. 1. A Generalized Saha-Langmuir Eq u ati on Co ns ider th e thermodynami c e quilibriu m existing inside of an isoth e rmal me tal enclos ure_ In addition to bla c kbody photon s, the s table gas eous species are el ec trons ey , met al ato ms M g, singly charge d positive ions M t, and singly c har ged n ega tive ions Mil wh en th e el ec tr on affinity of the atom is positive. If the numb er density of charged particl es is suffi- ciently small so that space -charge e ffec ts may be negl ec ted, then the pa rtial pr ess ures (Px ) are gove rn ed by th e following equilibria: t:. E=+ ! upp er sign f or positive ionization = - A lower sign f or negat iv e ionization. The quantity t:.E is th e energy (or free-energy) change for these ionization pro cesses at ab solu te zero_ Th e equilibrium constants are given by (p ±/ po)(P e) ±! = (Q J Qo)( Qe) -± ! exp (- t:.E / kT). 37 (1) "
Transcript of Positive and negative ion sublimation from transition ... · Positive and Negative Ion Sublimation...

JOURNAL OF RESEARCH of the Notional Bureau of Standards - A. Phys ics and Chemis try Vol. 74A, No.1 , January-Februa ry 1970
Positive and Negative Ion Sublimation from Transition Metal Surfaces: A Review of Some Recent Results
Milton D. Scheer
Institute for Materials Research, National Bureau of Standards, Washington, D.C. 20234
(September 8, 1969)
Singly cha rged , positive and negative, atomic ions ha ve been observed to sublime freely from 4d and 5d tran sition metal surfaces in the 1800 to 2600 K temperature range. The rates of sublim ation we re found to be about equal to those which would be observed under conditions of thermal equilibrium. Ion sublimation energies were obtained fro m the te mperature depe ndence of these subli ma tion rates. The energies were found to be consistent with currently accepted values for the atom su blimation ene rgy, electron work func tion, and first ion ization potentials of the elements investigated.
The electron affiniti es of these me tal. atoms we re determined from an isothermal measurement of the ratio of positive to negative ion sublimation rates . The results were compared with some recent th eoretical estimates of this quantity for those '3d transition metals whose vale nce electron configurations are analogous to the 4d and 5d ele ments considered he re.
Key words : Mass spectrometry; positive and negative ions; sublimation ; transition metals.
An atomically clean metal s urface may be characterized by the energies associated with the s ublima-tion processes :
(l)es ~e!J; cp , the elec tron work function
l o, the atom sublimation energy
(3) Ms -es ~ Mil; l +, the positive ion sublimation energy
(4) Ms +es~My; L, the negative ion sublimation energy.
At temperatures less than about t of the melting point, the energies associated with these processes may be strongly influenced by the geometric arrangement of the surface atoms. The observed difference in work fun ction between different crystalline faces is an example of such anisotropic be havior. At high temperatures the geometric s tructure and symmetry characteristics of the surface become less important as a result of r a pid surface migration and large sublimation rates. In fact, in the neighborhood of the melting point the surface can be thought of as a twodimensional liquid whose properties tend to be uniform in contrast to the considerable anisotropy exhibited at lowe r temperature s_
Process (3) h as been observed for a number of r efractory tr ansition metals [1-8, 10).1 Early attempts at a reliable measurement of l + were limited by primi-
] Figures in brackets in d icate the literature references at the end of this paper.
tive vacuum conditions and the presence of easily ionized alkali atom impurities. Process (4) can be obser ved when A (M) , the electron affi nity of M , is
' positive (Mil is stable). It has been reported for graphite, tungs te n, rh e nium , molybd enum , and tantalum [7 , 8 , 9 , 10].
1. A Generalized Saha-Langmuir Equation
Consider the thermodynamic equilibrium existing inside of an isothermal metal enclosure_ In addition to blackbody photons, the stable gaseous species are electrons ey, metal atoms M g, singly charged positive ions Mt, and s ingly charged negative ions Mil when the electron affinity of the atom is positive . If the number density of charged par ticles is sufficiently s mall so th at space-c harge effec ts may be neglected , then the partial press ures (Px ) are governed by the following equilibria:
t:.E=+ ! upper sign for positive ionization
= - A lower sign for negative ionization.
The quantity t:.E is the energy (or free-en ergy) change for these ionization processes at absolute zero_ The equilibrium constants are given by
(p ±/po)(P e) ± ! = (Q J Qo)( Qe) -± ! exp (- t:.E/ kT).
37
(1)
"
The Q's are the molar partItIOn functions for these gaseous species which are assumed to be in thermal equilibrium with the walls of the enclosure. The partial pressure of electrons (Pe) is given by the well-known Richardson equation:
Pe= Qe exp (- cf> /k T) (2)
The electronic work function ¢ is defined as the free-energy change at 0 K for electron sublimation. Substituting eq (2) into (1) yields the result that
The flux (j) of particles evaporating from (or condensing upon) the walls of the enclosure is given by
j= ap/ (21TmkT) 1/ 2 (4)
where a is the evaporation (or condensation) coefficient and p is the equilibrium vapor pressure. Since the masses (m) of the atomic ions and atoms are very nearly equal and, assuming that the evaporation coeffici ents for ions and atoms are also equal, the ratio of sublimation rates obtained from eqs (3) and (4) is
For the atomic and ionic species under consideration, the ratio of molar partition functions is equal to the ratio of electronic partition func tions :
since the translational factors cancel because of the equality of the particle masses . When Russel-Saunders spin-orbit coupling is obeyed, the electronic partition function can be written as
W=2:gn exp (-En/kT) (6) 11
where Eo = 0 and gn = 21" + 1. The quantity gn is the statistical weight of the level of energy En, and in the inner quantum number of the electronic state n. The summation need only be carried out for those states which are significantly populated at the temperature T. Under the condition of thermal equilibrium on the metal surface , eq (5) yields a result for the sublimation ratio of singly charged positive ions to neutral atoms which may be recognized as the familiar Saha-Langmuir equation [11]; namely,
(7)
The ratio of positive to negative self-surface ionization, obtained from eqs (7) and (8), is
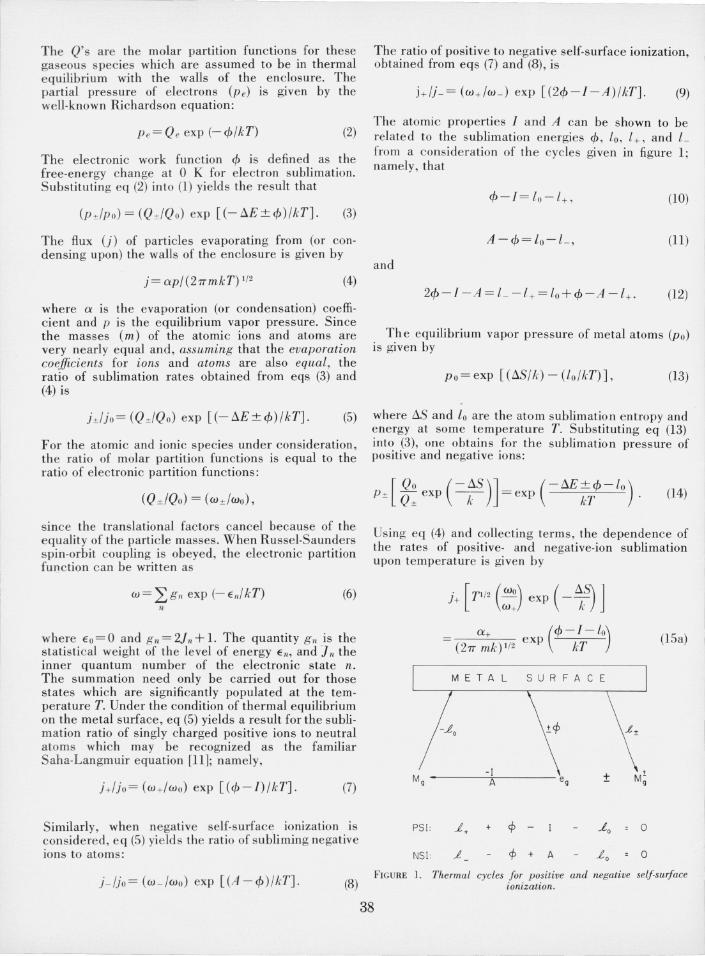
The atomic properties I and A can be shown to be related to the sublimation energies ¢ , 1o, 1+, and L from a con sideration of the cycles given in figure 1; namely, that
(10)
(11)
and
2¢ - I - A = 1_ - L + = 10 + ¢ - A - L + . (12)
The equilibrium vapor pressure of metal atoms (Po) is given by
Po= exp [(f1S/k) - (Lo/kT)], (13)
where f1S and io are the atom sublimation entropy and energy at some temperature T. Substituting eq (13) into (3) , one obtains for the sublimation pressure of positive and negative ions:
[ Qo (-LlS)J ( - LlE ± ¢-lo) P ± Q ± exp k- =exp kT . (14)
Using eq (4) and collecting terms , the dependence of the rates of positive- and negative-ion sublimation upon temperature is given by
j + [P/2 (::) exp ( - ~1 J
a + (¢ - I - 10) ( ) / exp kT 21T mk 1 2
(lSa)
METAL SURFAC E
-.to
- I ± t
A eg M-9
Similarly, when negative self-surface ionization is PSI: .t+ + cp - .Lo 0 considered, eq (5) yield s the ratio of subliming negative ions to atoms : NSI : ~ cp + A 10 0
J- Uo= (w - /wo) exp [(A-¢)/kT]. (8)
38
FIGURE 1. Thermal cycles for positive and negative selfsurface ionization.
and
J- [ TI /2 (::) exp ( - ~1 J
(27T1nk) 1/2 (A -cp- Lo)
exp kT ' (15b)
where from eqs (10) and (11) it is seen that cp- l -Lo=-l+ and A-cp-lo=-L The l's are sublimation energies at some mean temperature T in the middle of an experimental temperature range, and, like cp, I, and A, remain virtually unchanged from their values at absolute zero.
2. Apparatus
The apparatus used in these studies consis ted of a direction-focusing mass spectrometer. The surface ionization source of the mass analyzer was designed to facilitate the collection of negative ions , which evaporate in observable quantities only at surface temperatures at which electron emission is intense. A cylindrical modification of a Pierce lens [12] was used to collect the charged particles evaporating from the experimental surfaces. When the apparatus was biased for the detection of negative charges, the large electron flux focused by the lens was deflected by a small magnetic field and collected on a molybdenum plate. Because of space limitations in the ion source, the lens design was limited to the efficient collection of only about 2 mA of electron emission. At surface temperatures in excess of that which yields this value of the saturation electron current , a negative space charge begins to accumulate and the collection efficiency for negative ions decreases. This problem is not encountered in the case of positive ion sublimation so that meaningful measurements at a constant ion collection efficiency can be made at higher surface temperatures and larger positive ion currents.
Both the positive and negative ions were accelerated by the components of the Pierce lens to an energy of 4 k V prior to their traversal through the en trance slit of the IS-em radius, 60° sector, magnetic analyzer. The first dynode of a 16-stage eu-Be electron multiplier detector was maintained at ground poten tial, so that both positive and negative mass analyzed ions were collected with 4 kV of energy. The multiplier was operated with 190 V between stages so that the sixteenth dynode was at + 3040 V for both positive- and negative-ion detection. The output pulses were 20 to 30 ns. wide and were amplified with a voltage gain of 5000. The resultant pulse-height distribution was found to be about the same for both positive and negative ions. Thus, the secondary electron yields for 4 kV positive and negative ions impac ting on the first dynode surface do not appear to exhibit any significant charge discrimination. This is of particular importance for the determination of the ratio of positive to negative ion sublimation rates. The amplified pulses were then processed to give uniform I-V, 50-ns pulses which actuated a counter with a lO-MHz bandpass. The background count for
this instrument was usually less than 10 pulses/minute with the magnetic analyzer detuned and the experimental surface temperature well below 1800 K.
3 . Experimental Results
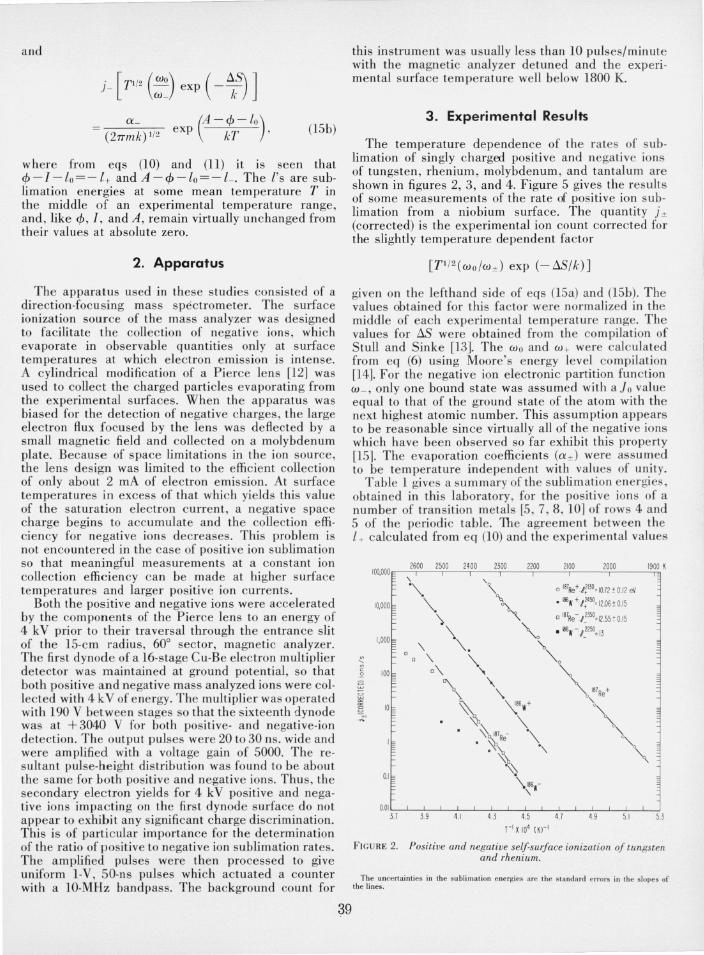
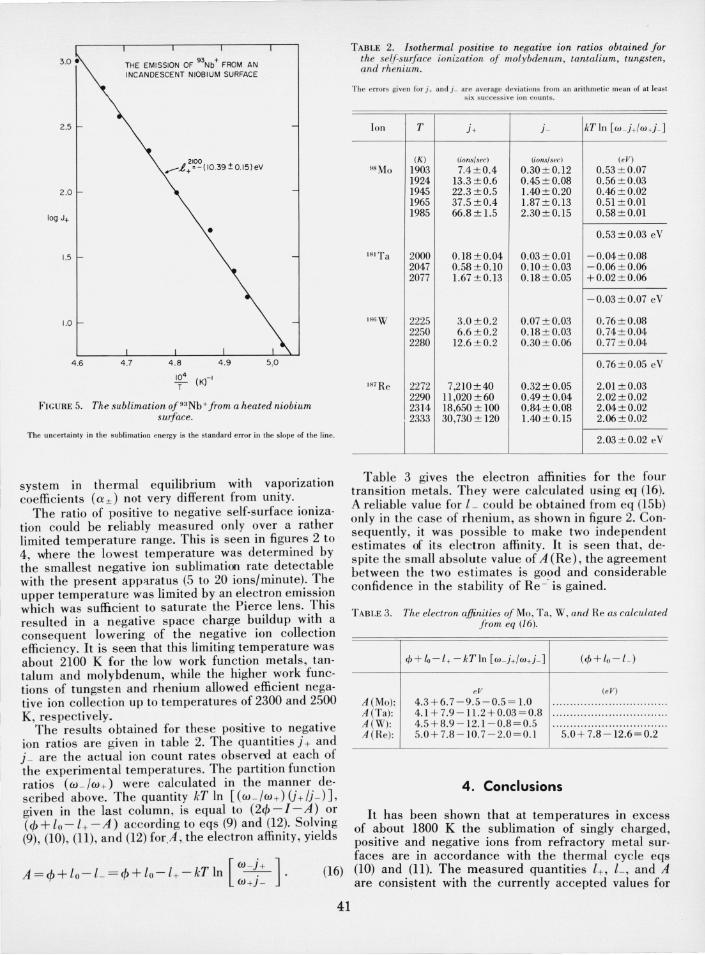
The temperature dependence of the rates of sublimation of singly charged positive and negative ions of tungsten, rhenium, molybdenum , and tantalum are shown in figures 2, 3, and 4. Figure 5 gives the results of some measurements of the rate of positive ion sublimation from a niobium surface. The quantity J", (corrected) is the experimental ion count corrected for the slightly temperature dependent factor
given on the lefthand side of eqs (15a) and (15b). The values obtained for this factor were normalized in the middle of each experimental temperature range. The values for t:.S were obtained from the compilation of Stull and Sinke [13]. The Wo and w + were calculated from eq (6) using Moore's energy level compilation [14]. For the negative ion electronic partition function w_, only one bound state was assumed with a.J 0 value equal to that of the ground state of the atom with the next highest atomic number. This assumption appears to be reasonable since virtually all of the negative ions which have been observed so far exhibit this property [151. The evaporation coefficients (O' ±) were assumed to be temperature independent with values of unity.
39
Table 1 gives a summary of the sublimation energies, obtained in this laboratory, for the positive ions of a number of transition metals [5 , 7, 8 , 10] of rows 4 and 5 of the periodic table. The · agreement between the L + calculated from eq (10) and the experimental values
1600 1500 1400 1300 1100 /100 1000 1900 K IOO.OOO'~-','-'---'-'T"----=,r--,----'-'r'----+----'+--~
10,000
I , OOO ~
0.01 ~-'--;'-;:---L---;~-'--;-;---L---;~--'--;-;---'---;:-::--'--;-:---'-; 3.7 3.9 4.1 4.3 4.5 4.7 4.9 5.1 5.3
1-1 X 10⁴ IK)-I
FIGURE 2. Positive and negative self-surface ionization of tungsten and rhenium.
The uncertainties in the sublimation energies are the standard errors in the slopes of the lines.

K 1900 1800
1500 • 98MO + t ';25 = 9.46 ± 0.08 eV
.e~40"'IOeV 1000
700
500
300
100
70
50 on
...... on
0 30
0 ~ w 2 I-U W a: a: 0 2
+1 10 ...... 7.0
5.0
3.0
1.0
0 .70
0.50
0.30
O.IOL..._.L..._.L..._.L..._.J...._.J...._.J...._.J...._:l-:-_.J....~
4.6 4 .8 5.0 5.2 5.6
lo"lr (K,-I
FIGURE 3 . Positive and negative selfsurface ionization of molybdenum.
The error bars represent the range of values obtained in at least ten determinations. The uncertainty in the sublimation ene rgy is the standard error in the slope.
is seen to be within the estimated uncertainties. The quantities I 0, I , and cf> for these metals were obtained from recent compilations [10, 13, 14, 16]. The intercepts of all of the experimental lines given in figures 2 to 5, divided by the subliming surface areas, fall within a factor of three of a value 5 X 1028 cm - 2 sec - I. This is
1,000,000 r----=.;'--'----_--=-.:;-=---_---=.;'--'----_-----==;:.::... __ ......2~--~2000
500,000
200,000 ~
100,000 I- "-50,000 .'"
+1
20,000
10,000
5,000
2,000
1,000
500
200
100
50
20
10
5
LO
0.5
0.2 0.10
0.05
0.02
• "'-.
4.1
"'" \ 1..2210 = 1 LIB ± 0.11 eV I
"'-. "'. "'. ""-. "'.
"'" "'" \"",
4.3 4.5 104 x T-1 ( Kr'
"'" " "'" I",_ £ !'" '\,.f
'-~lle~~ 4.7 4.9
FIGURE 4. Positive and negative ion sublimation from a tantalum surface.
The error bars represent the range of values obtained in at least ten determinations. The uncertainty in the sublimation energy is the standard error in the slope.
consistent with a maximum limiting sublimation rate of one monolayer (~ 1015 em - 2) per lattice vibration time (- 10- 14 s). It can therefore be concluded that a relatively large fraction of the evaporating ions was focused by the Pierce lens into the mass analyzer and ultimately detected by the electron multiplier. This result, together with the demonstrated validity of the thermal cycle eq (10), supports the conclusion that the observed free sublimation rates are approximately equal to those which would be observed in a closed .
40
TABLE 1. Positive ion sublimation energies
Ion T a I +(obs.) "(lo+I-</»
(K) (eV) (eV) 93Nh+ 2100 10.4 7.5+6.8-3.9= 10.5 98Mo+ 1925 9.5 6.7 +7.1-4.3 =9.5
'8!Ta + 2280 11.2 7.9+7.9-4.1 = 11.7 186W+ 2450 12.1 8.9 + 8.0 - 4.5 = 12.4 187Re+ 2130 10.7 7.8+7.9-5.0= 10.7
a Typical standard errors in the least square determination of 1+ are between 0.1 and 0.2 eV.
b Uncertainties in 10 , 1 and q, are each about 0.1 eV.
3 .0·
2.5
2.0
1.5
1.0
4 .6
THE EMISSION OF 9'Nb + FROM AN INCANDESCENT NIOBIUM SURFACE
•
,~4 (K)-I
FIGURE 5. The sublimation of93Nb + from a heated niobium surface.
The uncertainly in the sublimation energy is the standard error in the slope of the line.
system In thermal equilibrium with vaporization coefficients (0' ±) not very different from unity.
The ratio of positive to negative self-surface ionization could be reliably measured only over a rather limited temperature range_ This is seen in figures 2 to · 4, where the lowest temperature was determined by the smallest negative ion sublimation rate detectable with the present app'Hatus (S to 20 ions/minute)_ The upper temperature was limited by an electron emission which was sufficient to saturate the Pierce lens. This resulted in a negative space charge buildup with a consequent lowering of the negative ion collection efficiency. It is seen that this limiting temperature was about 2100 K for the low work function metals, tantalum and molybdenum, while the higher work functions of tungsten and rhenium allowed efficient negative ion collection up to temperatures of 2300 and 2S00 K, respectively_
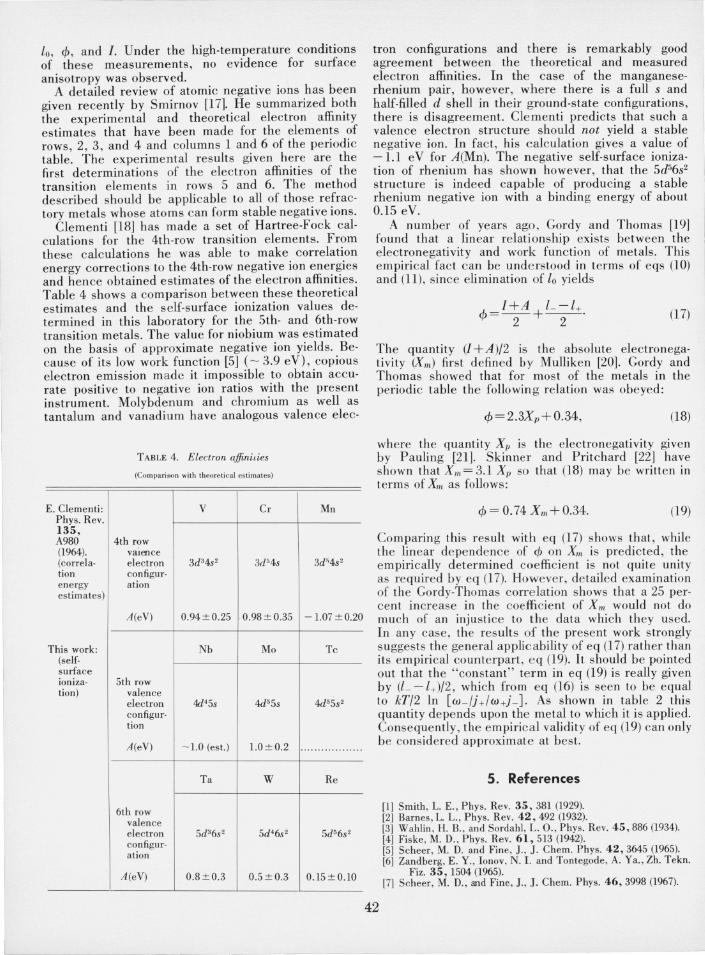
The results obtained for these positive to negative ion ratios are given in table 2. The quantities j + and j _ are the actual ion count rates observed at each of the experimental temperatures. The partition function ratios (w _lw +) were calculated in the manner described above_ The quantity kT In [(w _/w +) U+U- )], given in the last column, is equal to (2¢ - I - A) or (¢ + Lo -l+ - A) according to eqs (9) and (12). Solving (9), (10), (11), and (12) for.A; the electron affinity, yields
A=¢+lo-L = ¢+lo-l+- kTln [w _! + ]. (16) W+J-
41
TABLE 2 . . Isothermal positive to negative ion ratios obtained for the selj-sU/Jace wnLzatwn of molybdenum, tantalium, tungsten, ~LI1.d rh.elHum..
The e rrors given for j ... and i - are ave rage deviations fro m an a rithmeti c mean of at least si:x sliccessive ion count s.
Ion T j + j - kT In [w - j +/w+j - J
(K) (ions/sec) (ions/sec ) (eV) 98Mo 1903 7.4 ±0.4 0.30±0.12 0.53 ± 0.07
1924 13.3 ±0.6 0.45±0.OB 0.56±0.03 1945 22.3 ±0.5 1.40±0.20 0.46±0.02 1965 37.5 ±0.4 1.B7 ± 0.13 0.51 ±0.01 19B5 66.B ± 1.5 2.30±0.IS O.SB±O.OI
0.S3±0.03 eV
181Ta 2000 0.IB±0.04 0.03±0.01 -0.04±0.OB 2047 0.5B±0.1O 0.1O±0.03 -0.06±0.06 2077 1.67 ± 0.13 O.IB ± O.OS +0.02±0.06
-0.03 ± 0.07 eV
IR"W 2225 3.0 ± 0.2 0.07 ± 0.03 0.76 ± 0.OB 2250 6.6 ±0.2 O.IB ± O.03 0.74 ± 0.04 22BO 12.6 ±0.2 0.30 ± 0.06 0.77 ± 0.04
0.76±0.05 eV
187Re 2272 7,210±40 0.32±0.OS 2.01 ±0.03 2290 1l,020±60 0.49±0.04 2.02±0.02 2314 IB,650± 100 0.B4±0.OB 2.04±0.02 2333 30,730 ± 120 1.40 ± 0.15 2.06±0.02
2.03±0.02 eV
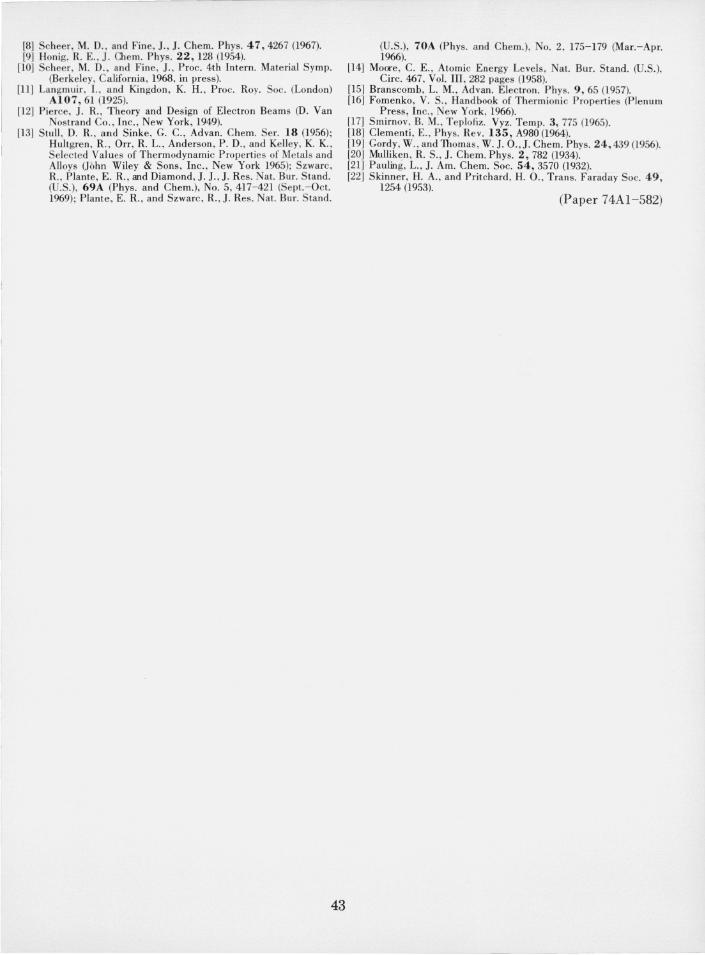
Table 3 gives the electron affinities for the four trans!tion metals. They were calculated using eq (16). A rel~able value for L_ could be obtained from eq (ISb) only III the case of rheniu m, as shown in figure 2_ Consequently, it .was possible to make two independent estImates of Its electron affinity_ It is seen that despite the small absolute value of A (Re), the agree~ent between the two estimates is good and considerable confidence in the stability of Re _. is gained_
TABLE 3. The electron affinities of Mo, Ta, \V , and Re as calculated from. eq (J 6).
A(Mo): A(Ta): A (W): A(Re):
eV
4.3+6.7 -9.5-0.5 = 1.0 4.1 + 7.9 -11.2 + 0.03 = O.B 4.S + B.9-12.1 - 0.B= 0.5 5.0 + 7.B - 1O.7 - 2.0 = 0.1
(e V)
5.0 + 7.B-12.6=0.2
4. Conclusions
It has been shown that at temperatures III excess of ~~out 1800 K the sublimation of singly charged, posItIve and negative ions from refractory metal surfaces are in accordance with the thermal cycle eqs (10) and Yl). T~e measured quantities l+, L, and A are consIstent WIth the currently accepted values for
lo , ¢, and I. Under the high-temperature conditions of these measurements, no evidence for surface anisotropy was observed.
A detailed review of atomic negative ions has been given recently by Smirnov [17]. He summarized both the experimental and theoretical electron affinity estimates that have been made for the elements of rows , 2 , 3, and 4 and columns 1 and 6 of the periodic table. The experimental results given here are the first determinations of the electron affinities of the transition elements in rows 5 and 6. The method described should be applicable to all of those refractory metals whose atoms can form stable negative ions.
Clementi [18] has made a set of Hartree-Fock calculations for the 4th-row transition elements. From these calculations he was able to make correlation energy corrections to the 4th-row negative ion energies and hence obtained estimates of the electron affinities. Table 4 shows a comparison between these theoretical estimates and the self-surface ionization values determined in this laboratory for the 5th- and 6th-row transition metals. The value for niobium was estimated on the basis of approximate negative ion yields. Because of its low work function [5] ( - 3.9 eV), copious electron emission madc it impossible to obtain accurate positive to negative ion ratios with the present instrument. Molybdenum and chromium as well as tantalum and vanadium have analogous valence elec-
TABLE 4. Electron affinities
(Comparison with theoretical estimates)
E. Clementi : V Cr Mn Phys. Rev. 135, A980 4th row (1964). valence (correIa· electron 3d34s 2 3d54s 3d'4s 2
tion configur· energy ation estimates)
A(eV) 0.94±0.25 0.98±0.35 -1.07 ± 0.20
This work : Nb Mo Tc (self-surface ioniza- 5th row tion) valence
electron 4d45s 4d55s 4d55s 2
configur-tion
A(eV) - 1.0 (est.) 1.0 ± 0.2 .. ...... ..... .. .. .
Ta W Re
6th row valence electron 5d36s 2 5d46s 2 5d5 6s 2
configur-ation
A(eV) 0.8 ± 0.3 0.5±0.3 0.15±0.10
tron configurations and there is remarkably good agreement between the theoretical and measured electron affinities . In the case of the manganeserhenium pair , however, where there is a full sand half-filled d shell in their ground-state configurations, there is disagreement. Clementi predicts that such a valence electron structure should not yield a stable negative ion. In fact, his calculation gives a value of - 1.1 eV for A(Mn). The negative self-surface ionization of rhenium has shown however, that the 5d56s2
structure is indeed capable of producing a stable rhenium negative ion with a binding energy of about 0.15 eV.
A number of years ago, Gordy and Thomas [19] found that a linear relationship exists between the electronegativity and work fun ction of metals . This empirical fact can be understood in terms of eqs (10) and (11), since elimination of lo yields
¢=I+A + L-l+. 2 2
(17)
The quantity (1+ A)/2 is the absolute elec tronegativity (Xm) first defined by Mulliken [20]. Gordy and Thomas showed that for most of the metals in the periodic table the followin g relation was obeyed:
¢ = 2.3Xp + 0.34, (18)
where the quantity Xp is the elec tronegativity given by Pauling [21]. Skinner and Pritchard [22] have shown that Xm = 3.1 Xp so that (18) may be written in terms of X", as follows:
¢=0.74X",+0.34. (19)
Comparing thi s result with eq (17) shows that, while the linear dependence of ¢ on Xm is predicted, the empirically determined coefficient is not quite unity as required by eq (17). However , detailed examination of the Gordy-Thomas correlation shows that a 25 percent increase in the coefficient of Xm would not do much of an injustice to the data which they used. In any case, the results of the present work strongly suggests the general applicability of eq (17) rather than its empirical counterpart , e q (19). It should be pointed out that the "constant" term in eq (19) is really given by (L -l+)/2 , which from eq (16) is seen to be equal to kT/2 In [w - U+/w+j - l As shown in table 2 this quantity depends upon the metal to which it is applied. Conseque ntly , the empirical validity of eq (19) can only be considered approximate at best.
42
5. References
[1] Smith , 1. E., Phys. Rev. 35 ,381 (1929). [2] Barnes , 1. L., Phys. Rev. 42 ,492 (1932). [3] Wahlin, H. B., and Sordahl, L. 0 ., Phys. Rev. 45 ,886 (1934). [4] Fiske, M. D., Phys. Rev. 61 .513 (1942). [5] Scheer , M. D. and Fine, J., J. Chern. Phys. 42,3645 (1965). [6] Zandberg, E. Y., Ionov, N. I. and Tontegode, A. Ya. , Zh. Tekn.
Fiz. 35,1504 (1965). [7] Scheer, M. D., and Fine, J., J. Chern. Phys. 46,3998 (1967).
[8] Scheer, M. D. , and Fine, J. , 1. Chern. Phys. 47,4267 (1967). [9] Honig, R. E., J. Chern. Phys. 22,128 (1954).
[10] Scheer, M. D. , and Fine, J., Proc. 4th Intern. Material Symp. (Berkeley, California, 1968, in press).
[11] Langmuir, I. , and Kingdon, K. H., Proc. Roy. Soc . (London) AI07, 61 (1925).
[12] Pie rce, J. R., Theory and Design of Electron Beams (D. Van Nostrand Co., Inc., New York, 1949).
[13] Stu ll , D. R., and Sinke, G. c., Advan. Chern. Ser. 18 (1956); Hultgre n, R., Orr, R. L., Anderson, P. D. , and Kelley, K. K. , Selected Values of Thermodynamic Properties of Metals and Alloys (John Wiley & Sons, Inc. , New York 1965); Szwarc, R. , Plante, E. R., and Diamond , J. J., J . Res. Nat. Bur. Stand. (U.S.), 69A (phys. and Chern.), No.5, 417-421 (Sept.-Oct. 1969); Plante, E. R., and Szwarc, R. , J. Res . Nat. Bur. Stand.
43
(U.S.), 70A (phys. and Chern.), No.2, 175- 179 (Mar.-Apr. 1966).
[14] Moore, C. E. , Atomic Energy Levels, Nat. Bur. Stand. (U.S.), Circ. 467, Vol. III , 282 pages (1958).
[15] Branscomb, L. M., Advan. Electron. Phys. 9,65 (1957). [16] Fomenko, V. S., Handbook of Thermion ic Properties (Plenum
Press , Inc., New York, 1966). [l7] Smirnov, B. M., Teplofiz. Vyz. Temp. 3,775 (1965). [18] Clementi, E., Phys. Rev. 135, A980 (1964). [19] Gordy, W. , and Thomas, W. J. 0.,1. Chem. Phys. 24,439 (1956). [20] Mulliken, R. S., J. Chern. Phys. 2,782 (1934). [21] Pauling, L., J. Am. Chem. Soc. 54,3570 (1932). [22J Skinner, H. A. , and Pritchard, H. 0., Trans. Faraday Soc. 49,
1254 (1953). (Paper 74Al-582)