Position/Orientation-Aware Physical Tags Using Photo ...
8
Abstract— This paper describes a novel method for measuring the position and orientation of physical tags on a large tabletop display. This method employs a set of photo sensors and accelerometers embedded in a tag to observe fiducial marker patterns shown on the display and to predict the incoming position/orientation of the tag. In this paper, we especially propose a new fiducial marker pattern that is more robust in terms of ambient light, the unevenness of display luminance, and the excess of measurement range than the one previously proposed. The new pattern also makes the physical tags smaller and less obtrusive. We finally show the results of several preliminary experiments that we conducted for each sensor device. I. INTRODUCTION In many practical situations, as in construction work, inspection, and door-to-door repair, it often happens that a small number of the experts and specialists who have the comprehensive understanding and technical expertise have to handle a bunch of inquiries from multiple field workers. Since it is costly and time consuming to develop skilled workers and deploy them to everywhere they are needed, effective remote collaboration technology between experts and field workers is required for alleviating the numerical disproportion. In such remote collaborative work, an expert often has to monitor what each worker is doing and to prepare appropriate instructions according to their circumstances, and pick up one or more workers to send instructions promptly and correctly. We can implement systems for remote collaborative work by using conventional WIMP (window, icon, menu, pointing device) interfaces, but it needs extra large displays and complicated function menus. It may impose more burdens on experts and may cause operational mistakes. To alleviate the burdens, applying a Tangible-User-Interface (TUI) scheme [3] as a post-WIMP interface, we developed a Tangible TableTop (TTT) interface (Figure 1) to support remote collaborative works between an expert and multiple field workers in direct and intuitive way [1]. The 1 st TTT consists of a large touchscreen LCD as a tabletop display and small ultrasonic transmitters that can measure their 3D positions as physical tags on the display. The physical tags represent either each worker or each tool such as clipboards, manuals, and maps, and are respectively coupled and worked with virtual graphical objects on the display such as a window to communicate with some worker and a window to browse some online manual. The TTT interface offers several remarkable features including affordances of the physical tags [2], “Tag Gesture” recognized by measuring 3D tag trajectories, and asymmetric bimanual simple manipulation with tags and touchscreen. The potential benefits of those features are to provide the expert with confidence and comfort in use, and concentration on communication and instruction. In this paper, we propose a novel method for measuring the position and orientation of physical tags which employs a set of photo sensors and accelerometers. First, we briefly review the methods which related works and our prior work use, second we describe the algorithm and the features of our method, and after that, we present the prototype of the 2 nd TTT on which we implemented this method and some fundamental experiments using this prototype. Figure 1. Remote collaborative work using the 1 st TTT. Position/Orientation-Aware Physical Tags Using Photo Sensors and Accelerometers for a Tangible Tabletop Interface Umi Kawamoto 12 , Takeshi Kurata 1 , Nobuchika Sakata 13 , Takashi Okuma 1 , Hideaki Kuzuoka 2 1 Information Technology Research Institute, AIST 2 University of Tsukuba 3 Osaka University http://itri.aist.go.jp/rwig/ari/
Transcript of Position/Orientation-Aware Physical Tags Using Photo ...
Abstract— This paper describes a novel method for measuring
the position and orientation of physical tags on a large tabletop display. This method employs a set of photo sensors and accelerometers embedded in a tag to observe fiducial marker patterns shown on the display and to predict the incoming position/orientation of the tag. In this paper, we especially propose a new fiducial marker pattern that is more robust in terms of ambient light, the unevenness of display luminance, and the excess of measurement range than the one previously proposed. The new pattern also makes the physical tags smaller and less obtrusive. We finally show the results of several preliminary experiments that we conducted for each sensor device.
I. INTRODUCTION In many practical situations, as in construction work, inspection, and door-to-door repair, it often happens that a small number of the experts and specialists who have the comprehensive understanding and technical expertise have to handle a bunch of inquiries from multiple field workers. Since it is costly and time consuming to develop skilled workers and deploy them to everywhere they are needed, effective remote collaboration technology between experts and field workers is required for alleviating the numerical disproportion.
In such remote collaborative work, an expert often has to monitor what each worker is doing and to prepare appropriate instructions according to their circumstances, and pick up one or more workers to send instructions promptly and correctly. We can implement systems for remote collaborative work by
using conventional WIMP (window, icon, menu, pointing device) interfaces, but it needs extra large displays and complicated function menus. It may impose more burdens on experts and may cause operational mistakes. To alleviate the burdens, applying a Tangible-User-Interface
(TUI) scheme [3] as a post-WIMP interface, we developed a Tangible TableTop (TTT) interface (Figure 1) to support remote collaborative works between an expert and multiple
field workers in direct and intuitive way [1]. The 1st TTT consists of a large touchscreen LCD as a
tabletop display and small ultrasonic transmitters that can measure their 3D positions as physical tags on the display. The physical tags represent either each worker or each tool such as clipboards, manuals, and maps, and are respectively coupled and worked with virtual graphical objects on the display such as a window to communicate with some worker and a window to browse some online manual. The TTT interface offers several remarkable features including affordances of the physical tags [2], “Tag Gesture” recognized by measuring 3D tag trajectories, and asymmetric bimanual simple manipulation with tags and touchscreen. The potential benefits of those features are to provide the expert with confidence and comfort in use, and concentration on communication and instruction. In this paper, we propose a novel method for measuring the position and orientation of physical tags which employs a set of photo sensors and accelerometers. First, we briefly review the methods which related works and our prior work use, second we describe the algorithm and the features of our method, and after that, we present the prototype of the 2nd TTT on which we implemented this method and some fundamental experiments using this prototype.
Figure 1. Remote collaborative work using the 1st TTT.
Position/Orientation-Aware Physical Tags Using Photo Sensors and Accelerometers for a
Tangible Tabletop Interface Umi Kawamoto12, Takeshi Kurata1, Nobuchika Sakata13, Takashi Okuma1, Hideaki Kuzuoka2
1Information Technology Research Institute, AIST 2University of Tsukuba 3Osaka University
http://itri.aist.go.jp/rwig/ari/
tomoyo
テキストボックス
The 2008 IEEE International Conference on Distributed Human-Machine Systems (DHMS 2008) in Athens, Greece, pp.397-404 (2008)

II. RELATED WORKS We have explored methods to measure the position and
orientation of physical tags because interaction techniques employed in the TTT relates closely to and is bound by features and precision of the method. In this section, we describe a brief overview of the 1st TTT, and pros and cons of the 3D ultrasonic tagging system. Then we discuss the related works and their methods to measure movement of physical objects and also discuss why we had not employed those methods.
A. A brief overview of the 1st TTT In the 1st TTT (Figure 1), a tabletop display placed in a
horizontal position presents multiple windows for communication with some worker or for browsing some online manual. Each window is respectively coupled with some physical tag which has an ultrasonic transmitter in it and the user mainly operates those windows by “Tag Gesture” recognized by measuring 3D tag trajectories. Figure 2 shows an example of Tag Gesture. In this figure, the Tag B is coupled with an image window. When we bring the Tag A close to the Tag B, the image is copied into the window coupled with the Tag A.
In order to recognize Tag Gesture, the 1st TTT employs ultrasonic tagging system to measure 3D tag trajectories. In this system, an ultrasonic transmitter embedded on the top of a physical tag emits ultrasonic to an ultrasonic receiver array above the tabletop display. The ultrasonic measurement is based on time-of-fright measurements and multilateration with random-sample-consensus (RANSAC) to obtain the absolute 3D position of each tag.
This method provides accurate measurement results enough to implement Tag Gesture we proposed [1]. However, the measuring rate of each tag is not high enough partly because a smoothing filter is needed for measurement errors caused by the multipath effect, etc., and mainly because the measurement is on a time-sharing basis. Consequently it causes time lag which appears when a window follows a tag. In addition, it is difficult to measure the orientation of each tag, so diversity of Tag Gesture is limited. It is also difficult to simplify the equipment since ultrasonic receivers have to be set up above the tabletop display. Obviously the measurement is interrupted when a user’s hand lies between a tag and receivers.
B. Related works RFID is used to measure the position of each physical object called “tile” in the method proposed by Rekimoto et al. [4]. With this method, possible places to put tiles are discrete due to poor positioning accuracy of the RFID tag/reader as a position sensor. Since the TTT requires physical tags to move to and be measured at any places on-and-above the tabletop display, the method is not adequate for the TTT.
There are some efforts to measure physical-object motion by image processing [5, 6]. In these methods, a fiducial marker is often put on measured objects and a camera observes the motion of the marker. However these methods easily get
disable when obstacles lie between cameras and markers. These are not desirable methods because users’ hands often cover the surface of the measured object in the TTT.
There have been some studies on the method in which photo sensors embedded in measured objects [7-9]. The sensors observe fiducial-marker patterns whose luminance changes temporally or spatially projected onto a wall or floor by a video projector. Then the position and orientation of the objects are calculated using the output signals of the sensors. These methods require that the sensors’ output signals are not affected by ambient light such as room illumination. Fortunately the tags of the TTT (measured objects) touch on the tabletop display very often, so we could adapt the last methods to our system without bothered by ambient light.
III. THE PROPOSED METHOD In this paper, we propose a novel method for measuring the
position and orientation of the physical tag by using a set of photo sensors and accelerometers built in each tag complementarily.
Figure 2. Copy Gesture.
Figure 3. [Top] A conceptual diagram of remote collaborative work
supported by the 2nd TTT. [Bottom] A GUI of the 2nd TTT.
Applying the method proposed by Sugimito et al. [9] to the TTT, we can get comparatively precise measurements of the absolute 3D position and orientation of tags on a tabletop display (Figure 3). In this section, we first describe a measuring method using only a set of photo sensors and its features, and then outline several features of accelerometers. Finally we present our novel method to measure the position and orientation of the tags precisely in a wide range by using not only both types of sensors that complements drawbacks of each sensor but also new fiducial marker patterns.
A. The measuring method with photo sensors We use a set of photo sensors embedded on the bottom face
of each tag to observe fiducial marker patterns shown on a display. These sensors are arrayed geometrically and the luminance of each fiducial marker pattern gradates spatially and linearly so that output signals of photo sensors change linearly as the tag moves on the marker pattern.
1) Conventional method In order to use either a conventional method [8, 9] or our
method, spatial gradation of a fiducial marker pattern has to correspond linearly to translation of a set of photo sensors.
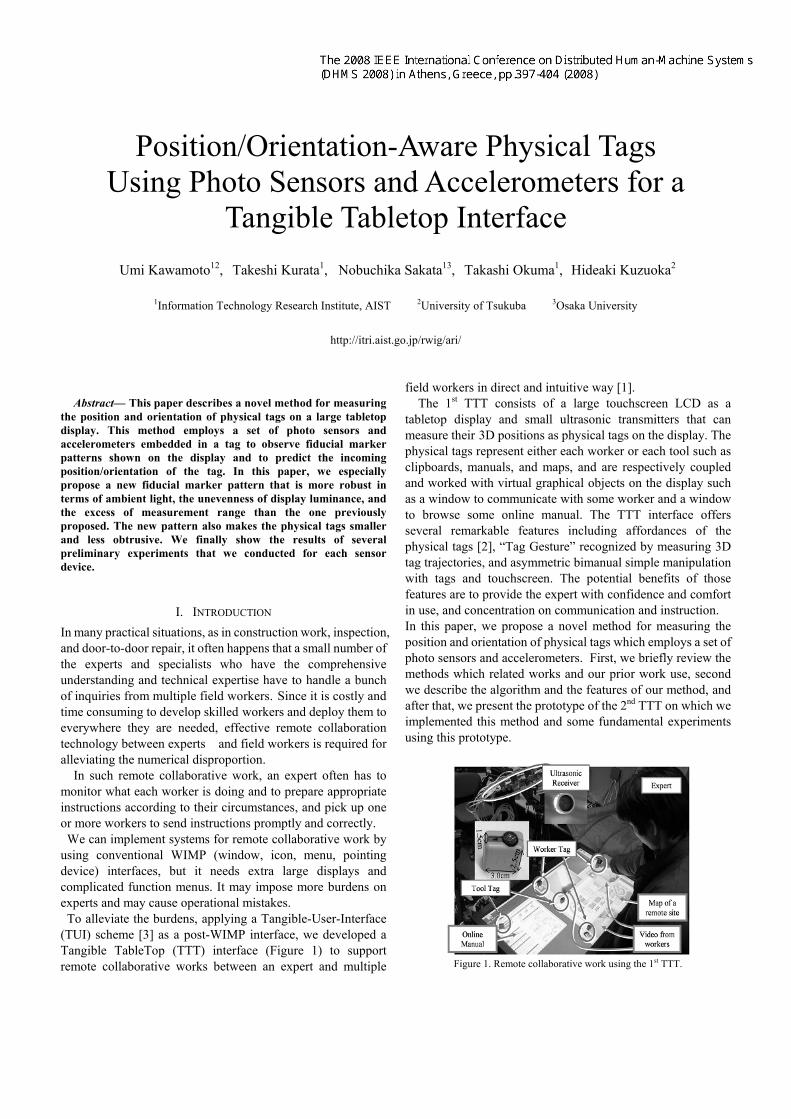
Figure 4 shows five photo sensors ( 51 ~ pp ) and a circular marker pattern that the conventional method [8] uses to measure the position and orientation of an object. The five sensors are arranged crisscross at set intervals d . In each of four sectors of the fiducial marker pattern around the center-circle sector, luminance gradates lineally along the x axis or y axis.
A radius of the pattern is set d5.1 (Figure-4 Left). This setting allows the five photo sensors to move in parallel within the white circles whose diameter is d or to rotate by 45 degrees (Figure-4 Right). If the set of sensors moves or rotates over this limit, we can’t measure the position and orientation of them by this method since each sensor moves out of each sector.
a) Measuring translation When the five photo sensors are translated from the home
position (shown in Figure 4), the translation is calculated from
Figure 4. [Left] The circular marker pattern with five sectors and five photo
sensors in the conventional method. [Right] Each white circle shows the range within which each of five sensors can move in parallel.
output signals of each sensor using an algorithm described below.
To begin with, we notice the translation yt along the y axis
in this algorithm. Luminance values of the marker pattern under 1p and 4p , that are 1l and 4l respectively, changes in proportion
to yt . Here we define tyl as the luminance variation caused by
the translation. In the same way, the output signals of 2p and 3p ,
that are 2l and 3l contain the luminance variation txl regarding
the translation xt along the x axis. And also we define
nil )5,,1( L=i as changes in the output signals of the sensors caused by ambient light. The output signals of 1p ~ 5p , that are
1l ~ 5l , can be modeled as follows:
).5.05.0,5.05.0(,5.0
,5.0,5.0
,5.0,5.0
55
4433
2211
≤≤−≤≤−+=
++=++=
++−=++−=
txtyn
ntyntx
ntxnty
llll
llllll
llllll
These equations enable us to represent txl and tyl like below:
),(2 23
23nntx lllll −−
−= )(
2 1414
nnty lllll −−−
= .
Assuming the ambient light equally affects each sensor, we
can let 023 ≅− nn ll , 014 ≅− nn ll , and so we can simply obtain the luminance variation in photo sensors caused by translation as
,2
23 llltx−
= 2
14 lllty−
= .
Letting the interval of each sensor be d , the value of
translation, xt and yt , are calculated by the changes in output
signals of photo sensors as Equations (1) since the luminance changes from the darkest to the lightest for the width
)2
3( db = in each sector (Figure-4 Right).
,2
3 dlt txx ⋅= dlt tyy 23
⋅= . (1)
b) Measuring rotation When a set of photo sensors rotates by )(radθ from the
home position shown in Figure 4, the output signals of each sensor change equally just as they were translated by
)sin( θ⋅= dtr . Then the values of output signals of five sensors 1l ~ 5l are represented by the equations below:
).31
31(,5.0
,5.0,5.0,5.0,5.0
55
4433
2211
≤≤−+=
++=++=++=++=
trn
ntrntr
ntrntr
lll
llllllllllll
Assuming ambient light affects each sensor equally, the

change in value of each sensor which caused by the rotation
denoted by trl becomes 5
4321
4lllllltr −
+++=
.
In the similar way as the translation, the angle of rotation is obtained by using output signals of the five photo sensors.
dldt trtr 23sin ⋅== θ , )()
23(sin 1 radltr
−=θ . (2)
c) Measuring rotation and translation independently Even if a set of photo sensors rotates and moves in parallel at
the same moment (Figure 5), we can obtain the position /orientation independently by using equations below.
In this case, the output signals of each sensor are indicated as
.5.0,5.0,5.0
,5.0,5.0
55
4433
2211
n
ntrtyntrtx
ntrtxntrty
llllllllll
llllllll
+=
+++=+++=
+++−=+++−=
If ambient light affects each sensor equally, txl , tyl , and trl
are described as below:
543211423
4,
2,
2llllllllllll trtytx −
+++=
−=
−= .
In this way the translation and rotation of the tag on the
marker pattern are obtained simultaneously and independently.
,2
3txldtx ⋅= ,
23
tyldty ⋅= ).()2
3(sin 1 radltr−=θ (3)
2) Proposed method
a) New fiducial marker pattern and reduced placement Since the conventional method needs five photo sensors to
obtain 4 parameters, θ,, tytx , and n (noise), it includes some redundancy. So we invented new fiducial marker patterns which need fewer sensors but enable to measure the translation/orientation as well as the conventional marker does1. Figure 6 shows two instances of new combinations for marker patterns and reduced-sensor alignment. These new patterns make the size of the bottom surface of tags 50% smaller and the size of markers 65% smaller (Figure 7). In case we use the left pattern of Figure 6, 3p and its output signal may cause fatal measuring error. As the right pattern of Figure 6 [10, 12] makes it possible to calculate the position/orientation in a more stable manner, we employ the right pattern in the remaining part of this paper.
1 Although we invented these patterns [12] inspired by the related works [9],
the same pattern was proposed in [11] just around the same time. However each work differs in its application field.
Figure 5. Measurement of the position/orientation of a tag when it moves in
parallel and rotates simultaneously.
Figure 6. Two instances of new fiducial marker patterns that need only four
photo sensors.
Figure 7. The conventional marker pattern (left) and new marker pattern
(right). The new pattern allows the set of photo sensors to move in the same measurement area (shown by white or gray circle) as the conventional one although the whole pattern size gets small.
For the right pattern in Figure 6 we measure the motion of a
tag as follows. The output signals of each sensor are represented as
.5.0,5.0
,5.0,5.0
4433
2211
ntrtyntrtx
ntrtxntrty
llllllll
llllllll
++−−=+++=
+++−=++−=
Assuming ambient light affects each sensor equally, changes
in output signals are
.4
,2
,2
43214123 lllllllllll trtytx−++−
=−
=−
=
In this case θsin22 dtr = and db
222 +
= , therefore the

Figure 8. Measurement of fast translation of a tag by using a rectangular
marker pattern.
Figure 9. Rectangular marker patterns are used to search for the position of a
tag in a wide area on the display and to do an initial search.
Figure 10. Four measurement modes for typical motion patterns of tags.
[Upper left: Low-speed measurement mode] Moving slowly on a display. [Upper right: High-speed measurement mode] Fast moving on a display.
[Lower left: Wide-area search mode] Landing on a display after moving above it. [Lower right: Static mode] Staying static on a display
Figure 11. State transition on four measuring modes.
translation and rotation are calculated as below:
).(})21{(sin
,2
22,2
22
1 radl
ldtyldtx
tr
tytx
+=
⋅+
=⋅+
=
−θ
(4)
b) Rectangular pattern specialized for translation The circular marker pattern described at the previous section
enables us to measure the position/orientation precisely but it limits the motion within a relatively narrow range up to 2
d in
per frame (Figure-7 Right). A rectangular marker pattern as in Figure 8 allows a tag to move in a wide range up to w per frame by extending the size. So we can measure the position of the tag no matter how fast it moves by using this pattern. However, luminance of this pattern gradates only in one direction in which w stretches. Since we can measure the position of the tag on the marker only in this direction, we need to steer the rectangular pattern in the direction where the tag is moving. We predict the direction using output signals of accelerometers and measurement results with a circular marker pattern just before using the rectangular pattern.
When we use this pattern, we obtain the translation t using 51 ~ ll and w as )5.0( −⋅= tlwt where
)4
(4
43214321 nnnnt
lllllllll +++−
+++= .
We can also use the rectangular pattern to search for the position of the tag in a wide area on the display and to do an initial search by displaying this pattern while sequentially shrinking and rotating it (Figure 9). However, it is difficult for the rectangular pattern to alleviate the influence of ambient light and unevenness of LCD luminance compared with the circular pattern in the same size, so after the rectangular pattern is used to broadly estimate the position of a tag, the circular pattern is used to measures the precise position and the orientation.
B. Hybrid measuring method with photo sensors and accelerometers By computing a double integral of data from accelerometers
embedded in a tag, we can measure the relative change of the 3D position of the tag. However the measuring errors are accumulated in its computed result, so that we can’t expect accelerometers to precisely compute the 3D position especially when we use it to measure low-speed motion for a long-time (See Section IV.B).
Based on the previous discussion, we have proposed four measurement modes for typical motion patterns of a tag in a wide range not only by using two types of sensors complementarily but also by using two types of marker patterns (Figure 10).
In each mode both sensors are employed to predict the position, orientation, and size of a marker pattern in addition to predicting the suitable mode for the next measurement (Figure 11).
When a tag is static or moves slowly on a display, the tag motion is measured by the low-speed measurement mode. In this mode, the circular marker pattern is mainly used so that we can measure the position/orientation of the tag precisely.
We usually use this mode, but if the tag moves on a display comparatively fast, we use the high-speed measurement mode. In this mode, we use the rectangular marker pattern that is generated based on the position, orientation and size of the pattern predicted with the previous state and both sensors.
While a tag is moving above a display, we use accelerometers to keep tracking the 3D motion, and restart measuring the position/orientation using photo sensors and the rectangular pattern after the tag lands on the display. We call this mode the wide-area search mode.
In addition, we use static mode and a hidden marker pattern if a tag lands static on the display. A size of this pattern matches the base dimension of a tag so that a marker pattern
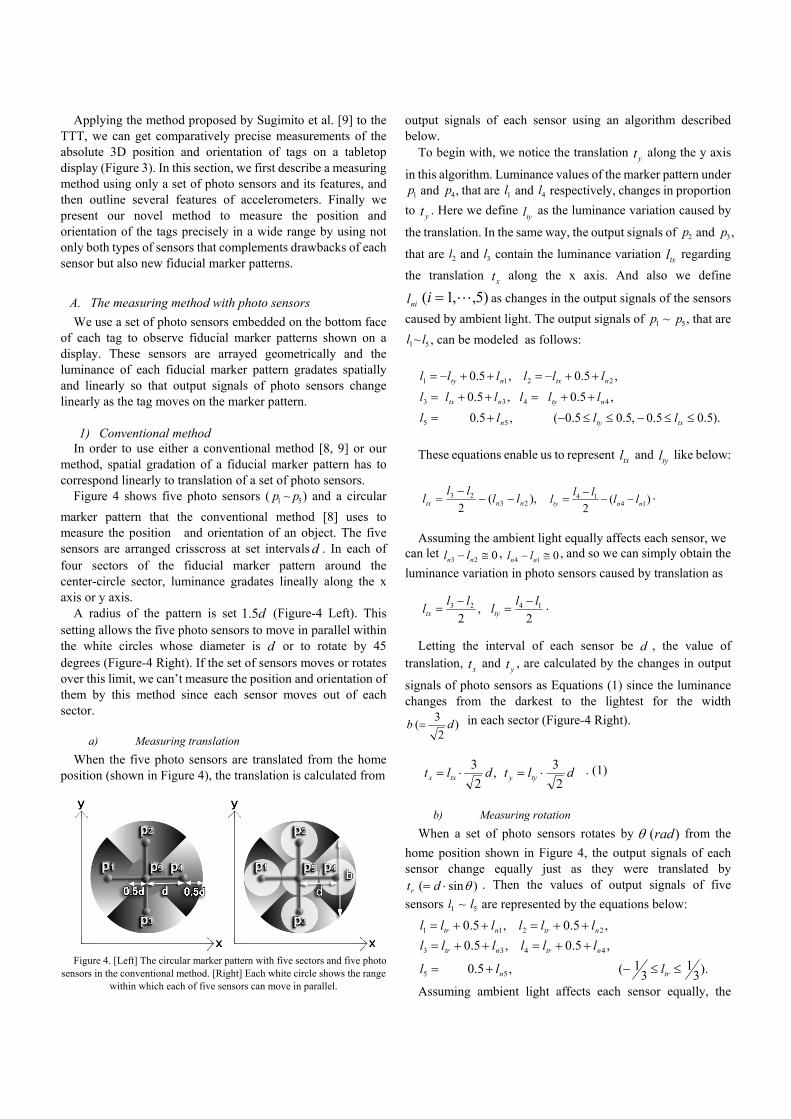
Figure 12. [Left] Four photo sensors fixed into plastic blocks.
[Right] A tag in which photo sensors and accelerometers are both embedded.
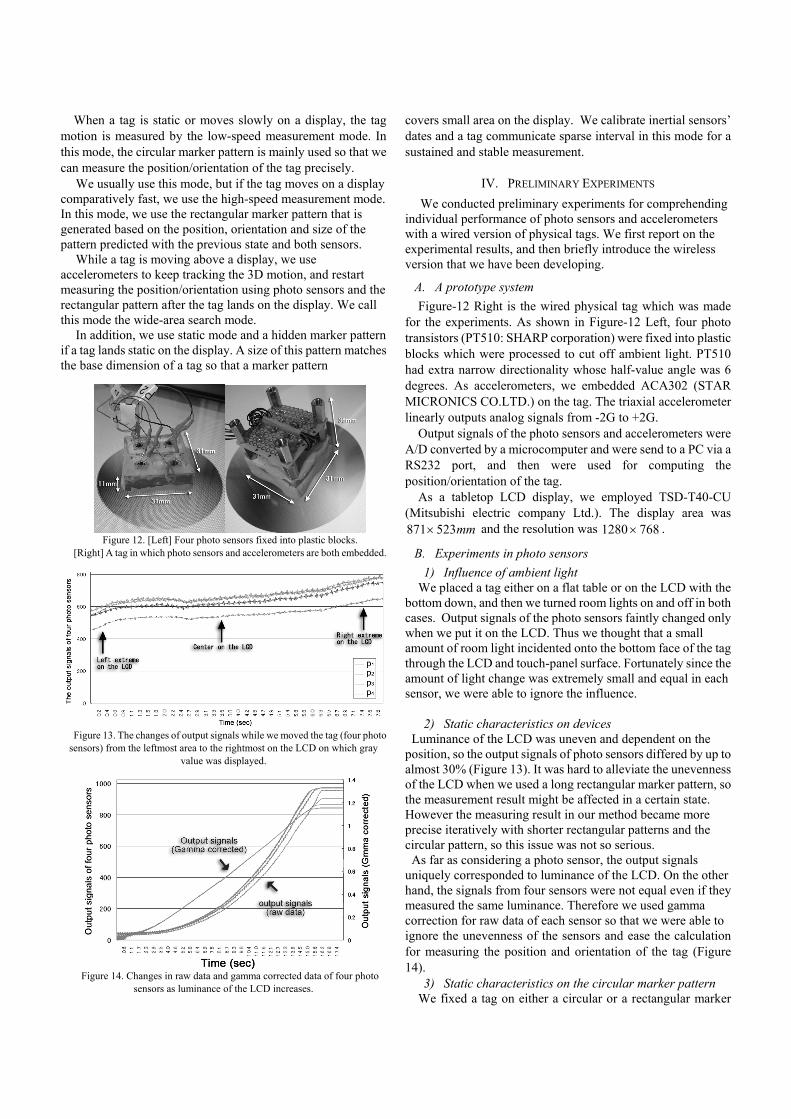
Figure 13. The changes of output signals while we moved the tag (four photo
sensors) from the leftmost area to the rightmost on the LCD on which gray value was displayed.
Figure 14. Changes in raw data and gamma corrected data of four photo
sensors as luminance of the LCD increases.
covers small area on the display. We calibrate inertial sensors’ dates and a tag communicate sparse interval in this mode for a sustained and stable measurement.
IV. PRELIMINARY EXPERIMENTS We conducted preliminary experiments for comprehending
individual performance of photo sensors and accelerometers with a wired version of physical tags. We first report on the experimental results, and then briefly introduce the wireless version that we have been developing.
A. A prototype system Figure-12 Right is the wired physical tag which was made
for the experiments. As shown in Figure-12 Left, four photo transistors (PT510: SHARP corporation) were fixed into plastic blocks which were processed to cut off ambient light. PT510 had extra narrow directionality whose half-value angle was 6 degrees. As accelerometers, we embedded ACA302 (STAR MICRONICS CO.LTD.) on the tag. The triaxial accelerometer linearly outputs analog signals from -2G to +2G.
Output signals of the photo sensors and accelerometers were A/D converted by a microcomputer and were send to a PC via a RS232 port, and then were used for computing the position/orientation of the tag.
As a tabletop LCD display, we employed TSD-T40-CU (Mitsubishi electric company Ltd.). The display area was
mm523871× and the resolution was 7681280 × .
B. Experiments in photo sensors 1) Influence of ambient light
We placed a tag either on a flat table or on the LCD with the bottom down, and then we turned room lights on and off in both cases. Output signals of the photo sensors faintly changed only when we put it on the LCD. Thus we thought that a small amount of room light incidented onto the bottom face of the tag through the LCD and touch-panel surface. Fortunately since the amount of light change was extremely small and equal in each sensor, we were able to ignore the influence.
2) Static characteristics on devices
Luminance of the LCD was uneven and dependent on the position, so the output signals of photo sensors differed by up to almost 30% (Figure 13). It was hard to alleviate the unevenness of the LCD when we used a long rectangular marker pattern, so the measurement result might be affected in a certain state. However the measuring result in our method became more precise iteratively with shorter rectangular patterns and the circular pattern, so this issue was not so serious. As far as considering a photo sensor, the output signals
uniquely corresponded to luminance of the LCD. On the other hand, the signals from four sensors were not equal even if they measured the same luminance. Therefore we used gamma correction for raw data of each sensor so that we were able to ignore the unevenness of the sensors and ease the calculation for measuring the position and orientation of the tag (Figure 14).
3) Static characteristics on the circular marker pattern We fixed a tag on either a circular or a rectangular marker

pattern displayed on the LCD, and then we measured the correspondences between output signals of four sensors and translation/rotation of the pattern.
Measurement errors reached around 0.04 mm in position and 0.007 degrees in orientation when the circular pattern used. The reason for them were that pixels of the LCD were not dense enough to display the marker pattern and its gradation of luminance, or the photo sensors might observe wider area in the marker pattern than we assumed. However, in the same way of the uneven luminance of the LCD, the measuring results were refined iteratively, so that these errors did not become a serious problem. In addition we noticed that it was effective to extend the circular marker pattern outward by 5 mm for alleviating the influence of graphics outside the marker more.
4) Dynamic characteristics on the system
We put these methods into practice, and confirmed the circular marker and a rectangular marker tracked the tag at sufficient speed for using this system for the TTT. Also the position/orientation of the tag obtained with the wide-area search mode was precise enough to start tracking it (Figures 15-17).
C. Experiments in accelerometers First we examined the static characteristic of ACA302. The computed position of a tag diverged as time went on because of accumulation of the measuring errors, which is so-called “drift”. Actually it reached 200 mm just for about 2 second.
Figure 15. Measuring the position and orientation of a tag using the low-speed measurement mode with the circular marker pattern.
Figure 16. An example of the wide-area search mode.
Then we examined the dynamic characteristic by observing
the computed positions when we moved the tag for a certain distance (300 mm or 570 mm). As shown in Figure 18, the results showed a tendency for the measuring error to become large when we moved the tag slower than a certain speed, which is let’s say 0.5 m/s. However we can compensate for these measuring errors with photo sensors and the circular marker patterns when a tag moves slowly. In contrast, faster a tag moves, more precise the measuring by accelerometers becomes.
Figure 17. [Left] Measuring the position and orientation of a tag moving at various speed by switching the low-speed measurement mode and the
high-speed measurement mode. [Right] Wide-area search after a tag moves above the display.
Figure 18. Relationship between maximum velocity and the measuring error
when a tag moves in parallel.
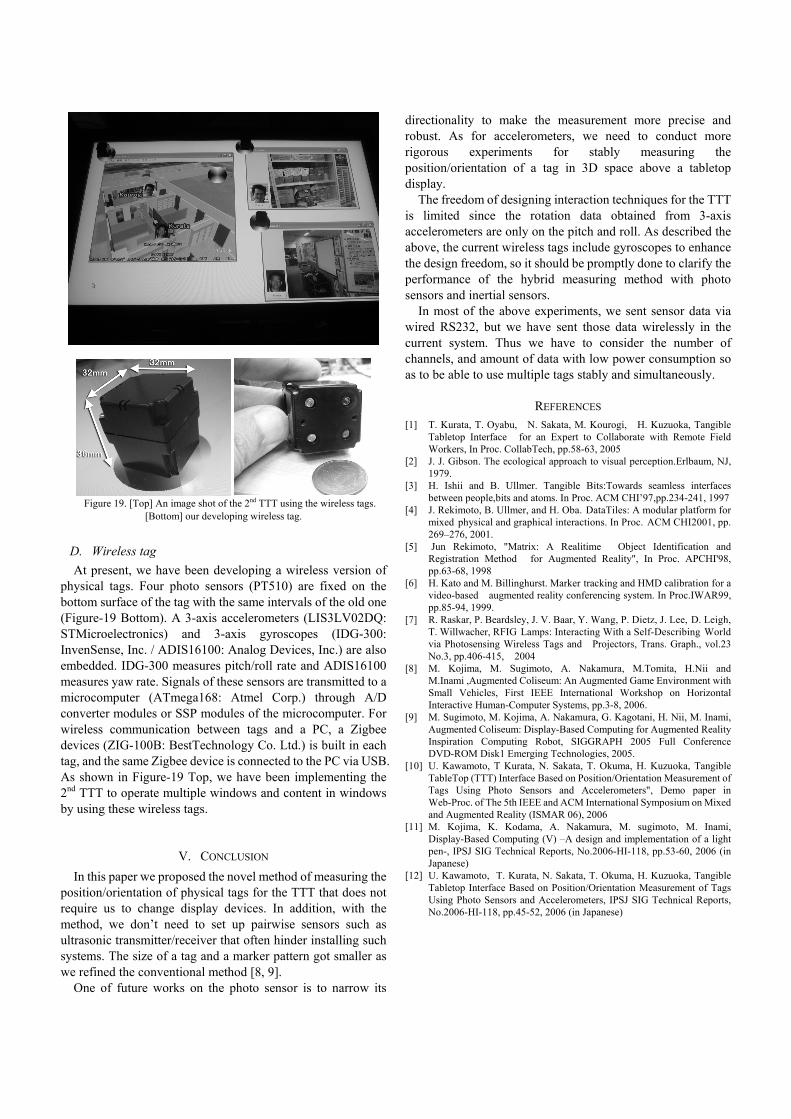
Figure 19. [Top] An image shot of the 2nd TTT using the wireless tags.
[Bottom] our developing wireless tag.
D. Wireless tag At present, we have been developing a wireless version of
physical tags. Four photo sensors (PT510) are fixed on the bottom surface of the tag with the same intervals of the old one (Figure-19 Bottom). A 3-axis accelerometers (LIS3LV02DQ: STMicroelectronics) and 3-axis gyroscopes (IDG-300: InvenSense, Inc. / ADIS16100: Analog Devices, Inc.) are also embedded. IDG-300 measures pitch/roll rate and ADIS16100 measures yaw rate. Signals of these sensors are transmitted to a microcomputer (ATmega168: Atmel Corp.) through A/D converter modules or SSP modules of the microcomputer. For wireless communication between tags and a PC, a Zigbee devices (ZIG-100B: BestTechnology Co. Ltd.) is built in each tag, and the same Zigbee device is connected to the PC via USB. As shown in Figure-19 Top, we have been implementing the 2nd TTT to operate multiple windows and content in windows by using these wireless tags.
V. CONCLUSION In this paper we proposed the novel method of measuring the
position/orientation of physical tags for the TTT that does not require us to change display devices. In addition, with the method, we don’t need to set up pairwise sensors such as ultrasonic transmitter/receiver that often hinder installing such systems. The size of a tag and a marker pattern got smaller as we refined the conventional method [8, 9].
One of future works on the photo sensor is to narrow its
directionality to make the measurement more precise and robust. As for accelerometers, we need to conduct more rigorous experiments for stably measuring the position/orientation of a tag in 3D space above a tabletop display.
The freedom of designing interaction techniques for the TTT is limited since the rotation data obtained from 3-axis accelerometers are only on the pitch and roll. As described the above, the current wireless tags include gyroscopes to enhance the design freedom, so it should be promptly done to clarify the performance of the hybrid measuring method with photo sensors and inertial sensors.
In most of the above experiments, we sent sensor data via wired RS232, but we have sent those data wirelessly in the current system. Thus we have to consider the number of channels, and amount of data with low power consumption so as to be able to use multiple tags stably and simultaneously.
REFERENCES [1] T. Kurata, T. Oyabu, N. Sakata, M. Kourogi, H. Kuzuoka, Tangible
Tabletop Interface for an Expert to Collaborate with Remote Field Workers, In Proc. CollabTech, pp.58-63, 2005
[2] J. J. Gibson. The ecological approach to visual perception.Erlbaum, NJ, 1979.
[3] H. Ishii and B. Ullmer. Tangible Bits:Towards seamless interfaces between people,bits and atoms. In Proc. ACM CHI’97,pp.234-241, 1997
[4] J. Rekimoto, B. Ullmer, and H. Oba. DataTiles: A modular platform for mixed physical and graphical interactions. In Proc. ACM CHI2001, pp. 269–276, 2001.
[5] Jun Rekimoto, "Matrix: A Realitime Object Identification and Registration Method for Augmented Reality", In Proc. APCHI'98, pp.63-68, 1998
[6] H. Kato and M. Billinghurst. Marker tracking and HMD calibration for a video-based augmented reality conferencing system. In Proc.IWAR99, pp.85-94, 1999.
[7] R. Raskar, P. Beardsley, J. V. Baar, Y. Wang, P. Dietz, J. Lee, D. Leigh, T. Willwacher, RFIG Lamps: Interacting With a Self-Describing World via Photosensing Wireless Tags and Projectors, Trans. Graph., vol.23 No.3, pp.406-415, 2004
[8] M. Kojima, M. Sugimoto, A. Nakamura, M.Tomita, H.Nii and M.Inami ,Augmented Coliseum: An Augmented Game Environment with Small Vehicles, First IEEE International Workshop on Horizontal Interactive Human-Computer Systems, pp.3-8, 2006.
[9] M. Sugimoto, M. Kojima, A. Nakamura, G. Kagotani, H. Nii, M. Inami, Augmented Coliseum: Display-Based Computing for Augmented Reality Inspiration Computing Robot, SIGGRAPH 2005 Full Conference DVD-ROM Disk1 Emerging Technologies, 2005.
[10] U. Kawamoto, T Kurata, N. Sakata, T. Okuma, H. Kuzuoka, Tangible TableTop (TTT) Interface Based on Position/Orientation Measurement of Tags Using Photo Sensors and Accelerometers", Demo paper in Web-Proc. of The 5th IEEE and ACM International Symposium on Mixed and Augmented Reality (ISMAR 06), 2006
[11] M. Kojima, K. Kodama, A. Nakamura, M. sugimoto, M. Inami, Display-Based Computing (V) –A design and implementation of a light pen-, IPSJ SIG Technical Reports, No.2006-HI-118, pp.53-60, 2006 (in Japanese)
[12] U. Kawamoto, T. Kurata, N. Sakata, T. Okuma, H. Kuzuoka, Tangible Tabletop Interface Based on Position/Orientation Measurement of Tags Using Photo Sensors and Accelerometers, IPSJ SIG Technical Reports, No.2006-HI-118, pp.45-52, 2006 (in Japanese)