
POSACONAZOLE PHARMACOKINETICS IN LUNG TRANSPLANT RECEIPIENTS...
65
1 POSACONAZOLE PHARMACOKINETICS IN LUNG TRANSPLANT RECEIPIENTS WITH AND WITHOUT CYSTIC FIBROSIS by Hongfei Zhang B.S., China Pharmaceutical University, 1996 M.S., China Pharmaceutical University, 2005 Submitted to the Graduate Faculty of School of Pharmacy in partial fulfillment of the requirements for the degree of Master of Science
Transcript of POSACONAZOLE PHARMACOKINETICS IN LUNG TRANSPLANT RECEIPIENTS...

1
POSACONAZOLE PHARMACOKINETICS
IN LUNG TRANSPLANT RECEIPIENTS WITH AND WITHOUT
CYSTIC FIBROSIS
by
Hongfei Zhang
B.S., China Pharmaceutical University, 1996
M.S., China Pharmaceutical University, 2005
Submitted to the Graduate Faculty of
School of Pharmacy in partial fulfillment
of the requirements for the degree of
Master of Science
University of Pittsburgh

ii
UNIVERSITY OF PITTSBURGH
SCHOOL OF PHARMACY
This thesis was presented
by
Hongfei Zhang
It was defended on
[July 15th, 2015]
and approved by
Jan H. Beumer, PharmD, PhD, Associate professor, School of Pharmacy
Christopher R. Ensor, PharmD, Assistant professor, School of Pharmacy
Thesis Advisor: Raman Venkataramanan, PhD, Professor, School of Pharmacy

iii
Copyright © by Hongfei Zhang
2015

iv
The incidence of invasive fungal infections (IFIs) is significantly high in patients
following lung transplantation. There have been no investigations on the pharmacokinetics of
posaconazole in patients with CF. In this study, 7 patients with CF and 13 patients without CF
were enrolled in a pharmacokinetic study upon initiation of posaconazole prophylaxis following
lung transplantation. We established a sensitive HPLC-fluorescence assay method to measure
plasma concentration of posaconazole. After a minimum five days of treatment, maximum
plasma concentration Css, max (0.311 μg/mL) in CF patients was 56% lower compared to Css, max
(0.699 μg/mL) in non-CF patients; the minimum plasma concentration Css, min (0.189·μg/mL) in
CF patients was lower by 60% compared to Css, min (0.474 μg/mL) in non-CF patients; the
average plasma concentration Css, av (0.233 μg/mL) in CF patients was lower by 61% compared
to Css, av (0.594 μg/mL) in non-CF patients, the dose normalized plasma area under curve AUC0-
24 (0.007 h*μg/mL) in CF patients was 65% lower compared to dose normalized AUC0-24 (0.02
h*μg/mL) in non-CF patients, and the apparent oral clearance of 2.51 L/h/kg in CF patients was
3.4 times higher compared to 0.74 L/h/kg in non-CF patients. Moreover, a steady state average
concentration of 0.7 μg/mL that is considered to be essentials for prophylaxis was only achieved
in 4 out of 20 patients. A good correlation between Ctrough and AUC0-τ demonstrates Ctrough is a
good surrogate marker to monitor systemic exposure of posaconazole in LTRs.
POSACONAZOLE PHARMACOKINETICS IN LUNG TRANSPLANT RECEIPIENTS
WITH AND WITHOUT CYSTIC FIBROSIS
Hongfei Zhang, M.S., University of Pittsburgh, 2015

v
TABLE OF CONTENT
PREFACE ..................................................................................................................................... XI
1.0 INTRODUCTION ......................................................................................................... 1
1.1 LUNG TRANSPLANTATION ............................................................................. 1
1.1.1 History of Lung Transplantation ..................................................................... 1
1.1.2 Types of Lung Transplantation ....................................................................... 2
1.1.3 Median Survival of Lung Transplantation ...................................................... 3
1.2 COMPLICATIONS AFTER LUNG TRANSPLANTATION .............................. 3
1.2.1 Causes of Death in LTRs ................................................................................ 3
1.3 CURRENT THERAPIES FOR INVASIVE FUNGAL INFECTIONS ................ 6
1.4 POSACONAZOLE.............................................................................................. 10
1.4.1 Posaconazole: a Promising First-line Prophylaxis and Treatment for Invasive
Fungal Infections .......................................................................................................... 10
1.4.2 Posaconazole Property and Mechanism of Its Antifungal Action ................ 11
1.4.3 Pharmacokinetic Profiles of Posaconazole ................................................... 12
1.4.4 Safety of posaconazole ................................................................................. 14
1.4.5 A Large Variation Is Observed in The Systemic Exposure of Posaconazole in
LTRs ....................................................................................................................... 15
1.5 CYSTIC FIBROSIS............................................................................................. 16
1.5.1 Pharmacokinetic Studies in CF Patients ....................................................... 17

vi
1.5.2 Pharmacokinetic Studies in LTRs With CF .................................................. 18
1.5.3 Pharmacokinetics of Antifungal Agents in CF Patients ............................... 18
2.0 MATERIALS AND METHODS ................................................................................. 20
2.1 CHEMICALS ...................................................................................................... 20
2.2 METHOD FOR POSACONAZOLE ASSAY..................................................... 20
2.2.1 Sample Preparation ....................................................................................... 20
2.2.2 HPLC Analysis Conditions ........................................................................... 21
2.2.3 Validation Procedures ................................................................................... 22
2.3 SYNOPSIS OF CLINICAL PROTOCOL........................................................... 23
2.4 POSACONAZOLE PHARMACOKINETIC AND STATISTICAL ANALYSES
............................................................................................................................. 25
3.0 RESULTS .................................................................................................................... 26
3.1 DETERMINATION OF EMISSION, EXCITATION AND OPTIMAL PH ..... 26
3.2 METHOD VALIDATION .................................................................................. 28
3.2.1 Selectivity ..................................................................................................... 28
3.2.2 Linearity ........................................................................................................ 30
3.2.3 Precision ........................................................................................................ 31
3.2.4 Accuracy ....................................................................................................... 33
3.2.5 Recovery ....................................................................................................... 34
3.2.6 Lower Limit of Quantification (LLOQ) ....................................................... 36
3.2.7 Stability ......................................................................................................... 36
3.2.8 Quality Controls ............................................................................................ 38

vii
3.3 POSACONAZOLE PLASMA CONCENTRATIONS IN PATIENT SAMPLES .
............................................................................................................................. 39
3.3.1 Patient Demographic Data ............................................................................ 39
3.3.2 Posaconaozle Plasma Concentrations in Lung Transplant Patients .............. 40
3.4 PHARMACOKINETIC PARAMETERS OF POSACONAZOLE .................... 41
3.5 A GOOD CORRELATION BETWEEN CTROUGH AND AUC0-Τ ....................... 43
4.0 DISCUSSION .............................................................................................................. 44
BIBLIOGRAPHY ......................................................................................................................... 50
viii
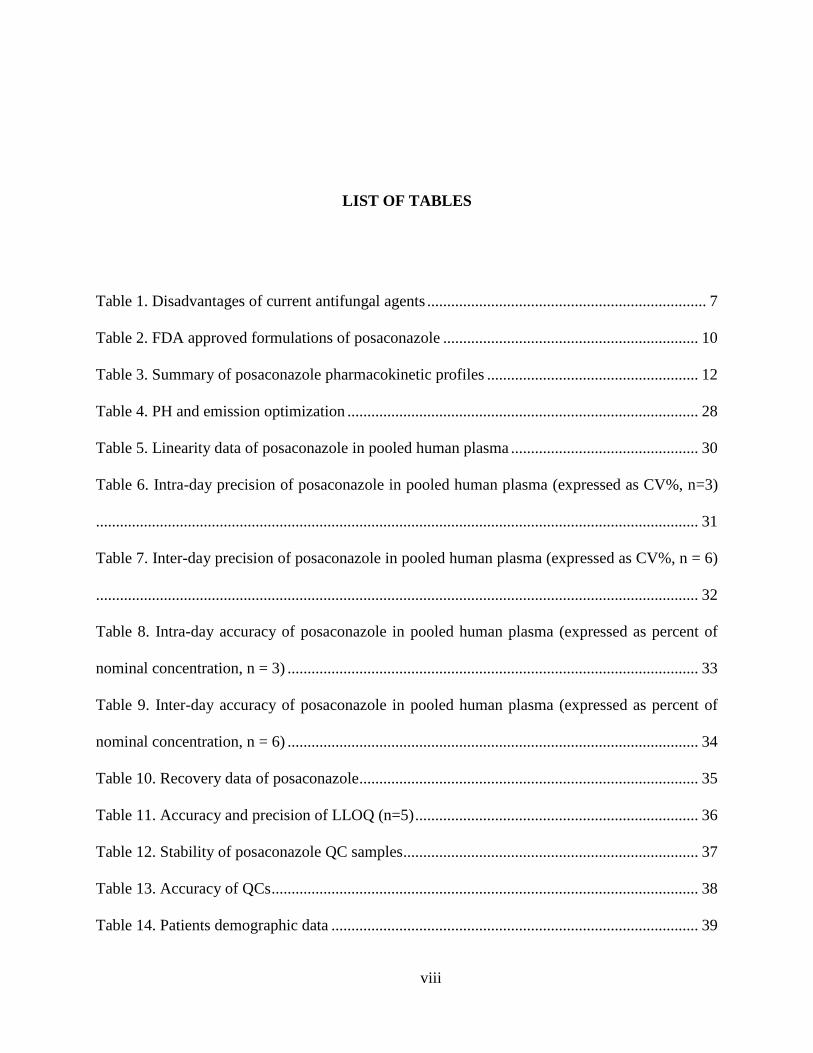
LIST OF TABLES
Table 1. Disadvantages of current antifungal agents ...................................................................... 7
Table 2. FDA approved formulations of posaconazole ................................................................ 10
Table 3. Summary of posaconazole pharmacokinetic profiles ..................................................... 12
Table 4. PH and emission optimization ........................................................................................ 28
Table 5. Linearity data of posaconazole in pooled human plasma ............................................... 30
Table 6. Intra-day precision of posaconazole in pooled human plasma (expressed as CV%, n=3)
....................................................................................................................................................... 31
Table 7. Inter-day precision of posaconazole in pooled human plasma (expressed as CV%, n = 6)
....................................................................................................................................................... 32
Table 8. Intra-day accuracy of posaconazole in pooled human plasma (expressed as percent of
nominal concentration, n = 3) ....................................................................................................... 33
Table 9. Inter-day accuracy of posaconazole in pooled human plasma (expressed as percent of
nominal concentration, n = 6) ....................................................................................................... 34
Table 10. Recovery data of posaconazole ..................................................................................... 35
Table 11. Accuracy and precision of LLOQ (n=5) ....................................................................... 36
Table 12. Stability of posaconazole QC samples.......................................................................... 37
Table 13. Accuracy of QCs ........................................................................................................... 38
Table 14. Patients demographic data ............................................................................................ 39

ix
Table 15. Pharmacokinetic parameters of posaconazole in CF and non-CF group (expressed as
median (range)) ............................................................................................................................. 42

x
LIST OF FIGURES
Figure 1. Allocation of causes of death in a time period following lung transplantation from 1992
to 2011 ............................................................................................................................................ 4
Figure 2. Risk factors for infections following lung transplantation .............................................. 5
Figure 3. Structure of posaconazole.............................................................................................. 11
Figure 4. Mechanism of antifungal action of posaconazole ......................................................... 11
Figure 5. Distribution of posaconazole plasma trough concentrations measured at our lab ........ 15
Figure 6. Health problem of cystic fibrosis .................................................................................. 16
Figure 7. Excitation and emission wavelength scan ..................................................................... 27
Figure 8. Representative chromatogram (A) Pooled blank human plasma; (B) Standard
calibration sample (3.0 μg/mL of posaconazole); (C) One patient sample .................................. 29
Figure 9. Posaconazole concentration - time profiles in 20 patients ............................................ 40
Figure 10. Correlation between Ctrough and AUC0-τ ..................................................................... 43

xi
PREFACE
First and foremost, I would like to express gratitude to my advisor, Dr. Raman
Venkataramanan for all his support. He always provided me with not only professional guidance
in my research, but also personal life lessons. I appreciate his diligence, generosity and kindness.
I am forever grateful to have been his student.
I owe tremendous thanks to Ryan K. Shields for performing the clinical study and for
supplying me with clinical information. I am extremely grateful to the members of my
dissertation committee: Dr. Jan H. Beumer and Christopher R. Ensor for their support and
advice. I sincerely thank Wenchen Zhao and Dr. Yang Zhao for their assistance with HPLC
method establishment for posaconazole. I also want to express my thanks to our lab members for
their friendship and kind advice. Special thanks to Lori M. Schmotzer and all faculty and staff in
the School of Pharmacy.
I thank my mother, father, sister, husband, and sons (Nash Wei and Spence Wei) for their
love and endorsement. Words cannot express my love and gratitude to them. This work is
dedicated to them.

1
1.0 INTRODUCTION
1.1 LUNG TRANSPLANTATION
1.1.1 History of Lung Transplantation
The foundation for clinical organ transplantation was laid by Alexis Carrel (1873-1944). In 1912,
Dr. Carrel was awarded the first Nobel Prize in physiology and medicine in recognition of his
groundbreaking contribution to vascular suture, and the transplantation of blood vessels and
organs (1). In 1963, Dr. James Hardy conducted the first human lung transplantation, but the
transplant recipient died after 18 days (2). Further, clinical lung transplantation was hampered by
lack of effective immunosuppressive agents and suboptimal surgical techniques. Twenty years
later, in 1982, the first successful human heart-lung transplantation was performed (3), and in the
following year, Dr. Joel Cooper carried out the first successful human single lung transplantation
with prolonged postoperative survival (4).
Lung transplantation has become a treatment option for patients with end-stage lung
disease over the past three decades. According to the 31st adult lung and heart-lung transplant
report from the Registry of the International Society for Heart and Lung Transplantation, 47, 647
adult lung transplants have been performed worldwide in 136 participating transplant centers
from 1985 to 2013 (5).

2
1.1.2 Types of Lung Transplantation
There are various types of lung transplantations including single lung transplantation, bilateral
lung transplantation, heart-lung transplantation and lobar lung transplantation. Both single and
bilateral lung transplantation are widely used in a variety of end-stage lung diseases. Single lung
transplantation could be applied to all end-stage lung diseases except for patients with septic lung
disease, which is an indication for bilateral lung transplantation. Although both single and
bilateral lung transplantation have continued to increase since the 1980s, the growth of bilateral
lung transplantation has exceeded single lung transplantation and has become the main form of
lung transplantation performed currently. According to the 29th report of the Registry of the
International Society for Heart and Lung Transplantation, conditional median survival
(transplant half-life) of single lung transplantation is 6.5 years, while it is 9.4 years for bilateral
lung transplantation (6). The more favorable median survival rate may be the reason that has led
to the increased numbers of bilateral lungs transplanted.
The indications for heart-lung transplantation are pulmonary vascular diseases, like
congenital heart disease and primary pulmonary hypertension. After a decline in 2003, the
number of heart-lung transplantation has stayed relatively stable. Around 100 cases are carried
out worldwide every year (6).
Living lobar lung transplantation is an alternative to cadaveric lung transplantation in
which right and left lower lobes from two separate donors are removed and implanted in a
recipient in place of the entire right and left lungs. Lobar lung transplantation remains a small
part of the total number of lung transplantations performed currently (7).

3
1.1.3 Median Survival of Lung Transplantation
In 2009, the conditional half-life of heart transplantation recipients was 14 years (8), while the
conditional half-lives of liver and kidney transplantation were over 12 years (9) and over 10
years (10) respectively. As of June 2010 overall median survival of single and bilateral lung
transplantation was 5.5 years, and conditional median survival was 7.7 years (7). Currently, the
median survival of lung transplantation is significantly lower compared with other solid organ
transplantations.
1.2 COMPLICATIONS AFTER LUNG TRANSPLANTATION
1.2.1 Causes of Death in LTRs
After lung transplantation, recipients may experience bronchiolitis, acute rejection, graft failure,
malignancy, infections and cardiovascular diseases that can cause recipients’ death.

4
Figure 1. Allocation of causes of death in a time period following lung transplantation from 1992 to
2011
Figure 1 demonstrates that infections are one of the main reasons for the mortality of the
LTRs and infections can result in death immediately after transplantation or over several years
(6). Between 1992 and 2011, during the first year after lung transplantation, almost 40% of
patients with infections died as a result of those infections (6).

5
Figure 2. Risk factors for infections following lung transplantation
As figure 2 shows, several reasons make infections more serious after lung
transplantation than after other solid organ transplantations. For example, the body may be
contaminated by the process of opening of the recipient’s airway during the lung transplant
surgery. Also, lungs are the only organs that are under a constant exposure to environmental
pathogens, which increases the chances of infections. Third, after lung transplantation,
immunosuppression must be well maintained in the recipients. Infection is a direct result of the
immunocompromised state of the LTRs. Moreover, lung infections can be caused by other
concomitant infections in the recipients.
Infections
Surgical Related
Environment
Immuno-
suppression
Concomitant Other
Infections

6
The incidence of IFIs is especially high in LTRs. IFIs are a direct consequence of
immunosuppression after solid organ transplantation. An investigation showed that fungal
infections occur in 15-35% of lung transplantations with a 60% overall mortality (11).
1.3 CURRENT THERAPIES FOR INVASIVE FUNGAL INFECTIONS
A few medications have been approved by the FDA for prophylaxis or treatment of lung
infections, including echinocandins, amphotericin, flucytosine and azoles. Voriconazole and
liposomal amphotericin B are recommended as the primary therapy for IFIs currently (12). These
drugs have certain limitations as summarized in Table 1. For example, voriconazole is involved
is metabolized by CYP2C19, CYP2C9 and CYP3A4 and involved in a number of drug
interactions. Amphotericin B is well known for its severe and potentially lethal side effects and
low response rate of 35%. Flucytosine has to be used with other antifungal agents due to
preexisting or emerging resistance. Echinocandins are only available for intravenous
administration (13).

7
Table 1. Disadvantages of current antifungal agents
Agent Profiles
Polyenes
Amphotericin B
Physiochemical: MW: 924, LogP: 0.8, pka1: 5.5
Only available for intravenous administration.
PK parameters: different formulations possess unique PK profiles.
Well known for its severe nephrotoxicity and infusion related reactions.
Pyrimidine analogues
Flucytosine
Physiochemical: MW: 129 , LogP: -1.1, pKa: 3.26
Only available for oral formulation.
PK parameters: half-life 2.4 to 4.8 hours, linear correlation between the elimination rate
constant of flucytosine and creatinine clearance, widely distributes in body water (volumes of
distribution from 0.6 to 0.9 L/kg
Preexisting or emerging resistance is common, must be combined with another antifungal.
Echinocandins
Caspofungin

8
Physiochemical: MW: 1093, LogP: -4.82
Only available for intravenous administration.
PK parameters: half-life 9-11 hours, clearance: 12 mL/min, volume of distribution: 9.67L
Significant acquisition costs.
Azole
Fluconazole
Physiochemical: MW: 306, LogP: 0.4, pKa2: 1.76
Available for intravenous and oral administration.
PK parameters: half-life 30 hours, clearance: 15 mL/min, volume of distribution: 50 L
Absence of activity against Aspergillus spp.; frequently reduced or absent activity against
Candida glabrata; inherent resistance of Candida krusei.
Itraconazole
Physiochemical: MW: 706 , LogP: 5.66, pKa: 3.7

9
Available for intravenous and oral administration.
PK parameters: half-life 21hours, clearance: 381 mL/min, volume of distribution: 796 L
FDA black box warning for heart failure; Capsule formulation highly variable; Acid-
dependant oral bioavailability leads to subtherapeutic; concentrations in critically ill patients
with elevated gastric pH; solution improves bioavailability, but associated with
gastrointestinal intolerance.
Voriconazole
Physiochemical: MW: 349 , LogP: 1, pKa: 2.27
Available for intravenous and oral administration.
PK parameters: half-life 21hours, clearance: 338 mL/min, volume of distribution: 4.6 L/kg
Voriconazole is metabolized by CYP2C19, 2C9, 3A4). Highly variable pharmacokinetics
Involved in a number of drug interactions.
Note: information of the table is from package insert of individual drug and www.drugbank.ca, except other
expcification.
1https://www.sigmaaldrich.com/content/dam/sigma-aldrich/docs/Sigma/Datasheet/6/a9528dat.pdf
2 http://www.pfizer.ca/sites/g/files/g10017036/f/201410/DIFLUCAN%282%29.pdf

10
1.4 POSACONAZOLE
1.4.1 Posaconazole: a Promising First-line Prophylaxis and Treatment for Invasive
Fungal Infections
Posaconazole was initially approved by the FDA as a suspension in 2006 for prophylaxis of
invasive Aspergillus and Candida infections in patients who are at high risk of developing these
infections due to the immunocompromised status of the patients. Posaconazole is also a
treatment for oropharyngeal candidiasis (OPC), including OPC refractory (rOPC) to itraconazole
and/or fluconazole. Posaconazole is a potent and broad-spectrum triazole antifungal agent. It is
effective against fungi that are refractory to other antifungal drugs. Posaconazole tablets and
injection were approved in 2013 and 2014, respectively (Table 2).
Table 2. FDA approved formulations of posaconazole
Formulation Strength Approval date
Suspension 40 mg/mL Sep. 2006
Tablet, Delayed- release 100 mg Nov. 2013
Injection 300mg per 16.7 mL Mar. 2014

11
1.4.2 Posaconazole Property and Mechanism of Its Antifungal Action
Figure 3. Structure of posaconazole
Posaconazole is a lipophilic drug with a logP of 5.4, pKa1 of 3.6 (piperazine) and pKa2 of 4.6
(triazole) (14). It belongs to class II in the biopharmaceutical drug classification system, which
means posaconazole has low solubility and high permeability. The molecular structure is shown
in Figure 4.
As with other triazole antifungal agents, posaconazole works by binding to the heme
cofactor located on the active site of the cytochrome P450 (CYP)-dependent 14α-demethylase,
an enzyme responsible for the conversion of lanosterol to 14α-dimethyl lanosterol in the
ergosterol biosynthetic pathway (Fig. 5). Ergosterol is an essential component of the fungal cell
membrane; therefore, inhibition of synthesis of ergosterol leads to disruption of the integrity and
function of the fungal cell membrane, as well as inhibition of fungal growth (15).
Figure 4. Mechanism of antifungal action of posaconazole
Mechanism of Action
lanosterol 14α-dimethyl
lanosterol ergosterol
14α-
demethylase
Ergosterol: an essential component of fungal cell
membrane.

12
1.4.3 Pharmacokinetic Profiles of Posaconazole
The pharmacokinetics properties of posaconazole are listed in Table 3.
Table 3. Summary of posaconazole pharmacokinetic profiles
Parameter Pharmacokinetic Profile
Absorption The peak of plasma concentration was observed around 3-5 hours following
administration of the oral suspension.
Absorption is significantly improved when administered with food.
Distribution Large apparent volume distribution (261 L).
Posaconazole is highly protein bound (98.2%), mainly to albumin.
Metabolism Primarily by glucuronidation;
P-gp substrate.
CYP3A4 inhibitor.
Elimination In healthy volunteers, after intravenous injection, the clearance was 6.5 L/h with a
half-life of 24 h.
Mainly eliminated in feces with the parent drug as the major component.
1.4.3.1 Absorption
The peak of plasma concentration of posaconazole (Cmax) is normally observed around 3-5 hours
following administration of an oral suspension. Both Cmax and area under curve (AUC) are
significantly higher when posaconazole is administrated with food, therefore whenever possible,
posacoazole suspension should be taken after a full meal (16). Because posaconazole AUC can
be markedly improved by smaller multiple daily doses (17), two or three doses per day are
recommended, although posaconazole has a long half-life. Besides food and dosing frequency,

13
posaconazole absorption can be affected by gastric pH. For example, proton pump inhibitors can
decrease posaconazole absorption (18). Given that gastric acid suppression therapy is common
among patients undergoing transplantation, we would anticipate poor absorption of posaconazole
in this patient population.
There is no data available regarding to the relative bioavailability of posaconazole
suspension, however, we predict that posaconazole suspension has a low bioavailability due to
its low solubility, being a substrate of P-gp efflux, and due to gut metabolism by UGT phase II
enzymes.
Recently a delayed-release tablet was developed with improved absorption and
bioavailability of posaconazole. The pharmacokinetics of tablet has been evaluated in healthy
volunteers. Under fasting condition, the AUC and Cmax for the tablet were slightly higher than the
suspension. However, under fed condition, the AUC and Cmax for the tablet were 3 times higher
than the suspension, and tablet showed less variability in exposure compared to the suspension
(19). The absolute bioavailability of the delayed-release tablet is 54% under fasting conditions
(16).
1.4.3.2 Distribution
Posaconazole has a large volume distribution and is also highly bound to albumin (20). The
average volume distribution is 261 L, after intravenous administration. Posaconazole is
distributed to pulmonary tissue and alveolar cells (21).
1.4.3.3 Metabolism
In healthy subjects, posaconazole has a mean half-life about 24 hours, but no half-life is reported
in patients following intravenous injection. Posaconazole mainly circulates in the blood as the
parent compound. Unlike other triazole antifungal agents, posaconazole is not metabolized by
14
cytochrome P450 enzyme. Only about 17% of the administered posaconazole is metabolized by
UDP-glucuronosyl transferase (UGT) 1A4 (22, 23), and its glucuronide metabolites have no
antifungal activities (24). Compared with other triazole antifungal agents, posacoazole has fewer
drug-drug interactions so its pharmacokinetic parameters are less influenced when co-
administrated with other drugs. However, posaconazole is a substrate of P-glycoprotein (P-gp)
mediated efflux (16), and when P-gp function is altered by either endogenous or exogenous
compounds, posaconazole pharmacokinetic parameters will be altered. In healthy volunteers,
after a single intravenous injection of 200 mg, the total body clearance was 6.5 L/h (16). But
clearance of posaconazole after intravenous injection has not been reported in patients.
1.4.3.4 Excretion
In one study, after administration of a radiolabeled suspension dosage form, 76.9% of
administrated posaconazole was excreted in feces (66.3% was posaconazole). Meanwhile, the
urinary excretion of posaconazole was negligible (24).
1.4.4 Safety of posaconazole
The most frequently observed adverse events in patients using posaconazole were diarrhea,
hypokalemia, pyrexia and nausea in clinical trials. Mild to moderate elevations in alanine
aminotransferase (ALT) and aspartate aminotransferase (AST) have also been reported in
clinical trials. Therefore patient’s liver function should be assessed at the onset of posaconazole
therapy and monitored during treatment (16). Like other azole antifungal agents, posaconazole
can prolong QT interval and can lead to arrhythmias (16).
15
1.4.5 A Large Variation Is Observed in The Systemic Exposure of Posaconazole in LTRs
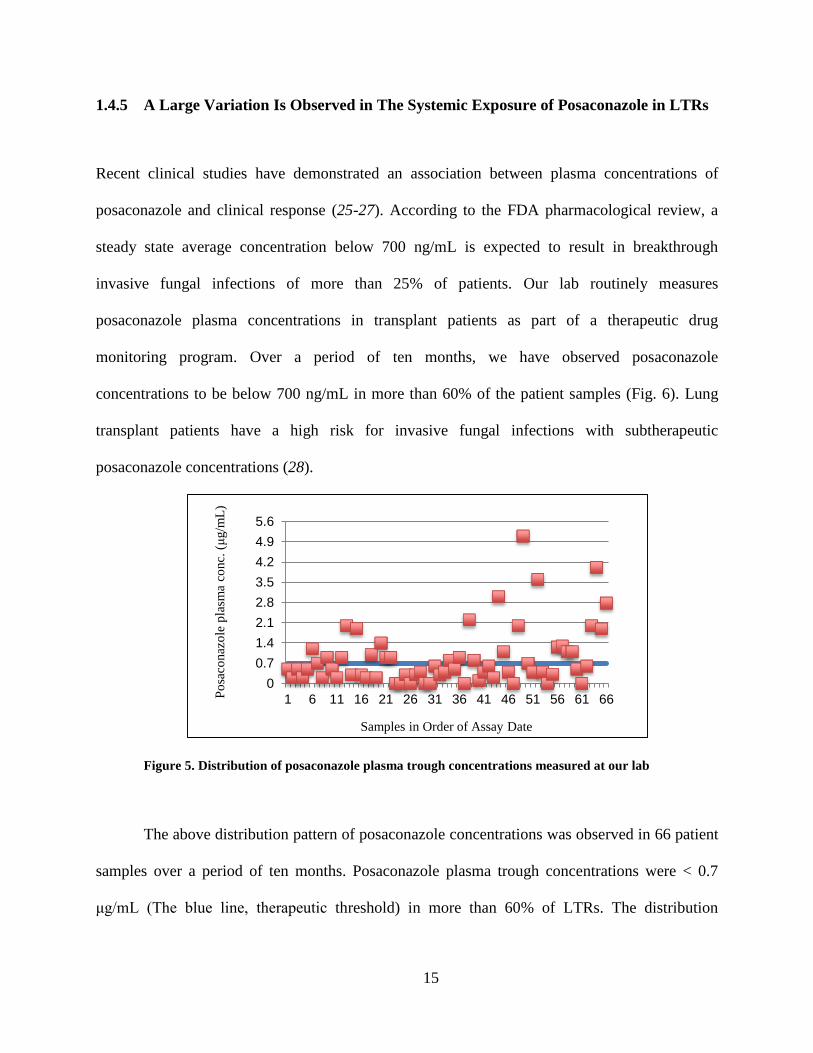
Recent clinical studies have demonstrated an association between plasma concentrations of
posaconazole and clinical response (25-27). According to the FDA pharmacological review, a
steady state average concentration below 700 ng/mL is expected to result in breakthrough
invasive fungal infections of more than 25% of patients. Our lab routinely measures
posaconazole plasma concentrations in transplant patients as part of a therapeutic drug
monitoring program. Over a period of ten months, we have observed posaconazole
concentrations to be below 700 ng/mL in more than 60% of the patient samples (Fig. 6). Lung
transplant patients have a high risk for invasive fungal infections with subtherapeutic
posaconazole concentrations (28).
Figure 5. Distribution of posaconazole plasma trough concentrations measured at our lab
The above distribution pattern of posaconazole concentrations was observed in 66 patient
samples over a period of ten months. Posaconazole plasma trough concentrations were < 0.7
μg/mL (The blue line, therapeutic threshold) in more than 60% of LTRs. The distribution
0
0.7
1.4
2.1
2.8
3.5
4.2
4.9
5.6
1 6 11 16 21 26 31 36 41 46 51 56 61 66
Samples in Order of Assay Date
Po
saco
naz
ole
pla
sma
conc.
(μ
g/m
L)

16
demonstrates posaconazole suspension didn’t produce sufficient plasma concentration, which
puts patients at high risk for invasive fungal infection after transplantation.
1.5 CYSTIC FIBROSIS
Cystic fibrosis is an autosomal recessive genetic disorder that primarily affects the lungs and
digestive system (Fig. 3). In patients with CF, a defective gene causes the body to produce
unusually thick, sticky mucus that clogs the lungs and leads to life-threatening lung infections.
Lung transplantation is a treatment for patients with advanced CF. Between 1995 and 2011, CF
was the third most common reason for lung transplant, with an overall rate of 16.7% (6).
Figure 6. Health problem of cystic fibrosis

17
Resource: http://en.wikipedia.org/wiki/Cystic_fibrosis
1.5.1 Pharmacokinetic Studies in CF Patients
Lower plasma concentrations of many drugs have been reported in patients with CF. The altered
pharmacokinetics of drugs in CF patients are the results of multiple factors. It is well-known that
CF patients are malnutrished due to malabsorption in the intestinal tract (29). The main cause of
malabsorption is pancreatic insufficiency, so CF patients normally receive pancreatic enzyme
supplement to facilitate absorption of nutrients (30). Decreased absorption of drugs in CF
patients similar to malabsorption of nutrients has been speculated. In fact, there are many
pathological changes in CF patients that can affect drug absorption, such as a more acidic
circumstance in the duodenum, insufficient pancreatic enzymes secretion, altered bile acid
turnover and a prolonged intestinal mobility (31). Therefore, drugs with different physiochemical
property may demonstrate variable absorption in CF patients.
Poor absorption, larger volume distribution and high total body clearance of certain drugs
in patients with CF may explain the observed lower plasma concentrations of several drugs in
patients with CF (32-34). However, the mechanism behind the altered pharmacokinetic profiles
of many drugs in CF patients has not been completely evaluated. Many studies have investigated
pharmacokinetics changes in CF patients, but the results are conflicting.
Pharmacokinetics of oral ciprofloxacin has been studied in six CF patients and six
healthy control subjects, closely matched with age, sex and weight. There was no statistical
differences in dose normalized plasma area under curve (AUC), maximum plasma concentration
(Cmax), half-life, total body clearance, renal clearance, and volume of distribution of
ciprofloxacin between CF and the control group (35).

18
One study demonstrated a significantly lower serum concentration of cloxacillin in CF
patients accompanied by dramatically increased total body clearance. However, no significant
difference in the bioavailability of cloxacillin was observed in CF group compared with non-CF
group after patients intravenous and oral administeration of cloxacillin (36).
1.5.2 Pharmacokinetic Studies in LTRs With CF
To date, limited information is available regarding the pharmacokinetics of drugs in LTRs with
CF. Three pharmacokinetic studies have been conducted in this patient population but only one
study compared the pharmacokinetics to a group of control subjects (37-39). That study was
designed to assess the pharmacokinetics of tacrolimus in 22 LTRs (11 with CF and 11 without
CF) (39). In the study, the CF group required a higher dose of tacrolimus to achieve similar drug
exposure compared to non-CF group, and after dose normalization, AUC and Cmax were
significantly lower in CF group compared to the non-CF group. Higher apparent total body
clearance and larger apparent volume of distribution were reported in the CF group.
1.5.3 Pharmacokinetics of Antifungal Agents in CF Patients
Although there is a high incidence of IFIs in CF patients, there are very few studies that have
investigated pharmacokinetic profiles of antifungal agents in this patient population. Only three
studies have been performed, but none of them compared the pharmacokinetics of antifungal
drugs in CF patients with a control group.
The pharmacokinetics and safety of oral itraconazole was evaluated in 17 patients with
CF. Despite receiving the recommended dosages of the oral solution, 11 of the patients did not

19
reach the target therapeutic threshold at steady state (40). The pharmacokinetics itraconazole
after administration of capsule and oral solution were assessed in 30 CF patients. Although the
patients received standard dosage of itraconazole, one half of the plasma samples had
concentrations below the limit of detection (0.04 mg/L) (41). The recommended breakpoint of
Ctrough for itraconazole is 0.5 mg/L (42).
A retrospective study reported the plasma trough concentration of voriconazole in CF
patients after lung transplantation. Following the standard dosing regimen (400 mg/day), in 30%
of the 35 CF patients the plasma concentration was lower than 0.5 mg/L (therapeutic
concentration is 1-2 mg/L). Even after increasing the dose (570 ± 160 mg/day), 40% of these
patients did not reach target plasma concentrations 16 days later (38).
No study has been performed to investigate the pharmacokinetic alterations of antifungal
agents in LTRs with CF. Our goal is to compare the pharmacokinetics of posaconazole in LTRs
with and without CF in order to improve treatment outcome with posaconazole. Because of the
physiochemical property of posaconazole, a lipophilic drug with low solubility, we anticipated
poor absorption of posaconazole in LTRs with CF, which exposes these patients to higher risk
for IFIs.
We hypothesize that LTRs with CF will have a significantly lower systemic exposure
compared with LTRs without CF following oral administration of posaconazole suspension due
to pathophysiological changes observed in CF. Our aims were as follows,
Specific aim 1 was to develop and validate a simple and sensitive analytical method to quantify
plasma concentrations of posaconazole in clinical samples.
Specific aim 2 was to investigate the pharmacokinetic difference in LTRs with and without CF.

20
2.0 MATERIALS AND METHODS
2.1 CHEMICALS
Posaconazole was a gift from the Schering-Plough (Wicklow, Ireland). The itraconazole that was
used as an internal standard (IS) was a gift from Janssen-Cilag (Beerse, Belgium). Acetonitrile,
methanol, and water, all HPLC Grade, were purchased from Sigma-Aldrich. Formic acid,
reagent grade, was also purchased from Sigma-Aldrich. Pooled human plasma was obtained
from the central lab at the University of Pittsburgh Medical Center (Pennsylvania, USA).
Ultrapure water was obtained from Milli-Q water purification system.
A Symmetry C18 column (4.6×250 mm) was purchased from Waters; solid phase
extraction (SPE) cartridges (Oasis, Hydrophilic-Lipophilic-Balanced, reverse-phase sorbent, 1cc/
30 mg) were also purchased from Waters.
2.2 METHOD FOR POSACONAZOLE ASSAY
2.2.1 Sample Preparation
Posaconazole stock solution with a concentration of 10 mg/mL was prepared in methanol and
was diluted with methanol to obtain 0.02, 0.05, 0.1, 0.2, 0.5, 1.0, and 3.0 mg/mL as working

21
solutions. Posaconazole working solutions were spiked into pooled human plasma to obtain
samples at concentrations of 0.02, 0.05, 0.1, 0.2, 0.5, 1.0, and 3.0 μg/mL as calibration standards.
Stock solution for quality controls (QCs) with a concentration of 4.9 mg/mL was prepared in
methanol and was diluted with methanol afterwards to obtain 0.049, 0.49, and 2.94 mg/mL as
working solutions. These working solutions were spiked into pooled human plasma to obtain
samples with the concentrations of 0.049, 0.49, and 2.94 μg/mL as QCs. IS stock solution 400
μg/mL in methanol was diluted to 8 μg/mL with 50% methanol. In safe-lock tubes, these stock
solutions, working solutions, calibration standards, and QCs were frozen at –20°C.
Plasma posaconazole concentrations were determined by a reverse-phase HPLC with a
fluorescence detector. Standard curves were prepared by spiking blank human plasma with
posaconazole working solutions. Internal standard 25μL was added to each sample. Solid phase
extraction cartridges loaded with 200μL plasma samples, were washed independently with 50%
methanol and then the posaconazole and IS were eluted with 100% methanol. The eluent was
dried under a stream of air. The dried residues were reconstituted into 100 μL with acetonitrile
and water (60:40, v: v).
2.2.2 HPLC Analysis Conditions
The system consisted of Waters 2695 HPLC separation module and Waster 2475 fluorescence
detector. Excitation and emission wavelengths were set as 258 and 350 nm, respectively. A
Symmetry C18 column was used together with a 0.5-mm precolumn filter. The column oven was
set to 40°C, the injection volume was 20 μL, and the autosampler tray was set to 10°C. The
compounds were separated with 25% of A consisting of water: acetonitrile (95:5, v:v) with

22
formic acid at a pH of 2, and 75% of B consisting acetonitrile: formic acid (100: 0.1, v: v), as
mobile phase. The mobile phase flow rate was 1.2 mL/min.
2.2.3 Validation Procedures
The HPLC-fluorescence method was optimized for emission and excitation wavelengths, and
pH, and validated by selectivity, linearity, precision, accuracy, recovery, and stability.
Emission, excitation wavelengths, and pH optimization were performed by comparing the
signal intensity of posaconazole and IS by changing different combinations of emission,
excitation wavelengths, and pH. Samples for study of emission, excitation wavelengths, and pH
optimization were prepared by spiking posaconazole and IS working solutions into reconstitution
medium. Selectivity was performed by analyzing pooled human blank plasma from six
individuals in order to exclude potential interference from any endogenous substances in the
assay. (What about other drug interference?)
Linearity was studied by assessing linear regression of HPLC response and posaconazole
concentration in a range of 0.02-3.0 μg/mL. Samples for linearity study were prepared by spiking
IS into calibration standards at series of concentrations (0.02, 0.05, 0.1, 0.2, 0.5, 1, and 3 μg/mL)
and samples were processed as described in the sample preparation section. The peak area ratios
of the posaconazole against the IS were plotted against posaconazole concentration. Weighting
of 1/response was applied during the regression analysis.
The lowest limit of quantification (LLOQ) was evaluated by using five samples from the
calibration standards at 0.02 μg/mL to analyze if the back-calculated concentrations have the
precision that are within 20% of CV and have the accuracy within 20% of 0.02 μg/mL.
Precision included intra- and inter-day reproducibility. QCs of three different

23
concentrations (0.049, 0.49, and 2.94 μg/mL) were tested. For intra-day precision, three samples
of each concentration were assayed on a single day; for inter-day precisions, six samples of each
concentration were measured on three consecutive days. The intra-day and inter-day coefficient
of variations were within 15%.
Accuracy included intra- and inter-day accuracy. QCs of three different concentrations
(0.049, 0.49, and 2.94 μg/mL) were tested. For intra-day accuracy, three samples of each
concentration were assayed on a single day; for inter-day accuracy, six samples of each
concentration were measured on three consecutive days. The intra-day and inter-day accuracy
were within 85% to 115% of the nominal values.
Recovery experiments (extraction efficiency) were performed by comparing the
responses of extracted QC samples (0.049, 0.49, and 2.94 μg/mL) with the response of
corresponding concentrations of posaconazole in eluent obtained from extracted blank human
plasma that represents 100% recovery.
The stability of posaconazole QCs at low and high concentrations were assessed under
three freeze-thaw cycles, placing samples on room temperature for 24 hours and remaining
processed samples in the autosampler for 16 hours.
2.3 SYNOPSIS OF CLINICAL PROTOCOL
Title of Study Pharmacokinetic Analysis of Posaconazole in LTRs
Number of Planned
Subjects
A total enrollment of 20 patients
10 patients in each of the following groups will be enrolled:

24
1) LTRs with CF
2) LTRs without CF as controls
Study Model A single-center, two-cohort, prospective and observational study.
Primary Objectives To characterize the PK of posaconazole in LTRs on a fixed-dose
regimen in order to determine the extent of interpatient variability
and factors that lead to interpatient variability in plasma levels.
Subject Selection
Criteria
Primary Inclusion criteria:
Inform consented;
≥18 years old;
Initiation of posaconazole prophylaxis following lung
transplantation.
Primary Exclusion criteria:
Received posaconazole within the previous 30 days.
Study Therapies Posaconazole suspension ( NOXAFIL® ) 400 mg b.i.d.
Blood sampling Serial blood samples (3 mL) will be collected in heparinized tubes
from each patient just prior to (0 h) and at 2, 4, 6, 8, and 12 h
following administration of a minimum of five days of treatment.
Blood Samples
Processing
The exact time of the blood draw will be recorded, and blood
samples will be placed in ice and subsequently centrifuged at
1,000g for 10 min, and the plasma stored at − 80°C until they are
assayed.

25
2.4 POSACONAZOLE PHARMACOKINETIC AND STATISTICAL ANALYSES
Posaconazole pharmacokinetic analyses Pharmacokinetic analyses were performed using
Phoenix WinNonlin® 6.4. Maximum plasma concentration at steady state (Css, max), time to Css,
max (Tmax), minimum plasma concentration at steady state (Css, min), and elimination rate constant
k were obtained from Phoenix WinNonlin®. Posaconazole plasma concentrations were used to
determine the pharmacokinetic parameters using a non-compartment model. Maximum plasma
concentration at steady state (Css, max), time to Css, max (Tmax), minimum plasma concentration at
steady state (Css, min) after five doses were obtained from each patient’s plasma concentration-
time profile. Ctrough was defined as concentration at time zero. Area under plasma concentration
versus time curve (AUC) was determined from time zero (0 h) to 12 h or to 8 h using the
trapezoidal method. Average concentration at steady state (Css, av) was calculated by AUC0-24/24.
There was some deviation from the protocol regarding dosing and blood sampling time,
therefore, sometimes plasma concentrations at 12 h or 8 h were extrapolated using the
elimination rate constant k; plasma concentrations at 0 h were assumed to be identical to the
concentrations at 12 h or 8 h at steady state whenever necessary. Oral clearance (CL/F) was
calculated according to the equation CL/F = Daily Dose/AUC0-24.
Statistic analyses Statistic analyses were conducted using GraphPad Prism 6.0. Mann-Whitney
non-parametric test was applied to compare the difference in pharmacokinetic parameters
between LTRs with or without CF. A P value of < 0.05 was considered statistically significant.

26
3.0 RESULTS
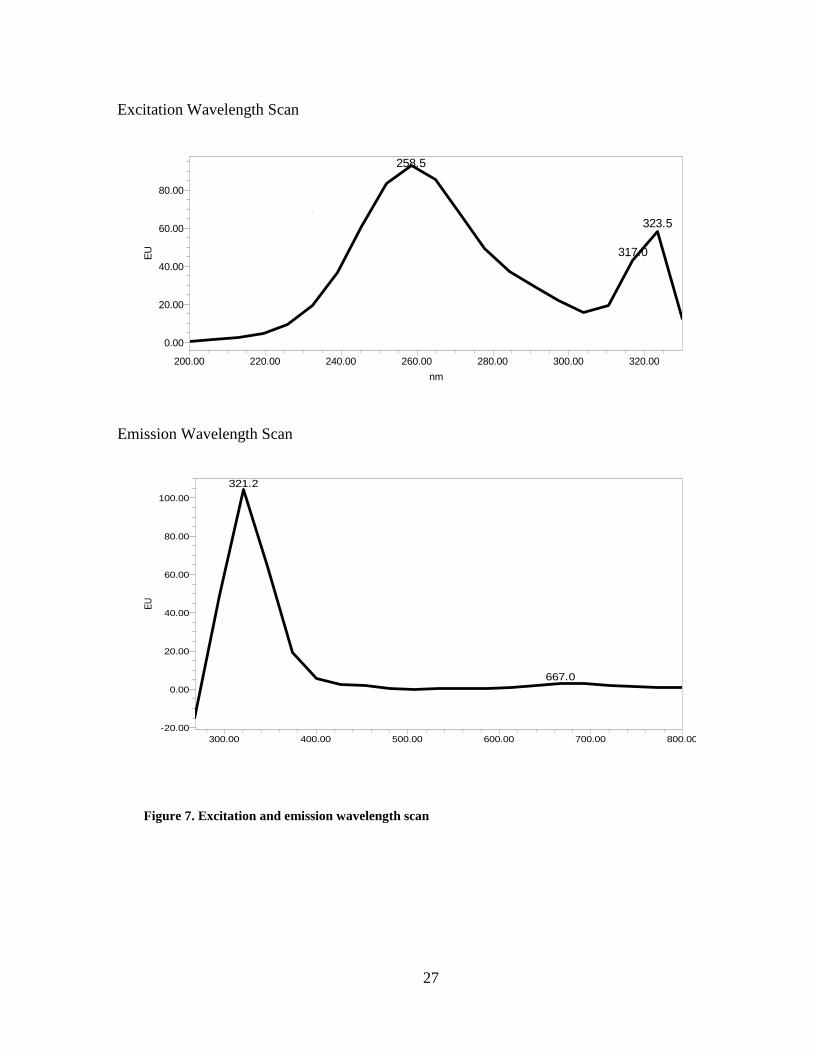
3.1 DETERMINATION OF EMISSION, EXCITATION AND OPTIMAL PH
Optimal emission, excitation and pH were evaluated by spiking posaconazole and IS working
solutions into reconstitution solution to obtain posaconazole at 6 μg/mL and IS at 4μg/mL.
Injection volume was 10 μL.
We observed excitation and emission peaks at 258 nm and 321 nm, respectively, after
wavelength scans for excitation and emission (Fig. 7). To the best of our knowledge, there are
two publications using HPLC with fluorescence detection for posaconazole quantification. They
reported using excitation 260 nm, emission 350 nm, and excitation wavelength 240 nm, emission
wavelength 385 nm, respectively (43, 44). We optimized the emission wavelength and pH to get
a good response from both posaconazole and IS from a fluorescence detector.
When pH of the mobile phase was greater than 3.5, it was difficult to detect the peaks of
posaconazole and IS. In this experiment, we fixed the excitation wavelength at 258 nm to
optimize emission wavelength and pH. The results showed when excitation was fixed at 258nm,
the response of posaconazole and IS were at the maximum with an emission wavelength of 350
nm and a pH of 2 (Table 4).
27
Figure 7. Excitation and emission wavelength scan
Excitation Wavelength Scan
Emission Wavelength Scan
258.5
317.0
323.5
EU
0.00
20.00
40.00
60.00
80.00
nm
200.00 220.00 240.00 260.00 280.00 300.00 320.00
321.2
667.0
EU
-20.00
0.00
20.00
40.00
60.00
80.00
100.00
nm
300.00 400.00 500.00 600.00 700.00 800.00

28
Table 4. PH and emission optimization
3.2 METHOD VALIDATION
3.2.1 Selectivity
Posaconazole and IS were eluted at 2.3 min and 3.3 min, respectively with sharp and symmetric
peaks using the HPLC method described above. No interference peaks were found at the retention
time of posaconazole and IS in pooled blank human plasma (Fig. 8).
PH Wavelength (nm) Posaconazole Area IS Area
PH=3.5 Ex258/Em321 76611 Hard to detect peak
Ex258/Em385 3174348 5372943
Ex258/Em350 3568617 4406309
PH=3 Ex258/Em321 334689 Hard to detect peak
Ex258/Em385 5301558 5528465
Ex258/Em350 8929110 9580873
PH=2.5 Ex258/Em321 Hard to detect peak Hard to detect peak
Ex258/Em385 4923988 5068319
Ex258/Em350 8685634 9731927
PH=2 Ex258/Em321 9825702 138057161
Ex258/Em385 108036 Hard to detect peak
Ex258/Em350 11299093 10237234

29
Figure 8. Representative chromatogram (A) Pooled blank human plasma; (B) Standard calibration
sample (3.0 μg/mL of posaconazole); (C) One patient sample
A
B
C

30
3.2.2 Linearity
Linearity was tested by spiking IS into calibration standards at series of concentrations (0.02,
0.05, 0.1, 0.2, 0.5, 1, 3 μg/mL) and samples were processed as described in method section. The
peak area ratios of the posaconazole to the IS were plotted against analyte concentration (least
squares linear regression). A weighting factor of 1/response was applied. A linear response was
observed over the calibration range (r2 > 0.99) (Table 5).
Table 5. Linearity data of posaconazole in pooled human plasma
Nominal Conc.
(μg/mL) POSA/IS POSA/ IS POSA/ IS POSA/IS POSA/IS
0.02 0.028 0.024 0.027 0.025 0.030
0.05 0.066 0.066 0.068 0.052 0.059
0.1 0.113 0.104 0.110 0.109 0.114
0.2 0.192 0.188 0.179 0.194 0.204
0.5 0.519 0.511 0.465 0.493 0.502
1 1.092 1.073 1.162 1.090 1.109
3 2.938 2.841 3.034 2.993 3.101
Weighting: 1/y
Equation
Y=1.001X+
0.01039
Y=0.9745+
0.008597
Y=1.026X+
0.00703
Y=1.012X+
0.003738
Y=1.040X+
0.007888
r2 0.9974 0.9965 0.9932 0.9982 0.9987

31
3.2.3 Precision
The intra-day and inter-day precisions were within 15% of the coefficient of variation (CV)
(Table 6, 7).
Table 6. Intra-day precision of posaconazole in pooled human plasma (expressed as CV%, n=3)
Nominal Conc.
(μg/mL)
Calculated Conc.
(μg/mL) Mean (μg/mL) SD (μg/mL) CV (%)
0.049
0.054 0.054 0.001 2.0
0.054
0.052
0.49
0.550 0.521 0.028 5.3
0.517
0.496
2.94
3.003 2.859 0.126 4.4
2.806
2.768
CV%=standard deviation/mean×100%;

32
Table 7. Inter-day precision of posaconazole in pooled human plasma (expressed as CV%, n = 6)
Nominal Conc.
(μg/mL)
Calculated
Conc. (μg/mL)
Mean (μg/mL) SD (μg/mL) CV (%)
0.049
0.054 0.052 0.006 10.8
0.054
0.052
0.045
0.060
0.045
0.49
0.550 0.498 0.031 6.3
0.517
0.496
0.472
0.478
0.472
2.94
3.003 2.778 0.144 5.2
2.806
2.768
2.749
2.551
2.791
CV%=standard deviation/mean×100%;

33
3.2.4 Accuracy
The intra-day and inter-day accuracy were within 85% to 115% of the nominal values of QC
samples (Table 8, 9).
Table 8. Intra-day accuracy of posaconazole in pooled human plasma (expressed as percent of
nominal concentration, n = 3)
Nominal Conc.
(μg/mL)
Calculated Conc.
(μg/mL) % of Nominal Conc.
Mean of % of
Nominal
Conc. SD (%)
0.049
0.054 111.0 109.2 2.2
0.054 109.8
0.052 106.8
0.49
0.550 112.3 106.4 5.6
0.517 105.6
0.496 101.2
2.94
3.003 102.1 97.2 4.3
2.806 95.5
2.768 94.2

34
Table 9. Inter-day accuracy of posaconazole in pooled human plasma (expressed as percent of nominal
concentration, n = 6)
Nominal
Conc. (μg/mL)
Calculated Conc.
(μg/mL)
% of Nominal
Conc.
Mean of % of
Nominal Conc.
SD (%)
0.049
0.054 111.0 105.6 11.4
0.054 109.8
0.052 106.8
0.045 92.1
0.060 121.4
0.045 92.6
0.49
0.550 112.3 101.6 6.4
0.517 105.6
0.496 101.2
0.472 96.2
0.478 97.6
0.472 96.4
2.94
3.003 102.1 94.5 4.9
2.806 95.5
2.768 94.1
2.749 93.5
2.551 86.8
2.791 95.0

35
3.2.5 Recovery
The mean recovery of posaconazole in three QC concentrations were in the range 86.21–105.96%
(Table 10).
Table 10. Recovery data of posaconazole
Conc.
(μg/mL)
POSA
AREA IS AREA RATIO
Mean
RATIO
Recovery
(%)
After extraction of QC
samples, spike IS into
eluent, evaporate and
reconstitute as
described in method
section.
0.049
455657 10480984 0.0435 0.043 106
396451 10433095 0.0380
494735 10390469 0.0476
0.49
4642214 10823417 0.4289 0.421 86
4595010 10964174 0.4191
4583174 11087297 0.4134
2.94
25888591 10699642 2.4196 2.379 89
26004189 10888182 2.3883
24258448 10412266 2.3298
Spike posaconazole
and IS into extracted
blank plasma,
evaporate and
reconstitute as
described in method
section
0.049
404749 10546872 0.0384 0.041
470954 10830538 0.0435
432906 10830538 0.0400
0.49
5213640 10438718 0.4995 0.488
5171392 10777765 0.4798
5270551 10893464 0.4838
2.94
29682732 11132868 2.6662 2.675
29791933 10838863 2.7486
29872087 11448286 2.6093

36
3.2.6 Lower Limit of Quantification (LLOQ)
The LLOQ was measured using five samples. The back-calculated concentrations have precision
and accuracy within 20% of the nominal concentration (Table 11).
Table 11. Accuracy and precision of LLOQ (n=5)
Nominal
Conc.
(μg/mL)
Calculated
Conc. (μg/mL)
% of Nominal Conc.
±SD CV (%)
0.02 0.021 109.4±2.3 2.1
0.02 0.022
0.02 0.022
0.02 0.022
0.02 0.022
CV%=standard deviation/mean×100%;
3.2.7 Stability
Stability was assessed through three cycles of freeze and thaw stability test, as well as a bench-
top stability test, and a processed sample stability test. The changes in the QC samples of
posaconazole concentrations were within 15% of nominal concentrations (Table 12).

37
Table 12. Stability of posaconazole QC samples
Nominal Conc.
(μg/mL)
Calculated Conc.
(μg/mL) RE (%)
3 cycles of
Freeze/ thaw
0.049
0.046 -6.1
0.048 -1.5
0.045 -7.7
2.94
2.753 -6.4
2.872 -2.3
2.971 1.0
24 hours room
temperature
0.049
0.044 -10.6
0.044 -10.6
0.048 -2.4
2.94
2.857 -2.8
2.871 -2.4
2.875 -2.2
Re-injection
after 16 hours
0.049
0.054 10.9
0.053 8.7
0.053 7.3
2.94
2.942 0.1
2.936 -0.2
2.965 0.9
RE%= ((calculated concentration−nominal concentration)/(nominal concentration))×100%

38
3.2.8 Quality Controls
The samples below were applied as quality controls when measuring patient samples (Table 13).
Table 13. Accuracy of QCs
Nominal Conc. (μg/mL) Calculated Conc. (μg/mL) RE(%)
Day 1
0.049 0.063 28.1
0.49 0.564 15.1
2.94 2.703 -8.1
Day 2
0.049 0.0575 17.3
0.49 0.5163 5.4
2.94 2.7063 -8.0
Day 3
0.049 0.0517 5.6
0.049 0.0518 5.7
0.49 0.5401 10.2
0.49 0.5118 4.5
2.94 2.8920 -1.6
2.94 2.7761 -5.6
Day 4
0.049 0.053 8.2
0.049 0.052 6.4
0.49 0.538 9.7
0.49 0.540 10.2
2.94 2.88 -2.0
2.94 2.92 -0.6

39
3.3 POSACONAZOLE PLASMA CONCENTRATIONS IN PATIENT SAMPLES
3.3.1 Patient Demographic Data
A total of 20 patients, including 7 LTRs with CF disease and 13 LTRs without CF disease were
enrolled into the study. The summarized patient demographic data lists in Table 14. The mean
age and weight of CF group are smaller than non CF group because patients with CF are under
malnourished (45).
Table 14. Patients demographic data
Characteristic
Value
CF Group
(n=7)
Non-CF Group
(n=13)
Total
(n=20)
P value
Mean Age [yr (range)] 36.1 (25-51) 60.7 (28-77) 52.1 (25-77) 0.0006
Age Range 0.04
≥ 18 to < 65 [n (%)] 7 (100%) 7 (54%) 14 (70%)
≥ 65 [n (%)] 0 6 (46%) 6 (30%)
Sex [n (%)] 0.07
Female 5 (71%) 3 (23%) 8 (40%)
Male 2 (29%) 10 (76%) 12 (60%)
Race [n (%)] 0.25
Caucasian 7 (100%) 10 (76%) 7 (85%)
Others 0 3 (23%) 3 (15%)
Mean Weight [kg(range)] 56.66 (41.6-68) 78.15 (48.3-110) 70.63 (41.6-110) 0.01

40
3.3.2 Posaconaozle Plasma Concentrations in Lung Transplant Patients
Posaconazole plasma concentrations-time profiles for 20 enrolled patients are listed in Figure 9.
Figure 9. Posaconazole concentration - time profiles in 20 patients
0 5 10 15 200.0
0.5
1.0
1.5
2.0
2.5
3.0
3.5
Time (h)
Po
saco
nazo
le P
lasm
a C
on
c. (m
g/m
L)
non-CF
CF

41
3.4 PHARMACOKINETIC PARAMETERS OF POSACONAZOLE
One patient from the non-CF cohort was excluded from the pharmacokinetic analysis due to
administration of a second dose within 6 hours after the first dose. The typical dosing frequency
of posaconazole suspension is twice daily, but 4 patients in CF group and 4 patients in non-CF
group received a second dose of posaconazole around 8 hours after the first dose. To measure the
area under the posaconazole plasma concentration-time curve from 0 to 12 hours or 0 to 8 hours
at steady state, plasma concentrations at 12 hours (5 patients), and plasma concentrations at 8
hours (5 patients) were extrapolated from last observed data and the elimination rate constant k.
Plasma concentrations at 0 hour were assumed to be the same as the concentrations at 12 hours
or 8 hours at steady state in 6 patients. After a minimum of five days treatment of posaconazole
maximum plasma concentration Css, max (0.311 μg/mL) in CF patients was 56% lower compared
to Css, max (0.699 μg/mL) in non-CF patients; the minimum plasma concentration Css, min
(0.189·μg/mL) in CF patients was 60% lower compared to Css, min (0.474 μg/mL) in non-CF
patients; the average plasma concentration Css, av (0.233 μg/mL) in CF patients was 61% lower
compared to Css, av (0.594 μg/mL) in non-CF patients, the dose normalized plasma area under
curve AUC0-24 (0.007 h*μg/mL) in CF patients was 65% lower compared to dose normalized
AUC0-24 (0.02 h*μg/mL) in non-CF patient, and the apparent oral clearance of 2.51 L/h/kg in CF
patients was 3.4 times higher compared to 0.74 L/h/kg in non-CF patients. We observed no
significant difference of Tmax and apparent oral clearance (Table 15). Weight normalized
apparent clearance however was significantly higher in CF patients.

42
Table 15. Pharmacokinetic parameters of posaconazole in CF and non-CF group (expressed as
median (range))
Parameter CF cohort
N= 7
Non-CF cohort
N= 12
P value
Tmax (h) 4.4 (0-7.8) 4 (0-11.8) 0.4
Css, max (μg/mL) 0.311 (0.021-0.968) 0.699 (0.227-2.983) NA*
Css, min (μg/mL) 0.189 (0-0.619) 0.474 (0.115-2.094) NA*
Css, av (μg/mL) 0.233 (0.01-0.772) 0.594 (0.154-2.455) 0.03
AUC0-24 / Daily dose (h*μg/mL) 0.007 (0.0003-0.019) 0.02 (0.005-0.074) 0.02
Oral clearance (L/h) 143.16 (32.26-3278.69) 51.83 (13.58-216.33) > 0.05
Weight normalized oral clearance (L/h/kg) 2.51 (0.76-48.22) 0.74 (0.25-2.66) 0.005
*NA: Not Applicable. Statistic analyses are not applicable to Css, max, and Css, min, because the enrolled patients didn’t
follow same dose interval.

43
3.5 A GOOD CORRELATION BETWEEN CTROUGH AND AUC0-Τ
Ctrough and AUC0-τ were well correlated (r2 = 0.91, P < 0.0001) (Fig. 10).
Figure 10. Correlation between Ctrough and AUC0-τ
A good correlation between Ctrough and AUC0-τ demonstrates that measurement of
posaconazole plasma concentration at trough when reaching steady state can predict
posaconazole systemic exposure. It documents that Ctrough can be used as surrogate for
therapeutic monitoring of posaconazole.
44
4.0 DISCUSSION
Lung transplant recipients have a high risk for invasive fungal infections. At the University of
Pittsburgh Medical Center, all LTRs receive routine antifungal prophylaxis with a triazole agent
(voriconazole or posaconazole) for at least four to six months after transplantation. Posaconazole
is an important antifungal agent for prophylaxis and treatment of invasive fungal infections. On
one hand, posaconazole has potent and broad-spectrum activity against yeast and molds; on the
other hand, posaconazole has fewer drug-drug interactions because it is not metabolized by
cytochrome P450 enzymes. Now posaconazole is extensively used after transplantation for
prophylaxis of invasive fungal infections and it is promising to become the first-line of therapy.
According to pharmacology review of two phase 3 clinical trials by the FDA, the plasma
exposure of posaconazole is associated with clinical response. A steady-state Cav of below 700
ng/mL is expected to result in a 25% invasive fungal infection breakthrough rate (28).
Posaconazole plasma exposure was proportionally increased when healthy volunteers were given
50 mg to 400 mg b.i.d. in a multiple-dose study. But plasma exposure of posaconazole was not
further increased following multiple doses from 400 mg to 600 mg b.i.d. in patients (16). The
absorption limitation of posaconazole suspension is probably due to its poor solubility. The FDA
suggests that if plasma concentration of posaconazole is below 0.7 μg /mL after patients receive
a posaconazole suspension of 400 mg t.i.d. for 7 days, the regimen should be switched to other
antifungal agents.

45
Besides posaconazole’s poor solubility, the absorption from a suspension can be affected
by a number of variables. Firstly, high-fat meals and non-fat meals significantly increase plasma
exposure of posaconazole. When patients are not allowed or not able to have a full meal while on
posaconazole, they are at high risk for invasive fungal infection breakthrough due to low drug
exposure. Secondly, drug-drug interactions can lead to low plasma exposure of posaconazole.
Posaconazole is a substrate of P-gp efflux and is metabolized by UGT 1A4. Drugs that induce
either UGT enzyme or P-gp efflux can decrease plasma exposure of posaconazole. The third
factor is the pH of gastrointestinal tract in patients. When patients undergo acid-suppressive
therapy, their plasma exposure of posaconazole is decreased. Given the unpredictable plasma
exposure of posaconazole, therapeutic drug monitoring should be applied to posaconazole to
individualize its dosing regimen (46-48).
Patients with CF have increased invasive fungal infections after lung transplantation, but
they are suspected to experience poor absorption of posaconazole. Most patients with CF have
exocrine pancreatic insufficiency and altered bile acid turnover, which may affect the absorption
of lipophilic drugs such as posaconazole (31). Due to the reasons above, it is imperative to
understand pharmacokinetic profiles of posaconazole in lung transplant recipients with CF. This
study is the first one to investigate pharmacokinetics of posaconazole suspension in lung
transplant recipients with CF.
In this study, we established a HPLC-fluorescence method to analyze plasma
concentrations of posaconazole. The method is very sensitive. HPLC–ultraviolet (UV) and
HPLC tandem mass spectrometer (MS) have been used to analyzed posaconazole (49-51). The
HPLC–UV was not sensitive to measure posaconazole in patient samples. One study reported
using HPLC-fluorescence to analyze posaconazole and itraconazole following liquid-liquid

46
extraction of its plasma samples (43). But an analytical interference was observed with this
method for posaconazole in pooled human blank plasma. We evaluated different extraction
reagents such as terbutylmethylether, hexane-dichloromethane and ethyl ether, but none of them
solved the analytical problem. Finally, we developed solid phase extraction for sample
extraction, and no interfering peaks appeared with the same retention time of posaconazole. In
this method, out of 100 μL of reconstitution volume, the injection volume used is only 20 μL.
This makes it possible to re-inject sample, if necessary. Since this assay requires only a small
volume of plasma, it is favorable to both pharmacokinetic studies and therapeutic drug
monitoring of posaconazole. There was no interfering endogenous materials in human plasma..
The probability for other drugs used with posaconazole to elute at same retention time and to
interfere with posaconazole and itraconazole at the specific excitation and emission wavelengths
and pH 2 used is rare. We tested chromatographic peaks of ketoconazole, fluconazole and
voriconazole at the described chromatographic method, and these three drugs didn’t show any
interfering peaks.
In the label of posaconazole, it is recommended to avoid concomitant use of cimetidine
(an H2-receptor antagonist) and esomeprazole (a proton pump inhibitor) with posaconazole oral
suspension, because lower plasma concentrations have been observed when patients
concomitantly used the two drugs with posaconazole suspension. In this study, none of the
twenty patients were taking either of the two drugs during the pharmacokinetic study.
In the study, we observed large variation in posaconazole pharmacokinetic parameters
and lower Css, max, Css, min, Css, av, and dose normalized AUC0-24 in CF group. Among the CF
patients, one patient did not receive any oral feeding, two patients were receiving tube feeding
and the other four patients were normally feed during the pharmacokinetic study. In the non-CF

47
group, among 13 patients, 2 patients were tube fed and the other patients were normally feed. We
observed a lower plasma concentration of posaconazole in the most of these patients not
receiving normal feeding, but lower plasma concentration of posaconazole was also observed in
patients with normal feeding. Because of the small sample size of patients, we can’t find
association between feeding and plasma concentration of posaconazole.
There was no statistic difference of total apparent oral clearance between the CF and non-
CF group, but we found significantly higher weight normalized total apparent oral clearance in
the CF patients. Currently, there is no published literature reporting association between weight
and total body clearance of posaconazole. Considering posaconazole is a highly lipophilic drug,
a patient with greater weight may have a larger volume distribution. From this study, we believe
weight may be a potential viability that could affect the total body exposure of posaconazole. But
additional studies need to be performed to understand the impact of weight of the patient on the
total body clearance of posaconazole.
Several factors could result in a lower systemic exposure of posaconazole in patients with
CF including absorption, glucuronidation, and reabsorption. Posaconazole is a lipophilic drug
and the decreased pancreatic enzyme secretion and altered bile acid turnover in CF can lead to
reduced absorption of posaconazole (24). Secondly, an enhanced activity of UGT1A4 in patients
with CF may be one of the reasons behind a lower plasma concentration of posaconazole. Some
studies reported the hepatic glucuronosyltransferase activity was increased in CF disease (52,
53), but more data are needed to prove the observation and no study specifically assessed the
alteration of UGT1A4 in CF. If UGT1A4 exhibits enhanced activity in CF, more posaconazole
would be metabolized into its inactive glucuronide conjugates, leading to decreased plasma
concentration of posaconazole. There are multiple factors that could affect posaconazole

48
reabsorption in CF patients. For example, a decreased activity of multidrug resistant protein 2, a
major transporter responsible for the biliary excretion of glucuronides, could decrease the
secretion of glucuronide conjugates from bile to intestine. Considering the altered microflora in
the intestine, patient with CF may have a lower glucuronidase activity in the gut to convert
posaconazole glucuronide to posaconazole for reabsorption. The alteration of glucuronidation,
and reabsorption can be confirmed by quantifying glucuronide conjugates of posaconazole in
plasma, but standard posaconazole glucouronide is not commercially available, currently.
Out of 20 patients, a steady state average concentration of 0.7 μg/mL was achieved only
in one CF patient and three non-CF patients. The findings supports therapeutic drug monitoring
of posaconazole is very important to LTRs, especially in LTRs with CF. Moreover, a good
correlation between Ctrough and AUC0-τ demonstrated that Ctrough is a good surrogate marker to
monitor systemic exposure of posaconazole.
In conclusion, therapeutic drug monitoring of posaconazole should be applied to LTRs. If
increasing the dosage of posaconazole suspension doesn’t help patients achieve desired target
therapeutic level in patients, using a posaconazole tablet or switching to other antifungal agents
should be considered.
There are some limitations to this clinical study. First, for pharmacokinetic study, the
time period of blood sampling should be 3 to 5 terminal elimination half-lives following the last
dose. The half-life of posaconazole is 24 hours, so ideally blood samples should be collected at
least 72 hours after the final dose. In this study, blood samples were only collected for 8 to 12
hours after a dose. This is the reason that we observed flat time-concentration profiles, because
concentration time profiles for posaconazole didn’t reach true terminal phase. This limitation
was due to clinical practice of administrating of drug b.i.d or t.i.d. Second, the clearance assessed

49
from suspension is oral clearance, not true systemic clearance. Based on the oral clearance we
could not conclude that CF patients have higher total body clearance for posaconazole or poor
oral absorption. Now, posaoncaozle injection has been approved by the FDA. In the future, we
could use the intravenous formulation to investigate true total body clearance of posaconazole in
CF patients. Furthermore, if we had measured the glucuronide metabolite of posaconazole and
analyzed the ratio of systemic exposure of metabolite against the parent drug, we would be able
to understand if there are changes to posaconazole metabolism in LTRs with CF. Alterations to
metabolic pathway could be one possible cause of low systemic exposure of posaconazole in
LTRs with CF.
In the past two decades, pulmonary drug delivery has been become a popular route
because 70-140 m2 of lung surface could be an ideal drug absorption site in addition to small
intestinal tract (54). From this study, we observed a low systemic exposure in LTRs. In the
future, we could develop inhaled posaconazole to improve prophylaxis of IFIs in LTRs because
localized posaconazole delivery by inhalation would increase intrapulmonary concentration of
posaconazole and bypass gastrointestinal absorption. Due to bypassing gastrointestinal
absorption, inhaled posaconazole will result in high drug concentration in the respiratory tract
with low systemic exposure, which will enable posaconazole to have better therapeutic effect
with fewer side effects. Moreover, an inhaled formulation would have fewer drug-drug
interactions that are very common observed with triazole antifungal drugs due to their
metabolism by cytochrome P450 enzyme.

50
BIBLIOGRAPHY
1. M. B. Mirskii, Alexis Carrel and his contribution to surgery and transplantology. Vestnik
khirurgii imeni I. I. Grekova 114, 139 (Mar, 1975).
2. L. Garcia-Covarrubias, T. A. Salerno, A. L. Panos, S. M. Pham, Lung transplantation.
State of the art. Gaceta medica de Mexico 143, 323 (Jul-Aug, 2007).
3. B. A. Reitz et al., Heart-lung transplantation: successful therapy for patients with
pulmonary vascular disease. The New England journal of medicine 306, 557 (Mar 11,
1982).
4. B. F. Meyers et al., Lung transplantation: a decade of experience. Annals of surgery 230,
362 (Sep, 1999).
5. R. D. Yusen et al., The registry of the International Society for Heart and Lung
Transplantation: thirty-first adult lung and heart-lung transplant report--2014; focus
theme: retransplantation. The Journal of heart and lung transplantation : the official
publication of the International Society for Heart Transplantation 33, 1009 (Oct, 2014).
6. J. D. Christie et al., The Registry of the International Society for Heart and Lung
Transplantation: 29th adult lung and heart-lung transplant report-2012. The Journal of
heart and lung transplantation : the official publication of the International Society for
Heart Transplantation 31, 1073 (Oct, 2012).
7. H. Date, Update on living-donor lobar lung transplantation. Current opinion in organ
transplantation 16, 453 (Oct, 2011).
8. M. Colvin-Adams et al., OPTN/SRTR 2011 Annual Data Report: heart. American
journal of transplantation : official journal of the American Society of Transplantation
and the American Society of Transplant Surgeons 13 Suppl 1, 119 (Jan, 2013).
9. W. R. Kim et al., OPTN/SRTR 2011 Annual Data Report: liver. American journal of
transplantation : official journal of the American Society of Transplantation and the
American Society of Transplant Surgeons 13 Suppl 1, 73 (Jan, 2013).
10. A. J. Matas et al., OPTN/SRTR 2011 Annual Data Report: kidney. American journal of
transplantation : official journal of the American Society of Transplantation and the
American Society of Transplant Surgeons 13 Suppl 1, 11 (Jan, 2013).

51
11. A. Sole, M. Salavert, Fungal infections after lung transplantation. Transplantation
reviews 22, 89 (Apr, 2008).
12. W. J. Heinz, G. Egerer, H. Lellek, A. Boehme, J. Greiner, Posaconazole after previous
antifungal therapy with voriconazole for therapy of invasive aspergillus disease, a
retrospective analysis. Mycoses 56, 304 (May, 2013).
13. D. W. Denning, W. W. Hope, Therapy for fungal diseases: opportunities and priorities.
Trends in microbiology 18, 195 (May, 2010).
14. S. Corporation, Oral pharmaceutical compositions in a molecular solid dispersion. Patent
WO 2009129301 A2, (2009).
15. A. Katragkou, F. Tsikopoulou, E. Roilides, T. E. Zaoutis, Posaconazole: when and how?
The clinician's view. Mycoses 55, 110 (Mar, 2012).
16. NOXAFIL® (posaconazole) Prescribing Information.
17. F. Ezzet et al., Oral bioavailability of posaconazole in fasted healthy subjects:
comparison between three regimens and basis for clinical dosage recommendations.
Clinical pharmacokinetics 44, 211 (2005).
18. A. M. Gopal Krishna, Lei Ma, Matthew M. Medlock and James McLeod,
Pharmacokinetics and Absorption of Posaconazole Oral Suspension under Various
Gastric Conditions in Healthy Volunteers. Antimicrobial agents and chemotherapy 53
(2009).
19. G. Krishna, L. Ma, M. Martinho, E. O'Mara, Single-dose phase I study to evaluate the
pharmacokinetics of posaconazole in new tablet and capsule formulations relative to oral
suspension. Antimicrobial agents and chemotherapy 56, 4196 (Aug, 2012).
20. G. M. Keating, Posaconazole. Drugs 65, 1553 (2005).
21. J. E. Conte, Jr., C. DeVoe, E. Little, J. A. Golden, Steady-state intrapulmonary
pharmacokinetics and pharmacodynamics of posaconazole in lung transplant recipients.
Antimicrobial agents and chemotherapy 54, 3609 (Sep, 2010).
22. A. Ghosal et al., Identification of human UDP-glucuronosyltransferase enzyme(s)
responsible for the glucuronidation of posaconazole (Noxafil). Drug metabolism and
disposition: the biological fate of chemicals 32, 267 (Feb, 2004).
23. H. P. Lipp, Posaconazole: clinical pharmacokinetics and drug interactions. Mycoses 54
Suppl 1, 32 (Jan, 2011).
24. P. Krieter et al., Disposition of posaconazole following single-dose oral administration in
healthy subjects. Antimicrobial agents and chemotherapy 48, 3543 (Sep, 2004).
52
25. O. A. Cornely et al., Posaconazole vs. fluconazole or itraconazole prophylaxis in patients
with neutropenia. The New England journal of medicine 356, 348 (Jan 25, 2007).
26. A. J. Ullmann et al., Posaconazole or fluconazole for prophylaxis in severe graft-versus-
host disease. The New England journal of medicine 356, 335 (Jan 25, 2007).
27. T. J. Walsh et al., Treatment of invasive aspergillosis with posaconazole in patients who
are refractory to or intolerant of conventional therapy: an externally controlled trial.
Clinical infectious diseases : an official publication of the Infectious Diseases Society of
America 44, 2 (Jan 1, 2007).
28. C. o. D. E. a. R. o. FDA, Clinical Pharmacology Review of Posaconazole. (2005).
29. S. Culhane, C. George, B. Pearo, E. Spoede, Malnutrition in cystic fibrosis: a review.
Nutrition in clinical practice : official publication of the American Society for Parenteral
and Enteral Nutrition 28, 676 (Dec, 2013).
30. J. M. Littlewood, S. P. Wolfe, Control of malabsorption in cystic fibrosis. Paediatric
drugs 2, 205 (May-Jun, 2000).
31. M. Spino, Pharmacokinetics of Drugs in Cystic Fibrosis. Clinical Reviews in Allergy 9,
41 (1991).
32. K. K. Tan et al., Altered pharmacokinetics of cyclosporin in heart-lung transplant
recipients with cystic fibrosis. Therapeutic drug monitoring 12, 520 (Nov, 1990).
33. G. L. Kearns, B. C. Hilman, J. T. Wilson, Dosing implications of altered gentamicin
disposition in patients with cystic fibrosis. The Journal of pediatrics 100, 312 (Feb,
1982).
34. J. Levy, A. L. Smith, J. R. Koup, J. Williams-Warren, B. Ramsey, Disposition of
tobramycin in patients with cystic fibrosis: a prospective controlled study. The Journal of
pediatrics 105, 117 (Jul, 1984).
35. M. D. Reed, R. C. Stern, C. M. Myers, T. S. Yamashita, J. L. Blumer, Lack of unique
ciprofloxacin pharmacokinetic characteristics in patients with cystic fibrosis. Journal of
clinical pharmacology 28, 691 (Aug, 1988).
36. M. Spino et al., Cloxacillin absorption and disposition in cystic fibrosis. The Journal of
pediatrics 105, 829 (Nov, 1984).
37. G. I. Snell et al., Pharmacokinetic assessment of oral ganciclovir in lung transplant
recipients with cystic fibrosis. The Journal of antimicrobial chemotherapy 45, 511 (Apr,
2000).

53
38. M. Berge et al., Voriconazole pharmacokinetic variability in cystic fibrosis lung
transplant patients. Transplant infectious disease : an official journal of the
Transplantation Society 11, 211 (Jun, 2009).
39. F. Saint-Marcoux et al., Pharmacokinetic study of tacrolimus in cystic fibrosis and non-
cystic fibrosis lung transplant patients and design of Bayesian estimators using limited
sampling strategies. Clinical pharmacokinetics 44, 1317 (2005).
40. S. P. Conway et al., Pharmacokinetics and safety of itraconazole in patients with cystic
fibrosis. The Journal of antimicrobial chemotherapy 53, 841 (May, 2004).
41. S. Hennig et al., A d-optimal designed population pharmacokinetic study of oral
itraconazole in adult cystic fibrosis patients. British journal of clinical pharmacology 63,
438 (Apr, 2007).
42. S. d. Farmacia, Therapeutic drug monitoring of itraconazole and the relevance
ofpharmacokinetic interactions. Clin Microbiol Infect 12, 10 (2006).
43. S. L. Buckner, M. M. Ceesay, A. Pagliuca, P. E. Morgan, R. J. Flanagan, Measurement of
posaconazole, itraconazole, and hydroxyitraconazole in plasma/serum by high-
performance liquid chromatography with fluorescence detection. Ther Drug Monit 33,
735 (Dec, 2011).
44. J. Walravens et al., Effect of pH and comedication on gastrointestinal absorption of
posaconazole: monitoring of intraluminal and plasma drug concentrations. Clinical
pharmacokinetics 50, 725 (Nov 1, 2011).
45. D. P. Addy, Cystic fibrosis: current survival and population estimates to the year 2000.
Thorax 47, 327 (Apr, 1992).
46. S. E. Hummert, M. R. Green, Therapeutic Drug Monitoring and Dose Adjustment of
Posaconazole Oral Suspension in Adults with Acute Myeloid Leukemia. Ther Drug
Monit, (Dec 29, 2014).
47. S. J. Howard, T. W. Felton, A. Gomez-Lopez, W. W. Hope, Posaconazole: the case for
therapeutic drug monitoring. Ther Drug Monit 34, 72 (Feb, 2012).
48. M. J. Dolton et al., Multicenter study of posaconazole therapeutic drug monitoring:
exposure-response relationship and factors affecting concentration. Antimicrobial agents
and chemotherapy 56, 5503 (Nov, 2012).
49. D. Storzinger et al., Development and validation of a high-performance liquid
chromatography assay for posaconazole utilizing solid-phase extraction. Clinical
chemistry and laboratory medicine : CCLM / FESCC 46, 1747 (2008).

54
50. C. V. Garcia, G. R. Costa, A. S. Mendez, Stability-indicating HPLC method for
posaconazole bulk assay. Scientia pharmaceutica 80, 317 (Jun, 2012).
51. A. A. Nomeir et al., Posaconazole (Noxafil, SCH 56592), a new azole antifungal drug,
was a discovery based on the isolation and mass spectral characterization of a circulating
metabolite of an earlier lead (SCH 51048). Journal of mass spectrometry : JMS 43, 509
(Apr, 2008).
52. R. M. Hutabarat et al., Disposition of drugs in cystic fibrosis. III. Acetaminophen.
Clinical pharmacology and therapeutics 50, 695 (Dec, 1991).
53. G. L. Kearns, G. B. Mallory, Jr., W. R. Crom, W. E. Evans, Enhanced hepatic drug
clearance in patients with cystic fibrosis. The Journal of pediatrics 117, 972 (Dec, 1990).
54. D. A. Groneberg, C. Witt, U. Wagner, K. F. Chung, A. Fischer, Fundamentals of
pulmonary drug delivery. Respiratory medicine 97, 382 (Apr, 2003).


![Posaconazole-InducedHypertensionMasqueradingasCongenital ... · 2020. 6. 25. · posaconazole-treatedpatients[10–12]and,inourpatient,at baseline,anditfellfrom12to3.5offtreatment.Wedidnot](https://static.fdocuments.us/doc/165x107/6149f26d12c9616cbc69182e/posaconazole-inducedhypertensionmasqueradingascongenital-2020-6-25-posaconazole-treatedpatients10a12andinourpatientat.jpg)


