PORTSMOUTH NAVAL SHIPYARD -- FACILITY AND HUMAN CAPACITY
20
PORTSMOUTH NAVAL SHIPYARD -- FACILITY AND HUMAN CAPACITY Question: Does Navy have sufficient Industrial Capacity, both Facilities and Human Capacity, to perform future maintenance with closure of Portsmouth? Answer: NO Discussion: There has been much discussion on whether Navy has adequate industrial capacity for the future. All discussions inevitably revert to asking: "What is the Submarine Force Structure of the future?" There have been numerous different DoD responses to that question over the past two months. It continues to be very difficult to obtain a straight answer. Latest information from Navy' is that they used a 56 submarine force structure for analysis, although we were previously told that capac~ty decisions were based on a reduced submarine force2. The workload and drydock information received fiom DoD on 22 July 2005j supports a 55 submarine force structure. Data and analysis in this paper, and the previous Industrial Capacity Point paperJ are all based on a 55 Submarine Force Structure. There are many levels at which Navy's Industrial Capacity can be assessed. Much data and analysis has been provided in previous briefings and testimony. Many statements have been made based on subjective comparisons between "the past and present" and much speculation of the future. Any Capacity decision should start with a review of factual data of how the Navy Fleet and Infrastructure has downsized over the past 17 years. The below (Chart 1)' identifies that the Navy had 100 Submarines as part of a 573 total active ship inventory in 1988, and that it dropped to 55 as part of a 285 ship fleet in 2005. This information establishes the shipyards to ships ratio at 1 :72, in 1988, and it remains constant at 1 :7 1 today. U.S. Navy Active Ship Force Levels, 1988 to the present I Chart 1 ' Adm. Willard Testimony to BRAC Commission on Tuesday, 18 July 2005 2 DoD Officials meeting with Congressional Staffers, 22 June 2005, and referenced in Earl Donnell Testimony to Commission on 6 July 2005, slide 17 ' Provided by DoD Offic~als to Congress~onal Inquiry, 20 Jul 2005. 4 Industrial Capacity Point Paper, prepared by Earl Donllell, forwarded to Commission staff by Congressional Delegation ' Data found on website; www.history.navy.rniI/branches/org9-4.ht & http://navweb.secnav.navy.mil/pubbud/O6pre~/highbooWSECTION~II~Winning~Today.pdf DCN 6969
Transcript of PORTSMOUTH NAVAL SHIPYARD -- FACILITY AND HUMAN CAPACITY

PORTSMOUTH NAVAL SHIPYARD -- FACILITY AND HUMAN CAPACITY
Question: Does Navy have sufficient Industrial Capacity, both Facilities and Human Capacity, to perform future maintenance with closure of Portsmouth?
Answer: NO
Discussion: There has been much discussion on whether Navy has adequate industrial capacity for the future. All discussions inevitably revert to asking: "What is the Submarine Force Structure of the future?" There have been numerous different DoD responses to that question over the past two months. It continues to be very difficult to obtain a straight answer. Latest information from Navy' is that they used a 56 submarine force structure for analysis, although we were previously told that capac~ty decisions were based on a reduced submarine force2. The workload and drydock information received fiom DoD on 22 July 2005j supports a 55 submarine force structure. Data and analysis in this paper, and the previous Industrial Capacity Point paperJ are all based on a 55 Submarine Force Structure.
There are many levels at which Navy's Industrial Capacity can be assessed. Much data and analysis has been provided in previous briefings and testimony. Many statements have been made based on subjective comparisons between "the past and present" and much speculation of the future. Any Capacity decision should start with a review of factual data of how the Navy Fleet and Infrastructure has downsized over the past 17 years. The below (Chart 1)' identifies that the Navy had 100 Submarines as part of a 573 total active ship inventory in 1988, and that it dropped to 55 as part of a 285 ship fleet in 2005. This information establishes the shipyards to ships ratio at 1 :72, in 1988, and it remains constant a t 1 :7 1 today.
U.S. Navy Active Ship Force Levels, 1988 to the present
I
Chart 1
' Adm. Willard Testimony to BRAC Commission on Tuesday, 18 July 2005 2 DoD Officials meeting with Congressional Staffers, 22 June 2005, and referenced in Earl Donnell Testimony to Commission on 6 July 2005, slide 17 ' Provided by DoD Offic~als to Congress~onal Inquiry, 20 Ju l 2005. 4 Industrial Capacity Point Paper, prepared by Earl Donllell, forwarded to Commission staff by Congressional Delegation ' Data found on website; www.history.navy.rniI/branches/org9-4.ht & http://navweb.secnav.navy.mil/pubbud/O6pre~/highbooWSECTION~II~Winning~Today.pdf
DCN 6969
During the same timeframe, the Navy's lnfrastructure was reshaped dramatically. Naval Shipyards have been cut by 50%, while the submarine force has shrunk by 45% and total fleet has dropped 50%.
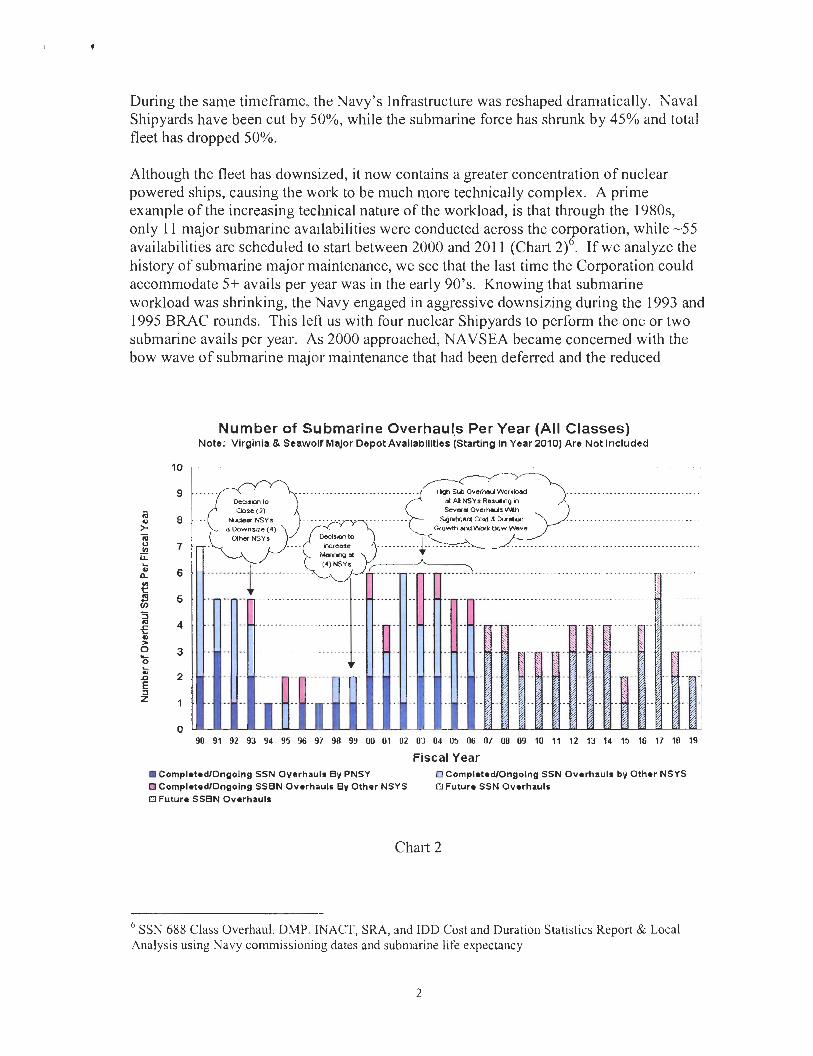
Although the fleet has downsized, it now contains a greater concentration of nuclear powered ships, causing the work to be much more technically complex. A prime example of the increasing technical nature of the workload, is that through the 1980s, only 11 major submarine availabilities were conducted across the corporation, while -55 availabilities are scheduled to start between 2000 and 201 1 (Chart 216. If we analyze the history of submarine major maintenance, we see that the last time the Corporation could accommodate 5+ avails per year was in the early 90's. Knowing that submarine workload was shrinking, the Navy engaged in aggressive downsizing during the 1993 and 1995 BRAC rounds. This left us with four nuclear Shipyards to perform the one or two submarine avails per year. As 2000 approached, NAVSEA became concerned with the bow wave of submarine major maintenance that had been deferred and the reduced
Number of Submarine 0verhauI.s Per Year (All Classes) Note: Virginia & Seawolf MaJor Depot Availabilities (Starting in Year 2010) Are Not Included
Fiscal Year CompletedlOngolng SSN Overhauls By PNSY CompletedlOngolng SSBN Overhauls By Other NSYS
I3 Future SSBN Overhauls
CompletedlOngoing SSN Overhauls by Other NSYS O Future SSN Overhauls
Chart 2
SSN 688 Class Overhaul, DMP, INACT, SRA, and IDD Cost and Duration Statistics Report & Local Analysis using Navy commissioning dates and submarine life expectancy

staffing and experience levels of the workforce to accomplish the peak from 2000 through 2006. That resulted in slow, incremental hiring to allow development of sufficient numbers and skills of personnel to meet the impending workload peak. Performance during this peak has been poor, especially on the west coast shipyards. A good example of why this occurred is that for nearly 10 years, Puget's only submarine work was cut-up of decominissioned ships. This work is low skill and their high-level expertise had been lost through downsizing and a decade of lesser technical submarine work. Once through this submarine peak, the existing infrastructure, four Naval Shipyards, will be better suited to perform the three to four submarine avails scheduled per year, and corporate performance should improve.
The personnel downsizing actually started in 1988 with the closure of Philadelphia Naval Shipyard, but accelerated between 1993 and 1997, as Mare Island, Long Beach and Charleston Naval Shipyards all closed. The remaining four Naval Shipyards downsized, as well, with their workforces reducing from -70,000 workers to -22,000 by 1996 (Chart 317.
Infrastructure and Human Capacity Reductions since 1988
1 -50 EOHs, DMPs 17 Q and/or EROs
EROr or
Reduced W o r k f ~ c c by 66%
-P- NS'
Chart 3
The downsizings in the 1990s left the workforce in a very narrow demographic band, with an average age of -47 years old. We separated thousands of employees who were junior in tenure, while enticing thousands of older, more experienced workers, to leave service through early retirement incentives. Since 1997, we have established
7 Chart and personnel data from NAVSEA Integrated Project Management Course Jan 2003, conducted at Oceana Naval Air Station, VA.
revitalization initiatives to replenish our workforce consistent with workload. Today we are staffed at -24,000 people, a remarkable 66% below levels in 1988. Through revitalization, we have lowered the average age across the corporation to -45 years old (gaining 2 years demographically), but we still have about 38% of our workforce that is over 50. This population of'+, 100 people (including Portsmouth workforce) have optional retirement opportunities within the next five years.
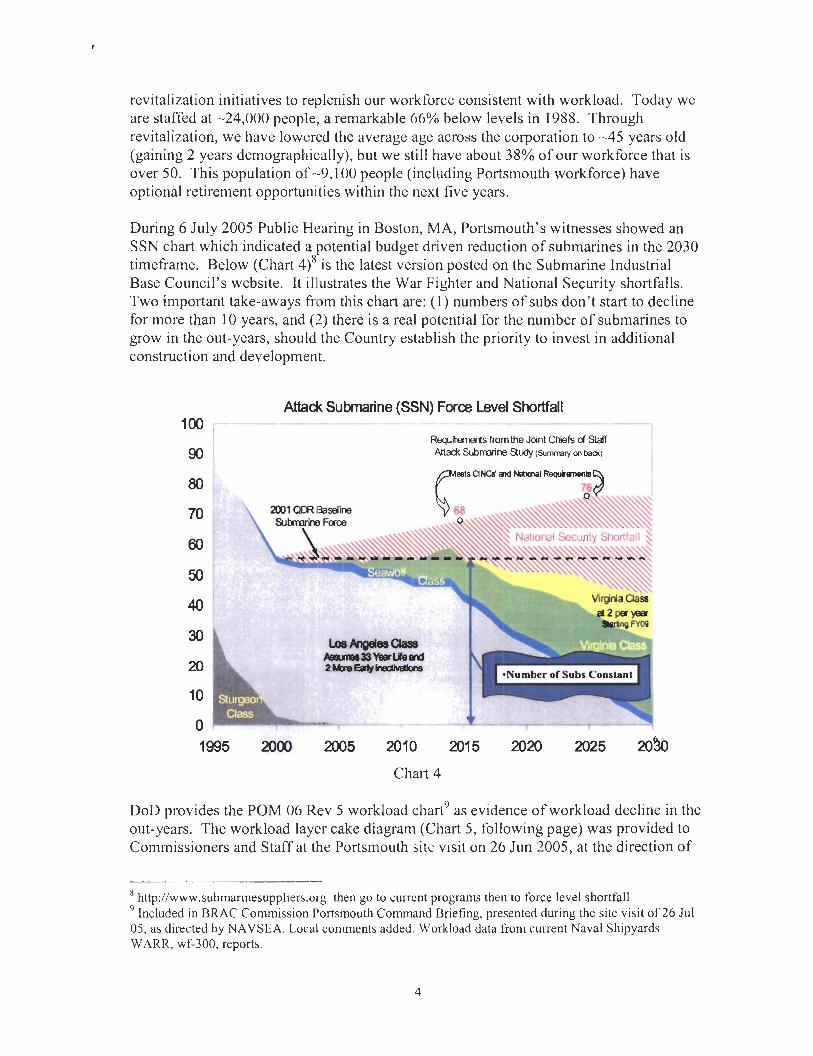
During 6 July 2005 Public Hearing in Boston, MA, Portsmouth's witnesses showed an SSN chart which indicated a potential budget driven reduction of submarines in the 2030 timeframe. Below (Chart 4)8 is the latest version posted on the Submarine Industrial Base Council's website. It illustrates the War Fighter and National Security shortfalls. Two important take-aways from this chart are: (1) numbers of subs don't start to decline for more than 10 years, and (2) there is a real potential for the number of submarines to grow in the out-years, should the Country establish the priority to invest in additional construction and development.
Attack Submarine (SSN) Force Level Shortfall 100, - . ~ ~ - - - - - - - - - - -
! Requhements fromlhe Jcint Chiefs d Staff ! W ! Made Subrdne Study (Sumrrery on back) I
Chart 4
DoD provides the POM 06 Rev 5 workload chart9 as evidence of workload decline in the out-years. The workload layer cake diagram (Chart 5, following page) was provided to Com~nissioners and Staff at the Portsmouth site visit on 26 Jun 2005, at the direction of
X http://www.submar1nesupp11ers.org then go to currunt programs then to force level shortfall 9 Included in BRAC Commission Portsmouth Comnland Briefing, presented during the site visit of 26 Jul 05, as directed by NAVSEA. Local comments added. Workload data from current Naval Shipyards WARR, wf-300, reports.

NAVSEA. We have annotated the chart with actual workload growth to show that since this POM 06 Rev 5 chart was published, Naval Shipyards have seen more than 1 Million mandays of growth between 2005 and 201 1. The magnitude of such growth cannot be ignored as we visualize Navy's maintenance workload in the distant future. We are certain that all out-year work projections are based on Notional quantities and durations, do not account for the aging of the fleet, nor do they adequately anticipate the negative affects of performance on quantity of work or duration of availabilities.
Naval 3hipyuds - 06 RBV 5 Woktoad (Nov 03)
-.Wn.HIR
Chart 5
If FY 07 has grown by -250K mandays in the 20 months since this Chart's development, what will '07 look like during the year of execution? What will FYs 2009 - 2020 look like by then? There should be grave concern for Capacity decisions made at the macro level, in the absence of comprehensive, accurate evaluation of true future workload requirements.
Navy alleges that proper analysis was performed of Drydock and Commodity Capacity to support their recommendation to close Portsmouth, yet DoD has provided little objective evidence to substantiate their claims. After two months of asking for evidence to support the recommendation and analysis performed, the Navy finally supplied the Drydock study (Chart 6, following page)'0, illustrating that much, but not all, of the Portsmouth workload could physically f i l in the Norfolk Drydocks. This chart represents Norfolk's workload for the 80120-workload split, where 80% of Portsmouth work would relocate to
10 Provided by DoD Officials to Corlgressional Inquiry, 20 Jul 2005. Notes added to reflect required ship schedule changes and omitted workload.

Norfolk; the remaining 20% relocates to Puget. This represents the initial Data Call Scenario. As noted in the yellow text box, one EOH was deferred by 4 months and one SRA was deferred for 2 months to make the plan workable. There is still no capacity for the 15 Portsmouth SRAs shown in light blue below the actual Drydock plan. There is not capacity for the historical 6 emergent dockings per year. Note the excessive high risk of this plan, as there is no room for any slippage of any schedule.
Portsmouth NSY Closure - NNSY Dry Dock
I *One EOH changed to April 2008 vice January 2008 start.
I .One SR4 changed to November 2007 vice October 2007 start.
I *No Capacity for 6 average emergent East Coast dockings. I
More important than the high risk of the above docking sequences is the fact that the above study is un-executable based on Norfolk's historical capacity. Over the past 5 years, Norfolk has been staffed, and actually executed -1.2 million mandays of work annually (see Chart 7, following page). The above plan would expect Norfolk to perform 1.7M mandays in both FY07 and FY08, some 500,000 manday above current and historical capacity. Chart 7 ' illustrates the increased workload created by this unrealistic drydock study which supporls the 80120 Portsmouth workload redistribution. Clearly this plan islwas unexecutable, resulting in DoD later deciding that a 4514511 0 redistribution would be required. When asked for the revised study, DoD Officials responded to Congressional Staffers, that none had been performed'2. Not only was there no high- level analytical analysis performed, there was also no CommodityIHuman Capacity analysis performed. All analytics are based 011 this flawed study, and none of the analytical conclusions from !his study support the closure recommendation.
' I Slide was part of a SEA 00 Briefing on 16 Dec 2004. Provided to Naval Shipyard Workload Forecasters by NAVSEA 04X, via e-mail dated 17 Dec 2004. I 2 Enmil from Senator Collins staCass~stant, documenting conununication with DoD Officials, dated 20 July 2005

Portsmouth NSY Closure - Norfolk Workload
Chart 7
From this review of Navy's history of downsizing and the uncertainties of the future workload, we can conclude the following:
Navy cut sufficiently deep in the 1990s to synchronize with future fleet size. Navy performed inadequate analysis of their own data to support their recommendation to close Portsmouth, Insufficient capacity will exist on the east coast for emergent dockings, SRAs and drydock maintenance. The Force Structure arid workload of the future is ill defined.
All of the analysis and Data Calls were based on the POM 06 Rev 5 workload (Chart 5), and on a Force Structure that included 55 submarines. It was this workload that shipyards used to complete the 7 Jan 04 Data Calls and corresponding Tables. Chart 8 (following page) provides Table numbers, definitions, and methodology used by Navy in completing the Data ca11I3.
l3 Found in www.defenselink.mil/brac, then go to Additional Documentation, Joint Cross-Service Groups, Industr~al, then to Capacity Analysts Plan (3.9MB)

DoD Capacity Analysis Methodology
Started with 4 Certified Capitcity Data Tables
Table 5.3.1.C Table 5.3. l . D / IDrydoeWPicr Methodoloav
*Table A = POM 06 Rev 5 *Required Capacity = Workload + some growth
*Table B = Bldg. sq.ft. + Workstations *Theoretical Capacity o f Back-shops
*Table C = Drydock loading as provided by NAVSEA
*Table D = Table B + Table C
Chart 9 (below) also lists assumptions, and some significant problems with the certified data, methodology employed by Navy, and conclusions drawn by DOD'~ .
DoD Capacity Analysis Methodology
Assump I ions
*Unlun~ted peoplelskills
*Back-shop and Drydock are directly additive
*Excess Capac~ty = Table D Table A
*Tuble B + C does NOT equal Table D
-Back-slq and Drydock are not d~reclly additive
*Growth in Table A averaged only 4% -Historical growth 14% ... likely 20% in future
-NO Human Capacity evaluation
*DoD concluded excess Commodities in the very yean (FY 03. W, 05) the Corporation experienced large shortages
Chart 9
I4 Found in www.defenselink.mil/brac, then go to Additional Documentation, Joint Cross-Service Groups, Industrial, then to Capacity Analysis Plan (3.9MB) and local review of results = (problems)

Chart 10" (following page) plots the certified data from the 7 Jan 04 Data Call and Tables listed in Chart 8, for eleven of our most critical Commodities. The Corporate Production Resource Team has denoted these as critical and comprising the majority of the direct Production work during a ship's major maintenance depot-level availability. The left graph on each of the following slides plots Total (certified) DoD Capacity, Required Capacity, and Workforce Capacity of all four Shipyards. The middle and right graphs plot Total (certified) DoD Capacity, Required Capacity and Workforce without the Portsmouth Capacity or workforce. The right graph adds 14% "historical and inefficiency" growth to the Required Capacity. In an effort to explain why Shipyard Capacity is overstated, each of the Total Capacity bars is split between drydock capacity (blue), and backshop capacity (yellow). The backshop, yellow portion, is again split between yellow band, which equals 15% above drydock workload, and a red
Required Capacity = Table 5.3.1 .A; found in www.defenselink.mil/brac, then go to Scenario Data Calls. Department of the Navy, Redacted Activity Data Calls-Final Certified Answers (Capacity), ZipFile 4 (32.6MB), then add the totals for 5.3.1 .A in the following PDF files: Redacted BRAC Capacity Data Call, 7 January, NAVSHIPYD-AND-IMF-PEARL-HARBOR-HI (Page 63), NAVSHIPYD-NORFOLK-VA (Page 72), NAVSHIPYD-PORTSMOUTH-NH (Page 1 1 I) and NAVSHIPYD-PUGET-SOUND-WA (Page 63)
Back-Shop Capacity = Table 5.3.1 .B found in www.defenselink.mil/brac, then go to Scenario Data Calls, Department of the Navy, Redacted Activity Data Calls-Final Certified Answers (Capacity), ZipFile 4 (32.6MB), then add the totals for 5.3.1.B in the following PDF files: Redacted BRAC Capacity Data Call, 7 January, NAVSHIPYD-AND-IMF-PEARL-HARBOR-HI (Page 63), NAVSHIPYD-NORFOLK-VA (Page 72), NAVSHIPYD-PORTSMOUTH-NH (Page 1 12) and NAVSHIPYD-PUGET-SOUND-WA (Page 64)
DrydocWPier Capacity = Table 5.3.1.C found in www.defenselink.rnil/brac, then go to Scenario Data Calls, Department of the Navy, Redacted Activity Data Calls-Final Certified Answers (Capacity), ZipFile 4 (32.6MB), then add the totals for 5.3.1.C in the following PDF files: Redacted BRAC Capacity Data Call, 7 January, NAVSHIPYD-AND-IMF-PEARL-HARBOR-HI (Page 65), NAVSHIPYD-NORFOLK-VA (Page 73), NAVSHIPYD-PORTSMOUTH-NH (Page 1 14) and NAVSHIPYD-PUGET-SOUND-WA (Page 66)
Total Capacity = Table 5.3.1 .D found in www.defenselink.mil/brac, then go to Scenario Data Calls, Department of the Navy, Redacted Activity Data Calls-Final Certified Answers (Capacity), ZipFile 4 (32.6MB), then add the totals for 5.3.1.D in the foIlowing PDF files: Redacted BRAC Capacity Data Call, 7 January, NAVSHIPYD-AND-IMF-PEARL-HARBOR-HI (Page 66), NAVSHIPYD-NORFOLK-VA (Page 75), NAVSHIPYD-PORTSMOUTH-NH (Page 1 15) and NAVSHIPYD-PUGET-SOUND-WA (Page 67)
Workforce Capacity = Naval Shipyard Available Force Data (Avg. Oct 04- Feb 05); found in www.nde.navy.mil, then go to WEBWARR, workforce, and use available force data
Calculated workforce capacity shortage (WF) (middle thermometer) (used 14% leave, 70% direct labor index, 15% overtime, and 2008 work hours per year) compared to certified Required Capacity data, Section 5.3.1 .A of 7 Jan 04 (above)
Shortage Calculations = Compared straight-time workforce capacity to certified Required Capacity and Required Capacity + 14% Growth to determine percentage short and people per day short, with no overtime and 15% overtime calculation.

crosshatched area, which represents the potential "over-calculated capacity". Naval Shipyards are in the business of performing repair work aboard ships. The backshop work is staffed to provide minimum throughput in direct support of ships undergoing repairlmodernization. There is essentially no backshop manufacturing of products to be sold on the open market. We only perform essential work in backshops that is in direct support of drydock and pierside work. About 15% of our direct work is "backshop" and consequently, the backshop capacity should have been capped at about 15% over drydock capacity. The use of building square footage and workstations, while assuming unlimited personnel, is a major failure in Navy's approach to determining both Total and Excess Capacity.
w t y , Required Capacity and Workforce Analysis I Total and Required Total and Required
Capacity Compariso w, Porismoulh~-~
paclty Comparison T-1 C V C ~ ~ Y w/o Portsmouth
4 Shpyard 3 Shpya'd
Total and Required Capaclly -With 14 % lnefflclency & Growth
wlo Porlsmoulh - 1
Chart 10
5
When comparing data in the middle and right graphs, the Required Capacity will significantly exceed actual capacity (blue area plus the yellow 15% band) in both. The Workforce Capacity will be 35% and 54% below Required Capacity, respectively, and the total skills shortages will range from - 4,000 people to as many as -8,000, if we apply a 15% overtime rate. Many experts will argue that sustained overtime at 15% is excessively high. Navy has had an unofficial overtime goal for the past 5 years, of lo%, but has yet to get the annual rate below the 16 - 20% band.
e s n ; 9 a t t w Q l 5 2 u x ST WF compared to Requ~red Capac~ty 35% 7091 ST WF compared to Requ~red Capac~ty + GroMh 54% 10942
Individual Trade graphs were developed from the same Data Tables as the total graph, using individual TradeICommodity information, in lieu of aggregated data. When developing the Trade graphs, we used the NAVSEA overtime goal of 10% to determine our potential shortages. We believe firmly that all Trade backshop Capacities were grossly overstated, primarily because there was NO consideration for the staffing and
shQauwa
4030 7880

skill levels that ultimately control throughput and actual capacity. The individual trade shortages (in people per day), without the Portsmouth workforce, are summarized below:
Marine (Outside) Machinist (Chart 1 I ) shortage -500 - 850 Paint (Chart 1 2) shortage -500 - 650 Crane and Rigging (Chart 13) shortage -280 - 480 Heavy Fabrication - Shipfitting (Chart 14) shortage -130 - 300 Piping (Chart 15) shortage -300 - 480 Welding (Chart 16) shortage -320 -- 5 10 Electrical (Chart 17) shortage -270 - 430 Electronics (Chart 18) shortage - 0 - 14 Sheetmetal (Chart 10) shortage -40 - 1 10 Shipwright (Chart 20) shortage -8 -- 90 Inside Machining (Chart2 1 ) shortage - 170 - 300
I Marine (Outside) Machinist / Total and Required
Capacily Comparison -
wl Portsmouth
Total and Required Capacily
comparison - wlo Portsmouth
Total and Required Capaclly.
With 14 X Inefficiency 8 Growth
Chart I I

Total and Required Capacity Comparison
wl Portsmouth
Total and Required Capacity Comparison
wlo Portsmoulh
Total and Required Capacity - With 14%
Inefficiency 8 Growth wlo Portsmouth
3 Shipyard
ST W F canpared lo Required Capaaty 75.3% 557 483 664
17 ST W F canparad lo Required Q ~ d t y + GroMh 93.8% 738
Chart 12
[Cranes and Rigging I Total and Required
Total and Required Total and Required Capacity -With 14 % Capacity Comparison. Capacity Comparison
Inefficiency 8 Growth wlo Pottsmouth
wlo Portsmouth wl Portsmouth
Chart 13
Shodra wlbout P)IS worlttbra Percent @lO%OT ST WF ccmpemd to Requked Capacity 3 7 . m 385 283 STWFcapemdtoR.qu(redC.pedty+Gmwth 66.- 683 4W) -
25

I Heavy Fabrication - Shipfitting I Total and Required Total and Required
Capacity Capacity- Comparison - Wih 14 %
W/O Portsmouth Inefficiencv 8 Growth
Total and Required Capacity Comparison
-wl Porlsmouth
rlo Portsmouth
lam
I Piping I
Shomge wlUtout PNS workforce Percent d l O % O T ST WF cmpamd lo Required Capadly ! 23.4% 225 129 ST WF canpared to Required Capacity + Growlh 40.796 381 295
Total and Required Capacity- With 14%
Ineffiiency 8 Growth
26
Total and Required Capacity Comparison
- wlo Portsmouth
Chart 14
Total and Required Capacity Comparison.
wl Portsmouth
NU)
P laa
5W
a
snorr.9. wmour PNQ wo*lb'ig) ST W F cancand to Required CImW I
UIZ I 27
Chart 15

Total and Requlred Capacity Comparison
wl Portsmouth
Total and Required Capacity - W l 1 4 % Inefficiency 8 Growth
wlo Porlsrnouth
Total and Requlred Capacity Comarieon .
wlo Portsmouth
Total and Required Capacity - Wih 14 % Inefficiency 8 Growth
Shomoe without PNS wotkhrm Percent Q 1 0 K O T ST W F campred to Required Capacity ' 46.4% 414 3 24 ST W F compared to Required Capaclty + Growth 66.8% 587 507
Total and Required Capaclty Comparison
wlo Portsmouth
28
Total and Requirod Capacity Comparison.
w 1 Portsmouth
Chart 16
'lo Portsmouth
3 Shipyard

Tolal and Requlred Capacity Comparison-
w l Portsmouth
4 S h p y a d
Total and Required Ca~acitv Com~arison
Total and Required Capacity .With 14 % Inefficiency 8 Growth
W/O Portsmouth
Shoriam wl(nout PNS worklbrm : P a n a n t u#, ~ I O K O T S T W F c m pared l o Requlred Capsclty 0.5% -2 -41 30 ST W F compared t o Raqulred Capacity Growlh 13.6% 63 14
Chart 18
1 Sheetmetal 1 Total and Required Capacity -With 14 X Inefficiency 8 Growth
Total and Required Capacity Comparison
- w l Portsmouth
Total and Required Capacity Comparsion
wlo Pommouth
4 S h p y a d 3 Shpyad

Total and Required Capacity Comparison-
wl Portsmouth
1 Shipwright ( Total and Required
Capacity Comparison WIO Porlsmoulh
I W J
Ya
0
3 Shipyard
Total and Required Capacity -With 14 O/o IneMciencv (L Growth
Shottape wllhout PNS workforce Percent @ l O % O T ST W F compared l o Requred Capaclly 11 5% 81 8
Requued Capacity Growih 27 2% 143 80 32
Chart 20
Tolal and Required Total and Required Capacity Capacity
Comparison - Comparison - w l Portsmouth wlo Portsmoulh
Total and Required Capacity- With 14 %
Ineffciency (L Growth WIO Portsmouth - 1
3 Shipyard
Sh0ri.n~ ~lfh011f PN8 W O & ~ ~ W P.tc~nt 0 10 %OT ST W F canpamd to Required bpac l t y 38.0% 238 170 ST W F canpared to Required Capacity + Growth 55 1% 360 2BS
Chart 2 1

An example of the overstated Backshop Capacity is well represented by an in-depth analysis of the Inside Machine Trade data. The Total Capacity calculated for Portsmouth by DoD was 423,700 hours per year'6. DoD also states Required Capacity as 227,200". Comparing these two figures (e.g.: (423700-227200)/227200) places DoD's Excess Capacity calculation at 90%. Using actual staffing levels'8, this TradeICommodity has 2 12,300 hours of straight-time capacity. The actual capacity this Commodity will execute this year is 232,000 hours '9(using 9% overtime). Comparing Total DoD to Workforce straight-time capacity shows 98% Excess Capacity. Total Capacity is overstated by 83% from what the workforce can actually perform. There is NO excess, as the shop, as currently staffed, would have to work 7% overtime to meet Required Capacity of the future. Similar analysis can be performed for every trade. Simply stated, the 423,700 hours Total Capacity calculated by DoD is fundamentally wrong and grossly overstates the throughput of this Trade. The methodology used to calculate Total Capacity was woefully inaccurate.
Human Capacity should have been used as an element when computing Total Industrial Capacity. This point was emphasized on numerous occasions by Adm. Klemm during meetings with the ISG and IJCSG, but ultimately was discounted2'. The following Human Capacity conclusio~ls can be drawn from o w discussion:
Today, Navy has 66% less Human Capacity than i t had at Shipyards in 1988, while the fleet and shipyards have only reduced by 50%. Navy miscalculated the Total Capacity by assuming theoretical Backshop and DrydockPierside Capacities were additive. By their own admission, Navy never conducted the comprehensive analyses of Commodities, or Drydocks to ensure feasibility of recommendations. Scenario COBRA data received substantial scrutiny ( e g : 10 or more revisions
after initial certification of data) prior to final acceptance. There is not evidence that Capacity data ever received validation as reasonable, accurate or supportive of their recommendation. Without the Portsmouth workforce, the Corporation will be short between 4,000 and 8,000 skilled artisans to perform scheduled work.
16 Inside Machine Total Capacity = Table 5.3.1.D found in www.defenselink.mil/brac, then go to Scenario Data Calls, Depai-tment of the Navy, Redacted Activity Data Calls-Final Certified Answers (Capacity), ZipFile 4 (32.6MB), then average the FY03 through FY05 ((DLH (K)) total for 5.3.1 .D in the following PDF file: Redacted BRAC Capacity Data Call, 7 January, NAVSHIPYD-PORTSMOUTH-NH (Page 1 15) - Inside Machine " Inside Machine Required Capacity = Table 5.3.1 .A; found in www.defenselink.mil/brac, then go to Scenario Data Calls, Department of'the Navy, Redacted Activity Data Calls-Final Certified Answers (Capacity), ZipFile 4 (32.6MB), then average the FY03 through FY05 ((DLH(K)) total for 5.3.1.A in the following PDF file: Redacted BRAC Capacity Data Call, 7 January, NAVSHIPYD-PORTSMOUTH-NH (Page 11 1) - Inside Machine 18 Portsmouth Workload and Resources Report June 2005 '' Same as Footnote 18 20 ISG meeting minutes, October 3,2003 and IJCSG meeting minutes, November 18, 2003.

Workforce ~ e m o g r a ~ h i c s ~ ' (Chart 22) are adding risk to future Commodity Capacity and more importantly to our Trade knowledge, skills and capabilities. We continue to deal with a workforce that has 38% eligible for retirement in the next five years. Naval Shipyards have a current staffing level of about 24,000 employees. Should the workforce at Portsmouth not relocate22, total employment would drop to about 20,000, If 38% of the remaining personnel retire and the Portsmouth workforce has to be reconstituted, then the Corporation would be looking at hiring about 1 1,000 people in the next five years. This equates to about 50% of the workforce. There has been no cost analysis done on a workforce change-out of this magnitude. The training infrastructure could not support and there would be a deleterious effect on Quality of work, further Schedule degradation and worsening Cost performance.
Naval Shipyard ( I I Cri~ical Trade Commodities)
r I
Chart 22
In conclusion: Navy's Infrastructure reductions since 1988 have been significant
o Submarines 45% o Total Fleet 50% o Shipyards 50% o Workforce 66%
Navy has not performed essential comprehensive analyses of Commodity and Drydock Capacity to support their recommendation Maintenance does not reduce for 15+ years Future Force Structure still very uncertain Op Tempo and Age of ships is increasing maintenance requirements Workforce Demographics are working against elimination of an entire shipyard's workforce.
21 Corporate Production Resource Team Demographic Data from June 2005 Meeting 22 Earl Donne11 Testinlony at Boston Hearing. Substantiated by Comptroller General Walker's Testimony to Commission on 19 July 2005. GAO 05-905 Military Bases, Transit~on Plans for Minimizing Disruption of Operations due to Loss of Specialized Skills, page 25 of Report.

There is no Excess as reported by DoD, in the areas of Drydock, Backshop or Human Capacities. Based on the facts in this document, previously supplied data and Testimony, a Portsmouth Naval Shipyard closure places the Navy and Nation at excessively high risk of being able to maintain it's war fighting capability; thereby, placing our National Security at risk.
This information is certified to be accurate to the best of my knowledge, Earl R. Dome11 Jr. //s//

There is no Excess as reported by DoD, in the areas of Drydock, Backshop or Human Capacities. Based on the facts in this document, previously supplied data and Testimony, a Portsmouth Naval Shipyard closure places the Navy and Nation at excessively high risk of being able to maintain it's war fighting capability; thereby, placing our National Security at risk.
This information is certified to be accurate to the best of my knowledge, Earl R. Donn