avtyg appel · avtyg appel . Title: menuset38 Created Date: 9/17/2018 10:39:25 AM

Confidential-Preliminary DraftFor Internal Use Only
Ports of Louisiana Strategic Economic Development Plan
Container Analysis Provided to the Port of New Orleans
September 2008

Page 2Confidential-Preliminary Draft For Internal Use Only
Important Notes
The attached analyses are work in progress and therefore subject to refinementThe attached slides represent a compendium of the container market analyses Norbridge prepared as part of the SESD effortThe attached analyses are based on PIERs data, which has limitations in terms of its ability to accurately identify the true inland origins and destinations for container cargoes

Page 3Confidential-Preliminary Draft For Internal Use Only
The container market assessment focuses on the following key areas:
Trends in North American container trafficTrends in global container capacityLeading container carriers and industry concentrationNorth American ports and industry concentrationKey trends in Gulf Coast container trafficPort infrastructureEconomicsImplications for Louisiana
Page 4Confidential-Preliminary Draft For Internal Use Only
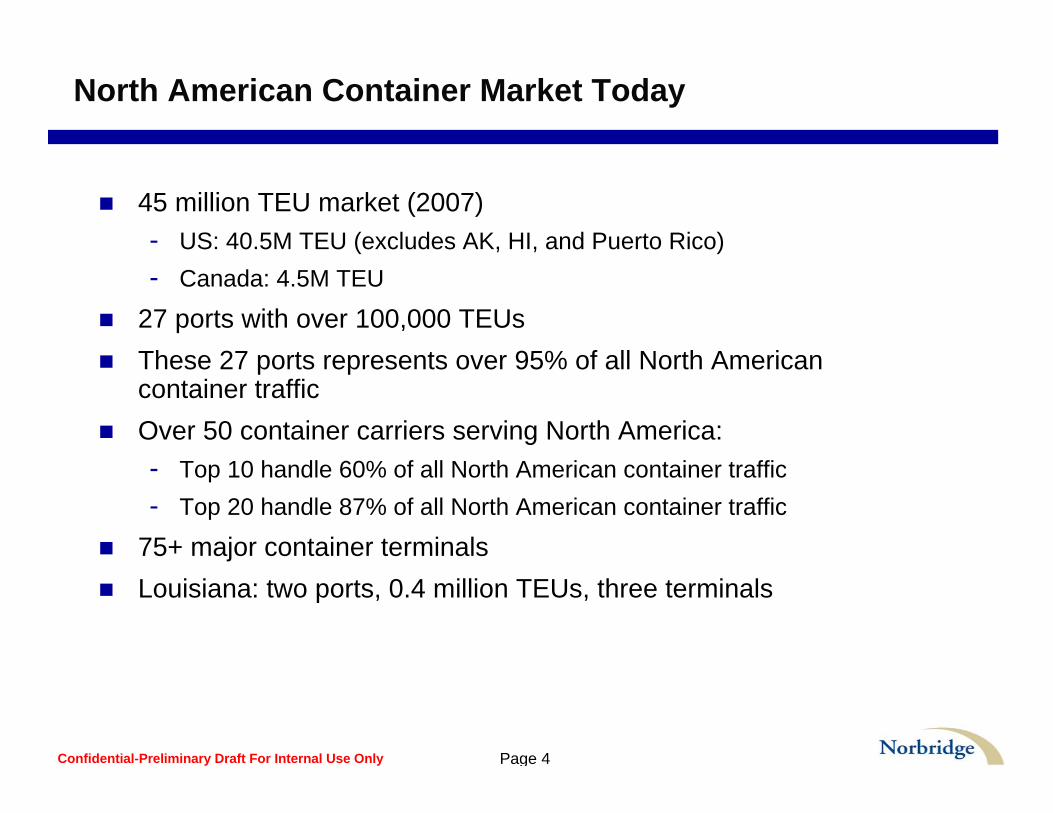
North American Container Market Today
45 million TEU market (2007) - US: 40.5M TEU (excludes AK, HI, and Puerto Rico)- Canada: 4.5M TEU
27 ports with over 100,000 TEUsThese 27 ports represents over 95% of all North American container trafficOver 50 container carriers serving North America:- Top 10 handle 60% of all North American container traffic- Top 20 handle 87% of all North American container traffic
75+ major container terminalsLouisiana: two ports, 0.4 million TEUs, three terminals

Page 5Confidential-Preliminary Draft For Internal Use Only
0
10,000,000
20,000,000
30,000,000
40,000,000
50,000,000
1992 1997 2002 2007
Pacific Coast Atlantic Coast Gulf Coast
The North American container industry has seen sustained growth during the last 15 years. West Coast container traffic has grown the fastest.
North American Container Throughput by Coastal Region*(TEUs)
15 Year CAGR:
West Coast:7.5%Atlantic Coast:6.0%Gulf Coast: 5.4%All Coasts:6.7%
6.7% CAGR
*Note: 1. Throughput is for top 25 U.S. and Canadian container ports, which account for more than 95% of all such flows.2. Excludes AK, HI, Guam and Puerto Rico (largely domestic) traffic
Source: AAPA; Port Reported Throughput; Norbridge Analysis

Page 6Confidential-Preliminary Draft For Internal Use Only
Over the last 10 years, North American container traffic has been growing at a CAGR of 6.6%, with Canada (7.5% CAGR) growing faster than the U.S. (6.5% CAGR).
North American Container Traffic: 1997-2007
05,000,000
10,000,00015,000,00020,000,00025,000,00030,000,00035,000,00040,000,00045,000,00050,000,000
1997
1998
1999
2000
2001
2002
2003
2004
2005
2006
2007T
EU
U.S Canada*Note: 1. Throughput is for top 25 U.S. and Canadian container ports, which account for more than 95% of all such flows.
2. Excludes AK, HI, Guam and Puerto Rico (largely domestic) trafficSource: AAPA; Port Reported Throughput; Norbridge Analysis
Page 7Confidential-Preliminary Draft For Internal Use Only
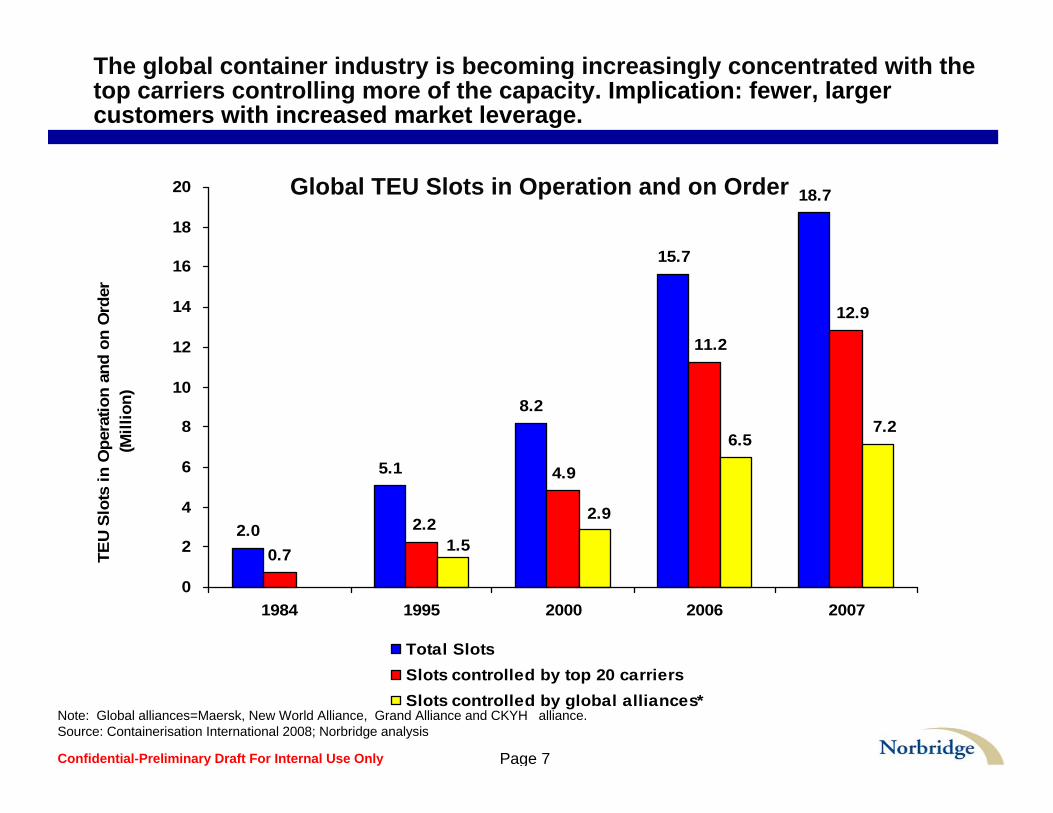
The global container industry is becoming increasingly concentrated with the top carriers controlling more of the capacity. Implication: fewer, larger customers with increased market leverage.
2.0
5.1
8.2
15.7
18.7
0.7
12.9
2.2
4.9
11.2
7.26.5
2.9
1.5
0
2
4
6
8
10
12
14
16
18
20
1984 1995 2000 2006 2007
TEU
Slot
s in
Ope
ratio
n an
d on
Ord
er(M
illio
n)
Total SlotsSlots controlled by top 20 carriersSlots controlled by global alliances*
Note: Global alliances=Maersk, New World Alliance, Grand Alliance and CKYH alliance.Source: Containerisation International 2008; Norbridge analysis
Global TEU Slots in Operation and on Order

Page 8Confidential-Preliminary Draft For Internal Use Only
Note: Bubble size indicates size of 2007 of TEUs in service by carrier.Source: Containerisation International 2008 and Norbridge analysis.
0%
5%
10%
15%
20%
25%
30%
35%
0 200 400 600 800 1,000 1,200Absolute Change 2001-2007
(TEU-000)
2001
-200
7 C
AG
R
Grand Alliance New World Alliance CKHY Evergreen Maersk MSC CMA-CGM
Major Global Container Carrier Capacity Growth 2001-2007
Major global container carriers continue to add capacity and aregrowing at significant rates.
CMA-CGM
Maersk
MSC
Grand Alliance
CKYHNWA
Ever.

Page 9Confidential-Preliminary Draft For Internal Use Only
The North American container port industry is highly concentrated, with the top 10 ports handling nearly 85% of all traffic.
0
1
2
3
4
5
6
7
8
9
LA LB NYNJSavannahOaklandVancouver, BC
Hampton Roads
SeattleTacomaHoustonCharlestonMontrealPort Everglades
MiamiJacksonvilleBaltimoreHalifaxWilmington, DE
Portland, ORPhiladelphia
TEU
(Mill
ion)
Note: NY/NJ, VA Ports, and Baltimore reported in 2006 throughput, as 2007 throughput not available. Source: AAPA 2007, port websites and Norbridge analysis.
Top 20 North America Container Ports2007
83%
Top 10 Port Handling

Page 10Confidential-Preliminary Draft For Internal Use Only
0.0
0.5
1.0
1.5
2.0
2.5
1997 1998 1999 2000 2001 2002 2003 2004 2005 2006 2007*
TEU
(Mill
ion)
West Gulf East Gulf
Over the last decade, the Gulf Coast container industry has beengrowing at a compound annual growth rate (CAGR) of 6%. This growth has been driven by an expansion in West Gulf traffic.
East and West Gulf Coast Container Throughput2007
Note: East Gulf includes Gulfport, Manatee, Mobile, New Orleans, and Tampa. West Gulf includes Freeport, Galveston, Houston and Lake Charles.*2007 data uses Galveston’s 2006 throughput, as 2007 throughput not available.Source: AAPA 2007 and Norbridge analysis.
6% CAGR

Page 11Confidential-Preliminary Draft For Internal Use Only
2007 Throughput (TEU)
0
500,000
1,000,000
1,500,000
1,800,000
Tampa - 40
Panama City - 54
New Orleans - 315
Mobile - 119
Manatee - 5
Lake Charles - 5
Houston – 1,769
Gulfport - 207
Greater Baton Rouge - 1
Freeport - 76
Houston was the Gulf Coast’s leading container gateway in 2007.
Note: *Galveston= 2006 data; 2007 not availableSource: AAPA 2007, American Shipper, and Norbridge analysis.

Page 12Confidential-Preliminary Draft For Internal Use Only
s
-10%
-5%
0%
5%
10%
15%
20%
25%
30%
35%
-100 0 100 200 300 400 500 600 700 800
Absolute Change between 2000-2007(TEU-000)
2000
-200
7 C
AG
R
Houston
Gulfport
New Orleans
Mobile
Other
Houston has also been the fastest growing Gulf Coast port.
Note: Bubble size indicates 2007 TEU throughput.“Other” includes Freeport, Galveston*, Lake Charles, Manatee, and Tampa. It excludes Greater Baton Rougeand Panama City due to insufficient data.*Galveston=2006 data; 2007 not available. Source: AAPA 2007 and Norbridge analysis.
Houston

Page 13Confidential-Preliminary Draft For Internal Use Only
Note: Bubble size indicates size of 2007 container market of each trade lane.Gulf includes Beaumont, Corpus Christi, Freeport, Galveston, Gulfport, Houston, Lake Charles, Mobile, and New Orleans.
Source: JOC PIERS 2007 and Norbridge analysis.
-20%
-10%
0%
10%
20%
30%
40%
50%
60%
70%
80%
-50 0 50 100 150 200Absolute Change between 2002-2007
(TEU-000)
2002
-200
7 C
AG
R
North Europe Caribbean/Central America Mediterranean China ECSA Other
Size and Growth of Gulf Coast Container Market Trade Lanes
North Europe and Caribbean/Central America are the largest Gulf Coast trade lanes, while China trade is expanding rapidly.
China
Carib-CentAmN.Europe

Page 14Confidential-Preliminary Draft For Internal Use Only
-20%
-10%
0%
10%
20%
30%
40%
50%
-90 -60 -30 0 30 60 90 120
Absolute Change between 2002-2007(TEU-000)
2002
-200
7 C
AG
R
TX CA OH AL MS MI LA AR Other
Size and Growth of Gulf Coast Container Market by State
Texas is the Gulf Coasts’ largest container market. OH and AL are smaller markets but growing rapidly. The accuracy of the Ohio data may be questionable, given the limitations of the PIERs data.
TX
OH
AL
OH
TX
Note: Bubble size indicates size of 2007 container market of each trade lane.Gulf includes Beaumont, Corpus Christi, Freeport, Galveston, Gulfport, Houston, Lake Charles, Mobile, and New Orleans.
Source: JOC PIERS 2007 and Norbridge analysis.

Page 15Confidential-Preliminary Draft For Internal Use Only
Note: Bubble size indicates size of 2007 container market of each carrier. “Other” includes 80+ various other shipping lines.Source: JOC PIERS 2007 and Norbridge analysis.
Size and Growth of Gulf Coast Container Market by Carrier
-20%
-10%
0%
10%
20%
30%
40%
50%
-30 0 30 60 90 120 150 180 210 240 270 300Absolute Change between 2002-2007
(TEU-000)
2002
-200
7 CA
GR
Other Mediterranean Shipping CompanyCMA-CGM ZimDole Ocean Cargo Express Great White FleetSeaboard Marine MaerskGrand Alliance New World Alliance
Four carriers, CMA-CGM, Seaboard Marine, Zim, and MSC, have experienced significant growth in Gulf traffic. Other carrier growth has been modest.
CMA
MSCZIM
Seaboard

Page 16Confidential-Preliminary Draft For Internal Use Only
U.S. geographic regions discussed in the next section are highlighted below.
Gulf
South Atlantic
Mid-Atlantic
North Atlantic
Midwest
Central South
WestAll Other

Page 17Confidential-Preliminary Draft For Internal Use Only
Note: Bubble size indicates size of 2007 container market of each region.North Atlantic includes ME, NH, VT, MA, RI, CT,NY, NJ and PA; Mid-Atlantic includes DE, MD, DC, VA and WV; South Atlantic includes NC, SC and GA; Central South includes KY, TN, AK and OK; Gulf includes FL, AL, MS, LAand TX; Midwest includes OH, IN, IL, MI, WI; and West includes ID, AZ, UT, WA, OR and CA.
Source: JOC PIERS 2002 and 2007, and Norbridge analysis.
-4%
-2%
0%
2%
4%
6%
8%
10%
-500 0 500 1,000 1,500 2,000 2,500 3,000 3,500 4,000 4,500Absolute Change between 2002-2007
(TEU-000)
2002
-200
7 C
AG
R
North Atlantic Mid-Atlantic South Atlantic Central SouthGulf Midwest West
Size and Growth of US Container Market by Region
The West is the largest and fastest growing U.S. container market (8%CAGR, 2002-2007). The Gulf, North Atlantic and South Atlantic regions have been growing at comparable annual rates (5% CAGR).
West
SATL Gulf NATL

Page 18Confidential-Preliminary Draft For Internal Use Only
0
10
20
30
40
50
60
NorthAtlantic
Mid-Atlantic SouthAtlantic
CentralSouth
Gulf Midwest West
Region
Popu
latio
n (M
illio
n)
Population by Region(Million)
Note: North Atlantic includes ME, NH, VT, MA, RI, CT,NY, NJ and PA; Mid-Atlantic includes DE, MD, DC, VA and WV; South Atlantic includes NC, SC and GA; Central South includes KY, TN, AK and OK; Gulf includes FL, AL, MS, LAand TX; Midwest includes OH, IN, IL, MI, WI; and West includes ID, AZ, UT, WA, OR and CA.
Source: U.S. Census Bureau’s July 2007 population estimates.
The Gulf region had an estimated population of 35 million in 2007.

Page 19Confidential-Preliminary Draft For Internal Use Only
Texas has the largest population in the Gulf Coast.
13%
8%
12%
67%
Alabama Mississippi Louisiana Texas
2007 Gulf Coast Population Estimate by StateTotal of 35.7 Million
Note: Gulf includes FL, AL, MS, LA and TX.Source: U.S. Census Bureau’s July 2007 population estimates.

Page 20Confidential-Preliminary Draft For Internal Use Only
Population100,000500,000
1,000,000
1,500,000
2,200,000
Gulf Coast cities with populations greater than 100,000 (2006) are potentially attractive container markets.
Note: Cities on this map all have populations over 100,000.Source: U.S. Census Bureau’s July 2006 population estimates.
DFW: 11 Cities with pop. > 100,000; total pop. in these cities Is 3.5M
Page 21Confidential-Preliminary Draft For Internal Use Only
Wichita - 0.4M
Tulsa - 0.4M
St. Louis - 0.3M
Springfield - 0.2M
Rockford - 0.2M
Overland Park - 0.2M
Omaha - 0.4M
Oklahoma City - 0.5M
Nashville - 0.6M
Memphis - 0.7M
Louisville - 0.6M
Little Rock - 0.2M
Lincoln - 0.2M
Lexington –0.3M
Knoxville –0.2M
Kansas City - 0.4M
Des Moines - 0.2M Chicago - 2.8M
Chattanooga - 0.2M
Aurora - 0.2M
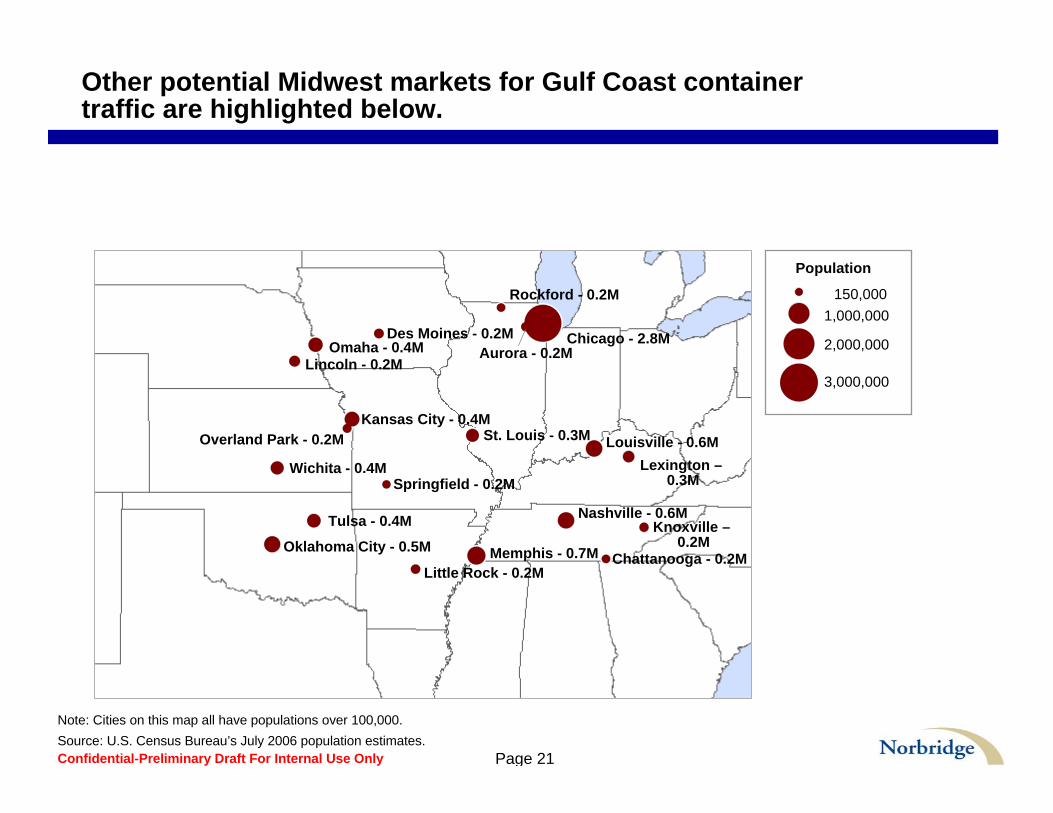
Note: Cities on this map all have populations over 100,000.Source: U.S. Census Bureau’s July 2006 population estimates.
Population
150,0001,000,000
2,000,000
3,000,000
Other potential Midwest markets for Gulf Coast container traffic are highlighted below.

Page 22Confidential-Preliminary Draft For Internal Use Only
Houston has the most capable Gulf Coast container terminal infrastructure.
2
CSX, CN, NS, BNSF, KCS
2
2,000
45
45
135 (at full buildout)
Mobile Container Terminal
16
BNSF, UP
9
8,000
40
45
315
Houston
4
CSX, CN, NS, BNSF, IC
2
1,400
40
45
61
New Orleans (Napoleon
Avenue Container Terminal)
Berth Depth (feet)
Channel Depth (feet)
# of Reported Container Berths
Berth Length (feet)
# of Container Gantry Cranes
Rail Service Providers
Terminal Acreage
Area
Source: CI; AAPA Seaports of the Americas, Port Websites, Norbridge Analysis
Gulf Coast Port Infrastructure Summary

Page 23Confidential-Preliminary Draft For Internal Use Only
Mobile and Houston have the shortest rail distances to major inland markets.
737
911
841
1,077
881
758
615
798413
936
Port of New Orleans
729
1.081
897
1,112
919
878
478
664414
930
Port of Mobile
645Wichita, KS
853St. Louis, MO
548Tulsa, OK
1002Omaha, NE
806Kansas City, KS
470Oklahoma City, OK
852Nashville, TN
1,038Louisville, KY620Memphis, TN
1,125Chicago, IL
Port of Houston
City, State
Note: Rail miles are in intermodal miles, which calculate the best route for intermodal trains.Highlighted cells represent shortest routes.
Source: PC Rail.
Gulf Coast Port Distances to Major Inland Destinations
Indicates lowest rail mileage

Page 24Confidential-Preliminary Draft For Internal Use Only
New and proposed Gulf Coast container terminals provide significant competition for the region’s container traffic.
N.A. Not AvailableSource: LexisNexis and port websites.
1,100 acres have been purchased.
Approximately 1,000 acres total. This includes 376 acres of container yard and a 123-acre intermodal facility.
135 acres upon completion.Acres
Uncertain; however, 3,800’shoreline available.
7 berths totalTwo 1,000’ berthsBerth
N.A.Expected to be completed in 2030.
Currently in final phase.Future Phases
La Quinta Trade GatewayBayport Container TerminalMobile Container TerminalName of Terminal
Port of Corpus ChristiPort of Houston AuthorityAPM Terminals North America & Terminal Link
Owner
39’ channel depthN.A.45’ channel depthDepth
Direct connection to Union Pacific. 5,000’ of on dock rail tracks.
On-dock rail with connection to all major destinations will be available.
Access to 5 Class I Railroads; on terminal rail available.
Rail
Initial stage: seeking additional partners in project and re-conducting market studies.
Opening phase of Bayport became operational in January 2007. 89 acres completed.
Expected to open summer of 2008. Completed phase one of 95 acres.
Current Status
Port of Corpus ChristiPort of Houston AuthorityMobile Container Terminal LLC
Operators
Port of Corpus Christi (proposed)
Port of HoustonPort of Mobile

Page 25Confidential-Preliminary Draft For Internal Use Only
Most niche river-based container ports have grown more slowly than the total U.S. container market during the past ten years
10 Year Index of TEUs through Select Ports
0.00
0.50
1.00
1.50
2.00
2.50
1997 1998 1999 2000 2001 2002 2003 2004 2005 2006 2007
Year
Inde
x (1
997
Bas
e Ye
ar)
Philadelphia Baltimore Wilmington, NC New Orleans Portland Total USNote: 2007 data for Baltimore not available.Source: AAPA data, and Norbridge analysis.

Page 26Confidential-Preliminary Draft For Internal Use Only
The following major container market trends are discussed next:
Containership Growth Panama Canal Expansion Major Port Expansions

Page 27Confidential-Preliminary Draft For Internal Use Only
S Class6800 TEUS Class
6800 TEU
L Class14,000 TEU
L Class14,000 TEU
Container ships continue to grow in size. The largest container ship today can hold about 14,000 TEUs.
Largest today:
Emma Maersk (14,000 TEU, 2006)Panama Canal limit today:
4,500 TEU
Source: Norbridge research and analysis
Containership Growth

Page 28Confidential-Preliminary Draft For Internal Use Only
Panama Canal expansion will permit larger ships and likely increase all-water container flows by 2014.
Complete: 2014Cost: $5.25 billionNew locks at both endsLock capacity:
- 4,500 TEU vessel today- 12,000 TEU vessel 2014
Container traffic growth:
- 8 containerships/day today
- 24 containerships/day in 2025
Replace w/map
Source: Norbridge research and analysis
Panama Canal Expansion

Page 29Confidential-Preliminary Draft For Internal Use Only
Issue: Gulf Coast depth is insufficient to handle the vast majority of both current and future large container ships (8,000 TEU and larger) which will potentially be navigating the expanded Panama Canal.
35
40
45
50
55
4,000 5,000 6,000 7,000 8,000 9,000 10,000 11,000 12,000 13,000
TEUs
Dra
ft (f
t)
Current Fleet Newbuilds
Container Vessels by Draft and TEU(4,500+ TEU Vessels)
Source: June 2007 Lloyd’s Fairplay; Norbridge research and analysis
Gulf Coast Draft Range
Containership Growth

Page 30Confidential-Preliminary Draft For Internal Use Only
The Gulf Coast container market will most likely not be able to support the extensive deployment of 10,000 TEU ships.
The Estimated Number of 10,000 TEU Weekly Vessel Strings required to Support Projected Gulf Coast
Trade
02468
2007 2010 2015 2020Mill
ions
of T
EUs;
Num
ber
of V
esse
l Stri
ngs
Projected Gulf Coast Container Trade10,000 TEU Service equivalents

Page 31Confidential-Preliminary Draft For Internal Use Only
0
100,000
200,000
300,000
400,000
500,000
600,000
700,000
800,000
2000
2002
2004
2006
2008
2010
2012
2014
2016
2018
2020
2022
2024
2026
2028
Northern Europe China-HK Central AmericaECSAmerica Med NCSAmerica
US Gulf imports from China-Hong Kong are forecasted to grow rapidly out to 2030.
N.Europe market share in ’08 is 17% and by 2028 it will be 13%. N.Europe market share in ’08 is 17% and by 2028 it will be 13%. China-HK will gain market share
given it is one of the fastest growing export region with an average annual growth of 5.7%.
China-HK will gain market share given it is one of the fastest growing export region with an average annual growth of 5.7%.

Page 32Confidential-Preliminary Draft For Internal Use Only
0
100,000
200,000
300,000
400,000
500,000
600,000
700,000
2000
2002
2004
2006
2008
2010
2012
2014
2016
2018
2020
2022
2024
2026
2028
Northern Europe Med ECSAmericaCentral America WCSAmerica China-HK
China-Hong Kong is expected to be the fastest growing Gulf coast export container market.
N.Europe market share in ’08 is 20% and by 2028 it will be 17%. N.Europe market share in ’08 is 20% and by 2028 it will be 17%.
China-HK is the fastest growing destination with a 7.9% average annual growth rate.
China-HK is the fastest growing destination with a 7.9% average annual growth rate.

Page 33Confidential-Preliminary Draft For Internal Use Only
There are a number of port expansions (recent and potential) which will impact future container flows.
Key US ports are investing to accommodate demand:- LA: 190 new acres of terminal storage by 2009- LB: 200 acres of terminal storage by 2012 - NY: Dredging will increase channel depth to 50’
New container gateways are opening
= existing
= potential future
Prince Rupert:Phase 1: 500K TEUPhase 2: 1.5M TEU
Punta Colonet:1M TEU Throughput
Guaymus1M TEU
Lazaro CardenasPhase 1: 700K TEUFut. Phase: 2M TEU
MelfordTEU TBD
Norfolk:New APMT term: 1m TEU
Mobile:New term: 350K TEU
Jacksonville:New term: 1 m TEU
Source: Norbridge research and analysis
Port Expansions

Page 34Confidential-Preliminary Draft For Internal Use Only
Container Industry Implications
Container industry concentration is increasing; fewer more powerful customers is becoming the normProximity and or sustainable competitive access to large population centers drives container growthThere are numerous, large container terminal expansion projects which have or will add significant North American capacityIn addition, there is significant latent capacity in existing container terminals for established players to expand Future growth may not support the added capacityLouisiana faces multiple, major challenges:- Market fundamentals: population, competitive positioning - Economics: transport, supply chain- Transit times
Confidential-Preliminary DraftFor Internal Use Only
Louisiana Container Market

Page 36Confidential-Preliminary Draft For Internal Use Only
With the exception of China, all major trade lanes declined in terms of container trade with Louisiana between 2001 and 2007.
-25%
-20%
-15%
-10%
-5%
0%
5%
10%
-40 -30 -20 -10 0 10 20
2001-2007 Change Thousands of TEU)
2001
-200
7 C
AG
R
China Central America Northern Europe N. Far East
SE Asia Caribbean ECSA All Other
Size and Growth of Louisiana Trade Lanes (2001-2007)
Source: PIERS; Norbridge Analysis

Page 37Confidential-Preliminary Draft For Internal Use Only
Three of the top six carriers experienced declines in their Louisiana traffic between 2001 and 2007.
-30%
-20%
-10%
0%
10%
20%
30%
40%
50%
-50 -40 -30 -20 -10 0 10 20
2001-2007 Change Thousands of TEU)
2001
-200
7 C
AG
R
AMPL HAPL MDSC MLSL OOCL CRLS Other Lines
Size and Growth of Louisiana Shipping Lines (2001-2007)
Source: PIERS; Norbridge Analysis
Page 38Confidential-Preliminary Draft For Internal Use Only
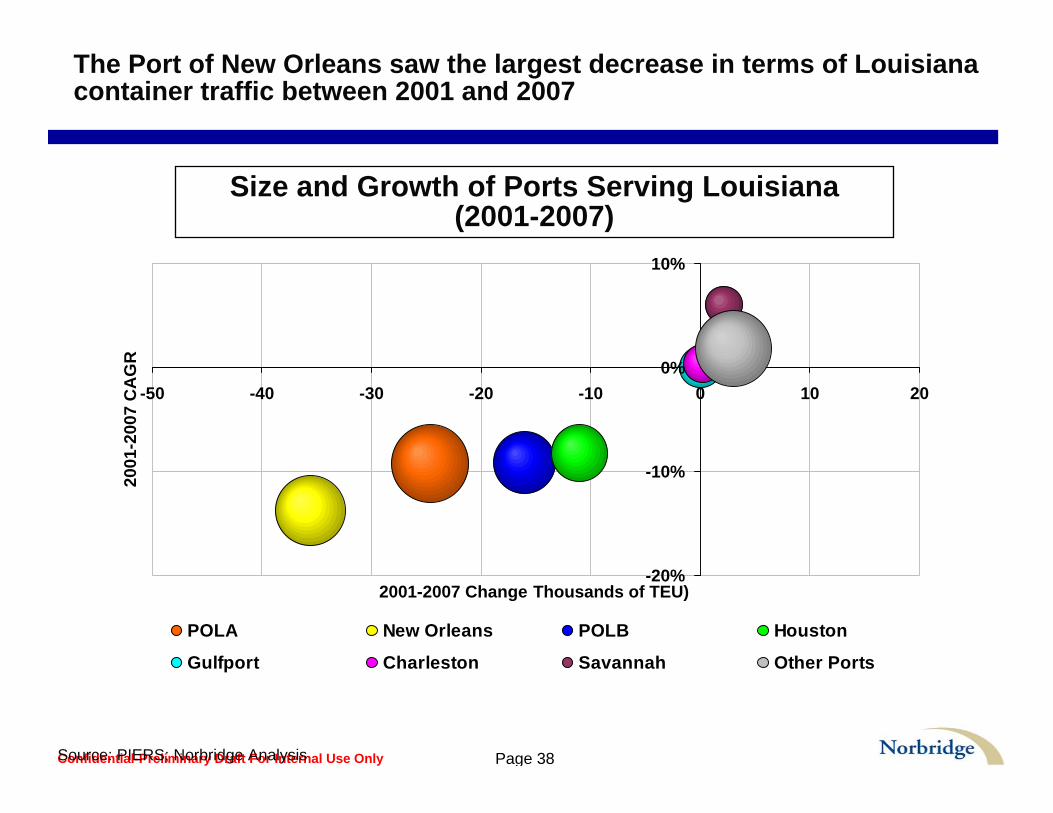
The Port of New Orleans saw the largest decrease in terms of Louisiana container traffic between 2001 and 2007
-20%
-10%
0%
10%
-50 -40 -30 -20 -10 0 10 20
2001-2007 Change Thousands of TEU)
2001
-200
7 C
AG
R
POLA New Orleans POLB Houston
Gulfport Charleston Savannah Other Ports
Size and Growth of Ports Serving Louisiana (2001-2007)
Source: PIERS; Norbridge Analysis

Confidential-Preliminary DraftFor Internal Use Only
Regional Container Market

Page 40Confidential-Preliminary Draft For Internal Use Only
Regional market growth has been driven by China, which is the largest and fastest growing trade lane.
-5%
0%
5%
10%
15%
20%
25%
30%
-200 -100 0 100 200 300 400 500 600 700 800 900
2001-2007 Change Thousands of TEU)
2001
-200
7 C
AG
R
China N. Far East SE Asia N. Europe C. America
Med. Indian Sub. All Other
Size and Growth of Regional Market Trade Lanes (2001-2007)
Source: PIERS; Norbridge Analysis*Note: Regional market includes LA, AR, MS, MO, and TN

Page 41Confidential-Preliminary Draft For Internal Use Only
Louisiana is the only state in the regional market to have experienced a in TEUs between 2001 and 2007.
-20%
-10%
0%
10%
20%
30%
40%
50%
-200 -100 0 100 200 300 400 500 600
2001-2007 Change Thousands of TEU)
2001
-200
7 C
AG
R
Arkansas Louisiana Missouri Mississippi Tennessee
Size and Growth of Regional Market States (2001-2007)
Source: PIERS; Norbridge Analysis*Note: Regional market includes LA, AR, MS, MO, and TN
Page 42Confidential-Preliminary Draft For Internal Use Only
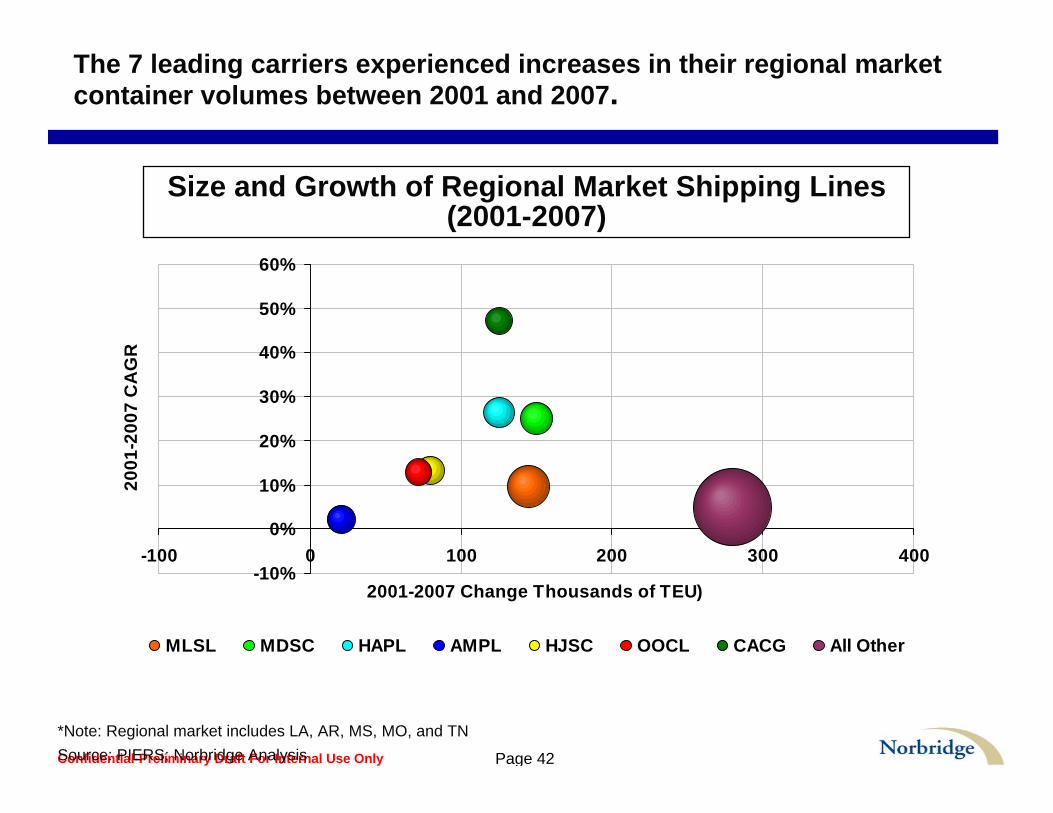
The 7 leading carriers experienced increases in their regional market container volumes between 2001 and 2007.
-10%
0%
10%
20%
30%
40%
50%
60%
-100 0 100 200 300 400
2001-2007 Change Thousands of TEU)
2001
-200
7 C
AG
R
MLSL MDSC HAPL AMPL HJSC OOCL CACG All Other
Size and Growth of Regional Market Shipping Lines (2001-2007)
Source: PIERS; Norbridge Analysis*Note: Regional market includes LA, AR, MS, MO, and TN

Page 43Confidential-Preliminary Draft For Internal Use Only
New Orleans is the only major port to realize a decline in regional market traffic volumes between 2001 and 2007.
-20%
-10%
0%
10%
20%
30%
40%
-100 0 100 200 300
2001-2007 Change Thousands of TEU)
2001
-200
7 C
AG
R
POLA POLB Savannah Charleston Tacoma Norfolk New Orleans All Other
Size and Growth of Ports Serving the Regional Market (2001-2007)
Source: PIERS; Norbridge Analysis*Note: Regional market includes LA, AR, MS, MO, and TN

Confidential-Preliminary DraftFor Internal Use Only
Midwest Container Market

Page 45Confidential-Preliminary Draft For Internal Use Only
Midwest market growth has been driven by China, which is the largest and fastest growing trade lane.
-10%
-5%
0%
5%
10%
15%
20%
25%
-500 -250 0 250 500 750 1,000 1,250 1,500
2001-2007 Change Thousands of TEU)
2001
-200
7 C
AG
R
China N. Far East SE Asia N. Europe
Mediterranean C. America Caribbean All Other
Size and Growth of Midwest Market Trade Lanes (2001-2007)
Source: PIERS; Norbridge Analysis*Note: Midwest market includes LA, AR, MS, MO, TN, IA, IN, and IL

Page 46Confidential-Preliminary Draft For Internal Use Only
Louisiana is the only state in the Midwest market to realize a decline in TEUs between 2001 and 2007.
-20%
-10%
0%
10%
20%
30%
40%
50%
-200 -100 0 100 200 300 400 500 600
2001-2007 Change Thousands of TEU)
2001
-200
7 C
AG
R
Arkansas Louisiana Missouri Mississippi Tennessee Indiana Illinois Iowa
Size and Growth of Midwest Market States (2001-2007)
Source: PIERS; Norbridge Analysis*Note: Midwest market includes LA, AR, MS, MO, TN, IA, IN, and IL

Page 47Confidential-Preliminary Draft For Internal Use Only
The 7 leading carriers experienced increases in their Midwest container traffic between 2001 and 2007.
-10%
0%
10%
20%
30%
-100 0 100 200 300 400 500 600
2001-2007 Change Thousands of TEU)
2001
-200
7 C
AG
R
MLSL MDSC AMPL HAPL OOCL HJSC KLIN All Other
Size and Growth of Midwest Market Shipping Lines (2001-2007)
Source: PIERS; Norbridge Analysis*Note: Midwest market includes LA, AR, MS, MO, TN, IA, IN, and IL
Page 48Confidential-Preliminary Draft For Internal Use Only
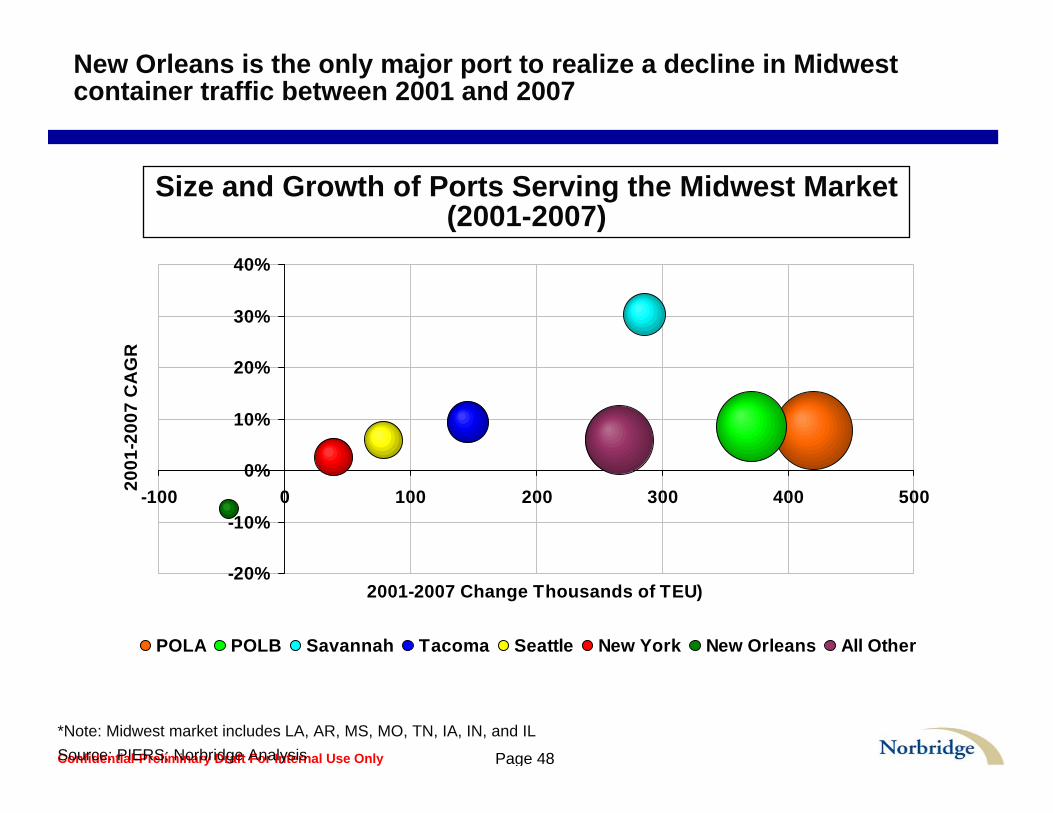
New Orleans is the only major port to realize a decline in Midwest container traffic between 2001 and 2007
-20%
-10%
0%
10%
20%
30%
40%
-100 0 100 200 300 400 500
2001-2007 Change Thousands of TEU)
2001
-200
7 C
AG
R
POLA POLB Savannah Tacoma Seattle New York New Orleans All Other
Size and Growth of Ports Serving the Midwest Market(2001-2007)
Source: PIERS; Norbridge Analysis*Note: Midwest market includes LA, AR, MS, MO, TN, IA, IN, and IL

Executive Summary 0
New Orleans, LAJune 10, 2009
EXECUTIVE SUMMARY
BRACandGNO, Inc. Trade StudyStrategy to optimize the international trade potentia l of Southeast Louisiana
This document is confidential and is intended solely for the use and information of the client to whom it is addressed.

1Executive Summary
Table Of Contents
�Study objectives and our approach
�Key learnings
�Cost model
�Trade assessment
�Business climate assessment
� Infrastructure assessment
�Strengths, weaknesses, opportunities, and threats (SWOT) analysis
�Recommendations and strategies

Executive Summary 2
The study followed a three-phase approach to assess both qualitative and quantitative information to develop potential strategies for Southeast Louisiana
Study ObjectivesStudy Objectives
� Determine the best international trade strategy for the region considering all infrastructure assets including, but not limited to: air, rail, ground transportation, ports and inland waterways
� Provide a fact based assessment and offer recommendations on near-term, mid-term, and long term strategies to improve and optimize international trade activities for the maximum economic benefit to Louisiana
� Review studies� Conduct interviews� Collect and normalize data
� Develop transportation cost model� Assess trade data � Assess market factors � Assess infrastructure factors � Evaluate competing ports on relative
position within the market
� Develop near-term, mid-term, long-term strategies for increasing economic growth considering existing regional assets
Study objectives and our approach
Southeast Louisiana
AnalysisAnalysis
22
Data GatheringData Gathering
11
RecommendationsRecommendations
33
Executive Summary 3
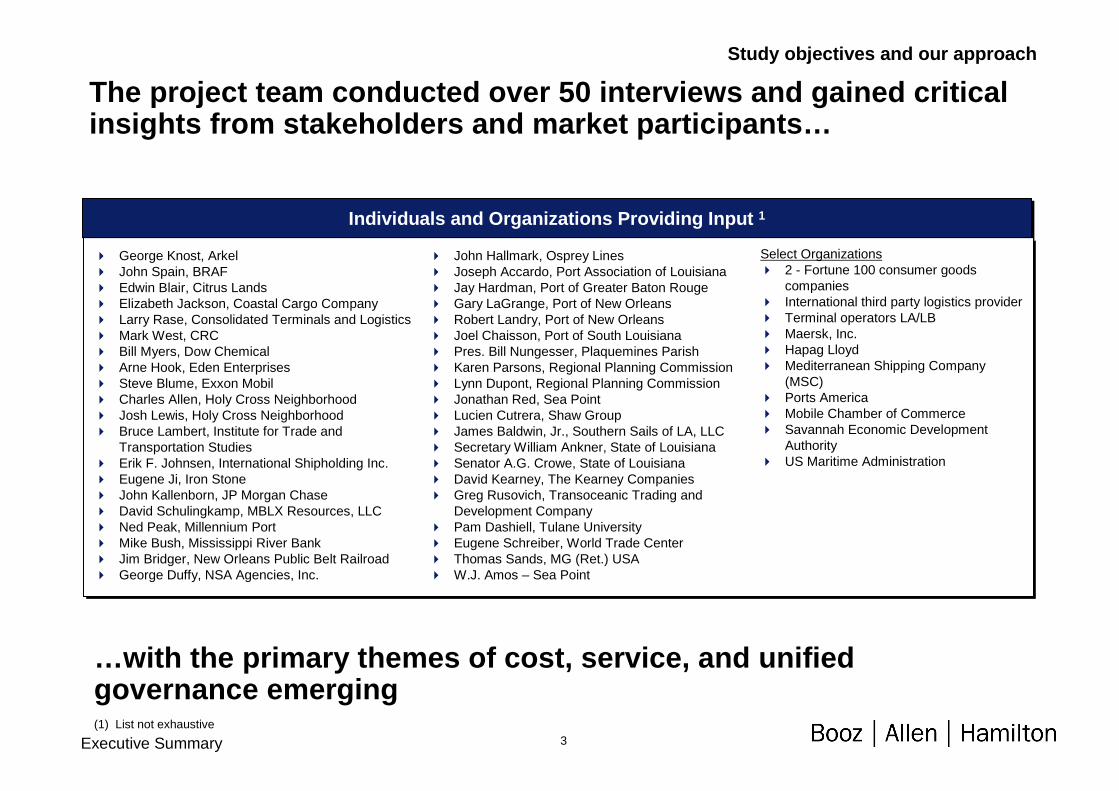
Individuals and Organizations Providing Input 1Individuals and Organizations Providing Input 1
� George Knost, Arkel� John Spain, BRAF� Edwin Blair, Citrus Lands� Elizabeth Jackson, Coastal Cargo Company� Larry Rase, Consolidated Terminals and Logistics� Mark West, CRC� Bill Myers, Dow Chemical� Arne Hook, Eden Enterprises� Steve Blume, Exxon Mobil� Charles Allen, Holy Cross Neighborhood� Josh Lewis, Holy Cross Neighborhood� Bruce Lambert, Institute for Trade and
Transportation Studies� Erik F. Johnsen, International Shipholding Inc.� Eugene Ji, Iron Stone� John Kallenborn, JP Morgan Chase� David Schulingkamp, MBLX Resources, LLC� Ned Peak, Millennium Port� Mike Bush, Mississippi River Bank� Jim Bridger, New Orleans Public Belt Railroad� George Duffy, NSA Agencies, Inc.
� John Hallmark, Osprey Lines� Joseph Accardo, Port Association of Louisiana� Jay Hardman, Port of Greater Baton Rouge� Gary LaGrange, Port of New Orleans� Robert Landry, Port of New Orleans� Joel Chaisson, Port of South Louisiana� Pres. Bill Nungesser, Plaquemines Parish� Karen Parsons, Regional Planning Commission� Lynn Dupont, Regional Planning Commission� Jonathan Red, Sea Point� Lucien Cutrera, Shaw Group � James Baldwin, Jr., Southern Sails of LA, LLC� Secretary William Ankner, State of Louisiana� Senator A.G. Crowe, State of Louisiana� David Kearney, The Kearney Companies� Greg Rusovich, Transoceanic Trading and
Development Company� Pam Dashiell, Tulane University� Eugene Schreiber, World Trade Center� Thomas Sands, MG (Ret.) USA� W.J. Amos – Sea Point
Select Organizations� 2 - Fortune 100 consumer goods
companies� International third party logistics provider� Terminal operators LA/LB� Maersk, Inc.� Hapag Lloyd� Mediterranean Shipping Company
(MSC)� Ports America� Mobile Chamber of Commerce� Savannah Economic Development
Authority� US Maritime Administration
The project team conducted over 50 interviews and g ained critical insights from stakeholders and market participants…
…with the primary themes of cost, service, and unif ied governance emerging
Study objectives and our approach
(1) List not exhaustive

Executive Summary 4
� The region lacks a unified vision on the trade and transportation industries
– No clear view on which markets to pursue; no strategic focus
– Too many local competing projects with no mechanism to determine what’s best for the region as a whole
� The region lacks a cohesive marketing strategy focused on select commodities, countries, and industry segments that can provide growth opportunities and direct economic impact; no tactical focus
� Southeast Louisiana is cost and service competitive on North - South (Latin America) trade, and therefore should be the primary focus
� East – West trade can be pursued on an opportunistic basis, potentially around specific global commodities (petrochemical, agriculture products, etc.)
– Sizeable market, but highly competitive
– The region’s cost and service is less competitive
� The existing port infrastructure is inadequate for potential container growth
� Current warehouse space is inadequate to support industrial or trade related growth
The key learnings from the study focus on opportuni ties related to governance, marketing, and infrastructure;all with the intent of driving economic growth
Key learnings
GovernanceGovernance
MarketingMarketing
InfrastructureInfrastructure

Executive Summary 5
A cost model was developed to run three scenarios t o identify natural logistical advantages and better understand Southeast Louisiana’s position relative to competing regions
Cost model
Level Playing Field
Level Playing Field
11
Normalized Market RatesNormalized
Market Rates
22
Impact of External Factors
Impact of External Factors
33
Puerto Cortes,Honduras
Santos,Brazil
Veracruz,Mexico
Rotterdam,Netherlands
Shanghai,China
Valparaiso,Chile
Description : All link costs by mode were set as being equal
Description : Normalized published transportation rates for import/export by link
Description : Determine the level of advantage/disadvantage per forty foot unit (FFE) unit for a given route
US PortsUS Ports
� Savannah
� New Orleans
� Houston
� Miami
� Los Angeles/Long Beach
� Savannah
� New Orleans
� Houston
� Miami
� Los Angeles/Long Beach
Foreign PortsForeign Ports
� Shanghai, CN
� Veracruz, MX
� Puerto Cortes, HN
� Valparaiso, CL
� Santos, BR
� Rotterdam, NL
� Shanghai, CN
� Veracruz, MX
� Puerto Cortes, HN
� Valparaiso, CL
� Santos, BR
� Rotterdam, NL
Global average rate per mile by mode
Global average rate per mile by mode
Market rate per mile by mode and lane
Market rate per mile by mode and lane
Southeast Louisiana $200 per FFE discount
Southeast Louisiana $200 per FFE discount

Executive Summary 6
In a level playing field scenario, Southeast Louisi ana has a cost advantage mainly in the lower Mississippi River cor ridor
7.3%
-18.1%
6.7%
-1.4%
8.0%
-7.1%
4.2%
-5.6%
-19.7%
-27.4%
-11.3%
-9.8%
0.1%
1.1%
-11.6%
Valparaiso,Chile
8.8%-13.9%-4.9%2.0%12.4%St. Louis
-66.0%-8.7%-5.0%-18.2%-48.9%Shreveport
7.5%-13.2%-4.5%1.8%10.7%Peoria
7.9%-1.8%-16.5%-7.3%0.8%Nashville
11.6%-1.5%-5.5%2.2%15.7%Memphis
-3.2%-13.0%-22.0%-13.8%-9.9%Louisville
1.3%0.0%-2.1%4.4%6.6%Little Rock
-0.6%-2.1%-20.3%-11.5%-7.1%Lexington
-47.9%-37.2%-10.9%-19.8%-39.3%Kansas City
-85.1%-13.6%-8.1%-27.7%-67.5%Dallas
-10.7%-4.7%-29.8%-19.6%-19.8%Columbus GA
-7.9%-10.6%-25.8%-17.0%-15.2%Cincinnati
8.8%-14.4%-12.8%-5.6%3.1%Chicago
14.8%1.5%-15.0%-6.0%6.6%Birmingham
-11.1%-4.7%-31.3%-20.4%-21.5%Atlanta
Veracruz,Mexico
Shanghai,China
Santos,Brazil
Rotterdam,Netherlands
Puerto Cortes,Honduras
Cost model – Level playing field
Note: Competitive field is defined as the ports of LA/LB, Savannah, Miami, and Houston
Percent Cost Difference Between Southeast Louisiana and the Competitive Field – Scenario 1
Positive numbers indicate a Southeast Louisiana advantagePositive numbers indicate a Southeast Louisiana advantage

Executive Summary 7
With normalized market rates, Southeast Louisiana i s disadvantaged with respect to East - West trade
2.8%
-22.8%
2.5%
3.1%
6.9%
-8.7%
1.6%
-9.0%
-23.2%
-57.0%
-7.0%
-11.2%
-4.0%
0.6%
-13.5%
Valparaiso,Chile
-3.1%-69.4%10.4%-4.9%4.3%St. Louis
-51.1%-44.2%10.9%-5.1%-31.0%Shreveport
-2.6%-62.0%9.3%-4.2%3.7%Peoria
-2.6%-45.6%7.3%-5.5%4.7%Nashville
2.4%-46.2%11.5%-5.5%9.9%Memphis
-2.7%-63.3%-4.3%-23.6%3.8%Louisville
3.5%-49.2%5.3%-12.2%9.8%Little Rock
-2.1%-40.7%-4.8%-19.6%3.9%Lexington
-41.9%-100.6%-0.1%-15.7%-29.0%Kansas City
-104.1%-79.7%-11.8%-30.8%-76.8%Dallas
2.1%-43.3%-2.2%-23.9%8.8%Columbus GA
-1.9%-63.4%-6.4%-27.2%4.4%Cincinnati
-3.6%-70.0%-0.1%-17.8%3.1%Chicago
27.9%-25.9%4.9%-15.8%19.5%Birmingham
14.9%-34.9%-7.6%-33.5%5.4%Atlanta
Veracruz,Mexico
Shanghai,China
Santos,Brazil
Rotterdam,Netherlands
Puerto Cortes,Honduras
Percent Cost Difference Between Southeast Louisiana and the Competitive Field – Scenario 2
Cost model – Normalized market rates
Note: Competitive field is defined as the ports of LA/LB, Savannah, Miami, and HoustonPositive numbers indicate a Southeast Louisiana advantagePositive numbers indicate a Southeast Louisiana advantage

Executive Summary 8
A per FFE advantage of $200 would increase Southeas t Louisiana’s competitiveness in Latin America and with the Rotte rdam trade
7.5%
-16.6%
6.6%
7.7%
12.0%
-4.0%
6.3%
-4.6%
-18.4%
-51.2%
-1.8%
-6.4%
0.5%
6.1%
-7.6%
Valparaiso,Chile
3.7%-65.4%14.5%0.1%10.3%St. Louis
-40.3%-40.7%15.2%0.1%-22.2%Shreveport
3.1%-58.5%12.9%0.1%8.7%Peoria
4.1%-42.2%11.5%-0.4%10.5%Nashville
10.1%-42.6%16.1%0.1%16.4%Memphis
3.2%-59.7%0.0%-18.3%9.0%Louisville
10.0%-45.7%9.7%-6.9%15.4%Little Rock
3.3%-37.7%-0.7%-14.7%8.7%Lexington
-34.9%-96.4%3.7%-11.2%-22.9%Kansas City
-94.6%-76.1%-7.9%-26.1%-69.0%Dallas
8.9%-39.9%2.6%-17.9%14.7%Columbus GA
4.1%-59.8%-2.0%-21.7%9.7%Cincinnati
2.4%-66.3%4.1%-12.7%8.4%Chicago
33.7%-22.8%9.9%-9.5%25.5%Birmingham
21.1%-31.6%-2.3%-26.7%11.8%Atlanta
Veracruz,Mexico
Shanghai,China
Santos,Brazil
Rotterdam,Netherlands
Puerto Cortes,Honduras
Percent Advantage/Disadvantage per FFE for Southeas t Louisiana – Scenario 3
Cost model – Impact of external factors
Note: Competitive field is defined as the ports of LA/LB, Savannah, Miami, and HoustonFFE – Forty foot equivalent
Positive numbers indicate a Southeast Louisiana advantagePositive numbers indicate a Southeast Louisiana advantage

Executive Summary 9
Trade with Latin America and Mexico presents a size able opportunity with ~141 million metric tons of contai nerized and non-containerized freight coming through competing gulf ports
Latin America and Mexico Container Trade Opportunity by Region
(Million Metric Tons - 2008)
42
3
1
1
1
3
11
2
1
2
15
0
3
6
9
12
15
18
21
24
Central East Gulf North West South West
~7
~23
~3
Mill
ion
Met
ric T
ons
~1
~4
Latin America and Mexico Non-Container Trade Opportunity by Region
(Million Metric Tons - 2008)
72 5
25
6
660
15
7
66
85
0
20
40
60
80
100
120
140
Central East Gulf North West South West
~134
~123
~13M
illio
n M
etric
Ton
s~8
~28
Central America Caribbean Mexico South America
(1) US Census Foreign Trade Statistics, 2008(2) Southeast Louisiana volumes excluded from graphs
Trade assessment
(US Port Regions) (US Port Regions)

Executive Summary 10
Latin America’s growth in trade has exceeded that o f Asia, Western Europe, and North America in recent years
(1) IHS Global Insight World Industry Forecasts, January 2009
Trade assessment
-18-12
-6
06
12
18
24
3036
42
2001 2002 2003 2004 2005 2006 2007 2008
Latin America
Asia
North America
Western Europe
-18
-12
-6
0
6
12
18
24
30
36
42
2001 2002 2003 2004 2005 2006 2007 2008
North America Latin America Western Europe Asia
Year over Year Growth of Regional Imports (US $)(2001 – 2008)
Year over Year Growth of Regional Exports (US $)(2001 – 2008)
Latin AmericaWestern Europe
North America
Asia
Latin America Imports~13% CAGR(2001-2008)
Latin America Imports~13% CAGR(2001-2008)
Latin America Exports~15% CAGR(2001-2008)
Latin America Exports~15% CAGR(2001-2008)
Gro
wth
Rat
e (Y
ear
over
Yea
r)G
row
th R
ate
(Yea
r ov
er Y
ear)

Executive Summary 11
0.2 0.2 0.5 0.4
1
2.5
4
012345
LosAngeles
Miami Houston Savannah Mobile NewOrleans
BatonRouge
13
14
15
16
17
17
186
24
47
203
0
100
200
300
LosAngeles
Miami Houston Savannah Mobile NewOrleans
BatonRouge
13
16
19
22
25
244
397
332 6 3
988
0
100
200
300
400
500
LosAngeles
Miami Houston Savannah Mobile NewOrleans
BatonRouge
2
4
6
8
Total Office Space (Millions of Sqr. Ft.)
Average Cost Per Sqr. Ft.
Total Industrial Space (Millions of Sqr. Ft.)
Labor Force (Millions)
Average Hourly Wage
Average Cost Per Sqr. Ft.
Southeast Louisiana is well positioned in the avera ge hourly wage category, but is lacking in industrial space to sup port near-term growth
Business climate assessment
Across all metrics, the region lacks scale, but is competitive
on a cost per unit basis
Across all metrics, the region lacks scale, but is competitive
on a cost per unit basis
988
Source: Cushman & Wakefield, Grubb & Ellis, CB Richard Ellis, US Bureau of Labor and Statistics

Executive Summary 12
When compared to its peers, Southeast Louisiana’s a ssets are adequate: exports are a strength, while the river i s both a strength and a limiting factor
• MIA (Hub)
• None
• Cruise congestion
• Local market• Established LATAM
trade network
• Large
• Limited bottlenecks
• 1
• Bottlenecks
• Florida
• Vehicles• Machinery• Finished goods
• Latin America, Asia
• Local landlord
• 66% export
• ~1.4 MMT
• 53% import
• 0.7
Miami
• ATL (Hub) + SAV• MOB (Small)• IAH (Major Hub)• LAX (Major Hub)• MSY (Small)Airport
• 16• None• 2• 9 (LB), 8 (LA)• 2 PNOForeign Sales/Reps
• Limited local demand• Small local markets• Ship channel• Congestion• River transit• Limited local demand
Disadvantages
• Integrated marketing• Nearby distribution centers
• Growing industry• Expansion
• Local market• Petro business• Exports
• Mega local market• Rail connectivity• Imbalance toward imports
• River for bulks• Local petro industry• Strong exports
Advantages
• Large (Atlanta)• Small• Large• Mega• SmallLocal markets
• 2• 5• 2• 2• 6Railroads served
• Limited bottlenecks• No bottlenecks• Minor bottlenecks (to/from Mexico)
• Major bottlenecks• Limited bottlenecksRail connectivity to hinterlands
• No bottlenecks• No bottlenecks• Bottlenecks• Major bottlenecks• Minor bottlenecksHighway connections
• Atlanta• Alabama• Nashville
• Texas, OK• Southwest• Chicago
• Baton RougeInland Markets
• Finished goods• Forest products• Salt
• Petroleum• Forest products• Auto
• Petroleum• Plastics• Chemical
• Finished goods• Petroleum• Vehicles
• Petroleum• Chemical• Agriculture
Key commodities
• 53% export• 74% import• 58% export• 68% import• 65% exportsContainer traffic balance
• Latin America, Europe
• Local, operator
• 65% import
• ~77.9 MMT
• 1.4
Houston
• Asia
• Local, landlord
• 72% import
• ~90.3 MMT
• 14
LA/LB
• Asia, Europe• Latin America, Asia• Latin AmericaPrimary markets
• State-owned, operator• State-owned, landlord• Local, landlordManagement
• 70% import• 61% import• 56% exportsNon-container balance
• ~14 MMT• ~32 MMT• ~90 MMTNon-container scale
• 3• 0.1• 0.3Container traffic scale (millions)
SavannahMobileSE LouisianaCategory
Comparative Assessment of Regional Infrastructure
Infrastructure assessment
Source: Port authorities, BAH analysis, interviews

Executive Summary 13
Southeast Louisiana’s key strength rests with non-c ontainerized trade, while a lack of industrial and consumer dema nd is the leading weakness
�Lack of regional demand – consumer and industrial�Limited near term container capacity�Lack of inland infrastructure found in competing regions – i.e.,
centralized intermodal transfer facilities and warehousing�Negative perceptions by the market�Lack of a unified goods movement strategy focused on driving
economic growth based upon the interconnectivity of regional assets
�Lack of a unified regional marketing strategy�Lack of unified port governance from Baton Rouge through to
Gulf of Mexico
Weaknesses
�Bulk and break bulk freight markets – agriculture, coal, petroleum, chemicals – good base of export tonnage
�Mississippi River connectivity to inland US and international locations – bulk goods movement
�PNO Napoleon Avenue Terminal receives 10 container calls per week – primarily from Latin America
� Inland transportation infrastructure - Six Class I railroads interstate highway connectivity
�Historical trade ties with Latin America�SE Louisiana is closer than Houston when coming into the Gulf
Strengths
Southeast Louisiana Strengths, Weaknesses, Opportun ities, and Threats
SWOT analysis
�Continued expansion of Gulf coast ports�Loss of existing trade related business to rising regional
competitors�West Coast ports such as Prince Rupert, Seattle/Tacoma,
Oakland, and Mexican ports such as Lazaro Cardenas could continue to capture East-West traffic from Asia to Central US
�East Coast ports such as NY/NJ, Norfolk, and Savannah continue to capture East-West traffic from Europe to Central US
Threats
�Near-term and long-term diversion opportunities oriented toward Latin America and Mexico with containerized cargo
�Well positioned to focus on select industries/commodities with aniche differentiation strategy rather than focusing on a broad market scope strategy
Opportunities

Executive Summary 14
Based on our analysis, we believe Southeast Louisia na needs to adopt a clear strategy for marketing, physical infr astructure, and regional coordination
RecommendationsRecommendations
� Marketing efforts should focus on North-South trades – it is your strength, it minimizes investment risks, it is a more balanced trade
– Strategy should focus on regional shippers with Latin America and Mexico trade
– East-West can follow, but should be pursued opportunistically
� Region needs a unified “go-to-market” strategy for coordinated infrastructure investment and unified marketing
– Clear trade vision and mission for Southeast Louisiana
– Region should work with the State to build overseas trade presence
� Near term infrastructure decisions should enable tactical efficiency and be built to scale for anticipated growth
� Region should evaluate new projects on:
– Their ability to reduce cost and improve service within and through the region
– Their ability to provide significant economic benefit for the region
� Region needs coordinated governance around an infrastructure strategy – trade and non-trade infrastructure
� Create global commodity groups to ensure alignment of trade and non-trade infrastructure to specific market opportunities
Recommendations

Executive Summary 15
We believe these three strategies will enable South east Louisiana to best leverage its assets to increase internation al trade
� Continue to expand and refine regional/commodity focus
� Opportunistically pursue other trades (e.g. Europe, Asia)
� Build overseas marketing presence in priority target markets (Latin America and Mexico)
� Develop and execute against marketing plans for selected target markets
� Conduct periodic reviews of functional strategies to ensure competitive positioning is maintained – refine where necessary
� Target Latin America and Mexico traffic at the onset
� Develop and execute a go-to-market strategy based upon select commodities/industries identified
� Define Key Performance Indicators to measure strategy effectiveness
� Create global commodity focus groups around key global exports / imports– Petrochemical, Rubber, Agriculture
Go-to-Market Strategy
Focus on cargo that is aligned with regional strengths and which produces significant
economic benefit to the region
� Monitor and measure effectiveness of goods movement strategy
� Implement changes in governance� Perform independent evaluation of
regional coordination effort– Goods movement strategy
� Make necessary refinements to strategy
� Identify and assess institutional structures for coordinated governance
� Identify, or create, institution to oversee regional coordination
� Develop a goods movement strategy among the various stakeholders with specific mission, vision, and goals
Regional Coordination StrategyEnsure all stakeholders are
aligned to execute the marketing and infrastructure objectives of
the SE Louisiana
� Evaluate near term infrastructure improvements against mid-term infrastructure needs
� Ensure near-term investments are aligned with regional strategies - go-to-market and goods movement
� Develop infrastructure strategy for non-transportation infrastructure (office, warehousing, and Free Trade Zones)
Near-Term
� Identify long-term container handling capacity based on vision for the region– PNO– Alternative sites
� Ensure adequate transportation infrastructure for key global commodities
� Execute non-transportation infrastructure strategy
Medium-Term
� Build/expand incremental container capacity
Long-Term
Physical Infrastructure Strategy
Provide modern, efficient trade, and trade support infrastructure, suited to the region’s key trading
markets
Strategy
11
22
33
Recommendations

Executive Summary 16
A detailed Go-to-Market strategy focused on Latin A merica and Mexico will identify opportunities for increased fr eight volumes
�Develop regional trade vision statement�Develop regional trade mission
statement
Step 1FocusStep 1Focus
Step 2Find
Step 2Find
�Identify country and commodity opportunities�Perform market scan of domestic companies �Segment addressable market �Identify trade policies – FTZ, subsidies,
incentives�Identify and evaluate value added activities
Step 4ExecuteStep 4
Execute
�Establish overseas presence serving prioritized trade lanes
�Segment select overseas markets�Develop overseas strategic communications
plan
Step 3Plan
Step 3Plan
�Develop implementation plan�Assess capabilities required to implement the
plan�Develop domestic strategic communications
plan
Key Near-Term Steps in Developing a Go-to-Market Strategy
Recommendations – Go-to-market
Potential Import/Export Diversion Opportunities between Brazil and Mobile/Houston
Santos,Brazil
Inland Target Market
71,100
397,657
97,482
139,775
ShortTons 1
102
568
140
200
Number of TEUs per 1% increase in
market share 2
Ceramic Products
Stone, Plaster, CementImports
Rubber
Plastics
Containerized Commodity
Exports
(1) US Census Foreign Trade Statistics, 2008(2) Assumes 7 short tons per TEU, annualized number of TEUsNote: Detailed breakout of Gulf coast, commodity, and country trade data is contained in the supplemental data workbook
11

Executive Summary 17
We believe these are the ideal infrastructure attri butes that should be in place for future port projects
Ideal Infrastructure Attributes for ConsiderationIdeal Infrastructure Attributes for Consideration
� River transit <4 hours
� Ample space to support long term terminal expansion goals
� Ample space to support inland infrastructure expansion goals – industrial/warehousing space, transload capability, rail yards, roads, and trucking terminals
� On dock rail or barge connectivity – i.e., Intermodal Container Transfer Facility
� Support modern terminal efficiency standards
� Terminals to accommodate post-panamax vessels
� Enable green port operations – e.g., cold ironing of vessels
� Synergies with bulk and break-bulk
� Inter-terminal competition
� Rail competition
Recommendations – Physical infrastructure22

Executive Summary 18
The decision to expand PNO or build a new port come s down to timing, cost, and the ability of one project to sat isfy the key attributes
� Can plan competition in new terminal
� Multiple railroads through belt
� Competing terminal operators
� Multiple railroads through belt, CN currently favored
Competition
� Uncertain whether gulf services will be on larger vessels
� Container traffic will be isolated from non-container
� All within a relative close proximity, but separate terminals
Synergies with other port traffic (bulk, break-bulk)
� Depends on trade routes pursued
� Can build for larger vessels
� LimitedVessel size
� Build from scratch is easier to better design for efficiency
� None in place, will be costly
� Opportunity to locate adjacent to port
� Region needs more
� Timing is critical� Must be more efficient
than Phase 3 project
� Only if build downriver from PNO
Build New Port
� Environmental considerations also growing in importance (e.g. vessels idle at berth)
� Needs modernization, more difficult to retrofitModern, efficient
terminal
� Barge competitiveness with rail is unproven, but has potential
� Rail, barge, and road in place, but need upgrading
Inland connectivity
� Some advantages with being adjacent to port, but not essential
� No opportunity to locate near port
Inland infrastructure proximity
� Regional problem, not a port problem with regards to availability
� Some warehousing at Napoleon Ave
� Region needs more
Inland infrastructure availability
� Need available capacity to go after markets in all stages – currently not enough available
� Limited, only up to 1.36 M TEUs (Napoleon Ave Phase 3)
Space for terminal expansion
� No opportunity
Expand Existing Port
� New project must improve� Must balance added inland
cost
Comment
Reduced river transit
Attribute
Qualitative Assessment of Build versus ExpandStrategy Implications
Pursue Napoleon Avenue Phase 2 to ensure near-term capacity in order to go after new markets (lock-in traffic before Gulfport builds, Mobile expands)
Pursue Napoleon Avenue Phase 2 to ensure near-term capacity in order to go after new markets (lock-in traffic before Gulfport builds, Mobile expands)
Using attribute list (previous slide), determine best alternative location (focus on one project)
• Downriver from PNO• Efficient $/acre incremental capacity (includes
inland costs)• Area for adjacent logistics activities• Effective connectivity (barge, rail, road)
Focus on economic benefit, not just efficiency
Determine whether new port or Napoleon Avenue Phase 3 for mid to long term, and consider timing
• Most efficient project for incremental capacity• Same or better service• Ability to handle larger vessels
Determine whether new port or Napoleon Avenue Phase 3 for mid to long term, and consider timing
• Most efficient project for incremental capacity• Same or better service• Ability to handle larger vessels
Consider alternative strategies for Napoleon Avenue if new port is built (examples)
• Niche container (e.g. rubber, petrochemical)• Revert to bulk, break-bulk with added
warehousing (on-site value add)
Consider alternative strategies for Napoleon Avenue if new port is built (examples)
• Niche container (e.g. rubber, petrochemical)• Revert to bulk, break-bulk with added
warehousing (on-site value add)
Recommendations – Physical infrastructure22
11
22
33
44
Executive Summary 19
�Poor regional coordination leads to an “unhealthy” alignment among stakeholders– Lack of accountability– Lack of action– Redundancy of institutional structures and plans
�Stronger regional coordination leads to a “healthy” alignment among stakeholders– Decision rights: clear decision rights and accountability related to trade and transportation
strategies– Information: Efficient information flows promote effective decision-making– Structure: Lean institutional structures enable the efficient implementation of plans– Motivators: Aligned motivators encourage stakeholder to pursue the right goals
�The focus region must be unified behind its core strategies to see the maximum economic benefit associated with trade and transportation
Recommendations – Regional coordination
Regional coordination has to be in place to evaluat e infrastructure trade-offs and to focus on market opportunities
33

December 22, 2009
Port Complex Market and Feasibility Analysis
This document is confidential and is exclusively intended for selected client employees. Distribution, quotations and duplications – even in the form of
extracts – for third parties is only permitted upon prior written consent of A.T. Kearney

A.T. Kearney xx/mm.yyyy/00000 2
The objective of this analysis was to analyze the competitiveness of a major container port in Louisiana
1. How attractive is Louisiana as a center for container shipping, given forecasted trade flows?
2. If the analysis shows Louisiana can be a competitive major container port, how can the State best support that goal?
Louisiana Economic Development (LED) and the Department of Transportation and Development (DOTD) asked two fundamental questions:

A.T. Kearney xx/mm.yyyy/00000 3
We received input and cooperation from key stakeholders and subject matter experts
Representative Interviews1
• Port of New Orleans
− Gary LaGrange, Pres. & CEO
− Patrick Gallwey, COO
− Robert Landry, Dir. of Marketing
− Ted Knight, Exec. Asst. for Ops.
− Matt Gresham, Leg. Liaison
− Andree Fant, Mngr. Terminal Ops.
− Terry Laughlin, N.O. Terminal
• Port of South Louisiana
− Joel Chaisson, Executive Director
• SeaPoint
− W. J. Amoss
− Jonathan Red
• Port of Baton Rouge
− Jay Hardman, Executive Director
• LIGTT
− John Vickerman
• Ports Association of Louisiana
− Joe Accardo
• State Legislators
− Sen. Joel Chaisson
− Sen. A.G. Crowe
− Sen. David Heitmeier
− Sen. Joe McPherson
− Rep. Jim Tucker
− Rep. Nita Hutter
• New Orleans Belt Railroad
− Jim Bridger, GM
− Robert Kollmar
• JPMorgan Chase
− John Kallenborn
• Non-Louisiana Ports
− Baltimore
− Charleston
− Gulfport
− Houston
− Jacksonville
− LA/Long Beach
− NY/NJ
− Oakland
− Port Everglades
− Portland
− Seattle
− Tacoma
• Plaquemines Parish
− President Billy Nungesser
− Parish Council
• Shipping Lines
− A.P. Moller-Maersk
− CMA – CGM
− American President Lines
− Hanjin
− NYK
• Railroads:
− BNSF
− CN
− KCS
• Marine Industry Experts
− Dr. Robert McCalla – Saint Mary’s University, Halifax, Nova Scotia
− Dr. Brian Slack – Concordia University, Montreal, Quebec
(1) Not a comprehensive list

A.T. Kearney xx/mm.yyyy/00000 4
We evaluated Louisiana’s competitiveness based on economics, stakeholder input and the Port Attractiveness Framework
Source: A.T. Kearney Analysis
Louisiana Stakeholders and Subject Matter Experts
Interviews
Potential Opportunity for Louisiana???
Port Attractiveness Framework
Cost & Time Economics Model
(At Sea Costs + Inland Transit Costs + Carrying Costs)
Shipping Line and Railroad Interviews
1 2
3 4

A.T. Kearney xx/mm.yyyy/00000 5
First we developed an understanding of the ocean timing and costs for five major trade lanesTime (days) and Distance (miles) for Select Global Trade Routes
North America
Latin America
Europe
Middle East
Far East Asia
Africa
South AsiaLos AngelesLouisiana
New York
HamburgShanghai
Valparaiso Santos
Mumbai
Time: 10 - 11 daysDistance: 3,968 miles
Time: 24 - 25 daysDistance: 9,394 miles
Time: 14 - 15 daysDistance: 5,593 miles
Time: 16 - 17 daysDistance: 6,534 miles
Time: 15 - 16 daysDistance: 6,077 miles
Source: AXSMarine; A.T. Kearney Analysis
Sample Trade Lanes

A.T. Kearney xx/mm.yyyy/00000 6
We segmented North America into thirteen different markets, including nine in the U.S.
Mid West
Seattle
Los Angeles
DenverChicago
Mountain Central North East
South East 2
South East 1
South West
North West
Western Canada Eastern Canada
South Central 1
Dallas
New York
Atlanta
Memphis
Louisiana
MexicoSouth Central 2
North American Markets
North West Market (Seattle)
South West Market (Los Angeles)
Mountain Central Market (Denver)
South Central 1 Market (Dallas)
South Central 2 Market (Louisiana)
Mid West Market (Chicago)
South East 1 Market (Memphis)
South East 2 Market (Atlanta)
North East Market (New York)
Eastern Canada Market
Western Canada Market
Mexico Market
Other Market (1)
Notes: (1) Other region (not shown) includes Alaska, Hawaii, Puerto Rico and US Virgin IslandsSource: AAPA; US Trade Online; A.T. Kearney Analysis

A.T. Kearney xx/mm.yyyy/00000 7
We modeled end-to-end shipping costs and time for different modes of transportation along each trade lane
Seattle
Los Angeles
Chicago
Louisiana
Shanghai to Chicago Routing:
Far East Asia
Shanghai
via Rail
via Bargevia Truck
via Truck
via Rail
via Rail
via Railvia Truckvia Bargevia Sea
via Sea
via Sea
via Sea
Mode of Transit:
from port to destination
Low Cost Route: via
Seattle
Los Angeles Route Louisiana Route
Time (days) Time (days)
Cost Diff. ($)
Time (days)
Cost Diff.($)
Rail 17 - 21 19-23 +7-8% 28-35 +29-35%Truck - 17-21 +59-73% 27-34 +51-63%Barge - - - 36-43 +27-33%
Cost Analysis:
Source: AXSMarine; PC Rail; US Coast Guard; A.T. Kearney Analysis
Example
A.T. Kearney xx/mm.yyyy/00000 8
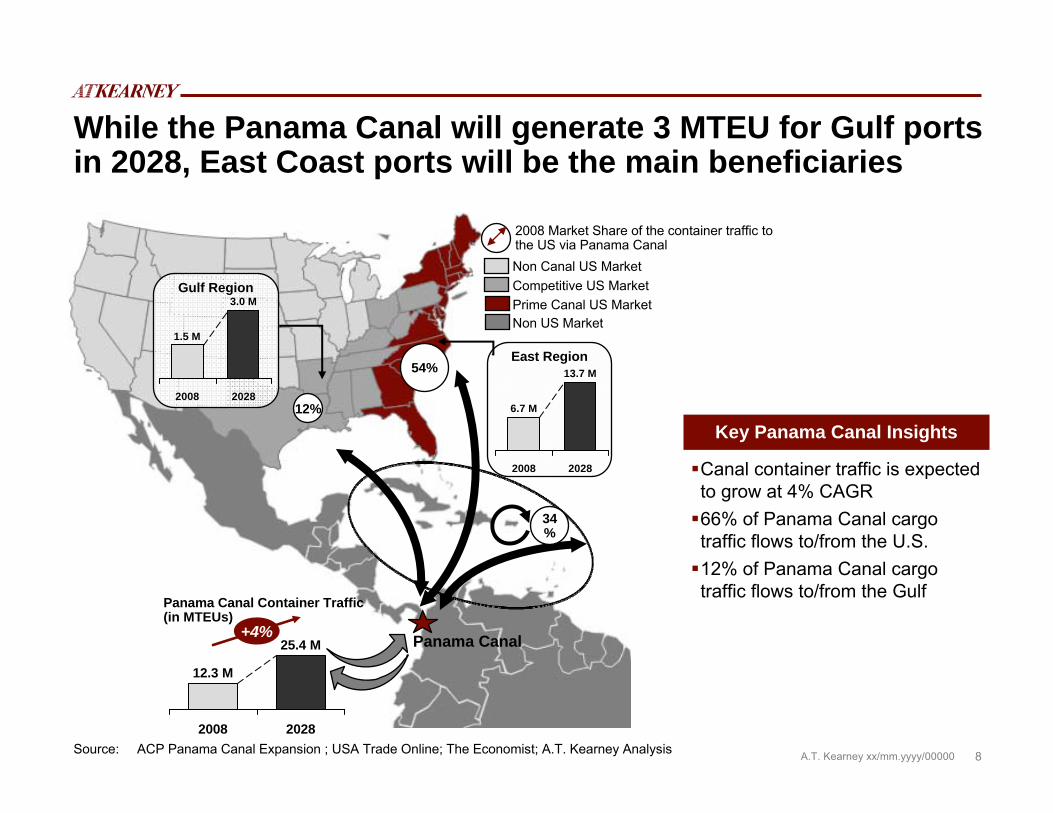
While the Panama Canal will generate 3 MTEU for Gulf ports in 2028, East Coast ports will be the main beneficiaries
Non Canal US MarketCompetitive US MarketPrime Canal US Market
54%
12%
2008 Market Share of the container traffic to the US via Panama Canal
Non US Market
Panama Canal
Source: ACP Panama Canal Expansion ; USA Trade Online; The Economist; A.T. Kearney Analysis
+4%
2028
25.4 M
2008
12.3 M
Panama Canal Container Traffic (in MTEUs)
Gulf Region
2028
3.0 M
2008
1.5 M
Key Panama Canal Insights
Canal container traffic is expected to grow at 4% CAGR66% of Panama Canal cargo traffic flows to/from the U.S.12% of Panama Canal cargo traffic flows to/from the Gulf
East Region
2028
13.7 M
2008
6.7 M
34%
A.T. Kearney xx/mm.yyyy/00000 9
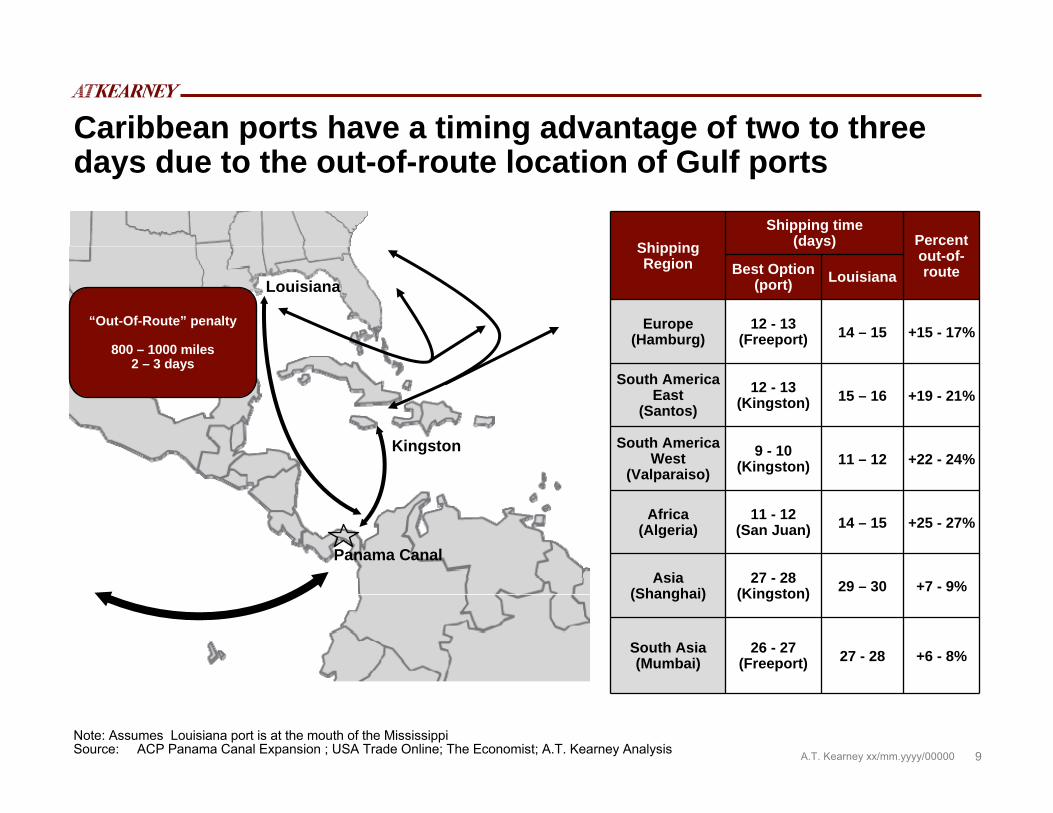
Caribbean ports have a timing advantage of two to three days due to the out-of-route location of Gulf ports
Panama Canal
Note: Assumes Louisiana port is at the mouth of the MississippiSource: ACP Panama Canal Expansion ; USA Trade Online; The Economist; A.T. Kearney Analysis
Shipping Region
Shipping time (days) Percent
out-of-routeBest Option
(port) Louisiana
Europe (Hamburg)
12 - 13(Freeport) 14 – 15 +15 - 17%
South America East
(Santos)12 - 13
(Kingston) 15 – 16 +19 - 21%
South America West
(Valparaiso)9 - 10
(Kingston) 11 – 12 +22 - 24%
Africa (Algeria)
11 - 12(San Juan) 14 – 15 +25 - 27%
Asia (Shanghai)
27 - 28(Kingston) 29 – 30 +7 - 9%
South Asia (Mumbai)
26 - 27(Freeport) 27 - 28 +6 - 8%
Kingston
Louisiana
“Out-Of-Route” penalty
800 – 1000 miles2 – 3 days

A.T. Kearney xx/mm.yyyy/00000 10
Overall, local market density and reach will continue to be the primary driver for port selection
Notes: (1) Primary MSA refers to the population of the metropolitan area where the port is located(2) Port reach that overlaps a represented competitor port excludes the overlapped port’s MSA from the population reach
Source: U.S. Census Bureau; A.T. Kearney analysis
U.S. population density and population by 400-mile port reach
Sea-TacPrimary MSA: 3.3MPopulation within
reach: 9M
Houston New Orleans
Mobile
Tampa
LA/LB
Sea-Tac
Savannah
NY/NJLA/LBPrimary MSA: 12.8M
Population within reach: 32M
HoustonPrimary MSA: 5.7MPopulation within
reach: 27M
New OrleansPrimary MSA: 1.1MPopulation within
reach: 12M
MobilePrimary MSA: 0.4MPopulation within
reach: 17.5M
TampaPrimary MSA: 2.7MPopulation within
reach: 22M
SavannahPrimary MSA: 0.3MPopulation within
reach: 23M
NY/NJPrimary MSA: 19MPopulation within
reach: 60M
400 mile port reach
Population > 250
50 < Population < 250
10 < Population < 50
Population < 10
Population per Square Mile

A.T. Kearney xx/mm.yyyy/00000 11
For traffic on the East Coast of South America (Santos) trade lane, Louisiana is competitive in most markets
Louisiana’s Regional Competitive Position – East Coast of South AmericaDestination
Market
Low Cost Route Louisiana Route
Port of Entry Time (days)
Time (days)
Cost (% diff)
North West(Seattle) Newark 19-23 20-24 +5-6%
South West(Los Angeles) Houston 18-22 18-22 +2-3%
Mountain Central(Denver) Gulfport 17-21 17-21 +4-5%
South Central 1(Dallas) Houston 15-19 15-18 +1-2%
South Central 2(Louisiana) Louisiana 14-17 14-17 +0%
Mid West(Chicago) Newark 15-18 23-28 +5-6%
South East 1(Memphis) Gulfport 15-18 18-22 +1-2%
South East 2(Atlanta) Savannah 14-17 15-18 +9-11%
North East(New York) Newark 14-17 17-21 +33-41%
Source: AXSMarine; PC Rail; US Coast Guard; A.T. Kearney Analysis
High
Medium
Low
Potential Opportunity for Louisiana

A.T. Kearney xx/mm.yyyy/00000 12
For traffic on the West Coast of South America (Valparaiso) trade lane, Louisiana is competitive in many markets
Destination Market
Low Cost Route Louisiana Route
Port of Entry Time (days)
Time (days)
Cost (% diff)
North West(Seattle) Seattle 16-19 16-20 +14-17%
South West(Los Angeles) Los Angeles 13-16 14-17 +18-22%
Mountain Central(Denver) Gulfport 14-17 14-17 +4-5%
South Central 1(Dallas) Houston 12-14 12-14 +2-3%
South Central 2(Louisiana) Louisiana 11-13 11-13 +0%
Mid West(Chicago) Louisiana 20-24 20-24 +0%
South East 1(Memphis) Gulfport 11-14 15-18 +0%
South East 2(Atlanta) Mobile 11-14 12-14 +3-4%
North East(New York) Newark 13-16 14-17 +14-18%
Source: AXSMarine; PC Rail; US Coast Guard; A.T. Kearney Analysis
Louisiana’s Regional Competitive Position – West Coast of South America
High
Medium
Low
Potential Opportunity for Louisiana

A.T. Kearney xx/mm.yyyy/00000 13
For traffic on the Europe (Hamburg) trade lane, Louisiana is competitive in South West and South Central markets
Destination Market
Low Cost Route Louisiana Route
Port of Entry Time (days)
Time (days)
Cost (% diff)
North West(Seattle) Newark 14-18 18-22 +18-23%
South West(Los Angeles) Houston 16-20 16-20 +2-4%
Mountain Central(Denver) Newark 12-16 16-20 +20-24%
South Central 1(Dallas) Houston 14-18 13-17 +1-3%
South Central 2(Louisiana) Louisiana 13-17 13-17 0%
Mid West(Chicago) Newark 10-14 22-26 +27-34%
South East 1(Memphis) Norfolk 10-14 18-22 +11-15%
South East 2(Atlanta) Norfolk 10-14 13-17 +25-31%
North East(New York) Newark 9-11 16-20 +82-100%
Source: AXSMarine; PC Rail; US Coast Guard; A.T. Kearney Analysis
Louisiana’s Regional Competitive Position - Europe
High
Medium
Low
Potential Opportunity for Louisiana

A.T. Kearney xx/mm.yyyy/00000 14
For traffic on the South Asia (Mumbai) trade lane, Louisiana is competitive in its own and two adjacent markets
Destination Market
Low Cost Route Louisiana Route
Port of Entry Time (days)
Time (days)
Cost (% diff)
North West(Seattle) Seattle 25-30 31-37 +45-55%
South West(Los Angeles) Los Angeles 27-33 29-35 +22-26%
Mountain Central(Denver) Newark 25-31 29-35 +8-10%
South Central 1(Dallas) Houston 27-33 26-32 +1-3%
South Central 2(Louisiana) Louisiana 25-31 25-31 0%
Mid West(Chicago) Newark 23-29 34-42 +11-15%
South East 1(Memphis) Savannah 25-29 29-35 +3-5%
South East 2(Atlanta) Savannah 24-29 27-33 +12-16%
North East(New York) Newark 22-27 29-35 +39-47%
Source: AXSMarine; PC Rail; US Coast Guard; A.T. Kearney Analysis
Louisiana’s Regional Competitive Position – South Asia
High
Medium
Low
Potential Opportunity for Louisiana

A.T. Kearney xx/mm.yyyy/00000 15
For traffic on the Far East (Shanghai) trade lane, Louisiana is competitive in only one market
Destination Market
Low Cost Route Louisiana Route
Port of Entry Time (days)
Time (days)
Cost (% diff)
North West(Seattle) Seattle 13-16 31-38 +180-220%
South West(Los Angeles) Los Angeles 15-19 30-36 +120-145%
Mountain Central(Denver) Seattle 16-20 30-36 +63-77%
South Central 1(Dallas) Los Angeles 18-22 27-33 +30-36%
South Central 2(Louisiana) Los Angeles 19-23 27-33 +9-11%
Mid West(Chicago) Seattle 18-22 36-43 +27-33%
South East 1(Memphis) Los Angeles 19-23 31-37 +16-20%
South East 2(Atlanta) Los Angeles 20-24 27-33 +8-10%
North East(New York) Seattle 20-24 30-36 +24-28%
Source: AXSMarine; PC Rail; US Coast Guard; A.T. Kearney Analysis
Louisiana’s Regional Competitive Position – Far East Asia
High
Medium
Low
Potential Opportunity for Louisiana

A.T. Kearney xx/mm.yyyy/00000 16
Louisiana’s opportunity for growth relies on capturing share from select markets
Source: A.T. Kearney analysis
U.S. Destination Market
Far East Asia
South Asia Europe
South America
(East)
South America(West)
Other Regions Total
North West 1.7 0.4 0.4 0.1 0.3 0.3 3.2
South West 7.5 1.8 2.0 0.6 1.2 1.2 14.3
Mountain Central 2.0 0.5 0.6 0.2 0.3 0.3 3.9
South Central 1 4.4 1.1 1.2 0.4 0.7 0.7 8.4
South Central 2 0.9 0.2 0.2 0.1 0.1 0.2 1.7
Midwest 9.6 2.3 2.6 0.8 1.5 1.6 18.3
South East 1 1.7 0.4 0.5 0.1 0.3 0.3 3.2
South East 2 5.6 1.3 1.5 0.5 0.9 0.9 10.7
North East 12.7 3.0 3.4 1.1 2.0 2.1 24.2
Other U.S. 0.3 0.1 0.1 0.0 0.1 0.1 0.6
Western Canada 2.9 0.7 0.8 0.2 0.5 0.5 5.6
Eastern Canada 2.2 0.5 0.6 0.2 0.3 0.4 4.1
Mexico 3.6 0.9 1.0 0.3 0.6 0.6 6.8
Total 54.9 13.2 14.7 4.6 8.5 9.1 104.9
Estimated container traffic in 2028 (millions of TEUs):
High
Medium
Low
Potential Opportunity for Louisiana:

A.T. Kearney xx/mm.yyyy/00000 17
Our analysis dispels several myths about container ports (one of two)
Topic Myth Reality
Panama Canal Expansion
• The addition of a third lane capable of accommodating Post-Panamax ships will drive a dramatic increase in container volume to the Gulf
• The expansion of the Panama Canal will increase container traffic, consistent with the current split: 12% of volume directed to the Gulf, or 3 MTEU total by 2028
• The shift to Post-Panamax ships favors ports with high local market density and therefore is likely to increase all-water routes to East Coast ports
Louisiana’s Advantage in Infrastructure
• The combination of six Class 1 railroads and the Mississippi River give Louisiana a competitive advantage other states cannot match
• Other Gulf Coast ports are also served by multiple Class 1 railroads, in some cases with better routings to the markets they serve
• The Mississippi River is a major asset for bulk shipping, but not for containers. The slow transit times associated with container-on-barge offsets some or all of the transportation cost benefits
West Coast Capacity Constraints
• West Coast ports are so capacity constrained that shipping lines will want to use a Gulf Coast port to handle the overflow
• West Coast ports will have capacity to meet all forecasted demands through 2028
• If LA/Long Beach congestion returns, shipping lines will use alternate West Coast ports or all-water routes to the East Coast before overflow reaches the Gulf Coast

A.T. Kearney xx/mm.yyyy/00000 18
Our analysis dispels several myths about container ports (two of two)
Topic Myth RealityAbility to Serve Midwestern Markets
• A Louisiana container port can compete with West Coast and East Coast ports to serve large Midwestern Markets such as Chicago
• A container routing through Louisiana to the upper Midwest is economically uncompetitive compared to current alternatives
State Investment in Infrastructure
• Louisiana should make a significant investment in container port infrastructure to stay competitive with other Gulf Coast states
• State investment in additional container port capacity would address only the supply side of the equation, and the Gulf Coast already has excess port capacity
• Analysis of the demand for a Louisiana container port shows competitiveness on two trade lanes, with growth to 660,000 TEUs by 2028—volumes at this level do not require a major state investment

A.T. Kearney xx/mm.yyyy/00000 19
Traffic Category Throughput (1)
Volume Rationale
North America 2008 50 MTEU • Volume is actual data reported by AAPA
North America 2009 37 MTEU• Captures the impact of the recession• Full-year volume is estimated using actual drop
(26%) in trade from Q308 to Q109
North America 2028 105 MTEU
• 5.6% CAGR from 2009-2028 was developed using historical data
• Adjustments were made for forward-looking events and a GDP growth of 2.5%
West Coast 2028 54 MTEU • West Coast will continue to grow, but slower than past years
Gulf Coast 2028 9 MTEU• Gulf Coast will have the highest overall growth• Considered impact of Panama Canal expansion
East Coast 2028 42 MTEU
• East Coast will grow at about the same rate as the West Coast
• Considered the impact of the Panama Canal expansion and an increase in “all water” routing
Louisiana 2028 660 K TEU • Louisiana will maintain 7% share of Gulf Traffic
Highlights of Key Throughput Volumes: 2008-2028
Source: (1) Includes import and export flow of loaded and empty containers

A.T. Kearney xx/mm.yyyy/00000 20
Highlights of Supporting Rationale for Forecast
The West Coast ports will expand their capacity to meet traffic needs through 2028• West Coast ports have a current capacity of 41 MTEU • Interviews with port officials and public announcements revealed that West Coast capacity will expand to 70
MTEU by 2028• Expansion is being undertaken at several West Coast ports: Prince Rupert, Vancouver, Tacoma, LA/LB, and
Manzanillo
The Panama Canal expansion will increase traffic to the Gulf• Panama Canal traffic will increase from 12 MTEU to 25 MTEU by 2028 according to the following split: Gulf
Coast - 12%, East Coast - 54%, Transshipment/Other - 34%• Increased use of larger Post-Panamax ships is expected
– Shippers will shift to larger ports with high local market density (e.g. Houston vs. other smaller Gulf ports)– Economics will favor an increase in “all-water” routes to East Coast ports
Caribbean ports are advantaged for transshipment traffic• Caribbean ports have an “in-route” advantage (i.e. 800-1,000 miles and 2-3 days transit time versus Gulf ports)• All shipping lines interviewed indicated that there would be challenging economics for a Gulf transshipment port• Caribbean ports enjoy low labor cost• Caribbean ports are planning to almost double their capacity by 2028
The Mississippi inland waterway container-on-barge traffic is advantaged only for select commodities• Mississippi inland waterway is well suited for bulk/barge traffic, particularly for downriver movement• Container-on-barge is marginally advantaged for low value commodities to select markets (e.g. Memphis)• Container-on-barge for medium and high value commodities are disadvantaged on total landed cost economics• A strong competitive response from rail and trucking competitors is likely
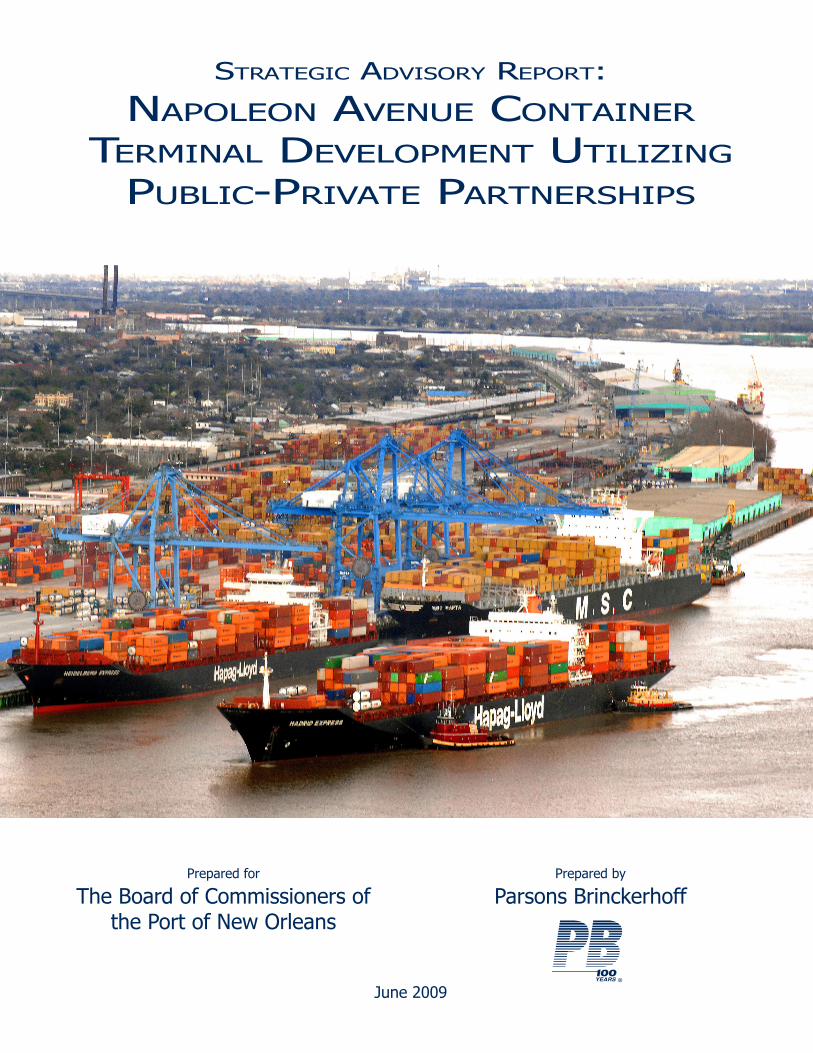
Prepared for
The Board of Commissioners ofthe Port of New Orleans
Prepared by
Parsons Brinckerhoff
Strategic Advisory Report:Napoleon Avenue Container
Terminal Development UtilizingPublic-Private Partnerships
Strategic adviSory report:
NapoleoN aveNue coNtaiNer termiNal developmeNt utiliziNg
public-private partNerShipS
June 2009

Strategic Advisory Report: Napoleon Avenue Container Terminal Development Utilizing Public-Private Partnerships
Prepared for: The Board of Commissioners of the Port of New Orleans
June 2009

PORT OF NEW ORLEANS STRATEGIC ADVISORY REPORT
NAPOLEON AVENUE CONTAINER TERMINAL DEVELOPMENT UTILIZING PUBLIC-PRIVATE PARTNERSHIPS
Table of Contents
i
Table of Contents
1 Executive Summary..................................................................... ES-1
1.1 Growth Action Plan.............................................................................................. ES-1 1.2 Demand Analysis & Forecast ................................................................................ ES-3 1.3 Capacity Analysis................................................................................................. ES-7 1.4 Strategies for Capacity Enhancement .................................................................... ES-8 1.5 Potential Financing Scenarios ..............................................................................ES-10
2 Introduction ..................................................................................... 1
2.1 Port of New Orleans Background ............................................................................... 1 2.2 Master Plan 2020 and Napoleon Avenue Container Terminal Expansion ........................ 1 2.3 Statement of Objectives............................................................................................ 2 2.4 Approach................................................................................................................. 2
2.4.1 Business Case Development .............................................................................. 2 2.4.2 Capacity Enhancement Scenarios....................................................................... 3 2.4.3 PPP Structures and Financing Scenarios ............................................................. 3
3 Demand Analysis & Forecast ............................................................ 4
3.1 Overview of US container trade ................................................................................. 4 3.1.1 Personal consumption expenditures ................................................................... 5 3.1.2 Import propensity............................................................................................. 6 3.1.3 Product Sourcing .............................................................................................. 7
3.2 PONO share of US container trade/Competitive analysis .............................................. 8 3.2.1 Gulf Coast ports ............................................................................................... 9 3.2.2 East Coast Ports ............................................................................................. 11 3.2.3 West Coast ports............................................................................................ 12 3.2.4 PONO’s Competitive Position ........................................................................... 14 3.2.5 PONO’s Competitive Advantages...................................................................... 15
3.3 Summary of Forecast.............................................................................................. 18 3.3.1 Background & Historic Container Throughput.................................................... 18 3.3.2 Base Demand Forecast ................................................................................... 19
3.4 Developing New Service.......................................................................................... 21 3.4.1 Potential for New Northeast Asian Liner Service ................................................ 21 3.4.2 Incremental demand projection based on new service ....................................... 24 3.4.3 Key Actions to Capture Potential New Service ................................................... 25
PORT OF NEW ORLEANS STRATEGIC ADVISORY REPORT
NAPOLEON AVENUE CONTAINER TERMINAL DEVELOPMENT UTILIZING PUBLIC-PRIVATE PARTNERSHIPS
Table of Contents
ii
4 Capacity Analysis............................................................................ 27
4.1 Throughput Capacity Analysis Methodology .............................................................. 27 4.1.1 UTC, MPC & SPC ............................................................................................ 27 4.1.2 Capacity Modeling Approach............................................................................ 28
4.2 Model Input Variables............................................................................................. 29 4.2.1 General Terminal Variables.............................................................................. 29 4.2.2 Wharf/Berth................................................................................................... 29 4.2.3 Storage ......................................................................................................... 32 4.2.4 Gate.............................................................................................................. 33 4.2.5 Intermodal Rail .............................................................................................. 33
4.3 Existing Throughput Capacity Results....................................................................... 34 4.3.1 Limiting Component........................................................................................ 34 4.3.2 Wharf/Berth................................................................................................... 35 4.3.3 Storage ......................................................................................................... 35 4.3.4 Gate.............................................................................................................. 36 4.3.5 Intermodal..................................................................................................... 36
4.4 Base Facility Capacity (Napoleon Ave. yard only)....................................................... 37
5 Strategies for Capacity Enhancement ............................................ 40
5.1 Existing Capacity vs. Forecasted Demand Comparison ............................................... 40 5.2 Capacity Improvement Options................................................................................ 41
5.2.1 Operational Improvements (Decrease Dwell Time) ............................................ 46 5.2.2 Increase Storage Density (Varying Equipment) ................................................. 48 5.2.3 Combine Operations (Ceres & PAG) ................................................................. 51 5.2.4 Expand Existing Terminal Infrastructure (Development Stages A-D).................... 54 5.2.5 New Container Terminal (Development Stages E & F)........................................ 56
5.3 Capacity Improvement Recommendations ................................................................ 58
6 Public-Private Partnerships and Potential Financing Scenarios ..... 61
6.1 Potential investor Base for Terminal Developments ................................................... 64 6.1.1 Financial Preconditions Going Forward ............................................................. 65 6.1.2 Fairview Container Terminal at the Port of Prince Rupert – A Case Study ............ 66
6.2 Available Financing Options..................................................................................... 68 6.3 PONO’s Role in Structuring a Financeable Terminal Development ............................... 70 6.4 Recommendations.................................................................................................. 71

PORT OF NEW ORLEANS STRATEGIC ADVISORY REPORT
NAPOLEON AVENUE CONTAINER TERMINAL DEVELOPMENT UTILIZING PUBLIC-PRIVATE PARTNERSHIPS
Table of Contents
iii
Figures
Figure ES-1: Overall Demand Forecast, 2007 to 2028......................................................... ES-5 Figure ES-2: Estimated Existing Capacity vs. Forecasted Demand........................................ ES-9 Figure 3-1: US Container Trade Volumes, 1990 to 2007 (in million TEUs).................................. 4 Figure 3-2: US Consumption Share of GDP, 1990 to 2008 (in percentage) ................................ 6 Figure 3-3: US Personal Savings Rate Share of GDP, 1929 to 2008 (in percentage) ................... 6 Figure 3-4: Personal Consumption Expenditure on & Imports of Apparel, 1992 to 2007 (in billions of dollars)............................................................................................................ 7 Figure 3-5: Share of Value of US Apparel Imports by Originating Country, 1992 to 2008 ........... 8 Figure 3-6: US Container Volumes and Share of Total US Container Volumes by Region, 1995 to 2007..................................................................................................................... 13 Figure 3-7: Trade Lane Composition of New Orleans Container Throughput, 2007 ................... 18 Figure 3-8: PONO Historic Container Volumes by Trade Lane, 2003 to 2007............................ 19 Figure 3-9: Base Projection of Container Demand at PONO, 2009 to 2028 (in thousand TEUs). 20 Figure 3-10: Routing Distance of PONO versus Ports of Seattle & British Columbia for the Transportation of Shanghai Containers to Chicago .......................................................... 22 Figure 3-11: PONO’s Competitive Market for Northeast Asia-US Trade Lane Lies in the Lower Mississippi Valley...................................................................................................... 23 Figure 3-12: Barge System May Allow PONO to be Competitive for the Midwest in Terms of Low-Value commodities ...................................................................................................... 24 Figure 3-13: Overall Demand Projections for PONO, 2009 to 2028.......................................... 25 Figure 4-1: Existing Ceres Operations .................................................................................. 30 Figure 4-2: Existing Ports America Operations ...................................................................... 31 Figure 4-3: Base Ceres & PAG Operations ............................................................................ 38 Figure 5-1: Estimated Existing Capacity vs. Forecasted Demand............................................. 40 Figure 5-2: PONO Phased Development Plan (Stages A-F) ..................................................... 42 Figure 5-3: Estimated Capacity (Dwell Time Reductions) vs. Forecasted Demand .................... 48 Figure 5-4: Estimated Capacity (Increasing RTGs) vs. Forecasted Demand.............................. 50 Figure 5-5: Estimated Capacity (Combined Operator) vs. Forecasted Demand ......................... 53 Figure 5-6: Estimated Capacity (by Development Stage) vs. Forecasted Demand..................... 56 Figure 6-1: Common Public-Private Structures ...................................................................... 62

PORT OF NEW ORLEANS STRATEGIC ADVISORY REPORT
NAPOLEON AVENUE CONTAINER TERMINAL DEVELOPMENT UTILIZING PUBLIC-PRIVATE PARTNERSHIPS
Table of Contents
iv
Tables
Table ES-1: Existing Capacity Results................................................................................ ES-8 Table 3-1: Total Distance from Chicago, IL and Memphis, TN to Panama, Brazil and Chile
(in miles) .......................................................................................................... 11 Table 3-2: Total Distance from Various US Inland Cities to Bremerhaven, Germany (in miles).. 12 Table 3-3: Low-Value Containerized Commodities are Likely to Utilize the Mississippi River
Barge System at PONO....................................................................................... 16 Table 3-4: PONO Share of Louisiana Containerized Exports to Northeast Asia, 2008
(in Metric Tons and %) ...................................................................................... 23 Table 4-1: General Terminal Variables ................................................................................. 29 Table 4-2: Wharf/Berth Variables ........................................................................................ 32 Table 4-3: Storage Variables ............................................................................................... 32 Table 4-4: Gate Variables ................................................................................................... 33 Table 4-5: Intermodal Rail Variables .................................................................................... 33 Table 4-6: Existing Capacity Results .................................................................................... 35 Table 4-7: Updated Storage Variables for Base Napoleon Avenue Container Terminal Capacity 37 Table 4-8: Terminal Capacity for Base Napoleon Avenue Container Terminal........................... 39 Table 5-1: Estimated Development Costs by Stage ............................................................... 45 Table 5-2: Capacity Improvement Options ........................................................................... 46 Table 5-3: Updated Storage Variables with 10% Reduction in Dwell Times ............................. 46 Table 5-4: Updated Storage Variables with 20% Reduction in Dwell Times ............................. 47 Table 5-5: Updated Storage Variables with 30% Reduction in Dwell Times ............................. 47 Table 5-6: Updated Storage Variables with 40% Reduction in Dwell Times ............................. 47 Table 5-7: Updated Storage Variables with 50% Reduction in Dwell Times ............................. 47 Table 5-8: Storage Variables (4 RTGs at Ceres and 4 RTGs at PAG)........................................ 49 Table 5-9: Storage Variables (6 RTGs at Ceres and 6 RTGs at PAG)........................................ 49 Table 5-10: Storage Variables (8 RTGs at Ceres and 8 RTGs at PAG)...................................... 50 Table 5-11: Storage Variables (10 RTGs at Ceres and 10 RTGs at PAG) .................................. 50 Table 5-12: Combined Operator Variables (4 RTGs) .............................................................. 52 Table 5-13: Combined Operator Variables (6 RTGs) .............................................................. 52 Table 5-14: Combined Operator Variables (8 RTGs) .............................................................. 52 Table 5-15: Combined Operator Variables (10 RTGs) ............................................................ 53 Table 5-16: Stage A Variables ............................................................................................. 54 Table 5-17: Stage B Variables ............................................................................................. 54 Table 5-18: Stage C Variables ............................................................................................. 55 Table 5-19: Stage D Variables ............................................................................................. 55 Table 5-20: New Container Terminal Variables (RTG)............................................................ 57 Table 5-21: New Container Terminal Variables (Reach Stacker/Top Pick) ................................ 57 Table 5-22: New Container Terminal Variables (Chassis) ....................................................... 58 Table 5-23: Cost per TEU of Capacity by Option ................................................................... 59 Table 6-1: Prince Rupert, BC Fairview Container Terminal Phase I Funding Partners
(in Canadian $ millions)...................................................................................... 67 Table 6-2: Approximate Capital Investment for Dedicated Terminal........................................ 69

PORT OF NEW ORLEANS STRATEGIC ADVISORY REPORT
NAPOLEON AVENUE CONTAINER TERMINAL DEVELOPMENT UTILIZING PUBLIC-PRIVATE PARTNERSHIPS
Executive Summary ES-1
1 Executive Summary
Parsons Brinckerhoff (PB) was retained by the Board of Commissioners of the Port of New Orleans (PONO) to develop an independent demand forecast, evaluate throughput capacity, assess the potential of attracting additional container volumes, and identify feasible financing options for the expansion of the Napoleon Avenue Container Terminal including utilizing public-private partnerships (PPPs). The analyses undertaken by PB as part of this assignment were limited to PONO’s containerized cargo only, and did not address bulk, neo-bulk or break-bulk cargoes. This project served to provide PONO with targeted perspective of the need for and strategy for achieving implementation of terminal expansion based on projected demand and estimated capacity. Below are the summary points and key findings.
1.1 Growth Action Plan
PB’s analysis shows a clear prospect for the Port of New Orleans to attract additional container volumes and at least one and possibly two new container liner services. The Port’s growth opportunity is particularly indicated for container lines serving Northeast Asia, with a key driver for the opportunity being the Panama Canal expansion scheduled for completion in 2014. While a certain level of additional container activity could be accommodated at the existing terminal by making incremental improvements in equipment and operating procedures, a shipping line is not likely to make a significant commitment of new liner services unless it can be assured of the Port’s ability to accommodate business growth. In addition, certain carriers may only be interested in establishing new services at the Port if they have access to a dedicated terminal which they can control. As such, part of the Port’s strategy should include communicating a clear message to the shipping industry that it can accommodate growth both for existing businesses and for new shipping services.
In short, container line service expansions could add significantly to PONO’s container traffic, but such volumes are dependent on successfully building this new business through a carefully crafted strategy including the following actions:
1) Proceed with planning for expansion of the Napoleon Avenue Terminal and for a new dedicated terminal adjacent to the existing terminal. This will allow the Port to be nimble in executing its expansion plans and will demonstrate its intentions to provide the capacity to meet the needs of its customer base.
2) PB’s analysis indicates that a new terminal could attract private investment, particularly from strategic investment partners such as shipping lines. However, a new terminal and related infrastructure is not likely to be financed solely by private sector capital. Public sector investment and/or subsidy will be required to finance the terminal development costs, and such funding is therefore an essential component in a container terminal development. In parallel with terminal planning activities, the Port should identify its own available funding levels and identify and secure commitment from sources for public investment/subsidy.
3) In pursuing public funding for its terminal expansion, the Port should emphasize that the most cost-effective and expedient way the State can realize Louisiana’s containerized cargo growth opportunities is to enhance

PORT OF NEW ORLEANS STRATEGIC ADVISORY REPORT
NAPOLEON AVENUE CONTAINER TERMINAL DEVELOPMENT UTILIZING PUBLIC-PRIVATE PARTNERSHIPS
Executive Summary ES-2
capacity where it presently exists as opposed to greenfield development—a perspective supported by the findings of this study and a similar study recently completed for the Ports Association of Louisiana.
4) Address existing challenges to secure increased container volumes and attract new container liner services, such as pilotage and associated costs of transiting the Mississippi River, and the lack of distribution centers within the Port’s hinterland.
5) Refine the market analysis from the sector-level analysis conducted for this study to one focused on specific companies and commodities that are imported into and exported from the Lower Mississippi Valley through the US West Coast and quantify the container volumes that are involved in this trade.
6) Identify and prioritize the companies and products that may benefit from using New Orleans via the Panama Canal as opposed to West Coast ports and the intermodal rail system.
7) Develop a detailed marketing program to reach potential beneficiaries of new Northeast Asian services.
8) In parallel, develop a marketing program to enhance cargo volumes and liner services derived from Latin American and European trade lanes.
9) Depending on the market analysis results, work with Louisiana state government to develop a proposed incentive program that would most effectively and economically boost container shipping through the Port of New Orleans for Louisiana companies.
10) Explore partnerships with State and regional economic development entities to identify companies that could benefit from the new lower costs of transportation and promote development of distribution and manufacturing facilities that can be served by the Port.
11) Work with carriers on all of the above steps to demonstrate the benefits of establishing a new service.
12) Monitor short- and mid-term economic and market trends that may result in changes in containerization patterns and develop strategies to take advantage of these trends.
While most of these marketing activities have been undertaken by PONO in past years, expansion of the Panama Canal has recently moved towards reality. Based on this development, marketing efforts can now be focused on liner companies and other potential partners based on the specific timetable that is now available. The aforementioned activities will allow the Port to aggressively position itself to define, fund, and implement the capital projects necessary to enhance its capacity. To maximize potential benefit from the Canal expansion, these enhancements—and the effort of securing new liner services—should be accomplished in parallel with the scheduled completion of the Canal expansion in 2014.
An additional component to consider as part of a new marketing plan will be to present as clear a picture as possible to liner companies, and other key potential partners, about long-term plans for developing Louisiana State ports. These companies are interested in
PORT OF NEW ORLEANS STRATEGIC ADVISORY REPORT
NAPOLEON AVENUE CONTAINER TERMINAL DEVELOPMENT UTILIZING PUBLIC-PRIVATE PARTNERSHIPS
Executive Summary ES-3
minimizing uncertainty in their investment plans, and any steps that may be taken to clarify for them the State’s port development plans will aid in accomplishing this end.
1.2 Demand Analysis & Forecast
The US has experienced a major shift in trade in the last two decades. With the entry of China into the World Trade Organization in 2001, coupled with increased consumption of imported goods in the US, China has become the US’s second largest trading partner (trailing only Canada). During this time, China has taken on more of the market share of manufacturing consumer goods, such as toys and apparel, relative to Mexico and Canada. This resulted in increased containerized consumer goods coming from Northeast Asia (primarily China, but also from Hong Kong, Taiwan, South Korea and Japan). To accommodate the sustained trajectory of import growth, many East Coast and Gulf Coast maritime ports, as well as the Panama Canal, began investing in large-scale infrastructure projects. PONO, as part of its Master Plan 2020, evaluated its own role and how best to anticipate the impacts from the Canal expansion. Against the backdrop of the current global economic slowdown, PB performed a market demand analysis to assess how much of the anticipated growth will materialize at PONO. Key findings of PB’s analysis and projections include:
1. Growth in US Container trade from 2009 to 2028 will be significantly lower than rates of growth experienced from 2002 to 2007. PB projects that US container trade growth will fall in the short-term, and resume to a modest 3.5% compounded annual growth rate (CAGR) after 2011. The reduction in the pace of growth, down from the 7.7% CAGR achieved from 2002 to 2007, reflects:
• Consumer spending growth rates in the US are expected to fall in the near future and then, over the long term, stabilize at a more sustainable percentage of GDP (less than 70%) than that seen in the previous decade.
• Import propensities for many commodities, which have inflated US container trade over the past decade, have for many products already reached saturation points. As such, we expect that overall US container trade will grow at rates closer to increases in GDP over the forecast period, rather than at a rate that is a multiple of GDP growth.
2. PB’s projection for PONO’s base throughput (that resulting from natural growth of the existing business profile and excluding prospective new liner services) is for a decline in container imports of 5% in 2009 before resuming average annual growth in container volume of 1%. Base throughput is projected to reach 350,000 Twenty-Foot Equivalent Units (TEUs) in 2028, the end year of the 20-year time horizon for this demand forecast.
3. Container volumes at East and Gulf Coast ports will benefit from the expansion of the Panama Canal, continuing a shift of Northeast Asia-US containers from West Coast ports. Through the development and implementation of a marketing program geared towards Northeast Asia, PB believes the Port of New Orleans can capture service along this trade lane. PB projects average annual growth of container volumes of 3.5-4.0% in the Gulf region over the 20-year forecast period. PONO’s base growth rate excluding

PORT OF NEW ORLEANS STRATEGIC ADVISORY REPORT
NAPOLEON AVENUE CONTAINER TERMINAL DEVELOPMENT UTILIZING PUBLIC-PRIVATE PARTNERSHIPS
Executive Summary ES-4
prospective new services is projected to be lower than key competitor ports. PONO’s container cargo has and continues to be mainly from Europe and Latin America, and there are currently no dedicated Northeast Asian liner services calling at the Port. Issues involved in developing new services, and volume projections that may result, are described in the section below.
4. Compared to other ports, PONO’s competitive advantage lies in the availability of a bundle of inland transportation services for containerized cargo. In addition to rail and truck connections, PONO also has direct access to the Mississippi River inland waterway system—a slower, but safer and more cost-effective transportation mode that is particularly attractive to shippers of low-value and/or hazardous goods, such as grains, waste materials and chemicals.
5. PONO faces several disadvantages that will make it a challenge to successfully attract Northeast Asian liner services. Like all other Gulf ports, PONO faces significant competition from West Coast ports, which means that competitive market reach of the Port for this trade lane is limited to the lower Mississippi River area. However, unlike Houston, PONO and other lower Mississippi River ports are disadvantaged by the lack of a large local consumer base and the fact that they are not presently located near major distribution centers and networks in the region.
6. PONO’s share of overall US container trade will continue to be challenged by key competitors such as Houston and Mobile, both of which have recently made significant investments to expand their own container terminal capacity. Although the potential expansion of Gulfport and other downstream developments along the Lower Mississippi may further impact PONO’s market share, these developments are in the pre-planning or planning phases, and as such, there is not conclusive evidence that they will constitute major competitive threats to PONO over the 20-year forecast period.
7. US South Atlantic ports (more specifically Charleston, Savannah, Jacksonville and Tampa) also consider themselves to be likely beneficiaries of increased cargo flows through the expanded Panama Canal. After the 2002 West Coast labor issues, these ports did benefit from the “all water” routings and based upon this experience, these ports must be considered as positioned to either maintain or even increase their market share of Northeast Asian cargo.
8. Improving its connectivity and creating backhaul opportunities will be critical components in determining whether or not PONO succeeds in capitalizing on the opportunity for Northeast Asian service. Enhanced connectivity to a large inland consumer base—as well as distribution, warehouse and transportation networks—and increased ability to provide ‘backhaul’ containerized exports to Northeast Asia will strengthen the economic case for new Northeast Asian liner service at PONO.
Volume Projections for New Liner Services
PB projects that one additional liner service, mostly likely from Northeast Asia, would increase total container volumes to 450,000 TEUs by 2028 (including the base growth of 1% per annum). Adding a second liner service,

PORT OF NEW ORLEANS STRATEGIC ADVISORY REPORT
NAPOLEON AVENUE CONTAINER TERMINAL DEVELOPMENT UTILIZING PUBLIC-PRIVATE PARTNERSHIPS
Executive Summary ES-5
again likely from Northeast Asia, would increase total container volumes to 550,000 TEUs by 2028. It is PB’s opinion that the Port of New Orleans is competitively positioned to capture these additional cargo volumes provided a series of carefully implemented actions are taken to market the Port, as outlined in the Growth Action Plan. While the Northeast Asia – US trade lane is believed to be the most likely source of new liner service, the Port’s marketing activities also should include seeking opportunities to expand service along Latin American and European trade lanes as well.
Figure ES-1 represents the overall demand forecast, which takes into account both the projected growth in the existing business as well as the potential for new vessel service. The base component of the forecast, shaded in blue, considers only the natural growth in the port’s existing business profile, while the layered segments represent the potential growth in cargo demand resulting from the addition of new liner services.
Figure ES-1: Overall Demand Forecast, 2007 to 2028
-
100
200
300
400
500
600
2007
2008
2009
2010
2011
2012
2013
2014
2015
2016
2017
2018
2019
2020
2021
2022
2023
2024
2025
2026
2027
2028
Con
tain
er c
argo
dem
and
(in
th
ousa
nd
TEU
s)
Base Forecast New Asian Service 1 New Asian Service 2 Source: PB Analysis
* Note that the graphic above serves as a general illustration as to how cargo demand may increase with the addition of new services. The ramp-up of the services may, in reality, entail a series of irregular step-functions rather than the smooth line shown above.
Developing New Northeast Asian Services
The demand forecast shown in the figure above includes volumes that could occur from new liner services calling on New Orleans from Northeast Asia or other locations. Realizing these new services will require a concerted effort by PONO, working with terminal operators, local business and economic development interests, transportation companies (rail, truck and barge) and government. Timing will also be critical. In the current economic environment, planning for such a new development may be difficult, but these plans will need to be accomplished by 2015 to take full advantage of the opening of the Panama Canal expansion. If these plans are not advanced by then, the opportunity may be diminished.
PORT OF NEW ORLEANS STRATEGIC ADVISORY REPORT
NAPOLEON AVENUE CONTAINER TERMINAL DEVELOPMENT UTILIZING PUBLIC-PRIVATE PARTNERSHIPS
Executive Summary ES-6
Ultimately the decision to add New Orleans as a call from Northeast Asia will be made by one or more liner carrier companies. These companies will make such a decision based on:
• Their customers’ demands;
• Competitive advantages that may be seized in providing the service;
• The ability to develop through (or door to door) service contracts with railroads and other logistical partners; and
• The potential for cutting costs
Customer demand can be examined in some detail by looking at the specific patterns of imports and exports that currently exist. Imports into the lower Mississippi Valley from Northeast Asia are most likely being served currently either through the US West Coast via rail or through the Port of Houston. Exports are being handled along the same corridors as backhaul to the predominant import flows.
Transit times through the West Coast are generally faster than via the all-water route through the Panama Canal. However, with the opening of the expanded Panama Canal, the all-water route will become less expensive which should tip the balance in routing for some shippers and for lower-value commodities and/or less time-sensitive cargoes. In addition, whatever incentives that may be offered by the State of Louisiana in terms of tax credits or other benefits may add to cost reduction possibilities.
Changing service patterns may allow a liner company to create an all-water service to the Gulf that is more competitive in attracting business from other lines (and the railroads). Compared to intermodal routes, an all-water route allows a carrier to reduce the overall costs for carrying cargo, thus increasing carrier profits and/or allowing the carrier to pass on lower costs to its customers.
The demand projection presented in Figure ES-1 above includes a reasonable expectation for container volumes that may result from the development of new Northeast Asia services calling on New Orleans. Given the natural desire of liner companies to minimize port calls, it is likely that the projected volumes for new Northeast Asia services will end up being concentrated in a single port location (or at most two).
Based on New Orleans’ currently existing capacity and ability to extend its capabilities relatively inexpensively, it is PB’s opinion that the Port of New Orleans is well-positioned to become a port of choice for such new or expanded services.
Potential Impact of Transshipment on the Port of New Orleans
In several recent studies regarding Panama Canal expansion and global trade patterns likely to result from this expansion, several possible ports have been identified as strong candidates to become transshipment hubs to service the much larger vessels that will be able to transit the expanded canal. Such transshipment hubs will be more likely to be developed if too few US East Coast ports develop the capacity to handle the larger containerships.
This “hub and spoke” transshipment system allows for a decrease in large vessel turnaround times and encourages the development of ports in the Gulf, the Caribbean, the US East

PORT OF NEW ORLEANS STRATEGIC ADVISORY REPORT
NAPOLEON AVENUE CONTAINER TERMINAL DEVELOPMENT UTILIZING PUBLIC-PRIVATE PARTNERSHIPS
Executive Summary ES-7
Coast and the South American East Coast. One such proposed port is the Louisiana International Gulf Transfer Terminal (LIGTT) described more fully in Section 3.2.1. Depending on the manner in which the LIGTT project is developed, it could impact cargo volumes for the Port of New Orleans in either direction. As such, it is recommended that the Port maintain active involvement in the LIGTT development process.
An alternative potential hub could be located in Cuba. The eventual liberalization of Cuba has, and continues to be, a significant potential that most Gulf and US Southeastern ports are targeting. However, at this point in time, PB feels the likelihood or timing of such a development in Cuba cannot be determined with any degree of certainty. Wherever a transshipment hub might be located, such a development could allow large ships to be effectively utilized on long-haul legs through the Panama Canal, with feeder ships serving US coastal ports. Feeder service patterns could reach more ports, serving smaller markets, with more frequent services. This service pattern could favor Gulf ports such as New Orleans.
1.3 Capacity Analysis
In order to determine the business case for the future needs of the Napoleon Avenue Container Terminal, it is important to first understand the throughput capacity of the existing terminal. Using capacity modeling techniques, PB estimated the throughput capacity of various components of the Napoleon Avenue Container Terminal—including berth, yard, gate, and intermodal rail yard—as they are presently operated. This analysis provides a quantitative estimate of the ability to move cargo through the terminal that, when considered with the demand analysis, provides perspective into the timing and magnitude of the need for capacity enhancement and/or terminal expansion. When estimating capacity for maritime terminals, there are three levels to consider:
• Ultimate Theoretical Capacity (UTC): Considered to be the highest theoretical level of a terminal’s ability to handle cargo demand. This ultimate capacity value is only constrained by the terminal infrastructure. UTC is not used for facility sizing, needs identification or future planning.
• Maximum Practical Capacity (MPC): The practical upper limit of a terminal’s ability to handle cargo demand is referred to as MPC. This capacity level is constrained by infrastructure, equipment and/or operating capabilities.
• Sustainable Practical Capacity (SPC): The SPC is the capacity at which improvements should be considered and generally ranges between 70% and 90% of MPC. For planning purposes in this analysis SPC was estimated at 80% of MPC.
For the analyses presented in this report, only the MPC and SPC were used. These are the two capacity values that are typically considered for planning purposes. An industry standard methodology (accepted by the US Maritime Administration) was used to estimate the MPC. An analogy typically used is that cargo flows through a terminal similar to the flow of water down a river. The most narrow and shallow point along a river will constrain the flow of water. Similarly, the component with the lowest MPC will constrain the flow of cargo through a terminal. The four key components to consider when estimating annual throughput capacity are:
• Wharf/Berth – This component is highly dependant on the length of berth, the number and productivity of the cranes. For example, berth congestion or crane

PORT OF NEW ORLEANS STRATEGIC ADVISORY REPORT
NAPOLEON AVENUE CONTAINER TERMINAL DEVELOPMENT UTILIZING PUBLIC-PRIVATE PARTNERSHIPS
Executive Summary ES-8
availability/capability can limit the capacity at this component. The two cranes that are currently on order were not included in the existing capacity because they are still 1-2 years away from being installed. These cranes were, however, included in all estimates of future terminal capacity.
• Storage – The primary variables that affect storage capacity are the size of storage area, amount and type of yard equipment, and cargo dwell time. In essence, the volume of cargo that can be stored at any given point (defined as static capacity) and the amount of time that cargo resided in the storage area.
• Gate – This capacity is based on the number of gate lanes, hours of operation and the processing rates at each lane. These variables can differ between inbound and outbound moves.
• Intermodal Rail – Working and storage track static capacity, cargo transfer and train switching times are the key variables that affect intermodal rail capacity. This includes the total length and configuration of rail tracks (working and storage), rail car (un)loading rate of the terminal lift equipment, time required to push in and pull out the rail cars between cargo transfer activities and the intermodal rail yard operating hours.
The storage area currently limits the Napoleon Avenue Terminal throughput capability (annual capacity of 594,000 TEUs for MPC and 475,000 TEUs for SPC) of the Port’s container operations under Ceres and Ports America (PAG) operations. Note that one capacity for berth, gate and intermodal operations are estimated for both operators as joint components. Only the storage area was estimated separately between the two operators, with the two values then added together to achieve a total terminal throughput capacity. This was done because the wharf/berth, gate and intermodal yard are shared by both.
Table ES-1: Existing Capacity Results
Terminal Name Ceres PAG TOTAL MPC
TOTAL SPC
1. Berth Component 619,000 619,000 495,000 2. Storage Component 238,000 356,000 594,000 475,000 3. Gate Component 936,000 936,000 749,000 4. Intermodal Rail Component 82,000 82,000 66,000
Capacity per Gross Terminal Acre 5,400 4,000
1.4 Strategies for Capacity Enhancement
Comparing the MPC estimated for the existing Napoleon Avenue Container Terminal, as it is presently operated, with the base demand forecast, it can be seen that the projected natural growth in existing cargo services moving through the terminal can be accommodated without requiring changes to operational methodologies or the physical infrastructure at the terminal.
Taking into account the overall demand forecast, which includes the base growth as well as the addition of two regular liner services, however, expansion of existing capacity would be required. Generally, when a terminal reaches its SPC, this serves as trigger point for the planning of capacity enhancements, so that they will be on-
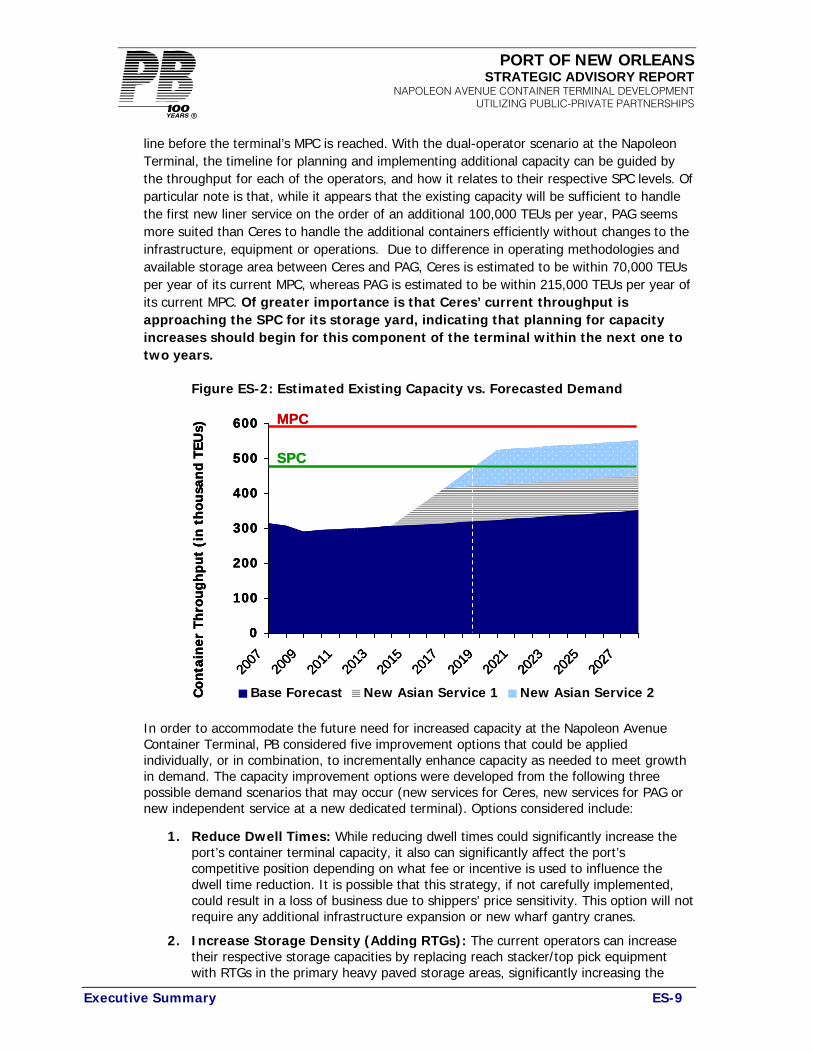
PORT OF NEW ORLEANS STRATEGIC ADVISORY REPORT
NAPOLEON AVENUE CONTAINER TERMINAL DEVELOPMENT UTILIZING PUBLIC-PRIVATE PARTNERSHIPS
Executive Summary ES-9
line before the terminal’s MPC is reached. With the dual-operator scenario at the Napoleon Terminal, the timeline for planning and implementing additional capacity can be guided by the throughput for each of the operators, and how it relates to their respective SPC levels. Of particular note is that, while it appears that the existing capacity will be sufficient to handle the first new liner service on the order of an additional 100,000 TEUs per year, PAG seems more suited than Ceres to handle the additional containers efficiently without changes to the infrastructure, equipment or operations. Due to difference in operating methodologies and available storage area between Ceres and PAG, Ceres is estimated to be within 70,000 TEUs per year of its current MPC, whereas PAG is estimated to be within 215,000 TEUs per year of its current MPC. Of greater importance is that Ceres’ current throughput is approaching the SPC for its storage yard, indicating that planning for capacity increases should begin for this component of the terminal within the next one to two years.
Figure ES-2: Estimated Existing Capacity vs. Forecasted Demand
0
100
200
300
400
500
600
2007
2009
2011
2013
2015
2017
2019
2021
2023
2025
2027
Con
tain
er T
hro
ug
hpu
t (i
n t
hou
san
d TE
Us)
Base Forecast New Asian Service 1 New Asian Service 2
MPC
SPC
0
100
200
300
400
500
600
2007
2009
2011
2013
2015
2017
2019
2021
2023
2025
2027
Con
tain
er T
hro
ug
hpu
t (i
n t
hou
san
d TE
Us)
Base Forecast New Asian Service 1 New Asian Service 2
0
100
200
300
400
500
600
2007
2009
2011
2013
2015
2017
2019
2021
2023
2025
2027
Con
tain
er T
hro
ug
hpu
t (i
n t
hou
san
d TE
Us)
Base Forecast New Asian Service 1 New Asian Service 2
MPC
SPC
In order to accommodate the future need for increased capacity at the Napoleon Avenue Container Terminal, PB considered five improvement options that could be applied individually, or in combination, to incrementally enhance capacity as needed to meet growth in demand. The capacity improvement options were developed from the following three possible demand scenarios that may occur (new services for Ceres, new services for PAG or new independent service at a new dedicated terminal). Options considered include:
1. Reduce Dwell Times: While reducing dwell times could significantly increase the port’s container terminal capacity, it also can significantly affect the port’s competitive position depending on what fee or incentive is used to influence the dwell time reduction. It is possible that this strategy, if not carefully implemented, could result in a loss of business due to shippers’ price sensitivity. This option will not require any additional infrastructure expansion or new wharf gantry cranes.
2. Increase Storage Density (Adding RTGs): The current operators can increase their respective storage capacities by replacing reach stacker/top pick equipment with RTGs in the primary heavy paved storage areas, significantly increasing the

PORT OF NEW ORLEANS STRATEGIC ADVISORY REPORT
NAPOLEON AVENUE CONTAINER TERMINAL DEVELOPMENT UTILIZING PUBLIC-PRIVATE PARTNERSHIPS
Executive Summary ES-10
container terminal’s storage capacity and consequently allowing for more room to move containers. This option will require minimal improvement in terminal infrastructure, but would require a significant increase in operating equipment investment/expenditure on new RTGs.
3. Combined Ceres & PAG Operations: Combining Ceres and PAG operations into one stevedoring operation will require some infrastructure modifications and operating equipment changes to accommodate the forecasted new services. More importantly, this option may raise competitive issues and would require the ‘buy in’ of the existing terminal operators and the renegotiation of the current terminal leases.
4. Existing Terminal Expansion: This option includes the expansion of the terminal’s footprint and existing Ceres and PAG operations as described by each expansion stage (Development Stages A through D, as defined in Figure 5-2). The expansion stages can significantly increase capacity when combined with Option 2. This option will require a significant amount of infrastructure investment, with the capacity increase dependant on which development stages are implemented.
5. New Terminal Development: In the event that new liner services materialize and require a dedicated terminal, it will be necessary to develop a new terminal adjacent to the existing terminal (expansion Stages E & F as defined in Figure 5-2). These are the most costly stages due to the significant amount of infrastructure development costs and the need to acquire four new wharf gantry cranes, but with the cost would come significant new capacity, greater than that of the existing terminal.
The port’s decision to implement any or a combination of these options will be affected by which operator handles the new services (Ceres, PAG or a new terminal). This can have an effect on the amount of infrastructure and operating equipment needed. The following items are of note in considering which option(s) to apply:
• Only Options 3 and 5 or a combination of Options 3 or 5 with any other option would not be affected by the decision of which existing operator would handle new vessel services.
• Options 1-4 do not require additional wharf gantry cranes (beyond the two cranes presently on order) to meet the forecasted demand of the two new services.
• Only Options 4 and 5 require significant infrastructure investments.
• Option 5 would require the acquisition of four new gantry cranes.
A combination of Options 1 & 2 should be investigated to accommodate the future forecasted capacity needs. Option 3 may be considered as an alternative if the competitive issues can be suitably addressed. Tenant and/or customer needs may warrant undertaking Option 4 in parallel with, or even in lieu of, Options 1 and 2. During interviews with tenants and customers (carriers) over the course of this study, both cited additional gantry cranes and berth space as being desirable to improve terminal operations. Finally, if the new service requires a dedicated terminal, the port will need to consider the best approach to implementing Option 5.
1.5 Potential Financing Scenarios
The private sector has been a party to port development and operation for decades, in a variety of forms, and the current economic crisis is not likely to change that in the long run. In the short term, however, inability to access capital and uncertainty about future trade volumes may well keep financial investors sidelined, especially

PORT OF NEW ORLEANS STRATEGIC ADVISORY REPORT
NAPOLEON AVENUE CONTAINER TERMINAL DEVELOPMENT UTILIZING PUBLIC-PRIVATE PARTNERSHIPS
Executive Summary ES-11
for projects perceived to be reliant on future growth and new market patterns for their support. Strategic investors (e.g. terminal operators and ocean carriers) with access to cash or inexpensive long-term financing will likely re-enter the investment market ahead of the financial players, hoping to solidify key geographic positions and to take advantage of reduced competition. They typically will be drawn to existing assets over greenfield ones, as proven cash flow will be required to finance any major investments.
While the majority of the incremental improvements outlined in Section 5 of this report would most likely be financed as part of the regular budgets of either the Port or the existing terminal operators, there may be a PPP opportunity for PONO in partnership with an ocean carrier that may see the prospect of a dedicated terminal as an attractive lure to move cargo and operations to New Orleans, either as a new service or from another location. Such was the case in Jacksonville with Mitsui and Hanjin, both of whom wanted an East Coast anchor for what they envision to be new routes after the expanded Panama Canal opens in 2014. In such an arrangement, the carrier will want to ensure that the terminal makes economic sense to its operation, both from a location and cost perspective. In the current financial environment, creating a public/private partnership structure that uses the Port’s ability to issue tax-exempt debt on behalf of the lessee would be the most cost-effective financing structure as well as the most feasible solution.
An important caveat to this type of Public/Private Partnership is the expectations of the private partner. By assuming full debt repayment obligation for the terminal and assets, which could ultimately revert to the Port, the private partner will expect the public side to assume responsibility for ‘long-life’ (e.g. wharf) and off-site infrastructure improvements that may be required to support the terminal. The additional ability of the public partner to contribute to the infrastructure investment and/or otherwise subsidize a portion of development costs would create a much more favorable transaction for a strategic investor to participate in a partnership agreement. In conjunction with planning for the terminal, an evaluation of the existing inland transportation network (road and rail) should be undertaken to determine if any improvements would be necessary to support the additional cargo volumes generated by the terminal.
For PONO, the most likely investment opportunity appears to be the development of a dedicated container terminal for a carrier whose long-term strategy involves major port call(s) in the Gulf, or who can be enticed by the opportunity to take over existing operations already in the black, or a combination thereof. A comprehensive marketing program, as briefly outlined in this report, emphasizing the Port’s competitive advantages, such as its connectivity to the inland transportation network via multiple modes, will be an important element in the pursuit and realization of such an opportunity.
Equally important will be the commitment of both the Port and the State of Louisiana to any new container terminal in New Orleans. Not only will private investors expect that public money be spent for needed infrastructure and access improvements, but they will require that it not be spent on new facilities that would compete with the public/private investment. The best leveraging of public funds would be to invest in expanding the facilities at PONO and strengthening the interconnectivity of PONO to the surface transportation and inland waterway links, so that the Port as whole can enhance its ability to compete with facilities in neighboring states.

PORT OF NEW ORLEANS STRATEGIC ADVISORY REPORT
NAPOLEON AVENUE CONTAINER TERMINAL DEVELOPMENT UTILIZING PUBLIC-PRIVATE PARTNERSHIPS
Introduction
1
2 Introduction
2.1 Port of New Orleans Background
The Port of New Orleans (PONO) has been a vibrant port for nearly 300 years, since the city’s founding in 1718. Located near the mouth of the Mississippi river, PONO is situated between 14,500 miles of inland waterway and the Gulf of Mexico. As the only maritime port in the US served by six Class I railroads, and connected to both an interstate highway network and the Mississippi River, PONO is where ships, rail, barges and trucks converge. PONO comprises several cargo and passenger cruise terminals. The cargo facilities are subdivided into the Industrial Canal facilities (which include the France Road Berths and Jourdan Road Terminals) and the Mississippi River complex (which includes the Nashville Avenue Complex, Napoleon Avenue Container Terminal, Napoleon Avenue/ Milan Street Complex and Louisiana Avenue Complex). PONO currently has 52 berths, 23.3 million square feet of cargo-handling area, seven gantry cranes, more than 3.1 million square feet of covered storage area, and 1.7 million square feet of cruise terminal and parking facilities.1 Approximately 1,900 vessel calls are made to PONO every year, representing the handling of 27 million tons of port wide cargo2 and over 306,000 Twenty Feet Equivalent Units (TEUs) of containerized cargo in 20083. Approximately one third of import cargo is from Europe, one third is from Asia, and the remaining one third is from South America, Central America, India sub-continent, Caribbean, and Australia/New Zealand.4
2.2 Master Plan 2020 and Napoleon Avenue Container Terminal Expansion
In 2008, PONO developed its 2020 Master Plan, a blueprint for its short- and long-term plans for growth. By looking at the current challenges, such as recovery from Hurricane Katrina damage, coupled with expectations of market growth due in part to the anticipated Panama Canal expansion in 2014, PONO laid out extensive capital improvement plans to increase the port’s capacity. Although PONO has historically been more of a break bulk port, with break bulk comprising 60% of all cargo tonnage5, a primary focus of the 2020 Master plan is phased capacity expansions at the Napoleon Avenue Container Terminal.
The first phase of the Napoleon Avenue Container Terminal was opened in January of 2004. The $101 million terminal includes two 1,000-foot berths with a draft of 45 feet. Ceres Gulf, Inc. (Ceres) and Ports America Louisiana, Inc. (PAG) each operate half of the terminal and are responsible for the stevedoring operations and maintenance. Four PONO-owned ship-to-shore gantry cranes serve the terminal.
As part of the future terminal development defined in the Master Plan, PONO has developed plans to expand the terminal by:
1 Official Statement May 2008 2 PONO supplied data 3 PONO supplied data 4 PONO Master Plan 2020 p. 9 5 PONO Master Plan 2020 p. 21 (average calculation from 2002-2006 of cargo tonnage)
PORT OF NEW ORLEANS STRATEGIC ADVISORY REPORT
NAPOLEON AVENUE CONTAINER TERMINAL DEVELOPMENT UTILIZING PUBLIC-PRIVATE PARTNERSHIPS
Introduction
2
• Creating two additional ship berths and 20 acres of additional container marshalling yard through the redevelopment of the Napoleon Avenue Wharves “B” and “C” sites and adjacent marshalling yards.
• Procurement of three additional ship-to-shore gantry cranes (the construction of two of which was commissioned by PONO in December 2008, with expectations to install these cranes by July 2010).
• Relocation of the intermodal rail facility to a proposed site adjacent to the Clarence Henry Truckway. This portion of the project would require reconfiguring existing rail tracks and paving to provide an efficient intermodal operation close to dock operations. Currently, the existing seven-acre intermodal rail terminal yard, which was dedicated in April 2008, is operated and maintained by Ceres while New Orleans Public Belt Railroad provides the switching services to the six Class I railroads.
• Construction of new wharf at the Milan Street Wharf, providing two additional ship berths, and nearly 50 acres of new marshalling yard and a terminal gatehouse.
2.3 Statement of Objectives
Spurred by the planning for the phased expansion of the Napoleon Avenue Container Terminal, PONO recognized the need to explore various options to finance the proposed terminal expansion. In addition to securing public funding, PONO realized that in order to execute projects of the magnitude envisioned in its Master Plan, it would require private financing, in the form of equity and/or debt. PONO began its exploration of public-private partnerships (PPPs) as a financing solution, and engaged Parsons Brinckerhoff (PB) under a consulting agreement to provide strategic advisory services including:
• Development of a ‘business case’ for the expansion, by estimating terminal capacity, examining the potential for market growth, and creating a demand forecast for containerized cargo at the Port;
• Evaluating various means to increase terminal throughput capacity to accommodate projected demand; and
• Identifying potential PPP structures and associated financing scenarios to allow for the execution of the recommended expansion scenario(s).
The analyses undertaken by PB as part of this engagement were limited to PONO’s containerized cargo only, and did not address bulk, neo-bulk, or break-bulk cargoes. This document constitutes PB’s Strategic Advisory Report and addresses the results of the various analyses conducted by PB as described above.
2.4 Approach
2.4.1 Business Case Development
Development of the business case for terminal expansion involved building a demand forecast that took into account PONO’s competitive position vis-à-vis other US ports, and addressed the potential for new liner services. This effort began with a

PORT OF NEW ORLEANS STRATEGIC ADVISORY REPORT
NAPOLEON AVENUE CONTAINER TERMINAL DEVELOPMENT UTILIZING PUBLIC-PRIVATE PARTNERSHIPS
Introduction
3
comprehensive evaluation of cargo throughput and cargo demand. PONO’s cargo data was aggregated and analyzed by breaking it down by trade lane and commodities. PB profiled PONO’s current business and assessed the impact of key drivers—such as current and projected economic trends, growth in US trade, and anticipated shifts in demand due to the Panama Canal expansion—and built the base component of the forecast on this basis. Using the base component as a starting point, PB next assessed PONO’s potential for attracting new liner services based on PONO’s geographic, market and infrastructure advantages. PB also evaluated PONO’s competitive position relative to other ports that vie for comparable trade lanes and commodity groups.
As a parallel activity, PB applied its capacity modeling techniques to estimate the throughput capacity of various components of the Napoleon Avenue Container Terminal—including berth, yard, gate, and intermodal rail yard—as they are presently operated. Two levels of capacity — maximum practical capacity, and sustainable practical capacity — were estimated for each component, allowing PB to gauge the limitations of cargo throughput at the terminal. The maximum practical capacity, the preferred capacity metric, was then compared to the demand forecast, to determine the business case for expanding the terminal.
2.4.2 Capacity Enhancement Scenarios
Based upon the degree by which forecasted demand exceeds capacity, PB evaluated various strategies for capacity enhancement at the terminal. These scenarios included potential changes to operations, storage density, terminal footprint (i.e. terminal expansion), or combinations thereof. Specific capacity enhancement strategies were analyzed, and the resulting capacity increase was quantified using PB’s capacity model, which was developed specifically to represent the Napoleon Terminal operation. The results of these analyses can by used by PONO as a ‘road map’ to guide the timing and magnitude of future terminal development based on the realization of increased demand and cargo throughput at the terminal.
2.4.3 PPP Structures and Financing Scenarios
Armed with an understanding of the cargo forecast and the means by which terminal capacity could be increased to accommodate additional cargo, PB evaluated the potential PPP structures and financing tools/mechanisms that could be applied by PONO to implement its projects. Based on the various capacity enhancement scenarios investigated under the previous task, PB evaluated the potential investor base, available financing options, and recommended actions for PONO.

PORT OF NEW ORLEANS STRATEGIC ADVISORY REPORT
NAPOLEON AVENUE CONTAINER TERMINAL DEVELOPMENT UTILIZING PUBLIC-PRIVATE PARTNERSHIPS
Demand Analysis & Forecast 4
3 Demand Analysis & Forecast
3.1 Overview of US container trade
Since 1990, overall US container trade has increased at a robust compound annual growth rate (CAGR) of 6.4%, from 15.6 million TEUs in 1990 to 45.0 million TEUs in 2007. The growth was boosted by the entry of China into the World Trade Organization (WTO) in 2001, which contributed to a surge of import containers through North American ports from 2002 through 2007, resulting in an increase of the CAGR to 7.7% over this period.
Figure 3-1: US Container Trade Volumes, 1990 to 2007 (in million TEUs)
0
5
10
15
20
25
30
35
40
45
50
1990
1991
1992
1993
1994
1995
1996
1997
1998
1999
2000
2001
2002
2003
2004
2005
2006
2007
Mill
ion
TEU
s
CAGR: 6.4%
CAGR: 7.7%
Source: American Association of Port Authorities (AAPA)
Over this same period, from 1990 through 2007, growth in Real Gross Domestic Product (GDP) averaged 2.9% per year, with two eight-month recessions experienced during this period (in 1990-91 and 2001). Driven by this relatively strong and steady economic growth, coupled with high consumer spending, and shifts in trade patterns favorable to US container trade, many North American port authorities sought to enhance their facilities’ container-handling capacity. Atlantic and Gulf port authorities, including the Port of New Orleans, have also pursued expansion strategies, in hopes of capitalizing on increased cargo demand expected from the opening of the expanded Panama Canal in 2014.
However, recent developments in the global economy are rapidly challenging the demand assumptions underlying the strategic plans of such ports. In December 2007, the US economy officially entered into a recession, signaling the end of an era of high consumer spending and ever-increasing import growth. At the time of writing, economic conditions

PORT OF NEW ORLEANS STRATEGIC ADVISORY REPORT
NAPOLEON AVENUE CONTAINER TERMINAL DEVELOPMENT UTILIZING PUBLIC-PRIVATE PARTNERSHIPS
Demand Analysis & Forecast 5
continue to decline and no consensus opinion has evolved regarding the length and depth of the US and global slowdowns.
More importantly, fundamentals of the US economy and trade patterns suggest that even after an economic rebound, container trade growth over the long term will likely be at lower rates than those seen over the previous decade. This will particularly undercut previously expected strong growth of containerized imports to the US—one of the key assumptions in port demand projections—requiring Gulf ports to revisit their basic rationales for expansion.
In this section of the report, the future demand for PONO is assessed, based on the most recent economic data and port industry outlook. Cargo demand for PONO is a product of both trade-level factors and routing factors. Trade-level factors include to macro-economic and commodity-specific drivers which affect the potential cargo that may move through the port. Routing factors refer to the ability of PONO to capture such potential trade flows vis-à-vis other port gateways in the US. Along with the port’s physical attributes, connectivity of its facility to inland consumption and production areas is an important factor that determines PONO’s port demand.
Although imports make up the smaller portion of container throughput at the Port of New Orleans, a careful assessment of the drivers of imports is very important, as increases in container imports are critical to PONO’s strategic plan for expanding the Napoleon Container Terminal. As US containerized import cargo heavily consists of high-value consumer items, this cargo flow is largely driven by three factors: i) personal consumption expenditures, ii) the nation’s propensity to import goods to meet demand, and iii) product sourcing.
3.1.1 Personal consumption expenditures
Over the past decade, high growth in US personal consumption expenditures (PCE) have led to significantly increased growth of containerized imports, which are heavily concentrated in final consumer goods such as apparel, toys, furniture, and consumer electronics. The PCE share of GDP reached an all-time high of 71.6% in 2007, an increase of four percentage points from the average level in the 1990s (see Figure 3-2). Easy access to credit markets over the past decade allowed US consumers to spend more of their income than previously possible. Personal savings rates in 2005 through 2007 averaged a very low 0.6% (see Figure 3-3). In no other years since 1932-34 have personal savings rates been lower than 1.0%.
If consumer spending as a share of total GDP has peaked, and the personal savings rate does not decline into negative territory, then these fundamental drivers of demand will no longer contribute to trade growth rates significantly in excess of GDP growth rates. In addition, if these fundamental drivers return towards historic norms, then these factors will contribute to a further dampening of trade growth rates. Initial evidence derived from 2008 data indicates that these trends could develop, with the consumption share of GDP declining to 70.9%—down from the historic high of 71.6% in 2007—and the personal savings rate increasing to 1.7%.

PORT OF NEW ORLEANS STRATEGIC ADVISORY REPORT
NAPOLEON AVENUE CONTAINER TERMINAL DEVELOPMENT UTILIZING PUBLIC-PRIVATE PARTNERSHIPS
Demand Analysis & Forecast 6
Figure 3-2: US Consumption Share of GDP, 1990 to 2008 (in percentage)
64%
65%
66%
67%
68%
69%
70%
71%
72%
1990
1991
1992
1993
1994
1995
1996
1997
1998
1999
2000
2001
2002
2003
2004
2005
2006
2007
2008
Con
sum
ptio
n S
har
e of
GD
P (
%)
Source: US Bureau of Economic Analysis (BEA)
Figure 3-3: US Personal Savings Rate Share of GDP, 1929 to 2008 (in percentage)
-5
0
5
10
15
20
25
30
1929
1932
1935
1938
1941
1944
1947
1950
1953
1956
1959
1962
1965
1968
1971
1974
1977
1980
1983
1986
1989
1992
1995
1998
2001
2004
2007
Source: US Bureau of Economic Analysis (BEA)
It is PB’s opinion that the PCE share of GDP is likely to fall back towards the levels seen in the 1990s. This in turn, implies a lower growth rate in container imports relative to GDP than that recorded during the past decade.
3.1.2 Import propensity
In addition to growth in consumer spending, recent US container import growth has also been inflated by increasing import propensities—i.e. the tendency of the US to import goods to meet demand. Over the past decade, US imports have grown more rapidly than US total economic activity, mainly due to global shifts in goods production.

PORT OF NEW ORLEANS STRATEGIC ADVISORY REPORT
NAPOLEON AVENUE CONTAINER TERMINAL DEVELOPMENT UTILIZING PUBLIC-PRIVATE PARTNERSHIPS
Demand Analysis & Forecast 7
Production of labor-intensive goods, such as apparel, electronics and toys, has largely shifted out of the US to countries with lower labor costs.
Looking forward, however, the import shares of many products consumed in the US are unlikely increase at the same rates as those seen in previous years as imports reach saturation points. For certain categories of products, such as toys, imports comprise most of US consumption. As shown in the Figure 3-4 below, apparel imports grew much faster than total consumption through 2000. From 2000 through 2008, imports have grown at about the same rate as consumption.
Figure 3-4: Personal Consumption Expenditure on & Imports of Apparel, 1992 to 2007 (in billions of dollars)
100
200
300
400
1992
1993
1994
1995
1996
1997
1998
1999
2000
2001
2002
2003
2004
2005
2006
2007
App
arel
Per
sona
l Con
sum
ptio
n Ex
pend
itur
e ll
(in
billi
ons
of d
olla
rs)
20
40
60
80 Apparel im
ports (in billions of dollars) Y
Consumption Imports
Source: Bureau of Economic Analysis & US Census
3.1.3 Product Sourcing
Container trade growth has also been boosted in recent years, beyond fundamental economic drivers, by shifts in the sourcing of goods. Specifically, as goods have been imported from overseas, rather than from Mexico and Canada, this has resulted in growth in maritime containerized trade by replacing trade in goods carried by truck or rail across US land borders. Figure 3-5 below shows that China gained significant market share of US apparel imports while Mexico’s share declined. However, the positive impact on maritime container volumes of this shift in sourcing is necessarily decelerating, as Mexico’s share declines toward minimal levels.

PORT OF NEW ORLEANS STRATEGIC ADVISORY REPORT
NAPOLEON AVENUE CONTAINER TERMINAL DEVELOPMENT UTILIZING PUBLIC-PRIVATE PARTNERSHIPS
Demand Analysis & Forecast 8
Figure 3-5: Share of Value of US Apparel Imports by Originating Country, 1992 to 2008
0%
5%
10%
15%
20%
25%
30%
35%
1992
1993
1994
1995
1996
1997
1998
1999
2000
2001
2002
2003
2004
2005
2006
2007
2008
Shar
e of
US
impo
rts
of a
ppar
el (
%)
Canada
China
Mexico
Vietnam
Source: US Census & PB Analysis
3.2 PONO share of US container trade/Competitive analysis
While the assessment of drivers of overall trade of US containerized goods (i.e. potential cargo for New Orleans) is important, it is equally imperative to evaluate the factors that affect the port’s share of such trade in developing PONO’s containerized cargo forecast. New Orleans’ share must be evaluated relative to each major trade lane, or sets of origins and destinations (e.g. transpacific, transatlantic and North/South trade between North America and Latin America). Within major trade lanes, shippers and liner companies generally make decisions on which ports to use based on the following factors:
• Location of the port relative to the trade lane;
• Proximity to inland consumer/production areas and/or regional distribution centers;
• Connectivity of the port to inland transportation; and
• Ability of the port (and terminals) to provide reliable, efficient, and cost-effective services.
While other ports within the Gulf region may be competitive with New Orleans for all container trade lanes, West Coast ports are competitive mainly for Northeast Asian cargo. Even though Northeast Asian container cargo makes up only a small fraction of PONO cargo, a discussion of West Coast and US Southeastern ports is warranted in this report as PONO’s prospects for capturing Northeast Asian cargo as a result of the Panama Canal expansion is one of key reasons for exploring the expansion of the Napoleon Container Terminal.

PORT OF NEW ORLEANS STRATEGIC ADVISORY REPORT
NAPOLEON AVENUE CONTAINER TERMINAL DEVELOPMENT UTILIZING PUBLIC-PRIVATE PARTNERSHIPS
Demand Analysis & Forecast 9
3.2.1 Gulf Coast ports
Ports within the Gulf region are competitive to PONO for all trade lanes. Of these ports, we consider Houston and Mobile to be the most significant competitors to PONO. Located roughly 300 miles and 135 miles respectively from New Orleans, these two ports have hinterlands that overlap that of PONO. Both ports have recently undergone expansion of their container-handling facilities, and are expected to gain market share of Gulf container throughput in the future.
Port of Houston
The Port of Houston is the largest container port in the Gulf, handling 65% (1.76 million TEUs) of total Gulf container volumes in 2007. Container throughput increased at a robust CAGR of 7.0% from 1998 to 2007, bolstered by strong growth of Northeast Asian cargo during that period. The port also benefited from the 2005 opening of a two-million-square-feet Wal-Mart distribution center in Baytown. To keep up with demand, the Port of Houston has been expanding its container handling capacity. In 2007, the port began operations of the first phase of the Bayport Container terminal, which comprises two berths, roughly 60 acres of marshalling area and six ship-to-shore container cranes6. At full build-out, projected to be by 2020, the annual capacity of the terminal is estimated to be 2.3 million TEUs.
Relative to PONO, Houston is particularly competitive in terms of Northeast Asia trade, and will likely continue to be a port of choice for major shipping companies currently calling the port, due to its large consumer population and its proximity to significant regional distribution centers.
Port of Mobile
In 2008, the Port of Mobile began operations at the new Mobile Container Terminal (MCT), which has a start-up capacity of 350,000 TEUs. The MCT facility also represents a phased development, and if fully built-out, will have a capacity of 800,000 TEUs. The MCT facility is expected to be especially competitive to PONO for container cargo that originates from or is destined for Alabama, the Florida panhandle and Western Georgia (specifically the Atlanta area). With access to five Class I railroads, this port is also likely to be competitive to New Orleans for Latin American container traffic originating in or destined to the US Midwest.
In addition to Houston and Mobile, there are also several potential developments in the Gulf that may vie for container traffic with New Orleans in the future, including plans to expand the port at Gulfport MS and to build cargo-handling facilities in Louisiana downriver from New Orleans on the Mississippi. However, such projects remain in the planning stages at the time of writing, and recent developments suggest that some of these plans may not materialize in the foreseeable future.
6 Port of Houston Website, http://www.portofhouston.com/

PORT OF NEW ORLEANS STRATEGIC ADVISORY REPORT
NAPOLEON AVENUE CONTAINER TERMINAL DEVELOPMENT UTILIZING PUBLIC-PRIVATE PARTNERSHIPS
Demand Analysis & Forecast 10
Gulfport
In 2008, the Mississippi State Port Authority approved a master plan that would extend the port farther south into the Mississippi sound and elevate it to a grade of 25 feet above sea level. The initial expansion is planned to be carried out in stages over a period of ten years. Phase I is to be financed mainly with $570 million in community development block grants that the Federal Department of Housing and Urban Development (HUD) awarded to the State of Mississippi after Hurricane Katrina.
The planned use of HUD money for port expansion created local controversy, and a lawsuit was filed in federal district court in December 2008 to stop the distribution of the funds to the port. While at the time of writing the port is continuing to move forward with its plans, the pace at which it can do so may ultimately be impacted by the lawsuit. In addition, funding sources for later stages of the project are likely to depend on public-private partnerships which will depend on demonstrated demand requirements and competitive strength of the Port of Gulfport.
Other developments
Established by the Louisiana legislation in 1999, the Millennium Port Authority was established to “facilitate the regional planning process to ensure adequate container port facilities and supporting inter-modal transportation infrastructure are developed to maximize Louisiana's opportunity to achieve a significant share of the projected growth in maritime container commerce within the Gulf of Mexico.”7 Among the development concepts pursued by the authority, Sea Point and Plaquemines Parish port development could potentially compete for container demand with PONO.
Sea Point. Sea Point is envisioned as a container transshipment port at mile 12 of the Mississippi River at Venice, Louisiana providing direct access to rail, truck and barge. The facility would have an annual capacity of 912,000 TEUs upon its opening. In March 2008, the Louisiana Legislature gave its preliminary approval for the issuance of $300 million in Gulf Opportunity Bond funds for the Sea Point development, which has been estimated to require $400 million to construct. The timing of the implementation for the project is unknown, as final approval and subsequent sale of the bonds have not occurred as of the time of writing.
Louisiana International Gulf Transfer Terminal (LIGTT). In December 2008, Louisiana legislation passed a bill that calls for the creation of the Louisiana International Deep Water Gulf Transfer Authority, a 12-member board that will study the feasibility of constructing a port complex in Plaquemines Parish. The port would be a transshipment terminal located near the mouth of the Mississippi River. The project is presently in the formative stages, with strategic and master planning efforts slated for 2009, and timing for its implementation is unknown. Depending on the manner in which the LIGTT project is developed, it could impact cargo volumes for the Port of New Orleans in either direction. As such, it is recommended that the Port maintain active involvement in the LIGTT development process.
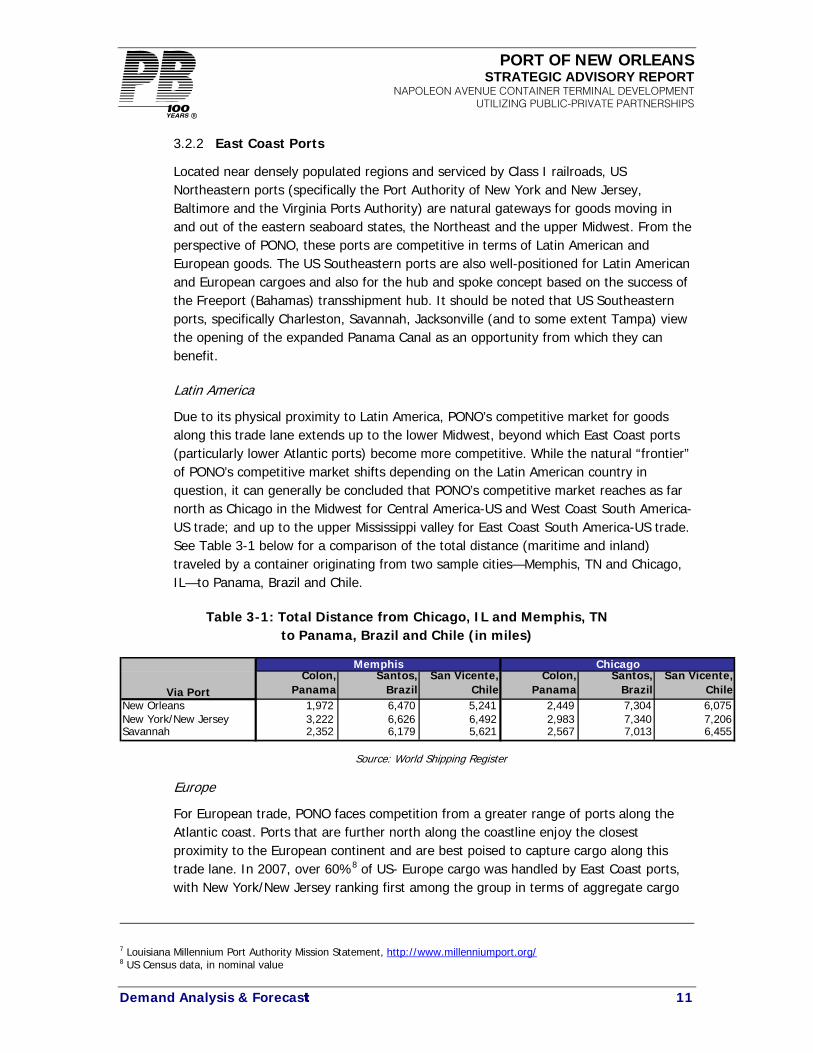
PORT OF NEW ORLEANS STRATEGIC ADVISORY REPORT
NAPOLEON AVENUE CONTAINER TERMINAL DEVELOPMENT UTILIZING PUBLIC-PRIVATE PARTNERSHIPS
Demand Analysis & Forecast 11
3.2.2 East Coast Ports
Located near densely populated regions and serviced by Class I railroads, US Northeastern ports (specifically the Port Authority of New York and New Jersey, Baltimore and the Virginia Ports Authority) are natural gateways for goods moving in and out of the eastern seaboard states, the Northeast and the upper Midwest. From the perspective of PONO, these ports are competitive in terms of Latin American and European goods. The US Southeastern ports are also well-positioned for Latin American and European cargoes and also for the hub and spoke concept based on the success of the Freeport (Bahamas) transshipment hub. It should be noted that US Southeastern ports, specifically Charleston, Savannah, Jacksonville (and to some extent Tampa) view the opening of the expanded Panama Canal as an opportunity from which they can benefit.
Latin America
Due to its physical proximity to Latin America, PONO’s competitive market for goods along this trade lane extends up to the lower Midwest, beyond which East Coast ports (particularly lower Atlantic ports) become more competitive. While the natural “frontier” of PONO’s competitive market shifts depending on the Latin American country in question, it can generally be concluded that PONO’s competitive market reaches as far north as Chicago in the Midwest for Central America-US and West Coast South America-US trade; and up to the upper Mississippi valley for East Coast South America-US trade. See Table 3-1 below for a comparison of the total distance (maritime and inland) traveled by a container originating from two sample cities—Memphis, TN and Chicago, IL—to Panama, Brazil and Chile.
Table 3-1: Total Distance from Chicago, IL and Memphis, TN to Panama, Brazil and Chile (in miles)
Colon, Panama
Santos, Brazil
San Vicente, Chile
Colon, Panama
Santos, Brazil
San Vicente, Chile
New Orleans 1,972 6,470 5,241 2,449 7,304 6,075 New York/New Jersey 3,222 6,626 6,492 2,983 7,340 7,206 Savannah 2,352 6,179 5,621 2,567 7,013 6,455
Memphis Chicago
Via Port
Source: World Shipping Register
Europe
For European trade, PONO faces competition from a greater range of ports along the Atlantic coast. Ports that are further north along the coastline enjoy the closest proximity to the European continent and are best poised to capture cargo along this trade lane. In 2007, over 60%8 of US- Europe cargo was handled by East Coast ports, with New York/New Jersey ranking first among the group in terms of aggregate cargo
7 Louisiana Millennium Port Authority Mission Statement, http://www.millenniumport.org/ 8 US Census data, in nominal value

PORT OF NEW ORLEANS STRATEGIC ADVISORY REPORT
NAPOLEON AVENUE CONTAINER TERMINAL DEVELOPMENT UTILIZING PUBLIC-PRIVATE PARTNERSHIPS
Demand Analysis & Forecast 12
value handled. From the figures below, it can be seen that competition from East Coast ports limits PONO’s competitive region to within the lower Mississippi region.
Table 3-2: Total Distance from Various US Inland Cities to Bremerhaven, Germany (in miles)
Via PortLittle Rock,
ArkansasSt. Louis, Missouri
Baton Rouge, Louisiana
New Orleans 6,140 6,384 5,854 New York/New Jersey 5,206 5,001 5,317 Savannah 5,380 5,395 5,309
Source: World Shipping Register
3.2.3 West Coast ports
For Northeast Asia trade originating in or destined to US inland regions, including the lower Mississippi Valley region, West Coast ports are currently dominant in serving these markets compared to the Port of New Orleans.
Due to their physical proximity, West Coast ports have long been the maritime gateways of choice for goods originating from/destined for Northeast Asia. West Coast container cargo, especially at Los Angeles and Long Beach, has grown both in aggregate volumes and in the share of total US container volumes over the past decade (see Figure 3-6). In addition to serving their local markets, the Southern California ports are also gateways to more remote inland markets, offering direct rail access for transcontinental shipment as well as trans-loading in the collection of warehouses and distribution centers in Southern California. This latter component is notable, as a high degree of the trans-load cargo is based upon domestic container (53 foot boxes) movements. Not all areas of the country enjoy the cost efficiency of the domestic box trade (for example, the Pacific Northwest sees very few domestic boxes) whereas the Southern California regional container traffic is almost 50% domestic.
From 2000 until 2007, congestion was a major concern of shippers and shipping companies using Southern California ports. Increases in container volumes outpaced increases in capacity, leading to severe delays and breakdowns in intermodal reliability. Labor union strikes further reduced the reliability of West Coast facilities, leading shippers to seek alternative routes, such as the all-water route through the Panama Canal to East and Gulf Coast ports, to gain more consistency in transit times for goods destined for the US heartland. According to figures from the American Association of Port Authorities (AAPA), 2007 US West Coast container volumes decreased by 1% from the previous year, while East Coast and Gulf Coast ports saw increases of 4% and 13% respectively. The expansion of the Panama Canal is expected to further accelerate this shift from 2014 onwards. West Coast congestion, environmental concerns, infrastructure capacities—and the associated increased costs for each of these—along with the resultant expected shift to an all-water routing, are part of the rationale for many Gulf and Southeastern US port authorities’ (including PONO’s) plans to expand the capacity of their container handling facilities.

PORT OF NEW ORLEANS STRATEGIC ADVISORY REPORT
NAPOLEON AVENUE CONTAINER TERMINAL DEVELOPMENT UTILIZING PUBLIC-PRIVATE PARTNERSHIPS
Demand Analysis & Forecast 13
However, the current economic climate calls into question whether port congestion, or more importantly, the shipper’s perception of such congestion, will persist at the West Coast ports. In 2008 an even more dismal picture of West Coast port volumes has emerged, with a decline of 8.2% from 2007. As the economic downturn dampens the growth of container imports, shippers and shipping companies’ long-held perception of West Coast port congestion could potentially diminish. This in turn could translate into lower than expected container volume growth for US Southeast and Gulf ports, as shippers continue to utilize West Coast ports to access the Midwest market.
Figure 3-6: US Container Volumes and Share of Total US Container Volumes by Region, 1995 to 2007
-
5
10
15
20
25
30
1995
1996
1997
1998
1999
2000
2001
2002
2003
2004
2005
2006
2007
Con
tain
er V
olu
mes
(in
mill
ion
TEU
s)
AtlanticWest CoastGulf
0%
10%
20%
30%
40%
50%
60%
1995
1996
1997
1998
1999
2000
2001
2002
2003
2004
2005
2006
2007
Shar
e of
tot
al U
S im
port
s (%
)
West CoastAtlanticGulf
Source: AAPA & PB Analysis

PORT OF NEW ORLEANS STRATEGIC ADVISORY REPORT
NAPOLEON AVENUE CONTAINER TERMINAL DEVELOPMENT UTILIZING PUBLIC-PRIVATE PARTNERSHIPS
Demand Analysis & Forecast 14
3.2.4 PONO’s Competitive Position
The competition that PONO faces from neighboring port facilities varies by trade lane, i.e. its natural hinterland shifts by trade; therefore, an analysis of PONO’s competitiveness must be conducted with that in mind. In this section of the report, the competitive position of PONO is discussed from the perspective of its current business profile—the two major trade lanes, US-Latin America and US-Europe. A discussion on PONO’s competitive position in terms of prospective Northeast Asia trade is provided in Section 3.4.
Based on interviews with customers of the Port, an additional competitive factor—applicable across existing trade lanes as well as potential trade lanes—that warrants consideration is the degree to which the Port’s overall cost structure is competitive with its peers, particularly those in the Gulf. In considering these costs, it is important to include not only the costs associated with port tariffs, crane charges, and stevedoring fees—where customer sentiments indicated that the Port is competitive with its peers—but also the ‘support services’ such as pilotage, as well as the costs of fuel associated with transiting the Mississippi River. While the Port may have advantages in serving certain customers along specific trade lanes, if the total costs associated with the movement of cargo through the port exceed those of competing ports by a sufficient amount, a ‘tipping point’ may be reached beyond which customer loyalties may be overridden by economic considerations.
US-Latin America
Ports located in the Gulf are a natural gateway for Latin American goods, and among all the trades currently handled by the port, PONO’s hinterland stretches farthest for goods traded between the US and Latin American countries. A review of PONO’s cargo database shows that for this trade lane, the port’s market reaches as far north as Michigan and as far west as California, made possible by the port’s connectivity to the six Class I railroads. PONO’s container throughput is dominated by exports along this trade route, with the largest product groups being plastics, rubber, chemical products, paper and paperboard materials.
For this trade, PONO’s most significant competitors are neighboring Gulf coast ports, particularly those offering similar inland connectivity into the industrial-product-manufacturing states of Louisiana, Missouri and Texas. Over the past five years, Houston has been gaining share along this trade lane, mainly due to Texas’ relatively faster growing chemicals and plastic manufacturing base. From 2003 to 2008, PONO’s share of total US exports to Latin America fell slightly from 5.9% to 4.8%, while Houston’s share increased by approximately five percentage points from 16.2% to 21.5%9.
9 US Census, percentage calculated from US containerized vessel value

PORT OF NEW ORLEANS STRATEGIC ADVISORY REPORT
NAPOLEON AVENUE CONTAINER TERMINAL DEVELOPMENT UTILIZING PUBLIC-PRIVATE PARTNERSHIPS
Demand Analysis & Forecast 15
US-Europe
PONO’s hinterland for the US-Europe trade lane is not as extensive as that for US-Latin American trade, as East Coast ports from New York/New Jersey to Savannah are particularly competitive for reaching the upper Midwest. A review of PONO’s cargo database shows that the port handles mostly exports from Missouri (synthetic resins and plastics), Louisiana (chemicals and plastics), Texas (chemicals and rubber/plastics) and Alabama (lumber).
From 2003 to 2008, PONO experienced a slight decrease in share of total US exports to Europe, from 4.4% to 3.5%, while Houston’s share increased by two percentage points, from 13% to 15%. This trend is again due to the comparatively more robust growth of the plastic and chemicals exports from Texas vis-à-vis the states for which PONO is more competitive.
3.2.5 PONO’s Competitive Advantages Current competitive advantage—barge system
One of the comparative advantages of PONO is the availability of a bundle of inland transportation services for containerized cargo transiting the port. While many major ports in the US offer rail and truck connections, PONO also has direct access to the Mississippi River barge system, one of the most cost-effective, albeit slower, method of moving containers in and out of the region.
The Mississippi River system connects PONO with major inland ports with relatively large consumption/production markets, such as Memphis, Cincinnati, St. Louis, Chicago, St. Paul and Pittsburgh. Although the barge is a slower transportation mode than alternatives, there are several advantages of the barge system that makes it very competitive for the movement of certain containerized goods.
First, barges are more cost-effective than other modes due to efficient fuel consumption. According to the US Department of Transportation, barges can move a ton of freight 514 miles utilizing one gallon of diesel, a significantly greater distance than that of trucks (59 miles) and of rail (202 miles), translating into savings for the shipper.
Second, in contrast especially to truck transport, container-on-barge (COB) shipping is more efficient and streamlined. Although a truck can transport a container from Memphis to New Orleans in eight to 10 hours, the fact remains that it is still one container. A fully-laden standard-sized barge can accommodate up to 90 TEUs, and make the same trip in seven days. The use of trucks in moving 90 TEUs involves 90 sets of paperwork, while COB shipment of the same load requires only one.
Third, containers that travel on barges are not subject to the same weight restrictions as those transported on truck. Truck-loaded containers that carry heavy items are often loaded only 80%, due to US highway weight restrictions. The use of the barge system

PORT OF NEW ORLEANS STRATEGIC ADVISORY REPORT
NAPOLEON AVENUE CONTAINER TERMINAL DEVELOPMENT UTILIZING PUBLIC-PRIVATE PARTNERSHIPS
Demand Analysis & Forecast 16
for the transport of such goods allows each container to be fully loaded, once again translating into cost-savings for the shipper (notwithstanding the potential for overweight issues with the “last mile”; the delivery of the container from the barge terminal to the ultimate destination).
Fourth, as the safest mode of transportation, the barge system is particularly accommodating in the movement of hazardous materials within the US. The use of COB for the transport of such materials amounts to greater insurance savings than are achievable by the use of truck or rail.
Due to the aforementioned advantages, the barge system is attractive to the movement of the following non-time sensitive and heavy commodities, creating a niche market in which PONO will be particularly competitive vis-à-vis other ports:
• Industrial chemicals
• Minerals
• Forest products
• Metals
• Waste products
• Specialty grains and other agricultural products
• Other hazardous cargo
Presented below is a list of specific containerized commodities, and their corresponding average value per metric ton, for which the barge system may be particularly attractive.
Table 3-3: Low-Value Containerized Commodities are Likely to Utilize the Mississippi River Barge System at PONO
CommodityValue
(USD/MT)Hydrogen Peroxide 170 Sodium and Potassium Hydroxides & Sodium and Potassium Peroxides 260 Milling Products; Malt; Starch; Inulin; Wheat Gluten 340 Sulfates; Aluminums; Peroxosulfates (persulfates) 380 Chloromethane And Chloroethane 420 Wood And Articles Of Wood; Wood Charcoal 500 Nucleic Acids & Salts 580 Sulfides Of Nonmetals 610 Paper & Paperboard & Articles 620 Wood Pulp Etc; Recovd (waste & scrap) 650 Iron And Steel 770
Source: US Census & PB Analysis

PORT OF NEW ORLEANS STRATEGIC ADVISORY REPORT
NAPOLEON AVENUE CONTAINER TERMINAL DEVELOPMENT UTILIZING PUBLIC-PRIVATE PARTNERSHIPS
Demand Analysis & Forecast 17
From a shipper’s perspective, the availability of options—trucks, six Class I Railroads and the barge system—at PONO is valuable, allowing them flexibility to select different modes of transportation to match their different cargo profiles and minimize costs.
Current competitive advantage: customer-oriented focus
In the aftermath of Hurricane Katrina, the Port of New Orleans was able to restore service to its customers at the Napoleon Avenue Container Terminal within one month. By customer accounts, this response was commendable and demonstrates a customer orientation on the part of the Port’s leadership that was cited in various customer interviews during this study. The desire on behalf of the Port’s management to accommodate customer requests and needs to achieve success for all parties is a valuable asset that can be used to enhance the image of the Port in the industry as one that focuses on providing a positive experience for its customers, including shippers, carriers, and consignees, among others.
Prospective competitive advantage: improving intermodal handling capabilities
One of the developments that could positively affect PONO’s competitive position in handling trade with Latin America and with Europe would be a significant improvement in its intermodal rail transfer capabilities, specifically an expansion of the port’s intermodal yard. For shippers and the liner companies that provide inclusive transportation in partnership with railroad partners, such a development could yield both faster and more reliable shipments. This could allow shipping companies to provide guarantees of faster delivery times which would translate into direct savings and to shippers. There are a variety of factors that enter into determining the magnitude of time savings and increases in reliability that could be achieved. Such factors include the ability to move trains quickly into and out of the intermodal yard, whether sufficient volume allows trains to be moved on a daily (or more frequent) schedule, and the balance of inbound and outbound cargo. What is clear, however, is that significant improvements in transit time and reliability can result in a distinct competitive advantage for a port relative to directly competitive ports, or even to a terminal relative to other terminals in the same port.
As a case in point, the Port of Savannah has on-dock rail facilities (which have recently been expanded) while the Port of Charleston offers off-dock rail connections requiring local drayage. It is PB’s opinion based on recent studies that this difference has been a significant factor in assisting the Port of Savannah in achieving significant growth rates while this has not been the case in Charleston.
For New Orleans, the availability of its adjacent intermodal yard, especially if it is expanded and upgraded, should provide the Port with a significant competitive advantage with its close-by neighbor Gulfport. New Orleans is competitive with Mobile (that also has on dock rail facilities) for reaching inland US markets via the CN.

PORT OF NEW ORLEANS STRATEGIC ADVISORY REPORT
NAPOLEON AVENUE CONTAINER TERMINAL DEVELOPMENT UTILIZING PUBLIC-PRIVATE PARTNERSHIPS
Demand Analysis & Forecast 18
3.3 Summary of Forecast
3.3.1 Background & Historic Container Throughput
To provide some context to PB’s forecasts, presented in this section is a brief summary of PONO’s container throughput over the recent years. Container volumes at PONO remained flat over the past decade, having increased from 305,780 TEUs in 1998 to 306,538 TEUs in 2008. While ports such as Houston, Savannah and LA/Long Beach enjoyed significant container volume increases with the surge in Northeast Asian imports, PONO did not capture much of this business and continued to move primarily transatlantic and Latin American containerized cargo.
In 200710, PONO container cargo was dominated by transatlantic trade, which made up 43% of total container volumes at the port (see Figure 3-7 below). Container volumes along this trade lane grew at a CAGR of 2% from 2003 to 2007, bolstered by US exports of chemicals to Northern Europe and of cotton to Turkey. This growth, however, is secondary to that of South American container trade, which exhibited a robust 16% CAGR over the same period, amounting to 86,683 TEUs and representing 34% of total PONO containers in 2007.
However, containerized cargo along other trade lanes has been declining in aggregate terms over the past five years, at an average annual rate of 5.1% as PONO has lost market share to competitive ports. The ports of Houston and Charleston have been gaining share of Central American and Caribbean trade.
Figure 3-7: Trade Lane Composition of New Orleans Container Throughput, 2007
31%
17%
16%
15%
11%
3%
1% 6%Northern Europe
West Cost SouthAmerica
East Coast SouthAmerica
Mediterranean
Central America
Caribbean
Far East
Other
Source: Port of New Orleans
10 2008 PONO trade lane-specific data was not available at the time of writing; therefore, 2007 was used as the most recent reference year in this discussion.
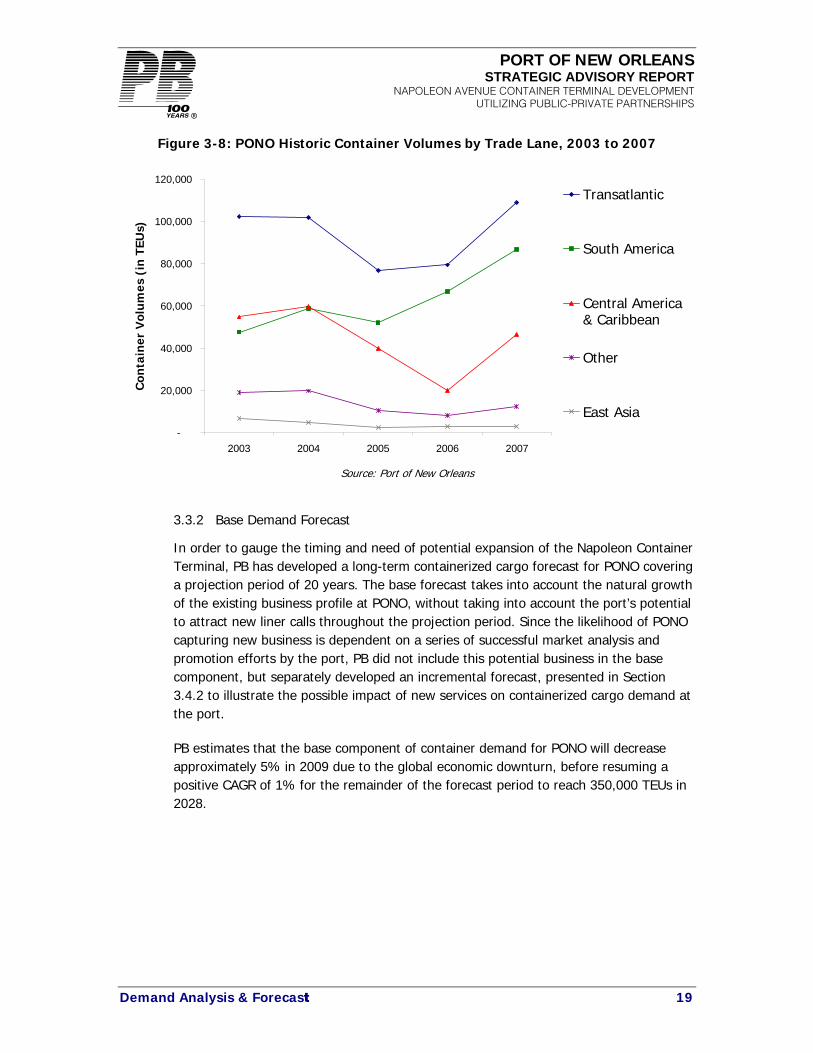
PORT OF NEW ORLEANS STRATEGIC ADVISORY REPORT
NAPOLEON AVENUE CONTAINER TERMINAL DEVELOPMENT UTILIZING PUBLIC-PRIVATE PARTNERSHIPS
Demand Analysis & Forecast 19
Figure 3-8: PONO Historic Container Volumes by Trade Lane, 2003 to 2007
-
20,000
40,000
60,000
80,000
100,000
120,000
2003 2004 2005 2006 2007
Con
tain
er V
olu
mes
(in
TEU
s)
Transatlantic
South America
Central America& Caribbean
Other
East Asia
Source: Port of New Orleans
3.3.2 Base Demand Forecast
In order to gauge the timing and need of potential expansion of the Napoleon Container Terminal, PB has developed a long-term containerized cargo forecast for PONO covering a projection period of 20 years. The base forecast takes into account the natural growth of the existing business profile at PONO, without taking into account the port’s potential to attract new liner calls throughout the projection period. Since the likelihood of PONO capturing new business is dependent on a series of successful market analysis and promotion efforts by the port, PB did not include this potential business in the base component, but separately developed an incremental forecast, presented in Section 3.4.2 to illustrate the possible impact of new services on containerized cargo demand at the port.
PB estimates that the base component of container demand for PONO will decrease approximately 5% in 2009 due to the global economic downturn, before resuming a positive CAGR of 1% for the remainder of the forecast period to reach 350,000 TEUs in 2028.

PORT OF NEW ORLEANS STRATEGIC ADVISORY REPORT
NAPOLEON AVENUE CONTAINER TERMINAL DEVELOPMENT UTILIZING PUBLIC-PRIVATE PARTNERSHIPS
Demand Analysis & Forecast 20
Figure 3-9: Base Projection of Container Demand at PONO, 2009 to 2028 (in thousand TEUs)
-
50
100
150
200
250
300
350
400
2007
2008
2009
2010
2011
2012
2013
2014
2015
2016
2017
2018
2019
2020
2021
2022
2023
2024
2025
2026
2027
2028
Con
tain
eriz
ed c
argo
dem
and
(in
th
ousa
nd
TEU
s)
Source: PB Analysis
Listed below are the key underlying assumptions of this component of the forecast:
• US container trade growth will resume, at a 3.5% annual growth after 2011.
• PONO’s container cargo demand is not expected to benefit much from the containerization of break-bulk cargoes. This is because such cargoes have already reached high containerization rates, such as plastics (90%) and rubber (88%). Although high bulk vessel rates over the past three years led to increased containerization of dry bulk cargoes such as wood pulp, grains and iron and steel, the dry bulk vessel market has undergone a sharp correction in the last four months of 2008. As such PB expects that the containerization of dry bulk cargoes will stabilize, and it is assumed that they will not significantly change through the projection period.
• A continuing shift of trade from the West coast to the Atlantic and Gulf coasts will result in an average annual growth of 3.5-4.0% for the Gulf region.
• PONO’s share of Gulf container volumes will continue to decline as the ports of Houston and Mobile gain share. First, import growth for PONO is expected to be lower than that of its competitors. Population growth of the local Louisiana market is projected to grow slower, at an annual rate of only 0.2%, lower than markets served by Mobile (0.6%) and Houston (1.6%)11. Second, PONO’s export
11 Global Insight Regional Forecast, 2008 to 2028

PORT OF NEW ORLEANS STRATEGIC ADVISORY REPORT
NAPOLEON AVENUE CONTAINER TERMINAL DEVELOPMENT UTILIZING PUBLIC-PRIVATE PARTNERSHIPS
Demand Analysis & Forecast 21
growth is projected to be slower than that of Mobile due to the expected higher growth of industrial production in Alabama. From 2008 to 2028, industrial production of states along the Mississippi River is projected to increase at a CAGR of 2.5%, while industrial production in Alabama is projected to grow at a CAGR of 3.3%12.
• A small shift from Napoleon Avenue to the planned Seaboard terminal at France Road is expected, as some of the cargo presently moving through Napoleon Terminal will shift to the new terminal.
3.4 Developing New Service
The planned 2014 opening of the expanded Panama Canal has been heralded as an impetus of future growth for the entire Gulf region. However, it is PB’s opinion that not all Gulf ports will necessarily see increases in container throughput as a result of the expansion because the impact of the Canal expansion has very specific trade lane, commodity and regional dimensions.
The major impact of the Canal expansion will be seen on long-haul trades, specifically Northeast Asia-US trade, where larger vessels will be increasingly deployed to take advantage of economies-of-scale. North-South trade lanes, on the other hand, will see little impact of the expansion, as ship sizes are not likely to change due to port draft restrictions in Latin America and the relatively short maritime distance which does not encourage the use of large vessels. Therefore, ports that are likely to benefit from the Canal expansion are those well-positioned for the Northeast Asian business—i.e. those that already have direct Northeast Asian services in place, or are poised to attract new Northeast Asian liner calls.
Although PONO does not have a direct Northeast Asian liner service as of early 2009, it is entirely possible that such a service could develop in the future. In this section, PB will discuss PONO’s potential to attract a Northeast Asian liner service and present an incremental demand projection assuming this development is successful.
It is also possible that PONO may be able to attract new services along trade lanes other than Northeast Asia-US. However, while the probability of a new Northeast Asian service can be concretely tied to Panama Canal expansion, there is no specific development in the foreseeable future that would necessarily lead to new services developing along other trade lanes. Therefore, the incremental demand projection presented in this report focuses on Northeast Asian services. The incremental volumes, however, would be applicable in the event new services are developed in other trade lanes.
3.4.1 Potential for New Northeast Asian Liner Service
The impact of Panama Canal expansion on Gulf ports has specific trade lane, commodity and regional dimensions. While the specific trade lane has already been identified—
12 Ibid.
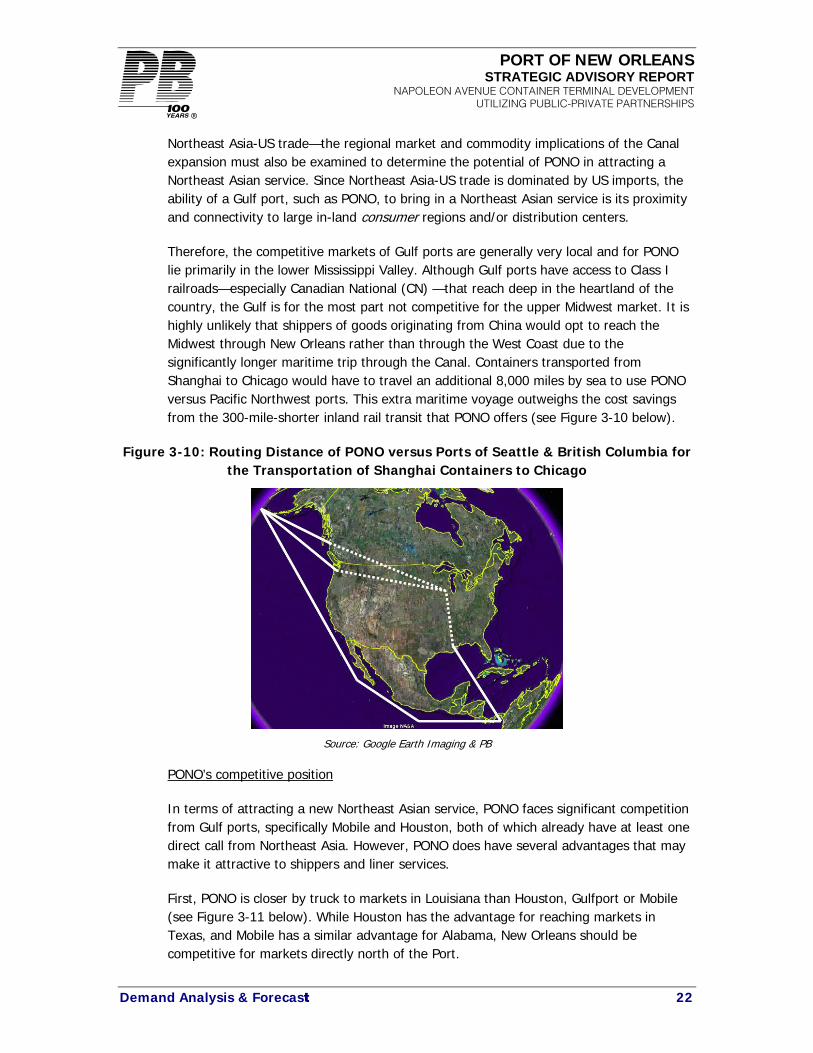
PORT OF NEW ORLEANS STRATEGIC ADVISORY REPORT
NAPOLEON AVENUE CONTAINER TERMINAL DEVELOPMENT UTILIZING PUBLIC-PRIVATE PARTNERSHIPS
Demand Analysis & Forecast 22
Northeast Asia-US trade—the regional market and commodity implications of the Canal expansion must also be examined to determine the potential of PONO in attracting a Northeast Asian service. Since Northeast Asia-US trade is dominated by US imports, the ability of a Gulf port, such as PONO, to bring in a Northeast Asian service is its proximity and connectivity to large in-land consumer regions and/or distribution centers.
Therefore, the competitive markets of Gulf ports are generally very local and for PONO lie primarily in the lower Mississippi Valley. Although Gulf ports have access to Class I railroads—especially Canadian National (CN) —that reach deep in the heartland of the country, the Gulf is for the most part not competitive for the upper Midwest market. It is highly unlikely that shippers of goods originating from China would opt to reach the Midwest through New Orleans rather than through the West Coast due to the significantly longer maritime trip through the Canal. Containers transported from Shanghai to Chicago would have to travel an additional 8,000 miles by sea to use PONO versus Pacific Northwest ports. This extra maritime voyage outweighs the cost savings from the 300-mile-shorter inland rail transit that PONO offers (see Figure 3-10 below).
Figure 3-10: Routing Distance of PONO versus Ports of Seattle & British Columbia for the Transportation of Shanghai Containers to Chicago
Source: Google Earth Imaging & PB
PONO’s competitive position
In terms of attracting a new Northeast Asian service, PONO faces significant competition from Gulf ports, specifically Mobile and Houston, both of which already have at least one direct call from Northeast Asia. However, PONO does have several advantages that may make it attractive to shippers and liner services.
First, PONO is closer by truck to markets in Louisiana than Houston, Gulfport or Mobile (see Figure 3-11 below). While Houston has the advantage for reaching markets in Texas, and Mobile has a similar advantage for Alabama, New Orleans should be competitive for markets directly north of the Port.

PORT OF NEW ORLEANS STRATEGIC ADVISORY REPORT
NAPOLEON AVENUE CONTAINER TERMINAL DEVELOPMENT UTILIZING PUBLIC-PRIVATE PARTNERSHIPS
Demand Analysis & Forecast 23
Second, PONO has significant potential for exporting containerized cargo to Northeast Asia. In 2008, only 6% of Louisiana’s containerized exports (in terms of nominal value) to Northeast Asia transited PONO, while most of the state’s exports moved to Northeast Asia via West Coast ports (see Table 3-4). The potential of containerized exports at PONO strengthens the case for the establishment of a Northeast Asian liner service, since liner companies can maximize revenues with balanced trade in both directions.
Finally, PONO’s barge system allows the port to extend its competitive region to the Midwest for select commodities (see Figure 3-12). Shippers may prefer to transport low-value commodities to the Midwest on a significantly cheaper all-water route through the Canal and inland waterways. As mentioned in the competitive analysis earlier, the availability of various inland transit options is valuable for the shipper as it allows mixing and matching of transportation modes to optimize inventory levels and minimize costs.
Figure 3-11: PONO’s Competitive Market for Northeast Asia-US Trade Lane Lies in the Lower Mississippi Valley
Source: PB Analysis
Table 3-4: PONO Share of Louisiana Containerized Exports to Northeast Asia, 2008 (in USD and %)
Commodity Total LA Export Value
2008 PONO Export Value
2008 PONO Share
(in %)All Commodities 787,304,551 45,194,022 6%Plastics And Articles Thereof 224,809,606 4,696,990 2%Organic Chemicals 156,981,078 17,029,215 11%Rubber And Articles Thereof 136,712,293 1,512,300 1%Inorganic Chemicals; Metals & Radioactive Compounds 50,115,610 2,317,309 5%Nuclear Reactors, Boilers & Machinery 43,454,258 2,091,618 5%Miscellaneous Chemical Products 29,563,646 767,258 3%Wood Pulp; Recovd (waste & Scrap) 25,591,336 1,505,292 6%Soap Etc; Waxes, Polish; Candles; Dental Preps 18,192,946 5,318,001 29%Copper And Articles Thereof 13,584,793 1,419,908 10%Miscellaneous Edible Preparations 12,553,724 118,366 1%Aluminum And Articles Thereof 11,239,312 2,023,743 18%
Source: US Census and PB analysis

PORT OF NEW ORLEANS STRATEGIC ADVISORY REPORT
NAPOLEON AVENUE CONTAINER TERMINAL DEVELOPMENT UTILIZING PUBLIC-PRIVATE PARTNERSHIPS
Demand Analysis & Forecast 24
Figure 3-12: Barge System May Allow PONO to be Competitive for the Midwest in Terms of Low-Value commodities
Source: PB Analysis
Ultimately, the port’s prospects for acquiring Northeast Asian liner services will depend on PONO’s marketing approach, competitive strategies and its ability to organize common interests with shippers, liner companies and Logistics Service Providers (LSPs).
3.4.2 Incremental demand projection based on new service
In this section of the report, we provide an incremental demand projection for PONO, based on the assumption that the port succeeds in attracting new Northeast Asian liner services resulting in part from the opening of the expanded Panama Canal. This additional demand projection is presented with the objective of determining how additional business at PONO may affect capacity requirements at the Napoleon Container terminal.
Figure 3-13 illustrates estimated demand that would result from two new Northeast Asian liner services. Due to the nature of these services, demand develops in large increments as opposed to a steady linear progression. Due to the current economic downturn, PB believes that new Northeast Asia services are not likely to occur until the time the expanded Panama Canal is projected to open, in 2014.
Under these specific assumptions, PONO could potentially see container volumes increase by 200,000 TEUs per year by 2021, assuming a three-year ramp-up period of two weekly services. With the addition of one new Asian service, PONO container volumes would reach an estimated 450,000 TEUs by 2028. In the event that PONO is

PORT OF NEW ORLEANS STRATEGIC ADVISORY REPORT
NAPOLEON AVENUE CONTAINER TERMINAL DEVELOPMENT UTILIZING PUBLIC-PRIVATE PARTNERSHIPS
Demand Analysis & Forecast 25
able to attract two new services, container volumes would increase by another 100,000 TEUs higher, reaching 550,000 TEUs by the end of the projection period.
Figure 3-13: Overall Demand Projections for PONO, 2009 to 2028
-
100
200
300
400
500
60020
07
2008
2009
2010
2011
2012
2013
2014
2015
2016
2017
2018
2019
2020
2021
2022
2023
2024
2025
2026
2027
2028
Con
tain
er c
argo
dem
and
(in
th
ousa
nd
TEU
s)
Base Forecast New Asian Service 1 New Asian Service 2
Source: PB Analysis
* Note that the graphic above serves as a general illustration as to how cargo demand may increase with the addition of new services. The ramp-up of the services may, in reality, entail a series of irregular step-functions rather than the smooth line shown above.
3.4.3 Key Actions to Capture Potential New Service
Achieving new Northeast Asia service, or services along other trade lanes, will require working in parallel with shipping lines, railroads, and LSPs to demonstrate the value of establishing a new service, with shippers to promote the benefits of using a service, and with companies involved in transportation (terminal operators, etc) who may provide ancillary services. Specific steps in a plan should include:
1) Refine the market analysis from the sector-level analysis conducted for this study to one focused on specific companies and commodities that are imported into and exported from the Lower Mississippi Valley through the US West Coast, particularly the ports of Los Angeles and Long Beach, and quantify the container volumes that are involved in this trade. Manifest-level data is commercially available to help accomplish such an analysis and could be supplemented by focused primary research including surveys. Two general categories of trade flows would be covered by this analysis. These include goods moved through West Coast ports that are then directly moved by rail or truck for transport to inland intermodal connections (e.g. in Memphis). The second category is goods

PORT OF NEW ORLEANS STRATEGIC ADVISORY REPORT
NAPOLEON AVENUE CONTAINER TERMINAL DEVELOPMENT UTILIZING PUBLIC-PRIVATE PARTNERSHIPS
Demand Analysis & Forecast 26
that are transferred from West Coast ports to facilities in Southern California where the goods are trans-loaded from international containers to larger 53-foot domestic containers for transport to their ultimate destinations.
2) Identify and prioritize the companies and products that may benefit from using New Orleans via the Panama Canal as opposed to West Coast ports and the intermodal rail system. It is expected that lower-value and/or less time-sensitive products such as industrial materials are likely to benefit most from lower transportation costs that may be realized from Panama Canal expansion.
3) Develop a detailed marketing program to reach potential beneficiaries of new Northeast Asian services. This program would include working with local business interests in Louisiana and other Lower Mississippi Valley states in an outreach program, and cooperating with the terminal operators, LSPs and other third party logistics providers to prioritize marketing efforts.
4) In parallel, develop a marketing program to enhance cargo volumes and liner services derived from Latin American and European trade lanes.
5) Depending on the market analysis results, work with Louisiana state government to develop a proposed incentive program that would most effectively and economically boost container shipping through the Port of New Orleans.
6) Work with state and local economic development agencies to identify companies that could benefit from the new lower costs of transportation to relocate to Louisiana or develop new distribution facilities to take advantage of a service.
7) Work with carriers on all of the above steps to demonstrate the benefits of establishing a new service.
8) Monitor short- and mid-term economic and market trends that may result in changes in containerization patterns and develop strategies to take advantage of these trends.
The Port of New Orleans has, of course, been engaged in these types of marketing activities for many years. However, the key impetus for developing new less-expensive Northeast Asian services is the expansion of the Panama Canal, and this development has only recently moved towards reality. Since the referendum was passed by the Panamanian people in late 2006 approving the Canal expansion, more complete plans have been developed, including final arrangements for financing completed in late 2008. This now-imminent development could provide a new focus on working with liner companies and others as they make more specific plans based on details of the Canal expansion, such as lock size and the expansion schedule. An additional key component of a new marketing plan will be to present as clear a picture as possible to liner companies, and other key potential partners, about long-term plans for developing Louisiana state ports. These companies will be interested in minimizing uncertainty in their investment plans, and any steps that may be taken to clarify for them the State’s port development plans will aid in accomplishing this end.

PORT OF NEW ORLEANS STRATEGIC ADVISORY REPORT
NAPOLEON AVENUE CONTAINER TERMINAL DEVELOPMENT UTILIZING PUBLIC-PRIVATE PARTNERSHIPS
Capacity Analysis 27
4 Capacity Analysis
The primary factor used to identify when and how much infrastructure, equipment or operating practices (three key elements for estimating capacity) need to expand or be modified is annual throughput capacity (capacity), particularly when compared to projected demand. A marine terminal’s capacity is directly affected by a variety of characteristics of these three key elements. For this analysis the container terminal capacities for both Ceres and PAG operations were considered, based upon the present operating characteristics at the time of this analysis. Capacities for these terminals were estimated in TEUs per year.
4.1 Throughput Capacity Analysis Methodology
To interpret terminal capacity estimates, it is important to first understand how capacity is defined, the methodology used to estimate capacity and the general approach for the model calculations.
4.1.1 UTC, MPC & SPC
When considering a marine terminal’s capacity, several values can be used. Before capacity can be estimated and used for planning purposes, it must be defined. The typical capacity values that are used in the maritime industry include:
• Ultimate Theoretical Capacity (UTC): Considered to be the ultimate high end of a terminal’s ability to handle cargo demand. This ultimate capacity value is only constrained by the terminal infrastructure. For example, berth length, terminal area and gate complex control this capacity value. All operating and equipment capabilities are assumed at the highest and most efficient levels. UTC is not used for facility sizing, needs identification or future planning; however, it does indicate the highest theoretical capacity level that a terminal can obtain.
• Maximum Practical Capacity (MPC): The practical upper limit of a terminal’s ability to handle cargo demand is referred to as MPC. This capacity level is constrained by infrastructure, equipment and/or operating capabilities. For planning purposes, MPC represents the highest level of throughput that a terminal can handle for a short period of time. MPC is difficult to maintain over long periods of time and can result in inefficient/costly operations as it often requires excessive re-handling and other work-around operations. Operating a terminal at MPC can significantly increase equipment maintenance, labor and energy/fuel costs to a level that can exceed profitability. For planning purposes, MPC is the upper threshold for determining the timeline when marine terminal improvements.
• Sustainable Practical Capacity (SPC): The SPC is the capacity at which improvements should be considered and generally ranges between 70% and 90% of MPC. When comparing capacity to projected throughput demand, a more aggressive demand curve (i.e. 15%+/- growth rate) requires the use of 70%-80% MPC for the SPC value while a lower projected demand curve (i.e. 1%-5% growth rate) would use 90% of MPC. When a terminal has reached the SPC, otherwise known as the
PORT OF NEW ORLEANS STRATEGIC ADVISORY REPORT
NAPOLEON AVENUE CONTAINER TERMINAL DEVELOPMENT UTILIZING PUBLIC-PRIVATE PARTNERSHIPS
Capacity Analysis 28
‘trigger point’, this signals the time when ports should begin the planning, design, equipment procurement or operation modification/technology acquisition process for improvements. The duration of time from when a terminal reaches its SPC to when it approaches its MPC, is typically the most productive and profitable under efficient management teams. For planning purposes in this analysis SPC will be estimated at 80% of MPC. PB has chosen this percentage because, while the base component of container growth is 1% over the projected 20-year demand forecast, the increases from additional liner services have a much steeper curve (approximately 8-9%).
Only MPC and SPC were calculated for this analysis and used for planning future capacity improvements.
4.1.2 Capacity Modeling Approach To estimate the MPC and SPC of a container terminal, a sound modeling methodology is required. Following a methodology that has been accepted by the US Maritime Administration, capacity for a marine terminal is estimated for each component of the terminal and the component with the lowest capacity limits the terminals overall throughput capability. An analogy typically used is that cargo flows through a terminal similar to the flow of water down a river. The most narrow and shallow point along a river will constrain the flow of water. The four key components to consider when estimating annual throughput capacity are:
• Wharf/Berth – This component is highly dependant on the length of berth and the amount/productivity of the cranes. For example, berth congestion resulting from berth or crane availability/capability can limit the capacity at this component.
• Storage – The primary variables that affect storage capacity are the size of storage area, amount and type of yard equipment, and cargo dwell time. In essence, the amount of cargo that can be held at any given point (defined as static capacity) and the amount of time that cargo resided in the storage area.
• Gate – This capacity is very sensitive to the number of gate lanes, hours of operation and the processing rates at each lane. These variables can differ between inbound and outbound moves.
• Intermodal Rail – Working and storage track static capacity, cargo transfer and train switching times are the key variables that affect intermodal rail capacity. This includes the total number and length of rail tracks (working and storage), rail car (un)loading rate of the terminal equipment and time required to push in and pull out the rail cars between cargo transfer activities and terminal operating hours.
The wharf/berth and gate components were calculated together for both the Ceres and PAG Terminals because they are shared/common user components. The intermodal rail yard is operated by Ceres, but both operators use it. Therefore its capacity was also calculated as a shared operation. The storage component was estimated separately for each terminal because the facilities, equipment and operations are independent of one

PORT OF NEW ORLEANS STRATEGIC ADVISORY REPORT
NAPOLEON AVENUE CONTAINER TERMINAL DEVELOPMENT UTILIZING PUBLIC-PRIVATE PARTNERSHIPS
Capacity Analysis 29
another. The two storage capacities are added together to show the total throughput capacity of the Napoleon Avenue Container Terminal operations.
The component with the lowest or limiting capacity is used to represent the overall terminal’s throughput capacity. In this section of the report, the existing capacity at the terminal was estimated. This capacity provides the base case for which all future capacity analysis, what-if options are based on and derived from.
4.2 Model Input Variables
The variables used to estimate the base case existing capacity for the Ceres and PAG operations are provided in the following subsections 4.2.1 through 4.2.5 provided below. The base/existing condition variables were developed in coordination with the existing terminal lease plans provided in Figures 4-1 and 4-2.
4.2.1 General Terminal Variables
Table 4-1 provides a summary of the general facility characteristics and variables attributed to both the Ceres and PAG operations in the Napoleon Avenue Container Terminal. Some of the variables are shown in a single column under both the Ceres and PAG headers; these variables are common and a part of both operations and used to estimate the capacity of the storage area, but rather are only used in the wharf/berth, gate and/or intermodal rail components that are calculated together.
Table 4-1: General Terminal Variables
Terminal Name Ceres PAG 1. TEU per container (ratio) 1.6 1.6 2. Percent import loads (%) 17% 41% 3. Percent export loads (%) 49% 42% 4. Percent empties (%) 33% 16% 5. Percent import reefer (%) 1% 1% 6. Percent export reefer (%) 7. SPC as a Percent of MPC (%) 80% 8. Percent intermodal rail transfer - import (%) 10% 9. Percent intermodal rail transfer - export (%) 3% 10 Peak to average monthly throughput (ratio) 1 1 11. Percent of time that monthly peaking occurs (%) 0% 0% 13. Total Gross Terminal Area (acre) 55 54 14. Total Storage Area (acre) 38 41
4.2.2 Wharf/Berth
Table 4-2 provides a summary of the common/combined wharf/berth variables used to estimate one capacity for both operations. These variables are all used to estimate the capacity of the shared wharf/berth, and hence are not attributable to the individual operators.

PORT OF NEW ORLEANS STRATEGIC ADVISORY REPORT
NAPOLEON AVENUE CONTAINER TERMINAL DEVELOPMENT UTILIZING PUBLIC-PRIVATE PARTNERSHIPS
Capacity Analysis 30
Figure 4-1: Existing Ceres Operations
Source: Port of New Orleans

PORT OF NEW ORLEANS STRATEGIC ADVISORY REPORT
NAPOLEON AVENUE CONTAINER TERMINAL DEVELOPMENT UTILIZING PUBLIC-PRIVATE PARTNERSHIPS
Capacity Analysis 31
Figure 4-2: Existing Ports America Operations
Source: Port of New Orleans

PORT OF NEW ORLEANS STRATEGIC ADVISORY REPORT
NAPOLEON AVENUE CONTAINER TERMINAL DEVELOPMENT UTILIZING PUBLIC-PRIVATE PARTNERSHIPS
Capacity Analysis 32
Table 4-2: Wharf/Berth Variables
1. Available working hours per day (hrs) 22.5 2. Working days per week (days) 7 3. Number of Holidays per year (days) 0 4. Number of berths (#) 2 5. Average number of vessel calls per year (#) 430 6. Average # of cranes per ship (#) 2 7. Average vessel transfer - import + export (TEU) 600 8. Average crane productivity (lifts/hr) 28 9. Vessel arrival time - lashing/berthing (hr) 1 10. Crane Utilization (%) 80% 11. Percent Crane down time (%) 5% 12. Berth Utilization (%) 65% 13. Berth down time (%) 5%
4.2.3 Storage
Table 4-3 provides a summary of the storage variable for both the Ceres and PAG operations. Note that, because each operator maintains its own dedicated storage area, all of the variables are shown in separate columns attributable to the Ceres and PAG operations. These variables are used to estimate the capacity of separate storage areas for each operator.
Table 4-3: Storage Variables
Terminal Ceres PAG 1. Restricted Empty only storage area (acre) 2 - 2. Multi use storage area…loads and empties (acre) 36 41 3. Percent storage area served by top pick (%) 60% 50% 4. Percent storage area served by reach stacker (%) 10% 10% 5. Percent storage area served by RTG (%) 20% 6. Percent storage area served by empty handler (%) 30% 20% 7. Top Pick container ground slots per acre (#) 80 80 8. Reach stacker container ground slots per acre (#) 60 60 9. RTG container ground slots per acre (#) 100 100 10. Empty handler container ground slots per acre (#) 85 85 11. Import load container stacking height (#) 3 3.5 12. Export Loaded container stacking height (#) 3 3.5 13. Restricted empty container stacking height (#) 3 3 14. Empty container stacking height (#) 5 5 15. Import reefer container stacking height (#) 2 2 16. Export reefer container stacking height (#) 2 2 17. Storage factor - Loads stack utilization (%) 75% 75% 18. Storage factor – Empty stack utilization (%) 75% 75% 19. Storage factor -Reefer stack utilization (%) 75% 75%

PORT OF NEW ORLEANS STRATEGIC ADVISORY REPORT
NAPOLEON AVENUE CONTAINER TERMINAL DEVELOPMENT UTILIZING PUBLIC-PRIVATE PARTNERSHIPS
Capacity Analysis 33
Table 4-3: Storage Variables (continued)
Terminal Ceres PAG 20. Average dwell time - Import Loads (days) 7 7 21. Average dwell time - Export Loads (days) 11 11 22. Average dwell time - Empties (days) 20 20 23. Average dwell time - Import Reefer (days) 5 5 24. Average dwell time - Export Reefer (days) 8 8
4.2.4 Gate
Table 4-4 provides a summary of the gate variables that were used to calculate the estimated gate capacity as a shared facility for both the Ceres and PAG operations.
Table 4-4: Gate Variables
1. Working hours per day (hrs) 10 2. Working days per week (days) 5 3. Holidays (days) 8 4. Processing rate per lane – Gate outbound (trucks/hr/lane) 30 5. Processing rate per lane – Gate inbound (trucks/hr/lane) 20 6. Percent outbound moves - export at wharf (%) 62% 7. Percent inbound moves - export at wharf (%) 33% 8. Percent Transshipment - no gate moves (%) 5% 6. Number of inbound lanes (#) 10 7. Number of outbound lanes (#) 6 8. Number of reversible lanes (#) 9. Percent of time gate delays occur (%) 5%
4.2.5 Intermodal Rail
Table 4-5 provides a summary of the intermodal rail variables which are used to estimate capacity of the intermodal rail as a shared facility for both the Ceres and PAG operations.
Table 4-5: Intermodal Rail Variables
1. Working hours per day (hrs) 10 2. Working days per week (days) 5 3. Holidays (days) 8 4. Total working track length (ft) 6800 5. Working track capacity (TEU) 440 6. Average number of lift equipment used (#) 1.5 7. Average container lifting rate per equipment (lifts/hr) 18 8. Rail working track utilization (%) 80% 9. Switching time per train (hr) 1 10. Percent of time intermodal rail yard delays occur (%) 5%

PORT OF NEW ORLEANS STRATEGIC ADVISORY REPORT
NAPOLEON AVENUE CONTAINER TERMINAL DEVELOPMENT UTILIZING PUBLIC-PRIVATE PARTNERSHIPS
Capacity Analysis 34
4.3 Existing Throughput Capacity Results
The first capacity to be estimated is the MPC and SPC for the current Ceres and PAG operations. This capacity model run was used as the basis for all the follow-on ‘what if’ capacity analyses.
4.3.1 Limiting Component
The storage area currently limits the throughput capability (594, 000 TEU/yr MPC and 475,000 SPC) of the port’s container operations in the combined Ceres and PAG terminal. Note that one capacity for berth, gate and intermodal operations is estimated for both operators as joint facilities. Only the storage area was estimated separately between the two operators, with the two values then added together to achieve a total terminal throughput capacity.
It is important to note that each operator has a different storage capacity and historically the two operators have handled roughly 50% of the port’s container throughput in recent years, with some slight variation each year. Ceres storage yard capacity is currently estimated at 238,000 TEU/yr MPC and their 2008 throughput was approximately 170,000 TEU, while PAG is estimated at 356,000 TEU/yr MPC with 2008 throughput of about 140,000 TEU. While the port currently does have sufficient capacity to handle the first 100,000 TEU/yr additional service, if both operations are considered together, the reality is that this capability is dependant on which operator will receive the new service.
For example, if the new service (100,000 TEU/yr) calls at Ceres it will exceed their current MPC by about 15%, but if that same service calls at PAG, this new throughput will be under the terminal’s current SPC of 285,000 TEU/yr. However, if the two terminals were operating as one and the total combined storage capacities (SPC and MPC) were utilized to accommodate one or two new services, potential capacity expansion strategies can be more efficient and flexible than if capacity expansion needs to carry on for each operator separately.
The intermodal rail capacity shown in Table 4-6 appears to be significantly lower than the storage capacity in the same table. Currently only about 13% of the cargo volumes crossing the wharf go through the intermodal yard. Therefore it is not accurate to compare wharf throughput (actual and projected) to the intermodal rail capacity. A more detailed explanation of this capacity and its comparison to throughput and other capacities are provided below.
The current annual throughput per gross terminal acre at the combined Ceres and PAG facilities is 2,900. This means the annual throughput volume is at 54% of MPC.

PORT OF NEW ORLEANS STRATEGIC ADVISORY REPORT
NAPOLEON AVENUE CONTAINER TERMINAL DEVELOPMENT UTILIZING PUBLIC-PRIVATE PARTNERSHIPS
Capacity Analysis 35
Table 4-6: Existing Capacity Results
Terminal Name Ceres PAG TOTAL MPC
TOTAL SPC
1. Berth Component 619,000 619,000 495,000 2. Storage Component 238,000 356,000 594,000 475,000 3. Gate Component 936,000 936,000 749,000 4. Intermodal Rail Component 82,000 82,000 66,000
Capacity per Gross Terminal Acre 5,400 4,000
4.3.2 Wharf/Berth
The estimated wharf/berth capacity is primarily limited by the number of cranes available to service vessels, especially during simultaneous vessel calls and barge calls. The limitation of berth length when two ships are at port and multiple barges are being worked requires the use of other berths with limited access due to the location of transit sheds at the adjacent Nashville Terminal. The location of Nashville Shed C hinders vessel operations by limiting on-dock ship hatch cover placement, as well as impacting traffic circulation between the dock and storage areas. The longer distance required by yard trucks to transport containers from this wharf to the storage area significantly affects the berth capacity. The proximity of the transit shed to the berth also limits the size of wharf gantry cranes that can operate there. It is not possible to work a ship with 100’ gauge wharf gantry cranes because the distance between the edge of the dock and Nashville Shed C is less than 100’.
This component is the second limiting component. As options for increasing storage capacity are considered, it will be important to understand the associated limitations at the wharf/berth. For future capacity analysis model runs, the port’s two new cranes (ordered in December 2008) were included, thus increasing the wharf/berth capacity to an MPC of 883,000 TEU/yr and an SPC of 706,000 TEU/yr. The limitation of the Nashville Shed C location will be partially mitigated by the two new gantry cranes on order. However once the terminal reaches a throughput of approximately 706,000 TEU/yr, additional wharf capacity will be needed. This may require an extension of the 100’ gauge gantry crane rail and removal of a part or all of Shed C or perhaps Shed B. An alternative to removing sheds would be the development of a new berth and addition of new cranes.
4.3.3 Storage
The overall limiting component of the existing container terminals is the storage area. Both operators experience higher than usual dwell times. The US average for all containers (import, export, reefer, dry, empty…) is 6-8 days. The Napoleon Terminal experiences dwell times between 5 and 20 days, with the average closer to 15 days. The challenge with decreasing dwell times is that these variables are driven by the market and customer/shipper. It can be challenging to identify mutually beneficial

PORT OF NEW ORLEANS STRATEGIC ADVISORY REPORT
NAPOLEON AVENUE CONTAINER TERMINAL DEVELOPMENT UTILIZING PUBLIC-PRIVATE PARTNERSHIPS
Capacity Analysis 36
incentive programs to influence the customer/shipper to decrease the dwell of containers in the terminal.
While one capacity improvement option may include ways to influence the reduction of dwell times, another option is to increase the terminal’s static storage capacity without increasing the terminal footprint by increasing storage density. This is achieved by reaching higher stacking heights and deeper stacking rows. This approach would require additional or different equipment (i.e. Rubber Tired Gantries, Rail-Mounted Gantries, Straddle Carriers, etc.) to handle the higher density stacks.
After considering the maximum and most efficient use of existing infrastructure (decreased dwell time and increased storage density), expanding the terminal footprint could provide additional capacity. This is typically the highest cost approach to increasing storage capacity. However, in some cases where a new business opportunity like a new service or new carrier emerges, the new customer may demand their own operation. In this case the port will need to consider the cost of developing the new terminal vs. the cargo volume/revenue opportunity.
4.3.4 Gate
The gate component has a relatively high existing capacity. In fact, the gate has the highest MPC at 936,000 TEU/yr and SPC at 749,000 TEU/yr. The gate capacity that is comparable to the projected cargo demand (wharf throughput) is actually higher because 13% of the cargo that crosses the wharf arrives and departs via rail and 5% of the cargo crossing the wharf is a transshipment move between barge and container vessel. Therefore, to compare the estimated capacities at the gate to the annual throughput across the wharf, the gate MPC can be considered at 1,140,000 TEU/yr and the SPC at 912,000 TEU/yr. These capacity values are derived by dividing the calculated capacity estimates by 0.82 (1-13%-5%) to accommodate for the volume difference.
The primary variable that is limiting this capacity is the number of shifts worked per day. Currently the gate operates one shift per working day and can easily expand its capacity by almost double by going to two shifts. The challenge with this approach is that it is costly and it would be difficult to get truckers to fully utilize the second shift. Additionally, the gate capacity could be increased by sharing all lanes in a combined operation. Currently each operator has an equal number of lanes dedicated to their operation, while the annual throughput volumes handled by each operator varies. Similar to the challenges with storage capacity and utilization from separate storage yards, this practice of dedicating gate lanes limits the efficient utilization of the gate and its capacity.
4.3.5 Intermodal
The intermodal operation at the port is currently limited by the amount of lift equipment working the tracks. Depending on the rail schedule, the intermodal yard is typically operated with one reach stacker and an additional one is pulled from the storage yard when needed. While the model calculated the throughput capacities at 82,000 TEU/yr

PORT OF NEW ORLEANS STRATEGIC ADVISORY REPORT
NAPOLEON AVENUE CONTAINER TERMINAL DEVELOPMENT UTILIZING PUBLIC-PRIVATE PARTNERSHIPS
Capacity Analysis 37
MPC and 66,000 TEU/yr SPC, only 13% of the cargo volume crossing the wharf goes through the intermodal yard. By dividing the estimated intermodal yard capacities by 0.13 (13%), the intermodal rail facility could theoretically support a wharf throughput of 630,000 TEU/yr and 500,000 TEU/yr, respective to MPC and SPC. Both of these throughput levels are slightly higher than estimated storage capacity for MPC and SPC.
The intermodal rail facility can significantly increase its capacity by adding additional lift equipment that is dedicated to intermodal operations. This could be additional reach stackers, Rubber-Tired Gantries (RTGs) or Rail-Mounted Gantries (RMGs) depending on the desired productivity and capacity levels.
4.4 Base Facility Capacity (Napoleon Ave. yard only)
As a parallel exercise to the previous analysis, PB analyzed the capacity at the Napoleon Avenue Container Terminal as it is defined by the Port of New Orleans (as opposed to how it is currently operated). As defined, the total gross terminal area is 61 acres with 22 acres of storage area for Ceres (20 acres within the main Napoleon Ave. container storage and 2 acres by Napoleon Ave. Wharf “B”) and 22 acres of storage yard for PAG in the Napoleon Ave. container terminal. Figure 4-3 includes a plan view of the base 61-acre operation.
Table 4-7 shows the pertinent variables that were changed from the base existing model and were used for modeling the base Napoleon Avenue Container Terminal capacity. Storage area percentages by equipment type were only changed for PAG, since they use RTGs and when the total storage area was decreased to 22 acres, the RTG percentage increased to 40%. The Ceres terminal operates with reach stackers, top picks and empty handlers that all have similar storage characteristics.
The capacity results are provided in Table 4-8. The computed MPC for the 61-acre terminal correlates well with previously published capacity figures (by others) of 366,000 TEU for the terminal. The resulting MPC/acre and SPC/acre are significantly higher than for the ‘as-operated’ scenario. This is primarily due to the fact that the additional areas being used by both operators are utilizing top picks, reach stackers or empty handlers in a lower density storage mode than base 61-acre areas that have 4 RTGs. In essence, when a significant amount of lower density storage area is removed from consideration, the capacity per acre increases.
Table 4-7: Updated Storage Variables for Base Napoleon Avenue Container Terminal Capacity
Terminal Name Ceres PAG General Information 13. Total Gross Terminal Area (acre) 30 31 14. Total Storage Area (acre) 22 22 Storage Component 1. Restricted Empty only storage area (acre) 2 2. Multi use storage area…loads and empties (acre) 20 22 3. Percent storage area served by top pick (%) 40% 5. Percent storage area served by RTG (%) 40%

PORT OF NEW ORLEANS STRATEGIC ADVISORY REPORT
NAPOLEON AVENUE CONTAINER TERMINAL DEVELOPMENT UTILIZING PUBLIC-PRIVATE PARTNERSHIPS
Capacity Analysis 38
Figure 4-3: Base Ceres & PAG Operations
Source: Port of New Orleans

PORT OF NEW ORLEANS STRATEGIC ADVISORY REPORT
NAPOLEON AVENUE CONTAINER TERMINAL DEVELOPMENT UTILIZING PUBLIC-PRIVATE PARTNERSHIPS
Capacity Analysis 39
Table 4-8: Terminal Capacity for Base Napoleon Avenue Container Terminal
Terminal Name Ceres PAG TOTAL MPC TOTAL SPC1. Berth Component 619,000 619,000 495,000 2. Storage Component 148,000 218,000 366,000 293,000 3. Gate Component 936,000 936,000 749,000 4. Intermodal Rail Component N/A N/A N/A
Capacity per Gross Terminal Acre 6,000 4,700
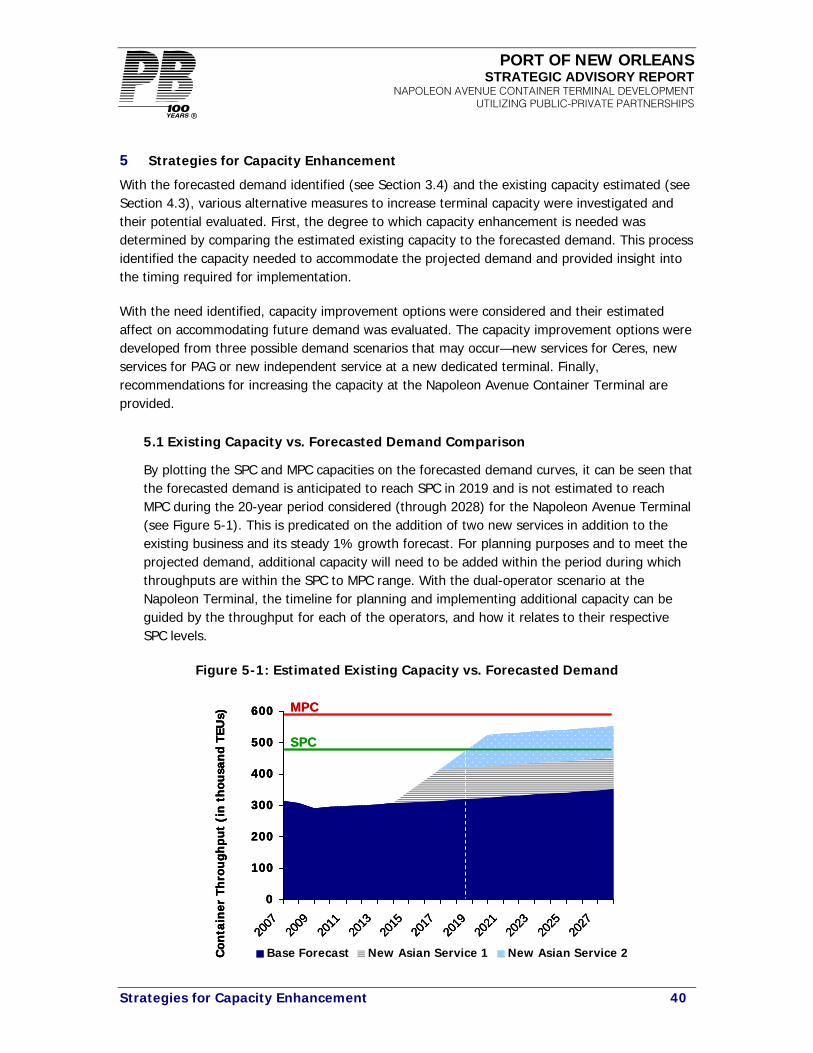
PORT OF NEW ORLEANS STRATEGIC ADVISORY REPORT
NAPOLEON AVENUE CONTAINER TERMINAL DEVELOPMENT UTILIZING PUBLIC-PRIVATE PARTNERSHIPS
Strategies for Capacity Enhancement 40
5 Strategies for Capacity Enhancement
With the forecasted demand identified (see Section 3.4) and the existing capacity estimated (see Section 4.3), various alternative measures to increase terminal capacity were investigated and their potential evaluated. First, the degree to which capacity enhancement is needed was determined by comparing the estimated existing capacity to the forecasted demand. This process identified the capacity needed to accommodate the projected demand and provided insight into the timing required for implementation.
With the need identified, capacity improvement options were considered and their estimated affect on accommodating future demand was evaluated. The capacity improvement options were developed from three possible demand scenarios that may occur—new services for Ceres, new services for PAG or new independent service at a new dedicated terminal. Finally, recommendations for increasing the capacity at the Napoleon Avenue Container Terminal are provided.
5.1 Existing Capacity vs. Forecasted Demand Comparison
By plotting the SPC and MPC capacities on the forecasted demand curves, it can be seen that the forecasted demand is anticipated to reach SPC in 2019 and is not estimated to reach MPC during the 20-year period considered (through 2028) for the Napoleon Avenue Terminal (see Figure 5-1). This is predicated on the addition of two new services in addition to the existing business and its steady 1% growth forecast. For planning purposes and to meet the projected demand, additional capacity will need to be added within the period during which throughputs are within the SPC to MPC range. With the dual-operator scenario at the Napoleon Terminal, the timeline for planning and implementing additional capacity can be guided by the throughput for each of the operators, and how it relates to their respective SPC levels.
Figure 5-1: Estimated Existing Capacity vs. Forecasted Demand
0
100
200
300
400
500
600
2007
2009
2011
2013
2015
2017
2019
2021
2023
2025
2027
Con
tain
er T
hro
ug
hpu
t (i
n t
hou
san
d TE
Us)
Base Forecast New Asian Service 1 New Asian Service 2
MPC
SPC
0
100
200
300
400
500
600
2007
2009
2011
2013
2015
2017
2019
2021
2023
2025
2027
Con
tain
er T
hro
ug
hpu
t (i
n t
hou
san
d TE
Us)
Base Forecast New Asian Service 1 New Asian Service 2
0
100
200
300
400
500
600
2007
2009
2011
2013
2015
2017
2019
2021
2023
2025
2027
Con
tain
er T
hro
ug
hpu
t (i
n t
hou
san
d TE
Us)
Base Forecast New Asian Service 1 New Asian Service 2
MPC
SPC
PORT OF NEW ORLEANS STRATEGIC ADVISORY REPORT
NAPOLEON AVENUE CONTAINER TERMINAL DEVELOPMENT UTILIZING PUBLIC-PRIVATE PARTNERSHIPS
Strategies for Capacity Enhancement 41
The actual timing associated with this need will shift if the realization of increased demand is either accelerated or delayed. If an opportunity to capture new service is realized before the opening of the Panama Canal expansion due to induced demand as described in Section 6.2, then the need and scheduling of new container terminal capacity will be accelerated.
As described above, if the current operations continue and the first new service (as defined in the demand forecast) calls at the PAG portion of the terminal, then there will be sufficient capacity at the Napoleon Avenue Terminal. However, if the new service calls with Ceres or (in the case of a major new service) warrants a new terminal, additional capacity will be needed. Of greater importance is that Ceres’ current throughput is approaching the SPC of its storage yard, indicating that planning for capacity increases should begin for this component of the terminal within the next one to two years.
5.2 Capacity Improvement Options
To develop capacity improvement options it is necessary to understand the unique strategies associated with the Napoleon Terminal. The three alternative strategies that were considered include:
• Modifying Operations: The reduction of dwell times and/or increase of storage density (change operating equipment) are operating changes that can significantly increase a terminal’s capacity without requiring large amounts of capital investment in new or expanded infrastructure.
• Combining Operations: Combining Ceres and PAG into a single operation will provide an increase in capacity by decreasing the amount of terminal acreage for common areas but more importantly, it would alleviate the issue of which operator can accommodate the future service.
• Expand Footprint: When all other lower cost and lower impact strategies have been exhausted, the development of new facilities or the expansion of existing facilities should be considered.
The Port of New Orleans has developed plans for expanding the Napoleon Avenue Terminal, in a possible six stage approach (Stages A through F) in an effort to increase capacity. These stages are shown in Figure 5-2 below and require some description prior to defining the potential variety of capacity improvement options available to PONO.
The purpose of the planned expansion program is to create additional new container handling areas through the redevelopment of the Napoleon Avenue Wharves “B’ and “C” sites and adjacent marshalling yards. Existing wharves will be demolished and new, higher capacity wharves will be built to handle container cranes. Backup areas will be developed into new marshalling yard space. This will enable the Port to have wharves with direct, linear access to the container yards without needing to drive around transit sheds and warehouses.

PORT OF NEW ORLEANS STRATEGIC ADVISORY REPORT
NAPOLEON AVENUE CONTAINER TERMINAL DEVELOPMENT UTILIZING PUBLIC-PRIVATE PARTNERSHIPS
Strategies for Capacity Enhancement 42
Figure 5-2: PONO Phased Development Plan (Stages A-F)
Source: Port of New Orleans
PORT OF NEW ORLEANS STRATEGIC ADVISORY REPORT
NAPOLEON AVENUE CONTAINER TERMINAL DEVELOPMENT UTILIZING PUBLIC-PRIVATE PARTNERSHIPS
Strategies for Capacity Enhancement 43
The cost estimates developed by the port were based on prior projects at the port for unit costs and apply inflation of 5% per annum and a Post-Katrina factor of 20% to calculate the total cost in 2007 US Dollars. The unit costs for which prior estimates were not available were obtained using “RS Means Guide for Estimating Construction Costs”. As part of our activities, PB has reviewed the assumptions, calculations and final cost estimates based on development costs of recent and past projects and notes that the estimates are within the expected range for the construction activities described. However, it should be noted that limited information regarding the development options was available. One item that may warrant additional consideration is that costs associated with installation of security apparatus such as video cameras do not appear to have been included in the cost estimate. These costs may be covered in the line items titled “Allowance for Unknown Infrastructure”.
In presenting summaries of costs for the various stages of proposed expansion in the paragraphs below, costs are in 2009 US Dollars and include engineering and construction support (at 13% of bare costs), and contingencies (at 15% of bare costs).
Stage A deals with demolition of Napoleon Avenue Shed “C” and Napoleon Avenue Wharf “B” as well as demolition of Napoleon Avenue Shed “C” marshalling areas. This stage will involve the construction of 1,100 feet of wharf comprising 765 feet of Napoleon Ave. Wharf “B” and 335 feet of Napoleon Ave. Wharf “C”. Also included in this stage is the installation of 50 ft and 100 ft gauge rails for container cranes. Stage A involves 250,000 sq-ft of area for container operations including 233,500 sq-ft of heavy duty pavements for storage. Demolition and dredging costs for this stage have been estimated at approximately $10.2 million and $2.1 million, respectively. The cost of wharf construction has been estimated at approximately $48,000 per linear ft of wharf. The cost of container yard expansion has been estimated at approximately $46 per sq-ft of yard.
Stage B includes the demolition of Napoleon Wharf “C” and of rail tracks in the vicinity of Wharf “C”. This stage includes the reconstruction of 1,040 feet of wharf comprising 665 feet of Napoleon Avenue Wharf “C” and 375 feet of Napoleon Avenue Open Wharf. This stage further involves installation of 50 ft and 100 ft gauge rails for container cranes. Stage B will also include 33,500 sq-ft of container yard expansion with heavy duty pavements. Demolition and dredging costs for this stage have been estimated at approximately $8.0 million and $2.0 million, respectively. The cost of wharf construction has been estimated at approximately $51,000 per linear ft of wharf. The cost of container yard expansion has been estimated at approximately $42 per sq-ft of yard.
Stage C includes the demolition of Sears’ warehouse structure and foundations. It also includes demolition of existing roadways in preparation of container yard expansion. It will involve preparation of 11.17 acres for container yard expansion and includes the construction of approximately 6 acres of heavy duty pavement. Demolition costs for this stage have been estimated at approximately $1.5 million. The cost of container yard expansion for this stage has been estimated at approximately $32 per sq-ft of yard.
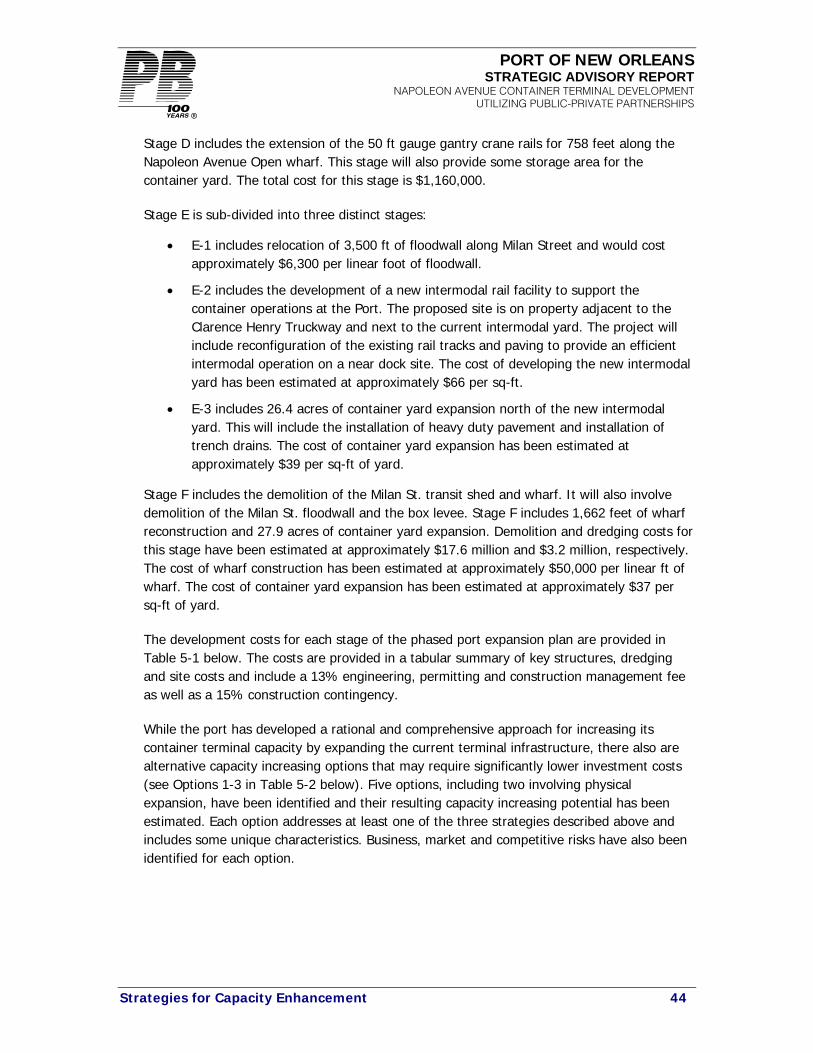
PORT OF NEW ORLEANS STRATEGIC ADVISORY REPORT
NAPOLEON AVENUE CONTAINER TERMINAL DEVELOPMENT UTILIZING PUBLIC-PRIVATE PARTNERSHIPS
Strategies for Capacity Enhancement 44
Stage D includes the extension of the 50 ft gauge gantry crane rails for 758 feet along the Napoleon Avenue Open wharf. This stage will also provide some storage area for the container yard. The total cost for this stage is $1,160,000.
Stage E is sub-divided into three distinct stages:
• E-1 includes relocation of 3,500 ft of floodwall along Milan Street and would cost approximately $6,300 per linear foot of floodwall.
• E-2 includes the development of a new intermodal rail facility to support the container operations at the Port. The proposed site is on property adjacent to the Clarence Henry Truckway and next to the current intermodal yard. The project will include reconfiguration of the existing rail tracks and paving to provide an efficient intermodal operation on a near dock site. The cost of developing the new intermodal yard has been estimated at approximately $66 per sq-ft.
• E-3 includes 26.4 acres of container yard expansion north of the new intermodal yard. This will include the installation of heavy duty pavement and installation of trench drains. The cost of container yard expansion has been estimated at approximately $39 per sq-ft of yard.
Stage F includes the demolition of the Milan St. transit shed and wharf. It will also involve demolition of the Milan St. floodwall and the box levee. Stage F includes 1,662 feet of wharf reconstruction and 27.9 acres of container yard expansion. Demolition and dredging costs for this stage have been estimated at approximately $17.6 million and $3.2 million, respectively. The cost of wharf construction has been estimated at approximately $50,000 per linear ft of wharf. The cost of container yard expansion has been estimated at approximately $37 per sq-ft of yard.
The development costs for each stage of the phased port expansion plan are provided in Table 5-1 below. The costs are provided in a tabular summary of key structures, dredging and site costs and include a 13% engineering, permitting and construction management fee as well as a 15% construction contingency.
While the port has developed a rational and comprehensive approach for increasing its container terminal capacity by expanding the current terminal infrastructure, there also are alternative capacity increasing options that may require significantly lower investment costs (see Options 1-3 in Table 5-2 below). Five options, including two involving physical expansion, have been identified and their resulting capacity increasing potential has been estimated. Each option addresses at least one of the three strategies described above and includes some unique characteristics. Business, market and competitive risks have also been identified for each option.

PORT OF NEW ORLEANS STRATEGIC ADVISORY REPORT
NAPOLEON AVENUE CONTAINER TERMINAL DEVELOPMENT UTILIZING PUBLIC-PRIVATE PARTNERSHIPS
Strategies for Capacity Enhancement 45
Table 5-1: Estimated Development Costs by Stage
2007 DOLLARS 2008 DOLLARS 2009 DOLLARS
Building Demolition & Wharf Reconstruction $64,524,031 $67,750,232 $71,137,744Dredging $1,919,953 $2,015,951 $2,116,749
Site development $9,785,538 $10,274,815 $10,788,556
TOTAL STAGE A $76,229,522 $80,040,998 $84,043,048
Building Demolition & Wharf Reconstruction $61,142,248 $64,199,360 $67,409,328Dredging $1,812,436 $1,903,058 $1,998,211
Site development $1,287,682 $1,352,066 $1,419,670
TOTAL STAGE B $64,242,366 $67,454,484 $70,827,208
Interim Milan St. Wharf Access $694,591 $729,321 $765,787Optional Stage C Drainage Pumping Station $1,949,250 $2,046,713 $2,149,048
Site development $10,240,679 $10,752,713 $11,290,348
TOTAL STAGE C $12,884,520 $13,528,746 $14,205,184
Building Demolition & Wharf Reconstruction $0 $0 $0Dredging $0 $0 $0
Site development: Extend Crane Rails $1,052,222 $1,104,833 $1,160,075
TOTAL STAGE D $1,052,222 $1,104,833 $1,160,075
Relocate Milan St. Floodwall $19,959,021 $20,956,972 $22,004,820Construct Intermodal Rail Yard $12,104,018 $12,709,219 $13,344,680
Site development $40,611,653 $42,642,236 $44,774,347
TOTAL STAGE E $72,674,692 $76,308,426 $80,123,848
Building Demolition & Wharf Reconstruction $103,528,920 $108,705,366 $114,140,634Dredging $2,918,329 $3,064,246 $3,217,458
Site development $29,374,978 $30,843,727 $32,385,913
TOTAL STAGE F $135,822,227 $142,613,338 $149,744,005
PURCHASE 3 NEW CONTAINER CRANES (STAGES A-D) $31,188,000 $32,747,400 $34,384,770PURCHASE 4 NEW CONTAINER CRANES (STAGE F) $41,584,000 $43,663,200 $45,846,360
SUBTOTAL $435,677,548 $457,461,426 $480,334,497Note: Estimates provided by PONO and modified by PB to include 13% design services and 15 % construction contingency in each line item.
STAGE E
STAGE F
STAGE A
STAGE B
STAGE C
STAGE D
Source: Port of New Orleans Data & PB Analysis

PORT OF NEW ORLEANS STRATEGIC ADVISORY REPORT
NAPOLEON AVENUE CONTAINER TERMINAL DEVELOPMENT UTILIZING PUBLIC-PRIVATE PARTNERSHIPS
Strategies for Capacity Enhancement 46
Table 5-2: Capacity Improvement Options
OPTION STRATEGIES CHALLENGES
1. Decrease Dwell Times
Modify Operations May affect the port’s competitive position
2. Increase Storage Density
Modify Operations Will place additional costs on the operators
3. Combine Operations
Combine & Modify Operations
Contractual and competitive issues
4. Expand Terminal Expand Footprint & Modify Operations
Significant capital investment
5. New Terminal Expand Footprint & Modify Operations
Significant capital investment that may be required by the new tenant
5.2.1 Operational Improvements (Decrease Dwell Time)
One way ports have approached meeting their capacity needs is to implement policies that decrease dwell times. This has typically been accomplished by charging storage fees for containers that dwell beyond the free time allowed or by providing cost incentives to customers that decrease their dwell times. Choosing the right incentive or fee to place on the tenant and/or its shipping partners can have a significant affect on a port’s competitive position.
Because dwell time reduction can significantly vary due to market and competitive issues associated with the chosen approach, a series of capacity model runs were performed for reducing dwell times by 10%, 20%, 30%, 40% and 50% to show the range of opportunities associated with this option. Tables 5-3 to 5-7 show the updated dwell times with a 10% incremental dwell time reduction as compared to the existing dwell times. Note that the only one dwell time is given for each container type because both Ceres and PAG have similar dwell times.
Table 5-3: Updated Storage Variables with 10% Reduction in Dwell Times
20. Average dwell time - Import Loads (days) 6.3 21. Average dwell time - Export Loads (days) 9.9 22. Average dwell time - Empties (days) 18 23. Average dwell time - Import Reefer (days) 4.5 24. Average dwell time - Export Reefer (days) 7.2
Note: Includes the addition of the two new cranes on order.

PORT OF NEW ORLEANS STRATEGIC ADVISORY REPORT
NAPOLEON AVENUE CONTAINER TERMINAL DEVELOPMENT UTILIZING PUBLIC-PRIVATE PARTNERSHIPS
Strategies for Capacity Enhancement 47
Table 5-4: Updated Storage Variables with 20% Reduction in Dwell Times
20. Average dwell time - Import Loads (days) 5.6 21. Average dwell time - Export Loads (days) 8.8 22. Average dwell time - Empties (days) 16 23. Average dwell time - Import Reefer (days) 4 24. Average dwell time - Export Reefer (days) 6.4
Note: Includes the addition of the two new cranes on order.
Table 5-5: Updated Storage Variables with 30% Reduction in Dwell Times
20. Average dwell time - Import Loads (days) 4.9 21. Average dwell time - Export Loads (days) 7.7 22. Average dwell time - Empties (days) 14 23. Average dwell time - Import Reefer (days) 3.5 24. Average dwell time - Export Reefer (days) 5.6
Note: Includes the addition of the two new cranes on order.
Table 5-6: Updated Storage Variables with 40% Reduction in Dwell Times
20. Average dwell time - Import Loads (days) 4.2 21. Average dwell time - Export Loads (days) 6.6 22. Average dwell time - Empties (days) 12 23. Average dwell time - Import Reefer (days) 3 24. Average dwell time - Export Reefer (days) 4.8
Note: Includes the addition of a third new crane.
Table 5-7: Updated Storage Variables with 50% Reduction in Dwell Times
20. Average dwell time - Import Loads (days) 3.5 21. Average dwell time - Export Loads (days) 5.5 22. Average dwell time - Empties (days) 10 23. Average dwell time - Import Reefer (days) 2.5 24. Average dwell time - Export Reefer (days) 4
Note: Includes the addition of a third new crane.
Figure 5-3 shows the incremental affect on the existing terminal’s MPC of each dwell time reduction. The current average dwell time for all containers at the Napoleon Avenue Terminal is approximately 12 days (import/export loads, reefer and empty). The US average (all ports, all containers) is between 6 and 8 days. A reduction of all dwell times by 30%-40% would result in the terminal achieving the US average dwell time, and an MPC of approximately 850,000 – 1,000,000 TEU/yr.

PORT OF NEW ORLEANS STRATEGIC ADVISORY REPORT
NAPOLEON AVENUE CONTAINER TERMINAL DEVELOPMENT UTILIZING PUBLIC-PRIVATE PARTNERSHIPS
Strategies for Capacity Enhancement 48
Figure 5-3: Estimated Capacity (Dwell Time Reductions) vs. Forecasted Demand
MPC – 10% Dwell Reduction
MPC – 20% Dwell Reduction
MPC – 30% Dwell Reduction
MPC – 40% Dwell Reduction
MPC – 50% Dwell Reduction
Existing MPC
0100200300400500600700800900
1,0001,1001,200
2007
2009
2011
2013
2015
2017
2019
2021
2023
2025
2027
Con
tain
er T
hro
ugh
put
(in
th
ousa
nd
TEU
s)
Base Forecast New Asian Service 1 New Asian Service 2
0100200300400500600700800900
1,0001,1001,200
2007
2009
2011
2013
2015
2017
2019
2021
2023
2025
2027
Con
tain
er T
hro
ugh
put
(in
th
ousa
nd
TEU
s)
Base Forecast New Asian Service 1 New Asian Service 2
Another way to reach this level of average dwell times is to move most empty containers (the highest dwell times) off the terminal to inland locations near manufacturing and distribution facilities. If the average empty dwell time was reduced to 4 days by relocating this storage function inland, the total terminal average dwell time would decrease to the US average of 6-8 days.
When considering this option the port must investigate the potential affect on its current market position due to implementing this type of strategy. It is possible that this strategy, if not carefully implemented, could result in a loss of business due to shippers’ price sensitivity.
5.2.2 Increase Storage Density (Varying Equipment)
Capacity can also be increased by increasing the storage density in the terminal. For Ceres and PAG, this will require replacing reach stackers/top picks with RTGs. It is assumed that empty handlers would continue to be used. Incremental increases of RTG storage areas were modeled and the effect on the capacity was noted. Due to site constraints, it was assumed that RTG operations are limited to a contiguous area of 20 acres in the Ceres Terminal with a maximum of 10 RTGs. Ceres currently uses an additional 2 acres of restricted 3-high empty storage, which is assumed to continue to be served by empty handlers to maximize storage density.
Likewise, the PAG component of the terminal has four existing RTGs and the RTG operation can be expanded to a total of 10 RTGs covering an area of 22 acres. An additional 22 acres of heavy paving in Marshalling Yards A, B and C are included in PAG’s

PORT OF NEW ORLEANS STRATEGIC ADVISORY REPORT
NAPOLEON AVENUE CONTAINER TERMINAL DEVELOPMENT UTILIZING PUBLIC-PRIVATE PARTNERSHIPS
Strategies for Capacity Enhancement 49
current Nashville Avenue Terminal lease but would not make sense to implement as RTG storage because the forecasted demand can easily be serviced by the primary storage yard. It is assumed that this area would continue to be operated as reach stacker/top pick or empty storage.
This modeling procedure includes re-calculating the area served by respective storage equipment with incremental additions of RTGs. Stack heights served by RTGs can be up to 5 high and the terminal stacking heights are calculated as a weighted average for stack heights as served by respective equipments. Ceres is presently considering the implementation of 4 new RTGs. The first model run includes 4 RTGs at both terminals. Tables 5-8 to 5-11 show the modified variables with incremental additions of 2 additional RTGs for both the Ceres and PAG operations up to the 10 RTG limits.
The incremental addition of RTGs affected the percent of storage served by equipment type and the stacking heights. Because both Ceres and PAG will continue to operate both of their facilities with some amount of area not suitable for RTG, 5-high stacked loads (13 acres for Ceres and 22 acres for PAG), the total storage % served by equipment never reaches 100% and the stacking height for import and export loads reaches 5 high when the full yard is served by RTGs. It was assumed that 20% of the storage yards (except for restricted empty areas) would use empty handlers. Therefore, the maximum amount of storage area served by RTGs is 80% for both operators. As RTGs are added, it is assumed that top picks would be replaced first, with reach stackers second.
Table 5-8: Storage Variables (4 RTGs at Ceres and 4 RTGs at PAG)
Terminal Name Ceres PAG 3. Percent storage area served by top pick (%) 55% 50% 4. Percent storage area served by reach stacker (%) 0% 10% 5. Percent storage area served by RTG (%) 15% 20% 6. Percent storage area served by empty handler (%) 30% 20% 11. Import load container stacking height (#) 3.5 3.5 12. Export Loaded container stacking height (#) 3.5 3.5 Note: Includes the addition of the two new cranes on order.
Table 5-9: Storage Variables (6 RTGs at Ceres and 6 RTGs at PAG)
Terminal Name Ceres PAG 3. Percent storage area served by top pick (%) 40% 40% 4. Percent storage area served by reach stacker (%) 0% 10% 5. Percent storage area served by RTG (%) 30% 30% 6. Percent storage area served by empty handler (%) 30% 20% 11. Import load container stacking height (#) 4 4 12. Export Loaded container stacking height (#) 4 4 Note: Includes the addition of the two new cranes on order.
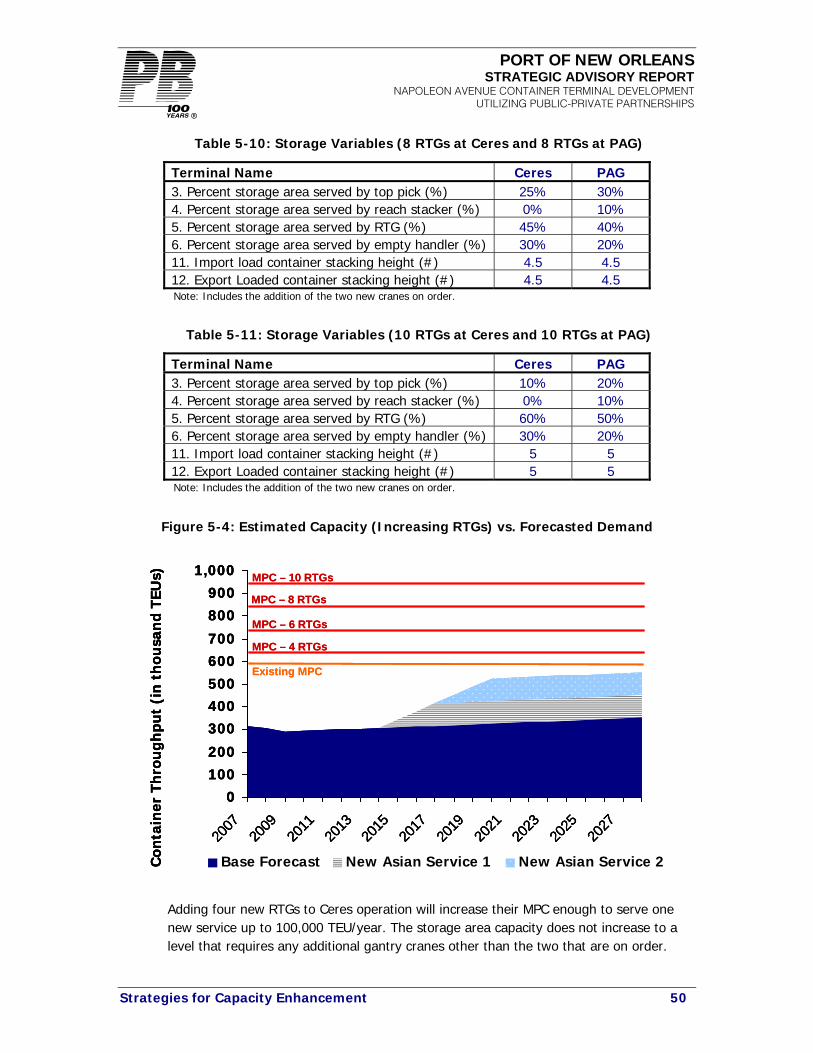
PORT OF NEW ORLEANS STRATEGIC ADVISORY REPORT
NAPOLEON AVENUE CONTAINER TERMINAL DEVELOPMENT UTILIZING PUBLIC-PRIVATE PARTNERSHIPS
Strategies for Capacity Enhancement 50
Table 5-10: Storage Variables (8 RTGs at Ceres and 8 RTGs at PAG)
Terminal Name Ceres PAG 3. Percent storage area served by top pick (%) 25% 30% 4. Percent storage area served by reach stacker (%) 0% 10% 5. Percent storage area served by RTG (%) 45% 40% 6. Percent storage area served by empty handler (%) 30% 20% 11. Import load container stacking height (#) 4.5 4.5 12. Export Loaded container stacking height (#) 4.5 4.5 Note: Includes the addition of the two new cranes on order.
Table 5-11: Storage Variables (10 RTGs at Ceres and 10 RTGs at PAG)
Terminal Name Ceres PAG 3. Percent storage area served by top pick (%) 10% 20% 4. Percent storage area served by reach stacker (%) 0% 10% 5. Percent storage area served by RTG (%) 60% 50% 6. Percent storage area served by empty handler (%) 30% 20% 11. Import load container stacking height (#) 5 5 12. Export Loaded container stacking height (#) 5 5 Note: Includes the addition of the two new cranes on order.
Figure 5-4: Estimated Capacity (Increasing RTGs) vs. Forecasted Demand
MPC – 4 RTGs
MPC – 6 RTGs
MPC – 8 RTGs
MPC – 10 RTGs
Existing MPC
0100200
300400500600700
800900
1,000
2007
2009
2011
2013
2015
2017
2019
2021
2023
2025
2027
Con
tain
er T
hro
ug
hpu
t (i
n t
hou
san
d TE
Us)
Base Forecast New Asian Service 1 New Asian Service 2
MPC – 4 RTGs
MPC – 6 RTGs
MPC – 8 RTGs
MPC – 10 RTGs
Existing MPC
0100200
300400500600700
800900
1,000
2007
2009
2011
2013
2015
2017
2019
2021
2023
2025
2027
Con
tain
er T
hro
ug
hpu
t (i
n t
hou
san
d TE
Us)
Base Forecast New Asian Service 1 New Asian Service 2
0100200
300400500600700
800900
1,000
2007
2009
2011
2013
2015
2017
2019
2021
2023
2025
2027
Con
tain
er T
hro
ug
hpu
t (i
n t
hou
san
d TE
Us)
Base Forecast New Asian Service 1 New Asian Service 2
Adding four new RTGs to Ceres operation will increase their MPC enough to serve one new service up to 100,000 TEU/year. The storage area capacity does not increase to a level that requires any additional gantry cranes other than the two that are on order.

PORT OF NEW ORLEANS STRATEGIC ADVISORY REPORT
NAPOLEON AVENUE CONTAINER TERMINAL DEVELOPMENT UTILIZING PUBLIC-PRIVATE PARTNERSHIPS
Strategies for Capacity Enhancement 51
Because the storage area capacity (at 5-6 RTGs) does not exceed the berth/wharf capacity with the two recently ordered cranes, no additional cranes would be needed to meet the forecasted demand. This option includes an increase of equipment and operating cost to typically borne by the operator and a minimal infrastructure cost while improving the port’s competitive position (higher capacity). The additional costs could have a counteracting negative affect on the port’s competitive position from a pricing perspective.
5.2.3 Combine Operations (Ceres & PAG)
After considering the first two options of maintaining the current lease structure with two separate operators while decreasing cargo dwell time or increasing storage equipment (RTGs) in an effort to increase capacity, one additional option to consider before expanding the current facility would be to consolidate all operations under one operator.
This option provides more flexibility and slightly more storage space by decreasing some circulation areas adjacent to Wharves A & B and assumes that maintenance and other administrative facilities would be consolidated (approximately 4 acres). The primary benefit of this option is to remove the capacity constraint regarding which operator a new service will use. As described above, if the new service wishes to call at Ceres’ terminal, they will significantly exceed their capacity while PAG will maintain a significant amount of excess capacity. A joint operation would alleviate this challenge.
A series of capacity model runs were performed to investigate the affect of combining operations and adding the additional 4 acres of storage. This option analysis considers the operating assumptions on the existing facility size (with the additional 4 acres of storage area) while adjusting the equipment from the existing to a full RTG operation similar to the storage density option described above. In addition to combining the storage areas and increasing them by 4 acres, the following general information regarding cargo mixes were used in all model runs to represent a combination of operations:
• 30% Import Loads
• 44% Export Loads
• 25% Empties
• 1% Refrigerated Containers
Pertinent variables used for modeling of this combined operation option include 4 additional RTGs for the Ceres operation in the terminal and an incremental increase of 2 RTGs per operating area (Ceres and PAG) per model run. The input variables that were adjusted on the original base model for each combined operations model run are provided in Tables 5-12 to 5-15.

PORT OF NEW ORLEANS STRATEGIC ADVISORY REPORT
NAPOLEON AVENUE CONTAINER TERMINAL DEVELOPMENT UTILIZING PUBLIC-PRIVATE PARTNERSHIPS
Strategies for Capacity Enhancement 52
Table 5-12: Combined Operator Variables (4 RTGs)
General Variables 13. Total Gross Terminal Area (acre) 109 14. Total Storage Area (acre) 79 Storage Component 3. Percent storage area served by top pick (%) 37.5% 4. Percent storage area served by reach stacker (%) 12.5% 5. Percent storage area served by RTG (%) 30% 6. Percent storage area served by empty handler (%) 20% 11. Import load container stacking height (#) 3.5 12. Export Loaded container stacking height (#) 3.5 Note: Includes the addition of the two new cranes on order.
Table 5-13: Combined Operator Variables (6 RTGs)
General Variables 13. Total Gross Terminal Area (acre) 109 14. Total Storage Area (acre) 79 Storage Component 3. Percent storage area served by top pick (%) 21.5% 4. Percent storage area served by reach stacker (%) 12.5% 5. Percent storage area served by RTG (%) 46% 6. Percent storage area served by empty handler (%) 20% 11. Import load container stacking height (#) 4 12. Export Loaded container stacking height (#) 4 Note: Includes the addition of the two new cranes on order.
Table 5-14: Combined Operator Variables (8 RTGs)
General Variables 13. Total Gross Terminal Area (acre) 109 14. Total Storage Area (acre) 79 Storage Component 3. Percent storage area served by top pick (%) 4.5% 4. Percent storage area served by reach stacker (%) 12.5% 5. Percent storage area served by RTG (%) 63% 6. Percent storage area served by empty handler (%) 20% 11. Import load container stacking height (#) 4.5 12. Export Loaded container stacking height (#) 4.5 Note: Includes the addition of the two new cranes on order.

PORT OF NEW ORLEANS STRATEGIC ADVISORY REPORT
NAPOLEON AVENUE CONTAINER TERMINAL DEVELOPMENT UTILIZING PUBLIC-PRIVATE PARTNERSHIPS
Strategies for Capacity Enhancement 53
Table 5-15: Combined Operator Variables (10 RTGs)
General Variables 13. Total Gross Terminal Area (acre) 109 14. Total Storage Area (acre) 79 Storage Component 3. Percent storage area served by top pick (%) 4. Percent storage area served by reach stacker (%) 5. Percent storage area served by RTG (%) 80% 6. Percent storage area served by empty handler (%) 20% 11. Import load container stacking height (#) 5 12. Export Loaded container stacking height (#) 5 Note: Includes the addition of a third new crane.
The key benefit to this option is that the projected new services would not be limited by which operator receives them. Also, this option requires the least amount of RTGs and infrastructure improvements to meet the projected demand.
This option includes a significant amount of challenges from a contractual and competitive position and would require both Ceres and PAG to acknowledge the potential benefit of combining their operations, and to work with the Port to that effect. Such challenges could overcome the potential benefit of the increased capacity on the existing footprint.
Figure 5-5: Estimated Capacity (Combined Operator) vs. Forecasted Demand
MPC – 4 RTGs
MPC – 6 RTGs
MPC – 8 RTGs
MPC – 10 RTGs
Existing MPC
0100200300400500600700800900
1,0001,100
2007
2009
2011
2013
2015
2017
2019
2021
2023
2025
2027
Con
tain
er T
hro
ug
hpu
t (i
n t
hou
san
d TE
Us)
Base Forecast New Asian Service 1 New Asian Service 2
MPC – 4 RTGs
MPC – 6 RTGs
MPC – 8 RTGs
MPC – 10 RTGs
Existing MPC
0100200300400500600700800900
1,0001,100
2007
2009
2011
2013
2015
2017
2019
2021
2023
2025
2027
Con
tain
er T
hro
ug
hpu
t (i
n t
hou
san
d TE
Us)
Base Forecast New Asian Service 1 New Asian Service 2
0100200300400500600700800900
1,0001,100
2007
2009
2011
2013
2015
2017
2019
2021
2023
2025
2027
Con
tain
er T
hro
ug
hpu
t (i
n t
hou
san
d TE
Us)
Base Forecast New Asian Service 1 New Asian Service 2

PORT OF NEW ORLEANS STRATEGIC ADVISORY REPORT
NAPOLEON AVENUE CONTAINER TERMINAL DEVELOPMENT UTILIZING PUBLIC-PRIVATE PARTNERSHIPS
Strategies for Capacity Enhancement 54
5.2.4 Expand Existing Terminal Infrastructure (Development Stages A-D) The container yard expansion project including Stages A through D will add additional infrastructure and capacity to the existing Ceres and PAG operations. A brief summary of these stages and their associated development costs is provided at the beginning of section 5.2.
Stage A adds an additional berth capability to the Napoleon Avenue Terminal and an estimated additional storage area of 1.5 acres. This additional storage area is assumed to be utilized by Ceres. It is assumed that all existing operations and equipment mixes will continue and that the storage area expansion is the primary enabler of capacity increases. Pertinent variables used for modeling of Stage A are provided in Table 5-16.
Table 5-16: Stage A Variables
Terminal Name Ceres PAG 13. Total Gross Terminal Area (acre) 56.5 54 14. Total Storage Area (acre) 39.5 41 Berth Component 4. Number of berths (#) 3 6. Average # of cranes per ship (#) 2 Storage Component 2. Multi use storage area…loads and empties (acre) 37.5 41
Stage B adds another berth in addition to Stage A, bringing the number of berths to a total of four. This will require an additional crane (beyond those presently being procured). This stage is also assumed to add an additional storage area of 1.5 acres which is assumed to be utilized by Ceres bringing their total storage area after Stage A & Stage B to 41 acres. Pertinent variables used for modeling of stage B are provided in Table 5-17.
Table 5-17: Stage B Variables
Terminal Name Ceres PAG 13. Total Gross Terminal Area (acre) 58 54 14. Total Storage Area (acre) 41 41 Berth Component 4. Number of berths (#) 4 6. Average # of cranes per ship (#) 2 Storage Component 2. Multi use storage area…loads and empties (acre) 39 41
Stage C of the expansion project adds an additional 10 acres of storage. It is assumed that this storage will be used by both of the terminal operators. This results in a storage
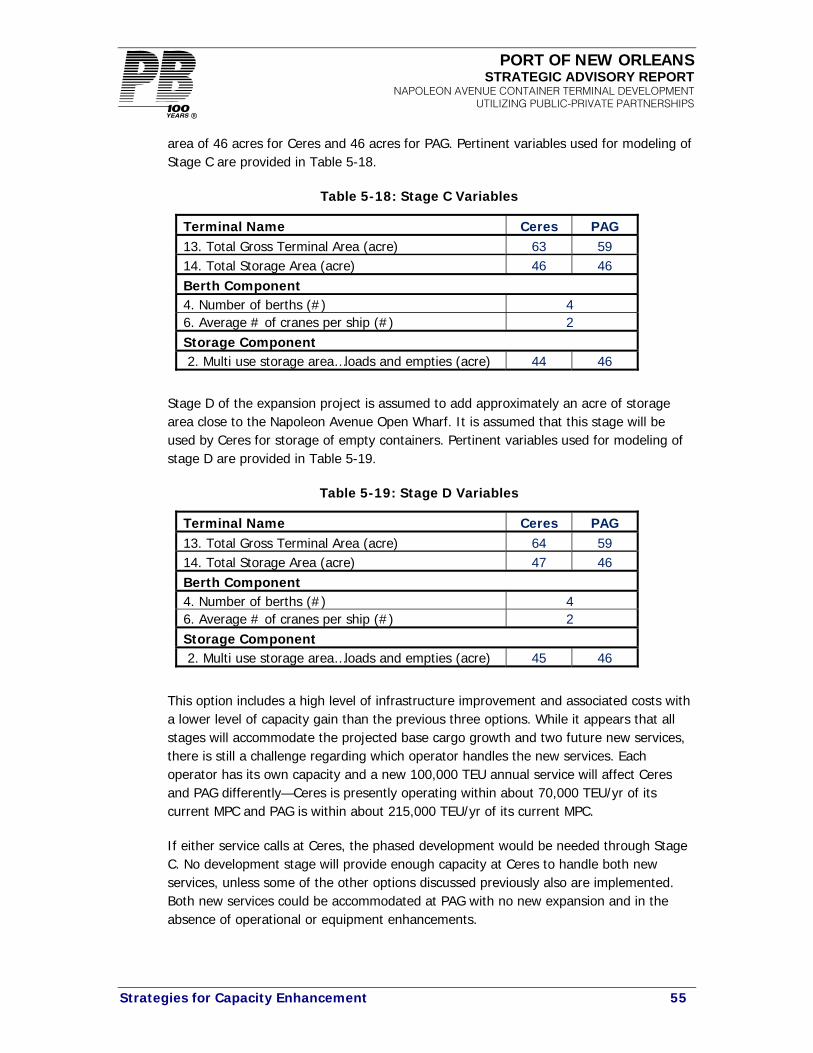
PORT OF NEW ORLEANS STRATEGIC ADVISORY REPORT
NAPOLEON AVENUE CONTAINER TERMINAL DEVELOPMENT UTILIZING PUBLIC-PRIVATE PARTNERSHIPS
Strategies for Capacity Enhancement 55
area of 46 acres for Ceres and 46 acres for PAG. Pertinent variables used for modeling of Stage C are provided in Table 5-18.
Table 5-18: Stage C Variables
Terminal Name Ceres PAG 13. Total Gross Terminal Area (acre) 63 59 14. Total Storage Area (acre) 46 46 Berth Component 4. Number of berths (#) 4 6. Average # of cranes per ship (#) 2 Storage Component 2. Multi use storage area…loads and empties (acre) 44 46
Stage D of the expansion project is assumed to add approximately an acre of storage area close to the Napoleon Avenue Open Wharf. It is assumed that this stage will be used by Ceres for storage of empty containers. Pertinent variables used for modeling of stage D are provided in Table 5-19.
Table 5-19: Stage D Variables
Terminal Name Ceres PAG 13. Total Gross Terminal Area (acre) 64 59 14. Total Storage Area (acre) 47 46 Berth Component 4. Number of berths (#) 4 6. Average # of cranes per ship (#) 2 Storage Component 2. Multi use storage area…loads and empties (acre) 45 46
This option includes a high level of infrastructure improvement and associated costs with a lower level of capacity gain than the previous three options. While it appears that all stages will accommodate the projected base cargo growth and two future new services, there is still a challenge regarding which operator handles the new services. Each operator has its own capacity and a new 100,000 TEU annual service will affect Ceres and PAG differently—Ceres is presently operating within about 70,000 TEU/yr of its current MPC and PAG is within about 215,000 TEU/yr of its current MPC.
If either service calls at Ceres, the phased development would be needed through Stage C. No development stage will provide enough capacity at Ceres to handle both new services, unless some of the other options discussed previously also are implemented. Both new services could be accommodated at PAG with no new expansion and in the absence of operational or equipment enhancements.

PORT OF NEW ORLEANS STRATEGIC ADVISORY REPORT
NAPOLEON AVENUE CONTAINER TERMINAL DEVELOPMENT UTILIZING PUBLIC-PRIVATE PARTNERSHIPS
Strategies for Capacity Enhancement 56
All of these stages can increase their capacity significantly by increasing the container storage density by replacing top picks and reach stackers with RTGs as described in Option 2 (Increase Storage Density). In fact if Option 2 and this infrastructure expansion option are combined, the highest level of capacity potential will be reached.
Figure 5-6: Estimated Capacity (by Development Stage) vs. Forecasted Demand
Stage A
Stage BStage C
Stage D
Existing MPC
0
100
200
300
400
500
600
700
2007
2009
2011
2013
2015
2017
2019
2021
2023
2025
2027
Con
tain
er T
hro
ug
hpu
t (i
n t
hou
sand
TEU
s)
Base Forecast New Asian Service 1 New Asian Service 2
Stage A
Stage BStage C
Stage D
Existing MPC
0
100
200
300
400
500
600
700
2007
2009
2011
2013
2015
2017
2019
2021
2023
2025
2027
Con
tain
er T
hro
ug
hpu
t (i
n t
hou
sand
TEU
s)
Base Forecast New Asian Service 1 New Asian Service 2
0
100
200
300
400
500
600
700
2007
2009
2011
2013
2015
2017
2019
2021
2023
2025
2027
Con
tain
er T
hro
ug
hpu
t (i
n t
hou
sand
TEU
s)
Base Forecast New Asian Service 1 New Asian Service 2
Each stage capacity shown in Figure 5-6 is cumulative from preceding stages. For example, the MPC presented for State D includes that from Stages A, B, and C. Because Stages A, B, and D involve construction of new wharf and/or crane rail on the existing wharf, logic dictates that they be implemented sequentially, whereas Stage C can be implemented independently of the other stages.
5.2.5 New Container Terminal (Development Stages E & F)
The new development as represented by Stages E & F (see Figure 5-3) will add a total of 54.2 acres downriver of the existing Ceres and PAG facilities. 48.3 acres of this new development is assumed to be used for storage. Our evaluation of this option assumes that the new service or services in the forecasted demand come with the requirement that a new dedicated terminal (represented by the Stage E & F development) be constructed.
Because an operator has not been identified, it is difficult to assume the operating mode and equipment that will be used. Therefore, the new container terminal was modeled as being operated with a full RTG operation, a combination of Top Pick and Reach Stackers and a full wheeled operation. The general terminal variables for this new operation are assumed to be an average of the current Ceres and PAG operations. The general terminal variables for the new terminal are shown in Table 5-20 to 5-22 for each operating mode. The Berth, Gate and Intermodal Rail components are assumed to be
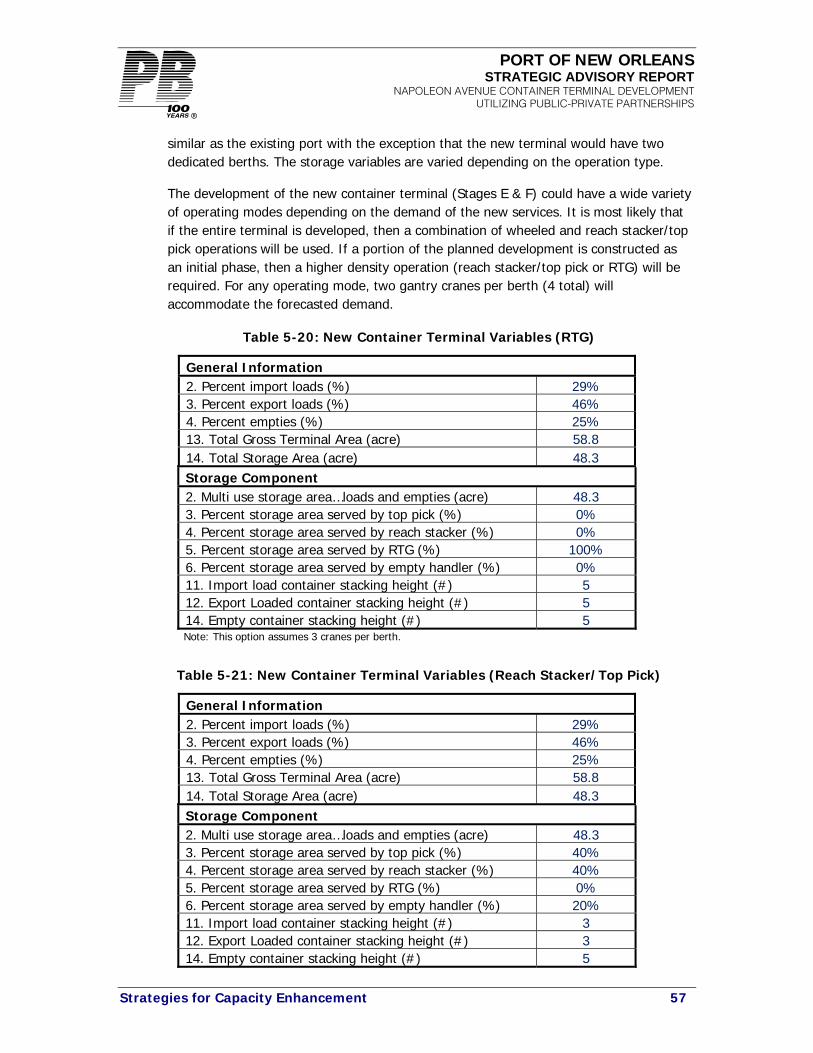
PORT OF NEW ORLEANS STRATEGIC ADVISORY REPORT
NAPOLEON AVENUE CONTAINER TERMINAL DEVELOPMENT UTILIZING PUBLIC-PRIVATE PARTNERSHIPS
Strategies for Capacity Enhancement 57
similar as the existing port with the exception that the new terminal would have two dedicated berths. The storage variables are varied depending on the operation type.
The development of the new container terminal (Stages E & F) could have a wide variety of operating modes depending on the demand of the new services. It is most likely that if the entire terminal is developed, then a combination of wheeled and reach stacker/top pick operations will be used. If a portion of the planned development is constructed as an initial phase, then a higher density operation (reach stacker/top pick or RTG) will be required. For any operating mode, two gantry cranes per berth (4 total) will accommodate the forecasted demand.
Table 5-20: New Container Terminal Variables (RTG)
General Information 2. Percent import loads (%) 29% 3. Percent export loads (%) 46% 4. Percent empties (%) 25% 13. Total Gross Terminal Area (acre) 58.8 14. Total Storage Area (acre) 48.3 Storage Component 2. Multi use storage area…loads and empties (acre) 48.3 3. Percent storage area served by top pick (%) 0% 4. Percent storage area served by reach stacker (%) 0% 5. Percent storage area served by RTG (%) 100% 6. Percent storage area served by empty handler (%) 0% 11. Import load container stacking height (#) 5 12. Export Loaded container stacking height (#) 5 14. Empty container stacking height (#) 5
Note: This option assumes 3 cranes per berth.
Table 5-21: New Container Terminal Variables (Reach Stacker/Top Pick)
General Information 2. Percent import loads (%) 29% 3. Percent export loads (%) 46% 4. Percent empties (%) 25% 13. Total Gross Terminal Area (acre) 58.8 14. Total Storage Area (acre) 48.3 Storage Component 2. Multi use storage area…loads and empties (acre) 48.3 3. Percent storage area served by top pick (%) 40% 4. Percent storage area served by reach stacker (%) 40% 5. Percent storage area served by RTG (%) 0% 6. Percent storage area served by empty handler (%) 20% 11. Import load container stacking height (#) 3 12. Export Loaded container stacking height (#) 3 14. Empty container stacking height (#) 5

PORT OF NEW ORLEANS STRATEGIC ADVISORY REPORT
NAPOLEON AVENUE CONTAINER TERMINAL DEVELOPMENT UTILIZING PUBLIC-PRIVATE PARTNERSHIPS
Strategies for Capacity Enhancement 58
Table 5-22: New Container Terminal Variables (Chassis)
General Information 2. Percent import loads (%) 29% 3. Percent export loads (%) 46% 4. Percent empties (%) 25% 13. Total Gross Terminal Area (acre) 58.8 14. Total Storage Area (acre) 48.3 Storage Component 2. Multi use storage area…loads and empties (acre) 48.3 3. Percent storage area served by top pick (%) 0% 4. Percent storage area served by reach stacker (%) 0% 5. Percent storage area served by RTG (%) 0% 6. Percent storage area served by Chassis (%) 100% 10. Chassis container ground slots per acre (#) 90 11. Import load container stacking height (#) 1 12. Export Loaded container stacking height (#) 1 14. Empty container stacking height (#) 1 15. Import reefer container stacking height (#) 1 16. Export reefer container stacking height (#) 1
Note: The highlighted variables were added to this model run only.
If the new terminal was built-out completely, its potential capacity (dependant on operating mode) would be:
• Chassis - 123,000 TEU/yr
• Reach Stacker/Top Pick - 330,000 TEU/yr
• RTG - 680,000 TEU/yr
If the new terminal’s dwell times were closer to the US average of 6-8 days, the capacity values provided above would be increased by over 40%.
5.3 Capacity Improvement Recommendations As can be seen from the previous analyses, there are a wide range of options for increasing capacity at the Napoleon Avenue Terminal and each includes different challenges (cost, operational, strategic, competitive, etc…) and offers increased capacity capabilities. From a cost and capacity perspective, it is important to understand how much the capacity increase in each option costs. Table 5-23 provides an order-of-magnitude comparison of the development cost per additional TEU of annual capacity based on the capital outlays identified for capacity increase Options 1 through 5. While reviewing the figures in this table, it is important to note that the capital outlays represent a discrete investment in 2009 US Dollars and the incremental capacity is presented on an annual and recurring basis. As such, the ‘cost per TEU’ figures are valuable for comparing options, but do not equate to the estimated cost for each additional TEU of throughput resulting from the investment.

PORT OF NEW ORLEANS STRATEGIC ADVISORY REPORT
NAPOLEON AVENUE CONTAINER TERMINAL DEVELOPMENT UTILIZING PUBLIC-PRIVATE PARTNERSHIPS
Strategies for Capacity Enhancement 59
Table 5-23: Cost per TEU of Capacity by Option
Infrastructue & Wharf Cranes Yard Equipment
1. Reduce Dwell Times-by 10% N/A N/A 56,000 N/A-by 20% N/A N/A 93,000 N/A-by 30% N/A N/A 106,000 N/A-by 40% N/A N/A 142,000 N/A-by 50% N/A N/A 198,000 N/ATotal N/A N/A 595,000 N/A
2. Increase Storage Density-Add 4 RTGs to Ceres N/A $7,200,000 45,000 $160-Add 2 RTGs to Ceres; 2 to PAG N/A $7,200,000 97,000 $70-Add 2 RTGs to Ceres; 2 to PAG N/A $7,200,000 100,000 $70-Add 2 RTGs to Ceres; 2 to PAG N/A $7,200,000 105,000 $70Total N/A $28,800,000 347,000 $83
3. Combine Operations-Add 4 RTGs to Ceres N/A $7,200,000 84,000 $90-Add 2 RTGs to Ceres; 2 to PAG N/A $7,200,000 97,000 $70-Add 2 RTGs to Ceres; 2 to PAG N/A $7,200,000 101,000 $70-Add 2 RTGs to Ceres; 2 to PAG N/A $7,200,000 140,000 $50Total N/A $28,800,000 422,000 $68
4. Expand Existing Terminal-Stage A $84,000,000 $0 10,000 $8,400-Stage B $82,000,000 $0 9,000 $9,110-Stage C $14,000,000 $3,000,000 76,000 $220-Stage D $1,000,000 $0 6,000 $170
$181,000,000 101,000 $1,7905. New Terminal
-Wheeled $276,000,000 $0 123,000 $2,240-Top-Pick/Reach Stacker $276,000,000 $13,000,000 330,000 $880-RTG $300,000,000 $28,800,000 680,000 $480Note: The "New Terminal" costs and capacities are not incremental, they are separatly calculated
Capacity Enhancement Option
Incremental Order-of-Magnitude Capital Investement (2009 US $) Approximate
Incremental MPC (TEU)
Increase
Incremental Cost per MPC
(TEU) Increase
As the Port proceeds with its marketing strategy to capture new liner services and increase its container volumes, the following concerns associated with each option should be considered:
1. Reduce Dwell Times: While reducing dwell times could significantly increase the port’s container terminal capacity, it can significantly affect the port’s competitive position depending on what fee or incentive is used to influence the dwell time reduction. This option will not require any additional infrastructure expansion or new wharf gantry cranes.
2. Increase Storage Density: Requiring the current operator to increase their respective terminal capacities by replacing reach stacker/top pick equipment with RTGs in the primary heavy paved storage areas will significantly increase the port’s container terminal capacity. Minimal infrastructure improvements and significant operating equipment increases will be required in this option.

PORT OF NEW ORLEANS STRATEGIC ADVISORY REPORT
NAPOLEON AVENUE CONTAINER TERMINAL DEVELOPMENT UTILIZING PUBLIC-PRIVATE PARTNERSHIPS
Strategies for Capacity Enhancement 60
3. Combined Operations: Combining Ceres and PAG operations will require some infrastructure modifications and operating equipment changes to accommodate the forecasted new services. This option includes competitive issues and would require the ‘buy in’ of the existing terminal operators and the renegotiation of the current terminal leases.
4. Existing Terminal Expansion: This option includes the expansion of the existing Ceres and PAG operations as described by each expansion stage (Development stages A through D). The expansion stages can significantly increase capacity if combined with Option 2. This option includes a significant amount of infrastructure investment and is dependant on the development stage.
5. New Terminal: If the new forecasted new liner services require a dedicated terminal, it will be necessary to develop a new terminal adjacent to the existing terminal (expansion Stages E & F as defined in Figure 5-2). These are the most costly stage due to the significant amount of infrastructure development costs and the need to acquire four new wharf gantry cranes.
The port’s decision to implement one of or a combination of these options will also be affected by which operator handles the new services (Ceres, PAG or a new terminal). This can have an effect on the amount of infrastructure and operating equipment needed. The following items are of note in considering which option(s) to apply:
• Only Options 3 and 5 or a combination of Options 3 or 5 with any other option would not be affected by the decision of which operator the new services will call.
• Options 1-4 do not require additional wharf gantry cranes (beyond the two cranes presently on order) to meet the forecasted demand of the two new services.
• Only Options 4 and 5 require significant infrastructure investments.
• Option 5 would require the acquisition of four new gantry cranes.
If possible, a combination of Options 1 & 2 should be investigated to accommodate the future forecasted capacity needs. Option 3 may be considered as an alternative if the competitive issues can be overcome. Tenant and/or customer needs may warrant undertaking Option 4 in parallel with, or even in lieu of, Options 1 and 2. During interviews with tenants and customers (carriers) over the course of this study, both cited additional gantry cranes and berth space as being desirable to improve terminal operations. Finally, if the new service requires a dedicated terminal, the port will need to consider the best approach to implementing Option 5.

PORT OF NEW ORLEANS STRATEGIC ADVISORY REPORT
NAPOLEON AVENUE CONTAINER TERMINAL DEVELOPMENT UTILIZING PUBLIC-PRIVATE PARTNERSHIPS
Potential Financing Scenarios 61
6 Public-Private Partnerships and Potential Financing Scenarios
Public-Private Partnerships (P3s or PPPs) refer to contractual agreements formed between one or more public agency and private sector entity to allow for greater private sector participation in the delivery of transportation projects. Before the advent of PPPs, private sector participation was generally limited to planning, design and construction contracts on a fee for service basis – based on the public agency’s specifications. Expanding the private sector role through PPP structures allows the public agencies to tap private sector technical, management and financial resources in new ways to achieve certain public agency objectives such as greater cost and schedule certainty, supplementing in-house staff, innovative technology applications, specialized expertise or access to private capital. Some of the primary reasons for public agencies to enter into public-private partnerships include:
• Encouraging private entrepreneurial development and operation of transportation infrastructure and related assets;
• Expanding financing capacity by inviting private sector expertise in accessing and organizing project financing techniques;
• Accelerating the implementation of high-priority projects by packaging and procuring services in new ways;
• Increasing operational efficiency by allowing the private sector to provide specialized management capacity for large and complex programs; and/or
• Consolidation of similar asset classes under a single management program.
PPPs provide benefits by allocating the responsibilities to the party—either public or private—that is best positioned to control the activity that will produce the desired result. With PPPs, this is accomplished by specifying the roles, risks and rewards contractually, so as to provide incentives for maximum performance and the flexibility necessary to achieve the desired results.
P3s have evolved over time and in many ways. There is an entire array of PPP methods and techniques used both domestically and internationally, on a continuum from the traditional government ownership/public procurement to the full private ownership/concession model, as shown in Figure 6-1. The operating model currently in place at the Napoleon Terminal—involving long-term lease agreements with both Ceres and Ports America—itself represents a form of PPP, and includes aspects of both the ‘Public Agency Operating Revenues’ and ‘Public-Private Partnership’ models described in Figure 6-1 below.

PORT OF NEW ORLEANS STRATEGIC ADVISORY REPORT
NAPOLEON AVENUE CONTAINER TERMINAL DEVELOPMENT UTILIZING PUBLIC-PRIVATE PARTNERSHIPS
Potential Financing Scenarios 62
Figure 6-1: Common Public-Private Structures
Financing Approach
Public Agency Tax-Backed
Public Agency Operating Revenues
Public Private Partnership
Private Concession
Operating Model Public Operator Public Operator/
Landlord Long Term Landlord
Passive Landlord
Primary Management
Control Public Public Public-Private Private
Typical Contracts &
Lease Agreement
N/A for Grants & Tax Revenues
Multiple Tenants; Variable Contracts
Discretionary Terms
Single Tenant; Long Term
Must Cover Debt
Single Tenant; Longest Term to
Cover Debt & Equity Return
Typical Facilities Financed
Public Use; Infrastructure such as Roads and Dredging
Private Activity; Docks, Wharves,
Cranes, Warehouses, Buildings, etc.
Private Activity; Docks, Wharves,
Cranes, Warehouses, Buildings, etc.
Private Activity; Docks, Wharves,
Cranes, Warehouses, Buildings, etc.
Sources of Revenues and
Security for Debt
Grants, Gov’t Transfers,
Taxes
Tariffs, Throughput Fees,
Security Fees, Facility Lease Revenue, etc.
Corporate Rental Minimum Guarantee
& Throughput Fees
Tariffs/Lease Revenue, etc. Received by
Private Concessionaire
Type of Debt Agency Revenue
Bonds Agency Revenue
Bonds
Agency Special Purpose Conduit
Bonds
Corporate Debt & Private Equity
Tax Status/ Term Gov’t Purpose & AMT Tax-Exempt
10-30 years
Gov’t Purpose & AMT Tax-Exempt
10-30 years
AMT Tax-Exempt 20-40 years
Taxable Debt 50–99 years
Primary Private Partners
Shipping Company, Railroads,
Private Haulers/Trucks
Shipping Company, Railroads,
Private Haulers/Trucks,
Terminal Operator
Terminal Operator/ Corporate Guarantor
(likely operator parent and/or shipping co)
Private Equity Concessionaire

PORT OF NEW ORLEANS STRATEGIC ADVISORY REPORT
NAPOLEON AVENUE CONTAINER TERMINAL DEVELOPMENT UTILIZING PUBLIC-PRIVATE PARTNERSHIPS
Potential Financing Scenarios 63
When the term “public-private partnership” was first used in the U.S, it generally referred to design-build construction or design-build, operate, and maintain (DBOM) concessions. The focus was primarily on trying to implement projects faster and/or more cost efficiently, not on financing. In the early days of PPP projects (the 1980s and 1990s) in the US, an assumed rate of return in the neighborhood of 20% or more was required to attract investment in infrastructure. The required return was not cost effective compared to public tax-exempt debt, and the large, liquid U.S. municipal bond market was still considered the best financing alternative.
Interest in Public Private Partnerships as a financing alternative was renewed by the 2004 sale of the Chicago Skyway project to Macquarie for $1.83 billion. This was followed more recently by the sale of the Indiana Toll Road for $3.85 billion as well as numerous long-term leases and concessions in the seaport sector during 2005-2007. The investment in transportation infrastructure assets was being driven by a desire from global infrastructure and pension funds, many of which were over-funded, to diversify their asset holdings, especially in the U.S. Since nearly all revenue producing infrastructure assets in countries such as Canada, Australia, and members of the European Union are already in private ownership, they began looking to the US to find new and diversified assets.
Prior to the current credit crisis, estimates showed equity of as much as $160 billion available for infrastructure investment. Today, accurate estimates of available equity are not available, although we do know many infrastructure funds are still actively seeking sound investments, generally in the so-called “brownfield” or existing asset category. Previously, a reasonable financing structure assumption had been an 80% debt 20% equity ratio. With banks now being stressed for capital, however, leverage ratios in today’s market are much lower, with the two most recent infrastructure transactions—the Chicago Parking Authority and Chicago’s Midway Airport— done with one hundred percent equity. Still, assuming that the amount of available equity has declined at a rate comparable to that of financial markets in general, $100 billion in equity is theoretically available for projects worldwide. This number is uncertain and will be changing with market and economic events. But the underlying point is that significant investment remains in place and may be drawn to properly structured P3 projects in the U.S. Investment funds and pension funds have very long-term and patient investment horizons, and revenue-generating transportation infrastructure remains an ideal long-term investment for them.
However, the recent economic slowdown presents unique challenges not seen since the Great Depression during the late 1920s and early 1930s. The US is currently faced with economic challenges that have affected all areas of the economy including consumption and trade. While at the moment, it is difficult to predict how deep or long this recession will be, what is known is that the global economy is contracting due to limited access to credit, decreased production and lower consumption, thus impacting the exchange of goods and services. PONO, along with other ports around the US and abroad, is subject to the volatility of the global economy, and will need to account for this circumstance while it evaluates the timing and need for its own expansion plans. This volatility further compounds the tightening already induced by the credit markets. Investor appetites for risk and leverage change rapidly and frequently even in the best of times,

PORT OF NEW ORLEANS STRATEGIC ADVISORY REPORT
NAPOLEON AVENUE CONTAINER TERMINAL DEVELOPMENT UTILIZING PUBLIC-PRIVATE PARTNERSHIPS
Potential Financing Scenarios 64
and new investment vehicles and funds rise as old ones vanish in response to ever-changing perspectives on growth and safety. Therefore, trying to accurately predict what financing options and financial structures will be available to support future terminal expansion and development that may occur a up to a decade or more in the future is difficult even in stable times; in these times of great financial turmoil, it is almost impossible. However, by using the past to postulate future behavior, it is possible to discuss patterns and trends, without predicting timing and pricing.
Less than two years ago, when the markets were celebrating a half-dozen multi-billion dollar transactions in the port and terminal sector, valuations of existing terminals reached unsustainable levels of more than 30 times earnings. Such valuations were driven by a belief that global trade levels were unbounded by old consumption spending patterns, and by prognostications that existing ports, especially those served by the major trade lanes or serving major population centers, would soon be flooded by more containers than they could handle.
Today, infrastructure investment funds have taken 50 to 60 percent write-downs on the assets they acquired during the global spending spree, and the banks that provided never-before-seen leverage levels to back their purchases are now seeking government bailouts to support their continued operation. The Port of Long Beach, CA—cited in 2007 as the most likely major port to have to close its doors to new cargo—reported December 2008 volumes down more than 25 percent from 2007, with overall 2008 volumes 11 percent off the prior year. And it is hardly alone in its double- digit decline.
And yet, earlier that same week, the first ship called upon the new Mitsui/TraPac terminal in Jacksonville, Florida, and the Jaxport Board announced that Hanjin would be partnering with them to build a new facility right next door.
In order to assess possible financial options for improvements at the Port of New Orleans, it is important to first understand how the market views the examples cited above, and how the actual improvements needed and manner in which they will be put into service and by whom define what types of external financing and investment are likely to be available over the long term.
6.1 Potential investor Base for Terminal Developments
Capital investments at US ports have historically been attractive to three broad groups of investors/lenders:
1) Strategic investors, such as marine terminal operators, ocean carriers, and logistics companies;
2) Financial investors and lenders, such as infrastructure funds, pension funds, commercial banks and financial holding companies like GE Capital; and
3) Municipal bond market investors, who comprise bond funds, money market funds and individuals.

PORT OF NEW ORLEANS STRATEGIC ADVISORY REPORT
NAPOLEON AVENUE CONTAINER TERMINAL DEVELOPMENT UTILIZING PUBLIC-PRIVATE PARTNERSHIPS
Potential Financing Scenarios 65
Each has different investment objectives, time horizons, return goals, and risk appetites, and each requires different financial structures to meet its portfolio requirements. Generally, financial investors have been reluctant to invest in or even lend to “greenfield” projects, or new assets, unless they are well-supported by creditworthy leases or throughput contracts that ensure stable cash flows, and unless the project sponsor can enter into guaranteed maximum price or fixed price turnkey construction contracts—in effect, unless they are also financially supported by strategic investors who shoulder much of the risk.
The increase in marine terminal valuation and transactional activity in 2007 was driven largely by financial buyers, who perceived this asset class as having value in high multiples of earnings relative to their acquisition price and a number of other factors including:
• Stable, inflation-adjusted returns on investment
• Growing revenues over a well-established base,
• High barriers to entry,
• Regulated industry model,
• Strong and/or predictable cash flow, and
• Little risk of obsolescence.
And, indeed, for a brief moment in time, all of those factors did align, and the buyers jumped in to acquire existing assets. In doing so, these investors drove up valuations to extraordinary levels, spurring new project development that may not have been possible in a less favorable environment, actually giving rise in some cases to new competition from hundreds, even thousands of miles away (e.g. Prince Rupert).
Ironically, acquired by the financial investment group RREEF as part of its acquisition of Maher Terminals, Prince Rupert is now considered the ‘crown jewel’ within that acquisition, as its traffic continues to grow even during this recession. However, in the valuation of the Maher Terminal assets leading to the acquisition, little long-term value was placed on Prince Rupert relative to the company’s flagship terminal in New York Harbor, as it had no history of viable revenues and thus would be discounted heavily by the bank markets that were critically needed to provide the high amount of leverage the deal required.
6.1.1 Financial Preconditions Going Forward
With the financial crisis and the collapse of not only valuations but the cash flow streams and trade volumes as well, financial investors have retrenched well back and at present are generally not making any new investments in the port and maritime arena. When they return to this market, they will undoubtedly come girded with a new set of requirements. The equity, as represented by the infrastructure funds, will likely be the first to return, but the lenders are wary of following too closely and will likely sit out the first few transactions until the market direction is clear. In fact, approval of the much-heralded sale of Midway Airport in Chicago to an investor group led by Citi

PORT OF NEW ORLEANS STRATEGIC ADVISORY REPORT
NAPOLEON AVENUE CONTAINER TERMINAL DEVELOPMENT UTILIZING PUBLIC-PRIVATE PARTNERSHIPS
Potential Financing Scenarios 66
Infrastructure Investors and John Hancock has been delayed as the original investors seek more equity partners to replace what they had assumed would be bank debt. As noted previously, the Chicago Parking Authority transaction, completed in December 2008, was funded entirely by equity.
Strategic investors, on the other hand, generally sat out the last round of terminal purchases, with some in fact selling assets. With facility investment being secondary to their other maritime businesses such as shipping, stevedoring or inland transport and warehousing, strategic buyers remain interested in acquiring quality facilities that either solidify their current positions or allow them to gain access into new markets at a low entry cost. But without the banks to lend them money for asset purchases, they are forced to either partner with the infrastructure funds and pursue low-leverage transactions with large amounts of equity, or seek alternative structures that look more like long-term leases than concessions or acquisitions. The equity players generally will only participate if they believe that they can re-leverage the asset when the debt markets stabilize, or if they can acquire assets at such low valuations that they still can achieve their return goals.
That leaves the municipal bond market to pick up the slack. This market, with its unique attributes of very long tenor, fixed rate issuances and 100 percent leverage, is well suited for long-lived infrastructure assets, but is generally limited to assets that are “governmentally owned.” Actual transaction structures must be in line with a plethora of US tax laws and regulations governing the use of tax-exempt debt, including limitations on how private parties can manage and operate the asset itself. However, for marine terminal facilities, the types of lease provisions required are in line with market practice. The Mitsui/TraPac terminal and the planned Hanjin terminal at Jaxport both follow this structure.
General borrowing by port authorities using their balance sheets and revenues is also typically done in the tax exempt municipal market, and certain types of equipment financing are also possible.
A final, albeit small and specialized, investor group is that of equipment lessors. In decades past, financial groups often had equipment leasing subsidiaries, but those are a thing of the past. In the present market, equipment financing seems to be limited to certain manufacturers, particularly those whose home countries subsidize export markets.
6.1.2 Fairview Container Terminal at the Port of Prince Rupert – A Case Study
In considering the potential for strategic investors to partake in PPPs given today’s financial conditions, potentially including one associated with the Port of New Orleans, some insight can be gained from the factors that resulted in the formation of such a partnership at Prince Rupert.

PORT OF NEW ORLEANS STRATEGIC ADVISORY REPORT
NAPOLEON AVENUE CONTAINER TERMINAL DEVELOPMENT UTILIZING PUBLIC-PRIVATE PARTNERSHIPS
Potential Financing Scenarios 67
The Fairview Container Terminal at the Port of Prince Rupert was initially conceived at a time when trade was trending towards containerization of goods, with the primary trade lane being between Northeast Asia and North America. To capitalize on the advantages of being two to three days closer to Northeast Asia than other West Coast US ports, along with an efficient and expedient on-dock rail network to service the US and Canadian mid-western markets, (e.g. Chicago, Memphis and Toronto), Prince Rupert seized an unprecedented opportunity to grow. Furthermore, compounded by growing congestion along US west coast ports, Prince Rupert’s new container terminal would activate a new trans-pacific corridor, thereby overcoming barriers to entry to this market. This opportunity attracted several partners all of whom stood to benefit from the development, and none of whom represented the financial investors as defined above. Table 6-1 below presents the breakdown of the partnership by funding amount of the Phase I13 container terminal.
Table 6-1: Prince Rupert, BC Fairview Container Terminal Phase I Funding Partners (in Canadian $ millions)14
1 Maher Terminals $60 35%2 Federal Government $30 18%3 British Columbia Province $30 18%4 CN Rail $25 15%5 Prince Rupert Port Authority $25 15%
TOTAL $170
Included in this unique group are three types of strategic partners: government (both Federal and Provincial), a terminal operator, and a railroad. Each foresaw how a new container terminal would produce benefits: for the governmental entities, it was the creation of jobs that would bolster the local and surrounding economies while creating a key gateway port on the West Coast; for the terminal operator (Maher), it was the chance to establish a west coast presence and seize geographic and infrastructure advantages unparalleled with other US west coast ports; for the railroads (CN Rail), it was the ability to provide to the shippers seamless transportation via rail to North America’s heartland.
All of these integrated benefits made Prince Rupert an interesting example of an outstanding greenfield project that even in a hot market initially failed to attract any pure financial investors, but was developed successfully nonetheless.
13 Phase I Container Terminal consists of 58 acres, 500,000-TEU capacity, 400 meter berth length and 16 meter draft, as well as 3-4 Super Post-Panamax cranes and a storage capacity of 9,430 TEUs with the ability to stack 4-high. 14 http://info.hktdc.com/shippers/vol30_6/vol30_6_canada01.htm “Prince Rupert’s Fairview Container Terminal Opens for Business”, April 2, 2008

PORT OF NEW ORLEANS STRATEGIC ADVISORY REPORT
NAPOLEON AVENUE CONTAINER TERMINAL DEVELOPMENT UTILIZING PUBLIC-PRIVATE PARTNERSHIPS
Potential Financing Scenarios 68
6.2 Available Financing Options
The majority of the improvements outlined in Section 5 of this report would generally be considered incremental terminal improvements or capital expenditures and should be financed as part of the regular budgets of either the Port or the terminal operators, depending on the lease terms and the timing of the improvements. These improvements include:
• Option 1: Decrease dwell times;
• Option 2: Increase storage density through operational measures and equipment purchase (e.g. purchase and use of RTGs in lieu of reach stackers/top picks);
• Option 3: Combine operations into a single-stevedore model; and
• Option 4: Expand existing terminal (through implementation of Phases A, B, C, and D of PONO’s expansion plan)
It is unlikely that an investor of the types noted in the previous section would be interested in participating in these transactions, other than the strategic investors already in place as the lessees/terminal operators. Borrowing for those needs should be done in the normal course of business, through normal bank or bond market instruments.
In the particular case of Option 5, representing the development of a new carrier-driven dedicated terminal, though, other options do present themselves.
There may be an opportunity for PONO to attract new carrier service, one which would see the prospect of a dedicated terminal as an attractive lure to move cargo and operations to New Orleans, either as a new service or from another location, as it would give them control over their own capacity and pricing. An important distinction to be made in considering such a terminal is that it is not perceived to be warranted by the projected demand described in this report, but rather by the cargo that the carrier itself brings to the Port as part of its long-term investment strategy. Such was the case in Jacksonville with Mitsui and Hanjin, both of whom wanted an East Coast anchor for what they envision to be new routes after the expanded Panama Canal opens in 2014. As the strategies of container carriers fall outside of the aspects that can be evaluated through demand analysis, this is referred to as ‘induced demand’.
In each of those cases, the port agreed to use its access to the municipal bond market to secure long-term financing for the terminal; in one case, the port also used its credit to backstop certain obligations. But to some extent, the credit for the bonds in each case is the obligation of the lessee to make lease payments to amortize the debt and provide appropriate debt service coverage to achieve an investment grade rating; that obligation can be backstopped either by the lessee’s creditworthy parent, by appropriate financial securities, or by the port authority.
Optimally, under such a structure, the Port’s credit is not involved, and the lease payment obligation is not tied to any particular volume of cargo. Minimum cargo volumes can be negotiated so that the port achieves its objectives of amortizing common use equipment or

PORT OF NEW ORLEANS STRATEGIC ADVISORY REPORT
NAPOLEON AVENUE CONTAINER TERMINAL DEVELOPMENT UTILIZING PUBLIC-PRIVATE PARTNERSHIPS
Potential Financing Scenarios 69
charges (if applicable) or sustaining a certain level of employment and activity, but the lessee bears the full obligation of the debt itself and the bondholders have no recourse to the Port. It then becomes the credit-worthiness of the lessee at issue, and removes the exposure of the Port to the potential that predicted demand does not materialize in a given future year.
The carrier itself, however, will want to ensure that the terminal makes economic sense to its operation, both from a location and a cost perspective. Based upon the current level of analysis, the new terminal and its required infrastructure would cost approximately $328 million in current dollars; at today’s interest rates (with no assurance such rates will be available in the future), a carrier would need to handle in excess of 500,000 TEU per year to find this level of investment acceptable in today’s competitive market.
The sheer volume of cargo needed to create sufficient revenues to finance the new terminal, representing 160 percent of current volumes at the Napoleon Terminal, underscores the likelihood that such a development would be undertaken by a carrier only in partnership with the Port. Part of the difficulty in making this terminal competitive is that much of the infrastructure—perhaps as much as $150 million (as shown in Table 6-2)—has an economic useful life far in excess of the available financial tenors and likely lease terms, so it has to be amortized much more quickly than necessary. The ability to use public funds for some of this ‘long-life’ infrastructure, specifically for the flood wall relocation, wharf construction, and intermodal yard relocation, so as not to have those costs fully reflected in the port charge, would make the proposition much more financially attractive. The Port could also provide certain financial backstops to the debt, or could pledge other revenues to its support.
Table 6-2: Approximate Capital Investment for Dedicated Terminal
Stage Description Cost
Relocate Milan St. Floodwall 22,005,000Construct Intermodal Rail Yard 13,345,000Container Yard Expansion 44,774,000
80,124,000$
Wharf Extension 110,580,000 Dredging 3,539,000 Container Yard Expansion 35,625,000
149,744,000$
Ship-to-Shore Cranes (6 ea.) 68,770,000 Rubber Tire Gantries (16 ea.) 28,800,000
97,570,000$
Total: 327,438,000$
Equipment
E
F
Notes: 1. Costs in 2009$ including Engineering, Testing & Construction Support (13%) and Contingency (15%); 2. Stage F Mobilization/Demobilization distributed among the components of Stage F work; and 3. Figures in red italics represent those for which the Port may bear some/all financial responsibility in
dedicated terminal development

PORT OF NEW ORLEANS STRATEGIC ADVISORY REPORT
NAPOLEON AVENUE CONTAINER TERMINAL DEVELOPMENT UTILIZING PUBLIC-PRIVATE PARTNERSHIPS
Potential Financing Scenarios 70
Properly sizing and timing the terminal expenditures is another way that any investor will manage the financial risk of such a large obligation. If only 200,000 containers are expected to show up in the first years of operation, then the carrier might well forego some of the paving, crane investment, and other deferrable capital expenditure until a later date. They might well start out with one operating model, then roll into a more sophisticated and costly one like RTG once the yard becomes more densely used. However, from an initial investment perspective, as opposed to the operational perspective, they are likely to assume the full build-out to make sure that it ties backs into the cargo and the financial obligations they will be required to commit to secure the tax-exempt financing.
One may ask if, depending on when the port and a private partner begin seriously discussing this kind of venture, whether the private equity market may again look at investment in port infrastructure, in particular in a project like this one. Recent discussions with major investors indicate that is highly unlikely within their current horizons, even once financial crisis abates, as there is a predominant sense that overcapacity and the need for cash flow at existing facilities will force pricing down and risks up to unacceptable levels. The timing of when that supply/demand imbalance rights itself will be difficult to assess until the recovery begins and new patterns emerge and solidify.
One way to potentially broaden interest in the new terminal would be to couple it with long-term operation of or even ownership in the existing container facilities that are currently generating revenues. Assessing those structures and their implications is beyond the boundaries of this analysis, however, as such a concept presents numerous issues regarding existing debt covenants, competitive factors, contract issues, pricing and valuation. It is not clear that the market is ready to consider such an offering at this time, but it may warrant further consideration as a future option.
6.3 PONO’s Role in Structuring a Financeable Terminal Development
An important caveat to this type of Public/Private Partnership is the expectations of the private partner. By assuming full debt repayment obligation for the terminal and assets, which could ultimately revert to the Port, the private partner will expect the public side to assume responsibility for ‘long-life’ (e.g. wharf) and off-site infrastructure improvements that may be required to support the terminal. The additional ability of the public partner to contribute to the infrastructure investment and/or otherwise subsidize a portion of development costs would create a much more favorable transaction for a strategic investor to participate in a partnership agreement. In conjunction with planning for the terminal, an evaluation of the existing inland transportation network (road and rail) should be undertaken to determine if any improvements would be necessary to support the additional cargo volumes generated by the terminal.
Regardless of the size of the transaction, however, the negotiation of documents acceptable to all parties, including rating agencies and bond holders, can take many months and hundreds of thousands of dollars. Additionally, as the Port itself has limited ability to commit to investments beyond its mandate to operate marine terminals, and is a legal creature of
PORT OF NEW ORLEANS STRATEGIC ADVISORY REPORT
NAPOLEON AVENUE CONTAINER TERMINAL DEVELOPMENT UTILIZING PUBLIC-PRIVATE PARTNERSHIPS
Potential Financing Scenarios 71
the State, the State itself will have a seat at the table on matters of indemnification, external transportation links or tax treatment.
A key issue for anyone considering a long-term at-risk investment in the Port of New Orleans will be the possibility for competing facilities along the Mississippi River, especially if those facilities might receive some form of public financial support that would cause the Port of New Orleans to be less competitive. Even in the case of a dedicated carrier terminal, the lessee’s ability to fill its capacity depends on its cost-competitiveness across the board. The lessee will continue to look to the Port to assert its role in maintaining reasonable third-party rates within the Port, to protect private operators from unreasonable charges or practices, and to continue to market the region for ocean trade.
During the pre-construction and construction periods of the development, the Port typically will carry on oversight of the design and construction, but would delegate the actual contractual responsibility to the lessee so as to avoid cost overrun risk. In Jacksonville, the lessee and Jaxport formed a joint committee and worked hand-in-hand throughout the construction period, but with TraPac having the final say on matters of cost.
During the operations period, the lessee would bear most of the maintenance and repair obligations for the terminal, equipment and yard, with the Port retaining responsibility for those elements deemed to be infrastructure, including:
• The obligation to maintain and repair wharf substructure, and other improvements with a life expectancy greater than the lease term; and
• The obligation to maintain navigable depth at the berths and approaches thereto.
One major difference between the current leases and this P3 lease relates to the gantry cranes that would be installed at the new terminal. Typically, the dedicated terminal lessee will procure and operate the ship-to-shore cranes and other terminal operating equipment, unlike the current leases which put that obligation on the Port.
One final element of note: the current Napoleon Terminal leases contain a provision (5G) that effectively requires equality between all lessees. Given the differences between a dedicated terminal lease and the normal lessee, it will be critical to assert that this section does not apply to leases such as this.
6.4 Recommendations
The private sector has been a party to port development and operation for decades, in a variety of forms, and the current economic crisis is not likely to change that in the long run. In the short term, however, inability to access capital and uncertainty about future trade volumes may well keep financial investors sidelined, especially for projects perceived to be reliant on future growth and new market patterns for their support. Strategic investors with access to cash or inexpensive long-term financing will likely re-enter the investment market ahead of the financial players, hoping to solidify key geographic positions and to take

PORT OF NEW ORLEANS STRATEGIC ADVISORY REPORT
NAPOLEON AVENUE CONTAINER TERMINAL DEVELOPMENT UTILIZING PUBLIC-PRIVATE PARTNERSHIPS
Potential Financing Scenarios 72
advantage of reduced competition. They typically will be drawn to existing assets over greenfield ones, as proven cash flow will be required to finance any major investments.
For PONO, the most likely investment opportunity will be the development of a dedicated container terminal for a carrier whose long-term strategy involves major port call(s) in the Gulf, or who can be enticed by the opportunity to take over existing operations already in the black. A comprehensive marketing program, as briefly outlined in this report, emphasizing the Port’s competitive advantages, such as its connectivity to the inland transportation network via multiple modes, will be an important element in the pursuit and realization of such an opportunity.
Equally important will be the commitment of both the Port and the State of Louisiana to any new container terminal in New Orleans. Not only will private investors expect that public money be spent for needed infrastructure and access improvements, but they will require that it not be spent on new facilities that would compete with the public/private investment. The best leveraging of public funds would be to invest to strengthen the interconnectivity of the Port of New Orleans to the surface transportation and inland waterway links, so that the Port as whole can enhance its ability to compete with facilities in neighboring states.