PORTLAND MUTUAL FUNDS INTERIM FINANCIAL REPORT Interim Financial Report... · portland mutual funds...
84
PORTLAND MUTUAL FUNDS INTERIM FINANCIAL REPORT MARCH 31, 2017
Transcript of PORTLAND MUTUAL FUNDS INTERIM FINANCIAL REPORT Interim Financial Report... · portland mutual funds...

PORTLAND MUTUAL FUNDSINTERIM FINANCIAL REPORT
MARCH 31, 2017

PORTLAND MUTUAL FUNDSINTERIM FINANCIAL REPORT
MARCH 31, 2017
Table of Contents
• Management’s Responsibility for Financial Reporting .............................................................................................................3
• Portland Advantage Fund ..........................................................................................................................................................................4
• Portland Canadian Balanced Fund ....................................................................................................................................................12
• Portland Canadian Focused Fund ......................................................................................................................................................20
• Portland Global Banks Fund ...................................................................................................................................................................28
• Portland Global Income Fund ..............................................................................................................................................................39
• Portland Global Dividend Fund ...........................................................................................................................................................52
• Portland Value Fund ....................................................................................................................................................................................65
• Notes to Financial Statements ..............................................................................................................................................................73
2

MANAGEMENT’S RESPONSIBILITY FOR FINANCIAL REPORTING PORTLAND MUTUAL FUNDS
Management’s Responsibility for Financial ReportingThe accompanying financial statements of Portland Advantage Fund, Portland Canadian Balanced Fund, Portland Canadian Focused Fund, Portland Global Banks Fund, Portland Global Dividend Fund, Portland Global Income Fund and Portland Value Fund (Funds) have been prepared by Portland Investment Counsel Inc. in its capacity as manager (Manager) of the Funds. The Manager of the Funds is responsible for the information and representations contained in these financial statements. The Board of Directors of the Manager, in its capacity as trustee of the Funds, has approved these financial statements.
The Manager maintains appropriate processes to ensure that relevant and reliable financial information is produced. The financial statements have been prepared in accordance with International Financial Reporting Standards and include certain amounts that are based on estimates and judgments. The significant accounting policies which management believes are appropriate for the Funds are described in Note 3 to these financial statements.
Michael Lee-Chin, Robert Almeida, Director Director May 17, 2017 May 17, 2017
These financial statements have not been reviewed by an independent auditor.
“Michael Lee-Chin” “Robert Almeida”
3

FINANCIAL STATEMENTS PORTLAND ADVANTAGE FUND
The accompanying notes are an integral part of these financial statements.
Statements of Financial Position (Unaudited)As at
March 31, 2017As at
September 30, 2016
AssetsCurrent Assets
Cash and cash equivalents $ 32,467 $ 178,864 Subscriptions receivable 1,205 1,830 Dividends receivable 14,684 15,774 Investments (note 5) 5,531,201 5,689,070
5,579,557 5,885,538
LiabilitiesCurrent Liabilities
Management fees payable 7,481 7,286 Expenses payable 2,741 2,767 Redemptions payable 35,300 559
45,522 10,612Net Assets Attributable to Holders of Redeemable Units $ 5,534,035 $ 5,874,926
Net Assets Attributable to Holders of Redeemable Units Per SeriesSeries A 2,811,119 2,770,840Series F 2,722,916 3,102,977Series G (note 1 (c)) - 1,109
$ 5,534,035 $ 5,874,926
Number of Redeemable Units Outstanding (note 6)Series A 237,307 235,362Series F 224,496 255,828Series G (note 1 (c)) - 102
Net Assets Attributable to Holders of Redeemable Units Per UnitSeries A 11.85 11.77Series F 12.13 12.13Series G (note 1 (c)) - 10.90
Approved by the Board of Directors of Portland Investment Counsel Inc.
Director Director
“Michael Lee-Chin” “Robert Almeida”
4
FINANCIAL STATEMENTS PORTLAND ADVANTAGE FUND
The accompanying notes are an integral part of these financial statements.
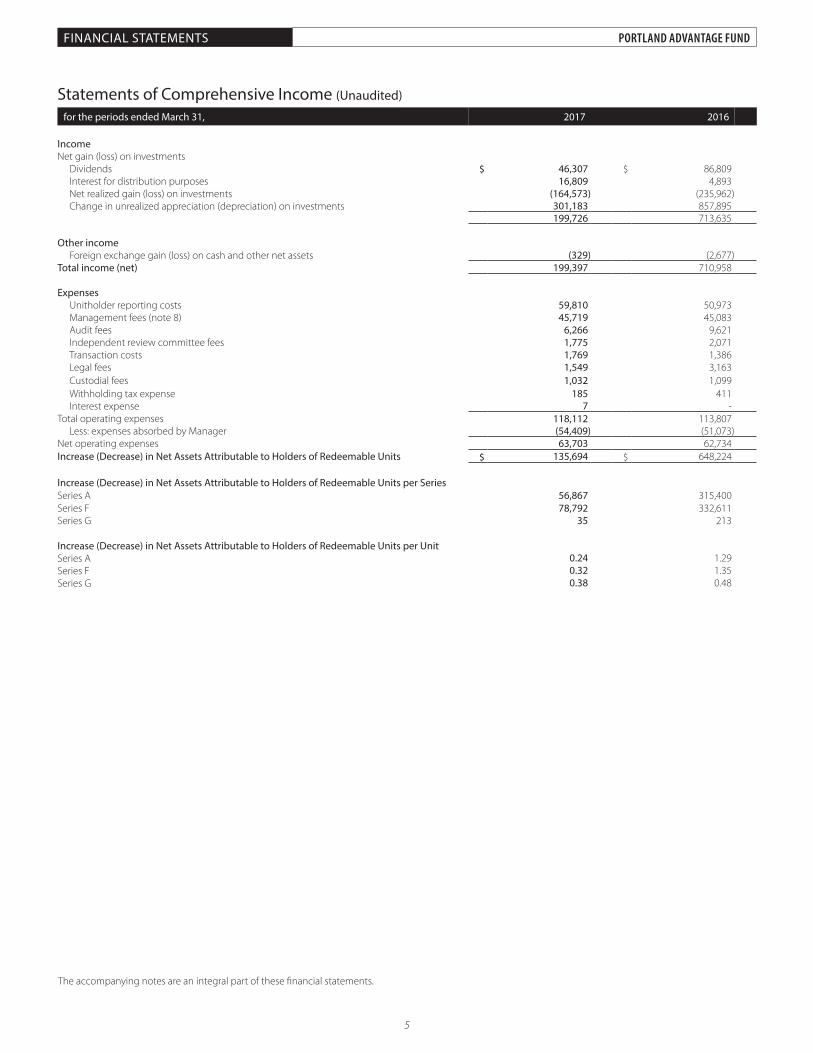
Statements of Comprehensive Income (Unaudited)
for the periods ended March 31, 2017 2016
IncomeNet gain (loss) on investments
Dividends $ 46,307 $ 86,809 Interest for distribution purposes 16,809 4,893 Net realized gain (loss) on investments (164,573) (235,962)Change in unrealized appreciation (depreciation) on investments 301,183 857,895
199,726 713,635
Other incomeForeign exchange gain (loss) on cash and other net assets (329) (2,677)
Total income (net) 199,397 710,958
ExpensesUnitholder reporting costs 59,810 50,973 Management fees (note 8) 45,719 45,083 Audit fees 6,266 9,621 Independent review committee fees 1,775 2,071 Transaction costs 1,769 1,386 Legal fees 1,549 3,163 Custodial fees 1,032 1,099 Withholding tax expense 185 411 Interest expense 7 -
Total operating expenses 118,112 113,807 Less: expenses absorbed by Manager (54,409) (51,073)
Net operating expenses 63,703 62,734 Increase (Decrease) in Net Assets Attributable to Holders of Redeemable Units $ 135,694 $ 648,224
Increase (Decrease) in Net Assets Attributable to Holders of Redeemable Units per SeriesSeries A 56,867 315,400Series F 78,792 332,611Series G 35 213
Increase (Decrease) in Net Assets Attributable to Holders of Redeemable Units per UnitSeries A 0.24 1.29Series F 0.32 1.35Series G 0.38 0.48
5
FINANCIAL STATEMENTS PORTLAND ADVANTAGE FUND
The accompanying notes are an integral part of these financial statements.
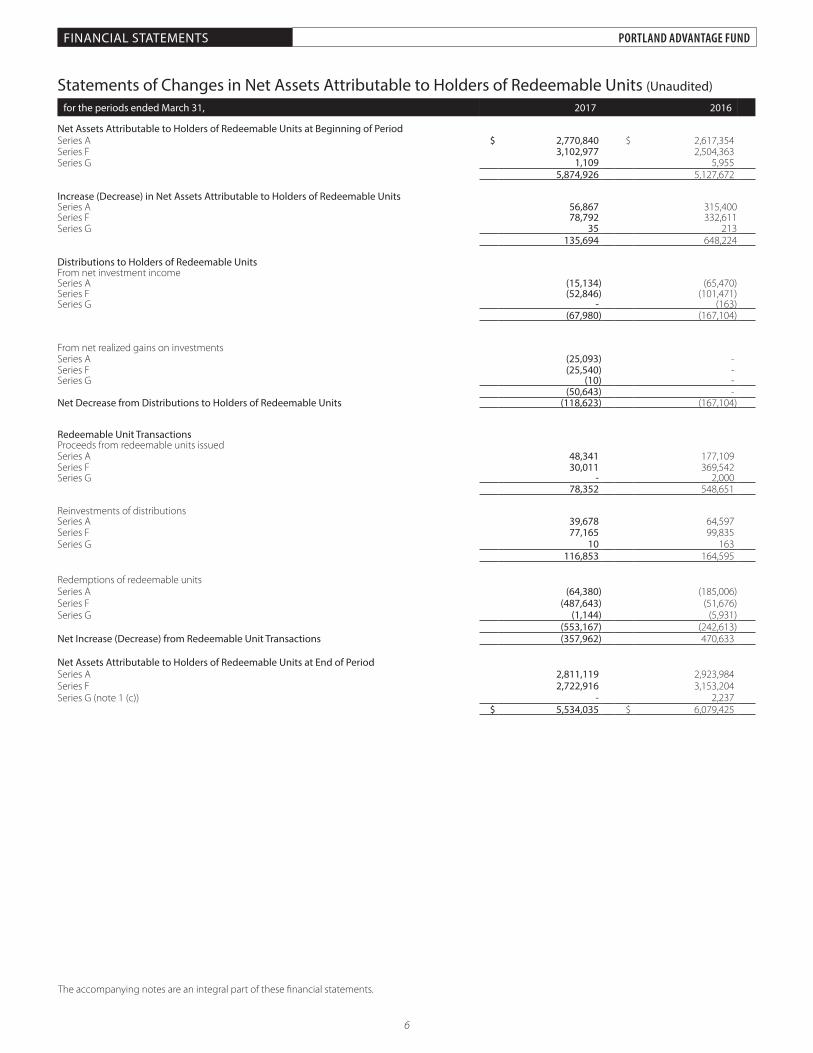
Statements of Changes in Net Assets Attributable to Holders of Redeemable Units (Unaudited)
for the periods ended March 31, 2017 2016
Net Assets Attributable to Holders of Redeemable Units at Beginning of PeriodSeries A $ 2,770,840 $ 2,617,354 Series F 3,102,977 2,504,363 Series G 1,109 5,955
5,874,926 5,127,672
Increase (Decrease) in Net Assets Attributable to Holders of Redeemable UnitsSeries A 56,867 315,400 Series F 78,792 332,611 Series G 35 213
135,694 648,224
Distributions to Holders of Redeemable UnitsFrom net investment incomeSeries A (15,134) (65,470)Series F (52,846) (101,471)Series G - (163)
(67,980) (167,104)
From net realized gains on investmentsSeries A (25,093) - Series F (25,540) - Series G (10) -
(50,643) - Net Decrease from Distributions to Holders of Redeemable Units (118,623) (167,104)
Redeemable Unit TransactionsProceeds from redeemable units issuedSeries A 48,341 177,109 Series F 30,011 369,542 Series G - 2,000
78,352 548,651
Reinvestments of distributionsSeries A 39,678 64,597 Series F 77,165 99,835 Series G 10 163
116,853 164,595
Redemptions of redeemable unitsSeries A (64,380) (185,006)Series F (487,643) (51,676)Series G (1,144) (5,931)
(553,167) (242,613)Net Increase (Decrease) from Redeemable Unit Transactions (357,962) 470,633
Net Assets Attributable to Holders of Redeemable Units at End of PeriodSeries A 2,811,119 2,923,984 Series F 2,722,916 3,153,204 Series G (note 1 (c)) - 2,237
$ 5,534,035 $ 6,079,425
6
FINANCIAL STATEMENTS PORTLAND ADVANTAGE FUND
The accompanying notes are an integral part of these financial statements.
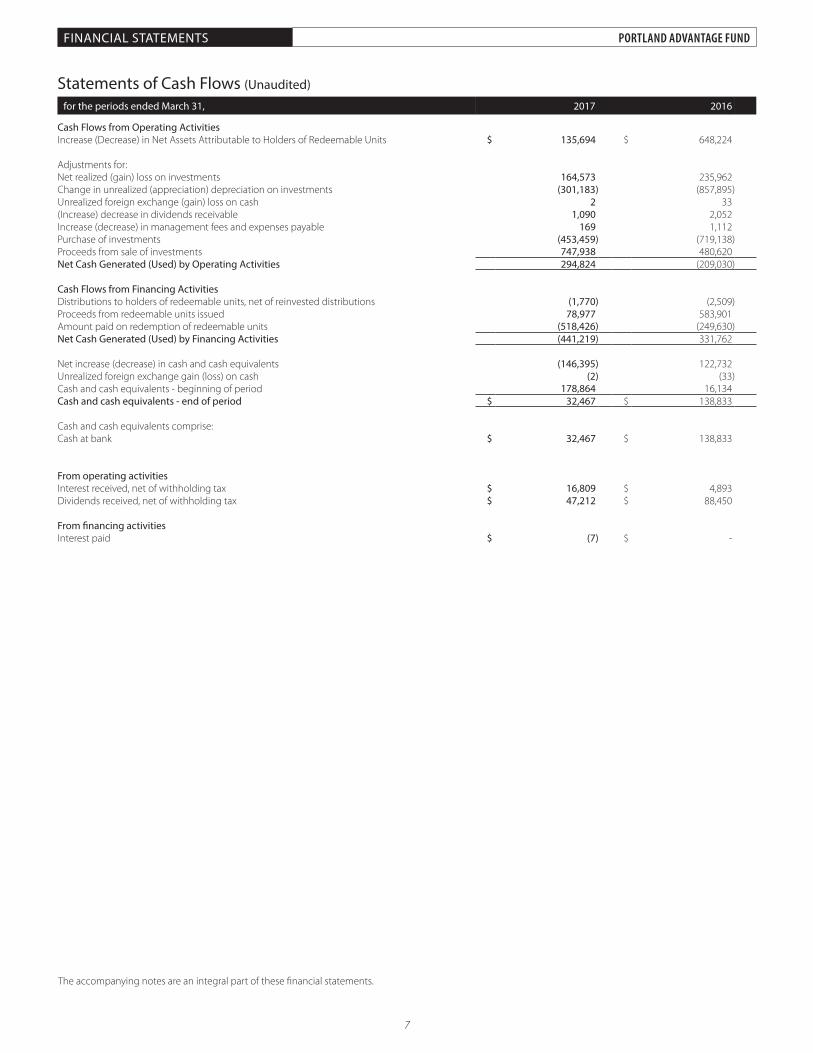
Statements of Cash Flows (Unaudited)
for the periods ended March 31, 2017 2016
Cash Flows from Operating ActivitiesIncrease (Decrease) in Net Assets Attributable to Holders of Redeemable Units $ 135,694 $ 648,224 Adjustments for:Net realized (gain) loss on investments 164,573 235,962 Change in unrealized (appreciation) depreciation on investments (301,183) (857,895)Unrealized foreign exchange (gain) loss on cash 2 33 (Increase) decrease in dividends receivable 1,090 2,052 Increase (decrease) in management fees and expenses payable 169 1,112 Purchase of investments (453,459) (719,138)Proceeds from sale of investments 747,938 480,620 Net Cash Generated (Used) by Operating Activities 294,824 (209,030)
Cash Flows from Financing ActivitiesDistributions to holders of redeemable units, net of reinvested distributions (1,770) (2,509)Proceeds from redeemable units issued 78,977 583,901 Amount paid on redemption of redeemable units (518,426) (249,630)Net Cash Generated (Used) by Financing Activities (441,219) 331,762
Net increase (decrease) in cash and cash equivalents (146,395) 122,732 Unrealized foreign exchange gain (loss) on cash (2) (33)Cash and cash equivalents - beginning of period 178,864 16,134 Cash and cash equivalents - end of period $ 32,467 $ 138,833
Cash and cash equivalents comprise:Cash at bank $ 32,467 $ 138,833
From operating activitiesInterest received, net of withholding tax $ 16,809 $ 4,893 Dividends received, net of withholding tax $ 47,212 $ 88,450
From financing activitiesInterest paid $ (7) $ -
7

FINANCIAL STATEMENTS PORTLAND ADVANTAGE FUND
The accompanying notes are an integral part of these financial statements.
Schedule of Investment Portfolio (Unaudited) As at March 31, 2017
No. of Shares/Par Value Security Name Average Cost Fair Value
% of Net AssetsAttributable
to Holders of Redeemable Units
BONDSBermuda
200,000 Digicel Group Limited Callable 8.250% September 30, 2020 $ 239,607 $ 228,575 239,607 228,575 4.1%
EQUITIESBermuda
6,195 Brookfield Infrastructure Partners L.P. 163,005 318,580 7,325 Brookfield Property Partners L.P. 163,852 217,260 7,565 Invesco Ltd. 273,577 308,147
600,434 843,987 15.3%Canada
58,205 Baytex Energy Corp. 439,328 264,251 4,780 BCE Inc. 242,867 281,446
12,990 Brookfield Asset Management Inc. Class A 465,873 629,366 6,071 CI Financial Corp. 196,631 160,457
23,277 Crescent Point Energy Corp. 578,730 334,490 63,600 ECN Capital Corp. 200,207 228,324
7,970 IGM Financial Inc. 371,633 316,090 11,753 Northland Power Inc. 200,490 288,654
4,159 The Bank of Nova Scotia 261,096 323,570 4,435 The Toronto-Dominion Bank 219,406 295,415
3,176,261 3,122,063 56.4%Luxembourg
3,385 Millicom International Cellular SA 249,909 251,033 4.5%
Panama1,028 Copa Holdings SA Class A 138,064 153,455 2.8%
United Kingdom8,105 Liberty Global PLC LiLAC Class A 303,542 239,712
10,610 Liberty Global PLC LiLAC Class C 444,394 325,088 747,936 564,800 10.2%
United States1,075 Berkshire Hathaway Inc. Class B 153,545 238,284 2,302 Franklin Resources, Inc. 127,556 129,004
281,101 367,288 6.6%Total equities 5,193,705 5,302,626 95.8%Total investment portfolio 5,433,312 5,531,201 99.9%Transaction costs (14,717) - -
$ 5,418,595 5,531,201 99.9%Other assets less liabilities 2,834 0.1%NET ASSETS ATTRIBUTABLE TO HOLDERS OF REDEEMABLE UNITS $ 5,534,035 100.0%
8

The accompanying notes are an integral part of these financial statements.
FUND SPECIFIC NOTES TO THE FINANCIAL STATEMENTS PORTLAND ADVANTAGE FUND
The accompanying notes are an integral part of these financial statements.
(a) FINANCIAL INSTRUMENTS BY CATEGORYThe following tables present the carrying amounts of the Fund’s financial instruments by category as at March 31, 2017:
Assets Held for Trading
($)
Financial assets at FVTPL Designated at Inception
($)
Financial assets at amortized cost($)
Total ($)
Cash and cash equivalents - - 32,467 32,467 Subscriptions receivable - - 1,205 1,205 Dividends receivable - - 14,684 14,684 Investments - 5,531,201 - 5,531,201 Total - 5,531,201 48,356 5,579,557
Liabilities Held for Trading
($)
Financial liabilities at FVTPL Designated at Inception
($)
Financial liabilities at amortized cost($)
Total ($)
Management fees payable - - 7,481 7,481 Expenses payable - - 2,741 2,741 Redemptions payable - - 35,300 35,300 Total - - 45,522 45,522
The following tables present the carrying amounts of the Fund’s financial instruments by category as at September 30, 2016:
Assets Held for Trading
($)
Financial assets at FVTPL Designated at Inception
($)
Financial assets at amortized cost($)
Total ($)
Cash and cash equivalents - - 178,864 178,864 Subscriptions receivable - - 1,830 1,830 Dividends receivable - - 15,774 15,774 Investments - 5,689,070 - 5,689,070 Total - 5,689,070 196,468 5,885,538
Liabilities Held for Trading
($)
Financial liabilities at FVTPL Designated at Inception
($)
Financial liabilities at amortized cost($)
Total ($)
Management fees payable - - 7,286 7,286 Expenses payable - - 2,767 2,767 Redemptions payable - - 559 559 Total - - 10,612 10,612
The following table presents the net gains (losses) on financial instruments at FVTPL by category for the six month periods ended March 31, 2017 and March 31, 2016.
Net gains (losses) ($)
Category 2017 2016
Financial assets at FVTPL Held for Trading - - Designated at Inception 199,726 713,635
Total financial assets at FVTPL 199,726 713,635
(b) RISK MANAGEMENT
Price RiskPlease see note 5 for a definition of Price Risk. The Manager moderates this risk through diversification of securities and other financial instruments within the limits of the Fund’s investment objectives and strategy.
The Fund is limited to investing in securities that comprise no more than 10% of the net asset value at the time of purchase.
If the price of investments held by the Fund on March 31, 2017 had been higher or lower by 5%, the net assets attributable to holders of redeemable units of the Fund would have been higher or lower by $265,131 (September 30, 2016: $273,056). Actual results may differ from the above sensitivity analysis and the difference could be material.
9

The accompanying notes are an integral part of these financial statements.
Concentration RiskThe following tables present the Fund’s exposure as a percentage of its net assets attributable to holders of redeemable units by geographic region and by industry sector as at March 31, 2017 and September 30, 2016.
By Geographic Region March 31, 2017 September 30, 2016
Canada 56.4% 54.2%
Bermuda 19.4% 19.5%
United Kingdom 10.2% 9.3%
United States 6.6% 7.9%
Luxembourg 4.5% 3.9%
Panama 2.8% 2.0%
Other Net Assets (Liabilities) 0.1% 3.2%
Total 100.0% 100.0%
By Industry Sector March 31, 2017 September 30, 2016
Asset Management & Custody Banks 28.0% 27.0%
Diversified Banks 11.1% 11.6%
Oil & Gas Exploration & Production 10.8% 14.5%
Cable & Satellite 10.2% 9.3%
Wireless Telecommunication Services 8.6% 7.8%
Electric Utilities 5.8% 5.7%
Independent Power Producers & Energy Traders 5.2% 5.6%
Integrated Telecommunication Services 5.1% 4.1%
Multi-Sector Holdings 4.3% 3.5%
Specialized Finance 4.1% -
Real Estate Operating Companies 3.9% 3.7%
Airlines 2.8% 2.0%
Other Net Assets (Liabilities) 0.1% 3.2%
Trucking - 1.4%
Trading Companies & Distributors - 0.4%
Construction and Engineering - 0.2%
Total 100.0% 100.0%
Currency RiskAs the Fund will invest in securities traded in foreign currencies, its net assets and cash flows, when measured in Canadian dollars, will, to the extent that they have not been fully hedged, be affected by changes in the value of these currencies relative to the Canadian dollar.
The tables below indicate the foreign currencies to which the Fund had significant exposure at March 31, 2017 and September 30, 2016, in Canadian dollar terms. The table also illustrates the potential impact on the net assets attributable to holders of redeemable units if the Canadian dollar had strengthened or weakened by 5% in relation to each of the other currencies, with all other variables held constant.
March 31, 2017
Exposure Impact on net assets attributable to holders
of redeemable units
Monetary ($)
Non-monetary ($)
Total ($)
Monetary ($)
Non-monetary ($)
Total ($)
Swedish Krona - 251,033 251,033 - 12,552 12,552U.S. Dollar 9,396 1,940,845 1,950,241 470 97,042 97,512Total 9,396 2,191,878 2,201,274 470 109,594 110,064% of net assets attributable to holders of redeemable units 0.2% 39.6% 39.8% - 2.0% 2.0%
FUND SPECIFIC NOTES TO THE FINANCIAL STATEMENTS PORTLAND ADVANTAGE FUND
10

The accompanying notes are an integral part of these financial statements.
FUND SPECIFIC NOTES TO THE FINANCIAL STATEMENTS PORTLAND ADVANTAGE FUND
September 30, 2016
Exposure Impact on net assets attributable to holders
of redeemable units
Monetary ($)
Non-monetary ($)
Total ($)
Monetary ($)
Non-monetary ($)
Total ($)
United States Dollar 15,280 2,048,143 2,063,423 764 102,407 103,171Swedish Krona - 230,361 230,361 - 11,518 11,518Total 15,280 2,278,504 2,293,784 764 113,925 114,689% of net assets attributable to holders of redeemable units 0.3% 38.8% 39.1% - 1.9% 1.9%
Interest Rate RiskAs at March 31, 2017 and September 30, 2016, the Fund did not have significant direct exposure to interest rate risk.
Credit RiskAs at March 31, 2017 and September 30, 2016, the Fund did not have significant direct exposure to credit risk.
Liquidity RiskThe Fund is exposed to liquidity risk on its obligations, including its issued redeemable units, management fees payable, expenses payable, redemptions payable, payable for investments purchased and distributions payable, as applicable.
The liquidity risk associated with issued redeemable units is managed by investing in a diversified portfolio with no more than 10% of its net assets in illiquid investments at the time of purchase. The Fund may also borrow temporarily to fund redemptions or settle trades.
As at March 31, 2017 and September 30, 2016, the Fund did not have any borrowings.
All other obligations including management fees payable, expenses payable, redemptions payable, payable for investments purchased and distributions payable, as applicable, were due within 3 months from the financial reporting date. Issued redeemable units are payable on demand.
(c) FAIR VALUE MEASUREMENTSThe following tables illustrate the classification of the Fund’s financial instruments within the fair value hierarchy as at March 31, 2017 and September 30, 2016.
Assets at fair value as at March 31, 2017 Level 1
($) Level 2
($) Level 3
($) Total
($)
Equities - Long 5,302,626 - - 5,302,626 Bonds - Long - 228,575 - 228,575 Total 5,302,626 228,575 - 5,531,201
Assets at fair value as at September 30, 2016 Level 1
($) Level 2
($) Level 3
($) Total
($)
Equities - Long 5,461,119 - - 5,461,119 Bonds - Long - 227,951 - 227,951 Total 5,461,119 227,951 - 5,689,070
Fair values are classified as Level 1 when the related security is actively traded and a quoted price is available. If an instrument classified as Level 1 subsequently ceases to be actively traded, it is transferred out of Level 1. In such cases, instruments are reclassified into Level 2, unless the measurement of its fair value requires the use of significant unobservable inputs, in which case it is classified as Level 3. All liabilities of the Fund are carried at amortized cost and therefore are not presented in the tables above.
(d) STRUCTURED ENTITIESAs at March 31, 2017 and September 30, 2016 the Fund did not have any investments in ETFs.
11

The accompanying notes are an integral part of these financial statements.
Statements of Financial Position (Unaudited)As at
March 31, 2017As at
September 30, 2016
AssetsCurrent Assets
Cash and cash equivalents $ 800,205 $ 579,321 Subscriptions receivable 50,330 8,550 Receivable for investments sold - 146,210 Dividends receivable 14,442 13,478 Investments (note 5) 6,809,402 4,935,764
7,674,379 5,683,323
LiabilitiesCurrent Liabilities
Management fees payable 8,813 6,438 Expenses payable 3,656 2,678 Redemptions payable 590 8,952
13,059 18,068Net Assets Attributable to Holders of Redeemable Units $ 7,661,320 $ 5,665,255
Net Assets Attributable to Holders of Redeemable Units Per SeriesSeries A 3,570,200 2,525,072Series F 4,091,120 3,139,072Series G (note 1 (c)) - 1,111
$ 7,661,320 5,665,255
Number of Redeemable Units Outstanding (note 6)Series A 241,302 188,496Series F 269,217 227,788Series G (note 1 (c)) - 91
Net Assets Attributable to Holders of Redeemable Units Per UnitSeries A 14.80 13.40Series F 15.20 13.78Series G (note 1 (c)) - 12.22
FINANCIAL STATEMENTS PORTLAND CANADIAN BALANCED FUND
Approved by the Board of Directors of Portland Investment Counsel Inc.
Director Director
“Michael Lee-Chin” “Robert Almeida”
12

FINANCIAL STATEMENTS PORTLAND ADVANTAGE FUND
The accompanying notes are an integral part of these financial statements.
FINANCIAL STATEMENTS PORTLAND CANADIAN BALANCED FUND
Statements of Comprehensive Income (Unaudited)
for the periods ended March 31, 2017 2016
IncomeNet gain (loss) on investments
Dividends $ 91,869 $ 65,075 Interest for distribution purposes 3,726 297 Net realized gain (loss) on investments 172,167 (2,742)Change in unrealized appreciation (depreciation) on investments 578,373 83,631
846,135 146,261
Other incomeForeign exchange gain (loss) on cash and other net assets (3,210) (3,927)
Total income (net) 842,925 142,334
ExpensesManagement fees (note 8) 47,732 35,737 Unitholder reporting costs 46,222 48,290 Audit fees 6,264 9,605 Legal fees 2,243 2,305 Independent review committee fees 1,774 2,068 Withholding tax expense 1,446 1,446 Custodial fees 1,143 310 Transaction costs 719 811
Total operating expenses 107,543 100,572 Less: expenses absorbed by Manager (39,295) (52,151)
Net operating expenses 68,248 48,421 Increase (Decrease) in Net Assets Attributable to Holders of Redeemable Units $ 774,677 $ 93,913
Increase (Decrease) in Net Assets Attributable to Holders of Redeemable Units per SeriesSeries A 327,787 66,014Series F 446,742 30,990Series G 148 (3,091)
Increase (Decrease) in Net Assets Attributable to Holders of Redeemable Units per UnitSeries A 1.63 0.31Series F 1.80 0.42Series G 1.84 (0.41)
13

FINANCIAL STATEMENTS PORTLAND ADVANTAGE FUND
The accompanying notes are an integral part of these financial statements.
FINANCIAL STATEMENTS PORTLAND CANADIAN BALANCED FUND
Statements of Changes in Net Assets Attributable to Holders of Redeemable Units (Unaudited)
for the periods ended March 31, 2017 2016
Net Assets Attributable to Holders of Redeemable Units at Beginning of PeriodSeries A $ 2,525,072 $ 2,738,271 Series F 3,139,072 822,922 Series G 1,111 107,888
5,665,255 3,669,081
Increase (Decrease) in Net Assets Attributable to Holders of Redeemable UnitsSeries A 327,787 66,014 Series F 446,742 30,990 Series G 148 (3,091)
774,677 93,913
Distributions to Holders of Redeemable UnitsFrom net investment incomeSeries A - - Series F (31,169) (7,303)Series G - -
(31,169) (7,303)
From net realized gains on investmentsSeries A (56,613) (93,731)Series F (71,648) (38,127)Series G (25) (3,552)
(128,286) (135,410)Net Decrease from Distributions to Holders of Redeemable Units (159,455) (142,713)
Redeemable Unit TransactionsProceeds from redeemable units issuedSeries A 798,716 190,977 Series F 616,913 678,639 Series G - 1,001
1,415,629 870,617
Reinvestments of distributionsSeries A 51,039 86,726 Series F 101,955 44,820 Series G 25 3,552
153,019 135,098
Redemptions of redeemable unitsSeries A (75,801) (253,654)Series F (110,745) (54,399)Series G (1,259) (104,761)
(187,805) (412,814)Net Increase (Decrease) from Redeemable Unit Transactions 1,380,843 592,901
Net Assets Attributable to Holders of Redeemable Units at End of PeriodSeries A 3,570,200 2,734,603 Series F 4,091,120 1,477,542 Series G (note 1 (c)) - 1,037
$ 7,661,320 $ 4,213,182
14

The accompanying notes are an integral part of these financial statements.
Statements of Cash Flows (Unaudited)
for the periods ended March 31, 2017 2016
Cash Flows from Operating ActivitiesIncrease (Decrease) in Net Assets Attributable to Holders of Redeemable Units $ 774,677 $ 93,913 Adjustments for:
Net realized (gain) loss on investments (172,167) 2,742 Change in unrealized (appreciation) depreciation on investments (578,373) (83,631)Unrealized foreign exchange (gain) loss on cash (340) 28 (Increase) decrease in interest receivable - 48 (Increase) decrease in dividends receivable (964) 996 Increase (decrease) in management fees and expenses payable 3,353 549 Purchase of investments (2,078,359) (1,134,102)Proceeds from sale of investments 1,101,471 1,292,282
Net Cash Generated (Used) by Operating Activities (950,702) 172,825
Cash Flows from Financing ActivitiesDistributions to holders of redeemable units, net of reinvested distributions (6,436) (7,615)Proceeds from redeemable units issued 1,369,821 870,567 Amount paid on redemption of redeemable units (192,139) (412,814)Net Cash Generated (Used) by Financing Activities 1,171,246 450,138
Net increase (decrease) in cash and cash equivalents 220,544 622,963 Unrealized foreign exchange gain (loss) on cash 340 (28)Cash and cash equivalents - beginning of period 579,321 363,671 Cash and cash equivalents - end of period 800,205 986,606
Cash and cash equivalents comprise:Cash at bank 200,327 586,633 Short-term investments 599,878 399,973
$ 800,205 $ 986,606
From operating activitiesInterest received, net of withholding tax $ 3,726 $ 345 Dividends received, net of withholding tax $ 89,459 $ 64,625
FINANCIAL STATEMENTS PORTLAND CANADIAN BALANCED FUND
15
FINANCIAL STATEMENTS PORTLAND ADVANTAGE FUNDFINANCIAL STATEMENTS PORTLAND CANADIAN BALANCED FUND
The accompanying notes are an integral part of these financial statements.
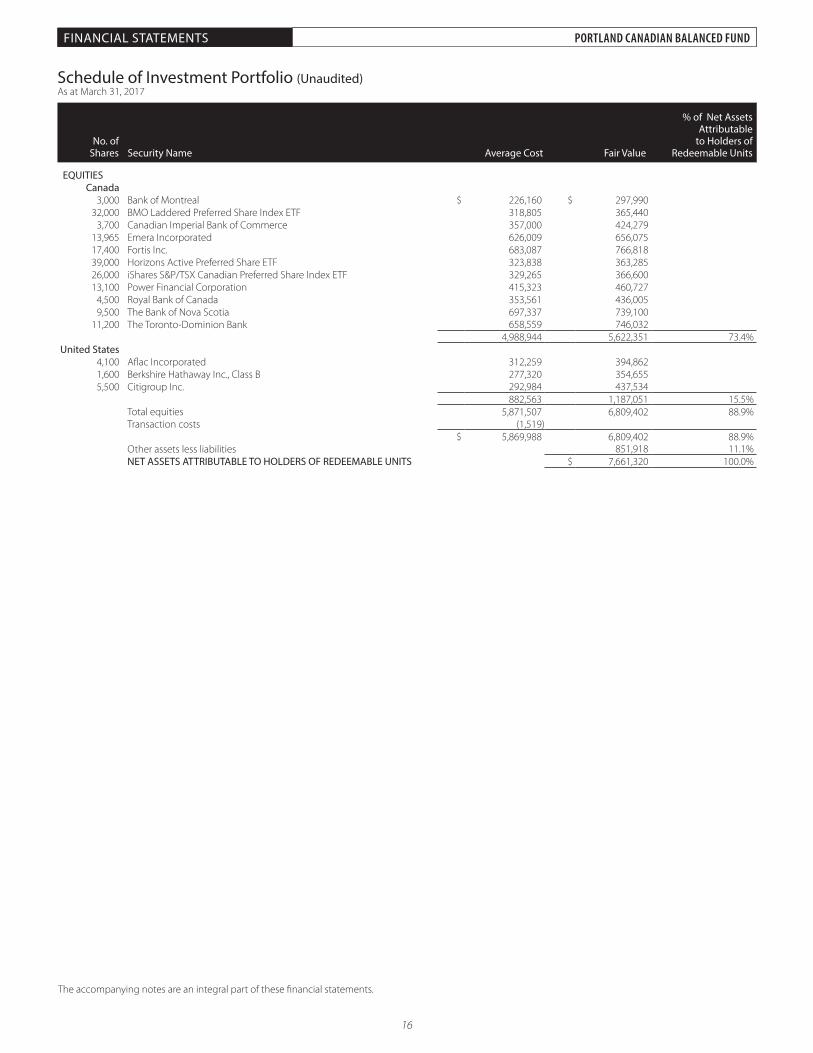
Schedule of Investment Portfolio (Unaudited) As at March 31, 2017
No. of Shares Security Name Average Cost Fair Value
% of Net AssetsAttributable
to Holders of Redeemable Units
EQUITIESCanada
3,000 Bank of Montreal $ 226,160 $ 297,990 32,000 BMO Laddered Preferred Share Index ETF 318,805 365,440
3,700 Canadian Imperial Bank of Commerce 357,000 424,279 13,965 Emera Incorporated 626,009 656,075 17,400 Fortis Inc. 683,087 766,818 39,000 Horizons Active Preferred Share ETF 323,838 363,285 26,000 iShares S&P/TSX Canadian Preferred Share Index ETF 329,265 366,600 13,100 Power Financial Corporation 415,323 460,727
4,500 Royal Bank of Canada 353,561 436,005 9,500 The Bank of Nova Scotia 697,337 739,100
11,200 The Toronto-Dominion Bank 658,559 746,032 4,988,944 5,622,351 73.4%
United States4,100 Aflac Incorporated 312,259 394,862 1,600 Berkshire Hathaway Inc., Class B 277,320 354,655 5,500 Citigroup Inc. 292,984 437,534
882,563 1,187,051 15.5%Total equities 5,871,507 6,809,402 88.9%Transaction costs (1,519)
$ 5,869,988 6,809,402 88.9%Other assets less liabilities 851,918 11.1%NET ASSETS ATTRIBUTABLE TO HOLDERS OF REDEEMABLE UNITS $ 7,661,320 100.0%
16

FUND SPECIFIC NOTES TO THE FINANCIAL STATEMENTS PORTLAND CANADIAN BALANCED FUND
The accompanying notes are an integral part of these financial statements.
(a) FINANCIAL INSTRUMENTS BY CATEGORYThe following tables present the carrying amounts of the Fund’s financial instruments by category as at March 31, 2017:
Assets Held for Trading
($)
Financial assets at FVTPL Designated at Inception
($)
Financial assets at amortized cost($)
Total ($)
Cash and cash equivalents - - 800,205 800,205 Subscriptions receivable - - 50,330 50,330 Dividends receivable - - 14,442 14,442 Investments - 6,809,402 - 6,809,402 Total - 6,809,402 864,977 7,674,379
Liabilities Held for Trading
($)
Financial liabilities at FVTPL Designated at Inception
($)
Financial liabilities at amortized cost($)
Total ($)
Management fees payable - - 8,813 8,813 Expenses payable - - 3,656 3,656 Redemptions payable - - 590 590 Total - - 13,059 13,059
The following tables present the carrying amounts of the Fund’s financial instruments by category as at September 30, 2016:
Assets Held for Trading
($)
Financial assets at FVTPL Designated at Inception
($)
Financial assets at amortized cost($)
Total ($)
Cash and cash equivalents - - 579,321 579,321 Subscriptions receivable - - 8,550 8,550 Receivable for investments sold - - 146,210 146,210 Dividends receivable - - 13,478 13,478 Investments - 4,935,764 - 4,935,764 Total - 4,935,764 747,559 5,683,323
Liabilities Held for Trading
($)
Financial liabilities at FVTPL Designated at Inception
($)
Financial liabilities at amortized cost($)
Total ($)
Management fees payable - - 6,438 6,438 Expenses payable - - 2,678 2,678 Redemptions payable - - 8,952 8,952 Total - - 18,068 18,068
The following table presents the net gains (losses) on financial instruments at FVTPL by category for the six months ended March 31, 2017 and March 31, 2016.
Net gains (losses) ($)
Category 2017 2016
Financial assets at FVTPL Held for Trading - (6,414) Designated at Inception 844,246 146,261
Total 844,246 139,847
(b) RISK MANAGEMENT
Price RiskPlease see note 5 for a definition of Price Risk. The Manager moderates this risk through diversification of securities and other financial instruments within the limits of the Fund’s investment objectives and strategy.
The Fund is limited to investing in securities that comprise no more than 10% of the net asset value at the time of purchase.
If the price of investments held by the Fund on March 31, 2017 had been higher or lower by 5%, the net assets attributable to holders of redeemable units of the Fund would have been higher or lower by $340,470 (September 30, 2016: $246,788). Actual results may differ from the above sensitivity analysis and the difference could be material.
17

FUND SPECIFIC NOTES TO THE FINANCIAL STATEMENTS PORTLAND CANADIAN BALANCED FUND
The accompanying notes are an integral part of these financial statements.
Concentration RiskThe following tables present the Fund’s exposure as a percentage of its net assets attributable to holders of redeemable units by industry sector as at March 31, 2017 and September 30, 2016.
By Industry Sector March 31, 2017 September 30, 2016
Financials 56.0% 66.6%
Utilities 18.6% 8.2%
Exchange Traded Funds 14.3% 12.3%
Other Net Assets (Liabilities) 11.1% 12.9%
Total 100.0% 100.0%
Currency RiskAs the Fund will invest in securities traded in foreign currencies, its net assets and cash flows, when measured in Canadian dollars, will, to the extent that they have not been fully hedged, be directly affected by changes in the value of these currencies relative to the Canadian dollar.
The Fund has indirect exposure to foreign currencies through its investments in ETFs which may themselves invest in securities that trade in foreign currencies.
The tables below indicate the foreign currencies to which the Fund had significant direct exposure at March 31, 2017 and September 30, 2016, in Canadian dollar terms. The table also illustrates the potential impact on the net assets attributable to holders of redeemable units if the Canadian dollar had strengthened or weakened by 5% in relation to each of the other currencies, with all other variables held constant.
March 31, 2017
Exposure Impact on net assets attributable to holders
of redeemable units
Monetary ($)
Non-monetary ($)
Total ($)
Monetary ($)
Non-monetary ($)
Total ($)
United States Dollar - 1,187,051 1,187,051 - 59,353 59,353Total - 1,187,051 1,187,051 - 59,353 59,353% of net assets attributable to holders of redeemable units - 15.5% 15.5% - 0.8% 0.8%
September 30, 2016
Exposure Impact on net assets attributable to holders
of redeemable units
Monetary ($)
Non-monetary ($)
Total ($)
Monetary ($)
Non-monetary ($)
Total ($)
United States Dollar 146,210 1,850,741 1,996,951 7,311 92,537 99,848Total 146,210 1,850,741 1,996,951 7,311 92,537 99,848% of net assets attributable to holders of redeemable units 2.6% 32.7% 35.3% 0.1% 1.6% 1.7%
Interest Rate RiskAs at March 31, 2017 and September 30, 2016, the Fund did not have significant direct exposure to interest rate risk. The Fund has indirect exposure to interest rate risk through its investments in bond ETFs.
Credit RiskAs at March 31, 2017 and September 30, 2016, the Fund did not have significant direct exposure to credit risk. The Fund has indirect exposure to credit risk through its investments in bond ETFs.
Liquidity RiskThe Fund is exposed to liquidity risk on its obligations, including its issued redeemable units, management fees payable, expenses payable, payable for investments purchased, redemptions payable and distributions payable, as applicable.
The liquidity risk associated with issued redeemable units is managed by investing in a diversified portfolio with no more than 10% of its net assets in illiquid investments at the time of purchase. The Fund may also borrow temporarily to fund redemptions or settle trades.
As at March 31, 2017 and September 30, 2016, the Fund did not have any borrowings.
All other obligations including management fees payable, expenses payable, redemptions payable, payable for investments purchased, and distributions payable, as applicable, were due within 3 months from the financial reporting date. Issued redeemable units are payable on demand.
18

FUND SPECIFIC NOTES TO THE FINANCIAL STATEMENTS PORTLAND CANADIAN BALANCED FUND
The accompanying notes are an integral part of these financial statements.
(c) FAIR VALUE MEASUREMENTSThe following tables illustrate the classification of the Fund’s financial instruments within the fair value hierarchy as at March 31, 2017 and September 30, 2016.
Assets at fair value as at March 31, 2017 Level 1
($) Level 2
($) Level 3
($) Total
($)
Equities - Long 6,809,402 - - 6,809,402 Total 6,809,402 - - 6,809,402
Assets at fair value as at September 30, 2016 Level 1
($) Level 2
($) Level 3
($) Total
($)
Equities - Long 4,935,764 - - 4,935,764 Total 4,935,764 - - 4,935,764
Fair values are classified as Level 1 when the related security or derivative is actively traded and a quoted price is available. If an instrument classified as Level 1 subsequently ceases to be actively traded, it is transferred out of Level 1. In such cases, instruments are reclassified into Level 2, unless the measurement of its fair value requires the use of significant unobservable inputs, in which case it is classified as Level 3. All liabilities of the Fund are carried at amortized cost and therefore are not presented in the tables above.
(d) STRUCTURED ENTITIESThe Fund’s investments in ETFs are susceptible to market price risk arising from uncertainties about future values. The investment manager makes investment decisions after extensive due diligence on the strategy and overall quality of the ETF’s manager.
The Fund’s investments in ETFs as at March 31, 2017 and September 30, 2016 are summarized below.
March 31, 2017
Fair Value of Fund’s Investment
($)Net Asset Value of ETF
($millions)% of ETF’s Net
Assets
BMO Laddered Preferred Share Index ETF 365,440 2,012 -Horizons Active Preferred Share ETF 363,285 1,073 -iShares S&P/TSX Canadian Preferred Share Index ETF 366,600 1,381 -
September 30, 2016
Fair Value of Fund’s Investment
($)Net Asset Value of ETF
($millions)% of ETF’s Net
Assets
BMO Laddered Preferred Share Index ETF 234,295 1,229 -Horizons Active Preferred Share ETF 233,240 810 -iShares S&P/TSX Canadian Preferred Share Index ETF 229,680 1,201 -
19

The accompanying notes are an integral part of these financial statements.
Statements of Financial Position (Unaudited)As at
March 31, 2017As at
September 30, 2016
AssetsCurrent Assets
Cash and cash equivalents $ 2,095,866 $ 264,695 Subscriptions receivable 51,188 1,648 Receivable for investments sold - 275,727 Dividends receivable 24,274 25,281 Investments (note 5) 11,363,216 9,214,391
13,534,544 9,781,742
LiabilitiesCurrent Liabilities
Management fees payable 13,117 8,740 Expenses payable 6,557 4,638 Redemptions payable 44,590 -
64,264 13,378Net Assets Attributable to Holders of Redeemable Units $ 13,470,280 $ 9,768,364
Net Assets Attributable to Holders of Redeemable Units Per SeriesSeries A 2,950,717 1,777,168Series F 10,504,436 7,976,763Series G 15,127 14,433
$ 13,470,280 $ 9,768,364
Number of Redeemable Units Outstanding (note 6)Series A 203,140 133,584Series F 691,090 569,929Series G 1,065 1,110
Net Assets Attributable to Holders of Redeemable Units Per UnitSeries A 14.53 13.30Series F 15.20 14.00Series G 14.20 13.01
FINANCIAL STATEMENTS PORTLAND CANADIAN FOCUSED FUND
Approved by the Board of Directors of Portland Investment Counsel Inc.
Director Director
“Michael Lee-Chin” “Robert Almeida”
20

FINANCIAL STATEMENTS PORTLAND ADVANTAGE FUND
The accompanying notes are an integral part of these financial statements.
FINANCIAL STATEMENTS PORTLAND CANADIAN FOCUSED FUND
Statements of Comprehensive Income (Unaudited)
for the periods ended March 31, 2017 2016
IncomeNet gain (loss) on investments
Dividends $ 160,953 $ 132,485 Interest for distribution purposes 3,762 488 Net realized gain (loss) on investments 384,986 99,105 Change in unrealized appreciation (depreciation) on investments 1,018,365 188,067
1,568,066 420,145
Other incomeForeign exchange gain (loss) on cash and other net assets (7,018) (4,913)
Total income (net) 1,561,048 415,232
ExpensesManagement fees (note 8) 71,664 47,175 Unitholder reporting costs 42,790 53,339 Audit fees 6,261 9,605 Withholding tax expense 3,992 1,742 Legal fees 2,242 2,305 Independent review committee fees 1,773 2,068 Custodial fees 1,464 1,090 Transaction costs 802 795 Total operating expenses 130,988 118,119 Less: expenses absorbed by Manager (21,873) (47,859)Net operating expenses 109,115 70,260 Increase (Decrease) in Net Assets Attributable to Holders of Redeemable Units $ 1,451,933 $ 344,972
Increase (Decrease) in Net Assets Attributable to Holders of Redeemable Units per SeriesSeries A 259,694 66,796Series F 1,190,232 279,962Series G 2,007 (1,786)
Increase (Decrease) in Net Assets Attributable to Holders of Redeemable Units per UnitSeries A 1.63 0.50Series F 1.90 0.63Series G 1.79 (0.22)
21

FINANCIAL STATEMENTS PORTLAND ADVANTAGE FUND
The accompanying notes are an integral part of these financial statements.
FINANCIAL STATEMENTS PORTLAND CANADIAN FOCUSED FUND
Statements of Changes in Net Assets Attributable to Holders of Redeemable Units (Unaudited)
for the periods ended March 31, 2017 2016
Net Assets Attributable to Holders of Redeemable Units at Beginning of PeriodSeries A $ 1,777,168 $ 1,652,985 Series F 7,976,763 5,559,835 Series G 14,433 119,655
9,768,364 7,332,475
Increase (Decrease) in Net Assets Attributable to Holders of Redeemable UnitsSeries A 259,694 66,796 Series F 1,190,232 279,962 Series G 2,007 (1,786)
1,451,933 344,972
Distributions to Holders of Redeemable UnitsFrom net investment incomeSeries A - - Series F (104,607) (56,594)Series G - -
(104,607) (56,594)
From net realized gains on investmentsSeries A (83,708) (80,877)Series F (385,771) (194,611)Series G (658) (4,183)
(470,137) (279,671)Net Decrease from Distributions to Holders of Redeemable Units (574,744) (336,265)
Redeemable Unit TransactionsProceeds from redeemable units issuedSeries A 1,118,271 156,911 Series F 1,828,969 953,359 Series G - 1,000
2,947,240 1,111,270
Reinvestments of distributionsSeries A 83,708 80,877 Series F 488,857 249,625 Series G 658 4,183
573,223 334,685
Redemptions of redeemable unitsSeries A (204,416) (249,866)Series F (490,007) (435,357)Series G (1,313) (105,569)
(695,736) (790,792)Net Increase (Decrease) from Redeemable Unit Transactions 2,824,727 655,163
Net Assets Attributable to Holders of Redeemable Units at End of PeriodSeries A 2,950,717 1,626,826 Series F 10,504,436 6,356,219 Series G 15,127 13,300
$ 13,470,280 $ 7,996,345
22
The accompanying notes are an integral part of these financial statements.
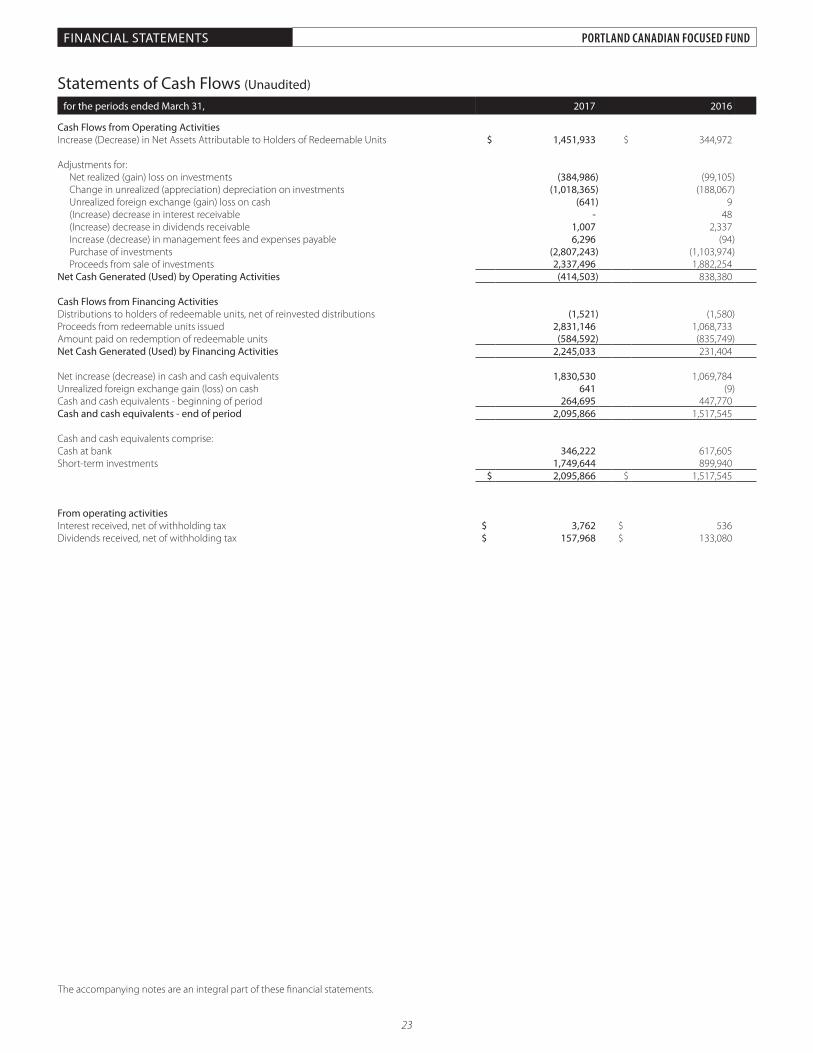
Statements of Cash Flows (Unaudited)
for the periods ended March 31, 2017 2016
Cash Flows from Operating ActivitiesIncrease (Decrease) in Net Assets Attributable to Holders of Redeemable Units $ 1,451,933 $ 344,972 Adjustments for:
Net realized (gain) loss on investments (384,986) (99,105)Change in unrealized (appreciation) depreciation on investments (1,018,365) (188,067)Unrealized foreign exchange (gain) loss on cash (641) 9 (Increase) decrease in interest receivable - 48 (Increase) decrease in dividends receivable 1,007 2,337 Increase (decrease) in management fees and expenses payable 6,296 (94)Purchase of investments (2,807,243) (1,103,974)Proceeds from sale of investments 2,337,496 1,882,254
Net Cash Generated (Used) by Operating Activities (414,503) 838,380
Cash Flows from Financing ActivitiesDistributions to holders of redeemable units, net of reinvested distributions (1,521) (1,580)Proceeds from redeemable units issued 2,831,146 1,068,733 Amount paid on redemption of redeemable units (584,592) (835,749)Net Cash Generated (Used) by Financing Activities 2,245,033 231,404
Net increase (decrease) in cash and cash equivalents 1,830,530 1,069,784 Unrealized foreign exchange gain (loss) on cash 641 (9)Cash and cash equivalents - beginning of period 264,695 447,770 Cash and cash equivalents - end of period 2,095,866 1,517,545
Cash and cash equivalents comprise:Cash at bank 346,222 617,605 Short-term investments 1,749,644 899,940
$ 2,095,866 $ 1,517,545
From operating activitiesInterest received, net of withholding tax $ 3,762 $ 536 Dividends received, net of withholding tax $ 157,968 $ 133,080
FINANCIAL STATEMENTS PORTLAND CANADIAN FOCUSED FUND
23

FINANCIAL STATEMENTS PORTLAND ADVANTAGE FUNDFINANCIAL STATEMENTS PORTLAND CANADIAN FOCUSED FUND
The accompanying notes are an integral part of these financial statements.
Schedule of Investment Portfolio (Unaudited) As at March 31, 2017
No. of Shares Security Name Average Cost Fair Value
% of Net AssetsAttributable
to Holders of Redeemable Units
EQUITIESCanada
9,110 Bank of Montreal $ 702,281 $ 904,896 9,000 Canadian Imperial Bank of Commerce 875,157 1,032,030
25,805 Emera Incorporated 1,156,408 1,212,319 30,800 Fortis Inc. 1,199,458 1,357,356 24,600 Power Financial Corporation 779,781 865,182 10,900 Royal Bank of Canada 851,303 1,056,101 16,900 The Bank of Nova Scotia 1,218,879 1,314,820 19,900 The Toronto-Dominion Bank 1,125,827 1,325,539
7,909,094 9,068,243 67.3%United States
8,700 Aflac Incorporated 662,598 837,878 3,200 Berkshire Hathaway Inc. 554,639 709,310 9,400 Citigroup Inc. 500,737 747,785
1,717,974 2,294,973 17.1%Total equities 9,627,068 11,363,216 84.4%Transaction costs (1,423) - -
$ 9,625,645 11,363,216 84.4%Other assets less liabilities 2,107,064 15.6%NET ASSETS ATTRIBUTABLE TO HOLDERS OF REDEEMABLE UNITS $ 13,470,280 100.0%
24

The accompanying notes are an integral part of these financial statements.
FUND SPECIFIC NOTES TO THE FINANCIAL STATEMENTS PORTLAND CANADIAN FOCUSED FUND
(a) FINANCIAL INSTRUMENTS BY CATEGORYThe following tables present the carrying amounts of the Fund’s financial instruments by category as at March 31, 2017:
Assets Held for Trading
($)
Financial assets at FVTPL Designated at Inception
($)
Financial assets at amortized cost($)
Total ($)
Cash and cash equivalents - - 2,095,866 2,095,866 Subscriptions receivable - - 51,188 51,188 Dividends receivable - - 24,274 24,274 Investments - 11,363,216 - 11,363,216 Total - 11,363,216 2,171,328 13,534,544
Liabilities Held for Trading
($)
Financial liabilities at FVTPL Designated at Inception
($)
Financial liabilities at amortized cost($)
Total ($)
Management fees payable - - 13,117 13,117 Expenses payable - - 6,557 6,557 Redemptions payable - - 44,590 44,590 Total - - 64,264 64,264
The following tables present the carrying amounts of the Fund’s financial instruments by category as at September 30, 2016:
Assets Held for Trading
($)
Financial assets at FVTPL Designated at Inception
($)
Financial assets at amortized cost($)
Total ($)
Cash and cash equivalents - - 264,695 264,695 Subscriptions receivable - - 1,648 1,648 Receivable for investments sold - - 275,727 275,727 Dividends receivable - - 25,281 25,281 Investments - 9,214,391 - 9,214,391 Total - 9,214,391 567,351 9,781,742
Liabilities Held for Trading
($)
Financial liabilities at FVTPL Designated at Inception
($)
Financial liabilities at amortized cost($)
Total ($)
Management fees payable - - 8,740 8,740 Expenses payable - - 4,638 4,638 Total - - 13,378 13,378
The following table presents the net gains (losses) on financial instruments at FVTPL by category for the six month periods ended March 31, 2017 and March 31, 2016.
Net gains (losses) ($)
Category 2017 2016
Financial assets at FVTPL Held for Trading - (2,417) Designated at Inception 1,564,775 420,145
Total 1,564,775 417,728
(b) RISK MANAGEMENT
Price RiskPlease see note 5 for a definition of Price Risk. The Manager moderates this risk through diversification of securities and other financial instruments within the limits of the Fund’s investment objectives and strategy.
The Fund is limited to investing in securities that comprise no more than 10% of the net asset value at the time of purchase.
If the price of investments held by the Fund on March 31, 2017 had been higher or lower by 5%, the net assets attributable to holders of redeemable units of the Fund would have been higher or lower by $568,161 (September 30, 2016: $460,720). Actual results may differ from the above sensitivity analysis and the difference could be material.
25

The accompanying notes are an integral part of these financial statements.
FUND SPECIFIC NOTES TO THE FINANCIAL STATEMENTS PORTLAND CANADIAN FOCUSED FUND
Concentration RiskThe following tables present the Fund’s exposure as a percentage of its net assets attributable to holders of redeemable units by geographic region and by industry sector as at March 31, 2017 and September 30, 2016.
By Geographic Region March 31, 2017 September 30, 2016
Canada 67.3% 55.6%
United States 17.1% 38.7%
Other Net Assets (Liabilities) 15.6% 5.7%
Total 100.0% 100.0%
By Industry Sector March 31, 2017 September 30, 2016
Financials 65.3% 85.4%
Utilities 19.1% 8.9%
Other Net Assets (Liabilities) 15.6% 5.7%
Total 100.0% 100.0%
Currency RiskAs the Fund will invest in securities traded in foreign currencies, its net assets and cash flows, when measured in Canadian dollars, will, to the extent that they have not been fully hedged, be affected by changes in the value of these currencies relative to the Canadian dollar.
The tables below indicate the foreign currencies to which the Fund had significant exposure at March 31, 2017 and September 30, 2016, in Canadian dollar terms. The table also illustrates the potential impact on the net assets attributable to holders of redeemable units if the Canadian dollar had strengthened or weakened by 5% in relation to each of the other currencies, with all other variables held constant.
March 31, 2017
Exposure Impact on net assets attributable to holders
of redeemable units
Monetary ($)
Non-monetary ($)
Total ($)
Monetary ($)
Non-monetary ($)
Total ($)
United States Dollar - 2,294,973 2,294,973 - 114,749 114,749Total - 2,294,973 2,294,973 - 114,749 114,749% of net assets attributable to holders of redeemable units - 17.1% 17.1% - 0.9% 0.9%
September 30, 2016
Exposure Impact on net assets attributable to holders
of redeemable units
Monetary ($)
Non-monetary ($)
Total ($)
Monetary ($)
Non-monetary ($)
Total ($)
United States Dollar 275,727 3,777,559 4,053,286 13,786 188,878 202,664Total 275,727 3,777,559 4,053,286 13,786 188,878 202,664% of net assets attributable to holders of redeemable units 2.8% 38.7% 41.5% 0.2% 1.9% 2.1%
Interest Rate RiskAs at March 31, 2017 and September 30, 2016, the Fund did not have significant direct exposure to interest rate risk.
Credit RiskAs at March 31, 2017 and September 30, 2016, the Fund did not have significant direct exposure to credit risk.
Liquidity RiskThe Fund is exposed to liquidity risk on its obligations, including its issued redeemable units, management fees payable, expenses payable, redemptions payable, payable for investments purchased and distributions payable, as applicable.
The liquidity risk associated with issued redeemable units is managed by investing in a diversified portfolio with no more than 10% of its net assets in illiquid investments at the time of purchase. The Fund may also borrow temporarily to fund redemptions or settle trades.
As at March 31, 2017 and September 30, 2016, the Fund did not have any borrowings.
All other obligations including management fees payable, expenses payable, redemptions payable, payable for investments purchased and distributions payable, as applicable, were due within 3 months from the financial reporting date. Issued redeemable units are payable on demand.
26

The accompanying notes are an integral part of these financial statements.
FUND SPECIFIC NOTES TO THE FINANCIAL STATEMENTS PORTLAND CANADIAN FOCUSED FUND
(c) FAIR VALUE MEASUREMENTSThe following tables illustrate the classification of the Fund’s financial instruments within the fair value hierarchy as at March 31, 2017 and September 30, 2016.
Assets at fair value as at March 31, 2017 Level 1
($) Level 2
($) Level 3
($) Total
($)
Equities - Long 11,363,216 - - 11,363,216 Total 11,363,216 - - 11,363,216
Assets at fair value as at September 30, 2016 Level 1
($) Level 2
($) Level 3
($) Total
($)
Equities - Long 9,214,391 - - 9,214,391 Total 9,214,391 - - 9,214,391
Fair values are classified as Level 1 when the related security or derivative is actively traded and a quoted price is available. If an instrument classified as Level 1 subsequently ceases to be actively traded, it is transferred out of Level 1. In such cases, instruments are reclassified into Level 2, unless the measurement of its fair value requires the use of significant unobservable inputs, in which case it is classified as Level 3. All liabilities of the Fund are carried at amortized cost and therefore are not presented in the tables above.
(d) STRUCTURED ENTITIESAs at March 31, 2017 and September 30, 2016 the Fund did not have any investments in ETFs.
27

The accompanying notes are an integral part of these financial statements.
Statements of Financial Position (Unaudited)As at
March 31, 2017As at
September 30, 2016
AssetsCurrent Assets
Cash and cash equivalents $ 28,282 $ 73,814 Margin accounts (note 11) 655 3 Subscriptions receivable - 1,500 Receivable for investments sold 32,192 65,212 Dividends receivable 11,165 2,904 Investments (note 5) 6,905,503 5,812,034 Investments - pledged as collateral (note 5 and 11) 298,777 306,117 Derivative assets 9,974 2,361
7,286,548 6,263,945
LiabilitiesCurrent Liabilities
Management fees payable 12,083 9,827 Expenses payable 3,463 2,826 Redemptions payable 10,515 6,094 Payable for investments purchased - 53,357 Distributions payable 1,590 1,882 Derivative liabilities 12,607 17,251
40,258 91,237 Net Assets Attributable to Holders of Redeemable Units $ 7,246,290 $ 6,172,708
Net Assets Attributable to Holders of Redeemable Units Per SeriesSeries A 456,852 316,018 Series A2 6,588,809 5,660,292 Series F 200,629 196,398
$ 7,246,290 $ 6,172,708
Number of Redeemable Units Outstanding (note 6)Series A 40,622 35,744 Series A2 579,851 634,956 Series F 17,181 21,532
Net Assets Attributable to Holders of Redeemable Units Per UnitSeries A 11.25 8.84 Series A2 11.36 8.91 Series F 11.68 9.12
FINANCIAL STATEMENTS PORTLAND GLOBAL BANKS FUND
Approved by the Board of Directors of Portland Investment Counsel Inc.
Director Director
“Michael Lee-Chin” “Robert Almeida”
28

The accompanying notes are an integral part of these financial statements.
FINANCIAL STATEMENTS PORTLAND GLOBAL BANKS FUND
Statements of Comprehensive Income (Unaudited)
for the periods ended March 31, 2017 2016
IncomeNet gain (loss) on investments and derivatives
Dividends $ 60,190 $ 73,829 Interest for distribution purposes 285 - Net realized gain (loss) on investments and options 398,414 10,777 Net realized gain (loss) on currency forward contracts 1,065 (12,732)Change in unrealized appreciation (depreciation) on investments and derivatives 1,482,303 (1,613,936)
1,942,257 (1,542,062)
Other incomeForeign exchange gain (loss) on cash and other net assets (5,721) (22,486)
Total income (net) 1,936,536 (1,564,548)
ExpensesUnitholder reporting costs 73,925 83,867 Management fees (note 8) 68,548 78,121 Withholding tax expense 6,578 8,466 Audit fees 6,073 9,350 Legal fees 2,175 2,244 Transaction costs 1,798 5,800 Independent review committee fees 1,721 2,013 Interest expense 104 3 Custodial fees - 3,362
Total operating expenses 160,922 193,226 Less: expenses absorbed by Manager (64,230) (80,081)
Net operating expenses 96,692 113,145 Increase (Decrease) in Net Assets Attributable to Holders of Redeemable Units $ 1,839,844 $ (1,677,693)
Increase (Decrease) in Net Assets Attributable to Holders of Redeemable Units per SeriesSeries A 95,657 (75,526)Series A2 1,692,883 (1,546,639)Series F 51,304 (55,528)
Increase (Decrease) in Net Assets Attributable to Holders of Redeemable Units per UnitSeries A 2.57 (2.90)Series A2 2.79 (2.07)Series F 2.88 (2.32)
29

The accompanying notes are an integral part of these financial statements.
FINANCIAL STATEMENTS PORTLAND GLOBAL BANKS FUND
Statements of Changes in Net Assets Attributable to Holders of Redeemable Units (Unaudited)
for the periods ended March 31, 2017 2016
Net Assets Attributable to Holders of Redeemable Units at Beginning of PeriodSeries A $ 316,018 $ 150,723 Series A2 5,660,292 8,712,264 Series F 196,398 232,358
6,172,708 9,095,345
Increase (Decrease) in Net Assets Attributable to Holders of Redeemable UnitsSeries A 95,657 (75,526)Series A2 1,692,883 (1,546,639)Series F 51,304 (55,528)
1,839,844 (1,677,693)
Distributions to Holders of Redeemable UnitsFrom return of capitalSeries A (10,159) (7,013)Series A2 (162,290) (191,638)Series F (4,653) (6,308)Net Decrease from Distributions to Holders of Redeemable Units (177,102) (204,959)
Redeemable Unit TransactionsProceeds from redeemable units issuedSeries A 46,150 204,600 Series A2 62,030 35,991 Series F 602 45,084
108,782 285,675
Reinvestments of distributionsSeries A 9,186 6,864 Series A2 153,907 182,937 Series F 4,653 6,442
167,746 196,243
Redemptions of redeemable unitsSeries A - - Series A2 (818,013) (1,223,499)Series F (47,675) -
(865,688) (1,223,499)Net Increase (Decrease) from Redeemable Unit Transactions (589,160) (741,581)
Net Assets Attributable to Holders of Redeemable Units at End of PeriodSeries A 456,852 279,648 Series A2 6,588,809 5,969,416 Series F 200,629 222,048
$ 7,246,290 $ 6,471,112
30

The accompanying notes are an integral part of these financial statements.
Statements of Cash Flows (Unaudited)
for the periods ended March 31, 2017 2016
Cash Flows from Operating ActivitiesIncrease (Decrease) in Net Assets Attributable to Holders of Redeemable Units $ 1,839,844 $ (1,677,693) Adjustments for:
Net realized (gain) loss on investments and options (398,414) (10,777)Change in unrealized (appreciation) depreciation on investments and derivatives (1,482,303) 1,613,936 Unrealized foreign exchange (gain) loss on cash (678) (10,986)(Increase) decrease in dividends receivable (8,261) (15,392)Increase (decrease) in management fees and expenses payable 2,893 (4,891)(Increase) decrease in harmonized sales tax recoverable - 1,325 Purchase of investments (394,940) (1,053,449)Proceeds from sale of investments 1,156,934 2,144,389
Net Cash Generated (Used) by Operating Activities 715,075 986,462
Cash Flows from Financing ActivitiesChange in margin cash (652) (34,018)Distributions to holders of redeemable units, net of reinvested distributions (9,648) (8,608)Proceeds from redeemable units issued 110,088 320,675 Amount paid on redemption of redeemable units (861,073) (1,215,779)Net Cash Generated (Used) by Financing Activities (761,285) (937,730)
Net increase (decrease) in cash and cash equivalents (46,210) 48,732 Unrealized foreign exchange gain (loss) on cash 678 10,986 Cash and cash equivalents - beginning of period 73,814 18,469 Cash and cash equivalents - end of period 28,282 78,187
Cash and cash equivalents comprise:Cash at bank $ 28,282 $ 78,187
From operating activitiesInterest received, net of withholding tax $ 285 $ - Dividends received, net of withholding tax $ 45,351 $ 49,971
From financing activitiesInterest paid $ (104) $ (3)
FINANCIAL STATEMENTS PORTLAND GLOBAL BANKS FUND
31

The accompanying notes are an integral part of these financial statements.
FINANCIAL STATEMENTS PORTLAND GLOBAL BANKS FUND
EQUITIESFrance
600 BNP Paribas S.A. $ 42,044 $ 53,141 4,000 BNP Paribas S.A. ADR 156,152 177,030
198,196 230,171 3.2%Japan5,000 Sumitomo Mitsui Financial Group, Inc. ADR 42,553 48,207 0.7%
Netherlands12,000 ING Groep N.V. ADR 175,654 240,809 3.3%
Norway5,000 DNB ASA 110,074 105,398 1.4%
Sweden9,000 Nordea Bank AB 142,421 136,641 1.9%
United Kingdom60,000 Barclays PLC 647,592 225,032 50,000 Barclays PLC ADR 1,300,827 747,376
1,000 HSBC Holdings PLC ADR 72,991 54,284 46,500 Royal Bank of Scotland Group PLC ADR 543,245 375,357 22,500 Standard Chartered PLC 258,904 286,039
2,823,559 1,688,088 23.3%United States
23,000 Bank of America Corporation 414,399 721,537 15,600 Citigroup Inc. 808,153 1,241,005
3,600 Citizens Financial Group Inc. 112,219 165,407 2,700 Fifth Third Bancorp 68,824 91,201
12,000 JPMorgan Chase & Co. 473,217 1,401,768 2,800 Morgan Stanley 93,192 159,518 2,000 State Street Corporation 148,023 211,739 2,400 The Goldman Sachs Group Inc. 436,767 733,183
400 Wells Fargo & Company 22,554 29,608 2,577,348 4,754,966 65.6%
Total equities 6,069,805 7,204,280 99.4%
DERIVATIVES - WRITTEN OPTIONSWritten Call Options
United StatesUSD (15) Citigroup Inc., Call 65, 21/04/2017 (1,079) ( 140)USD (10) JPMorgan Chase & Co., Call 95, 21/04/2017 (772) (80)USD (20) Citigroup Inc., Call 67.5, 19/05/2017 (1,604) (252)USD (10) Citigroup Inc., Call 70, 19/05/2017 (454) (40)
USD (5) JPMorgan Chase & Co., Call 100, 19/05/2017 (700) (36)Total written call options ( 4,609) (548) -
Written Put OptionsUnited Kingdom
USD (35) Royal Bank of Scotland Group PLC ADR, Put 4, 19/05/2017 (650) (465) -
United StatesUSD (12) Bank of America Corporation, Put 20, 21/04/2017 (379) (16)USD (10) State Street Corporation, Put 67.5, 19/05/2017 (1,802) (459)
(2,181) (475) -Total written put options (2,831) (940) -Total written options ( 7,440) (1,488) -
FORWARD CURRENCY CONTRACTS (Schedule 1)Total unrealized gain on forward currency contracts - 10,614 0.1%Total unrealized loss on forward currency contracts - (11,759) (0.1)%
- (1,145) -Net Investments 6,062,365 7,201,647 99.4%Transaction costs (22,340) - -
$ 6,040,025 7,201,647 99.4%Other assets less liabilities 44,643 0.6% NET ASSETS ATTRIBUTABLE TO HOLDERS OF REDEEMABLE UNITS $ 7,246,290 100.0%
Schedule of Investment Portfolio (Unaudited) As at March 31, 2017
No. of Shares/
(Contracts) Security Name Average Cost Fair Value
% of Net AssetsAttributable
to Holders of Redeemable Units
32

The accompanying notes are an integral part of these financial statements.
FINANCIAL STATEMENTS PORTLAND GLOBAL BANKS FUND
Schedule of Investment Portfolio (continued) As at March 31, 2017
Schedule 1
Purchased Currency Sold Currency
Contract Price
Settlement Date Currency
Amount ($)
Value as at March 31, 2017
($) CurrencyAmount
($)
Value as at March 31, 2017
($)
Unrealized gain (loss)
($)0.69461 Jun-15-17 Canadian Dollar 215,948 215,948 Euro 150,000 213,328 2,6200.74377 Jun-15-17 Canadian Dollar 672,250 672,250 United States Dollar 500,000 664,256 7,994
Unrealized gain 10,614
85.08000 Jun-15-17 Canadian Dollar 35,261 35,261 Japanese Yen 3,000,000 35,901 (640)0.61357 May-18-17 Canadian Dollar 488,941 488,941 British Pound 300,000 500,060 (11,119)
Unrealized loss (11,759)
33

The accompanying notes are an integral part of these financial statements.
(a) OFFSETTING OF FINANCIAL ASSETS AND FINANCIAL LIABILITIESThe Fund uses two counterparties for the execution of forward currency contracts. One counterparty is a Canadian chartered bank and one is a national U.S. bank. The Fund has master netting or similar arrangements in place with both counterparties. This means that in the event of default, the Fund may set off the assets held with the counterparty against the liabilities it owes to the same counterparty. When applicable the contracts in place under these arrangements have been offset and presented as a net figure in the statements of financial position of the Fund, where applicable. There is no collateral associated with these arrangements.
The following table presents the gross amount of recognized financial assets and liabilities of the Fund under master netting or similar arrangements as at March 31, 2017 and September 30, 2016.
TD Securities Inc. ($)Bank of New York
Mellon ($)
March 31, 2017Gross derivative assets 10,614 -Gross derivative liabilities (640) (11,119)Net exposure 9,974 (11,119)September 30, 2016Gross derivative assets - 2,361Gross derivative liabilities (12,221) -Net exposure (12,221) 2,361
(b) FINANCIAL INSTRUMENTS BY CATEGORYThe following tables present the carrying amounts of the Fund’s financial instruments by category as at March 31, 2017:
Assets Held for Trading
($)
Financial assets at FVTPL Designated at Inception
($)
Financial assets at amortized cost($)
Total ($)
Cash and cash equivalents - - 28,282 28,282 Margin accounts - - 655 655 Receivable for investments sold - - 32,192 32,192 Dividends receivable - - 11,165 11,165 Investments - 6,905,503 - 6,905,503 Investments - pledged as collateral - 298,777 - 298,777 Derivative assets 9,974 - - 9,974 Total 9,974 7,204,280 72,294 7,286,548
Liabilities Held for Trading
($)
Financial liabilities at FVTPL Designated at Inception
($)
Financial liabilities at amortized cost($)
Total ($)
Management fees payable - - 12,083 12,083 Expenses payable - - 3,463 3,463 Redemptions payable - - 10,515 10,515 Distributions payable - - 1,590 1,590 Derivative liabilities 12,607 - - 12,607 Total 12,607 - 27,651 40,258
The following tables present the carrying amounts of the Fund’s financial instruments by category as at September 30, 2016:
Assets Held for Trading
($)
Financial assets at FVTPL Designated at Inception
($)
Financial assets at amortized cost($)
Total ($)
Cash and cash equivalents - - 73,814 73,814 Margin accounts - - 3 3 Subscriptions receivable - - 1,500 1,500 Receivable for investments sold - - 65,212 65,212 Dividends receivable - - 2,904 2,904 Investments - 5,812,034 - 5,812,034Investments - pledged as collateral - 306,117 - 306,117Derivative assets 2,361 - - 2,361 Total 2,361 6,118,151 143,433 6,263,945
FUND SPECIFIC NOTES TO THE FINANCIAL STATEMENTS PORTLAND GLOBAL BANKS FUND
34

The accompanying notes are an integral part of these financial statements.
Liabilities Held for Trading
($)
Financial liabilities at FVTPL Designated at Inception
($)
Financial liabilities at amortized cost($)
Total ($)
Management fees payable - - 9,827 9,827Expenses payable - - 2,826 2,826 Redemptions payable - - 6,094 6,094 Payable for investments purchased - - 53,357 53,357 Distributions payable - - 1,882 1,882 Derivative liabilities 17,251 - - 17,251 Total 17,251 - 73,986 91,237
The following table presents the net gains (losses) on financial instruments at FVTPL by category for the six months periods ended March 31, 2017 and March 31, 2016.
Net gains (losses) ($)
Category 2017 2016
Financial assets at FVTPLHeld for Trading $ 9,781 49,236 Designated at Inception 1,944,815 (1,591,298)
Total 1,954,596 (1,542,062)Financial liabilities at FVTPL: Held for Trading (12,624) - Total $ 1,941,972 (1,542,062)
(c) RISK MANAGEMENT
Price RiskPlease see note 5 for a definition of Price Risk. The Manager moderates this risk through diversification of securities and other financial instruments within the limits of the Fund’s investment objectives and strategy.
The Fund is limited to investing in securities that comprise no more than 10% of the net asset value at the time of purchase.
If the price of investments held by the Fund on March 31, 2017 had been higher or lower by 5%, the net assets attributable to holders of redeemable units of the Fund would have been higher or lower by $360,140 (September 30, 2016: $305,656). Actual results may differ from the above sensitivity analysis and the difference could be material.
Concentration RiskThe following tables present the Fund’s exposure as a percentage of its net assets attributable to holders of redeemable units by geographic region and by industry sector as at March 31, 2017 and September 30, 2016.
By Geographic Region March 31, 2017 September 30, 2016
United States 65.6% 71.7%
United Kingdom 23.3% 21.6%
Netherlands 3.3% 3.2%
France 3.2% 1.5%
Sweden 1.9% -
Norway 1.4% -
Japan 0.7% 1.0%
Other Net Assets (Liabilities) 0.6% 1.2%
Forward Currency Contracts - (0.2%)
Total 100.0% 100.0%
FUND SPECIFIC NOTES TO THE FINANCIAL STATEMENTS PORTLAND GLOBAL BANKS FUND
35

The accompanying notes are an integral part of these financial statements.
By Industry Sector March 31, 2017 September 30, 2016
Diversified Banks 80.6% 80.5%
Investment Banking & Brokerage 12.3% 10.1%
Regional Banks 3.6% 4.7%
Asset Management & Custody Banks 2.9% 3.7%
Other Net Assets (Liabilities) 0.6% 1.2%
Forward Currency Contracts - (0.2%)
Total 100.0% 100.0%
Currency RiskAs the Fund will invest in securities traded in foreign currencies, its net assets and cash flows, when measured in Canadian dollars, will, to the extent that they have not been fully hedged, be affected by changes in the value of these currencies relative to the Canadian dollar.
The use of currency risk mitigation strategies such as forward currency contracts involves special risks including the possible default by the counterparty to the transaction, illiquidity and to the extent the Manager’s assessment of certain market movements is incorrect, the risk that the use of such strategies could result in losses greater than if the strategy had not been used. The forward currency contracts may have the effect of limiting or reducing the total returns of the Fund if the Manager’s expectations concerning future events or market conditions prove to be incorrect. In addition, costs associated with the forward currency contracts may outweigh the benefits of the arrangements in some circumstances.
The Manager may, from time to time, at its sole discretion, enter into forward currency contracts in relation to all or a portion of the value of the Fund’s non-Canadian dollar currency exposure or the non-Canadian currency exposure of the issuers whose securities comprise the Fund’s portfolio back, directly or indirectly, to the Canadian dollar. Forward currency contract amounts are based on a combination of trading currency of the Fund’s holdings and an estimate of the currency to which their operations are exposed.
The tables below indicate the foreign currencies to which the Fund had significant exposure at March 31, 2017 and September 30, 2016, in Canadian dollar terms, net of the notional amounts of forward currency contracts. The table also illustrates the potential impact on the net assets attributable to holders of redeemable units if the Canadian dollar had strengthened or weakened by 5% in relation to each of the other currencies, with all other variables held constant.
March 31, 2017
Exposure Impact on net assets attributable to holders
of redeemable units
Monetary ($)
Non-monetary ($)
Total ($)
Monetary ($)
Non-monetary ($)
Total ($)
British Pound (498,060) 511,071 13,011 (24,903) 25,554 651Euro (213,328) 53,141 (160,187) (10,666) 2,657 (8,009)Japanese Yen (35,901) - (35,901) (1,795) - (1,795)Norwegian Krone - 105,397 105,397 - 5,270 5,270Swedish Krona - 136,641 136,641 - 6,832 6,832United States Dollar (620,887) 6,396,540 5,775,653 (31,044) 319,827 288,783Total (1,368,176) 7,202,790 5,834,614 (68,408) 360,140 291,732% of net assets attributable to holders of redeemable units (18.9%) 99.4% 80.5% (0.9%) 5.0% 4.1%
September 30, 2016
Exposure Impact on net assets attributable to holders
of redeemable units
Monetary ($)
Non-monetary ($)
Total ($)
Monetary ($)
Non-monetary ($)
Total ($)
United States Dollar (1,100,127) 5,634,343 4,534,216 (55,006) 281,717 226,711British Pound (510,211) 438,306 (71,905) (25,511) 21,915 (3,596)Japanese Yen (77,826) - (77,826) (3,891) - (3,891)Euro (590,836) 40,473 (550,363) (29,542) 2,024 (27,518)Total (2,279,000) 6,113,122 3,834,122 (113,950) 305,656 191,706% of net assets attributable to holders of redeemable units (36.9%) 99.0% 62.1% (1.8%) 5.0% 3.2%
Interest Rate RiskAs at March 31, 2017 and September 30, 2016, the Fund did not have significant direct exposure to interest rate risk.
FUND SPECIFIC NOTES TO THE FINANCIAL STATEMENTS PORTLAND GLOBAL BANKS FUND
36

The accompanying notes are an integral part of these financial statements.
Credit RiskThe Fund’s exposure to credit risk arises primarily from investments in forward currency contracts. The maximum exposure to credit risk from these contracts is equivalent to the fair value of forward currency contracts that are in a net unrealized gain position as of the reporting date.
As at March 31, 2017 and September 30, 2016 the Fund had forward currency contracts with two counterparties. The following table outlines the exposure and credit rating of each counterparty in an unrealized gain position as of the date of the statements of financial position. The counterparties both have credit ratings which exceed the minimum requirement outlined in securities legislation.
March 31, 2017Net Unrealized Gain
($)Credit Rating
TD Securities Inc. 9,974 Standard & Poor’s AA-
September 30, 2016
Net Unrealized Gain($)
Credit Rating
Bank of New York Mellon 2,361 Standard & Poor’s A-1
The Fund limits its exposure to credit losses on forward currency contracts by ensuring there are netting arrangements with each counterparty to the forward currency contracts, such that any gains (amounts owing to the Fund) on individual contracts can be set off against any losses (amounts owing to the counterparty) in the event of default.
The Fund’s cash and margin accounts are maintained at financial institutions with a Standard & Poor’s credit rating of AA- and A+; and therefore credit risk is deemed minimal.
Liquidity RiskThe Fund is exposed to liquidity risk on its obligations, including its issued redeemable units, derivative liabilities, management fees payable, expenses payable, redemptions payable and distributions payable, as applicable.
The liquidity risk associated with issued redeemable units is managed by investing in a diversified portfolio with no more than 10% of its net assets in illiquid investments at the time of purchase. The Fund may also borrow temporarily to fund redemptions or settle trades.
As at March 31, 2017 and September 30, 2016, the Fund did not have any borrowings.
The Fund writes cash secured put options in accordance with its investment objectives and strategies. The value of the securities and/or cash required to satisfy the written options if they were exercised, is presented in the table below.
Value of securities or cash required to satisfy written put options
Less than 1 month ($)
1 to 3 months ($)
Greater than 3 months and less than one year
($)Total
($)
March 31, 2017 31,916 108,383 - 140,299September 30, 2016 26,239 98,396 69,534 194,169
All other obligations including management fees payable, expenses payable, redemptions payable, derivative liabilities associated with currency forward contracts and distributions payable, as applicable, were due within 3 months from the financial reporting date. Issued redeemable units are payable on demand.
(d) FAIR VALUE MEASUREMENTSThe following tables illustrate the classification of the Fund’s financial instruments within the fair value hierarchy as at March 31, 2017 and September 30, 2016.
Assets at fair value as at March 31, 2017 Level 1
($) Level 2
($) Level 3
($) Total
($)
Equities - Long 7,204,280 - - 7,204,280 Forward currency contracts - 10,614 - 10,614 Total 7,204,280 10,614 - 7,214,894
Liabilities at fair value as at March 31, 2017 Level 1
($) Level 2
($) Level 3
($) Total
($)
Options - Short (1,488) - - (1,488)Forward currency contracts - (11,759) - (11,759)Total (1,488) (11,759) - (13,247)
FUND SPECIFIC NOTES TO THE FINANCIAL STATEMENTS PORTLAND GLOBAL BANKS FUND
37

The accompanying notes are an integral part of these financial statements.
FUND SPECIFIC NOTES TO THE FINANCIAL STATEMENTS PORTLAND GLOBAL BANKS FUND
Assets at fair value as at September 30, 2016 Level 1
($) Level 2
($) Level 3
($) Total
($)
Equities - Long 6,118,151 - - 6,118,151 Forward currency contracts - 2,361 - 2,361 Total 6,118,151 2,361 - 6,120,512
Liabilities at fair value as at September 30, 2016 Level 1
($) Level 2
($) Level 3
($) Total
($)
Options - Short (5,030) - - (5,030)Forward currency contracts - (12,221) - (12,221)Total (5,030) (12,221) - (17,251)
Fair values are classified as Level 1 when the related security or derivative is actively traded and a quoted price is available. If an instrument classified as Level 1 subsequently ceases to be actively traded, it is transferred out of Level 1. In such cases, instruments are reclassified into Level 2, unless the measurement of its fair value requires the use of significant unobservable inputs, in which case it is classified as Level 3.
(e) STRUCTURED ENTITIESAs at March 31, 2017 and September 30, 2016 the Fund did not have any investments in ETFs.
38

The accompanying notes are an integral part of these financial statements.
Statements of Financial Position (Unaudited)As at
March 31, 2017As at
September 30, 2016
AssetsCurrent Assets
Cash and cash equivalents $ 228,408 $ 234,295 Margin accounts (note 11) 6,721 3,749 Subscriptions receivable 85,557 - Receivable for investments sold 668 17,391 Interest receivable 2,394 2,367 Dividends receivable 8,621 8,376 Investments (note 5) 5,326,073 5,046,071 Investments - pledged as collateral (note 5 and 11) 58,407 103,697 Derivative assets 4,477 1,763
5,721,326 5,417,709
LiabilitiesCurrent Liabilities
Management fees payable 7,723 7,084 Expenses payable 2,625 2,445 Redemptions payable 1,238 9,996 Payable for investments purchased 53,841 29,643 Distributions payable 2,943 2,250 Derivative liabilities 12,965 22,058
81,335 73,476 Net Assets Attributable to Holders of Redeemable Units $ 5,639,991 $ 5,344,233
Net Assets Attributable to Holders of Redeemable Units Per SeriesSeries A 967,672 753,528 Series A2 3,532,885 3,475,041 Series F 1,139,434 1,115,664
$ 5,639,991 $ 5,344,233
Number of Redeemable Units Outstanding (note 6)Series A 95,722 79,618 Series A2 346,524 364,590 Series F 108,249 113,958
Net Assets Attributable to Holders of Redeemable Units Per UnitSeries A 10.11 9.46 Series A2 10.20 9.53 Series F 10.53 9.79
FINANCIAL STATEMENTS PORTLAND GLOBAL INCOME FUND
Approved by the Board of Directors of Portland Investment Counsel Inc.
Director Director
“Michael Lee-Chin” “Robert Almeida”
39

FINANCIAL STATEMENTS PORTLAND ADVANTAGE FUND
The accompanying notes are an integral part of these financial statements.
FINANCIAL STATEMENTS PORTLAND GLOBAL INCOME FUND
Statements of Comprehensive Income (Unaudited)
for the periods ended March 31, 2017 2016
IncomeNet gain (loss) on investments and derivatives
Dividends $ 82,413 $ 123,835 Interest for distribution purposes 22,284 4,587 Net realized gain (loss) on investments and options (3,089) 64,936 Net realized gain (loss) on currency forward contracts 4,924 (29,380)Change in unrealized appreciation (depreciation) on investments and derivatives 450,157 (89,351)
556,689 74,627
Other incomeForeign exchange gain (loss) on cash and other net assets (4,151) (2,507)
Total income (net) 552,538 72,120
ExpensesUnitholder reporting costs 66,219 91,368 Management fees (note 8) 43,506 47,883 Audit fees 6,236 9,576 Withholding tax expense 3,739 9,994 Legal fees 1,879 3,148 Independent review committee fees 1,766 2,061 Transaction costs 937 2,271 Custodial fees 672 3,151 Interest expense 19 43
Total operating expenses 124,973 169,495 Less: expenses absorbed by Manager (61,894) (92,981)
Net operating expenses 63,079 76,514 Increase (Decrease) in Net Assets Attributable to Holders of Redeemable Units $ 489,459 $ (4,394)
Increase (Decrease) in Net Assets Attributable to Holders of Redeemable Units per SeriesSeries A 73,600 (2,345)Series A2 308,159 (4,461)Series F 107,700 2,412
Increase (Decrease) in Net Assets Attributable to Holders of Redeemable Units per UnitSeries A 0.88 (0.04)Series A2 0.90 (0.02)Series F 0.98 0.02
40

FINANCIAL STATEMENTS PORTLAND ADVANTAGE FUND
The accompanying notes are an integral part of these financial statements.
FINANCIAL STATEMENTS PORTLAND GLOBAL INCOME FUND
Statements of Changes in Net Assets Attributable to Holders of Redeemable Units (Unaudited)
for the periods ended March 31, 2017 2016
Net Assets Attributable to Holders of Redeemable Units at Beginning of PeriodSeries A $ 753,528 $ 776,845 Series A2 3,475,041 4,102,794 Series F 1,115,664 1,176,728
5,344,233 6,056,367
Increase (Decrease) in Net Assets Attributable to Holders of Redeemable UnitsSeries A 73,600 (2,345)Series A2 308,159 (4,461)Series F 107,700 2,412
489,459 (4,394)
Distributions to Holders of Redeemable UnitsFrom net investment incomeSeries A (8,792) - Series A2 (33,856) - Series F (16,006) -
(58,654) -
From return of capitalSeries A (12,635) (21,132)Series A2 (51,205) (104,421)Series F (11,345) (30,599)
(75,185) (156,152)Net Decrease from Distributions to Holders of Redeemable Units (133,839) (156,152)
Redeemable Unit TransactionsProceeds from redeemable units issuedSeries A 149,496 5,347 Series A2 273,076 20,204 Series F 67,466 15,635
490,038 41,186
Reinvestments of distributionsSeries A 15,608 17,144 Series A2 78,738 98,391 Series F 24,549 30,573
118,895 146,108
Redemptions of redeemable unitsSeries A (3,133) (11,612)Series A2 (517,068) (471,851)Series F (148,594) (100,486)
(668,795) (583,949)Net Increase (Decrease) from Redeemable Unit Transactions (59,862) (396,655)
Net Assets Attributable to Holders of Redeemable Units at End of PeriodSeries A 967,672 764,247 Series A2 3,532,885 3,640,656 Series F 1,139,434 1,094,263
$ 5,639,991 $ 5,499,166
41

The accompanying notes are an integral part of these financial statements.
Statements of Cash Flows (Unaudited)
for the periods ended March 31, 2017 2016
Cash Flows from Operating ActivitiesIncrease (Decrease) in Net Assets Attributable to Holders of Redeemable Units $ 489,459 $ (4,394) Adjustments for:
Net realized (gain) loss on investments and options 3,089 (64,936)Change in unrealized (appreciation) depreciation on investments and derivatives (450,157) 89,351 Unrealized foreign exchange (gain) loss on cash (298) (145)(Increase) decrease in interest receivable (27) 470 (Increase) decrease in dividends receivable (245) 2,464 Increase (decrease) in management fees and expenses payable 819 (1,021)(Increase) decrease in harmonized sales tax recoverable - 116 Purchase of investments (504,913) (745,630)Proceeds from sale of investments 746,383 1,368,422
Net Cash Generated (Used) by Operating Activities 284,110 644,697
Cash Flows from Financing ActivitiesChange in margin cash (2,972) 12,146 Distributions to holders of redeemable units, net of reinvested distributions (14,251) (9,967)Proceeds from redeemable units issued 403,462 41,186 Amount paid on redemption of redeemable units (676,534) (598,977)Net Cash Generated (Used) by Financing Activities (290,295) (555,612)
Net increase (decrease) in cash and cash equivalents (6,185) 89,085 Unrealized foreign exchange gain (loss) on cash 298 145 Cash and cash equivalents - beginning of period 234,295 58,435 Cash and cash equivalents - end of period 228,408 147,665
Cash and cash equivalents comprise:Cash at bank $ 228,408 $ 147,665
From operating activitiesInterest received, net of withholding tax $ 22,257 $ 5,057 Dividends received, net of withholding tax $ 78,429 $ 116,305
From financing activitiesInterest paid $ (19) $ (43)
FINANCIAL STATEMENTS PORTLAND GLOBAL INCOME FUND
42

FINANCIAL STATEMENTS PORTLAND ADVANTAGE FUNDFINANCIAL STATEMENTS PORTLAND GLOBAL INCOME FUND
The accompanying notes are an integral part of these financial statements.
BONDSCanada 100,000 Northland Power Inc. 5.000%, Convertible, Callable, June 30, 2019 $ 100,000 $ 116,000 100,000 Valeant Pharmaceuticals International Inc. 6.750%, Callable, August 15, 2018 126,307 133,151
226,307 249,151 4.4%EQUITIES
Australia5,000 Amcor Limited 52,817 76,505
40,000 AusNet Services 46,061 68,479 5,000 Super Retail Group Ltd. 41,925 52,070
140,803 197,054 3.5%Bermuda
3,000 Brookfield Infrastructure Partners L.P., Preferred, Series 5, Fixed-Reset 75,000 77,760 7,000 Brookfield Property Partners L.P. 162,300 207,620 2,000 Brookfield Renewable Partners L.P., Preferred, Series 11, Fixed-Reset 50,000 49,800 5,000 Cheung Kong Infrastructure Holdings Limited 35,125 52,191
322,425 387,371 6.9%Canada
2,000 AltaGas Ltd. Preferred, Series K, Fixed-Reset 50,000 51,300 3,500 Barrick Gold Corporation 73,928 88,388
15,000 BCE Inc., Preferred, Series AE, Floating Rate 307,274 256,650 1,000 Brookfield Asset Management Inc., Preferred, Series 46, Fixed-Reset 25,000 25,900 3,000 Brookfield Asset Management Inc., Preferred, Series 8, Floating Rate 69,418 51,780 1,000 Brookfield Office Properties Inc., Preferred, Series EE, Fixed-Reset 25,000 25,240
13,500 Brookfield Office Properties Inc., Preferred, Series V, Floating Rate 178,825 153,900 5,000 Brookfield Renewable Power Inc., Preferred, Series 2, Floating Rate 92,541 93,000 1,000 Crescent Point Energy Corp. 24,220 14,370 3,000 Enbridge Inc., Preferred, Series 11, Fixed-Reset 73,730 63,000 1,000 Enbridge Inc., Preferred, Series 17, Fixed-Reset 25,000 26,000 9,000 First National Financial Corporation, Preferred, Series 1, Fixed-Reset 142,003 136,260 2,000 iShares 1-5 Year Laddered Corporate Bond Index ETF 39,457 37,900 2,000 iShares S&P/TSX Canadian Preferred Share Index ETF 28,768 28,200 6,000 Northland Power Inc., Preferred, Series 1, Fixed-Reset 137,354 115,050
697 Pacific Exploration and Production Corporation 39,729 29,623 5,000 Power Financial Corporation, Preferred, Series A, Floating Rate 81,760 72,050 6,000 The Bank of Nova Scotia, Preferred, Series 19, Floating Rate 154,455 146,580
12,500 Thomson Reuters Corporation, Preferred, Series B, Floating Rate 225,533 172,500 7,000 TransAlta Corporation, Preferred, Series E, Fixed-Reset 168,439 137,620 2,000 TransAlta Renewables Inc. 19,580 31,500 1,500 TransCanada Corporation, Preferred, Series 15, Fixed-Reset 37,500 39,000 4,800 TransCanada Corporation, Preferred, Series 2, Floating Rate 86,332 90,720
2,105,846 1,886,531 33.4%France
1,515 Total SA ADR 94,797 101,582 1.8%
Sweden5,000 Nordea Bank AB 41,852 75,912 1.4%
Switzerland1,700 ABB Ltd 44,650 52,902 1,000 Aryzta AG 36,623 42,684
800 Nestlé SA 61,706 81,625 200 Roche Holding AG 57,129 67,923 700 Syngenta AG 52,637 82,384
252,745 327,518 5.8%United Kingdom
7,000 Barclays PLC ADR 129,834 104,633 3,500 BHP Billiton PLC 192,747 144,987
800 BP PLC ADR 34,139 36,725 1,500 Bunzl PLC 43,158 57,983 3,000 Compass Group PLC 64,338 75,277 1,000 Johnson Matthey PLC 59,118 51,318 2,800 Royal Dutch Shell PLC ADR 195,924 196,344
719,258 667,267 11.8%
Schedule of Investment Portfolio (Unaudited) As at March 31, 2017
No. of Shares/Par
Value/ (Contracts) Security Name Average Cost Fair Value
% of Net AssetsAttributable
to Holders of Redeemable Units
43

FINANCIAL STATEMENTS PORTLAND ADVANTAGE FUND
The accompanying notes are an integral part of these financial statements.
FINANCIAL STATEMENTS PORTLAND GLOBAL INCOME FUND
Schedule of Investment Portfolio (continued) As at March 31, 2017
No. of Shares/Par
Value/ (Contracts) Security Name Average Cost Fair Value
% of Net AssetsAttributable
to Holders of Redeemable Units
United States4,000 Ares Capital Corporation 74,197 92,451
800 AT&T Inc. 39,563 44,204 4,000 BlackRock Capital Investment Corporation 39,301 40,161
750 Chevron Corporation 99,577 107,090 1,500 Energy Select Sector SPDR Fund 138,480 139,435
14,000 Fifth Street Senior Floating Rate Corp. 183,921 164,210 300 Gilead Sciences, Inc. 29,799 27,097 100 iShares iBoxx $ Investment Grade Corporate Bond ETF 14,256 15,680
1,500 iShares India 50 ETF 55,519 64,491 6,000 iShares International Select Dividend ETF 234,964 251,023
500 JPMorgan Chase & Co. 22,724 58,407 1,000 PowerShares Fundamental High Yield Corporate Bond Portfolio 20,796 25,015
600 SPDR S&P 500 ETF Trust 156,069 188,099 700 SPDR S&P Global Dividend ETF 58,565 60,145
1,500 Technology Select Sector SPDR Fund ETF 69,638 106,341 400 The Walt Disney Company 49,103 60,317 500 Wal-Mart Stores, Inc. 40,684 47,928
1,327,156 1,492,094 26.5%Total equities 5,004,882 5,135,329 91.1%Total investment portfolio 5,231,189 5,384,480 95.5%
DERIVATIVES - WRITTEN OPTIONSWritten Call Options
CanadaUSD (10) Barrick Gold Corporation, Call 23, 19/05/2017 (467) (134) -
United StatesUSD (5) JPMorgan Chase & Co., Call 95, 21/04/2017 (386) (40)USD (3) Gilead Sciences, Inc., Call 77.5, 19/05/2017 (324) (80)
(710) (120) -Total written call options (1,177) (254) -
Written Put OptionsBermuda
CAD (5) Brookfield Property Partners L.P., Put 28, 21/04/2017 (370) (40) -
CanadaUSD (15) Barrick Gold Corporation, Put 15, 21/04/2017 (707) (20)CAD (10) Crescent Point Energy Corp., Put 13, 19/01/2018 (1,340) (1,160)
(2,047) (1,180) -Switzerland
USD (8) ABB Ltd ADR, Put 22, 16/06/2017 (361) (372) -
United KingdomUSD (10) BP PLC ADR, Put 32, 19/05/2017 (306) (319) -
Total written put options (3,084) (1,911) -Total written options (4,261) (2,165) -
FORWARD CURRENCY CONTRACTS (Schedule 1)Total unrealized gain on forward currency contracts - 4,477 0.1%Total unrealized loss on forward currency contracts - (10,800) (0.2%)
- (6,323) (0.1%)Net investments 5,226,928 5,375,992 95.4%Transaction costs (4,208) - -
$ 5,222,720 5,375,992 95.4%Other assets less liabilities 263,999 4.6%NET ASSETS ATTRIBUTABLE TO HOLDERS OF REDEEMABLE UNITS $ 5,639,991 100.0%
44
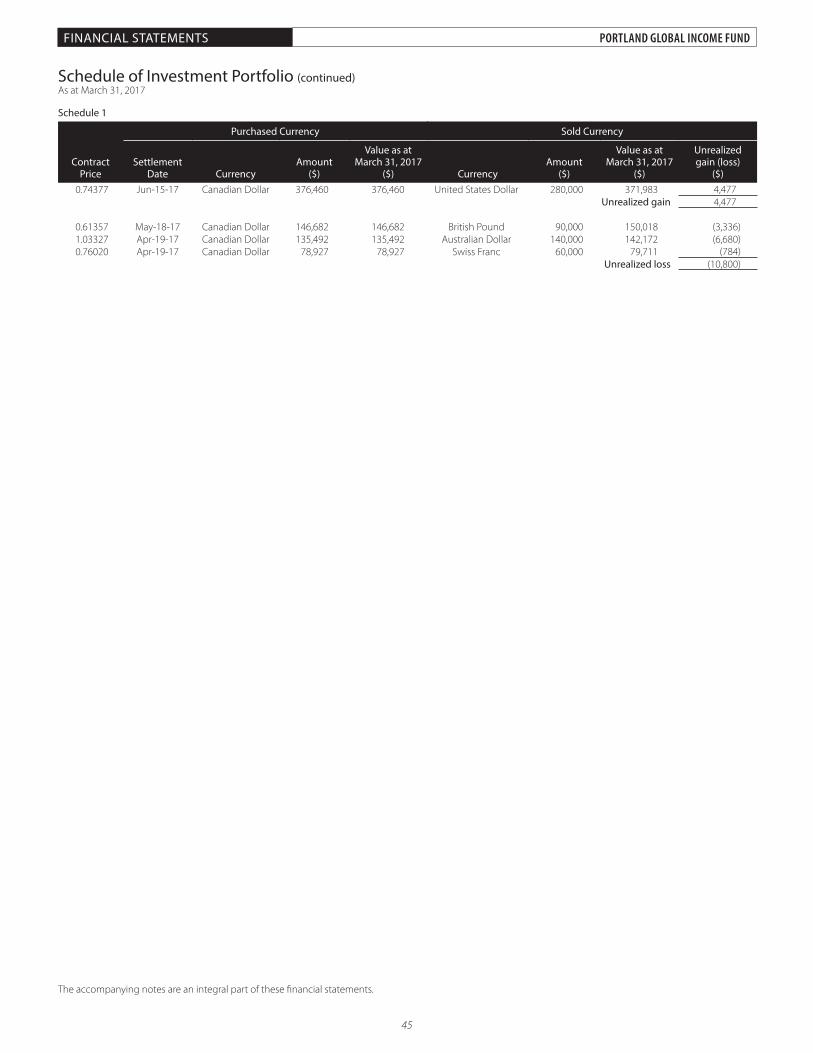
The accompanying notes are an integral part of these financial statements.
FINANCIAL STATEMENTS PORTLAND GLOBAL INCOME FUND
Schedule of Investment Portfolio (continued) As at March 31, 2017
Schedule 1
Purchased Currency Sold Currency
Contract Price
Settlement Date Currency
Amount($)
Value as at March 31, 2017
($) CurrencyAmount
($)
Value as at March 31, 2017
($)
Unrealized gain (loss)
($)0.74377 Jun-15-17 Canadian Dollar 376,460 376,460 United States Dollar 280,000 371,983 4,477
Unrealized gain 4,477
0.61357 May-18-17 Canadian Dollar 146,682 146,682 British Pound 90,000 150,018 (3,336)1.03327 Apr-19-17 Canadian Dollar 135,492 135,492 Australian Dollar 140,000 142,172 (6,680)0.76020 Apr-19-17 Canadian Dollar 78,927 78,927 Swiss Franc 60,000 79,711 (784)
Unrealized loss (10,800)
45

The accompanying notes are an integral part of these financial statements.
(a) OFFSETTING OF FINANCIAL ASSETS AND FINANCIAL LIABILITIESThe Fund uses three counterparties for the execution of forward currency contracts. Two counterparties are Canadian chartered banks and one is a national U.S. bank. The Fund has master netting or similar arrangements in place with all counterparties. This means that in the event of default, the Fund may set off the assets held with the counterparty against the liabilities it owes to the same counterparty. The contracts in place under these arrangements have been offset and presented as a net figure in the statements of financial position of the Fund, where applicable. There is no collateral associated with these arrangements.
The following table presents the gross amount of recognized financial assets and liabilities of the Fund that are offset under master netting or similar arrangements as at March 31, 2017 and September 30, 2016.
TD Securities Inc. ($)National Bank of
Canada ($)Bank of New York
Mellon ($)
March 31, 2017Gross derivative assets 4,477 - -Gross derivative liabilities - (7,465) (3,336)Net exposure 4,477 (7,465) (3,336)September 30, 2016Gross derivative assets 105 - 1,763Gross derivative liabilities (5,669) (11,775) -Net exposure (5,564) (11,775) 1,763
(b) FINANCIAL INSTRUMENTS BY CATEGORYThe following tables present the carrying amounts of the Fund’s financial instruments by category as at March 31, 2017:
Assets Held for Trading
($)
Financial assets at FVTPL Designated at Inception
($)
Financial assets at amortized cost($)
Total ($)
Cash and cash equivalents - - 228,408 228,408 Margin accounts - - 6,721 6,721 Subscriptions receivable - - 85,557 85,557 Receivable for investments sold - - 668 668 Interest receivable - - 2,394 2,394 Dividends receivable - - 8,621 8,621 Investments - 5,326,073 - 5,326,073 Investments - pledged as collateral - 58,407 - 58,407 Derivative assets 4,477 - - 4,477 Total 4,477 5,384,480 332,369 5,721,326
Liabilities Held for Trading
($)
Financial liabilities at FVTPL Designated at Inception
($)
Financial liabilities at amortized cost($)
Total ($)
Management fees payable - - 7,723 7,723 Expenses payable - - 2,625 2,625 Redemptions payable - - 1,238 1,238 Payable for investments purchased - - 53,841 53,841 Distributions payable - - 2,943 2,943 Derivative liabilities 12,965 - - 12,965 Total 12,965 - 68,370 81,335
The following tables present the carrying amounts of the Fund’s financial instruments by category as at September 30, 2016:
Assets Held for Trading
($)
Financial assets at FVTPL Designated at Inception
($)
Financial assets at amortized cost($)
Total ($)
Cash and cash equivalents - - 234,295 234,295 Margin accounts - - 3,749 3,749 Receivable for investments sold - - 17,391 17,391 Interest receivable - - 2,367 2,367 Dividends receivable - - 8,376 8,376 Investments - 5,046,071 - 5,046,071Investments - pledged as collateral - 103,697 - 103,697Derivative assets 1,763 - - 1,763 Total 1,763 5,149,768 266,178 5,417,709
FUND SPECIFIC NOTES TO THE FINANCIAL STATEMENTS PORTLAND GLOBAL INCOME FUND
46

The accompanying notes are an integral part of these financial statements.
Liabilities Held for Trading
($)
Financial liabilities at FVTPL Designated at Inception
($)
Financial liabilities at amortized cost($)
Total ($)
Management fees payable - - 7,084 7,084 Expenses payable - - 2,445 2,445 Redemptions payable - - 9,996 9,996 Payable for investments purchased - - 29,643 29,643 Distributions payable - - 2,250 2,250 Derivative liabilities 22,058 - - 22,058 Total 22,058 - 51,418 73,476
The following table presents the net gains (losses) on financial instruments at FVTPL by category for the six months period ended March 31, 2017 and March 31, 2016.
Net gains (losses) ($)
Category 2017 2016
Financial assets at FVTPL Held for Trading 14,176 5,015 Designated at Inception 534,303 69,612
Total 548,479 74,627 Financial liabilities at FVTPL:
Held for Trading 8,191 - Total 556,670 74,627
(c) RISK MANAGEMENT
Price RiskPlease see note 5 for a definition of Price Risk. The Manager moderates this risk through diversification of securities and other financial instruments within the limits of the Fund’s investment objectives and strategy.
The Fund is limited to investing in securities that comprise no more than 10% of the net asset value at the time of purchase.
If the price of investments held by the Fund on March 31, 2017 had been higher or lower by 5%, the net assets attributable to holders of redeemable units of the Fund would have been higher or lower by $256,658 (September 30, 2016: $243,306). Actual results may differ from the above sensitivity analysis and the difference could be material.
Concentration RiskThe following tables present the Fund’s exposure as a percentage of its net assets attributable to holders of redeemable units by geographic region and industry sector, as at March 31, 2017 and September 30, 2016.
By Geographic Region March 31, 2017 September 30, 2016
Canada 37.8% 33.4%
United States 26.5% 29.8%
United Kingdom 11.8% 12.4%
Bermuda 6.9% 6.4%
Switzerland 5.8% 6.0%
Other Net Assets (Liabilities) 4.6% 4.0%
Australia 3.5% 5.3%
France 1.8% 1.8%
Sweden 1.4% 1.2%
Forward Currency Contracts (0.1%) (0.3%)
Total 100.0% 100.0%
FUND SPECIFIC NOTES TO THE FINANCIAL STATEMENTS PORTLAND GLOBAL INCOME FUND
47

The accompanying notes are an integral part of these financial statements.
By Industry Sector March 31, 2017 September 30, 2016
Financials 23.8% 24.3%
Exchange Traded Funds 16.3% 21.0%
Energy 13.5% 10.4%
Utilities 11.0% 9.3%
Materials 8.0% 8.0%
Consumer Discretionary 6.4% 6.5%
Telecommunication Services 5.4% 4.0%
Other Net Assets (Liabilities) 4.6% 4.0%
Corporate Bonds 4.5% 5.3%
Consumer Staples 3.0% 3.7%
Industrials 1.9% 2.0%
Health Care 1.7% 1.8%
Forward Currency Contracts (0.1%) (0.3%)
Total 100.0% 100.0%
Currency RiskAs the Fund will invest in securities traded in foreign currencies, its net assets and cash flows, when measured in Canadian dollars, will, to the extent that they have not been fully hedged, be affected by changes in the value of these currencies relative to the Canadian dollar.
The use of currency risk mitigation strategies such as forward currency contracts involves special risks including the possible default by the counterparty to the transaction, illiquidity and to the extent the Manager’s assessment of certain market movements is incorrect, the risk that the use of such strategies could result in losses greater than if the strategy had not been used. The forward currency contracts may have the effect of limiting or reducing the total returns of the Fund if the Manager’s expectations concerning future events or market conditions prove to be incorrect. In addition, costs associated with the forward currency contracts may outweigh the benefits of the arrangements in some circumstances.
The Manager may, from time to time, at its sole discretion, enter into forward currency contracts in relation to all or a portion of the value of the Fund’s non-Canadian dollar currency exposure or the non-Canadian currency exposure of the issuers whose securities comprise the Fund’s portfolio back, directly or indirectly, to the Canadian dollar. Forward currency contract amounts are based on a combination of trading currency of the Fund’s holdings and an estimate of the currency to which their operations are exposed.
The tables below indicate the foreign currencies to which the Fund had significant direct exposure at March 31, 2017 and September 30, 2016, in Canadian dollar terms, net of the notional amounts of forward currency contracts. The table also illustrates the potential impact on the net assets attributable to holders of redeemable units if the Canadian dollar had strengthened or weakened by 5% in relation to each of the other currencies, with all other variables held constant.
March 31, 2017
Exposure Impact on net assets attributable to holders
of redeemable units
Monetary ($)
Non-monetary ($)
Total ($)
Monetary ($)
Non-monetary ($)
Total ($)
Australian Dollar (141,080) 197,054 55,974 (7,054) 9,853 2,799British Pound (150,018) 184,578 34,560 (7,501) 9,229 1,728Hong Kong Dollar - 52,191 52,191 - 2,610 2,610Swedish Krona - 75,911 75,911 - 3,796 3,796Swiss Franc (79,711) 192,232 112,521 (3,986) 9,612 5,626United States Dollar (410,371) 2,432,226 2,021,855 (20,519) 121,611 101,092Total (781,180) 3,134,192 2,353,012 (39,060) 156,711 117,651% of net assets attributable to holders of redeemable units (13.9%) 55.7% 41.8% (0.7%) 2.8% 2.1%
FUND SPECIFIC NOTES TO THE FINANCIAL STATEMENTS PORTLAND GLOBAL INCOME FUND
48

The accompanying notes are an integral part of these financial statements.
September 30, 2016
Exposure Impact on net assets attributable to holders
of redeemable units
Monetary ($)
Non-monetary ($)
Total ($)
Monetary ($)
Non-monetary ($)
Total ($)
United States Dollar (466,370) 2,508,290 2,041,920 (23,319) 125,415 102,096Australian Dollar (247,747) 284,422 36,675 (12,387) 14,221 1,834British Pound (186,918) 223,621 36,703 (9,346) 11,181 1,835Euro (221,681) - (221,681) (11,084) - (11,084)Hong Kong Dollar - 56,410 56,410 - 2,821 2,821Japanese Yen (70,044) - (70,044) (3,502) - (3,502)Swedish Krona (30,681) 65,110 34,429 (1,534) 3,256 1,722Swiss Franc (135,051) 180,337 45,286 (6,753) 9,017 2,264Total (1,358,492) 3,318,190 1,959,698 (67,925) 165,911 97,986% of net assets attributable to holders of redeemable units (25.4%) 62.1% 36.7% (1.3%) 3.1% 1.8%
The Fund had indirect exposure to currency risk through ETFs which may hold securities traded in foreign currencies.
Interest Rate RiskAs at March 31, 2017 and September 30, 2016, the Fund did not have significant direct exposure to interest rate risk. The Fund is also exposed to indirect interest rate risk as it holds units of exchange traded funds and other investment funds that invest in debt securities.
Credit RiskThe Fund’s exposure to credit risk arises primarily from investments in forward currency contracts. The maximum exposure to credit risk from these contracts is equivalent to the fair value of forward currency contracts that are in a net unrealized gain position as of the reporting date.
As at March 31, 2017 and September 30, 2016 the Fund had forward currency contracts with three counterparties. The following table outlines the exposure and credit rating of each counterparty in an unrealized gain position as of the date of the statements of financial position. The counterparties both have credit ratings which exceed the minimum requirement outlined in securities legislation.
March 31, 2017Net Unrealized Gain
($)Credit Rating
TD Securities Inc. 4,477 Standard & Poor’s AA-
September 30, 2016
Net Unrealized Gain($)
Credit Rating
Bank of New York Mellon 1,763 Standard & Poor’s A-1
The Fund limits its exposure to credit losses on forward currency contracts by ensuring there are netting arrangements with each counterparty to the forward currency contracts, such that any gains (amounts owing to the Fund) on individual contracts can be set off against any losses (amounts owing to the counterparty) in the event of default.
The Fund’s cash and margin accounts are maintained at financial institutions with a Standard & Poor’s credit rating of AA- and A+; and therefore credit risk is deemed minimal.
Liquidity RiskThe Fund is exposed to liquidity risk on its obligations, including its issued redeemable units, derivative liabilities, management fees payable, expenses payable, redemptions payable, payable for investments purchased and distributions payable, as applicable.
The liquidity risk associated with issued redeemable units is managed by investing in a diversified portfolio with no more than 10% of its net assets in illiquid investments at the time of purchase. The Fund may also borrow temporarily to fund redemptions or settle trades.
As at March 31, 2017 and September 30, 2016, the Fund did not have any borrowings.
The Fund writes cash secured put options in accordance with its investment objectives and strategies. The value of the securities and/or cash required to satisfy the written options if they were exercised, is presented in the table below:
Value of securities or cash required to satisfy written put options
Less than 1 month ($)
1 to 3 months ($)
Greater than 3 months and less than one year
($)Total
($)
March 31, 2017 43,923 65,960 13,000 122,883September 30, 2016 - 115,451 87,735 203,186
FUND SPECIFIC NOTES TO THE FINANCIAL STATEMENTS PORTLAND GLOBAL INCOME FUND
49
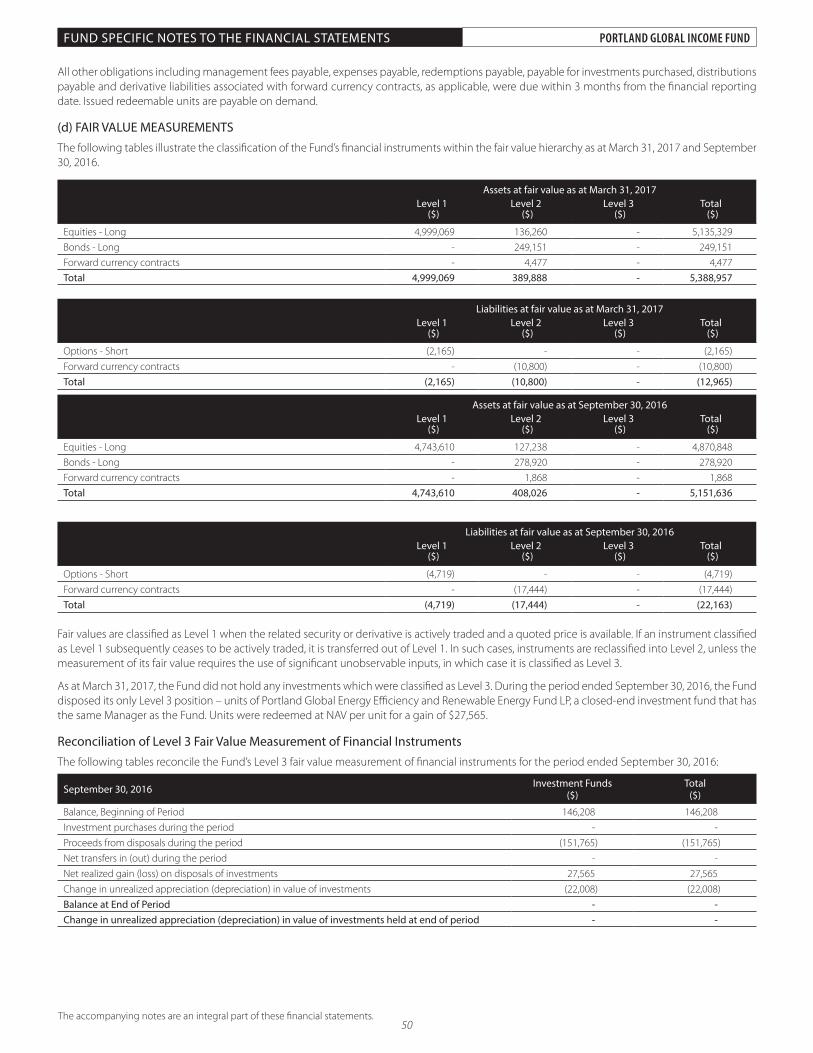
The accompanying notes are an integral part of these financial statements.
All other obligations including management fees payable, expenses payable, redemptions payable, payable for investments purchased, distributions payable and derivative liabilities associated with forward currency contracts, as applicable, were due within 3 months from the financial reporting date. Issued redeemable units are payable on demand.
(d) FAIR VALUE MEASUREMENTSThe following tables illustrate the classification of the Fund’s financial instruments within the fair value hierarchy as at March 31, 2017 and September 30, 2016.
Assets at fair value as at March 31, 2017 Level 1
($) Level 2
($) Level 3
($) Total
($)
Equities - Long 4,999,069 136,260 - 5,135,329 Bonds - Long - 249,151 - 249,151 Forward currency contracts - 4,477 - 4,477 Total 4,999,069 389,888 - 5,388,957
Liabilities at fair value as at March 31, 2017 Level 1
($) Level 2
($) Level 3
($) Total
($)
Options - Short (2,165) - - (2,165)Forward currency contracts - (10,800) - (10,800)Total (2,165) (10,800) - (12,965)
Assets at fair value as at September 30, 2016 Level 1
($) Level 2
($) Level 3
($) Total
($)
Equities - Long 4,743,610 127,238 - 4,870,848 Bonds - Long - 278,920 - 278,920 Forward currency contracts - 1,868 - 1,868 Total 4,743,610 408,026 - 5,151,636
Liabilities at fair value as at September 30, 2016 Level 1
($) Level 2
($) Level 3
($) Total
($)
Options - Short (4,719) - - (4,719)Forward currency contracts - (17,444) - (17,444)Total (4,719) (17,444) - (22,163)
Fair values are classified as Level 1 when the related security or derivative is actively traded and a quoted price is available. If an instrument classified as Level 1 subsequently ceases to be actively traded, it is transferred out of Level 1. In such cases, instruments are reclassified into Level 2, unless the measurement of its fair value requires the use of significant unobservable inputs, in which case it is classified as Level 3.
As at March 31, 2017, the Fund did not hold any investments which were classified as Level 3. During the period ended September 30, 2016, the Fund disposed its only Level 3 position – units of Portland Global Energy Efficiency and Renewable Energy Fund LP, a closed-end investment fund that has the same Manager as the Fund. Units were redeemed at NAV per unit for a gain of $27,565.
Reconciliation of Level 3 Fair Value Measurement of Financial InstrumentsThe following tables reconcile the Fund’s Level 3 fair value measurement of financial instruments for the period ended September 30, 2016:
September 30, 2016 Investment Funds ($)
Total ($)
Balance, Beginning of Period 146,208 146,208 Investment purchases during the period - - Proceeds from disposals during the period (151,765) (151,765)Net transfers in (out) during the period - - Net realized gain (loss) on disposals of investments 27,565 27,565 Change in unrealized appreciation (depreciation) in value of investments (22,008) (22,008)Balance at End of Period - - Change in unrealized appreciation (depreciation) in value of investments held at end of period - -
FUND SPECIFIC NOTES TO THE FINANCIAL STATEMENTS PORTLAND GLOBAL INCOME FUND
50

The accompanying notes are an integral part of these financial statements.
(e) STRUCTURED ENTITIESThe Fund’s investments in ETFs are subject to the terms and conditions of their respective offering documentation and are susceptible to market price risk arising from uncertainties about the future values. The investment manager makes investment decisions after extensive due diligence on the strategy and overall quality of the underlying fund’s manager.
The Fund’s investments in ETFs as at March 31, 2017 and September 30, 2016 are summarized below:
March 31, 2017Fair Value of Fund’s
Investment ($)Net Asset Value of ETF
($millions) % of ETF’s Net Assets
Energy Select Sector SPDR Fund 139,435 17,309 - iShares 1-5 Year Laddered Corporate Bond Index ETF 37,900 1,918 - iShares iBoxx $ Investment Grade Corporate Bond ETF 15,680 30,763 - iShares India 50 ETF 64,491 849 - iShares International Select Dividend ETF 251,023 3,893 - iShares S&P/TSX Canadian Preferred Share Index ETF 28,200 1,381 - PowerShares Fundamental High Yield Corporate Bond Portfolio 25,015 1,159 - SPDR S&P 500 ETF Trust 188,099 240,038 - SPDR S&P Global Dividend ETF 60,145 126 - Technology Select Sector SPDR Fund ETF 106,341 17,030 -
September 30, 2016Fair Value of Fund’s
Investment ($)Net Asset Value of ETF
($millions) % of ETF’s Net Assets
Energy Select Sector SPDR Fund 111,164 14,742 -iShares 1-5 Year Laddered Corporate Bond Index ETF 120,519 2,053 -iShares iBoxx $ Investment Grade Corporate Bond ETF 161,606 33,222 -iShares India 50 ETF 58,644 760 -iShares International Select Dividend ETF 235,994 3,182 -iShares MSCI Japan ETF 82,259 14,130 -iShares S&P/TSX Canadian Preferred Share Index ETF 6,380 1,201 -PowerShares Fundamental High Yield Corporate Bond Portfolio 61,891 1,079 -SPDR S&P 500 ETF Trust 170,265 197,121 -Technology Select Sector SPDR Fund 94,028 13,047 -WisdomTree Asia Local Debt Fund 6,000 27 -
FUND SPECIFIC NOTES TO THE FINANCIAL STATEMENTS PORTLAND GLOBAL INCOME FUND
51

The accompanying notes are an integral part of these financial statements.
Statements of Financial Position (Unaudited)As at
March 31, 2017As at
September 30, 2016
AssetsCurrent Assets
Cash and cash equivalents $ 67,080 $ 58,045 Margin accounts (note 11) 4,521 2,551 Subscriptions receivable - 500 Receivable for investments sold 758 - Dividends receivable 16,109 8,846 Investments (note 5) 6,153,997 6,965,536 Investments - pledged as collateral (note 5 and 11) 45,730 141,560 Derivative assets 9,076 21,979
6,297,271 7,199,017
LiabilitiesCurrent Liabilities
Management fees payable 9,227 10,023 Expenses payable 2,934 3,273 Redemptions payable 3,499 19,699 Distributions payable 4,461 4,860 Derivative liabilities 35,739 40,872
55,860 78,727 Net Assets Attributable to Holders of Redeemable Units $ 6,241,411 $ 7,120,290
Net Assets Attributable to Holders of Redeemable Units Per SeriesSeries A 61,644 120,767 Series A2 4,881,244 5,357,629 Series F 1,298,523 1,641,894
$ 6,241,411 $ 7,120,290
Number of Redeemable Units Outstanding (note 6)Series A 6,648 13,402 Series A2 524,745 593,551 Series F 137,464 179,954
Net Assets Attributable to Holders of Redeemable Units Per UnitSeries A 9.27 9.01 Series A2 9.30 9.03 Series F 9.45 9.12
Approved by the Board of Directors of Portland Investment Counsel Inc.
Director Director
FINANCIAL STATEMENTS PORTLAND GLOBAL DIVIDEND FUND
“Michael Lee-Chin” “Robert Almeida”
52

The accompanying notes are an integral part of these financial statements.
Statements of Comprehensive Income (Unaudited)
for the periods ended March 31, 2017 2016
IncomeNet gain (loss) on investments and derivatives
Dividends $ 84,624 $ 156,343 Interest for distribution purposes 847 - Net realized gain (loss) on investments and options 153,616 (234,002)Net realized gain (loss) on currency forward contracts 37,641 (59,791)Change in unrealized appreciation (depreciation) on investments and derivatives 188,200 106,798
464,928 (30,652)
Other incomeForeign exchange gain (loss) on cash and other net assets (8,147) (2,340)
Total income (net) 456,781 (32,992)
ExpensesUnitholder reporting costs 69,866 76,023 Management fees (note 8) 58,218 77,042 Audit fees 6,054 9,344 Transaction costs 2,295 6,362 Withholding tax expense 2,200 19,007 Legal fees 1,824 3,071 Independent review committee fees 1,715 2,011 Custodial fees 723 3,907 Interest expense 76 -
Total operating expenses 142,971 196,767 Less: expenses absorbed by Manager (62,218) (70,906)
Net operating expenses 80,753 125,861 Increase (Decrease) in Net Assets Attributable to Holders of Redeemable Units $ 376,028 $ (158,853)
Increase (Decrease) in Net Assets Attributable to Holders of Redeemable Units per SeriesSeries A 6,278 (2,846)Series A2 278,529 (118,588)Series F 91,221 (37,419)
Increase (Decrease) in Net Assets Attributable to Holders of Redeemable Units per UnitSeries A 0.51 (0.22)Series A2 0.51 (0.17)Series F 0.56 (0.14)
FINANCIAL STATEMENTS PORTLAND GLOBAL DIVIDEND FUND
53

The accompanying notes are an integral part of these financial statements.
Statements of Changes in Net Assets Attributable to Holders of Redeemable Units (Unaudited)
for the periods ended March 31, 2017 2016
Net Assets Attributable to Holders of Redeemable Units at Beginning of PeriodSeries A $ 120,767 $ 111,996 Series A2 5,357,629 6,886,194 Series F 1,641,894 2,272,210
7,120,290 9,270,400
Increase (Decrease) in Net Assets Attributable to Holders of Redeemable UnitsSeries A 6,278 (2,846)Series A2 278,529 (118,588)Series F 91,221 (37,419)
376,028 (158,853)
Distributions to Holders of Redeemable UnitsFrom net investment incomeSeries A (176) (3,148)Series A2 (18,455) (198,137)Series F (11,589) (99,928)
(30,220) (301,213)
From return of capitalSeries A (2,907) (543)Series A2 (117,280) (31,335)Series F (29,756) (10,368)
(149,943) (42,246)Net Decrease from Distributions to Holders of Redeemable Units (180,163) (343,459)
Redeemable Unit TransactionsProceeds from redeemable units issuedSeries A - 10,001 Series A2 3,340 3,989 Series F 506 77,430
3,846 91,420
Reinvestments of distributionsSeries A 1,637 1,737 Series A2 110,282 185,199 Series F 39,579 109,523
151,498 296,459
Redemptions of redeemable unitsSeries A (63,955) (4,507)Series A2 (732,801) (996,085)Series F (433,332) (307,304)
(1,230,088) (1,307,896)Net Increase (Decrease) from Redeemable Unit Transactions (1,074,744) (920,017)
Net Assets Attributable to Holders of Redeemable Units at End of PeriodSeries A 61,644 112,690 Series A2 4,881,244 5,731,237 Series F 1,298,523 2,004,144
$ 6,241,411 $ 7,848,071
FINANCIAL STATEMENTS PORTLAND GLOBAL DIVIDEND FUND
54

The accompanying notes are an integral part of these financial statements.
FINANCIAL STATEMENTS PORTLAND GLOBAL DIVIDEND FUND
Statements of Cash Flows (Unaudited)
for the periods ended March 31, 2017 2016
Cash Flows from Operating ActivitiesIncrease (Decrease) in Net Assets Attributable to Holders of Redeemable Units $ 376,028 $ (158,853) Adjustments for:
Net realized (gain) loss on investments and options (153,616) 234,002 Change in unrealized (appreciation) depreciation on investments and derivatives (188,200) (106,798)Unrealized foreign exchange (gain) loss on cash (198) (1,498)(Increase) decrease in interest receivable - 1,600 (Increase) decrease in dividends receivable (7,263) (15,223)Increase (decrease) in management fees and expenses payable (1,135) (3,269)(Increase) decrease in harmonized sales tax recoverable - 932 Purchase of investments (252,367) (1,156,652)Proceeds from sale of investments 1,508,564 2,408,978
Net Cash Generated (Used) by Operating Activities 1,281,813 1,203,219
Cash Flows from Financing ActivitiesChange in margin cash (1,970) 8,545 Distributions to holders of redeemable units, net of reinvested distributions (29,064) (48,021)Proceeds from redeemable units issued 4,346 91,350 Amount paid on redemption of redeemable units (1,246,288) (1,332,072)Net Cash Generated (Used) by Financing Activities (1,272,976) (1,280,198)
Net increase (decrease) in cash and cash equivalents 8,837 (76,979)Unrealized foreign exchange gain (loss) on cash 198 1,498 Cash and cash equivalents - beginning of period 58,045 130,824 Cash and cash equivalents - end of period 67,080 55,343
Cash and cash equivalents comprise:Cash at bank $ 67,080 $ 55,343
From operating activitiesInterest received, net of withholding tax $ 847 $ 1,600 Dividends received, net of withholding tax $ 75,161 $ 122,113
From financing activitiesInterest paid $ (76) $ -
55

The accompanying notes are an integral part of these financial statements.
FINANCIAL STATEMENTS PORTLAND GLOBAL DIVIDEND FUND
Schedule of Investment Portfolio (Unaudited) As at March 31, 2017
No. of Shares/Par
Value/ (Contracts) Security Name Average Cost Fair Value
% of Net AssetsAttributable
to Holders of Redeemable Units
EQUITIESAustralia
14,000 Amcor Limited $ 153,136 $ 214,215 120,000 AusNet Services 113,915 205,436
5,000 South32 Limited ADR 44,360 69,684 311,411 489,335 7.8%
Canada14,500 Canfor Corporation 333,035 262,885
1,000 Crescent Point Energy Corp. 24,220 14,370 357,255 277,255 4.4%
France600 LVMH Moet Hennessy Louis Vuitton SE 130,859 175,222
4,000 Total SA ADR 235,349 268,204 366,208 443,426 7.1%
Germany6,500 GEA Group AG 201,268 367,384 5.9%
Netherlands3,000 NN Group NV 115,416 129,746 2.1%
Switzerland4,000 ABB Ltd 73,802 124,474 5,200 Aryzta AG 230,902 221,958
20 Barry Callebaut AG 29,169 34,758 2,200 Dufry AG 367,028 445,722 2,000 Nestlé SA 118,443 204,061 1,500 Novartis AG ADR 131,778 148,152
400 Roche Holding AG 74,626 135,846 800 Roche Holding AG ADR 29,411 34,076
3,700 Syngenta AG 219,723 435,460 1,274,882 1,784,507 28.6%
United Kingdom18,000 Barclays PLC ADR 434,419 269,055
8,500 BHP Billiton PLC 469,259 352,111 4,000 BP PLC ADR 175,488 183,626 8,000 Compass Group PLC 170,491 200,740
500 Diageo PLC ADR 66,816 76,852 3,800 Johnson Matthey PLC 150,592 195,008 7,500 Prudential PLC 93,411 210,687
40,000 Rentokil Initial PLC 91,312 164,417 5,500 Royal Dutch Shell PLC ADR 385,307 385,676
2,037,095 2,038,172 32.7%United States
11,000 Fifth Street Senior Floating Rate Corp. 140,720 129,022 1,500 JPMorgan Chase & Co. 93,009 175,221 4,000 Mondelez International Inc. 171,168 229,160 1,500 Technology Select Sector SPDR Fund ETF 69,638 106,341
200 The Walt Disney Company 24,752 30,158 499,287 669,902 10.7%
Total equities 5,162,822 6,199,727 99.3%
DERIVATIVES - WRITTEN OPTIONS
Written Call OptionsUnited States
USD (5) JPMorgan Chase & Co., Call 95, 21/04/2017 (386) (40) -Total written call options (386) (40) -
Written Put OptionsBermuda
CAD (5) Brookfield Property Partners L.P., Put 28, 21/04/2017 (370) (40) -
CanadaCAD (10) Crescent Point Energy Corp., Put 13, 19/01/2018 (1,340) (1,160) -
SwitzerlandUSD (10) ABB Ltd ADR, Put 22, 16/06/2017 (452) (465) -
56

The accompanying notes are an integral part of these financial statements.
FINANCIAL STATEMENTS PORTLAND GLOBAL DIVIDEND FUND
Schedule of Investment Portfolio (continued) As at March 31, 2017
No. of Shares/Par
Value/ (Contract Size) Security Name Average Cost Fair Value
% of Net AssetsAttributable
to Holders of Redeemable Units
United KingdomUSD (5) Diageo PLC ADR, Put 105, 21/04/2017 (615) (27)
USD (10) BP PLC ADR, Put 32, 19/05/2017 (306) (319) (921) (346) -
Total written put options (3,083) (2,011) -Total written options (3,469) (2,051) -
FORWARD CURRENCY CONTRACTS (Schedule 1)Total unrealized gain on forward currency contracts - 9,076 0.2%Total unrealized loss on forward currency contracts - (33,688) (0.6%)
- (24,612) (0.4%)Net investments 5,159,353 6,173,064 98.9%Transaction costs (11,022) - -
$ 5,148,331 6,173,064 98.9%Other assets less liabilities 68,347 1.1%NET ASSETS ATTRIBUTABLE TO HOLDERS OF REDEEMABLE UNITS $ 6,241,411 100.0%
57

The accompanying notes are an integral part of these financial statements.
FINANCIAL STATEMENTS PORTLAND GLOBAL DIVIDEND FUND
Schedule of Investment Portfolio (continued) As at March 31, 2017
Schedule 1
Purchased Currency Sold Currency
Contract Price
Settlement Date Currency
Amount ($)
Value as at March 31, 2017
($) CurrencyAmount
($)
Value as at March 31, 2017
($)
Unrealized gain (loss)
($)0.69461 Jun-15-17 Canadian Dollar 431,895 431,895 Euro 300,000 426,656 5,2390.74377 Jun-15-17 Canadian Dollar 322,680 322,680 United States Dollar 240,000 318,843 3,837
Unrealized gain 9,076
0.61357 May-18-17 Canadian Dollar 692,667 692,667 British Pound 425,000 708,418 (15,751)1.03327 Apr-19-17 Canadian Dollar 270,984 270,984 Australian Dollar 280,000 284,345 (13,361)0.76020 Apr-19-17 Canadian Dollar 460,405 460,405 Swiss Franc 350,000 464,981 (4,576)
Unrealized gain (33,688)
58

The accompanying notes are an integral part of these financial statements.
(a) OFFSETTING OF FINANCIAL ASSETS AND FINANCIAL LIABILITIESThe Fund uses three counterparties for the execution of forward currency contracts. Two counterparties are Canadian chartered banks and one is a national U.S. bank. The Fund has master netting or similar arrangements in place with all counterparties. This means that in the event of default, the Fund may set off the assets held with the counterparty against the liabilities it owes to the same counterparty. The contracts in place under these arrangements have been offset and presented as a net figure in the statements of financial position of the Fund, where applicable. There is no collateral associated with these arrangements.
The following table presents the gross amount of recognized financial assets and liabilities of the Fund that are offset under master netting or similar arrangements as at March 31, 2017 and September 30, 2016.
TD Securities Inc. ($)National Bank of
Canada ($)Bank of New York
Mellon ($)
March 31, 2017Gross derivative assets 9,076 Gross derivative liabilities (17,937) (15,751) Net exposure (17,937) (15,751) 9,076 September 30, 2016Gross derivative assets - - 7,055Gross derivative liabilities (9,406) (25,526) -Net exposure (9,406) (25,526) 7,055
(b) FINANCIAL INSTRUMENTS BY CATEGORYThe following tables present the carrying amounts of the Fund’s financial instruments by category as at March 31, 2017:
Assets Held for Trading
($)
Financial assets at FVTPL Designated at Inception
($)
Financial assets at amortized cost($)
Total ($)
Cash and cash equivalents - - 67,080 67,080Margin accounts - - 4,521 4,521Subscriptions receivable - - 758 758Dividends receivable - - 16,109 16,109Investments - 6,153,997 - 6,153,997Investments - pledged as collateral - 45,730 - 45,730Derivative assets 9,076 - - 9,076Total 9,076 6,199,727 88,468 6,297,271
Liabilities Held for Trading
($)
Financial liabilities at FVTPL Designated at Inception
($)
Financial liabilities at amortized cost($)
Total ($)
Management fees payable - - 9,227 9,227Expenses payable - - 2,934 2,934Redemptions payable - - 3,499 3,499Distributions payable - - 4,461 4,461Derivative liabilities 35,739 - - 35,739Total 35,739 - 20,121 55,860
The following tables present the carrying amounts of the Fund’s financial instruments by category as at September 30, 2016:
Assets Held for Trading
($)
Financial assets at FVTPL Designated at Inception
($)
Financial assets at amortized cost($)
Total ($)
Cash and cash equivalents - - 58,045 58,045 Margin accounts - - 2,551 2,551 Subscriptions receivable - - 500 500 Dividends receivable - - 8,846 8,846 Investments - 6,965,536 - 6,965,536Investments - pledged as collateral - 141,560 - 141,560Derivative assets 21,979 - - 21,979Total 21,979 7,107,096 69,942 7,199,017
FUND SPECIFIC NOTES TO THE FINANCIAL STATEMENTS PORTLAND GLOBAL DIVIDEND FUND
59

The accompanying notes are an integral part of these financial statements.
Liabilities Held for Trading
($)
Financial liabilities at FVTPL Designated at Inception
($)
Financial liabilities at amortized cost($)
Total ($)
Management fees payable - - 10,023 10,023 Expenses payable - - 3,273 3,273 Redemptions payable - - 19,699 19,699 Distributions payable - - 4,860 4,860 Derivative liabilities 40,872 - - 40,872 Total 40,872 - 37,855 78,727
The following table presents the net gains (losses) on financial instruments at FVTPL by category for the six month periods ended March 31, 2017 and March 31, 2016.
Net gains (losses) ($)
Category 2017 2016
Financial assets at FVTPL Held for Trading 40,906 28,294 Designated at Inception 409,713 (58,946)
Total 450,619 (30,652)Financial liabilities at FVTPL: Held for Trading 14,305 - Total 464,924 (30,652)
(c) RISK MANAGEMENT
Price RiskPlease see note 5 for a definition of Price Risk. The Manager moderates this risk through diversification of securities and other financial instruments within the limits of the Fund’s investment objectives and strategy.
The Fund is limited to investing in securities that comprise no more than 10% of the net asset value at the time of purchase.
If the price of investments held by the Fund on March 31, 2017 had been higher or lower by 5%, the net assets attributable to holders of redeemable units of the Fund would have been higher or lower by $309,884 (September 30, 2016: $354,287). Actual results may differ from the above sensitivity analysis and the difference could be material.
Concentration RiskThe following tables present the Fund’s exposure as a percentage of its net assets attributable to holders of redeemable units by geographic region and by industry sector as at March 31, 2017 and September 30, 2016.
By Geographic Region March 31, 2017 September 30, 2016
United Kingdom 32.7% 34.1%
Switzerland 28.6% 26.1%
United States 10.7% 12.2%
Australia 7.8% 8.7%
France 7.1% 6.0%
Germany 5.9% 5.6%
Canada 4.4% 3.5%
Netherlands 2.1% 1.7%
Other Net Assets (Liabilities) 1.1% 0.5%
Forward Currency Contracts (0.4%) (0.4%)
Japan - 1.1%
Cayman Islands - 0.9%
Total 100.0% 100.0%
FUND SPECIFIC NOTES TO THE FINANCIAL STATEMENTS PORTLAND GLOBAL DIVIDEND FUND
60
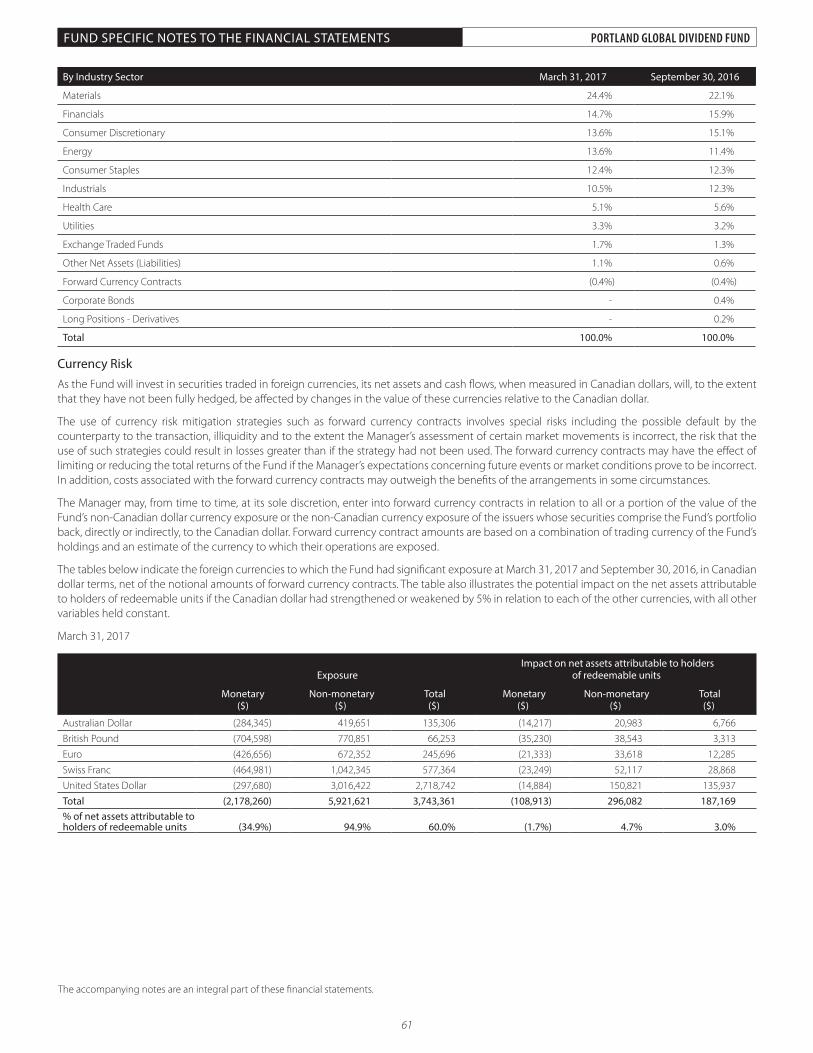
The accompanying notes are an integral part of these financial statements.
By Industry Sector March 31, 2017 September 30, 2016
Materials 24.4% 22.1%
Financials 14.7% 15.9%
Consumer Discretionary 13.6% 15.1%
Energy 13.6% 11.4%
Consumer Staples 12.4% 12.3%
Industrials 10.5% 12.3%
Health Care 5.1% 5.6%
Utilities 3.3% 3.2%
Exchange Traded Funds 1.7% 1.3%
Other Net Assets (Liabilities) 1.1% 0.6%
Forward Currency Contracts (0.4%) (0.4%)
Corporate Bonds - 0.4%
Long Positions - Derivatives - 0.2%
Total 100.0% 100.0%
Currency RiskAs the Fund will invest in securities traded in foreign currencies, its net assets and cash flows, when measured in Canadian dollars, will, to the extent that they have not been fully hedged, be affected by changes in the value of these currencies relative to the Canadian dollar.
The use of currency risk mitigation strategies such as forward currency contracts involves special risks including the possible default by the counterparty to the transaction, illiquidity and to the extent the Manager’s assessment of certain market movements is incorrect, the risk that the use of such strategies could result in losses greater than if the strategy had not been used. The forward currency contracts may have the effect of limiting or reducing the total returns of the Fund if the Manager’s expectations concerning future events or market conditions prove to be incorrect. In addition, costs associated with the forward currency contracts may outweigh the benefits of the arrangements in some circumstances.
The Manager may, from time to time, at its sole discretion, enter into forward currency contracts in relation to all or a portion of the value of the Fund’s non-Canadian dollar currency exposure or the non-Canadian currency exposure of the issuers whose securities comprise the Fund’s portfolio back, directly or indirectly, to the Canadian dollar. Forward currency contract amounts are based on a combination of trading currency of the Fund’s holdings and an estimate of the currency to which their operations are exposed.
The tables below indicate the foreign currencies to which the Fund had significant exposure at March 31, 2017 and September 30, 2016, in Canadian dollar terms, net of the notional amounts of forward currency contracts. The table also illustrates the potential impact on the net assets attributable to holders of redeemable units if the Canadian dollar had strengthened or weakened by 5% in relation to each of the other currencies, with all other variables held constant.
March 31, 2017
Exposure Impact on net assets attributable to holders
of redeemable units
Monetary ($)
Non-monetary ($)
Total ($)
Monetary ($)
Non-monetary ($)
Total ($)
Australian Dollar (284,345) 419,651 135,306 (14,217) 20,983 6,766British Pound (704,598) 770,851 66,253 (35,230) 38,543 3,313Euro (426,656) 672,352 245,696 (21,333) 33,618 12,285Swiss Franc (464,981) 1,042,345 577,364 (23,249) 52,117 28,868United States Dollar (297,680) 3,016,422 2,718,742 (14,884) 150,821 135,937Total (2,178,260) 5,921,621 3,743,361 (108,913) 296,082 187,169% of net assets attributable to holders of redeemable units (34.9%) 94.9% 60.0% (1.7%) 4.7% 3.0%
FUND SPECIFIC NOTES TO THE FINANCIAL STATEMENTS PORTLAND GLOBAL DIVIDEND FUND
61

The accompanying notes are an integral part of these financial statements.
September 30, 2016
Exposure Impact on net assets attributable to holders
of redeemable units
Monetary ($)
Non-monetary ($)
Total ($)
Monetary ($)
Non-monetary ($)
Total ($)
United States Dollar (670,141) 3,549,338 2,879,197 (33,507) 177,467 143,960Australian Dollar (417,686) 443,512 25,826 (20,884) 22,176 1,292British Pound (805,197) 1,107,667 302,470 (40,260) 55,383 15,123Euro (516,866) 700,410 183,544 (25,843) 35,021 9,178Hong Kong Dollar - 66,710 66,710 - 3,336 3,336Japanese Yen (80,421) - (80,421) (4,021) - (4,021)Swiss Franc (607,730) 1,022,079 414,349 (30,387) 51,104 20,717Total (3,098,041) 6,889,716 3,791,675 (154,902) 344,487 189,585% of net assets attributable to holders of redeemable units (43.5%) 96.8% 53.3% (2.2%) 4.8% 2.6%
Interest Rate RiskAs at March 31, 2017 and September 30, 2016, the Fund did not have significant direct exposure to interest rate risk.
Credit RiskThe Fund’s exposure to credit risk arises primarily from investments in forward currency contracts. The maximum exposure to credit risk from these contracts is equivalent to the fair value of forward currency contracts that are in a net unrealized gain position as of the reporting date.
As at March 31, 2017 and September 30, 2016 the Fund had forward currency contracts with three counterparties. The following table outlines the exposure and credit rating of each counterparty in an unrealized gain position as of the date of the statements of financial position. The counterparties both have credit ratings which exceed the minimum requirement outlined in securities legislation.
March 31, 2017Net Unrealized Gain
($)Credit Rating
TD Securities Inc. 9,076 Standard & Poor’s AA-
September 30, 2016
Net Unrealized Gain($)
Credit Rating
Bank of New York Mellon 7,055 Standard & Poor’s A-1
The Fund limits its exposure to credit losses on forward currency contracts by ensuring there are netting arrangements with each counterparty to the forward currency contracts, such that any gains (amounts owing to the Fund) on individual contracts can be set off against any losses (amounts owing to the counterparty) in the event of default.
The Fund’s cash and margin accounts are maintained at financial institutions with a Standard & Poor’s credit rating of AA- and A+; and therefore credit risk is deemed minimal.
Liquidity RiskThe Fund is exposed to liquidity risk on its obligations, including its issued redeemable units, derivative liabilities, management fees payable, expenses payable, redemptions payable, payable for investments purchased and distributions payable, as applicable.
The liquidity risk associated with issued redeemable units is managed by investing in a diversified portfolio with no more than 10% of its net assets in illiquid investments at the time of purchase. The Fund may also borrow temporarily to fund redemptions or settle trades.
As at March 31, 2017 and September 30, 2016, the Fund did not have any borrowings.
The Fund writes cash secured put options in accordance with its investment objectives and strategies. The value of the securities and/or cash required to satisfy the written options if they were exercised, is presented in the table below.
Value of securities or cash required to satisfy written put options
Less than 1 month ($)
1 to 3 months ($)
Greater than 3 months and less than one year
($)Total
($)
March 31, 2017 83,817 71,812 13,000 168,629September 30, 2016 - 115,451 100,735 216,186
All other obligations including management fees payable, expenses payable, redemptions payable, payable for investments purchased, distributions payable and derivative liabilities associated with forward currency contracts, as applicable, were due within 3 months from the financial reporting date. Issued redeemable units are payable on demand.
FUND SPECIFIC NOTES TO THE FINANCIAL STATEMENTS PORTLAND GLOBAL DIVIDEND FUND
62

The accompanying notes are an integral part of these financial statements.
(d) FAIR VALUE MEASUREMENTSThe following tables illustrate the classification of the Fund’s financial instruments within the fair value hierarchy as at March 31, 2017 and September 30, 2016.
Assets at fair value as at March 31, 2017 Level 1
($) Level 2
($) Level 3
($) Total
($)
Equities - Long 6,199,727 - - 6,199,727 Forward currency contracts - 9,076 - 9,076 Total 6,199,727 9,076 - 6,208,803
Liabilities at fair value as at March 31, 2017 Level 1
($) Level 2
($) Level 3
($) Total
($)
Options - Short (2,051) - - (2,051)Forward currency contracts - (33,688) - (33,688)Total (2,051) (33,688) - (35,739)
Assets at fair value as at September 30, 2016 Level 1
($) Level 2
($) Level 3
($) Total
($)
Equities - Long 7,076,757 - - 7,076,757 Bonds - Long - 30,339 - 30,339 Options - Long 14,924 - - 14,924 Forward currency contracts - 7,055 - 7,055 Total 7,091,681 37,394 - 7,129,075
Liabilities at fair value as at September 30, 2016 Level 1
($) Level 2
($) Level 3
($) Total
($)
Options - Short (5,940) - - (5,940)Forward currency contracts - (34,932) - (34,932)Total (5,940) (34,932) - (40,872)
Fair values are classified as Level 1 when the related security or derivative is actively traded and a quoted price is available. If an instrument classified as Level 1 subsequently ceases to be actively traded, it is transferred out of Level 1. In such cases, instruments are reclassified into Level 2, unless the measurement of its fair value requires the use of significant unobservable inputs, in which case it is classified as Level 3.
As at March 31, 2017, the Fund did not hold any investments which were classified as Level 3. During the period ended September 30, 2016, the Fund disposed its only Level 3 position – units of Portland Global Energy Efficiency and Renewable Energy Fund LP, a closed-end investment fund that has the same Manager as the Fund. Units were redeemed at NAV per unit for a gain of $27,529.
Reconciliation of Level 3 Fair Value Measurement of Financial InstrumentsThe following tables reconcile the Fund’s Level 3 fair value measurement of financial instruments for the period ended September 30, 2016:
Investment Funds ($)
Total ($)
Balance at Beginning of Period 145,905 145,905 Investment purchases during the period - - Proceeds from disposals during the period (151,449) (151,449)Net transfers in (out) during the period - - Net realized gain (loss) on disposal of investments 27,529 27,529 Change in unrealized appreciation (depreciation) in value of investments (21,985) (21,985)Balance at End of Period - - Change in unrealized appreciation (depreciation) in value of investments held at end of period - -
FUND SPECIFIC NOTES TO THE FINANCIAL STATEMENTS PORTLAND GLOBAL DIVIDEND FUND
63

The accompanying notes are an integral part of these financial statements.
(e) STRUCTURED ENTITIESThe Fund’s investments in ETFs are subject to the terms and conditions of their respective offering documentation and are susceptible to market price risk arising from uncertainties about the future values. The investment manager makes investment decisions after extensive due diligence on the strategy and overall quality of the underlying fund’s manager.
The Fund’s investments in ETFs as at March 31, 2017 and September 30, 2016 are summarized below.
March 31, 2017Fair Value of Fund’s
Investment ($)Net Asset Value of ETF
($millions) % of ETF’s Net Assets
Technology Select Sector SPDR Fund ETF 106,341 17,030 -
September 30, 2016Fair Value of Fund’s
Investment ($)Net Asset Value of ETF
($millions) % of ETF’s Net Assets
Technology Select Sector SPDR Fund ETF 94,027 13,047 -
FUND SPECIFIC NOTES TO THE FINANCIAL STATEMENTS PORTLAND GLOBAL DIVIDEND FUND
64

The accompanying notes are an integral part of these financial statements.
FINANCIAL STATEMENTS PORTLAND VALUE FUND
Statements of Financial Position (Unaudited)As at
March 31, 2017As at
September 30, 2016
AssetsCurrent Assets
Cash and cash equivalents $ 49,922 $ 116,270 Dividends receivable 402 311 Investments (note 5) 537,270 534,525
587,594 651,106
LiabilitiesCurrent Liabilities
Management fees payable 914 1,015 Expenses payable 1,017 299 Payable for investments purchased - 8,009
1,931 9,323 Net Assets Attributable to Holders of Redeemable Units $ 585,663 $ 641,783
Net Assets Attributable to Holders of Redeemable Units Per SeriesSeries A 373,784 470,433 Series F 211,879 171,350
$ 585,663 $ 641,783
Number of Redeemable Units Outstanding (note 6)Series A 45,832 53,522 Series F 25,767 19,316
Net Assets Attributable to Holders of Redeemable Units Per UnitSeries A 8.16 8.79 Series F 8.22 8.87
Approved by the Board of Directors of Portland Investment Counsel Inc.
Director Director
“Michael Lee-Chin” “Robert Almeida”
65

The accompanying notes are an integral part of these financial statements.
FINANCIAL STATEMENTS PORTLAND VALUE FUND
Statements of Comprehensive Income (Unaudited)
for the periods ended March 31, 2017 2016
IncomeNet gain (loss) on investments
Dividends $ 1,275 $ 2,475 Interest for distribution purposes 499 - Net realized gain (loss) on investments 3,859 20 Change in unrealized appreciation (depreciation) on investments (39,047) 3,117
(33,414) 5,612
Other incomeForeign exchange gain (loss) on cash and other net assets 108 (644)
Total income (net) (33,306) 4,968
ExpensesUnitholder reporting costs 48,066 34,127 Audit fees 6,273 9,624 Management fees (note 8) 5,744 1,972 Legal fees 1,890 3,164 Independent review committee fees 1,777 2,072 Custodial fees 1,135 710 Minimum Tax 733 - Transaction costs 105 137 Withholding tax expense - 25
Total operating expenses 65,723 51,831 Less: expenses absorbed by Manager (57,447) (49,034)
Net operating expenses 8,276 2,797 Increase (Decrease) in Net Assets Attributable to Holders of Redeemable Units $ (41,582) $ 2,171
Increase (Decrease) in Net Assets Attributable to Holders of Redeemable Units per SeriesSeries A (29,650) (533)Series F (11,932) 2,704
Increase (Decrease) in Net Assets Attributable to Holders of Redeemable Units per UnitSeries A (0.59) (0.04)Series F (0.58) 0.18
66

The accompanying notes are an integral part of these financial statements.
FINANCIAL STATEMENTS PORTLAND VALUE FUND
Statements of Changes in Net Assets Attributable to Holders of Redeemable Units (Unaudited)
for the periods ended March 31, 2017 2016
Net Assets Attributable to Holders of Redeemable Units at Beginning of PeriodSeries A $ 470,433 $ 46,143 Series F 171,350 111,150
641,783 157,293
Increase (Decrease) in Net Assets Attributable to Holders of Redeemable UnitsSeries A (29,650) (533)Series F (11,932) 2,704
(41,582) 2,171
Distributions to Holders of Redeemable UnitsFrom net investment incomeSeries A - (131)Series F (49) (848)
(49) (979)
From net realized gains on investmentsSeries A (2,602) - Series F (2,035) -
(4,637) - Net Decrease from Distributions to Holders of Redeemable Units (4,686) (979)
Redeemable Unit TransactionsProceeds from redeemable units issuedSeries A 11,559 112,149 Series F 54,919 45,000
66,478 157,149
Reinvestments of distributionsSeries A 2,602 131 Series F 2,084 848
4,686 979
Redemptions of redeemable unitsSeries A (78,558) - Series F (2,458) -
(81,016) - Net Increase (Decrease) from Redeemable Unit Transactions (9,852) 158,128
Net Assets Attributable to Holders of Redeemable Units at End of PeriodSeries A 373,784 157,759 Series F 211,879 158,854
$ 585,663 $ 316,613
67

The accompanying notes are an integral part of these financial statements.
FINANCIAL STATEMENTS PORTLAND VALUE FUND
Statements of Cash Flows (Unaudited)
for the periods ended March 31, 2017 2016
Cash Flows from Operating ActivitiesIncrease (Decrease) in Net Assets Attributable to Holders of Redeemable Units $ (41,582) $ 2,171 Adjustments for:
Net realized (gain) loss on investments (3,859) (20)Change in unrealized (appreciation) depreciation on investments 39,047 (3,117)Unrealized foreign exchange (gain) loss on cash 4 - (Increase) decrease in dividends receivable (91) 44 Increase (decrease) in management fees and expenses payable 617 379 Purchase of investments (73,778) (161,144)Proceeds from sale of investments 27,836 222
Net Cash Generated (Used) by Operating Activities (51,806) (161,465)
Cash Flows from Financing ActivitiesProceeds from redeemable units issued 65,704 179,649 Amount paid on redemption of redeemable units (80,242) - Net Cash Generated (Used) by Financing Activities (14,538) 179,649
Net increase (decrease) in cash and cash equivalents (66,344) 18,184 Unrealized foreign exchange gain (loss) on cash (4) - Cash and cash equivalents - beginning of period 116,270 16,753 Cash and cash equivalents - end of period 49,922 34,937
Cash and cash equivalents comprise:Cash at bank $ 49,922 $ 34,937
From operating activitiesInterest received, net of withholding tax $ 499 $ - Dividends received, net of withholding tax $ 1,184 $ 2,494
68

The accompanying notes are an integral part of these financial statements.
FINANCIAL STATEMENTS PORTLAND VALUE FUND
Schedule of Investment Portfolio (Unaudited) As at March 31, 2017
No. of Shares Security Name Average Cost Fair Value
% of Net AssetsAttributable
to Holders of Redeemable Units
EQUITIESBermuda
1,249 Brookfield Business Partners L.P. $ 33,738 $ 40,960 7.0%
British Virgin Islands3,650 Nomad Foods Limited 50,094 55,578 9.5%
Canada11,410 Baytex Energy Corp. 71,516 51,801
915 Brookfield Asset Management Inc. Class A 40,133 44,365 4,073 Crescent Point Energy Corp. 78,437 58,529
600 Restaurant Brands International Inc. 31,712 44,476 5,880 Whitecap Resources, Inc. 59,673 60,857
281,471 260,028 44.4%Guernsey
2,670 Pershing Square Holdings, Ltd. 57,927 53,971 9.2%
United Kingdom2,100 Liberty Global PLC LiLAC Class A 92,005 62,109 10.6%
United States190 Berkshire Hathaway Inc. Class B 34,727 42,115 965 Hertz Global Holdings, Inc. 52,706 22,509
87,433 64,624 11.0%Total investment portfolio 602,668 537,270 91.7%Transaction costs (812) - -
$ 601,856 537,270 91.7%Other assets less liabilities 48,393 8.3%NET ASSETS ATTRIBUTABLE TO HOLDERS OF REDEEMABLE UNITS $ 585,663 100.0%
69

FUND SPECIFIC NOTES TO THE FINANCIAL STATEMENTS PORTLAND VALUE FUND
The accompanying notes are an integral part of these financial statements.
(a) FINANCIAL INSTRUMENTS BY CATEGORYThe following tables present the carrying amounts of the Fund’s financial instruments by category as at March 31, 2017:
Assets Held for Trading
($)
Financial assets at FVTPL Designated at Inception
($)
Financial assets at amortized cost($)
Total ($)
Cash and cash equivalents - - 49,922 49,922 Dividends receivable - - 402 402 Investments - 537,270 - 537,270 Total - 537,270 50,324 587,594
Liabilities Held for Trading
($)
Financial liabilities at FVTPL Designated at Inception
($)
Financial liabilities at amortized cost($)
Total ($)
Management fees payable - - 914 914 Expenses payable - - 1,017 1,017 Total - - 1,931 1,931
The following tables present the carrying amounts of the Fund’s financial instruments by category as at September 30, 2016:
Assets Held for Trading
($)
Financial assets at FVTPL Designated at Inception
($)
Financial assets at amortized cost($)
Total ($)
Cash and cash equivalents - - 116,270 116,270 Dividends receivable - - 311 311 Investments - 534,525 - 534,525 Total - 534,525 116,581 651,106
Liabilities Held for Trading
($)
Financial liabilities at FVTPL Designated at Inception
($)
Financial liabilities at amortized cost($)
Total ($)
Management fees payable - - 1,015 1,015 Expenses payable - - 299 299 Payable for investments purchased - - 8,009 8,009 Total - - 9,323 9,323
The following table presents the net gains (losses) on financial instruments at FVTPL by category for the six month period ended March 31, 2017 and 2016.
Net gains (losses) ($)
Category 2017 2016
Financial assets at FVTPL Held for Trading - 70 Designated at Inception (33,414) 5,612
Total (33,414) 5,682
(b) RISK MANAGEMENT
Price RiskPlease see note 5 for a definition of Price Risk. The Manager moderates this risk through diversification of securities and other financial instruments within the limits of the Fund’s investment objectives and strategy.
The Fund is limited to investing in securities that comprise no more than 10% of the net asset value at the time of purchase.
If the price of investments held by the Fund on March 31, 2017 had been higher or lower by 5%, the net assets attributable to holders of redeemable units of the Fund would have been higher or lower by $26,864 (September 30, 2016: $26,726). Actual results may differ from the above sensitivity analysis and the difference could be material.
70
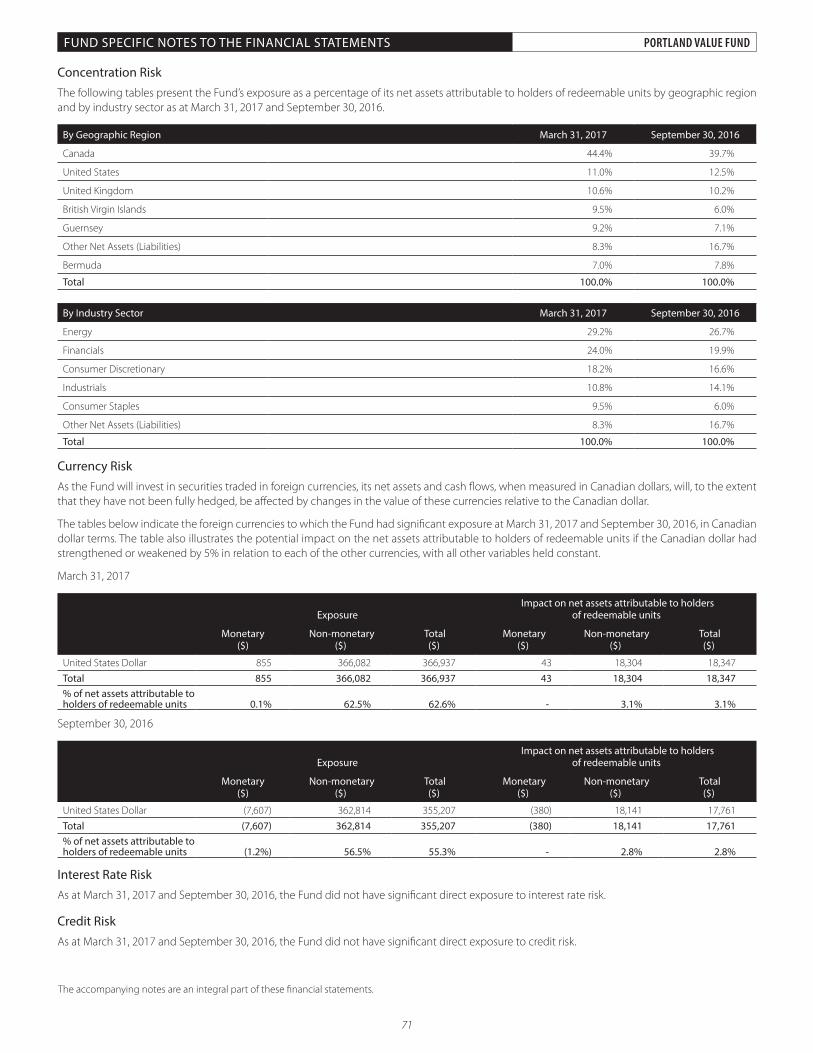
FUND SPECIFIC NOTES TO THE FINANCIAL STATEMENTS PORTLAND VALUE FUND
The accompanying notes are an integral part of these financial statements.
Concentration RiskThe following tables present the Fund’s exposure as a percentage of its net assets attributable to holders of redeemable units by geographic region and by industry sector as at March 31, 2017 and September 30, 2016.
By Geographic Region March 31, 2017 September 30, 2016
Canada 44.4% 39.7%
United States 11.0% 12.5%
United Kingdom 10.6% 10.2%
British Virgin Islands 9.5% 6.0%
Guernsey 9.2% 7.1%
Other Net Assets (Liabilities) 8.3% 16.7%
Bermuda 7.0% 7.8%
Total 100.0% 100.0%
By Industry Sector March 31, 2017 September 30, 2016
Energy 29.2% 26.7%
Financials 24.0% 19.9%
Consumer Discretionary 18.2% 16.6%
Industrials 10.8% 14.1%
Consumer Staples 9.5% 6.0%
Other Net Assets (Liabilities) 8.3% 16.7%
Total 100.0% 100.0%
Currency RiskAs the Fund will invest in securities traded in foreign currencies, its net assets and cash flows, when measured in Canadian dollars, will, to the extent that they have not been fully hedged, be affected by changes in the value of these currencies relative to the Canadian dollar.
The tables below indicate the foreign currencies to which the Fund had significant exposure at March 31, 2017 and September 30, 2016, in Canadian dollar terms. The table also illustrates the potential impact on the net assets attributable to holders of redeemable units if the Canadian dollar had strengthened or weakened by 5% in relation to each of the other currencies, with all other variables held constant.
March 31, 2017
Exposure Impact on net assets attributable to holders
of redeemable units
Monetary ($)
Non-monetary ($)
Total ($)
Monetary ($)
Non-monetary ($)
Total ($)
United States Dollar 855 366,082 366,937 43 18,304 18,347Total 855 366,082 366,937 43 18,304 18,347% of net assets attributable to holders of redeemable units 0.1% 62.5% 62.6% - 3.1% 3.1%
September 30, 2016
Exposure Impact on net assets attributable to holders
of redeemable units
Monetary ($)
Non-monetary ($)
Total ($)
Monetary ($)
Non-monetary ($)
Total ($)
United States Dollar (7,607) 362,814 355,207 (380) 18,141 17,761Total (7,607) 362,814 355,207 (380) 18,141 17,761% of net assets attributable to holders of redeemable units (1.2%) 56.5% 55.3% - 2.8% 2.8%
Interest Rate RiskAs at March 31, 2017 and September 30, 2016, the Fund did not have significant direct exposure to interest rate risk.
Credit RiskAs at March 31, 2017 and September 30, 2016, the Fund did not have significant direct exposure to credit risk.
71

FUND SPECIFIC NOTES TO THE FINANCIAL STATEMENTS PORTLAND VALUE FUND
The accompanying notes are an integral part of these financial statements.
Liquidity RiskThe Fund is exposed to liquidity risk on its obligations, including its issued redeemable units, management fees payable, expenses payable, payable for investments purchased and distributions payable, as applicable.
The liquidity risk associated with issued redeemable units is managed by investing in a diversified portfolio with no more than 10% of its net assets in illiquid investments at the time of purchase. The Fund may also borrow temporarily to fund redemptions or settle trades.
As at March 31, 2017 and September 30, 2016, the Fund did not have any borrowings.
All other obligations including management fees payable, expenses payable, redemptions payable, payable for investments purchased and distributions payable, as applicable, were due within 3 months from the financial reporting date. Issued redeemable units are payable on demand.
(c) FAIR VALUE MEASUREMENTSThe following tables illustrate the classification of the Fund’s financial instruments within the fair value hierarchy as at March 31, 2017 and September 30, 2016.
Assets at fair value as at March 31, 2017 Level 1
($) Level 2
($) Level 3
($) Total
($)
Equities - Long 537,270 - - 537,270 Total 537,270 - - 537,270
Assets at fair value as at September 30, 2016 Level 1
($) Level 2
($) Level 3
($) Total
($)
Equities - Long 534,525 - - 534,525 Total 534,525 - - 534,525
Fair values are classified as Level 1 when the related security is actively traded and a quoted price is available. If an instrument classified as Level 1 subsequently ceases to be actively traded, it is transferred out of Level 1. In such cases, instruments are reclassified into Level 2, unless the measurement of its fair value requires the use of significant unobservable inputs, in which case it is classified as Level 3. All liabilities of the Fund are carried at amortized cost and therefore are not presented in the tables above.
(d) Structured EntitiesAs at March 31, 2017 and September 30, 2016 the Fund did not have any investments in ETFs.
72

Notes to Financial Statements
1. GENERAL INFORMATIONa) Portland Advantage Fund, Portland Canadian Balanced Fund, Portland Canadian Focused Fund, Portland Global Banks Fund, Portland Global Income Fund, Portland Global Dividend Fund and Portland Value Fund (collectively referred to as the Funds) are open-ended mutual funds created under the laws of Ontario in Canada and governed by a Master Declaration of Trust as amended and restated from time to time. The Funds offer units to the public under a simplified prospectus dated April 20, 2017, as may be amended from time to time (Prospectus). The Funds were formed and related series commenced operations on the following dates:
Name of Fund Formation Date of Fund
Commencement of Operations
Series A, Series F Series A2 (note 1b) Series G (note 1c)
Portland Advantage Fund October 1, 2012 October 31, 2012 n/a March 14, 2013
Portland Canadian Balanced Fund October 1, 2012 October 31, 2012 n/a March 14, 2013
Portland Canadian Focused Fund October 1, 2012 October 31, 2012 n/a January 24, 2013
Portland Global Banks Fund January 25,2007 December 17, 2013 December 17, 2013 n/a
Portland Global Income Fund January 25,2005 December 17, 2013 December 17, 2013 n/a
Portland Global Dividend Fund April 27, 2007 May 29, 2014 May 29, 2014 n/a
Portland Value Fund May 6, 2015 May 19, 2015 n/a n/a
Portland Investment Counsel Inc. (Manager) is the Investment Fund Manager, Portfolio Manager and Trustee of each Fund. The head office of the Fund is 1375 Kerns Road, Suite 100, Burlington, Ontario L7P 4V7. Effective October 19, 2015, the Funds changed custodians from Citibank Canada to CIBC Mellon Trust Company. These financial statements are presented in Canadian dollars and were authorized for issue by the board of directors of the Manager on May 17, 2017. The Funds are authorized to issue an unlimited number of units in an unlimited number of series.
The statements of financial position of the Funds are as at March 31, 2017 and September 30, 2016. The statements of comprehensive income, changes in net assets attributable to holders of redeemable units, and cash flows of the Funds are for the 6 month period ended March 31, 2017 and March 31, 2016.
The following table presents the investment objective of each Fund.
Name of Fund Investment Objective
Portland Advantage Fund Provide positive long-term total returns, consisting of both income and capital gains, by investing primarily in a portfolio of Canadian equities.
Portland Canadian Balanced Fund Provide positive long-term total returns, consisting of both income and capital gains by investing primarily in a portfolio of fixed income securities and Canadian equity securities.
Portland Canadian Focused Fund Provide positive long-term total returns by investing primarily in a portfolio of Canadian equities.Portland Global Banks Fund Provide positive long-term total returns by investing primarily in a portfolio of global bank equities.
Portland Global Income FundProvide income and long-term total returns by investing primarily in a high-quality portfolio of fixed/float-ing rate income securities, preferred shares and dividend paying equities of issuers located anywhere in the world
Portland Global Dividend Fund Provide income and long- term total returns by investing primarily in a portfolio of global dividend paying equities.
Portland Value Fund Provide positive long-term total returns by investing primarily in a portfolio of global equities.
b) Fund Restructuring
Portland Global Banks Fund and Portland Global Income Fund were subject to a restructuring in December 2013 and Portland Global Dividend Fund was subject to a restructuring in May 2014, at which time they became open ended funds with multiple series. Prior to the restructuring Series A2 Units of these Funds were referred to as Trust Units. Due to the restructuring, the date of commencement for the Trust Units was reset.
c) Effective April 20, 2017 the decision was made to cease offering Series G units. All Series G units of Portland Canadian Balanced Fund and Portland Advantage Fund were redeemed prior to March 31, 2017. All other Series G units were redeemed as of April 28, 2017.
2. BASIS OF PRESENTATIONThe financial statements of the Funds have been prepared in compliance with International Financial Reporting Standards (IFRS) as published by the International Accounting Standards Board (IASB).
73

3. SUMMARY OF SIGNIFICANT ACCOUNTING POLICIESFinancial instruments
(a) Classification
The Funds recognize financial instruments at fair value upon initial recognition, plus transaction costs in the case of financial instruments measured at amortized cost. The Funds’ investments and derivative assets and liabilities are measured at fair value through profit and loss (FVTPL). Other than its derivative assets and liabilities which are held for trading, all of the Funds’ investments have been designated at FVTPL including its equity investments, fixed income investments and investments in other investment funds.
The Funds’ obligation for net assets attributable to holders of redeemable units is presented at the redemption amount which approximates fair value due to its short term nature.
All other financial assets and liabilities are classified as loans and receivables or other financial liabilities and are measured at amortized cost which approximates fair value due to their short-term maturities. Under this method, financial assets and liabilities reflect the amount required to be received or paid, discounted, when appropriate, at the contract’s effective interest rate.
The Funds’ accounting policies for measuring the fair value of its investments and derivatives are similar to those used in measuring their net asset value (NAV) for unitholder transactions; therefore it is expected that net assets attributable to holders of redeemable units will be the same in all material respects as the NAV per unit used in processing unitholder transactions.
Financial assets and liabilities may be offset and the net amount reported in the statements of financial position when there is a legally enforceable right to offset the recognized amounts and there is an intention to settle on a net basis, or to realize the asset and settle the liability simultaneously. In the normal course of business, the Funds may enter into various master netting agreements or similar agreements that do not meet the criteria for offsetting in the statements of financial position but still allow for the related amounts to be set off in certain circumstances, such as bankruptcy, certain events of default or termination of the contracts.
(b) Recognition, de-recognition and measurement
Purchases and sales of financial assets are recognized on their trade date - the date on which the Funds commit to purchase or sell the investment. Financial assets and liabilities at FVTPL are initially recognized at fair value. Transaction costs are expensed as incurred in the statements of comprehensive income.
Financial assets are de-recognized when the rights to receive cash flows from the investments have expired or the Funds have transferred substantially all the risks and rewards of ownership. Upon disposal, the difference between the amount received and the average cost to acquire the financial asset is included within ‘Net realized gain (loss) on investments and options’ in the statements of comprehensive income.
When the Funds write an option, an amount equal to fair value which is based on the premium received by the Funds is recorded as a liability. When options are closed, the difference between the premium and the amount received, net of brokerage commissions, or the full amount of the premium if the option expires worthless, is recognized as a gain or loss and is presented in the statements of comprehensive income within ‘Net realized gain (loss) on investments and options’. When a written call option is exercised, the amount of gain or loss realized from the disposition of the related investment at the exercise price, plus the premiums received at the time the option was written are included in the statements of comprehensive income within ‘Net realized gain (loss) on investments and options’. When a written put option is exercised, the amount of premiums received is deducted from the cost to acquire the related investment.
Option premiums paid when a Fund purchases an option are recorded as an asset. Exchange traded options are valued at their last traded market price where the last traded market price falls within the day’s bid-ask spread. In cases where the last traded price is not within the day’s bid-ask spread, the Manager determines the point within the bid-ask spread that is most representative of fair value based on specific facts and circumstances.
Realized gains and losses relating to purchased options may arise from:
i. Expiration of purchased options - realized losses will arise equal to the premium paid;
ii. Exercise of the purchased options - realized gains will arise up to the intrinsic value of the option net of premiums paid; or
iii. Closing of the purchased options - realized gains or losses will arise equal to the proceeds from selling the options to close the position, net of any premium paid.
Realized gains and losses related to options are included in ‘Net realized gain (loss) on investments and options’ in the statements of comprehensive income.
Subsequent to initial recognition, all financial assets and liabilities at FVTPL are measured at fair value. Gains and losses arising from change in fair value of the ‘financial assets and liabilities at fair value through profit or loss’ category are presented in the statements of comprehensive income within ‘Change in unrealized appreciation (depreciation) of investments and derivatives’ in the period in which they arise.
Fair value measurement
Fair value is the price that would be received to sell an asset or paid to transfer a liability in an orderly transaction between market participants at the measurement date. The fair value of financial assets and liabilities traded in active markets (such as publicly traded derivatives and marketable securities) are based on quoted market prices at the close of trading on the reporting date. The Funds use the last traded market price for both financial assets and financial liabilities where the last traded price falls within that day’s bid-ask spread. In circumstances where the last traded price
74

is not within the bid-ask spread, the Manager determines the point within the bid-ask spread that is most representative of fair value based on the specific facts and circumstances. If there has been no trade, the mid price (average bid and asking price) as of the close of the business on the reporting date is used to approximate fair value. The Funds’ policy is to recognize transfers into and out of the fair value hierarchy levels as of the date of the event or change in circumstances giving rise to the transfer.
Forward contracts are agreements to purchase or sell financial instruments at a specified future date. As forward contracts are not traded on an exchange, the agreements between counterparties are not standardized. Changes in value of forward contracts are settled only on termination of the contract. Open forward contracts are revalued to fair value in the statements of comprehensive income based on the difference between the contract rate and the applicable forward rate. Gains and losses associated with the valuation of open forward contracts are recorded in the statements of comprehensive income as ‘Change in unrealized appreciation (depreciation) of investments and derivatives’. The cumulative change in value upon settlement is included in the statements of comprehensive income as ‘Net realized gain (loss) on forward currency contracts’.
The fair value of bonds is based on closing bid quotations.
In accordance with the Funds’ fair value policy, an Investment Committee comprised of representatives from the fund reporting and oversight, compliance and portfolio management teams respond to fair value situations, using inputs from various sources which may include the portfolio management team, the administrator and general news. Fair value situations are reported to senior management and the Independent Review Committee and if deemed necessary, to the Board of Directors.
Structured Entities
A structured entity is an entity that has been designed so that voting or similar rights are not the dominant factor in deciding who controls the entity, such as when any voting rights relate to administrative tasks only and the relevant activities are directed by means of contractual arrangements. A structured entity often has some or all of the following features or attributes: (a) restricted activities; (b) a narrow and well-defined objective, such as to provide investment opportunities for investors by passing on risks and rewards associated with the assets of the structured entity to investors; c) insufficient equity to permit the structured entity to finance its activities without subordinate financial support; and (d) financing in the form of multiple contractually linked instruments to investors that create concentrations of credit or other risks (tranches).
The Funds consider all of their investments in exchange traded funds (ETFs) to be investments in unconsolidated structured entities. ETFs are bought and sold on the stock market on which they are traded and are valued at the last traded price as per above section on Fair Value Measurement.
The change in fair value of each ETF is included in the statement of comprehensive income in ‘Change in unrealized appreciation (depreciation) of the investments and derivatives’.
Revenue recognition
‘Interest for distribution purposes’ shown on the statements of comprehensive income represents the coupon interest earned by the Funds on debt securities accounted for on an accrual basis. The Funds do not amortize premiums paid or discounts received on the purchase of fixed income securities other than zero coupon debt securities which are amortized on a straight line basis. Interest receivable is shown separately in the statement of financial position based on the debt instruments’ stated rates of interest. Dividends on equity investments and distributions on investments in other investment funds are recognized as income on the ex-dividend date.
Foreign currency translation
The Funds’ subscriptions and redemptions are denominated in Canadian dollars, which is also its functional and presentation currency. Foreign currency transactions are translated into the functional currency using the exchange rates prevailing at the dates that transactions occur. Assets and liabilities denominated in a foreign currency are translated into the functional currency using the exchange rate prevailing at the reporting date. Foreign exchange gains and losses related to assets and liabilities at amortized cost are recognized in profit and loss and are presented as ‘Foreign exchange gain (loss) on cash and other net assets’ on the statements of comprehensive income. Realized foreign exchange gains and losses related to investments and options are recognized when incurred and are presented in the statement of comprehensive income within ‘Net realized gain (loss) on investments and options’. Realized gains and losses on forward currency contracts are recognized when incurred and are presented in the statement of comprehensive income within ‘Net realized gain (loss) on foreign currency contracts’.
Unrealized exchange gains or losses on investments, options and forward currency contracts are included in ‘Change in unrealized appreciation (depreciation) of investments and derivatives’ in the statements of comprehensive income.
‘Foreign exchange gain (loss) on cash and other net assets’ arise from sale of foreign currencies, currency gains or losses realized between trade and settlement dates on securities transactions, and the difference between the recorded amounts of dividend, interest and foreign withholding taxes and the Canadian dollar equivalent of the amounts actually received or paid.
Cash and cash equivalents
The Funds consider highly liquid investments with an original maturity of three months or less that are readily convertible to known amounts of cash and which are subject to an insignificant risk of changes in value to be cash equivalents. Cash is comprised of deposits with financial institutions.
Cost of investments
The cost of investments represents the cost for each security excluding transaction costs and amortization of premiums and discounts on fixed income securities with the exception of zero coupon bonds. The cost of each investment is determined on an average basis by dividing the total cost of such investment by the number of shares purchased. On the schedule of investment portfolio, transaction costs have been deducted in aggregate from the total cost of individual investments which include transaction costs. The premium received on a written put option is added to the cost of investments acquired when the written put option is exercised.
75

Redeemable units
The Funds issue multiple series of redeemable units, which are redeemable at the holder’s option and do not have identical rights. Therefore, such units are classified as financial liabilities. Redeemable units can be put back to the Funds at any redemption date for cash equal to a proportionate share of the Funds’ NAV attributable to the unit series. Units are redeemable daily.
Redeemable units are issued and redeemed at the holder’s option at prices based on each Fund’s NAV per unit at the time of issue or redemption. The Funds’ NAVs per unit are calculated by dividing the NAV of each series of redeemable units by the total number of outstanding redeemable units of each respective series. In accordance with the provisions of the Prospectus, investment positions are valued based on the last traded market price for the purposes of determining the NAV per unit for subscriptions and redemptions.
Expenses
Expenses of the Funds including management fees and other operating expenses are recorded on an accrual basis.
Transaction costs associated with investment transactions for financial assets and liabilities at FVTPL, including brokerage commissions, have been expensed on the statements of comprehensive income.
Interest expense associated with margin borrowing is recorded on an accrual basis.
Increase (decrease) in net assets attributable to holders of redeemable units per unit
‘Increase (Decrease) in Net Assets Attributable to Holders of Redeemable Units per Unit’ in the statements of comprehensive income represents the Increase (Decrease) in Net Assets Attributable to Holders of Redeemable Units per Series, divided by the daily average units outstanding of that Series during the reporting period.
Distribution to the Unitholders
Distributions will be made to Unitholders only at such times and in such amounts as may be determined at the discretion of the Manager. The Funds are required to distribute enough net income and net realized capital gains so that they do not have to pay ordinary income tax. All distributions by the Funds will be automatically reinvested in additional units of the Fund held by the investor at the NAV per unit thereof, unless the investor notifies the Manager in writing that cash distributions are preferred.
Allocation of income and expense, and realized and unrealized gains and losses
Management fees and other costs directly attributable to a series are charged to that series. Each Fund’s shared operating expenses, income, and realized and unrealized gains and losses are generally allocated proportionately to each series based upon the relative NAV of each Series.
Collateral
Cash collateral provided by the Funds is identified in the statements of financial position as margin accounts and is not included as a component of cash and cash equivalents.
Collateral other than cash is classified in the statements of financial position separately from other assets and liabilities as pledged collateral if the party to whom the collateral is provided has the right by contract or custom to sell or re-pledge the collateral.
Future accounting changes
IFRS 9, Financial Instruments
The final version of IFRS 9, Financial Instruments, was issued by the IASB in July 2014 and will replace IAS 39 Financial Instruments: Recognition and Measurement. IFRS 9 introduces a model for classification and measurement, a single, forward-looking ‘expected loss’ impairment model and a substantially reformed approach to hedge accounting. The new single, principle based approach for determining the classification of financial assets is driven by cash flow characteristics and the business model in which an asset is held. The new model also results in a single impairment model being applied to all financial instruments, which will require more timely recognition of expected credit losses. It also includes changes in respect of own credit risk in measuring liabilities elected to be measured at fair value, so that gains caused by the deterioration of an entity’s own credit risk on such liabilities are no longer recognized in profit or loss. IFRS 9 is effective for annual periods beginning on or after January 1, 2018, however is available for early adoption. In addition, the own credit changes can be early applied in isolation without otherwise changing the accounting for financial instruments. The Fund is in the process of assessing the impact of IFRS 9.
4. CRITICAL ACCOUNTING ESTIMATES AND JUDGMENTSThe preparation of financial statements requires management to use judgment in applying its accounting policies and to make estimates and assumptions about the future. The following discusses the most significant accounting judgments and estimates the Funds have made in preparing these financial statements.
Fair value measurement of investments not quoted in an active market
The Funds may hold investments in other investment funds that are not quoted in active markets. Fair values of such instruments are measured using the latest available published NAV per unit, which may be adjusted at the discretion of the Manager if it is determined not to be indicative of fair value. Refer to the Fund Specific Notes to the Financial Statements for further information about the fair value measurement of each Fund’s financial instruments.
76

Classification and measurement of investments and application of the fair value option
In classifying and measuring financial instruments under IAS 39, Financial Instruments - Recognition and Measurement, the Manager is required to make significant judgments about whether or not the investments of the Funds are considered held for trading or that the fair value option can be applied to those that are not. The Manager has concluded that the fair value option can be applied to the Funds’ investments that are not considered held for trading. Such investments have been designated at FVTPL.
Functional and presentation currency
The Funds’ investors are mainly from Canada, with subscriptions and redemptions of the redeemable units denominated in Canadian dollars. The performance of the Funds is measured and reported to the investors in Canadian dollars. The manager considers the Canadian dollar as the currency that most faithfully represents the economic effects of the underlying transactions, events and conditions. The financial statements are presented in Canadian dollars, which is the Funds’ functional and presentation currency.
5. RISKS ASSOCIATED WITH FINANCIAL INSTRUMENTSThe Funds’ investment activities may be exposed to various financial risks, including market risk (which includes currency risk, interest rate risk and price risk), credit risk and liquidity risk. The Funds’ risk management goals are to ensure that the outcome of activities involving risk is consistent with the Funds’ investment objectives and risk tolerance per the Funds’ offering documents. All investments result in a risk of loss of capital.
For a detailed discussion of risks associated with each Fund, refer to the ‘Fund Specific Notes to the Financial Statements’.
Price risk
Price risk is the risk that the fair value or future cash flows of financial instruments will fluctuate due to changes in market prices (other than those arising from interest rate risk or currency risk). Financial instruments held by the Funds are susceptible to market price risk arising from uncertainties about future prices of the instruments. The Fund limits its exposure to any one security to 10% of NAV at the time of purchase, which is monitored on a daily basis.
Interest rate risk
Interest rate risk arises on interest-bearing financial instruments having fixed interest rates held by the Funds, such as bonds and borrowings. The fair value and future cash flows of such instruments held by the Fund will fluctuate due to changes in market interest rates.
Currency risk
Currency risk is the risk that the value of a financial instrument will fluctuate due to changes in foreign exchange rates. Securities included in the Funds may be valued in or have exposure to currencies other than the Canadian dollar and when measured in Canadian dollars, be affected by fluctuations in the value of such currencies relative to the Canadian dollar. The Funds may enter into currency forward contracts to limit their currency exposure.
Liquidity risk
Liquidity risk is the risk that the Funds will encounter difficulty in meeting their obligations associated with financial liabilities. The Funds are exposed to daily cash redemptions. As a result, the Funds invest the majority of assets in investments that are traded in an active market and can be readily disposed of. There can be no assurance that an active trading market for the investments will exist at all times, or that the prices at which the securities trade accurately reflect their values. In accordance with securities regulations, each fund must maintain at least 90% of assets in liquid investments at time of purchase. In addition, each fund has the ability to borrow up to 5% of its net assets attributable to holders of redeemable units for the purposes of funding redemptions and settling portfolio transactions.
Credit risk
Credit risk is the risk that a party to a financial instrument will fail to discharge an obligation or commitment that it has entered into with the Funds. All transactions in listed securities are settled or paid for upon delivery using approved brokers. The risk of default is considered minimal, as delivery of securities sold is only made once the broker has received payment. Payment is made on a purchase once the securities have been received by the broker. The trade will fail if either party fails to meet its obligation.
Investments in currency forward contracts and long term debt securities represent the main concentration of credit risk in a fund. The Funds manage their exposure to credit risk by limiting investment in such contracts to those with (i) terms less than 365 days and (ii) counterparties are major banks having a minimum short-term debt credit rating of A-1 (Low) as published by the Standard & Poor’s Ratings Service (Canada). The Funds limit exposure to any one counterparty to no more than 10% of the NAV of each Fund. The fair value of debt instruments includes consideration of the credit worthiness of the issuer, and accordingly, represents the maximum credit risk exposure of the Funds.
Fair value of financial instruments
Financial instruments measured at fair value are classified according to a fair value hierarchy that reflects the importance of the inputs used to perform each valuation. The fair value hierarchy is made up of the following levels:
Level 1 - quoted prices (unadjusted) in active markets for identical assets or liabilities that the entity can access at the measurement date; Level 2 - inputs other than quoted prices included within Level 1 that are observable for the asset or liability, either directly or indirectly; and Level 3 - inputs are unobservable for the asset or liability.
The fair value hierarchy requires the use of observable market data each time such data exists. A financial instrument is classified at the lowest level of the hierarchy for which significant input has been considered in measuring fair value.
77

6. REDEEMABLE UNITSThe Funds are permitted to have an unlimited number of series of units, having such terms and conditions as the Manager may determine. Additional series may be offered in future on different terms, including different fee and dealer compensation terms and different minimum subscription levels. Each unit of a series represents an undivided ownership interest in the net assets of a Fund attributable to that series of units.
The Funds endeavor to invest capital in appropriate investments in conjunction with their investment objectives. The Funds maintain sufficient liquidity to meet redemptions, such liquidity being augmented by short-term borrowings or disposal of investments, where necessary.
Units of the Funds are available in multiple series as outlined below. The principal difference between the series of units relates to the management fee payable to the Manager, the compensation paid to dealers, distributions and the expenses payable by the series. Units of each Fund are entitled to participate in its liquidation of assets on a series basis. Units are issued as fully paid and non-assessable and are redeemable at the NAV per unit of the applicable series of units being redeemed, determined at the close of business on the day the redemption request is submitted.
Series A Units and Series A2 Units are available to all investors. Series G Units were available to investors who reside in non-HST provinces but ceased to be offered effective April 20, 2017.
Series F Units are available to investors who participate in fee-based programs through their dealer and whose dealer has signed a Series F Agreement with the Manager, investors for whom the Funds do not incur distribution costs, or individual investors approved by the Manager.
The number of units issued and outstanding for the period ended March 31, 2017 was as follows:
Balance, Beginning of Period Units Issued Units Reinvested Units Redeemed Balance,
End of Period
Weighted Average Number of Units
Portland Advantage Fund
Series A Units 235,362 4,093 3,372 5,520 237,307 235,770
Series F Units 255,828 2,529 6,425 40,286 224,496 244,065
Series G Units 102 - 1 103 - 89
Portland Canadian Balanced Fund
Series A Units 188,496 54,531 3,545 5,270 241,302 200,669
Series F Units 227,788 41,936 6,915 7,422 269,217 248,428
Series G Units 91 - 2 93 - 80
Portland Canadian Focused Fund
Series A Units 133,584 78,083 5,874 14,401 203,140 158,929
Series F Units 569,929 121,344 32,884 33,067 691,090 627,292
Series G Units 1,110 - 47 92 1,065 1,124
Portland Global Banks Fund
Series A Units 35,744 4,030 848 - 40,622 40,622
Series A2 Units 634,956 5,385 14,143 74,633 579,851 579,851
Series F Units 21,532 65 417 4,833 17,181 17,181
Portland Global Income Fund
Series A Units 79,618 14,838 1,586 320 95,722 83,981
Series A2 Units 364,590 26,735 7,963 52,764 346,524 341,856
Series F Units 113,958 6,402 2,408 14,519 108,249 109,623
Portland Global Dividend Fund
Series A Units 13,402 - 181 6,935 6,648 12,334
Series A2 Units 593,551 364 12,209 81,379 524,745 549,629
Series F Units 179,954 56 4,329 46,875 137,464 163,127
Portland Value Fund
Series A Units 53,522 1,369 304 9,363 45,832 50,333
Series F Units 19,316 6,497 242 288 25,767 20,550
The number of units issued and outstanding for the period ended September 30, 2016 was as follows:
Balance, Beginning of Period Units Issued Units Reinvested Units Redeemed Balance,
End of Period
Weighted Average Number of Units
Portland Advantage Fund
Series A Units 244,347 24,347 5,602 38,934 235,362 244,637
Series F Units 227,399 37,355 8,647 17,573 255,828 253,915
Series G Units 600 206 15 719 102 292
78

Balance, Beginning of Period Units Issued Units Reinvested Units Redeemed Balance,
End of Period
Weighted Average Number of Units
Portland Canadian Balanced Fund
Series A Units 215,918 22,615 7,032 57,069 188,496 211,005
Series F Units 62,993 201,800 3,691 40,696 227,788 134,330
Series G Units 9,313 91 314 9,627 91 3,791
Portland Canadian Focused Fund
Series A Units 133,150 26,929 6,842 33,337 133,584 132,067
Series F Units 434,414 203,479 20,599 88,563 569,929 493,165
Series G Units 10,053 88 362 9,393 1,110 4,706
Portland Global Banks Fund
Series A Units 13,981 20,655 1,700 592 35,744 30,095
Series A2 Units 804,849 6,555 37,792 214,240 634,956 706,437
Series F Units 21,156 5,186 1,399 6,209 21,532 24,720
Portland Global Income Fund
Series A Units 84,293 584 3,679 8,938 79,618 84,065
Series A2 Units 443,266 2,309 20,086 101,071 364,590 400,159
Series F Units 125,023 1,770 6,061 18,896 113,958 118,731
Portland Global Dividend Fund
Series A Units 12,464 1,063 378 503 13,402 13,176
Series A2 Units 763,877 559 35,392 206,277 593,551 676,611
Series F Units 248,627 9,593 18,297 96,563 179,954 232,372
Portland Value Fund
Series A Units 5,594 48,004 15 91 53,522 28,126
Series F Units 13,417 5,797 102 - 19,316 16,817
7. TAXATIONAll of the Funds except Portland Value Fund qualify as mutual fund trusts within the meaning of the Income Tax Act (Canada). Portland Value Fund is a unit trust and has registered investment status. It will qualify as a mutual fund trust once it has 150 qualifying unitholders. The Funds are subject to tax on any income, including net realized capital gains, which is not paid or payable to their unitholders. Each Fund’s net income for tax purposes and sufficient net capital gains realized in any period are required to be distributed to unitholders such that no income tax is payable by each Fund. As a result, the Funds do not record income taxes. Since the Funds do not record income taxes, the tax benefit of capital and non-capital losses has not been reflected in the statements of financial position as a deferred income tax asset.
Portland Value Fund may incur Minimum Tax (as defined in the Income Tax Act (Canada)) since it is a unit trust. Minimum Tax is reflected as an expense on the statements of comprehensive income, if applicable.
The Funds currently incur withholding taxes imposed by certain countries on investment income and capital gains. Such income or gains are recorded gross of withholding taxes in the statements of comprehensive income. Withholding taxes are shown as a separate item in the statements of comprehensive income.
The taxation year-end for the Funds is December 15, except Portland Value Fund which has a taxation year-end of December 31. The following chart presents the amount of non-capital loss carry forwards available to the Funds by year of expiry.
2030 ($)
2032 ($)
2033 ($)
2035 ($)
Total ($)
Portland Global Banks Fund 279,354 1,913 336,358 56,124 673,749
The following chart presents the amount of unused capital losses which can be carried forward indefinitely by the Funds.
Total ($)
Portland Global Banks Fund 159,072,011
Portland Global Income Fund 23,140,077
Portland Global Dividend Fund 26,866,722
79

8. MANAGEMENT FEES AND EXPENSESPursuant to the Prospectus, the Funds agree to pay management fees to the Manager, calculated and accrued daily based on a percentage of the net asset value of each series of each Fund and paid monthly. The annual management fees rate of the respective series of units are as follows:
Series A Units
Series A2 Units
Series F Units
Series G Units
Portland Advantage Fund 2.00% n/a 1.00% 2.00%
Portland Canadian Balanced Fund 2.00% n/a 1.00% 2.00%Portland Canadian Focused Fund 2.00% n/a 1.00% 2.00%Portland Global Banks Fund 2.00% 1.75% 1.00% 2.00%Portland Global Income Fund 1.85% 1.65% 0.85% 1.85%Portland Global Dividend Fund 2.00% 1.85% 1.00% 2.00%Portland Value Fund 2.00% n/a 1.00% 2.00%
The Manager is reimbursed for any operating expenses it incurs on behalf of the Funds, including regulatory filing fees, custodian fees, legal and audit fees, costs associated with the Independent Review Committee, bank charges, the cost of financial reporting, and all related sales taxes. GST and HST paid by the Funds on its expenses is not recoverable. The Manager also provides key management personnel to the Fund. The Manager may charge the Funds for actual time spent by its personnel (or those of its affiliates) in overseeing the day-to-day business affairs of the Funds. The amount charged for time spent by personnel is determined based on fully allocated costs and does not include a mark up or administration fee. The Manager may absorb fund operating expenses at its discretion but is under no obligation to do so.
The Manager may reduce the effective management fee payable by some unitholders by reducing the management fee it charges to the particular fund and directing the fund to make management fee distributions to these unitholders in amounts equal to the amounts of the management fee reduction.
Management fee distributions are accounted for as distributions for financial reporting purposes.
9. SOFT DOLLARSAllocation of business to brokers of the Funds is made on the basis of coverage, trading ability and fundamental research expertise. The Manager may choose to affect portfolio transactions with dealers who provide research, statistical and other similar services to the Funds or to the Manager at prices which reflect such services (termed proprietary research). The dealers do not provide the Manager with an estimate of the cost of the research, statistical and other similar services (referred to as soft dollars).
In addition to the foregoing, effective January 1, 2016, the Manager may use third party research, which is generally also available on a subscription basis, the value of which will be used to approximate the value of research and other similar services received from third parties through commission sharing arrangements with executing brokers. The ascertainable value of the third party soft dollar arrangements in connection with portfolio transactions for the periods ended March 31, 2017 and March 31, 2016 are presented in the table below:
For the period ended March 31, 2017 ($)
March 31, 2016 ($)
Portland Advantage Fund 167 80
Portland Canadian Balanced Fund - -Portland Canadian Focused Fund - -Portland Global Banks Fund 18 147Portland Global Income Fund 31 26Portland Global Dividend Fund 50 45Portland Value Fund 23 20
10. RELATED PARTY TRANSACTIONSThe following tables outline the management fees and operating expense reimbursements that were paid to the Manager by the Funds during the periods ended March 31, 2017 and March 31, 2016. The tables include the amount of operating expense reimbursement that was paid to affiliates of the Manager for administrative services provided in managing the day-to-day operation of the Funds and the amount of additional absorbed operating expenses that the Manager chose not to charge to the Funds. All of the dollar amounts in the tables below exclude applicable GST or HST:
80

Period ended March 31, 2017
Management Fees($)
Operating Expense Reimbursement
($)
Absorbed Operating Expenses
($)
Operating Expenses Reimbursed to Affiliates of the
Manager($)
Portland Advantage Fund 40,474 14,184 48,165 1,382
Portland Canadian Balanced Fund 42,250 16,252 34,800 1,382
Portland Canadian Focused Fund 63,453 28,936 19,380 1,382
Portland Global Banks Fund 62,609 17,960 58,665 1,382
Portland Global Income Fund 38,702 13,236 55,060 1,382
Portland Global Dividend Fund 53,348 16,461 57,010 1,382
Portland Value Fund 5,079 1,498 50,800 1,349
Period ended March 31, 2016
Management Fees($)
Operating Expense Reimbursement
($)
Absorbed Operating Expenses
($)
Operating Expenses Reimbursed to Affiliates of the
Manager($)
Portland Advantage Fund 39,902 14,034 45,210 1,450
Portland Canadian Balanced Fund 31,681 9,246 46,240 1,450
Portland Canadian Focused Fund 41,817 18,220 42,435 1,450
Portland Global Banks Fund 70,456 18,905 72,940 1,450
Portland Global Income Fund 42,585 14,517 82,695 1,450
Portland Global Dividend Fund 69,867 21,377 64,635 1,450
Portland Value Fund 1,745 587 43,390 1,450
The Funds owed the following amounts to the Manager as at March 31, 2017 and September 30, 2016 (excluding applicable GST or HST):
Period ended March 31, 2017
Management Fees($)
Operating Expense Reimbursement
($)
Portland Advantage Fund 6,942 2,389
Portland Canadian Balanced Fund 8,394 3,174
Portland Canadian Focused Fund 12,931 5,664
Portland Global Banks Fund 11,045 3,165
Portland Global Income Fund 6,878 2,333
Portland Global Dividend Fund 8,720 2,657
Portland Value Fund 818 251
Period ended September 30, 2016
Management Fees($)
Operating Expense Reimbursement
($)
Portland Advantage Fund 6,489 2,412
Portland Canadian Balanced Fund 5,745 2,325
Portland Canadian Focused Fund 7,846 3,999
Portland Global Banks Fund 8,967 2,579
Portland Global Income Fund 6,306 2,174
Portland Global Dividend Fund 9,225 2,953
Portland Value Fund 899 264
81

The Manager and/or its affiliates, officers and directors (Related Parties) may invest in units of the Funds from time to time in the normal course of business. All such transactions are measured at net asset value per unit. The following table presents the percentage ownership of each of the Funds by Related Parties on each reporting date.
March 31, 2017 September 30, 2016
Portland Advantage Fund 12.1% 9.5%
Portland Canadian Balanced Fund 1.7% 1.9%
Portland Canadian Focused Fund 1.3% 1.5%
Portland Global Banks Fund 0.1% 1.3%
Portland Global Income Fund 2.2% 2.4%
Portland Global Dividend Fund 0.1% 0.7%
Portland Value Fund 21.4% 20.8%
11. BROKERAGE FACILITYAs of March 31, 2017 and September 30, 2016, each of Portland Global Banks Fund, Portland Global Income Fund and Portland Global Dividend Fund had a Settlement Services Agreement with RBC Dominion Securities Inc. (RBCDS), and has placed securities and cash on account with RBCDS as collateral for their option writing strategy. In the event of default, including failure to make any payment or delivery to RBCDS, RBCDS may freeze the collateral property and cease the provision of settlement services. In such circumstances, RBCDS has the right to set off the collateral property to reduce or eliminate the amount owed to them. RBCDS also has the right to sell or otherwise dispose of the collateral property held on account for the Funds in order to set off against amounts owing to them from the Funds. Non-cash collateral has been classified separately within the statements of financial position from other assets and is identified as ‘Investments - pledged as collateral’. Cash collateral has been classified separately on the statements of financial position as ‘Margin accounts’.
12. COMPARISON OF NET ASSET VALUEAs at March 31, 2017 and September 30, 2016, there was no difference between the NAV per unit used for transactional purposes and the net assets attributable to holders of redeemable units per unit in these financial statements.
82

Statement of Corporate Governance Practices
Canadian securities law requires certain reporting issuers to publish specific disclosure concerning their corporate governance practices. The Manager has established an Independent Review Committee consisting of three members appointed to provide independent advice to assist the Manager in performing its services and to consider and provide recommendations to the Manager on conflicts of interest to which the Manager is subject when managing the Fund.

Commissions, service fees, management fees and expenses may be associated with investment funds. Investment funds are not guaranteed, their values change frequently and past performance may not be repeated. The views and opinions contained in this report are as of March 31, 2017 and this report is not intended to provide legal, accounting, tax or specific investment advice. Please read the prospectus before investing. PORTLAND, PORTLAND INVESTMENT COUNSEL and the Clock Tower Design are registered trademarks of Portland Holdings Inc. Used under licence by Portland Investment Counsel Inc.Portland Investment Counsel Inc., 1375 Kerns Road, Suite 100, Burlington, Ontario L7P 4V7 Tel:1-888-710-4242 • Fax: 1-866-722-4242 www.portlandic.com • [email protected]
PIC0052-E(05/17)