Portfolio Re Balancing
15
P ortfolio Rebalancing in Theory and Practice Vanguard ® Investment Counseling & Research Number 31 Connect with V anguard > www.vanguard.com > [email protected] Executive summary A portfolio’s asset allocation determines the portfolio’s risk and return charac- teristics. Over time, as different asset classes produce different returns, the portfolio’s asset allocation changes. To recapture the portfolio’s original risk and return characteristics, the portfolio must be rebalanced to its original asset allocation. This paper identifies the factors that influence a rebalancing strategy. We present a conceptual framework for developing rebalancing strategies that can accommodate changes in the financial market environment and in asset class characteristics, as well as account for an institution’s unique risk tolerance and time horizon. Our findings indicate that: • Determining an effective rebalancing strategy is a function of the portfolio’s assets: their expected returns, their volatility, and the correlation of their returns. For example, a high correlation among the returns of a portfolio’s assets means that they tend to move together, which will tend to reduce the need for rebalancing. In addition, the investment time horizon affects the rebalancing strategy. A portfolio with a short time horizon is less likely to need rebalancing because there is less time for the portfolio to drift from the target asset allocation. In addition, such a portfolio is less likely to recover the trading costs of rebalancing. Author Yesim Tokat, Ph.D.
-
Upload
sainath-reddy -
Category
Documents
-
view
219 -
download
0
Transcript of Portfolio Re Balancing
8/8/2019 Portfolio Re Balancing
http://slidepdf.com/reader/full/portfolio-re-balancing 1/15
Portfolio Rebalancing in Theory and Practice
Vanguard® Investment Counseling & Research
Number 31
Connect with Vanguard > www.vanguard.com > [email protected]
Executive summary
A portfolio’s asset allocation determines the portfolio’s risk and return charac-
teristics. Over time, as different asset classes produce different returns, the
portfolio’s asset allocation changes. To recapture the portfolio’s original risk
and return characteristics, the portfolio must be rebalanced to its original
asset allocation.
This paper identifies the factors that influence a rebalancing strategy. We
present a conceptual framework for developing rebalancing strategies that
can accommodate changes in the financial market environment and in asset
class characteristics, as well as account for an institution’s unique risk
tolerance and time horizon. Our findings indicate that:
• Determining an effective rebalancing strategy is a function of the portfolio’s
assets: their expected returns, their volatility, and the correlation of their
returns. For example, a high correlation among the returns of a portfolio’s
assets means that they tend to move together, which will tend to reduce
the need for rebalancing. In addition, the investment time horizon affects
the rebalancing strategy. A portfolio with a short time horizon is less likely
to need rebalancing because there is less time for the portfolio to drift
from the target asset allocation. In addition, such a portfolio is less likely
to recover the trading costs of rebalancing.
Author
Yesim Tokat, Ph.D.
8/8/2019 Portfolio Re Balancing
http://slidepdf.com/reader/full/portfolio-re-balancing 2/15
• The effect of a rebalancing strategy on a portfolio depends on return patterns over time.
If security prices approximately follow a random-walk pattern,1 then rebalancing more
frequently or within tighter bands reduces a portfolio’s downside risk (absolute as well
as relative to the target asset allocation). In a trending or mean-reverting market, the
impact of rebalancing may be somewhat different when viewed on an absolute or
relative-to-target basis.
• Additional factors to consider when implementing a rebalancing strategy include
preference and costs, such as time spent, redemption fees, or trading costs. Each
cost incurred will reduce the return of the portfolio. The nature and magnitude of
trading costs affect the choice of rebalancing strategies.
• Due to differing risk tolerances, two institutions with identical asset allocations may
prefer different rebalancing strategies.
Introduction
Portfolio rebalancing is a powerful risk-control strat-
egy. Over time, as a portfolio’s different investments
produce different returns, the portfolio drifts from
its target asset allocation, acquiring risk and return
characteristics that may be inconsistent with an
investor’s goals and preferences. A rebalancing
strategy addresses this risk by formalizing guidelines
about how frequently the portfolio should be moni-
tored, how far an asset allocation can deviate from
its target before it’s rebalanced, and whether period-
ic rebalancing should restore a portfolio to its target
or to some intermediate allocation.
Although these general decisions apply to allrebalancing strategies, the specific guidelines
appropriate to a particular portfolio may be unique.
Because each guideline has an impact on the portfo-
lio’s risk and return characteristics, the how often,
how far, and how much are partly questions of
investor preference.
This paper establishes a theoretical framework
for developing a portfolio-rebalancing strategy. We
start by exploring the trade-off between variousrebalancing decisions and a portfolio’s risk and
return characteristics. In theory, investors select
a rebalancing strategy that balances their willing-
ness to assume risk against returns net of the
cost of rebalancing. We also explore a second
important determinant of the appropriate rebalanc-
ing strategy—the characteristics of the portfolio’s
assets. For example, high correlation among the
returns of a portfolio’s various assets reduces the
risk that the portfolio will drift from its target alloca-
tion, thus limiting the need to rebalance.
We conduct simulations to analyze how these
different factors and different rebalancing guidelines
affect a portfolio’s risk and return characteristics.
Our simulations explore a range of return patterns—
trending, mean-reverting, and random walk—to
illustrate the impact of different rebalancing guide-
lines in different market environments. We conclude
with a review of practical rebalancing considerations.
Although we encourage rebalancing for risk control,
our analysis can also be used to build a framework
for tactical rebalancing.
Number 32 > Vanguard Investment Counseling & Research
1 When prices follow a random-walk pattern, market prices follow a random path up and down, without any influence by past price movements, making it
impossible to predict with any accuracy which direction the market will move at any point.

8/8/2019 Portfolio Re Balancing
http://slidepdf.com/reader/full/portfolio-re-balancing 3/15
0
Risk of return deviation
Figure 1. Hypothetical Rebalancing Trade-Off
Relative to a Target Asset Allocation
After costs
Trade-off frontier
Before costs
Trade-off frontierInvestor preference
Low risk of return deviation
from target allocation, high expected
return deviation-cost
Target allocation
Expected return deviation = 0
Risk of return deviation = 0
E x p e c t e d
r e t u r n
d e v i
a t i o n
The rebalancing frontier can be adapted to
account for the costs of rebalancing—transaction
costs, taxes, and time and labor costs—which
diminish the portfolio’s return. As the portfolio is
rebalanced more frequently, costs become a bigger
drag on performance. This relationship is depicted inFigure 1 by the sharp downward slope in the rebal-
ancing frontier represented by the dashed line. At
the upper-right end of the frontier, the low frequency
of rebalancing imposes minimal costs. At the highly
risk-controlled lower-left end of the frontier, rebalanc-
ing costs can be a significant burden. We present a
detailed analysis of the impact of costs on the rebal-
ancing frontier in “The impact of rebalancing costs
on rebalancing strategy” on page 10.
Trade-offs in the rebalancing decision
Like the selection of a portfolio’s target asset alloca-
tion, a rebalancing strategy involves a trade-off
between risk and return. In asset allocation, risk
and return are absolutes. For instance, an expected
annual return of 10% might be associated with
annualized volatility of 15%, while a return of 5%
might be associated with volatility of 7%. In a rebal-
ancing strategy, by contrast, risk and return are
measured relative to the performance of the target
asset allocation (Leland, 1999; Pliska and Suzuki,
2004). The decisions that determine the difference
between an actual portfolio’s performance and that
of the portfolio’s target asset allocation include how
frequently the portfolio is monitored, what degree
of deviation from the target allocation triggers the
rebalancing, and whether a portfolio is rebalanced
to its target or to an intermediate allocation.
If a portfolio is never rebalanced, it will graduallydrift from its target asset allocation to higher-return,
higher-risk assets. Compared with the target alloca-
tion, the portfolio’s expected return increases, as
does its vulnerability to deviations from the return
of the target asset allocation. This trade-off, which
can be thought of as the rebalancing frontier, is
depicted in Figure 1.
Consider a portfolio with a target asset
allocation of 60% stocks and 40% bonds that is
never rebalanced. Because stocks have historically
outperformed bonds, the portfolio’s asset allocationgradually drifts to 90% stocks and 10% bonds.
As the portfolio’s equity exposure increases, the
portfolio moves toward the upper-right end of the
rebalancing frontier—higher risk and higher return.
Vanguard Investment Counseling & Research >Number 31

8/8/2019 Portfolio Re Balancing
http://slidepdf.com/reader/full/portfolio-re-balancing 4/15
Just as there is no universally optimal asset
allocation, there is no universally optimal rebalancing
strategy. An institution selects a rebalancing strategy
based on its tolerance for risk relative to a target allo-
cation. Because institutional preferences are unique,
the rebalancing strategies that portfolio managers
choose from the rebalancing frontier may differ. For
example, some institutions may satisfy their riskpreferences by monitoring their portfolios at an annu-
al frequency and then rebalancing if the allocation
shifts more than 10%. Other managers may want
tighter risk control and choose to monitor their port-
folios monthly, rebalancing if the allocation drifts by
more than 1%.
Asset characteristics and the
rebalancing decision
The development of a rebalancing strategy that is
consistent with an institution’s preferences also
depends on the characteristics of a portfolio’s assets.
A rebalancing strategy that maintains an appropriate
level of risk control in a portfolio of stocks and bonds
may not be appropriate in a portfolio made up of
hedge funds, real estate, and commodities.
As formalized by Stanley R. Pliska and Kiyoshi
Suzuki (2004), the asset class characteristics that in-
fluence the rebalancing strategy include the following:
• Correlation: High correlation among the returns
of asset classes means that they tend to move
together. When the returns of all the assets in the
portfolio move in the same direction, the asset
allocation weightings tend to remain unchanged,
reducing both the risk of significant deviation from
the target allocation and the need to rebalance.
• Volatility: High return volatility increases the
fluctuation of the asset class weightings around
the target allocation and increases the risk of
significant deviation from the target. Greater
volatility implies a greater need to rebalance. In
the presence of time-varying volatility, rebalancing
occurs more often when volatility rises.• Expected return: A high expected return for a
particular asset causes a portfolio’s allocation to
drift toward this asset class more quickly.
Significant differences among the expected
returns of portfolio holdings increase the risk of
significant deviation from the target allocation
and thus increase the need to rebalance.
• Time horizon: A long time horizon increases the
likelihood of a portfolio drifting from its target
allocation, which produces a greater risk of signifi-
cant return deviation. This long-term drift increasesthe need to rebalance. There is also more time to
recover any costs of rebalancing. For a portfolio
with a finite time horizon, in the presence of
costly rebalancing, the optimal rebalancing fre-
quency declines as the terminal investment date
approaches (Liu and Loewenstein, 2002;
Zakamouline, 2002).
Market environments and rebalancing results
A portfolio’s return relative to its target asset alloca-
tion is the appropriate framework for evaluating a
rebalancing strategy’s effectiveness at risk control.
However, real-world experience indicates that
investors often view risk in absolute terms. In most
market environments, where returns follow a ran-
dom-walk pattern, successful relative risk control
also reduces absolute risk. However, in some market
environments, successful relative risk control can
increase absolute risk. We examine market environ-
ments in which this disjunction between theory and
perception is likely to be most pronounced.
We conduct simulations to identify return patternsin which rebalancing strategies and the decision
not to rebalance produce the greatest discrepancies
between relative and absolute performance.2 If fore-
warned is forearmed, then a simple acknowledgment
of these eventualities (which are always visible in ret-
rospect, but rarely in advance) can help an institution
maintain a disciplined rebalancing strategy through
challenging market environments. We simulate rebal-
ancing strategies with reasonable ad hoc monitoring
frequencies and a 5% rebalancing threshold.3 We
rebalance to the target asset allocation, which is
60% stocks and 40% bonds. (See “Simulation
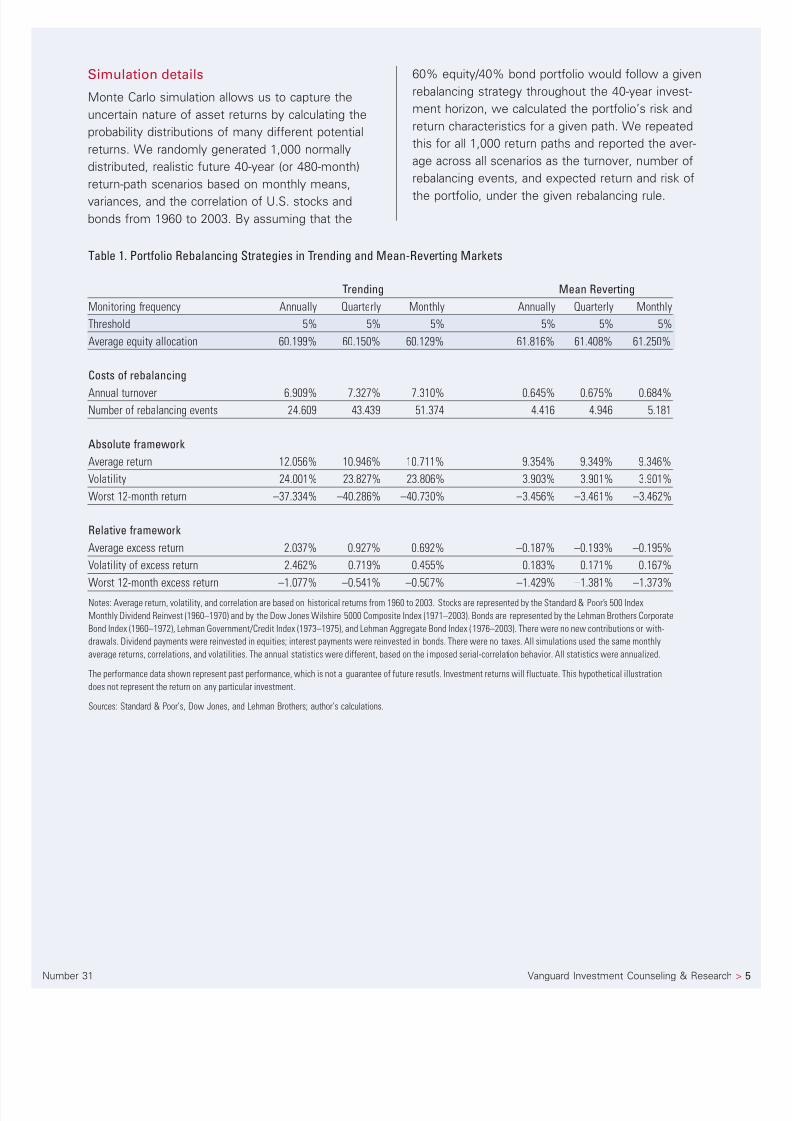
details” on page 5.)
Number 34 > Vanguard Investment Counseling & Research
2 Absolute performance is the total return on the portfolio. Relative performance is the performance difference between the portfolio and its target asset allocation.
3 When a portfolio has a 5% rebalancing threshold, the portfolio is rebalanced if its allocation deviates 5% or more from the target asset allocation.
8/8/2019 Portfolio Re Balancing
http://slidepdf.com/reader/full/portfolio-re-balancing 5/15

8/8/2019 Portfolio Re Balancing
http://slidepdf.com/reader/full/portfolio-re-balancing 6/15
Trending markets
In trending markets, rebalancing can test an institu-
tion’s or individual investor’s resolve. If equity prices
rise every period, regular rebalancing implies continu-
ally selling the strongly performing asset and investing
in the weaker performer. The result is a lower return
compared with a less frequently rebalanced portfolio.
The U.S. stock market’s steady upward surge duringthe mid- to late-1990s was an example of a trending
market. Rebalancing produced lower returns than a
portfolio that was never rebalanced.
The two-and-a-half years following the U.S. stock
market’s March 2000 peak were an example of a
downward-trending market, again an environment
that made rebalancing unattractive. If stock prices fall
every period, then the portfolio is continually buying
equities as their prices decline, experiencing returns
below those of a portfolio that is never rebalanced.
To illustrate the performance of a rebalancing
strategy in trending markets, we simulate a strongly
trending equity market (serial correlation of 90%)
over the 40-year investment horizon. It should be
noted that serial correlation of 90% is an extreme
manifestation of trending. We choose this exagger-
ated figure to highlight the differences between
rebalanced and never-rebalanced portfolios.
Our simulations indicate that the more frequently
a portfolio is rebalanced, the tighter its risk control
relative to the target asset allocation, even during
periods of strong price momentum. This tighter risk
control is accompanied by the higher potential cost
of rebalancing, as indicated by the greater number of
rebalancing events and the higher turnover rate. This
finding is consistent with our theoretical framework.
Table 1 on page 5 indicates that a portfolio’s
expected-return deviation and risk-of-return deviation
declined as the portfolio was rebalanced more
frequently. In a portfolio that was rebalanced annually,
the volatility of excess return was 2.462%. When
the portfolio was rebalanced monthly, this figure
declined to 0.455%. The less frequently rebalanced
portfolio also sustained a larger maximum 12-monthloss relative to the target allocation.
In a trending market, a potentially troubling
paradox was that tight relative risk control increased
a portfolio’s absolute risk. As the portfolio was rebal-
anced more frequently, its average return decreased.
The most frequently rebalanced portfolio also pro-
duced the worst absolute return—the result of
continually buying equities as their returns fell in
a downward-trending market.
Mean-reverting markets
The opposite of a trending market is a mean-reverting market. Price increases are followed by
price declines, and vice versa. In a mean-reverting
market, a portfolio’s returns can be enhanced by
rebalancing, buying an asset after it has decreased
in value and selling it after it has appreciated. In 1987
and 1988, the stock market followed a pattern of
mean reversion. Stock prices rallied through much
of 1987, collapsed on October 19, then recovered in
a back-and-forth pattern during 1988.
Number 36 > Vanguard Investment Counseling & Research

8/8/2019 Portfolio Re Balancing
http://slidepdf.com/reader/full/portfolio-re-balancing 7/15
Our simulation assumes an exaggerated level
of mean reversion (serial correlation of –90%) to
highlight the impact of different rebalancing strate-
gies in a mean-reverting market. As was the case in
a trending market, the more frequently rebalanced
portfolio had tighter risk control relative to the target
asset allocation. In a portfolio that was rebalanced
monthly, the volatility of excess return was 0.167%,as displayed in Table 1. In a portfolio that was rebal-
anced annually, this figure rose modestly to 0.183%.
The less frequently rebalanced portfolio also sus-
tained a greater maximum 12-month loss relative to
its benchmark.
Although a portfolio’s buy-and-sell decisions are
generally well timed when rebalancing in a mean-
reverting market, our simulation indicated that as a
portfolio was rebalanced more frequently, or within
tighter bands, its absolute average return decreased.
The additional return produced by well-timed pur-chases and sales was less than the additional return
produced by the higher equity allocation in a less
frequently rebalanced portfolio.
Risk differences among the different portfolios
were relatively modest. The small scale of differ-
ences in this simulation was partly due to the low
standard deviation of all portfolio returns in mean-
reverting markets. When each upward or downward
price movement was followed by its opposite,
a portfolio’s fluctuation around its average return
tended to be modest. For example, in a trending
market, the annualized standard deviation of a portfo-
lio that was rebalanced annually was 24.001%. In
the mean-reverting market, a portfolio with this
same rebalancing strategy had a standard deviation
of 3.903%.
Interpretations of rebalancing data in trending and
mean-reverting markets
In certain market environments, rebalancing
produces superior risk control but inferior returns.
This disjunction can challenge an institution’s com-
mitment to rebalancing. It’s important to recognize,
however, that whether the prospective market
environment will be trending or mean-reverting israrely clear in advance. Rebalancing’s risk-control
benefits, by contrast, are a certainty. Commitment
to a long-term rebalancing strategy requires absolute
clarity about the institution’s goals and risk tolerance,
as well as the simple recognition that rebalancing
will at times produce inferior returns.
An alternative interpretation of our simulation
results is that managers who can predict return
patterns can rebalance tactically to increase a portfo-
lio’s return and reduce the portfolio’s risk. Although
there is weak evidence for short-term trending and
long-term mean-reverting in equity markets, both
practical and academic evidence show that this
predictability is very hard to exploit (Campbell,
Lo, and MacKinlay, 1996).
Vanguard Investment Counseling & Research >Number 31

8/8/2019 Portfolio Re Balancing
http://slidepdf.com/reader/full/portfolio-re-balancing 8/15
Rebalancing trade-offs in a
random-walk environment
Although the equity markets may seem to experi-
ence periods of trending and mean-reversion, a more
realistic model of security-price movements is a ran-
dom walk.4 (The evidence against the random-walk
model is often weak and time-period dependent
[Campbell, Lo, and MacKinlay, 1996]). We conducted
a simulation that assumes monthly security prices
follow a random-walk pattern. We analyzed the
impact of rebalancing strategies on both relative
and absolute performance.
Table 2 shows the expected return and risk
characteristics of portfolio-rebalancing strategies
with reasonable ad hoc monitoring frequencies and
rebalancing thresholds. The portfolios were rebal-
anced to the target asset allocation. We display the
results for monthly, quarterly, and annual monitoring
frequencies with 1%, 5%, and 10% rebalancingthresholds. If a portfolio is monitored monthly with
a 1% threshold, in other words, it will be rebalanced
if its actual asset allocation differs from its target
asset allocation by 1% or more.
We compared the risk and return characteristics
produced by these various rebalancing strategies rel-
ative to a target asset allocation of 60% equities and
40% bonds. The target allocation was rebalanced
monthly irrespective of the magnitude of the alloca-
tion drift. The relative risk and return characteristics
for the different rebalancing strategies are presented
in the bottom three rows of Table 2. A portfolio that
was rebalanced more frequently, either because it
was monitored more frequently or because it had
tighter rebalancing thresholds, tracked the target
asset allocation more closely.
For example, a portfolio that was monitored
monthly and rebalanced at 1% thresholds producedvirtually no excess return or risk relative to the target
allocation. Its worst relative 12-month loss was
–0.206%. A portfolio that was monitored annually,
with a rebalancing threshold of 10%, produced
greater excess return and risk. Its worst relative
12-month loss was –2.227%.
Although this simulation implies that a more
frequently rebalanced portfolio will have less risk
than a less frequently rebalanced portfolio, it also
suggests that the cost of rebalancing may place
upper limits on the optimal number of rebalancingevents. Transaction costs, taxes, and time and labor
costs detract from the portfolio’s return, potentially
undermining the risk-control benefits of some rebal-
ancing strategies. In our simulation, the number of
rebalancing events and the annual turnover were
proxies for costs. The actual costs will depend on
a portfolio’s unique transaction costs, taxes, and
time and labor costs.
A rebalancing strategy that included monthly
monitoring and 1% thresholds was more costly
to implement (an average of 177.184 rebalancing
events, with annual portfolio turnover of 7.126%)
than one that included annual monitoring and 10%
thresholds (an average of 3.520 rebalancing events
and annual portfolio turnover of 1.051%).
Number 38 > Vanguard Investment Counseling & Research
4 More accurately, random walk with drift.

8/8/2019 Portfolio Re Balancing
http://slidepdf.com/reader/full/portfolio-re-balancing 9/15
Table 2. A Range of Por tfolio Rebalancing Strategies in a Random-Walk Return Environment
Monitoring frequency Annually Annually Annually Quar terly Quar terly Quar terly Monthly Monthly Monthly
Threshold 10% 5% 1% 10% 5% 1% 10% 5% 1%
Average equity allocation 61.524% 60.549% 60.240% 61.279% 61.351% 59.996% 61.184% 60.276% 59.952%
Costs of rebalancing
Annual turnover 1.051% 1.714% 2.722% 1.193% 2.085% 4.971% 1.242% 2.273% 7.126%Number of rebalancing events 3.520 9.739 30.593 4.357 13.861 92.789 4.714 16.276 177.184
Absolute framework
Average return 9.642% 9.615% 9.605% 9.637% 9.606% 9.594% 9.633% 9.604% 9.592%
Volatility 10.334% 10.201% 10.159% 10.298% 10.173% 10.123% 10.287% 10.161% 10.111%
Worst 12-month return –16.643% –16.338% –16.267% –16.529% –16.367% –16.475% –16.540% –16.403% –16.555%
Relative framework
Average excess return 0.051% 0.024% 0.013% 0.046% 0.015% –0.003% 0.041% 0.012% 0.001%
Volatility of excess return 0.782% 0.502% 0.366% 0.366% 0.380% 0.162% 0.655% 0.336% 0.065%
Worst 12-month excess return –2.227% –1.331% –0.959% –1.955% –0.956% –0.454% –1.835% –0.834% –0.206%Notes: Average return, volatility, and correlation are based on historical returns from 1960 to 2003. Stocks are represented by the S & P 500 Index Monthly Dividend Reinvest
(1960–1970) and by the Dow Jones Wilshire 5000 Index (1971–2003). Bonds are represented by the Lehman Corporate Bond Index (1960–1972), Lehman Government/Credit
Index (1973–1975), and Lehman Aggregate Bond Index (1976–2003). There were no new contributions or withdrawals. Dividend payments were reinvested in equities; interest
payments were reinvested in bonds. There were no taxes. All simulations used the same monthly average returns, correlations, and volatilities. The annual statistics were
different, based on the imposed serial-correlation behavior. All statistics were annualized.
The performance data shown represent past performance, which is not a guarantee of future results. Investment returns will fluctuate. This hypothetical illustration does not
represent the return on any particular investment.
Sources: Standard & Poor’s, Dow Jones, and Lehman Brothers; author’s calculations.
Vanguard Investment Counseling & Research >Number 31
Costs also have an impact on rebalancing consid-
erations outside the scope of our simulation—
whether to rebalance to the target asset allocation
or to some intermediate allocation. The decision
depends on the type of rebalancing cost. When trad-
ing costs are mainly fixed and independent of the
size of the trade—the cost of time, for example—
rebalancing to the target allocation is optimal
because it reduces the need for further transactions.
On the other hand, when trading costs are mainly
proportional to the size of the trade—as for commis-
sions or taxes, for example—rebalancing to the
closest rebalancing boundary is optimal, minimizing
the size of the transaction. If both types of costs
exist, the optimal strategy is to rebalance to some
intermediate point. (See “The impact of rebalancing
costs on rebalancing strategy” on page 10.)

8/8/2019 Portfolio Re Balancing
http://slidepdf.com/reader/full/portfolio-re-balancing 10/15
Number 310 > Vanguard Investment Counseling & Research
The impact of rebalancing costs
on rebalancing strategy
In the previous sections, we addressed any potential
rebalancing costs implicitly by reporting the number
of rebalancing events and the turnover ratio. In this
section, we will discuss the implications of rebalanc-
ing costs on the rebalancing strategy.
Fixed costs (such as time and labor costs)
When trading costs are mainly fixed, independent of
the size of the trade, rebalancing to the target asset
allocation is optimal to avoid the need for further
transactions (Zakamouline, 2002). For nontaxable
mutual fund investors, the primary rebalancing cost
is the fixed cost.
Proportional costs (such as redemption
fees and taxes)
On the other hand, when trading costs are mainly
proportional to the size of the trade, rebalancingto the closest rebalancing boundary, which mini-
mizes the size of the transaction, is optimal
(Zakamouline, 2002).
If trading costs are lower for larger trade sizes,
then portfolios may be better off rebalancing closer
to the target asset allocation.
When both fixed and variable transaction costs
exist, the investor should rebalance to an intermedi-
ate point between the target asset allocation and the
rebalancing boundary (Zakamouline, 2002; Pliska and
Suzuki, 2004). Most investors with taxable accounts
incur both fixed and variable trading costs. However,
the tax impact can be significantly reduced through
customized strategies. In addition, the redemption
fees may not be relevant for most investors.
Higher rebalancintarget
Upper rebalancin
boundary
Target asset
allocation
Lower rebalancin
target
Lower rebalancin
boundary
Rebalancing occurs
D
C
Actual allocation
Maximum trade size
Figure 2. Optimal Rebalancing Rule With Fixed Costs
Source: Vanguard Investment Counseling & Research.
Figure 3. Optimal Rebalancing Rule With Proportional Costs
Rebalancing occursA
BActual asset allocation
Minimum trade sizeUpper rebalancing
boundary
Higher rebalancin
target
Target asset
allocation
Lower rebalancin
target
Lower rebalancin
boundarySource: Vanguard Investment Counseling & Research.

8/8/2019 Portfolio Re Balancing
http://slidepdf.com/reader/full/portfolio-re-balancing 11/15
Implementing a rebalancing strategy
In translating this conceptual rebalancing framework
into practical strategies, it’s important to recognize
two real-world limitations to the framework’s
assumptions. First, conventional wisdom among
financial practitioners suggests that investor prefer-
ences may be less precise than assumed by theory.
Institutional investors’ target asset allocations are
typically flexible within 5% to 10% ranges, indicating
that managers are mostly indifferent to small risk or
return deviations. Even if there are no rebalancing
costs, the typical institution may opt for wider rebal-
ancing thresholds and less frequent portfolio moni-
toring. Second, some costs of rebalancing—time,
labor, and market impact—are difficult to quantify.Such costs are often included indirectly in advisory
fees or reflected as trading restrictions, making it
difficult to explicitly consider rebalancing costs.
Practical strategies aim to capture the risk-control
benefits illustrated by our theoretical framework
while minimizing the cost of rebalancing. Rebalanc-
ing a portfolio with dividends, interest payments,realized capital gains, or new contributions can help
investors accomplish both goals. Tax-management
strategies can also be used to minimize any
tax impact.
Table 3 illustrates how dividend and interest pay-
ments can be used to reduce potential rebalancing
costs. The last column of the table shows a 60%
stock/40% bond portfolio that was rebalanced by
investing the portfolio’s dividend and interest pay-
ments in the underweighted asset class from 1960
to 2003. A manager who had simply redirected theportfolio’s income would have achieved most of the
risk-control benefits of more labor- and transaction-
intensive rebalancing strategies at a much lower cost.
Vanguard Investment Counseling & Research >Number 31
Table 3. Historical Performance of Alternative Rebalancing Rules for a 60% Equity/40% Bond Por tfolio (1960–2003)
Monitoring frequency Monthly Monthly Quar terly Annually Never Income
Threshold 0% 5% 5% 5% None None
Average equity allocation 60.055% 61.099% 61.014% 61.088% 74.366% 61.580%
Costs of rebalancing
Annual turnover 9.130% 2.130% 2.670% 2.110% 0% 0%
Number of rebalancing events 528 17 18 13 0 0
Absolute framework
Average return 9.509% 9.495% 9.669% 9.612% 9.655% 9.294%
Volatility 10.103% 10.182% 10.100% 10.165% 12.083% 10.126%
Worst 12-month return –28.592% –28.193% –26.990% –26.967% –31.096% –25.978%
Relative framework
Average excess return –0.013% 0.160% 0.103% 0.146% –0.215%
Volatility of excess return 0.371% 0.431% 0.763% 2.650% 1.067%
Worst 12-month excess return –1.331% –0.959% –1.955% –0.956% –0.454%Notes: Stocks are represented by the S&P 500 Index Monthly Dividend Reinvest (1960–1970) and Dow Jones Wilshire 5000 Index (1971–2003). Bonds are represented by the
Lehman Corporate Bond Index (1960–1972), Lehman Government/Credit Index (1973–1975), and Lehman Aggregate Bond Index (1976–2003). There were no new contributions
or withdrawals. There were no taxes. Except in the “Income” column, dividend payments were reinvested in equities and interest payments were reinvested in bonds.
The performance data shown represent past performance, which is not a guarantee of future results. Investment returns will fluctuate. This hypothetical illustration does not
represent the return on any particular investment.
Sources: Standard & Poor’s, Dow Jones, and Lehman Brothers; author’s calculations.

8/8/2019 Portfolio Re Balancing
http://slidepdf.com/reader/full/portfolio-re-balancing 12/15
For example, a portfolio that was monitored
monthly and rebalanced at 5% thresholds had 17
rebalancing events and annual portfolio turnover of
2.130%. The portfolio that was rebalanced with
redirected income had no rebalancing events and
portfolio turnover of 0%. For taxable investors, this
strategy was also very tax-efficient. The differences
in risk among the various rebalancing strategieswere very modest. One caution: The high levels
of dividends and interest rates during this 43-year
period may not be available in the future. An effec-
tive approach that doesn’t depend on the level
of dividends and bond yields is to use portfolio
contributions and withdrawals to rebalance the port-
folio. However, the potential tax consequences of
these transactions may require more customized
rebalancing strategies.
Table 3 also illustrates the interplay of the various
factors described in our conceptual rebalancingframework in a broadly diversified balanced portfolio
during the past 40-plus years. We present the results
for portfolios that were monitored monthly, quarterly,
or annually and rebalanced if the allocation deviated
more than 5% from the target asset allocation. We
also show the alternative of no rebalancing. Results
from the historical analysis are generally consistent
with the random-walk simulation results in Table 2.5,6
The relatively small differences in risk and return
among the various rebalancing strategies suggests
that the rebalancing strategies based on various
reasonable monitoring frequencies (every year or so)
and reasonable allocation thresholds (variations of
5% or so) may provide sufficient risk control relative
to the target asset allocations for most portfolios
with broadly diversified stock and bond holdings.There are two important qualifications to this
conclusion. First, this analysis assumes that some
approximation of the stock and bond markets’ histori-
cal return patterns, average returns, volatility, and low
return correlation can be expected to persist in the
future. Second, our analysis assumes that a portfolio
holds a broadly diversified set of liquid assets with
readily available market prices.7 These characteristics
don’t apply to some vehicles, such as hedge funds
or private equity investments. Managers of these
investment vehicles often require a lock-up period orprovide limited liquidity, limiting an investor’s ability
to rebalance by selling an asset that has grown too
large or by buying an asset that has fallen below its
target weighting. Also, these investments, as well as
alternatives such as directly held real estate, may
report returns based on appraisal, rather than market
pricing, which adds an element of subjectivity to the
measure of an asset’s weight in a portfolio. In such
cases, our quantitative analysis may serve as a guide
to qualitative judgment.
Number 312 > Vanguard Investment Counseling & Research
5 One anomaly—in this case, a positive anomaly—is the quarterly rebalancing strategy, which had a higher level of annualized excess return than strategies that
rebalanced portfolios more or less frequently, or not at all. Oddly enough, the quarterly strategy also had a lower standard deviation and smaller maximum
12-month loss than portfolios that were rebalanced more frequently and a smaller maximum loss than a portfolio that was rebalanced more frequently. The
anomalous results are the exception, rather than an actionable insight, that supports our general conclusions about rebalancing and risk control.
6 The absolute-return framework shows that more frequent rebalancing produced lower returns and lower volatility, but a higher maximum 12-month loss. This
seemingly inconsistent result represents an instance of rebalancing in a downward-trending market, from September 1973 to September 1974. As noted earlier,
rebalancing in a downward-trending market implies continually buying more of the asset that is performing worst. In judging the two risk measures presented in
Table 2, it’s worth remembering that the worst 12-month loss during the past 43 years represented just one moment in time. The annualized standard deviation
of return summarizes portfolio volatility during the entire historical time period.
7 A concentrated or an aggressive, actively managed portfolio of stocks and bonds may also behave differently from our illustrated examples. Such portfolios tend
to be more volatile than broadly diversified stock and bond portfolios (Tokat, 2005), requiring more frequent rebalancing to maintain similar risk control relative to
the target asset allocation.

8/8/2019 Portfolio Re Balancing
http://slidepdf.com/reader/full/portfolio-re-balancing 13/15
Conclusion
To ensure that a portfolio’s risk and return character-
istics remain consistent over time, a portfolio must
be rebalanced. The appropriate rebalancing strategy
depends on a number of factors such as the market
environment and asset-class characteristics. Rebal-
ancing achieves the goal of risk control relative to
the target asset allocation in all market environ-
ments. Although market return patterns may create
opportunities for tactical rebalancing, this active
strategy is challenging.
Based on reasonable expectations about return
patterns, average returns, risk, and correlations, we
conclude that for most broadly diversified stock and
bond fund portfolios, annual or semiannual monitor-
ing, with rebalancing at 5% thresholds, produces
an acceptable balance between risk control and
cost minimization. To the extent possible, this
rebalancing strategy should be carried out by appro-priately redirecting interest income, dividends, new
contributions, and withdrawals.
Vanguard Investment Counseling & Research >Number 31

8/8/2019 Portfolio Re Balancing
http://slidepdf.com/reader/full/portfolio-re-balancing 14/15
References
Campbell, John Y., Andrew W. Lo, and A. Craig
MacKinlay, 1996. The Econometrics of Financial
Markets. Princeton, N.J.: Princeton University
Press. 632 p.
Leland, Hayne E., 1999. Optimal Portfolio
Management With Transactions Costs and Capital
Gains Taxes. Berkeley, Ca.: Institute of Business and
Economic Research, University of California. 49 p.
Research Program in Finance Working Paper No. 290.
Liu, Hong, and Mark Loewenstein, 2002. Optimal
Portfolio Selection With Transaction Costs and Finite
Horizons. Review of Financial Studies 15:805-35.
Pliska, Stanley R., and Kiyoshi Suzuki, 2004.
Optimal Tracking for Asset Allocation With Fixed
and Proportional Transaction Costs. Quantitative
Finance 4(2):233-43.
Tokat, Yesim, 2005. The Asset Allocation Debate:
Provocative Questions, Enduring Realities. Valley
Forge, Pa.: Investment Counseling & Research,The Vanguard Group. 12 p.
Zakamouline, Valeri I., 2002. Optimal Portfolio
Selection With Transaction Costs for a CARA
Investor With Finite Horizon. Bergen, Norway:
Institute of Finance and Management Science,
Norwegian School of Economics and Business
Administration. 36 p.
Number 314 > Vanguard Investment Counseling & Research
8/8/2019 Portfolio Re Balancing
http://slidepdf.com/reader/full/portfolio-re-balancing 15/15
Vanguard Investment
Counseling & Research
P.O. Box 2600
Valley Forge, PA 19482-2600
Connect with Vanguard™ > www.vanguard.com > 800-523-1036
For more information about Vanguard funds,
visit www.vanguard.com, or call 800-662-7447,
to obtain a prospectus. Investment objectives,risks, charges, expenses, and other important
information about a fund are contained in the
prospectus; read and consider it carefully
before investing.
Connect with Vanguard, Vanguard, and the ship logo are
trademarks of The Vanguard Group, Inc. All other marks are
the exclusive property of their respective owners.
Vanguard Investment Counseling & Research
Catherine D. Gordon/Principal/Department Head
Joseph H. Davis, Ph.D./PrincipalFrancis M. Kinniry Jr., CFA/Principal
Daniel W. Wallick/Principal
Nelson W. Wicas, Ph.D./Principal
Frank J. Ambrosio, CFA
John Ameriks, Ph.D.
Donald G. Bennyhoff
Scott J. Donaldson, CFA, CFP®
Colleen M. Jaconetti, CFP, CPA
Kushal Kshirsagar, Ph.D.
Christopher B. Philips
Glenn Sheay, CFA
Kimberly A. Stockton
Yesim Tokat, Ph.D.
David J. Walker, CFA
© 2006 The Vanguard Group, Inc.
All rights reserved.
Vanguard Marketing Corporation, Distributor.