PORTFOLIO ADDITIONAL ESTIMATES STATEMENTS 2012 … · Immigration and Citizenship Portfolio logo,...
143
PORTFOLIO ADDITIONAL ESTIMATES STATEMENTS 2012-13 IMMIGRATION AND CITIZENSHIP PORTFOLIO EXPLANATIONS OF ADDITIONAL ESTIMATES 2012-13
Transcript of PORTFOLIO ADDITIONAL ESTIMATES STATEMENTS 2012 … · Immigration and Citizenship Portfolio logo,...

PORTFOLIO ADDITIONAL ESTIMATES STATEMENTS 2012-13 IMMIGRATION AND CITIZENSHIP PORTFOLIO EXPLANATIONS OF ADDITIONAL ESTIMATES 2012-13

© Commonwealth of Australia 2013
ISBN 978-0-9871132-8-3
This publication is available for your use under a Creative Commons BY Attribution
3.0 Australia licence, with the exception of the Commonwealth Coat of Arms, the
Immigration and Citizenship Portfolio logo, photographs, images, signatures and
where otherwise stated. The full licence terms are available from http://creativecommons.org/licenses/by/3.0/au/legalcode.
Use of Immigration and Citizenship Portfolio material under a Creative Commons BY
Attribution 3.0 Australia licence requires you to attribute the work (but not in any way
that suggests that the Department endorses you or your use of the work);
Immigration and Citizenship Portfolio material used 'as supplied'
Provided you have not modified or transformed Immigration and Citizenship
Portfolio material in any way including, for example, by changing the Immigration
and Citizenship Portfolio text; calculating percentage changes; graphing or charting
data; or deriving new statistics from published Immigration and Citizenship Portfolio
statistics – then Immigration and Citizenship Portfolio prefers the following
attribution:
Source: The Australian Government Immigration and Citizenship Portfolio
Derivative material
If you have modified or transformed Immigration and Citizenship Portfolio material,
or derived new material from those of the Immigration and Citizenship Portfolio in
any way, then Immigration and Citizenship Portfolio prefers the following attribution:
Based on The Australian Government Immigration and Citizenship Portfolio data
Use of the Coat of Arms
The terms under which the Coat of Arms can be used are set out on the It’s an Honour
website (see www.itsanhonour.gov.au)
Other Uses
Inquiries regarding this licence or any questions regarding this publication please
contact Stephen Sheehan, Chief Financial Officer in the Department of Immigration
and Citizenship on (02) 6264 1235.
A copy of this document can be located on the Australian Government Budget website
at: http://www.budget.gov.au.

The Hon Brendan O’Connor MP Minister for Immigration and Citizenship
President of the Senate Australian Senate Parliament House CANBERRA ACT 2600 Speaker House of Representatives Parliament House CANBERRA ACT 2600
Dear Mr President Dear Ms Speaker
I hereby submit Portfolio Additional Estimates Statements in support of the additional appropriations being sought for the Immigration and Citizenship Portfolio through Appropriation Bill (No. 3) 2012-13 and Appropriation Bill (No. 4) 2012-13.
These statements have been developed, and are submitted to the Parliament, as a statement on the funding requirements being sought for the portfolio.
I present these statements to provide accountability to the Parliament and, through it, the public. Yours sincerely
BRENDAN O’CONNOR
Parliament House Canberra ACT 2600 Telephone (02) 6277 7667 Fax (02) 6273 9395

iv
Abbreviations and conventions
The following notations may be used:
NEC/nec not elsewhere classified
- nil
.. not zero, but rounded to zero
na not applicable (unless otherwise specified)
nfp not for publication
$m $ million
Figures in tables and in the text may be rounded. Figures in text are generally rounded
to one decimal place, whereas figures in tables are generally rounded to the nearest
thousand. Discrepancies in tables between totals and sums of components are due to
rounding.
USER GUIDE TO THE
PORTFOLIO ADDITIONAL ESTIMATES STATEMENTS


vii
USER GUIDE
USER GUIDE
The purpose of the Portfolio Additional Estimates Statements (PAES), like that of the
Portfolio Budget Statements (PB Statements), is to inform Senators and Members of
Parliament of the proposed allocation of resources to Government outcomes by
agencies within the portfolio. The focus of the PAES differs from the PB Statements in
one important aspect. While the PAES include an Agency Resource Statement to
inform Parliament of the revised estimate of the total resources available to an agency,
the focus of the PAES is on explaining the changes in resourcing by outcome(s) since
the Budget. As such, the PAES provides information on new measures and their
impact on the financial and/or non-financial planned performance of programs
supporting those outcomes.
The PAES facilitate understanding of the proposed appropriations in Appropriation
Bills (No. 3 and No. 4) 2012-13. In this sense the PAES is declared by the Additional
Estimates Appropriation Bills to be a relevant document to the interpretation of the
Bills according to section 15AB of the Acts Interpretation Act 1901.
Whereas the Mid-Year Economic and Fiscal Outlook 2012-13 is a mid-year budget report
which provides updated information to allow the assessment of the Government’s
fiscal performance against its fiscal strategy, the PAES update the most recent budget
appropriations for agencies within the portfolio.

viii
STRUCTURE OF THE PORTFOLIO ADDITIONAL ESTIMATES STATEMENTS
The PAES are presented in three parts with subsections.
User guide
Provides a brief introduction explaining the purpose of the PAES.
Portfolio overview
Provides an overview of the portfolio, including a chart that outlines the outcomes for agencies
in the portfolio.
Agency additional estimates statements
A statement (under the name of the agency) for each agency affected by Additional
Estimates.
Section 1: Agency
overview and resources
This section details the total resources available to an agency,
the impact of any measures since Budget, and impact on
Appropriation Bills No. 3 and No. 4.
Section 2: Revisions to
outcomes and planned
performance
This section details changes to Government outcomes and/or
changes to the planned performance of agency programs.
Section 3: Explanatory
tables and budgeted
financial statements
This section contains updated explanatory tables on special
account flows and staffing levels and revisions to the budgeted
financial statements.
Glossary Explains key terms relevant to the Portfolio.
Index (Optional) Alphabetical guide to the Statements

ix
CONTENTS
Portfolio Overview......................................................................................................... 3
Department of Immigration and Citizenship .............................................................. 9
Migration Review Tribunal and Refugee Review Tribunal .................................... 109
Glossary ..................................................................................................................... 129
Acronyms ................................................................................................................... 132


PORTFOLIO OVERVIEW

Portfolio Overview
3
PORTFOLIO OVERVIEW
There have been no significant changes to the functions of the Immigration and
Citizenship Portfolio during 2012-13. A full outline of Immigration and Citizenship’s
Portfolio Overview can be found in the Portfolio Budget Statements 2012-13.
The portfolio agencies – both of which are Financial Management and Accountability Act
1997 (FMA Act) entities – are:
the Department of Immigration and Citizenship (DIAC)—a department of state
and
the Migration Review Tribunal and Refugee Review Tribunal (MRT-RRT)—a
prescribed agency.
ADDITIONAL ESTIMATES AND VARIATIONS—PORTFOLIO LEVEL
DIAC:
DIAC is seeking additional resourcing of $92.664 million.
The additional funding for DIAC comprises:
$73.276 million for Administered programs; and
$19.388 million for Departmental programs.
The revised funding requirements by agency outcome and their impact on
appropriations are detailed in the Agency Resource Statement section of this
document.
MRT-RRT:
The Migration Review Tribunal and Refugee Review Tribunal are seeking additional
funding of $4.663 million.
Portfolio Overview
4
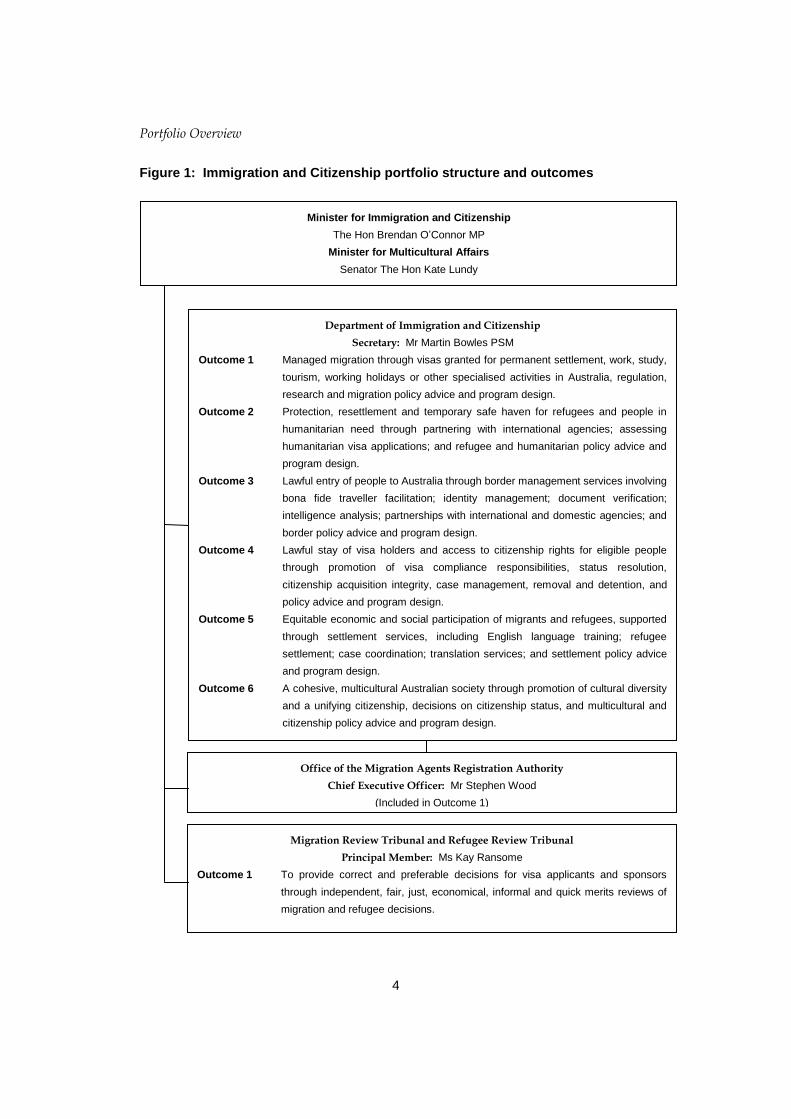
Figure 1: Immigration and Citizenship portfolio structure and outcomes
Minister for Immigration and Citizenship
The Hon Brendan O’Connor MP
Minister for Multicultural Affairs
Senator The Hon Kate Lundy
Migration Review Tribunal and Refugee Review Tribunal
Principal Member: Ms Kay Ransome
Outcome 1 To provide correct and preferable decisions for visa applicants and sponsors
through independent, fair, just, economical, informal and quick merits reviews of
migration and refugee decisions.
Department of Immigration and Citizenship
Secretary: Mr Martin Bowles PSM
Outcome 1 Managed migration through visas granted for permanent settlement, work, study,
tourism, working holidays or other specialised activities in Australia, regulation,
research and migration policy advice and program design.
Outcome 2 Protection, resettlement and temporary safe haven for refugees and people in
humanitarian need through partnering with international agencies; assessing
humanitarian visa applications; and refugee and humanitarian policy advice and
program design.
Outcome 3 Lawful entry of people to Australia through border management services involving
bona fide traveller facilitation; identity management; document verification;
intelligence analysis; partnerships with international and domestic agencies; and
border policy advice and program design.
Outcome 4 Lawful stay of visa holders and access to citizenship rights for eligible people
through promotion of visa compliance responsibilities, status resolution,
citizenship acquisition integrity, case management, removal and detention, and
policy advice and program design.
Outcome 5 Equitable economic and social participation of migrants and refugees, supported
through settlement services, including English language training; refugee
settlement; case coordination; translation services; and settlement policy advice
and program design.
Outcome 6 A cohesive, multicultural Australian society through promotion of cultural diversity
and a unifying citizenship, decisions on citizenship status, and multicultural and
citizenship policy advice and program design.
Office of the Migration Agents Registration Authority
Chief Executive Officer: Mr Stephen Wood
(Included in Outcome 1)
Portfolio Overview
5
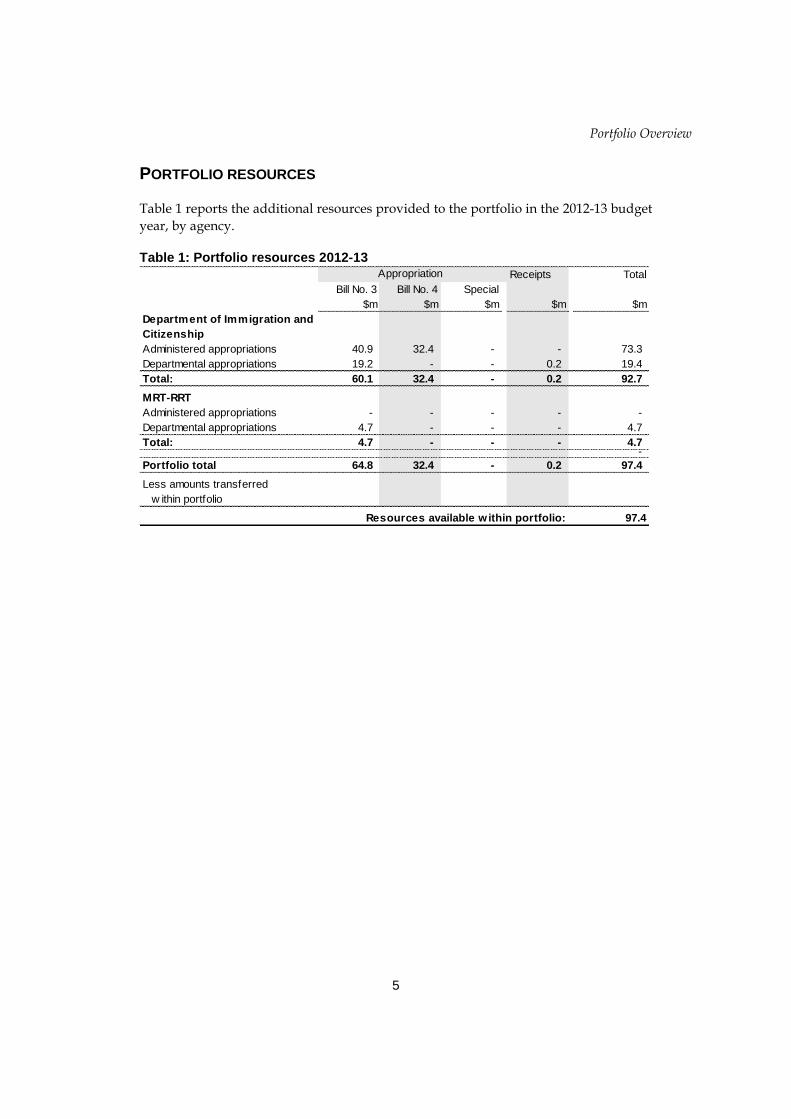
PORTFOLIO RESOURCES
Table 1 reports the additional resources provided to the portfolio in the 2012-13 budget
year, by agency.
Table 1: Portfolio resources 2012-13
Receipts Total
Bill No. 3 Bill No. 4 Special
$m $m $m $m $m
Department of Immigration and
Citizenship
Administered appropriations 40.9 32.4 - - 73.3
Departmental appropriations 19.2 - - 0.2 19.4
Total: 60.1 32.4 - 0.2 92.7
MRT-RRT
Administered appropriations - - - - -
Departmental appropriations 4.7 - - - 4.7
Total: 4.7 - - - 4.7 -
Portfolio total 64.8 32.4 - 0.2 97.4
Less amounts transferred
w ithin portfolio
Resources available w ithin portfolio: 97.4
Appropriation


AGENCY ADDITIONAL ESTIMATES
STATEMENTS
Department of Immigration and Citizenship .............................................................. 9
Migration Review Tribunal and Refugee Review Tribunal .................................... 109

9
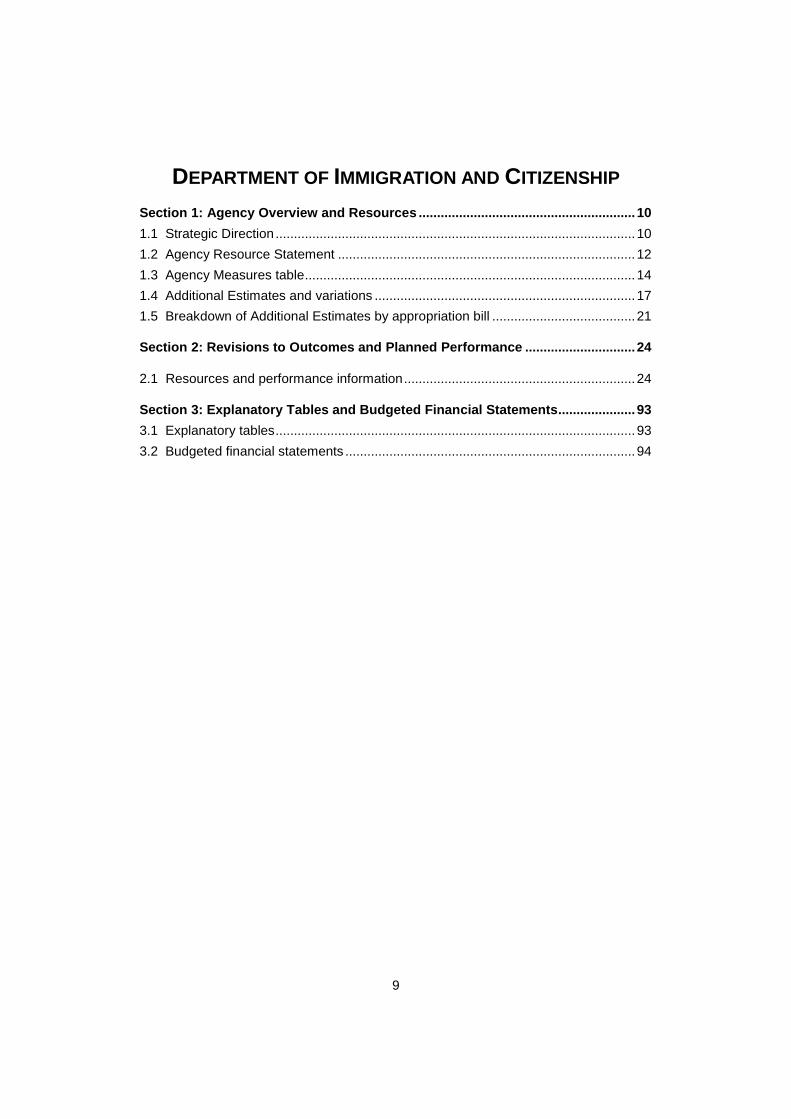
DEPARTMENT OF IMMIGRATION AND CITIZENSHIP
Section 1: Agency Overview and Resources ........................................................... 10
1.1 Strategic Direction .................................................................................................. 10
1.2 Agency Resource Statement ................................................................................. 12
1.3 Agency Measures table .......................................................................................... 14
1.4 Additional Estimates and variations ....................................................................... 17
1.5 Breakdown of Additional Estimates by appropriation bill ....................................... 21
Section 2: Revisions to Outcomes and Planned Performance .............................. 24
2.1 Resources and performance information ............................................................... 24
Section 3: Explanatory Tables and Budgeted Financial Statements ..................... 93
3.1 Explanatory tables .................................................................................................. 93
3.2 Budgeted financial statements ............................................................................... 94
DIAC Additional Estimates Statements
10
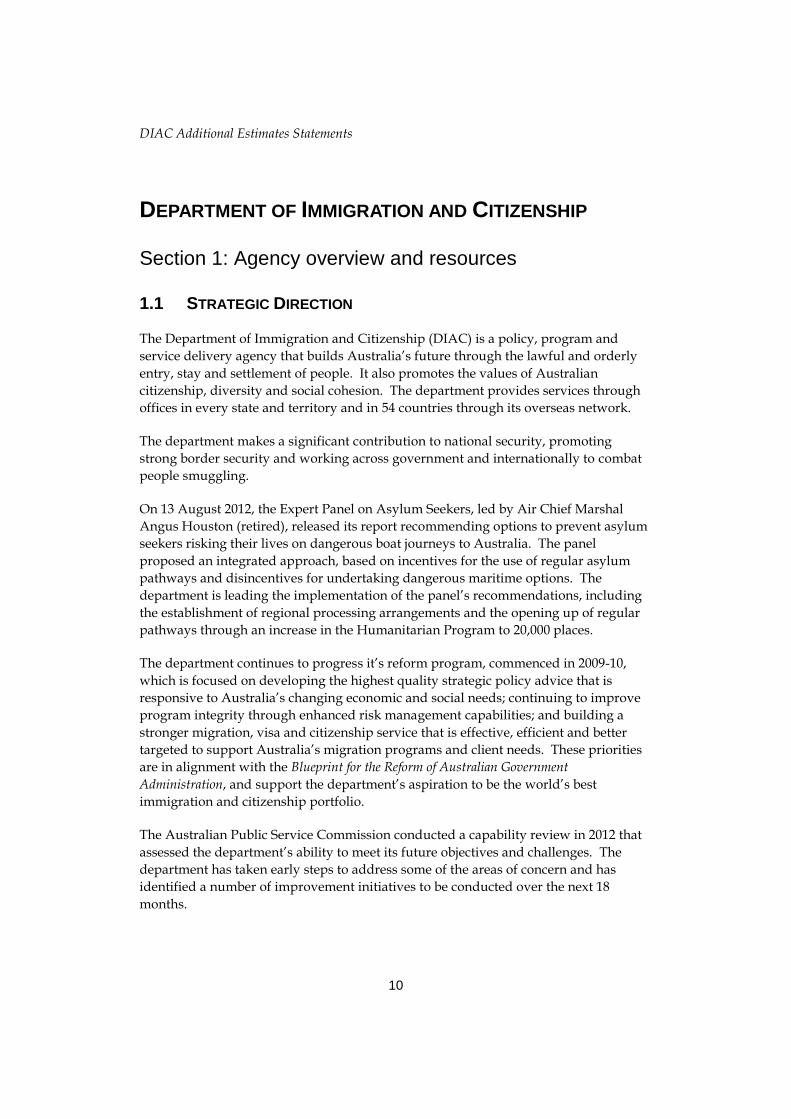
DEPARTMENT OF IMMIGRATION AND CITIZENSHIP
Section 1: Agency overview and resources
1.1 STRATEGIC DIRECTION
The Department of Immigration and Citizenship (DIAC) is a policy, program and
service delivery agency that builds Australia’s future through the lawful and orderly
entry, stay and settlement of people. It also promotes the values of Australian
citizenship, diversity and social cohesion. The department provides services through
offices in every state and territory and in 54 countries through its overseas network.
The department makes a significant contribution to national security, promoting
strong border security and working across government and internationally to combat
people smuggling.
On 13 August 2012, the Expert Panel on Asylum Seekers, led by Air Chief Marshal
Angus Houston (retired), released its report recommending options to prevent asylum
seekers risking their lives on dangerous boat journeys to Australia. The panel
proposed an integrated approach, based on incentives for the use of regular asylum
pathways and disincentives for undertaking dangerous maritime options. The
department is leading the implementation of the panel’s recommendations, including
the establishment of regional processing arrangements and the opening up of regular
pathways through an increase in the Humanitarian Program to 20,000 places.
The department continues to progress it’s reform program, commenced in 2009-10,
which is focused on developing the highest quality strategic policy advice that is
responsive to Australia’s changing economic and social needs; continuing to improve
program integrity through enhanced risk management capabilities; and building a
stronger migration, visa and citizenship service that is effective, efficient and better
targeted to support Australia’s migration programs and client needs. These priorities
are in alignment with the Blueprint for the Reform of Australian Government
Administration, and support the department’s aspiration to be the world’s best
immigration and citizenship portfolio.
The Australian Public Service Commission conducted a capability review in 2012 that
assessed the department’s ability to meet its future objectives and challenges. The
department has taken early steps to address some of the areas of concern and has
identified a number of improvement initiatives to be conducted over the next 18
months.

DIAC Additional Estimates Statements
11
During 2012-13, the strategic priorities of the department are to:
contribute to Australia’s economic, labour market, social and environmental
objectives through a holistic long-term planning framework for temporary and
permanent migration
respond to the challenges of displacement and irregular migration through
administering Australia’s Humanitarian Program and close engagement with
regional immigration and border control agencies, relevant international
organisations and through the Regional Cooperation Framework
implement the recommendations of the Expert Panel, including regional
processing arrangements
strengthen the department’s organisational capability
strengthen identity management through increased use of biometrics and risk
analytics to facilitate bona fide entry and enhance border management
continue the process of modernising the delivery of immigration and citizenship
services through a range of more efficient client-centric service delivery channels
that include Service Centres, Service Delivery Partners, e-business initiatives,
and more strategic work placement with a strong focus on centralised electronic
processing of high volume, low risk caseloads
build a more mature capacity to detect, measure and mitigate risk across the
department’s full operations, including identifying program risks, and more
accurate targeting and resolution of potentially high risk cases
achieve substantive outcomes for unlawful non-citizens in a lawful, timely, fair
and reasonable way, and treat people in immigration detention fairly and
reasonably in accordance with our obligations
continue work associated with simplifying the visa system to make it responsive
to changing needs, cost-effective and easier to understand
continue to promote the benefits of a united and diverse society through
programs that support and enhance social cohesion
enhance analysis, research and evaluation capacity to provide innovative and
quality advice to government on current and emerging policy and program
issues
consolidate changes to the skilled migration program to ensure it is responsive
to economic cycles, the needs of industry and employers, and better addresses
the nation’s future skill needs.

DIAC Additional Estimates Statements
12
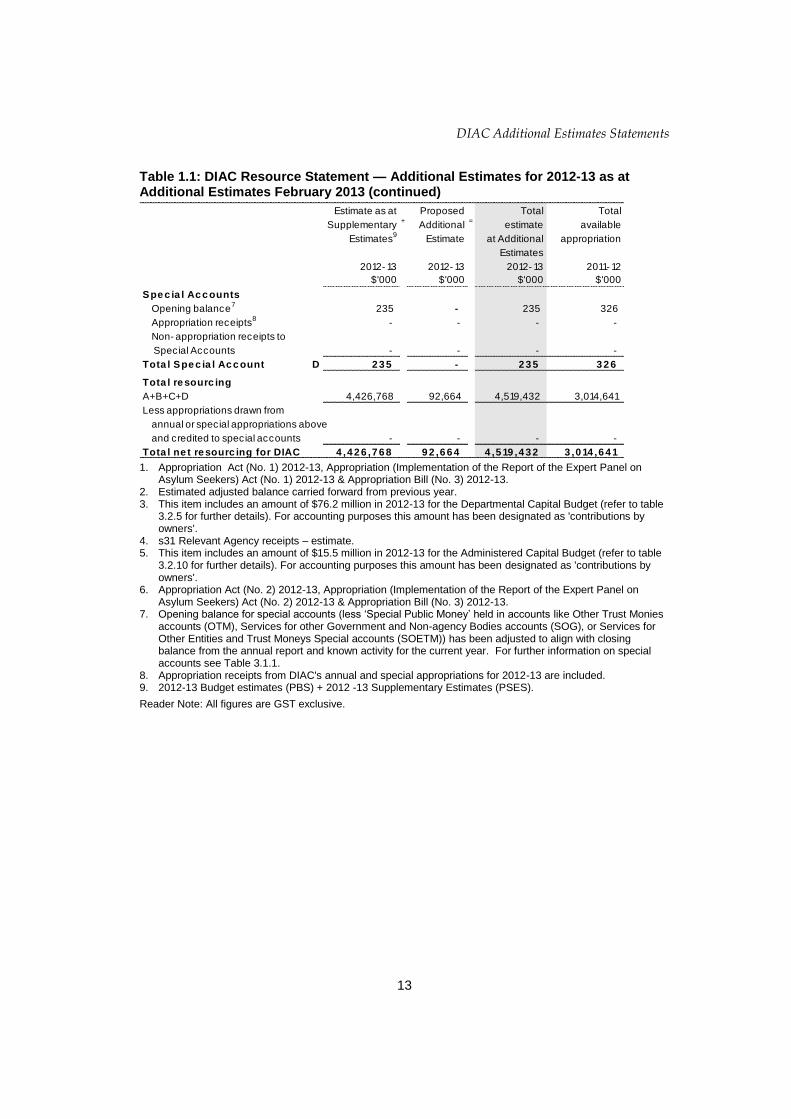
1.2 AGENCY RESOURCE STATEMENT
The Agency Resource Statement details the resourcing for the Department of
Immigration and Citizenship at Additional Estimates. Table 1.1 outlines the total
resourcing available from all sources for the 2012-13 Budget year, including variations
through Appropriation Bills No. 3 and No. 4, special appropriations and special
accounts.
Table 1.1: DIAC Resource Statement — Additional Estimates for 2012-13 as at Additional Estimates February 2013
Estimate as at Proposed Total Total
Supplementary+
Additional=
estimate at available
Estimates9
Estimate Additional appropriation
Estimates
2012- 13 2012- 13 2012- 13 2011- 12
$'000 $'000 $'000 $'000
Ordina ry a nnua l se rvic e s1
De pa rtme nta l a ppropria tion
Prior year departmental appropriation2 115,166 - 115,166 -
Departmental appropriation3 1,515,066 19,177 1,534,243 1,436,973
s31 Relevant agency receipts4 56,605 211 56,816 101,725
Tota l 1,6 8 6 ,8 3 7 19 ,3 8 8 1,7 0 6 ,2 2 5 1,5 3 8 ,6 9 8
Administe re d e xpe nse s
Outcome 1 50 - 50 50
Outcome 2 41,128 - 41,128 37,169
Outcome 3 - - - 168
Outcome 45 1,995,334 32,699 2,028,033 1,067,491
Outcome 5 407,932 8,183 416,115 329,642
Outcome 6 2,757 - 2,757 5,433
Tota l 2 ,4 4 7 ,2 0 1 4 0 ,8 8 2 2 ,4 8 8 ,0 8 3 1,4 3 9 ,9 5 3
Tota l ordina ry a nnua l se rvic e s A 4 ,13 4 ,0 3 8 6 0 ,2 7 0 4 ,19 4 ,3 0 8 2 ,9 7 8 ,6 5 1
Othe r se rvic e s6
De pa rtme nta l non- ope ra ting
Equity injections 25,115 - 25,115 11,698
Tota l 2 5 ,115 - 2 5 ,115 11,6 9 8
Administe re d non- ope ra ting
Administered assets and liabilities 267,380 32,394 299,774 23,966
Tota l 2 6 7 ,3 8 0 3 2 ,3 9 4 2 9 9 ,7 7 4 2 3 ,9 6 6
Tota l othe r se rvic e s B 2 9 2 ,4 9 5 3 2 ,3 9 4 3 2 4 ,8 8 9 3 5 ,6 6 4
Tota l a va ila ble a nnua l
a ppropria tions 4 ,4 2 6 ,5 3 3 9 2 ,6 6 4 4 ,5 19 ,19 7 3 ,0 14 ,3 15
Spe c ia l a ppropria tions
Spe c ia l a ppropria tions limite d
by c rite ria /e ntitle me nt
Migration Act 1958, section 332B - - - -
Tota l spe c ia l a ppropria tions C - - - -
Tota l a ppropria tions e xc luding
Spe c ia l Ac c ounts 4 ,4 2 6 ,5 3 3 9 2 ,6 6 4 4 ,5 19 ,19 7 3 ,0 14 ,3 15 Continued on next page
DIAC Additional Estimates Statements
13
Table 1.1: DIAC Resource Statement — Additional Estimates for 2012-13 as at Additional Estimates February 2013 (continued)
Estimate as at Proposed Total Total
Supplementary+
Additional=
estimate available
Estimates9
Estimate at Additional appropriation
Estimates
2012- 13 2012- 13 2012- 13 2011- 12
$'000 $'000 $'000 $'000
Spe c ia l Ac c ounts
Opening balance7
235 - 235 326
Appropriation receipts8
- - - -
Non- appropriation receipts to
Special Accounts - - - -
Tota l Spe c ia l Ac c ount D 2 3 5 - 2 3 5 3 2 6
Tota l re sourc ing
A+B+C+D 4,426,768 92,664 4,519,432 3,014,641
Less appropriations drawn from
annual or special appropriations above
and credited to special accounts - - - -
Tota l ne t re sourc ing for DIAC 4 ,4 2 6 ,7 6 8 9 2 ,6 6 4 4 ,5 19 ,4 3 2 3 ,0 14 ,6 4 1 1. Appropriation Act (No. 1) 2012-13, Appropriation (Implementation of the Report of the Expert Panel on
Asylum Seekers) Act (No. 1) 2012-13 & Appropriation Bill (No. 3) 2012-13. 2. Estimated adjusted balance carried forward from previous year. 3. This item includes an amount of $76.2 million in 2012-13 for the Departmental Capital Budget (refer to table
3.2.5 for further details). For accounting purposes this amount has been designated as 'contributions by owners'.
4. s31 Relevant Agency receipts – estimate. 5. This item includes an amount of $15.5 million in 2012-13 for the Administered Capital Budget (refer to table
3.2.10 for further details). For accounting purposes this amount has been designated as 'contributions by owners'.
6. Appropriation Act (No. 2) 2012-13, Appropriation (Implementation of the Report of the Expert Panel on Asylum Seekers) Act (No. 2) 2012-13 & Appropriation Bill (No. 3) 2012-13.
7. Opening balance for special accounts (less ‘Special Public Money’ held in accounts like Other Trust Monies accounts (OTM), Services for other Government and Non-agency Bodies accounts (SOG), or Services for Other Entities and Trust Moneys Special accounts (SOETM)) has been adjusted to align with closing balance from the annual report and known activity for the current year. For further information on special accounts see Table 3.1.1.
8. Appropriation receipts from DIAC's annual and special appropriations for 2012-13 are included. 9. 2012-13 Budget estimates (PBS) + 2012 -13 Supplementary Estimates (PSES).
Reader Note: All figures are GST exclusive.

DIAC Additional Estimates Statements
14
1.3 Agency Measures Table
Table 1.2 summarises new Government measures taken since the 2012-13 Budget except
for measures funded through the Appropriation (Implementation of the Report of the
Expert Panel on Asylum Seekers) Act (No.1) 2012-13 and Appropriation (Implementation
of the Report of the Expert Panel on Asylum Seekers) Act (No.2) 2012-13 which were
published in the Portfolio Supplementary Estimates Statements (PSES) 2012-13 which was
tabled on 29 October 2012. The table is split into revenue, expense and capital measures,
with the affected program identified.
Table 1.2: DIAC 2012-13 Measures since Budget (excluding PSES)
Program 2012-13 2013-14 2014-15 2015-16
$'000 $'000 $'000 $'000
Revenue measures
Response to the expert panel
- Permanent migration program - additional
family stream places from 2012-13
Administered revenues 1.1 3,914 4,012 4,112 4,215
Departmental revenues - - - -
Total 3,914 4,012 4,112 4,215
Visa Application Charges - targeted
increases
Administered revenues 1.1 52,240 143,022 156,243 168,957
Departmental revenues - - - -
Total 52,240 143,022 156,243 168,957
2015 Asian Football Cup1
Administered revenues 1.1 - - 4,655 -
Departmental revenues - - - -
Total - - 4,655 -
2015 Cricket World Cup1
Administered revenues 1.1 - - 2,915 -
Departmental revenues - - - -
Total - - 2,915 -
Australia in the Asian century
- Work and Holiday Visa Program - addition
of new capped places1
Administered revenues 1.1 500 513 526 539
Departmental revenues - - - -
Total 500 513 526 539
Private Sponsorship of Humanitarian
Entrants Pilot Program1
Administered revenues 1.1 2,623 2,683 - -
Departmental revenues - - - -
Total 2,623 2,683 - -
Total revenue measures
Administered 59,277 150,230 168,451 173,711
Departmental - - - -
Total 59,277 150,230 168,451 173,711 Continued on next page

DIAC Additional Estimates Statements
15
Table 1.2: DIAC 2012-13 Measures since Budget (excluding PSES) (continued)
Program 2012-13 2013-14 2014-15 2015-16
$'000 $'000 $'000 $'000
Expense measures
2015 Asian Football Cup1
Administered expenses 4.1 - - 11 22
Departmental expenses Various - - 2,283 183
Total - - 2,294 205
2015 Cricket World Cup1
Administered expenses 4.1 - - 12 24
Departmental expenses Various - - 1,758 190
Total - - 1,770 214
Australia in the Asian century
- Work and Holiday Visa Program - addition
of new capped places1
Administered expenses - - - -
Departmental expenses 1.1 63 64 65 65
Total 63 64 65 65
Targeted savings - public service
eff iciencies
Administered expenses - - - -
Departmental expenses All (6,667) (6,653) (6,653) (6,653)
Total (6,667) (6,653) (6,653) (6,653)
Counter People Smuggling
Communications1
Administered expenses - - - -
Departmental expenses 4.3 1,862 - - -
Total 1,862 - - -
Fire Service Levy - reduction2
Administered expenses - - - -
Departmental expenses All (1,343) (1,402) (1,466) (1,466)
Total (1,343) (1,402) (1,466) (1,466)
Biometrics - introduction into selected
Australian visa processing arrangements
overseas
Administered expenses - - - -
Departmental expenses - - - -
Total - - - -
Response to the expert panel
- Irregular Migration - research
Administered expenses - - - -
Departmental expenses - - - -
Total - - - -
Total expense measures
Administered - - 23 46
Departmental (6,085) (7,991) (4,013) (7,681)
Total (6,085) (7,991) (3,990) (7,635)

DIAC Additional Estimates Statements
16
Table 1.2: DIAC 2012-13 Measures since Budget (excluding PSES) (continued)
Program 2012-13 2013-14 2014-15 2015-16
$'000 $'000 $'000 $'000
Capital measures
Immigration Detention Netw ork
- Enhanced accomodation capacity1
Administered capital 4.3 15,675 - - -
Departmental capital - - - -
Total 15,675 - - -
Total capital measures
Administered 15,675 - - -
Departmental - - - -
Total 15,675 - - - 1. Measure relates to a decision made post 2012 -13 MYEFO. 2. Measure was announced in the 2012-13 Budget but has not previously been reported in a portfolio
statement. This statement has been prepared on an Australian Accounting Standards basis.

DIAC Additional Estimates Statements
17
1.4 Additional Estimates and Variations
The following tables detail the changes to the resourcing for the Department of
Immigration and Citizenship at Additional Estimates, by outcome. Table 1.3 details the
Additional Estimates and variations resulting from new measures since the 2012-13
Budget in Appropriation Bills No. 3 and No. 4. Table 1.4 details Additional Estimates or
variations through other factors, such as parameter adjustments.
Table 1.3: Additional estimates and variations to Outcomes from measures since 2012-13 Budget (excluding PSES)
Program 2012-13 2013-14 2014-15 2015-16
impacted $'000 $'000 $'000 $'000
Outcome 1
Increase in estimates (departmental)
2015 Asian Football Cup1 1.1 - - 1,593 -
2015 Cricket World Cup1 1.1 - - 1,027 -
Australia in the Asian century
- Work and Holiday Visa Program -
addition of new capped places1 1.1 63 64 65 65
Decrease in estimates (departmental)
Fire Service Levy - reduction2 1.1 (616) (643) (672) (672)
Targeted savings - public service
eff iciencies 1.1 (3,056) (3,050) (3,050) (3,050)
Net impact on estimates
for Outcome 1 (departmental) (3,609) (3,629) (1,037) (3,657)
Outcome 2
Increase in estimates (departmental)
2015 Asian Football Cup1 2.1 - - 178 183
2015 Cricket World Cup1 2.1 - - 188 190
Decrease in estimates (departmental)
Fire Service Levy - reduction2 2.1 (81) (84) (88) (88)
Targeted savings - public service
eff iciencies 2.1 (400) (400) (400) (400)
Net impact on estimates
for Outcome 2 (departmental) (481) (484) (122) (115)
Outcome 3
Increase in estimates (departmental)
2015 Asian Football Cup1 3.1 - - 134 -
2015 Cricket World Cup1 3.1 - - 543 -
Decrease in estimates (departmental)
Fire Service Levy - reduction2 3.1 (132) (137) (144) (144)
Targeted savings - public service
eff iciencies 3.1 (653) (652) (652) (652)
Net impact on estimates
for Outcome 3 (departmental) (785) (789) (119) (796) Continued on next page

DIAC Additional Estimates Statements
18
Table 1.3: Additional estimates and variations to Outcomes from measures since 2012-13 Budgets (excluding PSES) (continued)
Program 2012-13 2013-14 2014-15 2015-16
impacted $'000 $'000 $'000 $'000
Outcome 4
Increase in estimates (administered)
2015 Asian Football Cup1 4.1 - - 11 22
2015 Cricket World Cup1 4.1 - - 12 24
Net impact on estimates
for Outcome 4 (administered) - - 23 46
Increase in estimates (departmental)
Counter People Smuggling
Communications 1 4.3 1,862 - - -
2015 Asian Football Cup1 4.1 - - 378 -
Decrease in estimates (departmental)
Fire Service Levy - reduction2 4.1 - 4.5 (369) (385) (403) (403)
Targeted savings - public service
eff iciencies 4.1 - 4.5 (1,831) (1,826) (1,826) (1,826)
Net impact on estimates
for Outcome 4 (departmental) (338) (2,211) (1,851) (2,229)
Outcome 5
Decrease in estimates (departmental)
Fire Service Levy - reduction2 5.1 (66) (69) (73) (73)
Targeted savings - public service
eff iciencies 5.1 (332) (331) (331) (331)
Net impact on estimates
for Outcome 5 (departmental) (398) (400) (404) (404)
Outcome 6
Decrease in estimates (departmental)
Fire Service Levy - reduction2 6.1 (79) (84) (86) (86)
Targeted savings - public service
eff iciencies 6.1 (395) (394) (394) (394)
Net impact on estimates
for Outcome 6 (departmental) (474) (478) (480) (480) 1. Measure relates to a decision made post 2012-13 MYEFO. 2. Measure was announced in the 2012-13 Budget but has not previously been reported in a portfolio
statement.

DIAC Additional Estimates Statements
19
Table 1.4: Additional estimates and variations to Outcomes from other variations
Program 2012-13 2013-14 2014-15 2015-16
impacted $'000 $'000 $'000 $'000
Outcome 1
Increase in estimates (departmental)
Program specif ic parameter variations 1.1 18,290 - - -
Other variations 1.1 2,743 6,179 11,459 11,459
Decrease in estimates (departmental)
Economic parameter variations 1.1 - (2,073) (3,183) (4,068)
Net impact on estimates
for Outcome 1 (departmental) 21,033 4,106 8,276 7,391
Outcome 2
Decrease in estimates (administered)
Economic parameter variations 2.1 - (221) (183) (157)
Net impact on estimates
for Outcome 2 (administered) - (221) (183) (157)
Increase in estimates (departmental)
Program specif ic parameter variations 2.1 594 - - -
Other variations 2.1 - 66 66 66
Decrease in estimates (departmental)
Economic parameter variations 2.1 - (321) (485) (632)
Net impact on estimates
for Outcome 2 (departmental) 594 (255) (419) (566)
Outcome 3
Increase in estimates (departmental)
Other variations 3.1 - 108 108 108
Decrease in estimates (departmental)
Economic parameter variations 3.1 - (483) (763) (1,030)
Program specif ic parameter variations 3.1 (2,832) - - -
Net impact on estimates
for Outcome 3 (departmental) (2,832) (375) (655) (922)
Outcome 4
Increase in estimates (administered)
Program specif ic parameter variations 4.3 32,699 312,381 - -
Decrease in estimates (administered)
Economic parameter variations 4.1 - 4.5 - (5,943) (2,385) (1,668)
Net impact on estimates
for Outcome 4 (administered) 32,699 306,438 (2,385) (1,668)
Increase in estimates (departmental)
Program specif ic parameter variations 4.1 - 4.5 33,863 10,475 - -
Other variations 4.1 - 4.5 - 302 302 302
Decrease in estimates (departmental)
Program specif ic parameter variations 4.3 (28,978) - - -
Economic parameter variations 4.1 - 4.5 - (1,582) (1,904) (2,155)
Net impact on estimates
for Outcome 4 (departmental) 4,885 9,195 (1,602) (1,853) Continued on next page

DIAC Additional Estimates Statements
20
Table 1.4: Additional estimates and variations to Outcomes from other variations (continued)
Program 2012-13 2013-14 2014-15 2015-16
impacted $'000 $'000 $'000 $'000
Outcome 5
Increase in estimates (administered)
Program specif ic parameter variations 5.1 8,183 - - -
Decrease in estimates (administered)
Economic parameter variations 5.1 - (2,216) (2,689) (3,192)
Net impact on estimates
for Outcome 5 (administered) 8,183 (2,216) (2,689) (3,192)
Increase in estimates (departmental)
Other variations 5.1 - 54 54 54
Decrease in estimates (departmental)
Economic parameter variations 5.1 - (225) (321) (474)
Net impact on estimates
for Outcome 5 (departmental) - (171) (267) (420)
Outcome 6
Decrease in estimates (administered)
Economic parameter variations 6.1 - (9) (15) (17)
Net impact on estimates
for Outcome 6 (administered) - (9) (15) (17)
Increase in estimates (departmental)
Program specif ic parameter variations 6.1 1,582 - - -
Other variations 6.1 - 65 65 65
Decrease in estimates (departmental)
Economic parameter variations 6.1 - (277) (421) (543)
Net impact on estimates
for Outcome 6 (departmental) 1,582 (212) (356) (478)

DIAC Additional Estimates Statements
21
1.5 Breakdown of additional estimates by Appropriation Bill
The following tables detail the Additional Estimates sought for the Department of Immigration and Citizenship through Appropriation Bills No. 3 and No. 4.
Table 1.5: Appropriation Bill (No. 3) 2012-13
2011-12 2012-13 2012-13 Additional Reduced
Available1 PSES2 Revised Estimates Estimates
$'000 $'000 $'000 $'000 $'000
ADMINISTERED ITEMS
Outcome 1
Contributing to Australia's society and its
economic advancement through the lawful
and orderly entry and stay of people
50 50 50 - -
Outcome 2
A society which values Australian citizenship
and social cohesion, and enables migrants
and refugees to participate equitably37,169 41,128 41,128 - -
Outcome 3
Lawful entry o f people to Australia through
border management services invo lving bona
f ide traveller facilitation; identity
management; document verification;
intelligence analysis; partnerships with
international and domestic agencies; and
border policy advice and program design
168 - - - -
Outcome 4
Lawful stay of visa holders and access to
citizenship rights for eligible people through
promotion of visa compliance
responsibilities, status resolution, citizenship
acquisition integrity, case management,
removal and detention, and policy advice and
program design
1,067,491 1,995,334 2,028,033 32,699 -
Outcome 5
Equitable economic and social participation
of migrants and refugees, supported through
settlement services, including English
language training; refugee settlement; case
coordination; translation services; and
settlement policy advice and program design
329,642 407,932 416,115 8,183 -
Outcome 6
A cohesive, multicultural Australian society
through promotion of cultural diversity and a
unifying citizenship, decisions on citizenship
status, and multicultural and citizenship
policy advice and program design
5,433 2,757 2,757 - -
Total 1,439,953 2,447,201 2,488,083 40,882 - Continued on next page
DIAC Additional Estimates Statements
22
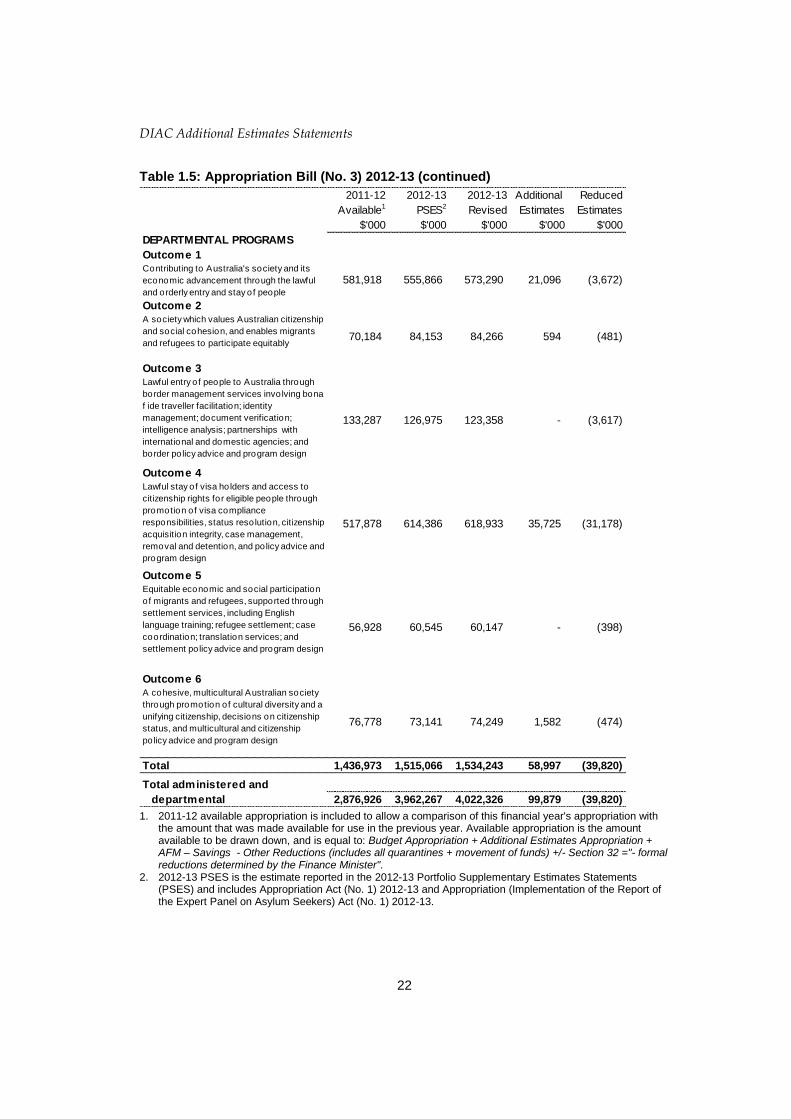
Table 1.5: Appropriation Bill (No. 3) 2012-13 (continued)
2011-12 2012-13 2012-13 Additional Reduced
Available1 PSES2 Revised Estimates Estimates
$'000 $'000 $'000 $'000 $'000
DEPARTMENTAL PROGRAMS
Outcome 1
Contributing to Australia's society and its
economic advancement through the lawful
and orderly entry and stay of people
581,918 555,866 573,290 21,096 (3,672)
Outcome 2
A society which values Australian citizenship
and social cohesion, and enables migrants
and refugees to participate equitably70,184 84,153 84,266 594 (481)
Outcome 3
Lawful entry o f people to Australia through
border management services invo lving bona
f ide traveller facilitation; identity
management; document verification;
intelligence analysis; partnerships with
international and domestic agencies; and
border policy advice and program design
133,287 126,975 123,358 - (3,617)
Outcome 4
Lawful stay of visa holders and access to
citizenship rights for eligible people through
promotion of visa compliance
responsibilities, status resolution, citizenship
acquisition integrity, case management,
removal and detention, and policy advice and
program design
517,878 614,386 618,933 35,725 (31,178)
Outcome 5
Equitable economic and social participation
of migrants and refugees, supported through
settlement services, including English
language training; refugee settlement; case
coordination; translation services; and
settlement policy advice and program design
56,928 60,545 60,147 - (398)
Outcome 6
A cohesive, multicultural Australian society
through promotion of cultural diversity and a
unifying citizenship, decisions on citizenship
status, and multicultural and citizenship
policy advice and program design
76,778 73,141 74,249 1,582 (474)
Total 1,436,973 1,515,066 1,534,243 58,997 (39,820)
Total administered and
departmental 2,876,926 3,962,267 4,022,326 99,879 (39,820) 1. 2011-12 available appropriation is included to allow a comparison of this financial year's appropriation with
the amount that was made available for use in the previous year. Available appropriation is the amount available to be drawn down, and is equal to: Budget Appropriation + Additional Estimates Appropriation + AFM – Savings - Other Reductions (includes all quarantines + movement of funds) +/- Section 32 ="- formal reductions determined by the Finance Minister".
2. 2012-13 PSES is the estimate reported in the 2012-13 Portfolio Supplementary Estimates Statements (PSES) and includes Appropriation Act (No. 1) 2012-13 and Appropriation (Implementation of the Report of the Expert Panel on Asylum Seekers) Act (No. 1) 2012-13.

DIAC Additional Estimates Statements
23
Table 1.6: Appropriation Bill (No. 4) 2012-13
2011-12 2012-13 2012-13 Additional Reduced
Available1 PSES2 Revised Estimates Estimates
$'000 $'000 $'000 $'000 $'000
Non-operating
Equity injections 11,698 25,115 25,115 - -
Administered assets and liabilities 23,966 267,380 299,774 32,394 -
Total non-operating 35,664 292,495 324,889 32,394 -
Department of Immigration and
Citizenship
Total 35,664 292,495 324,889 32,394 - 1. 2011-12 available appropriation is included to allow a comparison of this financial year's appropriation with
the amount that was made available for use in the previous year. Available appropriation is the amount available to be drawn down, and is equal to: Budget Appropriation + Additional Estimates Appropriation + AFM – Savings - Other Reductions (includes all quarantines + movement of funds) +/- Section 32 ="- formal reductions determined by the Finance Minister".
2. 2012-13 PSES is the estimate reported in the 2012-13 Portfolio Supplementary Estimates Statements (PSES) and includes Appropriation Act (No. 1) 2012-13 and Appropriation (Implementation of the Report of the Expert Panel on Asylum Seekers) Act (No. 1) 2012-13.

DIAC Additional Estimates Statements
24
Section 2: Revisions to Outcomes and Planned Performance
2.1 RESOURCES AND PERFORMANCE INFORMATION
The Program Key Performance Indicators table reflects the changes in the respective
Outcome key performance indicators and targets used to assess and monitor the
performance of the Department of Immigration and Citizenship in achieving government
outcomes.
Outcome strategies, program information and deliverables have been outlined under the
respective Outcome below.
Details of Outcome strategy, program information and deliverables are in line with those
reported in the Portfolio Budget Statements (PBS) 2012-13.
Outcome 1: Managed migration through visas granted for permanent
settlement, work, study, tourism, working holidays or other specialised
activities in Australia, regulation, research and migration policy advice and
program design.
Outcome 1 Strategy
Outcome 1 contributes to Australia’s economic and social prosperity through the
provision of visa services and policy and program development in relation to permanent
migration and temporary entry, including:
• developing policy in line with the Government’s expectations to implement migration
and visa reform agendas including labour market initiatives, long-term migration
planning, reforms to temporary entry programs and visa simplification and
deregulation
• program development
• robust policy and sound research and evaluation to support efficient program delivery
and to enhance the integrity of the program
• promotion of client service delivery excellence.
The Department’s progress is measured on the development and implementation of the
Government’s reform agenda including the:
• labour market policy framework
• long-term migration planning framework

DIAC Additional Estimates Statements
25
• skills targeting (permanent and temporary)
• review of student programs
• working holiday visitor and specialist entry programs
• visa simplification and deregulation agenda
• implementation of a fairer approach to migration for people with a disability
The Department’s performance will be measured by:
• the delivery of the 2012-13 Migration Program within parameters set by the
Government
• the Continuous Survey of Australian Migrants to monitor the integration of recent
migrants, and a rolling annual program for surveying the main groups of temporary
migrants
• the Department’s responsiveness to Australian Government initiatives and reforms
related to migration, the temporary entry program and sustainable population policies
• progress in the development of the long-term migration planning framework
• the integration of research and evaluation programs, which support evidence based policy formulation and decision making including relevant stakeholder input and expert opinions.

DIAC Additional Estimates Statements
26
Table 2.1.1: Budgeted Expenses and Resources for Outcome 1 Table 2.1.1: Budgeted Expenses for Outcome 1
2011-12 2012-13
Actual Revised
expenses estimated
expenses
$'000 $'000
Program 1.1: Visa and Migration
Administered expenses
Ordinary annual services 1 - 50
Total for Program 1.1 - 50
Program 1.1.1: Visa and Migration - Service Delivery
Departmental expenses
Departmental appropriation 2 448,670 457,202
Expenses not requiring appropriation in the Budget year 3 37,750 49,120
Total for Program 1.1.1 486,420 506,322
Program 1.1.2: Visa and Migration -
Policy Advice and Program Design
Departmental expenses
Departmental appropriation 2 59,575 63,815
Expenses not requiring appropriation in the Budget year 3 13,324 17,434
Total for Program 1.1.2 72,899 81,249
Program 1.1.3: Visa and Migration - Office of the MARA
Departmental appropriation 2 5,967 5,999
Expenses not requiring appropriation in the Budget year 3 337 441
Total for Program 1.1.3 6,304 6,440
Outcome 1 Totals by appropriation type
Administered Expenses
Ordinary annual services 1 - 50
Departmental expenses
Departmental appropriation 2 514,213 527,016
Expenses not requiring appropriation in the Budget year 3 51,413 66,995
Total expenses for Outcome 1 565,626 594,061
2011-12 2012-13
Average Staffing Level (number) 3,901 3,839 1. Ordinary annual services include Appropriation Act (No. 1) 2012-13 & Appropriation Bill (No. 3) 2012-13 .
2. Departmental Appropriation combines ‘Ordinary annual services (Appropriation Act No. 1 & Appropriation
Bill No. 3)’ and ‘Revenue from independent sources (s31)’. 3. Expenses not requiring appropriation in the Budget year consists of Depreciation and Amortisation Expense. Note: Departmental appropriation amounts are indicative estimates and may change in the course of the budget year as government priorities change.

DIAC Additional Estimates Statements
27
Contributions to Outcome 1
Program 1.1: Visa and Migration
Program Objective
Permanent migration and temporary entry is a key contributor to Australia’s economic, demographic, cultural and social needs. A targeted migration program which facilitates the lawful and orderly entry and stay of people in Australia and that responds to Australia’s changing economic, cultural and social needs, will be achieved by:
• the delivery of the annual Migration Program, within the parameters set by Government to respond to Australia’s labour and demographic needs whilst maintaining program integrity
• the implementation of strategies to strengthen the economic, budgetary, cultural and social benefits from both permanent migration and temporary entry
• the strengthening of the Government’s ability to develop evidence-based policy addressing population and migration issues
• the ongoing review and improvement of Australia’s temporary entry arrangements to better meet the needs of business, education and tourism
• the delivery of the permanent skilled migration program in a way that supports the Australian economy, business, and the education and training of Australians
• a robust family migration program which brings benefits to individual families and the wider community
• the protection of the Australian people and health systems from potential health risks arising from migration
• supporting the Ministerial Advisory Council on Skilled Migration’s capacity to provide strong advice to Government.
Office of the MARA
The Office of the MARA works collaboratively with its stakeholders to achieve the following objectives:
• consumers understand their rights and agents understand their obligations under the regulatory framework
• only suitable persons are registered as migration agents, and unsuitable persons are refused registration or re-registration
• registered migration agents maintain appropriate knowledge and skills to enable them to provide accurate and timely advice to consumers
• registered migration agents are monitored to ensure the integrity of their conduct and quality of the immigration assistance provided to consumers
• consumers of the services of registered, or formerly registered, migration agents are provided with an efficient and effective complaints handling service.
DIAC Additional Estimates Statements
28
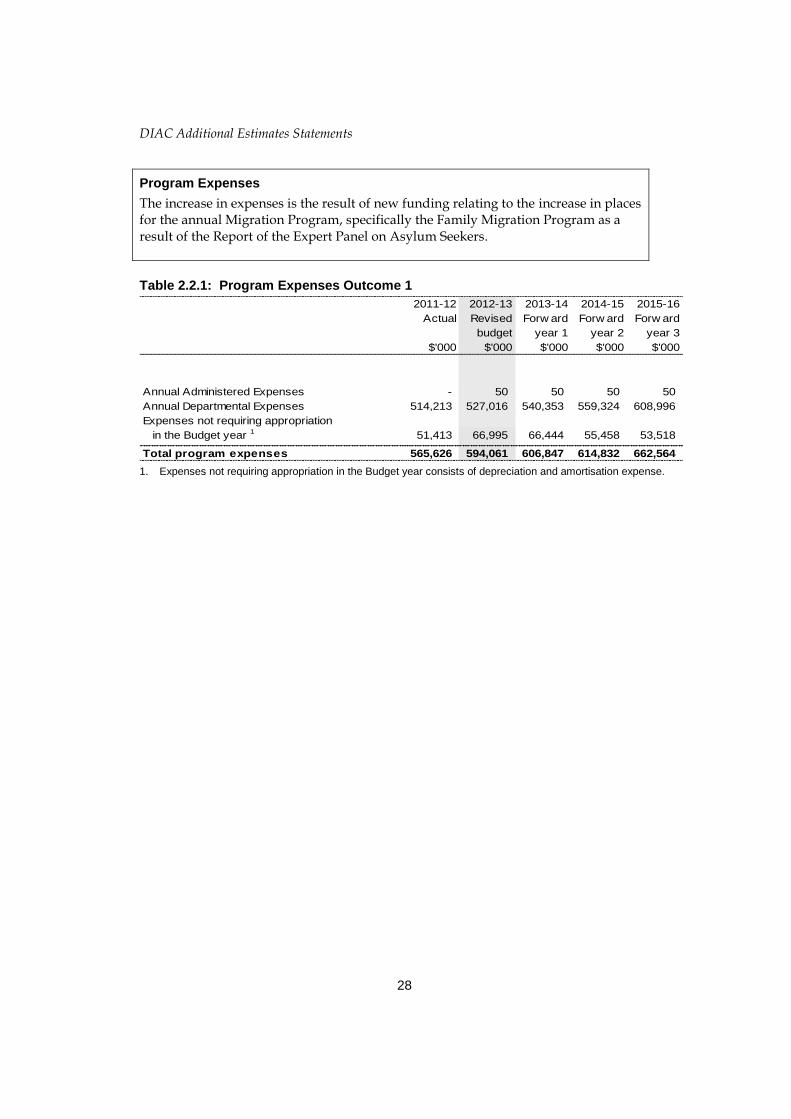
Program Expenses
The increase in expenses is the result of new funding relating to the increase in places for the annual Migration Program, specifically the Family Migration Program as a result of the Report of the Expert Panel on Asylum Seekers.
Table 2.2.1: Program Expenses Outcome 1
2011-12 2012-13 2013-14 2014-15 2015-16
Actual Revised Forw ard Forw ard Forw ard
budget year 1 year 2 year 3
$'000 $'000 $'000 $'000 $'000
Annual Administered Expenses - 50 50 50 50
Annual Departmental Expenses 514,213 527,016 540,353 559,324 608,996
Expenses not requiring appropriation
in the Budget year 1 51,413 66,995 66,444 55,458 53,518
Total program expenses 565,626 594,061 606,847 614,832 662,564
1. Expenses not requiring appropriation in the Budget year consists of depreciation and amortisation expense.
DIAC Additional Estimates Statements
29
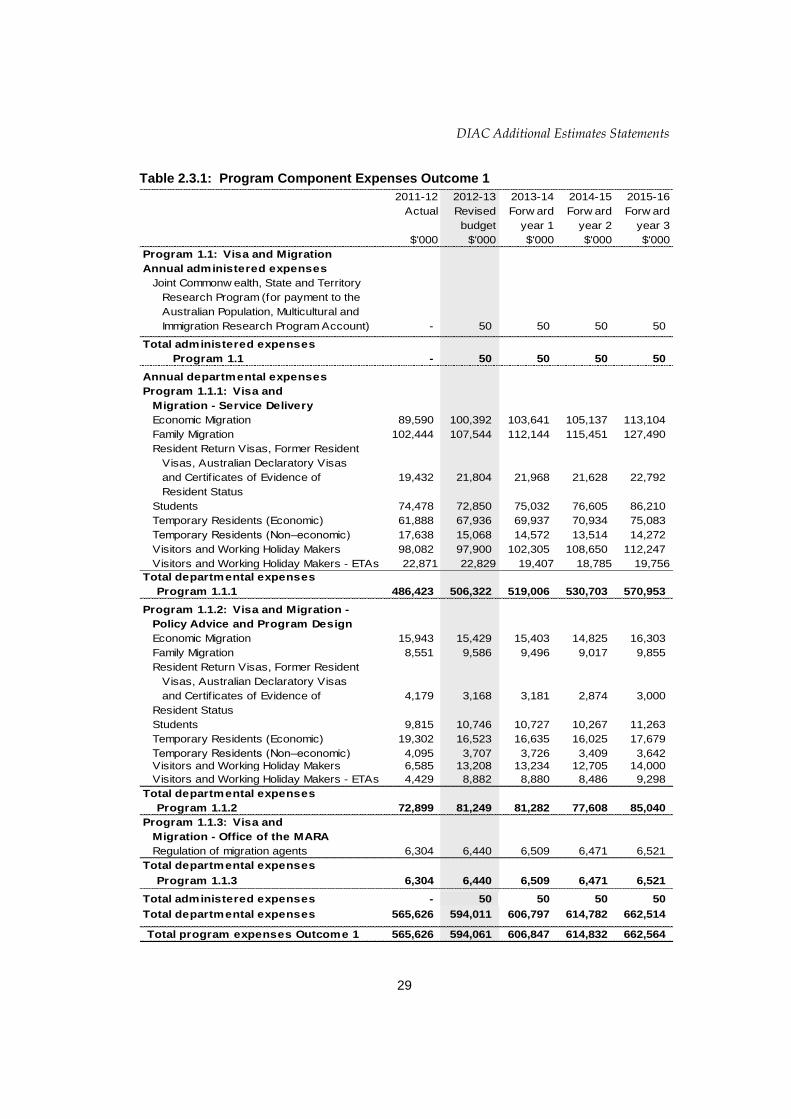
Table 2.3.1: Program Component Expenses Outcome 1
2011-12 2012-13 2013-14 2014-15 2015-16
Actual Revised Forw ard Forw ard Forw ard
budget year 1 year 2 year 3
$'000 $'000 $'000 $'000 $'000
Program 1.1: Visa and Migration
Annual administered expenses
Joint Commonw ealth, State and Territory
Research Program (for payment to the
Australian Population, Multicultural and
Immigration Research Program Account) - 50 50 50 50
Total administered expenses
Program 1.1 - 50 50 50 50
Annual departmental expenses
Program 1.1.1: Visa and
Migration - Service Delivery
Economic Migration 89,590 100,392 103,641 105,137 113,104
Family Migration 102,444 107,544 112,144 115,451 127,490
Resident Return Visas, Former Resident
Visas, Australian Declaratory Visas
and Certif icates of Evidence of 19,432 21,804 21,968 21,628 22,792
Resident Status
Students 74,478 72,850 75,032 76,605 86,210
Temporary Residents (Economic) 61,888 67,936 69,937 70,934 75,083
Temporary Residents (Non–economic) 17,638 15,068 14,572 13,514 14,272
Visitors and Working Holiday Makers 98,082 97,900 102,305 108,650 112,247
Visitors and Working Holiday Makers - ETAs 22,871 22,829 19,407 18,785 19,756
Total departmental expenses
Program 1.1.1 486,423 506,322 519,006 530,703 570,953
Program 1.1.2: Visa and Migration -
Policy Advice and Program Design
Economic Migration 15,943 15,429 15,403 14,825 16,303
Family Migration 8,551 9,586 9,496 9,017 9,855
Resident Return Visas, Former Resident
Visas, Australian Declaratory Visas
and Certif icates of Evidence of 4,179 3,168 3,181 2,874 3,000
Resident Status
Students 9,815 10,746 10,727 10,267 11,263
Temporary Residents (Economic) 19,302 16,523 16,635 16,025 17,679
Temporary Residents (Non–economic) 4,095 3,707 3,726 3,409 3,642
Visitors and Working Holiday Makers 6,585 13,208 13,234 12,705 14,000
Visitors and Working Holiday Makers - ETAs 4,429 8,882 8,880 8,486 9,298
Total departmental expenses
Program 1.1.2 72,899 81,249 81,282 77,608 85,040
Program 1.1.3: Visa and
Migration - Office of the MARA
Regulation of migration agents 6,304 6,440 6,509 6,471 6,521
Total departmental expenses
Program 1.1.3 6,304 6,440 6,509 6,471 6,521
Total administered expenses - 50 50 50 50
Total departmental expenses 565,626 594,011 606,797 614,782 662,514
Total program expenses Outcome 1 565,626 594,061 606,847 614,832 662,564

DIAC Additional Estimates Statements
30
Program 1.1 Deliverables
The Visa and Migration outcome will:
• continue to develop and implement permanent migration and temporary entry strategies which support government priorities, including social, economic, budgetary and international imperatives
• deliver the Migration Program within Government targets whilst maintaining program integrity
• process visa applications within service standards and according to applicable priority processing directions
• ensure temporary entry and permanent migration does not increase health risks or costs to the Australian community
• undertake high quality evidence-based analysis of the way migration, the economy, the labour market and the wider community support evidence-based migration policy development and program delivery
• work closely with key stakeholders to increase the level of awareness of key issues and concerns with the operation of visa programs and gain support for necessary changes
• provide secretariat support to the Ministerial Advisory Council on Skilled Migration to allow them to advise government on skilled migration policy
• consolidate the new SkillSelect migrant selection model within the skilled migration program delivery framework.
The Office of the MARA will:
• implement a communications strategy that increases consumers understanding of their rights and agents understanding of their obligations under the regulatory framework
• consider all applications for registration appropriately to ensure that only suitable persons are registered as migration agents, and unsuitable persons are refused registration or re-registration
• pursue improvements to entry level qualifications and continuing professional development
• ensure the interests of persons using the services of registered migration agents are effectively protected
• ensure all complaints about the services of registered, or formerly registered, migration agents are appropriately addressed in line with transparent complaint handling criteria including referral to other relevant agencies.

DIAC Additional Estimates Statements
31
Program 1.1 Key Performance Indicators
• temporary and permanent migration programs actively contribute towards the government’s social, economic, budgetary and international imperatives
• the permanent migration program, including skilled migration, family migration and special eligibility components are delivered within government targets
• visa applications are finalised within service standards and according to applicable priority processing directions
• data and analysis is regularly provided on the performance of visa programs in order to support evidence based policy development and implementation
• temporary entry and permanent migration does not increase health risks or costs to the Australian community
• policy development and reform to visa programs are implemented effectively and in a timely and cost-effective manner while maintaining program integrity
• high quality and timely support provided to key stakeholders through the provision of migration program policy advice via helpdesks, secretariats, briefings, speeches and presentations and replies to correspondence
• provide effective support to the Ministerial Advisory Council on Skilled Migration with appropriate secretariat services.
DIAC Additional Estimates Statements
32
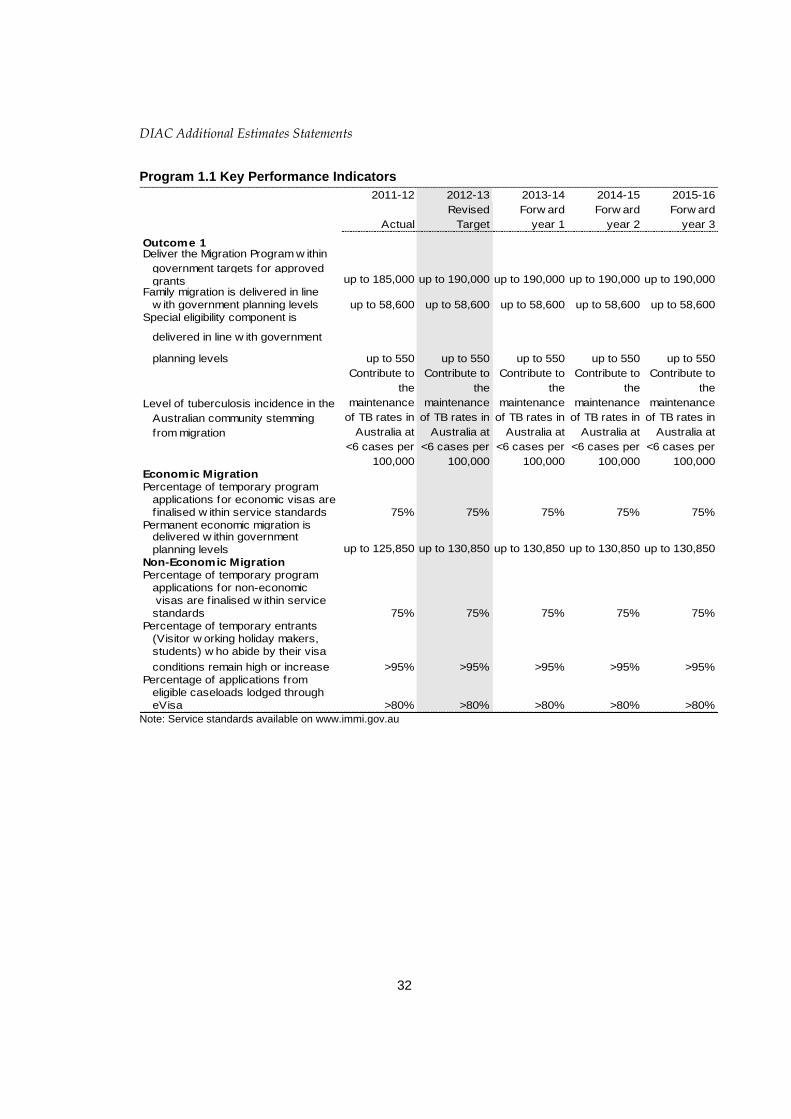
Program 1.1 Key Performance Indicators
2011-12 2012-13 2013-14 2014-15 2015-16
Revised Forw ard Forw ard Forw ard
Actual Target year 1 year 2 year 3
Outcome 1Deliver the Migration Program w ithin
government targets for approved
grantsFamily migration is delivered in line
w ith government planning levels
Special eligibility component is
delivered in line w ith government
planning levels
Level of tuberculosis incidence in the
Australian community stemming
from migration
Economic Migration
Percentage of temporary program
applications for economic visas are
finalised w ithin service standards
Permanent economic migration is delivered w ithin government
planning levels
Non-Economic Migration
Percentage of temporary program
applications for non-economic
visas are f inalised w ithin service
standards
Percentage of temporary entrants
(Visitor w orking holiday makers,
students) w ho abide by their visa
conditions remain high or increase >95% >95% >95% >95%
Percentage of applications from
eligible caseloads lodged through
eVisa
>95%
up to 58,600
Contribute to
the
maintenance
of TB rates in
Australia at
<6 cases per
100,000
Contribute to
the
maintenance
of TB rates in
Australia at
<6 cases per
100,000
Contribute to
the
maintenance
of TB rates in
Australia at
<6 cases per
100,000
Contribute to
the
maintenance
of TB rates in
Australia at
<6 cases per
100,000
75%
up to 550 up to 550 up to 550
75% 75% 75% 75%75%
up to 58,600
75%75%
up to 58,600
Contribute to
the
maintenance
of TB rates in
Australia at
<6 cases per
100,000
>80%
up to 125,850 up to 130,850
up to 550 up to 550
>80% >80%
75%75%
>80%
up to 130,850
up to 58,600
>80%
up to 58,600
up to 130,850 up to 130,850
up to 185,000 up to 190,000 up to 190,000 up to 190,000 up to 190,000
Note: Service standards available on www.immi.gov.au

DIAC Additional Estimates Statements
33
2011-12 2012-13 2013-14 2014-15 2015-16
Revised Forw ard Forw ard Forw ard
Actual Target year 1 year 2 year 3
Office of the MARA
Percentage of MARA’s stakeholders
that f ind information products useful
and informative
Percentage of complete registration
applicants f inalised w ithin service
standards
Percentage of registered migration
agents w ho participated in Continuing
Professional Development activities
and found them useful
Percentage of registered migration
agents applying for repeat
that are compliance checked.
Percentage of complete complaints
f inalised w ithin service standards1 100%
>60%
95%
>65%
100%
>60%
95%
>65%
100%
100%
100%
95%
>65%
100% 100%
>65%
>60% >60%
95%
>60%
>65%
100% 100% 100%
95%
Note: Service standards available at www.mara.gov.au.
Program 1.1 Key Performance Indicators - Office of the MARA
• improved level of consumer understanding of what they can expect from registered migration agents and how those agents are regulated
• new registration or re-registration applications finalised within service standards
• effective continuing professional development activities offered to registered migration agents
• efficient resolution of complaints about registered or formerly registered migration agents.

DIAC Additional Estimates Statements
34
Administered item under Program 1.1: Visa and Migration
Joint Commonwealth, State and Territory Research Program (for payment to
the Australian Population, Multicultural and Immigration Research Program
Account)
Item Objectives
The Australian Population, Multicultural and Immigration Research Program was
established jointly by the Australian Government and state and territory
governments to undertake studies in the areas of migration settlement, multicultural
affairs and population trends. Individual studies are designed to gather information
not adequately covered by existing data and surveys.
Item Deliverables
Research contributes to and informs Government policy making.

DIAC Additional Estimates Statements
35
Outcome 2: Protection, resettlement and temporary safe haven for refugees and
people in humanitarian need through partnering with international agencies;
assessing humanitarian visa applications; and refugee and humanitarian policy
advice and program design.
Outcome 2 Strategy
Outcome 2 will be achieved through the following strategies and initiatives:
• meet Australia’s international protection obligations and contribute to the resettlement of refugees and those in humanitarian need through the delivery of the Humanitarian Program, to a high level of integrity
• through the offshore Humanitarian Program, continue to work with the United Nations High Commissioner for Refugees (UNHCR) to provide resettlement for refugees, focusing on those in protracted situations, in urban environments and others in critical need
• enhance the protection framework in Australia to ensure those in need of protection receive it
• work closely with UNHCR, the International Organization for Migration (IOM), other international agencies and partner countries to promote managed migration, enhance the functioning of the international protection system to more equitably meet the protection needs of refugees, make effective use of resettlement, reduce incentives for secondary movement and provide greater support for countries of first asylum
• continue to develop policy, program design and procedures to improve the fairness, accountability and integrity of the Humanitarian Program.
DIAC Additional Estimates Statements
36
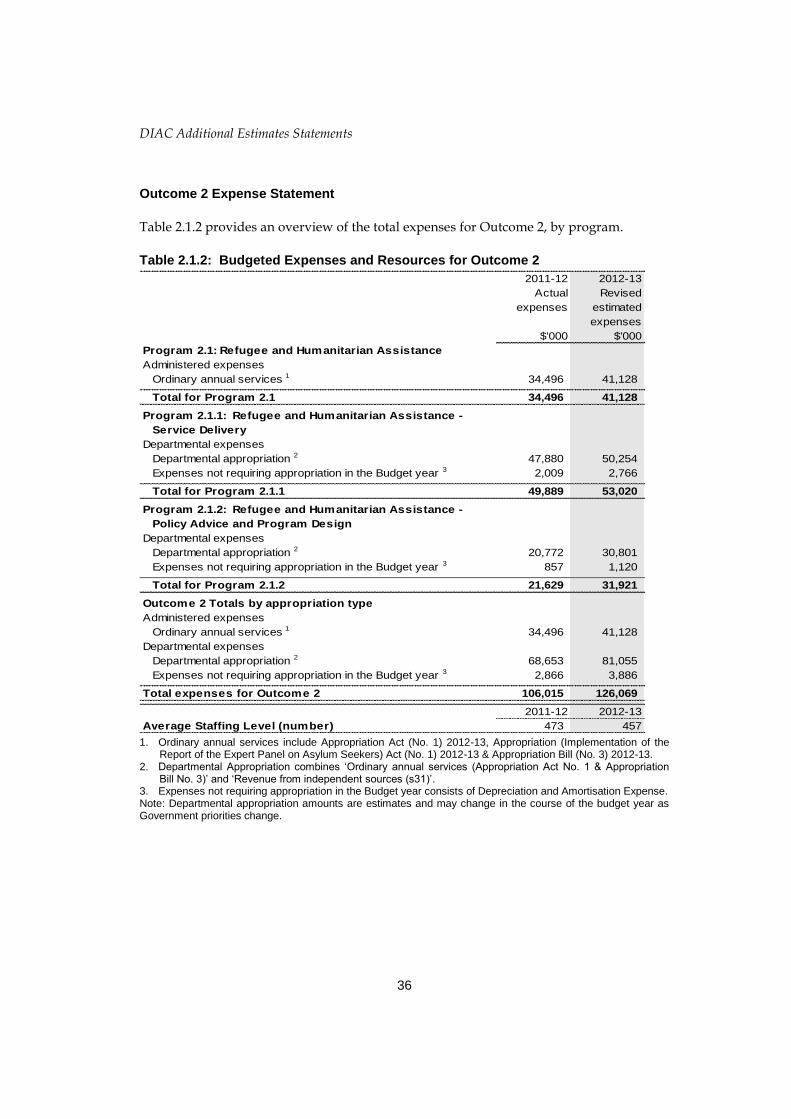
Outcome 2 Expense Statement
Table 2.1.2 provides an overview of the total expenses for Outcome 2, by program.
Table 2.1.2: Budgeted Expenses and Resources for Outcome 2
2011-12 2012-13
Actual Revised
expenses estimated
expenses
$'000 $'000
Program 2.1: Refugee and Humanitarian Assistance
Administered expenses
Ordinary annual services 1 34,496 41,128
Total for Program 2.1 34,496 41,128
Program 2.1.1: Refugee and Humanitarian Assistance -
Service Delivery
Departmental expenses
Departmental appropriation 2 47,880 50,254
Expenses not requiring appropriation in the Budget year 3 2,009 2,766
Total for Program 2.1.1 49,889 53,020
Program 2.1.2: Refugee and Humanitarian Assistance -
Policy Advice and Program Design
Departmental expenses
Departmental appropriation 2 20,772 30,801
Expenses not requiring appropriation in the Budget year 3 857 1,120
Total for Program 2.1.2 21,629 31,921
Outcome 2 Totals by appropriation type
Administered expenses
Ordinary annual services 1 34,496 41,128
Departmental expenses
Departmental appropriation 2 68,653 81,055
Expenses not requiring appropriation in the Budget year 3 2,866 3,886
Total expenses for Outcome 2 106,015 126,069
2011-12 2012-13
Average Staffing Level (number) 473 457 1. Ordinary annual services include Appropriation Act (No. 1) 2012-13, Appropriation (Implementation of the
Report of the Expert Panel on Asylum Seekers) Act (No. 1) 2012-13 & Appropriation Bill (No. 3) 2012-13. 2. Departmental Appropriation combines ‘Ordinary annual services (Appropriation Act No. 1 & Appropriation
Bill No. 3)’ and ‘Revenue from independent sources (s31)’. 3. Expenses not requiring appropriation in the Budget year consists of Depreciation and Amortisation Expense. Note: Departmental appropriation amounts are estimates and may change in the course of the budget year as Government priorities change.
DIAC Additional Estimates Statements
37
Contributions to Outcome 2
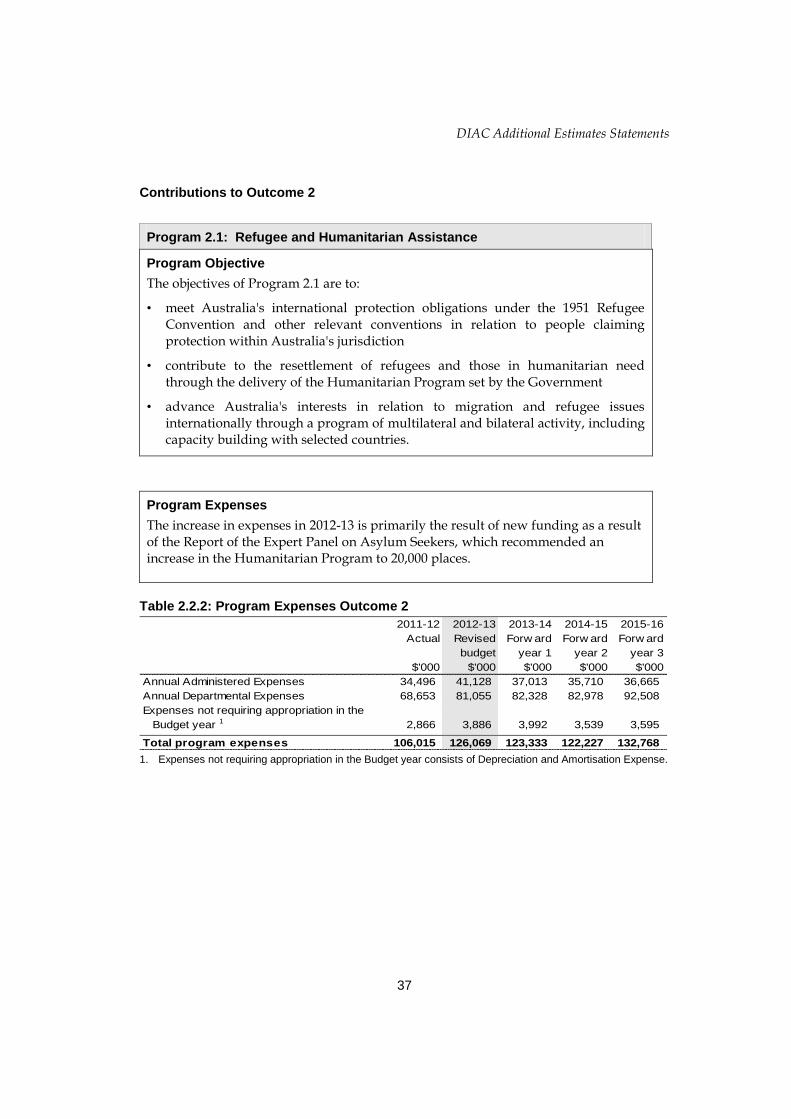
Program 2.1: Refugee and Humanitarian Assistance
Program Objective
The objectives of Program 2.1 are to:
• meet Australia's international protection obligations under the 1951 Refugee Convention and other relevant conventions in relation to people claiming protection within Australia's jurisdiction
• contribute to the resettlement of refugees and those in humanitarian need through the delivery of the Humanitarian Program set by the Government
• advance Australia's interests in relation to migration and refugee issues internationally through a program of multilateral and bilateral activity, including capacity building with selected countries.
Program Expenses
The increase in expenses in 2012-13 is primarily the result of new funding as a result of the Report of the Expert Panel on Asylum Seekers, which recommended an increase in the Humanitarian Program to 20,000 places.
Table 2.2.2: Program Expenses Outcome 2
2011-12 2012-13 2013-14 2014-15 2015-16
Actual Revised Forw ard Forw ard Forw ard
budget year 1 year 2 year 3
$'000 $'000 $'000 $'000 $'000
Annual Administered Expenses 34,496 41,128 37,013 35,710 36,665
Annual Departmental Expenses 68,653 81,055 82,328 82,978 92,508
Expenses not requiring appropriation in the
Budget year 1 2,866 3,886 3,992 3,539 3,595
Total program expenses 106,015 126,069 123,333 122,227 132,768
1. Expenses not requiring appropriation in the Budget year consists of Depreciation and Amortisation Expense.
DIAC Additional Estimates Statements
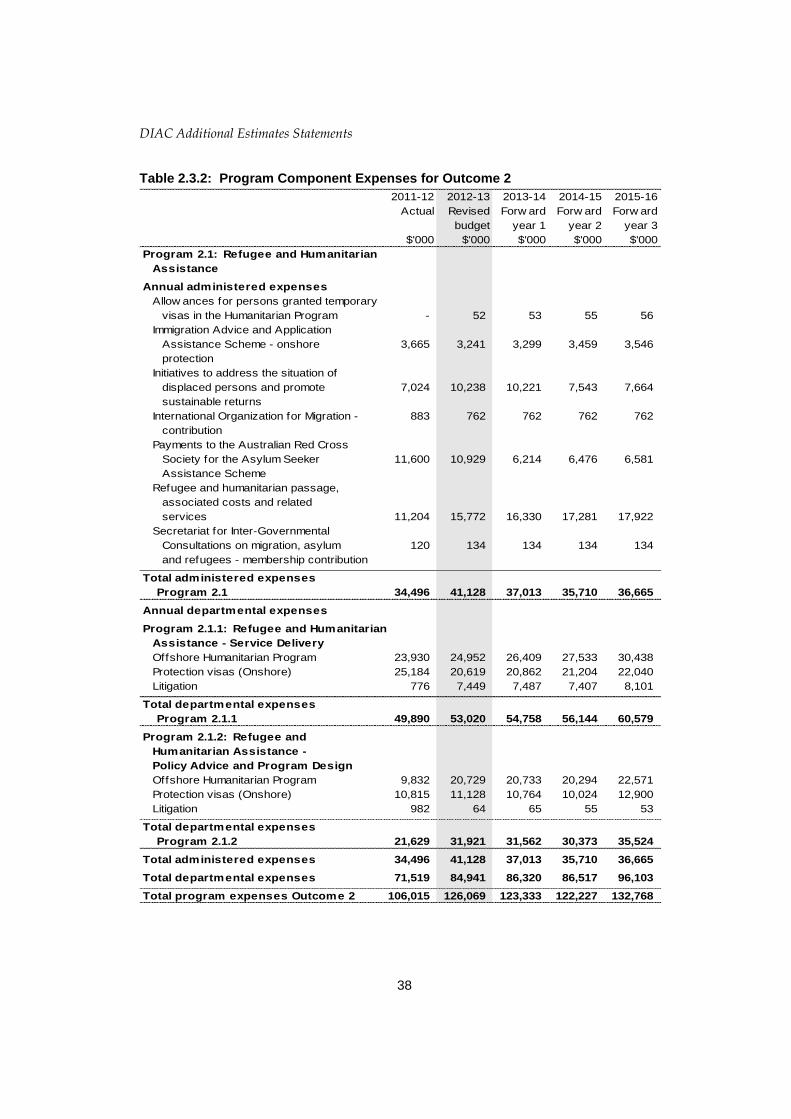
38
Table 2.3.2: Program Component Expenses for Outcome 2
2011-12 2012-13 2013-14 2014-15 2015-16
Actual Revised Forw ard Forw ard Forw ard
budget year 1 year 2 year 3
$'000 $'000 $'000 $'000 $'000
Program 2.1: Refugee and Humanitarian
Assistance
Annual administered expenses
Allow ances for persons granted temporary
visas in the Humanitarian Program - 52 53 55 56
Immigration Advice and Application
Assistance Scheme - onshore 3,665 3,241 3,299 3,459 3,546
protection
Initiatives to address the situation of
displaced persons and promote 7,024 10,238 10,221 7,543 7,664
sustainable returns
International Organization for Migration - 883 762 762 762 762
contribution
Payments to the Australian Red Cross
Society for the Asylum Seeker 11,600 10,929 6,214 6,476 6,581
Assistance Scheme
Refugee and humanitarian passage,
associated costs and related
services 11,204 15,772 16,330 17,281 17,922
Secretariat for Inter-Governmental
Consultations on migration, asylum 120 134 134 134 134
and refugees - membership contribution
Total administered expenses
Program 2.1 34,496 41,128 37,013 35,710 36,665
Annual departmental expenses
Program 2.1.1: Refugee and Humanitarian
Assistance - Service Delivery
Offshore Humanitarian Program 23,930 24,952 26,409 27,533 30,438
Protection visas (Onshore) 25,184 20,619 20,862 21,204 22,040
Litigation 776 7,449 7,487 7,407 8,101
Total departmental expenses
Program 2.1.1 49,890 53,020 54,758 56,144 60,579
Program 2.1.2: Refugee and
Humanitarian Assistance -
Policy Advice and Program Design
Offshore Humanitarian Program 9,832 20,729 20,733 20,294 22,571
Protection visas (Onshore) 10,815 11,128 10,764 10,024 12,900
Litigation 982 64 65 55 53
Total departmental expenses
Program 2.1.2 21,629 31,921 31,562 30,373 35,524
Total administered expenses 34,496 41,128 37,013 35,710 36,665
Total departmental expenses 71,519 84,941 86,320 86,517 96,103
Total program expenses Outcome 2 106,015 126,069 123,333 122,227 132,768
DIAC Additional Estimates Statements
39
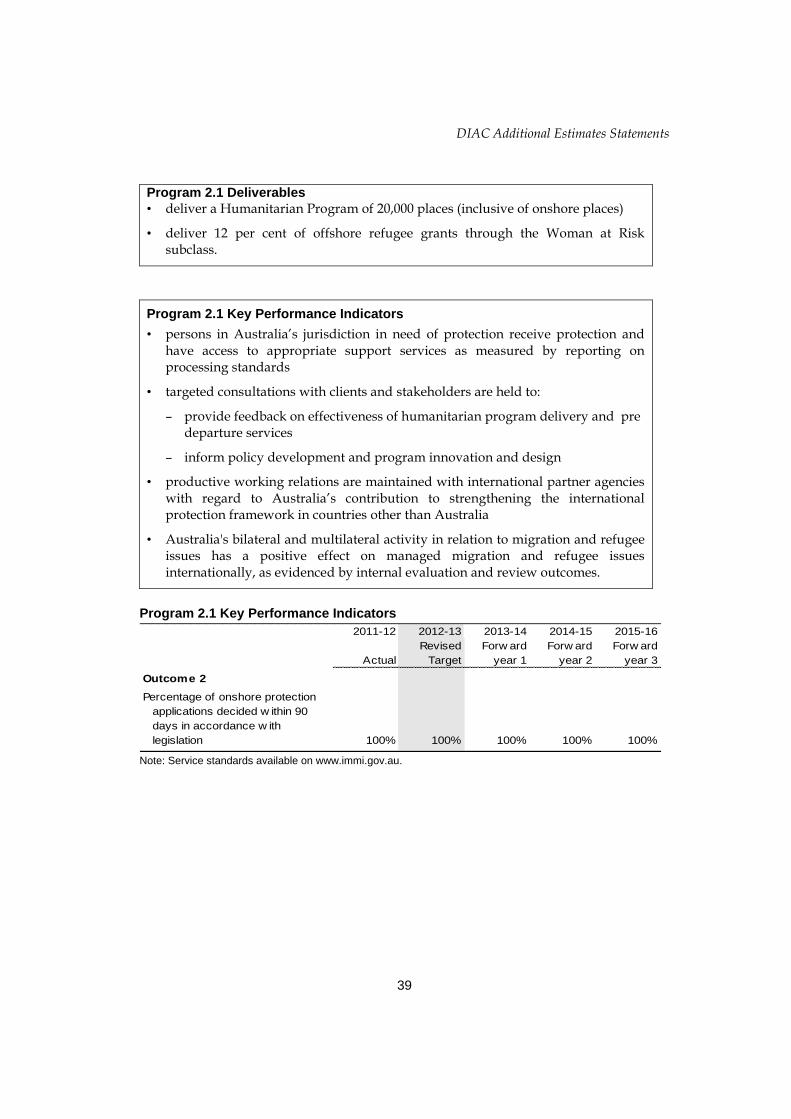
Program 2.1 Deliverables
• deliver a Humanitarian Program of 20,000 places (inclusive of onshore places)
• deliver 12 per cent of offshore refugee grants through the Woman at Risk subclass.
Program 2.1 Key Performance Indicators
• persons in Australia’s jurisdiction in need of protection receive protection and have access to appropriate support services as measured by reporting on processing standards
• targeted consultations with clients and stakeholders are held to:
– provide feedback on effectiveness of humanitarian program delivery and pre departure services
– inform policy development and program innovation and design
• productive working relations are maintained with international partner agencies with regard to Australia’s contribution to strengthening the international protection framework in countries other than Australia
• Australia's bilateral and multilateral activity in relation to migration and refugee issues has a positive effect on managed migration and refugee issues internationally, as evidenced by internal evaluation and review outcomes.
Program 2.1 Key Performance Indicators
2011-12 2012-13 2013-14 2014-15 2015-16
Revised Forw ard Forw ard Forw ard
Actual Target year 1 year 2 year 3
Outcome 2
Percentage of onshore protection
applications decided w ithin 90
days in accordance w ith
legislation 100%100% 100%100% 100%
Note: Service standards available on www.immi.gov.au.
DIAC Additional Estimates Statements
40
Administered items under Program 2.1: Refugee and Humanitarian Assistance
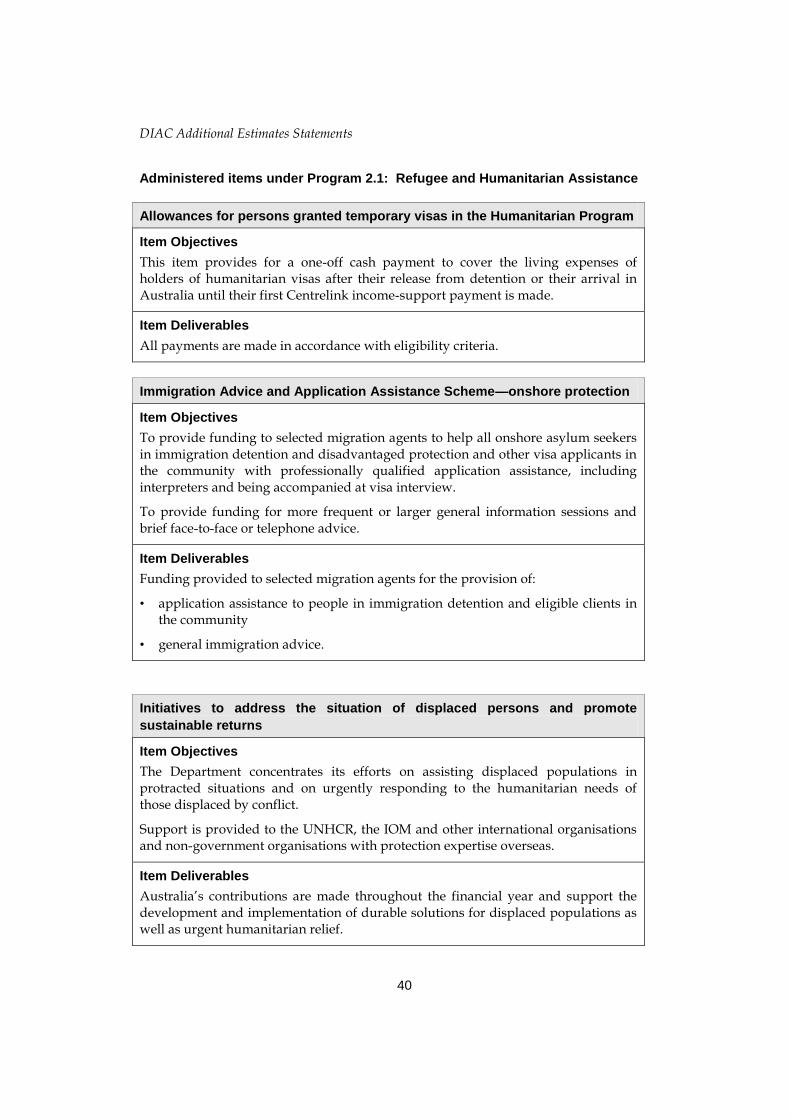
Allowances for persons granted temporary visas in the Humanitarian Program
Item Objectives
This item provides for a one-off cash payment to cover the living expenses of holders of humanitarian visas after their release from detention or their arrival in Australia until their first Centrelink income-support payment is made.
Item Deliverables
All payments are made in accordance with eligibility criteria.
Immigration Advice and Application Assistance Scheme—onshore protection
Item Objectives
To provide funding to selected migration agents to help all onshore asylum seekers in immigration detention and disadvantaged protection and other visa applicants in the community with professionally qualified application assistance, including interpreters and being accompanied at visa interview.
To provide funding for more frequent or larger general information sessions and brief face-to-face or telephone advice.
Item Deliverables
Funding provided to selected migration agents for the provision of:
• application assistance to people in immigration detention and eligible clients in the community
• general immigration advice.
Initiatives to address the situation of displaced persons and promote
sustainable returns
Item Objectives
The Department concentrates its efforts on assisting displaced populations in protracted situations and on urgently responding to the humanitarian needs of those displaced by conflict.
Support is provided to the UNHCR, the IOM and other international organisations and non-government organisations with protection expertise overseas.
Item Deliverables
Australia’s contributions are made throughout the financial year and support the development and implementation of durable solutions for displaced populations as well as urgent humanitarian relief.
DIAC Additional Estimates Statements
41
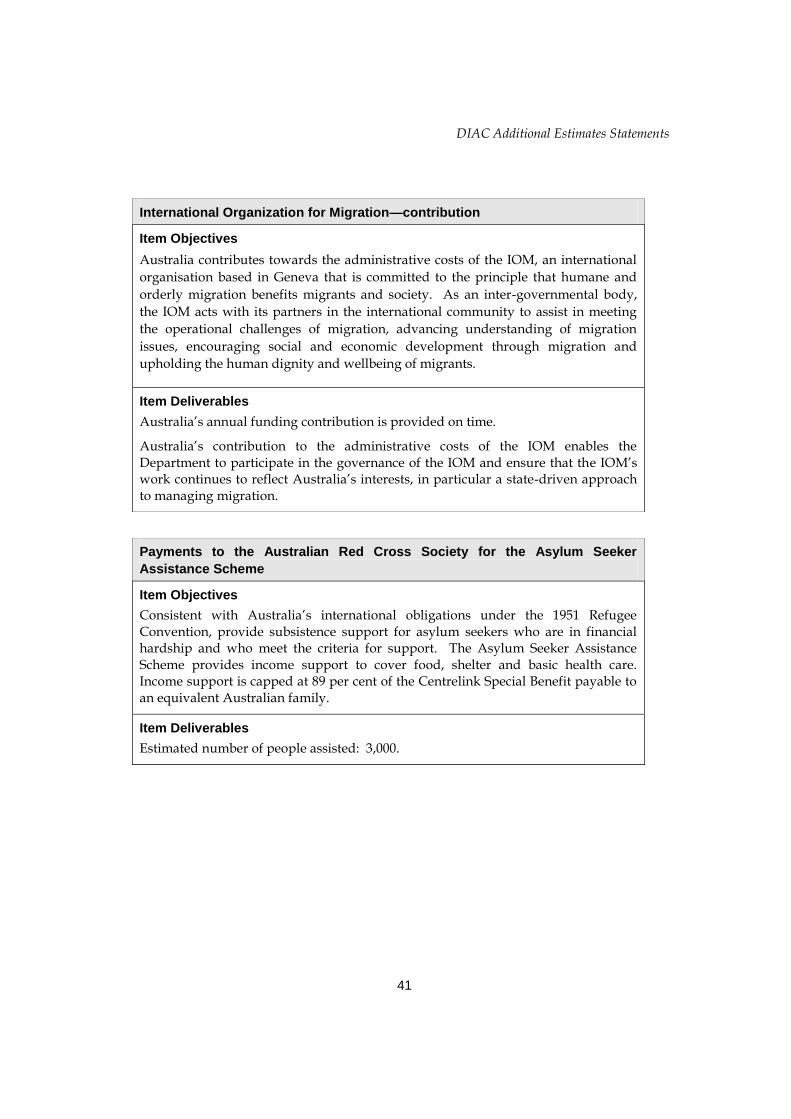
Payments to the Australian Red Cross Society for the Asylum Seeker
Assistance Scheme
Item Objectives
Consistent with Australia’s international obligations under the 1951 Refugee Convention, provide subsistence support for asylum seekers who are in financial hardship and who meet the criteria for support. The Asylum Seeker Assistance Scheme provides income support to cover food, shelter and basic health care. Income support is capped at 89 per cent of the Centrelink Special Benefit payable to an equivalent Australian family.
Item Deliverables
Estimated number of people assisted: 3,000.
International Organization for Migration—contribution
Item Objectives
Australia contributes towards the administrative costs of the IOM, an international
organisation based in Geneva that is committed to the principle that humane and
orderly migration benefits migrants and society. As an inter-governmental body,
the IOM acts with its partners in the international community to assist in meeting
the operational challenges of migration, advancing understanding of migration
issues, encouraging social and economic development through migration and
upholding the human dignity and wellbeing of migrants.
Item Deliverables
Australia’s annual funding contribution is provided on time.
Australia’s contribution to the administrative costs of the IOM enables the Department to participate in the governance of the IOM and ensure that the IOM’s work continues to reflect Australia’s interests, in particular a state-driven approach to managing migration.
DIAC Additional Estimates Statements
42
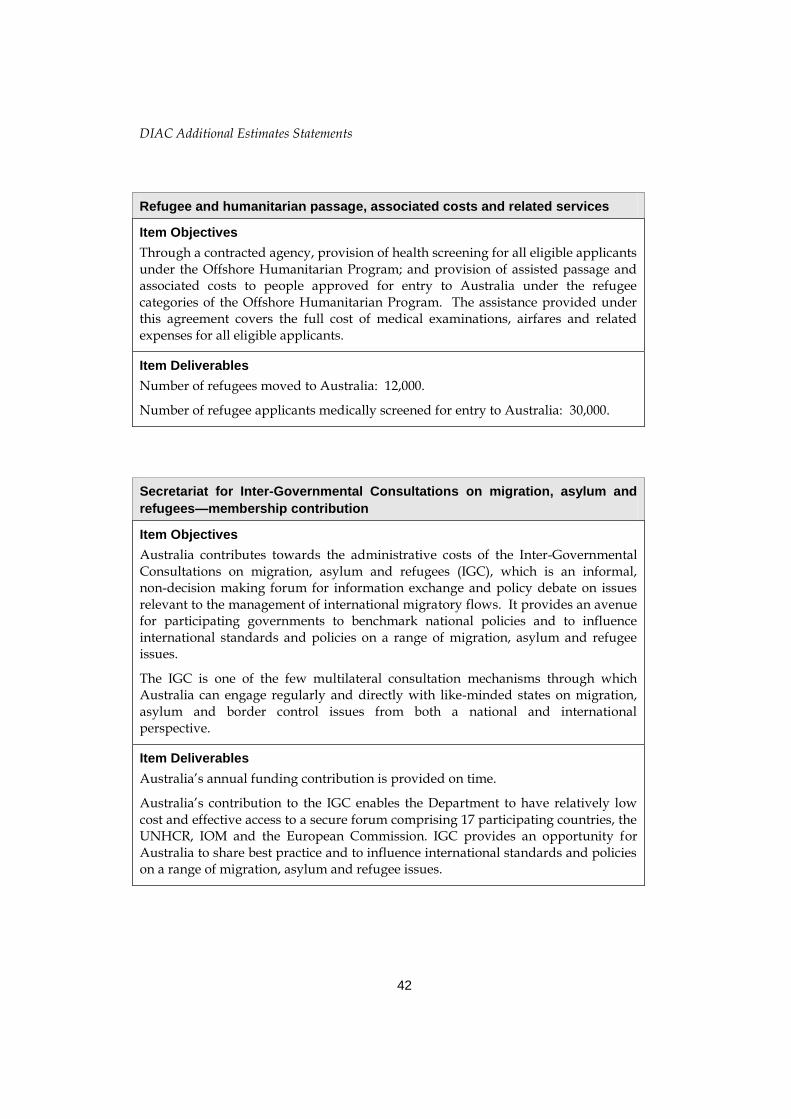
Secretariat for Inter-Governmental Consultations on migration, asylum and
refugees—membership contribution
Item Objectives
Australia contributes towards the administrative costs of the Inter-Governmental Consultations on migration, asylum and refugees (IGC), which is an informal, non-decision making forum for information exchange and policy debate on issues relevant to the management of international migratory flows. It provides an avenue for participating governments to benchmark national policies and to influence international standards and policies on a range of migration, asylum and refugee issues.
The IGC is one of the few multilateral consultation mechanisms through which Australia can engage regularly and directly with like-minded states on migration, asylum and border control issues from both a national and international perspective.
Item Deliverables
Australia’s annual funding contribution is provided on time.
Australia’s contribution to the IGC enables the Department to have relatively low cost and effective access to a secure forum comprising 17 participating countries, the UNHCR, IOM and the European Commission. IGC provides an opportunity for Australia to share best practice and to influence international standards and policies on a range of migration, asylum and refugee issues.
Refugee and humanitarian passage, associated costs and related services
Item Objectives
Through a contracted agency, provision of health screening for all eligible applicants under the Offshore Humanitarian Program; and provision of assisted passage and associated costs to people approved for entry to Australia under the refugee categories of the Offshore Humanitarian Program. The assistance provided under this agreement covers the full cost of medical examinations, airfares and related expenses for all eligible applicants.
Item Deliverables
Number of refugees moved to Australia: 12,000.
Number of refugee applicants medically screened for entry to Australia: 30,000.

DIAC Additional Estimates Statements
43
Outcome 3: Lawful entry of people to Australia through border management
services involving bona fide traveller facilitation; identity management;
document verification; intelligence analysis; partnerships with international
and domestic agencies; and border policy advice and program design.
Outcome 3 Strategy
The key initiatives and major strategies contributing to Outcome 3 in 2012-13 are to:
• enhance the Department’s ability, through international and inter-jurisdictional agreements, biometric technology and tools, to acquire (offshore and onshore) and use identity information
• support law enforcement and security agencies in preventing the entry of people who are a direct or indirect threat to the Australian community and to national security and contribute to the Australian Government’s efforts in relation to counter terrorism
• prevent and deter unauthorised and irregular entry to Australia by working closely with overseas governments, international organisations, airlines, shipping companies and other agencies through the use of information, intelligence and technology
• maintain and where appropriate develop new intelligence led risk-based entry policies and procedures, which facilitate the orderly arrival and departure of travellers whilst maintaining integrity
• maintain the integrity of the border by closely working with other border agencies to maintain and improve effective screening, through initiatives and international fora that aim to strengthen border integrity within the Asia and Pacific regions
• enhance the Department’s ability to detect and minimise identity and document fraud
• contribute to whole of government initiatives on identity fraud and transnational organised crime
• maintain a capacity to coordinate and contribute to engagement in whole of government responses to offshore emergencies.

DIAC Additional Estimates Statements
44
Outcome 3 Expense Statement
Table 2.1.3 provides an overview of the total expenses for Outcome 3, by program.
Table 2.1.3: Budgeted Expenses and Resources for Outcome 3
2011-12 2012-13
Actual Revised
expenses estimated
expenses
$'000 $'000
Program 3.1: Border Management
Administered expenses
Ordinary annual services 1 279 -
Total for Program 3.1 279 -
Program 3.1.1: Border Management - Service Delivery
Departmental expenses
Departmental appropriation 2 88,367 85,377
Expenses not requiring appropriation in the Budget year 3 5,279 6,909
Total for Program 3.1.1 93,646 92,286
Program 3.1.2: Border Management - Policy Advice
and Program Design
Departmental expenses
Departmental appropriation 2 46,450 35,635
Expenses not requiring appropriation in the Budget year 3 7,953 10,628
Total for Program 3.1.2 54,403 46,263
Outcome 3 Totals by appropriation type
Administered expenses
Ordinary annual services 1 279 -
Departmental expenses
Departmental appropriation 2 134,818 121,012
Expenses not requiring appropriation in the Budget year 3 13,231 17,537
Total expenses for Outcome 3 148,328 138,549
2011-12 2012-13
Average Staffing Level (number) 718 684 1. Ordinary annual services include Appropriation Act (No. 1) 2012-13 & Appropriation Bill (No. 3) 2012-13 2. Departmental Appropriation combines ‘Ordinary annual services (Appropriation Act No. 1 & Appropriation
Bill No. 3)’ and ‘Revenue from independent sources (s31)’ 3. Expenses not requiring appropriation in the Budget year consists of Depreciation and Amortisation
Expense. Note: Departmental appropriation amounts are estimates and may change in the course of the budget year as Government priorities change.

DIAC Additional Estimates Statements
45
Contributions to Outcome 3
Program 3.1: Border Management
Program Objective
Effectively facilitate entry of genuine travellers to Australia while preventing entry
of those likely to threaten the national interest, as achieved through a
whole-of-government, layered approach to border management.
Linked to:
• Australian Customs and Border Protection Service
• Attorney-General’s Department.
Table 2.2.3: Program Expenses Outcome 3
2011-12 2012-13 2013-14 2014-15 2015-16
Actual Revised Forw ard Forw ard Forw ard
budget year 1 year 2 year 3
$'000 $'000 $'000 $'000 $'000
Annual Administered Expenses 279 - - - -
Annual Departmental Expenses 134,818 121,012 124,076 130,923 150,537
Expenses not requiring appropriation
in the Budget year 1 13,231 17,537 17,669 15,157 14,979
Total program expenses 148,328 138,549 141,745 146,080 165,516
1. Expenses not requiring appropriation in the Budget year consists of Depreciation and Amortisation Expense.

DIAC Additional Estimates Statements
46
Table 2.3.3: Program Component Expenses for Outcome 3
2011-12 2012-13 2013-14 2014-15 2015-16
Actual Revised Forw ard Forw ard Forw ard
budget year 1 year 2 year 3
$'000 $'000 $'000 $'000 $'000
Program 3.1: Border Management
Annual administered expenses
Combating people smuggling 285 - - - -
Border Protection
Combating people smuggling
Indonesian Border Management Capacity (6) - - - -
Building Partnership
Total administered expenses
Program 3.1 279 - - - -
Annual departmental expenses
Program 3.1.1: Border Management -
Service Delivery
Borders 64,891 62,572 65,684 70,256 79,428
Identity 28,755 29,714 29,987 31,823 37,175
Total departmental expenses
Program 3.1.1 93,646 92,286 95,671 102,079 116,603
Program 3.1.2: Border Management -
Policy Advice and Program Design
Borders 32,951 26,819 25,945 24,874 27,792
Identity 21,452 19,444 20,129 19,127 21,121
Total departmental expenses
Program 3.1.2 54,403 46,263 46,074 44,001 48,913
Total administered expenses 279 - - - -
Total departmental expenses 148,049 138,549 141,745 146,080 165,516
Total program expenses Outcome 3 148,328 138,549 141,745 146,080 165,516
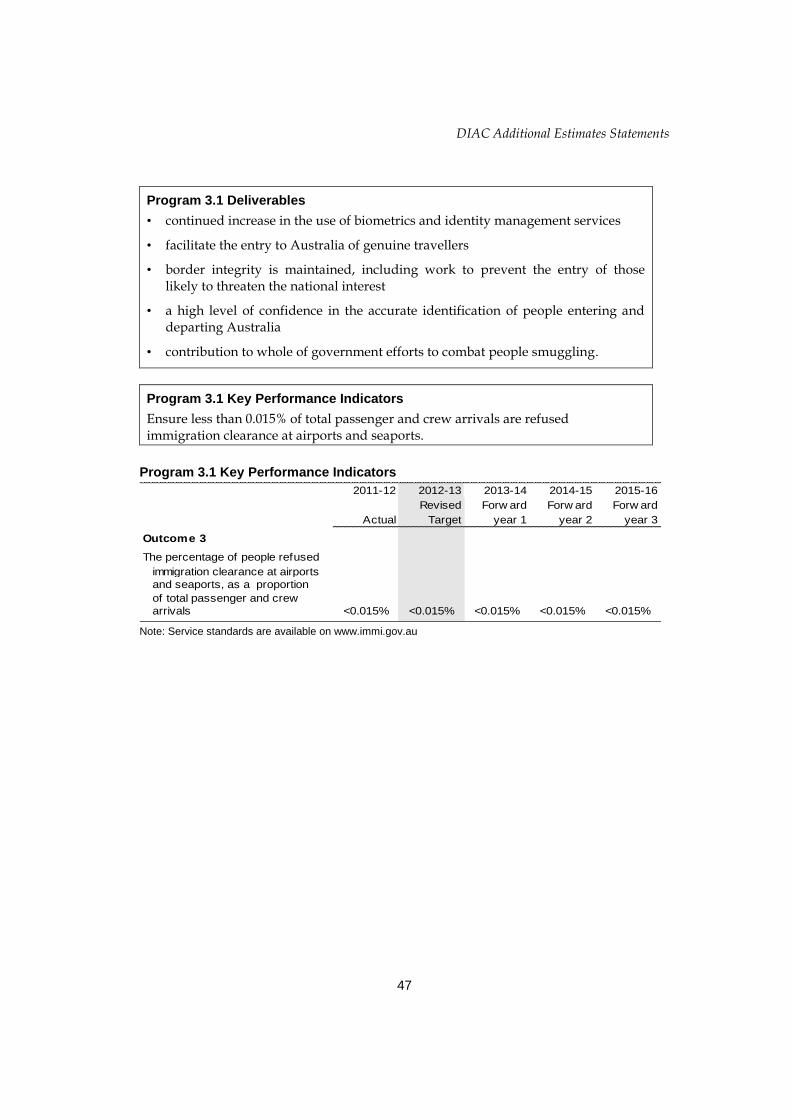
DIAC Additional Estimates Statements
47
Program 3.1 Deliverables
• continued increase in the use of biometrics and identity management services
• facilitate the entry to Australia of genuine travellers
• border integrity is maintained, including work to prevent the entry of those likely to threaten the national interest
• a high level of confidence in the accurate identification of people entering and departing Australia
• contribution to whole of government efforts to combat people smuggling.
Program 3.1 Key Performance Indicators
Ensure less than 0.015% of total passenger and crew arrivals are refused immigration clearance at airports and seaports.
Program 3.1 Key Performance Indicators
2011-12 2012-13 2013-14 2014-15 2015-16
Revised Forw ard Forw ard Forw ard
Actual Target year 1 year 2 year 3
Outcome 3
The percentage of people refused
immigration clearance at airports
and seaports, as a proportion
of total passenger and crew
arrivals <0.015%<0.015% <0.015% <0.015% <0.015%
Note: Service standards are available on www.immi.gov.au

DIAC Additional Estimates Statements
48
Outcome 4 Strategy
To achieve this outcome, the Department will:
• support the integrity of Australia's visa and citizenship programs by enabling staff within the Department and other agencies to identify and respond to breaches of immigration and citizenship law or other irregularities in an appropriate manner
• maximise voluntary compliance by raising awareness of Australia's immigration and citizenship laws through a variety of media, education and training programs and communication with clients, and stakeholders through collaboration with other Government service providers
• deter non-citizens from overstaying or breaching their visa conditions through prompt and effective enforcement of immigration and citizenship law
• reduce the incidence of people working illegally, deter people smugglers, investigate offences under migration and citizenship law by migration agents, employers or intermediaries, and undertake employer awareness activities through an active compliance strategy
• administer the immigration detention of unlawful non-citizens, including Irregular Maritime Arrivals (IMAs) and foreign fishers in accordance with law and government policy by the provision of appropriate care, facilities and options for their lawful, humane and efficient detention
• efficiently and effectively develop and manage changes to detention infrastructure as necessary
• facilitate the continued use of residence determination (known as Community Detention) to enable children, families and vulnerable clients to live in the community with appropriate support while their status is being resolved
• manage people who are granted Bridging Visas, including IMAs to achieve an immigration outcome through early intervention and provision of needs-based support and assistance
Outcome 4: Lawful stay of visa holders and access to citizenship rights for
eligible people through promotion of visa compliance responsibilities, status
resolution, citizenship acquisition integrity, case management, removal and
detention, and policy advice and program design.

DIAC Additional Estimates Statements
49
• secure the return of people who do not have a right to remain in Australia, and those to whom Australia does not owe a protection obligation, including unlawful non-citizens, IMAs and foreign fishers
• strengthen the migration and border management capabilities of governments in the Asia-Pacific region and parts of South Asia and the Middle East
• assist the facilitation of bona fide people movements while preventing and deterring irregular movements, including people smuggling and trafficking, in our region and in source/transit countries
• support international organisations in the care of irregular migrants intercepted en route to Australia
• provide funding to the IOM to enhance Indonesian immigration detention and transit facilities
• provide resources including infrastructure to support, manage and oversee agreed bilateral and multilateral arrangements under the Regional Cooperation Framework and other measures for harmonisation of treatment of asylum seekers across the region
• support and facilitate timely and efficient independent merits reviews and judicial reviews of refugee status determination for IMAs, and treat people fairly and reasonably within the law.
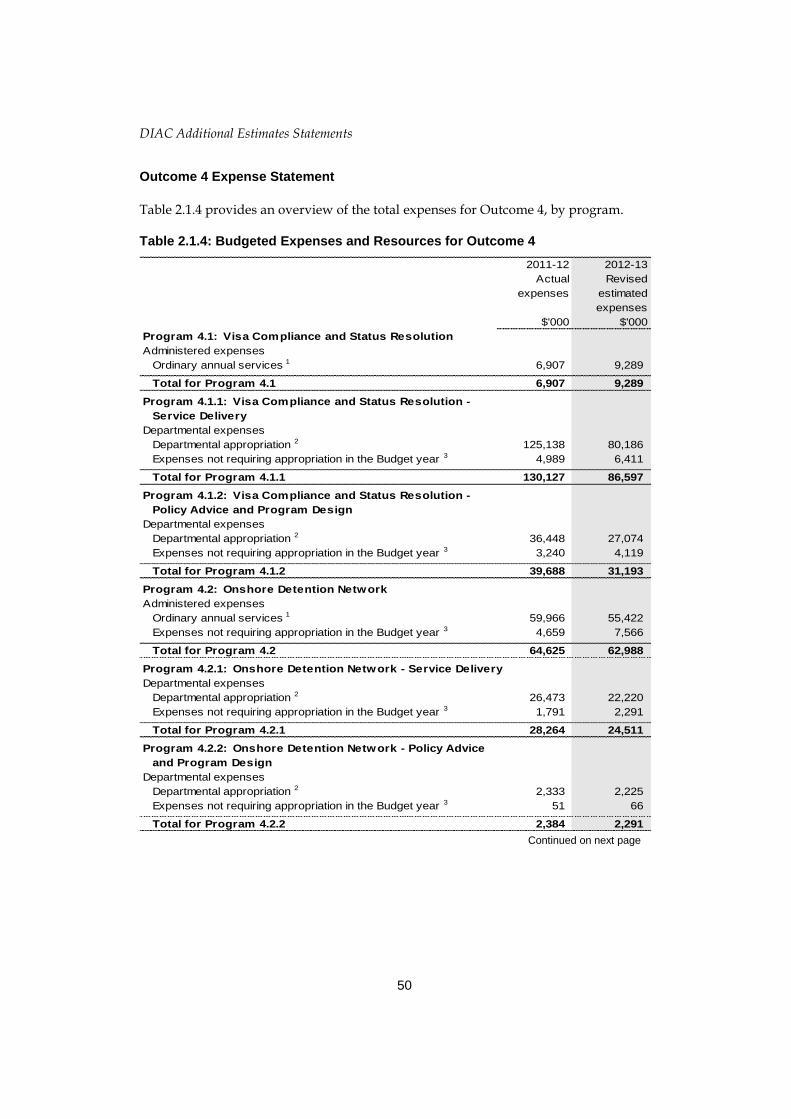
DIAC Additional Estimates Statements
50
Outcome 4 Expense Statement
Table 2.1.4 provides an overview of the total expenses for Outcome 4, by program.
Table 2.1.4: Budgeted Expenses and Resources for Outcome 4
2011-12 2012-13
Actual Revised
expenses estimated
expenses
$'000 $'000
Program 4.1: Visa Compliance and Status Resolution
Administered expenses
Ordinary annual services 1 6,907 9,289
Total for Program 4.1 6,907 9,289
Program 4.1.1: Visa Compliance and Status Resolution -
Service Delivery
Departmental expenses
Departmental appropriation 2 125,138 80,186
Expenses not requiring appropriation in the Budget year 3 4,989 6,411
Total for Program 4.1.1 130,127 86,597
Program 4.1.2: Visa Compliance and Status Resolution -
Policy Advice and Program Design
Departmental expenses
Departmental appropriation 2 36,448 27,074
Expenses not requiring appropriation in the Budget year 3 3,240 4,119
Total for Program 4.1.2 39,688 31,193
Program 4.2: Onshore Detention Network
Administered expenses
Ordinary annual services 1 59,966 55,422
Expenses not requiring appropriation in the Budget year 3 4,659 7,566
Total for Program 4.2 64,625 62,988
Program 4.2.1: Onshore Detention Network - Service Delivery
Departmental expenses
Departmental appropriation 2 26,473 22,220
Expenses not requiring appropriation in the Budget year 3 1,791 2,291
Total for Program 4.2.1 28,264 24,511
Program 4.2.2: Onshore Detention Network - Policy Advice
and Program Design
Departmental expenses
Departmental appropriation 2 2,333 2,225
Expenses not requiring appropriation in the Budget year 3 51 66
Total for Program 4.2.2 2,384 2,291 Continued on next page
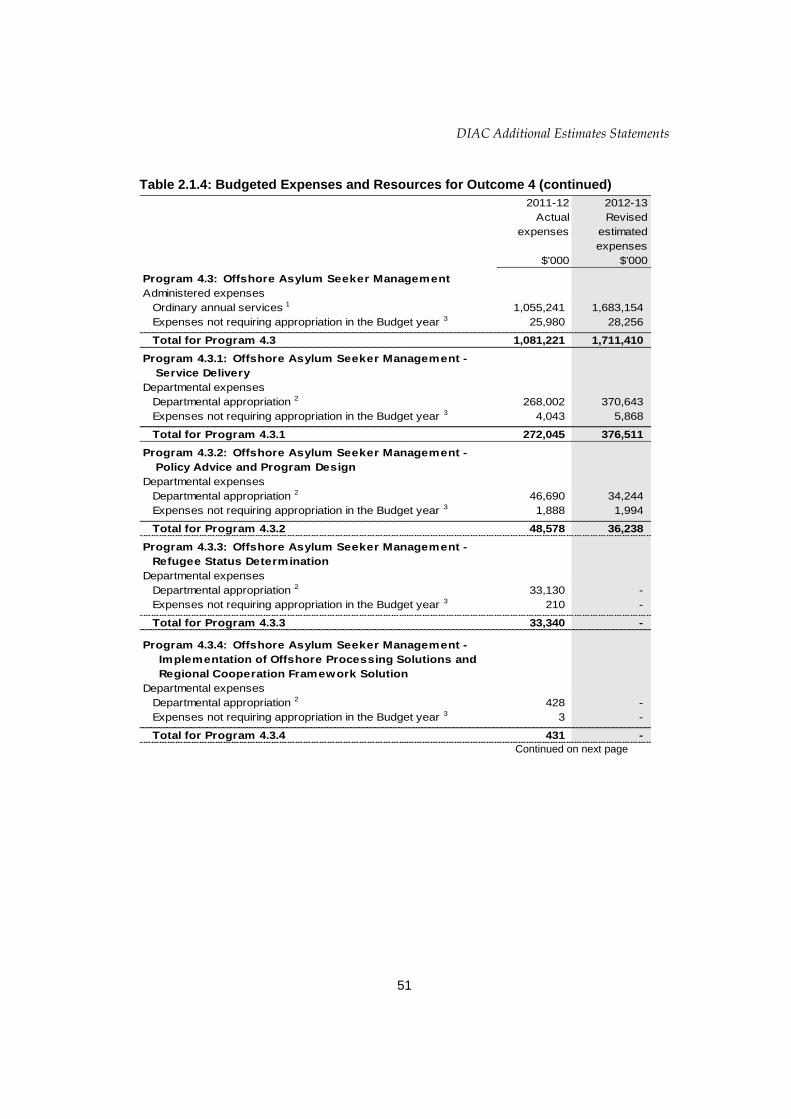
DIAC Additional Estimates Statements
51
Table 2.1.4: Budgeted Expenses and Resources for Outcome 4 (continued)
2011-12 2012-13
Actual Revised
expenses estimated
expenses
$'000 $'000
Program 4.3: Offshore Asylum Seeker Management
Administered expenses
Ordinary annual services 1 1,055,241 1,683,154
Expenses not requiring appropriation in the Budget year 3 25,980 28,256
Total for Program 4.3 1,081,221 1,711,410
Program 4.3.1: Offshore Asylum Seeker Management -
Service Delivery
Departmental expenses
Departmental appropriation 2 268,002 370,643
Expenses not requiring appropriation in the Budget year 3 4,043 5,868
Total for Program 4.3.1 272,045 376,511
Program 4.3.2: Offshore Asylum Seeker Management -
Policy Advice and Program Design
Departmental expenses
Departmental appropriation 2 46,690 34,244
Expenses not requiring appropriation in the Budget year 3 1,888 1,994
Total for Program 4.3.2 48,578 36,238
Program 4.3.3: Offshore Asylum Seeker Management -
Refugee Status Determination
Departmental expenses
Departmental appropriation 2 33,130 -
Expenses not requiring appropriation in the Budget year 3 210 -
Total for Program 4.3.3 33,340 -
Program 4.3.4: Offshore Asylum Seeker Management -
Implementation of Offshore Processing Solutions and
Regional Cooperation Framework Solution
Departmental expenses
Departmental appropriation 2 428 -
Expenses not requiring appropriation in the Budget year 3 3 -
Total for Program 4.3.4 431 - Continued on next page
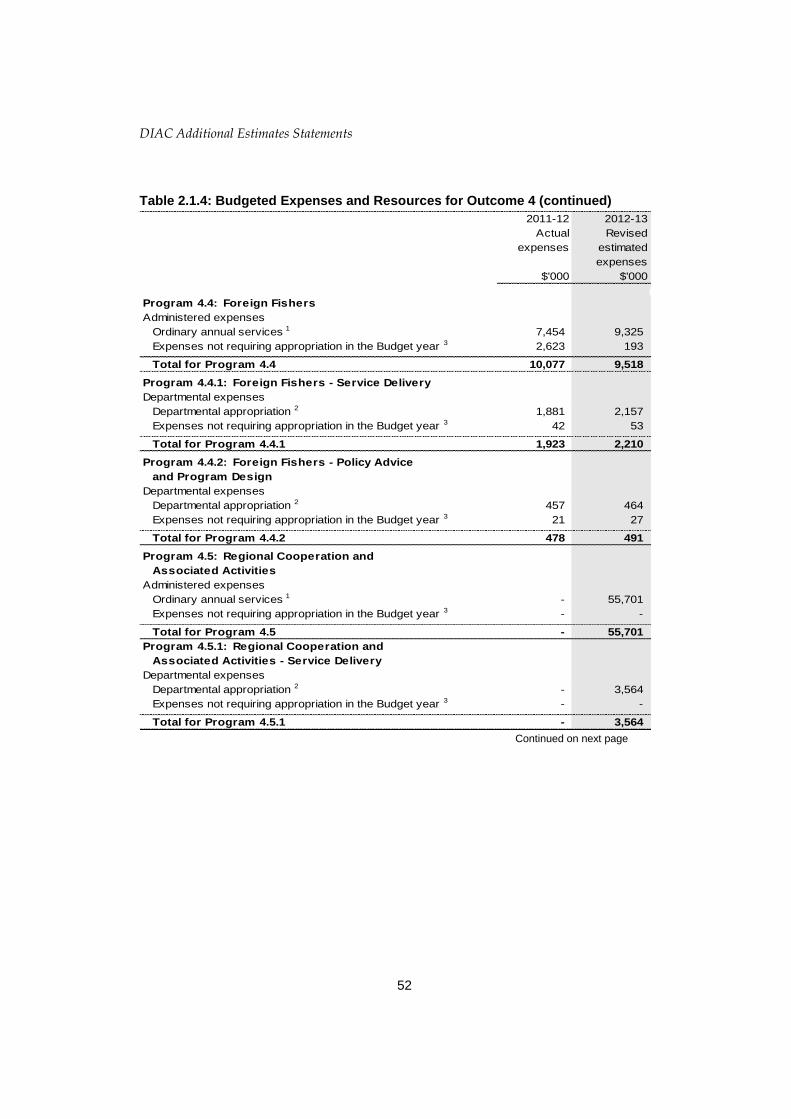
DIAC Additional Estimates Statements
52
Table 2.1.4: Budgeted Expenses and Resources for Outcome 4 (continued)
2011-12 2012-13
Actual Revised
expenses estimated
expenses
$'000 $'000
Program 4.4: Foreign Fishers
Administered expenses
Ordinary annual services 1 7,454 9,325
Expenses not requiring appropriation in the Budget year 3 2,623 193
Total for Program 4.4 10,077 9,518
Program 4.4.1: Foreign Fishers - Service Delivery
Departmental expenses
Departmental appropriation 2 1,881 2,157
Expenses not requiring appropriation in the Budget year 3 42 53
Total for Program 4.4.1 1,923 2,210
Program 4.4.2: Foreign Fishers - Policy Advice
and Program Design
Departmental expenses
Departmental appropriation 2 457 464
Expenses not requiring appropriation in the Budget year 3 21 27
Total for Program 4.4.2 478 491
Program 4.5: Regional Cooperation and
Associated Activities
Administered expenses
Ordinary annual services 1 - 55,701
Expenses not requiring appropriation in the Budget year 3 - -
Total for Program 4.5 - 55,701
Program 4.5.1: Regional Cooperation and
Associated Activities - Service Delivery
Departmental expenses
Departmental appropriation 2 - 3,564
Expenses not requiring appropriation in the Budget year 3 - -
Total for Program 4.5.1 - 3,564 Continued on next page

DIAC Additional Estimates Statements
53
Table 2.1.4: Budgeted Expenses and Resources for Outcome 4 (continued)
2011-12 2012-13
Actual Revised
expenses estimated
expenses
$'000 $'000
Program 4.5.2: Regional Cooperation and Associated
Activities - Policy Advice and Program Design
Departmental expenses
Departmental appropriation 2 - 8,637
Expenses not requiring appropriation in the Budget year 3 - -
Total for Program 4.5.2 - 8,637
Program 4.6: Refugee Status Determinations
for Offshore Entry Persons
Administered expenses
Ordinary annual services 1 - 13,617
Expenses not requiring appropriation in the Budget year 3 - -
Total for Program 4.6 - 13,617
Program 4.6.1: Refugee Status Determinations
for Offshore Entry Persons - Service Delivery
Departmental expenses
Departmental appropriation 2 - 27,186
Expenses not requiring appropriation in the Budget year 3 - -
Total for Program 4.6.1 - 27,186
Outcome 4 Totals by appropriation type
Administered Expenses
Ordinary annual services 1 1,129,569 1,826,508
Expenses not requiring appropriation in the Budget year 3 33,262 36,015
Departmental expenses
Departmental appropriation 2 540,979 578,600
Expenses not requiring appropriation in the Budget year 3 16,278 20,829
Total expenses for Outcome 4 1,720,087 2,461,952
2011-12 2012-13
Average Staffing Level (number) 2,691 2,990 1. Ordinary annual services include Appropriation Act (No. 1) 2012-13, Appropriation (Implementation
of the Report of the Expert Panel on Asylum Seekers) Act (No. 1) 2012-13 & Appropriation Bill (No. 3) 2012-13.
2. Departmental Appropriation combines ‘Ordinary annual services (Appropriation Act No. 1 & Appropriation Bill No. 3)’ and ‘Revenue from independent sources (s31)’.
3. Expenses not requiring appropriation in the Budget year consists of Depreciation and Amortisation Expense. Note: Departmental appropriation amounts are estimates and may change in the course of the budget year as Government priorities change.

DIAC Additional Estimates Statements
54
Contributions to Outcome 4
Program 4.1: Visa Compliance and Status Resolution
Program Objective
To design, manage and undertake an effective program of prevention and deterrence with enforcement used as a last resort that seeks to:
• achieve adherence to Australian entry and stay requirements
• identify and respond to suspected breaches of immigration and citizenship law in Australia
• detect and locate persons who have no lawful authority to be in Australia or are in breach of conditions that apply to their visa (for example, people working in breach of their conditions)
• protect the public through the cancellation or refusal of visas to non-citizens who may be of concern to the public for reasons such as their involvement in serious criminal activity
• obtain a substantive immigration outcome for unlawful non-citizens or Bridging Visa E holders in a lawful, timely, fair and reasonable manner .
Program 4.1 Expenses
There are no significant variations in respect of the estimate of expenses in relation
to this program for 2012-13.
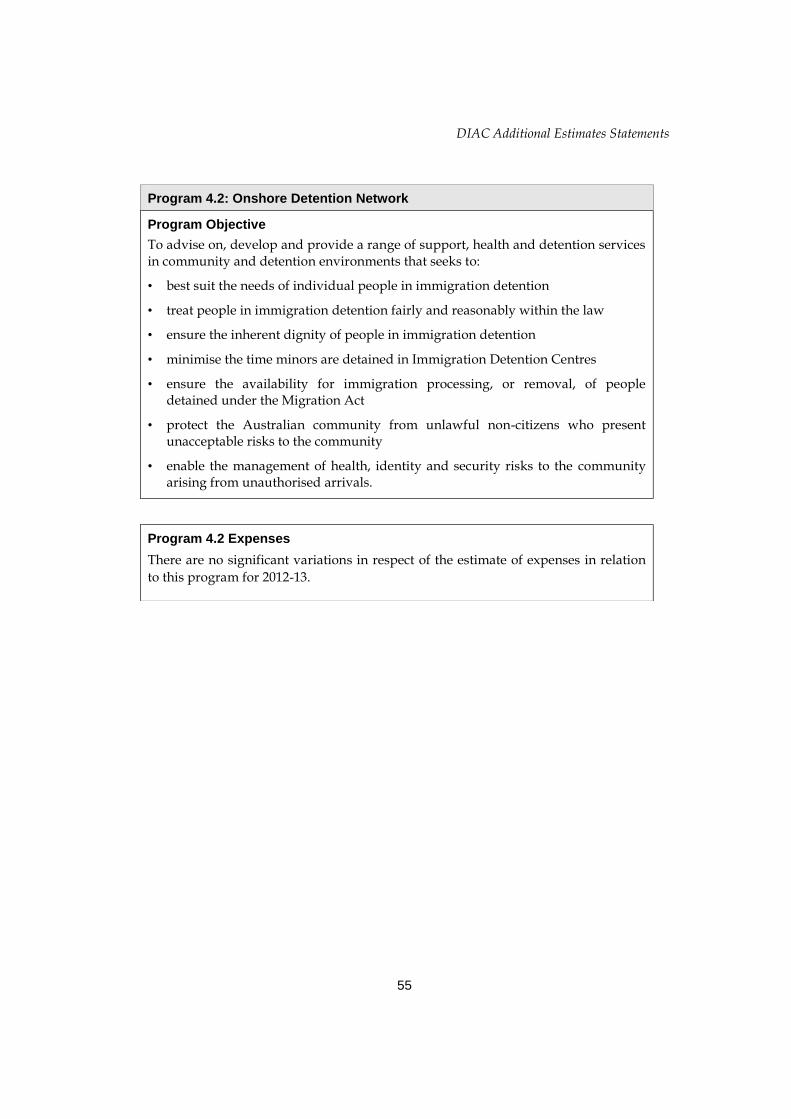
DIAC Additional Estimates Statements
55
Program 4.2: Onshore Detention Network
Program Objective
To advise on, develop and provide a range of support, health and detention services in community and detention environments that seeks to:
• best suit the needs of individual people in immigration detention
• treat people in immigration detention fairly and reasonably within the law
• ensure the inherent dignity of people in immigration detention
• minimise the time minors are detained in Immigration Detention Centres
• ensure the availability for immigration processing, or removal, of people detained under the Migration Act
• protect the Australian community from unlawful non-citizens who present unacceptable risks to the community
• enable the management of health, identity and security risks to the community arising from unauthorised arrivals.
Program 4.2 Expenses
There are no significant variations in respect of the estimate of expenses in relation
to this program for 2012-13.

DIAC Additional Estimates Statements
56
Program 4.3: Offshore Asylum-Seeker Management
Program Objective
To advise on, develop and provide a range of support, health care and services in regional processing centres, community and onshore detention environments for Irregular Maritime Arrivals (IMAs), that seeks to:
• best suit the needs of individual people transferred to regional processing centres, in immigration detention or on a Bridging Visa E
• treat people in detention and the community fairly and reasonably within the law
• ensure the inherent dignity of people in immigration detention and on a Bridging Visa E
• minimise the time minors are detained in Immigration Detention Centres
• ensure the availability for immigration processing, or the removal, of people under the Migration Act
• enable the management of health, identity and security risks to the community arising from IMAs
• encourage cooperation and voluntary compliance of IMAs, whether in detention or on a Bridging Visa E, in respect of resolving their status
• remove from Australia IMAs who are not owed protection by Australia and who have no lawful basis to remain
• assist the Independent State of Papua New Guinea and the Republic of Nauru to best meet the needs, and ensure the inherent dignity, of people transferred for regional processing .
Program 4.3 Expenses
The increase in estimated expenditure for this program reflects the continued
increase in arrivals of IMAs and the response to the Report of the Expert Panel on
Asylum Seekers. With the implementation of the recommendations in relation to
Regional Processing Centres, appropriations have increased through the
Appropriation (Implementation of the Report of the Expert Panel on Asylum
Seekers) Act (no.1) 2012-13 to enable these facilities to become established and
commence taking clients. This Appropriation also included additional funding
required to cover the increased expenditure in relation to the increase in arrivals.
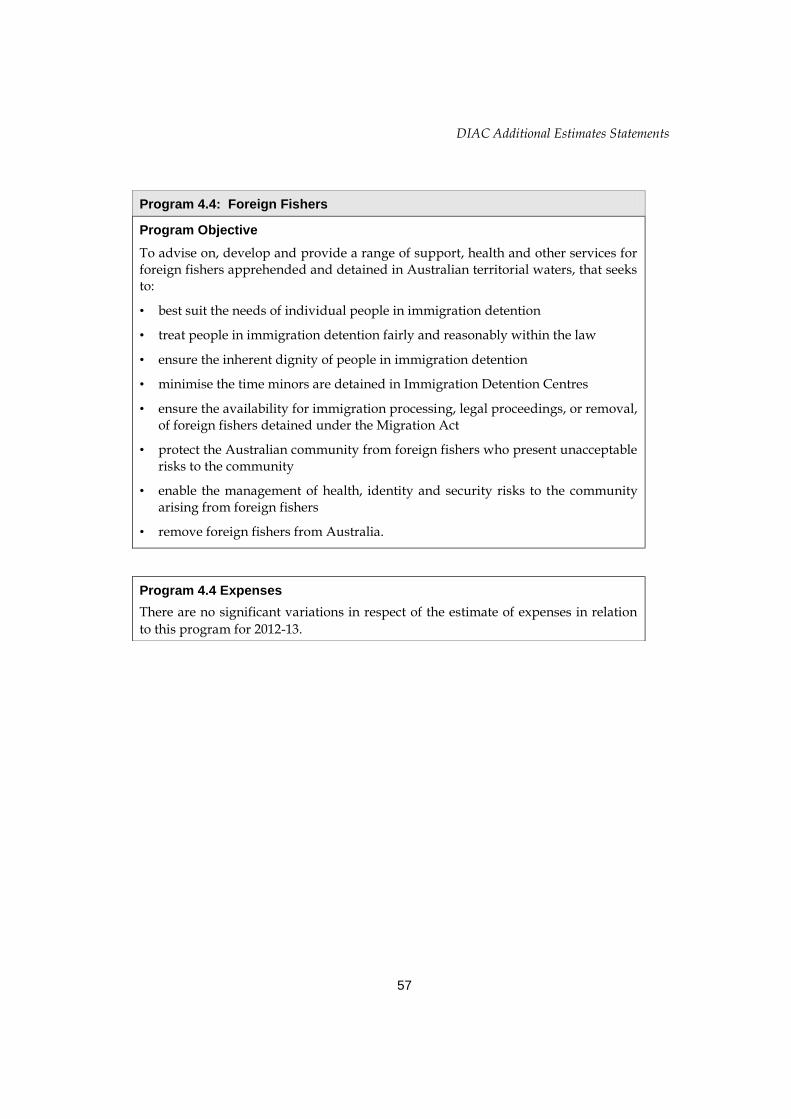
DIAC Additional Estimates Statements
57
Program 4.4: Foreign Fishers
Program Objective
To advise on, develop and provide a range of support, health and other services for foreign fishers apprehended and detained in Australian territorial waters, that seeks to:
• best suit the needs of individual people in immigration detention
• treat people in immigration detention fairly and reasonably within the law
• ensure the inherent dignity of people in immigration detention
• minimise the time minors are detained in Immigration Detention Centres
• ensure the availability for immigration processing, legal proceedings, or removal, of foreign fishers detained under the Migration Act
• protect the Australian community from foreign fishers who present unacceptable risks to the community
• enable the management of health, identity and security risks to the community arising from foreign fishers
• remove foreign fishers from Australia.
Program 4.4 Expenses
There are no significant variations in respect of the estimate of expenses in relation
to this program for 2012-13.

DIAC Additional Estimates Statements
58
Program 4.5: Regional Cooperation & Associated Activities
Program Objective
To strengthen the migration and border management capabilities of governments in the Asia-Pacific region and parts of South Asia and the Middle East by providing advice on, developing and providing a range of support and other services in respect of regional cooperation and associated activities, that seeks to:
• assist the facilitation of bona fide people movements while preventing and deterring irregular movements, including people smuggling and trafficking, in our region and in source/transit countries
• support international organisations for the care of irregular migrants intercepted en route to Australia
• provide funding to the IOM to enhance Indonesian immigration detention and transit facilities
• provide assistance, training and resources to support, manage and oversee agreed bilateral and multilateral arrangements under the Regional Cooperation Framework and other measures for the effective management and harmonisation of treatment of asylum seekers across the region
• assist in the establishment of a Regional Support Office to take forward a range of practical initiatives under the auspices of the Regional Cooperation Framework.
Program 4.5 Expenses
The increase in this program is due to the Report of the Expert Panel on Asylum
Seekers and the recommendations which involved an increase in Regional Capacity
Building initiatives.

DIAC Additional Estimates Statements
59
Table 2.2.4: Program Expenses Outcome 4
2011-12 2012-13 2013-14 2014-15 2015-16
Actual Revised Forw ard Forw ard Forw ard
budget year 1 year 2 year 3
$'000 $'000 $'000 $'000 $'000
Annual Administered Expenses 1,129,568 1,826,508 1,073,136 306,603 215,112
Annual Departmental Expenses 540,979 578,600 416,112 328,960 315,550
Expenses not requiring appropriation
in the Budget year 1 49,540 56,844 56,559 52,869 51,841
Total program expenses 1,720,087 2,461,952 1,545,807 688,432 582,503
1. Expenses not requiring appropriation in the Budget year consists of Depreciation and Amortisation Expense.
Program 4.6: Refugee Status Determination for Offshore Entry Persons
Program Objective
To provide a range of support and other services in respect of refugee status determination for IMAs, that seeks to:
• facilitate independent merits reviews by the Independent Protection Assessment Office to be carried out and concluded as expeditiously and efficiently as possible
• support the courts and administrative tribunals to ensure the delivery of timely and efficient judicial reviews
• treat people fairly and reasonably within the law.
Program 4.6 Expenses
The estimates for this program are expected to decrease in line with the decline in
the caseload of the Independent Protection Assessment Office as a result of the
Government decision to move to a single protection visa process and the
responsibility for merits reviews of refugee status determinations to transition to the
Refugee Review Tribunal.

DIAC Additional Estimates Statements
60
Table 2.3.4: Program Component Expenses for Outcome 4
2011-12 2012-13 2013-14 2014-15 2015-16
Actual Revised Forw ard Forw ard Forw ard
budget year 1 year 2 year 3
$'000 $'000 $'000 $'000 $'000
Program 4.1: Visa Compliance and
Status Resolution
Annual administered expenses
Compliance Resolution, Community
Care and Assistance 6,907 9,289 9,457 9,940 10,211
Total administered expenses
Program 4.1 6,907 9,289 9,457 9,940 10,211
Annual departmental expenses
Program 4.1.1: Visa Compliance
Status Resolution - Service Delivery
Detection Onshore 63,847 52,131 54,003 55,762 57,599
Removals 25,225 16,786 16,996 16,950 17,092
Status Resolution 41,055 17,680 17,688 17,415 17,517
Total departmental expenses
Program 4.1.1 130,127 86,597 88,687 90,127 92,208
Program 4.1.2: Visa Compliance &
Status Resolution - Policy Advice
and Program Design
Detection Onshore 15,474 20,155 20,109 19,968 19,962
Removals 11,053 4,944 4,969 4,813 4,824
Status Resolution 13,161 6,094 6,108 6,067 6,111
Total departmental expenses
Program 4.1.2 39,688 31,193 31,186 30,848 30,897
Total departmental expenses
Program 4.1 169,815 117,790 119,873 120,975 123,105
Total expenses Program 4.1 176,722 127,079 129,330 130,915 133,316
Program 4.2: Onshore Detention
Network
Annual administered expenses
Community and Detention Services 61,426 59,222 60,218 63,233 64,817
Payments under Section 33 (FMA Act ) -
Act of Grace Payments 23 100 100 100 100
Recovery of Removal Charges and
Detention Costs 3,176 3,666 3,849 4,042 4,042
Total administered expenses
Program 4.2 64,625 62,988 64,167 67,375 68,959
Continued on next page
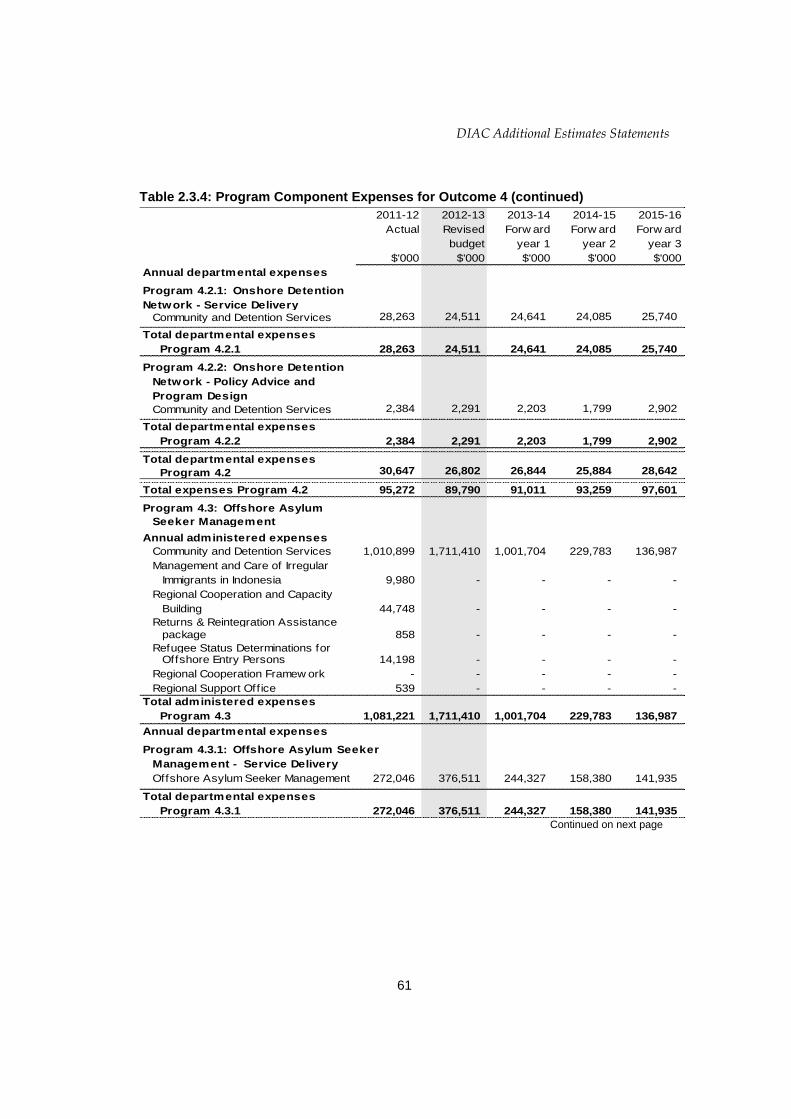
DIAC Additional Estimates Statements
61
Table 2.3.4: Program Component Expenses for Outcome 4 (continued)
2011-12 2012-13 2013-14 2014-15 2015-16
Actual Revised Forw ard Forw ard Forw ard
budget year 1 year 2 year 3
$'000 $'000 $'000 $'000 $'000
Annual departmental expenses
Program 4.2.1: Onshore Detention
Network - Service Delivery
Community and Detention Services 28,263 24,511 24,641 24,085 25,740
Total departmental expenses
Program 4.2.1 28,263 24,511 24,641 24,085 25,740
Program 4.2.2: Onshore Detention
Network - Policy Advice and
Program Design
Community and Detention Services 2,384 2,291 2,203 1,799 2,902
Total departmental expenses
Program 4.2.2 2,384 2,291 2,203 1,799 2,902
Total departmental expenses
Program 4.2 30,647 26,802 26,844 25,884 28,642
Total expenses Program 4.2 95,272 89,790 91,011 93,259 97,601
Program 4.3: Offshore Asylum
Seeker Management
Annual administered expenses
Community and Detention Services 1,010,899 1,711,410 1,001,704 229,783 136,987
Management and Care of Irregular
Immigrants in Indonesia 9,980 - - - -
Regional Cooperation and Capacity
Building 44,748 - - - -
Returns & Reintegration Assistance
package 858 - - - -
Refugee Status Determinations for Offshore Entry Persons 14,198 - - - -
Regional Cooperation Framew ork - - - - -
Regional Support Office 539 - - - -
Total administered expenses
Program 4.3 1,081,221 1,711,410 1,001,704 229,783 136,987
Annual departmental expenses
Program 4.3.1: Offshore Asylum Seeker
Management - Service Delivery
Offshore Asylum Seeker Management 272,046 376,511 244,327 158,380 141,935
Total departmental expenses
Program 4.3.1 272,046 376,511 244,327 158,380 141,935 Continued on next page

DIAC Additional Estimates Statements
62
Table 2.3.4: Program Component Expenses for Outcome 4 (continued)
2011-12 2012-13 2013-14 2014-15 2015-16
Actual Revised Forw ard Forw ard Forw ard
budget year 1 year 2 year 3
$'000 $'000 $'000 $'000 $'000
Program 4.3.2: Offshore Asylum
Seeker Management - Policy Advice
and Program Design
Offshore Asylum Seeker Management 48,577 36,238 33,750 28,455 25,440
Total departmental expenses
Program 4.3.2 48,577 36,238 33,750 28,455 25,440
Program 4.3.3: Offshore Asylum
Seeker Management - Refugee
Status Determination
Refugee Status Determinations for Offshore Entry Persons 33,340 - - - -
Total departmental expenses
Program 4.3.3 33,340 - - - -
Program 4.3.4: Offshore Asylum Seeker
Management - Implementation of
Offshore Processing Solutions &
Regional Cooperation Framework
Solution
Regional Cooperation Framew ork 431 - - - -
Total departmental expenses
Program 4.3.4 431 - - - -
Total departmental expenses
Program 4.3 354,394 412,749 278,077 186,835 167,375
Total expenses Program 4.3 1,435,615 2,124,159 1,279,781 416,618 304,362
Program 4.4: Foreign Fishers
Annual administered expenses
Community and Detention Services 10,077 9,518 9,689 10,350 10,604
Total administered expenses
Program 4.4 10,077 9,518 9,689 10,350 10,604
Annual departmental expenses:
Program 4.4.1: Foreign Fishers -
Service Delivery
Foreign Fishers 1,924 2,210 2,233 2,293 2,312
Total departmental expenses
Program 4.4.1 1,924 2,210 2,233 2,293 2,312
Continued on next page

DIAC Additional Estimates Statements
63
Table 2.3.4: Program Component Expenses for Outcome 4 (continued)
2011-12 2012-13 2013-14 2014-15 2015-16
Actual Revised Forw ard Forw ard Forw ard
budget year 1 year 2 year 3
$'000 $'000 $'000 $'000 $'000
Program 4.4.2: Foreign Fishers -
Policy Advice and Program Design
Foreign Fishers 478 491 495 496 501
Total departmental expenses
Program 4.4.2 478 491 495 496 501
Total departmental expenses
Program 4.4 2,402 2,701 2,728 2,789 2,813
Total expenses Program 4.4 12,478 12,219 12,417 13,139 13,417
Program 4.5: Regional Cooperation
and Associated Activities
Management and Care of Irregular Immigrants in Indonesia - 7,891 - - -
Regional Cooperation and Capacity Building - 42,493 21,011 22,095 22,648
Returns and Reintegration Assistance - 1,726 1,875 1,994 2,150
packages
Regional Support Office - 1,471 1,486 1,512 -
Combatting People Smuggling- Address irregular migration in region - 2,120 - - -
Total administered expenses
Program 4.5 - 55,701 24,372 25,601 24,798
Annual departmental expenses
Program 4.5.1: Regional Cooperation
& Associated Activities - Service
Delivery
Regional Cooperation and Associated
Activities - 3,564 304 303 303
Total departmental expenses
Program 4.5.1 - 3,564 304 303 303
Program 4.5.2: Regional Cooperation
& Associated Activities - Policy
Advice and Program Design
Regional Cooperation and Associated
Activities - 8,637 8,592 8,597 8,706
Total departmental expenses
Program 4.5.2 - 8,637 8,592 8,597 8,706
Total departmental expenses
Program 4.5 - 12,201 8,896 8,900 9,009
Total expenses Program 4.5 - 67,902 33,268 34,501 33,807
Continued on next page
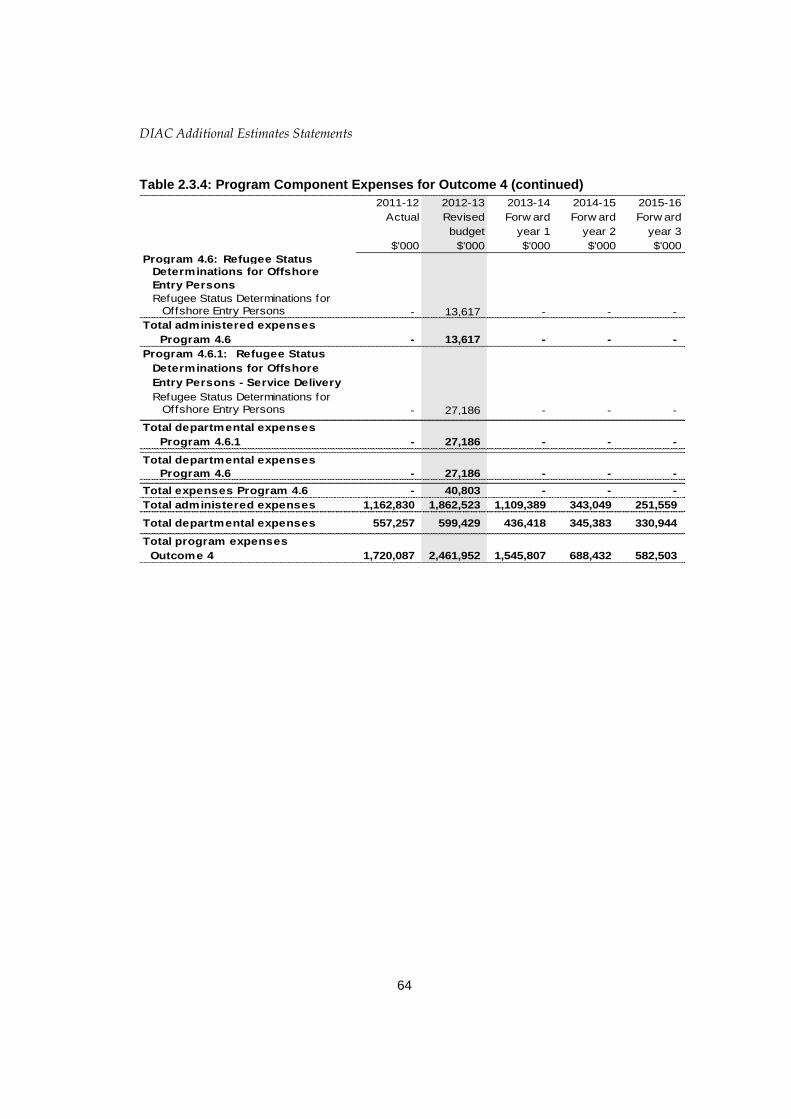
DIAC Additional Estimates Statements
64
Table 2.3.4: Program Component Expenses for Outcome 4 (continued)
2011-12 2012-13 2013-14 2014-15 2015-16
Actual Revised Forw ard Forw ard Forw ard
budget year 1 year 2 year 3
$'000 $'000 $'000 $'000 $'000
Program 4.6: Refugee Status
Determinations for Offshore
Entry Persons
Refugee Status Determinations for
Offshore Entry Persons - 13,617 - - -
Total administered expenses
Program 4.6 - 13,617 - - -
Program 4.6.1: Refugee Status
Determinations for Offshore
Entry Persons - Service Delivery
Refugee Status Determinations for
Offshore Entry Persons - 27,186 - - -
Total departmental expenses
Program 4.6.1 - 27,186 - - -
Total departmental expenses
Program 4.6 - 27,186 - - -
Total expenses Program 4.6 - 40,803 - - -
Total administered expenses 1,162,830 1,862,523 1,109,389 343,049 251,559
Total departmental expenses 557,257 599,429 436,418 345,383 330,944
Total program expenses
Outcome 4 1,720,087 2,461,952 1,545,807 688,432 582,503

DIAC Additional Estimates Statements
65
Program 4.1: Visa Compliance and Status Resolution
Program 4.1 Deliverables
Visa compliance and status resolution programs will:
• provide general compliance activities including targeted communication strategies, promotion of visa obligations and education for clients, employers, unions, universities and other stakeholders
• undertake compliance field activities to conduct awareness and integrity verification visits and locate unlawful non-citizens
• investigate suspected breaches of immigration and citizenship law and where appropriate impose prompt sanctions and prosecute individuals and third parties involved in the abuse of the immigration and citizenship systems/programs
• refuse or cancel visas for individuals who are in breach of their visa conditions or present a risk to the Australian community
• initiate and manage immigration detention of non-citizens in accordance with the law and government policy
• provide services that assist to resolve the immigration status of clients in the community or immigration detention
• remove people who have no right to remain in Australia
• policy advice and service design to enable such service provision.
Program 4.1 Deliverables
2011-12 2012-13 2013-14 2014-15 2015-16
Revised Budget Forw ard Forw ard Forw ard
Deliverables budget year 1 year 2 year 3
Field activities to conduct aw areness
and integrity verif ication visits
and locate unlaw ful non-citizens. 2,000+ 2,000+ 2,000+ 2,000+2,000+

DIAC Additional Estimates Statements
66
Program 4.1 Key Performance Indicators
• prevention and deterrence strategies which increase voluntary compliance with visa conditions
• increased engagement of peak employment bodies, employers, unions and labour suppliers, the provision of employment status information to employers through Visa Entitlement Verification Online (VEVO), and where appropriate the application of sanctions to limit the opportunity for illegal work in Australia
• enforcement strategies imposed that maintain the integrity of the Department’s programs by prosecuting serious breaches of immigration law
• effective screening of visa applications offshore to prevent people of character concern from travelling to Australia through maintaining effective relationships with law enforcement and security partners, and enhanced application of identity technology
• people held in immigration detention are to have the length and conditions of their detention subject to regular reviews to ensure that it is lawful and appropriate
• the effective management of lawful non-citizens and resolution of their immigration status while they are in the community on a Bridging Visa E, does not lead to an unacceptable increase in non-compliance with Bridging Visa E conditions
• people who have no right to remain in Australia are removed by the Department at the earliest practicable opportunity.
Program 4.1 Key Performance Indicators
2011-12 2012-13 2013-14 2014-15 2015-16
Revised Forw ard Forw ard Forw ard
Actual Target year 1 year 2 year 3
Program 4.1
Percentage of overstayers against
relevant temporary entries
Number of parties registered w ith
VEVO
Percentage of people held in
immigration detention w hose
ongoing detention and placement
is review ed w ithin service
standards
Percentage of Bridging Visa E
overstayers against relevant
Bridging Visa E grants
<1%
12,000+
98%
<1%
12,000+
98% 98% 98%
9-10%9-10% 9-10% 9-10% 9-10%
12,000+ 12,000+
98%
<1% <1% <1%
12,000+
Note: Service standards are available on www.immi.gov.au

DIAC Additional Estimates Statements
67
Program 4.2: Onshore Detention Network
Program 4.2 Key Performance Indicators
2011-12 2012-13 2013-14 2014-15 2015-16
Revised Forw ard Forw ard Forw ard
Actual Target year 1 year 2 year 3
Program 4.2
Percentage of persons in IDCs that
are not know n to be,or are not
reasonably suspected of being,
a minor
Percentage of people held in
immigration detention w hose
ongoing detention and placement
is review ed w ithin service
standards 98% 98% 98%
100% 100% 100%
98% 98%
100% 100%
Note: Service standards available on www.immi.gov.au
Program 4.2 Deliverables
• Provision of support, health and detention services to people in immigration detention, in both community and detention environments, in accordance with the objectives and Key Performance Indicator (KPI) targets for this program
• Policy advice and service design to enable such service provision.
Program 4.2 Key Performance Indicators
• Only people who are not known to be, or are not reasonably suspected of being, minors are detained in Immigration Detention Centres
• People held in immigration detention will have the length and conditions of their detention subject to regular review to ensure that it is lawful, appropriate and neither indefinite nor arbitrary.

DIAC Additional Estimates Statements
68
Program 4.3: Offshore Asylum Seeker Management
Program 4.3 Key Performance Indicators
2011-12 2012-13 2013-14 2014-15 2015-16
Revised Forw ard Forw ard Forw ard
Actual Target year 1 year 2 year 3
Program 4.3
Percentage of persons in IDCs that
are not know n to be, or are not
reasonably suspected of being,
a minor
Percentage of people held in
immigration detention w hose
ongoing detention and placement
is review ed w ithin service
standards 98% 98%98%
100%
98% 98%
100% 100% 100%100%
Note: Service standards available on www.immi.gov.au
Program 4.3 Deliverables
• provision of support, health and other services to IMAs in the immigration detention network, Community Detention or those who are granted a Bridging Visa E while their status is being resolved, in accordance with the objectives and KPI targets for this program
• provision of policy advice and service design that enables service delivery
• services to develop, implement and undertake the removal from Australia of IMAs that are not owed protection by Australia. All removals to be handled expeditiously and in line with service standards.
Program 4.3 Key Performance Indicators
• only people who are not known to be, or are not reasonably suspected of being, minors are detained in Immigration Detention Centres
• IMAs held in immigration detention will have the length and conditions of their detention subject to regular review to ensure that it is neither indefinite nor arbitrary
• IMAs who are found not to be owed protection under Australia's international obligations, are to be removed by the Department at the earliest practicable opportunity.

DIAC Additional Estimates Statements
69
Program 4.4: Foreign Fishers
Program 4.4 Key Performance Indicators
2011-12 2012-13 2013-14 2014-15 2015-16
Revised Forw ard Forw ard Forw ard
Actual Target year 1 year 2 year 3
Program 4.4
Percentage of persons in IDCs
that are not know n to be or are
reasonably suspected to be a minor 100% 100%100%100% 100%
Note: Service standards available on www.immi.gov.au
Program 4.4 Deliverables
• provision of support, health and detention services to foreign fishers in immigration detention, in both community and detention environments, in accordance with the objectives and KPI targets for this program
• provision of policy advice and service design that enables service delivery
• services to develop, implement and undertake the removal of foreign fishers from Australia.
Program 4.4 Key Performance Indicators
• only people who are not known to be, or are not reasonably suspected of being, minors are detained in Immigration Detention Centres
• foreign fishers, who have no right to remain in Australia, are to be removed by the Department at the earliest practicable opportunity.

DIAC Additional Estimates Statements
70
Program 4.5: Regional Cooperation & Associated Activities
Program 4.5 Deliverables
Regional Cooperation and Associated Activities will:
• provide assistance, training and resources to support, manage and oversee agreed bilateral and multilateral arrangements under the Regional Cooperation Framework and other measures for the effective management and harmonisation of treatment of asylum seekers across the region
• provide assistance with a strong focus on working in partnership with international organisations to provide enhanced migration management (enhancements to legislation, governance and organisational structures, business processes, returns and reintegration assistance, cross-agency coordination mechanisms and policy frameworks), identity management, immigration intelligence initiatives and support for regional fora
• assist in the establishment of a Regional Support Office to take forward a range of practical initiatives under the auspices of the Regional Cooperation Framework
• support international organisations for the care of irregular migrants intercepted en route to Australia
• provide policy advice and service design to enable such service provision.
Program 4.5 Key Performance Indicators
• the capacity of states in the region to manage irregular migration through the region, including that of asylum seekers is increased
• the Regional Support Office is established and effectively acting as a focal point and coordination point for migration management and increased protection capacity in the region
• returns and reintegration assistance supports voluntary returns to country of origin for those found not to be in need of protection.
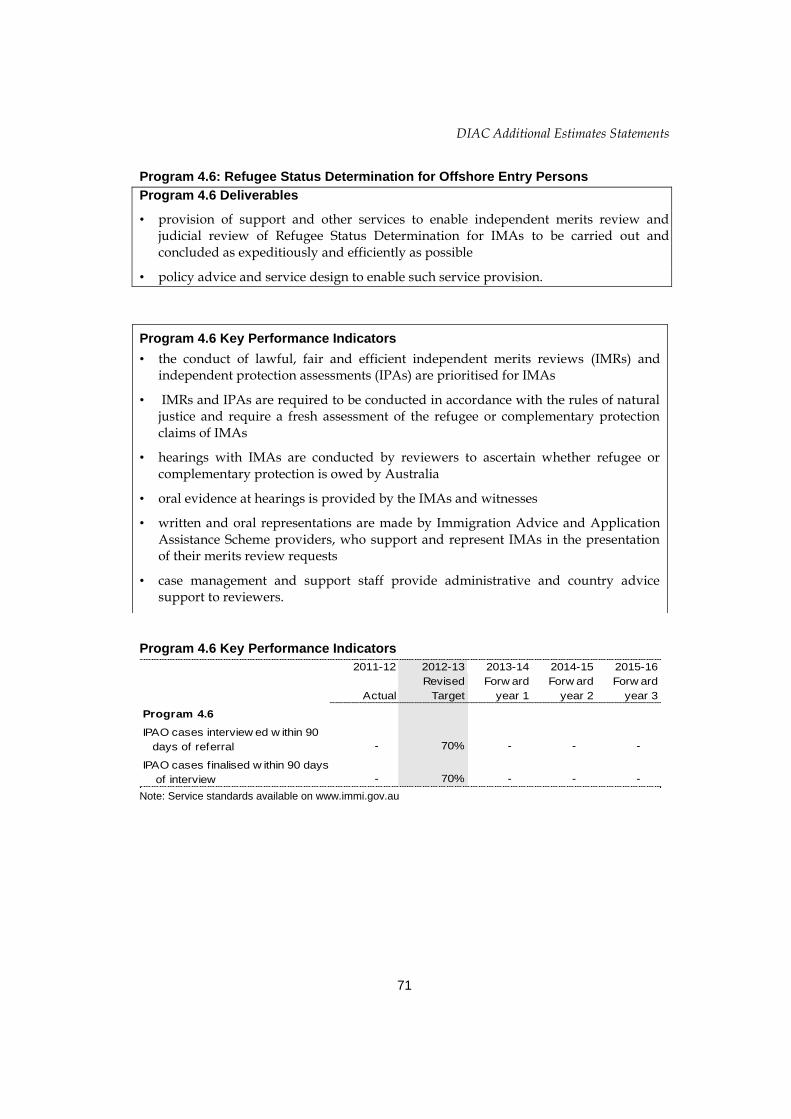
DIAC Additional Estimates Statements
71
Program 4.6: Refugee Status Determination for Offshore Entry Persons
Program 4.6 Deliverables
• provision of support and other services to enable independent merits review and judicial review of Refugee Status Determination for IMAs to be carried out and concluded as expeditiously and efficiently as possible
• policy advice and service design to enable such service provision.
Program 4.6 Key Performance Indicators
2011-12 2012-13 2013-14 2014-15 2015-16
Revised Forw ard Forw ard Forw ard
Actual Target year 1 year 2 year 3
Program 4.6
IPAO cases interview ed w ithin 90
days of referral
IPAO cases finalised w ithin 90 days
of interview
-
- 70% - - -
- 70% - -
Note: Service standards available on www.immi.gov.au
Program 4.6 Key Performance Indicators
• the conduct of lawful, fair and efficient independent merits reviews (IMRs) and independent protection assessments (IPAs) are prioritised for IMAs
• IMRs and IPAs are required to be conducted in accordance with the rules of natural justice and require a fresh assessment of the refugee or complementary protection claims of IMAs
• hearings with IMAs are conducted by reviewers to ascertain whether refugee or complementary protection is owed by Australia
• oral evidence at hearings is provided by the IMAs and witnesses
• written and oral representations are made by Immigration Advice and Application Assistance Scheme providers, who support and represent IMAs in the presentation of their merits review requests
• case management and support staff provide administrative and country advice support to reviewers.

DIAC Additional Estimates Statements
72
Administered items under Program 4.1: Visa Compliance and Status Resolution
Compliance Resolution, Community Care and Assistance
Item Objectives
To actively, efficiently and effectively manage unlawful non-citizens and Bridging Visa E holders in the community to an immigration outcome through early intervention and provision of needs-based support and assistance.
Item Deliverables
• health, welfare and income support.
• national assisted voluntary return service.
• expanded immigration advice and application assistance.
Administered items under Program 4.2: Onshore Detention Network
Community and Detention Services
Item Objectives
To fund the provision of a range of support, health and detention services to people in the immigration detention environments, including community detention that seek to:
• best suit the needs of individual people in immigration detention
• treat people in detention fairly and reasonably within the law
• ensure the inherent dignity of people in immigration detention
• minimise the time minors are detained in Immigration Detention Centres
• ensure the availability for immigration processing, or otherwise the removal of, people detained under the Migration Act
• enable the management of health, identity and security risks to the community arising from unauthorised arrivals.
Item Deliverables
Provision of support, health and detention services to people in the immigration
detention environments, including community detention, in accordance with the
objectives and KPI targets for this program.
DIAC Additional Estimates Statements
73
Administered items under Program 4.3: Offshore Asylum Seeker Management
Community and Detention Services
Item Objectives
To fund the provision of a range of support, health and detention services to IMAs seeking asylum who are in an immigration detention environment, including community detention, as well as those in the community on Bridging Visa E’s, that seek to:
• best suit the needs of individual people in immigration detention or on a Bridging Visa E
• treat people in immigration detention, or on a Bridging Visa E, fairly and reasonably within the law
• ensure the inherent dignity of people in immigration detention or on a Bridging Visa E
• minimise the time minors are detained in Immigration Detention Centres
• provide IMAs in immigration detention, or on a Bridging Visa E, who are seeking asylum, with professionally qualified immigration advice and assistance
• ensure the availability for immigration processing, or otherwise the removal of, people detained under the Migration Act
• enable the management of health, identity and security risks to the community arising from IMAs.
Item Deliverables
Provision of support, health and detention services to IMAs in immigration
detention environments, including community detention, as well as those in the
community on Bridging Visa E’s in accordance with the objectives and KPI targets
for this program.
Payments under Section 33 (FMA Act)—Act of Grace Payments
Item Objectives
Payments made under Section 33 (FMA Act) are special discretionary compensatory
payments (acts of grace) made in circumstances where there is no other viable
avenue of redress available and the Minister for Finance and Deregulation considers
the payment is appropriate because of ‘special circumstances’.
Item Deliverables
Payments are made in accordance with legislative requirements and guidelines.
DIAC Additional Estimates Statements
74
Administered items under Program 4.4: Foreign Fishers
Community and Detention Services
Item Objectives
To fund the provision of a range of support, health and detention services in the immigration detention environments that seek to:
• best suit the needs of individual people in immigration detention
• treat people in immigration detention fairly and reasonably within the law
• ensure the inherent dignity of people in immigration detention
• minimise the time minors are detained in Immigration Detention Centres
• ensure the availability for immigration processing, or removal, of people detained under the Migration Act
• enable the management of health, identity and security risks to the community arising from foreign fishers.
Item Deliverables
Provision of support, health and detention services to foreign fishers in immigration
detention environments, in accordance with the objectives and KPI targets for this
program.
DIAC Additional Estimates Statements
75
Administered items under Program 4.5: Regional Cooperation and Associated Activities
Regional Cooperation and Capacity Building
Item Objectives
• to strengthen the migration and border management capabilities of governments in the Asia-Pacific region and parts of South Asia and the Middle East.
• to assist the facilitation of bona fide people movements while preventing and deterring irregular movements, including people smuggling and trafficking, in our region and in source/transit countries.
• to support international organisations for the care of irregular migrants intercepted en route to Australia.
Item Deliverables
• provide assistance with a strong focus on working in partnership with international organisations to enhance migration management (enhancements to legislation, governance and organisational structures, business processes, cross-agency coordination mechanisms and policy frameworks), identity management and document examination, immigration intelligence initiatives, support for regional fora and English language training.
• provide support to international organisations for the care of irregular migrants intercepted en route to Australia.
Management and Care of Irregular Immigrants in Indonesia
Item Objectives
• strengthen regional cooperation arrangements in Indonesia to support international organisations to provide care and welfare for irregular migrants who are intercepted in Indonesia.
• provide funding to the IOM to enhance Indonesian immigration detention and transit facilities and to improve the care and support provided to irregular migrants in Indonesia.
• provide training in identity management to Indonesian immigration officials, in particular facial identification techniques.
Item Deliverables
• payment to IOM to undertake major refurbishment works at a number of detention centres in Indonesia.
• training sessions conducted for Indonesian immigration officials.
DIAC Additional Estimates Statements
76
Returns and Reintegration Assistance Packages
Item Objectives
The primary objective is to provide support for the returnee to rebuild their life in the country of return and to reduce the risk of further irregular migration.
Item Deliverables
IOM will develop and deliver reintegration assistance tailored to the needs of the
individual.
Administered items under Program 4.6: Refugee Status Determination for Offshore Entry Persons
Refugee Status Determination for Offshore Entry Persons
Item Objectives
To streamline the process for the determination of refugee status for offshore entry persons.
Item Deliverables
Refugee status assessments under the Protection Obligation Determination (POD)
process will be made efficiently and lawfully.
The backlog of requests for independent merits review of negative decisions under
the previous process will be determined expeditiously and concurrently with POD
assessments being finalised.
DIAC Additional Estimates Statements
77
Outcome 5: Equitable economic and social participation of migrants and
refugees, supported through settlement services, including English language
training; refugee settlement; case coordination; translation services; and
settlement policy advice and program design.
Outcome 5 Strategy
To achieve this outcome, the Department ensures high quality settlement services are
available and accessible for humanitarian entrants and other eligible migrants as soon as
possible after arrival. These services support clients in their transition to life in Australia
by helping to build self-reliance, developing English language skills and fostering links
with mainstream services.
This outcome will be achieved through: • providing a planning framework for the delivery of settlement services, and
information for recently arrived migrants and humanitarian entrants that complements other services the Government directs to the Australian community
• providing demographic data and other information to assist service providers across the three levels of Government to plan to meet the needs of newly arrived migrants and humanitarian entrants
• supporting initial settlement services delivered through the Humanitarian Settlement Services (HSS), managed through contracted service providers
• supporting the Settlement Grants Program (SGP) by helping funded organisations manage work programs, service agreements and reporting and financial accountability requirements
• supporting the Adult Migrant English Program (AMEP) managed by the Department through contracts for English training and ancillary services
• providing translating and interpreting services.

DIAC Additional Estimates Statements
78
The administered expenses supporting this outcome are:
• the AMEP, providing settlement-focused English training to eligible humanitarian entrants and migrants
• the SGP, where eligible organisations are funded to provide settlement services, including information, referral and casework services for new arrivals, community capacity building, service planning, participation and integration services
• the HSS, where funded organisations provide initial settlement services to humanitarian entrants, including case coordination, cultural orientation, referrals and accommodation services
• the financial contribution to the National Accreditation Authority for Translators and Interpreters Ltd (NAATI)
• the grant to the Refugee Council of Australia (RCOA) for advice on the views of the refugee and humanitarian non-government sector on the Australian Humanitarian Program and its related impact on settlement processes
• settlement support and welfare supervision arrangements for Unaccompanied Humanitarian Minors (UHMs).

DIAC Additional Estimates Statements
79
Outcome 5 Expense Statement
Table 2.1.5 provides an overview of the total expenses for Outcome 5, by program.
Table 2.1.5: Budgeted Expenses and Resources for Outcome 5
2011-12 2012-13
Actual Revised
expenses estimated
expenses
$'000 $'000
Program 5.1: Settlement Services for Migrants and
Administered expenses
Ordinary annual services 1 337,149 416,115
Total for Program 5.1 337,149 416,115
Program 5.1.1: Settlement Services for Migrants and
Refugees - Service Delivery
Departmental expenses
Departmental appropriation 2 49,495 79,633
Expenses not requiring appropriation in the Budget year 3 1,431 2,018
Total for Program 5.1.1 50,926 81,651
Program 5.1.2: Settlement Services for Migrants and
Refugees - Policy Advice and Program Design
Departmental expenses
Departmental appropriation 2 18,336 14,734
Expenses not requiring appropriation in the Budget year 3 869 1,241
Total for Program 5.1.2 19,205 15,975
Outcome 5 Totals by appropriation type
Administered expenses
Ordinary annual services 1 337,149 416,115
Departmental expenses
Departmental appropriation 2 67,829 94,367
Expenses not requiring appropriation in the Budget year 3 2,299 3,259
Total expenses for Outcome 5 407,277 513,741
2011-12 2012-13
Average Staffing Level (number) 391 408 1. Ordinary annual services include Appropriation Act (No. 1) 2012-13, Appropriation (Implementation of the
Report of the Expert Panel on Asylum Seekers) Act (No. 1) 2012-13 & Appropriation Bill (No. 3) 2012-13. 2. Departmental Appropriation combines ‘Ordinary annual services (Appropriation Act No. 1 & Appropriation
Bill No. 3)’ and ‘Revenue from independent sources (s31)’. 3. Expenses not requiring appropriation in the Budget year consists of Depreciation and Amortisation Expense. Note: Departmental appropriation amounts are estimates and may change in the course of the budget year as Government priorities change.
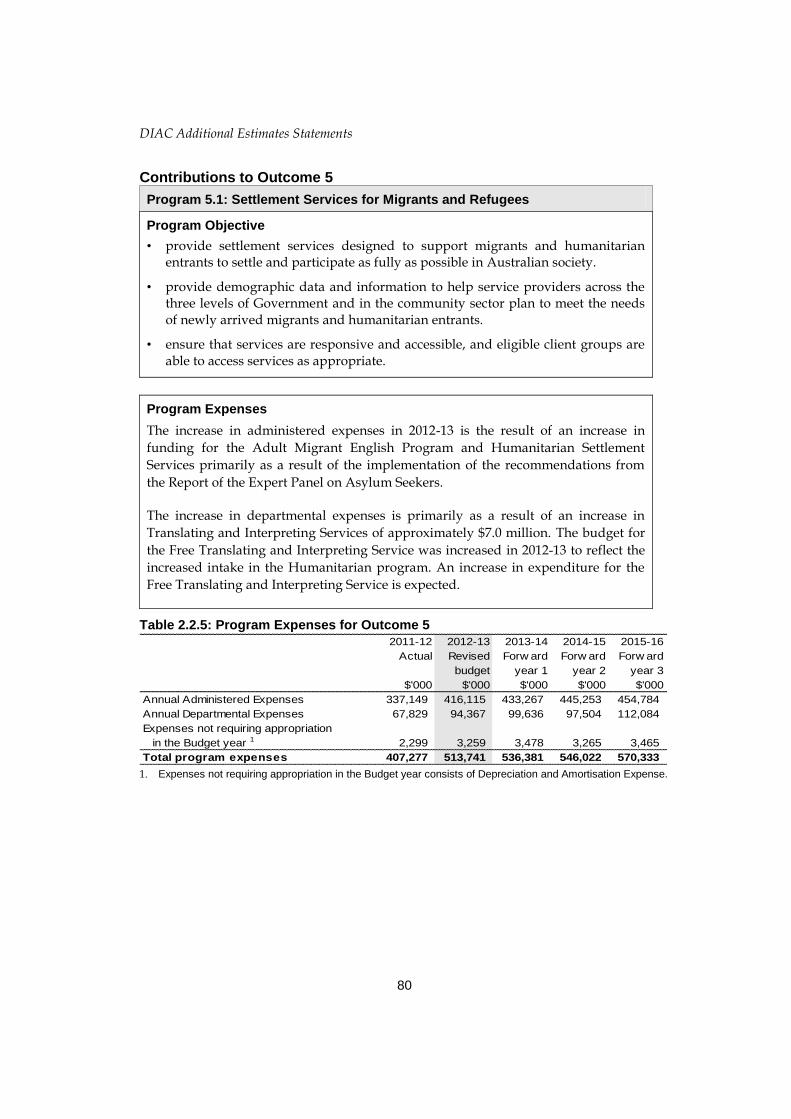
DIAC Additional Estimates Statements
80
Contributions to Outcome 5
Program 5.1: Settlement Services for Migrants and Refugees
Program Objective
• provide settlement services designed to support migrants and humanitarian entrants to settle and participate as fully as possible in Australian society.
• provide demographic data and information to help service providers across the three levels of Government and in the community sector plan to meet the needs of newly arrived migrants and humanitarian entrants.
• ensure that services are responsive and accessible, and eligible client groups are able to access services as appropriate.
Program Expenses
The increase in administered expenses in 2012-13 is the result of an increase in
funding for the Adult Migrant English Program and Humanitarian Settlement
Services primarily as a result of the implementation of the recommendations from
the Report of the Expert Panel on Asylum Seekers.
The increase in departmental expenses is primarily as a result of an increase in
Translating and Interpreting Services of approximately $7.0 million. The budget for
the Free Translating and Interpreting Service was increased in 2012-13 to reflect the
increased intake in the Humanitarian program. An increase in expenditure for the
Free Translating and Interpreting Service is expected.
Table 2.2.5: Program Expenses for Outcome 5
2011-12 2012-13 2013-14 2014-15 2015-16
Actual Revised Forw ard Forw ard Forw ard
budget year 1 year 2 year 3
$'000 $'000 $'000 $'000 $'000
Annual Administered Expenses 337,149 416,115 433,267 445,253 454,784
Annual Departmental Expenses 67,829 94,367 99,636 97,504 112,084
Expenses not requiring appropriation
in the Budget year 1 2,299 3,259 3,478 3,265 3,465
Total program expenses 407,277 513,741 536,381 546,022 570,333
1. Expenses not requiring appropriation in the Budget year consists of Depreciation and Amortisation Expense.
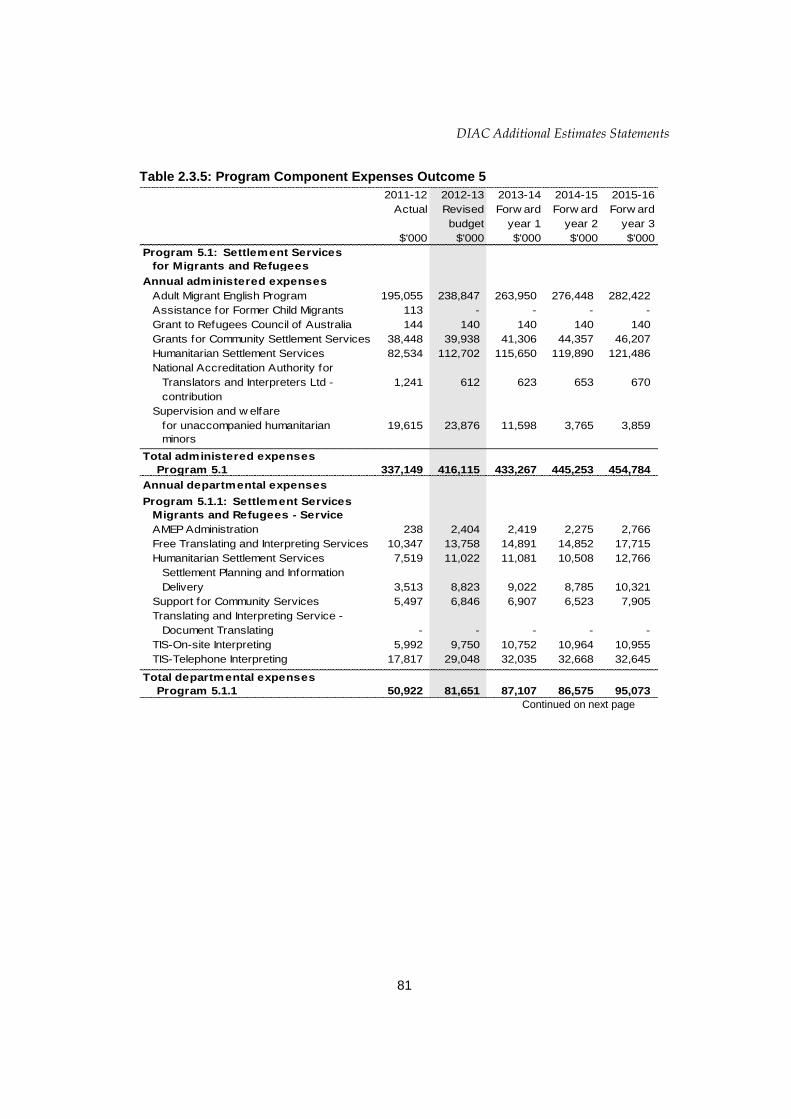
DIAC Additional Estimates Statements
81
Table 2.3.5: Program Component Expenses Outcome 5
2011-12 2012-13 2013-14 2014-15 2015-16
Actual Revised Forw ard Forw ard Forw ard
budget year 1 year 2 year 3
$'000 $'000 $'000 $'000 $'000
Program 5.1: Settlement Services
for Migrants and Refugees
Annual administered expenses
Adult Migrant English Program 195,055 238,847 263,950 276,448 282,422
Assistance for Former Child Migrants 113 - - - -
Grant to Refugees Council of Australia 144 140 140 140 140
Grants for Community Settlement Services 38,448 39,938 41,306 44,357 46,207
Humanitarian Settlement Services 82,534 112,702 115,650 119,890 121,486
National Accreditation Authority for
Translators and Interpreters Ltd - 1,241 612 623 653 670
contribution
Supervision and w elfare
for unaccompanied humanitarian 19,615 23,876 11,598 3,765 3,859
minors
Total administered expenses
Program 5.1 337,149 416,115 433,267 445,253 454,784
Annual departmental expenses
Program 5.1.1: Settlement Services
Migrants and Refugees - Service
AMEP Administration 238 2,404 2,419 2,275 2,766
Free Translating and Interpreting Services 10,347 13,758 14,891 14,852 17,715
Humanitarian Settlement Services 7,519 11,022 11,081 10,508 12,766
Settlement Planning and Information
Delivery 3,513 8,823 9,022 8,785 10,321
Support for Community Services 5,497 6,846 6,907 6,523 7,905
Translating and Interpreting Service -
Document Translating - - - - -
TIS-On-site Interpreting 5,992 9,750 10,752 10,964 10,955
TIS-Telephone Interpreting 17,817 29,048 32,035 32,668 32,645
Total departmental expenses
Program 5.1.1 50,922 81,651 87,107 86,575 95,073 Continued on next page

DIAC Additional Estimates Statements
82
Table 2.3.5: Program Component Expenses Outcome 5 (continued)
2011-12 2012-13 2013-14 2014-15 2015-16
Actual Revised Forw ard Forw ard Forw ard
budget year 1 year 2 year 3
$'000 $'000 $'000 $'000 $'000
Program 5.1.2: Settlement Services
for
Migrants and Refugees - Policy
and Program Design
AMEP Administration 3,502 3,086 3,018 2,461 3,941
Free Translating and Interpreting Services 326 2,355 3,101 3,234 3,736
Humanitarian Settlement Services 7,525 4,805 4,728 4,062 6,412
Settlement Planning and Information
Delivery 4,527 3,987 3,454 2,991 4,118
Support for Community Services 3,169 1,717 1,681 1,425 2,249
TIS - On-site Interpreting 29 2 2 2 2
TIS - Telephone Interpreting 127 23 23 19 18
Total departmental expenses
Program 5.1.2 19,205 15,975 16,007 14,194 20,476
Total administered expenses 337,149 416,115 433,267 445,253 454,784
Total departmental expenses 70,127 97,626 103,114 100,769 115,549
Total program expenses Outcome 5 407,277 513,741 536,381 546,022 570,333

DIAC Additional Estimates Statements
83
Program 5.1 Key Performance Indicators
• settlement information and services are available to eligible migrants and humanitarian entrants nationwide
• Humanitarian Settlement Services and Complex Case Support services are available and being delivered across Australia
• NAATI provide high a quality credentialing service supported by Members
• administer the payment for the provision of fee free language services for eligible clients.
Program 5.1 Key Performance Indicators
2011-12 2012-13 2013-14 2014-15 2015-16
Revised Forw ard Forw ard Forw ard
Actual Target year 1 year 2 year 3
Outcome 5
Effective and timely assessment of
grants applications
Percentage of service level
standards in Humanitarian
Settlement Services and
Complex Case Support contracts
are met1
Settlement focused English language
training is made available to all eligible
humanitarian entrants and migrants
through contracted service providers
95%
95%
95%
95%
95%
100% 100% 100% 100% 100%
95%
95%
95%
95%
95%
Note: Service standards are available on www.immi.gov.au
Program 5.1 Deliverables
• evidence based policy advice to the Government on settlement services for migrants and humanitarian entrants
• settlement planning information to support community organisations and migrants and humanitarian entrants
• administration of the AMEP
• administration of the SGP
• support for humanitarian entrants by effective management of the HSS and Complex Case Support programs
• support the NAATI in the provision of an effective credentialing framework for translators and interpreters
• supervision and settlement of UHMs
• translating and interpreting services for eligible clients.
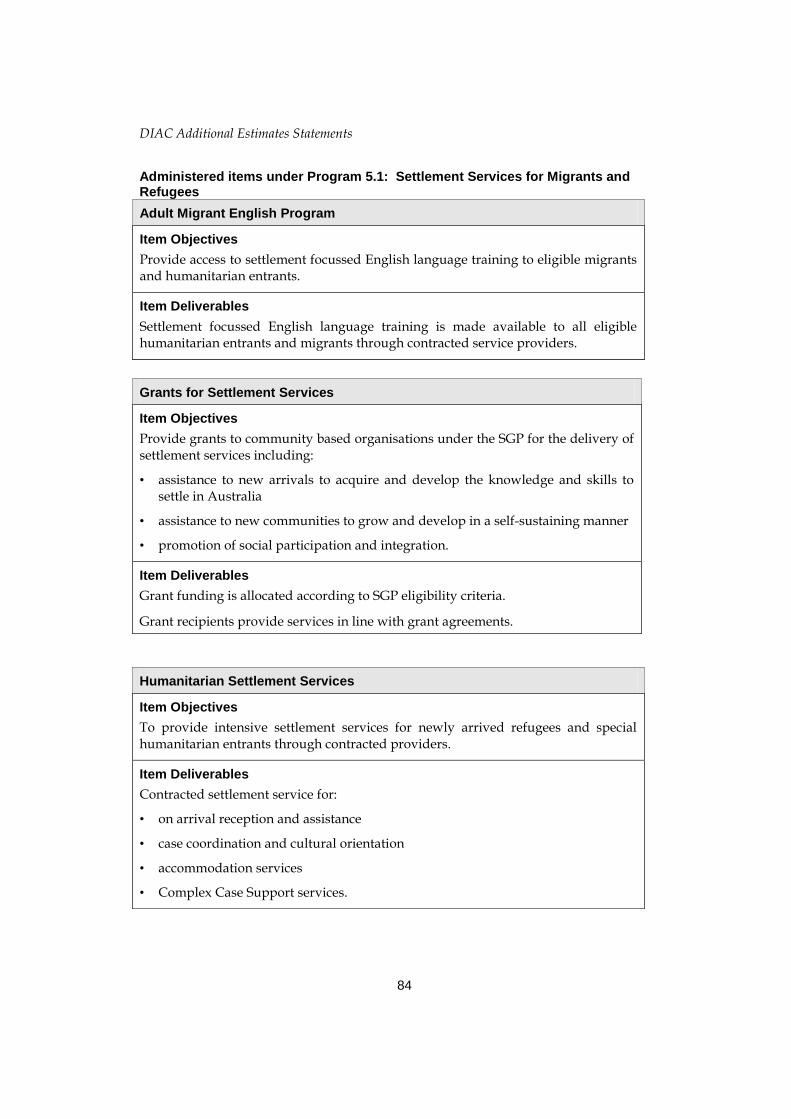
DIAC Additional Estimates Statements
84
Administered items under Program 5.1: Settlement Services for Migrants and Refugees
Adult Migrant English Program
Item Objectives
Provide access to settlement focussed English language training to eligible migrants and humanitarian entrants.
Item Deliverables
Settlement focussed English language training is made available to all eligible humanitarian entrants and migrants through contracted service providers.
Grants for Settlement Services
Item Objectives
Provide grants to community based organisations under the SGP for the delivery of settlement services including:
• assistance to new arrivals to acquire and develop the knowledge and skills to settle in Australia
• assistance to new communities to grow and develop in a self-sustaining manner
• promotion of social participation and integration.
Item Deliverables
Grant funding is allocated according to SGP eligibility criteria.
Grant recipients provide services in line with grant agreements.
Humanitarian Settlement Services
Item Objectives
To provide intensive settlement services for newly arrived refugees and special humanitarian entrants through contracted providers.
Item Deliverables
Contracted settlement service for:
• on arrival reception and assistance
• case coordination and cultural orientation
• accommodation services
• Complex Case Support services.

DIAC Additional Estimates Statements
85
National Accreditation Authority for Translators and Interpreters Ltd –
contribution
Item Objectives
Provide financial support to the NAATI as specified in the funding agreement.
Item Deliverables
Funding paid to NAATI according to funding agreement.
Refugee Council of Australia
Item Objectives
Provide a grant to the RCOA for advice on the views of the refugee and humanitarian non-government sector on the Humanitarian Program, including resettlement and onshore protection, and humanitarian settlement issues.
Item Deliverables
Funding agreement meets Government objectives.
Supervision and welfare for Unaccompanied Humanitarian Minors (UHMs)
Item Objectives
To have in place guardianship, monitoring and settlement support arrangements for UHMs until they reach 18 years of age or otherwise exit the program.
Item Deliverables
Supervision and settlement of UHMs.

DIAC Additional Estimates Statements
86
Outcome 6: A cohesive, multicultural Australian society through promotion of
cultural diversity and a unifying citizenship, decisions on citizenship status,
and multicultural and citizenship policy advice and program design.
Outcome 6 Strategy
To achieve this outcome, the Department promotes the importance of respect, fairness,
inclusion and a sense of belonging in a culturally diverse society and the value of
Australian citizenship. The Department will:
• promote the benefits of a united and diverse Australia
• ensure that citizenship policies and procedures support the objectives of Australia’s citizenship law
• implement Government policy in relation to Australian citizenship
• encourage the community to value citizenship
• promote the acquisition of Australian citizenship.
This outcome will be achieved through:
• implementing the People of Australia, Australia’s Multicultural Policy and its initiatives
• a Diversity and Social Cohesion Program, which addresses issues of cultural, racial and religious intolerance by delivering grants to community-based organisations and information activities such as Harmony Day
• an Australian Government Multicultural Access and Equity Policy and Multicultural language Services Guidelines for Australian Government Agencies, which promotes the importance of Australian Government agencies being responsive to Australia's cultural diversity
• the Department's nationwide network of community liaison officers, which monitors community relations through extensive contacts with community groups and individuals
• provision of funding to eligible community organisations to conduct community-based projects that build on social cohesion, harmony and security
• provision of research, evidence-based policy advice and support for both Ministers
• providing secretariat support for the Australian Multicultural Council, a ministerially-appointed body that provides advice on social cohesion, the inclusion of migrants into Australian society, overcoming racism and intolerance and communicating the benefits of Australia’s cultural diversity to the community

DIAC Additional Estimates Statements
87
• a communication strategy that promotes the value of Australian citizenship
• lawful decision making in accordance with Australian citizenship legislation.
The administered expenses supporting this outcome are:
• grants for the Diversity and Social Cohesion Program, which provides funding to eligible community organisations to address issues affecting community relations and to conduct community-based projects
• grants to support communities participating in the Pacific Seasonal Workers’ Scheme
• the grant to the Federation of Ethnic Communities’ Councils of Australia (FECCA) for the FECCA to provide advice to the Government on the views and needs of ethnic communities in Australia
• contributing towards the cost of developing a multicultural centre in Mirrabooka, Western Australia.

DIAC Additional Estimates Statements
88
Outcome 6 Expense Statement
Table 2.1.6 provides an overview of the total expenses for Outcome 6, by program.
Table 2.1.6: Budgeted Expenses and Resources for Outcome 6
2011-12 2012-13
Actual Revised
expenses estimated
expenses
$'000 $'000
Program 6.1: Multicultural and Citizenship Services
Administered expenses
Ordinary annual services 1 4,902 2,757
Total for Program 6.1 4,902 2,757
Program 6.1.1: Multicultural and Citizenship Services -
Service Delivery
Departmental expenses
Departmental appropriation 2 47,181 51,981
Expenses not requiring appropriation in the Budget year 3 3,467 4,698
Total for Program 6.1.1 50,648 56,679
Program 6.1.2: Multicultural and Citizenship Services -
Policy Advice and Program Design
Departmental expenses
Departmental appropriation 2 17,613 17,597
Expenses not requiring appropriation in the Budget year 3 882 1,153
Total for Program 6.1.2 18,495 18,750
Outcome 6 Totals by appropriation type
Administered expenses
Ordinary annual services 1 4,902 2,757
Departmental expenses
Departmental appropriation 2 64,794 69,578
Expenses not requiring appropriation in the Budget year 3 4,347 5,851
Total expenses for Outcome 6 74,043 78,186
2011-12 2012-13
Average Staffing Level (number) 463 457 1. Ordinary annual services include Appropriation Act (No. 1) 2012-13 & Appropriation Bill (No. 3) 2012-13 . 2. Departmental Appropriation combines ‘Ordinary annual services (Appropriation Act No. 1 & Appropriation
Bill No. 3)’ and ‘Revenue from independent sources (s31)’. 3. Expenses not requiring appropriation in the Budget year consists of Depreciation and Amortisation Expense. Note: Departmental appropriation amounts are estimates and may change in the course of the budget year as Government priorities change.

DIAC Additional Estimates Statements
89
Contributions to Outcome 6
Program 6.1: Multicultural and Citizenship Services
Program Objective
• promoting mutual respect, fairness, inclusion and a sense of belonging and addressing issues of cultural, racial and religious intolerance.
• efficient and effective delivery of the Australian citizenship program in line with Australia’s citizenship law and Government policies.
• promote the value of Australian citizenship.
Program Expenses
The decrease in administered expenses in 2012-13 is a return to levels that were
normal prior to 2011-12. In 2011-12 there was an additional $2.1 million rolled
forward from 2010-11 in regards to the Diversity and Social Cohesion program.
Table 2.2.6: Program Expenses for Outcome 6
2011-12 2012-13 2013-14 2014-15 2015-16
Actual Revised Forw ard Forw ard Forw ard
budget year 1 year 2 year 3
$'000 $'000 $'000 $'000 $'000
Annual Administered Expenses 4,902 2,757 2,343 2,455 2,511
Annual Departmental Expenses 64,794 69,578 71,161 71,855 79,381
Expenses not requiring appropriation
in the Budget year 1 4,347 5,851 5,974 5,241 5,278
Total program expenses 74,043 78,186 79,478 79,551 87,170 1. Expenses not requiring appropriation in the Budget year consists of Depreciation and Amortisation Expense.
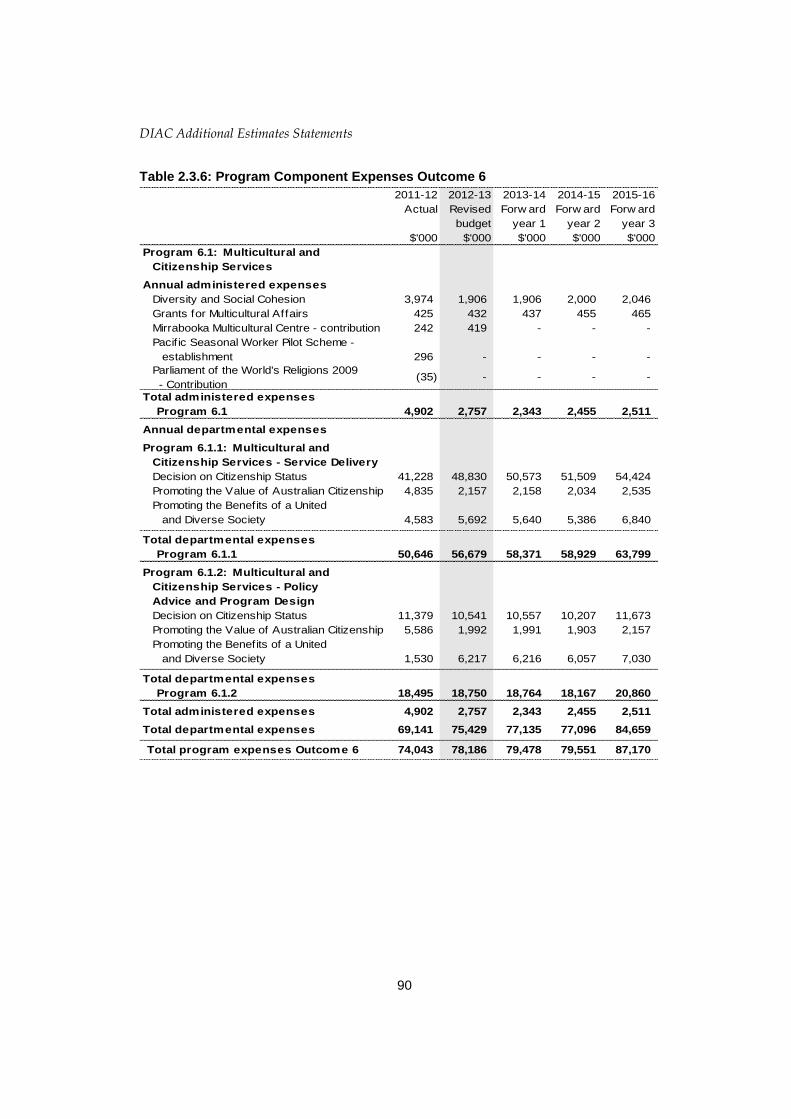
DIAC Additional Estimates Statements
90
Table 2.3.6: Program Component Expenses Outcome 6
2011-12 2012-13 2013-14 2014-15 2015-16
Actual Revised Forw ard Forw ard Forw ard
budget year 1 year 2 year 3
$'000 $'000 $'000 $'000 $'000
Program 6.1: Multicultural and
Citizenship Services
Annual administered expenses
Diversity and Social Cohesion 3,974 1,906 1,906 2,000 2,046
Grants for Multicultural Affairs 425 432 437 455 465
Mirrabooka Multicultural Centre - contribution 242 419 - - -
Pacif ic Seasonal Worker Pilot Scheme -
establishment 296 - - - -
Parliament of the World's Religions 2009
- Contribution(35) - - - -
Total administered expenses
Program 6.1 4,902 2,757 2,343 2,455 2,511
Annual departmental expenses
Program 6.1.1: Multicultural and
Citizenship Services - Service Delivery
Decision on Citizenship Status 41,228 48,830 50,573 51,509 54,424
Promoting the Value of Australian Citizenship 4,835 2,157 2,158 2,034 2,535
Promoting the Benefits of a United
and Diverse Society 4,583 5,692 5,640 5,386 6,840
Total departmental expenses
Program 6.1.1 50,646 56,679 58,371 58,929 63,799
Program 6.1.2: Multicultural and
Citizenship Services - Policy
Advice and Program Design
Decision on Citizenship Status 11,379 10,541 10,557 10,207 11,673
Promoting the Value of Australian Citizenship 5,586 1,992 1,991 1,903 2,157
Promoting the Benefits of a United
and Diverse Society 1,530 6,217 6,216 6,057 7,030
Total departmental expenses
Program 6.1.2 18,495 18,750 18,764 18,167 20,860
Total administered expenses 4,902 2,757 2,343 2,455 2,511
Total departmental expenses 69,141 75,429 77,135 77,096 84,659
Total program expenses Outcome 6 74,043 78,186 79,478 79,551 87,170

DIAC Additional Estimates Statements
91
Program 6.1 Key Performance Indicators
2011-12 2012-13 2013-14 2014-15 2015-16
Revised Forw ard Forw ard Forw ard
Actual Target year 1 year 2 year 3
Outcome 6
Visits to the Citizenship Wizard 300,000 300,000 300,000 300,000 300,000
Percentage of citizenship decisions
overturned
Effective and timely assessment
of grant applications
<1%
80%
<1%
80%
<1%
80%
<1%
80%
<1%
80% Note: Service standards available on www.immi.gov.au
Program 6.1 Deliverables
• provide research, evidence-based policy advice and support services to both Ministers
• administer the grants for community relations and for multicultural affairs
• manage the Diversity and Social Cohesion Program
• provide support services to the Australian Multicultural Council
• encourage Australian Government agency responsiveness to cultural and linguistic diversity through implementing the Multicultural Access and Equity Policy and Multicultural Language Services Guidelines for Australian Government Agencies
• deliver lawful citizenship decisions under Australian citizenship legislation
• continue to provide a communication strategy that promotes the value of Australian citizenship and encourages eligible non-citizens to become Australian citizens.
Program 6.1 Key Performance Indicators
• milestones and timelines specified in funding agreements for grants are met
• government agencies report increased client satisfaction with the delivery of government services
• government services available and accessible nationwide
• percentage of refusal decisions for Australian citizenship overturned through an appeal process
• percentage of client conferral applications decided within service delivery standards
• increased awareness of, and interest in, Australian citizenship.
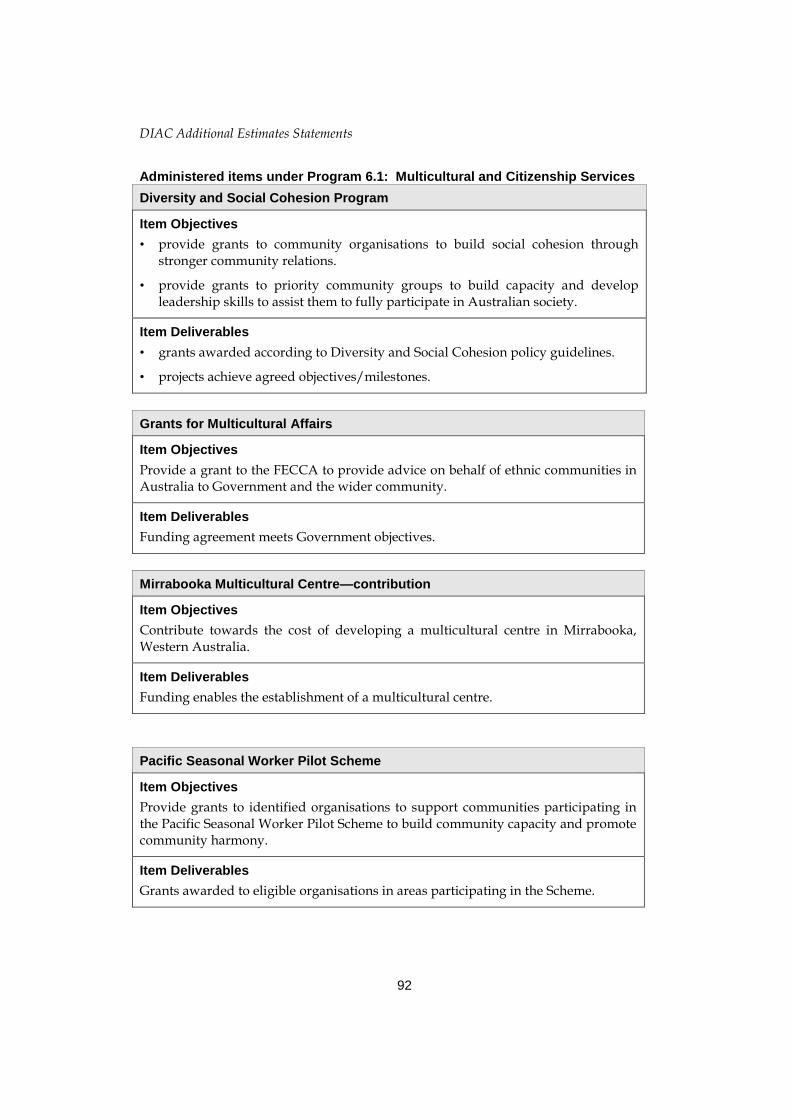
DIAC Additional Estimates Statements
92
Administered items under Program 6.1: Multicultural and Citizenship Services
Diversity and Social Cohesion Program
Item Objectives
• provide grants to community organisations to build social cohesion through stronger community relations.
• provide grants to priority community groups to build capacity and develop leadership skills to assist them to fully participate in Australian society.
Item Deliverables
• grants awarded according to Diversity and Social Cohesion policy guidelines.
• projects achieve agreed objectives/milestones.
Grants for Multicultural Affairs
Item Objectives
Provide a grant to the FECCA to provide advice on behalf of ethnic communities in Australia to Government and the wider community.
Item Deliverables
Funding agreement meets Government objectives.
Mirrabooka Multicultural Centre—contribution
Item Objectives
Contribute towards the cost of developing a multicultural centre in Mirrabooka, Western Australia.
Item Deliverables
Funding enables the establishment of a multicultural centre.
Pacific Seasonal Worker Pilot Scheme
Item Objectives
Provide grants to identified organisations to support communities participating in the Pacific Seasonal Worker Pilot Scheme to build community capacity and promote community harmony.
Item Deliverables
Grants awarded to eligible organisations in areas participating in the Scheme.

DIAC Additional Estimates Statements
93
Section 3: Explanatory Tables and Budgeted Financial Statements
3.1 EXPLANATORY TABLES
Estimates of Special Account Flows
Special accounts provide a means to set aside and record amounts used for specified
purposes. Table 3.1.1 reports the expected additions (receipts) and reductions (payments)
for each account used by the Department of Immigration and Citizenship. The
corresponding table in the 2012-13 Portfolio Budget Statements is Table 3.1.2.
Table 3.1.1: Estimates of Special Account Flows
Opening Closing
balance Receipts Payments Adjustments balance
2012-13 2012-13 2012-13 2012-13 2012-13
2011-12 2011-12 2011-12 2011-12 2011-12
Outcome $'000 $'000 $'000 $'000 $'000
Australian Population
Multicultural and Immigration
Research Program Account 1 235 - 235 - -
- Section 20 FMA Act (A) 326 - 91 - 235
Total Special Accounts
2012-13 Budget estimate 235 - 235 - -
Total Special Accounts
2011-12 actual 326 - 91 - 235 (A) = Administered (D) = Departmental

DIAC Additional Estimates Statements
94
3.2 BUDGETED FINANCIAL STATEMENTS
3.2.1 Analysis of budgeted financial statements
An analysis of the primary source of movements between the financial statements published in the Portfolio Budget Statements 2012-13 (PBS) and the Portfolio Additional Estimates Statements 2012-13 (PAES) is provided below.
Budgeted departmental comprehensive income statement
The Department of Immigration and Citizenship is budgeting for a break-even departmental operating result, adjusted for depreciation and amortisation expense, in 2012-13.
This statement presents the expected financial result for the Department and identifies expenses and revenues on a full accrual basis.
Expenses
In 2012-13, total departmental expenses are expected to increase from $1,435.1 million (as published in the 2012-13 PBS) to $1,590 million, an increase of $154.9 million. This movement reflects the net impact of $77.4 million increase due to new measures since 2012-13 Budget, an increase of $37.4 million in depreciation and amortisation costs and other variations of $40.1 million across all outcomes.
Full details of the additional funding for 2012-13 for new measures and other variations are provided in the tables presented in Section 1 of this document.
Income
In 2012-13, total departmental revenue is expected to increase from $1,354.2 million (as published in the 2012-13 PBS) to $1,471.6 million. The movement is primarily due to an increase in Revenue from Government (appropriation revenue) of $113.8 million and an increase in DIAC’s own source revenue of $3.6 million.
Budgeted departmental balance sheet
This statement reports the financial position of the Department, its assets, liabilities and equity.
In 2012-13, total departmental assets are expected to decrease from $844.5 million (as published in the 2012-13 PBS) to $793.5 million. This decrease is mainly due to the increase in depreciation of $37.4 million.

DIAC Additional Estimates Statements
95
Departmental Statement of Changes in Equity – Summary of Movements
Equity is also expected to decrease from $435.1 million (as published in the 2012-13 PBS) to $372.5 million. The decrease of $62.6 million in departmental equity mainly reflects the Accumulated Deficit in relation to the 2011-12 operating result.
Budgeted departmental statement of cash flows
The cash flow statement reports the extent and nature of cash flows, grouped according to operating, investing and financing activities.
The budgeted cash flows largely mirror the trends and impacts of the measures reported above for the income statement and balance sheet.
Capital budget statement—departmental
This statement reports the forward plan for capital expenditure. `
Statement of asset movements
This statement reports the budgeted movements by asset class of the Department’s non-financial assets during the current financial year.
Schedule of Administered Activity
Schedule of budgeted income and expenses administered on behalf of government
This schedule identifies the main revenue and expense items administered by the Department on behalf of the Government.
Expenses
In 2012-13, administered expenses are expected to increase from $1,206.8 million (as published in the 2012-13 PBS) to $2,322.6 million, an increase of $1,115.8 million. The change in administered expenses reflects an increase in government decisions of $317.2 million, additional funding of $984.6 million due to the continued increase in arrivals and to implement recommendations from the Report of the Expert Panel on Asylum Seekers.
Income
In 2012-13, the Department will administer the collection of revenue on behalf of the Government of $1,374.6 million, which is an increase of $58.6 million in the administered revenue estimate published in the 2012-13 PBS.
This increase in revenue primarily relates to additional government revenue measures of $59.3 million which are detailed in this document in Table 1.2 Budget Measures.
DIAC Additional Estimates Statements
96
Schedule of budgeted assets and liabilities administered on behalf of government
This schedule reports assets and liabilities administered by the Department on behalf of the Government.
Schedule of budgeted administered cash flows
This schedule shows the cash flows administered on behalf of the Government. The cash flows largely reflect the transactions of the schedule of income and expenses.
Schedule for administered capital budget
This statement reports the forward plan for capital expenditure.
Statement of administered asset movements
This statement reports the budgeted movements by asset class of Administered non-financial assets during the current financial year.
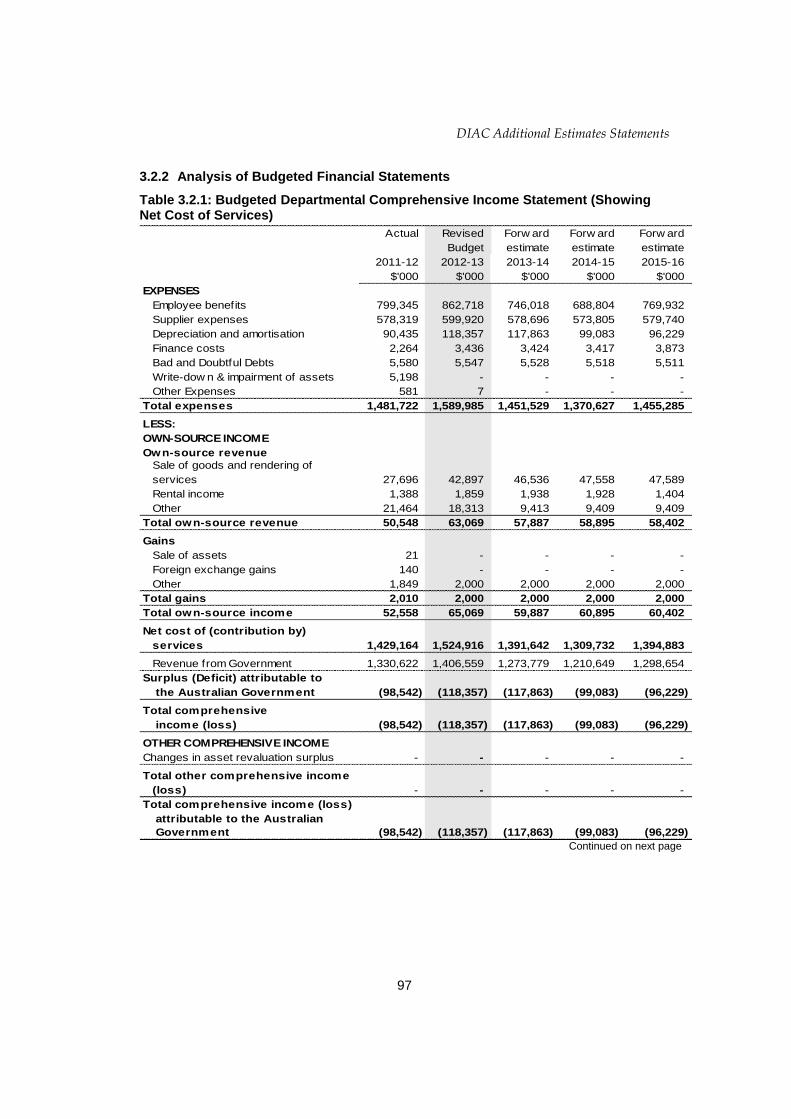
DIAC Additional Estimates Statements
97
3.2.2 Analysis of Budgeted Financial Statements
Table 3.2.1: Budgeted Departmental Comprehensive Income Statement (Showing Net Cost of Services)
Actual Revised Forw ard Forw ard Forw ard
Budget estimate estimate estimate
2011-12 2012-13 2013-14 2014-15 2015-16
$'000 $'000 $'000 $'000 $'000
EXPENSES
Employee benefits 799,345 862,718 746,018 688,804 769,932
Supplier expenses 578,319 599,920 578,696 573,805 579,740
Depreciation and amortisation 90,435 118,357 117,863 99,083 96,229
Finance costs 2,264 3,436 3,424 3,417 3,873
Bad and Doubtful Debts 5,580 5,547 5,528 5,518 5,511
Write-dow n & impairment of assets 5,198 - - - -
Other Expenses 581 7 - - -
Total expenses 1,481,722 1,589,985 1,451,529 1,370,627 1,455,285
LESS:
OWN-SOURCE INCOME
Own-source revenue
Sale of goods and rendering of
services 27,696 42,897 46,536 47,558 47,589
Rental income 1,388 1,859 1,938 1,928 1,404
Other 21,464 18,313 9,413 9,409 9,409
Total own-source revenue 50,548 63,069 57,887 58,895 58,402
Gains
Sale of assets 21 - - - -
Foreign exchange gains 140 - - - -
Other 1,849 2,000 2,000 2,000 2,000
Total gains 2,010 2,000 2,000 2,000 2,000
Total own-source income 52,558 65,069 59,887 60,895 60,402
Net cost of (contribution by)
services 1,429,164 1,524,916 1,391,642 1,309,732 1,394,883
Revenue from Government 1,330,622 1,406,559 1,273,779 1,210,649 1,298,654
Surplus (Deficit) attributable to
the Australian Government (98,542) (118,357) (117,863) (99,083) (96,229)
Total comprehensive
income (loss) (98,542) (118,357) (117,863) (99,083) (96,229)
OTHER COMPREHENSIVE INCOME
Changes in asset revaluation surplus - - - - -
Total other comprehensive income
(loss) - - - - -
Total comprehensive income (loss)
attributable to the Australian
Government (98,542) (118,357) (117,863) (99,083) (96,229)
Continued on next page
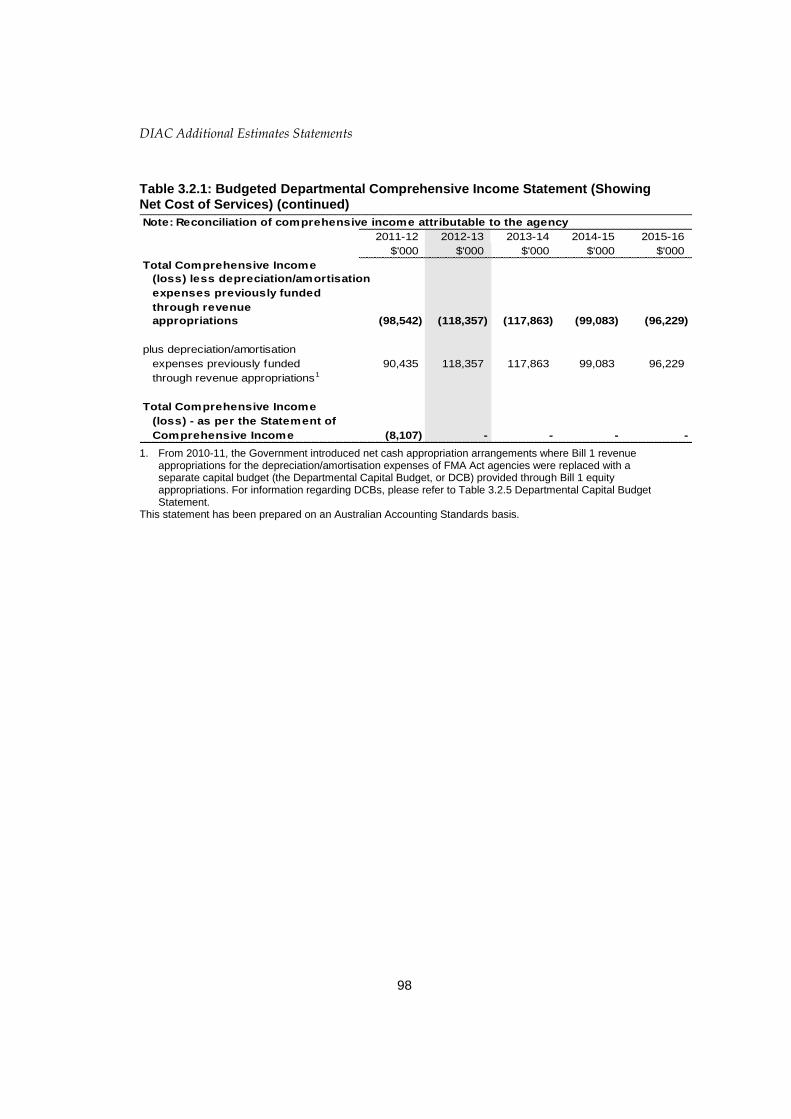
DIAC Additional Estimates Statements
98
Table 3.2.1: Budgeted Departmental Comprehensive Income Statement (Showing Net Cost of Services) (continued)
Note: Reconciliation of comprehensive income attributable to the agency
2011-12 2012-13 2013-14 2014-15 2015-16
$'000 $'000 $'000 $'000 $'000
Total Comprehensive Income
(loss) less depreciation/amortisation
expenses previously funded
through revenue
appropriations (98,542) (118,357) (117,863) (99,083) (96,229)
plus depreciation/amortisation
expenses previously funded 90,435 118,357 117,863 99,083 96,229
through revenue appropriations1
Total Comprehensive Income
(loss) - as per the Statement of
Comprehensive Income (8,107) - - - -
1. From 2010-11, the Government introduced net cash appropriation arrangements where Bill 1 revenue appropriations for the depreciation/amortisation expenses of FMA Act agencies were replaced with a separate capital budget (the Departmental Capital Budget, or DCB) provided through Bill 1 equity appropriations. For information regarding DCBs, please refer to Table 3.2.5 Departmental Capital Budget Statement.
This statement has been prepared on an Australian Accounting Standards basis.

DIAC Additional Estimates Statements
99
Table 3.2.2: Budgeted Departmental Balance Sheet (as at 30 June)
Actual Revised Forw ard Forw ard Forw ard
Budget estimate estimate estimate
2011-12 2012-13 2013-14 2014-15 2015-16
$'000 $'000 $'000 $'000 $'000
ASSETS
Financial assets
Cash and cash equivalents 2,386 53,883 53,883 53,883 53,883
Trade and other receivables 353,670 315,773 303,508 310,666 319,501
Other f inancial assets 2,070 2,069 2,069 2,069 2,069
Total financial assets 358,126 371,725 359,460 366,618 375,453
Non-financial assets
Land and buildings 73,761 63,287 60,406 55,170 229,519
Property, plant and equipment 37,511 58,929 107,414 116,189 123,252
Intangibles 313,165 285,166 204,271 183,016 163,859
Other non-financial assets 14,407 14,407 14,407 14,407 14,407
Total non-financial assets 438,844 421,789 386,498 368,782 531,037
Total assets 796,970 793,514 745,958 735,400 906,490
LIABILITIES
Payables
Suppliers 25,649 25,649 25,649 25,649 25,649
Other payables 125,835 129,375 129,375 129,375 129,375
Total payables 151,484 155,024 155,024 155,024 155,024
Interest bearing liabilities
Leases 2,690 2,241 (17,466) (17,466) (17,466)
Total interest bearing liabilities 2,690 2,241 (17,466) (17,466) (17,466)
Provisions
Employee provisions 231,675 234,767 234,767 234,767 234,767
Other 29,021 29,023 29,021 29,021 29,021
Total provisions 260,696 263,790 263,788 263,788 263,788
Total liabilities 414,870 421,055 401,346 401,346 401,346
Net assets 382,100 372,459 344,612 334,054 505,144
EQUITY*
Parent entity interest
Contributed equity 478,739 580,041 662,613 743,977 1,002,460
Reserves 112,495 116,094 116,366 116,369 116,369
Retained surplus
(accumulated deficit) (209,134) (323,676) (434,367) (526,292) (613,685)
Total parent entity interest 382,100 372,459 344,612 334,054 505,144
Total Equity 382,100 372,459 344,612 334,054 505,144 * Equity is the residual interest in assets after deduction of liabilities. This statement has been prepared on an Australian Accounting Standards basis.

DIAC Additional Estimates Statements
100
Table 3.2.3: Departmental Statement of Changes in Equity — Summary of Movement (Budget year 2012-13)
Retained Asset Other Contributed Total
earnings revaluation reserves equity/ equity
reserve capital
$'000 $'000 $'000 $'000 $'000
Opening balance as at 1 July 2012
Balance carried forw ard from
previous period (209,134) 112,495 - 478,739 382,100
Adjustment for changes in
accounting policies - - - - -
Adjusted opening balance (209,134) 112,495 - 478,739 382,100
Comprehensive income
Other comprehensive income - - - - -
Surplus (deficit) for the period (118,357) - - - (118,357)
Other 3,815 3,599 - - 7,414
Total comprehensive income (114,542) 3,599 - - (110,943)
of w hich:
Attributable to the Australian Government (114,542) 3,599 - - (110,943)
Transactions with owners
Contributions by owners
Equity Injection - - - - -
Equity Injection - Appropriation - - - 25,115 25,115
Departmental Capital Budget (DCBs) - - - 76,187 76,187
Sub-total transactions with owners - - - 101,302 101,302
Estimated closing balance
as at 30 June 2013 (323,676) 116,094 - 580,041 372,459
Closing balance attributable to the
Australian Government (323,676) 116,094 - 580,041 372,459 This statement has been prepared on an Australian Accounting Standards basis.
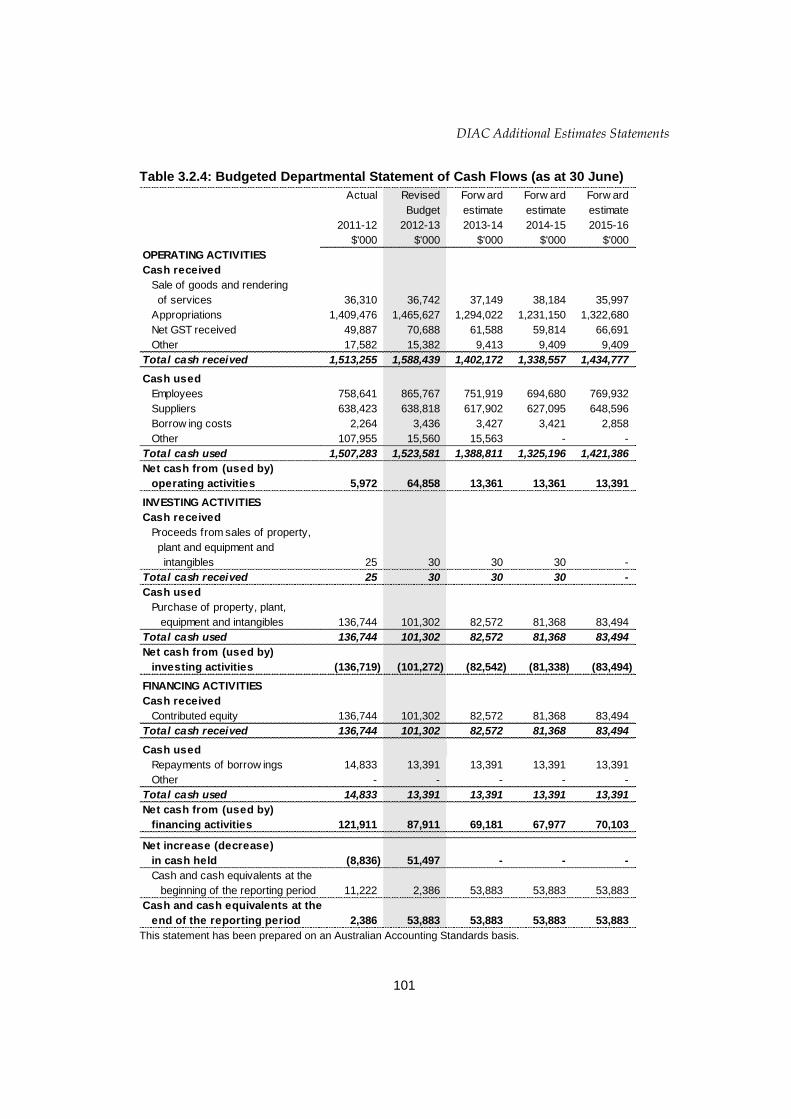
DIAC Additional Estimates Statements
101
Table 3.2.4: Budgeted Departmental Statement of Cash Flows (as at 30 June)
Actual Revised Forw ard Forw ard Forw ard
Budget estimate estimate estimate
2011-12 2012-13 2013-14 2014-15 2015-16
$'000 $'000 $'000 $'000 $'000
OPERATING ACTIVITIES
Cash received
Sale of goods and rendering
of services 36,310 36,742 37,149 38,184 35,997
Appropriations 1,409,476 1,465,627 1,294,022 1,231,150 1,322,680
Net GST received 49,887 70,688 61,588 59,814 66,691
Other 17,582 15,382 9,413 9,409 9,409
Total cash received 1,513,255 1,588,439 1,402,172 1,338,557 1,434,777
Cash used
Employees 758,641 865,767 751,919 694,680 769,932
Suppliers 638,423 638,818 617,902 627,095 648,596
Borrow ing costs 2,264 3,436 3,427 3,421 2,858
Other 107,955 15,560 15,563 - -
Total cash used 1,507,283 1,523,581 1,388,811 1,325,196 1,421,386
Net cash from (used by)
operating activities 5,972 64,858 13,361 13,361 13,391
INVESTING ACTIVITIES
Cash received
Proceeds from sales of property,
plant and equipment and
intangibles 25 30 30 30 -
Total cash received 25 30 30 30 -
Cash used
Purchase of property, plant,
equipment and intangibles 136,744 101,302 82,572 81,368 83,494
Total cash used 136,744 101,302 82,572 81,368 83,494
Net cash from (used by)
investing activities (136,719) (101,272) (82,542) (81,338) (83,494)
FINANCING ACTIVITIES
Cash received
Contributed equity 136,744 101,302 82,572 81,368 83,494
Total cash received 136,744 101,302 82,572 81,368 83,494
Cash used
Repayments of borrow ings 14,833 13,391 13,391 13,391 13,391
Other - - - - -
Total cash used 14,833 13,391 13,391 13,391 13,391
Net cash from (used by)
financing activities 121,911 87,911 69,181 67,977 70,103
Net increase (decrease)
in cash held (8,836) 51,497 - - -
Cash and cash equivalents at the
beginning of the reporting period 11,222 2,386 53,883 53,883 53,883
Cash and cash equivalents at the
end of the reporting period 2,386 53,883 53,883 53,883 53,883 This statement has been prepared on an Australian Accounting Standards basis.

DIAC Additional Estimates Statements
102
Table 3.2.5: Capital Budget Statement — Departmental
Actual Revised Forw ard Forw ard Forw ard
Budget estimate estimate estimate
2011-12 2012-13 2013-14 2014-15 2015-16
$'000 $'000 $'000 $'000 $'000
CAPITAL APPROPRIATIONS
Capital budget - Act No. 1 (DCB) 104,746 76,187 76,737 80,603 82,720
Equity injections - Act No. 2 11,698 25,115 5,835 765 774
Total new capital appropriations 116,444 101,302 82,572 81,368 83,494
Provided for:
Purchase of non-financial assets 99,631 101,302 82,572 81,368 83,494
Annual finance lease costs 16,813 - - - -
Total Items 116,444 101,302 82,572 81,368 83,494
PURCHASE OF NON-FINANCIAL
ASSETS
Funded by capital appropriations 131,583 25,115 5,835 765 774
Funded by capital appropriation - DCB 2132,255 76,187 76,737 80,603 82,720
TOTAL AMOUNT SPENT 163,838 101,302 82,572 81,368 83,494
RECONCILIATION OF CASH
USED TO ACQUIRE ASSETS
TO ASSET MOVEMENT TABLE
Total purchases 136,744 101,302 82,572 81,368 83,494
Total cash used to
acquire assets 136,744 101,302 82,572 81,368 83,494 1. Includes both current and prior Act 2 and Bills 4/6 appropriations and special capital appropriations. 2. Does not include annual finance lease costs. Include purchase from current and previous years'
Departmental Capital Budgets (DCB).
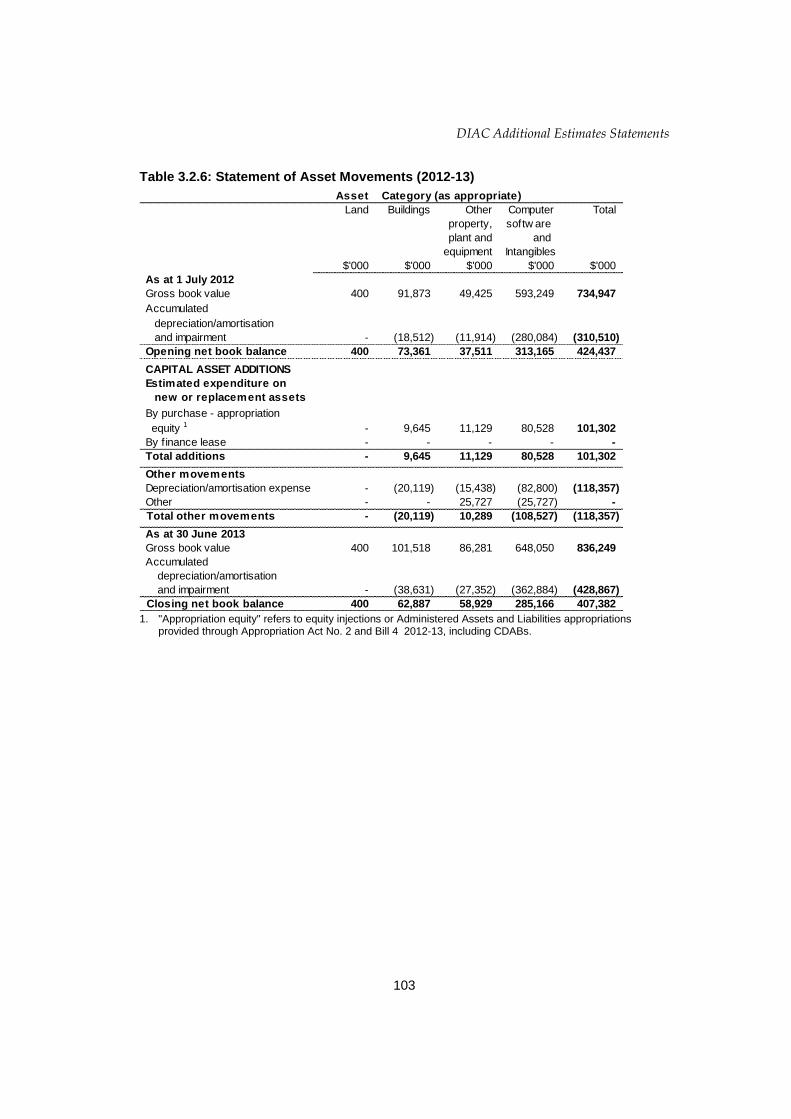
DIAC Additional Estimates Statements
103
Table 3.2.6: Statement of Asset Movements (2012-13)
Asset Category (as appropriate)
Land Buildings Other Computer Total
property, softw are
plant and and
equipment Intangibles
$'000 $'000 $'000 $'000 $'000
As at 1 July 2012
Gross book value 400 91,873 49,425 593,249 734,947
Accumulated
depreciation/amortisation
and impairment - (18,512) (11,914) (280,084) (310,510)
Opening net book balance 400 73,361 37,511 313,165 424,437
CAPITAL ASSET ADDITIONS
Estimated expenditure on
new or replacement assets
By purchase - appropriation
equity 1 - 9,645 11,129 80,528 101,302
By f inance lease - - - - -
Total additions - 9,645 11,129 80,528 101,302
Other movements
Depreciation/amortisation expense - (20,119) (15,438) (82,800) (118,357)
Other - - 25,727 (25,727) -
Total other movements - (20,119) 10,289 (108,527) (118,357)
As at 30 June 2013
Gross book value 400 101,518 86,281 648,050 836,249
Accumulated
depreciation/amortisation
and impairment - (38,631) (27,352) (362,884) (428,867)
Closing net book balance 400 62,887 58,929 285,166 407,382 1. "Appropriation equity" refers to equity injections or Administered Assets and Liabilities appropriations
provided through Appropriation Act No. 2 and Bill 4 2012-13, including CDABs.
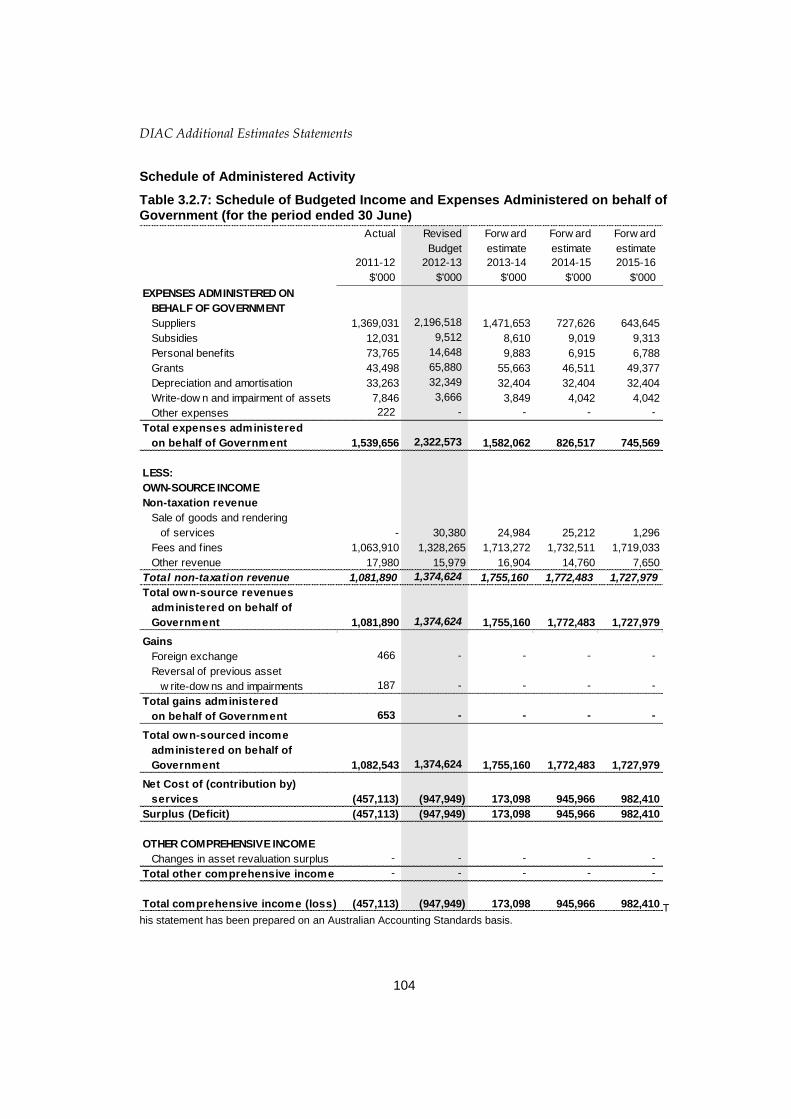
DIAC Additional Estimates Statements
104
Schedule of Administered Activity
Table 3.2.7: Schedule of Budgeted Income and Expenses Administered on behalf of Government (for the period ended 30 June)
Actual Revised Forw ard Forw ard Forw ard
Budget estimate estimate estimate
2011-12 2012-13 2013-14 2014-15 2015-16
$'000 $'000 $'000 $'000 $'000
EXPENSES ADMINISTERED ON
BEHALF OF GOVERNMENT
Suppliers 1,369,031 2,196,518 1,471,653 727,626 643,645
Subsidies 12,031 9,512 8,610 9,019 9,313
Personal benefits 73,765 14,648 9,883 6,915 6,788
Grants 43,498 65,880 55,663 46,511 49,377
Depreciation and amortisation 33,263 32,349 32,404 32,404 32,404
Write-dow n and impairment of assets 7,846 3,666 3,849 4,042 4,042
Other expenses 222 - - - -
Total expenses administered
on behalf of Government 1,539,656 2,322,573 1,582,062 826,517 745,569
LESS:
OWN-SOURCE INCOME
Non-taxation revenue
Sale of goods and rendering
of services - 30,380 24,984 25,212 1,296
Fees and f ines 1,063,910 1,328,265 1,713,272 1,732,511 1,719,033
Other revenue 17,980 15,979 16,904 14,760 7,650
Total non-taxation revenue 1,081,890 1,374,624 1,755,160 1,772,483 1,727,979
Total own-source revenues
administered on behalf of
Government 1,081,890 1,374,624 1,755,160 1,772,483 1,727,979
Gains
Foreign exchange 466 - - - -
Reversal of previous asset
w rite-dow ns and impairments 187 - - - -
Total gains administered
on behalf of Government 653 - - - -
Total own-sourced income
administered on behalf of
Government 1,082,543 1,374,624 1,755,160 1,772,483 1,727,979
Net Cost of (contribution by)
services (457,113) (947,949) 173,098 945,966 982,410
Surplus (Deficit) (457,113) (947,949) 173,098 945,966 982,410
OTHER COMPREHENSIVE INCOME
Changes in asset revaluation surplus - - - - -
Total other comprehensive income - - - - -
Total comprehensive income (loss) (457,113) (947,949) 173,098 945,966 982,410 This statement has been prepared on an Australian Accounting Standards basis.

DIAC Additional Estimates Statements
105
Table 3.2.8: Schedule of Budgeted Assets and Liabilities Administered on behalf of Government (as at 30 June)
Actual Revised Forw ard Forw ard Forw ard
Budget estimate estimate estimate
2011-12 2012-13 2013-14 2014-15 2015-16
$'000 $'000 $'000 $'000 $'000
ASSETS ADMINISTERED ON
BEHALF OF GOVERNMENT
Financial assets
Cash and cash equivalents 24,708 24,708 24,708 24,708 24,708
Trade and other receivables 14,146 18,076 18,105 18,696 18,696
Other f inancial assets 22,192 22,192 22,192 22,192 22,192
Total financial assets 61,046 64,976 65,005 65,596 65,596
Non-financial assets
Land and buildings 895,100 1,161,337 1,144,728 1,128,381 1,112,459
Property, plant and equipment 5,277 21,990 21,974 21,950 21,923
Other non-financial assets 73 73 73 73 73
Total non-financial assets 900,450 1,183,400 1,166,775 1,150,404 1,134,455
Total assets administered
on behalf of Government 961,496 1,248,376 1,231,780 1,216,000 1,200,051
LIABILITIES ADMINISTERED ON
BEHALF OF GOVERNMENT
Payables
Suppliers 59,137 59,137 59,137 59,137 59,137
Subsidies 6,675 6,675 6,675 6,675 6,675
Personal benefits 13,732 13,732 13,732 13,732 13,732
Grants 984 984 984 984 984
Other payables 320,213 134,213 134,213 134,213 134,213
Total payables 400,741 214,741 214,741 214,741 214,741
Provisions
Other provisions 13,157 13,157 13,157 13,157 13,157
Total provisions 13,157 13,157 13,157 13,157 13,157
Total liabilities administered
on behalf of Government 413,898 227,898 227,898 227,898 227,898
Net assets/(liabilities) 547,598 1,020,478 1,003,882 988,102 972,153 This statement has been prepared on an Australian Accounting Standards basis.

DIAC Additional Estimates Statements
106
Table 3.2.9: Schedule of Budgeted Administered Cash Flows (for the period ended 30 June)
Actual Revised Forw ard Forw ard Forw ard
Budget estimate estimate estimate
2011-12 2012-13 2013-14 2014-15 2015-16
$'000 $'000 $'000 $'000 $'000
OPERATING ACTIVITIES
Cash received
Sales of goods and rendering
of services 1,060,659 1,355,345 1,734,340 1,753,478 1,720,379
Net GST received 159,489 87,156 67,837 67,543 65,511
Other 29,276 15,864 16,971 14,963 11,339
Total cash received 1,249,424 1,458,365 1,819,148 1,835,984 1,797,229
Cash used
Grant 42,938 65,876 55,660 46,485 49,277
Subsidies paid 7,408 11,636 11,745 9,019 9,313
Personal benefits 67,312 14,648 9,883 10,415 10,288
Suppliers 1,435,719 2,469,228 1,540,035 793,388 706,809
Other 35,461 - - - -
Total cash used 1,588,838 2,561,388 1,617,323 859,307 775,687
Net cash from (used by)
operating activities (339,414) (1,103,023) 201,825 976,677 1,021,542
INVESTING ACTIVITIES
Cash used
Purchase of property, plant 192,494 315,299 15,779 16,033 16,455
and equipment
Total cash used 192,494 315,299 15,779 16,033 16,455
Net cash from (used by)
investing activities (192,494) (315,299) (15,779) (16,033) (16,455)
FINANCING ACTIVITIES
Cash received
Capital injections 192,494 315,299 15,779 16,033 16,455
Total cash received 192,494 315,299 15,779 16,033 16,455
Net cash from (used by)
financing activities 192,494 315,299 15,779 16,033 16,455
Net increase (decrease) in
cash held (339,414) (1,103,023) 201,825 976,677 1,021,542
Cash and cash equivalents at
beginning of reporting period 15,105 24,708 24,708 24,708 24,708
Cash from Official Public
Account for:
- Appropriations 1,592,802 2,559,737 1,615,468 857,179 775,687
Total 1,607,907 2,584,445 1,640,176 881,887 800,395
Cash to Official Public
Account for:
- Appropriations 1,243,785 1,456,714 1,817,293 1,833,856 1,797,229
Total 1,243,785 1,456,714 1,817,293 1,833,856 1,797,229
Cash and cash equivalents at end
of reporting period 24,708 24,708 24,708 24,708 24,708 This statement has been prepared on an Australian Accounting Standards basis.

DIAC Additional Estimates Statements
107
Table 3.2.10: Schedule of Administered Capital Budget
Actual Revised Forw ard Forw ard Forw ard
Budget estimate estimate estimate
2011-12 2012-13 2013-14 2014-15 2015-16
$'000 $'000 $'000 $'000 $'000
CAPITAL APPROPRIATIONS
Capital budget - Act 1 (ACB) 18,517 15,525 15,779 16,033 16,455
Administered assets and
Liabilities - Act 2 23,966 299,774 - - -
Total new capital appropriations 42,483 315,299 15,779 16,033 16,455 - - - -
Provided for:
Purchase of non-financial assets 21,755 47,919 15,779 16,033 16,455
Other Items 20,728 267,380 - - -
Total Items 42,483 315,299 15,779 16,033 16,455 - - - -
PURCHASE OF NON-FINANCIAL
ASSETS
Funded by capital appropriations1177,089 299,774 - - -
Funded by capital appropriation - ACB218,517 15,525 15,779 16,033 16,455
TOTAL AMOUNT SPENT 195,606 315,299 15,779 16,033 16,455
RECONCILIATION OF CASH
USED TO ACQUIRE ASSETS
TO ASSET MOVEMENT TABLETO ASSET MOVEMENT TABLE - - - - Total purchases 192,494 315,299 15,779 16,033 16,455
Total cash used to
acquire assets 192,494 315,299 15,779 16,033 16,455 1. This item includes both current and prior Act 2 and Bills 4/6 appropriations and special capital
appropriations. 2. This item does not include annual finance lease costs. Include purchase from current and previous years
Administered Capital Budgets (ACBs).

DIAC Additional Estimates Statements
108
Table 3.2.11: Statement of Administered Asset Movements (2012-13)
Asset Category (as appropriate)
Land Buildings Other Computer Total
property, softw are
plant and and
equipment Intangibles
$'000 $'000 $'000 $'000 $'000
As at 1 July 2012
Gross book value 66,470 863,245 8,042 - 937,757
Accumulated
depreciation/amortisation
and impairment - (34,615) (2,765) - (37,380)
Opening net book balance 66,470 828,630 5,277 - 900,377
CAPITAL ASSET ADDITIONS
Estimated expenditure on
new or replacement assets
By purchase - appropriation equity 1 43 289,517 25,739 - 315,299
Total additions 43 289,517 25,739 - 315,299 - - -
Other movements
Depreciation/amortisation expense - (23,323) (9,026) - (32,349)
Total other movements - (23,323) (9,026) - (32,349)
As at 30 June 2013
Gross book value 66,513 1,152,762 33,781 - 1,253,056
Accumulated
and impairment - (57,938) (11,791) - (69,729)
Closing net book balance 66,513 1,094,824 21,990 - 1,183,327 1. "Appropriation equity" refers to equity injections or Administered Assets and Liabilities appropriations
provided through Appropriation Act No.2 and Bill No.4 2012-13, including CDABs. This statement has been prepared on an Australian Accounting Standards basis.
Migration Review Tribunal and
Refugee Review Tribunal
Agency resources and planned performance

111
MIGRATION REVIEW TRIBUNAL
AND
REFUGEE REVIEW TRIBUNAL
Section 1: Agency overview and resources ........................................................... 113
1.1 Strategic Direction ................................................................................................ 113
1.2 Agency Resource Statement ............................................................................... 114
1.3 Agency Measures table ........................................................................................ 114
1.4 Additional Estimates and variations ..................................................................... 115
1.5 Breakdown of Additional Estimates by appropriation bill ..................................... 116
Section 2: Revisions to agency outcomes and planned performance ................ 117
2.1 Resources and performance information ............................................................. 117
Section 3: Explanatory tables and budgeted financial statements ..................... 118
3.1 Explanatory tables ................................................................................................ 118
3.2 Budgeted financial statements ............................................................................. 119

MRT-RRT Additional Estimates Statements
113
MIGRATION REVIEW TRIBUNAL
AND
REFUGEE REVIEW TRIBUNAL
Section 1: Agency overview and resources
1.1 STRATEGIC DIRECTION
The key strategic priorities for the tribunals are to meet their statutory objectives
through the delivery of consistent, high-quality reviews and timely and lawful
decisions. Each review has to be conducted in a way that ensures, as far as practicable,
that an applicant understands the issues and has a fair opportunity to respond to any
matters which might lead to an adverse outcome. These priorities are reflected in the
Tribunals’ Plan.
In 2012–13, the tribunals expect that lodgements will increase to around 23,000
applications for review.
In July 2012-13, under a Machinery of Government change, the functions for the
operation of the Independent Protection Assessment Office (IPAO) were transferred to
the tribunal and the caseload has now been finalised.

MRT-RRT Additional Estimates Statements
114
1.2 AGENCY RESOURCE STATEMENT
The Agency Resource Statement details the resourcing for the Migration Review
Tribunal and Refugee Review Tribunal (MRT-RRT) at Additional Estimates. Table 1.1
outlines the total resourcing available from all sources for the 2012-13 Budget year,
including variations through Appropriation Bills No.3 and No.4, special
appropriations and special accounts.
Table 1.1: MRT-RRT resource statement — Additional estimates for 2012-13 as at Additional Estimates February 2013
Estimate
as Proposed Total Total
at Budget+
Additional=
estimate available
Estimate
at
Additional
appropriati
on
Estimates
2012- 13 2012- 13 2012- 13 2011- 12
$'000 $'000 $'000 $'000
Ordina ry a nnua l se rvic e s1
De pa rtme nta l a ppropria tion
Prior year departmental appropriation2 6,000 - 6,000 -
Departmental appropriation3
54,166 4,663 58,829 46,772
s31 Relevant agency receipts4
200 - 200 -
Tota l 6 0 ,3 6 6 4 ,6 6 3 6 5 ,0 2 9 4 6 ,7 7 2
Othe r Se rvic e s
De pa rtme nta l non- ope ra ting
Equity injections 41 - 41 -
Tota l 4 1 - 4 1 -
Tota l othe r se rvic e s 4 1 - 4 1 -
Tota l a va ila ble a nnua l
a ppropria tions 6 0 ,4 0 7 4 ,6 6 3 6 5 ,0 7 0 4 6 ,7 7 2 1. Appropriation Act (No. 1) 2012-13 & Appropriation Bill (No. 3) 2012-13. 2. Estimated adjusted balance carried forward from previous year. 3. This item includes an amount of $4.87 million in 2012-13 for the Departmental Capital Budget
(refer to table 3.2.5 for further details). For accounting purposes this amount has been designated as 'contributions by owners'.
4. s31 Relevant Agency receipts – estimate
NOTE: The MRT-RRT has received $14.455 million under an interim section 32 determination.
Reader note: All figures are GST exclusive.
1.3 AGENCY MEASURES TABLE
Table 1.2 summarises new Government measures taken since the 2012-13 Budget. The
table is split into revenue, expense and capital measures, with the affected program
identified.

MRT-RRT Additional Estimates Statements
115
Table 1.2: MRT-RRT 2012-13 Measures since Budget
Program 2012-13 2013-14 2014-15 2015-16
$'000 $'000 $'000 $'000
Expense measures
Targeted savings - public service
efficiencies
Administered expenses - - - -
Departmental expenses 1.1 (10) (12) (12) (12)
Total (10) (12) (12) (12)
Total expense measures
Administered - - - -
Departmental (10) (12) (12) (12)
Total (10) (12) (12) (12) This statement has been prepared on an Australian Accounting Standards basis.
1.4 ADDITIONAL ESTIMATES AND VARIATIONS
The following tables detail the changes to the resourcing for the MRT-RRT at
Additional Estimates, by outcome. Table 1.3 details the Additional Estimates and
variations resulting from new measures since the 2012-13 Budget in Appropriation
Bills No. 3 and No. 4. Table 1.4 details Additional Estimates or variations through
other factors, such as parameter adjustments.
Table 1.3: Additional estimates and variations to outcomes from measures since 2012-13 Budget
Program 2012-13 2013-14 2014-15 2015-16
impacted $'000 $'000 $'000 $'000
Outcome 1
Decrease in estimates (departmental)
Targeted savings - public service
efficiencies 1.1 (10) (12) (12) (12)
Net impact on estimates
for Outcome 1 (departmental) (10) (12) (12) (12)
Table 1.4: Additional estimates and variations to outcomes from other variations
Program 2012-13 2013-14 2014-15 2015-16
impacted $'000 $'000 $'000 $'000
Outcome 1
Increase in estimates (departmental)
Program specif ic parameter variation 1.1 4,673 - - -
Decrease in estimates (departmental)
Other variation 1.1 - (173) (261) (311)
Net impact on estimates
for Outcome 1 (departmental) 4,673 (173) (261) (311)

MRT-RRT Additional Estimates Statements
116
1.5 BREAKDOWN OF ADDITIONAL ESTIMATES BY APPROPRIATION BILL
The following tables detail the Additional Estimates sought for the MRT-RRT through
Appropriation Bill No. 3 and No.4.
Table 1.5: Appropriation Bill (No. 3) 2012-13
2011-12 2012-13 2012-13 Additional Reduced
Available1 Budget Revised Estimates Estimates
$'000 $'000 $'000 $'000 $'000
DEPARTMENTAL PROGRAMS
Outcome 1
Outcome 1: To provide correct
and preferable decisions for
visa applicants and sponsors
through independent, fair, just,
economical, informal and quick
merits review s of migration and
refugee decisions.
46,772 54,166 58,829 4,673 (10)
46,772 54,166 58,829 4,673 (10) 1. 2011-12 available appropriation is included to allow a comparison of this financial year's appropriation
with the amount that was made available for use in the previous year. Available appropriation is the amount available to be drawn down, and is equal to: Budget Appropriation + Additional Estimates Appropriation + AFM – Savings - Other Reductions (includes all quarantines + movement of funds) +/- Section 32 ="- formal reductions determined by the Finance Minister"
Table 1.6: Appropriation Bill (No. 4) 2012-13
The MRT-RRT has no Appropriation Bill No. 4 items. For this reason Table 1.6 has
been omitted.

MRT-RRT Additional Estimates Statements
117
Section 2: Revisions to agency resources and planned performance
2.1 RESOURCES AND PERFORMANCE INFORMATION
Outcome 1: To provide correct and preferable decisions for visa applicants
and sponsors through independent, fair, just, economical, informal and quick
merits reviews of migration and refugee decisions.
Outcome 1 strategy
There has been no change to the MRT-RRT’s strategy.
Table 2.1 Budgeted Expenses and Resources for Outcome 1
2011-12 2012-13
Actual Revised
expenses estimated
expenses
$'000 $'000
Program 1.1: Final independent merits review of decisions
concerning refugee status and the refusal or cancellation
of migration and refugee visas.
Administered expenses
Write-dow n of assets - bad debts 1,751 2,600
Refund of application fees 4,481 5,700
Departmental expenses
Ordinary annual services (Appropriation Bill No. 1) 46,772 58,829
Total for Program 1.1 53,004 67,129
Total expenses for Outcome 1 53,004 67,129
2011-12 2012-13
Average Staffing Level (number) 335 365
MRT-RRT Additional Estimates Statements
118
Section 3: Explanatory tables and budgeted financial statements
3.1 EXPLANATORY TABLES
Estimates of special account flows
Special accounts provide a means to set aside and record amounts used for specified
purposes.
Table 3.1.1: Estimates of special account flows
The MRT-RRT has no special accounts. For this reason Table 3.1.1 has been omitted.

MRT-RRT Additional Estimates Statements
119
3.2 BUDGETED FINANCIAL STATEMENTS
3.2.1 Analysis of budgeted financial statements
There are no major changes for the year.
3.2.2 Budgeted financial statements
Table 3.2.1: Budgeted departmental Comprehensive Income Statement (Showing Net Cost of Services)
Actual Revised Forw ard Forw ard Forw ard
budget estimate estimate estimate
2011-12 2012-13 2013-14 2014-15 2015-16
$'000 $'000 $'000 $'000 $'000
EXPENSES
Employee benefits 41,658 58,461 34,827 35,107 35,992
Suppliers 10,021 10,174 9,449 9,436 9,530
Depreciation and amortisation 1,477 1,231 1,231 1,231 1,231
Finance costs 65 80 80 - -
Write-dow n and impairment of assets 111 - - - -
Total expenses 53,332 69,946 45,587 45,774 46,753
LESS:
OWN-SOURCE INCOME
Own-source revenue
Sale of goods and rendering of services 1,457 200 200 147 200
Total own-source revenue 1,457 200 200 147 200
Gains
Other R.R.F.O.C. 42 60 60 56 60
Total gains 42 60 60 56 60
Total own-source income 1,499 260 260 203 260
Net cost of services 51,833 69,686 45,327 45,571 46,493
Revenue from Government 48,168 68,455 44,096 44,340 45,262 * * * *
(Deficit) attributable to
the Australian Government (3,665) (1,231) (1,231) (1,231) (1,231)
Total comprehensive (loss)
attributable to the Australian
Government (3,665) (1,231) (1,231) (1,231) (1,231)

MRT-RRT Additional Estimates Statements
120
Note: Impact of Net Cash Apppropriation Arrangements
2011-12 2012-13 2013-14 2014-15 2015-16
$'000 $'000 $'000 $'000 $'000
Total Comprehensive Income
(loss) less depreciation/amortisation
expenses previously funded through
revenue appropriations. (2,188) - - - -
plus depreciation/amortisation expenses
previously funded through revenue
appropriations 1,477 1,231 1,231 1,231 1,231
Total Comprehensive
(loss) - as per the Statement of
Comprehensive Income (3,665) (1,231) (1,231) (1,231) (1,231) This statement has been prepared on an Australian Accounting Standards basis.

MRT-RRT Additional Estimates Statements
121
Table 3.2.2: Budgeted departmental balance sheet (as at 30 June) Actual Revised Forw ard Forw ard Forw ard
budget estimate estimate estimate
2011-12 2012-13 2013-14 2014-15 2015-16
$'000 $'000 $'000 $'000 $'000
ASSETS
Financial assets
Cash and cash equivalents 304 307 259 282 (1,343)
Trade and other receivables 6,829 6,297 6,265 6,165 6,165
Total financial assets 7,133 6,604 6,524 6,447 4,822
Non-financial assets
Land and buildings 837 3,443 3,059 2,988 2,988
Property, plant and equipment 1,180 2,157 3,034 3,566 3,822
Intangibles 2,556 2,547 2,500 2,095 1,888
Other non-financial assets 30 30 30 30 30
Total non-financial assets 4,603 8,177 8,623 8,679 8,728
Assets held for sale
Total assets 11,736 14,781 15,147 15,126 13,550
LIABILITIES
Payables
Suppliers 1,612 1,612 1,612 1,612 1,612
Total payables 1,612 1,612 1,612 1,612 1,612
Interest bearing liabilities
Leases 848 263 101 25 25
Total interest bearing liabilities 848 263 101 25 25
Provisions
Employee provisions 9,026 9,026 9,026 9,026 9,026
Total provisions 9,026 9,026 9,026 9,026 9,026
Total liabilities 11,486 10,901 10,739 10,663 10,663
Net assets 250 3,880 4,408 4,463 2,887
EQUITY*
Parent entity interest
Contributed equity 14,782 19,643 21,402 22,688 22,343
Reserves 384 384 384 384 384
Retained surplus
(accumulated deficit) (14,916) (16,147) (17,378) (18,609) (19,840)
Total parent entity interest 250 3,880 4,408 4,463 2,887 This statement has been prepared on an Australian Accounting Standards basis.

MRT-RRT Additional Estimates Statements
122
Table 3.2.3: Departmental statement of changes in equity — summary of movement (Budget year 2012-13)
Retained Asset Contributed Total
earnings revaluation equity/ equity
reserve capital
$'000 $'000 $'000 $'000
Opening balance as at 1 July 2012 (14,916) 384 14,782 250
Comprehensive income
Other comprehensive income
Surplus (deficit) for the period (1,231) - - (1,231)
Total comprehensive income (1,231) - - (1,231)
Transactions with owners
Contributions by owners
Equity Injection - Appropriation - - 41 41
Departmental Capital Budget (DCBs) - - 4,820 4,820
Sub-total transactions with owners - - 4,861 4,861
Estimated closing balance
as at 30 June 2013 (16,147) 384 19,643 3,880 This statement has been prepared on an Australian Accounting Standards basis.
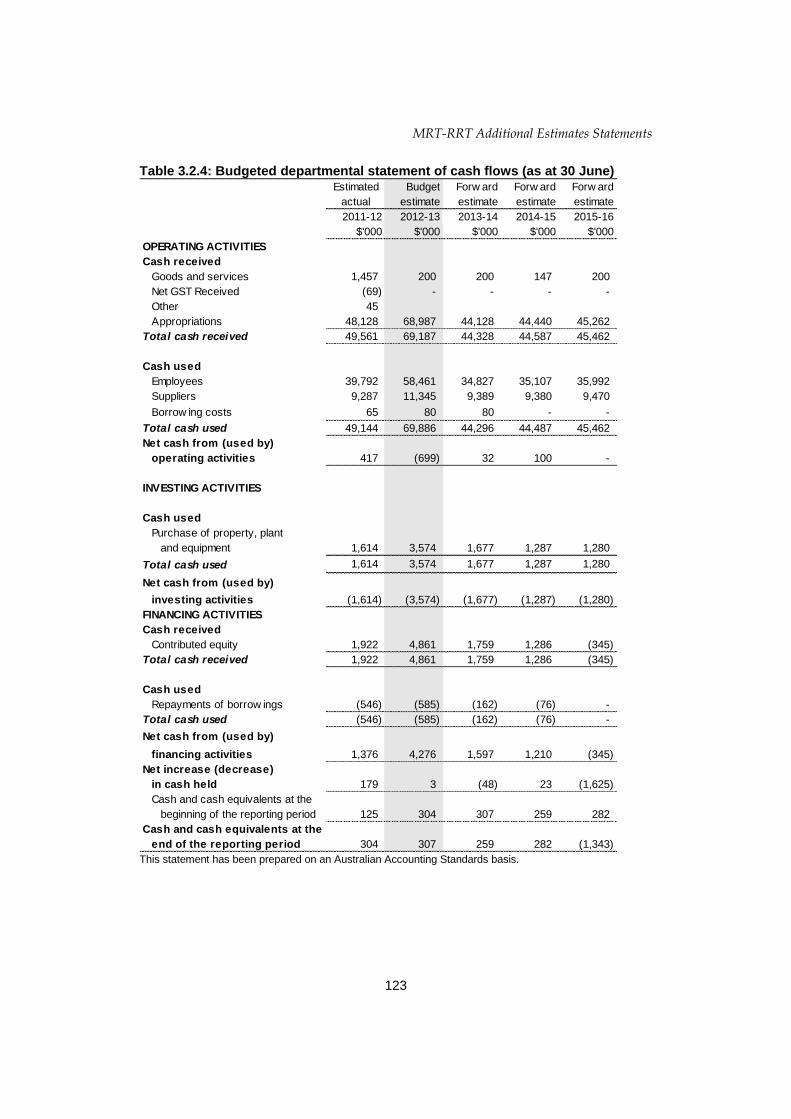
MRT-RRT Additional Estimates Statements
123
Table 3.2.4: Budgeted departmental statement of cash flows (as at 30 June) Estimated Budget Forw ard Forw ard Forw ard
actual estimate estimate estimate estimate
2011-12 2012-13 2013-14 2014-15 2015-16
$'000 $'000 $'000 $'000 $'000
OPERATING ACTIVITIES
Cash received
Goods and services 1,457 200 200 147 200
Net GST Received (69) - - - -
Other 45
Appropriations 48,128 68,987 44,128 44,440 45,262
Total cash received 49,561 69,187 44,328 44,587 45,462
Cash used
Employees 39,792 58,461 34,827 35,107 35,992
Suppliers 9,287 11,345 9,389 9,380 9,470
Borrow ing costs 65 80 80 - -
Total cash used 49,144 69,886 44,296 44,487 45,462
Net cash from (used by)
operating activities 417 (699) 32 100 -
INVESTING ACTIVITIES
Cash used
Purchase of property, plant
and equipment 1,614 3,574 1,677 1,287 1,280
Total cash used 1,614 3,574 1,677 1,287 1,280
Net cash from (used by)
investing activities (1,614) (3,574) (1,677) (1,287) (1,280)
FINANCING ACTIVITIES
Cash received
Contributed equity 1,922 4,861 1,759 1,286 (345)
Total cash received 1,922 4,861 1,759 1,286 (345)
Cash used
Repayments of borrow ings (546) (585) (162) (76) -
Total cash used (546) (585) (162) (76) -
Net cash from (used by)
financing activities 1,376 4,276 1,597 1,210 (345)
Net increase (decrease)
in cash held 179 3 (48) 23 (1,625)
Cash and cash equivalents at the
beginning of the reporting period 125 304 307 259 282
Cash and cash equivalents at the
end of the reporting period 304 307 259 282 (1,343) This statement has been prepared on an Australian Accounting Standards basis.
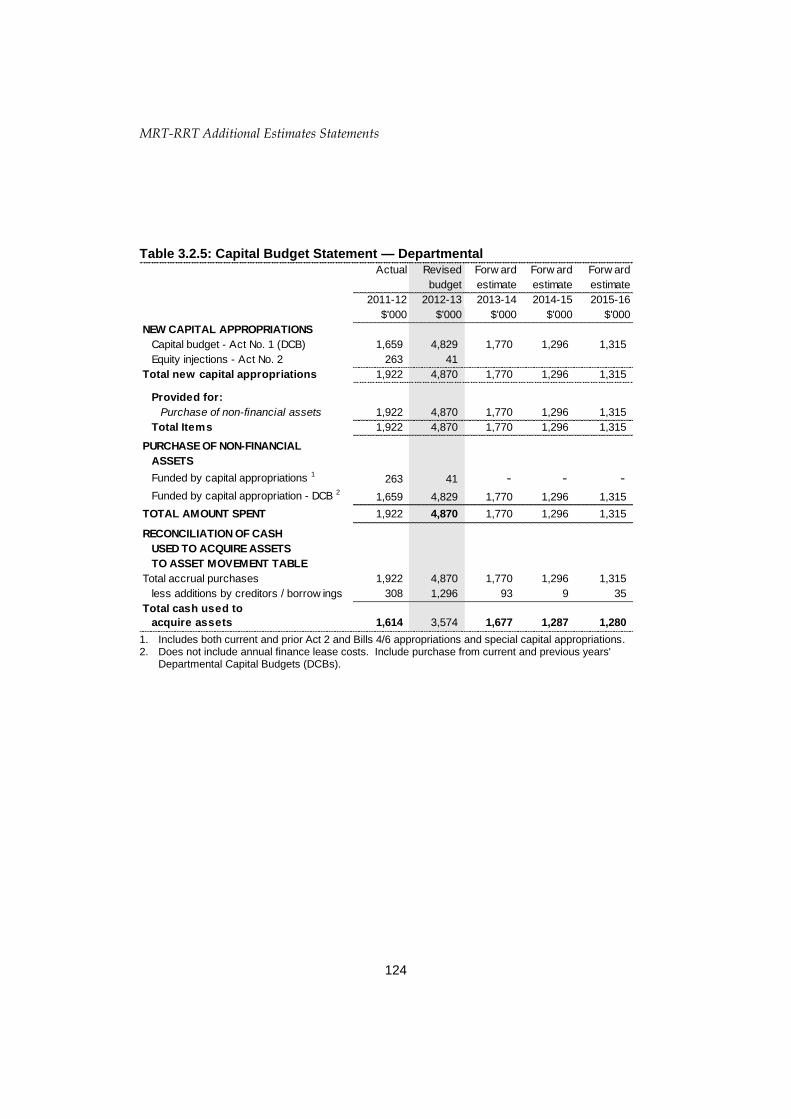
MRT-RRT Additional Estimates Statements
124
Table 3.2.5: Capital Budget Statement — Departmental
Actual Revised Forw ard Forw ard Forw ard
budget estimate estimate estimate
2011-12 2012-13 2013-14 2014-15 2015-16
$'000 $'000 $'000 $'000 $'000
NEW CAPITAL APPROPRIATIONS
Capital budget - Act No. 1 (DCB) 1,659 4,829 1,770 1,296 1,315
Equity injections - Act No. 2 263 41
Total new capital appropriations 1,922 4,870 1,770 1,296 1,315
Provided for:
Purchase of non-financial assets 1,922 4,870 1,770 1,296 1,315
Total Items 1,922 4,870 1,770 1,296 1,315
PURCHASE OF NON-FINANCIAL
ASSETS
Funded by capital appropriations 1263 41 - - -
Funded by capital appropriation - DCB 21,659 4,829 1,770 1,296 1,315
TOTAL AMOUNT SPENT 1,922 4,870 1,770 1,296 1,315
RECONCILIATION OF CASH
USED TO ACQUIRE ASSETS
TO ASSET MOVEMENT TABLE
Total accrual purchases 1,922 4,870 1,770 1,296 1,315
less additions by creditors / borrow ings 308 1,296 93 9 35
Total cash used to
acquire assets 1,614 3,574 1,677 1,287 1,280
1. Includes both current and prior Act 2 and Bills 4/6 appropriations and special capital appropriations. 2. Does not include annual finance lease costs. Include purchase from current and previous years'
Departmental Capital Budgets (DCBs).
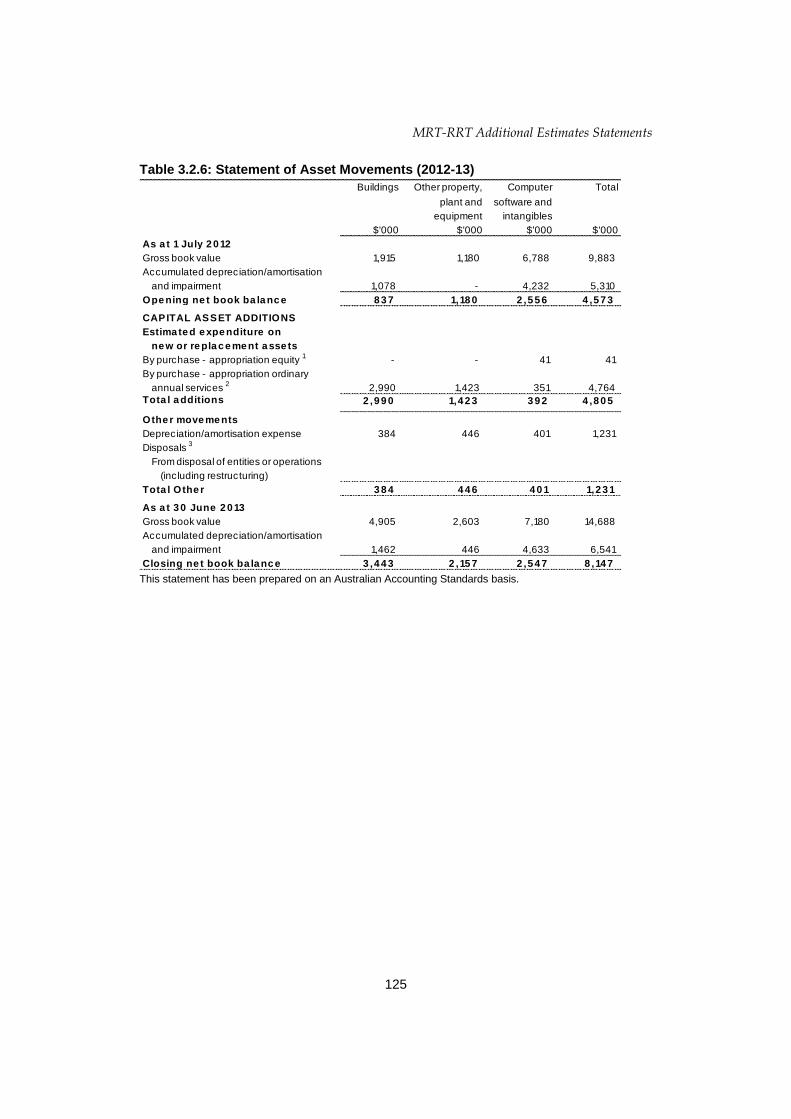
MRT-RRT Additional Estimates Statements
125
Table 3.2.6: Statement of Asset Movements (2012-13)
Buildings Other property, Computer Total
plant and software and
equipment intangibles
$'000 $'000 $'000 $'000
As a t 1 July 2 0 12
Gross book value 1,915 1,180 6,788 9,883
Accumulated depreciation/amortisation
and impairment 1,078 - 4,232 5,310
Ope ning ne t book ba la nc e 8 3 7 1,18 0 2 ,5 5 6 4 ,5 7 3
CAPITAL ASSET ADDITIONS
Estima te d e xpe nditure on
ne w or re pla c e me nt a sse ts
By purchase - appropriation equity 1
- - 41 41
By purchase - appropriation ordinary
annual services 2
2,990 1,423 351 4,764
Tota l a dditions 2 ,9 9 0 1,4 2 3 3 9 2 4 ,8 0 5
Othe r move me nts
Depreciation/amortisation expense 384 446 401 1,231
Disposals 3
From disposal of entities or operations
(including restructuring)
Tota l Othe r 3 8 4 4 4 6 4 0 1 1,2 3 1
As a t 3 0 June 2 0 13
Gross book value 4,905 2,603 7,180 14,688
Accumulated depreciation/amortisation
and impairment 1,462 446 4,633 6,541
Closing ne t book ba la nc e 3 ,4 4 3 2 ,15 7 2 ,5 4 7 8 ,14 7
This statement has been prepared on an Australian Accounting Standards basis.

MRT-RRT Additional Estimates Statements
126
Schedule of administered activity
Applications are expected to increase and this has been reflected in the accounts as an
increase in revenues.
Table 3.2.7: Schedule of budgeted income and expenses administered on behalf of government (for the period ended 30 June)
Estimated Budget Forw ard Forw ard Forw ard
actual estimate estimate estimate estimate
2011-12 2012-13 2013-14 2014-15 2015-16
$'000 $'000 $'000 $'000 $'000
INCOME ADMINISTERED ON
BEHALF OF GOVERNMENT
Revenue
Non-taxation revenue
Fees 23,504 27,788 28,431 26,431 26,431
Total non-taxation revenue 23,504 27,788 28,431 26,431 26,431
Total income administered
on behalf of Government 23,504 27,788 28,431 26,431 26,431
EXPENSES ADMINISTERED ON
BEHALF OF GOVERNMENT
Bad Debts - RRT Post Decision Fees 1,751 2,600 2,600 2,600 2,600
Refunds - MRT Application Fees 4,481 5,700 5,700 5,700 5,700
Total expenses administered
on behalf of Government 6,232 8,300 8,300 8,300 8,300 This statement has been prepared on an Australian Accounting Standards basis.

MRT-RRT Additional Estimates Statements
127
Table3.2.8: Schedule of budgeted assets and liabilities administered on behalf of government (as at 30 June)
Estimated Budget Forw ard Forw ard Forw ard
actual estimate estimate estimate estimate
2011-12 2012-13 2013-14 2014-15 2015-16
$'000 $'000 $'000 $'000 $'000
ASSETS ADMINISTERED ON
BEHALF OF GOVERNMENT
Financial assets
Cash and cash equivalents 71 71 71 71 71
Receivables 1,782 1,782 1,782 1,782 1,782
Total financial assets 1,853 1,853 1,853 1,853 1,853
Total assets administered
on behalf of Government 1,853 1,853 1,853 1,853 1,853
LIABILITIES ADMINISTERED ON
BEHALF OF GOVERNMENT
Total liabilities administered
on behalf of Government - - - - - This statement has been prepared on an Australian Accounting Standards basis.

MRT-RRT Additional Estimates Statements
128
Table 3.2.9: Schedule of budgeted administered cash flows (for the period ended 30 June)
Estimated Budget Forw ard Forw ard Forw ard
actual estimate estimate estimate estimate
2011-12 2012-13 2013-14 2014-15 2015-16
$'000 $'000 $'000 $'000 $'000
OPERATING ACTIVITIES
Cash received
Rendering of services 21,276 25,188 25,831 23,831 23,831
Total cash received 21,276 25,188 25,831 23,831 23,831
Cash used
Refunds 4,481 5,700 5,700 5,700 5,700
Total cash used 4,481 5,700 5,700 5,700 5,700
Net cash from (used by)
operating activities 16,795 19,488 20,131 18,131 18,131
Net increase (decrease) in
cash held
Cash and cash equivalents at
beginning of reporting period 71 71 71 71 71
Cash from Official Public Account for:
- Transfers from other entities
(Finance - Whole of Government) 4,481 5,700 5,700 5,700 5,700
Sub-total 4,552 5,771 5,771 5,771 5,771
Cash to Official Public Account for:
- Transfers to other entities
(Finance - Whole of Government) 21,276 25,188 25,831 23,831 23,831
Sub-total 21,276 25,188 25,831 23,831 23,831
Net (decrease) in cash held (16,724) (19,417) (20,060) (18,060) (18,060)
Cash and cash equivalents at end
of reporting period 71 71 71 71 71
This statement has been prepared on an Australian Accounting Standards basis.

Portfolio Glossary
129
PORTFOLIO GLOSSARY
Term Meaning
Administered
items
Expenses, revenues, assets or liabilities managed by agencies on
behalf of the Commonwealth. Agencies do not control
administered items. Administered expenses include grants,
subsidies and benefits. In many case, administered expenses
fund the delivery of third party agencies.
Additional
estimates
Where amounts appropriated at Budget time are insufficient,
Parliament may appropriate more funds to portfolios through
the Additional Estimates Acts.
Appropriation An authorisation by Parliament to spend monies from the
Consolidated Revenue Fund, for a particular purpose.
Annual
appropriation
Two appropriation Bills are introduced into Parliament in May
and comprise the Budget for the financial year beginning 1 July.
Further Bills are introduced later in the financial year as part of
the Additional Estimates. Parliamentary Departments have
their own appropriations.
Consolidated
Revenue Fund
Section 81 of the Constitution stipulates that all revenue raised
or money received by the Commonwealth forms the one
Consolidated Revenue Fund (CRF). The CRF is not a bank
account. The Official Public Accounts reflects most of the
operations of the CRF.
Departmental
items
Assets, liabilities, revenues and expenses that are controlled by
the agency in providing program outputs. Departmental items
would generally include computers, plant and equipment assets
used by agencies in providing goods and services and most
employee expenses, supplier costs and other administrative
expenses incurred.
Depreciation Apportionment of an asset’s capital value as an expense over its
estimated useful life to take account of normal usage,
obsolescence, or the passage of time.
Equity or net
assets
Residual interest in the assets of an entity after deduction of its
liabilities.

Portfolio Glossary
130
Expense Total value of all of the resources consumed in producing goods
and services or the loss of future economic benefits in the form
of reductions in assets or increases in liabilities of an entity.
FMA Act Financial Management and Accountability Act 1997.
Migration Act Migration Act 1958.
Outcomes The Government’s objectives in each portfolio area. Outcomes
are desired results, impacts or consequences for the Australian
community as influenced by the action of the Australian
Government. Actual outcomes are assessments of the end-
results or impacts actually achieved.
Prescribed
agency
As per section 5 of the FMA Act, a prescribed agency means: a
body, organisation or group of persons prescribed by the
Regulations for the purposes of this definition. Prescribed
agencies are made by the Governor-General by Regulation
under the FMA Act. Prescribed legal authority and
responsibility to manage their financial affairs.
Programs A logical aggregation of agency outcomes based on
homogeneity, type of product, business line or beneficiary target
group. Aggregation of programs may also be needed for the
provision of adequate information for performance monitoring,
or based on a materiality test.
Quality One of the three key efficiency indicators. Relates to the
characteristics by which customers or stakeholders judge an
organisation, product or service. Assessment of quality involves
use of information gathered from interested parties to identify
differences between user’s expectations and experiences.
Quantity One of the three key efficiency indicators. Examples include:
size of an output; count or volume measures; how many or how
much.
Revenue Total value of resources earned or received to cover production
of goods and services.
Section 31
(FMA) revenue
Section 31 of the Financial Management and Accountability Act
1997, which identifies revenue items where cash will be received
that the Department is permitted to spend.
Portfolio Glossary
131
Service centre Service Centres are multi-channelled contact centres, aimed at
providing low to medium risk general information to the public.
Special account Balances existing within the CRF that are supported by standing
appropriations (FMA Act section 20 and 21). Special Accounts
allow money in the CRF to be acknowledged as set-aside
(hypothecated) for a particular purpose. Amounts credited to a
Special Account may only be spent for the purposes of the
Special Account. Special Accounts can only be established by a
written determination of the Finance Minister (section 20 FMA
Act) or through an Act of Parliament (referred to in section 21 of
the FMA Act).
Acronyms
132
ACRONYMS
Acronym Description
AMEP Adult Migrant English Program
CRF Consolidated Revenue Fund
DCB Departmental Capital Budget
DIAC Department of Immigration and Citizenship
ETA Electronic Travel Authority
FECCA Federation of Ethnic Communities’ Councils of Australia
FMA Act Financial Management and Accountability Act 1997
GST Goods and Services Tax
HSS Humanitarian Settlement Services
ICT Information and Communication Technology
IDC Immigration Detention Centre
IGC Inter-Governmental Consultations on migration, asylum and
refugees
IMA Irregular Maritime Arrival
IOM International Organization for Migration
KPI Key Performance Indicator
MARA Migration Agents Registration Authority
Migration Act Migration Act 1958
MP Member of Parliament
MRT Migration Review Tribunal
Acronyms
133
NAATI National Accreditation Authority for Translators and
Interpreters Ltd
RCOA Refugee Council of Australia
RRT Refugee Review Tribunal
SGP Settlement Grants Program
TIS Translating and Interpreting Service
UHM Unaccompanied Humanitarian Minor
UNHCR United Nations High Commissioner for Refugees
VEVO Visa Entitlement Verification Online.