Ngqura Container Terminal named the fastest growing container terminal in the world

PORT OF NGQURA
MARINE BIOMONITORING
PROGRAMME Annual Report 2002-2003
Prepared for
September 2003
IECM Report C86
Institute for Environmental & Coastal Management Environmental Consulting and Research

This report should be cited as: Klages, NTW & Bornman, TG 2003. Port of Ngqura Marine Biomonitoring Programme. Annual Report 2002 – 2003. Institute for Environmental & Coastal Management C86: 65 pp.

PORT OF NGQURA
MARINE BIOMONITORING
PROGRAMME Annual Report 2002-2003
Contributors Dr TG Bornman (editor), Dr EE Campbell, A Cloete, Dr E Hosten, Dr NTW Klages
(editor), Dr B Newman, Dr DR du Preez, Dr D Schoeman, Dr EH Schumann.
Student assistence K Bezuidenhoudt, B Clark, M Difford, S Du Preez, M. Ralph, P-P Steyn.
UNIVERSITY OF PORT ELIZABETH, P. O. BOX 1600, PORT ELIZABETH, 6000, SOUTH AFRICA TEL: 041 – 5042877 FAX: 041 – 5832317 EMAIL: [email protected]
Institute for Environmental & Coastal Management Environmental Consulting and Research

PORT OF NGQURA MARINE BIOMONITORING PROGRAMME - 4 -
TABLE OF CONTENTS
Chapter contents Page
Executive summary 5
1. Introduction 7
2. Physical environment 13
3. Surface water nutrient status 20
4. Phytoplankton composition and biomass
25
5. Zooplankton composition and biomass
33
6. Subtidal macrobenthos 36
7. Island intertidal communities 42
8. Status of the African Penguin 50
9. Metals and organic pollutants 53
10. Surface water bacteriological pathogens
60
11. References 62

PORT OF NGQURA MARINE BIOMONITORING PROGRAMME - 5 -
EXECUTIVE SUMMARY The seawater quality and biological monitoring programme was designed to provide a long-term assessment of marine environmental health near the Ngqura Port presently under construction in Algoa Bay, South Africa. The need for the monitoring programme arose from conditions imposed on the developer, the National Ports Authority (NPA), in the Environmental Impact Assessment process. The programme follows on from pre-construction, baseline marine monitoring conducted in 2000 and 2001 in the area by the Institute for Environmental & Coastal Management (IECM). The state of the environment is described in the 10 chapters of this report. Chapter 1 (Introduction) revisits the objectives, scope and deliverables of the marine monitoring programme. It then describes the sampling regime, what kinds of measurements were made and what methods were used to analyse the collected data. In brief, the objectives of the monitoring programme are to:
• Provide a qualitative and quantitative assessment of ambient water quality and environmental health through the use of indicator algae and animal species in the sea,
• Determine statistically significant changes or trends in the key characteristics of water quality and selected biota,
• Provide data to assess the long-term ecologically sustainable development of the Ngqura Port.
The scope of work comprises sampling, analysis and reporting of water and sediment, and representative faunal and floral populations from the sea off the Ngqura Port construction site. The data presented in this report were collected during two sampling sessions, in summer 2002/03 and in the winter of 2003, and therefore they allow for the determination of seasonal variability. Information and biological material was collected in the water column, from the seabed, from the rocky shores of Bird, Jahleel and St Croix Islands in Algoa Bay and also from mainland beaches near the port construction site. Chapter 2 (The Physical Environment) compares the standard oceanographic parameters of temperature, salinity, pH and dissolved oxygen content measured at a grid of 18 stations off the construction site with historical information on the general physical oceanography of Algoa Bay. The chapter concludes that both summer and winter oceanographic conditions measured in November and June, respectively, were within the range of natural variability. Chapter 3 (Surface Water Nutrient Status) describes the pattern of nutrient concentrations of the sampling area in order to delineate natural variation in concentrations of nutrients. Following construction of the port, deviations from this natural variation could be considered to be a result of port associated activities. Chapter 4 (Phytoplankton Biomass and Species Composition) describes phytoplankton abundance and diversity in the study area and checks whether deviations from this pattern have occurred since harbour construction commenced. The analyses concluded that construction-based disturbances of the phytoplankton community were not found. The summer samples showed an increase in the diversity of diatom species associated with the harbour but the differences were not persistent nor did they replace the naturally dominant species. Chapter 5 (Zooplankton Composition and Biomass) gives novel data on the animal plankton community. The findings seem to contradict current perceptions of seasonal variability in zooplankton abundance by being higher in winter than in summer.

PORT OF NGQURA MARINE BIOMONITORING PROGRAMME - 6 -
However, with the scarcity of comparable data in the scientific literature it is not possible to decide whether the contemporary hypothesis ought to be revoked. Chapter 6 (Subtidal Macrobenthos) employs advanced mathematical tests to measure the changes in species abundance and biomass of benthic invertebrates (e.g. molluscs, polychaetes, crustaceans) to pollution events from port construction. The results show that the subtidal macrobenthos is presently healthy. Chapter 7 (Island Intertidal Communities) reports on the state of macroalgae (seaweeds) and the invertebrate fauna of the rocky shores of the islands. Although major differences between the pre-construction samples and those measured after construction commenced were found, these cannot be unequivocally attributed to harbour construction activity. Chapter 8 (Status of the African Penguin) presents direct counts of active nests of African Penguin on their breeding islands in Algoa Bay. The census data show that there was widespread breeding failure in summer 2002/03 which is attributed to the exceptionally hot weather conditions experienced at the time as a result of the 2002/03 El Niño. It is unproven whether the mere presence of a weather mast on Jahleel Island has aggravated the halving of the breeding population on that island. Chapter 9 (Metals and Organic Pollutants) provides data on metal and organic pollutant concentrations recorded in biological tissue and surficial sediment from the sampling area, and evaluates these against pertinent national and international regulatory standards and guidelines. Concentrations of 11 trace metals (aluminium, arsenic, cadmium, chrome(6), copper, iron, lead, manganese, mercury, tin, zinc) determined in sediments off the construction site fell well within permissible ranges. However, metal concentration measured in the tissues of Brown Mussels (Perna perna) collected on the shore at Hougham Park, on St Croix, Jahleel and on Bird Island frequently exceeded safety standards and may not be fit for human consumption. Implementation of a non-collection policy for the port area is advisable. These observed high levels in mussel tissue are unlikely to originate from construction activity, rather they are interpreted as a result of past marine pollution events. Total hydrocarbon, polyaromatic hydrocarbons, total organic carbon, oil & grease loading in seawater analysed in water samples taken off the construction site indicate that an unidentified oil spill may have occurred just prior to sampling in November 2002. By June 2003, these effects had dissipated entirely. Chapter 10 (Surface Water Bacteriological Pathogens) reports on the presence of faecal bacteria as indicators of sewage contamination of seawater off the construction site. Coliform bacteria as well as enterococci were reassuringly absent in seawater over the whole grid of stations on both sampling occasions, underpinning the notion that the risk of contracting gastroenteritis from full contact with seawater in the study area was small.
PORT OF NGQURA MARINE BIOMONITORING PROGRAMME - 7 -
Biomonitoring is the use of biological responses to assess changes in the environment, generally changes due to anthropogenic causes, and is a valuable assessment tool that is receiving increased use throughout the world.
INTRODUCTION The reason for this programme This document presents the first annual report of the seawater quality and biological monitoring programme designed to provide a long-term assessment of marine environmental health near the Ngqura Port presently under construction in Algoa Bay, South Africa. The programme follows on from baseline marine monitoring conducted in 2000 and 2001 in the area by the Institute for Environmental & Coastal Management (IECM). The need for the monitoring programme arose from conditions imposed on the developer, the National Ports Authority (NPA), in the Environmental Impact Assessment process. Monitoring of the effects of port construction and operation on the environment is an explicit condition in the Record of Decision issued by the South African government’s Department of Environmental Affairs & Tourism when port development was approved (Condition # 2.29 of the Port Record of Decision dated 21 November 2001).
Objectives, scope and deliverables
Objectives Ports are well recognised as having numerous impacts on the marine environment. These include pollution due to various port-associated activities, the dissemination of sediment contaminants with dredge spoil, and the introduction of alien (invasive) organisms through ballast water release and hull fouling. Consequently, the status of the natural environment, both physical and biological, near ports is regularly monitored in many regions throughout the world, primarily in order to detect signs of pollution and consequent ecological impacts, and in this manner identify and implement appropriate mitigatory actions. The objectives of the monitoring programme are to:
• Provide a qualitative and quantitative assessment of ambient water quality and environmental health through the use of indicator algae and animal species in the sea,
• Determine statistically significant changes or trends in the key characteristics of water quality and selected biota,
• Provide data to assess the long-term ecologically sustainable development of the Ngqura Port.
Scope of work Sampling, analysis and reporting of water and sediment, and representative faunal and floral populations from marine and near-shore environments within and in the vicinity of Coega Development Zone. The scope of the appointment includes quality assurance protocol and audits against these protocols and such further services as set out below.

PORT OF NGQURA MARINE BIOMONITORING PROGRAMME - 8 -
On behalf of the NPA, the Service Provider will: a.) Conduct coastal marine sampling. b.) Manage the process of sample analysis to ensure accurate, reliable and legally
defensible data on which to base reporting information. c.) Manage all sub-contractors involved in sample collection and analyses
referenced above. d.) Develop and adhere to quality assurance procedures governing the sample
collection of water sediment and floral and faunal specimens, as well as sample handling and storage, operation and maintenance of any sampling equipment, data management and reporting of results.
e.) Alert the NPA promptly of any environmental problems that may be identified during the programme, and liase with the NPA in resolution of such problems.
f.) Summarize all findings in a comprehensive annual report, including the referencing of results against standards and guidelines where available.
g.) Archive full records of all data collected during the biomonitoring programme.
Deliverables • Provide a qualitative and quantitative assessment of ambient water quality and
environmental health through the use of indicator algae and animal species in the sea.
• Determine statistically significant changes or trends in the key characteristics of water quality and selected biota.
• Provide data to assess the long-term ecologically sustainable development of the Port of Ngqura.
• Collate the collected information in an annual report.
Sampling regime, measurements and analyses
Biomonitoring Biomonitoring uses the biological responses of indicator species or indicator communities to assess changes in the environment, generally changes due to anthropogenic causes. Such biological responses manifest themselves in presence or absence of an indicator species. Absence of multiple species of different orders with similar tolerance levels that were present previously at the same site is more indicative of pollution than absence of a single species, as there may be reasons other than pollution that result in its absence (e.g. predation, competition, or geographic barriers which prevented it from ever being at the site). Variations in the abundance and density of an indicator community also reflect prevailing environmental conditions. However, ecological processes underlying community structure are complex, and primarily involve slow processes, rare events, and high annual variability. To detect such phenomena, long-term data sets are often required. A wide range of baseline data on the marine environment near the Ngqura Port construction site, both of a physico-chemical and of a biotic nature have been collected and were reported on, during 2000 and 2001 by the IECM (Newman 2001).

PORT OF NGQURA MARINE BIOMONITORING PROGRAMME - 9 -
Coega River
St. Croix
Brenton
Jahleel
Port of Port Elizabeth
Swartkops Estuary
Abalone Farm
Ngqura Port Development
These baseline data will serve as benchmarks against which the results obtained during the 2002/03 marine biomonitoring campaign and future environmental changes can be assessed.
Sampling regime The data presented in this report were collected during two sampling sessions, in summer 2002/03 and in the winter of 2003, and therefore allow for the determination of seasonal variability. Information and biological material was collected in the water column, from the seabed, from the rocky shores of Bird, Jahleel and St Croix Islands in Algoa Bay and also from mainland beaches in or near the port construction site. Figure 1.1. Map of the study area
Stn Position Depth
A1 33046.450'S, 025044.700'E 12
A2 33046.945'S, 025045.218'E 18
A3 33047.864'S, 025046.00'E 18
A7 33048.700'S, 025046.850'E 28
B1 33048.000'S, 025041.900'E 10
B2 33048.202'S, 025042.215'E 10
B3 33048.315'S, 025042.386'E 12
B4 33048.427'S, 025042.285'E 17
B5 33048.300'S, 025042.230'E 12
B6 33048.800'S, 025042.550'E 19
B7 33049.250'S, 025043.200'E 21
C1 33049.850'S, 025039.900'E 11
C2 33050.300'S, 025040.410'E 16
C4 33051.450'S, 025041.600'E 20
D1 33046.100'S, 025046.100'E 16
D2 33046.900'S, 025046.100'E 20
O 33053.974'S, 025040.581'E 20
X 33048.760'S, 025041.000'E 13
PORT OF NGQURA MARINE BIOMONITORING PROGRAMME - 10 -
Boat-based sampling Sixteen marine sampling stations, arranged in four lines (A, B, C and D) plus two more stations (X and O) were used. This grid of stations was basically the same as used during the baseline monitoring except for the addition of three stations north of St Croix (line D). A control site (O), located away from the immediate influence of the construction activities on the 30 m depth contour off Deal Party was also sampled (Figure 1.1). The geographical positions and water depths of the stations are given in the table inserted in Figure 1.1. At each station, various physico-chemical parameters were measured and biological samples were collected as described below. Land-based sampling Samples were also collected from the hard substratum in the intertidal below the Marine Growers abalone farm at Hougham Park, as well as from numerous locations stations in the intertidal of St Croix, Jahleel and Bird Islands. The latter island, more than 40 km east of Coega River Mouth, served as a control site. It was not possible to conduct work on Brenton Island, since there was no safe access for fieldworkers and equipment even during relatively calm weather.
Measurements made and samples collected Physical oceanography Parameters: Water depth, salinity, temperature, dissolved oxygen, pH. This information was complemented with satellite thermal infrared images of the study area. Method: Vertical profile measurements of the water column were made with a SeaBird Electronics SeaCat SBE 19-03 profiler. This group of parameters was collected in November 2002 and in June 2003. Motivation: Chiefly, this data is needed for the interpretation and analysis of other measured parameters. Additionally, low salinity indicates freshwater input during storm events, whereas high salinity may indicate intrusion from nearby saltpans. Low oxygen levels may occur after the discharge into the sea of organic material promoting bacterial growth. Such conditions are expected to have an attendant shift in pH. Nutrients and photosynthetic pigments Parameters: total Kjeldahl nitrogen (TKN), ammonia, nitrate, reactive phosphate, chlorophyll a. Method: Water samples were collected from 1 m and from 10 m depth using a pop-bottle in November 2002 and in June 2003. TKN and ammonia was analysed by ChemQuest Industrial Services, PE Technicon, using a multianalyser. The other analyses were done by the Department of Botany, University of Port Elizabeth. Nitrate was determined using the cadmium reduction method after Parsons et al. (1984). Phosphorus was determined using the acidified molybdate method after Grasshoff et al. (1983). Chlorophyll a was determined using the ethanol extraction, with acidification method after Nunsch (1980). Motivation: The major sources of nitrogen and phosphorus into the Ngqura Port area are from sewage, stormwater containing soil, industrial discharges and rainfall. Nutrients in excess (eutrophication) can lead to excessive algal growth. This in turn can lead to depletion of oxygen and cause fish deaths and other negative effects on marine life.
PORT OF NGQURA MARINE BIOMONITORING PROGRAMME - 11 -
Phytoplankton Parameters: Species composition and abundance of diatoms and dinoflagellates. Method: Tows of phytoplankton nets (90 micron) at each station of the sampling grid in November 2002 and in June 2003. Phytoplankton was identified and enumerated under a Zeiss Axioplan microscope equipped with a JVC KY-F30 camera system using AnalySiS imaging software. Motivation: Because of the low (10%) cumulative variance of species recorded during baseline marine biomonitoring, it will be possible to detect deviations from this composition due to disturbance from industrial developments or ballast water discharges. Zooplankton Parameters: Faunal composition by major taxonomic groups and meso-zooplankton biomass. Method: Tows of plankton nets (WP2, 300 micron) equipped with a flow meter at each station of the sampling grid in November 2002 and in June 2003. Zooplankton was sorted into major taxonomic groups, identified and the biomass was determined by means of the displacement method. Motivation: The zooplankton of Algoa Bay is poorly documented in the scientific literature and no samples were taken and analysed during the baseline marine biomonitoring. This gap in the information has now been filled. Subtidal macrobenthos Parameters: Faunal composition by major taxonomic groups. Method: Six Van Veen grab samples from the seafloor per station at each of the stations to assess natural environmental variability. This parameter was sampled in November 2002. Motivation: Benthic invertebrates (e.g. molluscs, polychaetes, crustaceans) respond with changes in species abundance and biomass to pollution from port construction and port operation in characteristic ways. Island intertidal communities Macroalgae Parameters: Biomass and species composition of macroalgae on rocky substrate. Method: By means of photo analysis, employing a continuous transect method across the full extent of the intertidal. Transects were worked, in February 2003, on Jahleel, St Croix and Bird Islands. The latter locality served as the control site for this parameter. Motivation: Marine macroalgae (seaweeds) consist of few cell layers that readily absorb pollutants dissolved in seawater. As some species are more tolerant to pollution than others are, change of community structure serves as a useful indicator of long-term environmental degradation. Macrofauna Parameters: Biomass and species composition of rocky shore macrofauna. Method: By means of photo analysis, employing a continuous transect method across the full extent of the intertidal. Transects were worked, in February 2003, on Jahleel, St Croix and Bird Islands. The latter locality served as the control site for this parameter.

PORT OF NGQURA MARINE BIOMONITORING PROGRAMME - 12 -
Penguin census Parameter: Numbers breeding African Penguin. Method: Direct counts of active nests of African Penguin on their breeding islands in Algoa Bay. This activity was conducted in cooperation with Marine & Coastal Management (administrators of the Sea Birds and Seals Protection Act, 1973), and who have borne the costs of the census in terms of a contract between M&CM and IECM. The presented data are cited with kind permission of Dr RJM Crawford, Marine & Coastal Management, Cape Town. Motivation: Penguins are near the apex of the foodweb in Algoa Bay. Port activity, both during the construction and during the operational phases, may potentially depress breeding success of this non-flying seabird species, which is classified as threatened and is known to respond predictably to environmental changes on their breeding sites, especially since long-term record of breeding performance exist. Metals and organic pollutants Parameters: Concentrations of 11 metals (aluminium, arsenic, cadmium, chrome(6), copper, iron, lead, manganese, mercury, tin, zinc) in sediment was sampled taken at each station of the sampling grid. Metal concentration were also determined in the fatty tissues of mussels (Perna perna) collected on the shore at Hougham Park, on St Croix, Jahleel and on Bird Island in February 2003. Total hydrocarbon, polyaromatic hydrocarbons, total organic carbon, oil & grease loading in seawater was analysed in water samples taken at 1 m depth at each station of the sampling grid in November 2002 and in June 2003. Methods: Metal analyses were performed by the Department of Chemistry, University Port Elizabeth, with a Perkin-Elmer Sciex Elan 6100 ICP-MS equipped with a FIAS 400 flow injection accessory and AS 90 autosampler. The instrumentation was controlled with the Perkin-Elmer Sciex Elan 2.3.2 software. A Perkin-Elmer Anton Paar Multiwave microwave sample preparation system was used for the sample digestion prior to analysis. Organic pollutants were determined by ChemQuest Industrial Services, PE Technicon, and by the Scientific Services Division of the Nelson Mandela Metropolitan Municipality, using various SABS certified methods for seawater. Motivation: Metals tend to accumulate readily in sediments and fatty tissue of molluscs. Although some are essential biological elements, such as iron, all have the potential to be toxic to organisms above certain concentrations. Heavy metal contamination off the Coega Port can be directly linked to industrial sources and urban runoff. The major sources of hydrocarbons are combustion engines (ships, vehicles) operating in the area as well as chronic oil pollution from a variety of sources. Harmful effects of hydrocarbons are both of a physical (e.g. smothering of benthic organisms) and of a physiological nature (as cellular poison). Surface water bacteriological pathogens (marine microbiology) Parameters: Faecal coliform bacteria, E. coli type 1, enterococci, standard agar plate count. Method: The parameters were measured by the National Health Laboratory Service using standard microbiological lab methods. Motivation: The presence of these microorganisms in water is important primarily from a human health perspective, as they are indicators of sewage contamination.

PORT OF NGQURA MARINE BIOMONITORING PROGRAMME - 13 -
Algoa Bay
Land
Indian Ocean
THE PHYSICAL ENVIRONMENT Introduction Algoa Bay is the largest of a series of eastward-facing bays along the south coast of South Africa. Cape Recife, consisting of resistant rocks of the Cape Supergroup, forms a headland in the southwest. The dominant waves in the Southern Ocean are from the southwest, and as a consequence, Algoa Bay has formed as a half-heart bay to the north and east of Cape Recife, with Port Elizabeth established in the protected southwest corner. The Bird Island group of islands demarcates the eastern boundary of Algoa Bay, with Jahleel, St Croix and Brenton islands situated in the shallower central area. The mouth of the bay is some 60 to 70 km wide, with a depth generally less than 70 m. The composition of the sediment of Algoa Bay is dominated by quartzose terrigenous detritus (60 %) and calcium carbonate (30 %). Coarse-grained sediments, gravel to medium-grained sand, tend to be concentrated in deep water. Fine-grained sand (0.125-0.250 mm) is fractionated at river mouths into a coarse half, which is dispersed right around the bay in shallow water, and a fine half that settles from suspension, together with very fine sand and mud, in the central, deeper parts of the bay (Bremner 1991).
Physical oceanography of Algoa Bay Physical oceanographic conditions come under the influence of a number of different external processes. The Agulhas Current, flowing southwestward with its core generally offshore of the continental shelf edge, forms the major open ocean influence (Schumann 1998). Speeds in excess of 2 m·s-1 are common, and the structure extends well below 2000 m depth. The continental shelf width increases with distance southwestwards and concurrently the Agulhas Current also moves farther offshore: it brings warm subtropical surface waters and deeper central water into the region, moderating the climate. Figure 2.1 shows the Agulhas Current off Algoa Bay in a typical position. However, it is also common for meanders to occur in the flow, and two or three times a year very large pulses can be observed to progress with the flow at speeds around 0.2 m·s-1 (Lutjeharms & Roberts 1988). Occasionally these inshore boundary eddies will cause warm Agulhas water to enter Algoa Bay as a surface layer a few tens of metres deep (Goschen & Schumann 1994). As part of the dynamics of the Agulhas Current, the isotherms on the inner boundary curve sharply upward, see e.g. Goschen & Schumann (1988, 1994). Ekman veering in the bottom boundary layer further serves to bring colder, deeper water onto the continental shelf (Schumann 1987). These colder waters are often upwelled along the south-east coast of South Africa, the process being accentuated by northeasterly winds; they can also penetrate westward past Bird Island and into Algoa Bay. Winds across Algoa Bay are predominantly from the west-southwest, but with a strong seasonal dependence (Schumann & Martin 1991). Thus, the percentage of northeasterly winds increases in summer, while overall, the period April to July is the calmest, and
Figure 2.1. RSMAS satellite image showing sea-surface temperatures off Algoa Bay. The image has been false-colour enhanced, with the colour code of the temperatures shown on the right margin.

PORT OF NGQURA MARINE BIOMONITORING PROGRAMME - 14 -
strongest winds occur in October to December. Marked variability has been observed across Algoa Bay, with land and sea breezes important farther west (Schumann et al. 1991); generally, the duration of winds from any quarter does not last longer than 2 or 3 days. Stronger insolation during summer, coupled with weaker winds, means that intense thermoclines can be established within Algoa Bay and along the wider continental shelf farther west. The easterly winds then also cause upwelling at Cape Recife, and subsequent westerly winds serve to bring this colder water into Algoa Bay, though the extent of the penetration is not known (Goschen & Schumann 1995). Schumann et al. (2003) have described conditions in the sector around and immediately north of the Port Elizabeth harbour. With little input of fresh water, salinity does not vary appreciably from Central Water values around 35.3 ppt, while in summer intense thermoclines occur: the extent of their penetration towards the coast depends on conditions at the time. Currents close to the coast are sluggish, with tidal and inertial currents evident. Towards the central regions of Algoa Bay, the deeper flow is generally southwestwards, with surface waters coming more under the influence of the local winds.
Measurements The instrument used in the measurements was a Sea-Bird Electronics SeaCat 19-03 conductivity, temperature and depth recorder (CTD) with an attached YSI dissolved oxygen/pH (DO/pH) sensor. On each of the 18 stations the SeaCat was lowered over the side of the boat, and held at a depth of about 3 m for two to three minutes to allow the pump to switch on and the DO sensor to polarize. Then it was lowered to the seabed and raised again at a rate of about 1 m · s-1. The SeaCat was set to record sensor values every 0.5 s during this procedure. Processing of the data was done using standard SBE software. One process aligns the sensors (which are set apart on the instrument) to avoid spiking at sharp temperature changes. The final edited data were averaged into 1.0 m bins, using both the down and upcast measurements. Geographical positions and water depth [m] at the 18 sampling stations are shown in Figure 1.1 (Chapter 1, Introduction). Over the years from the end of 1997 to 2002 Onset Hobo temperature recorders were fixed onto a taut-line mooring with a subsurface buoy at a position about 1 km south of Jahleel Island, in a water depth varying around 17 m. The accuracy is given as 0.2 O C with a best resolution of 0.16 O C. The upper recorder was at a depth of about 6 m while the bottom recorder was 2 m above the seabed. The data return is not complete, but the results show the type of temperature variability that can be expected around the islands.
Results and discussion
Temperature variability The results from the temperature recorders are presented first as they demonstrate the type of temperature variability that can be expected in the area. Figure 2.2 shows a section of the total record, namely 70 days from 1 March to 9 May 2000. The effect of the summer thermocline is demonstrated in the rapid temperature variations measured

PORT OF NGQURA MARINE BIOMONITORING PROGRAMME - 15 -
at the lower recorder. Dramatic decreases or increases of 7 or 8 degrees within a few hours are evident as the colder bottom water moved in or out of the position of the recorder. Over this period, the colder water did not reach the upper recorder, although in other years this did happen. Regular variations could be the result of internal waves moving on the thermocline, although the data are not adequate to isolate such phenomena. Temperatures measured during summer varied from over 25 O C to under 11 O C. In all the years - 1998 to 2002 - there appeared to be a sudden onset of isothermal conditions near the end of April. On the other hand, the development of a thermocline appears to be a slower process, taking place in October and November. Temperatures over the water column varied between about 14 O C and 19 O C over the months May to September.
Oceanographic conditions in November 2002 The measurements took place on 11 November 2002. Initial weather conditions were relatively calm but an easterly wind gusting up to 20 to 25 knots sprang up during mid-morning. Vertical temperature profiles made on the lines of stations north of St Croix Island (D), at St Croix Island (A), Jahleel Island (B) and farther southwest (C) for November 2002 are shown in Figure 2.3. The isothermal conditions indicate that the summer thermocline had not yet developed in this inner section of Algoa Bay at the time of the measurements; the slightly cooler inshore waters at section A are probably not significant. On the other hand, surface coastal temperatures (Figure 2.4) were slightly warmer than those farther offshore, which is symptomatic of summer conditions. Measurements at the deepest station (A7) extended to 28 m, and it is apparent that the colder water on the inshore boundary of the Agulhas Current was situated nearer the mouth of Algoa Bay in deeper water.
X
O
D2
D1
C4
C2
C1
B7
B 6
B5B4
B3B 2
B1
A7
A3
A 2
A 1
Sea surface temperatures
November 2002
15.5 - 16
16 - 16.5
16.5 - 17
17 - 17.5
17.5 - 18
18 - 18.5
18.5 - 19
19 - 19.5
Figure 2.2. Hourly temperature measurements made at depths of about 6 m (upper line) and at about 15 m (lower line) at the mooring site southwest of Jahleel Island from March to May 2000.
For several of the physical and biological parameters measured, the data are presented as contour plots (see Figure 2.3 for an example of such a plot). These plots show the actual value measured at each station and they visualise the probable response of the parameter between stations where data were measured by using a mathematical interpolation technique called Kriging.
Figure 2.3. Sea surface temperatures in November 2002.

PORT OF NGQURA MARINE BIOMONITORING PROGRAMME - 16 -
Figure 2.4. Vertical temperature profiles made on the lines of stations north of St Croix Island (D), at St Croix Island (A), Jahleel Island (B) and farther southwest (C) for November 2002. Vertical profiles of salinity for the lines of stations north of St Croix Island (D), at St Croix Island (A), Jahleel Island (B) and farther southwest (C) for November 2002 are shown in Figure 2.5. Salinities varied little with depth or position on any of the lines; this is expected with the lack of any appreciable input of fresh water from the rivers flowing into Algoa Bay.
Figure 2.5. Vertical salinity profiles made on the lines of stations north of St Croix Island (D), at St Croix Island (A), Jahleel Island (B) and farther southwest (C) for November 2002.
17 17.5 18 18.5 19
Line ATemperature ( ºC)
28
26
24
22
20
18
16
14
12
10
8
6
4
2
0
De
pth
(m
)
A7
A3
A2
A1
18 18.5 19 19.5
Line BTemperature (ºC)
22
20
18
16
14
12
10
8
6
4
2
0
Dep
th (
m)
B1B2
B3
B4
B5
B6
B7
18 18.5 19
Line DTemperature ( ºC)
22
20
18
16
14
12
10
8
6
4
2
0
Dep
th (
m)
D1
D2
17.6 18 18.4 18.8 19.2
Line CTemperature (ºC)
20
18
16
14
12
10
8
6
4
2
0
Dept
h (m
)
C1
C4
C2
35 35.25 35.5
Line ASalinity (ppt)
28
26
24
22
20
18
16
14
12
10
8
6
4
2
0
Dep
th (
m)
A7
A3
A2
A1
35 35.25 35.5
Line BSalinity (ppt)
28
26
24
22
20
18
16
14
12
10
8
6
4
2
0
Dep
th (
m)
B7
B6
B5
B4
B3
B2
B1
35 35.25 35.5
Line CSalinity (ppt)
28
26
24
22
20
18
16
14
12
10
8
6
4
2
0
De
pth
(m
)
C4
C2
C1
35 35.25 35.5
Line DSalinity (ppt)
28
26
24
22
20
18
16
14
12
10
8
6
4
2
0
De
pth
(m
)
D2
D1

PORT OF NGQURA MARINE BIOMONITORING PROGRAMME - 17 -
The Dissolved Oxygen measurements indicate that seawater was generally well oxygenated (Figure 2.6).
8 8.5 9 9.5 10
Line AOxygen (mg.l -1)
28
26
24
22
20
18
16
14
12
10
8
6
4
2
0
Dep
th (
m) A7
A2
A3A1
Figure 2.6. Vertical dissolved oxygen profiles made on the lines of stations north of St Croix Island (D), at St Croix Island (A), Jahleel Island (B) and farther southwest (C) for November 2002.
Oceanographic condition in June 2003 Data were collected over two days, 29 and 30 June 2003. Weather conditions were similar on both days, with a northeasterly breeze moderating after about 10 am. Vertical temperature profiles from the stations on each of the four lines (A, B, C and D) (Figure 2.7) indicate that the isothermal winter conditions were well set, with colder
water on the coastal side (Figure 2.8). Temperatures were slightly warmer towards the northeast, though this is probably not significant. Temperatures are essentially isothermal, but with colder, deeper water farther offshore.
7 7.5 8 8.5 9 9.5 10
Line BOxygen (mg.l-1)
28
26
24
22
20
18
16
14
12
10
8
6
4
2
0
De
pth
(m
)
B7
B1
B5
B2
B3
B4
B6
8 8.5 9 9.5 10
Line COxygen (mg.l-1)
28
26
24
22
20
18
16
14
12
10
8
6
4
2
0
De
pth
(m
)
C1
C2
C3
8 8.5 9 9.5 10
Line DOxygen (mg.l-1)
28
26
24
22
20
18
16
14
12
10
8
6
4
2
0
De
pth
(m
)
D1D2
X
O
D2
D1
C4
C2
C1
B 7
B6
B 5B 4
B 3B2
B 1
A 7
A 3
A2
A 1
Sea surface temperatures
June 200315.5 - 16
16 - 16.5
16.5 - 17
17 - 17.5
17.5 - 18
18 - 18.5
18.5 - 19
19 - 19.5
Figure 2.8. Contour plot of sea surface temperatures in June 2003.

PORT OF NGQURA MARINE BIOMONITORING PROGRAMME - 18 -
Figure 2.7. Vertical temperature profiles made on the lines of stations north of St Croix Island (D), at St Croix Island (A), Jahleel Island (B) and farther southwest (C) for June 2003. Salinities were largely constant, but with an indication of lower salinity in the colder water (Figure 2.9). Dissolved oxygen values showed some structure, with deeper water having lower values (Figure 2.10). As expected, the slightly alkaline seawater had a pH around 8.2. No significant differences were observed at the other stations where profile measurements were made.
Figure 2.9. Vertical salinity profiles made on the lines of stations north of St Croix Island (D), at St Croix Island (A), Jahleel Island (B) and farther southwest (C) for June 2003.
16 16.5 17 17.5 18
Line ATemperature (ºC)
26
24
22
20
18
16
14
12
10
8
6
4
2
0
De
pth
(m
)
A7
A3A2
A1
15 15.5 16 16.5 17 17.5
Line BTemperature (ºC)
22
20
18
16
14
12
10
8
6
4
2
0
De
pth
(m
)
B1
B2
B3
B4
B5
B6
B7
15.6 15.8 16 16.2 16.4 16.6 16.8 17
Line CTemperature (ºC)
20
18
16
14
12
10
8
6
4
2
0
Dept
h (m
)
C1 C4C2
16.5 17 17.5
Line DTemperature (ºC)
22
20
18
16
14
12
10
8
6
4
2
0
De
pth
(m
)
D1 D2
35 35.25 35.5
Line ASalinity (ppt)
26
24
22
20
18
16
14
12
10
8
6
4
2
0
Dep
th (
m)
A7
A3
A2
A1
35 35.25 35.5
Line BSalinity (ppt)
26
24
22
20
18
16
14
12
10
8
6
4
2
0
Dep
th (
m)
B7
B6
B5
B4
B3
B2
B1
35 35.25 35.5
Line CSalinity (ppt)
28
26
24
22
20
18
16
14
12
10
8
6
4
2
0
Dep
th (
m)
C4
C2
C1
35 35.25 35.5 35.75 36
Line DSalinity (ppt)
28
26
24
22
20
18
16
14
12
10
8
6
4
2
0D
epth
(m
)
D2
D1

PORT OF NGQURA MARINE BIOMONITORING PROGRAMME - 19 -
Figure 2.10. Vertical dissolved oxygen profiles made on the lines of stations north of St Croix Island (D), at St Croix Island (A), Jahleel Island (B) and farther southwest (C) for June 2003.
Figure 2.11. Satellite images of southern Africa: the left picture (taken on 30 November 2002) shows extensive areas of warm water (yellow) typical of summer. The right picture (taken on 30 June 2003) shows typical winter conditions, with no pronounced upwelling on the inshore edge of the Agulhas Current and no marked eddies off Algoa Bay.
5 5.5 6 6.5 7
Line AOxygen (mg.l-1)
28
26
24
22
20
18
16
14
12
10
8
6
4
2
0
Dep
th (
m)
A7
A2
A3
A1
5.5 6 6.5 7
Line BOxygen (mg.l-1)
28
26
24
22
20
18
16
14
12
10
8
6
4
2
0
Dep
th (
m)
B7
B1
B5B2
B3
B4
B6
6 6.5 7
Line COxygen (mg.l-1)
28
26
24
22
20
18
16
14
12
10
8
6
4
2
0
Dep
th (
m)
C1
C2
C3
4.5 5 5.5 6 6.5
Line DOxygen (mg.l-1)
28
26
24
22
20
18
16
14
12
10
8
6
4
2
0
Dep
th (
m) D1
D2

PORT OF NGQURA MARINE BIOMONITORING PROGRAMME - 20 -
SURFACE WATER NUTRIENT STATUS Introduction Various nutrients occur naturally within marine waters and are necessary growth substrates for marine flora (Paerl et al. 1990). However, anthropogenic inputs of nutrients are commonly high in coastal waters in the vicinity of developments and may lead to eutrophication, which in turn may lead to phytoplankton blooms (increase in numbers) (Paerl 1998). The purpose of describing the pattern of nutrient concentrations of the sampling area site was to determine and illustrate natural variation in concentrations. Following construction of the port, deviations from this natural variation could be considered to be a result of port associated activities. However, nutrient concentrations in marine systems, especially near the coast, are extremely variable (Baird et al. 2001; Seuront et al. 2002) and can change dramatically within a short space of time (hours to days) depending on prevailing conditions, such as rainfall, winds, currents and biota in the water. Because of this, changes in nutrient concentrations over time must be interpreted with care.
Methods and Materials The summer (November) 2002 nutrient analyses are not included in this report as the laboratory that was subcontracted to do the analyses encountered difficulties with their methodologies. The results delivered by the laboratory were either below the detection limit of the methods they used or were inconsistent with what was expected. Because of the problems encountered with the subcontracted laboratory it was decided to do the winter (June) 2003 nutrient analyses in the laboratories at UPE. In addition to ammonium, nitrate and phosphate, it was decided to include total organic nitrogen and organic phosphorus as well as total nitrogen and total phosphorus. The inorganic nutrients give an instantaneous measure of the nutrient in the water while the total organic nutrient gives an indication as to the status of the nutrient over a longer period of time. The total nutrient concentration is the sum of the inorganic nutrient and the organic nutrient.
Results No nutrient results are available for the summer period as a result of the difficulties encountered by the analytical laboratory. A complete set of results is available for the winter period.
Ammonium The concentration of ammonium (NH4+) in the water in the area of interest (Figure 3.1) was low (both at 1 and 10 m depths) compared to previous sampling periods. Ammonium is a form of inorganic nitrogen that is derived from materialisation of decaying organic matter (Stolte et al. 1994). There is no evidence to suggest that the harbour development has influenced this process in any way.
Eutrophication - the addition of nutrients in concentrations well in excess of natural concentrations

PORT OF NGQURA MARINE BIOMONITORING PROGRAMME - 21 -
Figure 3.1. Ammonium concentrations in winter 2003 at 1 m (left) and 10 m (right).
Nitrate On the whole, the nitrate (NO3-) concentration in the water in the winter 2003 sampling period (Figure 3.2) was what is to be expected at this time of year. The concentration of nitrate in the vicinity of the estuary mouth is a little higher than the surrounding area but this is not unexpected as the estuary can be a source of this nutrient. Nitrate in marine waters is very often derived from upwelling events and the pattern of distribution at 10 m compared to 1 m suggests that this nitrate may have been derived from a localised upwelling event. However, the nitrate concentrations are relatively low compared to previous sampling periods, so this seems unlikely. It is also possible that Jahleel Island is the source of the nitrate although one would not expect to
Figure 3.2. Nitrate concentrations in winter 2003 at 1 m (left) and 10 m (right).

PORT OF NGQURA MARINE BIOMONITORING PROGRAMME - 22 -
measure elevated levels of nitrate but rather ammonium or urea. The extent to which ammonium is mineralised to nitrate in this region is unknown and should be studied if the nutrient fluxes in this area are to be properly understood and predicted.
Total organic nitrogen The total organic nitrogen in the water, which would, in part, be an indicator of phytoplankton biomass, is low (Figure 3.3). This corresponds with the low chlorophyll a values measured.
Total nitrogen Total nitrogen is the sum of ammonium, nitrate and organic nitrogen and is uniformly low throughout the area of interest, although at 10 m it is slightly higher inshore than further offshore (Figure 3.4).
Figure 3.3. Total Organic Nitrogen at 1 m (left) and 10 m (right).
Figure 3.4. Total nitrogen (organic and inorganic) at 1 m (left) and 10 m (right).

PORT OF NGQURA MARINE BIOMONITORING PROGRAMME - 23 -
Phosphate The phosphate concentrations in the area of interest are normal for this time of year and area similar to those measured on previous sampling occasions. There is a plume of phosphate, which is particularly noticeable at 10 m depth that appears to originate from Jahleel Island (Figure 3.5). Similar plumes have been seen to be associated with the other islands in the area during previous sampling periods. It is believed that these plumes are the result of nutrients being washed off the island into the sea.
Organic phosphorus The organic phosphorus content of the water is low at both 1 m and 10 m depths and fairly uniform across the whole study area (Figure 3.6). There is no evidence that that the harbour development has any influence on the organic phosphorus.
Figure 3.5. Phosphate concentrations in winter 2003 at 1 m (left) and 10 m (right).
Figure 3.6. Organic Phosphorus at 1 m (left) and 10 m (right).

PORT OF NGQURA MARINE BIOMONITORING PROGRAMME - 24 -
Total phosphorus Total phosphorus is the sum of phosphate and organic phosphorus in the water. The concentration of total phosphorus is higher in the vicinity of the harbour development (Figure 3.7). This might be a result of the release of phosphorus being immobilized in the sediments of the estuary (Sundbäck et al. 2003). The harbour development work being carried out in the region might result in the suspension of these sediments and the subsequent release of the nutrient into the water column.
Figure 3.7. Total Phosphorus at 1m (top) and 10m (bottom)

PORT OF NGQURA MARINE BIOMONITORING PROGRAMME - 25 -
PHYTOPLANKTON BIOMASS AND SPECIES COMPOSITION
Introduction and objectives Phytoplankton cells require inorganic nutrients in order to convert sunlight into organic matter. By taking up nutrients, phytoplankton contribute to the removal of nutrients from the water to the extent that this feature may serve an environmental protection role (Brix 1993, Campbell & Bate 1997). Such conversion of nutrients results in increased phytoplankton biomass at the nutrient source (Schumann & Campbell 1999), while pollutants may cause a local decline in biomass (Clark 2000).
• To determine the extent of natural variation in phytoplankton abundance and diversity in the area surrounding the Ngqura harbour
• To establish whether deviations from this pattern have occurred following construction of the harbour
Methods Methods followed by Campbell (2001) were used in this study. Water samples for the determination of chlorophyll were collected at each of the 18 stations of the sampling grid in November 2002 and in June 2003. At each station, a plankton net was towed near the surface for a distance of 500 m and vertical drop-tow was taken collecting phytoplankton from the surface to the bottom and back to the near-surface. Samples for identification of phytoplankton were fixed in a 2% glutaraldehyde solution. These samples were catalogued as voucher specimens. Subsamples for identification of diatoms and silicoflagellates were prepared as described in Campbell (2001). Digital images of diatoms, dinoflagellates and silicoflagellates were recorded for each sample and species present were grouped into three abundance classes: dominant (more than 50 % of the community), common (10 - 50 % of the community) and present (less than 10 % of the community). Species composition is presented as an ordination plot where similar samples and species lie close together. A detrended correspondence analysis of the phytoplankton species by sample matrix was analysed using CANOCO (Ter Braak 1986). Diatom data was also analysed with data collected prior to the construction of the harbour breakwater (Campbell 2001) and this data is used to infer patterns relating to harbour construction activity.
Results The chlorophyll a concentrations, which are an indicator of phytoplankton biomass, did not exhibit marked seasonal differences in the period under review. The values in June 2003 were only marginally lower than in November 2002 and ranged between 2 and 4 µg · l-1) in the area of concern (see Figure 4.1 for an example ). By comparison, the chlorophyll a concentrations measured during the baseline study conducted in 2000 were markedly higher in summer but not in winter (Figure 4.2).
Phytoplankton -unattached microscopic algae
Chlorophyll is the green molecule in plants that absorbs sunlight and uses its energy to synthesise carbohydrates from CO2 and water. This process is known as photosynthesis and is the basis for sustaining the life processes of all plants.
CANOCO is a multivariate mathematical technique to relate community composition to known variation in the environment.

PORT OF NGQURA MARINE BIOMONITORING PROGRAMME - 26 -
-1.5 +5.5
-2.0
+7.0
This result should not be taken as an indicator that the harbour development was influencing the phytoplankton biomass; rather it is indicative of the low water nutrient concentrations (see chapter 3). There is no evidence that the harbour development has had any influence on the concentration of chlorophyll a (phytoplankton biomass) in the area of interest.
Figure 4.2. Interpolated chlorophyll a concentrations (µg l-1) measured in summer 2000 (left) and winter 2000 (right).
The diatom species composition (which species were recorded) was found to be unaffected by the islands (Figure 4.3top; there is no spatial separation of symbols using this classification indicating no effect of position on species composition: squares are contained within the extent of the circles and plusses). However, composition was slightly seasonal (Figure 4.3bottom; the winter samples are slightly to the right, the summer in the centre and autumn samples slightly to the left indicating a small change in species composition with season). The seasonal differences are not sharp changes in species composition as is indicated by the overlap of each group of symbols with other groups (Figure 4.3bottom). The change in species composition with changing season is also less (change from autumn to winter = eigenvalue of 1.5) than the variability in species composition for each season (eigenvalue = 3 for winter, taken in the same direction as seasonal change). All species recorded are tabulated at the end of this report.
Fugure 4.1. The uniformly low chl a concentrations measured in November 2002.
-1.5 +5.5
-2.0
+7.0
Figure 4.3. Ordination diagram of (top) samples classified according to position of sample collection: inshore (+), offshore (o) and island (solid squares) stations and (bottom) samples classified according to season of sample collection: autumn (+), summer (o) and winter (solid squares).

PORT OF NGQURA MARINE BIOMONITORING PROGRAMME - 27 -
In November 2002 and June 2003, the diatom communities were different to those recorded prior to harbour construction (Fig. 4.4a). Only four (<5 %) of the samples taken prior to construction sorted with the post-construction samples. Prior to construction, there was a low cumulative variance of species (10 %) for the ordination presented (Fig. 4.3). However, after the November 2002 and June 2003 samples are added the cumulative variance of species increased to 17 % (Figure 4.4a). This could be as a result of construction disturbances, and in order to elucidate this, an ordination was done only on the diatom samples taken in November 2002 and June 2003. If the effect had been caused by the harbour construction activities, then those samples close to the construction site should be different from those further away, in particular the control stations. Analysing the samples in this way shows that the control stations as well as the stations on the seaward end of the sampling lines were similar to those close to the harbour construction site (Fig. 4.4b). This indicates that the differences in diatom communities cannot be attributed to harbour construction activity. a b
Figure 4.4. Ordination diagram of a) diatom samples where open symbols are pre-construction samples and solid symbols are post-construction samples (summer samples are circles and winter ones are squares) showing a strong spatial separation of symbols using this classification indicating a change in diatom species composition and b) phytoplankton samples taken in November 2002 and June 2003 and classified according to position of sample collection: control (*), close to harbour construction (solid squares), inshore south of harbour (triangle), inshore north of harbour (diamonds) and offshore (O). Pattern of species richness (number of diatom species), however, was affected by proximity to St. Croix Island prior to harbour construction (Figure 4.5a-d). More species were recorded around St Croix in all sampling sessions than in surrounding waters. The same pattern was not found around Jahleel Island. After harbour construction commenced the summer samples appeared to be influenced by harbour related activities with high species richness in the construction area (Figure 4.5e). In winter, when biomass was low, the patterns of diversity distribution appeared to be associated with the islands again, this time stations near both Jahleel and St. Croix had higher diversity than other stations (with the exception of C2; Figure 4.5f). This pattern was not found when analysing diatom communities using ordination (see previous, Figure 4.3). This is because the same species were dominant near to the islands compared to further away, but more low-abundance species were consistently found near the islands.
-1.0 +8.0
-2.0
+6.0
-2.5 +4.5
-2.0

PORT OF NGQURA MARINE BIOMONITORING PROGRAMME - 28 -
Figure 4.5. Interpolated species richness for the diatom communities of near-surface waters during each of the four pre-construction sampling sessions (a – March 2000; b – July 2000; c – November 2000; d – April 2001) and after commencement of construction in e) November 2002 and f) June 2003.
a b
c d
e f

PORT OF NGQURA MARINE BIOMONITORING PROGRAMME - 29 -
-1.5 +5.0
-3.0
+5.5
-2.0 +5.0
-3.0
+5.5
The patterns of species richness differed for diatoms and dinoflagellates (Figure 4.6) with the distribution inversely related: high diatom species richness was found where dinoflagellate species richness was low.
Figure 4.6. Interpolated species richness for the diatom (left) and dinoflagellates (right) communities of the water column measured during November 2002. Ordination of phytoplankton species supports this difference. The dinoflagellates are concentrated in the top right of the ordination (Figure 4.7left), most likely due to their different physiological requirements. These two groups of phytoplankton may in future indicate different types of disturbances, providing valuable information.
Figure 4.7. Ordination diagram of (l) phytoplankton species where solid squares are dinoflagellates and grey circles are diatom species sampled in November 2002 and (r) phytoplankton samples where solid squares are horizontal tow samples and circles are vertical tow drops sampled in November 2002.

PORT OF NGQURA MARINE BIOMONITORING PROGRAMME - 30 -
The species richness was generally greater in horizontal compared to vertical tows of phytoplankton (Figure 4.8) and hence additional information added by sampling a vertical tow in addition to the horizontal tow is minimal (Figure 4.8right). Figure 4.8. Interpolated species richness for the vertical (left) and horizontal (right) tow of phytoplankton (diatom and dinoflagellate) communities measured during November 2002.
Discussion Phytoplankton species richness shows a different pattern to that of either phytoplankton biomass or species composition. More species (although similar species) were recorded around St. Croix Island for each sampling session. High biomass resulting from high nutrient loading typically causes a decrease in diversity (Raymont, 1980), however this is not the case for St. Croix. Here nutrients appear to sustain more species, possibly by alleviating competition. The possibility of species introduced by the African Penguins is excluded because the dominant diatom species in the water surrounding the islands is unaffected. This first monitoring of phytoplankton is insufficient to indicate construction-based disturbances of the phytoplankton community. Previous studies have shown alteration of diversity of diatom species as a result of disturbance (Schumann & Campbell 1999). The summer samples showed such an increase in diversity associated with the harbour. However, the differences were not persistent nor did they replace the naturally dominant species. Additions of species from the benthos during disturbance of the sea floor, altered discharge from the Coega River or movement of species due to dredging could have caused additional species to be sampled in the plankton. Because the existing diatom diversity range forms a coherent community with small seasonal fluctuations it is possible to detect disturbances in the diatom community. Future samples will elucidate this.

PORT OF NGQURA MARINE BIOMONITORING PROGRAMME - 31 -
Table 4.1. Phytoplankton species recorded in samples collected off the Ngqura harbour construction site. DIVISION CHRYSOPHYTA (silicoflagellates)
Dictyocha speculum (Ehrenberg) Haeckel var. octonarius (Ehrenberg) Jorgensen
Dictyocha fibula Ehrenberg
DIVISION BACILLARIOPHYTA (diatoms)
CLASS COSCINODISCOPHYCEAE Round & Crawford in Round et al. 1990 (centric diatoms) Thalassiosira angulata (Gregory) Hasle Anaulus australis Drebes et Schulz Thalassiosira lentigenosa (Janish) Fryxell Lithodesmium undulatum Ehrenberg Thalassiosira poro-irregulata Hasle & Heim Ditylum brightwellii (West) Grunow in Van
Heurck Thalassiosira proshkinae Makarova Rhizosolenia imbricata Brightwell Thalassiosira rotula Meunier Rhizosolenia setigera Brightwell Minidiscus trioculatus (Taylor) Hasle Chaetoceros danicus Cleve Cyclotella meneghiniana Kützing Chaetoceros decipiens Cleve Lauderia annulata Cleve Chaetoceros eibenii (Grunow) Meunier Stephanopyxis palmeriana (Greville) Grunow Chaetoceros lorenzianus Grunow Paralia sulcata (Ehrenberg) Cleve Chaetoceros protuberans Lauder Coscinodiscus radiatus Ehrenberg Bacteriastrum furcatum Shadbolt Coscinodiscus stellaris Roper Bacteriastrum hyalinum Lauder Aulacodiscus petersii Leptocylindrus danicus Cleve Actinoptychus senarius (Ehrenberg) Ehrenberg
Synedra crystallina (Agardh) Kützing
Asteromphalus flabellatus (Brébisson) Greville
Bleakeleya notata (Grunow in Van Heurck) Round
Asteromphalus heptactis (Brébisson) Ralfs Licmophora hyalina (Kützing) Grunow Triceratium antediluvianum (Ehrenberg) Grunow
Rhabdonema minutum Kützing
Triceratium favus Ehrenberg Delphineis karstenii (Boden) Fryxell Odontella mobiliensis (J.W. Bailey) Grunow. Agardh
Delphineis surirella (Ehrenberg) G. Andrews
Odontella rostrata (Hustedt) Simonsen Thalassionema nitzschioides Grunow Isthmia obliquata (J.E. Smith) Agardh Grammatophora marina (Lyngbye) Kützing Eucampia cornuta (Cleve) Grunow Entopyla australis (Ehrenberg) Ehrenberg Eucampia zodiacus Ehrenberg CLASS BACILLARIOPHYCEAE (raphid, pennate diatoms) Gomphonema parvulum (Kützing) Kützing Pleurosigma elongatum W. Smith Achnanthes brevipes Agardh Pleurosigma normanii Ralfs in Pritchard Achnanthes longipes Agardh Amphora angusta Gregory Cocconeis clandestina A. Schmidt Amphora bacillaris Gregory Cocconeis dirupta Gregory Amphora binodis Gregory Cocconeis disculoides Hustedt Amphora commutata Grunow in Van Heurck Cocconeis guttata Hustedt & Aleem Amphora costata Smith Cocconeis pseudomarginata Gregory Amphora obtusa Gregory Cocconeis scutellum Ehrenberg Amphora tenerrima Aleem et Hustedt

PORT OF NGQURA MARINE BIOMONITORING PROGRAMME - 32 -
Campyloneis grevillei (Wm. Smith) Grunow Amphora turgida Gregory Brachysira aponina Kützing Psammodictyon levidensis (W. Smith) D.G.
Mann Pinnularia ergudneis (Gregory) Ralfs in Pritchard
Psammodictyon panduriforme (Gregory) D.G. Mann
Pinnularia stauntonii (Grunow) Cleve Psammodictyon panduriforme (Gregory) D.G. Mann var. continua Grunow
Diploneis crabro (Ehrenberg) Ehrenberg Nitzschia angularis W. Smith Diploneis notatilis (Greville) Cleve Nitzschia distans Gregory Diploneis subadvena Hustedt Nitzschia seriata Cleve Navicula arenaria Donkin Nitzschia vermicularis (Kützing) Hantzscha
in Rabenhorst Navicula gregaria Donkin Nitzschia vitrea Norman Navicula pavillardii Hustedt Fragilariopsis pseudonana (Hasle) Hasle Navicula peregrina (Ehrenberg) Kützing Entomoneis alata Ehrenberg Navicula ramosissima (Agardh) Cleve Campylodiscus fastuosus Ehrenberg Pleurosigma cuspidatum Cleve Campylodiscus ralfsii W. Smith
DIVISION PYRROPHYTA (dinoflagellates) Order Prorocentrales Lemmermann 1910 Prorocentrum micans Ehrenberg Prorocentrum triestinum Schiller Prorocentrum compressum (Bailey) Abé ex Dodge Order Dinophysales Lindemann 1928 Dinophysis fortii Pavillard Dinophysis ovum Schütt Dinophysis tripos Gourret Phalacroma rotundatum (Claparède &
Lachmann) Kofoid & Michener Order Gymnodiniales Lankester 1885 Phaeopolykrikos beauchampii Chatton Order Gonyaulacales F.J.R. Taylor 1980 Ceratium breve Nie Ceratium macroceros (Ehrenberg) Vanöffen Ceratium buceros Zacharias Ceratium pulchellum Schröder Ceratium candelabrum (Ehrenberg) Stein Ceratium sp. Ceratium furca (Ehrenberg) Claparède & Lachmann
Ceratium symmetricum Pavillard
Ceratium horridum (Cleve) Gran Ceratium trichoceros (Ehrenberg) Kofoid Ceratium lineatum (Ehrenberg) Cleve Ceratium tripos (O.F. Müller) Nitzsch Ceratium longirostrum Gourret Gonyaulax spinifera (Claparède &
Lachmann) Diesing Order Peridiniales Haeckel 1894 Scripsiella sp. Protoperidinium diabolum (Cleve) Balech Scripsiella trochoidea (Stein) Loeblich III Protoperidinium mite Pavillard Protoperidinium claudicans (Paulsen) Balech Protoperidinium pellucidum Bergh Protoperidinium conicum (Gran) Balech Protoperidinium pentagonum (Gran) Balech Protoperidinium depressum (Bailey) Balech Protoperidinium punctulatum Paulsen

PORT OF NGQURA MARINE BIOMONITORING PROGRAMME - 33 -
ZOOPLANKTON Introduction Situated on the south coast of South Africa within the Agulhas Current Large Marine Ecosystem, Algoa Bay is considered part of the warm-temperate marine province. Two distinctly different forms of upwelling occur readily in this area, namely shelf edge upwelling and austral summer wind-driven upwelling, concentrated at the capes. In both cases, cold water rich in nutrients enhances biological productivity in the euphotic zone. The neritic zooplankton community of Algoa Bay has been poorly studied, with only sporadic surveys of temporal and spatial variations in abundance of select taxa. Diversity, biomass distribution at horizontal and vertical scales, and the ecological relationships and importance of the neritic holo- and merozooplankton community are consequently unknown. In the few surveys that have been undertaken, copepods, chaetognaths, euphausids, and a variety of small gelatinous forms, including ctenophoran comb jellies, appear to dominate the holoplankton community, with copepods the numerically dominant form. Biomass is however extremely variable, over small and large scales, within the Bay (Wooldridge 1983, Goschen et al. 1990, Cloete pers. obs.). Besides holoplanktonic forms, most bony fish and the majority of invertebrate species have retained a pelagic larval phase of development in their life history and consequently contribute to the neritic zooplankton community. Peaks in merozooplanktonic biomass in most regions of the world are associated with seasonal breeding cycles, and this probably also applies to Algoa Bay. Peaks in abundance and biomass of meroplanktonic forms, particularly larvae of crustaceans and molluscs, are believed to occur during the warmer summer months (Wooldridge pers. com.). Crustacean larvae, particularly those of decapods, are particularly prevalent in zooplankton samples collected from the nearshore. Studies on the spatial variations in the distribution and abundance of the larvae of two decapod crustaceans have been undertaken in Algoa Bay, one a truly marine form and other a resident of estuaries (Three-Spot Swimming Crab Ovalipes trimaculatus, Schoeman 1990; Estuarine Mudprawn Upogebia africana, Newman 2000.) The nearshore ichthyoplankton [fish larvae]of Algoa Bay has received some attention. Beckley (1986) identified larvae of 25 families of teleosts at several nearshore stations, of which gobiid (gobies), engraulid (anchovy) and clupeid (sardines) forms were dominant. No distinct spatial or seasonal trends in larval abundance were evident, with a maximum of 2.5 larvae per m3 recorded. The contribution of zooplankton to the ecological functioning of Algoa Bay is unknown, since no production studies have been undertaken in marine waters. However, as is the situation with other regions of the world, zooplanktonic organisms are extremely important as they constitute a trophic link between phytoplankton and vertebrates. Numerous fish and other invertebrates consume zooplankton, themselves in turn becoming prey for other predators. The Swartkops estuary, with its extensive intertidal mud flats and saltmarshes, and attendant high densities of prawns and brachyuran crabs, undoubtedly is an important source of meroplankton in Algoa Bay. The Sundays estuary has little intertidal, and no salt marshes, and consequently fewer of
Plankton – small life forms drifting with the currents in the water column. Holozooplankton – small animals that live all their life in the open water. Merozooplankton – small animals that spend their youth (usually as larvae) in the open water.
Teleosts – bony fish

PORT OF NGQURA MARINE BIOMONITORING PROGRAMME - 34 -
these organisms, which may in part explain the low abundance of decapod larvae in waters of the eastern portion of the bay.
Material and methods A single vertical haul with a WP2 net (300 µm mesh size) was made at each station of the sampling grid by lowering the net to within 3 m off the bottom and retrieving it at a rate of 0.5 m·s-1. The volume of water sampled was calculated from the pre-calibrated flow-meter reading, attached to the mouth of the WP2 net. Hauls were made in November 2002 and repeated in June 2003. Individual plankters were counted under a dissecting microscope and then grouped into 11 taxonomic categories for a coarse assessment of the diversity of meso-zooplankton off the Ngqura Port development. Zooplankton biomass was estimated from the displacement of the settled volume of the plankters in graduated cylinders.
Results Numerically, zooplankton was dominated by Copepoda, Coelenterata (cnidarians, siphonophores, ctenophores), and Chaetognatha. High densities of fish eggs were also recorded but the numbers of fish larvae were very low. Seasonal differences were evident, with calanoid copepods, chaetognaths and various species of medusae being more abundant in winter than in summer. No amphipods were recorded in winter and no isopods were recorded in summer (Table 5.1). A considerable density and diversity of decapod crustaceans in many stages (juvenile, larval, zoae, megalopa) were found, both in winter and in summer, with brachyuran zoae and megalopa stages being the most abundant. This zooplankton group may include a large proportion of euryhaline species of estuarine origin with a mandatory marine phase in their larval development.
Abundance (individuals · m-3) Coarse taxonomic groups
November 2002 June 2003
Coelenterata (= medusae) 729 1109
Tunicates 11 0
Calanoid copepods 446 4793
Cyclopoid copepods 14 128
Poecilostomatoid copepods 33 70
Cladocerans 75 41
Amphipods 57 0
Isopods 0 5
Decapod crustaceans 308 365
Chaetognaths 538 1116
Fish larvae & eggs 2574 1056
Table 5.1. Abundance of zooplankton off Coega in summer 2002 and winter 2003.

PORT OF NGQURA MARINE BIOMONITORING PROGRAMME - 35 -
Zooplankton biomass averaged 24 g · 100 m -3 (range 4-63) and 57 g · 100 m -3 (range 21-239) in November 2002 and June 2003, respectively. However, large variations were measured as shown in Figure 5.1. Winter peaks at stations B2, B3 and B6 were caused by large numbers of clupeid fish larvae.
Figure 5.1. Biomass of zooplankton off Coega in summer 2002 and winter 2003. The horizontal solid lines represent the average biomass for all stations in summer and in winter, respectively.
Discussion The results of this study seem to contradict current perceptions of seasonal variability in zooplankton abundance by being higher in winter than in summer. However, with the scarcity of comparable data in the scientific literature it is not possible to decide whether the contemporary hypothesis ought to be revoked. Previous zooplankton data recorded in Algoa Bay during both summer and winter periods found high abundances of zooplankton in the northwestern sector of Algoa Bay. Values ranged between 250 g · 100 m-3 and 1250 g ·100 m-3 in August 1988 and 250 g · 100 m-3 and 1750 g ·100 m-3 in February 1989 (Goschen et al. 1990). The high maxima recorded by Goschen et al. (1990) were due to an abundance of ctenophores (comb jellies) at the time, which tend to inflate settled volumes because of their high water content but contribute very little to biomass. With this in mind, the results of both zooplankton studies produced similar results.
A1 A2 A3 A7 B1 B2 B3 B4 B5 B6 B7 C1 C2 C4 D1 D2 O XStation
0
25
50
75
100
125
150
175
200
225
250
Bio
ma
ss (g
.m-3)
November 2002June 2003
PORT OF NGQURA MARINE BIOMONITORING PROGRAMME - 36 -
SUBTIDAL MACROBENTHOS Introduction Anthropogenic disturbance of marine habitats is constantly increasing in scope and severity. As a result, a large amount of research effort has recently focused on the development of methods for detecting such changes and understanding their consequences (Thomas 1993, Clarke & Warwick 1994, Goñi 1998, Boyd et al. 2003). Most of this work has concentrated on the ecology of benthic macroinfauna. The reasons for this are numerous, but among the most important are:
• These animals are of a convenient size, making them relatively easy to sample, identify, store and study.
• Such fauna are often commercially valuable, forming the basis of socio-economically important fisheries (e.g. crabs, lobsters, scallops, etc.).
• Benthic infauna are broadly linked with inhabitants of other aquatic systems (such as the plankton, the intertidal etc.), exchanging energy and nutrients with such systems and therefore being integral to broader ecosystem integrity (Gili & Coma 1998).
• Macrobenthic systems are particularly diverse, generally poorly studied and often contain large numbers of rare species (Grassle et al. 1991). They therefore have intrinsic value to conservation in general.
• Adults of most macrobenthic species form aggregations that are relatively static in space and time. This makes them good indicators of change.
• Many macrobenthic species associate with particular physical attributes of the environment (Thomas 1993, Newell et al. 2001). Therefore, change can be detected not only as a result of physical destruction of organisms, but also as a result of reasonably subtle alteration of the physico-chemical environment.
Bearing these advantages in mind, there are several disadvantages associated with studies of subtidal benthic infauna. The most important of these are: the difficulty of collecting consistent, quantitative samples (Boyd 2002), the lack of taxonomic information for important infaunal groups (such as polychaetes and amphipods) and the concomitant difficulty in properly identifying specimens collected (Grassle et al. 1991), and, finally, the consequent lack of understanding regarding the aut- and synecology of these ecosystems (Coterill 1995). However, with every study conducted, new data is collected and the consequences of these disadvantages are ameliorated. This is particularly important in the Eastern Cape, where subtidal benthic ecology has been largely overlooked, with only a handful of studies having addressed very limited questions (McLachlan et al. 1984, Wooldridge 1988, Malan 1991, Bentley & Cockcroft 1995). The current dataset is therefore important not only in a local perspective, but also nationally and internationally.
Objectives • To provide a quantitative spatial description of the benthic infaunal community
inhabiting the seabed adjacent to the Coega Development Zone. • To provide a basis for identifying important or sensitive habitats within said
study area.
Macrobenthic infauna are invertebrate animals large enough to be retained on a 1mm mesh that live partly or entirely within the sediments of the sea floor.

PORT OF NGQURA MARINE BIOMONITORING PROGRAMME - 37 -
• To assess the progression of variations in time and space that might be attributable to the Ngqura Port construction.
• To provide a reference against which recolonisation could be measured, should any significant disturbance occur.
Methods To address these objectives, six quantitative samples of the benthic infauna were collected using a 0.1 m2 Van Veen grab at each of the 18 sampling stations (see Figure 1.1 and Table 2.1) in November 2002. In the laboratory, three samples were selected at random from those available at each site. All macrofaunal specimens in each sample were extracted from the sediment, identified to the highest possible taxonomic resolution on the basis of externally visible morphological features, and then each taxon was enumerated. Methods conformed to recommendations laid out by Boyd (2002).
Results and discussion
Diversity and abundance In total, the sample area comprised 5.4 m2 and contained 3683 specimens belonging to 153 species, of which most (48 %) were arthropods (mainly crustaceans of the orders Amphipoda and Isopoda), although errant polychaete annelids were also well represented (27 %), as were ophiuroid echinoderms (6.5 %). The remaining species included cnidarians, platyhelminths, nemotaodes, nemerteans, sipunculids, sedentary polychaetes, molluscs, other echinoderms and protochordates. To place this abundance and diversity in context locally, a sample of comparable size from the intertidal sediments of an adjacent sandy beach, would typically yield less than 2000 specimens from less than 25 species (Schoeman et al. in press). Very few comparable data are available for marine subtidal macrobenthos in South African waters, but elsewhere in the world, analogous subtidal systems support roughly similar or higher abundance and diversity (Gray et al. 1998, Bergen et al. 2001, Newell et al. 2001, Rumohr et al. 2001, Boyd & Rees 2003, Boyd et al. 2003) However, it is important not to see the observed diversity as an isolated measure. Instead, the mean discovery rate of species should be investigated using a species-effort curve (Štirn et al. 1975). In this case (Figure 6.1), with each sample station inspected, several new species were added to the database, and this happened irrespective of the order in which samples are inspected. This indicates that many species are rare; in fact, roughly 35 % of the species recorded (excluding amphipods, for which individual species were not enumerated at each station) were found at only a single sample site.
Taxon (pl. taxa) - the named classification unit to which individuals, or sets of species, are assigned, such as species, genus, order etc. Taxonomy - studies of the relationships of taxa.
0
20
40
60
80
100
120
140
1 2 3 4 5 6 7 8 9 10 11 12131415161718
Sites inspected
Cum
ulat
ive
spec
ies
coun
t
Figure 6.1

PORT OF NGQURA MARINE BIOMONITORING PROGRAMME - 38 -
The discovery curve also indicate that the investigated material (18 x 3 =54 samples) describes only a very small fraction of the local macrobenthic biodiversity; no asymptote was reached in the species discovery curve, and it seems likely that the discovery rate would only start to tail off at much higher levels of sampling effort. Together, these observations strongly motivate for data aggregation in order to ameliorate the effects of chance inclusion or exclusion of rare species or taxa.
For these reasons, data from the three grab samples taken from each station were pooled and further analyses were conducted on a per station basis only. After pooling, two species-by-station databases were set up and queried for proxy measures of abundance and diversity. The first, ‘Coarse Taxonomic’, database aggregated species into broad taxonomic categories (phyla, classes, orders, etc.), depending on the meristic features and taxonomic knowledge available for each group. Of these taxonomic groups, only those taxa comprising at least 2.5 % of the community of at least one sample site were included in the analysis. This was done in order to reduce the dimensionality of the analysis and also to ensure that results were not unduly influenced by species that were present at low abundances and which might have gone undetected at any given site purely on the basis of chance. The second database (‘Indicator Species’) held those species that were both easy to identify and occurred in at least 20 % of the stations. Both of these groups were chosen with the aim of trying to establish easily obtainable indicators of potential change in the benthic communities within the study area.
Figure 6.2. Interpolated surface plots of coarse taxonomic groups (A) and indicator species (B).
Each new site that is investigated adds new species to the species list.
A B

PORT OF NGQURA MARINE BIOMONITORING PROGRAMME - 39 -
Univariate analyses Interpolated surface plots of biological diversity (Figure 6.2 A) and abundance of coarse taxa (Figure 6.2 B) proved difficult to interpret. Nevertheless, these univariate data tentatively suggest that the patterns detected during the baseline marine monitoring survey (linking abundance and diversity of the macrobenthic communities most strongly with proximity to St Croix and Jahleel Islands) might have persisted at some level. In contrast, the tentative identification of a phyllocariid crustacean amongst the samples taken during the baseline monitoring survey was not confirmed by the current analysis. It is possible that this was a misidentification, as several cumacean and amphipod species identified in the current survey bear a superficial resemblance to phyllocarids. Careful inspection of future samples will probably resolve this issue.
Multivariate analyses The paucity of meaningful information content of the univariate measures of abundance and diversity (Figure 6.2. A, B) is unsurprising, given that the abundance of each taxon at each station presents a variable in its own right. Therefore, a multivariate analytical approach (Clarke & Warwick 1994) was followed in the subsequent exploration of the databases. A species-by-station data matrix compiled from the abundance of individuals of each taxonomic group (either coarse taxonomic groups or indicator species) served as the basic input. Associations amongst these samples were first identified by means of hierarchical agglomerative clustering, using group-average linking on Bray-Curtis similarity measures (obtained from the untransformed species-sample matrix in the case of the coarse taxonomic database and square-root-transformed data in the case of the indicator species dataset; the difference in transformation being motivated by differential requirements to weight rare species). To allow better representation of similarities, the clustering exercise was supplemented by a non-metric multidimensional scaling (MDS) analysis on the same similarity data.
While these analyses have been developed to take cognisance of all species present, irrespective of their abundance or prevalence in a dataset, several studies (Gray et al. 1988, Defeo & Lercari in press) have demonstrated that aggregation of data into coarse taxonomic groups frequently does not alter the interpretation of the data. This feature of multivariate analysis is of particular importance to the current study, fully justifying the separate analysis of the coarse taxonomic database and the indicator species database. Multivariate analyses of the coarse taxa matrix revealed no striking pattern (Figure 6.3. A, B), except that the benthic communities at stations A7, C2, D1 and D2 were not very similar either to each other or to any of those at the rest of the stations. Stations X and O (the control site) were reasonably well associated with communities at other stations, suggesting that they are appropriately located to assist in the detection of potential
Cluster diagrams - Essentially, cluster diagrams are branching structures, with successively disparate groups of samples being split from one another on the basis of the similarities among their constituent biotic communities. Samples linked to one another at high levels of similarity have faunas that have a lot in common (in terms of actual taxa as well as their respective abundances), whereas those on branches that diverge at lower levels of similarity have very different faunas. In the same way, MDS-plots are the results of a computer algorithm that attempts to distribute samples in two-dimensional space so that samples having similar faunas are close together, whereas samples having dissimilar faunas are far apart.
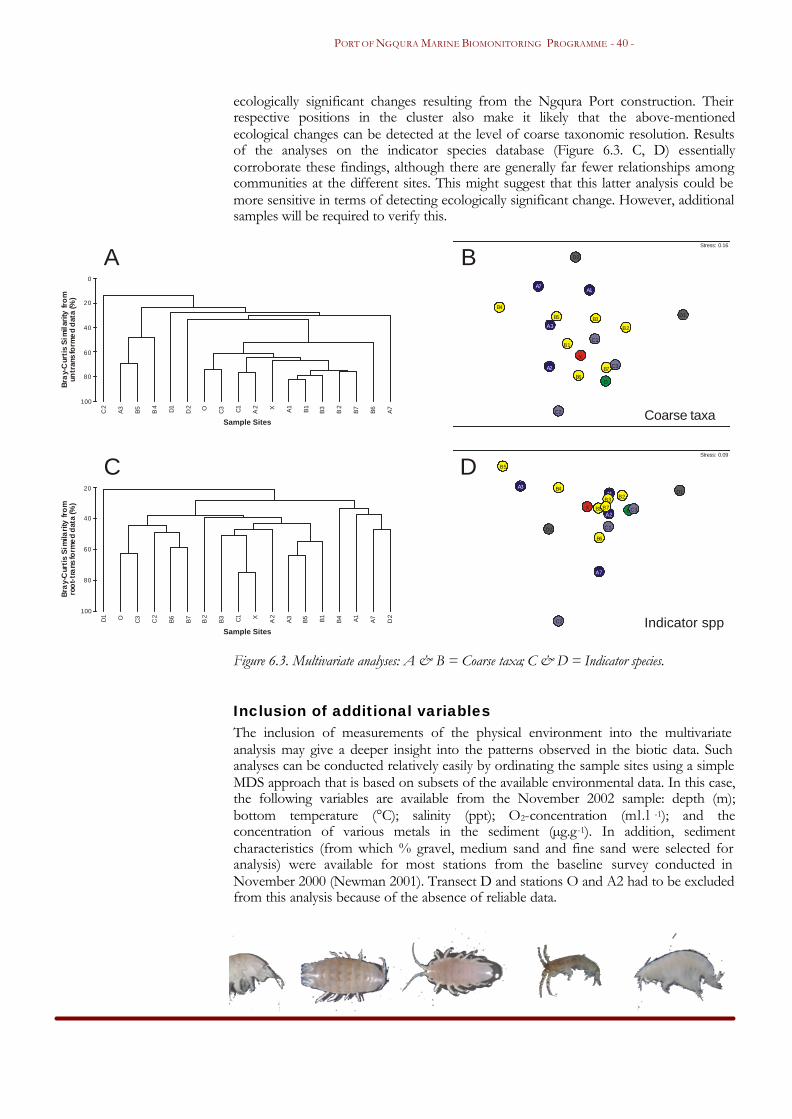
PORT OF NGQURA MARINE BIOMONITORING PROGRAMME - 40 -
ecologically significant changes resulting from the Ngqura Port construction. Their respective positions in the cluster also make it likely that the above-mentioned ecological changes can be detected at the level of coarse taxonomic resolution. Results of the analyses on the indicator species database (Figure 6.3. C, D) essentially corroborate these findings, although there are generally far fewer relationships among communities at the different sites. This might suggest that this latter analysis could be more sensitive in terms of detecting ecologically significant change. However, additional samples will be required to verify this.
Figure 6.3. Multivariate analyses: A & B = Coarse taxa; C & D = Indicator species.
Inclusion of additional variables The inclusion of measurements of the physical environment into the multivariate analysis may give a deeper insight into the patterns observed in the biotic data. Such analyses can be conducted relatively easily by ordinating the sample sites using a simple MDS approach that is based on subsets of the available environmental data. In this case, the following variables are available from the November 2002 sample: depth (m); bottom temperature (°C); salinity (ppt); O2-concentration (ml.l -1); and the concentration of various metals in the sediment (µg.g-1). In addition, sediment characteristics (from which % gravel, medium sand and fine sand were selected for analysis) were available for most stations from the baseline survey conducted in November 2000 (Newman 2001). Transect D and stations O and A2 had to be excluded from this analysis because of the absence of reliable data.
Sample Sites
Bra
y-C
urti
s S
imil
arity
fro
mun
tran
sfo
rme
d d
ata
(%)
C2
A3
B5
B4
D1
D2 O C3 C1
A2 X A1
B1
B3
B2
B7
B6
A7
0
20
40
60
80
100
A
A1
O
B3X
A2
A3
A7
B1
B2B4
B5
B6
B7
C1
C2
C3
D1
D2
Stress: 0.09
Indicator spp
D
Bra
y-C
urti
s S
imila
rity
fro
mro
ot-
tra
nsfo
rme
d d
ata
(%)
Sample Sites
C2
A3
B5
B4D1
D2O C3 C1
A2X A1
B1
B3
B2
B7
B6
A7
20
40
60
80
100
C
A1
A2
A3
A7
B1
B2
B3
B4
B5
B6B7
C1
C2
C3
D1
D2
O
X
Stress: 0.16
Coarse taxa
B

PORT OF NGQURA MARINE BIOMONITORING PROGRAMME - 41 -
Scatter plots of all possible pairwise combinations of physical variables indicated that most of the concentration data (oxygen, metals) were positively skewed. To avoid scaling any errors multiplicatively, the concentration data were therefore all log-transformed prior to further biostatistical treatment. Inspection of pairwise scatter plots of transformed data confirmed that resultant variables were more symmetrical. It also indicated that copper could be used as a proxy in the analysis for aluminium, mercury, tin and zinc, as all pairwise correlations among these variables averaged >0.96. The adoption of copper as a stand-in helped to reduce the dimensionality of subsequent ordinations. Results of the ordination analyses initially suggested that certain physical variables might introduce some explanatory power in respect of the benthic communities found at each station. For coarse taxa, for instance, temperature showed a reasonably good correlation (r = 0.32) with the biotic ordination. However, when additional physical variables could not improve the fit, it became clear that the available physical data could add little to the understanding of the ecological pattern that was not evident already from the analysis of the coarse taxa data alone. Analysis of the indicator species database, on the other hand, revealed a better correlation (r = 0.441) between the ordination based on only the biotic data and one that introduced the proportion of gravel in the sediment as well as chromium and arsenic concentrations. Adding the variable percent medium-sand improved the correlation marginally to 0.44 but not enough justify the inclusion of an addition dimension in the analysis. These results suggest that biotic communities, as described by the indicator species selected, might be distributed on the basis of sediment characteristics as well as metal concentrations. This again shows promise that the chosen analytical approach may be able to detect changes potentially caused by the Ngqura Port development, especially from dredge spoil contamination and from metal pollution originating from industrial activities.
Situational analysis It is far too early into the investigation of the benthos of Algoa Bay that the above discussion of the results should be interpreted in a cause-and-effect manner. The correlations described here merely indicate that certain environmental attributes are interrelated. To establish causal relationships, manipulative experiments will have to be conducted. Revisiting the objectives, it is difficult to provide a comprehensive quantitative spatial description of the benthic infaunal community inhabiting the study area site simply because it is so rich and diverse. On the basis of the samples collected, no particularly sensitive habitats could be identified, although the areas around the islands should continue to be monitored closely. Nevertheless, the grid of sampling stations and the analyses based on coarse taxa as well as indicator species seem to provide a suitable basis for the description of future temporal changes (including the future possibility of defaunation and subsequent recolonisation) in the macrobenthic community structure in the vicinity of the Ngqura Port development. Moreover, the reasonably low number of indicator species (34 in total), their reasonably easy identification and their ordination by a limited number of physical variables indicates a potentially useful avenue for the development of locally specific toxicological assays for the detection of pollution.

PORT OF NGQURA MARINE BIOMONITORING PROGRAMME - 42 -
ISLAND INTERTIDAL COMMUNITIES Introduction Macroalgae (seaweeds) and macrobenthic fauna occupy the intertidal of the shoreline wherever hard substrata are present. Because the intertidal has varying exposure times at different heights above mean low tide levels, a range of intertidal organisms occupy this zone: each species or group of species occupying the zone in which they are best adapted to the environmental constraints imposed by exposure. Consequently, intertidal organisms are particularly useful as indicators of environmental change. The islands of St. Croix and Jahleel are outcrops of Table Mountain Sandstone (Beckley & McLachlan 1979). The intertidal (littoral) zone is affected by semidiurnal tides of 1.61 m mean spring range and 0.51 m mean neap range (South African Navy 1977). The extent of wave action is dependent on the topography of the shoreline and position relative to the open sea and prevailing wind direction (Beckley & McLachlan 1979). The north coasts of the islands are protected from the dominant winds and swells. The south and east coasts face into the swells while the west coast faces into the dominant winds. Wave heights are around 1.5 m on the south-facing side and 0.8 m on the western side of the islands (Beckley and McLachlan 1979). Bird Island was chosen as a control station as it lies well away from the Ngqura port at the eastern end of Algoa Bay. The island flora falls in the South Coast biogeographic region (Stephenson & Stephenson 1972). Generally, diversity of species increases lower down the intertidal range (Lubke & Seagrief 1998) due to the reduction in severity of stress. The terminology used to describe vertical zonation of intertidal organisms is as follows: Littorina Zone:
- spring high water à neap high water - prolonged desiccation - low abundance of organisms (Porphyra capensis; Littorina spp.) - Bare rock dominant
Upper Balanoid Zone:
- neap high water à mean sea level - moderate desiccation - seaweed tufts (Ulva spp. and Gelidium pristoides) - Barnacles and winkles
Lower Balanoid Zone:
- mean sea level à neap low water - some desiccation - seaweed luxuriant (dominant is Gelidium pristoides) - Faunal composition include limpets, winkles and mussels (high densities of mussels occur in this zone on the islands)
Cochlear Zone:
- neap low water à spring low water - minimal desiccation - seaweeds conspicuous (dominant is Cheilosporum sagittatum with Gelidium micropterum fringing cochlear limpets) - High density of Patella cochlear
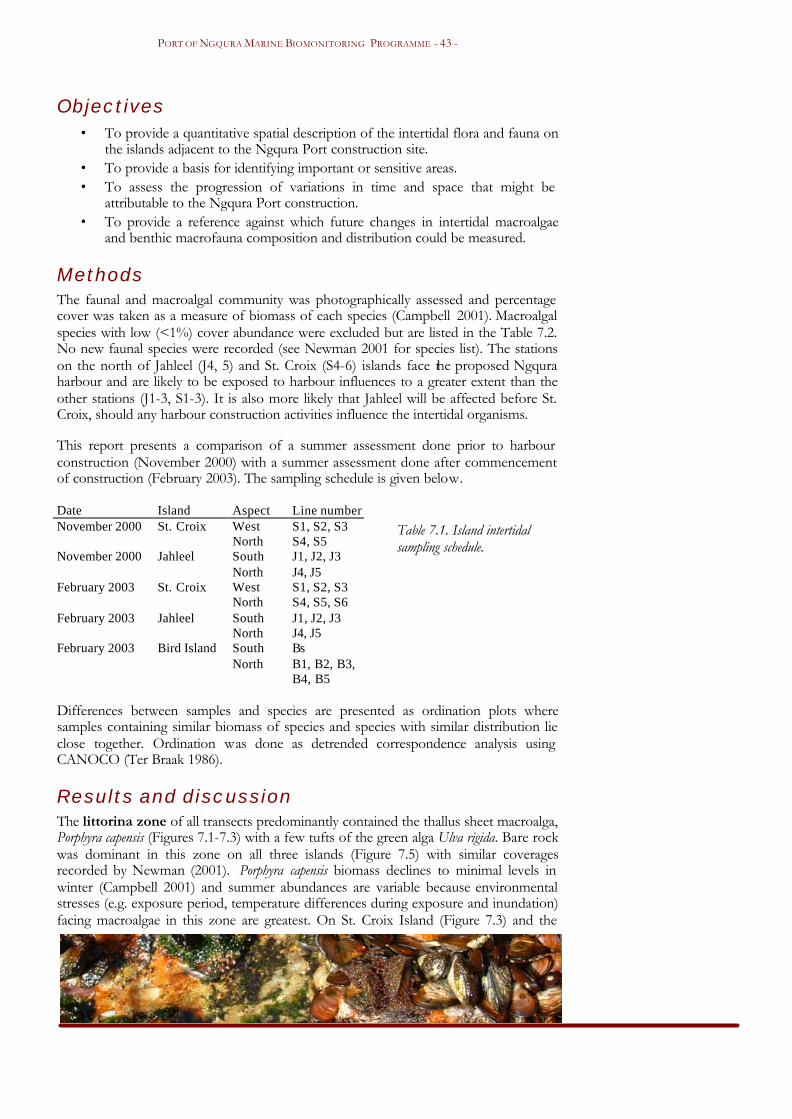
PORT OF NGQURA MARINE BIOMONITORING PROGRAMME - 43 -
Objectives • To provide a quantitative spatial description of the intertidal flora and fauna on
the islands adjacent to the Ngqura Port construction site. • To provide a basis for identifying important or sensitive areas. • To assess the progression of variations in time and space that might be
attributable to the Ngqura Port construction. • To provide a reference against which future changes in intertidal macroalgae
and benthic macrofauna composition and distribution could be measured.
Methods The faunal and macroalgal community was photographically assessed and percentage cover was taken as a measure of biomass of each species (Campbell 2001). Macroalgal species with low (<1%) cover abundance were excluded but are listed in the Table 7.2. No new faunal species were recorded (see Newman 2001 for species list). The stations on the north of Jahleel (J4, 5) and St. Croix (S4-6) islands face the proposed Ngqura harbour and are likely to be exposed to harbour influences to a greater extent than the other stations (J1-3, S1-3). It is also more likely that Jahleel will be affected before St. Croix, should any harbour construction activities influence the intertidal organisms.
This report presents a comparison of a summer assessment done prior to harbour construction (November 2000) with a summer assessment done after commencement of construction (February 2003). The sampling schedule is given below.
Date Island Aspect Line number November 2000 St. Croix West
North S1, S2, S3 S4, S5
November 2000 Jahleel South North
J1, J2, J3 J4, J5
February 2003 St. Croix West North
S1, S2, S3 S4, S5, S6
February 2003 Jahleel South North
J1, J2, J3 J4, J5
February 2003 Bird Island South North
Bs B1, B2, B3, B4, B5
Differences between samples and species are presented as ordination plots where samples containing similar biomass of species and species with similar distribution lie close together. Ordination was done as detrended correspondence analysis using CANOCO (Ter Braak 1986).
Results and discussion The littorina zone of all transects predominantly contained the thallus sheet macroalga, Porphyra capensis (Figures 7.1-7.3) with a few tufts of the green alga Ulva rigida. Bare rock was dominant in this zone on all three islands (Figure 7.5) with similar coverages recorded by Newman (2001). Porphyra capensis biomass declines to minimal levels in winter (Campbell 2001) and summer abundances are variable because environmental stresses (e.g. exposure period, temperature differences during exposure and inundation) facing macroalgae in this zone are greatest. On St. Croix Island (Figure 7.3) and the
Table 7.1. Island intertidal sampling schedule.

PORT OF NGQURA MARINE BIOMONITORING PROGRAMME - 44 -
northern side of Jahleel Island (Figure 7.2a, c), the littorina zone contained high biomass of Porphyra capensis. The littorina on the southern side of Jahleel (Figure 7.2d) had a very small algal biomass, but the situation was the same before harbour construction (Figure 7.2b). Both St Croix and Jahleel had substantially less Porphyra capensis on the north-facing shores after construction commenced compared to that before (Figure 7.2a vs c; Figure 7.3a vs c). This trend remains to be confirmed by subsequent monitoring. Both Jahleel and St. Croix islands had substantially less algal cover in the upper balanoid zone after construction commenced compared to that before construction (Figure 7.2a vs c; Figure 7.3a vs c). As with the littorina, this trend remains to be confirmed by subsequent monitoring. On both islands, this zone had minimal algal cover on the south side before and after harbour construction (Figure 7.2b, c; Figure 7.3b, c), but the cover of barnacles, from which this zone derived its name, remained unchanged (Figure 7.5 and Newman 2001). The lower balanoid zone of Jahleel and St. Croix north-facing shores showed a decrease in the cover of algae after harbour construction (Figure 7.2a vs c; Figure 7.3a vs c). Over the same period there was no substantial decrease in algal cover on the south side of both islands (Figure 7.2b vs d; Figure 7.3b vs d). The zone was dominated by Gelidium pristoides and Hypnea tenuis (Figures 7.2, 7.3). The mussel-dominated portion of the lower balanoid zone generally contained a much higher cover abundance of Hypnea tenuis than the remainder of the lower balanoid zone (Figures 7.1-7.3) and biomass trends of this portion were similar to that of the rest of the zone. Macroalgal growth rather than mussels dominated the lower balanoid zone on Bird Island. The limpet Patella cochlear dominated the cochlear zone of all islands. Dominant seaweeds in this zone were Cheilosporum sagittatum and Gelidium micropterum (Figures 7.1-7.3). Gelidium pristoides, Hypnea tenuis, Laurencia flexuosa, Laurencia natalensis and Ulva rigida were also represented. The greatest number of additional species not visible in the digital images was collected from this and the lower balanoid zones. Gelidium micropterum was not as abundant on Bird Island compared to the other two islands (Figure 7.1) but Plocamium corrallorhiza was abundant here but absent from the islands near Ngqura (Figures 7.1-7.3). The change in total algal biomass from November 2000 to February 2003 was significant for the north side of Jahleel (t = 6.880, d.f. = 3, p = 0.006) while no significant difference was found on the south side (t = 0.305, d.f. = 4, p = 0.775). No significant differences in intertidal macrofauna biomass were recorded from November 2000 to February 2003. Bird Island had the lowest macrofaunal biomass of all the islands (Figure 7.5) possibly due to the high algal biomass. The data indicate that the intertidal organisms inhabiting the rocky shores on the islands do not differ noticeably from those of similar habitats along the shoreline of Algoa Bay. There do not seem to be any unusual species, species richness is neither high nor low, and the zonation patterns within the assemblages are conventional.

PORT OF NGQURA MARINE BIOMONITORING PROGRAMME - 45 -
Figure 7.1. Macroalgal species cover abundance in five intertidal zones on the north (a) and south (b) sides of Bird Island during February 2003.
Figure 7.1a Figure 7.1b Figure 7.2. Macroalgal species cover abundance in five intertidal zones on the north (a, c) and south (b, d) sides of Jahleel Island during November 2000 (a, b), and February 2003 (c, d).
Figure 7.2a Figure 7.2b
Figure 7.2c Figure 7.2d
Littorin
a
Upper b
alano
id
Lower b
alanoid
Mussel
Cochlea
r
0
20
40
60
80
100
Cov
er a
bund
ance
(%
)
Porphyra capensisUlva rigidaGelidium micropterumGelidium pristoidesHypnea tenuisLaurencia natalensisCheilosporum sagittatumPlocamium corrallorhiza
Littor
ina
Upper
balano
id
Lower b
alanoid
Mussel
Cochlear
0
20
40
60
80
100
Cove
r abun
dan
ce (%
)
Porphyra capensis
Ulva rigidaGelidium pristoidesHypnea tenuis
Laurencia natalensis
Littorina Upper balanoid Lower balanoid Mussel Cochlear
0
20
40
60
80
100
Cov
er abun
dan
ce (%
)
Porphyra capensisUlva rigida
Gelidium micropterumGelidium pristoides
Hypnea tenuisLaurencia natalensisCheilosporum sagittatum
Littorina Upper balanoid Lower balanoid Mussel Cochlear
0
20
40
60
80
100
Cove
r abu
ndanc
e (%
)
Porphyra capensis
Ulva rigida
Gelidium micropterum
Gelidium pristoides
Hypnea tenuis
Laurencia natalensis
Cheilosporum sagittatum
No access
Litto
rina
Upper
balan
oid
Lower
bala
noid
Mus
sel
Cochl
ear
0
20
40
60
80
100
Cove
r ab
unda
nce
(%
)
Porphyra capensis
Ulva rigida
Gelidium microp terum
Gelidium pristoides
Hypnea tenuis
Laurencia natalensis
Che ilosporum sag ittatum
Plocamium corral lorhiza
Litto
rina
Upper
balan
oid
Lower
bala
noid
Mus
sel
Cochl
ear
0
20
40
60
80
100
Cove
r ab
unda
nce
(%
)
Porphyra capensis
Ulva rigida
Gelidium microp terum
Gelidium pristoides
Hypnea tenuis
Laurencia natalensis
Che ilosporum sag ittatum
Plocamium corral lorhiza

PORT OF NGQURA MARINE BIOMONITORING PROGRAMME - 46 -
Figure 7.3. Macroalgal species cover abundance in five intertidal zones on the north (a, c) and south (b, d) sides of St. Croix Island during November 2000 (a, b), and February 2003 (c, d).
Figure 7.3a Figure 7.3.b
Figure 7.3c Figure 7.3d Figure 7.4. Ordination diagram of intertidal transects (left) for Bird Island (asterisks), St. Croix (circles) and Jahleel (squares) Islands, before (open symbols) and after (solid symbols) harbour construction. The ordination of species is on the right.
Littorina Upper balanoid Lower balanoid Mussel Cochlear
0
20
40
60
80
100
Cov
er abu
ndan
ce (%
)
Porphyra capensisUlva rigida
G elid ium micropterumGelidium pristoides
Hypnea tenuisLaurencia natalensis
Cheilosporum sagittatum
Littorina Upper balanoid Lower balanoid Mussel Cochlear
0
20
40
60
80
100
Cov
er abun
danc
e (%
)
Porphyra capensisUlva rigidaG elid ium micropterumGelidium pristoidesHypnea tenuisLaurencia natalensisCheilosporum sagittatum
Littorin
a
Upper b
alan
oid
Low
er b
alano
id
Mus
sel
Cochlear
0
20
40
60
80
100
Cove
r ab
unda
nce
(%
)
Porphyra capensis
Ulva rigida
Gelidium micropterum
Gelidium pristoides
Hypnea tenuis
Laurencia natalensis
Chei losporum sag ittatum
Plocamium corral lorhiza
Littorin
a
Upper b
alan
oid
Low
er b
alano
id
Mus
sel
Cochlear
0
20
40
60
80
100
Cove
r ab
unda
nce
(%
)
Porphyra capensis
Ulva rigida
Gel idium micropterum
Gelidium pristoides
Hypnea tenuis
Laurencia natalensis
Cheilosporum sagi ttatum
Plocamium corrallorhiza
-1.0 +5.0
-1.5
+5.0
-1.0 +5.0
-1.5
+5.0
Plocamium corrallorhiza
Laurencia flexuosa
Cheilosporum sagittatum
Oxystele
Gelidium pristoides
Ulva rigida
Jania crassa
Porphyra capensis
Nodilittorina
Laurencia natalensis
Hypnea tenuis
barnacles
limpets
mussels
Gelidium micropterum
anemones

PORT OF NGQURA MARINE BIOMONITORING PROGRAMME - 47 -
Ordination of quadrats of intertidal samples (algae and fauna) show that Bird Island sites (the control) are different to the sites on the other two islands (Figure 7.4a; the asterisks lie to the right of the other symbols). This is primarily due to the presence of Plocamium corallorhiza at Bird Island: a species that was not recorded on either of the other islands (P. corallorhiza lies on the far right of the species ordination plot Figure 7.4b). All the St. Croix quadrats show a change comparing the analysis before and after harbour construction commenced. This can be seen in the ordination diagram (Figure 7.4a) where the open circles lie in a group separate from the solid circles. The Jahleel samples taken before and after harbour construction do not separate into groups in the same way: three of the five samples taken before construction commenced form a group with all the post-construction samples (Figure 7.4a). Taxonomic group
open rock
barnacles
limpets
mussels
topshells
winkles
anemones
Cheilosporum sagittatum
Gelidium micropterum
Gelidium pristoides
Hypnea tenuis
Laurencia flexuosa
Laurencia natalensis
Plocamium corrallorhiza
Porphyra capensis
Ulva rigida
Jania crassa
Figure 7.5. Kite diagrams of dominant macroalgal and macrofaunal species along the intertidal shores of Bird, Jahleel and St. Croix Islands. The major differences between the pre-construction samples and those measured after construction commenced are caused by changes in cover of Porphyra capensis (Figure 7.4b) The cover abundance of this species is lower in the recent samples (a decrease of total cover per transect from 7% to 2%). The intertidal macrofauna, with the exception of the limpets, are grouped to one side of the ordination diagram (Figure 7.4b). This
Bird Jahleel St Croix B1
B2
B3
B4
B5
J1
J2
J3
J4
S1
S5
S4
S2
S3
S6
J5

PORT OF NGQURA MARINE BIOMONITORING PROGRAMME - 48 -
separate grouping is the result of the macroalgae and macrofauna occupying different zones along the shore. The limpets occur where their food source (macroalgae) is most abundant resulting in them being grouped together. It does seem unlikely that the changes are due to the harbour construction as the greatest influence of change in water quality is likely to take place at Jahleel and in the lower part of the intertidal (cochlear zone). The most rapid responses, however, are expected to occur in the littorina as biomass changes are greatest here, but they are expected to occur at Jahleel before they do at St. Croix Island. This was not the case. Further monitoring will be required to determine conclusively whether there has been an effect of the harbour construction activities on the intertidal communities. It is possible that differences in oceanic and climatic conditions could have caused the changes shown here. Table 7.2. Intertidal macroalgal species recorded (Location: S = St. Croix Island, J = Jahleel Island: B = Bird Island. Identifications were done using Seagrief (1967, 1984); Simons (1976); Norris (1992); Branch et al. (1994); Stegenga et al. (1997) and Lubke & De Moor (1998)).
DIVISION CHLOROPHYTA Location Bryopsis eckloniae Stegenga, Bolton & Anderson S Bryopsis africana Areschoug J Bryopsis hypnoides Lamouroux J Chaetomorpha aerea (Dillwyn) Kuetzing J Cladophora radiosa (Suhr) Kuetzing S; J; B Codium lucasii Setchell subsp. capense B Enteromorpha compressa (L.) Greville S; J Enteromorpha prolifera (O.F. Mueller) J. Agardh J; B Halimeda cuneata Hering in Krauss J Ulothrix speciosa (Carmichael ex Harvey in Hooker) Kuetzing S; J; B Ulva fasciata Delile S; J; B Ulva rigida C. Agardh S; J; B
DIVISION PHAEOPHYTA
Carpomitra costata (Stackhouse) Batters S; J Dictyocha liturata J. Agardh B Ectocarpus sp. B Iyengaria stellata (Boergesen) Boerg esen B Sargassum heterophyllum (Turner) C. Agardh S; J; B Acinetospora crinita (Carmichael ex Harvey in Hooker) Kuetzing J Splachnidinium rugosum (L.) Greville J Zeacarpa leiomorpha Anderson, Simons & Bolton B
DIVISION RHODOPHYTA

PORT OF NGQURA MARINE BIOMONITORING PROGRAMME - 49 -
Amphiroa capensis Areschoug in J. Agardh B Amphiroa ephedraea (Lamarck) Decaisne B Amphiroa rigida Lamouroux B Arthrocardia flabellata (Kuetzing (Manza) S Ceramium arenarium Simons S; B Ceramium dawsonii Joly B Centroceroceras clavulatum (C. Agardh) Montagne in Durieu de Maisonneuve J; B Champium compressa Harvey B Cheilosporum sagittatum (Lamouroux) Areschoug in J. Agardh S; J; B Chondrococcus tripinnatus (Hering) Delf et. Michell B Epymenia capensis J. Agardh) Papenfuss S Gelidium abbottiorum R.E. Norris S; B Gelidium micropterum Kuetzing S; J; B Gelidium pristoides (Rutner) Kuetzing S; J; B Gelidium reptans (Suhr) Kylin B Gigartina paxillata Papenfuss J Gigartina radula (Esper) J. Agardh B Herposiphonia prorepens (Harvey) Schmitz in Engler B Hypnea ecklonii Suhr S Hypnea musciformis (Wulfen) Lamouroux J Hypnea rosea Papenfuss B Hypnea spicifera (Suhr) Harvey in J. Agardh S; B Hypnea tenuis Kylin S; J; B Jania adherens Lamouroux B Jania crassa Lamouroux S; B Jania verrucosa Lamouroux S; J; B Laurencia flexuosa Kuetzing S; B Laurencia natalensis Kylin S; B Laurencia glomerata Kuetzing J; B Nothogenia erinacea (Turner) Parkinson J Pachymenia carnosa (J. Agardh) J. Agardh S; B Plocamium corrallorhiza (Turner) Harvey in Hooker & Harvey B Plocamium suhrii Kuetzing B Polysiphonia sp. J Polysiphonia incompta Harvey S Porphyra capensis Kuetzing S; J; B Potieria hornemannii (Lyngbye) Silva in Silva et al. B Pterosiphonia cloiophylla (C. Agardh) Falkenberg S Pterosiphonia spinifera (Kuetzing) R.E. Norris & Aken J Pterosiphonia stangerii (J. Agardh) Falkenberg B Rhodophyllis reptans (Suhr) Papenfuss S Rhodothamniella floridula (Dillwyn) Feldmann in Christensen B Rhodymenia holmesii Ardissone S Rhodymenia natalensis Kylin S Sarcodia dentata (Suhr) R.E. Norris B Spongites yendoi (Foslie) Chamberlain B

PORT OF NGQURA MARINE BIOMONITORING PROGRAMME - 50 -
STATUS OF THE AFRICAN PENGUIN Some of the data presented in this chapter are cited with kind permission of Dr RJM Crawford, Marine & Coastal Management, Cape Town. Penguins are near the apex of the foodweb in Algoa Bay and data on their conservation status is regarded as informative in the context of this marine biomonitoring programme.
National conservation status The African Penguin breeds only in South Africa and Namibia. South Africa supports 90% of the population, including the four largest colonies: Dassen, St Croix, Robben and Bird islands. Dassen and Robben islands lie off the west coast, north of Cape Town. St Croix and Bird islands are in Algoa Bay, east of Port Elizabeth. The African Penguin is classified as Vulnerable to Extinction because its population decreased in a dramatic and sustained fashion during the 20th century, from well over 1.5 million adults in 1930 to just 160000 in the 1990s. Initially, this decrease was due to excessive harvests of penguin eggs. More recently, it has been caused by a shortage of food, which has resulted in poor reproductive success, and oiling, which has killed substantial numbers of grown birds. Additionally, Cape Fur Seals have displaced penguins from breeding sites at several colonies. Breeding populations at South African colonies are surveyed annually. The surveys conducted in 2001 indicate a clear increase in the penguin population, from a low of about 36000 breeding pairs in 1993 to some 56000 pairs at present. Between 2000 and 2001, the South African population increased from 46000 to 56000 breeding pairs, with each of the four largest colonies showing substantial growth (Crawford et al. 2001). At Dassen and Robben islands this growth was not expected because of the loss of 2000 birds during the Treasure oil spill in June 2000. Additionally, 5000 birds from these colonies died during the Apollo Sea spill of June 1994 The recent increase in South Africa’s penguins is attributed to good recruitment to the breeding population that in turn results from an increase in the abundance of South Africa’s stocks of Sardine and Anchovy, the two most important prey items of African Penguins. The combined biomass of these fish stocks in November 2000 was more than 5 million tons, double the highest biomass recorded since acoustic surveys to estimate their abundance began in 1984. However, feeding conditions have been consistently good since 1997. African Penguins breed for the first time when aged 3-4 years, and the young birds now recruiting to breeding colonies will have hatched during 1997 and 1998. The Sardine stock has increased steadily since 1984, as a result of careful management of this resource that includes minimizing the catch of young sardine and setting the catch at conservative levels. The Anchovy resource has undergone wide fluctuations in abundance that result from environmental conditions. Careful management of the food resources, a favourable marine environment and the dedicated efforts of the South African National Foundation for the Conservation of Coastal Birds (SANCCOB) in successful rehabilitating some 17000 penguins that were oiled after the Treasure sank a year ago have halted the long downward slide of the African Penguin. However, it will

PORT OF NGQURA MARINE BIOMONITORING PROGRAMME - 51 -
still be some time before its status as Vulnerable will be reassessed, because in terms of criteria stipulated by The World Conservation Union this is based on the population trend over its most recent three generations, which span a period of about 30 years.
Breeding colonies in Algoa Bay The islands of St Croix, Brenton and Jahleel (collectively: the Islands of the Cross) occur a few kilometres offshore and are located between the mouths of the Swartkops and Sundays Rivers. A second group of islands is located at the western end of Algoa Bay opposite Woody Cape and comprises Bird, Seal and Stag. Penguin breeding of the eastern subpopulation is restricted to these six islands. The nearest permanent breeding colony outside Algoa Bay is at Dyer Island, some 590 km to the west. St Croix and Bird Island are the most important breeding colonies in the Bay. Numbers of breeding birds on Jahleel, Brenton, Sealo and Stag Islands are usually less than one or two orders of magnitude lower.
Recent population trends in Algoa Bay Recent trends in the numbers of active nests (which are proportional to the number of adult by birds by a factor of 3.2) differed considerably between breeding islands in Algoa Bay for which there are reasonably good time series available. Census results from Bird
Island fluctuated by some 20% during the 1990s and then soared to historically unprecedented levels. The number of penguins breeding on Jahleel Island, situated 500 metres off the construction site, more than halved. A peak count of 19 500 active nests in 1993, against declining numbers elsewhere, gained St Croix Island the status of the last stronghold of the species. But, the euphoria was soon replaced by consternation
African Penguin on St Croix, the largest breeding colony of the species in Algoa Bay

PORT OF NGQURA MARINE BIOMONITORING PROGRAMME - 52 -
when the 1999 count documented the loss of 5 500 breeding pairs in six years. The irony of this decline is that it has occurred in the first marine reserve proclaimed in South Africa (in 1981; surrounding by 500 m St Croix and its two satellite islets of Jahleel and Brenton) and in a Provincial Nature Reserve (since 1987; encompassing all Algoa Bay breeding islands). The 2001 counts of active nests show an upward trend again at all South African breeding sites and St Croix was no exception. This may have resulted from the exceptionally good feeding conditions prevailing in early 2001 which allowed a greater proportion of adults to breed than in previous years. The latest (2003) apparent decline is explained by the extremely high (30 oC plus) air temperatures observed in Algoa Bay just prior to the census and linked to the 2002/2003 El Niño: penguins abandoned their eggs and small chicks en masse to seek relief in the relatively cool sea. Table 9.1. Numbers of active nests of African Penguin on selected Algoa Bay Islands, 1990-2003.
Bird Jahleel St Croix
Year Number of active nests 1990 3705 1991 3184 1992 3784 1993 549 194781994 1995 3651 1996 3144 1997 3726 331 1998 2578 56081999 3883 243 140052000 3940 2001 5376 169502002 4459 2003 936 141 9116
Although it is unproven whether the mere presence of a weather mast on Jahleel Island has aggravated the halving of the breeding population on that island, it would be advisable to remove the structure as soon as it has fulfilled its function of collecting baseline weather data for the harbour.

PORT OF NGQURA MARINE BIOMONITORING PROGRAMME - 53 -
METALS AND ORGANIC POLLUTANTS Metals in sediment
Introduction This chapter provides data on metal and organic pollutant concentrations recorded in biological tissue and surficial sediment from the sampling area, and evaluates these against pertinent national and international regulatory standards and guidelines. Pollutants are usually introduced into the sea in solution, for instance as industrial effluent, but only a relatively small portion of the introduced load tends to remain in solution. Rather, most of these chemicals are ‘scavenged’ from the water column to bottom sediments by absorption, and in this manner they may accumulate to concentrations that cause adverse ecological effects. Although physico-chemical processes (diagenesis) in the sediment can modify and redistribute contaminants between solid and solution phases, immobilisation by sedimentation is the rule for most elemental contaminants. Therefore, concentrations of metals in bottom sediments usually exceed those in the overlying water column by several orders of magnitude. Table 10.1. DEAT draft Action, Special Care and Prohibition guidelines (µg/g dry weight) for various trace metals in South African coastal sediments and National Oceanic and Atmospheric Association Effects Range Low (ERL) and Effects Range Medium (ERM) guideline (µg/g dry weight) for trace metals in marine and estuarine sediments in the USA.
DEAT NOAA
Metal Action Level*
/ Special Care Level**
Prohibition Level ERL ERM
Arsenic 30-150** >150 8.20 70.0 Cadmium 1.5-10.0 * >10 1.20 9.60 Chromium 50-500** >500 81.0 370
Copper 50-500** >500 34.0 270 Lead 100-500** >500 46.7 218
Mercury 0.5-5.0 * >5.0 0.15 0.71 Nickel 50-500** >500 20.9 51.6 Zinc 150-750** >750 150.0 410.0
Combination* 1.0-5.0** >5.0 Combination** 50-500** >500
Bottom sediment not only acts as a sink for contaminants but can also act as a significant contaminant source when remobilised (e.g. during dredging). Thus, even when water column contaminant concentrations are within ecologically ‘safe’ limits, stirred up bottom sediment can cause water quality problems. Contaminated sediment represents a potentially significant hazard to the health of aquatic ecosystems. Bottom sediment provides habitat for a wide variety of organisms, both plants and animals. These organisms are in intimate contact with the sediment and, therefore, any contaminants that it may contain. Both acute and chronic toxicity of

PORT OF NGQURA MARINE BIOMONITORING PROGRAMME - 54 -
metals in sediment to algae, invertebrates, fish and birds have been measured in toxicity tests, while field surveys have identified subtler effects, such as abnormalities in bottom feeding fish. Sediment associated metals also have the potential to bioaccumulate in the tissues of aquatic organisms and to consequently be biomagnified through a food chain, and ultimately may pose a threat to human health through consumption of table fish and shellfish.
Methods and Materials Surficial sediment (upper 2-3 cm) was collected from the 18 stations of the sampling grid in November 2003. Sediment samples were frozen until analysis in the laboratory. Sediment samples were analysed for total concentrations of aluminium (Al), arsenic (As), cadmium (Cd), chromium (Cr), copper (Cu), iron (Fe), lead (Pb), manganese (Mn), mercury (Hg), nickel (Ni), tin (Sn) and zinc (Zn), using a strong acid, total dissolution procedure. The selection of these metals for analysis is based on their implication in adverse ecological effects to aquatic ecosystems in other regions of the world. Several of these metals exhibit high toxicity to biota, even at relatively low concentrations, and have few or no known natural functions in biotic processes. Frozen sediment samples were thawed in Teflon jars, ground and homogenised, and a portion of the sample dried. About 0.5 g of dried sediment was then digested in a mixture of strong acids, and metal concentrations in solution were measured by Inductively Coupled Plasma Mass Spectrophotometry. Instrument blanks were run to identify sample carryover and spiked blanks to assess accuracy and precision. Calibration solutions were rerun after every 6 samples. Metal concentration data are expressed on a bulk sediment dry weight basis.
Results and Discussion Notwithstanding criticism regarding the ability to predict adverse biological effects, the most common procedure for evaluating sediment quality is from a toxicological perspective, by comparing measured chemical concentrations in sediment to so-called effects based numerical Sediment Quality Guidelines (SQGs). This is especially true for sediments collected from marine waters where anthropogenic enrichment is strongly suspected, and where no background data are available or cannot be collected because of this anthropogenic influence. SQGs are developed from data sets comprising concurrent measurements of sediment chemistry and associated biological data (e.g. benthic infaunal community structure, laboratory sediment toxicity test data, histopathological disorders in demersal fish), and define threshold concentrations above which various chemicals are likely to cause adverse biological effects, based on previous measurements. DEAT has compiled draft sediment quality guidelines for application during dredging operations in the South African coastal waters, although these have yet to be promulgated (Table 10.1.). These guidelines describe so-called ‘Action Levels’, ‘Special Care Levels’ and ‘Prohibition Levels’, which define metal specific concentration thresholds which, when exceeded, require some form of response during the disposal of dredge spoil (e.g. appropriate care during dredge spoil dump site selection, isolation of severely contaminated sediments by dumping and subsequent capping with uncontaminated sediment). The formulation of the DEAT guidelines was however not based upon locally collected data, but rather on various internationally developed
PORT OF NGQURA MARINE BIOMONITORING PROGRAMME - 55 -
guidelines. The criteria used by the DEAT to derive the draft guidelines from this mix of international guidelines were a subjective selection of various international guidelines, with no specific selection for the most conservative guideline. Thus, these guidelines make no allowance for possible regional variations in the background concentrations of metals. As a further problem, the international guideline data used as the basis for the formulation of the draft guidelines are, for various technical reasons, not readily compatible. The applicability of the DEAT guidelines for evaluating the quality of sediment from marine coastal waters is thus somewhat contentious. Due to these problems, the DEAT guidelines, as well as guidelines developed by the National Oceanic and Atmospheric Association (NOAA, USA), are compared and used to evaluate the metal concentrations in sediment collected from the Coega area. The NOAA describes two threshold concentrations, namely the Effects Range Low (ERL) and Effects Range Medium (ERM). Sediment metal concentrations below the ERL are unlikely to elicit adverse effects to biota, while those above the ERL but below the ERM may be associated with adverse effects. Metal concentrations exceeding the ERM have a very strong likelihood of eliciting adverse effects. The inclusion of the NOAA guidelines is based on the fact that both have been developed from extensive databases comprising concurrent chemical and biological measurements and are not only widely applied in the USA itself but have also either been adopted by some countries (e. g. Canada), or have been used as the basis for developing sediment quality guidelines in other countries (e.g. Australia and New Zealand). Evident in Table 10.1 are the sometimes large discrepancies between guidelines for almost all metals that are considered toxic to biota, or for which there is sufficient data available for the development of SQGs. The DEAT guidelines are considerably less conservative (describe higher threshold concentrations) than the other guidelines indicated. The concentrations of all target metals analysed for in sediment from the Coega area are below the DEAT Action Level/Special Care Level guidelines and, with the exception of arsenic, were also below the ERL guidelines of the NOAA (Table 10.2). Thus, sediments in the Coega area can be considered uncontaminated by metals and to provide minimal risks to biota. This is not surprising considering that the Coega area is situated a considerable distance from possible anthropogenic sources of metals, and thus no contamination would be expected. The concentration of arsenic recorded from Station A7 exceeded the ERL guideline, although only marginally; this appears to be a natural phenomenon and not related to anthropogenic enrichment. This case highlights problems with extrapolating data over regional scales without taking into account natural variations in sediment metal concentrations. The DEAT guidelines also define combined concentrations for selected suites of metals (Table 10.1). The combined concentrations for these suites of metals recorded in sediment from the Coega area were all well below the guideline levels. No significant deviations from the trace metal concentrations measured during the biomonitoring baseline survey were evident. The somewhat elevated metal concentrations detected near the Coega River mouth, especially at Station X, were confirmed. These are thought to reflect a composition of metals weathered from soil and rocks in the river’s catchment area and deposited in the nearshore by historical flooding events.

PORT OF NGQURA MARINE BIOMONITORING PROGRAMME - 56 -
Table 10.2. Concentrations (µg · g-1 dry weight) of trace metals in surficial sediment collected from the sampling grid off the Ngqura Port construction site.
Station Alu
min
ium
Chr
omiu
m
Man
gane
se
Iron
Cop
per
Zin
c
Cad
miu
m
Ars
enic
Tin
Lead
Mer
cury
A1 782 5.1 96 1681 2.2 11.9 0.12 6.9 0.31 6.5 0.03
A2 673 4.4 106 1410 1.6 9.2 0.08 7.1 0.27 5.1 0.02
A3 847 3.4 39 1222 1.5 11.5 0.16 5.7 0.17 3.3 0.02
A7 860 7.5 743 5118 1.8 13.9 0.12 29.9 0.22 8.2 0.02
B1 1741 9.3 59 2041 2.5 16.6 0.09 5.0 0.47 6.8 0.04
B2 951 5.7 34 1079 1.8 12.4 0.08 3.5 0.21 4.0 0.02
B3 767 6.6 68 1936 2.5 16.7 0.06 5.0 0.41 4.3 0.03
B4 506 2.9 60 1020 1.2 11.2 0.08 5.0 0.18 4.1 0.02
B5 698 2.8 36 810 1.1 11.6 0.07 3.3 0.14 3.2 0.02
B6 1384 7.9 54 2052 2.0 16.2 0.09 5.7 0.31 5.3 0.03
B7 1967 12.0 72 3136 3.5 19.0 0.10 6.2 0.51 6.7 0.04
C1 1735 10.8 64 2433 3.0 16.9 0.08 4.3 0.68 6.5 0.04
C2 459 4.9 44 1252 1.2 10.4 0.07 5.7 0.19 3.9 0.02
C3 1133 7.1 46 1697 1.7 13.7 0.07 5.1 0.26 4.1 0.02
D1 2108 10.7 100 3176 2.9 18.3 0.10 7.2 0.47 8.2 0.02
D2 1078 3.3 131 1162 1.2 13.3 0.12 8.0 0.17 3.9 0.03
O 1289 7.9 37 1778 2.0 12.7 0.09 4.3 0.26 4.8 0.02
X 2976 13.7 82 3341 3.8 19.5 0.08 4.2 0.87 6.2 0.04
Metals in biological tissues
Bioaccumulation Once pollutants reach the sea, they may concentrate through aquatic food chains and accumulate in biological tissues. Aquatic organisms may bioaccumulate environmental contaminants to more than 1 million times the concentrations detected in the water column. Bioaccumulation is the net result when the uptake of a pollutant by an organism exceeds its excretion. Some organisms accumulate metals more readily than others do. Good examples of marine organisms in this respect are bivalve molluscs (oysters, mussels and clams), and this is why they are used in many countries for monitoring purposes. Bivalve molluscs are filter feeders that accumulate trace metals directly from the water column or indirectly through the food that they filter from the sea. Mussels give an indication of pollutant input, even if this is intermittent, as they provide an integrated measure of the

PORT OF NGQURA MARINE BIOMONITORING PROGRAMME - 57 -
trace metal load of the surrounding seawater. Because they are sessile, they may reflect local contaminant concentrations more accurately than more mobile crustacean or finfish species. Thus, shellfish tissue monitoring serves as an important indicator of contaminated sediments and water quality problems, and many countries routinely conduct chemical contaminant analyses of shellfish tissues as part of their comprehensive water quality monitoring programmes. The mollusc used in this biomonitoring programme is the Brown Mussel Perna perna. It reaches a maximum size of 80 mm on intertidal rocky substrates and it is the dominant mussel species on the south and east coasts of South Africa (Van Erkom Schurink & Griffiths 1990).
Material and methods Brown Mussels (Perna perna) were collected from the intertidal of Hougham Park, Jahleel, St Croix and Bird Islands in February 2003. In the laboratory, the mussels were excised from their shells, thoroughly homogenised and then digested in acid. Trace metals analysed for were arsenic, cadmium, chromium, copper, mercury, nickel, lead, tin and zinc using the same analytical procedures as used for the metals in sediments. Table 10.3. Concentrations (µg · g -1 dry weight) of selected trace metals in Brown Mussel tissue collected in summer 2002/03 compared to national and international guidelines. Historical trace metal loads in Brown Mussel collected near the mouth of the Swartkops River reported by Watling & Watling (1983) are shown for comparative purposes (ND = not determined).
Locality Ars
enic
Cad
miu
m
Chr
omiu
m
Cop
per
Mer
cury
Nic
kel
Lead
Tin
Zin
c Bird I. 1 20.7 4.8 1.9 10.2 0.19 8.3 1.05 0.04 116.0 Bird I. 2 21.8 5.0 1.5 7.0 0.13 8.5 0.57 0.03 106.5 St Croix I. 1 20.8 6.3 1.1 6.5 0.19 5.4 0.68 0.05 102.0 St Croix I. 2 21.1 6.2 1.2 7.0 0.17 5.5 0.69 0.04 101.7 Hougham Park 1 12.3 1.6 3.6 8.8 0.17 14.4 2.54 0.23 159.7 Hougham Park 2 12.8 1.6 3.2 9.8 0.16 14.9 2.46 0.20 157.2 Jahleel I. 1 21.0 3.3 2.1 8.1 0.15 8.6 1.26 0.12 132.7 Jahleel I. 2 20.8 3.4 2.0 8.8 0.13 9.1 1.30 0.09 132.1 US FDA 86 3.7 13 - 1 80 1.7 - - ANZ FA 1 2 1.5 70 0.5 - 2.5 - 1000 DWAF 12 3 8 5 0.3 25 4 40 300 Watling & Watling (1983) ND 1.23 4.28 7.5 ND 8.14 3.32 ND 131.7
Results and discussion Tissue concentrations of all metals analysed for in mussels collected at the three island in Algoa Bay and along the shoreline of Hougham Park showed similar values than historical data where these are available (Watling & Watling 1979, 1983) (Table 10.3). This suggests that the substantial population growth and ongoing industrialisation of Port Elizabeth in the intervening 20 years has not led to a concomitant increase in the trace metal burden. However, the absolute metal concentrations that were measured in Brown Mussel fall outside levels regarded as uncontaminated, although they never reach
Brown Mussel

PORT OF NGQURA MARINE BIOMONITORING PROGRAMME - 58 -
the ten times (and more) higher levels reported from highly polluted aquatic environments (Johns 2001). Several metals exceed South African (DWAF 1996) as well as international human consumption safety limits (Table 10.3). Notwithstanding the criticism advanced earlier on in this chapter whether the South African guidelines set by DEAT for marine sediments and by DWAF for mariculture products have been set with due consideration of the natural, unpolluted background levels, the metal loads in mussels collected in the bay are cause for concern and will require careful monitoring in future. The elevated concentrations that were measured provide a clear example and warning of the propensity for marine shellfish to accumulate contaminants with all its ramifications for marine food chains. The data presented in this report indicate that Brown Mussel collected from island and mainland rocky shores are not entirely safe for human consumption. While consumption of mussels on the islands is unlikely in future considering that the islands are protected, and NPA will presumably enforce a no collection policy for the port itself, consumption safety levels present a good benchmark against which to evaluate data. However, this should not be viewed in isolation, and any upswing in contaminant body burdens should be a cause for appropriate action.
Organic pollutants The main anthropogenic flows of oil pollution into the marine environment come from land-based sources (refineries, storage facilities, municipal wastes, river runoff, etc.) and transportation activity (tanker oil transportation and shipping).
Oil and grease With the exception of Line A and D, all the stations in the study area during summer had oil and grease concentrations similar to that recorded at the control station (O)
(Figure 10.1). Oil and grease should not be present in concentrations that could be visible, detected by odour or deposited on the shoreline (DWAF 1995a, ANZECC 2000, California regional water quality control board 2001). No objectionable floating matter (including oil and grease) was noticed in the study area during both sampling sessions. No target values for oil and grease in South African waters have been set. The values recorded during this baseline monitoring programme was compared to the average values recorded in the existing port of Port Elizabeth for the first half of 2003. The highest values recorded in the existing port of Port Elizabeth (analyses done by the same laboratory) were 8 mg · l-1 (Bornman 2003). These low values were recorded in spite of a visible sheen present on most days in the harbour waters. The 40 mg · l-1 oil and grease concentration measured at station D1 in November 2002 is extremely high (Figure 10.1.). The fact that no oil and grease were noticed as a film on the surface, suggests that contamination of the sample at Station D1 could have taken place. The high values recorded along Transect line A
though, indicates the possibility of a serious pollution event in that area or immediately to the west prior to summer sampling (November 2002). Oil and grease concentrations in the surface water during winter were negligible.
Figure 10.1. Oil and Grease concentrations in near surface waters during the November 2002 sampling period.
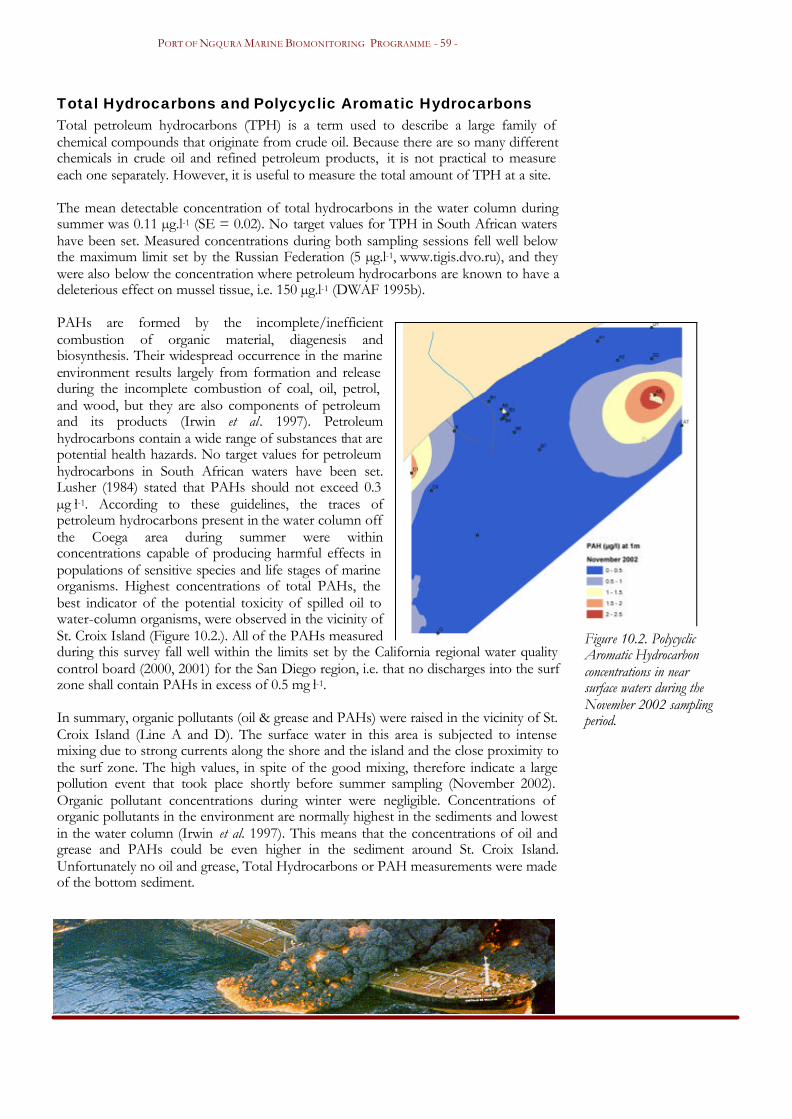
PORT OF NGQURA MARINE BIOMONITORING PROGRAMME - 59 -
Total Hydrocarbons and Polycyclic Aromatic Hydrocarbons Total petroleum hydrocarbons (TPH) is a term used to describe a large family of chemical compounds that originate from crude oil. Because there are so many different chemicals in crude oil and refined petroleum products, it is not practical to measure each one separately. However, it is useful to measure the total amount of TPH at a site. The mean detectable concentration of total hydrocarbons in the water column during summer was 0.11 µg.l-1 (SE = 0.02). No target values for TPH in South African waters have been set. Measured concentrations during both sampling sessions fell well below the maximum limit set by the Russian Federation (5 µg.l-1, www.tigis.dvo.ru), and they were also below the concentration where petroleum hydrocarbons are known to have a deleterious effect on mussel tissue, i.e. 150 µg.l-1 (DWAF 1995b). PAHs are formed by the incomplete/inefficient combustion of organic material, diagenesis and biosynthesis. Their widespread occurrence in the marine environment results largely from formation and release during the incomplete combustion of coal, oil, petrol, and wood, but they are also components of petroleum and its products (Irwin et al. 1997). Petroleum hydrocarbons contain a wide range of substances that are potential health hazards. No target values for petroleum hydrocarbons in South African waters have been set. Lusher (1984) stated that PAHs should not exceed 0.3 µg·l-1. According to these guidelines, the traces of petroleum hydrocarbons present in the water column off the Coega area during summer were within concentrations capable of producing harmful effects in populations of sensitive species and life stages of marine organisms. Highest concentrations of total PAHs, the best indicator of the potential toxicity of spilled oil to water-column organisms, were observed in the vicinity of St. Croix Island (Figure 10.2.). All of the PAHs measured during this survey fall well within the limits set by the California regional water quality control board (2000, 2001) for the San Diego region, i.e. that no discharges into the surf zone shall contain PAHs in excess of 0.5 mg·l-1. In summary, organic pollutants (oil & grease and PAHs) were raised in the vicinity of St. Croix Island (Line A and D). The surface water in this area is subjected to intense mixing due to strong currents along the shore and the island and the close proximity to the surf zone. The high values, in spite of the good mixing, therefore indicate a large pollution event that took place shortly before summer sampling (November 2002). Organic pollutant concentrations during winter were negligible. Concentrations of organic pollutants in the environment are normally highest in the sediments and lowest in the water column (Irwin et al. 1997). This means that the concentrations of oil and grease and PAHs could be even higher in the sediment around St. Croix Island. Unfortunately no oil and grease, Total Hydrocarbons or PAH measurements were made of the bottom sediment.
Figure 10.2. Polycyclic Aromatic Hydrocarbon concentrations in near surface waters during the November 2002 sampling period.

PORT OF NGQURA MARINE BIOMONITORING PROGRAMME - 60 -
SURFACE WATER BACTERIAL POLLUTANTS
Indicators of sewage contamination Enteric bacteria of human origin are used as indicators for sewage contamination of water, soil, fish and shellfish. In particular, microbiological tests proving the absence, or quantifying the presence, of faecal coliform bacteria, and more specifically Escherichia coli, are widely used to measure sewage contamination. Such bacteria die in seawater in a matter of days, so they are only suitable indicators of very recent pollution events. Enterococci (faecal streptococci) are relatively specific indicators of faecal pollution which tend to survive longer in aquatic environments than coliform bacteria. It is important to note that the presence of faecal coliforms indicates a possible risk to health, but the absence of indicators does not guarantee absence of risk. Target ranges and maximum permissible counts of faecal bacteria in the South African Water Quality Guidelines (DWAF 1995, 1996) distinguish between consumptive use (e.g eating mussels, which are filter feeders), full contact recreational use (e.g. swimming), intermediate contact use (e.g. yachting, fishing), and non-contact. Most recreational activities off the port construction site fall into the categories of intermediate contact or non-contact. Table 11.1 summarises national and selected international sewage contamination standards. Table 11.1. National and international sewage contamination standards
$ = consumptive use, * = full contact recreational use, # = intermediate contact recreational use
Results Bacterial counts of all tests performed on water samples collected at a depth of 1 m at each of the 18 stations of the sampling grid were generally well within the limits shown in Table 11.1.
Count per 100 ml
Guidelines Total coliform count E. coli Enterococci
DWAF (1995, 1996)
20 in 80 % & 60 in 95 % of samples$
100 in 80 % & 2000 in 95 % of samples *
0 – 130 * 0 – 30 *
Australian and New Zealand Guidelines for Fresh and Marine Water Quality
(2000) < 150 *
< 1000 # < 35 *
< 230 #
California regional water quality control board for the San Diego region (2000,
2001) < 1000 # < 200 *

PORT OF NGQURA MARINE BIOMONITORING PROGRAMME - 61 -
Total coliform counts (TCC) had a median value of 74 per 100 ml in November 2002, but included a high value of 2419 per 100 ml at Station A1 off the Abalone farm at Hougham Park (Figure 11.1). With as median value of 2 per 100 ml, TCC values were generally much lower in June 2003 (range 1-28 per 100 ml) (Table 11.2). Table 11.2. Median and ranges of bacterial counts performed in seawater collected off the Ngqura construction site in November 2002 and June 2003. Counts of TCC, E. coli and enterococci are determined in 100 ml of water, whereas the Standard Agar Plate Count (SAPC) reports the number of colony forming units per1 ml.
Minimum Maximum Median
Nov 02 Jun 03 Nov 02 Jun 03 Nov 02 Jun 03
Total coliform count
35 1 2419 37 74 7
E. coli 0 0 28 3 2 0
Enterococci 0 0 1 0 0 0
SAPC 10 0 114 120 20 10 Escherichia coli, a highly specific indicator of faecal pollution originating from humans and other mammals, was also elevated at Station A1 (28 per 100 ml) and Station A3 (13 per 100 ml) in November 2002, thus lending substance to the hypothesis that a recent discharge of sewage had occurred near the site (Figure 11.1). The collected information is insufficient to decide what the origin was (ship-based, land-based) of this sewage discharge. All other stations recorded the absence or very low levels of E. coli. Enterococci were reassuringly absent in seawater over the whole grid of stations on both sampling occasions, underpinning the notion that the risk of contracting gastroenteritis from full contact with seawater in the study area was small. The standard agar plate count is used as an indication of the level of microbiological activity in the water, by measuring the number of biological growth in 1 ml sample of water. Its diagnostic value was insignificant, suggesting that the measurement of this parameter should be dropped in future investigations.
Discussion Few measurements of bacterial activity of seawater in Algoa Bay have been made. Schumann & Campbell (1999) recorded an average faecal coliform count of 48 on the Bay side of the Charl Malan quay of the Port Elizabeth Harbour over the period January 1996 to September 1998. Bornman (2002, 2003) recorded maximum levels for TCC and E. coli of 2400 and 1048, respectively in the Port Elizabeth Harbour, which were suspected as originating from the discharge of untreated sewage into harbour water from moored deckboats. In summary, the inshore waters of the Ngqura Port construction site can be regarded as unpolluted from faecal matter in the period under review but the situation off the Abalone farm warrants further attention in the future.
Figure 11.1. Total coliform counts in November 2003.

PORT OF NGQURA MARINE BIOMONITORING PROGRAMME - 62 -

PORT OF NGQURA MARINE BIOMONITORING PROGRAMME - 63 -
REFERENCES Australian and New Zealand Guidelines for Fresh and Marine Water Quality. 2000. The Guidelines. Paper No. 4, Volume 1. Chapters 1 – 7. http://www.ea.gov.au/water/quality/nwqms/volume1.html. Baird ME, Emsley SM & McGlade JM. 2001. Modelling the interacting effects of nutrient uptake, light capture and temperature on phytoplankton growth. Journal of Plankton Research 23: 829-840. Beckley, L.E. &. Van Der Lingen, D.C.D. 1999. Biology, fishery and management of sardines (Sardinops sagax) in southern African waters. Mar. Freshwater Res. 50: 955-978. Bentley, A.C. & Cockcroft, A.C. 1995. Sublittoral sand dollar (Echinodiscus bisperforatus) communities in two bays on the South African south coast. South African Journal of Zoology 30: 5-17. Bornman, T.G. 2003. Report on seawater quality in the port of Port Elizabeth. November 2002 survey. Institute for Environmental & Coastal Management, University of Port Elizabeth. IECM Report No. C79. 16 pp. Bornman, T.G. 2003. Reports on seawater quality in the port of Port Elizabeth. March 2003 survey. Institute for Environmental & Coastal Management, University of Port Elizabeth. IECM Report No. C82. 26 pp. Boyd, S.E. & Rees, H.L. 2003. An examination of the spatial scales of impact on the marine benthos arising from marine aggregate extraction in the central English Channel. Estuarine, Coastal and Shelf Science 57: 1-16. Boyd, S.E. 2002. Guidelines for the conduct of benthic studies at aggregate dredging sites. U.K. Department for Transport, Local Government and the Region. London. 117 pp. Boyd, S.E., Limpenny, D.S., Rees, H.L., Cooper, K.M. & Campbell, S. 2003. Primary observations of the effects of dredging intensity on the re-colonisation of dredged sediments off the southeast coast of England (Area 222). Estuarine, Coastal and Shelf Science 57: 209-223. Bremner, J. M. 1991. Properties of surficial sediment in Algoa Bay. Bulletin of the Geological Survey 100: 23-74. Government Printer, Pretoria. Brix, H. 1993. Wastewater treatment in constructed wetlands: System design, removal process and treatment performances. In Moshiri, G.A. Constructed Wetlands for Water Quality Improvement. Lewis Publishers, Florida. California Regional Water Quality Control Board. 2000. General waste discharge requirements for San Diego Bay and storm drains or other conveyance systems tributary thereto. NPDES No. CAG919001. 54 pp. http://www.dot.ca.hq/construc/AppDReg9No2000-90.pdf. California Regional Water Quality Control Board. 2001. General waste discharge requirements for surface waters w ithin the San Diego region. NPDES No. CAG919002. 39 pp. http://www.swrcb.ca.gov. Campbell, E.E. 2001. Phytoplankton biomass and species composition. In IECM, Marine Baseline Biomonitoring for the Proposed Ngqura Deepwater Port Development. pp. 36-40. Campbell, E.E. and Bate, G.C. 1997. Physical features of the southern African coastline related to the occurrence of surf diatom accumulations. Bot. Mar. 40: 179-185. Clark, B. 2000. The effect of potential pollutants on the surf-zone diatom, Anaulus australis. MSc dissertation, University of Port Elizabeth. 112 pp. Clarke, K.R. & Warwick, R.M. 1994. Change in marine communities: an approach to statistical analysis and interpretation. Natural Environmental Research Council, UK. 144 pp. Cotterill, F.P.D. 1995. Systematics, biological knowledge and environmental conservation. Biodiversity and Conservation 4: 183-205. Crawford, R.J.M. and Whittington, P.A. 1997. Jackass Penguin Spheniscus demersus. In Harrison, J.A., Allan, D.G., Underhill, L.G., Herremans, M., Tree, A.J., Parker, V. and

PORT OF NGQURA MARINE BIOMONITORING PROGRAMME - 64 -
Brown, C.J. (eds). The Atlas of Southern African Birds. Vol. 1: Non-passerines. BirdLife South Africa, Johannesburg. Crawford, RJM., Klages, N. & Wolfaardt, A. 2001. First results from the 2001 African Penguin census: South Africa's Penguins on the rebound! http://www.uct.ac.za/depts/stats/adu/species003_09.htm. Defeo, O. & Lercari, D. In press. Testing taxonomic resolution levels for ecological monitoring in sandy beach macrobenthic communities. Aquatic Conservation: Marine and Freshwater Ecosystems. DWAF 1995. South African Water Quality Guidelines for Coastal Marine Waters. Vol. 2 – Recreational Use. Dept. of Water Affairs & Forestry. DWAF 1996. South African Water Quality Guidelines for Coastal Marine Waters. Vol. 4 – Mariculture. Dept. of Water Affairs & Forestry. Gili, J.-M. & Coma, R. 1998. Benthic suspension feeders: their paramount role in littoral marine food webs. Trends in Ecology and Evolution 13(8): 316-321. Goñi, R. 1998. Ecosystem effects of marine fisheries: an overview. Ocean & Coastal Management 40: 37-64. Goschen, W S & Schumann, E.H. 1994. An Agulhas Current intrusion into Algoa Bay during August 1988. South African Journal of Marine Science 14: 47-57. Goschen, W S & Schumann, E.H. 1995. Upwelling and the occurrence of cold water around Cape Recife, Algoa Bay, South Africa. South African Journal of Marine Science 16: 57-67. Goschen, W. S., Schumann, E. H., Wooldridge, T. H., Talbot, M. M. B. & Strydom, S. 1990. Physical oceanographic features and biological distribution offshore of Algoa Bay: Results from the 1989-1990 Meiring Naude cruise. UPE Internal Report. Goschen, W.S. & Schumann, E.H. 1988. Ocean current and temperature structures in Algoa Bay and beyond, November 1986. South African Journal of Marine Science 7: 101-116. Grassel, J.F., Lasserre, P., McIntyre, A.D. & Ray, G.C. 1991. Marine biodiversity and ecosystem function. A proposal for an international programme of research. Biology International, Special Issue No 23. Grasshoff, K., Ehrhardt, M. & Kremling, K. 1983. Methods of seawater analysis. Verlag Chemie, Weinheim. Gray, J.S., Aschan, M., Carr, M.R., Green, R.H., Pearson, T.H., Rosenberg, R., & Warwick, R.M. 1988. Analysis of community attributes of the benthos of Frierfjord and in a mesocosm experiment. Marine Ecology Progress Series 46: 151-165. Gray, J.S., Poore, G.C.B., Ugland, K.I., Wilson, R.S., Olsgard, F. & Johannessen, Ø. 1998. Coastal and deep-sea benthic diversities compared. Marine Ecology Progress Series 159: 97-103. Johns, C. 2001. Spatial distribution of total cadmium, copper, and zinc in the Zebra Mussel (Dreissena polymorpha) along the Upper St Lawrence River. J. Great Lakes Res. 27(3): 354-366. Luoma, S. 1990. Processes affecting metal concentrations in estuarine and coastal marine sediments. pp. 51-66 in: Furness, R, and P. Rainbow (eds.). Heavy metals in the marine environment. CRC Press, Boca Raton, FL. Lutjeharms, J.R.E. & Roberts, H.R. 1988. The Natal Pulse: an extreme transient on the Agulhas Current. Journal of Geophysical Research 93: 631-645. Malan, D.E. 1991. The role of the subtidal benthic system in the functioning of exposed sandy beaches. Unpublished PhD thesis, University of Port Elizabeth, 192 pp. McLachlan, A., Cockcroft, A.C. & Malan, D.E. 1984. Benthic faunal response to a high energy gradient. Marine Ecology Progress Series 16: 51-63. Newell, R.C., Seiderer, L.J. & Robinson, J.E. 2001. Animal:sediment relationships in coastal deposits of the eastern English Channel. Journal of the Marine Biological Association of the nited Kingdom 81: 1-9. Newman, B, (ed). 2001. Marine baseline biomonitoring for the proposed Ngqura port development: Final Report. IECM Report C66. 105 pp. Newman, B.K. 2000. Life history strategies of the mudprawn, Upogebia africana Ortmann

PORT OF NGQURA MARINE BIOMONITORING PROGRAMME - 65 -
1894 (Thalassinidea, Decapoda, Crustacea), during the marine phase of development. PhD Thesis, University of Port Elizabeth, South Africa. Nunsch, E.A. 1980. Comparison of different methods for chlorophyll and phæopigment determination. Arch. Hydrobiol. Beih. Ergebn. Limnol. 14, 14–36. Paerl, HW, Rudek, J & Mallin, MA. 1990. Stimulation of phytoplankton production in coastal waters by natural rainfall inputs: nutritional and trophic implications. Marine Biology 107: 247-254 Paerl, HW. 1998. Structure and function of anthropogenically altered microbial communities in coastal waters. Current Opinion in Microbiology 1: 296-302 Parsons, T. R., Maita, Y. & Lalli, C. M. 1984. A Manual of Chemical and Biological Methods for Seawater Analysis, 1st edition. Pergamon Press, Oxford. Raymont, J.E.G. 1980. Plankton and Productivity in the Oceans. 2nd edition. Pergamon Press, Oxford. Rumohr, H., Karakassis, I. & Jensen, J.N. 2001. Estimating species richness, abundance and diversity with 70 macrobenthic replicates in the Western Baltic Sea. Marine Ecology Progress Series 214: 103-110. Schoeman, D.S. 1990. Larval biology of the three spot swimming crab Ovalipes trimaculatus (De Haan). MSc Thesis, University of Port Elizabeth, South Africa. Schoeman, D.S., Wheeler, M. & Wait, M. In press. The relative accuracy of standard estimators for macrofaunal abundance and species richness derived from selected intertidal transect designs used to sample exposed sandy beaches. Estuarine, Coastal and Shelf Science 56. Schumann, E.H. & Campbell, E.E. 1999. Pollution status and assimilative capacity of the western sector of Algoa Bay. SAB Institute for Coastal Resource Management C55. 106 pp. Schumann, E.H, Churchill, J.R.S. & Zaayman, H.J. 2003. Oceanic variability in the western sector of Algoa Bay, South Africa. South African Journal of Marine Science (in press). Schumann, E.H, W.K. Illenberger & Goschen, W.S. 1991. Surface winds over Algoa Bay, South Africa. South African Journal of Science 87: 202-207. Schumann, E.H. & Martin, J.A. 1991. Climatological aspects of the coastal wind field at Cape Town, Port Elizabeth and Durban. South African Geographical Journal 73: 48-51. Schumann, E.H. 1987. The coastal ocean off the east coast of South Africa. Transactions of the Royal Society of South Africa 46: 215-229. Schumann, E.H. 1998. The coastal ocean off southeast Africa, including Madagascar. (Eds: A R Robinson and K H Brink) The Sea 11: 557-582. Seuront, L., Gentilhomme V., & Lagadeuc, Y. 2002. Small-scale nutrient patches in tidally mixed coastal waters. Marine Ecology Progress Series 232: 29-44 Štirn, J. et al.. 1975. Selected biological methods for assessment of marine pollution. In: Marine pollution and marine waste disposal (eds.) E.A. Pearson and E. de Fraja Frangipane, Oxford, Pergamon Press, pp. 307-327. Stolte, W., Mccollin, T., Noordeloos A.A.M. & Riegman, R. 1994. Effect of nitrogen source on the size distribution within marine phytoplankton populations. Journal of Experimental Marine Biology and Ecology 184: 83-97 Sundbäck, K., Miles, A., Hulth, S., Pihl, L., Engström, P., Selander, E., & Svenson, A. 2003. Importance of benthic nutrient regeneration during initiation of macroalgal blooms in shallow bays. Marine Ecology Progress Series 246: 115-126 Ter Braak, C. J. F. 1986. Canonical correspondence analysis: a new eigenvector method for multivariate direct gradient analysis. Ecology 67: 1167-1179. Thomas, J.D. 1993. Biological monitoring and tropical biodiversity in marine environments: a critique with recommendations, and comments on the use of amphipods as bioindicators. Journal of Natural History 27: 795-806. Van Erkom Schurink, C. & GriffithS, C.L. 1990. Marine mussels of southern Africa - their distribution patterns, standing stocks, exploitation and culture. Journal of Shellfish Research 9 (1): 75-85. Watling, R. J. & H. R. Watling 1979. Metal concentrations in Perna perna from the

PORT OF NGQURA MARINE BIOMONITORING PROGRAMME - 66 -
Southern African coast. S. Afr. J. Sci. 75: 371. Watling, R. J. & H. R. Watling. 1983. Trace metal surveys in Mossel Bay, St Francis Bay and Algoa Bay, South Africa. Water SA 9: 57-65. Wooldridge, T. 1988. (Ed.) Proposed marina development in the southwest sector of Plettenberg Bay – an ecological assessment. Institute for Coastal Research – U.P.E. Report No. 18, 62 pp. Wooldridge, T. H. 1983. Ecology of beach and surfzone mysid shrimps in the Eastern Cape, South Africa. In: McLachlan, A. and Erasmus, T. (Eds.). Sandy Beaches as Ecosystems. Developments in Hydrobiology: Junk, The Hague. pp. 501-506.