A kit to evaluate international markets competition International competitiveness guide.
27
Port Competition and Competitiveness
Theo Notteboom and Wei Yim Yap
27 .1 Introduction
Ports are dissimilar in their roles, assets, functions and institutional organizations (Bichou and Gray 2005). Thus, many definitions exist for the port. They can range from a small quay for berthing a ship to a largescale center with numerous terminals and a cluster of industries and services. For the purposes of this study, the definition of Notteboom (2001) is used: "a logistic and industrial center of an outspokenly maritime nature that plays an active role in the global transport system [for containerized cargoes] and that is characterised by a spatial and functional clustering of activities that are directly and indirectly involved in 'seamless' transportation and information processes in production chains."
Container ports serve as important nodes in facilitating the efficient flow of containerized cargoes. Specifically, they provide the primary interface for demand and supply forces to interact, and function as important marketplaces where the physical exchange between buyers and sellers of containerized
shipping capacity can be consolidated and realized. The container port can be further distinguished by its function, which consists of serving primarily as a gateway port that acts as an interface between hinterland and deep-sea routings of containerized cargoes, or of serving primarily as a transshipment port that acts as an interface for interchange between deep-sea routings of containerized cargoes.
The influence of container ports on the demand for the transport of containers by sea is exerted mainly through improvements to productivity, especially in areas related to cargo handling, providing excellent maritime and hinterland access, and ensuring that the pace of capacity expansion is adequate to meet anticipated demand. However, actualization of demand is dependent on container shipping services, for the decision to call at a port can bring additional cargo and result in beneficial spin-offs for local as well as hinterland economies. In addition, the presence of inter-container port complementarity (see Notteboom 2009a) means
The Blackwell Companion to Maritime Economics, First Edition. Edited by Wayne K. Talley. ~ 2012 Blackwell Publishing Ltd. Published 2012 by Blackwell Publishing Ltd.
550 THEO NOTTEBOOM AND WEI YIM YAP
that such benefits will be extended to other ports which complement the port in question.
Conversely, the decision by shipping services to stop calling at a port will result in reduced connectivity, choice of service providers and container throughput, which may have a negative impact on the competitive potential of its local and hinterland economies. The negative impact will also affect other ports which are complemented by services connected to the port. Hence, the decision by a container shipping service to switch from one port-of-call to another can lead to significant economic and commercial ramifications, for both ports and container ports which show less flexibility in accommodating to the requirements of shipping lines may be circumvented, while ports that are able to complement and add value to the objectives of liner shipping companies will become preferred channels of containerized traffic.
Consequently, container ports that are competitive will become focal points for key arteries of trade in containerized cargoes. This means that ports may have to serve as collection and distribution points for hinterlands that extend far beyond their traditional boundaries, and deal with issues and challenges that are presented by the whole logistics chain. Furthermore, efficiency gains that are generated by container ports will have important implications for the comparative and competitive advantages of their hinterlands. In particular, container ports that are endowed with efficient and modern infrastructure, and supported by competitive and reliable transportation services, can raise the level of welfare benefits which extend beyond the container port community and transport users to the whole of society.
This chapter aims to unravel seaport competition and competitiveness by providing insight into the relations between container ports through the analysis of container shipping services. It will be demonstrated that the configuration of liner services exerts a direct and immediate effect on inter-container port competition. The first sections discuss definitions of and approaches to port competition and competitiveness. We then introduce a research methodology to analyze inter-container port competition and competitiveness by means of annualized slot capacity figures calling at container ports. The methodology is applied to the container ports along the Malacca Strait, the Pearl River Delta and the Antwerp-Hamburg range.
27 .2 Defining Port Competition
Port competition is not a well-defined concept, partly because of its complex nature. Hence, the nature and characteristics of competition depend among other things upon the type of port involved (e.g. gateway port, local port, transshipment port) and the commodity (e.g. containers and liquid bulk). Heaver (1995) points out that terminals are the major focus of competitive strategy, not ports. In line with this perspective we argue that port competition essentially involves a competition for trades, with terminals as the competing physical units, transport concerns and/ or industrial enterprises as the chain managers and representatives of the respective trades, and port authorities and port policy makers as representatives and defenders of the port sector at a higher level, engaged in offering good working conditions (e.g. infrastructure) to this sector. Following from Van de
PORT COMPETITION AND COMPETITNENESS 551
Voorde and Winkelmans (2002), container port competition could unfold at three levels. At the first level, intra-port competition takes place between terminal operators located within the given port. The competitive arena includes all aspects of the containerized trade, such as the traffic routings, shippers and shipping lines concerned. For instance, competition could be focused on enticing major shipping lines and shippers to hub their operations at the terminal, or targeted at specific services operated by specific shipping lines in order to strengthen the level of connectivity on particular trade routes and to particular regions. Important shippers do not necessarily choose a port, but a logistics chain solution in which a port is merely a node. At the second level, terminal operators have to account for competition with terminal operators located in other ports. Termed "inter-port competition," this can be played out at the national and regional levels. At the highest level, inter-port competition occurs between terminal operators located in different port ranges. The authors define a container port range to be a geographically defined area with a number of ports that possess largely overlapping hinterlands and thus serve mostly the same customers.
Progressive changes in regional economic performance and overlapping hinterlands, made possible by improvements in intermodal technology and organization, prompt shipping lines and shippers to frequently review the service schedules, traffic routings and assets utilized in order to exploit changing traffic density and achieve greater economies. As a single node in global value-driven chain systems, a container port continuously strives to capitalize on the factors that contribute to its competitive advantage in order to entrench
and enlarge its captive hinterland, and at the same time to erode that of its competitors.
Analyses of container port competition in various container-handling regions in the world showed that ports compete not only with their immediate neighbors but also with other ports located in the wider region. In particular, competition was found to be more intensive between major load centers located within certain regions (Gouvernal, Debrie and Slack 2005; Yap and Lam 2006a). Marcadon ( 1999) also highlighted the trend for fierce competition to cause ports to extend their hinterland into areas previously neglected; large hinterland coverage was thought to enhance container port attractiveness to shippers and carriers through the advantages of a larger choice of carriers, better connectivity and potential scale economies that can be reaped. However, Notteboom (2009b) suggested that the immediate hinterland continues to serve as the backbone of ports' cargo base in interport rivalry.
27 .3 Defining Port Competitiveness
The competitive position of a container port is determined by its competitive offering to the host of shippers and shipping lines for specific trade routes, geographical regions and other ports to which the container port is connected. However, at the broader dimension, the competitiveness of a container port is determined by the range of competitive advantages that are acquired or created by the port over time (Haezendonck and Notteboom 2002). Consolidating the list of factors drawn from
552 THEO NOTTEBOOM AND WEI YIM YAP
various perspectives showed that a container port is likely to be more competitive if the port:
• enjoys proximity to key centers of production and consumption, and major trade lanes;
• possesses excellent maritime and hinterland access and offers superior connectivity to markets;
• is able to reduce port costs for users through higher productivity;
• is able to persuade and entrench carriers and shippers in relation to their cargo routings by adding value to the business pursuits of these entities; is able to expand capacity in time to meet demand and has sufficient space to cater to future development and capacity extensions;
• enables users to compete effectively with other transport modes; is able to cope with challenges posed by the new logistics business environment; is able to capitalize on the complementary and reinforcing effects of the port cluster;
• has greater involvement from the private sector at the level of terminal operations;
• is perceived to be a key driver of the local economy; and enjoys a long tradition of support from key stakeholders in the port area and the wider community.
The list of factors shown above reveals the complexity and difficulties inherent in defining competitiveness. Further complication is involved if the wide spectrum and great diversity of industry and community players with their various objectives, means and
possible impacts are included in the analysis; then well-balanced stakeholder relations management is demanded (Winkelmans and Notteboom 2007). Hence, the specific meaning, perception, interpretation, measurement and implication of these factors are bound to be different for the various parties involved in the port business. Furthermore, the competitive offering will have to depend on what is presented by the entire port community, not just the container terminal operator.
A variety of methods have been used to ascertain the magnitude and characteristics of container port competitiveness. These studies can also be categorized into those that utilize quantitative techniques and those that are descriptive in nature. Quantitative methods employed included those using integer linear programming (Aversa, Batter, Haralambides and Yoshizaki 2005), dynamic programming (Zeng and Yang 2002), the analytical hierarchy process (Guy and Urli 2006; Lirn, Thanopoulou, Beynon and Beresford 2004), stochastic frontier analysis (Notteboom, Coeck and Van den Broeck 2000; Tongzon and Heng 2005), data envelopment analysis (GarciaAlonso and Martin-Bofarull 2007; Trujillo and Tovar 2007), the logit model (Veldman, Bi.ickmann and Saitua 2005), the structural equation model (Bichou and Bell 2007), the cointegration test and error correction model (Yap and Lam 2006a), the transport cost model (Jara-Diaz, Cortes and Ponce 2001), the transport demand model (Luo and Grigalunas 2003), cluster analysis (De Langen 2002), shipping networks (Yap, Lam and Notteboom 2006), and the oligopolistic model (Yap and Lam 2006b).
These methods generally focused on investigating explicit aspects of competition that are measurable and comparable across
PORT COMPETITION AND COMPETITIVENESS 553
selected samples of container ports and terminals. These aspects include various operational, financial and output indicators of container port performance which are related to efficiency of resource utilization, productivity achieved by assets employed, share of traffic handled, and overall level of satisfaction with service provided and costs incurred by shippers and shipping lines. However, these investigation techniques are dependent on the correct specification of the models, appropriate representation of variables and the adoption of a suitable unit of analysis.
Although components that are quantifiable can potentially be used to ascertain competitiveness in an objective manner, the factors which determine competitiveness typically extend beyond these to include many that are qualitative in nature. These factors are generally covered by analyses which are descriptive in nature and associated with areas related to:
• container port development (Cullinane, Wang and Cullinane 2004; Notteboom and Rodrigue 2005; Slack and Fremont 2005);
container port competition (Notteboom 2002; Robinson 2002; Van de Voorde and Winkelmans 2002; Yap and Lam 2004);
• container shipping lines (Heaver, Meersman, Moglia and Van de Voorde 2000; Slack, Comtois and Mccalla 2002);
and the supply chain (Notteboom and Winkelmans 2001).
As a whole, the variety of measurements and methodologies propagated show the extent and complexity of considerations related to container port competitiveness and competition.
27 .4 Research Methodology
The preceding sections have shown that container shipping services are instrumental in influencing competitive relationships between container ports. Hence, the chapter examines the competitive relationships embedded within three major containerhandling regions of the world by analyzing the manner in which container shipping lines manage their container shipping fleet by implementing new or removing existing service routings.
27.4.1 Annualized slot capacity (ASC)
For this purpose, container port competition is determined by gains made or losses incurred as a result of changes in the annualized slot capacity (ASC) that calls at container ports. Specifically, ASC can be derived from the actual vessel capacity deployed in liner services; the corresponding computation for an individual port "X" for an individual service can be obtained by the formula:
!v!" Tx~ = 2G~F! _,,h=~1-
n
where T is the annualized slot capacity, measured in TEU, that called at port "X" for a particular service "k" in time period "t";
G is the number of calls made at port "X" for the whole service loop;
F is the frequency of call in a year;
V h is the capacity of vessel h for n vessels deployed; and
554 THEO NOTTEBOOM AND WEI YIM YAP
W is the average capacity of vessels
!v.~ deployed for w.~ = ~h~=1--
n Multiplication by a factor of 2 presumes that the vessels are fully loaded and that all the containers will be unloaded and the vessels subsequently reloaded to their maximum capacity. Nonetheless, container vessels will be carrying containers that are destined for other ports as well. Hence, T! denotes the theoretical ASC limit for containers which can be handled at port "X." In actual fact, the proportion of ASC allocated for the port will be much lower as a percentage of the total ASC deployed. The actual number of containers handled at the port for a given two-way vessel capacity will also be dependent on factors such as:
• the number of ports of call on the relevant side of the trade route. The higher the number of ports, the lower will be the average share of containers handled as a percentage of the ASC deployed per port of call.
• the liner service network structure. A carrier may decide to route most of its cargo via one specific hub without abandoning the multiple-call system. In such a case, the hub will show a high share of containers handled as a percentage of the ASC deployed while other ports of call in the same service will have a low share. For example, the Mediterranean Shipping Company (MSC) concentrated most of its North European cargo at the MSC Home Terminal in Antwerp, but the liner services of MSC remain linebundling services with multiple calls in Northern Europe. the cargo-generating effect of the port calls. For example, Notteboom (2007)
demonstrated that upstream ports in Northern Europe such as Antwerp and Hamburg typically have a higher share than coastal ports of containers handled as a percentage of the ASC deployed. Upstream ports need an elevated cargogenerating effect and good terminal productivity partly to compensate for the time lost when the vessel sails up and down the river. Calling at coastal ports often involves only a little deviation.
Consider the example of the EUl service operated by the Grand Alliance comprising Hapag-Lloyd, Malaysia International Shipping Corporation (MISC), Nippon Yusen Kaisha Line (NYK) and Orient Overseas Container Line (OOCL) (Informa Pk 2007). The computed ASC deployed on this service with reference to equation (1) which turns around in Southampton for the European end of the voyage will be 645,600
TEU, based on the service attributes depicted in Table 27. 1. However, the same service that calls at Singapore will generate twice the amount of ASC, at 1,291,200 TEU, because the service calls at the port on both the eastbound and westbound legs of the voyage.
27.4.2 Assessing inter-port competition and competitiveness by means of ASC information
The information on ASC can be used to analyze container port competition and assess port competitiveness. The argument for this approach stems from the fact that commercially driven shipping lines are assumed to always choose the best bundle of decisions that they can afford. Specifically, the deployment pattern of container shipping services in a particular geographical

PORT COMPETITION AND COMPETITIVENESS 555
Table 27.1 Service attributes of the EUl service of the Grand Alliance
Service attribute type Service attribute value
Port rotation Southampton- Amsterdam- Hamburg- Le Havre-Singapore-Kobe- Nagoya-Tokyo-ShimizuSingapore-Southampton
Trade route Service partners Service frequency Vessels employed
Europe- Far East Hapag-Lloyd, MISC, NYK, OOCL Weekly
Total vessel capacity employed Annualized slot capacity
8 (by NYK) 49,660 TEU 645,600 TEU
region can serve as a rough indication of port competitiveness, because a port which is deemed by shipping lines to be less competitive will attract fewer services than another port located in the same area. Hence, the basic framework of analysis aims to identify changes in liner service routings, and to deduce their impact on container port competition. After that, analyses will be conducted for ASC deployed by liner services that call at each pair of ports in a particular region, in order to identify changes in their connectivity to other trade routes as shipping lines adjust their service schedules to meet changing market conditions.
This method of analysis is depicted by the schematic shown in Figure 27 .1. ASC which calls at the two ports can be divided into three categories:
category A calls exclusively at port "X''; category B calls at both ports; and category C calls exclusively at port "Y."
The presence, extent and development of container port competition can be established by examining variations in the ASC
Port X PortY
Figure 27.1 Framework for analyzing inter-container port relationships for the case of two ports.
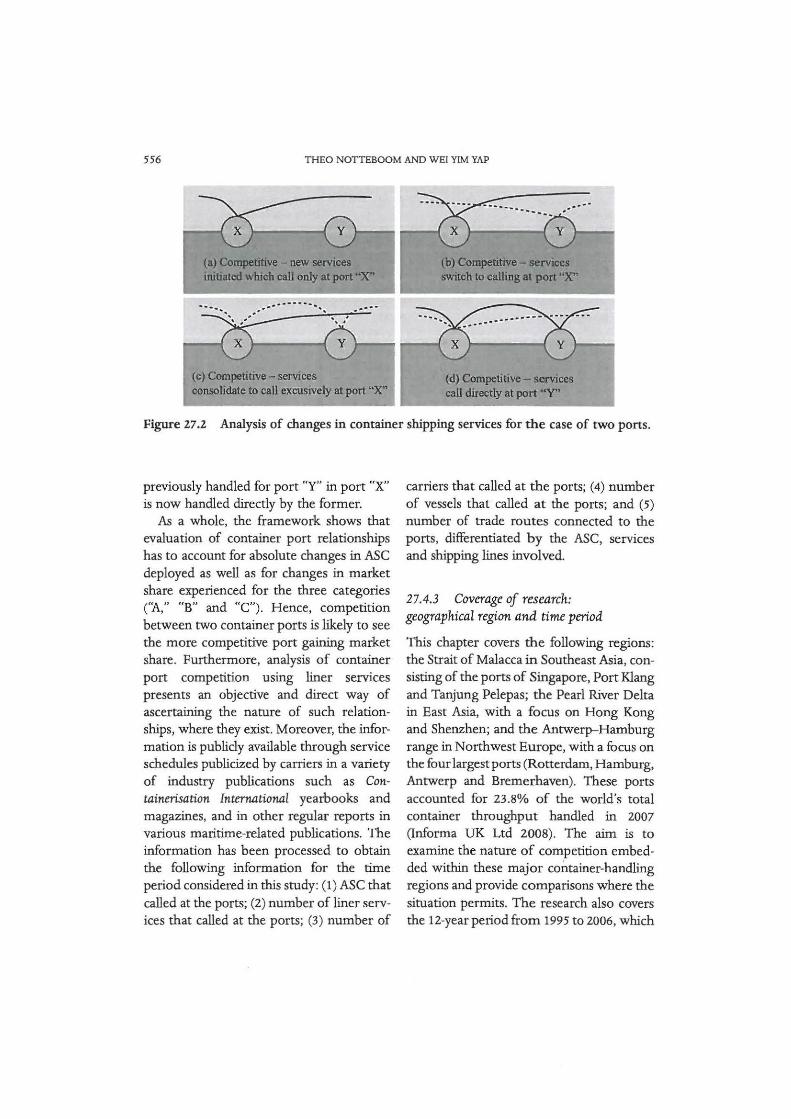
handled in each of the categories. This can be illustrated by the scenarios presented in Figure 27.2.
In the case shown in Figure 27.2(a), new container services operated by the shipping line will lead to an improvement in the ASC deployed under category "A," which is an indication of competition between the two ports. Figures 27.2(b) and 27.2(c) show other indications of scenarios with the presence of port competition which will lead to higher share of ASC for category "/\.' at the expense of categories "B" and "C." As for Figure 27.2(d), the situation will lead to an increase in ASC deployed under category "B." However, this development can be seen as a sign of competition, as cargo that was
556 THEO NOTTBBOOM AND WEI YIM YAP
(a) Competitive - new seMces initiated which call on]y at port "X'"
.................. , .......
(c) Competitive- services consolidate to call excusively at port "X"
(b) Competitive - services swttch to calling at port "X''
(d) Competitive - services call directly at port "Y''
Figure 27.2 Analysis of changes in container shipping services for the case of two ports.
previously handled for port ''Y'' in port "X" is now handled directly by the former.
As a whole, the framework shows that evaluation of container port relationships has to account for absolute changes in ASC
deployed as well as for changes in market share experienced for the three categories ("A," "B" and "C"). Hence, competition between two container ports is likely to see the more competitive port gaining market share. Furthermore, analysis of container port competition using liner services presents an objective and direct way of ascertaining the nature of such relationships, where they exist. Moreover, the information is publicly available through service schedules publicized by carriers in a variety of industry publications such as Containerisation International yearbooks and magazines, and in other regular reports in various maritime-related publications. 1be information has been processed to obtain the following information for the time period considered in this study: (1) A.SC that called at the ports; (2) number of liner services that called at the ports; (3) number of
carriers that called at the ports; (4) number of vessels that called at the ports; and (5) number of trade routes connected to the ports, differentiated by the A.SC, services and shipping lines involved.
27.4.3 Coverage of research: geographical region and time period
1bis chapter covers the following regions: the Strait of Malacca in Southeast Asia, consisting of the ports of Singapore, Port Klang and Tanjung Pelepas; the Pearl River Delta in East Asia, with a focus on Hong Kong and Shenzhen; and the Antwerp-Hamburg range in Northwest Europe, with a focus on the four largest ports (Rotterdam, Hamburg, Antwerp and Bremerhaven). These ports accounted for 23.8% of the world's total container throughput handled in 2007 (Informa UK Ltd 2008). The aim is to examine the nature of competition embedded within these major container-handling regions and provide comparisons where the situation permits. The research also covers the 12-year period from 1995 to 2006, which

PORT COMPETITION AND COMPETITIVENESS 557
includes the scene before the formation of shipping alliances up to the latest major developments in the liner shipping industry, namely the acquisitions of P&O Nedlloyd by Maersk, Delmas by CMA-CGM, and CP Ships by Hapag-Lloyd.
27 .5 Research Findings
2 7. 5 .1 Port competition and competitiveness in the Strait of Malacca
Container ports in Southeast Asia handled 64.0 million TEU in 2007, of which 63.3% was accounted for by the three largest container ports in the region, Singapore, Port Klang and Tanjung Pelepas (Informa UK Ltd 2008). Singapore remains the market leader in the region, but saw its market share in the port sample decrease from about 90% in the mid-1990s to around 70% at the end of the observation period. The Malaysian ports increased their joint market share (Figure 27.3).
2500 -+-Singapore
2000 - -e-Port Klang
-i!r-Tanjung Pclepas
1500
,er,
t I
1000
500
> 19951
0 1995-1998
\A, F ;r
003-200~ 1998
In 2006, the three ports were connected to 21 trade routes, which saw 105.8 million TEUs of ASC deployed by 96 shipping lines in 344 shipping services. Most of the ASC that called at the selected container ports consisted of capacity deployed on east-west trade routes connecting Europe and the Mediterranean with East Asia. This was followed by the ASC deployed within Southeast Asia and then by that which plied between East Asia and the Middle East.
Analysis of container port competition in Southeast Asia revealed that the greatest intensity of competition occurred between Singapore and Port Klang, followed by Singapore and Tanjung Pelepas (Table 27.2). Specifically, container terminal operators in these ports sought to position themselves as important links within value chains that connect Southeast Asia to other parts of the world, primarily East Asia and Europe. This led to container port competition in three areas., The first focus was on attracting major carriers to hub their transshipment operations at the terminals, while the
2003 2006 1
~
199 1998 ~
r ~
\J 0% 10% 20% 30% 40% 50% 60% 70% 80% 90% 100%
Average market share (three-year periods)
Figure 27.3 Evolution of market share and average annual growth based on annual throughput in TEU.

558 THEO NOTTEBOOM AND WEI YIM YAP
Table 27.2 ASC affected by inter-port competition in the Malacca Strait
Competing Europe-Far East % Mediterranean- Far % Intra-Southeast %
port pairs• ('OOO TEUs) share East ('OOO TEUs) share Asia ('OOO TEUs) share
SNGvs. PKL 27,756 46.2 15,122 65.5 9,356 48.6
SNGvs. PTP 21,270 35.4 2,977 12.9 8,160 42.4
PKL vs. PTP 10,988 18.3 4,998 21.6 1,745 9.1
Total 60,014 99.9 23,097 100.0 19,261 010.1
' PKL denotes Port Klang, PTP Tanjung Pelepas and SNG Singapore.
Source: Authors' computation.
second was on targeting specific services, operated by specific carriers or alliances, that aimed at strengthening the level of connectivity to specific trade routes and regions. This development resulted in inter-container port dynamics being influenced to a large extent by the hubbing decisions of mainline operators of container shipping alliances, as well as those of independent carriers which included Maersk Line, MSC, CMA-CGM, Evergreen and CSCL. The third objective was to encourage shippers located in southern Malaya to handle their containers through either of the ports. On the whole, the main objective is to capture the largest possible share of the transshipment traffic, as such containers are seen to provide stronger growth opportunities than local containers.
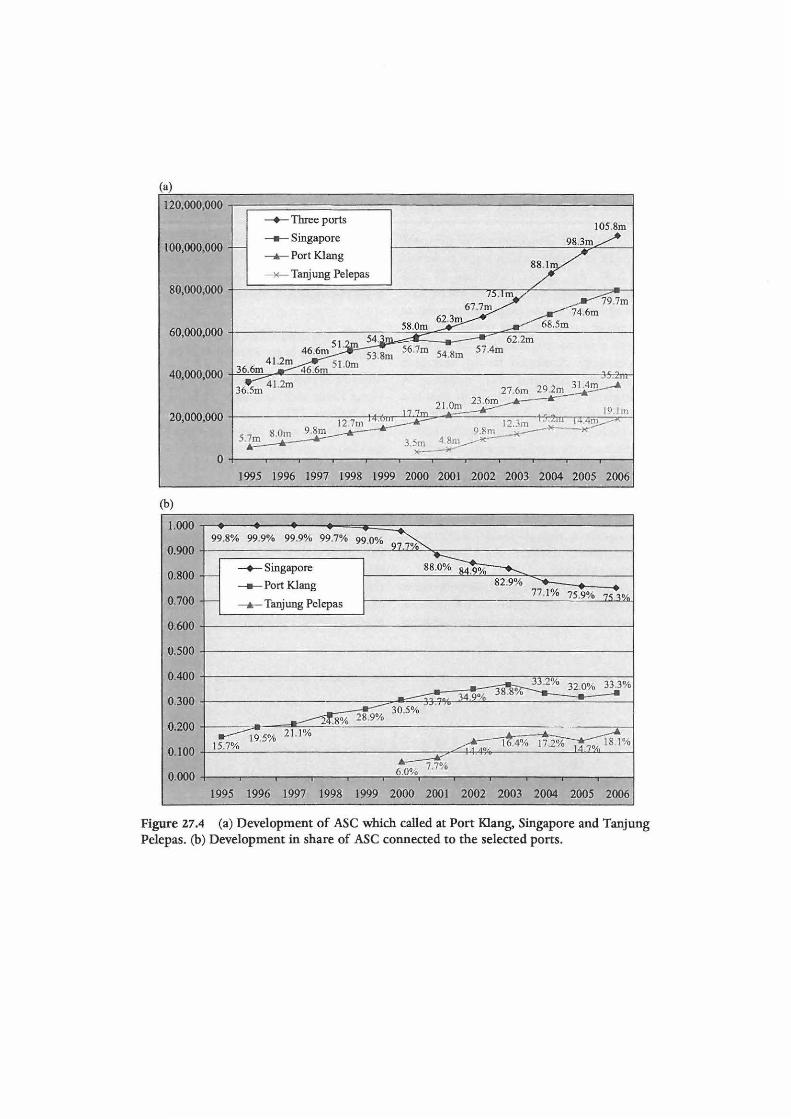
The impact of the emergence of Port Klang and Tanjung Pelepas as competitive alternatives to Singapore could also be seen in the share of ASC received by Singapore, which fell from almost 100% in the years before 2000 to 75.3% by 2006 (Figures 27.4(a) and 27.4(b)). In direct contrast to Singapore, Port Klang saw its share of ASC rise from 15.7% in 1995 to a peak of 36.8% in 2003, before declining to 33.3% in 2006. The rise in ASC was attributed to an increas-
ing number of shipping lines, such as members of the Grand Alliance, Hanjin, COSCO and Evergreen, which chose to schedule some of their capacity to call at both Port Klang and Singapore in the same service instead of calling exclusively at the latter. In addition, the decision by CMACGM and CSCL to relocate their operational hubs in Southeast Asia to Port Klang from Singapore contributed substantially to the increase in ASC received from 2001 onwards and helped to boost the port's connectivity for the Europe-Far East and Mediterranean- Far East trade routes. As a whole, these developments had the effect of siphoning off cargo which would otherwise have been handled at Singapore. However, the decline experienced after 2003 was attributed to new services, initiated by MSC, PIL, the CHKY Alliance and New World Alliance, which chose to call only at Singapore. This development also caused the share of ASC that called at Tanjung Pelepas to dip in 2005. Nonetheless, the port quickly recovered and its share of ASC reached a new high at 18.1% in 2006 as the acquisition of P&O Nedlloyd by Maersk saw a majority of the farmer's services reorganized to call at Tanjung Pelepas instead of Singapore.
(a)
120,000,000 i--:===============::::;-- ---------------i -+-Three ports
105.8m
100,000,000 -Singapore
--..-.. Port Klang
- x-Tanjung Pelepas
1995 1996 1997 1998 1999 2000 2001 2002 2003 2004 2005 2006
(b)
l.000 . T ~
99.0% Q~ 99.8% 99.9% 99.9% 99.7% 0.900
88~% -+-Singapore 0.800
-.........._ ,_____ 82.9% - Port Klang ---- .
77.1% 75.9% 7'\ ; % 0.700 - --..-.. Tanjung Pelepas
0.600
0.500
o.400 - --- 33.2% 32.0% 33.3%
~ .. 149% 38.8% - ~
0.300 -30.5% ~~· .•
...--2?.8% 28.9% 0.200 21.1% . . ___ __...
19.5% 15.7% ~o 164% 172% 1770,1,, lS. l %
0.100 . ~ - 77% 0.000 6.0~0
1995 1996 1997 1998 1999 2000 2001 2002 2003 2004 2005 2006
Figure 27.4 (a) Development of ASC which called at Port Klang, Singapore and Tanjung Pelepas. (b) Development in share of ASC connected to the selected ports.
560 THEO NOTTEBOOM AND WEI YIM YAP
In the case of Tanjung Pelepas, the decision by Maersk to invest in a 30 percent stake in the port resulted in the relocation of its hub from Singapore to the port, and the shift in capacity, which began at the end of 2000, was largely completed by mid-2001. As Maersk Line operated several services which connected Singapore to many of the major east- west trade routes, the move led to a permanent reduction in the share of capacity accounted for by Singapore from 2001 onwards. The decision by Evergreen to emulate Maersk in 2002 saw the gap in market share widen, especially for trade routes connecting the Far East to Europe and the Mediterranean. In addition, Evergreen's move to Tanjung Pelepas resulted in most of its mainline services being rescheduled to call at that port instead of at Port Klang. This development led to the significant changes in ASC attributed to competition between Port Klang and Tanjung Pelepas.
As a whole, hubbing decisions by mainline operators had a significant influence on competition dynamics between major ports
;:J 3500
~ 3000 0 0 0 ,,.-..
2500 ...... "' c "O ·- .g ~& 2000 0 ....
bh ~ 1500 ~ ~ §] 1000 "'~ a> 500 ~ .... a> 0
,r:\ I
I J
r d'
1995- 998
in the Malacca Strait. While the beginning of the period in 1995 saw Singapore the dominant player, the end of the period in 2006 witnessed Port Klang and Tanjung Pelepas gaining competitiveness and becoming competitive alternatives for transshipment operations in the region.
27.5.2 Port competition and competitiveness in the Pearl River Delta
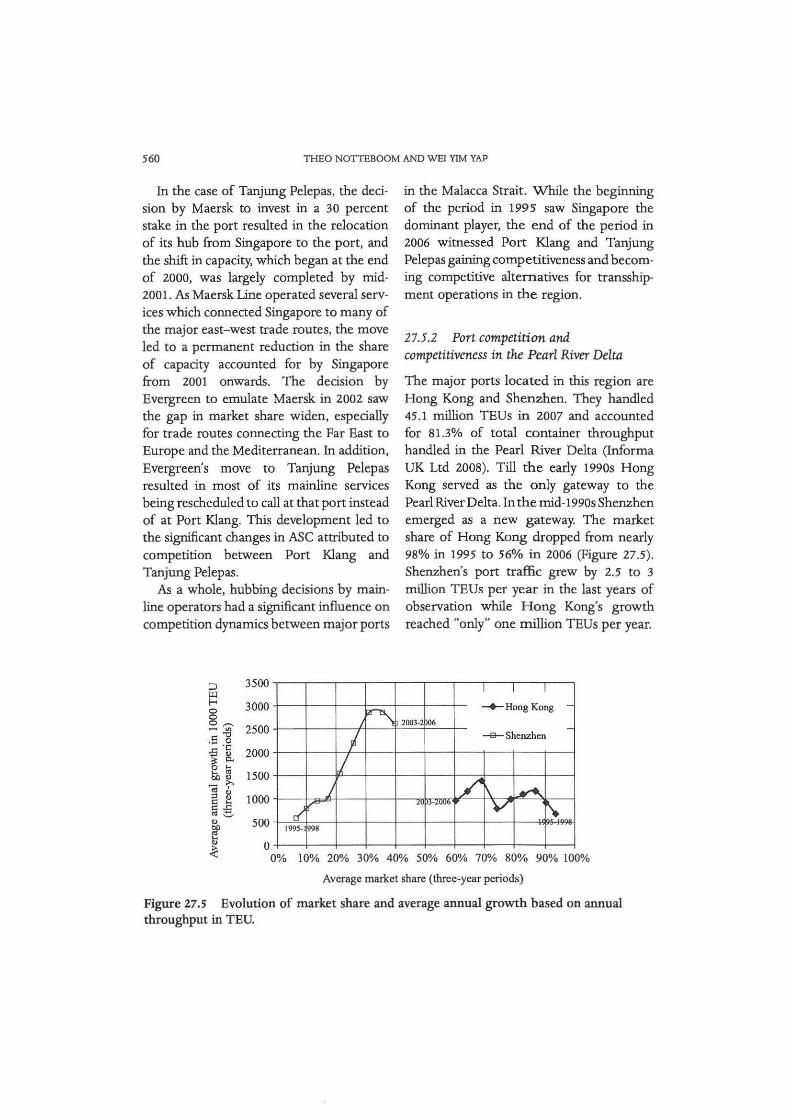
The major ports located in this region are Hong Kong and Shenzhen. They handled 45 .1 million TEUs in 2007 and accounted for 81.3% of total container throughput handled in the Pearl River Delta (Informa UK Ltd 2008). Till the early 1990s Hong Kong served as the only gateway to the Pearl River Delta. In the mid-1990s Shenzhen emerged as a new gateway. The market share of Hong Kong dropped from nearly 98% in 1995 to 56% in 2006 (Figure 27.5). Shenzhen's port traffic grew by 2.5 to 3 million TEUs per year in the last years of observation while Hong Kong's growth reached "only" one million TEUs per year.
I I I
-+-Hong Kong -0 2003-2 po6 -
-e-Shenzhen
/\ ......... '°""" "~-4-\IUV v \ ·-
~ 0% 10% 20% 30% 40% 50% 60% 70% 80% 90% 100%
Average market share (three-year periods)
Figure 27.5 Evolution of market share and average annual growth based on annual throughput in TEU.

PORT COMPETITION AND COMPETITIVENESS 561
In 2006, the container ports of Hong Kong and Shenzhen saw 113 .6 million TEUs of ASC deployed by 90 shipping lines in 314 shipping services. Unlike the scenario for Southeast Asia, which received a spread of ASC from east- west, north-south and intraregional services, the situation faced by Hong Kong and Shenzhen saw two-thirds of capacity that called at these ports accounted for by east- west trades. The largest of these was the transpacific trade with a share of 33. 7%. This was followed by the Europe- Far East trade and Southeast Asia- Far East trade.
As with the situation for the Strait of Malacca, Figures 27.6(a) and 27.6(b) also show that while the dominant port, Hong Kong, was able to attract 100% of the capacity at the beginning, its share began to decline from 1998 as more shipping lines chose to call direct at Shenzhen. This phenomenon was attributed to two major developments. First, the lack of investment in major container-handling facilities between the completion of Container Terminal 8 (CT8) in 1994 and that of CT9 in 2003 led to container terminals in Hong Kong becoming congested and expensive. For example, the terminal handling charge levied on a container by the Intra-Asian Discussion Agreement for Hong Kong rose from HK$600 in July 1992 to HKSl,200 in January 1995, and reached HK$1,800 by June 1998 (Drewry Shipping Consultants 2003). Capacity utilization for container terminals at the port also reached 95.8% in 2001 (Ocean Shipping Consultants Ltd 2003).
Second, the presence of international terminal operators in Shenzhen contributed to improved confidence on the part of port users and persuaded an increasing number of shipping lines to route more of their services to call there. These developments
resulted in Hong Kong's share of capacity falling to 85.1 % by 2006. Nonetheless, the port continued to receive the bulk of capacity that called in the region, with many of the services making parallel calls at Shenzhen in the same schedule. This development also contributed significantly towards boosting the share of capacity received by Shenzhen from 5.3% in 1995 to 64.9% in 2006.
Containers are handled mainly at six facilities, Kwai Tsing Container Terminals and River Trade Terminals in Hong Kong, and Yantian, Chiwan, Shekou and Mawan in Shenzhen. Examination of the terminals revealed several of the operators to be located in a number of facilities in both ports. For example, Modern Terminals Limited has a presence in Kwai Tsing, Shekou, Chiwan and Mawan, whereas Hutchison Port Holdings is simultaneously present in Kwai Tsing, River Trade Terminals . and Yantian. The proximity of these terminals suggests the presence of a high level of inter- as well as intra-container port competition, where container terminal operators in the two ports actively sought to position themselves as important links for value chains that connect Southern China with major markets in other parts of the world.
Table 27.3 shows that the amount of ASC affected by competition between the two ports was largest for the transpacific trade, followed by the Europe- Far East and Southeast Asia-Far East trades. Empirical evidence also showed that although Hong Kong dominated the container shipping scene by attracting, in most cases, more than 90% of ASC deployed to call exclusively at the port in 1995, the end of the period in 2006 saw the share of ASC received by Shenzhen for the transpacific and Mediterranean- Far East trade routes

(a)
---.-- Two ports
100,000,000 -Hong Kong
--...- Shenzhen
60,000,000
(b)
I.OOO
0.900
0.800
0.700
0.600
0.500
0.400
0.300
0.200
0.100
0.000
2. lm 5.3%
o.j.....:..:..l:'.=:~::::::;..-=.-,-~-.--~..----.~----.-~-,-~-.-~-.-~.-----l
1995 1996 1997 1998 1999 2000 2001 2002 2003 2004 2005 2006
T T T T T
993% T
100% 100% 100% 100% 99.9% 99.4% 96.7% Q')~
,...___ __.__Hong Kong 89.7% 882% 85.1%
- Shenzhen o ... ,,,.
56.5% 59.6~
~ y 40.0°
29.7% ~-
11.<% 2iy
7.4% 10.0~ 5.~
1995 1996 1997 1998 1999 2000 2001 2002 2003 2004 2005 2006
Figure 27.6 (a) Development of total ASC which called at Hong Kong and Shenzhen (in TEU). (b) Development in share of ASC connected to the selected ports.

PORT COMPETITION AND COMPETITIVENESS 563
exceeding that which called at Hong Kong. Specifically, Shenzhen was receiving more capacity than Hong Kong for two of the three largest east-west trades connected to the region. This is an important achievement given that two-thirds of capacity that called at the region was generated from such trades.
The basis for Shenzhen's strong performance was attributed to the period between 1996 and 2001, which saw many carriers beginning to include the port in their port rotation in addition to Hong Kong. The norm was to pair Hong Kong up with one of the terminals in Shenzhen. This would be considered a positive development for
Table 27.3 ASC affected by inter-port competition in the Pearl River Delta
Major trade routes
Transpacific Europe- Far East Southeast Asia-Far East
HKGvs. SEZ ('OOO TEUs)°
57,898
27,329
25,328
• HKG denotes Hong Kong and SEZ Shenzhen. Source: Authors' computation.
Shenzhen, because users of the port would benefit in terms of improved connectivity and a larger choice of shipping lines to choose from. Economies of scale and scope generated from higher traffic volumes also led to lower cost per TEU handled, for both shippers and shipping lines.
As a whole, a comparison of container shipping statistics for the two ports in Table 27.4 revealed that Hong Kong remained very much the focus of service schedules operated by major container shipping lines. While Shenzhen received calls from 153
container shipping services, operated by 41
shipping lines, comparative figures for Hong Kong were significantly higher. There are fewer services where carriers will call only at Shenzhen, and the norm was to pair Hong Kong up with one of the terminals in Shenzhen. In fact, only 24 services called exclusively at Shenzhen, the rest making parallel calls at Hong Kong as well. By comparison, 158 shipping services called exclusively at Hong Kong. Nonetheless, most of those which called at Shenzhen were mainline services and tended to involve bigger vessels, thereby generating higher ASC. In fact, Table 27.4 shows that the average size
Table 27.4 Comparison of container shipping statistics between Hong Kong and Shenzhen (2006)
Statistic Hong Kong Shenzhen
Container throughput (TEUs) 23,539,000 18,468,900 Shipping services 290 153 Shipping lines 90 41 Ports connected to 268 193 Annualized slot capacity (TEUs) 48,359,870 36,887,300 Vessel capacity (TEUs) 4,691 ,223 4,102,802 Vessels 1,361 948 Average vessel size (TEUs) 3,447 4,328
Source: lnforma Pk (2007).

564 THEO NOTTEBOOM AND WEI YIM YAP
of vessels received by Shenzhen was 25 .6% larger than those calling at Hong Kong.
However, empirical evidence had shown that Shenzhen was able to make strong gains on the major east-west trade routes. Specifically, the development of calling patterns at both container ports showed that most carriers called at both Shenzhen and Hong Kong in order to pick up direct cargo at the former, and direct with an increasing share of transshipment cargoes fed from surrounding regions at the latter. Hence, although Hong Kong was able to retain a sizable feeder network, which has supported its premier hub status in the Pearl River Delta thus far, it runs the risk of losing a significant share of the feeder business should these services follow their mainline counterparts by relocating to Shenzhen.
27.5.3 Port competition and competitiveness in the Antwerp-Hamburg range
The ports of Rotterdam, Hamburg, Antwerp and Bremerhaven handled 33.8
~ 1000
E-< 900 ,.___ -+-Antwerp
0 800 0
0,-... >- -e- Rotterdam
- Cll 700 .s] ..c: .... 600 ~ ~ 500 6b ~
- ;>.. 400 ~ 0
- -&-- Hamburg -~ Bremerhaven
2003·2 ~06
' ~
million TEUs, or 59.3% of all containers handled in Northwest Europe in 2007 (Informa UK Ltd 2008). The period 1995-2006 was characterized by a gradual decrease in Rotterdam's market share, mainly caused by poor traffic growth in the late 1990s (see Figure 27.7). Hamburg seems to have benefited most from this situation, while Antwerp also improved its market position vis-a-vis its neighboring rival. Despite the later traffic boom in Rotterdam of about 1 million TEUs per year, the main Dutch port was not able to increase its market share.
In 2006, the four ports saw 64.1 million TEUs of ASC deployed by 162 shipping lines in 413 shipping services. The profile of ASC deployed consisted mainly of capacity operating on the major east- west trades. Such capacity accounted for 35.5 million TEUs, or 55.4% of all ASC supplied. The remaining capacity was made up of shipping services connecting to various regions within Western and Northern Europe. The largest of the trades that called at the selected container ports was the Europe-
2!03-2~ l
/,~ -'~ 1' l l
2003-2006 i • i
• ~ Jl' I
1995-1998 i:l I!) 300 §! ) )
v 1995-19~8 " \ T 200 I!)
"'° ~ 100 I!)
~ 0
L
j ~ 1995-199 I 995-1998 v
0% 5% 10% 15% 20% 25% 30% 35% 40% 45%
Average market share (three-year periods)
Figure 27.7 Evolution of market share and average annual growth based on annual throughput in TEU.
PORT COMPETITION AND COMPETITIVENESS 565
Far East trade. This was followed by the intra-Europe and transatlantic trades.
A number of operators of container terminal facilities located in the selected ports operate terminals in other ports. For example, Eurogate has facilities in Bremerhaven and Hamburg while PSA International has operations in Antwerp (and Zeebrugge) and operates a small container facility in Rotterdam. APM Terminals of the Maersk group operates large dedicated facilities in Bremerhaven and Rotterdam (and also in Zeebrugge), whereas MSC operates the MSC Home Terminal in Antwerp Uoint venture with PSA) and a similar facility in Bremerhaven. In addition, DP World operates several terminals in Antwerp and is expected to start operations at Rotterdam's Maasvlakte 2 in 2013. If we include new projects scheduled to come on-stream by 2013, the sample includes CMA-CGM (Antwerp and Rotterdam). Furthermore, the four largest European container shipping lines (Maersk, MSC, CMA-CGM and Hapag-Lloyd) are also found to have shareholding interests in these ports. Hence, the proximity of these facilities and operators suggests the presence of a high level of inter- as well as intra-container-port competition, where container terminal operators in these ports actively sought to position their facilities as important links within value chains that connect Europe and major markets in Asia and North America.
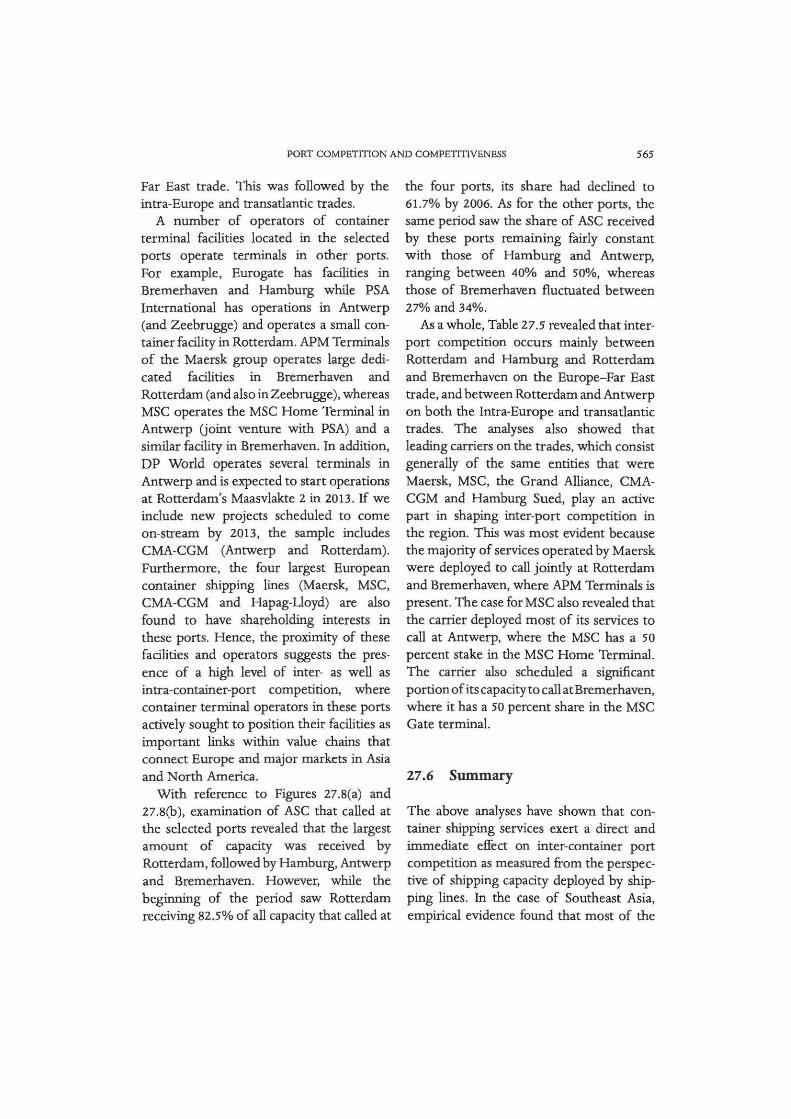
With reference to Figures 27.B(a) and 27.B(b), examination of ASC that called at the selected ports revealed that the largest amount of capacity was received by Rotterdam, followed by Hamburg, Antwerp and Bremerhaven. However, while the beginning of the period saw Rotterdam receiving 82.5% of all capacity that called at
the four ports, its share had declined to 61.7% by 2006. As for the other ports, the same period saw the share of ASC received by these ports remaining fairly constant with those of Hamburg and Antwerp, ranging between 40% and 50%, whereas those of Bremerhaven fluctuated between 27% and 34%.
As a whole, Table 27.5 revealed that interport competition occurs mainly between Rotterdam and Hamburg and Rotterdam and Bremerhaven on the Europe-Far East trade, and between Rotterdam and Antwerp on both the Intra-Europe and transatlantic trades. The analyses also showed that leading carriers on the trades, which consist generally of the same entities that were Maersk, MSC, the Grand Alliance, CMACGM and Hamburg Sued, play an active part in shaping inter-port competition in the region. This was most evident because the majority of services operated by Maersk were deployed to call jointly at Rotterdam and Bremerhaven, where APM Terminals is present. The case for MSC also revealed that the carrier deployed most of its services to call at Antwerp, where the MSC has a 50 percent stake in the MSC Home Terminal. The carrier also scheduled a significant portion of its capacity to call at Bremer haven, where it has a 50 percent share in the MSC Gate terminal.
27 .6 Summary
The above analyses have shown that container shipping services exert a direct and immediate effect on inter-container port competition as measured from the perspective of shipping capacity deployed by shipping lines. In the case of Southeast Asia, empirical evidence found that most of the
(a)
70,000, 000 -+- Four ports
- Rorrerdam 64.lm
60,000, 000 -+- Hamburg
-- Antwerp
50,000,000 - Bremerhaven
8.2m 8.5m 8.5m
1995 1996 I 997 I 998 1999 2000 200 I 2002 2003 2004 2005 2006
(b)
90.0 82.5% 82.3%
80.0
70.0 - Hamourg
60.0 -+-Antwerp
--Bremerhaven
50.0
40.0
30.0 ~
30.8% 29.7% 29.1% 28.6% 31.8% 31.4%
20.0 1995 1996 1997 1998 1999 2000 2001 2002 2003 2004 2005 2006
Figure 27.8 (a) Development of ASC that called at the selected ports in Northwest Europe (in TEU). (b) Development in share of ASC connected to the selected ports.

PORT COMPETITION AND COMPETITIVENESS 567
Table 27.5 ASC affected by inter-port competition in the Antwerp-Hamburg range
Competing port Europe-Far East % share Intra-Europe % Transatlantic % share pairs• ('OOO TEUs) ('OOO TEUs) share ('OOO TEUs)
ROTvs. HMB 13,677 26.0 6,174 20.8 6,096 13.8 ROTvs.ANT 8,982 17.1 7,209 24.2 11,550 26.2
ROTvs. BMN 12,790 24.3 5,006 16.8 7,017 15.9
HMBvs. ANT 6,938 13.2 2,769 9.3 8,186 18.5
HMBvs. BMN 3,297 6.3 5,304 17.8 4,863 11.0
ANTvs. BMN 6,965 13.2 3,276 11.0 6,431 14.6
Total 52,650 100.1 29,738 99.9 44,143 100.0
'ANT denotes Antwerp, BMN Bremen/ Bremerhaven, HMB Hamburg and ROT Rotterdam. Source: Authors' computation.
competition occurs between Singapore and Port Klang, followed by Singapore and Tanjung Pelepas. While Singapore was found to remain the port which received most of the shipping calls in the region, the increasing competitiveness of Port Klang and Tanjung Pelepas saw both ports slowly gaining on the incumbent's market share.
In the Pearl River Delta, port competition saw Shenzhen being included in an increasing number of services that used to call exclusively at Hong Kong, which resulted in container traffic being handled directly at the port. The presence of Hutchison Port Holdings and Modern Terminals Limited in a number of facilities in both ports could also contribute to interas well as intra-port competition, as these container terminal operators seek to position their facilities as important links in value chains that connect Southern China and major markets in the world.
Turning to Northwest Europe, inter-port competition between Rotterdam, Hamburg, Antwerp and Bremerhaven caused the changes in ASC to be distributed fairly evenly rather than being concentrated on specific port pairs as in Southeast Asia (i.e.,
Singapore versus Port Klang, and Singapore versus Tanjung Pelepas). The analyses also showed that inter-port competition occurred mainly between different port pairs for different trades. Specifically, inter-port competition was found to occur mainly between Rotterdam and Hamburg and Rotterdam and Bremerhaven on the Europe- Far East trade, and Rotterdam and Antwerp on both the Intra-Europe and transatlantic trades.
As a whole, although container port competition and competitiveness had formerly been analyzed from a variety of perspectives and in great detail, very few studies had attempted to integrate the liner shipping aspects of the business with the port. Hence, this chapter has attempted to address this by delving into the details of service schedules and port calls while investigating the competitive dynamics between container ports. Specifically, the research has shown that analyses of relationships between container ports should not be conducted at an aggregated level. As every market served by each port involves different decision makers, regions, routes, cargoes and shipping lines, it is unlikely that one port will compete with another across the
568 THEO NOTTEBOOM AND WEI YlM YAP
whole spectrum of variables and sectors. Hence, the aim has been to draw decision makers' attention to the need to identify the extensity and intensity of such relationships in order to craft and implement decisions with greater precision.
The research findings presented were based primarily on evidence provided by container shipping services that called at the selected ports between 1995 and 2006. The merits of this approach have been discussed. However, the research findings can be complemented with other information and perspectives beyond the supply dimension to include capacity development and considerations from the demand side. Specifically, the analyses were conducted at the level of the container port. Thus, examination of inter-container port competition from the perspective of individual shipping lines and terminal operators for each container port may uncover greater insights into the market structure, the nature of relationships, and the level of competitiveness as differentiated by cost and price. Furthermore, future research could also take into account a larger sample size of ports. Hence, future research on this issue that is able to address these concerns should offer deeper insights into the dynamics of relationships between container ports and port competitiveness.
References
Aversa, R., R. C. Botter, H. E. Haralambides and H. T. Y. Yoshizaki (2005) A mixed integer programming model on the location of a hub port in the east coast of South America. Maritime Economics and Logistics 7(1): 1- 18.
Bichou, K. and M. G. H. Bell (2007)
Internationalisation and consolidation of the container port industry: assessment of
channel structure and relationships. Maritime Economics and Logistics 9(1): 35-51.
Bichou, K. and R. Gray (2005) A critical review of conventional terminology for classifying seaports. Transportation Research Part A 39(1): 75- 92.
Cullinane, K., T. F. Wang and S. Cullinane (2004)
Container terminal development in mainland China and its impact on the competitiveness of the port of Hong Kong. Transport Reviews 24(1): 33- 56.
De Langen, P. W. (2002) Clustering and performance: the case of maritime clustering in the Netherlands. Maritime Policy and Management 29(3): 209-21.
Drewry Shipping Consultants (2003) Intra-Asia container trades: dynamism beyond bounds. London: Drewry Shipping Consultants Ltd.
Garcia-Alonso, L. and M. Martin-Bofarull (2007)
Impact of port investment on efficiency and capacity to attract traffic in Spain: Bilbao versus Valencia. Maritime Economics and Logistics 9(3): 254--67.
Gouvernal, E., ]. Debrie and B. Slack (2005)
Dynamics of change in the port system of the Western Mediterranean. Maritime Policy and Management 32(2): 107-21.
Guy, E. and B. Urli (2006) Port selection and multicriteria analysis: an application to the Montreal-New York alternative. Maritime Economics and Logistics 8(2): 169- 86.
Haezendonck., E. and T. Notteboom (2002) The competitive advantage of seaports. In M. Huybrechts, H. Meersman, E. Van de Voorde, E. Van Hooydonk, A. Verbeke and W.
Wmkelmans (eds.), Port Competitiveness: An Economic and Legal Analysis of the Factors Determining the Competitiveness of Seaports, pp. 67-88. Antwerp: De Boeck.
Heaver, T. (1995) The implications of increased competition among ports for port policy and management. Maritime Policy and Management 22(2): 125-34.
Heaver, T., H. Meersman, F. Moglia and E. Van de Voorde (2000) Do mergers and alliances influence European shipping and port compe-
PORT COMPETITION ANO COMPETITIVENESS 569
tition? Maritime Policy and Management 27(4): 363- 73.
Informa Pie (2007) Containerisation International Yearbook 2001. London: Informa UK Ltd.
Informa UK Ltd (2008) Container Traffic. www.ci-online.co.uk. (accessed March 17, 2008).
Jara-Diaz, S.R., C. Cortes and F. Ponce (2001) Number of points served and economies of spatial scope in transport cost functions. journal of Transport Economics and Policy 35(2): 327-42.
Urn, T. C., H. A. Thanopoulou, M . ]. Beynon and A. K. C. Beresford (2004) An application of AHP on transhipment port selection: a global perspective. Maritime Economics and Logistics 6(1 ): 70-91.
Luo, M. and T. A. Grigalunas (2003) A spatialeconomic multimodal transportation simulation model for US coastal container ports. Maritime Economics and Logistics 5(2): 158-78.
Marcadon, ]. (1999) Containerisation in the ports of Northern and Western Europe. Geojournal 48: 15-20.
Notteboom, T. (2001) Spatial and functional integration of container port systems and hinterland networks in Europe. In ECMT, Land Access to Sea Ports, pp. 5-55. Paris: Economic Research Centre, European Conference of Ministers of Transport.
Notteboom, T. E. (2002) The interdependence between liner shipping networks and intermodal networks. Proceedings of the Annual Conference of the International Association of Maritime Economists (IAMB), Panama City, November 13- 15, 2002.
Notteboom, T. (2007) Spatial dynamics in the container load centres of the Le HavreHamburg range. Zeitschrift far Wirtschaftsgeographie 51: 108-23.
Notteboom, T. (2009a) Complementarity and substitutability among adjacent gateway ports. Environment and Planning A 41(3): 743-62.
Notteboom, T. (2009b) The relationship between seaports and the intermodal hinterland in
light of global supply chains: European challenges. In OECD /ITF, Port Competition and Hinterland Connections, pp. 25- 75. Round Table no. 143. Paris: OECD, International Transport Forum.
Notteboom, T., C. Coeck and]. Van den Broeck (2000) Measuring and explaining the relative efficiency of container terminals by means of Bayesian stochastic frontier models. International journal of Maritime Economics 2(2): 83- 106.
Notteboom, T. E. andJ-P. Rodrigue (2005) Port regionalisation: towards a new phase in port development. Maritime Policy and Management 32(3): 297-313.
Notteboom, T. E. and W Winkelmans (2001) Structural changes in logistics: How will port authorities face the challenge? Maritime Policy and Management 28(1): 71- 89.
Ocean Shipping Consultants Ltd (2003) World Containerport Outlook to 2015. Chertsey, Surr.: Ocean Shipping Consultants Ltd.
Robinson, R. (2002) Ports as elements in valuedriven chain systems: the new paradigm. Maritime Policy and Management 29(3): 241- 55.
Slack, B., C. Comtois and R. McCalla (2002) Strategic alliances in the container shipping industry: a global perspective. Maritime Policy and Management 29(1): 65- 76.
Slack, B. and A. Fremont (2005) Transformation of port terminal operators: from the local to the global. Transport Reviews 25(1): 117-30.
Tongzon, J. and W Heng (2005) Port privatisation, efficiency and competitiveness: some empirical evidence from container ports (terminals). Transportation Research Part A 39: 405- 24.
Trujillo, L. and B. Tovar (2007) The European port industry: an analysis of its economic efficiency. Maritime Economics and Logistics 9(2): 148- 71.
Van de Voorde, E. and W Winkelmans (2002) A general introduction to port competition and management. In M. Huybrechts, H . Meersman, E. Van de Voorde, E. Van
570 THEO NOTTEBOOM AND WEI YIM YAP
Hooydonk, A. Verbeke and W. Winkelmans (eds.), Port Competitiveness: An Economic and Legal Analysis of the Factors Determining the Competitiveness of Seaports, pp. 1-16. Antwerp: De Boeck.
Veldman, S.j., E. H. Btickmann and R. N. Saitua (2005) River depth and container port market shares: the impact of deepening the Scheidt River on the West European container hubport market shares. Maritime Economics and Logistics 7(4): 336- 55 .
Winkelmans, W., T. Notteboom (2007) Port master planning: balancing stakeholders' interests. In K.. Dobrowolski and ]. Zurek (eds), The Reality and Dilemmas of Globalization, pp. 395-408. Gdansk: Foundation for the Development of Gdansk University.
Yap, W. Y. and J. S. L. Lam (2004) An interpretation of inter-container port relationships
from the demand perspective. Maritime Policy and Management 31(4): 337-55.
Yap, W. Y. andJ. S. L. Lam (2006a) Competition dynamics between container ports in East Asia. Transportation Research Part A 40: 35- 51.
Yap, W. Y. and]. S. L. Lam (2006b) A measurement and comparison of cost competitiveness of container ports in Southeast Asia. Transportation 33: 641-54.
Yap, W. Y.,]. S. L. Lam and T. E. Notteboom (2006) Developments in container port competition in East Asia. Tran.sport Reviews 26: 167- 88.
Zeng, Z. B. and Z. Yang (2002) Dynamic programming of port position and scale in the hierarchized container ports network. Maritime Policy and Management 29(2): 163-77.