Porphyry Copper Deposit Model
186
U.S. Department of the Interior U.S. Geological Survey Scientific Investigations Report 2010–5070–B Porphyry Copper Deposit Model
-
Upload
remote-sensing-geoimage -
Category
Technology
-
view
7.448 -
download
8
description
Porphyry Copper Deposit Model
Transcript of Porphyry Copper Deposit Model
U.S. Department of the InteriorU.S. Geological Survey
Scientific Investigations Report 2010–5070–B
Porphyry Copper Deposit Model

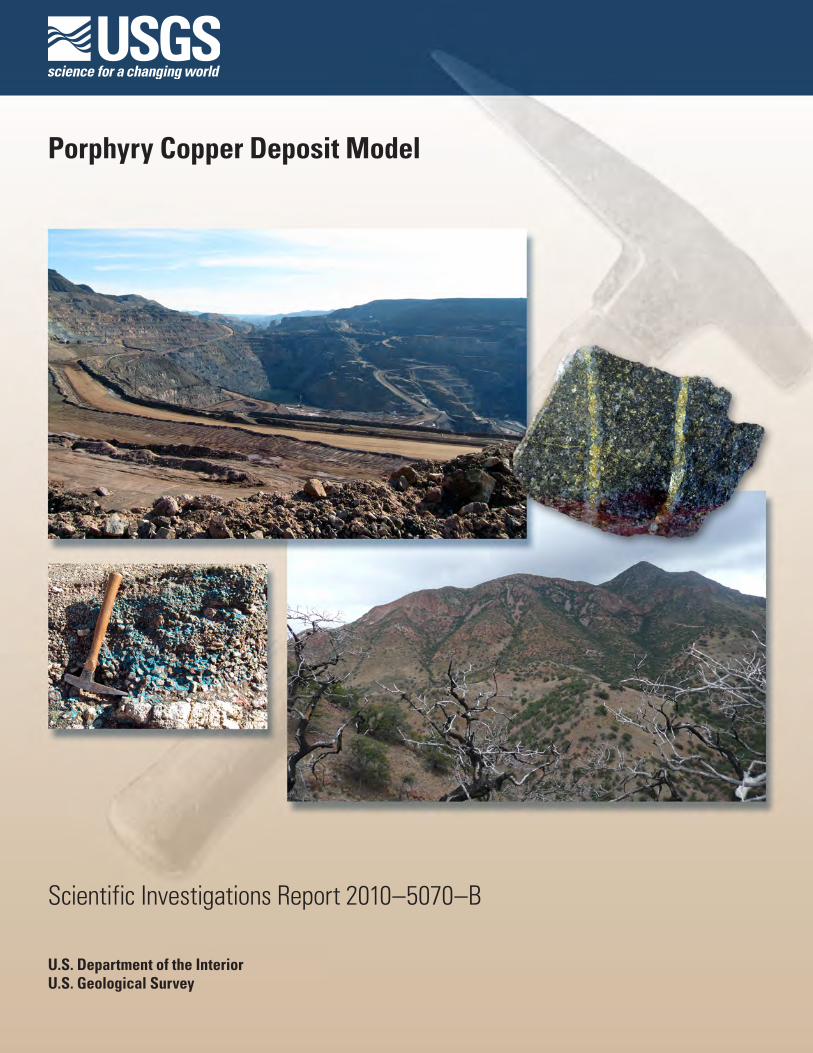
Cover. Photographs of porphyry copper deposits and ores. Upper left: Ray Mine, Arizona, one of the largest porphyry copper deposits in the United States. Upper right: High-grade copper ore from the Ray Mine, Arizona. Chalcopyrite veins cut the Ray diabase. Sample is about 6.5 centimeters wide. Lower left: Chrysocolla (blue) cementing gravel, Black Copper Wash, Kelvin-Riverside district, Arizona. Small exotic copper deposit in older Holocene gravel deposits that cover Kelvin-Riverside porphyry copper system. Hammer handle is about 28 centimeters long. Lower right: View of the west side of Red Mountain, Arizona, showing hydrothermally altered volcanic rocks that overlie porphyry copper deposit that lies about 1,000 meters below the top of the mountain.
Porphyry Copper Deposit Model
By David A. John, editor, with contributions by Robert A. Ayuso, Mark D. Barton, Richard J. Blakely, Robert J. Bodnar, John H. Dilles, Floyd Gray, Fred T. Graybeal, John C. Mars, Darcy K. McPhee, Robert R. Seal, Ryan D. Taylor, and Peter G. Vikre
Chapter B ofMineral Deposit Models for Resource Assessment
Scientific Investigations Report 2010–5070–B
U.S. Department of the InteriorU.S. Geological Survey
U.S. Department of the InteriorKEN SALAZAR, Secretary
U.S. Geological SurveyMarcia K. McNutt, Director
U.S. Geological Survey, Reston, Virginia: 2010
For more information on the USGS—the Federal source for science about the Earth, its natural and living resources, natural hazards, and the environment, visit http://www.usgs.gov or call 1-888-ASK-USGS
For an overview of USGS information products, including maps, imagery, and publications, visit http://www.usgs.gov/pubprod
To order this and other USGS information products, visit http://store.usgs.gov
Any use of trade, product, or firm names is for descriptive purposes only and does not imply endorsement by the U.S. Government.
Although this report is in the public domain, permission must be secured from the individual copyright owners to reproduce any copyrighted materials contained within this report.
Suggested citation:John, D.A., Ayuso, R.A., Barton, M.D., Blakely, R.J., Bodnar, R.J., Dilles, J.H., Gray, Floyd, Graybeal, F.T., Mars, J.C., McPhee, D.K., Seal, R.R., Taylor, R.D., and Vikre, P.G., 2010, Porphyry copper deposit model, chap. B of Mineral deposit models for resource assessment: U.S. Geological Survey Scientific Investigations Report 2010–5070–B, 169 p.
iii
Contents
Abstract ...........................................................................................................................................................1Summary of Porphyry Copper Deposit Model .........................................................................................1
Associated Commodities and Deposit Types ..................................................................................1Regional Environment .........................................................................................................................1Physical Description of Deposits .......................................................................................................2Geophysical Characteristics ...............................................................................................................3Hypogene Ore Characteristics ...........................................................................................................3Supergene Ore Characteristics ..........................................................................................................4Hypogene and Supergene Gangue Characteristics .......................................................................4Hydrothermal Alteration ......................................................................................................................5Geochemical Characteristics .............................................................................................................6Petrology of Associated Igneous Rocks ...........................................................................................7Theory of Ore Deposit Genesis ...........................................................................................................8
Sources of Fluids .........................................................................................................................8Controls on Permeability and Fluid Flow ..................................................................................8Chemical Transport and Transfer Processes ..........................................................................9Heat-Transfer Processes ............................................................................................................9Pressure Gradients ......................................................................................................................9Wall-Rock Reaction and Ore-Mineral Deposition Processes ..............................................9Relation between Alteration, Gangue, and Veins .................................................................10
Geoenvironmental Features ..............................................................................................................10Porphyry Copper Deposit Exploration and Resource Assessment Objectives
and Guides ..............................................................................................................................10Broader Implications, Societal Relevance, and Knowledge Gaps of Porphyry
Copper Deposits ....................................................................................................................10A. Introduction.............................................................................................................................................11B. Deposit Type and Associated Commodities ......................................................................................11
Name ..................................................................................................................................................11Synonyms .............................................................................................................................................11Brief Description .................................................................................................................................13Associated and Transitional Deposit Types ...................................................................................14Primary Commodities ........................................................................................................................14By-Product Commodities ..................................................................................................................14Trace Constituents ..............................................................................................................................14Example Deposits................................................................................................................................14
C. History of Porphyry Copper Deposits .................................................................................................14D. Regional Environment ..........................................................................................................................15
Geotectonic Environment .................................................................................................................15Temporal (Secular) Relations ............................................................................................................18
Variations Through Geologic Time ..........................................................................................18Variation Within Magmatic Cycles .........................................................................................18
Duration of Magmatic-Hydrothermal Systems that Form Porphyry Copper Deposits ...........18Relations to Structures .....................................................................................................................21
iv
Structural Setting(s) and Controls ..........................................................................................21Tectonic Setting .........................................................................................................................21Structural Control of Magma Emplacement ..........................................................................21Origin of Veins ............................................................................................................................21Preservation and Dismemberment of Porphyries ................................................................23
Relations to Igneous Rocks ...............................................................................................................24Relations to Sedimentary Rocks .....................................................................................................24Relations to Metamorphic Rocks .....................................................................................................24
E. Physical Description of Deposits .........................................................................................................24Dimensions in Plan View ...................................................................................................................25Vertical Extent ....................................................................................................................................25Form/Shape .........................................................................................................................................25Size of Hydrothermal Systems Relative to Extent of Economically
Mineralized Rock ...................................................................................................................25Host Rocks ..........................................................................................................................................28Structural Setting(s) and Controls ...................................................................................................28
F. Geophysical Characteristics ................................................................................................................28Introduction .........................................................................................................................................28Regional-Scale Geophysics .............................................................................................................31Deposit-Scale Geophysics ...............................................................................................................32
Magnetic Anomalies .................................................................................................................32Electrical and Electromagnetic Methods ..............................................................................33
Electrical Methods ...........................................................................................................35Electromagnetic Methods ...............................................................................................36Examples of Electrical and Electromagnetic Surveys in Porphyry
Copper Exploration ..............................................................................................37Other Geophysical Methods ....................................................................................................37
Self (Spontaneous) Potential .........................................................................................37Gravity ................................................................................................................................37Seismic Reflection ............................................................................................................38
Limitations ...........................................................................................................................................38VINR-SWIR and TIR Remote Sensing of Porphyry Copper Deposits .........................................38
Introduction.................................................................................................................................38Porphyry Copper Deposits and Spectral Characteristics ...................................................38Hyperspectral and Multispectral Imaging Systems and Previous
Studies Mapping Porphyry Copper Deposits ..........................................................39Case Study—Mapping Altered Rocks in the Sar Cheshmeh Region
of Iran using ASTER Data ............................................................................................43Introduction, Geology, and Mapped Alteration ...........................................................43Data and Calibration—Mapping Methods—ASTER False Color
Composite Image .................................................................................................45Description and Interpretation of ASTER468 Image and ASTER
Alteration Minerals Map ....................................................................................46Conclusions.................................................................................................................................50
G. Hypogene Ore Characteristics ............................................................................................................50Grade ..................................................................................................................................................50
v
Mineralogy ...........................................................................................................................................50Mineral Assemblages ........................................................................................................................51Paragenesis and Zoning ....................................................................................................................51Forms and Textures ............................................................................................................................51
H and K. Hypogene and Supergene Gangue Characteristics .............................................................55Mineralogy ...........................................................................................................................................55Mineral Assemblages and Paragenesis .........................................................................................55Zoning ..................................................................................................................................................55Textures and Grain Sizes of Hypogene Gangue ...........................................................................56Textures and Grain Sizes of Supergene Gangue ..........................................................................56Significance of Gangue .....................................................................................................................57
I. Hydrothermal Alteration .........................................................................................................................57Mineralogy ...........................................................................................................................................57Mineralogy of Assemblages and Associated Veins .....................................................................57Lateral and Vertical Dimensions .....................................................................................................60Selvages ...............................................................................................................................................60Rock Matrix Alteration .......................................................................................................................62Intensity ................................................................................................................................................62Textures ................................................................................................................................................62Zoning Patterns ...................................................................................................................................62
J. Supergene Ore Characteristics ..........................................................................................................64Dimensions, Tonnages, and Grades ...............................................................................................65Formation and Distribution ...............................................................................................................65Mineralogy ...........................................................................................................................................66Mineral Associations and Assemblages ........................................................................................66Textures and Grain Size ....................................................................................................................66
L. Weathering/Supergene Processes ....................................................................................................66Introduction..........................................................................................................................................66Mineralogy ...........................................................................................................................................68Rates ..................................................................................................................................................68Effects of Micro and Macro Climates .............................................................................................68Effects of Hydrologic Setting ............................................................................................................68
M. Geochemical Characteristics .............................................................................................................70Lithochemistry ....................................................................................................................................70Minor Element Zoning Patterns .......................................................................................................70Mineral Compositions .......................................................................................................................73Fluid-Inclusion Thermometry and Geochemistry .........................................................................80Chemical Compositions of Fluids ....................................................................................................83Stable Isotope Compositions of Fluids ...........................................................................................87Nontraditional Stable Isotopes—Copper and Molybdenum ......................................................88
N. Petrology of Associated Igneous Rocks ...........................................................................................89Rock Names .........................................................................................................................................89Forms of Igneous Rocks and Rock Associations .........................................................................89Mineralogy ..........................................................................................................................................89Textures and Structures ....................................................................................................................89
vi
Grain Size .............................................................................................................................................91Petrochemistry ....................................................................................................................................91Trace-Element Geochemistry ...........................................................................................................97Isotope Geochemistry ......................................................................................................................100Radiogenic Isotopes of Ore ............................................................................................................106Depth of Emplacement .....................................................................................................................107
O. Petrology of Associated Sedimentary Rocks .................................................................................107P. Petrology of Associated Metamorphic Rocks ...............................................................................107Q. Theory of Ore Deposit Formation .....................................................................................................108
Ore Deposit System Affiliations .....................................................................................................108Controls on Permeability and Fluid Flow .......................................................................................109Sources of Fluids and Metals .........................................................................................................109Chemical Transport and Transfer Processes ...............................................................................112Heat Transport and Transfer Processes .......................................................................................113
Time Scale .................................................................................................................................113Pressure Gradients During Porphyry Copper System Formation .............................................114Wall-Rock Reaction and Ore-Mineral Deposition Processes ..................................................114Relation Between Alteration, Gangue and Vein Mineralization ...............................................115
R. Porphyry Copper Exploration and Resource Assessment Guides ..............................................116Hypogene Characteristics of PCDs and Gradients within PCD Systems ................................116
Mapping of Rock Types, Structure, Hydrothermal Minerals, and Zoning ......................116Fluid Inclusion Zoning and Thermal Gradients ..................................................................117Mineral Properties ...................................................................................................................117Vein Abundance, Mineralogy, and Paragenesis ................................................................117Distribution of Sulfide Minerals .............................................................................................117Minor-Element Geochemistry ................................................................................................117Spectral Imagery .....................................................................................................................120
Supergene-Enriched and Oxidized PCDs .....................................................................................120Supergene Enrichment and Leached Capping Characteristics .......................................120Copper-Oxide Minerals ..........................................................................................................120
Recognition of Permissive Terrain for Porphyry Copper Exploration and Assessment ........121Postmineralization Cover and Proximity to Porphyry Copper Deposits ..........................121Regional Structure and Intrusion Emplacement ................................................................121Continental-Scale Permissive Terrains ...............................................................................121Depth Limitations .....................................................................................................................121
S. Geoenvironmental Features ..............................................................................................................122Weathering Processes ....................................................................................................................122Pre-Mining Baseline Signatures in Soil, Sediment, and Water ...............................................123Past and Future Mining Methods and Ore Treatment ...............................................................124Volume of Mine Waste and Tailings .............................................................................................124Mine Waste Characteristics ..........................................................................................................124Acid/Base Accounting ....................................................................................................................124Metal Mobility Related to Mining in Groundwater and Surface Water ..................................124Pit Lakes ............................................................................................................................................124Ecosystem Issues ............................................................................................................................125
vii
Human Health Issues ......................................................................................................................125Climate Effects on Geoenvironmental Signatures .....................................................................125
T. Knowledge Gaps and Future Research Directions ........................................................................125U. Broader Implications and Societal Relevance of Porphyry Copper Systems ...........................126References Cited........................................................................................................................................131Appendix 1. Grade and tonnage models ...............................................................................................158Appendix 2. Characteristics of Representative Porphyry Copper Deposits ..................................158
Figures A1. Map showing Phanerozoic porphyry belts, porphyry deposits, and
representative porphyry copper deposits summarized in Appendix 2 ..............................12 B1. Schematic cross section showing general setting of porphyry copper
and associated deposit types ...................................................................................................13 D1. Diagrams showing plate tectonic setting of porphyry copper deposits ...........................16 D2. Simplified map of porphyry copper belts and major porphyry copper
deposits in the Andes .................................................................................................................17 D3. Cartoon cross section showing optimum conditions for development of
giant porphyry copper deposits ...............................................................................................18 D4. Map of Southeast Asia and the west Pacific showing major Cenozoic arcs
and copper ± gold and gold deposits ......................................................................................19 D5. Histogram of the ages of known porphyry copper deposits ...............................................20 D6. Maps showing porphyry veins .................................................................................................22 D7. Cross sections showing offset and tilting of the San Manuel–Kalamazoo
orebody by the San Manuel fault .............................................................................................23 E1. Generalized geologic maps and vertical profiles through several porphyry
copper deposits showing vertical extent of ore and footprints of porphyry copper deposits ..........................................................................................................................26
E2. Maps showing copper ore zones at Batu Hijau, Indonesia, Bingham in Utah, Pre-Main stage porphyry copper-molybdenum mineralization at Butte, Montana, Bajo el Alumbrera, Argentina, and Yerington, Nevada ......................................27
E3. Plan map showing geochemical zoning around the Bingham Canyon deposit, Utah ................................................................................................................................29
E4. Schematic cross section showing relationship of hydrothermal systems and porphyry copper and related deposits to crystallizing granitic batholith based on exposed deposits and altered rocks in and near the Yerington district in western Nevada ........................................................................................................30
F1. Map showing aeromagnetic anomalies from the Quebrada Blanca–Collahuasi district, northern Chile .............................................................................32
F2. Cross sections showing magnetic anomaly caused by a hypothetical porphyry copper deposit ...........................................................................................................34
F3. Map showing aeromagnetic anomalies over the Silver Bell porphyry copper deposits in Arizona .......................................................................................................35
F4. Resistivity, chargeability, and susceptibility of the Mount Milligan porphyry deposits in British Columbia, as determined through inversion of direct- current resistivity, induced polarization, and magnetic measurements ...........................36
F5. Illustrated deposit model of a porphyry copper deposit ......................................................39
viii
F6–F9. Graphs showing: F6. Laboratory spectra of epidote, calcite, muscovite, kaolinite, chlorite,
and alunite, which are common hydrothermal alteration minerals ..........................40 F7. TIR laboratory spectra of quartz and opal at full TIR spectrometer
spectral resolution (2600 bands) and resampled to ASTER TIR spectral resolution (5 bands) ...........................................................................................41
F8. Comparison of ASTER, AVIRIS, and Landsat Thematic Mapper (TM) VNIR and SWIR image spatial and spectral characteristics .....................................41
F9. (A) VNIR–SWIR AVIRIS (AV), ASTER (AST), and Landsat TM-ETM+ (TM) resampled spectral pairs of epidote, calcite, muscovite, kaolinite, chlorite, and alunite. (B) VNIR–SWIR AVIRIS (AV), ASTER (AST), and Landsat TM-ETM+ (TM) resampled spectral pairs of limonite, jarosite, hematite, and goethite .......................................................................................42
F10. Maps showing TM band 7 image with argillically- and sericitically-altered rocks of the area around the Meiduk copper mine in Iran and alteration minerals map of the Infiernillo copper porphyry deposit in Argentina ..............................44
F11. Geologic map of the Sar Cheshmeh and Seridune area ......................................................45 F12. Detailed alteration and lithologic map of the Sar-Cheshmeh deposit, Iran ......................46 F13. Detailed lithologic map of the Seridune prospect and hydrothermal
alteration map of the Seridune prospect ................................................................................47 F14. ASTER false color composite image of the Sar Cheshmeh area .......................................48 F15. ASTER minerals map of the Sar Cheshmeh area consisting of an ASTER
false color composite image and advanced argillic, sericitic, propylitic, and silica-rich rocks ...................................................................................................................49
I1. Diagram showing AKF–ACF mineral assemblages in major types of wall-rock alteration ....................................................................................................................58
I2. Schematic cross sections showing hydrothermal alteration zoning patterns and fluid flow paths for porphyry copper deposits emplaced in different environments ...............................................................................................................61
I3. Graph showing temperature relative to mKCl/mHCl diagram for the system K2O-Al2O3-SiO2-KCl-HCl-H2O at 1 kilobar with quartz present showing mineral stability and fields for hydrothermal alteration types common in porphyry copper deposits .....................................................................................................63
I4. Model of fluid circulation and alteration in the root zone environment of porphyry copper deposits .........................................................................................................64
J1. Schematic cross section showing mature supergene profile based on porphyry copper deposits in northern Chile ...........................................................................65
L1. Diagram showing mature gossan profile................................................................................67 M1. Example of lithogeochemistry applied to porphyry copper deposit
identification in the Collahuasi district, Chile .........................................................................71 M2–M3. Gain/loss diagrams for: M2. Major oxides and minor elements in altered rocks in the Bajo de la
Alumbrera porphyry copper deposit, Argentina ...........................................................72 M3. Major and minor elements in potassic and phyllic alteration zones
in the Sar Chesmeh porphyry copper deposit, Iran, based on comparisons of least altered to potassically altered rocks, and potassically altered to phyllically altered rocks ...........................................................73
M4. Cross sections showing distribution of ore-grade copper and gold in the porphyry copper-gold deposit at Bajo de la Alumbrera, Argentina ...................................73
ix
M5–M7. Graphs showing: M5. Distribution of molybdenum and zinc relative to copper and alteration
zones in the porphyry copper deposit at Red Mountain, Arizona .............................74 M6. Compositions of magmatic and hydrothermal biotite in porphyry
copper-molybdenum deposits, and porphyry molybdenum deposits, and magmatic biotites from granitic intrusions, based on magnesium, iron, fluorine, and chlorine concentrations ...................................................................75
M7. Manganese oxide in coexisting chlorite and epidote relative to lateral distance from the outer edge of the biotite alteration zones in the Silver Bell and Safford porphyry copper deposits, Arizona ............................76
M8. Plan view of illite crystallinity relative to hydrothermal alteration zones and hypogene and supergene copper grades at various depths in the Campana Mahuida porphyry copper deposit, Argentina .....................................................77
M9. Cathodoluminescence image of bright quartz cut by dark quartz in a quartz+pyrite vein from the porphyry copper deposit at Butte, Montana .........................78
M10. Map showing distribution of sulfur isotope compositions of hypogene sulfide minerals relative to alteration zones and gold grade in the Cadia alkalic porphyry gold-copper deposit, Australia, corrected for temperature fractionations between pyrite, chalcopyrite, and bornite ...................................................79
M11. Photographs showing examples of different types of fluid inclusions found in porphyry copper deposits .....................................................................................................81
M12. Diagram showing phases in fluid inclusions at room temperature and corresponding entrapment pressures and temperatures for magmatic fluid inclusions from several porphyry copper deposits ......................................................83
M14. Diagram showing distribution of fluid inclusion types in time and space along a traverse from the center to the periphery of the system and along a traverse from shallow to deep in the center of the system ..............................................84
M13. Graph showing copper concentration compared to homogenization temperature for two fluid inclusion groups, and relative to chalcopyrite solubility, Bingham porphyry copper deposit in Utah ...........................................................84
M15. South-southeast to north-northwest section through the Bingham porphyry copper deposit in Utah, showing distribution of fluid inclusion types, copper orebody with grade contours, quartz vein abundances, quartz monzonite porphyry, and monzonite............................................................................85
M16–M17. Graphs showing: M16. Partitioning of elements between vapor and liquid, determined by
LA–ICP–MS analysis of coeval, individual vapor-rich and liquid-rich fluid inclusions from the Bajo de la Alumbrera, Argentina, and Grasberg, Indonesia, porphyry copper-gold deposits .................................................86
M17. δ18O and δD compositions of hydrothermal fluids in equilibrium with hydrothermal minerals and mineral zones, in per mil, for porphyry copper deposits at El Salvador, Chile, Oyu Tolgoi, Mongolia, La Caridad, Mexico, Bingham, Utah, and Butte, Montana .........................................88
N1. Histogram of rock types in porphyry copper deposits .........................................................90 N2. Photograph of drill core of quartz feldspar porphyry from Sunnyside
porphyry copper system in Arizona that forms main host rock for copper-molybdenum resource .................................................................................................90
N3. Plots summarizing whole-rock chemical data for selected suites of igneous rocks related to porphyry copper systems .............................................................92
x
Tables E1. Summary statistics of areas of ore, sulfides, and altered rock in porphyry
copper deposits compiled in Singer and others ...................................................................28 G1. Frequency of occurrence (percentage of deposits) of hypogene
hydrothermal (H) and supergene minerals and elements (S) in porphyry copper deposits ..........................................................................................................................52
G2. Some common hypogene vein and disseminated mineral assemblages in porphyry copper deposits .....................................................................................................54
L1. Mineral assemblages in geochemical domains in high and low mass flux conditions .....................................................................................................................................69
L2. Minerals commonly found in the oxide zone of porphyry copper deposits ......................69 N1. Temporal evolution of the definition of adakites ..................................................................94 N2. General chemical characteristics of selected porphyry copper-
molybdenum stocks. ..................................................................................................................96
N4–N6. Graphs showing: N4. Yttrium compared to strontium/yttrium diagram for samples of
plutonic rocks associated with porphyry copper deposits ........................................99 N5. 207Pb/204Pb-206Pb/204Pb diagrams showing generalized fields of granitic
rocks, feldspars, and sulfide minerals associated with porphyry copper deposits ...............................................................................................................102
N6. Neodymium-strontium isotope compositions of granitic rocks associated with porphyry copper deposits .................................................................103
N7. Map showing depth of erosion of Mesozoic plutonic rocks and copper and tungsten deposits in the Western United States .........................................................108
Q1. Graph showing pressure-temperature diagram for the NaCl-H2O fluid system, showing isopleths of solubility of sodium chloride in water and in steam with approximate depths corresponding to lithostatic pressures on right vertical axis and hydrostatic pressures on left vertical axis ..............................110
R1. Cross sections of a model of a porphyry copper system that shows the distribution and types of mineral deposits, rocks, and alteration zones in porphyry copper systems, and lateral profiles of system attributes that compose exploration guides ...................................................................................................118
U1. Diagram showing estimates of the annual flux of elements mined during the production of porphyry deposits as compared to annual global consumption of the same elements .......................................................................................127
U2. Schematic diagrams showing generalized mass flow in the crust, at the surface, and during mining in relation to Lifecycles of Porphyry Copper Deposits project tasks .............................................................................................................128
U3. Map of Arizona showing the distribution of known porphyry copper deposits, Laramide-age (coeval) igneous rocks, post-Laramide cover, and areas where mineral development is restricted by population growth or other land-use restrictions .................................................................................................130
xi
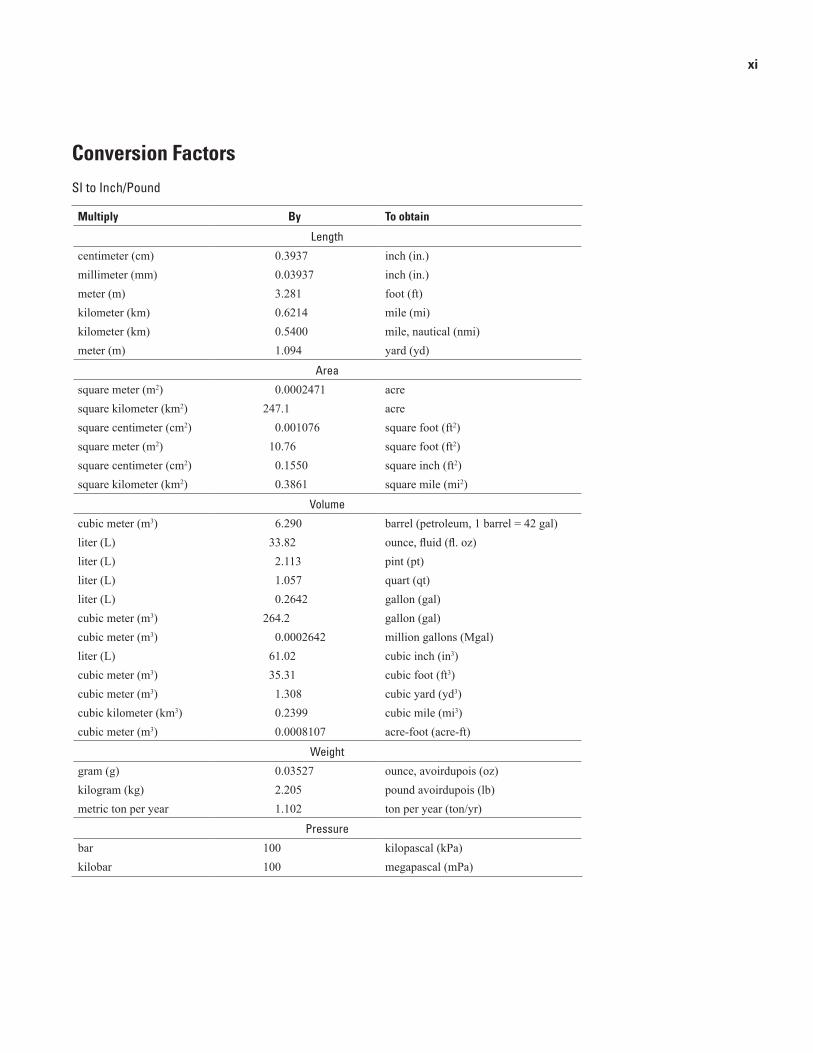
Conversion FactorsSI to Inch/Pound
Multiply By To obtain
Length
centimeter (cm) 0.3937 inch (in.)millimeter (mm) 0.03937 inch (in.)meter (m) 3.281 foot (ft) kilometer (km) 0.6214 mile (mi)kilometer (km) 0.5400 mile, nautical (nmi) meter (m) 1.094 yard (yd)
Area
square meter (m2) 0.0002471 acre square kilometer (km2) 247.1 acresquare centimeter (cm2) 0.001076 square foot (ft2)square meter (m2) 10.76 square foot (ft2) square centimeter (cm2) 0.1550 square inch (ft2) square kilometer (km2) 0.3861 square mile (mi2)
Volume
cubic meter (m3) 6.290 barrel (petroleum, 1 barrel = 42 gal)liter (L) 33.82 ounce, fluid (fl. oz)liter (L) 2.113 pint (pt)liter (L) 1.057 quart (qt)liter (L) 0.2642 gallon (gal)cubic meter (m3) 264.2 gallon (gal) cubic meter (m3) 0.0002642 million gallons (Mgal) liter (L) 61.02 cubic inch (in3) cubic meter (m3) 35.31 cubic foot (ft3)cubic meter (m3) 1.308 cubic yard (yd3) cubic kilometer (km3) 0.2399 cubic mile (mi3) cubic meter (m3) 0.0008107 acre-foot (acre-ft)
Weight
gram (g) 0.03527 ounce, avoirdupois (oz)kilogram (kg) 2.205 pound avoirdupois (lb)metric ton per year 1.102 ton per year (ton/yr)
Pressure
bar 100 kilopascal (kPa) kilobar 100 megapascal (mPa)
xii
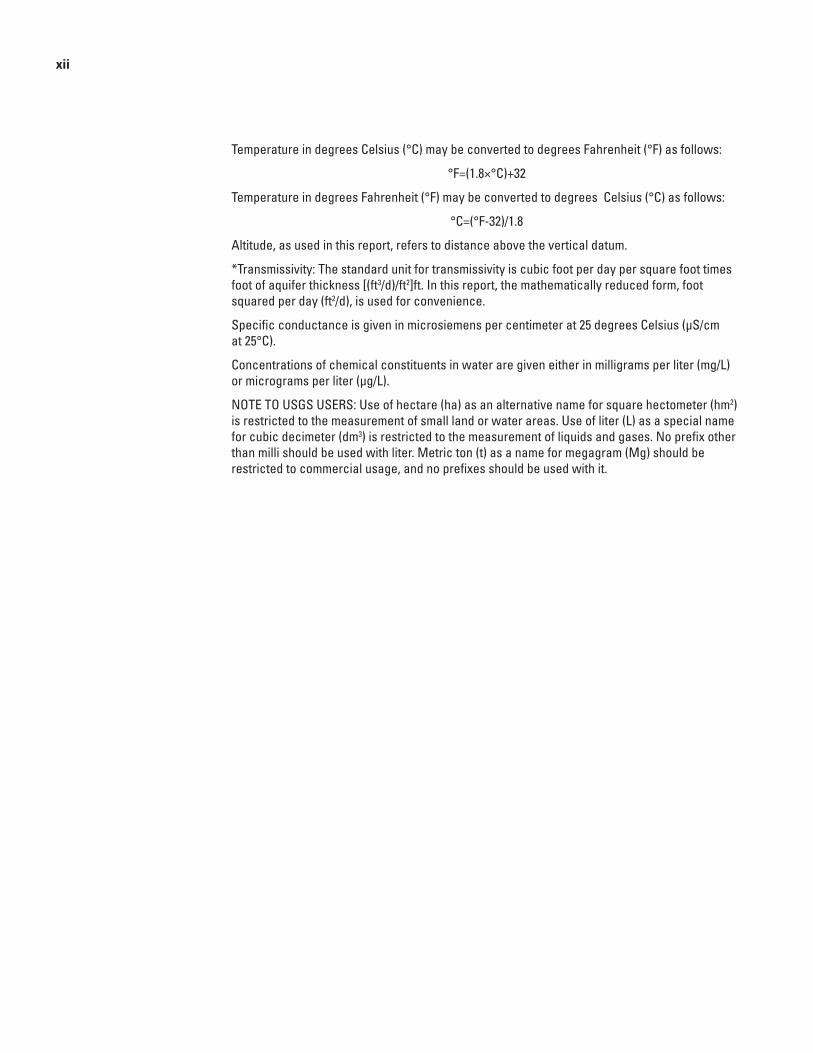
Temperature in degrees Celsius (°C) may be converted to degrees Fahrenheit (°F) as follows:
°F=(1.8×°C)+32
Temperature in degrees Fahrenheit (°F) may be converted to degrees Celsius (°C) as follows:
°C=(°F-32)/1.8
Altitude, as used in this report, refers to distance above the vertical datum.
*Transmissivity: The standard unit for transmissivity is cubic foot per day per square foot times foot of aquifer thickness [(ft3/d)/ft2]ft. In this report, the mathematically reduced form, foot squared per day (ft2/d), is used for convenience.
Specific conductance is given in microsiemens per centimeter at 25 degrees Celsius (µS/cm at 25°C).
Concentrations of chemical constituents in water are given either in milligrams per liter (mg/L) or micrograms per liter (µg/L).
NOTE TO USGS USERS: Use of hectare (ha) as an alternative name for square hectometer (hm2) is restricted to the measurement of small land or water areas. Use of liter (L) as a special name for cubic decimeter (dm3) is restricted to the measurement of liquids and gases. No prefix other than milli should be used with liter. Metric ton (t) as a name for megagram (Mg) should be restricted to commercial usage, and no prefixes should be used with it.
Porphyry Copper Deposit Model
By David A. John, editor, with contributions by Robert A. Ayuso, Mark D. Barton, Richard J. Blakely, Robert J. Bodnar, John H. Dilles, Floyd Gray, Fred T. Graybeal, John C. Mars, Darcy K. McPhee, Robert R. Seal, Ryan D. Taylor, and Peter G. Vikre
AbstractThis report contains a revised descriptive model of
porphyry copper deposits (PCDs), the world’s largest source (about 60 percent) and resource (about 65 percent) of copper and a major source of molybdenum, gold and silver. Despite relatively low grades (average 0.44 percent copper in 2008), PCDs have significant economic and societal impacts due to their large size (commonly hundreds of millions to billions of metric tons), long mine lives (decades), and high produc-tion rates (billions of kilograms of copper per year). The revised model describes the geotectonic setting of PCDs, and provides extensive regional- to deposit-scale descriptions and illustrations of geological, geochemical, geophysical, and geoenvironmental characteristics. Current genetic theories are reviewed and evaluated, knowledge gaps are identified, and a variety of exploration and assessment guides are presented. A summary is included for users seeking overviews of specific topics.
Summary of Porphyry Copper Deposit Model
(David A. John, Peter G. Vikre, Richard J. Blakely, and Robert R. Seal)
Porphyry copper deposits (PCDs) consist of disseminated copper minerals and copper minerals in veins and breccias that are relatively evenly distributed in large volumes of rock, forming high tonnage (greater than 100 million tons), low to moderate grade (0.3–2.0 percent copper) ores. Host rocks are altered and genetically related granitoid porphyry intrusions and adjacent wall rocks. Porphyry copper deposits are the world’s most important source of copper, accounting for more than 60 percent of the annual world copper production and about 65 percent of known copper resources. PCDs also are an important source of other metals, notably molybdenum, gold, and silver. Despite their relatively low grades, PCDs have a significant societal and economic impact due to their large size (commonly hundreds of millions to billions of metric tons),
long mine lives, and scale of mining operations. Porphyry copper deposits were the first type of metallic mineral deposit exploited by large-scale, open-pit mining methods in the early 20th century, a low-cost mining technique since adapted to other large-tonnage, low-grade mineral deposits (for example, gold and silver).
Associated Commodities and Deposit Types
Porphyry copper deposits are mined primarily for copper, although molybdenum and gold are co-products in some deposits, and with silver a by-product in many deposits. Rhenium, tellurium, platinum group elements, arsenic, and zinc are recovered from a few deposits.
With increasing molybdenum/copper, porphyry copper deposits are transitional to low fluorine (quartz monzonite type) porphyry molybdenum deposits, and with increasing gold/copper, they are transitional to porphyry gold deposits.
A variety of mineral deposits may be genetically associ-ated with porphyry copper deposits, including:
• Skarns (including copper, iron, gold, zinc types)
• Polymetallic replacement (silver, lead, zinc, copper, gold)
• Polymetallic veins (gold, silver, copper, lead, zinc, manganese, arsenic)
• Distal disseminated gold-silver (gold, silver)
• Epithermal vein (intermediate/low sulfidation gold-silver)
• High sulfidation epithermal (gold, silver, copper, arsenic)
Regional Environment
The regional, deposit-scale, and local-scale environments of porphyry copper deposits are diverse, and despite much scientific study, many features are poorly understood in regard to their relevance as controls of ore formation. Porphyry copper systems are widespread (fig. A1), but they are mostly
2 Porphyry Copper Deposit Model
localized in time and space within the evolution of magmatic arcs along convergent plate margins where subduction of oceanic crust and arc-type magmatism generates hydrous, oxidized upper crustal granitoids genetically related to ores. In most cases, arc crust is relatively thick, and there is evidence for broadly coeval compressional or transpressional tectonism. Some authors have suggested that many porphyry copper deposits formed during unusual periods of subduction, includ-ing flat subduction induced by subduction of buoyant oceanic structures, such as ridges, ocean plateaus, and seamount chains, or during episodes of plate reorganization. Within this broadly compressive environment, transpression is expressed as strike-slip faults with significant reverse movement, and it has been suggested that stress relaxation to transtensional or mildly extensional conditions is associated with emplacement of mineralized porphyry intrusions.
Some porphyry copper deposits formed in postsubduc-tion magmatic settings in both extensional and compressional environments. Magmas formed in postsubduction settings tend to be small volume, spatially isolated, and mildly alkaline (high-K ± Na calc-alkaline) to strongly alkaline in composi-tion, although some of the world’s largest porphyry copper (gold) deposits are interpreted to have formed in this tectonic setting (for example, Grasberg, Indonesia).
Porphyry copper deposits have formed throughout most of Earth’s history, but because they generally form in the upper crust (less than 5–10 km depth) in tectonically unstable convergent plate margins and are prone to erosion, more than 90 percent of known deposits are Cenozoic or Mesozoic in age (see fig. D5). Postmineral faults figure prominently in preser-vation of porphyry copper deposits, but they also present large challenges to exploration and assessment.
Fracture and vein systems and breccias are an inevitable consequence of porphyry magmatism. Ascent of intermediate and silicic hydrous magmas into the upper crust from deeper sources is driven by the buoyancy of these magmas that are less dense than the surrounding crust. Where density contrasts decrease in the upper crust, buoyancy forces diminish so that magmas pond to form plutons or batholiths. Hydrous fluids are produced as magmas cool, crystallize, and solidify causing volatile exsolution.
Porphyry intrusions may be pluglike and enclosed in both steeply dipping, radial fractures and gently dipping, concen-tric fractures, reflecting stress conditions that are magma-dominated where the two horizontal principal stresses are nearly equal. However, sets of concentric and radial fractures are rarely documented in porphyry copper deposits. Rather, steeply dipping, sheeted, parallel vein and dikelike porphyry intrusions are more common and presumably reflect condi-tions where the two principal horizontal stresses are signifi-cantly different and likely reflect the far-field stress regime.
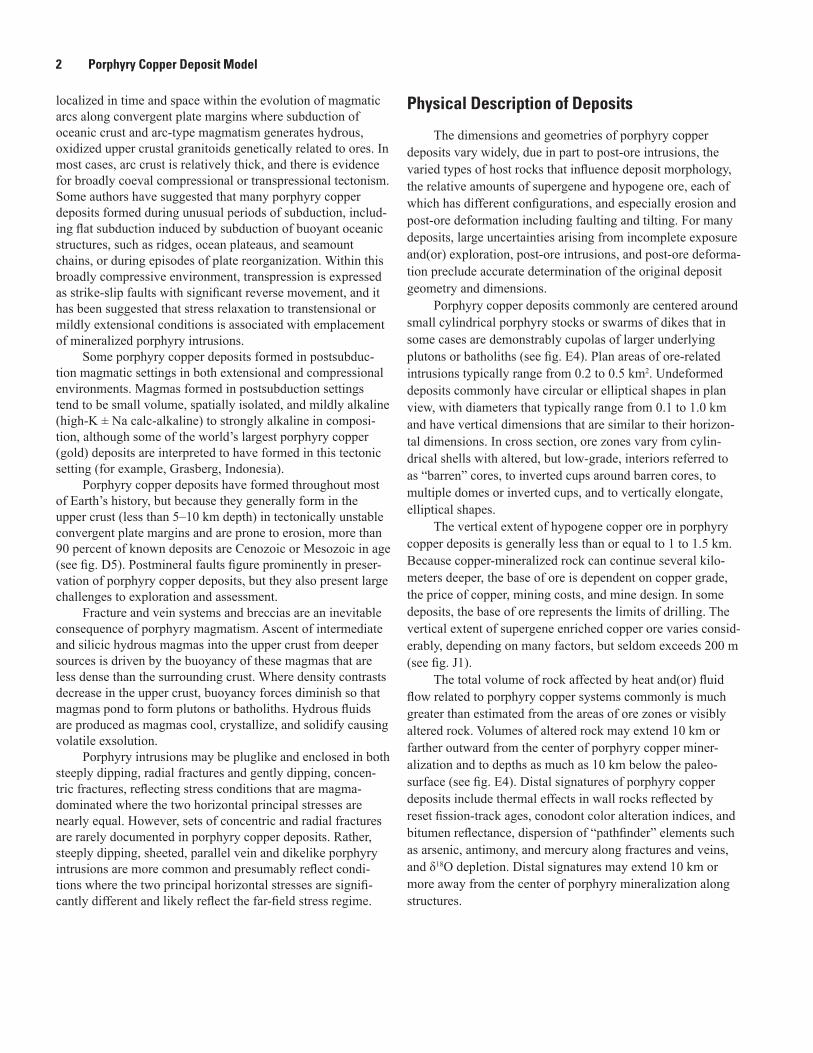
Physical Description of Deposits
The dimensions and geometries of porphyry copper deposits vary widely, due in part to post-ore intrusions, the varied types of host rocks that influence deposit morphology, the relative amounts of supergene and hypogene ore, each of which has different configurations, and especially erosion and post-ore deformation including faulting and tilting. For many deposits, large uncertainties arising from incomplete exposure and(or) exploration, post-ore intrusions, and post-ore deforma-tion preclude accurate determination of the original deposit geometry and dimensions.
Porphyry copper deposits commonly are centered around small cylindrical porphyry stocks or swarms of dikes that in some cases are demonstrably cupolas of larger underlying plutons or batholiths (see fig. E4). Plan areas of ore-related intrusions typically range from 0.2 to 0.5 km2. Undeformed deposits commonly have circular or elliptical shapes in plan view, with diameters that typically range from 0.1 to 1.0 km and have vertical dimensions that are similar to their horizon-tal dimensions. In cross section, ore zones vary from cylin-drical shells with altered, but low-grade, interiors referred to as “barren” cores, to inverted cups around barren cores, to multiple domes or inverted cups, and to vertically elongate, elliptical shapes.
The vertical extent of hypogene copper ore in porphyry copper deposits is generally less than or equal to 1 to 1.5 km. Because copper-mineralized rock can continue several kilo-meters deeper, the base of ore is dependent on copper grade, the price of copper, mining costs, and mine design. In some deposits, the base of ore represents the limits of drilling. The vertical extent of supergene enriched copper ore varies consid-erably, depending on many factors, but seldom exceeds 200 m (see fig. J1).
The total volume of rock affected by heat and(or) fluid flow related to porphyry copper systems commonly is much greater than estimated from the areas of ore zones or visibly altered rock. Volumes of altered rock may extend 10 km or farther outward from the center of porphyry copper miner-alization and to depths as much as 10 km below the paleo-surface (see fig. E4). Distal signatures of porphyry copper deposits include thermal effects in wall rocks reflected by reset fission-track ages, conodont color alteration indices, and bitumen reflectance, dispersion of “pathfinder” elements such as arsenic, antimony, and mercury along fractures and veins, and δ18O depletion. Distal signatures may extend 10 km or more away from the center of porphyry mineralization along structures.
Summary of Porphyry Copper Deposit Model 3
Geophysical Characteristics
Modern geophysical methods are widely used in the exploration for and characterization of porphyry copper depos-its (see figs. R1A,B). Regional-scale aeromagnetic, seismic, gravity, and remote-sensing techniques provide insights into the broad crustal structure and magmatic framework that hosts mineralization, whereas deposit-scale aeromagnetic, ground-magnetic, and electromagnetic studies help to characterize mineralization in three dimensions.
The very nature of porphyry copper system evolution concentrates minerals of diverse geophysical properties near the topographic surface. To first order, alteration associated with porphyry copper deposition occurs in zones, causing predictable spatial patterns of magnetic properties. High-resolution aeromagnetic and ground-based magnetic surveys can map these zones, thus providing useful exploration tools at deposit scales. Iron and copper sulfides (pyrite, chalcopyrite, chalcocite, and bornite) are distributed throughout most ore and alteration zones. Such minerals typically have low resis-tivities detectable with modern electrical and electromagnetic methods. In particular, the dispersed nature of sulfide minerals in porphyry systems is well suited for induced polarization methods, which measure the chargeability of crustal materi-als. Sophisticated inverse methods applied to electrical and electromagnetic data can help define the three-dimensional framework of porphyry copper deposits. Seismic-reflection and seismic-tomographic methods provide three-dimensional views of seismic velocity, sometimes useful in identifying lithologies surrounding and capping porphyry copper depos-its. Depending on the contrast in density between pluton and host rock, gravity anomalies can help locate and characterize plutons genetically associated with porphyry copper systems. Geophysical interpretations are inherently nonunique, and geology is always complicated. Interpretations must be constrained by independent geologic information, including geologic mapping, multiple geophysical datasets, and subsur-face lithologic and mineralogic information.
In areas of good exposure with limited vegetation, remote sensing by airborne and spaceborne multispectral and hyperspectral imaging systems can be used to map alteration mineral associations and their spatial relationships in porphyry copper systems. In particular, hydrothermal minerals charac-teristic of sericitic, intermediate and advanced argillic, and propylitic alteration, iron oxides and hydroxides, and silica can be remotely mapped using their distinctive absorption features in the visible near-infrared through short-wave infrared and thermal infrared wavelengths.
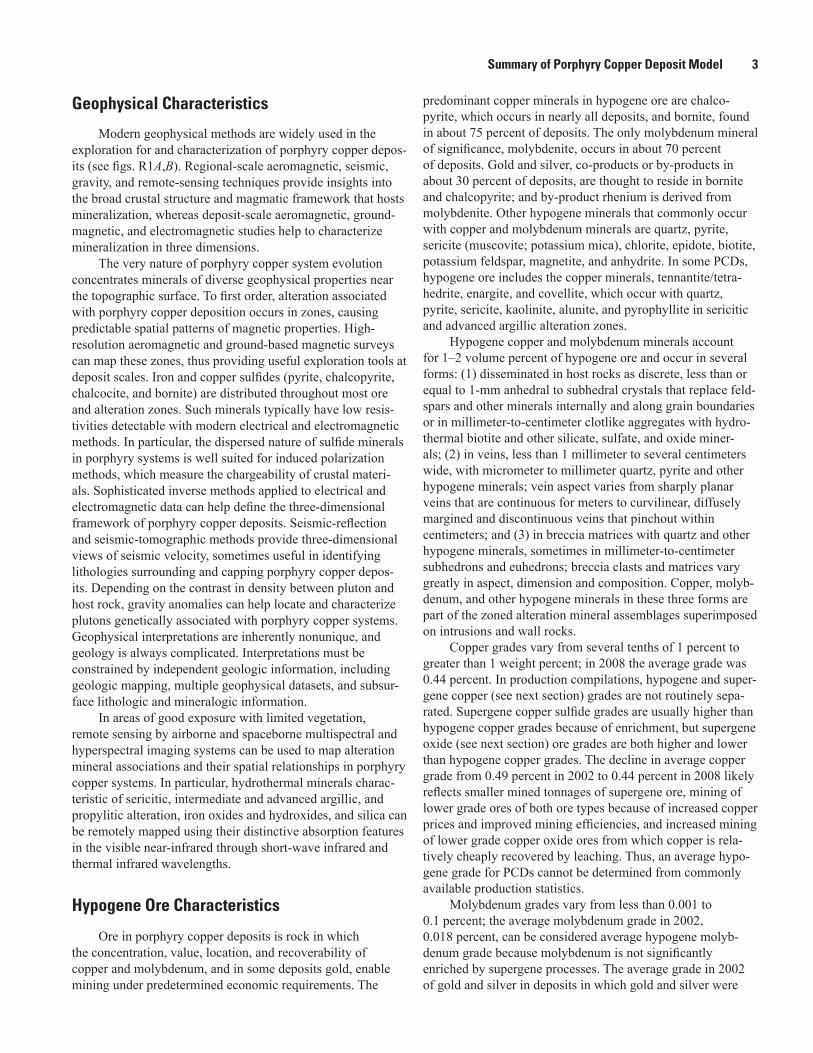
Hypogene Ore Characteristics
Ore in porphyry copper deposits is rock in which the concentration, value, location, and recoverability of copper and molybdenum, and in some deposits gold, enable mining under predetermined economic requirements. The
predominant copper minerals in hypogene ore are chalco-pyrite, which occurs in nearly all deposits, and bornite, found in about 75 percent of deposits. The only molybdenum mineral of significance, molybdenite, occurs in about 70 percent of deposits. Gold and silver, co-products or by-products in about 30 percent of deposits, are thought to reside in bornite and chalcopyrite; and by-product rhenium is derived from molybdenite. Other hypogene minerals that commonly occur with copper and molybdenum minerals are quartz, pyrite, sericite (muscovite; potassium mica), chlorite, epidote, biotite, potassium feldspar, magnetite, and anhydrite. In some PCDs, hypogene ore includes the copper minerals, tennantite/tetra-hedrite, enargite, and covellite, which occur with quartz, pyrite, sericite, kaolinite, alunite, and pyrophyllite in sericitic and advanced argillic alteration zones.
Hypogene copper and molybdenum minerals account for 1–2 volume percent of hypogene ore and occur in several forms: (1) disseminated in host rocks as discrete, less than or equal to 1-mm anhedral to subhedral crystals that replace feld-spars and other minerals internally and along grain boundaries or in millimeter-to-centimeter clotlike aggregates with hydro-thermal biotite and other silicate, sulfate, and oxide miner-als; (2) in veins, less than 1 millimeter to several centimeters wide, with micrometer to millimeter quartz, pyrite and other hypogene minerals; vein aspect varies from sharply planar veins that are continuous for meters to curvilinear, diffusely margined and discontinuous veins that pinchout within centimeters; and (3) in breccia matrices with quartz and other hypogene minerals, sometimes in millimeter-to-centimeter subhedrons and euhedrons; breccia clasts and matrices vary greatly in aspect, dimension and composition. Copper, molyb-denum, and other hypogene minerals in these three forms are part of the zoned alteration mineral assemblages superimposed on intrusions and wall rocks.
Copper grades vary from several tenths of 1 percent to greater than 1 weight percent; in 2008 the average grade was 0.44 percent. In production compilations, hypogene and super-gene copper (see next section) grades are not routinely sepa-rated. Supergene copper sulfide grades are usually higher than hypogene copper grades because of enrichment, but supergene oxide (see next section) ore grades are both higher and lower than hypogene copper grades. The decline in average copper grade from 0.49 percent in 2002 to 0.44 percent in 2008 likely reflects smaller mined tonnages of supergene ore, mining of lower grade ores of both ore types because of increased copper prices and improved mining efficiencies, and increased mining of lower grade copper oxide ores from which copper is rela-tively cheaply recovered by leaching. Thus, an average hypo-gene grade for PCDs cannot be determined from commonly available production statistics.
Molybdenum grades vary from less than 0.001 to 0.1 percent; the average molybdenum grade in 2002, 0.018 percent, can be considered average hypogene molyb-denum grade because molybdenum is not significantly enriched by supergene processes. The average grade in 2002 of gold and silver in deposits in which gold and silver were
4 Porphyry Copper Deposit Model
recovered was 0.16 gram per ton (g/t) and 2.67 g/t, respec-tively, and grade ranges were 0 to 0.65 g gold/t and 0 to about 10 g silver/t. There are no published data that distinguish hypogene and supergene grades of silver and gold.
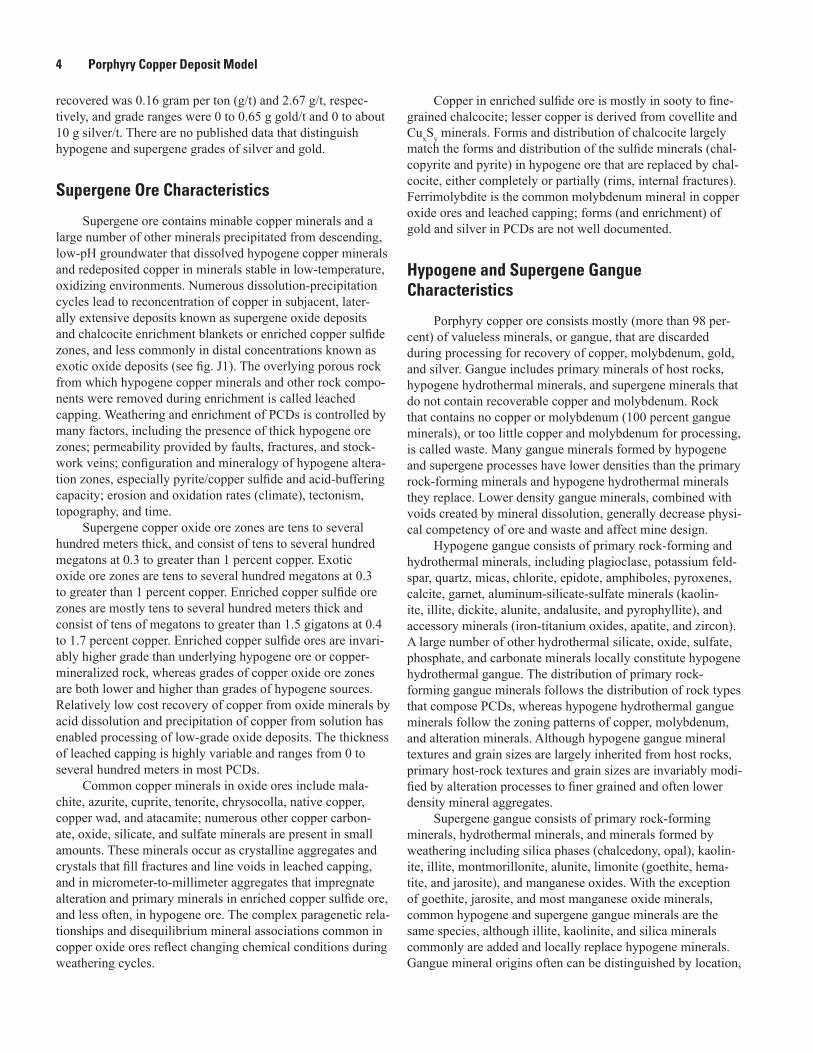
Supergene Ore Characteristics
Supergene ore contains minable copper minerals and a large number of other minerals precipitated from descending, low-pH groundwater that dissolved hypogene copper minerals and redeposited copper in minerals stable in low-temperature, oxidizing environments. Numerous dissolution-precipitation cycles lead to reconcentration of copper in subjacent, later-ally extensive deposits known as supergene oxide deposits and chalcocite enrichment blankets or enriched copper sulfide zones, and less commonly in distal concentrations known as exotic oxide deposits (see fig. J1). The overlying porous rock from which hypogene copper minerals and other rock compo-nents were removed during enrichment is called leached capping. Weathering and enrichment of PCDs is controlled by many factors, including the presence of thick hypogene ore zones; permeability provided by faults, fractures, and stock-work veins; configuration and mineralogy of hypogene altera-tion zones, especially pyrite/copper sulfide and acid-buffering capacity; erosion and oxidation rates (climate), tectonism, topography, and time.
Supergene copper oxide ore zones are tens to several hundred meters thick, and consist of tens to several hundred megatons at 0.3 to greater than 1 percent copper. Exotic oxide ore zones are tens to several hundred megatons at 0.3 to greater than 1 percent copper. Enriched copper sulfide ore zones are mostly tens to several hundred meters thick and consist of tens of megatons to greater than 1.5 gigatons at 0.4 to 1.7 percent copper. Enriched copper sulfide ores are invari-ably higher grade than underlying hypogene ore or copper-mineralized rock, whereas grades of copper oxide ore zones are both lower and higher than grades of hypogene sources. Relatively low cost recovery of copper from oxide minerals by acid dissolution and precipitation of copper from solution has enabled processing of low-grade oxide deposits. The thickness of leached capping is highly variable and ranges from 0 to several hundred meters in most PCDs.
Common copper minerals in oxide ores include mala-chite, azurite, cuprite, tenorite, chrysocolla, native copper, copper wad, and atacamite; numerous other copper carbon-ate, oxide, silicate, and sulfate minerals are present in small amounts. These minerals occur as crystalline aggregates and crystals that fill fractures and line voids in leached capping, and in micrometer-to-millimeter aggregates that impregnate alteration and primary minerals in enriched copper sulfide ore, and less often, in hypogene ore. The complex paragenetic rela-tionships and disequilibrium mineral associations common in copper oxide ores reflect changing chemical conditions during weathering cycles.
Copper in enriched sulfide ore is mostly in sooty to fine-grained chalcocite; lesser copper is derived from covellite and CuxSy minerals. Forms and distribution of chalcocite largely match the forms and distribution of the sulfide minerals (chal-copyrite and pyrite) in hypogene ore that are replaced by chal-cocite, either completely or partially (rims, internal fractures). Ferrimolybdite is the common molybdenum mineral in copper oxide ores and leached capping; forms (and enrichment) of gold and silver in PCDs are not well documented.
Hypogene and Supergene Gangue Characteristics
Porphyry copper ore consists mostly (more than 98 per-cent) of valueless minerals, or gangue, that are discarded during processing for recovery of copper, molybdenum, gold, and silver. Gangue includes primary minerals of host rocks, hypogene hydrothermal minerals, and supergene minerals that do not contain recoverable copper and molybdenum. Rock that contains no copper or molybdenum (100 percent gangue minerals), or too little copper and molybdenum for processing, is called waste. Many gangue minerals formed by hypogene and supergene processes have lower densities than the primary rock-forming minerals and hypogene hydrothermal minerals they replace. Lower density gangue minerals, combined with voids created by mineral dissolution, generally decrease physi-cal competency of ore and waste and affect mine design.
Hypogene gangue consists of primary rock-forming and hydrothermal minerals, including plagioclase, potassium feld-spar, quartz, micas, chlorite, epidote, amphiboles, pyroxenes, calcite, garnet, aluminum-silicate-sulfate minerals (kaolin-ite, illite, dickite, alunite, andalusite, and pyrophyllite), and accessory minerals (iron-titanium oxides, apatite, and zircon). A large number of other hydrothermal silicate, oxide, sulfate, phosphate, and carbonate minerals locally constitute hypogene hydrothermal gangue. The distribution of primary rock-forming gangue minerals follows the distribution of rock types that compose PCDs, whereas hypogene hydrothermal gangue minerals follow the zoning patterns of copper, molybdenum, and alteration minerals. Although hypogene gangue mineral textures and grain sizes are largely inherited from host rocks, primary host-rock textures and grain sizes are invariably modi-fied by alteration processes to finer grained and often lower density mineral aggregates.
Supergene gangue consists of primary rock-forming minerals, hydrothermal minerals, and minerals formed by weathering including silica phases (chalcedony, opal), kaolin-ite, illite, montmorillonite, alunite, limonite (goethite, hema-tite, and jarosite), and manganese oxides. With the exception of goethite, jarosite, and most manganese oxide minerals, common hypogene and supergene gangue minerals are the same species, although illite, kaolinite, and silica minerals commonly are added and locally replace hypogene minerals. Gangue mineral origins often can be distinguished by location,
Summary of Porphyry Copper Deposit Model 5
texture, density, mineral associations, and mineral properties (crystallinity, chemical composition, and isotope composition). Textures and grain sizes of supergene gangue usually reflect several cycles of weathering and enrichment. In copper oxide ore near the surface, supergene gangue consists of low-density and porous, fine- to very fine grained aggregates of residual and derivative rock components, mainly silica, kaolinite, and limonite; such ore is essentially mineralized leached capping. In supergene-enriched copper sulfide ore beneath oxide ore, gangue consists of earlier formed supergene minerals and primary rock-forming minerals, and gangue texture is largely inherited from host-rock texture.
Ore in PCDs is nearly entirely composed of hypo-gene and supergene gangue minerals, and the physical and chemical properties of gangue minerals, coupled with copper±molybdenum±gold grade, determine feasibility of mining PCDs. Physical properties, including hardness, fracture and vein density, and particle-size distribution after blasting and crushing, determine mining equipment requirements, ore/waste stripping ratios (pit slopes), blast hole density, crushing capacity, truck tire replacement frequency, and mill design. Gangue minerals that react with processing reagents, generate acid (pyrite), and require sulfur control (all sulfide minerals) further influence mill design and copper recov-ery methods. Gangue properties largely control mining and processing (operating) costs, strongly influence capital costs and production rates, and ultimately determine the profitability of producing copper±molybdenum±gold±silver from a PCD.
Compositions and textures of iron oxide minerals (limo-nite), often components of gangue, are useful in PCD explora-tion and evaluation because precursor sulfide mineralogy of leached capping (pyrite, chalcopyrite, chalcocite, enargite) can be interpreted by the mineralogy (goethite, hematite, jarosite), color, texture, and origin of residual limonite.
Hydrothermal Alteration
Hydrothermal alteration refers to metasomatic processes that change the composition, mineralogy, and texture of rocks that constitute a porphyry copper system. In porphyry envi-ronments, wall-rock alteration is intimately linked to narrow veins, commonly 0.1 to 10 cm in width, that typically make up less than 1 to 5 volume percent of ore but also are present in other alteration zones. Hydrothermal alteration is character-ized by ionic metasomatism, including alkali metasomatism and hydrolytic (or acidic) reactions, oxidation-reduction reac-tions (including sulfidation), solubility-induced precipitation reactions, such as quartz precipitation, and hydration-carbon-ation reactions in which water or carbonate is added.
Several types of wall-rock alteration characterize porphyry copper ore zones (see fig. E4). These alteration types extend upward and outward several kilometers from deposit centers and are spatially and temporally zoned. Major alteration types commonly present in porphyry copper deposits are (1) potassic, (2) sericitic, (3) advanced argillic,
(4) intermediate argillic, (5) propylitic, (6) sodic-calcic and sodic, (7) greisen, and (8) skarn.
Potassic alteration includes replacement and vein potassium phases, potassium feldspar and biotite; potassium feldspar addition characteristically is the dominant potassium mineral in silicic or granitic wall rocks, whereas biotite is the dominant potassium mineral in intermediate or mafic compo-sition wall rocks. Sulfide minerals in this alteration include bornite, chalcopyrite, and(or) pyrite. Magnetite, molybdenite, anhydrite, and(or) calcite are other common minerals in this alteration. Potassic alteration is directly associated with abun-dant stockwork quartz-rich veins, including A veins (quartz-bornite-chalcopyrite ±magnetite±anhydrite±calcite), B veins (quartz±copper-iron-sulfides±molybdenite), and transitional AB veins, but also including veins dominated by biotite, magnetite, or copper-iron sulfides.
Sericitic alteration forms selvages typically a few centi-meters wide along structurally controlled “D” veins that lie on fractures and faults. Where these veins are closely spaced, this alteration may be pervasive in volumes up to 1 km3. D veins are dominated by sulfides and minor to major amounts of quartz. Sulfides commonly are strongly zoned from central chalcopyrite-rich veins cutting potassic ore zones upward or outward to pyrite-chalcopyrite veins to pyrite-dominated veins. Late veins tend to be pyrite-rich and may occur at all levels, even below ore zones. Sericitic alteration selvages are characterized by replacement of all rock minerals by fine-grained white potassium-mica (sericite) and quartz accompa-nied by a small percentage of pyrite or specular hematite.
Advanced argillic alteration refers to intense hydrolytic alteration and alkali-base cation leaching that forms alkali-free hydrous aluminum silicate minerals (pyrophyllite, dickite, and kaolinite, in order of decreasing thermal stability), local andalusite in high-temperature zones, alunite, and a variety of aluminum, fluorine, and silica-rich minerals, such as topaz, diaspore, zunyite, corundum, and dumortierite and pyrite. Quartz-rich zones in which all aluminum is also removed (residual silica alteration) are common in near-surface zones that are transitional to epithermal environments. Hypo-gene sulfides are dominated by pyrite and copper minerals including enargite, covellite, digenite, and less commonly, tetrahedrite/tennantite.
Intermediate argillic alteration refers to clay-bearing assemblages formed by hydrolytic alteration that typically forms at lower temperature than sericitic alteration and at rela-tively low pH but at higher pH than advanced argillic altera-tion at similar temperatures. In this alteration, smectite clay minerals or kaolinite replace plagioclase, igneous potassium feldspar is stable, and ferromagnesian minerals are replaced by chlorite and pyrite.
Propylitic alteration refers to alteration of igneous rocks by hydration, carbonation, oxidation, and locally sulfida-tion reactions to form assemblages rich in hydrous minerals and containing minor carbonate, sulfide and(or) hematite. Typical assemblages contain epidote, chlorite, or actinolite and in some cases, pyrite, at higher temperatures and chlorite,
6 Porphyry Copper Deposit Model
illite-sericite, or smectite and in some cases, pyrite, at lower temperatures as replacements of calcic plagioclase and ferro-magnesian minerals. Hypogene copper minerals are uncom-mon in propylitic alteration zones.
Sodic-calcic and sodic alteration refers to strong alkali alteration in which sodium and commonly calcium minerals are added and potassium and commonly iron minerals are destroyed. Characteristic alteration reactions are sodium-rich plagioclase replacement of potassium feldspar, and Ca-Fe-Mg mineral replacement of potassium-mica. Sodic-plagioclase, actinolite, epidote, chlorite, and titanite are typical added minerals. Calcic-pyroxene, calcic-plagioclase and local Ca-Al-Fe garnet may form at high temperatures (greater than 450°C).
Greisen refers to vein-selvage pairs with macro-scopically crystalline hydrothermal muscovite. Greisen consists of veins containing muscovite, quartz, and minor sulfides (pyrite greater than chalcopyrite) with potassium feldspar-muscovite selvages.
Skarn refers to Ca-Fe-Mg silicate minerals that have replaced carbonate and other wall rocks. Magnesium silicate minerals are dominant in dolomitic protoliths, and calcium-iron silicate minerals are dominant in limestone protoliths that most commonly host to PCD ores. Early anhydrous skarn typically consists of carbonate minerals replaced by garnet and calcium-rich pyroxene. Later actinolite is characteristic of hydrous skarn assemblages that overprint anhydrous skarn and commonly are associated with chalcopyrite-pyrite, magnetite, and ore formation.
Hydrothermal alteration minerals and assemblages are zoned spatially and temporally (see fig. E4). Hydrothermal alteration zones have kilometer-scale vertical and lateral dimensions that show significant variation in geometry, largely as a function of rock composition, depth, and orientation of more permeable zones, such as hydrofractured rock and porphyry dikes. Most notably, potassic and sericitic altera-tion are invariably associated with sulfide mineralization in PCDs and generally are temporally, spatially, and thermally zoned with respect to one another. Potassic alteration tends to be more centrally located, deeper, higher temperature, and earlier compared to sericitic alteration. Advanced argillic and sericitic alteration are commonly zonally arranged around fluid flow conduits, but advanced argillic and intermedi-ate argillic alteration assemblages may be adjacent to one another in the low-temperature and near-surface epithermal quartz-alunite environment overlying some porphyry systems. Advanced argillic alteration generally overlies potassic and sericitic alteration zones. Greisen forms sets of sheeted veins in the deep root zones of some porphyry copper systems that are formed from silicic, hornblende-poor granites. Sodic-calcic and sodic alteration form at deep levels and along the sides of some PCDs. Propylitic alteration in porphyry copper systems generally forms at shallow to moderate depths peripheral to central zones of advanced argillic, sericitic, and potassic alteration; propylitic zones may grade downward into deeper zones of sodic-calcic and sodic alteration.
Geochemical Characteristics
Geochemical characteristics of porphyry copper deposits result from a large number of physical and chemical processes, including magma generation, differentiation, emplacement, and degassing, high-temperature reactions between degassed fluids, crystallized intrusions, wall rocks, and meteoric and other nonmagmatic water, and near-surface reactions between low-temperature meteoric water and earlier formed, high-temperature minerals. Description of geochemical character-istics can be categorized by the type of material analyzed and analytic strategy; characteristics include lithochemistry of host rocks, minor-element zoning patterns, mineral compositions, and fluid compositions.
Major oxide and minor element compositions of premineralization, mineralized, and postmineralization rocks have been collected mainly by mining companies for explora-tion and mining applications. Applications include discrimina-tion of altered from unaltered host rocks by mass gains and losses and distinguishing mineralized from unmineralized intrusions (see fig. M1).
The spatial distribution of copper, molybdenum, silver, and gold, has been routinely determined at porphyry copper±molybdenum±gold mines for grade control and mine planning. Abundances of these and other minor elements in rocks, soils, and sediments also have been routinely used in exploring for PCDs (see fig. M3B). More recently, minor-element and isotope analyses of water (surface and subsur-face), gases, and floras have become common components of geochemical exploration programs.
The chemical and isotope compositions of hydrous igneous and hydrothermal minerals in PCDs, including biotite, chlorite, epidote, feldspar, amphibole, potassium-mica, and sulfide minerals, have been evaluated for discrimina-tion between mineralized and unmineralized intrusions, for quantification of magmatic variables (temperature, oxidation state, fugacities of H2O, HCl, HF, H2), and to define gradients outward from the central potassic alteration zones, although few data for minerals other than biotite have been published.
The physical properties and compositions of hydrother-mal fluids that formed PCDs have been directly determined by petrography, microthermometry, and analysis of fluid inclu-sions and indirectly determined by thermodynamic modeling of equilibrium reactions between hydrous fluids and igneous and hydrothermal mineral assemblages that make up PCDs. Fluid inclusion assemblages, or groups of coeval and unmodi-fied inclusions that represent a single fluid, have been used, in conjunction with alteration assemblages, to interpret processes that form PCDs, including temperatures, pressures, and compositions of ore and alteration fluids, and partitioning of metals and solutes between fluid phases, usually aqueous fluid or brine and water vapor (plus important but variable amounts of CO2, CH4, SO2, H2S, H2, and other volatiles).
Qualitative determination of the major components, relative ages, and evolution of fluids that formed PCDs, including identification of daughter minerals and some gases,
Summary of Porphyry Copper Deposit Model 7
paragenesis of fluid inclusion populations, and recognition of constant or variable phase ratios within populations, can be determined solely by petrographic examination of fluid inclusions in hydrothermal and igneous minerals. Quantitative minor-element compositions of fluids that formed PCDs have been derived entirely from analyses of fluid inclusions, which requires fairly advanced instrumentation. These minor-element analyses show that (1) early magmatic fluids contain elevated concentrations of metals, including Cu, Fe, Zn, Pb, and Mn, and (2) although phase separation during or after volatile exsolution from magma can cause concentration of copper, gold, arsenic, and sulfur into low-density vapor, metal trans-port by aqueous liquid or brine is also effective in concentrat-ing copper in deposits.
Stable isotope compositions of waters that form PCDs have been determined directly from fluids extracted from inclusions by crushing or thermal decrepitation of host miner-als in a vacuum (hydrogen, reported as δD in per mil), and from host minerals (hydrogen and oxygen, reported as δ18O in per mil, corrected for temperature fractionation). Stable isotope compositions indicate multiple water sources in addi-tion to time-space variations in water composition. In general, early potassic alteration and some sericitic (muscovite; potassium-mica) alteration are characterized by water isotope compositions similar to magmatic water. Other sericitic and argillic and advanced argillic (kaolinite, dickite, alunite, pyro-phyllite) alteration waters have δD and δ18O isotope values that are nearer to the meteoric water line or lower δ18O isotope values that reflect mixtures of magmatic and meteoric water involved in alteration processes.
Sulfur isotope compositions of fluids that deposited sulfide and sulfate minerals in porphyry copper systems comprise a large range because (1) the bulk sulfur isotopic composition of porphyry magmas varies considerably as a result of diverse sources of sulfur, brine-vapor immiscibility, and loss of sulfur during magma ascent; (2) variations in δ34S values due to the oxidation state of the fluid, which is largely determined by H2S/SO4
2–, and temperature; and (3) fraction-ation between simultaneously precipitating sulfide and sulfate minerals that can exceed 20 per mil at PCD temperatures. Analyses of coexisting pyrite-anhydrite and pyrite-alunite pairs from several PCDs suggest deposition from relatively oxidizing fluids with H2S/SO4
2– less than 0.5 to 1 and with variable δ34SΣS values (about +1 to +10 per mil).
Petrology of Associated Igneous Rocks
Porphyry copper deposits are centered in high-level intrusive complexes that commonly include stocks, dikes, and breccia pipes. Many deposits are focused in swarms of porphyry dikes that may radiate from larger intrusions or batholiths (see fig. E4). The deposits are formed at shallow (mostly 6 km or less) depth by fluids exsolved from under-lying crystallizing magmas emplaced at greater than 3–10-km depth in the upper crust and by external waters heated by those
magmas. Many known deposits are genetically related to inter-mediate to felsic calc-alkaline magmas in volcano-plutonic arcs formed above active subduction zones. These shallow, subvolcanic complexes typically are composed of multiple intrusions of varying composition. Porphyry copper miner-alization commonly forms near the end of magmatic cycles, and mineralized volcanic wall rocks may be significantly older than the ages of the intrusive rocks and ore.
Igneous rocks in porphyry copper deposits range from volcanic rocks through hypabyssal intrusions, including porphyry dikes, breccias, and small stocks, to coarse-grained plutons and batholiths. Plutons and batholiths hosting ore in many districts are older and unrelated to the ore-forming system but may be part of long-lived (millions to more than 10 m.y.) magmatic successions. In other districts, the plutons and batholiths are only slightly older (hundreds of thousands of years) and range from multiple large stocks to compos-ite batholiths. The upper parts of intrusions range in shape from cylindrical to broadly domal. Dike abundances vary from a few isolated dikes forming less than one percent of the rocks exposed in ore zones to dike swarms that host most ore. Multiple sets of porphyry dikes commonly are present in porphyry copper systems, and different sets of porphyry dikes may be pre-, syn-, and(or) post-ore. In tilted systems and in some well-exposed upright systems, successive generations of porphyry dikes emanate from successively deeper levels of the underlying pluton.
Textures of igneous rocks in porphyry copper deposits range from fine-grained porphyro-aphanitic to coarse-grained equigranular. Nearly all deposits contain exposures of “porphyry,” which is a strongly porphyritic hypabyssal intru-sive rock with a characteristic aplitic quartz-feldspar ground-mass (crystal sizes 0.02 to 0.3 mm). The aplitic groundmass is interpreted as a quench texture resulting from rapid ascent and loss of volatiles from the magma. Porphyry intrusions typically contain 35–55 percent fine- to medium-grained phenocrysts. The groundmass grain size tends to coarsen with increasing depth and grades to seriate and eventually hypidiomorphic-granular or granitic texture.
Intrusive, intrusion, and tectonic breccias are present in most porphyry copper systems. There are wide ranges in the composition of the breccia matrix and fragments and in the dimensions and geometry of these breccias that reflect their variable origins. Some breccias are cemented by hydrothermal minerals including copper sulfide minerals and can form high-grade ore, whereas many igneous breccias are barren and may dilute hypogene ore grades unless they contain older mineral-ized clasts.
A wide variety of igneous rock types and compositions are spatially associated with, or host, porphyry copper depos-its. Quartz monzonite, diorite, granodiorite, dacite, andesite, quartz diorite, and monzonite are the most commonly reported rock types. Porphyry intrusions associated with most porphyry copper deposits contain plagioclase phenocrysts; hornblende and biotite are common in intermediate composition intru-sions; clinopyroxene ± orthopyroxene is present in some
8 Porphyry Copper Deposit Model
more mafic composition intrusions, and in alkalic intrusions; and biotite, potassium feldspar, and quartz are common in intrusions with more silicic compositions. Common primary accessory minerals are magnetite, ilmenite and(or) titanite, apatite, and zircon. Magmatic anhydrite has been reported in some deposits.
Chemical analyses of the least altered rocks in porphyry copper deposits also indicate a wide range of rock compo-sitions. PCDs are associated with multiphase, shallowly emplaced, and moderately evolved granitic rocks (as shown by moderate silica contents and high potassium/rubidium and rubidium/strontium). The mineralizing stocks are oxidized (high whole-rock values of Fe2O3/FeO) magnetite-series rocks, and most contain magnetite and titanite. Porphyry copper deposits related to calc-alkaline magmas are enriched in large ion lithophile and fluid-mobile elements (for example, Cs, Rb, Ba, U, K, Pb, and Sr) and are relatively depleted in Nb, Ta, P, and Ti compared to primitive mantle. They also are commonly depleted in manganese and thorium. Mineralized intrusions have highly fractionated rare earth element (REE) patterns, commonly with heavy rare earth element (HREE) and yttrium depletions relative to barren intrusions. Mineralized intru-sions commonly have high lanthanum/ytterbium (40–60), high strontium/yttrium (mostly greater than 20), and chondrite-normalized REE patterns that have small negative or positive europium anomalies. Many of the minor-element and REE compositional features are similar to those of adakites.
Radiogenic isotope compositions (Pb-Nd-Sr-Hf-Os) of rocks that make up porphyry copper systems have wide varia-tions. There is a correlation of many porphyry copper magmas with isotopic and chemical compositions similar to adakite, and there is an inferred association of many of these magmas to ridge subduction processes. A wide range of lithologic sources is capable of explaining the observed compositional features, including Mid-Ocean Ridge Basalt (MORB), basaltic oceanic crust, lower crust, delaminated mantle, metasomatized mantle peridotite, and metasomatized lithosphere, and there is multiplicity of inferred tectonic environments that also enlarge the potential sources of porphyry copper system components. The radiogenic isotope data imply that a wide range of contri-butions from normal and enriched mantle, oceanic crust, and crust are involved with porphyry copper metallogenesis.
Theory of Ore Deposit Genesis
Geologic and geochemical evidence demonstrates that porphyry copper systems are predominantly formed by magmatic fluids that are released during shallow emplacement of porphyritic granitoid stocks. Formation of porphyry copper deposits involves a complex series of processes including magma generation, differentiation, emplacement, crystal-lization and degassing, high-temperature reactions between degassed fluids, crystallized intrusions, wall rocks, and mete-oric and other nonmagmatic waters, and near-surface reactions
between low-temperature meteoric water and earlier-formed, high-temperature minerals.
Sources of Fluids Geologic studies have long established an intimate
relationship between intrusions and zoned, high-temperature vein and alteration mineral assemblages in intrusive and adjacent wall rocks that imply magmatic sources of intro-duced components of PCDs (metals, water, sulfur, chlorine). Similarly, isotopic, fluid inclusion, and melt inclusion studies indicate mostly a magmatic origin for high-temperature fluids that are released during inward crystallization of shallowly emplaced intrusions (second boiling). The formation of many porphyry copper systems involves mixtures of magmatic fluids and nonmagmatic external fluids, although the latter are mostly involved in the waning stages of hydrothermal activ-ity when lower temperatures and hydrostatic pressure allow incursion of external water. External saline waters (sedimen-tary brines) were involved in the earlier stages of evolution of some porphyry copper systems, resulting in sodic and sodic-calcic alteration.
Controls on Permeability and Fluid FlowThe upper 10 km of continental crust commonly contains
groundwater under hydrostatic pressure conditions, in contrast to magma bodies that supply magmatic-hydrothermal fluids to porphyry copper systems at lithostatic pressures. In this environment, mafic magma injection, buoyancy of magmatic-hydrothermal fluids in cupolas of crystallizing magmas, or far-field tectonic stress may produce high strain rates that cause the ductile carapace of the magma chamber to brittlely fracture. Fractures produced by the magmatic-hydrothermal fluid dictate that virtually all magmatic-hydrothermal fluid flows from lithostatic to near-hydrostatic pressure conditions except after fracture sealing by vein minerals. Nonmagmatic fluids are hydrostatically pressured. Fractures typically are dominated by a single strike direction with a vertical dip where far-field tectonic stress fields are dominant, but in some cases, steep radial and shallow concentric fractures are present. These fractures produce parallel or so-called sheeted vein sets and the subparallel porphyry dike orientations typical of most porphyry copper deposits. Where such sheeted frac-tures are dominant, they can extend great distances (more than 5 km) laterally, as well as vertically from the source cupola. They may host porphyry dikes and be hydrothermally altered and provide fluid pathways for entry of external nonmagmatic fluids into the outer part of the hydrothermal system that cause sodic-calcic alteration.
Permeability in the column of rock from the cupola to the surface can be maintained as long as temperature/pressure gradients cause magmatic-hydrothermal fluids to ascend from the cupola. When these fluids cease to flow, fracture perme-ability decreases by precipitation of minerals, predominantly
Summary of Porphyry Copper Deposit Model 9
quartz, in fractures to form veins. Abundant A and B type quartz veins are precipitated from depressurized and cooled hydrothermal fluids at about 700° to 500°C, but retrograde quartz solubility in the temperature range of 350° to 500°C typically leads to local cycles of local dissolution and precipi-tation, so that fractures do not seal between 500° and 350°C.
Chemical Transport and Transfer ProcessesFluid-phase separation from porphyry copper magmas
fractionates water, metals, sulfur and other volatiles from the crystallizing magma. In a few shallow porphyry plutons (less than 5-km depth), separate brine-rich and vapor-rich fluids may directly separate from magma. In most cases, fluids derived from magma at more than 1.4-kilobar pressure (greater than 5-km depth) are a single, supercritical phase and have moderate to low salinities (about 3–5 weight percent). With declining pressure, single-phase fluids separate into high-salin-ity brine and lower salinity vapor phases. Aqueous brines were thought to be the main agent of metal transport in porphyry copper deposits based on their abundance in fluid inclusions and their high metal contents and transport capacity. Recent studies of fluid inclusion compositions have demonstrated that low-density fluids perform an important function in transport of copper, gold, and sulfur, but that the subordinate mass of brine is also a key to transport of these components, as well as Fe, alkalis, W, Mo, Ag, Pb, and Zn. The relative importance of these two coexisting magmatic fluids in the transport and deposition of ore components is a topic of ongoing research and debate. In some cases, where evidence for separate brine and vapor is rare, moderate- to low-density magmatic fluids formed PCDs (including the giant Butte PCD in Montana).
Because the formation of porphyry deposits involves considerable volumes of fluid, a focusing mechanism is required. Most workers conclude that fluid flow foci are the apices (cupolas) of magma chambers, although apices seldom coincide with central volcanic structures where these struc-tures are present.
Heat-Transfer ProcessesIn porphyry copper systems, both conduction and advec-
tion redistribute the heat that is introduced with magmas. Most magmatic heat lost by conduction causes widespread, rela-tively uniformly distributed contact metamorphism. Magmatic heat is advectively transferred by aqueous fluids expelled from magma chambers and, if permeability is sufficient, by external fluids circulated by convection into thermal haloes of magmas. The amount of heat redistributed by fluids is generally subordinate to conductive heat transport. Advective redistribution of heat becomes dominant only in areas of high and sustained fluid flux, notably in upwelling zones over the tops or edges of intrusions or in highly permeable zones. The principal evidence for advective heat transport comes from the large volumes of high-temperature hydrothermal alteration
assemblages in and around intrusions and by the presence of veins. This alteration-centered pattern is expected, given the focused distribution of permeability due to fracturing by magmatic fluids.
Pressure Gradients
Pressures vary greatly during the formation of porphyry systems, both in host rocks and in ore-forming fluids. Pres-sures during the evolution of porphyry copper systems are governed by the interplay between (1) lithostatic gradients, reflecting the weight of overlying rocks; (2) hydrostatic gradients in hydrologic systems open to the surface; and (3) dynamic contributions related to magma emplacement, fluid release, and evolving thermal structure and permeabil-ity. Fluid pressures are near lithostatic values in the vicinity of magma chambers and decrease to near hydrostatic values above and lateral to the locus of magmatism in areas of lower temperature. Magmatic volatile separation (second boiling) releases considerable mechanical energy because of the large increase in total volume of the system. This energy release creates overpressures that commonly lead to brittle failure (hydrofracturing) of the wall rocks and, at high strain rates, the magmas themselves. Fluid pressure gradients vary markedly in orientation, and these pressure gradients drive fluid flow.
Wall-Rock Reaction and Ore-Mineral Deposition Processes
Copper-iron sulfide mineral precipitation is largely governed by temperature, availability of sulfur, and pH. The reaction, Cu+ + Fe2+
+ 2H2S + 0.25O2 = CuFeS2 + 3H+
+ 0.5H2O, can be used to understand distribution of copper-iron sulfides. First, low-pH (acidic) conditions tend to keep copper in solution. In low-pH fluids that produce sericitic and advanced argillic alteration, temperatures at which chalco-pyrite or other copper-iron sulfide minerals are precipitated are depressed with respect to the more neutral environment of potassic alteration. Second, decomposition of ferromagnesian minerals in wall rocks by fluid, such as hydrothermal biotite replacement of igneous hornblende in potassic alteration, both increases pH and supplies Fe2+ to the fluid, thereby resulting in precipitation of chalcopyrite. Third, at high temperatures, oxidized magmatic-hydrothermal fluids have SO2 contents greater than H2S contents. As the magmatic-hydrothermal fluid cools below 400°C, SO2 disproportionates by reaction with water to form sulfuric acid and H2S, and H2S combines with aqueous metal species to form copper-iron sulfide minerals.
Gold is likely transported as a bisulfide or other sulfur complex, and where sulfur is removed from the hydrother-mal fluid during copper-iron sulfide and pyrite precipitation, gold is also precipitated, usually as solid solution in bornite or chalcopyrite. Molybdenum likely is transported as molyb-denum hydroxide complex at high temperature. High fluid
10 Porphyry Copper Deposit Model
H2S concentrations and low pH will destabilize hydroxides, causing molybdenite (MoS2) to precipitate.
Relation between Alteration, Gangue, and VeinsQuartz, anhydrite, and calcite are the chief gangue miner-
als in hydrothermal veins, and their precipitation is driven both by solubility relationships and by wall-rock reactions. Silica solubility, except in the retrograde region, decreases as temperature and pressure decrease to produce A and AB type veins. Additional silica is liberated by way of feldspar hydro-lysis reactions producing sericitic alteration and likely is the source of most quartz in D veins in sericitic and advanced argillic zones. Anhydrite and calcite are common vein miner-als in potassic and some other alteration types. Magmatic-hydrothermal fluids supply acids, carbonate, and sulfate, and calcium is supplied largely by hydrolytic reactions that destroy calcium-bearing ferromagnesian silicates and the anorthite component of plagioclase. Anhydrite solubilities reach a minimum near about 400°C and are reflected in local precipi-tation in D veins with sericite; the bulk of anhydrite commonly forms in potassic alteration at slightly higher temperatures. Calcite has a wider temperature range and is common in high-temperature veins associated with potassic alteration, in distal parts of D veins with sericite envelopes, and in some propylitic zones.
Geoenvironmental Features
Geoenvironmental characteristics of porphyry copper deposits are important factors when evaluating the potential economic viability of undiscovered deposits and likely will be a factor in determining which deposits become future mines. The most important geoenvironmental features of PCDs include their enormous size, their potential for generating low to moderate amounts of acid due to the presence of pyrite, and their trace-element associations, which include copper, zinc, lead, and locally arsenic. Acid-neutralizing potential in these ores and their associated wastes is provided by the presence of feldspars and trace amounts of carbonate minerals. The presence of elevated acidity and concentrations of a variety of elements, especially Cu, Pb, Zn, Mo, and As, in soil, sediment, groundwater, and surface water prior to mining underscores the need for accurate baseline characterization to serve as a basis for establishing closure goals for proposed mines. Drainage on mine sites shows a strong link with the underly-ing geology of porphyry copper deposits. The pH of drainage can reach as low as 2 with total dissolved solids getting as high as 6 g/L. Sulfate is the dominant anionic species and Fe and aluminum can be important cations. Copper and zinc are the most significant trace metals. The toxicity to aquatic life of elements released to surface water depends on a variety of factors including pH, alkalinity, major and minor element composition, and dissolved organic carbon concentration of the water. Secondary phases may have solubilities that
are greater than or less than their precursor sulfide minerals, which determines their potential effects on aquatic ecosys-tems. The most prominent pathway for human-health threats is contamination of groundwater. However, both ecosystem and human-health threats can be prevented through sound environmental practices.
Porphyry Copper Deposit Exploration and Resource Assessment Objectives and Guides
Mineral resource assessments and exploration have a common initial focus—identification of mineral resources or the probable existence of mineral resources—but they have different objectives and approaches toward achieving those objectives. The objectives of mineral resource assessments by governments are to assist mineral resource development, to determine mineral resource endowment for strategic purposes such as dependency on external mineral supplies, and to support land-use planning that ultimately determines mineral resource availability. The objective of mineral resource explo-ration is to discover an economic mineral deposit.
Geologic data evaluated in PCD assessment and explo-ration are numerous and diverse (see fig. R1). They include regional-scale data, such as rock types, structure, intrusion types and ages, postmineralization cover, geophysical proper-ties, spectral imagery, distribution of known PCDs and other deposit types, and prospective depths of unidentified PCDs. Exploration also requires local-scale data including, in addi-tion to lithologies and structure, distribution of hydrother-mal minerals; vein abundance, mineralogy and paragenesis; minor-element and whole-rock geochemistry; fluid inclu-sion zoning and thermal gradients; chemical and isotopic compositions of minerals; detailed geophysical and spectral properties; and distribution of sulfide minerals. Within known systems, leached capping and iron- and copper-oxide mineral-ogy provide characteristics of subjacent enriched sulfide and hypogene mineralization. Much exploration data are obtained by geologic mapping and petrography. Collection of geophysi-cal, geochemical, and spectral data, mineral compositions, and quantitative fluid inclusion data requires advanced instru-mentation. Ultimately, the only way to determine the mineral endowment of a terrane is to explore it.
Broader Implications, Societal Relevance, and Knowledge Gaps of Porphyry Copper Deposits
Porphyry copper systems have broad implications for society. Beyond their importance as the principal source of copper and significant source of molybdenum, gold, and silver, the production of PCDs constitutes a major disturbance of the Earth’s surface and elicits diverse reactions from communities affected by their occurrence and production. Understanding deposit characteristics and distribution can have a broader effect on many other aspects of human activity.
B. Deposit Type and Associated Commodities 11
Many porphyry copper systems exist, and their evolu-tionary paths and fates differ. Most are eroded and dispersed, while others are deformed, dismembered, and preserved deeper into the geologic record. Mining of PCDs moves several cubic kilometers of the Earth’s upper crust per year, a volume comparable to arc volcanism (see fig. U1). Porphyry-related magmatic-hydrothermal systems comprise about 5–10 percent of the upper arc crust in the vicinity of magmatic centers, and hydrothermal alteration is ubiquitous in associated volcanic rocks. The volumes of economically mineralized rocks are a small fraction of the volume of crust affected by porphyry-related magmatic-hydrothermal systems. These larger volumes themselves comprise zones of distinc-tive geochemical anomalies, with baselines and environ-mental characteristics that affect significant regions within arc terrains.
Despite more than 100 years of investigation and produc-tion, many geologic aspects of porphyry copper systems remain poorly understood, and many aspects of their origins and of the origins of the environments that create them remain enigmatic. Complete four-dimensional documentation of porphyry copper systems is not available due to their large size, the lack of incentive to drill out entire systems, and where drilling exists, the focus on production-related aspects rather than many geological and geochemical aspects. Exist-ing data commonly are treated as proprietary. Thus funda-mental information about grade distribution, metal contents and ratios, and other elements of economic, scientific, and(or) environmental interest commonly are unavailable.
Another set of challenges for assessments arises from the lack of understanding of the potential for resources at the regional level. Fundamental questions remain about the nature of crustal structure, its correlation with ore-forming systems, and the consequences of postmineral events, especially under cover. Even given a general evaluation of a region’s resource potential, many land-use decisions are made on specific loca-tions and typically are made in the absence of area-specific data. Thus many decisions are made without the “best avail-able” science.
A. Introduction
(David A. John)
Porphyry copper deposits (PCDs) consist of disseminated copper minerals and copper minerals in veins and breccias that are relatively evenly distributed in large volumes of rock, forming high tonnage (greater than 100 million tons), low to moderate grade (0.3–2.0 percent copper) ores. Host rocks are altered, genetically related, porphyritic granitoid intru-sions and adjacent wall rocks. Porphyry copper deposits are the world’s most important source of copper, accounting for more that 60 percent of the annual world copper production
and about 65 percent of known copper resources (Sinclair, 2007; D.A. Singer, written commun., 2007). PCDs also are an important source of other metals, notably molybdenum, gold, and silver. Despite their relatively low grades, PCDs have significant societal and economic effects due to their large deposit size (commonly hundreds of millions to billions of metric tons), long mine lives, and scale of mining operations. Porphyry copper deposits also were the first type of metal-lic mineral deposit exploited by large-scale, open-pit mining methods in the early 20th century, a low-cost mining technique since adapted to other large tonnage, low-grade mineral depos-its (for example, gold and silver).
This model of porphyry copper deposits is part of a systematic effort by the USGS Mineral Resources Program to update existing, and develop new, descriptive mineral deposit models that are needed for an upcoming national mineral-resource assessment (http://minerals.cr.usgs.gov/projects/nat_assess_planning/index.html). Recently published models, both for porphyry deposits in general and specific to porphyry copper deposits, have added considerably to our knowledge of these systems (for example, Seedorff and others, 2005; Sinclair, 2007; Berger and others, 2008). This new deposit modeling effort by the USGS is intended to supplement these models by developing more inclusive models in a common format for use in mineral-resource and mineral-environmental assessments.
This new porphyry copper deposit model contains a summary of the characteristics of known deposits, including geological, geochemical, geophysical, and geoenvironmental aspects of these deposits. Models for the genesis of porphyry copper deposits are discussed, and areas where additional research is needed to understand the genesis of porphyry copper deposits are identified. Finally, the application of descriptive and genetic aspects of the model to mineral explo-ration and assessment of undiscovered deposits is discussed.
John Proffett and Lew Gustafson reviewed a draft version of this model and provided helpful comments and suggestions that markedly improved it.
B. Deposit Type and Associated Commodities
(David A. John)
Name
Porphyry copper
Synonyms
Porphyry copper-molybdenum, Porphyry copper-gold
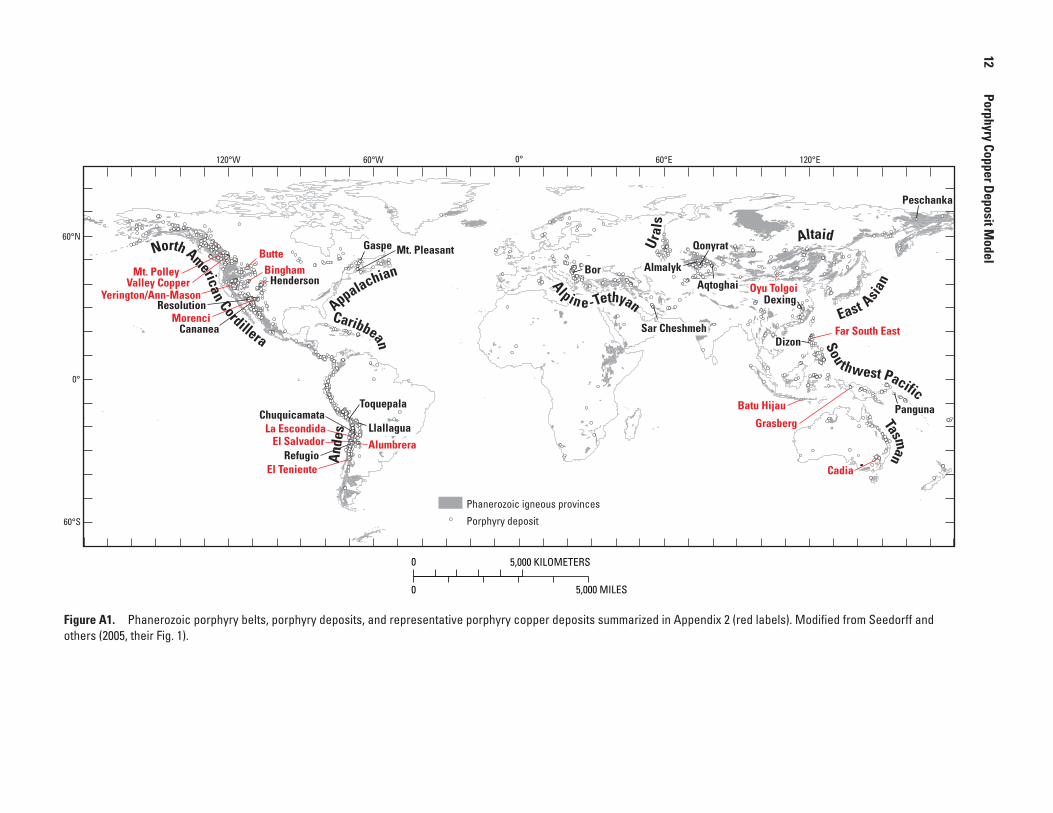
60°N
0°
60°S
120°W 60°W 0° 60°E 120°E
0 5,000 MILES
0 5,000 KILOMETERS
ButteBingham
Morenci
La Escondida
El Teniente
Alumbrera
Oyu Tolgoi
Batu Hijau
Grasberg
Cadia
Far South East
El Salvador
Mt. PolleyValley Copper
Resolution
Cananea
Llallagua
Toquepala
Yerington/Ann-MasonHenderson
Gaspe Mt. Pleasant
Chuquicamata
Refugio
Sar Cheshmeh
AlmalykBor
Qonyrat
AqtoghaiDexing
Dizon
Panguna
Peschanka
North American CordilleraAppalachian
Caribbean
Ande
s
Alpin e -Tethyan
Ural
s
Altaid
East Asia
n
Sou thwest Pacific
Tasman
Phanerozoic igneous provinces
Porphyry deposit
Figure A1. Phanerozoic porphyry belts, porphyry deposits, and representative porphyry copper deposits summarized in Appendix 2 (red labels). Modified from Seedorff and others (2005, their Fig. 1).
12
Porphyry Copper Deposit Model
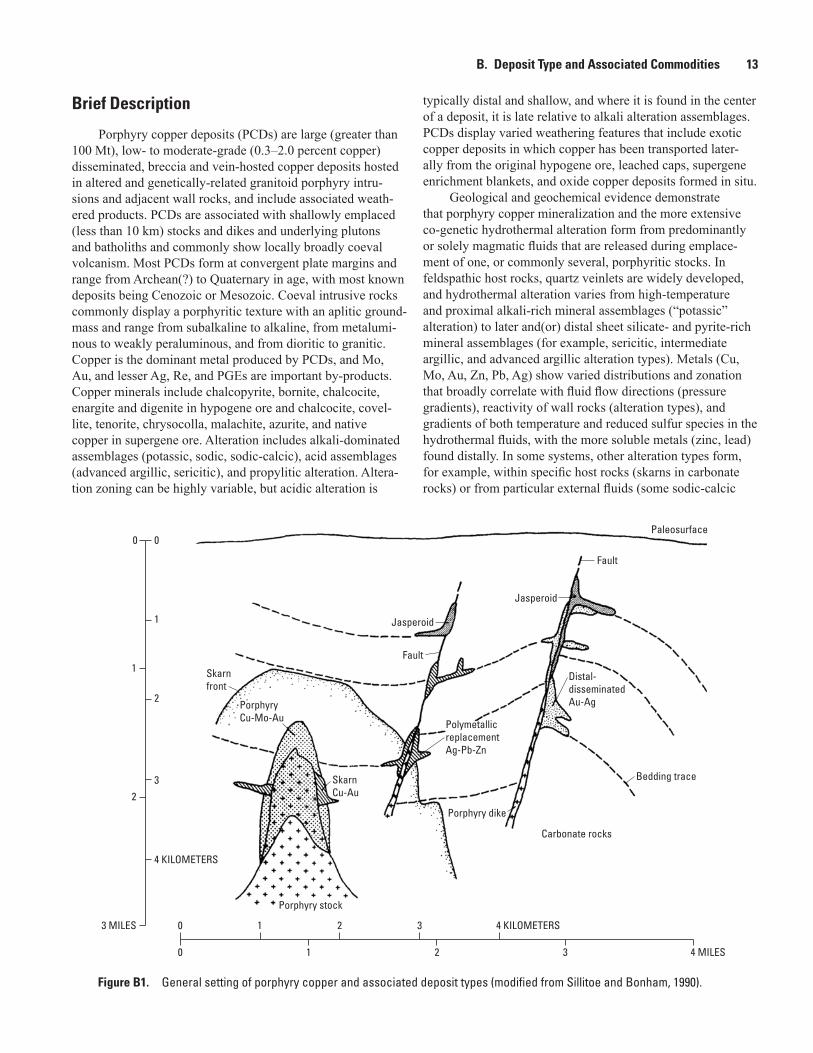
Figure B1. General setting of porphyry copper and associated deposit types (modified from Sillitoe and Bonham, 1990).
Distal-disseminatedAu-AgPorphyry
Cu-Mo-Au
SkarnCu-Au
PolymetallicreplacementAg-Pb-Zn
Paleosurface
Fault
Jasperoid
Jasperoid
Fault
Skarnfront
Porphyry dike
Porphyry stock
Carbonate rocks
Bedding trace
4 KILOMETERS
3
2
1
00
3 MILES
1
0 1 2 3 4 KILOMETERS
0 1 2 3 4 MILES
2
B. Deposit Type and Associated Commodities 13
Brief Description
Porphyry copper deposits (PCDs) are large (greater than 100 Mt), low- to moderate-grade (0.3–2.0 percent copper) disseminated, breccia and vein-hosted copper deposits hosted in altered and genetically-related granitoid porphyry intru-sions and adjacent wall rocks, and include associated weath-ered products. PCDs are associated with shallowly emplaced (less than 10 km) stocks and dikes and underlying plutons and batholiths and commonly show locally broadly coeval volcanism. Most PCDs form at convergent plate margins and range from Archean(?) to Quaternary in age, with most known deposits being Cenozoic or Mesozoic. Coeval intrusive rocks commonly display a porphyritic texture with an aplitic ground-mass and range from subalkaline to alkaline, from metalumi-nous to weakly peraluminous, and from dioritic to granitic. Copper is the dominant metal produced by PCDs, and Mo, Au, and lesser Ag, Re, and PGEs are important by-products. Copper minerals include chalcopyrite, bornite, chalcocite, enargite and digenite in hypogene ore and chalcocite, covel-lite, tenorite, chrysocolla, malachite, azurite, and native copper in supergene ore. Alteration includes alkali-dominated assemblages (potassic, sodic, sodic-calcic), acid assemblages (advanced argillic, sericitic), and propylitic alteration. Altera-tion zoning can be highly variable, but acidic alteration is
typically distal and shallow, and where it is found in the center of a deposit, it is late relative to alkali alteration assemblages. PCDs display varied weathering features that include exotic copper deposits in which copper has been transported later-ally from the original hypogene ore, leached caps, supergene enrichment blankets, and oxide copper deposits formed in situ.
Geological and geochemical evidence demonstrate that porphyry copper mineralization and the more extensive co-genetic hydrothermal alteration form from predominantly or solely magmatic fluids that are released during emplace-ment of one, or commonly several, porphyritic stocks. In feldspathic host rocks, quartz veinlets are widely developed, and hydrothermal alteration varies from high-temperature and proximal alkali-rich mineral assemblages (“potassic” alteration) to later and(or) distal sheet silicate- and pyrite-rich mineral assemblages (for example, sericitic, intermediate argillic, and advanced argillic alteration types). Metals (Cu, Mo, Au, Zn, Pb, Ag) show varied distributions and zonation that broadly correlate with fluid flow directions (pressure gradients), reactivity of wall rocks (alteration types), and gradients of both temperature and reduced sulfur species in the hydrothermal fluids, with the more soluble metals (zinc, lead) found distally. In some systems, other alteration types form, for example, within specific host rocks (skarns in carbonate rocks) or from particular external fluids (some sodic-calcic
14 Porphyry Copper Deposit Model
alteration from brines). The distribution of alteration types and associated geochemical anomalies underpins the geochemical and geophysical signatures that allow effective exploration and assessment of porphyry copper deposits.
Associated and Transitional Deposit Types
A wide variety of mineral deposits may be genetically associated with porphyry copper deposits. More common types of deposits with primary metals recovered in parentheses are listed below and shown in a schematic cross section where they most frequently occur (fig. B1):
• Skarns (including Cu, Fe, Au, Zn types)
• Polymetallic replacement (Ag, Pb, Zn, Cu, Au)
• Polymetallic veins (Au, Ag, Cu, Zn, Pb, Mn, As)
• Distal disseminated gold-silver (Au, Ag)
• Epithermal gold-silver vein (intermediate/low sulfida-tion) (Ag, Au, Pb, Zn)
• High sulfidation epithermal (Au, Ag, Cu, As)The presence of any or all of these deposit types does not
directly indicate the existence of a nearby porphyry copper deposit, and similarly, their absence does not preclude the occurrence of a nearby porphyry copper deposit.
With increasing molybdenum/copper, porphyry copper deposits are transitional to low fluorine (quartz monzonite type) porphyry molybdenum deposits, and with increasing gold/copper, they are transitional to porphyry gold deposits (Seedorff and others, 2005).
Primary Commodities
Copper is the primary commodity in all porphyry copper deposits, although molybdenum and gold are co-products in some deposits.
By-Product Commodities
Molybdenum, gold, and silver are the main by-products recovered from porphyry copper deposits.
Trace Constituents
Rhenium, tellurium, platinum group elements (PGEs), arsenic, and zinc are commonly present in elevated concen-trations in porphyry copper deposits and are recovered from some deposits. Molybdenite in PCDs is a major source of rhenium. Tellurium is produced mostly from anode slimes collected from electrolytic copper refining. Small amounts of PGEs are recovered from smelting of copper ore from Bingham Canyon in Utah, and perhaps other deposits.
Example Deposits
Singer and others (2008) reported grade and tonnage data for 422 well-explored deposits worldwide and used these data in their porphyry copper grade and tonnage models. In addition to copper grades, their compilation included molyb-denum, gold, and silver grades where available. Singer and others’ compilation included more than 250 additional deposits that lack grade and tonnage data. In the Appendix are summa-ries of 15 representative deposits that highlight the diverse characteristics and settings of porphyry copper deposits.
C. History of Porphyry Copper Deposits
(Frederick T. Graybeal)
The earliest mining of porphyry copper systems in the United States is thought to have been in the 1700s by Spanish explorers (Parsons, 1933). Recorded mining of these systems began in 1864 with production of gold- and silver-bearing lead ores at Bingham Canyon in Utah, and placer gold mining at Butte, Montana (Meyer and others, 1968). Mining of oxidized copper ores began at Morenci, Arizona, in 1870 (Parsons, 1933). The early high-grade oxidized copper ores were often shipped on mules to the Pacific coast where they were loaded on ships destined for smelters in Swansea, Wales (Meyer and others, 1968). These early efforts quickly evolved to selective underground mining and local smelting of high-grade copper oxide and sulfide-bearing vein and carbonate replacement deposits.
The transformative event in the history of porphyry copper deposits was a September 1899 report by D.C. Jackling and R.C. Gemmell that proposed development of a new mine using “quarrying or open-pit methods” at the Utah Copper Company property in Bingham Canyon, Utah (Parsons, 1933). Stripping of the open pit ores began in 1906. The 1933 book by Parsons, titled “The Porphyry Coppers,” documents the financing, engineering, and development of 12 differ-ent porphyry copper deposits beginning with production at Bingham. The foreword of that book notes that the expanded use of electricity for the 20th century development of the United States could not have occurred without the reliable and large supply of copper provided by open-pit mining of porphyry copper deposits.
A thorough review of the evolution of geological thought on porphyry copper deposits is in the Jackling Lecture by S.R. Titley (1997). He noted that Emmons (1918) may have been the first to use the term “porphyry copper deposit.” Prior to that time the accepted term was “disseminated copper deposit.”Although the spatial relationship with porphyritic granitoid intrusions had been recognized, it was not clear that the relationship was genetic (consult Ransome, 1919). At this point in time, genetic discussions were focused largely on supergene enrichment processes. Both descriptive terms noted
D. Regional Environment 15
above were widely used in concurrent publications for the next several decades. Parsons (1933) noted that the essential char-acteristics of these deposits were (1) large size, (2) uniform dissemination of copper minerals, and (3) low grade of the ore.
Also in 1933, the AIME published a second book titled “Ore Deposits of the Western States,” which used only the term “disseminated copper deposits” and included a 2-page discussion of genesis. As late as 1948 the term was still written as “porphyry” copper deposits (McKinstry, 1948), reflecting an ongoing uncertainty as to the precise nature of the term.
Research on porphyry copper deposits was stimulated by the first book dedicated entirely to that subject by Titley and Hicks (1966), which contains the only known discussion and diagram of features important during exploration (Jerome, 1966). This book was followed by the first Penrose conference on porphyry copper deposits in 1969, a compilation by Lowell and Guilbert (1970) with the first diagram of a genetic model of these deposits, and the first conference on porphyry copper deposits organized by the Arizona Geological Society (1976). In addition to field work done by the U.S. Geological Survey (USGS) in the early 20th century that established a geologic framework for understanding porphyry copper deposit geology, the USGS also supported groundbreaking laboratory research on the chemical processes operating in these deposits (for example, Hemley and Jones, 1964). Publications have increasingly focused on hypogene genesis and genetic models, all summarized in important compilations by Seedorff and others (2005) and Sillitoe (2005), although studies of super-gene processes have lagged somewhat. As of 2009 there was still no generally accepted, short, one-sentence definition of a porphyry copper deposit.
Exploration for porphyry copper deposits expanded rapidly after World War II when managed exploration programs were established by many large mining companies. Discoveries in the Western United States and Canada were made at an increasing rate until the early 1970s. At that time, passage of the Clean Air Act in the United States in 1975 required major investments by mining companies to reduce fugitive emissions from their operations, exploration had greatly depleted the inventory of porphyry copper systems that were at least partially exposed for examination, and the price of gold had increased markedly. These events reduced funding for porphyry copper exploration in the United States and accelerated exploration in other countries, largely on the Pacific Rim, where regulatory policies were less strict, where porphyry copper-related features were exposed in outcrop, and where the metallogeny favored the discovery of gold. Discov-ery rates in these areas initially increased but have fallen in recent years, reflecting the rapid depletion of the inventory of exposed ore deposits or hydrothermal systems. More recent events related to political instability and security, the rise of resource nationalism, changing legal and financial policies, and the worldwide application of modern environmental poli-cies by major lending institutions have rekindled interest in exploration for porphyry copper deposits in North America. This exploration work has focused on a reexamination of
the geology of old mining districts, the application of new geologic concepts, and the evaluation of prospective areas under postmineral cover.
D. Regional Environment
(David A. John, John H. Dilles, and Peter G. Vikre)
Geotectonic Environment
(David A. John)
Most porphyry copper deposits form in subduction-related magmatic arcs along convergent plate margins, both in continental and oceanic settings (for example, Sillitoe, 1972; Sillitoe and Hedenquist, 2003; Richards, 2003a; fig. D1A). In these magmatic arcs, deformation can be very complex, and porphyry copper deposits can form in a variety of tectonic settings (for example, Tosdal and Richards, 2001; Richards, 2009). In recent years it has become apparent that some porphyry copper deposits form in back-arc or postsubduction settings where tectonic affinity is more poorly understood, especially as is the case of most Mesozoic or older deposits (for example, Cloos and Housh, 2008; Richards, 2009). More details on the relationship of regional- to local-scale structures to porphyry copper deposits are discussed in the “Relations to Structures” section herein.
Porphyry copper systems are widespread, but they seem to be localized in time and space within the overall evolution-ary pattern of magmatic arcs along plate convergent margins (fig. A1). In most cases, arc crust is relatively thick, and there is evidence for broadly coeval contractional or transpressional tectonism. In detail, some authors have suggested that many porphyry copper deposits formed during unusual periods of subduction, including flat or shallow subduction induced by subduction of buoyant oceanic features, such as ridges, ocean plateaus, and seamount chains, during subduction-zone erosion, or during episodes of plate reorganization. For example, in the Andes, multiple belts of porphyry copper deposits formed from the Late Paleozoic to the Pliocene in continental-margin magmatic arcs that are related to subduc-tion of the Farallon and Nazca plates beneath South America (fig. D2; Sillitoe and Perrellό, 2005). Three Tertiary metal-logenic belts contain most known porphyry copper deposits, including many of the world’s largest deposits. Sillitoe and Perrellό suggest that compression possibly related to flatten-ing of the underthrust slabs induced crustal thickening and suppressed volcanism. Combined with high rates of surface uplift and rapid exhumation, this resulted in optimization of the conditions for accumulation of fluid-rich magma in large, shallow-level chambers favorable for development of giant porphyry copper deposits (fig. D3). In Southeast Asia and the western Pacific, numerous porphyry copper depos-its are related major Cenozoic magmatic arcs constructed
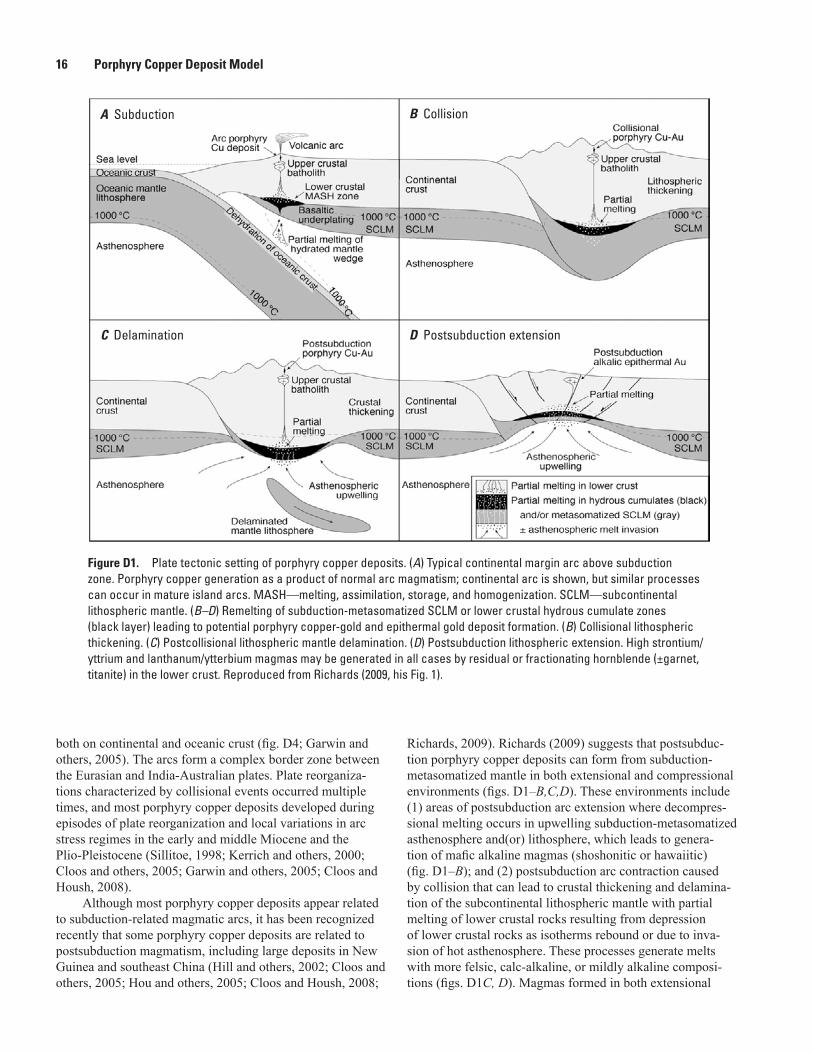
Figure D1. Plate tectonic setting of porphyry copper deposits. (A) Typical continental margin arc above subduction zone. Porphyry copper generation as a product of normal arc magmatism; continental arc is shown, but similar processes can occur in mature island arcs. MASH—melting, assimilation, storage, and homogenization. SCLM—subcontinental lithospheric mantle. (B–D) Remelting of subduction-metasomatized SCLM or lower crustal hydrous cumulate zones (black layer) leading to potential porphyry copper-gold and epithermal gold deposit formation. (B) Collisional lithospheric thickening. (C) Postcollisional lithospheric mantle delamination. (D) Postsubduction lithospheric extension. High strontium/yttrium and lanthanum/ytterbium magmas may be generated in all cases by residual or fractionating hornblende (±garnet, titanite) in the lower crust. Reproduced from Richards (2009, his Fig. 1).
A Subduction B Collision
C Delamination D Postsubduction extension
16 Porphyry Copper Deposit Model
both on continental and oceanic crust (fig. D4; Garwin and others, 2005). The arcs form a complex border zone between the Eurasian and India-Australian plates. Plate reorganiza-tions characterized by collisional events occurred multiple times, and most porphyry copper deposits developed during episodes of plate reorganization and local variations in arc stress regimes in the early and middle Miocene and the Plio-Pleistocene (Sillitoe, 1998; Kerrich and others, 2000; Cloos and others, 2005; Garwin and others, 2005; Cloos and Housh, 2008).
Although most porphyry copper deposits appear related to subduction-related magmatic arcs, it has been recognized recently that some porphyry copper deposits are related to postsubduction magmatism, including large deposits in New Guinea and southeast China (Hill and others, 2002; Cloos and others, 2005; Hou and others, 2005; Cloos and Housh, 2008;
Richards, 2009). Richards (2009) suggests that postsubduc-tion porphyry copper deposits can form from subduction-metasomatized mantle in both extensional and compressional environments (figs. D1–B,C,D). These environments include (1) areas of postsubduction arc extension where decompres-sional melting occurs in upwelling subduction-metasomatized asthenosphere and(or) lithosphere, which leads to genera-tion of mafic alkaline magmas (shoshonitic or hawaiitic) (fig. D1–B); and (2) postsubduction arc contraction caused by collision that can lead to crustal thickening and delamina-tion of the subcontinental lithospheric mantle with partial melting of lower crustal rocks resulting from depression of lower crustal rocks as isotherms rebound or due to inva-sion of hot asthenosphere. These processes generate melts with more felsic, calc-alkaline, or mildly alkaline composi-tions (figs. D1C, D). Magmas formed in both extensional
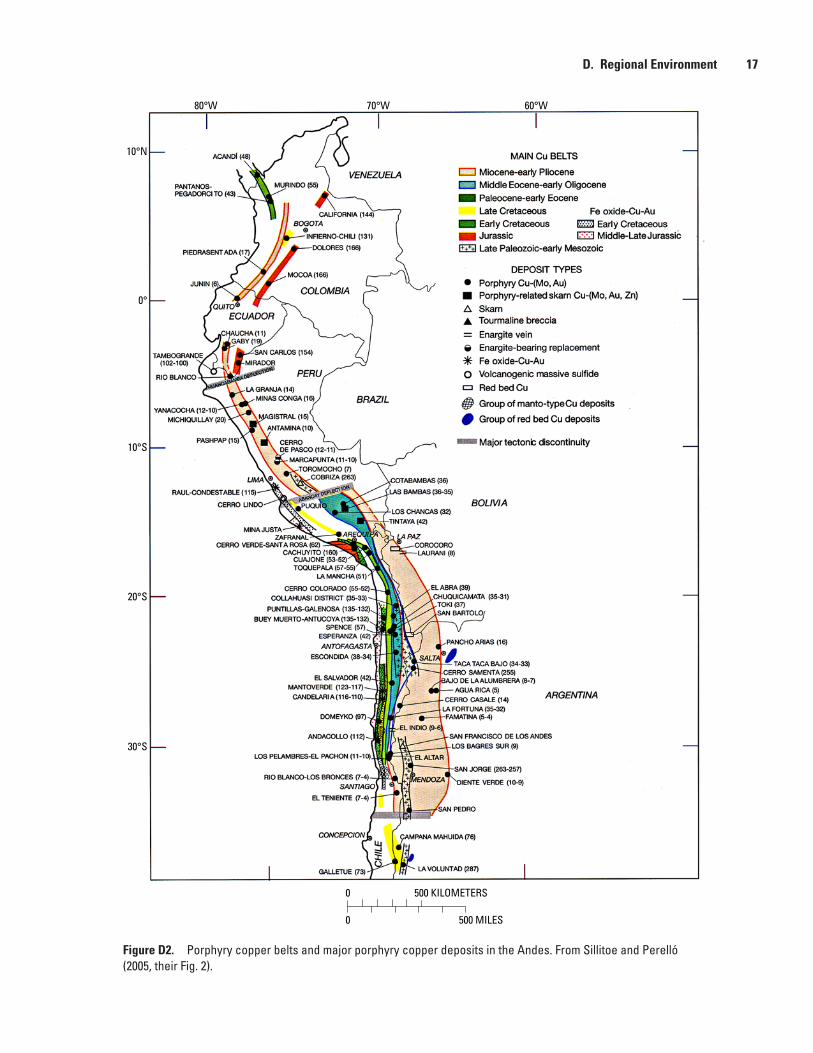
Figure D2. Porphyry copper belts and major porphyry copper deposits in the Andes. From Sillitoe and Perelló (2005, their Fig. 2).
0 500 KILOMETERS
0 500 MILES
30°S
20°S
10°S
0°
10°N
80°W 70°W 60°W
D. Regional Environment 17
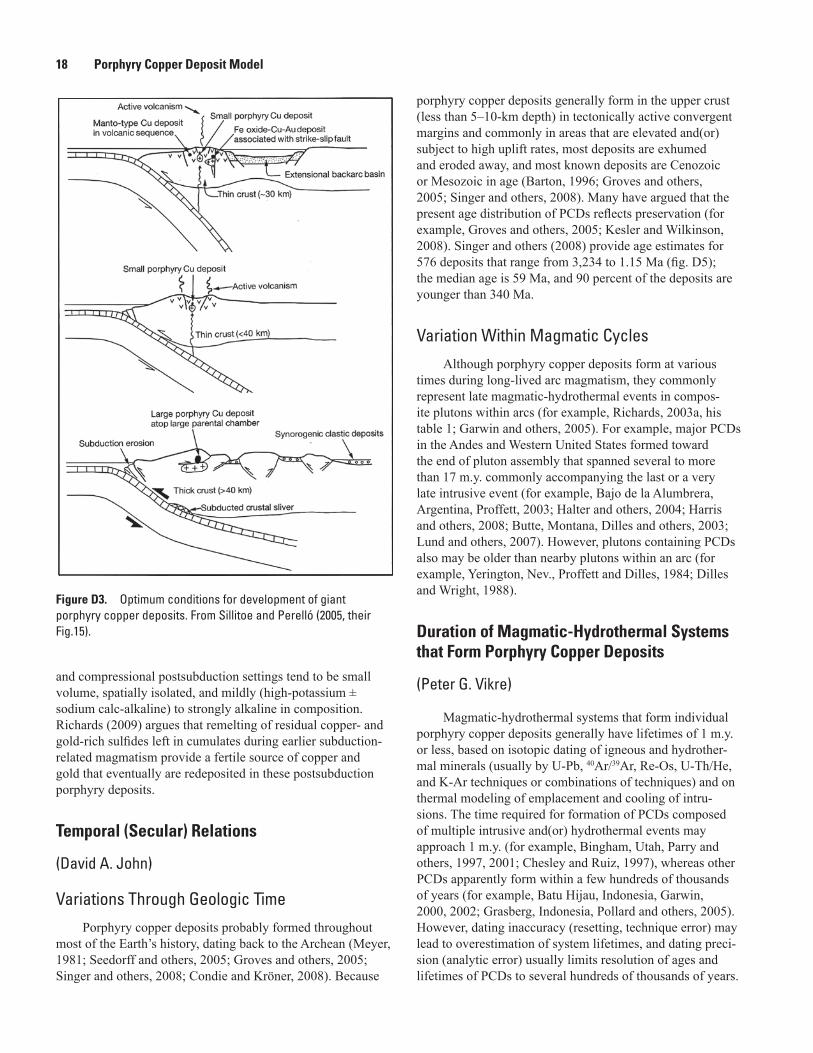
Figure D3. Optimum conditions for development of giant porphyry copper deposits. From Sillitoe and Perelló (2005, their Fig.15).
18 Porphyry Copper Deposit Model
and compressional postsubduction settings tend to be small volume, spatially isolated, and mildly (high-potassium ± sodium calc-alkaline) to strongly alkaline in composition. Richards (2009) argues that remelting of residual copper- and gold-rich sulfides left in cumulates during earlier subduction-related magmatism provide a fertile source of copper and gold that eventually are redeposited in these postsubduction porphyry deposits.
Temporal (Secular) Relations
(David A. John)
Variations Through Geologic Time
Porphyry copper deposits probably formed throughout most of the Earth’s history, dating back to the Archean (Meyer, 1981; Seedorff and others, 2005; Groves and others, 2005; Singer and others, 2008; Condie and Kröner, 2008). Because
porphyry copper deposits generally form in the upper crust (less than 5–10-km depth) in tectonically active convergent margins and commonly in areas that are elevated and(or) subject to high uplift rates, most deposits are exhumed and eroded away, and most known deposits are Cenozoic or Mesozoic in age (Barton, 1996; Groves and others, 2005; Singer and others, 2008). Many have argued that the present age distribution of PCDs reflects preservation (for example, Groves and others, 2005; Kesler and Wilkinson, 2008). Singer and others (2008) provide age estimates for 576 deposits that range from 3,234 to 1.15 Ma (fig. D5); the median age is 59 Ma, and 90 percent of the deposits are younger than 340 Ma.
Variation Within Magmatic Cycles
Although porphyry copper deposits form at various times during long-lived arc magmatism, they commonly represent late magmatic-hydrothermal events in compos-ite plutons within arcs (for example, Richards, 2003a, his table 1; Garwin and others, 2005). For example, major PCDs in the Andes and Western United States formed toward the end of pluton assembly that spanned several to more than 17 m.y. commonly accompanying the last or a very late intrusive event (for example, Bajo de la Alumbrera, Argentina, Proffett, 2003; Halter and others, 2004; Harris and others, 2008; Butte, Montana, Dilles and others, 2003; Lund and others, 2007). However, plutons containing PCDs also may be older than nearby plutons within an arc (for example, Yerington, Nev., Proffett and Dilles, 1984; Dilles and Wright, 1988).
Duration of Magmatic-Hydrothermal Systems that Form Porphyry Copper Deposits
(Peter G. Vikre)
Magmatic-hydrothermal systems that form individual porphyry copper deposits generally have lifetimes of 1 m.y. or less, based on isotopic dating of igneous and hydrother-mal minerals (usually by U-Pb, 40Ar/39Ar, Re-Os, U-Th/He, and K-Ar techniques or combinations of techniques) and on thermal modeling of emplacement and cooling of intru-sions. The time required for formation of PCDs composed of multiple intrusive and(or) hydrothermal events may approach 1 m.y. (for example, Bingham, Utah, Parry and others, 1997, 2001; Chesley and Ruiz, 1997), whereas other PCDs apparently form within a few hundreds of thousands of years (for example, Batu Hijau, Indonesia, Garwin, 2000, 2002; Grasberg, Indonesia, Pollard and others, 2005). However, dating inaccuracy (resetting, technique error) may lead to overestimation of system lifetimes, and dating preci-sion (analytic error) usually limits resolution of ages and lifetimes of PCDs to several hundreds of thousands of years.
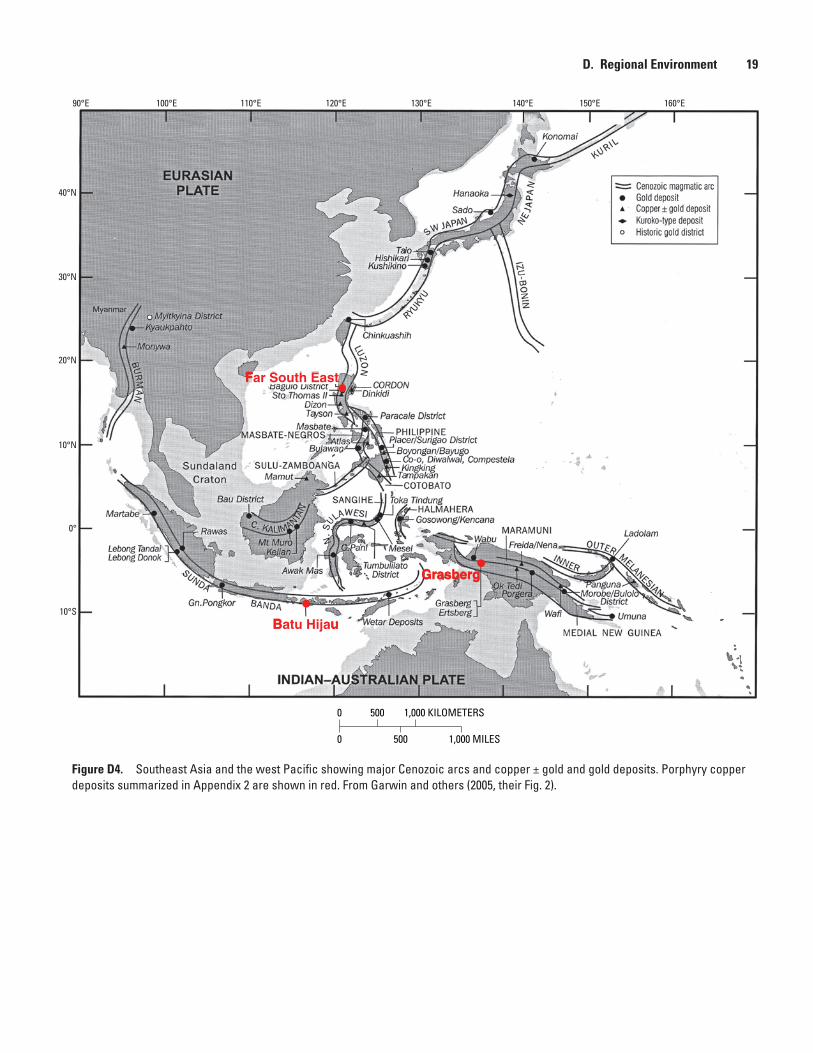
Figure D4. Southeast Asia and the west Pacific showing major Cenozoic arcs and copper ± gold and gold deposits. Porphyry copper deposits summarized in Appendix 2 are shown in red. From Garwin and others (2005, their Fig. 2).
0 1,000 KILOMETERS500
0 1,000 MILES500
Batu Hijau
Grasberg
Far South East
100°E90°E 110°E 120°E 130°E 140°E 150°E 160°E
40°N
30°N
20°N
10°N
0°
10°S
D. Regional Environment 19
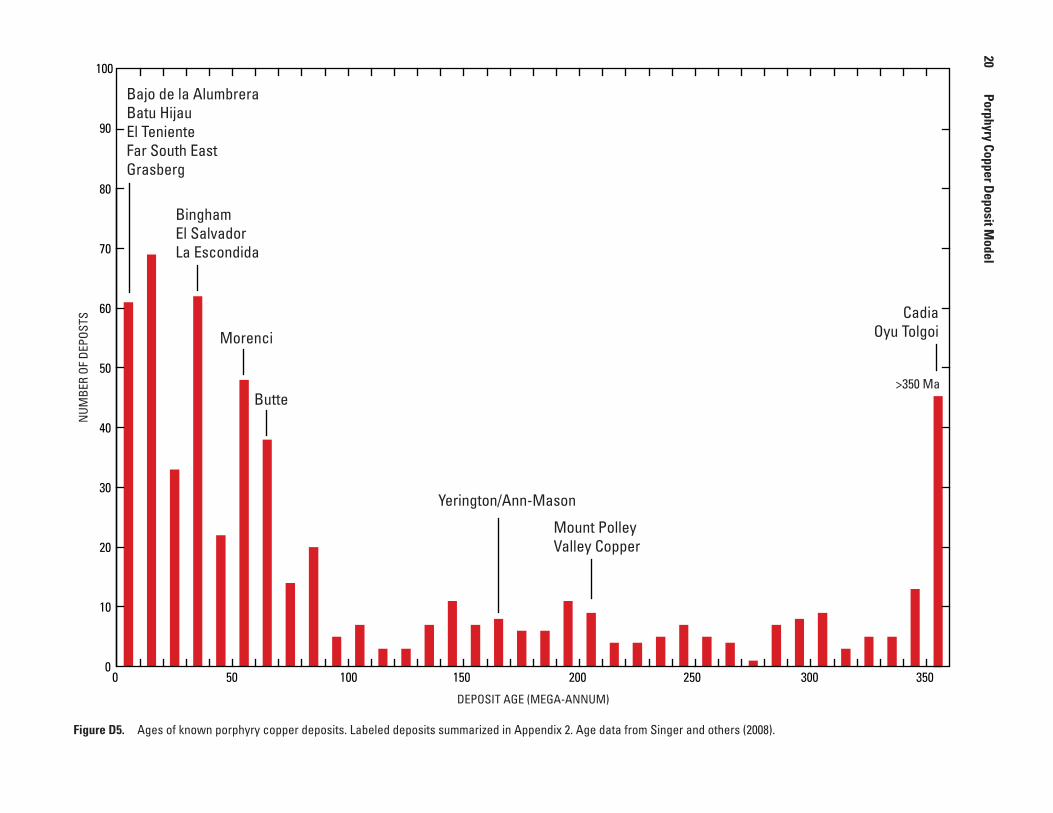
0
10
20
30
40
50
60
70
80
90
100
DEPOSIT AGE (MEGA-ANNUM)
0 50 100 150 200 250 300 350
>350 Ma
NUM
BER
OF D
EPOS
TS
Morenci
Mount PolleyValley Copper
Yerington/Ann-Mason
Bajo de la AlumbreraBatu HijauEl TenienteFar South EastGrasberg
BinghamEl SalvadorLa Escondida
CadiaOyu Tolgoi
Butte
Figure D5. Ages of known porphyry copper deposits. Labeled deposits summarized in Appendix 2. Age data from Singer and others (2008).
20
Porphyry Copper Deposit Model
D. Regional Environment 21
Relations to Structures
(John H. Dilles)
Structural Setting(s) and Controls
The regional, deposit-scale, and local-scale struc-tural settings of porphyry copper deposits are diverse, and despite much scientific study, many important features are poorly understood in regard to their relevance as a control of ore formation.
Tectonic Setting
Porphyry copper deposits mostly form in convergent margin settings where subduction of oceanic crust is related to arc-type magmatism that generates most of the hydrous, oxidized upper crustal granitoids genetically related to ores (see “Geotectonic Environment” section). Large deposits may form in the arc axis where magma flux is highest—for example, in the Eocene and late Miocene-Pliocene belts of Chile (Camus, 2002) and in the southwest Pacific islands (Garwin and others, 2005). In contrast, large plutonic and volcanic belts formed more than 150 km from the trench are attributed to flat-slab subduction geometries (Kay and Mpodozis, 2001); for example, the Laramide Province of Southwestern United States (Titley, 1997); Butte, Montana; Bajo de la Alumbrera (Proffett, 2003; Halter and others, 2004); and the Andahuaylas-Yauri belt of southern Peru (Perelló and others, 2004). Alkalic or mafic magmatism, in some cases in the back-arc, is associated with modest extension, for example, the enormous Bingham Canyon porphyry copper-molybdenum-gold deposit in Utah (Babcock and others, 1995; Keith and others, 1997).
Structural Control of Magma Emplacement
In the convergent margin settings, the broad tectonic environment is typically one of compressive stress and strain that in some cases is associated with considerable crustal thickening, notably in the Late Mesozoic-Early Cenozoic (Laramide) of the Southwestern United States and in the central Andes (Barton, 1996; DeCelles, 2004; Sillitoe and Perelló, 2005). Within the broadly compressive environment, transpression is expressed as strike-slip faults with signifi-cant reverse movement, for example, in the Eocene Cordil-lera Domeyko of northern Chile, where porphyry-containing plutonic complexes locally were emplaced along reverse faults, but where major faults such as the West fault are largely postmineral (Tomlinson and Blanco, 1997; Dilles and others, 1997; Richards, 2003a). Tosdal and Richards (2001) and Rich-ards (2003a) suggested that stress relaxation to transtensional or mildly extensional conditions is associated with emplace-ment of mineralized porphyry intrusions. Alternatively, similar environments have been interpreted as compressive
(Potrerillos, Chile; Niemeyer and Munizaga, 2008; Butte, Montana; Proffett, 1973). Overall, in southwestern North America, porphyry systems were better developed with the compressional, crustal thickening episodes of the Laramide than they were with the neutral to extensional episodes that prevailed earlier in the Mesozoic or during much of the middle and latter parts of the Tertiary (Barton, 1996).
In most cases, emplacement of porphyry magmas into the upper crust does not seem to be closely related to, or emplaced along faults, but nonetheless alignment of some deposits, districts, or plutons has been interpreted as reflecting deep-seated or ancient structures (consult Behn and others, 2001; Hildenbrand and others, 2001; Richards, 2003a). For example, alignment of late Eocene intrusions normal to the convergent margin occurs in the compressive environment of northern Chile (Behn and others, 2001) and in the extensional back-arc environment extending more than 200 km from Battle Moun-tain, Nevada, to Bingham Canyon and Park City, Utah (John, 1989a; Presnell, 1997).
Origin of VeinsFracture and vein systems, as well as breccias, are an
inevitable consequence of porphyry magmatism. Ascent of intermediate and silicic hydrous magmas into the upper crust from deeper sources is driven by the buoyancy of these magmas that are lower density compared to surrounding crust. Where crustal density decreases in the upper crust, the buoyancy forces diminish so that magmas may pond to form plutonic or batholithic chambers. Although many magmas contain minor associated volatiles during ascent, evolution of large amounts of hydrous fluids is mostly produced in the upper crust as magmas cool, crystallize, and solidify causing vapor exsolution termed “second-boiling” by Burnham (1979). In porphyry systems, hydrous vapor accumulates in the cupolas or apical parts of porphyry magma chambers to produce a low-density, highly buoyant magma plus fluid mixture (consult Dilles, 1987). Once a fracture is initiated, either by magma injection or tectonism, the vapor rises and expands, providing mechanical energy that produces hydro-fractures and breccias characteristic of porphyry copper deposits (Burnham and Ohmoto, 1980; Fournier, 1999). Such hydrofracturing occurs wherever Pfluid is greater than Phydrostatic + tensional strength of rock (consult Tosdal and Richards, 2001). Magma ascends into the fractured carapace, loses vola-tiles, and pressure quenches to form typical aplitic textured porphyry intrusions that are closely associated with PCD ores.
As noted by Tosdal and Richards (2001), porphyry intrusions may be pluglike and in some cases are associated with both steeply dipping, radial fractures and gently dipping, concentric fractures, reflecting stress conditions that are magma-dominated where the two horizontal principal stresses are nearly equal (fig. D6A). There are numerous examples of such concentric and radial fracture systems in the rhyo-lite or Climax-type porphyry molybdenum deposits (consult Carten and others, 1993), but these geometries are relatively
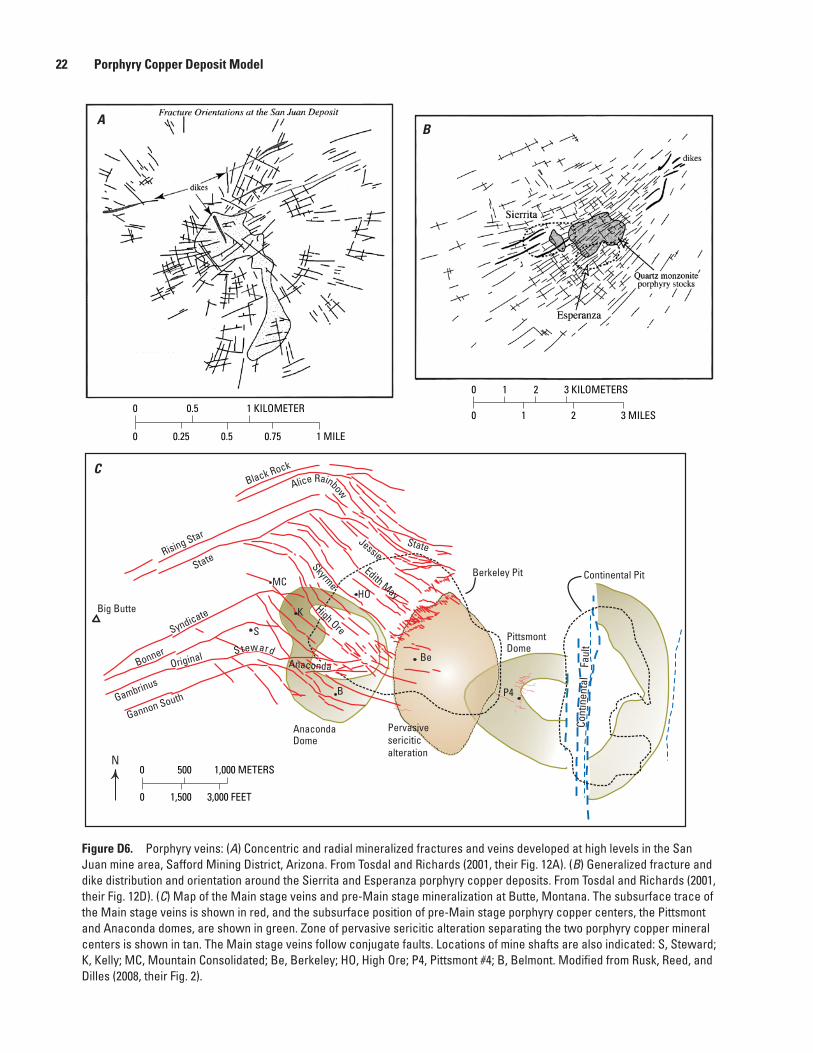
Figure D6. Porphyry veins: (A) Concentric and radial mineralized fractures and veins developed at high levels in the San Juan mine area, Safford Mining District, Arizona. From Tosdal and Richards (2001, their Fig. 12A). (B) Generalized fracture and dike distribution and orientation around the Sierrita and Esperanza porphyry copper deposits. From Tosdal and Richards (2001, their Fig. 12D). (C) Map of the Main stage veins and pre-Main stage mineralization at Butte, Montana. The subsurface trace of the Main stage veins is shown in red, and the subsurface position of pre-Main stage porphyry copper centers, the Pittsmont and Anaconda domes, are shown in green. Zone of pervasive sericitic alteration separating the two porphyry copper mineral centers is shown in tan. The Main stage veins follow conjugate faults. Locations of mine shafts are also indicated: S, Steward; K, Kelly; MC, Mountain Consolidated; Be, Berkeley; HO, High Ore; P4, Pittsmont #4; B, Belmont. Modified from Rusk, Reed, and Dilles (2008, their Fig. 2).
Pervasive sericitic alteration
Cont
inen
tal
Fau
lt
Big Butte
Berkeley Pit Continental Pit
Syndicate
State
State
Skyrme
High Ore
Edith May
Black Rock
Rising Star
Gambrinus
OriginalAnaconda
Gannon South
Bonner S teward
AnacondaDome
PittsmontDome
K
MCHO
B
S
Be
P4
KILOMETERS
N
AB
C
Jessie
Alice Rainbow
0 500 1,000 METERS
0 1,500 3,000 FEET
0 1 2 3 KILOMETERS
0 1 2 3 MILES0 0.5 1 KILOMETER
0 0.25 0.5 0.75 1 MILE
22 Porphyry Copper Deposit Model
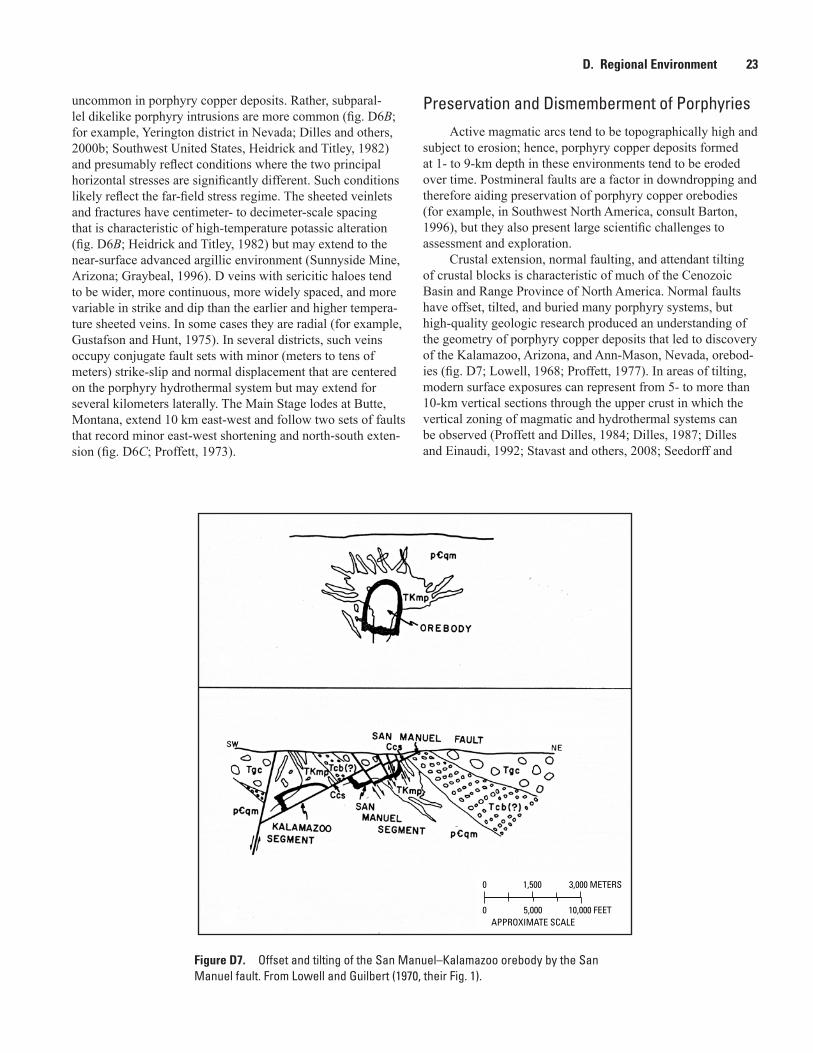
APPROXIMATE SCALE
0 1,500 3,000 METERS
0 5,000 10,000 FEET
Figure D7. Offset and tilting of the San Manuel–Kalamazoo orebody by the San Manuel fault. From Lowell and Guilbert (1970, their Fig. 1).
D. Regional Environment 23
uncommon in porphyry copper deposits. Rather, subparal-lel dikelike porphyry intrusions are more common (fig. D6B; for example, Yerington district in Nevada; Dilles and others, 2000b; Southwest United States, Heidrick and Titley, 1982) and presumably reflect conditions where the two principal horizontal stresses are significantly different. Such conditions likely reflect the far-field stress regime. The sheeted veinlets and fractures have centimeter- to decimeter-scale spacing that is characteristic of high-temperature potassic alteration (fig. D6B; Heidrick and Titley, 1982) but may extend to the near-surface advanced argillic environment (Sunnyside Mine, Arizona; Graybeal, 1996). D veins with sericitic haloes tend to be wider, more continuous, more widely spaced, and more variable in strike and dip than the earlier and higher tempera-ture sheeted veins. In some cases they are radial (for example, Gustafson and Hunt, 1975). In several districts, such veins occupy conjugate fault sets with minor (meters to tens of meters) strike-slip and normal displacement that are centered on the porphyry hydrothermal system but may extend for several kilometers laterally. The Main Stage lodes at Butte, Montana, extend 10 km east-west and follow two sets of faults that record minor east-west shortening and north-south exten-sion (fig. D6C; Proffett, 1973).
Preservation and Dismemberment of PorphyriesActive magmatic arcs tend to be topographically high and
subject to erosion; hence, porphyry copper deposits formed at 1- to 9-km depth in these environments tend to be eroded over time. Postmineral faults are a factor in downdropping and therefore aiding preservation of porphyry copper orebodies (for example, in Southwest North America, consult Barton, 1996), but they also present large scientific challenges to assessment and exploration.
Crustal extension, normal faulting, and attendant tilting of crustal blocks is characteristic of much of the Cenozoic Basin and Range Province of North America. Normal faults have offset, tilted, and buried many porphyry systems, but high-quality geologic research produced an understanding of the geometry of porphyry copper deposits that led to discovery of the Kalamazoo, Arizona, and Ann-Mason, Nevada, orebod-ies (fig. D7; Lowell, 1968; Proffett, 1977). In areas of tilting, modern surface exposures can represent from 5- to more than 10-km vertical sections through the upper crust in which the vertical zoning of magmatic and hydrothermal systems can be observed (Proffett and Dilles, 1984; Dilles, 1987; Dilles and Einaudi, 1992; Stavast and others, 2008; Seedorff and
24 Porphyry Copper Deposit Model
others, 2008). Structural and geological reconstructions of normal-faulted terranes present enormous research challenges but also can provide greatly improved targeting for the many undiscovered Laramide porphyry deposits that likely remain in the Southwestern United States (consult Seedorff and others, 2008).
Although strike-slip faults less commonly cut older porphyry copper deposits, the West Fissure and other Miocene faults of northern Chile have offset several large deposits. The West Fissure sinistrally offsets the Eocene El Abra-Fortuna granodiorite complex by 35 km (Dilles and others, 1997; Tomlinson and Blanco, 1997) and truncates the western margin of the enormous Chuquicamata deposit (Ossandón and others, 2001). The MM deposit possibly represents an economic part of Chuquicamata displaced in fault slivers about 10 km southward (consult Sillitoe and others, 1996).
Relations to Igneous Rocks
(David A. John)
Porphyry copper deposits are centered in high-level intrusive complexes that commonly include stocks, dikes, and breccia pipes. Many deposits are focused on swarms of porphyry dikes that may form apotheses on larger intrusions or batholiths (for example, El Salvador, Chile, Gustafson and Hunt, 1975; Yerington and Ann-Mason, Nev., Dilles and Proffett, 1995; Proffett, 2009). The deposits are formed at shallow (mostly 6 km or less) depth by fluids exsolved from crystallizing magmas emplaced at about 3.5–10-km depth in the upper crust (for example, Burnham, 1979; Sillitoe and Hedenquist, 2003; Richards, 2003a). Most known deposits are genetically related to intermediate to felsic calc-alkaline magmas in volcano-plutonic arcs above active subduction zones (fig. D1A; see summary in “Geotectonic Environment” section). These shallow, subvolcanic complexes typically are composed of multiple intrusions of varying composition, as summarized in section N, “Petrology of Associated Igneous Rocks.” Porphyry copper mineralization commonly forms near the end of the evolution of intrusive centers, and mineral-ized volcanic wall rocks may be significantly older than the ages of the intrusive rocks and ore formation (see “Temporal (Secular) Relations”).
Relations to Sedimentary Rocks
(David A. John)
Sedimentary rocks are common in many districts and may host other important mineral deposits genetically related to porphyry copper systems, including skarn, manto, replace-ment, and vein deposits mined principally for copper, iron, gold, silver, lead, and(or) zinc (for example, West Mountain [Bingham] district in Utah, Babcock and others, 1995; Arizona porphyry systems, Einaudi, 1982a,b).
Sedimentary wall rocks can also influence the char-acteristics of porphyry copper deposits, such as shape and grade. They can be sources of external fluids, salts, and other components that result in variations in types of alteration, for example sodic-calcic and some propylitic alteration (Dilles and Einaudi, 1992; Dilles and others, 1992). External fluids in porphyry copper deposits vary from dilute meteoric waters to hypersaline brines; the latter generally are present at depth although they may impinge on some deposits from near-surface evaporitic/playa lake environments.
Relations to Metamorphic Rocks
(David A. John)
Metamorphic rocks locally host ore in porphyry copper deposits, but regional metamorphism does not contribute to porphyry copper ore formation. Contact metamorphism (thermal and metasomatic) is ubiquitous where unmeta-morphosed wall rocks are present in porphyry districts (for example, Barton and others, 1988; Barton, Staude, and others, 1991). Thermal metamorphism, resulting in hornfels and marble, commonly precedes porphyry copper and skarn miner-alization (for example, Einaudi and others, 1981). Metamor-phism modifies the mechanical properties and permeability of host rocks and thus can affect hydrology of the fluids. For example, formation of massive marble can decrease perme-ability and restrict flow into intrusive rocks. Sillitoe (1997) noted that many gold-rich giant porphyry copper deposits (those containing more than 200 metric tons gold) are hosted by relatively impermeable marble or limestone or other meta-morphic rocks (for example, Grasberg, Indonesia).
Porphyry ore formation and metasomatism are both metamorphic processes and can have the same fluid sources as metamorphic rocks. Thermally metamorphosed rocks and other measures of thermal change (for example, conodont alteration) can be indicators of nearby heat sources and of ore-forming processes in nearby intrusive rocks.
E. Physical Description of Deposits
(David A. John)
The dimensions and geometries of porphyry copper deposits vary widely, due in part to post-ore intrusions, the varied types of host rocks that influence deposit morphology, the relative amounts of supergene and hypogene ore, each of which has different configurations, and especially, erosion and post-ore deformation including faulting and tilting. For many deposits, large uncertainties arising from incomplete exposure and(or) exploration, post-ore intrusions, and post-ore deforma-tion preclude accurate determination of the original deposit geometry and dimensions.
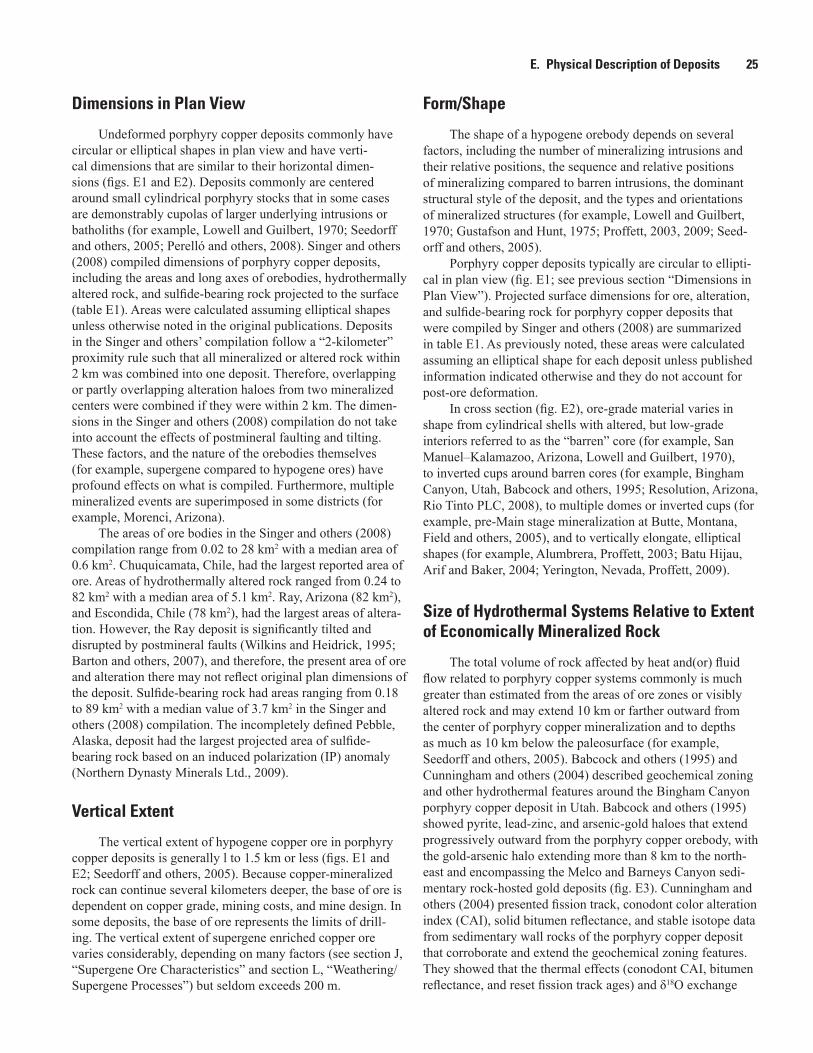
E. Physical Description of Deposits 25
Dimensions in Plan View
Undeformed porphyry copper deposits commonly have circular or elliptical shapes in plan view and have verti-cal dimensions that are similar to their horizontal dimen-sions (figs. E1 and E2). Deposits commonly are centered around small cylindrical porphyry stocks that in some cases are demonstrably cupolas of larger underlying intrusions or batholiths (for example, Lowell and Guilbert, 1970; Seedorff and others, 2005; Perelló and others, 2008). Singer and others (2008) compiled dimensions of porphyry copper deposits, including the areas and long axes of orebodies, hydrothermally altered rock, and sulfide-bearing rock projected to the surface (table E1). Areas were calculated assuming elliptical shapes unless otherwise noted in the original publications. Deposits in the Singer and others’ compilation follow a “2-kilometer” proximity rule such that all mineralized or altered rock within 2 km was combined into one deposit. Therefore, overlapping or partly overlapping alteration haloes from two mineralized centers were combined if they were within 2 km. The dimen-sions in the Singer and others (2008) compilation do not take into account the effects of postmineral faulting and tilting. These factors, and the nature of the orebodies themselves (for example, supergene compared to hypogene ores) have profound effects on what is compiled. Furthermore, multiple mineralized events are superimposed in some districts (for example, Morenci, Arizona).
The areas of ore bodies in the Singer and others (2008) compilation range from 0.02 to 28 km2 with a median area of 0.6 km2. Chuquicamata, Chile, had the largest reported area of ore. Areas of hydrothermally altered rock ranged from 0.24 to 82 km2 with a median area of 5.1 km2. Ray, Arizona (82 km2), and Escondida, Chile (78 km2), had the largest areas of altera-tion. However, the Ray deposit is significantly tilted and disrupted by postmineral faults (Wilkins and Heidrick, 1995; Barton and others, 2007), and therefore, the present area of ore and alteration there may not reflect original plan dimensions of the deposit. Sulfide-bearing rock had areas ranging from 0.18 to 89 km2 with a median value of 3.7 km2 in the Singer and others (2008) compilation. The incompletely defined Pebble, Alaska, deposit had the largest projected area of sulfide-bearing rock based on an induced polarization (IP) anomaly (Northern Dynasty Minerals Ltd., 2009).
Vertical Extent
The vertical extent of hypogene copper ore in porphyry copper deposits is generally l to 1.5 km or less (figs. E1 and E2; Seedorff and others, 2005). Because copper-mineralized rock can continue several kilometers deeper, the base of ore is dependent on copper grade, mining costs, and mine design. In some deposits, the base of ore represents the limits of drill-ing. The vertical extent of supergene enriched copper ore varies considerably, depending on many factors (see section J, “Supergene Ore Characteristics” and section L, “Weathering/Supergene Processes”) but seldom exceeds 200 m.
Form/Shape
The shape of a hypogene orebody depends on several factors, including the number of mineralizing intrusions and their relative positions, the sequence and relative positions of mineralizing compared to barren intrusions, the dominant structural style of the deposit, and the types and orientations of mineralized structures (for example, Lowell and Guilbert, 1970; Gustafson and Hunt, 1975; Proffett, 2003, 2009; Seed-orff and others, 2005).
Porphyry copper deposits typically are circular to ellipti-cal in plan view (fig. E1; see previous section “Dimensions in Plan View”). Projected surface dimensions for ore, alteration, and sulfide-bearing rock for porphyry copper deposits that were compiled by Singer and others (2008) are summarized in table E1. As previously noted, these areas were calculated assuming an elliptical shape for each deposit unless published information indicated otherwise and they do not account for post-ore deformation.
In cross section (fig. E2), ore-grade material varies in shape from cylindrical shells with altered, but low-grade interiors referred to as the “barren” core (for example, San Manuel–Kalamazoo, Arizona, Lowell and Guilbert, 1970), to inverted cups around barren cores (for example, Bingham Canyon, Utah, Babcock and others, 1995; Resolution, Arizona, Rio Tinto PLC, 2008), to multiple domes or inverted cups (for example, pre-Main stage mineralization at Butte, Montana, Field and others, 2005), and to vertically elongate, elliptical shapes (for example, Alumbrera, Proffett, 2003; Batu Hijau, Arif and Baker, 2004; Yerington, Nevada, Proffett, 2009).
Size of Hydrothermal Systems Relative to Extent of Economically Mineralized Rock
The total volume of rock affected by heat and(or) fluid flow related to porphyry copper systems commonly is much greater than estimated from the areas of ore zones or visibly altered rock and may extend 10 km or farther outward from the center of porphyry copper mineralization and to depths as much as 10 km below the paleosurface (for example, Seedorff and others, 2005). Babcock and others (1995) and Cunningham and others (2004) described geochemical zoning and other hydrothermal features around the Bingham Canyon porphyry copper deposit in Utah. Babcock and others (1995) showed pyrite, lead-zinc, and arsenic-gold haloes that extend progressively outward from the porphyry copper orebody, with the gold-arsenic halo extending more than 8 km to the north-east and encompassing the Melco and Barneys Canyon sedi-mentary rock-hosted gold deposits (fig. E3). Cunningham and others (2004) presented fission track, conodont color alteration index (CAI), solid bitumen reflectance, and stable isotope data from sedimentary wall rocks of the porphyry copper deposit that corroborate and extend the geochemical zoning features. They showed that the thermal effects (conodont CAI, bitumen reflectance, and reset fission track ages) and δ18O exchange
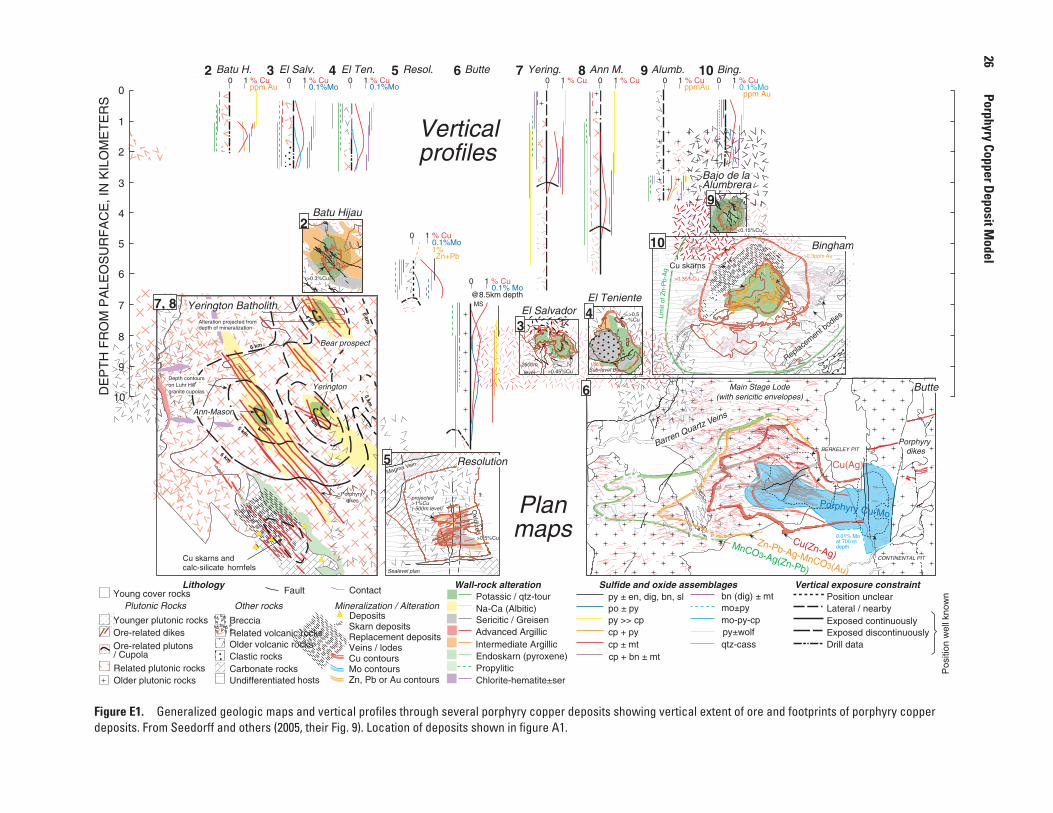
Figure E1. Generalized geologic maps and vertical profiles through several porphyry copper deposits showing vertical extent of ore and footprints of porphyry copper deposits. From Seedorff and others (2005, their Fig. 9). Location of deposits shown in figure A1.
0 1 % Cu 0.1%Moppm Au
>0.35%Cu
Limit of Cu>0.3ppm Au
Lim
it of
Zn-
Pb-
Ag
Replacement b
odies
cpla
Replacement b
od
u
it of Cu>0
>0.35%Cu
Limit of Cu
Lim
it of
Zn-
Pb-
Ag
Cu skarns
0 1 % Cu ppmAu
?
?
0 1 % Cu 0 1 % Cu
5 km
3 km
6 km
Cu skarns andcalc-silicate hornfels
Ann-Mason
Yerington on Luhr Hill
5 km
4 km
6 km4 km
6 km Bear prospect
Alteration projected from
Porphyry
depth of mineralization
dikes
Depth contours
granite cupolas
0 1 % Cu0.1% Mo
@8.5km depthMS
MnCO3-Ag(Zn-Pb)
Zn-Pb-Ag-MnCO3(Au)
Cu(Zn-Ag)
Cu(Ag)
0.01% Moat 700 m depth
CONTINENTAL PIT
BERKELEY PITBarren Quartz Veins
Porphyrydikes
Main Stage Lode(with sericitic envelopes)
Porphyry Cu-Mo
0 1 % Cu 0.1%Mo1%Zn+Pb
?
Oxidized
Sealevel plan
Magma Vein
>0.5%Cu
Oxidized
>0.5%
projected>1%Cu (-500m level)
0 1 % Cu 0.1%Mo
>0.5%Cu
Sub-level B
0 1 % Cu 0.1%Mo
2600m
level >0.45%Cu
ppm Au0 1 % Cu
>0.3%Cu
abundant qtz
0 1 % Cu ppm Au
veins
<0.15%Cu
Resolution
Refugio
Yerington Batholith
Bingham
Batu Hijau
Butte
El TenienteEl Salvador
102
34
5
6
7, 8
1 2 3 4 5 6 7 8 9 10 11Alumb.Ann M.Yering.ButteResol.El Ten.El Salv.Batu H.
0
1
2
3
4
5
6
7
8
9
10
Bing.
9
Bajo de laAlumbrera
Veins / lodes
Ore-related dikes
Young cover rocks
/ Cupola
Related plutonic rocksOlder plutonic rocks
Younger plutonic rocks
Carbonate rocksClastic rocks
BrecciaRelated volcanic rocksOlder volcanic rocks
Undifferentiated
ContactFault
Deposits
Cu contoursMo contoursZn, Pb or Au contours
Replacement depositsSkarn deposits
Ore-related plutons
Vertical exposure constraintPosition unclearLateral / nearbyExposed continuouslyExposed discontinuouslyDrill data
py ± en, dig, bn, slpo ± pypy >> cpcp + pycp ± mtcp + bn ± mt
bn (dig) ± mtmo±pymo-py-cppy±wolfqtz-cass
Mineralization / AlterationPlutonic Rocks
Lithology
Other rocks
Sulfide and oxide assemblagesWall-rock alterationPotassic / qtz-tourNa-Ca (Albitic)Sericitic / GreisenAdvanced ArgillicIntermediate ArgillicEndoskarn (pyroxene)PropyliticChlorite-hematite±ser
Pos
ition
wel
l kno
wn
hosts
DE
PT
H F
RO
M P
ALE
OS
UR
FA
CE
, IN
KIL
OM
ET
ER
S
Planmaps
Verticalprofiles
26
Porphyry Copper Deposit Model
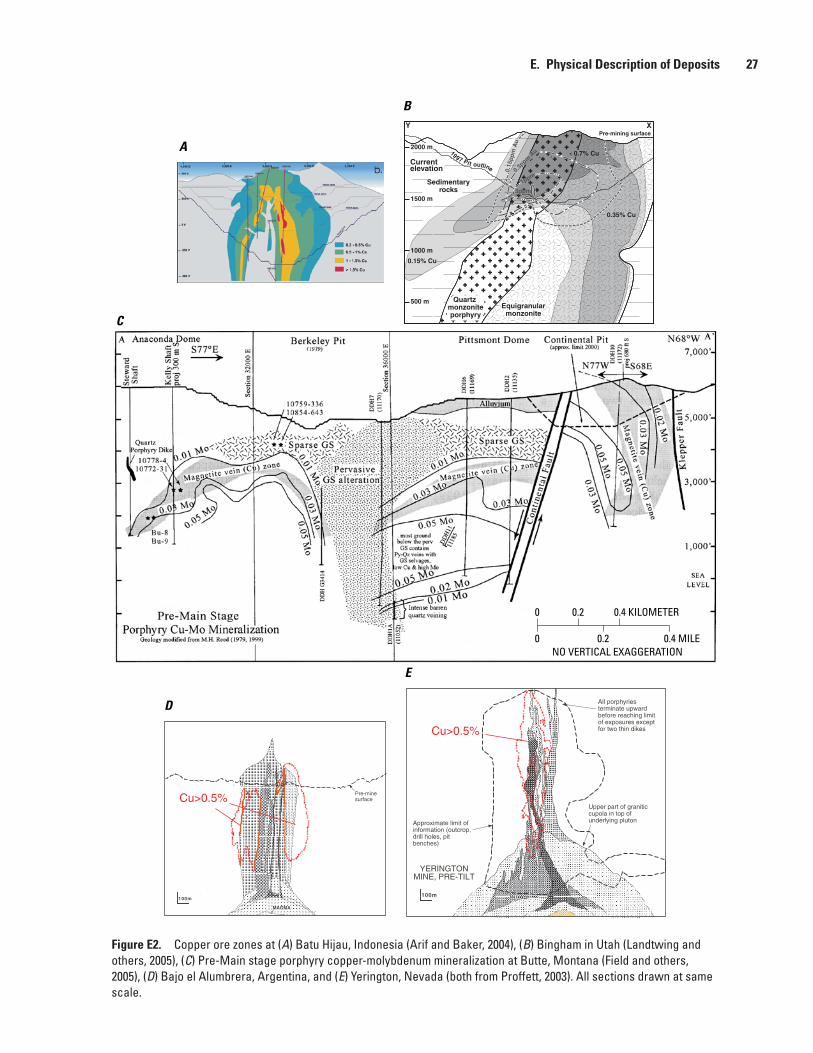
Pre-mine surface
100m
MAGMA
Cu>0.5%
Cu>0.5%
100m
Approximate limit of information (outcrop, drill holes, pit benches)
All porphyries terminate upward before reaching limit of exposures except for two thin dikes
YERINGTON MINE, PRE-TILT
Upper part of granitic cupola in top of underlying pluton
XY
1997 Pit outline
0.15% Cu
0.35% Cu
0.7% Cu
1ppm
0.15
ppm
Au
Quartz monzoniteporphyry
0.3ppm
Au
3ppmSedimentary
rocks
Equigranularmonzonite
Pre-mining surface
1500 m
1000 m
500 m
2000 m
Currentelevation
A
B
C
D
E
0 0.4 KILOMETER0.2
0 0.4 MILE0.2NO VERTICAL EXAGGERATION
Figure E2. Copper ore zones at (A) Batu Hijau, Indonesia (Arif and Baker, 2004), (B) Bingham in Utah (Landtwing and others, 2005), (C) Pre-Main stage porphyry copper-molybdenum mineralization at Butte, Montana (Field and others, 2005), (D) Bajo el Alumbrera, Argentina, and (E) Yerington, Nevada (both from Proffett, 2003). All sections drawn at same scale.
E. Physical Description of Deposits 27
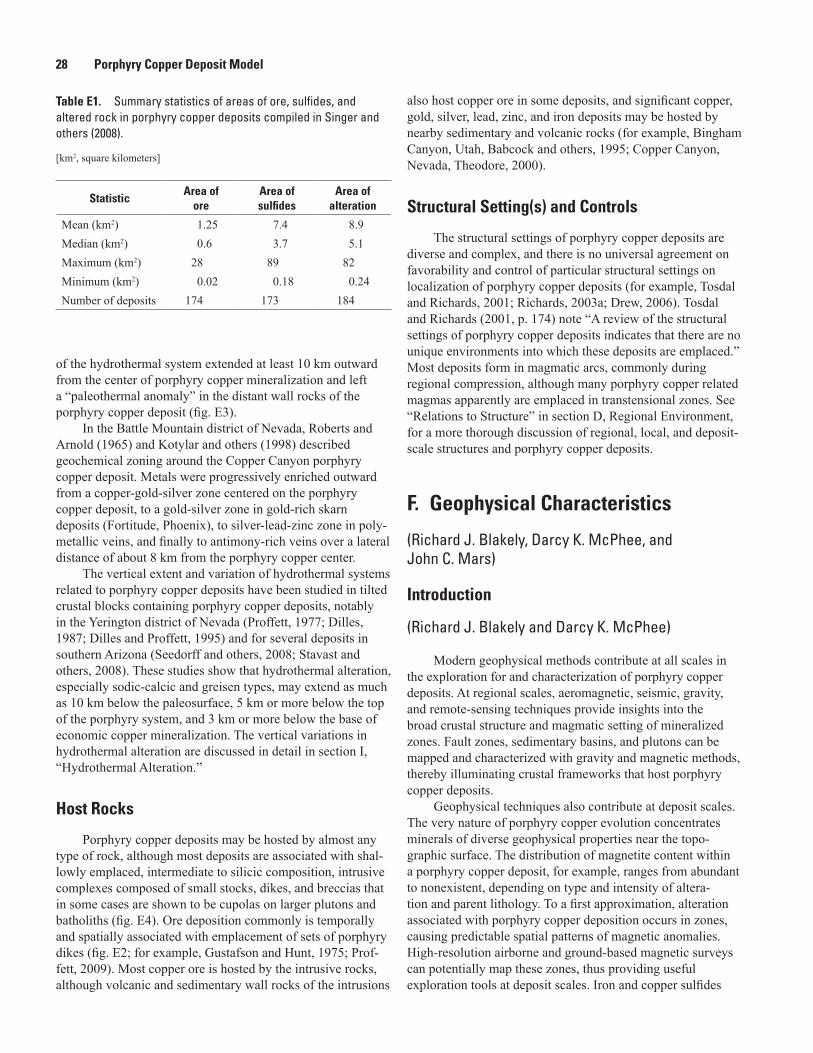
Table E1. Summary statistics of areas of ore, sulfides, and altered rock in porphyry copper deposits compiled in Singer and others (2008).
[km2, square kilometers]
StatisticArea of
oreArea of sulfides
Area of alteration
Mean (km2) 1.25 7.4 8.9Median (km2) 0.6 3.7 5.1Maximum (km2) 28 89 82Minimum (km2) 0.02 0.18 0.24Number of deposits 174 173 184
28 Porphyry Copper Deposit Model
of the hydrothermal system extended at least 10 km outward from the center of porphyry copper mineralization and left a “paleothermal anomaly” in the distant wall rocks of the porphyry copper deposit (fig. E3).
In the Battle Mountain district of Nevada, Roberts and Arnold (1965) and Kotylar and others (1998) described geochemical zoning around the Copper Canyon porphyry copper deposit. Metals were progressively enriched outward from a copper-gold-silver zone centered on the porphyry copper deposit, to a gold-silver zone in gold-rich skarn deposits (Fortitude, Phoenix), to silver-lead-zinc zone in poly-metallic veins, and finally to antimony-rich veins over a lateral distance of about 8 km from the porphyry copper center.
The vertical extent and variation of hydrothermal systems related to porphyry copper deposits have been studied in tilted crustal blocks containing porphyry copper deposits, notably in the Yerington district of Nevada (Proffett, 1977; Dilles, 1987; Dilles and Proffett, 1995) and for several deposits in southern Arizona (Seedorff and others, 2008; Stavast and others, 2008). These studies show that hydrothermal alteration, especially sodic-calcic and greisen types, may extend as much as 10 km below the paleosurface, 5 km or more below the top of the porphyry system, and 3 km or more below the base of economic copper mineralization. The vertical variations in hydrothermal alteration are discussed in detail in section I, “Hydrothermal Alteration.”
Host Rocks
Porphyry copper deposits may be hosted by almost any type of rock, although most deposits are associated with shal-lowly emplaced, intermediate to silicic composition, intrusive complexes composed of small stocks, dikes, and breccias that in some cases are shown to be cupolas on larger plutons and batholiths (fig. E4). Ore deposition commonly is temporally and spatially associated with emplacement of sets of porphyry dikes (fig. E2; for example, Gustafson and Hunt, 1975; Prof-fett, 2009). Most copper ore is hosted by the intrusive rocks, although volcanic and sedimentary wall rocks of the intrusions
also host copper ore in some deposits, and significant copper, gold, silver, lead, zinc, and iron deposits may be hosted by nearby sedimentary and volcanic rocks (for example, Bingham Canyon, Utah, Babcock and others, 1995; Copper Canyon, Nevada, Theodore, 2000).
Structural Setting(s) and Controls
The structural settings of porphyry copper deposits are diverse and complex, and there is no universal agreement on favorability and control of particular structural settings on localization of porphyry copper deposits (for example, Tosdal and Richards, 2001; Richards, 2003a; Drew, 2006). Tosdal and Richards (2001, p. 174) note “A review of the structural settings of porphyry copper deposits indicates that there are no unique environments into which these deposits are emplaced.” Most deposits form in magmatic arcs, commonly during regional compression, although many porphyry copper related magmas apparently are emplaced in transtensional zones. See “Relations to Structure” in section D, Regional Environment, for a more thorough discussion of regional, local, and deposit-scale structures and porphyry copper deposits.
F. Geophysical Characteristics
(Richard J. Blakely, Darcy K. McPhee, and John C. Mars)
Introduction
(Richard J. Blakely and Darcy K. McPhee)
Modern geophysical methods contribute at all scales in the exploration for and characterization of porphyry copper deposits. At regional scales, aeromagnetic, seismic, gravity, and remote-sensing techniques provide insights into the broad crustal structure and magmatic setting of mineralized zones. Fault zones, sedimentary basins, and plutons can be mapped and characterized with gravity and magnetic methods, thereby illuminating crustal frameworks that host porphyry copper deposits.
Geophysical techniques also contribute at deposit scales. The very nature of porphyry copper evolution concentrates minerals of diverse geophysical properties near the topo-graphic surface. The distribution of magnetite content within a porphyry copper deposit, for example, ranges from abundant to nonexistent, depending on type and intensity of altera-tion and parent lithology. To a first approximation, alteration associated with porphyry copper deposition occurs in zones, causing predictable spatial patterns of magnetic anomalies. High-resolution airborne and ground-based magnetic surveys can potentially map these zones, thus providing useful exploration tools at deposit scales. Iron and copper sulfides
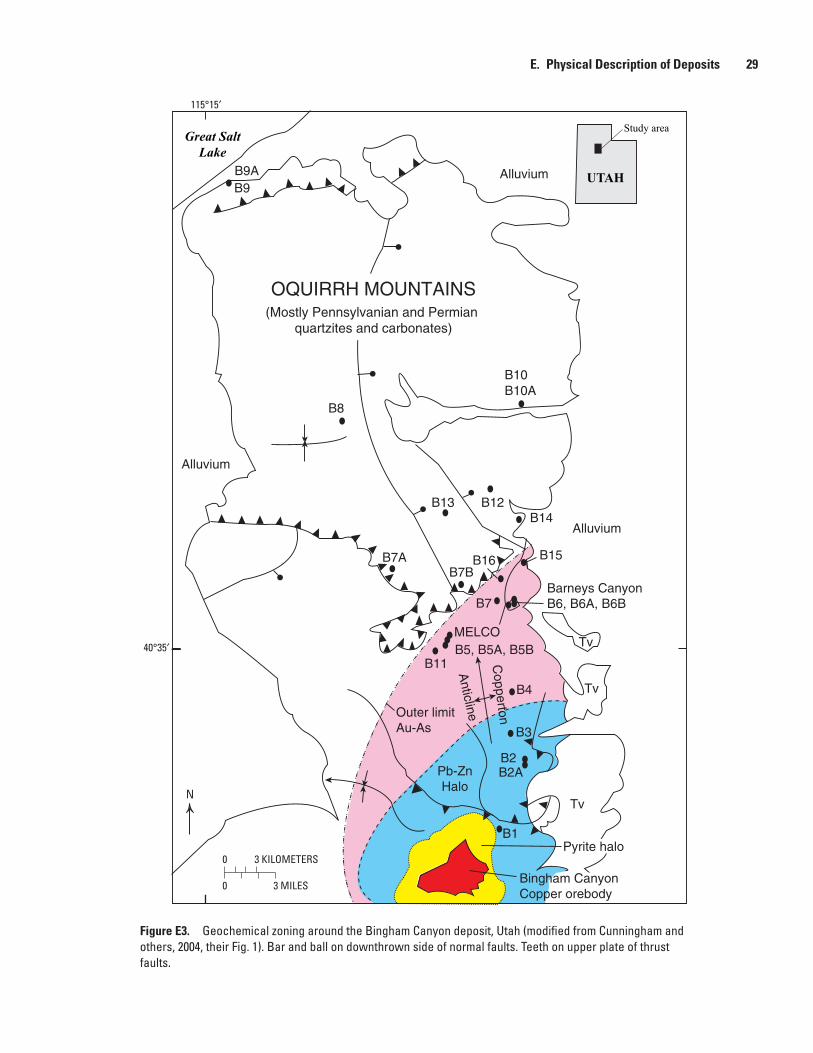
Figure E3. Geochemical zoning around the Bingham Canyon deposit, Utah (modified from Cunningham and others, 2004, their Fig. 1). Bar and ball on downthrown side of normal faults. Teeth on upper plate of thrust faults.
B10B10A
B8
B9Alluvium
Alluvium
UTAH
Study area
B9A
Tv
Tv
B7BB7A
Tv
Alluvium
BB@B2
Anticline
B3
B2A
Outer limitAu-As
MELCO
B11B5, B5A, B5B
B7
B4
Pb-ZnHalo
Copperton
B2
B1
B13 B12B14
B15B16
OQUIRRH MOUNTAINS
Pyrite halo
Great SaltLake
(Mostly Pennsylvanian and Permian quartzites and carbonates)
Bingham CanyonCopper orebody
Barneys CanyonB6, B6A, B6B
115°15′
40°35′
N
0 3 KILOMETERS
0 3 MILES
E. Physical Description of Deposits 29
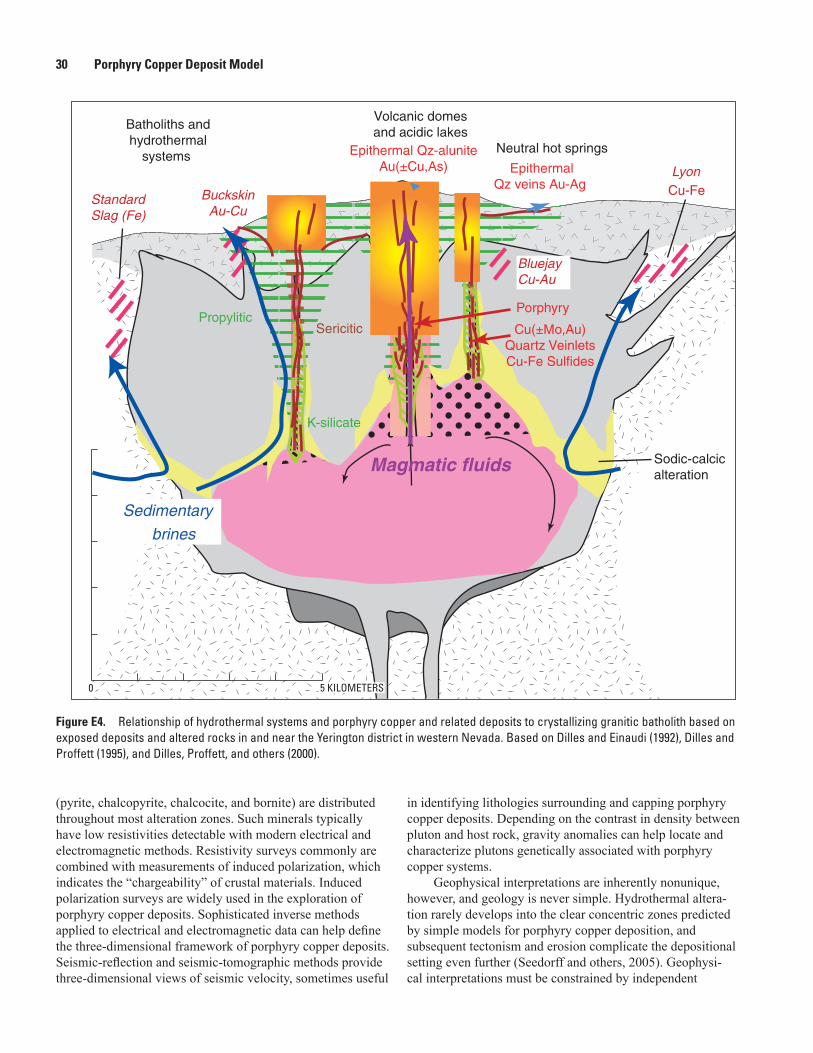
Figure E4. Relationship of hydrothermal systems and porphyry copper and related deposits to crystallizing granitic batholith based on exposed deposits and altered rocks in and near the Yerington district in western Nevada. Based on Dilles and Einaudi (1992), Dilles and Proffett (1995), and Dilles, Proffett, and others (2000).
LL
Propylitic
Sodic-calcicalteration
K-silicate
Sericitic
Porphyry
Cu(±Mo,Au)Quartz VeinletsCu-Fe Sulfides
Epithermal Qz-aluniteAu(±Cu,As) Epithermal
Qz veins Au-Ag
Volcanic domesand acidic lakes
Neutral hot springs
Batholiths andhydrothermal
systems
BuckskinAu-Cu
StandardSlag (Fe)
Cu-FeLyon
Magmatic fluids
Sedimentary
brines
BluejayCu-Au
5 KILOMETERS0
30 Porphyry Copper Deposit Model
(pyrite, chalcopyrite, chalcocite, and bornite) are distributed throughout most alteration zones. Such minerals typically have low resistivities detectable with modern electrical and electromagnetic methods. Resistivity surveys commonly are combined with measurements of induced polarization, which indicates the “chargeability” of crustal materials. Induced polarization surveys are widely used in the exploration of porphyry copper deposits. Sophisticated inverse methods applied to electrical and electromagnetic data can help define the three-dimensional framework of porphyry copper deposits. Seismic-reflection and seismic-tomographic methods provide three-dimensional views of seismic velocity, sometimes useful
in identifying lithologies surrounding and capping porphyry copper deposits. Depending on the contrast in density between pluton and host rock, gravity anomalies can help locate and characterize plutons genetically associated with porphyry copper systems.
Geophysical interpretations are inherently nonunique, however, and geology is never simple. Hydrothermal altera-tion rarely develops into the clear concentric zones predicted by simple models for porphyry copper deposition, and subsequent tectonism and erosion complicate the depositional setting even further (Seedorff and others, 2005). Geophysi-cal interpretations must be constrained by independent
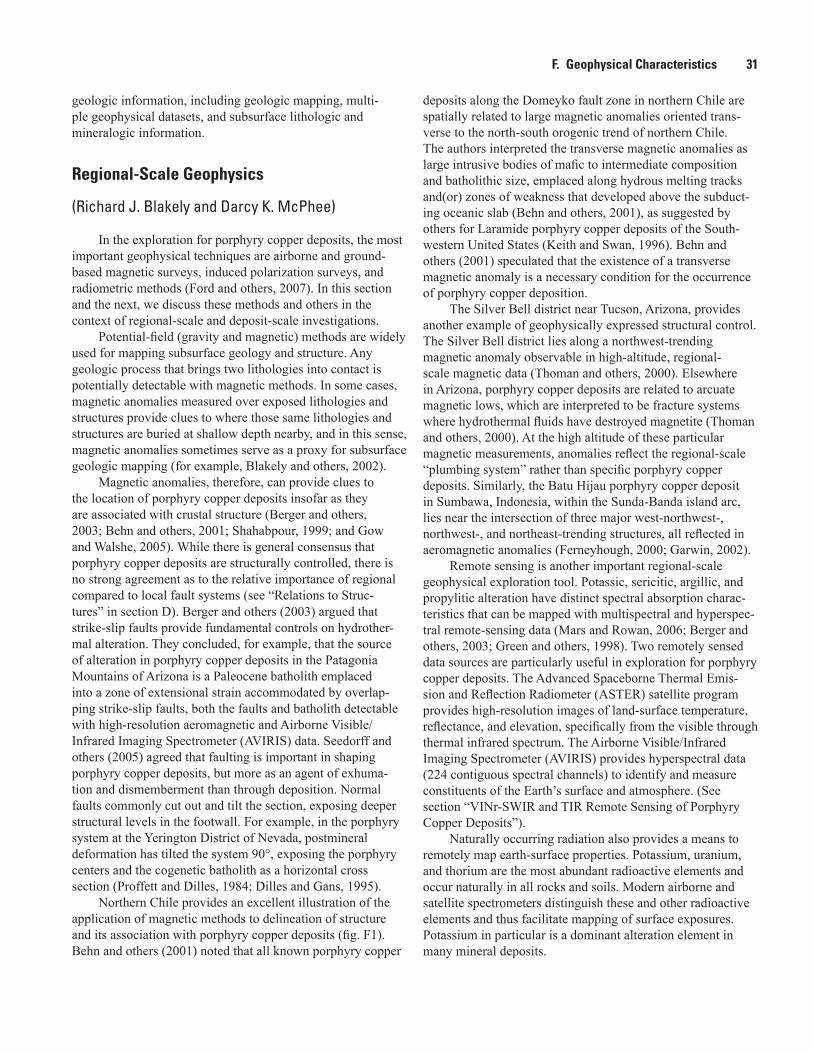
F. Geophysical Characteristics 31
geologic information, including geologic mapping, multi-ple geophysical datasets, and subsurface lithologic and mineralogic information.
Regional-Scale Geophysics
(Richard J. Blakely and Darcy K. McPhee)
In the exploration for porphyry copper deposits, the most important geophysical techniques are airborne and ground-based magnetic surveys, induced polarization surveys, and radiometric methods (Ford and others, 2007). In this section and the next, we discuss these methods and others in the context of regional-scale and deposit-scale investigations.
Potential-field (gravity and magnetic) methods are widely used for mapping subsurface geology and structure. Any geologic process that brings two lithologies into contact is potentially detectable with magnetic methods. In some cases, magnetic anomalies measured over exposed lithologies and structures provide clues to where those same lithologies and structures are buried at shallow depth nearby, and in this sense, magnetic anomalies sometimes serve as a proxy for subsurface geologic mapping (for example, Blakely and others, 2002).
Magnetic anomalies, therefore, can provide clues to the location of porphyry copper deposits insofar as they are associated with crustal structure (Berger and others, 2003; Behn and others, 2001; Shahabpour, 1999; and Gow and Walshe, 2005). While there is general consensus that porphyry copper deposits are structurally controlled, there is no strong agreement as to the relative importance of regional compared to local fault systems (see “Relations to Struc-tures” in section D). Berger and others (2003) argued that strike-slip faults provide fundamental controls on hydrother-mal alteration. They concluded, for example, that the source of alteration in porphyry copper deposits in the Patagonia Mountains of Arizona is a Paleocene batholith emplaced into a zone of extensional strain accommodated by overlap-ping strike-slip faults, both the faults and batholith detectable with high-resolution aeromagnetic and Airborne Visible/Infrared Imaging Spectrometer (AVIRIS) data. Seedorff and others (2005) agreed that faulting is important in shaping porphyry copper deposits, but more as an agent of exhuma-tion and dismemberment than through deposition. Normal faults commonly cut out and tilt the section, exposing deeper structural levels in the footwall. For example, in the porphyry system at the Yerington District of Nevada, postmineral deformation has tilted the system 90°, exposing the porphyry centers and the cogenetic batholith as a horizontal cross section (Proffett and Dilles, 1984; Dilles and Gans, 1995).
Northern Chile provides an excellent illustration of the application of magnetic methods to delineation of structure and its association with porphyry copper deposits (fig. F1). Behn and others (2001) noted that all known porphyry copper
deposits along the Domeyko fault zone in northern Chile are spatially related to large magnetic anomalies oriented trans-verse to the north-south orogenic trend of northern Chile. The authors interpreted the transverse magnetic anomalies as large intrusive bodies of mafic to intermediate composition and batholithic size, emplaced along hydrous melting tracks and(or) zones of weakness that developed above the subduct-ing oceanic slab (Behn and others, 2001), as suggested by others for Laramide porphyry copper deposits of the South-western United States (Keith and Swan, 1996). Behn and others (2001) speculated that the existence of a transverse magnetic anomaly is a necessary condition for the occurrence of porphyry copper deposition.
The Silver Bell district near Tucson, Arizona, provides another example of geophysically expressed structural control. The Silver Bell district lies along a northwest-trending magnetic anomaly observable in high-altitude, regional-scale magnetic data (Thoman and others, 2000). Elsewhere in Arizona, porphyry copper deposits are related to arcuate magnetic lows, which are interpreted to be fracture systems where hydrothermal fluids have destroyed magnetite (Thoman and others, 2000). At the high altitude of these particular magnetic measurements, anomalies reflect the regional-scale “plumbing system” rather than specific porphyry copper deposits. Similarly, the Batu Hijau porphyry copper deposit in Sumbawa, Indonesia, within the Sunda-Banda island arc, lies near the intersection of three major west-northwest-, northwest-, and northeast-trending structures, all reflected in aeromagnetic anomalies (Ferneyhough, 2000; Garwin, 2002).
Remote sensing is another important regional-scale geophysical exploration tool. Potassic, sericitic, argillic, and propylitic alteration have distinct spectral absorption charac-teristics that can be mapped with multispectral and hyperspec-tral remote-sensing data (Mars and Rowan, 2006; Berger and others, 2003; Green and others, 1998). Two remotely sensed data sources are particularly useful in exploration for porphyry copper deposits. The Advanced Spaceborne Thermal Emis-sion and Reflection Radiometer (ASTER) satellite program provides high-resolution images of land-surface temperature, reflectance, and elevation, specifically from the visible through thermal infrared spectrum. The Airborne Visible/Infrared Imaging Spectrometer (AVIRIS) provides hyperspectral data (224 contiguous spectral channels) to identify and measure constituents of the Earth’s surface and atmosphere. (See section “VINr-SWIR and TIR Remote Sensing of Porphyry Copper Deposits”).
Naturally occurring radiation also provides a means to remotely map earth-surface properties. Potassium, uranium, and thorium are the most abundant radioactive elements and occur naturally in all rocks and soils. Modern airborne and satellite spectrometers distinguish these and other radioactive elements and thus facilitate mapping of surface exposures. Potassium in particular is a dominant alteration element in many mineral deposits.
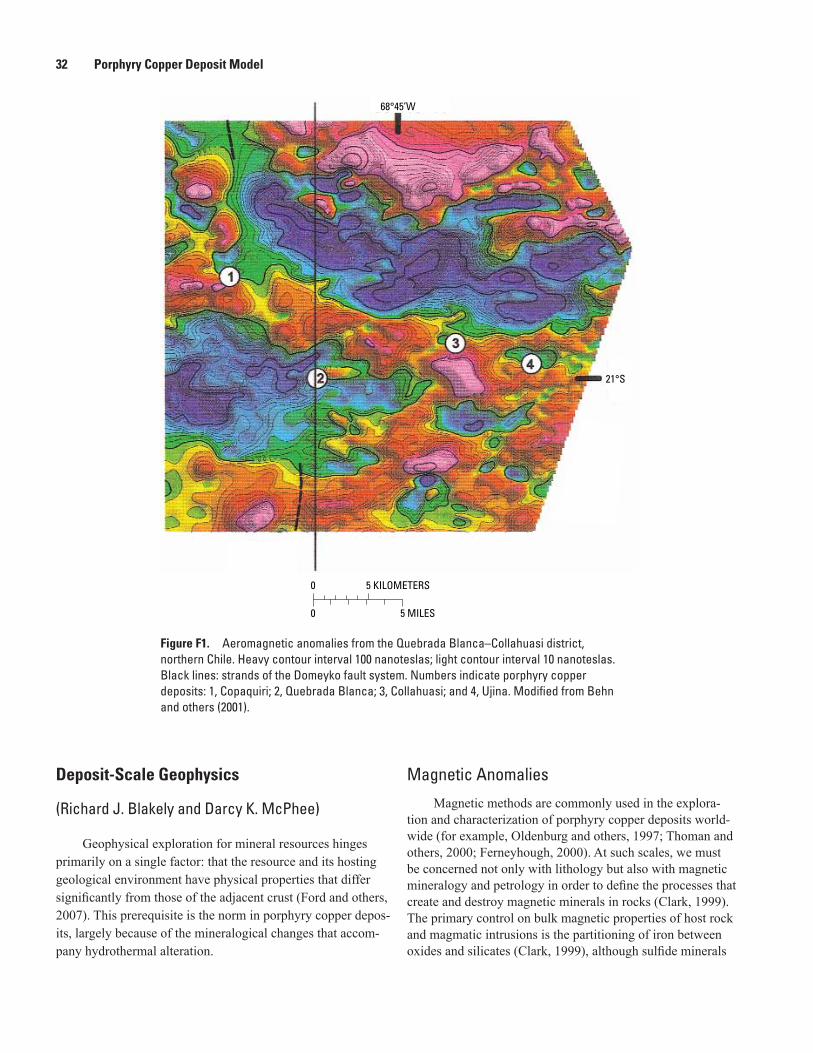
68°45’W
21°S
0 5 KILOMETERS
0 5 MILES
Figure F1. Aeromagnetic anomalies from the Quebrada Blanca–Collahuasi district, northern Chile. Heavy contour interval 100 nanoteslas; light contour interval 10 nanoteslas. Black lines: strands of the Domeyko fault system. Numbers indicate porphyry copper deposits: 1, Copaquiri; 2, Quebrada Blanca; 3, Collahuasi; and 4, Ujina. Modified from Behn and others (2001).
32 Porphyry Copper Deposit Model
Deposit-Scale Geophysics
(Richard J. Blakely and Darcy K. McPhee)
Geophysical exploration for mineral resources hinges primarily on a single factor: that the resource and its hosting geological environment have physical properties that differ significantly from those of the adjacent crust (Ford and others, 2007). This prerequisite is the norm in porphyry copper depos-its, largely because of the mineralogical changes that accom-pany hydrothermal alteration.
Magnetic Anomalies
Magnetic methods are commonly used in the explora-tion and characterization of porphyry copper deposits world-wide (for example, Oldenburg and others, 1997; Thoman and others, 2000; Ferneyhough, 2000). At such scales, we must be concerned not only with lithology but also with magnetic mineralogy and petrology in order to define the processes that create and destroy magnetic minerals in rocks (Clark, 1999). The primary control on bulk magnetic properties of host rock and magmatic intrusions is the partitioning of iron between oxides and silicates (Clark, 1999), although sulfide minerals
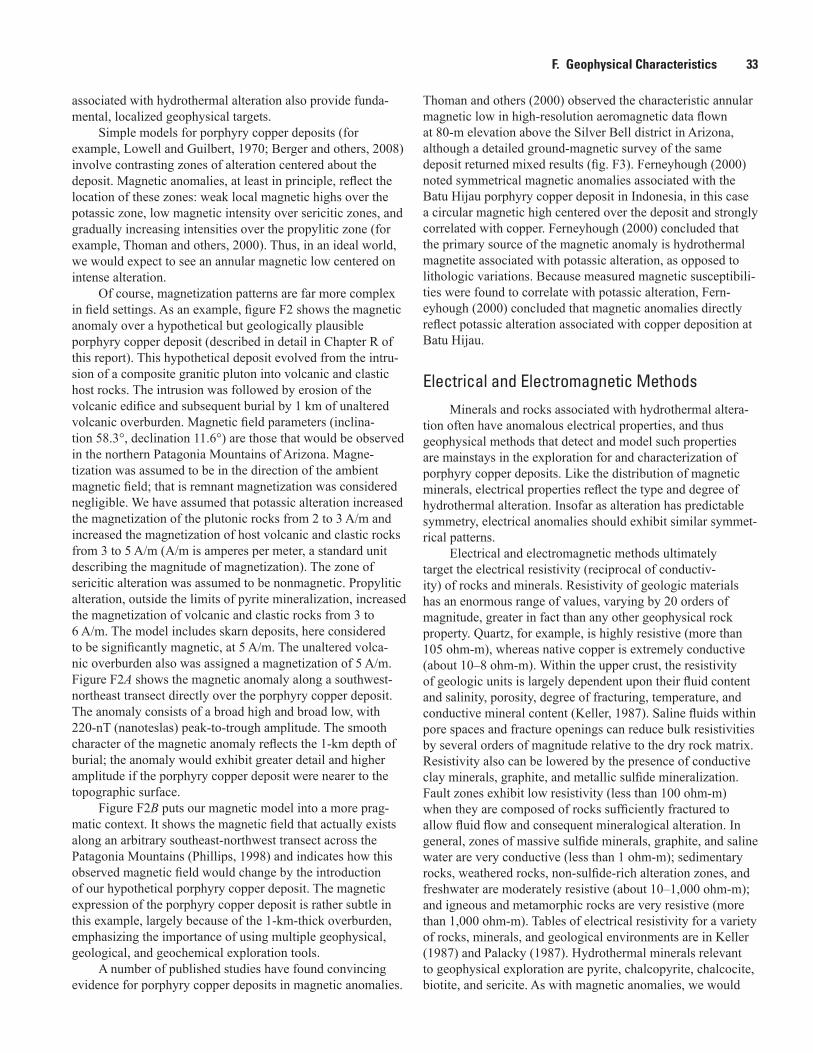
F. Geophysical Characteristics 33
associated with hydrothermal alteration also provide funda-mental, localized geophysical targets.
Simple models for porphyry copper deposits (for example, Lowell and Guilbert, 1970; Berger and others, 2008) involve contrasting zones of alteration centered about the deposit. Magnetic anomalies, at least in principle, reflect the location of these zones: weak local magnetic highs over the potassic zone, low magnetic intensity over sericitic zones, and gradually increasing intensities over the propylitic zone (for example, Thoman and others, 2000). Thus, in an ideal world, we would expect to see an annular magnetic low centered on intense alteration.
Of course, magnetization patterns are far more complex in field settings. As an example, figure F2 shows the magnetic anomaly over a hypothetical but geologically plausible porphyry copper deposit (described in detail in Chapter R of this report). This hypothetical deposit evolved from the intru-sion of a composite granitic pluton into volcanic and clastic host rocks. The intrusion was followed by erosion of the volcanic edifice and subsequent burial by 1 km of unaltered volcanic overburden. Magnetic field parameters (inclina-tion 58.3°, declination 11.6°) are those that would be observed in the northern Patagonia Mountains of Arizona. Magne-tization was assumed to be in the direction of the ambient magnetic field; that is remnant magnetization was considered negligible. We have assumed that potassic alteration increased the magnetization of the plutonic rocks from 2 to 3 A/m and increased the magnetization of host volcanic and clastic rocks from 3 to 5 A/m (A/m is amperes per meter, a standard unit describing the magnitude of magnetization). The zone of sericitic alteration was assumed to be nonmagnetic. Propylitic alteration, outside the limits of pyrite mineralization, increased the magnetization of volcanic and clastic rocks from 3 to 6 A/m. The model includes skarn deposits, here considered to be significantly magnetic, at 5 A/m. The unaltered volca-nic overburden also was assigned a magnetization of 5 A/m. Figure F2A shows the magnetic anomaly along a southwest-northeast transect directly over the porphyry copper deposit. The anomaly consists of a broad high and broad low, with 220-nT (nanoteslas) peak-to-trough amplitude. The smooth character of the magnetic anomaly reflects the 1-km depth of burial; the anomaly would exhibit greater detail and higher amplitude if the porphyry copper deposit were nearer to the topographic surface.
Figure F2B puts our magnetic model into a more prag-matic context. It shows the magnetic field that actually exists along an arbitrary southeast-northwest transect across the Patagonia Mountains (Phillips, 1998) and indicates how this observed magnetic field would change by the introduction of our hypothetical porphyry copper deposit. The magnetic expression of the porphyry copper deposit is rather subtle in this example, largely because of the 1-km-thick overburden, emphasizing the importance of using multiple geophysical, geological, and geochemical exploration tools.
A number of published studies have found convincing evidence for porphyry copper deposits in magnetic anomalies.
Thoman and others (2000) observed the characteristic annular magnetic low in high-resolution aeromagnetic data flown at 80-m elevation above the Silver Bell district in Arizona, although a detailed ground-magnetic survey of the same deposit returned mixed results (fig. F3). Ferneyhough (2000) noted symmetrical magnetic anomalies associated with the Batu Hijau porphyry copper deposit in Indonesia, in this case a circular magnetic high centered over the deposit and strongly correlated with copper. Ferneyhough (2000) concluded that the primary source of the magnetic anomaly is hydrothermal magnetite associated with potassic alteration, as opposed to lithologic variations. Because measured magnetic susceptibili-ties were found to correlate with potassic alteration, Fern-eyhough (2000) concluded that magnetic anomalies directly reflect potassic alteration associated with copper deposition at Batu Hijau.
Electrical and Electromagnetic MethodsMinerals and rocks associated with hydrothermal altera-
tion often have anomalous electrical properties, and thus geophysical methods that detect and model such properties are mainstays in the exploration for and characterization of porphyry copper deposits. Like the distribution of magnetic minerals, electrical properties reflect the type and degree of hydrothermal alteration. Insofar as alteration has predictable symmetry, electrical anomalies should exhibit similar symmet-rical patterns.
Electrical and electromagnetic methods ultimately target the electrical resistivity (reciprocal of conductiv-ity) of rocks and minerals. Resistivity of geologic materials has an enormous range of values, varying by 20 orders of magnitude, greater in fact than any other geophysical rock property. Quartz, for example, is highly resistive (more than 105 ohm-m), whereas native copper is extremely conductive (about 10–8 ohm-m). Within the upper crust, the resistivity of geologic units is largely dependent upon their fluid content and salinity, porosity, degree of fracturing, temperature, and conductive mineral content (Keller, 1987). Saline fluids within pore spaces and fracture openings can reduce bulk resistivities by several orders of magnitude relative to the dry rock matrix. Resistivity also can be lowered by the presence of conductive clay minerals, graphite, and metallic sulfide mineralization. Fault zones exhibit low resistivity (less than 100 ohm-m) when they are composed of rocks sufficiently fractured to allow fluid flow and consequent mineralogical alteration. In general, zones of massive sulfide minerals, graphite, and saline water are very conductive (less than 1 ohm-m); sedimentary rocks, weathered rocks, non-sulfide-rich alteration zones, and freshwater are moderately resistive (about 10–1,000 ohm-m); and igneous and metamorphic rocks are very resistive (more than 1,000 ohm-m). Tables of electrical resistivity for a variety of rocks, minerals, and geological environments are in Keller (1987) and Palacky (1987). Hydrothermal minerals relevant to geophysical exploration are pyrite, chalcopyrite, chalcocite, biotite, and sericite. As with magnetic anomalies, we would
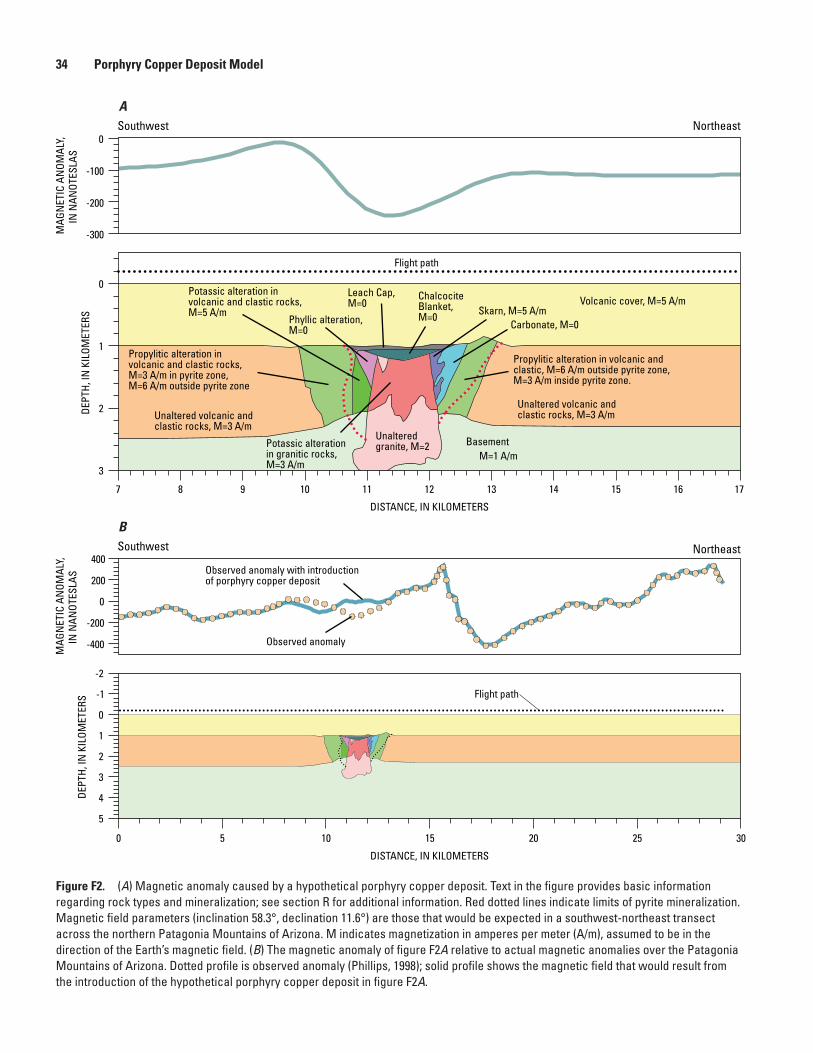
Figure F2. (A) Magnetic anomaly caused by a hypothetical porphyry copper deposit. Text in the figure provides basic information regarding rock types and mineralization; see section R for additional information. Red dotted lines indicate limits of pyrite mineralization. Magnetic field parameters (inclination 58.3°, declination 11.6°) are those that would be expected in a southwest-northeast transect across the northern Patagonia Mountains of Arizona. M indicates magnetization in amperes per meter (A/m), assumed to be in the direction of the Earth’s magnetic field. (B) The magnetic anomaly of figure F2A relative to actual magnetic anomalies over the Patagonia Mountains of Arizona. Dotted profile is observed anomaly (Phillips, 1998); solid profile shows the magnetic field that would result from the introduction of the hypothetical porphyry copper deposit in figure F2A.
-400
-200
0
200
400
0 5 10 15 20 25 30
DISTANCE, IN KILOMETERS
5
4
3
2
1
0
-1
-2
MAG
NET
IC A
NOM
ALY,
IN N
ANOT
ESLA
S DE
PTH,
IN K
ILOM
ETER
S
MAG
NET
IC A
NOM
ALY,
IN N
ANOT
ESLA
S
-300
-200
-100
0
7 8 9 10 11 12 13 14 15 16 17
DEPT
H, IN
KIL
OMET
ERS
3
2
1
0
Flight path
Volcanic cover, M=5 A/m Leach Cap,M=0
Chalcocite Blanket,M=0 Skarn, M=5 A/m
Unaltered granite, M=2 Potassic alteration
in granitic rocks,M=3 A/m
Unaltered volcanic and clastic rocks, M=3 A/m
Carbonate, M=0
Potassic alteration in volcanic and clastic rocks,M=5 A/m
Propylitic alteration in volcanic and clastic, M=6 A/m outside pyrite zone,M=3 A/m inside pyrite zone.
Basement
Propylitic alteration involcanic and clastic rocks,M=3 A/m in pyrite zone,M=6 A/m outside pyrite zone
Phyllic alteration,M=0
M=1 A/m
Unaltered volcanic and clastic rocks, M=3 A/m
Southwest Northeast
DISTANCE, IN KILOMETERS
Southwest Northeast
Flight path
Observed anomaly
Observed anomaly with introduction of porphyry copper deposit
A
B
34 Porphyry Copper Deposit Model
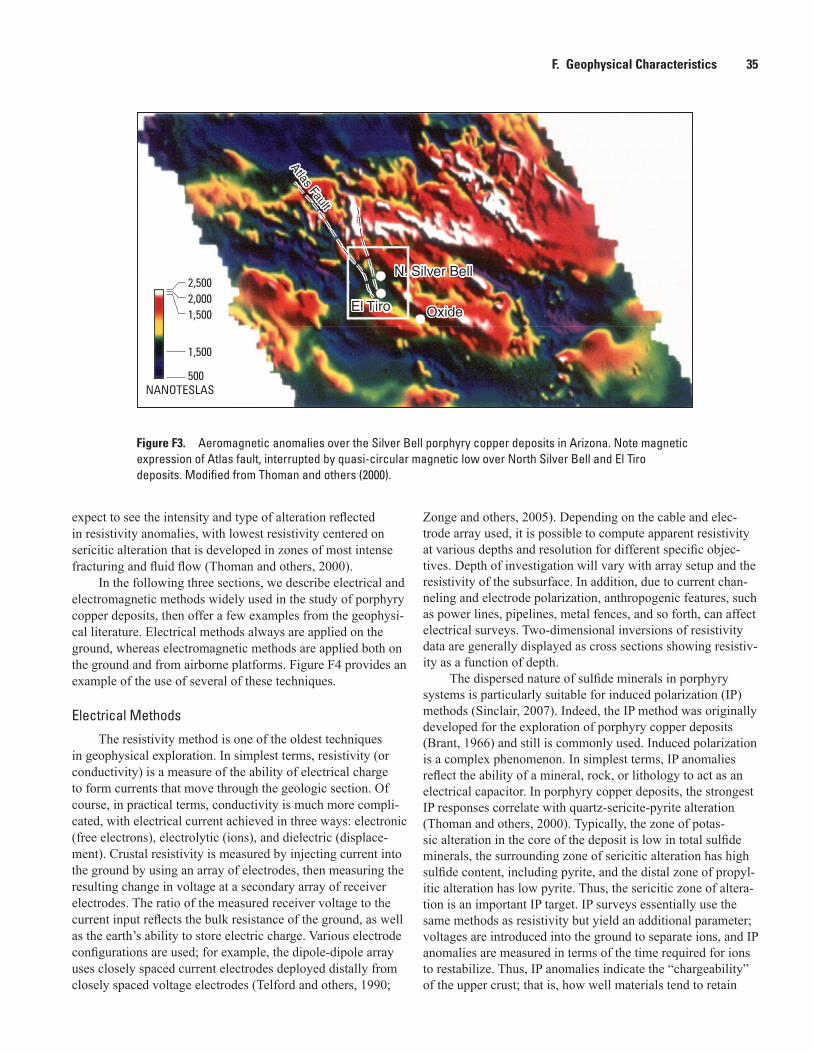
Figure F3. Aeromagnetic anomalies over the Silver Bell porphyry copper deposits in Arizona. Note magnetic expression of Atlas fault, interrupted by quasi-circular magnetic low over North Silver Bell and El Tiro deposits. Modified from Thoman and others (2000).
2,5002,0001,500
1,500
NANOTESLAS500
N. Silver BellN. Silver Bell
El TiroEl Tiro OxideOxide
Atlas Fault
Atlas Fault
F. Geophysical Characteristics 35
expect to see the intensity and type of alteration reflected in resistivity anomalies, with lowest resistivity centered on sericitic alteration that is developed in zones of most intense fracturing and fluid flow (Thoman and others, 2000).
In the following three sections, we describe electrical and electromagnetic methods widely used in the study of porphyry copper deposits, then offer a few examples from the geophysi-cal literature. Electrical methods always are applied on the ground, whereas electromagnetic methods are applied both on the ground and from airborne platforms. Figure F4 provides an example of the use of several of these techniques.
Electrical Methods
The resistivity method is one of the oldest techniques in geophysical exploration. In simplest terms, resistivity (or conductivity) is a measure of the ability of electrical charge to form currents that move through the geologic section. Of course, in practical terms, conductivity is much more compli-cated, with electrical current achieved in three ways: electronic (free electrons), electrolytic (ions), and dielectric (displace-ment). Crustal resistivity is measured by injecting current into the ground by using an array of electrodes, then measuring the resulting change in voltage at a secondary array of receiver electrodes. The ratio of the measured receiver voltage to the current input reflects the bulk resistance of the ground, as well as the earth’s ability to store electric charge. Various electrode configurations are used; for example, the dipole-dipole array uses closely spaced current electrodes deployed distally from closely spaced voltage electrodes (Telford and others, 1990;
Zonge and others, 2005). Depending on the cable and elec-trode array used, it is possible to compute apparent resistivity at various depths and resolution for different specific objec-tives. Depth of investigation will vary with array setup and the resistivity of the subsurface. In addition, due to current chan-neling and electrode polarization, anthropogenic features, such as power lines, pipelines, metal fences, and so forth, can affect electrical surveys. Two-dimensional inversions of resistivity data are generally displayed as cross sections showing resistiv-ity as a function of depth.
The dispersed nature of sulfide minerals in porphyry systems is particularly suitable for induced polarization (IP) methods (Sinclair, 2007). Indeed, the IP method was originally developed for the exploration of porphyry copper deposits (Brant, 1966) and still is commonly used. Induced polarization is a complex phenomenon. In simplest terms, IP anomalies reflect the ability of a mineral, rock, or lithology to act as an electrical capacitor. In porphyry copper deposits, the strongest IP responses correlate with quartz-sericite-pyrite alteration (Thoman and others, 2000). Typically, the zone of potas-sic alteration in the core of the deposit is low in total sulfide minerals, the surrounding zone of sericitic alteration has high sulfide content, including pyrite, and the distal zone of propyl-itic alteration has low pyrite. Thus, the sericitic zone of altera-tion is an important IP target. IP surveys essentially use the same methods as resistivity but yield an additional parameter; voltages are introduced into the ground to separate ions, and IP anomalies are measured in terms of the time required for ions to restabilize. Thus, IP anomalies indicate the “chargeability” of the upper crust; that is, how well materials tend to retain
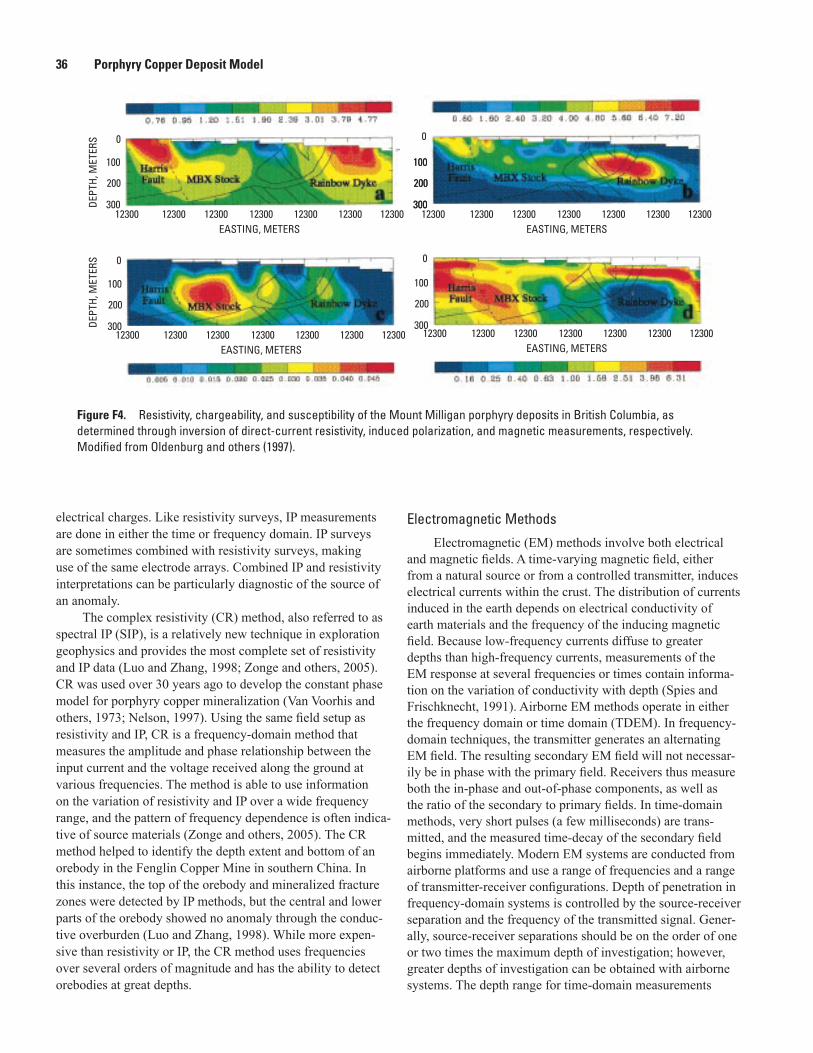
Figure F4. Resistivity, chargeability, and susceptibility of the Mount Milligan porphyry deposits in British Columbia, as determined through inversion of direct-current resistivity, induced polarization, and magnetic measurements, respectively. Modified from Oldenburg and others (1997).
DEPT
H, M
ETER
S 0
100
200
300
DEPT
H, M
ETER
S 0
100
200
300
100
200
300
0
100
200
300
0
100
200
300
12300 123001230012300123001230012300EASTING, METERS
12300 123001230012300123001230012300EASTING, METERS
12300 123001230012300123001230012300EASTING, METERS
12300 123001230012300123001230012300EASTING, METERS
36 Porphyry Copper Deposit Model
electrical charges. Like resistivity surveys, IP measurements are done in either the time or frequency domain. IP surveys are sometimes combined with resistivity surveys, making use of the same electrode arrays. Combined IP and resistivity interpretations can be particularly diagnostic of the source of an anomaly.
The complex resistivity (CR) method, also referred to as spectral IP (SIP), is a relatively new technique in exploration geophysics and provides the most complete set of resistivity and IP data (Luo and Zhang, 1998; Zonge and others, 2005). CR was used over 30 years ago to develop the constant phase model for porphyry copper mineralization (Van Voorhis and others, 1973; Nelson, 1997). Using the same field setup as resistivity and IP, CR is a frequency-domain method that measures the amplitude and phase relationship between the input current and the voltage received along the ground at various frequencies. The method is able to use information on the variation of resistivity and IP over a wide frequency range, and the pattern of frequency dependence is often indica-tive of source materials (Zonge and others, 2005). The CR method helped to identify the depth extent and bottom of an orebody in the Fenglin Copper Mine in southern China. In this instance, the top of the orebody and mineralized fracture zones were detected by IP methods, but the central and lower parts of the orebody showed no anomaly through the conduc-tive overburden (Luo and Zhang, 1998). While more expen-sive than resistivity or IP, the CR method uses frequencies over several orders of magnitude and has the ability to detect orebodies at great depths.
Electromagnetic Methods
Electromagnetic (EM) methods involve both electrical and magnetic fields. A time-varying magnetic field, either from a natural source or from a controlled transmitter, induces electrical currents within the crust. The distribution of currents induced in the earth depends on electrical conductivity of earth materials and the frequency of the inducing magnetic field. Because low-frequency currents diffuse to greater depths than high-frequency currents, measurements of the EM response at several frequencies or times contain informa-tion on the variation of conductivity with depth (Spies and Frischknecht, 1991). Airborne EM methods operate in either the frequency domain or time domain (TDEM). In frequency-domain techniques, the transmitter generates an alternating EM field. The resulting secondary EM field will not necessar-ily be in phase with the primary field. Receivers thus measure both the in-phase and out-of-phase components, as well as the ratio of the secondary to primary fields. In time-domain methods, very short pulses (a few milliseconds) are trans-mitted, and the measured time-decay of the secondary field begins immediately. Modern EM systems are conducted from airborne platforms and use a range of frequencies and a range of transmitter-receiver configurations. Depth of penetration in frequency-domain systems is controlled by the source-receiver separation and the frequency of the transmitted signal. Gener-ally, source-receiver separations should be on the order of one or two times the maximum depth of investigation; however, greater depths of investigation can be obtained with airborne systems. The depth range for time-domain measurements
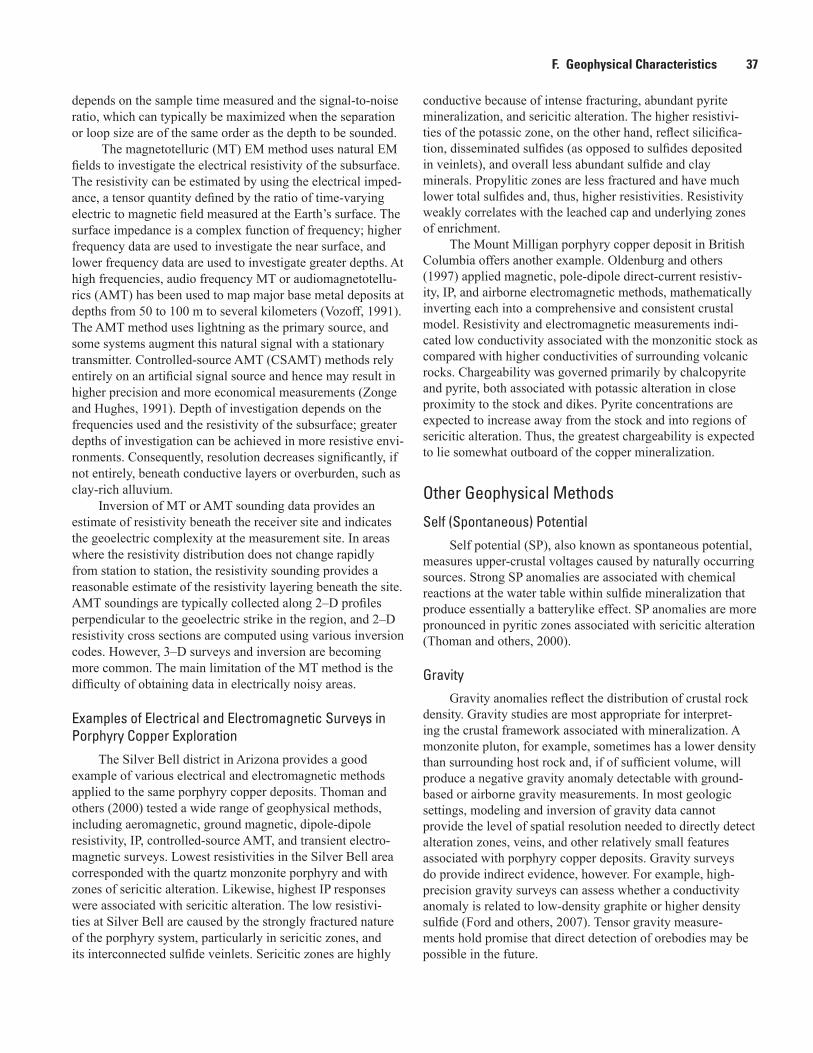
F. Geophysical Characteristics 37
depends on the sample time measured and the signal-to-noise ratio, which can typically be maximized when the separation or loop size are of the same order as the depth to be sounded.
The magnetotelluric (MT) EM method uses natural EM fields to investigate the electrical resistivity of the subsurface. The resistivity can be estimated by using the electrical imped-ance, a tensor quantity defined by the ratio of time-varying electric to magnetic field measured at the Earth’s surface. The surface impedance is a complex function of frequency; higher frequency data are used to investigate the near surface, and lower frequency data are used to investigate greater depths. At high frequencies, audio frequency MT or audiomagnetotellu-rics (AMT) has been used to map major base metal deposits at depths from 50 to 100 m to several kilometers (Vozoff, 1991). The AMT method uses lightning as the primary source, and some systems augment this natural signal with a stationary transmitter. Controlled-source AMT (CSAMT) methods rely entirely on an artificial signal source and hence may result in higher precision and more economical measurements (Zonge and Hughes, 1991). Depth of investigation depends on the frequencies used and the resistivity of the subsurface; greater depths of investigation can be achieved in more resistive envi-ronments. Consequently, resolution decreases significantly, if not entirely, beneath conductive layers or overburden, such as clay-rich alluvium.
Inversion of MT or AMT sounding data provides an estimate of resistivity beneath the receiver site and indicates the geoelectric complexity at the measurement site. In areas where the resistivity distribution does not change rapidly from station to station, the resistivity sounding provides a reasonable estimate of the resistivity layering beneath the site. AMT soundings are typically collected along 2–D profiles perpendicular to the geoelectric strike in the region, and 2–D resistivity cross sections are computed using various inversion codes. However, 3–D surveys and inversion are becoming more common. The main limitation of the MT method is the difficulty of obtaining data in electrically noisy areas.
Examples of Electrical and Electromagnetic Surveys in Porphyry Copper Exploration
The Silver Bell district in Arizona provides a good example of various electrical and electromagnetic methods applied to the same porphyry copper deposits. Thoman and others (2000) tested a wide range of geophysical methods, including aeromagnetic, ground magnetic, dipole-dipole resistivity, IP, controlled-source AMT, and transient electro-magnetic surveys. Lowest resistivities in the Silver Bell area corresponded with the quartz monzonite porphyry and with zones of sericitic alteration. Likewise, highest IP responses were associated with sericitic alteration. The low resistivi-ties at Silver Bell are caused by the strongly fractured nature of the porphyry system, particularly in sericitic zones, and its interconnected sulfide veinlets. Sericitic zones are highly
conductive because of intense fracturing, abundant pyrite mineralization, and sericitic alteration. The higher resistivi-ties of the potassic zone, on the other hand, reflect silicifica-tion, disseminated sulfides (as opposed to sulfides deposited in veinlets), and overall less abundant sulfide and clay minerals. Propylitic zones are less fractured and have much lower total sulfides and, thus, higher resistivities. Resistivity weakly correlates with the leached cap and underlying zones of enrichment.
The Mount Milligan porphyry copper deposit in British Columbia offers another example. Oldenburg and others (1997) applied magnetic, pole-dipole direct-current resistiv-ity, IP, and airborne electromagnetic methods, mathematically inverting each into a comprehensive and consistent crustal model. Resistivity and electromagnetic measurements indi-cated low conductivity associated with the monzonitic stock as compared with higher conductivities of surrounding volcanic rocks. Chargeability was governed primarily by chalcopyrite and pyrite, both associated with potassic alteration in close proximity to the stock and dikes. Pyrite concentrations are expected to increase away from the stock and into regions of sericitic alteration. Thus, the greatest chargeability is expected to lie somewhat outboard of the copper mineralization.
Other Geophysical Methods
Self (Spontaneous) Potential Self potential (SP), also known as spontaneous potential,
measures upper-crustal voltages caused by naturally occurring sources. Strong SP anomalies are associated with chemical reactions at the water table within sulfide mineralization that produce essentially a batterylike effect. SP anomalies are more pronounced in pyritic zones associated with sericitic alteration (Thoman and others, 2000).
GravityGravity anomalies reflect the distribution of crustal rock
density. Gravity studies are most appropriate for interpret-ing the crustal framework associated with mineralization. A monzonite pluton, for example, sometimes has a lower density than surrounding host rock and, if of sufficient volume, will produce a negative gravity anomaly detectable with ground-based or airborne gravity measurements. In most geologic settings, modeling and inversion of gravity data cannot provide the level of spatial resolution needed to directly detect alteration zones, veins, and other relatively small features associated with porphyry copper deposits. Gravity surveys do provide indirect evidence, however. For example, high-precision gravity surveys can assess whether a conductivity anomaly is related to low-density graphite or higher density sulfide (Ford and others, 2007). Tensor gravity measure-ments hold promise that direct detection of orebodies may be possible in the future.
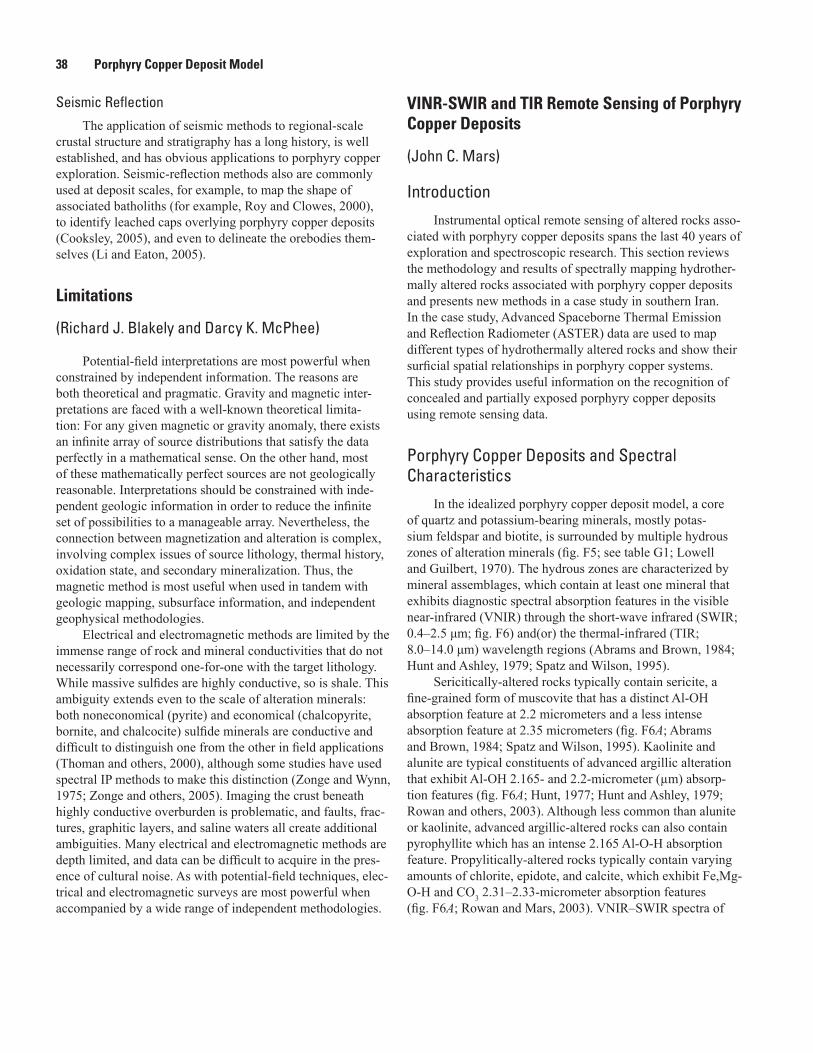
38 Porphyry Copper Deposit Model
Seismic Reflection
The application of seismic methods to regional-scale crustal structure and stratigraphy has a long history, is well established, and has obvious applications to porphyry copper exploration. Seismic-reflection methods also are commonly used at deposit scales, for example, to map the shape of associated batholiths (for example, Roy and Clowes, 2000), to identify leached caps overlying porphyry copper deposits (Cooksley, 2005), and even to delineate the orebodies them-selves (Li and Eaton, 2005).
Limitations
(Richard J. Blakely and Darcy K. McPhee)
Potential-field interpretations are most powerful when constrained by independent information. The reasons are both theoretical and pragmatic. Gravity and magnetic inter-pretations are faced with a well-known theoretical limita-tion: For any given magnetic or gravity anomaly, there exists an infinite array of source distributions that satisfy the data perfectly in a mathematical sense. On the other hand, most of these mathematically perfect sources are not geologically reasonable. Interpretations should be constrained with inde-pendent geologic information in order to reduce the infinite set of possibilities to a manageable array. Nevertheless, the connection between magnetization and alteration is complex, involving complex issues of source lithology, thermal history, oxidation state, and secondary mineralization. Thus, the magnetic method is most useful when used in tandem with geologic mapping, subsurface information, and independent geophysical methodologies.
Electrical and electromagnetic methods are limited by the immense range of rock and mineral conductivities that do not necessarily correspond one-for-one with the target lithology. While massive sulfides are highly conductive, so is shale. This ambiguity extends even to the scale of alteration minerals: both noneconomical (pyrite) and economical (chalcopyrite, bornite, and chalcocite) sulfide minerals are conductive and difficult to distinguish one from the other in field applications (Thoman and others, 2000), although some studies have used spectral IP methods to make this distinction (Zonge and Wynn, 1975; Zonge and others, 2005). Imaging the crust beneath highly conductive overburden is problematic, and faults, frac-tures, graphitic layers, and saline waters all create additional ambiguities. Many electrical and electromagnetic methods are depth limited, and data can be difficult to acquire in the pres-ence of cultural noise. As with potential-field techniques, elec-trical and electromagnetic surveys are most powerful when accompanied by a wide range of independent methodologies.
VINR-SWIR and TIR Remote Sensing of Porphyry Copper Deposits
(John C. Mars)
Introduction
Instrumental optical remote sensing of altered rocks asso-ciated with porphyry copper deposits spans the last 40 years of exploration and spectroscopic research. This section reviews the methodology and results of spectrally mapping hydrother-mally altered rocks associated with porphyry copper deposits and presents new methods in a case study in southern Iran. In the case study, Advanced Spaceborne Thermal Emission and Reflection Radiometer (ASTER) data are used to map different types of hydrothermally altered rocks and show their surficial spatial relationships in porphyry copper systems. This study provides useful information on the recognition of concealed and partially exposed porphyry copper deposits using remote sensing data.
Porphyry Copper Deposits and Spectral Characteristics
In the idealized porphyry copper deposit model, a core of quartz and potassium-bearing minerals, mostly potas-sium feldspar and biotite, is surrounded by multiple hydrous zones of alteration minerals (fig. F5; see table G1; Lowell and Guilbert, 1970). The hydrous zones are characterized by mineral assemblages, which contain at least one mineral that exhibits diagnostic spectral absorption features in the visible near-infrared (VNIR) through the short-wave infrared (SWIR; 0.4–2.5 μm; fig. F6) and(or) the thermal-infrared (TIR; 8.0–14.0 μm) wavelength regions (Abrams and Brown, 1984; Hunt and Ashley, 1979; Spatz and Wilson, 1995).
Sericitically-altered rocks typically contain sericite, a fine-grained form of muscovite that has a distinct Al-OH absorption feature at 2.2 micrometers and a less intense absorption feature at 2.35 micrometers (fig. F6A; Abrams and Brown, 1984; Spatz and Wilson, 1995). Kaolinite and alunite are typical constituents of advanced argillic alteration that exhibit Al-OH 2.165- and 2.2-micrometer (µm) absorp-tion features (fig. F6A; Hunt, 1977; Hunt and Ashley, 1979; Rowan and others, 2003). Although less common than alunite or kaolinite, advanced argillic-altered rocks can also contain pyrophyllite which has an intense 2.165 Al-O-H absorption feature. Propylitically-altered rocks typically contain varying amounts of chlorite, epidote, and calcite, which exhibit Fe,Mg-O-H and CO3 2.31–2.33-micrometer absorption features (fig. F6A; Rowan and Mars, 2003). VNIR–SWIR spectra of
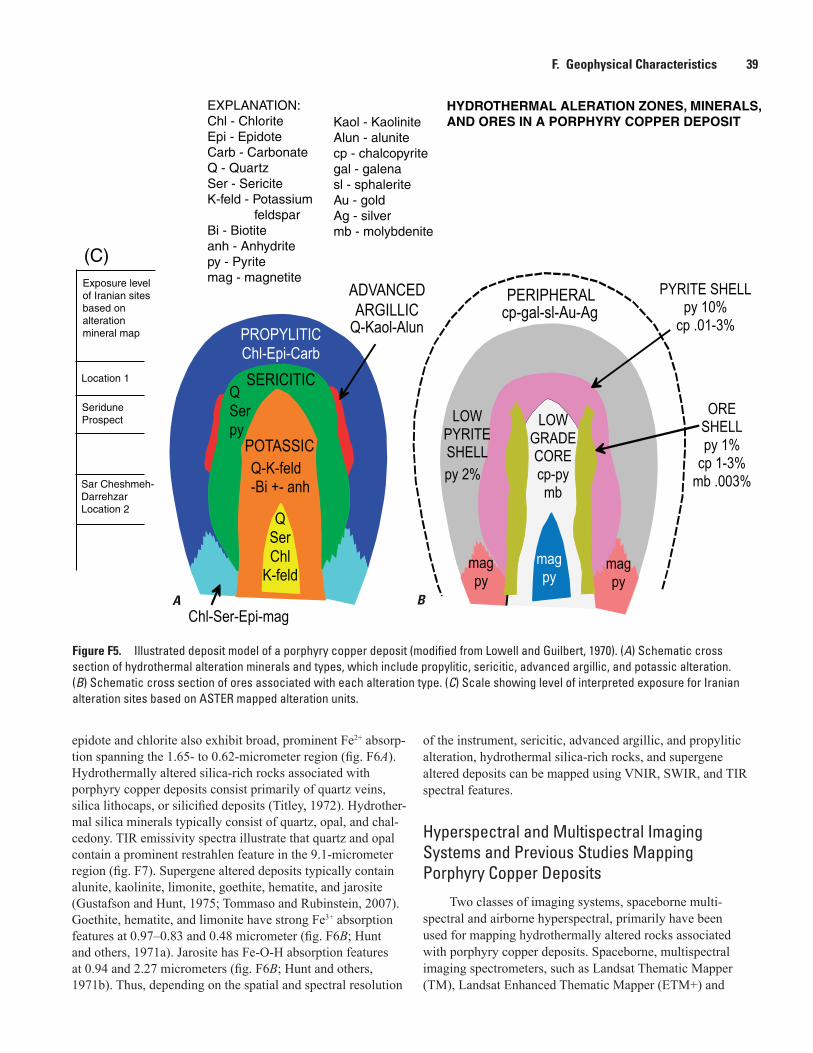
Figure F5. Illustrated deposit model of a porphyry copper deposit (modified from Lowell and Guilbert, 1970). (A) Schematic cross section of hydrothermal alteration minerals and types, which include propylitic, sericitic, advanced argillic, and potassic alteration. (B) Schematic cross section of ores associated with each alteration type. (C) Scale showing level of interpreted exposure for Iranian alteration sites based on ASTER mapped alteration units.
Location 1
(C)
EXPLANATION:Chl - ChloriteEpi - EpidoteCarb - CarbonateQ - QuartzSer - SericiteK-feld - Potassium feldsparBi - Biotiteanh - Anhydritepy - Pyritemag - magnetite
Kaol - KaoliniteAlun - alunitecp - chalcopyritegal - galenasl - sphaleriteAu - goldAg - silvermb - molybdenite
HYDROTHERMAL ALERATION ZONES, MINERALS,AND ORES IN A PORPHYRY COPPER DEPOSIT
Sar Cheshmeh-Darrehzar Location 2
Exposure level of Iranian sites based on alteration mineral map
Seridune Prospect
A B
F. Geophysical Characteristics 39
epidote and chlorite also exhibit broad, prominent Fe2+ absorp-tion spanning the 1.65- to 0.62-micrometer region (fig. F6A). Hydrothermally altered silica-rich rocks associated with porphyry copper deposits consist primarily of quartz veins, silica lithocaps, or silicified deposits (Titley, 1972). Hydrother-mal silica minerals typically consist of quartz, opal, and chal-cedony. TIR emissivity spectra illustrate that quartz and opal contain a prominent restrahlen feature in the 9.1-micrometer region (fig. F7). Supergene altered deposits typically contain alunite, kaolinite, limonite, goethite, hematite, and jarosite (Gustafson and Hunt, 1975; Tommaso and Rubinstein, 2007). Goethite, hematite, and limonite have strong Fe3+ absorption features at 0.97–0.83 and 0.48 micrometer (fig. F6B; Hunt and others, 1971a). Jarosite has Fe-O-H absorption features at 0.94 and 2.27 micrometers (fig. F6B; Hunt and others, 1971b). Thus, depending on the spatial and spectral resolution
of the instrument, sericitic, advanced argillic, and propylitic alteration, hydrothermal silica-rich rocks, and supergene altered deposits can be mapped using VNIR, SWIR, and TIR spectral features.
Hyperspectral and Multispectral Imaging Systems and Previous Studies Mapping Porphyry Copper Deposits
Two classes of imaging systems, spaceborne multi-spectral and airborne hyperspectral, primarily have been used for mapping hydrothermally altered rocks associated with porphyry copper deposits. Spaceborne, multispectral imaging spectrometers, such as Landsat Thematic Mapper (TM), Landsat Enhanced Thematic Mapper (ETM+) and
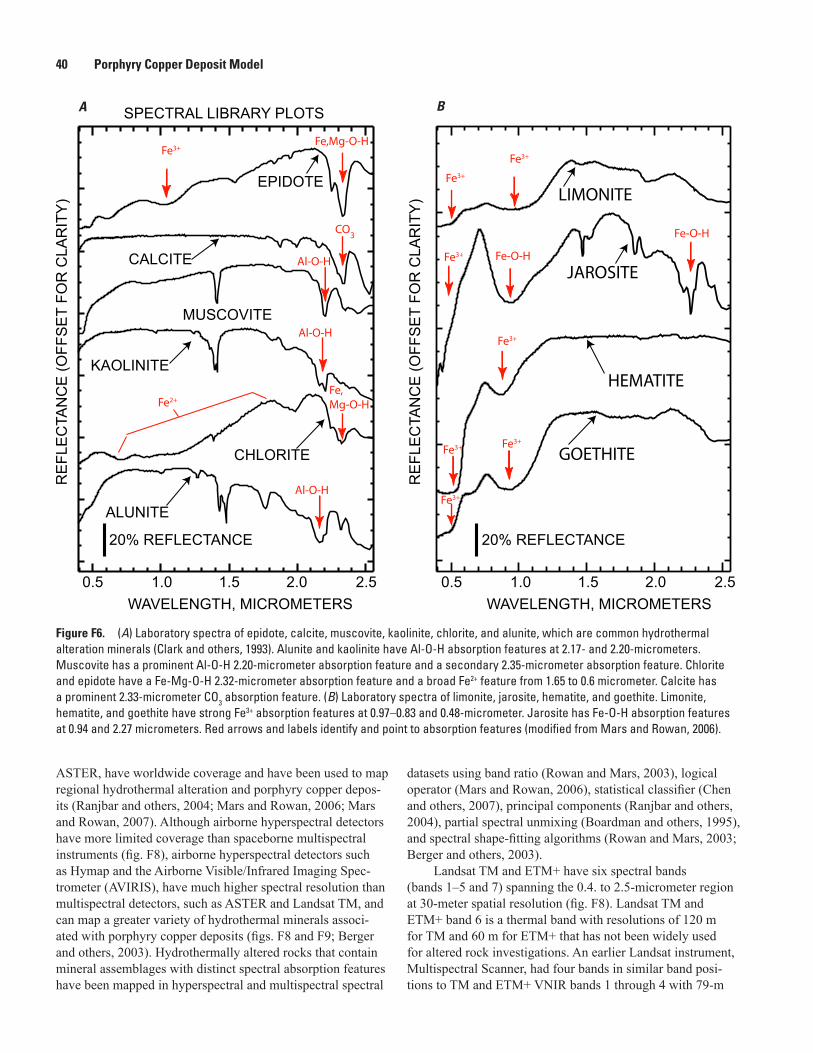
A B
Figure F6. (A) Laboratory spectra of epidote, calcite, muscovite, kaolinite, chlorite, and alunite, which are common hydrothermal alteration minerals (Clark and others, 1993). Alunite and kaolinite have Al-O-H absorption features at 2.17- and 2.20-micrometers. Muscovite has a prominent Al-O-H 2.20-micrometer absorption feature and a secondary 2.35-micrometer absorption feature. Chlorite and epidote have a Fe-Mg-O-H 2.32-micrometer absorption feature and a broad Fe2+ feature from 1.65 to 0.6 micrometer. Calcite has a prominent 2.33-micrometer CO3 absorption feature. (B) Laboratory spectra of limonite, jarosite, hematite, and goethite. Limonite, hematite, and goethite have strong Fe3+ absorption features at 0.97–0.83 and 0.48-micrometer. Jarosite has Fe-O-H absorption features at 0.94 and 2.27 micrometers. Red arrows and labels identify and point to absorption features (modified from Mars and Rowan, 2006).
40 Porphyry Copper Deposit Model
ASTER, have worldwide coverage and have been used to map regional hydrothermal alteration and porphyry copper depos-its (Ranjbar and others, 2004; Mars and Rowan, 2006; Mars and Rowan, 2007). Although airborne hyperspectral detectors have more limited coverage than spaceborne multispectral instruments (fig. F8), airborne hyperspectral detectors such as Hymap and the Airborne Visible/Infrared Imaging Spec-trometer (AVIRIS), have much higher spectral resolution than multispectral detectors, such as ASTER and Landsat TM, and can map a greater variety of hydrothermal minerals associ-ated with porphyry copper deposits (figs. F8 and F9; Berger and others, 2003). Hydrothermally altered rocks that contain mineral assemblages with distinct spectral absorption features have been mapped in hyperspectral and multispectral spectral
datasets using band ratio (Rowan and Mars, 2003), logical operator (Mars and Rowan, 2006), statistical classifier (Chen and others, 2007), principal components (Ranjbar and others, 2004), partial spectral unmixing (Boardman and others, 1995), and spectral shape-fitting algorithms (Rowan and Mars, 2003; Berger and others, 2003).
Landsat TM and ETM+ have six spectral bands (bands 1–5 and 7) spanning the 0.4. to 2.5-micrometer region at 30-meter spatial resolution (fig. F8). Landsat TM and ETM+ band 6 is a thermal band with resolutions of 120 m for TM and 60 m for ETM+ that has not been widely used for altered rock investigations. An earlier Landsat instrument, Multispectral Scanner, had four bands in similar band posi-tions to TM and ETM+ VNIR bands 1 through 4 with 79-m
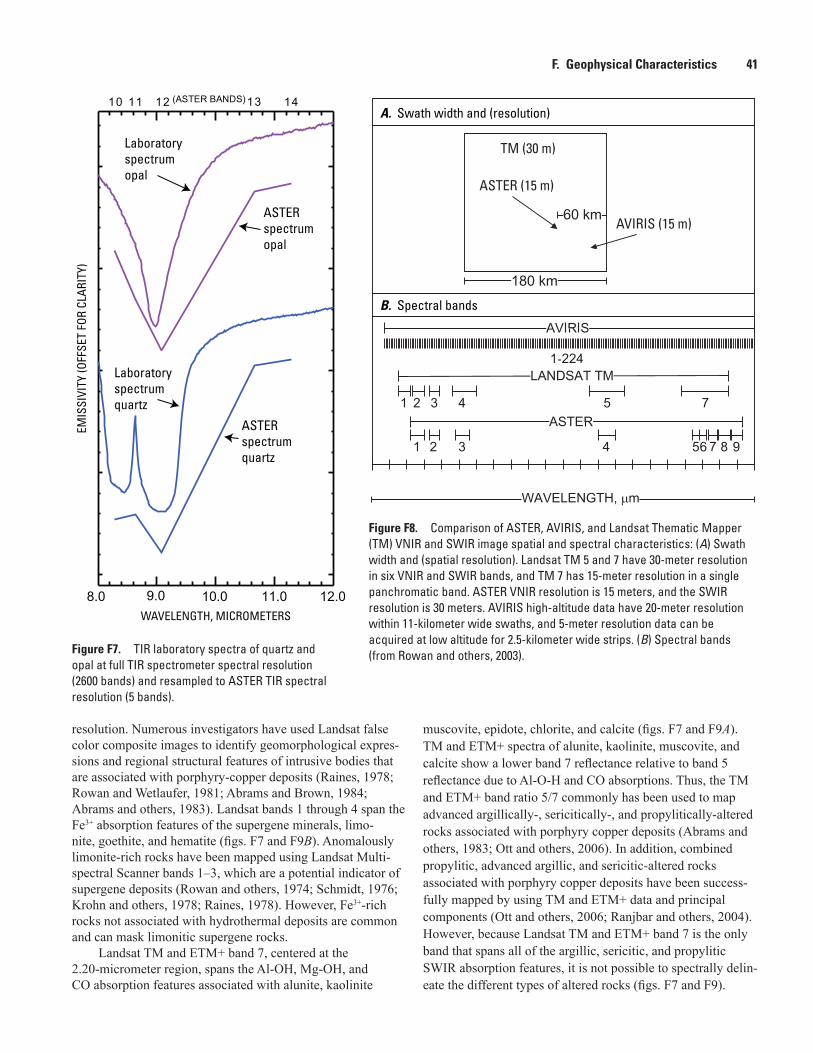
TM (30 m)
ASTER (15 m)
AVIRIS (15 m)
A. Swath width and (resolution)
B. Spectral bands
Figure F8. Comparison of ASTER, AVIRIS, and Landsat Thematic Mapper (TM) VNIR and SWIR image spatial and spectral characteristics: (A) Swath width and (spatial resolution). Landsat TM 5 and 7 have 30-meter resolution in six VNIR and SWIR bands, and TM 7 has 15-meter resolution in a single panchromatic band. ASTER VNIR resolution is 15 meters, and the SWIR resolution is 30 meters. AVIRIS high-altitude data have 20-meter resolution within 11-kilometer wide swaths, and 5-meter resolution data can be acquired at low altitude for 2.5-kilometer wide strips. (B) Spectral bands (from Rowan and others, 2003).Figure F7. TIR laboratory spectra of quartz and
opal at full TIR spectrometer spectral resolution (2600 bands) and resampled to ASTER TIR spectral resolution (5 bands).
Laboratoryspectrumopal
Laboratoryspectrumquartz
ASTERspectrumopal
ASTERspectrumquartz
WAVELENGTH, MICROMETERS
EMIS
SIVI
TY (O
FFSE
T FO
R CL
ARIT
Y)F. Geophysical Characteristics 41
resolution. Numerous investigators have used Landsat false color composite images to identify geomorphological expres-sions and regional structural features of intrusive bodies that are associated with porphyry-copper deposits (Raines, 1978; Rowan and Wetlaufer, 1981; Abrams and Brown, 1984; Abrams and others, 1983). Landsat bands 1 through 4 span the Fe3+ absorption features of the supergene minerals, limo-nite, goethite, and hematite (figs. F7 and F9B). Anomalously limonite-rich rocks have been mapped using Landsat Multi-spectral Scanner bands 1–3, which are a potential indicator of supergene deposits (Rowan and others, 1974; Schmidt, 1976; Krohn and others, 1978; Raines, 1978). However, Fe3+-rich rocks not associated with hydrothermal deposits are common and can mask limonitic supergene rocks.
Landsat TM and ETM+ band 7, centered at the 2.20-micrometer region, spans the Al-OH, Mg-OH, and CO absorption features associated with alunite, kaolinite
muscovite, epidote, chlorite, and calcite (figs. F7 and F9A). TM and ETM+ spectra of alunite, kaolinite, muscovite, and calcite show a lower band 7 reflectance relative to band 5 reflectance due to Al-O-H and CO absorptions. Thus, the TM and ETM+ band ratio 5/7 commonly has been used to map advanced argillically-, sericitically-, and propylitically-altered rocks associated with porphyry copper deposits (Abrams and others, 1983; Ott and others, 2006). In addition, combined propylitic, advanced argillic, and sericitic-altered rocks associated with porphyry copper deposits have been success-fully mapped by using TM and ETM+ data and principal components (Ott and others, 2006; Ranjbar and others, 2004). However, because Landsat TM and ETM+ band 7 is the only band that spans all of the argillic, sericitic, and propylitic SWIR absorption features, it is not possible to spectrally delin-eate the different types of altered rocks (figs. F7 and F9).
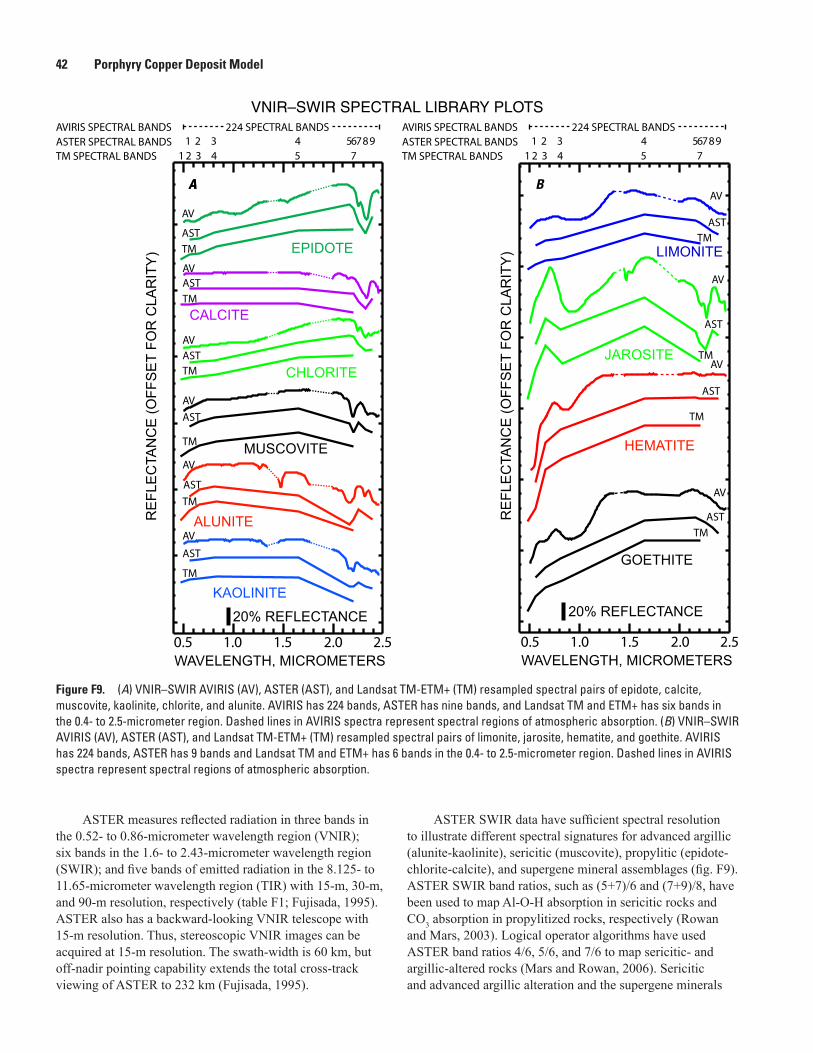
VNIR–SWIR SPECTRAL LIBRARY PLOTS
AA B
Figure F9. (A) VNIR–SWIR AVIRIS (AV), ASTER (AST), and Landsat TM-ETM+ (TM) resampled spectral pairs of epidote, calcite, muscovite, kaolinite, chlorite, and alunite. AVIRIS has 224 bands, ASTER has nine bands, and Landsat TM and ETM+ has six bands in the 0.4- to 2.5-micrometer region. Dashed lines in AVIRIS spectra represent spectral regions of atmospheric absorption. (B) VNIR–SWIR AVIRIS (AV), ASTER (AST), and Landsat TM-ETM+ (TM) resampled spectral pairs of limonite, jarosite, hematite, and goethite. AVIRIS has 224 bands, ASTER has 9 bands and Landsat TM and ETM+ has 6 bands in the 0.4- to 2.5-micrometer region. Dashed lines in AVIRIS spectra represent spectral regions of atmospheric absorption.
42 Porphyry Copper Deposit Model
ASTER measures reflected radiation in three bands in the 0.52- to 0.86-micrometer wavelength region (VNIR); six bands in the 1.6- to 2.43-micrometer wavelength region (SWIR); and five bands of emitted radiation in the 8.125- to 11.65-micrometer wavelength region (TIR) with 15-m, 30-m, and 90-m resolution, respectively (table F1; Fujisada, 1995). ASTER also has a backward-looking VNIR telescope with 15-m resolution. Thus, stereoscopic VNIR images can be acquired at 15-m resolution. The swath-width is 60 km, but off-nadir pointing capability extends the total cross-track viewing of ASTER to 232 km (Fujisada, 1995).
ASTER SWIR data have sufficient spectral resolution to illustrate different spectral signatures for advanced argillic (alunite-kaolinite), sericitic (muscovite), propylitic (epidote-chlorite-calcite), and supergene mineral assemblages (fig. F9). ASTER SWIR band ratios, such as (5+7)/6 and (7+9)/8, have been used to map Al-O-H absorption in sericitic rocks and CO3 absorption in propylitized rocks, respectively (Rowan and Mars, 2003). Logical operator algorithms have used ASTER band ratios 4/6, 5/6, and 7/6 to map sericitic- and argillic-altered rocks (Mars and Rowan, 2006). Sericitic and advanced argillic alteration and the supergene minerals
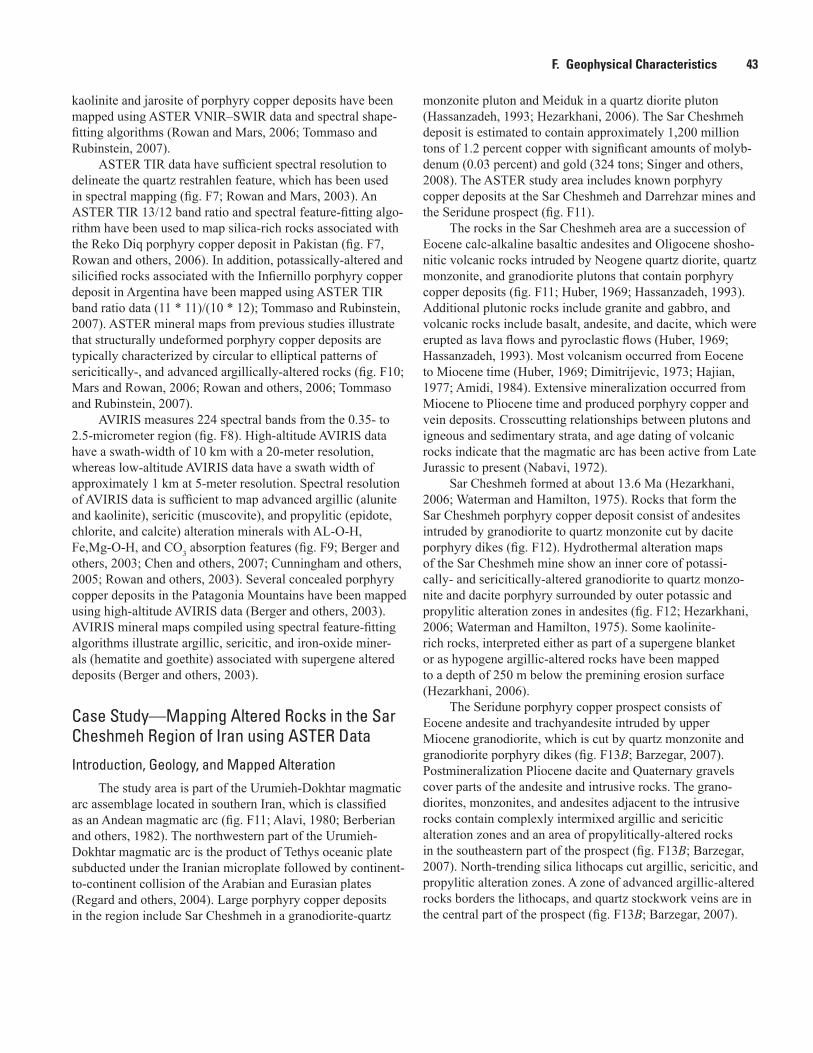
F. Geophysical Characteristics 43
kaolinite and jarosite of porphyry copper deposits have been mapped using ASTER VNIR–SWIR data and spectral shape-fitting algorithms (Rowan and Mars, 2006; Tommaso and Rubinstein, 2007).
ASTER TIR data have sufficient spectral resolution to delineate the quartz restrahlen feature, which has been used in spectral mapping (fig. F7; Rowan and Mars, 2003). An ASTER TIR 13/12 band ratio and spectral feature-fitting algo-rithm have been used to map silica-rich rocks associated with the Reko Diq porphyry copper deposit in Pakistan (fig. F7, Rowan and others, 2006). In addition, potassically-altered and silicified rocks associated with the Infiernillo porphyry copper deposit in Argentina have been mapped using ASTER TIR band ratio data (11 * 11)/(10 * 12); Tommaso and Rubinstein, 2007). ASTER mineral maps from previous studies illustrate that structurally undeformed porphyry copper deposits are typically characterized by circular to elliptical patterns of sericitically-, and advanced argillically-altered rocks (fig. F10; Mars and Rowan, 2006; Rowan and others, 2006; Tommaso and Rubinstein, 2007).
AVIRIS measures 224 spectral bands from the 0.35- to 2.5-micrometer region (fig. F8). High-altitude AVIRIS data have a swath-width of 10 km with a 20-meter resolution, whereas low-altitude AVIRIS data have a swath width of approximately 1 km at 5-meter resolution. Spectral resolution of AVIRIS data is sufficient to map advanced argillic (alunite and kaolinite), sericitic (muscovite), and propylitic (epidote, chlorite, and calcite) alteration minerals with AL-O-H, Fe,Mg-O-H, and CO3 absorption features (fig. F9; Berger and others, 2003; Chen and others, 2007; Cunningham and others, 2005; Rowan and others, 2003). Several concealed porphyry copper deposits in the Patagonia Mountains have been mapped using high-altitude AVIRIS data (Berger and others, 2003). AVIRIS mineral maps compiled using spectral feature-fitting algorithms illustrate argillic, sericitic, and iron-oxide miner-als (hematite and goethite) associated with supergene altered deposits (Berger and others, 2003).
Case Study—Mapping Altered Rocks in the Sar Cheshmeh Region of Iran using ASTER Data
Introduction, Geology, and Mapped AlterationThe study area is part of the Urumieh-Dokhtar magmatic
arc assemblage located in southern Iran, which is classified as an Andean magmatic arc (fig. F11; Alavi, 1980; Berberian and others, 1982). The northwestern part of the Urumieh-Dokhtar magmatic arc is the product of Tethys oceanic plate subducted under the Iranian microplate followed by continent-to-continent collision of the Arabian and Eurasian plates (Regard and others, 2004). Large porphyry copper deposits in the region include Sar Cheshmeh in a granodiorite-quartz
monzonite pluton and Meiduk in a quartz diorite pluton (Hassanzadeh, 1993; Hezarkhani, 2006). The Sar Cheshmeh deposit is estimated to contain approximately 1,200 million tons of 1.2 percent copper with significant amounts of molyb-denum (0.03 percent) and gold (324 tons; Singer and others, 2008). The ASTER study area includes known porphyry copper deposits at the Sar Cheshmeh and Darrehzar mines and the Seridune prospect (fig. F11).
The rocks in the Sar Cheshmeh area are a succession of Eocene calc-alkaline basaltic andesites and Oligocene shosho-nitic volcanic rocks intruded by Neogene quartz diorite, quartz monzonite, and granodiorite plutons that contain porphyry copper deposits (fig. F11; Huber, 1969; Hassanzadeh, 1993). Additional plutonic rocks include granite and gabbro, and volcanic rocks include basalt, andesite, and dacite, which were erupted as lava flows and pyroclastic flows (Huber, 1969; Hassanzadeh, 1993). Most volcanism occurred from Eocene to Miocene time (Huber, 1969; Dimitrijevic, 1973; Hajian, 1977; Amidi, 1984). Extensive mineralization occurred from Miocene to Pliocene time and produced porphyry copper and vein deposits. Crosscutting relationships between plutons and igneous and sedimentary strata, and age dating of volcanic rocks indicate that the magmatic arc has been active from Late Jurassic to present (Nabavi, 1972).
Sar Cheshmeh formed at about 13.6 Ma (Hezarkhani, 2006; Waterman and Hamilton, 1975). Rocks that form the Sar Cheshmeh porphyry copper deposit consist of andesites intruded by granodiorite to quartz monzonite cut by dacite porphyry dikes (fig. F12). Hydrothermal alteration maps of the Sar Cheshmeh mine show an inner core of potassi-cally- and sericitically-altered granodiorite to quartz monzo-nite and dacite porphyry surrounded by outer potassic and propylitic alteration zones in andesites (fig. F12; Hezarkhani, 2006; Waterman and Hamilton, 1975). Some kaolinite-rich rocks, interpreted either as part of a supergene blanket or as hypogene argillic-altered rocks have been mapped to a depth of 250 m below the premining erosion surface (Hezarkhani, 2006).
The Seridune porphyry copper prospect consists of Eocene andesite and trachyandesite intruded by upper Miocene granodiorite, which is cut by quartz monzonite and granodiorite porphyry dikes (fig. F13B; Barzegar, 2007). Postmineralization Pliocene dacite and Quaternary gravels cover parts of the andesite and intrusive rocks. The grano-diorites, monzonites, and andesites adjacent to the intrusive rocks contain complexly intermixed argillic and sericitic alteration zones and an area of propylitically-altered rocks in the southeastern part of the prospect (fig. F13B; Barzegar, 2007). North-trending silica lithocaps cut argillic, sericitic, and propylitic alteration zones. A zone of advanced argillic-altered rocks borders the lithocaps, and quartz stockwork veins are in the central part of the prospect (fig. F13B; Barzegar, 2007).
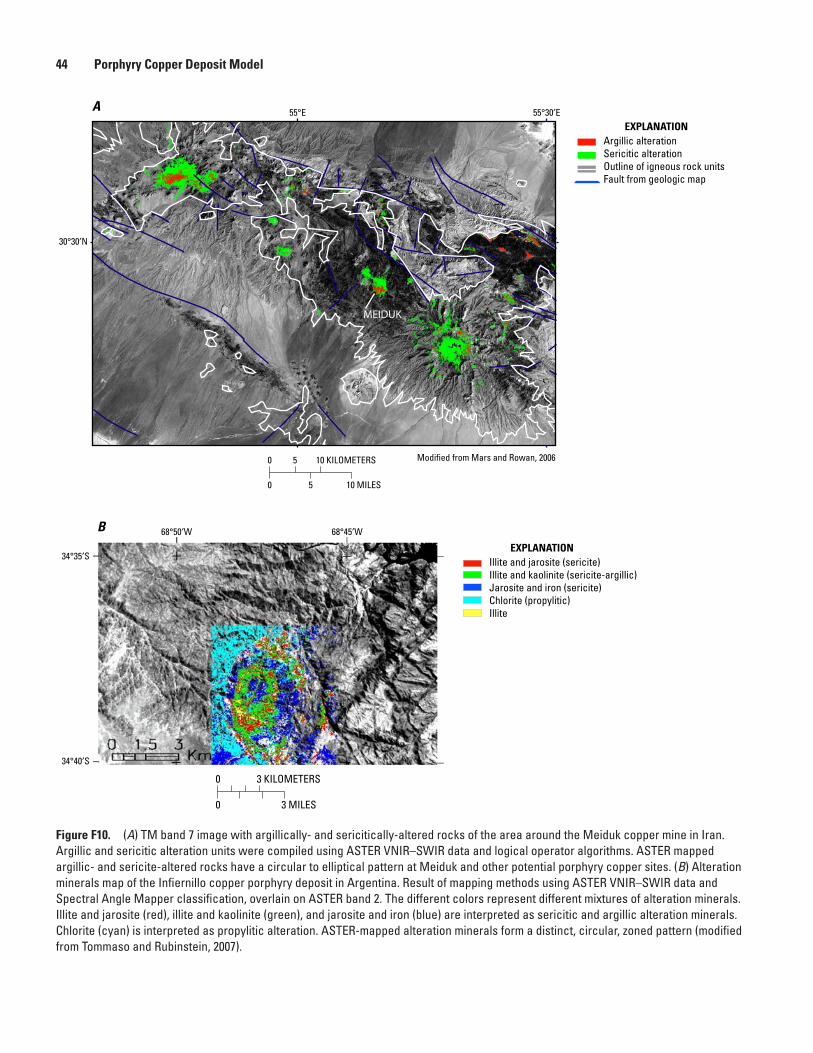
Figure F10. (A) TM band 7 image with argillically- and sericitically-altered rocks of the area around the Meiduk copper mine in Iran. Argillic and sericitic alteration units were compiled using ASTER VNIR–SWIR data and logical operator algorithms. ASTER mapped argillic- and sericite-altered rocks have a circular to elliptical pattern at Meiduk and other potential porphyry copper sites. (B) Alteration minerals map of the Infiernillo copper porphyry deposit in Argentina. Result of mapping methods using ASTER VNIR–SWIR data and Spectral Angle Mapper classification, overlain on ASTER band 2. The different colors represent different mixtures of alteration minerals. Illite and jarosite (red), illite and kaolinite (green), and jarosite and iron (blue) are interpreted as sericitic and argillic alteration minerals. Chlorite (cyan) is interpreted as propylitic alteration. ASTER-mapped alteration minerals form a distinct, circular, zoned pattern (modified from Tommaso and Rubinstein, 2007).
B
Argillic alterationSericitic alterationOutline of igneous rock unitsFault from geologic map
AEXPLANATION
Modified from Mars and Rowan, 2006
55°E 55°30′E
30°30′N
Illite and jarosite (sericite)Illite and kaolinite (sericite-argillic)Jarosite and iron (sericite)Chlorite (propylitic)Illite
EXPLANATION
68°50′W 68°45′W
34°35′S
34°40′S
0 5 10 KILOMETERS
0 5 10 MILES
0 3 KILOMETERS
0 3 MILES
44 Porphyry Copper Deposit Model
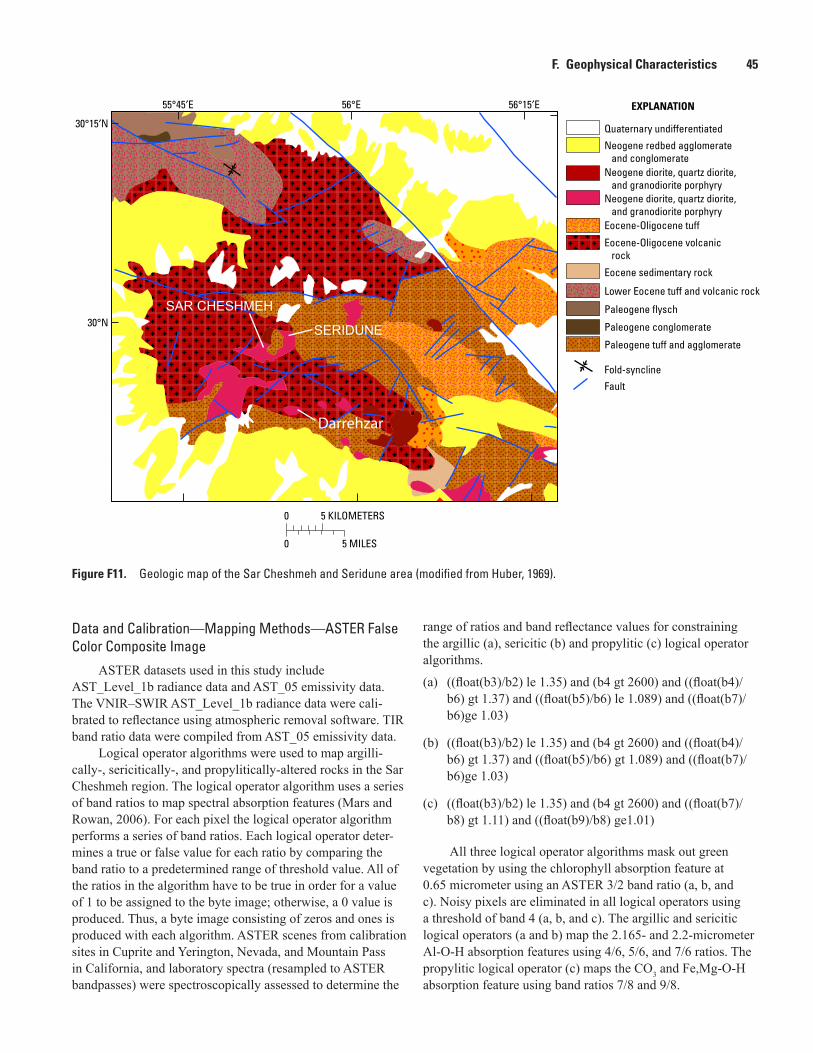
Figure F11. Geologic map of the Sar Cheshmeh and Seridune area (modified from Huber, 1969).
Quaternary undifferentiated
EXPLANATION
Neogene redbed agglomerate and conglomerateNeogene diorite, quartz diorite, and granodiorite porphyryNeogene diorite, quartz diorite, and granodiorite porphyryEocene-Oligocene tuff
Eocene-Oligocene volcanic rock
Fault
Eocene sedimentary rock
Lower Eocene tuff and volcanic rock
Paleogene flysch
Paleogene conglomerate
Paleogene tuff and agglomerate
Fold-syncline
55°45′E 56°E 56°15′E
30°15′N
0 5 KILOMETERS
0 5 MILES
30°N
F. Geophysical Characteristics 45
Data and Calibration—Mapping Methods—ASTER False Color Composite Image
ASTER datasets used in this study include AST_Level_1b radiance data and AST_05 emissivity data. The VNIR–SWIR AST_Level_1b radiance data were cali-brated to reflectance using atmospheric removal software. TIR band ratio data were compiled from AST_05 emissivity data.
Logical operator algorithms were used to map argilli-cally-, sericitically-, and propylitically-altered rocks in the Sar Cheshmeh region. The logical operator algorithm uses a series of band ratios to map spectral absorption features (Mars and Rowan, 2006). For each pixel the logical operator algorithm performs a series of band ratios. Each logical operator deter-mines a true or false value for each ratio by comparing the band ratio to a predetermined range of threshold value. All of the ratios in the algorithm have to be true in order for a value of 1 to be assigned to the byte image; otherwise, a 0 value is produced. Thus, a byte image consisting of zeros and ones is produced with each algorithm. ASTER scenes from calibration sites in Cuprite and Yerington, Nevada, and Mountain Pass in California, and laboratory spectra (resampled to ASTER bandpasses) were spectroscopically assessed to determine the
range of ratios and band reflectance values for constraining the argillic (a), sericitic (b) and propylitic (c) logical operator algorithms.
(a) ((float(b3)/b2) le 1.35) and (b4 gt 2600) and ((float(b4)/b6) gt 1.37) and ((float(b5)/b6) le 1.089) and ((float(b7)/b6)ge 1.03)
(b) ((float(b3)/b2) le 1.35) and (b4 gt 2600) and ((float(b4)/b6) gt 1.37) and ((float(b5)/b6) gt 1.089) and ((float(b7)/b6)ge 1.03)
(c) ((float(b3)/b2) le 1.35) and (b4 gt 2600) and ((float(b7)/b8) gt 1.11) and ((float(b9)/b8) ge1.01)
All three logical operator algorithms mask out green vegetation by using the chlorophyll absorption feature at 0.65 micrometer using an ASTER 3/2 band ratio (a, b, and c). Noisy pixels are eliminated in all logical operators using a threshold of band 4 (a, b, and c). The argillic and sericitic logical operators (a and b) map the 2.165- and 2.2-micrometer Al-O-H absorption features using 4/6, 5/6, and 7/6 ratios. The propylitic logical operator (c) maps the CO3 and Fe,Mg-O-H absorption feature using band ratios 7/8 and 9/8.
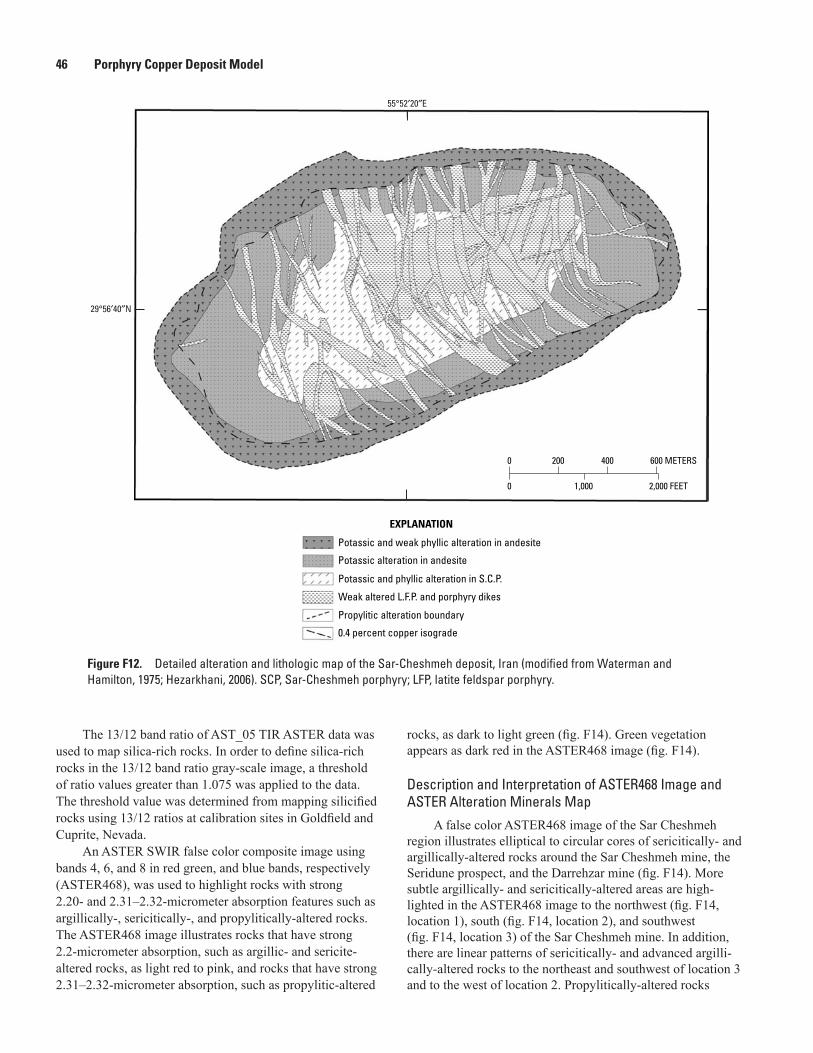
Potassic and weak phyllic alteration in andesite
Potassic alteration in andesite
Potassic and phyllic alteration in S.C.P.
Weak altered L.F.P. and porphyry dikes
Propylitic alteration boundary
0.4 percent copper isograde
EXPLANATION
29°56′40″N
55°52′20″E
0 400200 600 METERS
0 1,000 2,000 FEET
Figure F12. Detailed alteration and lithologic map of the Sar-Cheshmeh deposit, Iran (modified from Waterman and Hamilton, 1975; Hezarkhani, 2006). SCP, Sar-Cheshmeh porphyry; LFP, latite feldspar porphyry.
46 Porphyry Copper Deposit Model
The 13/12 band ratio of AST_05 TIR ASTER data was used to map silica-rich rocks. In order to define silica-rich rocks in the 13/12 band ratio gray-scale image, a threshold of ratio values greater than 1.075 was applied to the data. The threshold value was determined from mapping silicified rocks using 13/12 ratios at calibration sites in Goldfield and Cuprite, Nevada.
An ASTER SWIR false color composite image using bands 4, 6, and 8 in red green, and blue bands, respectively (ASTER468), was used to highlight rocks with strong 2.20- and 2.31–2.32-micrometer absorption features such as argillically-, sericitically-, and propylitically-altered rocks. The ASTER468 image illustrates rocks that have strong 2.2-micrometer absorption, such as argillic- and sericite-altered rocks, as light red to pink, and rocks that have strong 2.31–2.32-micrometer absorption, such as propylitic-altered
rocks, as dark to light green (fig. F14). Green vegetation appears as dark red in the ASTER468 image (fig. F14).
Description and Interpretation of ASTER468 Image and ASTER Alteration Minerals Map
A false color ASTER468 image of the Sar Cheshmeh region illustrates elliptical to circular cores of sericitically- and argillically-altered rocks around the Sar Cheshmeh mine, the Seridune prospect, and the Darrehzar mine (fig. F14). More subtle argillically- and sericitically-altered areas are high-lighted in the ASTER468 image to the northwest (fig. F14, location 1), south (fig. F14, location 2), and southwest (fig. F14, location 3) of the Sar Cheshmeh mine. In addition, there are linear patterns of sericitically- and advanced argilli-cally-altered rocks to the northeast and southwest of location 3 and to the west of location 2. Propylitically-altered rocks
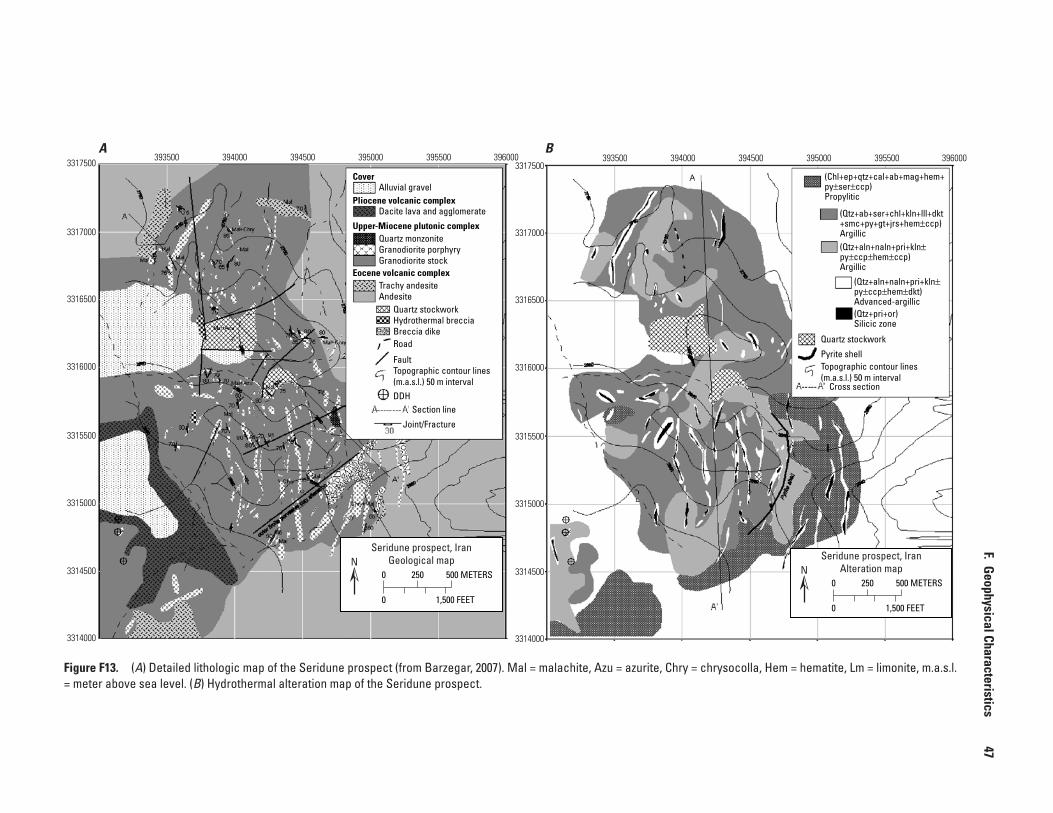
Figure F13. (A) Detailed lithologic map of the Seridune prospect (from Barzegar, 2007). Mal = malachite, Azu = azurite, Chry = chrysocolla, Hem = hematite, Lm = limonite, m.a.s.l. = meter above sea level. (B) Hydrothermal alteration map of the Seridune prospect.
A B
Seridune prospect, IranGeological mapN
0 250 500 METERS
0 1,500 FEET
Seridune prospect, IranAlteration mapN
0 250 500 METERS
0 1,500 FEET
3317500
3317000
3316500
3316000
3315500
3314500
3314000
3315000
3960003955003950003945003940003935003317500
3317000
3316500
3316000
3315500
3314500
3314000
3315000
396000395500395000394500394000393500
CoverAlluvial gravel
Pliocene volcanic complexDacite lava and agglomerate
Upper-Miocene plutonic complexQuartz monzonite
Eocene volcanic complexTrachy andesiteAndesite
Granodiorite porphyryGranodiorite stock
Quartz stockworkHydrothermal brecciaBreccia dikeRoad
Fault
DDHSection line
Joint/Fracture
Topographic contour lines(m.a.s.l.) 50 m interval
(Chl+ep+qtz+cal+ab+mag+hem+py±ser±ccp)Propylitic
(Qtz+ab+ser+chl+kln+lll+dkt+smc+py+gt+jrs+hem±ccp)Argillic(Qtz+aln+naln+pri+kln±py±ccp±hem±ccp)Argillic
(Qtz+aln+naln+pri+kln±py±ccp±hem±dkt)Advanced-argillic(Qtz+pri+or)Silicic zone
Quartz stockwork
Pyrite shell
Cross section
Topographic contour lines(m.a.s.l.) 50 m interval
F. Geophysical Characteristics
47
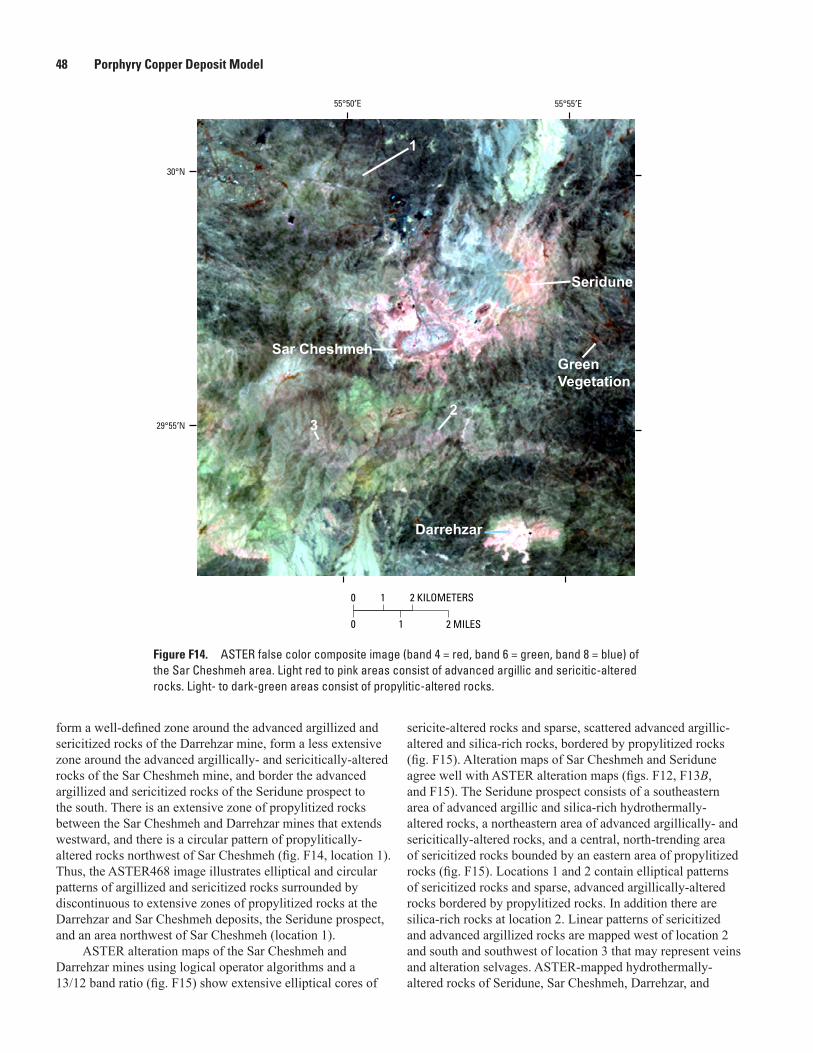
0 1
0 1 2 MILES
2 KILOMETERS
29°55′N
30°N
55°55′E55°50′E
Figure F14. ASTER false color composite image (band 4 = red, band 6 = green, band 8 = blue) of the Sar Cheshmeh area. Light red to pink areas consist of advanced argillic and sericitic-altered rocks. Light- to dark-green areas consist of propylitic-altered rocks.
48 Porphyry Copper Deposit Model
form a well-defined zone around the advanced argillized and sericitized rocks of the Darrehzar mine, form a less extensive zone around the advanced argillically- and sericitically-altered rocks of the Sar Cheshmeh mine, and border the advanced argillized and sericitized rocks of the Seridune prospect to the south. There is an extensive zone of propylitized rocks between the Sar Cheshmeh and Darrehzar mines that extends westward, and there is a circular pattern of propylitically-altered rocks northwest of Sar Cheshmeh (fig. F14, location 1). Thus, the ASTER468 image illustrates elliptical and circular patterns of argillized and sericitized rocks surrounded by discontinuous to extensive zones of propylitized rocks at the Darrehzar and Sar Cheshmeh deposits, the Seridune prospect, and an area northwest of Sar Cheshmeh (location 1).
ASTER alteration maps of the Sar Cheshmeh and Darrehzar mines using logical operator algorithms and a 13/12 band ratio (fig. F15) show extensive elliptical cores of
sericite-altered rocks and sparse, scattered advanced argillic-altered and silica-rich rocks, bordered by propylitized rocks (fig. F15). Alteration maps of Sar Cheshmeh and Seridune agree well with ASTER alteration maps (figs. F12, F13B, and F15). The Seridune prospect consists of a southeastern area of advanced argillic and silica-rich hydrothermally-altered rocks, a northeastern area of advanced argillically- and sericitically-altered rocks, and a central, north-trending area of sericitized rocks bounded by an eastern area of propylitized rocks (fig. F15). Locations 1 and 2 contain elliptical patterns of sericitized rocks and sparse, advanced argillically-altered rocks bordered by propylitized rocks. In addition there are silica-rich rocks at location 2. Linear patterns of sericitized and advanced argillized rocks are mapped west of location 2 and south and southwest of location 3 that may represent veins and alteration selvages. ASTER-mapped hydrothermally-altered rocks of Seridune, Sar Cheshmeh, Darrehzar, and
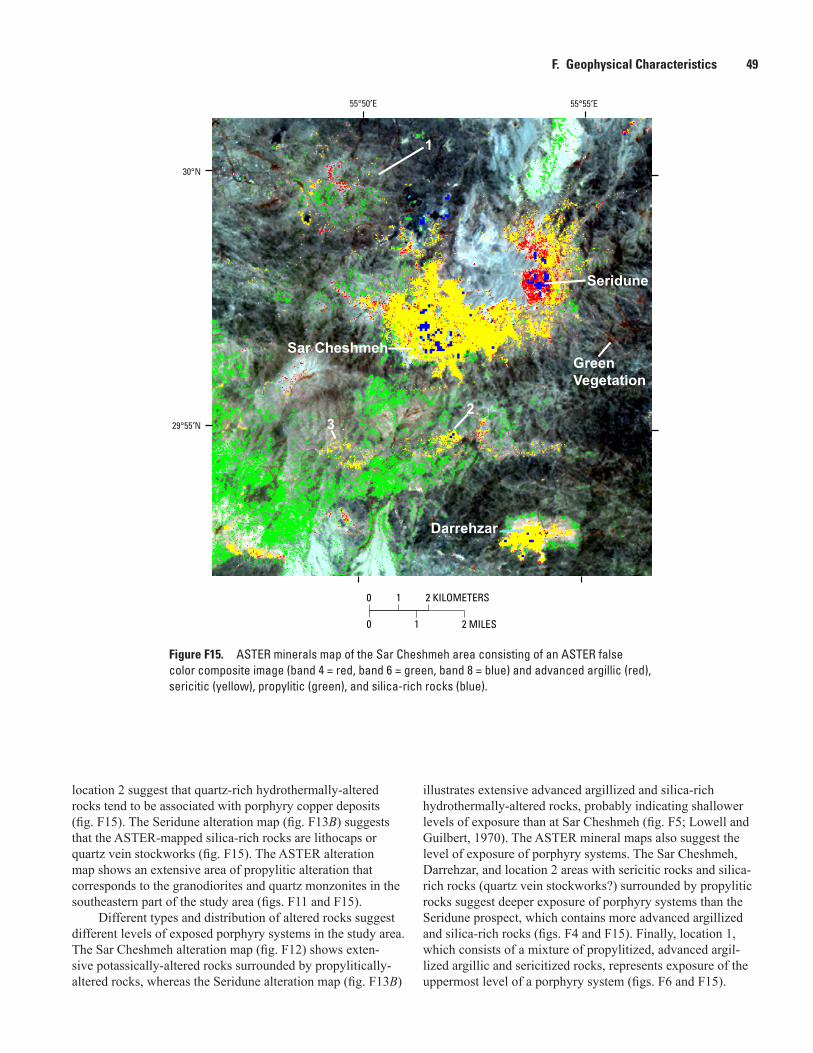
0 1
0 1 2 MILES
2 KILOMETERS
29°55′N
30°N
55°55′E55°50′E
Figure F15. ASTER minerals map of the Sar Cheshmeh area consisting of an ASTER false color composite image (band 4 = red, band 6 = green, band 8 = blue) and advanced argillic (red), sericitic (yellow), propylitic (green), and silica-rich rocks (blue).
F. Geophysical Characteristics 49
location 2 suggest that quartz-rich hydrothermally-altered rocks tend to be associated with porphyry copper deposits (fig. F15). The Seridune alteration map (fig. F13B) suggests that the ASTER-mapped silica-rich rocks are lithocaps or quartz vein stockworks (fig. F15). The ASTER alteration map shows an extensive area of propylitic alteration that corresponds to the granodiorites and quartz monzonites in the southeastern part of the study area (figs. F11 and F15).
Different types and distribution of altered rocks suggest different levels of exposed porphyry systems in the study area. The Sar Cheshmeh alteration map (fig. F12) shows exten-sive potassically-altered rocks surrounded by propylitically-altered rocks, whereas the Seridune alteration map (fig. F13B)
illustrates extensive advanced argillized and silica-rich hydrothermally-altered rocks, probably indicating shallower levels of exposure than at Sar Cheshmeh (fig. F5; Lowell and Guilbert, 1970). The ASTER mineral maps also suggest the level of exposure of porphyry systems. The Sar Cheshmeh, Darrehzar, and location 2 areas with sericitic rocks and silica-rich rocks (quartz vein stockworks?) surrounded by propylitic rocks suggest deeper exposure of porphyry systems than the Seridune prospect, which contains more advanced argillized and silica-rich rocks (figs. F4 and F15). Finally, location 1, which consists of a mixture of propylitized, advanced argil-lized argillic and sericitized rocks, represents exposure of the uppermost level of a porphyry system (figs. F6 and F15).
50 Porphyry Copper Deposit Model
Conclusions
Hydrothermally-altered rocks associated with porphyry copper deposits have been successfully mapped using ASTER data. ASTER VNIR–SWIR AST_Level_1B radiance data were converted to reflectance and used with logical operators to map advanced argillically-, sericitically-, and propylitically-altered rocks. In addition, an ASTER TIR band ratio 13/12 from AST_05 emissivity data was used to map silica-rich rocks.
The spatial distribution of identified and spectrally mapped hydrothermally-altered rocks using ASTER data in the Sar Cheshmeh area shows excellent correlation to the distribution and types of altered zones in the general-ized Lowell and Guilbert (1970) porphyry copper model. The ASTER468 image and ASTER alteration map illustrate circular to elliptical areas of sericite- and argillic-altered rocks bordered by propylitized rocks which correspond to known porphyry copper deposits such as Sar Cheshmeh, Darrehzar, and Seridune and potential porphyry deposits such as at loca-tions 2 and 3 (fig. F15). At location 1, the ASTER468 image showed a circular area of propylitically-altered rocks and less extensive argillically- and sericitically-altered rocks, suggest-ing a concealed porphyry deposit at depth.
The ASTER mineral maps also illustrate circular to elliptical areas of argillic- and sericite-altered rocks that in some cases contain silica-rich rocks. Propylitically-altered zones border the circular to elliptical areas of argillically- and sericitically-altered rocks. Extensive sericitically-altered rocks bordered by propylitized rocks illustrated at Sar Cheshmeh, Darrehzar, and location 2 suggest a deeper level of expo-sure than the abundant advanced argillized and sericitized rocks spectrally mapped at Seridune. The circular pattern of abundant propylitized rocks with less extensive amounts of sericitically- and advanced argillically-altered rocks suggest a shallower level of exposure of a hydrothermal cell than mapped at Seridune. Thus, this study illustrates the usefulness of identifying potential concealed and partially exposed porphyry copper deposits and determining the level of exposure by spectrally mapping the outer hydrothermal alteration zones.
G. Hypogene Ore Characteristics
(Peter G. Vikre)
Ore in porphyry copper deposits (PCDs) is rock in which the concentration, value, location, and recoverability of copper±molybdenum±gold enable mining under predeter-mined economic requirements. Hypogene ore contains copper and molybdenum minerals and numerous other hydrothermal minerals deposited by high-temperature fluids derived from or heated by magmas. The terms hypogene ore and super-gene ore (see section J, “Supergene Ore Characteristics”),
a combination of genetic and economic descriptors, were applied during initial bulk mining of PCDs when it was recog-nized that weathering of hypogene minerals created supergene minerals and enriched copper concentrations near the surface. Historically, supergene enrichment of hypogene copper sulfide minerals into supergene sulfide ore made bulk mining of PCDs economically viable.
Grade
The 2002 median copper and molybdenum grades of 217 PCDs were 0.49 percent and 0.018 percent, respec-tively (Singer and others, 2002). The 2008 median grade of 422 PCDs was 0.44 percent copper (Singer and others, 2008). In compilations of copper, molybdenum, silver, and gold grades of PCDs, hypogene and supergene ore grades are not routinely separated; however, supergene copper sulfide grades in most if not all deposits are higher than hypogene copper sulfide grades because of enrichment (see section J, “Supergene Ore Characteristics”). The decline from 2002 to 2008 in median copper grades is most likely a reflection of several factors, including smaller mined tonnages of supergene sulfide-enriched ore, mining of lower grade ores of both types, increased mining of lower grade copper oxide ores (section J, “Supergene Ore Characteristics”) from which copper is relatively cheaply recovered by leaching, and increases in the price of copper that converted low-grade copper-mineralized rock into ore.
Hypogene copper grades vary considerably from several tenths of a percent to greater than 1 percent. Hypogene molyb-denum grades also vary considerably from less than 0.001 to 0.1 percent (Singer and others, 2008). The 2008 median molybdenum grade of 0.013 percent can be considered the median hypogene molybdenum grade because molybdenum is not chemically enriched by weathering, although it may be residually enriched in some deposits.
The 2008 median grade of by-product silver in PCDs in which silver was recovered (about one-third of deposits) was 2.0 g/t; silver grades range from 0 to about 21 g/t (Singer and others, 2008). The 2008 median grade of by-product gold (recovered from about two-thirds of deposits) was 0.21 g/t; gold grades range from 0 to 1.3 g/t (Singer and others, 2008). By-product rhenium is also recovered from some PCDs, but production data are not routinely available. There are no published grade data that distinguish hypogene and supergene grades of silver and gold.
Mineralogy
The main hypogene copper ore minerals are chalcopy-rite and bornite, one or both of which occur in all deposits (table G1). The only molybdenum mineral of significance is molybdenite; it occurs in nearly three-fourths of PCDs (table G1). Lesser amounts of hypogene copper are recovered from digenite, covellite, enargite, and tetrahedrite/tennantite.
G. Hypogene Ore Characteristics 51
Covellite, enargite and digenite are present mostly in pyrite-rich parts of advanced argillic alteration assemblages that formed or were preserved in relatively few deposits (see section I, “Hydrothermal Alteration”). Tetrahedrite and tennantite are associated with both sericitic alteration and advanced argillic alteration. Silver and gold are thought to occur in chalcopyrite and bornite; rhenium is contained in molybdenite. Hypogene ore minerals are technically hypo-gene minerals recovered for their copper±molybdenum±gold contents, but the term hypogene ore mineral, or ore mineral, is broadly applied to copper and molybdenum minerals through-out a deposit regardless of mining feasibility.
Mineral Assemblages
Hypogene copper and molybdenum minerals occur with other hydrothermal minerals in groups called assemblages, if equilibrium among minerals composing the group is known or assumed, or associations, where equilibrium is unknown or unspecified. Hypogene mineral assemblages and associa-tions occur as veins and breccia matrices; they also replace primary minerals (feldspars, biotite, amphibole, pyroxene) and rock fragments in host rocks. Bornite, chalcopyrite, and molybdenite commonly occur with hydrothermal quartz, pyrite, potassium feldspar, biotite, magnetite, and potassium-mica (potassic and sericitic alteration, table G2) in a large variety of assemblages that reflect temperature, pH, sulfidation state, and oxidation state of the depositing fluid (Seedorff and others, 2005). These assemblages constitute hypogene ore in most PCDs. Hypogene ore and low-grade zones in potassic, sericitic, and advanced argillic alteration zones in most PCDs are surrounded by propylitic alteration assemblages (quartz, plagioclase, potassium feldspar, calcite, epidote, and chlo-rite; table G2). Sodic and sodic-calcic alteration assemblages (primarily albite and(or) sodic-plagioclase, actinolite, chlorite, epidote; table G2) are present at depth in some PCDs, gener-ally below and lateral to potassic alteration assemblages.
Paragenesis and Zoning
Temporal (paragenetic) and spatial (zoning) relation-ships of hypogene hydrothermal mineral assemblages includ-ing copper and molybdenum minerals (table G2) are broadly similar in PCDs. In general, potassic alteration forms initially at depth, followed by sericitic alteration which may either surround or cut through and postdate the central zone of potas-sic alteration (fig. I1). Argillic alteration commonly forms near the surface in many deposits but extends to the deepest levels of others; it is usually superimposed on sericitic and potassic alteration. In detail, however, local to depositwide perturba-tions in assemblage paragenesis and zoning are not uncom-mon. Assemblages may reflect reversals in fluid temperature and composition (pH and activities of K+ and Na+), gradients that define the overall configuration of potassic, sericitic, propylitic, and other alteration zones. For example, potassic
alteration assemblages (including hypogene copper and molybdenum minerals) may form several times during the evolution of PCDs that are composed of multiple intrusions (Proffett, 2009). Vein assemblages and intersections, with or without wall-rock offset, most clearly manifest paragenetic relationships among hypogene mineral assemblages. Altera-tion mineral assemblages and paragenetic and zoning relation-ships among assemblages are described more thoroughly in section I, “Hydrothermal Alteration.”
Forms and Textures
Hypogene copper and molybdenum sulfide minerals typically comprise 1–2 volume percent of hypogene ore. They occur in three textural forms that are variably present in all PCDs: (1) copper and molybdenum minerals, mainly chalcopyrite, bornite, and molybdenite, disseminated in host rocks; (2) copper and molybdenum minerals in veinlets; and (3) copper and molybdenum minerals in breccia matrices. Most hypogene copper minerals are disseminated in host rocks as discrete 1-mm or smaller anhedral to subhedral crystals, or occur in millimeter-to-centimeter clotlike aggregates with other hypogene minerals (quartz, pyrite, potassium feldspar, potassium-mica, anhydrite, and biotite). Disseminated copper minerals and aggregates commonly are concentrated in origi-nal igneous iron-magnesium silicate and oxide mineral sites that have been replaced by intergrown hydrothermal silicate and sulfide minerals, but they also occur on grain boundar-ies between or microfractures in silicate minerals in igneous host rocks.
Veins containing copper and molybdenum minerals are generally less than 1 mm to several centimeters wide; vein minerals vary from micrometers to several millimeters in dimension. Vein aspect varies from sharply planar veins that are contiguous for meters to curvilinear and have diffuse margins and discontinuous veins that pinch out within centi-meters (see “Relations to Structures” in section D, “Regional Environment”). Planar veins fill fractures formed by brittle deformation of host rocks, whereas diffusely margined, curvi-linear veins form during ductile deformation or have been modified by subsequent alteration. Distinct to subtle selvages of alteration minerals, millimeters to centimeters in width, that envelop most veins reflect disequilibrium between vein fluid and wall-rock minerals. Minerals in planar to subplanar veins may be internally zoned with sulfide minerals concentrated along vein margins and coalescing quartz±sulfide euhedrons filling vein centers; such zoning is caused by open-space deposition. Some veins consist of both chemical and clastic components with sub-millimeter mineral clasts aligned along or parallel to vein margins cemented by quartz and sulfide minerals. These veins are indicative of relatively high velocity fluid flow and clast sorting.
Breccias that contain copper and molybdenum miner-als are volumetrically the smallest ore component in most PCDs, and the contribution to ore grade by breccias (and
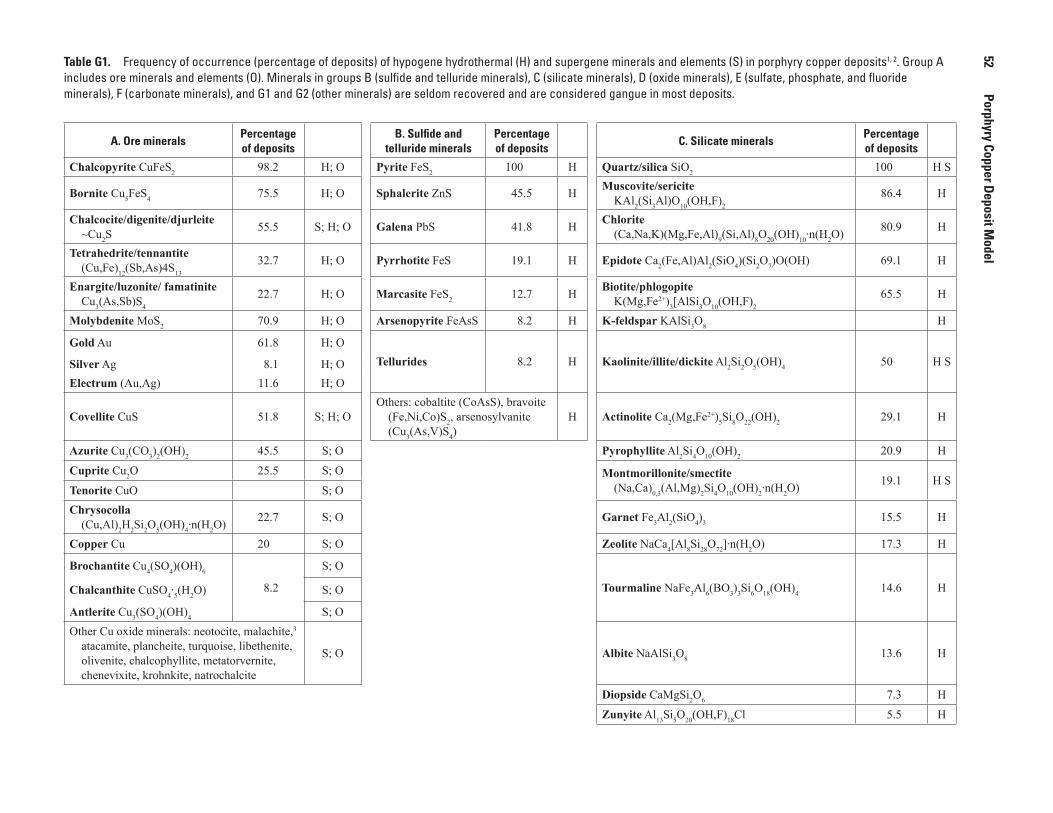
A. Ore mineralsPercentage of deposits
B. Sulfide and telluride minerals
Percentage of deposits
C. Silicate mineralsPercentage of deposits
Chalcopyrite CuFeS2 98.2 H; O Pyrite FeS2 100 H Quartz/silica SiO2 100 H S
Bornite Cu5FeS4 75.5 H; O Sphalerite ZnS 45.5 H Muscovite/sericite KAl2(Si3Al)O10(OH,F)2
86.4 H
Chalcocite/digenite/djurleite ~Cu2S
55.5 S; H; O Galena PbS 41.8 H Chlorite (Ca,Na,K)(Mg,Fe,Al)9(Si,Al)8O20(OH)10·n(H2O) 80.9 H
Tetrahedrite/tennantite (Cu,Fe)12(Sb,As)4S13
32.7 H; O Pyrrhotite FeS 19.1 H Epidote Ca2(Fe,Al)Al2(SiO4)(Si2O7)O(OH) 69.1 H
Enargite/luzonite/ famatinite Cu3(As,Sb)S4
22.7 H; O Marcasite FeS2 12.7 H Biotite/phlogopite K(Mg,Fe2+)3[AlSi3O10(OH,F)2
65.5 H
Molybdenite MoS2 70.9 H; O Arsenopyrite FeAsS 8.2 H K-feldspar KAlSi3O8 H
Gold Au 61.8 H; OTellurides 8.2 H Kaolinite/illite/dickite Al2Si2O5(OH)4 50 H SSilver Ag 8.1 H; O
Electrum (Au,Ag) 11.6 H; O
Covellite CuS 51.8 S; H; O Others: cobaltite (CoAsS), bravoite
(Fe,Ni,Co)S2, arsenosylvanite (Cu3(As,V)S4)
H Actinolite Ca2(Mg,Fe2+)5Si8O22(OH)2 29.1 H
Azurite Cu3(CO3)2(OH)2 45.5 S; O Pyrophyllite Al2Si4O10(OH)2 20.9 H
Cuprite Cu2O 25.5 S; O Montmorillonite/smectite (Na,Ca)0,3(Al,Mg)2Si4O10(OH)2·n(H2O) 19.1 H S
Tenorite CuO S; OChrysocolla
(Cu,Al)2H2Si2O5(OH)4·n(H2O) 22.7 S; O Garnet Fe3Al2(SiO4)3 15.5 H
Copper Cu 20 S; O Zeolite NaCa4[Al8Si28O72]·n(H2O) 17.3 H
Brochantite Cu4(SO4)(OH)6
8.2
S; O
Tourmaline NaFe3Al6(BO3)3Si6O18(OH)4 14.6 HChalcanthite CuSO4·5(H2O) S; O
Antlerite Cu3(SO4)(OH)4 S; OOther Cu oxide minerals: neotocite, malachite,3
atacamite, plancheite, turquoise, libethenite, olivenite, chalcophyllite, metatorvernite, chenevixite, krohnkite, natrochalcite
S; O Albite NaAlSi3O8 13.6 H
Diopside CaMgSi2O6 7.3 H
Zunyite Al13Si5O20(OH,F)18Cl 5.5 H
Table G1. Frequency of occurrence (percentage of deposits) of hypogene hydrothermal (H) and supergene minerals and elements (S) in porphyry copper deposits1, 2. Group A includes ore minerals and elements (O). Minerals in groups B (sulfide and telluride minerals), C (silicate minerals), D (oxide minerals), E (sulfate, phosphate, and fluoride minerals), F (carbonate minerals), and G1 and G2 (other minerals) are seldom recovered and are considered gangue in most deposits. —Continued
52
Porphyry Copper Deposit Model
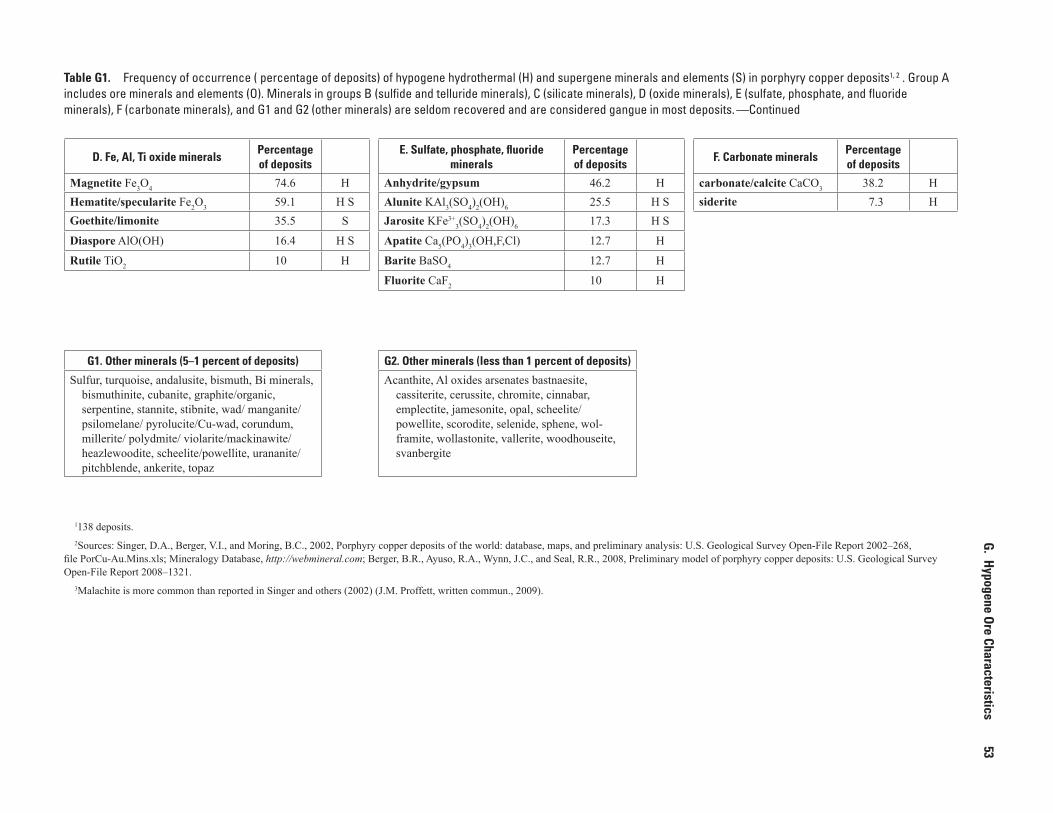
D. Fe, Al, Ti oxide mineralsPercentage of deposits
E. Sulfate, phosphate, fluoride minerals
Percentage of deposits
F. Carbonate mineralsPercentage of deposits
Magnetite Fe3O4 74.6 H Anhydrite/gypsum 46.2 H carbonate/calcite CaCO3 38.2 HHematite/specularite Fe2O3 59.1 H S Alunite KAl3(SO4)2(OH)6 25.5 H S siderite 7.3 HGoethite/limonite 35.5 S Jarosite KFe3+
3(SO4)2(OH)6 17.3 H S
Diaspore AlO(OH) 16.4 H S Apatite Ca5(PO4)3(OH,F,Cl) 12.7 H
Rutile TiO2 10 H Barite BaSO4 12.7 H
Fluorite CaF2 10 H
G1. Other minerals (5–1 percent of deposits) G2. Other minerals (less than 1 percent of deposits)
Sulfur, turquoise, andalusite, bismuth, Bi minerals, bismuthinite, cubanite, graphite/organic, serpentine, stannite, stibnite, wad/ manganite/psilomelane/ pyrolucite/Cu-wad, corundum, millerite/ polydmite/ violarite/mackinawite/ heazlewoodite, scheelite/powellite, urananite/pitchblende, ankerite, topaz
Acanthite, Al oxides arsenates bastnaesite, cassiterite, cerussite, chromite, cinnabar, emplectite, jamesonite, opal, scheelite/powellite, scorodite, selenide, sphene, wol-framite, wollastonite, vallerite, woodhouseite, svanbergite
1138 deposits.2Sources: Singer, D.A., Berger, V.I., and Moring, B.C., 2002, Porphyry copper deposits of the world: database, maps, and preliminary analysis: U.S. Geological Survey Open-File Report 2002–268,
file PorCu-Au.Mins.xls; Mineralogy Database, http://webmineral.com; Berger, B.R., Ayuso, R.A., Wynn, J.C., and Seal, R.R., 2008, Preliminary model of porphyry copper deposits: U.S. Geological Survey Open-File Report 2008–1321.
3Malachite is more common than reported in Singer and others (2002) (J.M. Proffett, written commun., 2009).
Table G1. Frequency of occurrence ( percentage of deposits) of hypogene hydrothermal (H) and supergene minerals and elements (S) in porphyry copper deposits1, 2 . Group A includes ore minerals and elements (O). Minerals in groups B (sulfide and telluride minerals), C (silicate minerals), D (oxide minerals), E (sulfate, phosphate, and fluoride minerals), F (carbonate minerals), and G1 and G2 (other minerals) are seldom recovered and are considered gangue in most deposits. —Continued
G. Hypogene Ore Characteristics
53
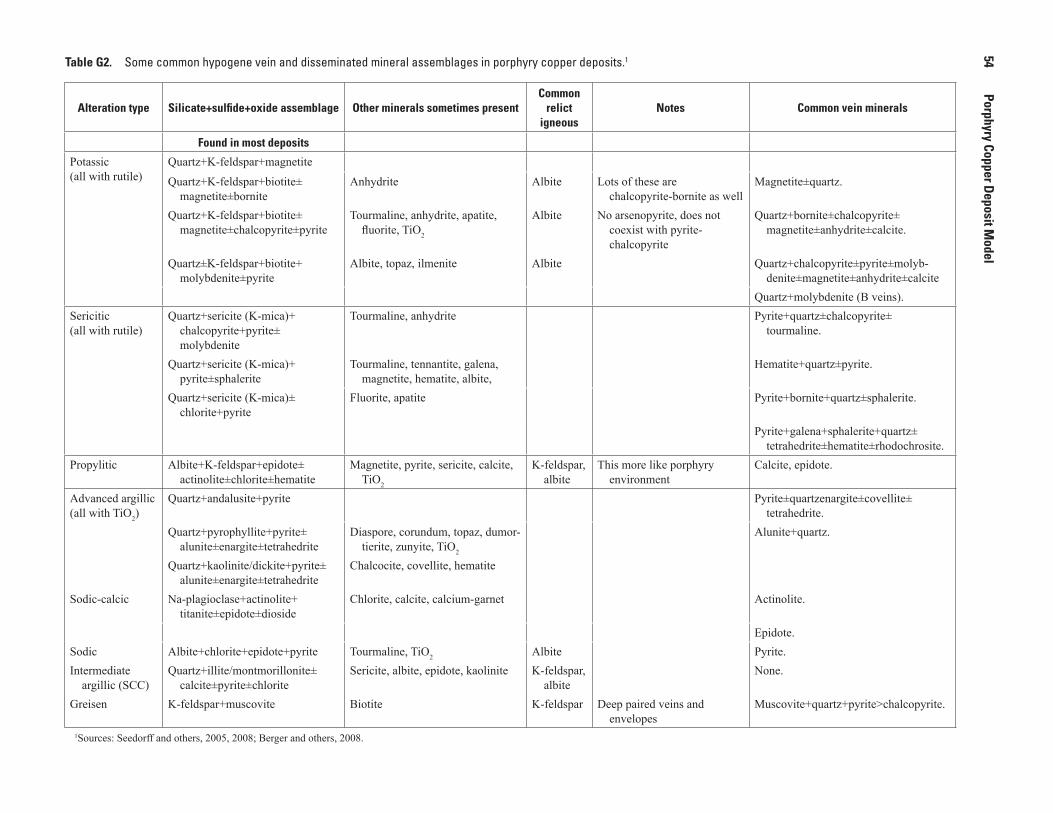
Table G2. Some common hypogene vein and disseminated mineral assemblages in porphyry copper 1deposits.
Alteration type Silicate+sulfide+oxide assemblage Other minerals sometimes present Common
relict igneous
Notes Common vein minerals
Found in most deposits
Potassic(all with rutile)
Quartz+K-feldspar+magnetite
Quartz+K-feldspar+biotite± magnetite±bornite
Quartz+K-feldspar+biotite± magnetite±chalcopyrite±pyrite
Quartz±K-feldspar+biotite+ molybdenite±pyrite
Anhydrite
Tourmaline, anhydrite, apatite, fluorite, TiO2
Albite, topaz, ilmenite
Albite
Albite
Albite
Lots of these are chalcopyrite-bornite as well
No arsenopyrite, does not coexist with pyrite-chalcopyrite
Magnetite±quartz.
Quartz+bornite±chalcopyrite± magnetite±anhydrite±calcite.
Quartz+chalcopyrite±pyrite±molyb- denite±magnetite±anhydrite±calcite
Quartz+molybdenite (B veins).Sericitic(all with rutile)
Quartz+sericite (K-mica)+ chalcopyrite+pyrite± molybdenite
Quartz+sericite (K-mica)+ pyrite±sphalerite
Quartz+sericite (K-mica)± chlorite+pyrite
Tourmaline, anhydrite
Tourmaline, tennantite, galena, magnetite, hematite, albite,
Fluorite, apatite
Pyrite+quartz±chalcopyrite± tourmaline.
Hematite+quartz±pyrite.
Pyrite+bornite+quartz±sphalerite.
Pyrite+galena+sphalerite+quartz± tetrahedrite±hematite±rhodochrosite.
Propylitic Albite+K-feldspar+epidote± actinolite±chlorite±hematite
Magnetite, pyrite, sericite, calcite, TiO2
K-feldspar, albite
This more like porphyry environment
Calcite, epidote.
Advanced argillic(all with TiO )2
Sodic-calcic
SodicIntermediate
argillic (SCC)Greisen
Quartz+andalusite+pyrite
Quartz+pyrophyllite+pyrite± alunite±enargite±tetrahedrite
Quartz+kaolinite/dickite+pyrite± alunite±enargite±tetrahedrite
Na-plagioclase+actinolite+ titanite±epidote±dioside
Albite+chlorite+epidote+pyriteQuartz+illite/montmorillonite±
calcite±pyrite±chloriteK-feldspar+muscovite
Diaspore, corundum, topaz, dumor-tierite, zunyite, TiO 2
Chalcocite, covellite, hematite
Chlorite, calcite, calcium-garnet
Tourmaline, TiO2
Sericite, albite, epidote, kaolinite
Biotite
AlbiteK-feldspar,
albiteK-feldspar Deep paired veins and
envelopes
Pyrite±quartzenargite±covellite± tetrahedrite.
Alunite+quartz.
Actinolite.
Epidote.Pyrite.None.
Muscovite+quartz+pyrite>chalcopyrite.
1Sources: Seedorff and others, 2005, 2008; Berger and others, 2008.
54
Porphyry Copper Deposit Model
H and K. Hypogene and Supergene Gangue Characteristics 55
veins) is proportional to their abundance. Breccias form along wall-rock contacts by emplacement of solidified intrusions (intrusion breccias), by forceful injection of fluids (magmatic or hydrous) that fracture, transport, and abrade wall rocks (intrusive breccias), and by planar fracturing of solidified intrusions and wall rocks (tectonic breccias; also see “Textures and Structures” in section N, “Petrology of Associated Igneous Rocks”). Breccias can form throughout the evolution of a PCD, they are usually permeable, and they commonly are mineralized. Breccia clasts and matrices vary greatly in aspect, dimension, and composition. Matrices may contain vugs of millimeter to centimeter euhedral crystals of copper sulfide minerals, molybdenite, and other hypogene minerals, the coarsest grained hydrothermal minerals found in PCDs.
H and K. Hypogene and Supergene Gangue Characteristics
(Peter G. Vikre)
Because porphyry copper deposits are bulk-mined, more than 98 percent of ore consists of valueless rock and miner-als, known as gangue, that are discarded during processing for recovery of copper, molybdenum, gold, and silver. Gangue includes primary minerals of host rocks, hypogene hydro-thermal minerals, and supergene minerals that do not contain recoverable copper and molybdenum. Rock that contains no copper or molybdenum (100 percent gangue minerals), or too little copper and molybdenum for processing, is called waste.
Mineralogy
Hypogene gangue in PCDs in granitic rocks, the most common host rocks of PCDs, is predominantly primary rock-forming plagioclase, potassium feldspar, quartz, micas, amphiboles, pyroxenes, and accessory minerals (iron-titanium oxides, apatite, zircon). In sedimentary host rocks, hypogene gangue includes primary calcite and dolomite, in addition to quartz, feldspars, micas, mafic minerals, and rock fragments. Hypogene hydrothermal gangue minerals are mainly quartz, potassium-mica, chlorite, epidote, biotite, potassium feldspar, anhydrite, and aluminum-silicate minerals (kaolinite, illite, dickite, and pyrophyllite), although a large number of other hydrothermal silicate, oxide, sulfate, phosphate, and carbonate minerals constitute hypogene hydrothermal gangue (table G1). In PCDs with skarn ore, common hypogene gangue minerals are pyroxene, actinolite, garnet, and iron-oxide minerals.
Supergene gangue includes valueless minerals formed by weathering of host rocks, hypogene primary rock-forming minerals, and hypogene hydrothermal minerals. The most abundant supergene gangue minerals are silica phases (chal-cedony, opal), kaolinite, illite, montmorillonite, limonite (goethite, hematite, and jarosite), and alunite (table G1). With
the exception of limonite and most manganese oxide miner-als, the common gangue minerals formed by supergene and hypogene processes are the same mineral species. The origin of gangue minerals can be determined by location, texture, mineral associations, and compositional characteristics listed in section “Zoning.”
Mineral Assemblages and Paragenesis
Hypogene hydrothermal mineral assemblages that constitute gangue, and assemblage parageneses, are described in section G, “Hypogene Ore Characteristics” and table G2. Supergene gangue mineral assemblages are more difficult to define as many supergene minerals occur in nonequilibrium associations produced by multiple weathering cycles. Super-gene gangue mineral associations are described in several places in this section; supergene ore mineral assemblages and associations are described in section J, “Supergene Ore Characteristics.”
Zoning
The distribution of primary rock-forming gangue minerals follows the distribution of rock types that make up PCDs, whereas hypogene hydrothermal gangue minerals, and supergene minerals are often zoned (section G, “Hypo-gene Ore Characteristics”; section I, “Hydrothermal Altera-tion”; section J, “Supergene Ore Characteristics”; section M, “Geochemical Characteristics”). Hypogene hydrothermal gangue in deeper parts of zoned deposits is mostly quartz, micas, feldspars, and pyrite in both wall rocks and veins. Near-surface hypogene hydrothermal gangue in zoned depos-its can include higher proportions of fine-grained quartz, clay, sulfide, oxide, and sulfate minerals in wall rocks and veins. Weathering of both deep and near-surface gangue increases proportions of supergene aluminum-silicate, clay, iron oxide, and sulfate minerals, such as kaolinite, illite, montmorillonite, limonite (goethite, hematite, and jarosite), and alunite in wall rocks and veins (table G1). Many gangue minerals formed by hypogene and supergene processes have lower densities than the primary rock-forming minerals and hypogene hydrother-mal minerals they replace. Lower density gangue minerals, combined with voids created by mineral dissolution, generally decrease physical competency of ore and waste.
Spatial relationships, textures, mineral associations, and mineral compositions distinguish supergene mineral associa-tions from hypogene gangue and ore minerals. Supergene gangue mineral associations generally:
1. are proximal to the present surface;
2. include earthy iron (and manganese) oxides that are not part of hypogene mineral assemblages and form only by weathering;
56 Porphyry Copper Deposit Model
3. occur in porous, low-density, often disaggregated rocks in which rock components have been removed by chemical (dissolution) and physical (erosion) weathering;
4. do not include minerals with high-temperature, two-phase fluid inclusions; and
5. include minerals with slightly different chemical, and slightly to markedly different isotopic compositions com-pared to hypogene gangue minerals of the same species.Supergene gangue minerals in supergene ore (section J,
“Supergene Ore Characteristics”) have additional distinguish-ing characteristics in that they occur:6. in assemblages with supergene sulfide minerals, includ-
ing chalcocite and covellite, and CuxSy minerals, and with hypogene sulfide minerals, including pyrite and chalco-pyrite;
7. with supergene and hypogene sulfide minerals in later-ally extensive layers that are near and often parallel to the present surface, and overlie the hypogene ore and gangue from which they were derived;
8. with or without earthy iron (and manganese) oxides; and
9. both in porous, low-density rocks and in rocks in which densities have been less affected or unaffected by hypo-gene and supergene processes.
Textures and Grain Sizes of Hypogene Gangue
Hypogene gangue minerals make up more than 98 percent of ore, hypogene ore minerals account for less than 2 percent of ore, and proportions of gangue minerals and ore minerals are relatively constant throughout large volumes of host rocks. Therefore, textures and grain sizes of gangue and ore minerals in most PCDs are broadly similar, facilitating common mining and processing techniques. Although gangue mineral textures and grain sizes are largely inherited from host rocks, primary host rock textures and grain sizes are invari-ably modified by alteration processes that change primary host-rock gangue minerals into minerals with different grain sizes and densities as well as compositions. For example, in the sericitic alteration zone of porphyry host rocks that contain sufficient copper±molybdenum sulfide minerals to constitute ore, sericite has partly to entirely replaced primary phenocryst and matrix feldspars and mafic minerals, leaving remnant to relict primary porphyry texture and mineralogy. This gangue sericite is generally finer grained than primary host rock and sulfide ore minerals, with micrometer dimensions common and millimeter dimensions rare, and forms aggregates with densities lower than the densities of the primary minerals it replaced. Volume loss coupled with reduced grain size gener-ally lowers rock strength and produces a greater abundance of fine particles when sericitic ore is mined and processed. Conversely, gangue minerals in potassic alteration zones
of porphyry ore, mostly feldspars and quartz, may preserve primary host-rock textures and grain sizes except in cases of strong potassium feldspar-biotite addition and are generally coarser grained than copper±molybdenum sulfide minerals. Replacement of primary feldspars, biotite, and hornblende with hydrothermal potassium feldspar and biotite usually produces potassic-zone gangue that is relatively competent. Potassic-zone ore may require more closely spaced blast holes and may produce a lower proportion of fine particles than sericitic ore when mined and processed.
Textures and Grain Sizes of Supergene Gangue
Textures and grain sizes of supergene gangue in PCDs differ from those of hypogene gangue in that weathering and enrichment processes have: (1) removed by chemical dissolution hypogene gangue and
ore minerals and earlier formed supergene gangue and ore minerals or mineral components, leaving porous and friable aggregates of residual rock components (mainly forms of silica, iron oxides and hydroxides, relict sericite, and kaolinite) that constitute leached capping; and
(2) replaced, impregnated, and partly filled hypogene gangue and ore minerals, earlier formed supergene gangue and ore minerals, and porous rock residue with less dense and generally finer grained copper and other silicate, oxide, sulfate, carbonate, chloride, and phosphate minerals (near the present surface or paleosurfaces) forming oxide ore. Processes involved in weathering and copper enrich-
ment of PCDs, and grades, tonnages, depths, configurations, zoning, and mineralogy of enriched oxide and sulfide copper zones are provided by Anderson (1982), Titley and Marozas (1995), Long (1995), and Sillitoe (2005). Spatial relationships of leached capping, oxide ore, and sulfide ore are shown in figure J1.
Supergene gangue textures and grain sizes, products of one or more enrichment and erosion cycles, are associated with variable abundances of copper minerals. Supergene minerals, most commonly iron oxides, kaolinite, smectite (montmorillonite), and lesser alunite, are finely dispersed in fractures in other minerals (supergene, hypogene, and primary) or along grain boundaries and fill or encrust fractures and voids as crystalline aggregates and euhedral crystals. Super-gene opaline silica and copper oxide minerals such as chryso-colla may exhibit colloform texture in fractures and voids. In leached capping residual rock, texture consists of vuggy to hackly matrices of fine to very fine grained silica, earthy iron oxides, and kaolinite/smectite that enclose up to tens of percent void spaces; primary rock textures are partly to totally obscured. If supergene minerals or residual rock-forming minerals in leached capping occur with recoverable copper oxide minerals, they can be considered supergene gangue; otherwise, they constitute waste.
I. Hydrothermal Alteration 57
Significance of Gangue
Porphyry copper deposits are nearly entirely composed of hypogene and supergene gangue minerals, and gangue mineral characteristics, coupled with Cu±Mo±Au grade, determine feasibility of mining PCDs. In addition, gangue minerals, such as iron oxides, are useful for exploration and resource evaluation.
Gangue minerals control physical properties of ore, such as hardness, fracture and vein density, and particle-size distribution after blasting and crushing. These physical proper-ties, in turn, dictate a large number of mining and equipment requirements including ore/waste stripping ratios (pit slopes), blast hole density, crushing capacity, truck tire replacement frequency, and mill design. Although not technically gangue, leached capping and waste may have physical characteristics that differ considerably from those of ore, requiring separate layback design and removal (stripping) scheduling in open-pit mines. Gangue minerals that react with processing fluids and reagents further influence mill design. Pyrite gangue strongly affects geoenvironmental aspects of PCDs because of its acid-generating capacity and burden on sulfur control (see section S, “Geoenvironmental Features”). All of these factors affect mining and processing (operating) costs, capital costs, and production rates, and ultimately the profitability of producing Cu±Mo±Au±Ag from a PCD.
Compositions and textures of supergene iron oxide minerals (limonite) are useful in PCD identification and evaluation. Precursor sulfide mineralogy of leached capping (pyrite, chalcopyrite, chalcocite, enargite) can be identified by the mineralogy (goethite, hematite, jarosite), color, texture and origin of limonite (Blanchard, 1968; Anderson, 1982; Gilmour, 1995; Sillitoe, 2005). Transported limonites are indicative of elevated pyrite, and in-situ limonites are indicative of low pyrite/copper sulfide minerals. In Andean PCDs, goethite is associated with minor leaching and copper oxide minerals, hematite is associated with mature copper enrichment and pyrite/chalcopyrite about 5/1, and jarosite generally developed peripheral to goethitic and hematitic leached capping over pyrite haloes surrounding PCDs (Sillitoe, 2005).
I. Hydrothermal Alteration
(John H. Dilles)
Hydrothermal alteration here refers to metasomatic processes that change both the composition and mineral-ogy of wall rocks or host rocks to ores. As such, it nominally excludes vein fillings; however, in porphyry environments wall-rock alteration is intimately linked with narrow veins or “veinlets” up to 10 cm in width but more commonly 0.1 to 10 cm in width that make up less than 1 to 5 volume percent, and rarely more than 10 volume percent of the rock in economic ore zones. A salient example characteristic of
porphyry deposits is sets of veins termed D veins and defined as sulfide±quartz veins with sericitic alteration selvages a few millimeters to centimeters in width. The veins that are char-acteristic of porphyry deposits are summarized in the section “Veins and Veinlets,” and alteration selvages are discussed in the following section.
Hydrothermal rock alteration is characterized by ionic metasomatism, including the important alkali metasoma-tism and hydrolytic (or acidic) reactions, oxidation/reduc-tion reactions (including sulfidation), solubility-induced precipitation reactions, such as quartz precipitation, and hydration-carbonation reactions in which water or carbonate is added (fig. I1).
Mineralogy
The most common host rocks of porphyry copper deposits consist predominantly of primary rock-forming plagioclase, potassium feldspar, quartz, micas, amphiboles, pyroxenes, and accessory minerals (iron-titanium oxides, apatite, zircon) and more rarely feldspathoids, carbonate, and microcrystalline minerals or glass. Sedimentary host rocks may include primary calcite, dolomite, clays, organic materials (carbon, and so forth) sulfate, and sulfide (pyrite), in addi-tion to quartz, feldspars, micas, ferromagnesian minerals, and rock fragments.
Hypogene and hydrothermally formed gangue minerals are mainly quartz, potassium-mica, chlorite, epidote, biotite, potassium feldspar, albite or Na-rich plagioclase, montmoril-lonite, and aluminum-silicate minerals, including kaolinite, illite, dickite, pyrophyllite, and andalusite, although a large number of other hydrothermal silicate, oxide, sulfate, phos-phate, and carbonate minerals constitute hypogene hydro-thermal gangue (table G1). In PCDs with skarn ore, common hypogene gangue minerals are actinolite, calcium-pyroxene, and garnet.
Mineralogy of Assemblages and Associated Veins
Several types of wall-rock alteration characterize porphyry copper ore zones. These alteration types may extend upward and outward several kilometers (greater distances for D vein selvages) and are temporally and spatially zoned. Mineral assemblages include new or hydrothermal minerals (including ore sulfides and oxides), as well as relict or modi-fied original rock minerals that are present except in cases of extreme hydrolytic alteration. Table G2 summarizes the common mineral associations, which include minerals formed in chemical equilibrium and relict minerals or metastable hydrothermal minerals that are not necessarily in equilibrium.
Potassic alteration and sericitic alteration are invari-ably associated with sulfide mineralization in PCDs, and they are generally temporally, spatially, and thermally zoned with respect to one another. Potassic alteration tends to be more
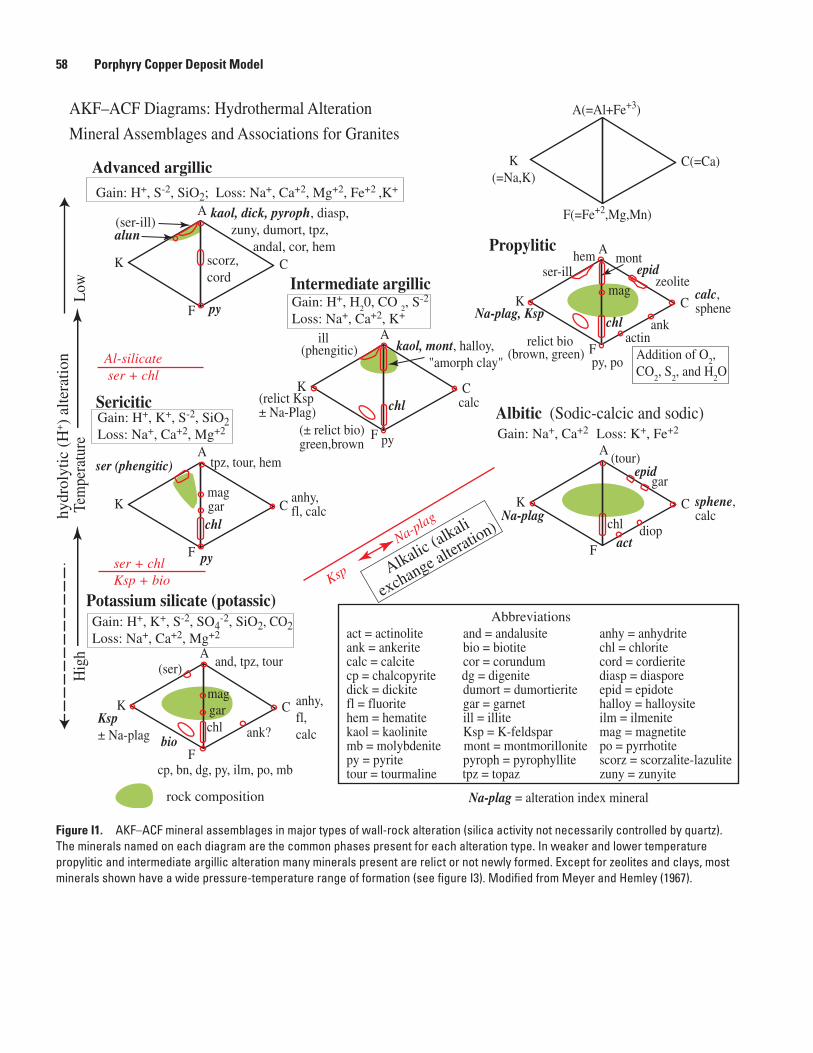
rock composition
K(=Na,K)
A(=Al+Fe+3)
C(=Ca)
F(=Fe+2,Mg,Mn)
K
A
C
F
K
A
C
F
K
A
C
F
K
A
C
F
chlbio
Potassium silicate (potassic)
anhy, fl, calcank?
(ser)
Ksp± Na-plag
cp, bn, dg, py, ilm, po, mb
and, tpz, tour
Sericitic
tpz, tour, hemser (phengitic)
py
Propylitic
Albitic (Sodic-calcic and sodic)
Na-plag, Ksp
relict bio(brown, green)
py, po
ank
calc,sphene
zeolite
montepid
chlactin
ser-ill
chlact
sphene,calcNa-plag
(tour)
mag
K
A
C
F
Intermediate argillic
ill(phengitic) kaol, mont, halloy,
"amorph clay"
calc
py
(relict Ksp ± Na-Plag)
(± relict bio)green,brown
chl
gar
epid
diop
gar
hem
mag
chl
maggar
anhy,fl, calc
K
A
C
F
Advanced argillic
kaol, dick, pyroph, diasp, zuny, dumort, tpz, andal, cor, hem
(ser-ill)alun
py
scorz,cord
act = actinolite and = andalusite anhy = anhydrite ank = ankerite bio = biotite chl = chlorite calc = calcite cor = corundum cord = cordierite cp = chalcopyrite dg = digenite diasp = diaspore dick = dickite dumort = dumortierite epid = epidotefl = fluorite gar = garnet halloy = halloysite hem = hematite ill = illite ilm = ilmenite kaol = kaolinite Ksp = K-feldspar mag = magnetite mb = molybdenite mont = montmorillonite po = pyrrhotite py = pyrite pyroph = pyrophyllite scorz = scorzalite-lazulitetour = tourmaline tpz = topaz zuny = zunyite
Abbreviations
Na-plag = alteration index mineral
H(citylordyh
+noitaretla
)
Alkalic (alkali
exchange alteration)
Addition of O2,
CO2, S
2, and H
2O
Al-silicate ser + chl
ser + chlKsp + bio Ksp
Na-plag
Gain: H+, K+, S-2, SiO2Loss: Na+, Ca+2, Mg+2
Gain: H+, K+, S-2, SO4-2, SiO2, CO2
Loss: Na+, Ca+2, Mg+2
Gain: H+, S-2, SiO2; Loss: Na+, Ca+2, Mg+2, Fe+2 ,K+
Gain: H+, H20, CO
2, S-2
Loss: Na+, Ca+2, K+
Gain: Na+, Ca+2 Loss: K+, Fe+2
woL
erutarepmeT
hgiH
AKF–ACF Diagrams: Hydrothermal Alteration
Mineral Assemblages and Associations for Granites
Figure I1. AKF–ACF mineral assemblages in major types of wall-rock alteration (silica activity not necessarily controlled by quartz). The minerals named on each diagram are the common phases present for each alteration type. In weaker and lower temperature propylitic and intermediate argillic alteration many minerals present are relict or not newly formed. Except for zeolites and clays, most minerals shown have a wide pressure-temperature range of formation (see figure I3). Modified from Meyer and Hemley (1967).
58 Porphyry Copper Deposit Model
I. Hydrothermal Alteration 59
central, deeper, higher temperature, and earlier compared to sericitic alteration (figs. E4 and I2). Potassic alteration includes added potassium silicate phases; potassium feld-spar addition characteristically is the dominant K-mineral in silicic or granitic wall rocks, whereas biotite is the dominant K-mineral in intermediate or mafic composition wall rocks (fig. I1). Additional added minerals include sulfides with moderate sulfidation states (bornite, chalcopyrite, and pyrite) and commonly include magnetite, molybdenite, anhydrite, or calcite. Sodic plagioclase is commonly relict. Potassic altera-tion is directly associated with abundant stockwork quartz-rich veinlets, including the important A style (quartz-bornite-chalcopyrite±magnetite ±anhydrite±calcite) and B style quartz±molybdenite±Cu-Fe-sulfide veins (Gustafson and Hunt, 1975), but also including veins dominated by biotite, magnetite, or copper-iron sulfides. EDM or “early dark mica-ceous” veins are centimeter-scale potassic alteration selvages along copper-iron-sulfide-bearing, quartz-poor veins, but these veins typically also contain minor amounts of sericite (musco-vite) and local andalusite (Meyer, 1965). Alkali (potassium-rich) metasomatic addition dominates with a lesser amount of hydrolytic alteration. Metal and sulfur addition produce moderate sulfidation-state sulfide assemblages accompanied by common anhydrite.
Sericitic alteration forms selvages a few centimeters wide (but varying from less than 1 millimeter to greater than 1 meter) along structurally controlled “D” veins along fractures and faults. Where these veins are closely spaced, this alteration may be pervasive in volumes up to 1 km3 (consult Butte: Rusk, Reed, and Dilles, 2008). D veins vary from less than 1 mm to greater than 1 m wide and are dominated by pyritic sulfides and minor to major amounts of quartz, and almost invariably postdate most porphyry dikes and all A and B style veins. Sulfide minerals in D veins are strongly zoned from central chalcopyrite-rich veins cutting older potassic alteration zones upward and outward to pyrite-chalcopyrite veins to pyrite-dominated veins with variable amounts of sphalerite, tetrahedrite, and minor galena and manganese carbonates; tourmaline or anhydrite is common. In the shal-lowest environments, specular hematite and quartz are domi-nant minerals in some D veins. Sericitic alteration selvages are characterized by replacement of all rock minerals by fine-grained white potassium-mica (sericite) and quartz accompa-nied by a small percentage of pyrite or specular hematite and accessory rutile or other TiO2 minerals. Outside the selvage of pervasive sericitic alteration, mafic minerals are gener-ally converted to chlorite for some distance, and plagioclase is typically partly replaced by sericite with relict albite. The sericitic potassium-mica is typically muscovite near copper-ore zones, but in upper and outer sericitic alteration zones, the mica formed at lower temperatures and is iron-magnesium-bearing phengite, which is commonly associated with chlorite.
Advanced argillic alteration refers to intense hydrolytic alteration and alkali-base cation leaching that forms alkali-free hydrous aluminum silicate minerals (pyrophyllite, dickite, and kaolinite, in order of decreasing thermal stability), local
andalusite in high-temperature zones, alunite, and a variety of aluminum, fluorine, and silica-rich minerals, such as topaz, diaspore, zunyite, corundum, and dumortierite (figs. I1 and I3). Quartz-rich zones (lithocaps) in which all aluminum is also removed (residual silica alteration) are common in shallow zones transitional to epithermal environments. Minor to trace amounts of TiO2 and phosphate minerals are present in all assemblages. This intense hydrolytic alteration is caused by extremely low-pH fluids that are commonly associated with high sulfur contents and result in relatively sulfide-rich high-sulfidation assemblages dominated by pyrite with covel-lite, digenite, enargite, tennantite, and(or) bornite associated with alunite.
Intermediate argillic alteration refers to clay-bearing assemblages formed by hydrolytic alteration that typically form at lower temperature than sericitic alteration and at relatively low pH but at higher pH than advanced argillic alteration at similar temperatures. Intermediate argillic altera-tion may surround quartz-alunite zones in the near-surface environment, but it extends locally to great depth as a late, low-temperature overprint atop potassic and sericitic zones. As defined at Butte, Montana, smectite or kaolinite clays replace plagioclase, igneous potassium feldspar is not altered, and ferromagnesian minerals are relict or partly altered to chlorite (Sales and Meyer, 1948; Meyer and others, 1968). Other clay minerals include halloysite and amorphous clays at low temperature and illite that is typically phengitic at higher temperatures. Albite, biotite, pyroxene, and amphibole may be relict. Sulfide contents are typically low and dominated by pyrite, and calcite is common. Sales and Meyer (1948) showed that the intermediate argillic zones at Butte are outer selvages to the sericitic alteration that is around Main stage veins, and interpreted that these two alteration assemblages formed contemporaneously (Meyer and Hemley, 1967). More recent studies of epithermal and geothermal systems suggest intermediate argillic alteration forms at low temperature (less than 200°C; Reyes, 1990; Simmons and others, 2005) compared to sericitic alteration (250–450°C; Rusk, Reed, and Dilles, 2008; Rusk, Miller, and Reed, 2008). In intermediate composition host rocks rich in calcic plagioclase, such as SW Pacific porphyry deposits, a similar alteration is common and has been referred to as SCC (for illitic sericite-chlorite-clay) (consult Sillitoe and Gappé, 1984; Sillitoe, 2000).
Propylitic alteration refers to alteration of igneous rocks by hydration, carbonation, oxidation, and locally sulfidation reactions to form assemblages rich in hydrous minerals and containing minor carbonate, sulfide, and(or) hematite (fig. I1). Typical assemblages contain epidote-group minerals, chlorite, or actinolite at higher temperatures and chlorite, illite-sericite, or smectite at lower temperatures as replacements of calcic-plagioclase and ferromagnesian minerals. Most igneous miner-als are locally relict or stable (for example, potassium feldspar, biotite, amphibole, magnetite, titanite), and albite is commonly crystallized from the sodium-rich components of precursor plagioclase. Sulfide contents are typically low.
60 Porphyry Copper Deposit Model
Sodic-calcic and sodic alteration refers to strong alkali alteration in which sodium- and commonly calcium-rich minerals are added and potassium- and commonly iron-rich minerals are destroyed. Characteristic alteration reactions are sodium-rich plagioclase replacement of potassium feldspar, and Ca-Fe-Mg mineral or chlorite replacement of potassium-mica. The typical alkali exchange is addition of Na ± Ca and loss of K ± Fe. Typical added minerals are sodic-plagioclase, actinolite, epidote, chlorite, and titanite. At temperatures below about 400°C, albite is accompanied by chlorite and epidote. At temperatures greater than 450°C, calcium-pyroxene, calcium-rich plagioclase, and local Ca-Al-Fe garnet may form in igneous rocks near carbonate rocks, and in this environment sodic-calcic alteration is gradational into endos-karn (consult Dilles and Einaudi, 1992). Sulfide minerals are typically absent from sodic-calcic alteration but may be present in sodic alteration where it is in contact with potassic or sericitic alteration.
Greisen refers to vein-envelope pairs with macroscopi-cally crystalline hydrothermal muscovite (Seedorff and others, 2008). Greisen consists of veins containing muscovite, quartz, and minor sulfides (pyrite greater than chalcopyrite) with potassium feldspar-muscovite envelopes. Greisen takes the form of sheeted vein sets in the root zones of porphyry copper systems that are formed from silicic, hornblende-poor granites. Although greisen alteration has mineralogical similarities with sericitic alteration, the coarse grain size, presence of potassium feldspar and local hydrothermal biotite, and the scarcity of sulfide minerals, all distinguish it from sericitic alteration.
Skarn refers to calcium-iron-magnesium silicate minerals that have replaced carbonate and other wall rocks, as reviewed in the PCD environment by Einaudi (1982a,b) and Einaudi and others (1981). Magnesium silicate minerals are dominant in dolomitic protoliths, and calcium-iron silicate minerals are dominant in limestone protoliths that most commonly host PCD ores. Typical early anhydrous skarn includes andradite-grossular garnet and calcium-rich pyroxene ranging in composition from diopside to magnesium-hedenbergite. These minerals typically replace carbonate. Actinolite is characteristic of hydrous skarn assemblages that in many cases are associated with chalcopyrite, pyrite, magnetite, and ore formation (Einaudi, 1982b). Later stages of hydrous skarn include minerals such as actinolite, chlorite, and talc that are commonly associated with calcite, quartz, magnetite or hema-tite, and sulfides that replace early garnet and pyroxene and commonly are interpreted to represent retrograde alteration during cooling, hydration, and carbonation.
Lateral and Vertical Dimensions
Hydrothermal alteration zones have kilometer-scale vertical and lateral dimensions that show significant variation in geometry, largely as a function of depth, rock composition, and orientation of more permeable zones, such as hydrofrac-tured rock and porphyry dikes (fig. I2; Seedorff and others,
2005). In the shallow environment, porphyry intrusions tend to be dikelike in narrow zones that focus hydrothermal fluids in zones less than 1 km wide and elongate along the strike of the dikes. Vertical dimensions in this environment tend to be short (1–3 km) and the alteration zones flare upward into epithermal hydrothermal zones that in some cases contain copper-gold mineralization (fig. E4; compare Yerington, Nevada; Yana-cocha, Peru; Far South East-Lepanto, Philippines). In deeper environments, such as at Butte, Montana, and perhaps some Southwestern United States deposits, porphyry alteration zones tend to be shaped like inverted cups with alteration terminating upward and laterally with dimensions of 1–4 km. In most of these environments, sericitic alteration zones breach a part of this cup-shaped older potassic alteration dome and extend unknown distances (more than 2 km) upward. Where faulting occurred synchronously with the sericitic alteration, the veins and sericitic alteration zones may extend upward more than 3 km and laterally more than 5 km (El Abra, Chile, Ambrus, 1977). So-called Cordilleran base metal lode depos-its, exemplified by numerous zoned, base-metal-rich lodes in the Peruvian Andes (Einaudi, 1977; Bartos, 1987; Baumgart-ner and others, 2008) and at Butte, Montana (Meyer and others, 1968), consist of veins and associated sericitic altera-tion that extend as much as 10 km laterally (fig. D6C).
Selvages
As noted above, hydrothermal alteration selvages around semiplanar millimeter- to centimeter- to locally decimeter-scale veins are characteristic of PCDs. Pervasive alteration results where veins and selvages are so close that the selvages overlap. The theory of vein selvage formation is that hydro-thermal fluids flow along the semiplanar fractures and fluid components diffuse into the adjacent wall rock through a stagnant pore to produce hydrothermal mineral reactions (consult Korzhinski, 1959; Geiger and others, 2002). Selvages commonly form through a series of mineral reactions at slightly different distances from the vein center, but these are not usually described in the literature (Sales and Meyer, 1948, 1950; Geiger and others, 2002).
Potassic alteration is characterized by pervasive addi-tion of hydrothermal biotite and(or) potassium feldspar in zones greater than 1 km wide by 1 km high, but this altera-tion is flanked by narrow zones where fractures filled with sulfides, quartz, carbonates, biotite, and magnetite are flanked by narrow millimeter-scale selvages of hydrothermal biotite developed in fresh rock (consult Butte: Roberts, 1975; Geiger and others, 2002; Bingham: Seedorff and others, 2005, fig. 9).
Sericitic alteration invariably forms as centimeter- to decimeter-scale but rarely meter-scale selvages in which sericite replaces feldspars. The ferromagnesian minerals, typi-cally biotite, are generally converted to sericite in a second selvage (or reaction front) at greater distance from the vein, but in some cases such as in the gray sericite zone at Butte, the biotite reaction front is closer to the vein than the feldspar
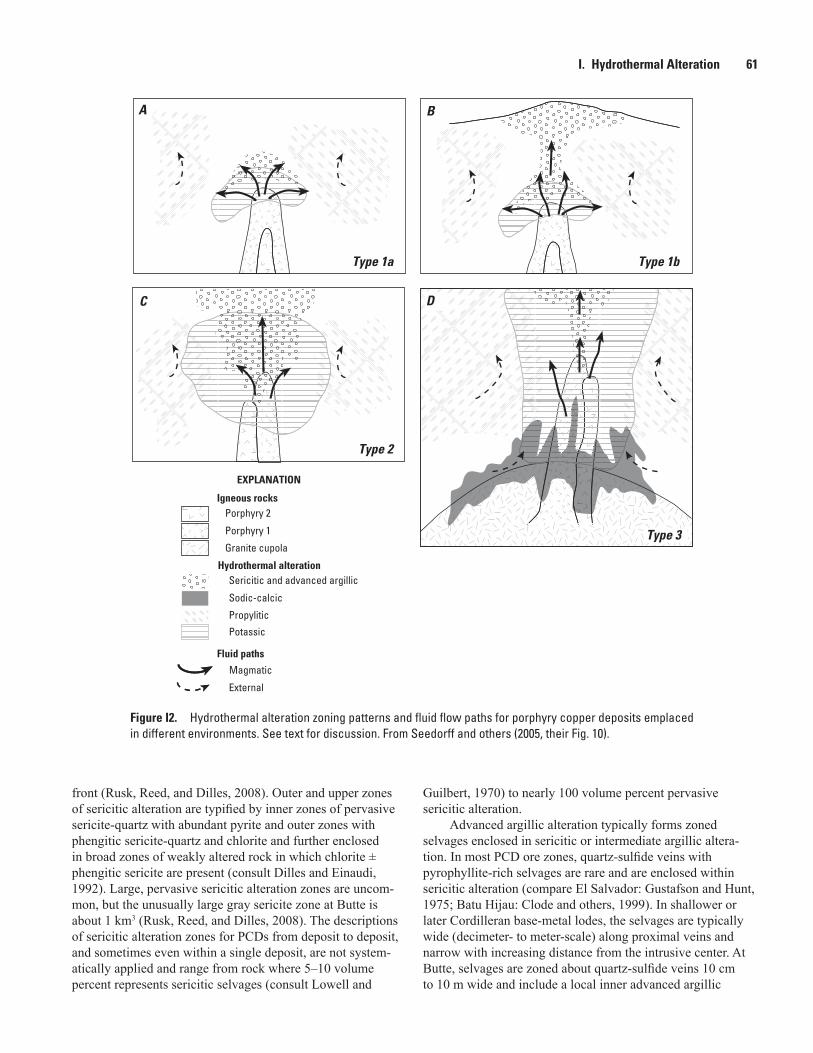
Type 3
Type 1a Type 1b
Type 2
A B
C D
Potassic
Sodic-calcic
Sericitic and advanced argillic
Granite cupola
Porphyry 1
Porphyry 2
Hydrothermal alteration
Igneous rocks
EXPLANATION
Magmatic
External
Fluid paths
Propylitic
Type 3
Figure I2. Hydrothermal alteration zoning patterns and fluid flow paths for porphyry copper deposits emplaced in different environments. See text for discussion. From Seedorff and others (2005, their Fig. 10).
I. Hydrothermal Alteration 61
front (Rusk, Reed, and Dilles, 2008). Outer and upper zones of sericitic alteration are typified by inner zones of pervasive sericite-quartz with abundant pyrite and outer zones with phengitic sericite-quartz and chlorite and further enclosed in broad zones of weakly altered rock in which chlorite ± phengitic sericite are present (consult Dilles and Einaudi, 1992). Large, pervasive sericitic alteration zones are uncom-mon, but the unusually large gray sericite zone at Butte is about 1 km3 (Rusk, Reed, and Dilles, 2008). The descriptions of sericitic alteration zones for PCDs from deposit to deposit, and sometimes even within a single deposit, are not system-atically applied and range from rock where 5–10 volume percent represents sericitic selvages (consult Lowell and
Guilbert, 1970) to nearly 100 volume percent pervasive sericitic alteration.
Advanced argillic alteration typically forms zoned selvages enclosed in sericitic or intermediate argillic altera-tion. In most PCD ore zones, quartz-sulfide veins with pyrophyllite-rich selvages are rare and are enclosed within sericitic alteration (compare El Salvador: Gustafson and Hunt, 1975; Batu Hijau: Clode and others, 1999). In shallower or later Cordilleran base-metal lodes, the selvages are typically wide (decimeter- to meter-scale) along proximal veins and narrow with increasing distance from the intrusive center. At Butte, selvages are zoned about quartz-sulfide veins 10 cm to 10 m wide and include a local inner advanced argillic
62 Porphyry Copper Deposit Model
(pyrophyllite-rich) zone enclosed successively by sericitic, intermediate argillic, and propylitic alteration zones (Sales and Meyer, 1948; Meyer and others, 1968). Recent stable isotope and fluid inclusion studies suggest that the intermediate argil-lic alteration at Butte formed at lower temperature (less than 200°C) and at a later time than the sericite-pyrophyllite altera-tion at 250–350°C (Zhang, 2000; Rusk, Miller, and Reed, 2008). In uppermost zones of shallow PCDs, the advanced argillic alteration zones are similar to and transitional into the well-documented advanced argillic alteration characteristic of quartz-alunite or high sulfidation epithermal gold deposits (Hedenquist and others, 2000). Inner quartz-rich zones are typically enclosed in quartz-alunite and quartz-kaolinite-dickite±pyrophyllite, and chlorite-rich propylitic alteration (compare, El Salvador, Watanabe and Hedenquist, 2001). Intermediate argillic alteration is common in a zone lying between the advanced argillic and propylitic zones in these near-surface environments, but it is also common as a deep, low-temperature weak alteration superimposed as a wash in PCD ore zones.
Sodic-calcic alteration selvages with centimeter- to decimeter-scale widths are common adjacent to actinolite and epidote veinlets, and rarely along quartz veinlets, as exem-plified by examples from Yerington, Nevada (Carten, 1986; Dilles and Einaudi, 1992).
Propylitic and intermediate argillic alteration forms less distinct selvages that are poorly described in the literature. Anhydrous skarn alteration zones typically do not form as selvages to veins but rather occur as sharp reaction fronts between unaltered and relatively impermeable carbonate-rich rock and permeable and porous skarns adjacent to lithologic contacts or faults.
Rock Matrix Alteration
The alteration mineral assemblages described above refer to the entire rock, and no distinction here is made between matrix and the rest of the rock. All wall-rock alteration zones are here considered to be selvages along veins. The one excep-tion in PCDs is the aplitic groundmass of porphyry dikes that is typically very permeable relative to host equigranular granitoid rocks. The aplitic groundmass commonly is strongly altered, whereas included phenocrysts are less altered, provid-ing strong evidence that the poorly fractured aplitic ground-mass allows fluid flow (see Dilles and Einaudi, 1992).
Intensity
The intensity of rock alteration is here considered to be recorded by the net change through gains or losses of chemi-cal components from a rock of constant volume (an assump-tion supported by textural evidence; compare the Gresens approach; Gresens, 1967; Grant, 1986). The intensity of altera-tion in terms of chemical mass transfer generally decreases from intense to weak in the general order advanced argillic,
sericitic, sodic-calcic and sodic, potassic, intermediate argillic, and propylitic. Anhydrous skarn is considered intense and similar to advanced argillic alteration.
Textures
Primary rock textures may be destroyed or largely preserved. Rock textures are typically entirely destroyed in skarns, advanced argillic alteration, and strong sericitic altera-tion and partly preserved in sodic-calcic and sodic alteration, weak sericitic alteration (chlorite-sericite), and potassic altera-tion, and are largely preserved in intermediate argillic and propylitic alteration.
Zoning Patterns
Hydrothermal minerals are zoned spatially in part because fluid flow paths and physicochemical properties vary spatially at a given time and partly because the magmatic-hydrothermal system evolves and changes over system-scale time-spans that may range from hundreds of thousands to millions of years (see “Duration of Magmatic-Hydrothermal Systems” in section D, “Regional Environment”). Hydrother-mal mineral zoning occurs both on the millimeter to meter scale as described previously for vein selvages developed parallel to vein fractures (perpendicular to hydrothermal fluid flow) and on the kilometer scale parallel to fluid flow along veins, fractures, and porphyry dikes. Pressure gradi-ents, described herein, largely drive fluid flow. Therefore, large-scale zonation patterns are strongly dictated by perme-ability, which is in turn strongly influenced by the ability of magmatic-hydrothermal fluids or faulting to produce fractures and the sealing of these fractures by precipitated hydro-thermal minerals (mainly dictated by quartz). Secondly, the pressure and temperature conditions of rock and fluid dictate fluid viscosity and other properties. An extremely important feature of parental magmatic-hydrothermal fluids is that they typically have about 5 weight percent dissolved salts, and as they depressurize upon separating from magma at shallow depths, they typically unmix into low-density vapor with small amounts of brine (Bodnar and others, 1985; Heinrich, 2005). Lower temperature, nonmagmatic fluids or late, deeply derived magmatic-hydrothermal fluids typically do not unmix into vapor and brine.
Three key components are recognized here that contrib-ute to alteration zoning. The first element is the ascent of early magmatic-hydrothermal fluids from the deep magma chamber. These fluids commonly unmix, producing low-density vapor and brine phases, but in all cases expand to produce mechani-cal energy that hydrofractures the rock (Burnham and Ohmoto, 1980). Such fluid moves away from the magmatic source, generally outward and upward toward the surface. As long as fluid is released from the underlying magma chamber, this zone is overpressured with respect to ambient groundwater under hydrostatic pressure, and these magmatic-hydrothermal
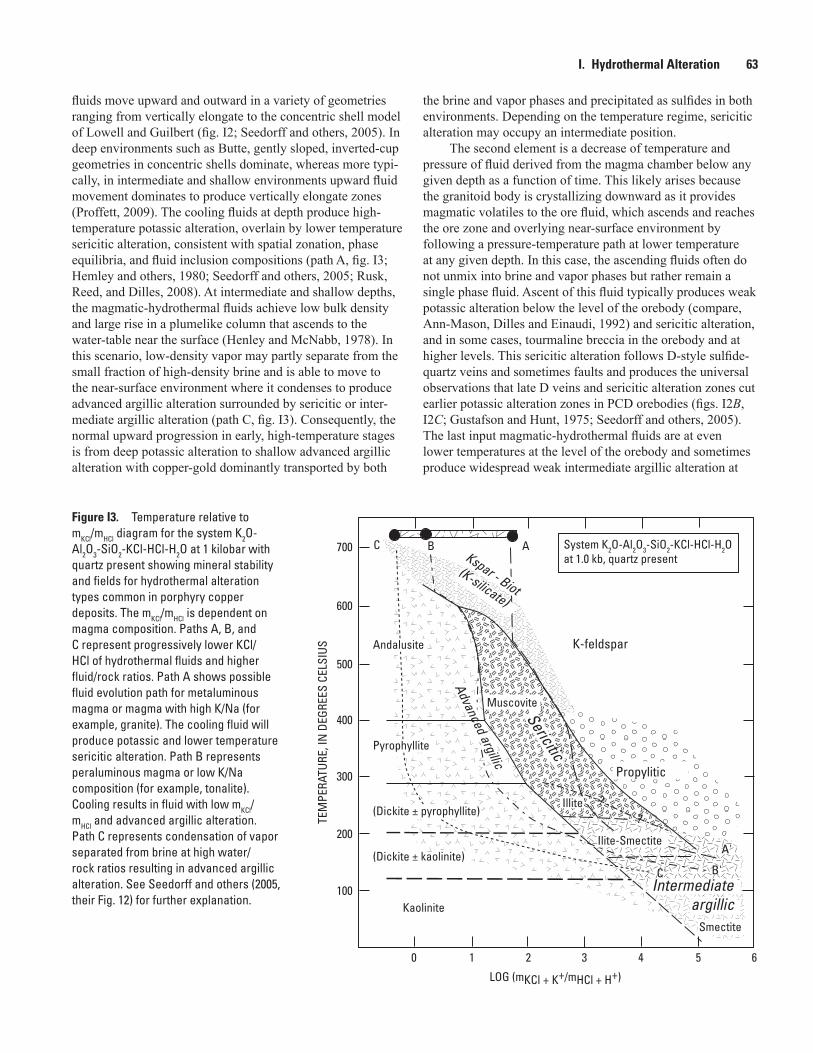
0 1 2 3 4 5 6
700
100
200
300
400
500
600
Kspar - Biot
(K-silicate)
Sericitic
Advanced argillic
Intermediate argillic
Propylitic
Kaolinite
Pyrophyllite
Andalusite
Muscovite
K-feldspar
LOG (mKCl + K+/mHCl + H+)
(Dickite ± kaolinite)
(Dickite ± pyrophyllite)Illite
Smectite
TEM
PERA
TURE
, IN
DEG
REES
CEL
SIUS
??
Ilite-Smectite
System K2O-Al2O3-SiO2-KCl-HCl-H2O at 1.0 kb, quartz present
ABC
A'
B'C'
Figure I3. Temperature relative to mKCl/mHCl diagram for the system K2O-Al2O3-SiO2-KCl-HCl-H2O at 1 kilobar with quartz present showing mineral stability and fields for hydrothermal alteration types common in porphyry copper deposits. The mKCl/mHCl is dependent on magma composition. Paths A, B, and C represent progressively lower KCl/HCl of hydrothermal fluids and higher fluid/rock ratios. Path A shows possible fluid evolution path for metaluminous magma or magma with high K/Na (for example, granite). The cooling fluid will produce potassic and lower temperature sericitic alteration. Path B represents peraluminous magma or low K/Na composition (for example, tonalite). Cooling results in fluid with low mKCl/mHCl and advanced argillic alteration. Path C represents condensation of vapor separated from brine at high water/rock ratios resulting in advanced argillic alteration. See Seedorff and others (2005, their Fig. 12) for further explanation.
I. Hydrothermal Alteration 63
fluids move upward and outward in a variety of geometries ranging from vertically elongate to the concentric shell model of Lowell and Guilbert (fig. I2; Seedorff and others, 2005). In deep environments such as Butte, gently sloped, inverted-cup geometries in concentric shells dominate, whereas more typi-cally, in intermediate and shallow environments upward fluid movement dominates to produce vertically elongate zones (Proffett, 2009). The cooling fluids at depth produce high-temperature potassic alteration, overlain by lower temperature sericitic alteration, consistent with spatial zonation, phase equilibria, and fluid inclusion compositions (path A, fig. I3; Hemley and others, 1980; Seedorff and others, 2005; Rusk, Reed, and Dilles, 2008). At intermediate and shallow depths, the magmatic-hydrothermal fluids achieve low bulk density and large rise in a plumelike column that ascends to the water-table near the surface (Henley and McNabb, 1978). In this scenario, low-density vapor may partly separate from the small fraction of high-density brine and is able to move to the near-surface environment where it condenses to produce advanced argillic alteration surrounded by sericitic or inter-mediate argillic alteration (path C, fig. I3). Consequently, the normal upward progression in early, high-temperature stages is from deep potassic alteration to shallow advanced argillic alteration with copper-gold dominantly transported by both
the brine and vapor phases and precipitated as sulfides in both environments. Depending on the temperature regime, sericitic alteration may occupy an intermediate position.
The second element is a decrease of temperature and pressure of fluid derived from the magma chamber below any given depth as a function of time. This likely arises because the granitoid body is crystallizing downward as it provides magmatic volatiles to the ore fluid, which ascends and reaches the ore zone and overlying near-surface environment by following a pressure-temperature path at lower temperature at any given depth. In this case, the ascending fluids often do not unmix into brine and vapor phases but rather remain a single phase fluid. Ascent of this fluid typically produces weak potassic alteration below the level of the orebody (compare, Ann-Mason, Dilles and Einaudi, 1992) and sericitic alteration, and in some cases, tourmaline breccia in the orebody and at higher levels. This sericitic alteration follows D-style sulfide-quartz veins and sometimes faults and produces the universal observations that late D veins and sericitic alteration zones cut earlier potassic alteration zones in PCD orebodies (figs. I2B, I2C; Gustafson and Hunt, 1975; Seedorff and others, 2005). The last input magmatic-hydrothermal fluids are at even lower temperatures at the level of the orebody and sometimes produce widespread weak intermediate argillic alteration at
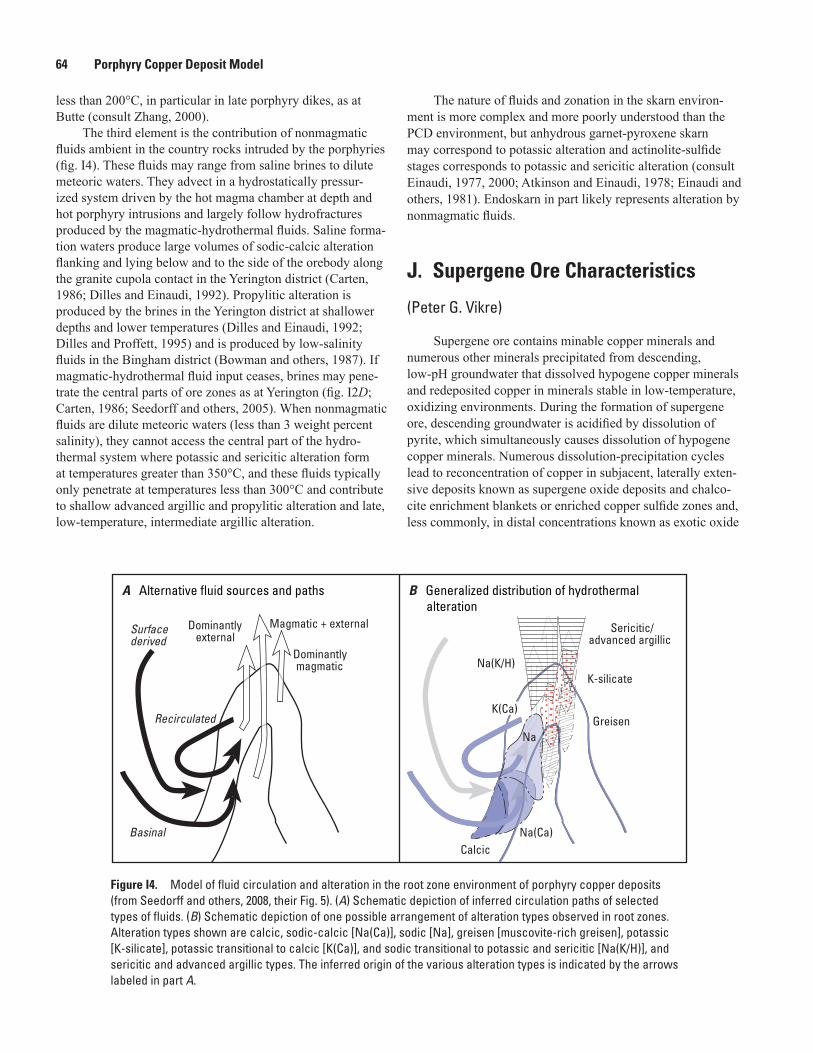
Dominantlymagmatic
Magmatic + externalDominantlyexternal
Surfacederived
Recirculated
Basinal
m Sericitic/advanced argillic
K-silicate
Greisen
CalcicNa(Ca)
Na
Na(K/H)
K(Ca)
B Generalized distribution of hydrothermal alteration
A Alternative fluid sources and paths
Figure I4. Model of fluid circulation and alteration in the root zone environment of porphyry copper deposits (from Seedorff and others, 2008, their Fig. 5). (A) Schematic depiction of inferred circulation paths of selected types of fluids. (B) Schematic depiction of one possible arrangement of alteration types observed in root zones. Alteration types shown are calcic, sodic-calcic [Na(Ca)], sodic [Na], greisen [muscovite-rich greisen], potassic [K-silicate], potassic transitional to calcic [K(Ca)], and sodic transitional to potassic and sericitic [Na(K/H)], and sericitic and advanced argillic types. The inferred origin of the various alteration types is indicated by the arrows labeled in part A.
64 Porphyry Copper Deposit Model
less than 200°C, in particular in late porphyry dikes, as at Butte (consult Zhang, 2000).
The third element is the contribution of nonmagmatic fluids ambient in the country rocks intruded by the porphyries (fig. I4). These fluids may range from saline brines to dilute meteoric waters. They advect in a hydrostatically pressur-ized system driven by the hot magma chamber at depth and hot porphyry intrusions and largely follow hydrofractures produced by the magmatic-hydrothermal fluids. Saline forma-tion waters produce large volumes of sodic-calcic alteration flanking and lying below and to the side of the orebody along the granite cupola contact in the Yerington district (Carten, 1986; Dilles and Einaudi, 1992). Propylitic alteration is produced by the brines in the Yerington district at shallower depths and lower temperatures (Dilles and Einaudi, 1992; Dilles and Proffett, 1995) and is produced by low-salinity fluids in the Bingham district (Bowman and others, 1987). If magmatic-hydrothermal fluid input ceases, brines may pene-trate the central parts of ore zones as at Yerington (fig. I2D; Carten, 1986; Seedorff and others, 2005). When nonmagmatic fluids are dilute meteoric waters (less than 3 weight percent salinity), they cannot access the central part of the hydro-thermal system where potassic and sericitic alteration form at temperatures greater than 350°C, and these fluids typically only penetrate at temperatures less than 300°C and contribute to shallow advanced argillic and propylitic alteration and late, low-temperature, intermediate argillic alteration.
The nature of fluids and zonation in the skarn environ-ment is more complex and more poorly understood than the PCD environment, but anhydrous garnet-pyroxene skarn may correspond to potassic alteration and actinolite-sulfide stages corresponds to potassic and sericitic alteration (consult Einaudi, 1977, 2000; Atkinson and Einaudi, 1978; Einaudi and others, 1981). Endoskarn in part likely represents alteration by nonmagmatic fluids.
J. Supergene Ore Characteristics
(Peter G. Vikre)
Supergene ore contains minable copper minerals and numerous other minerals precipitated from descending, low-pH groundwater that dissolved hypogene copper minerals and redeposited copper in minerals stable in low-temperature, oxidizing environments. During the formation of supergene ore, descending groundwater is acidified by dissolution of pyrite, which simultaneously causes dissolution of hypogene copper minerals. Numerous dissolution-precipitation cycles lead to reconcentration of copper in subjacent, laterally exten-sive deposits known as supergene oxide deposits and chalco-cite enrichment blankets or enriched copper sulfide zones and, less commonly, in distal concentrations known as exotic oxide
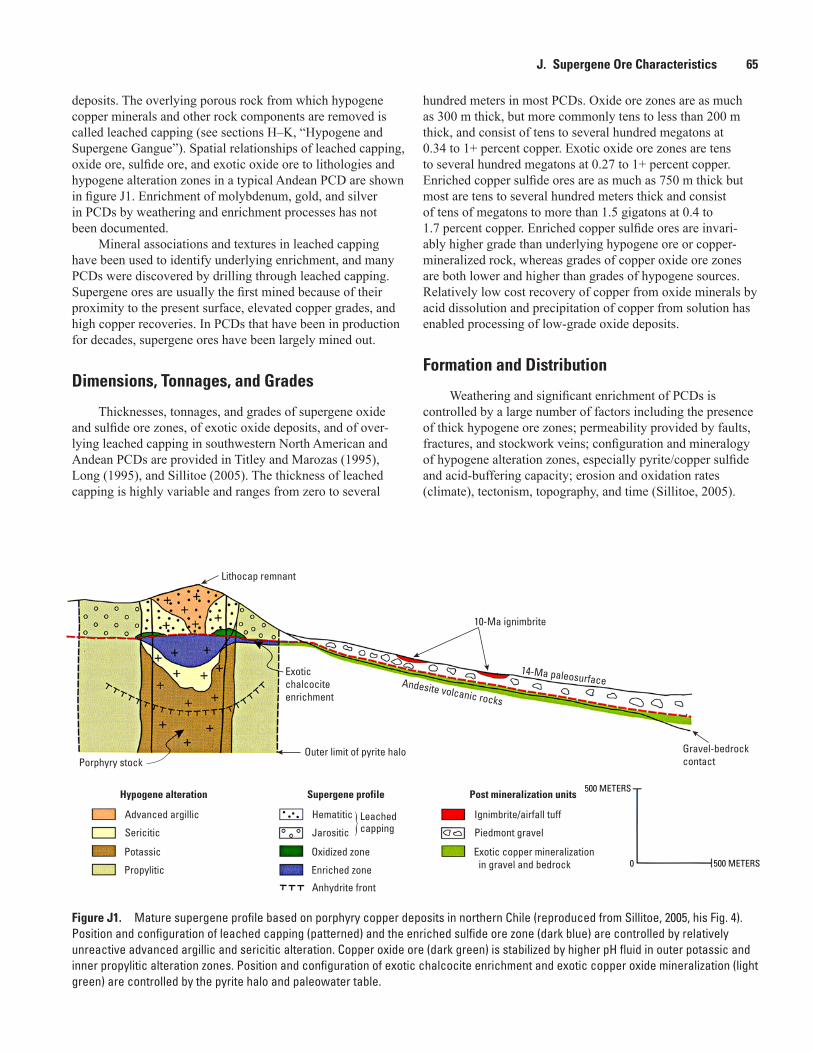
Figure J1. Mature supergene profile based on porphyry copper deposits in northern Chile (reproduced from Sillitoe, 2005, his Fig. 4). Position and configuration of leached capping (patterned) and the enriched sulfide ore zone (dark blue) are controlled by relatively unreactive advanced argillic and sericitic alteration. Copper oxide ore (dark green) is stabilized by higher pH fluid in outer potassic and inner propylitic alteration zones. Position and configuration of exotic chalcocite enrichment and exotic copper oxide mineralization (light green) are controlled by the pyrite halo and paleowater table.
Lithocap remnant
Exoticchalcociteenrichment
Outer limit of pyrite halo
10-Ma ignimbrite
14-Ma paleosurfaceAndesite volcanic rocks
Gravel-bedrockcontact
Hypogene alteration
Advanced argillic
Sericitic
Potassic
Propylitic
Post mineralization units
Ignimbrite/airfall tuff
Piedmont gravel
Exotic copper mineralization in gravel and bedrock
Anhydrite front
Supergene profile
Hematitic
Jarositic
Oxidized zone
Enriched zone
}Leachedcapping
Porphyry stock
500 METERS
500 METERS0
J. Supergene Ore Characteristics 65
deposits. The overlying porous rock from which hypogene copper minerals and other rock components are removed is called leached capping (see sections H–K, “Hypogene and Supergene Gangue”). Spatial relationships of leached capping, oxide ore, sulfide ore, and exotic oxide ore to lithologies and hypogene alteration zones in a typical Andean PCD are shown in figure J1. Enrichment of molybdenum, gold, and silver in PCDs by weathering and enrichment processes has not been documented.
Mineral associations and textures in leached capping have been used to identify underlying enrichment, and many PCDs were discovered by drilling through leached capping. Supergene ores are usually the first mined because of their proximity to the present surface, elevated copper grades, and high copper recoveries. In PCDs that have been in production for decades, supergene ores have been largely mined out.
Dimensions, Tonnages, and Grades
Thicknesses, tonnages, and grades of supergene oxide and sulfide ore zones, of exotic oxide deposits, and of over-lying leached capping in southwestern North American and Andean PCDs are provided in Titley and Marozas (1995), Long (1995), and Sillitoe (2005). The thickness of leached capping is highly variable and ranges from zero to several
hundred meters in most PCDs. Oxide ore zones are as much as 300 m thick, but more commonly tens to less than 200 m thick, and consist of tens to several hundred megatons at 0.34 to 1+ percent copper. Exotic oxide ore zones are tens to several hundred megatons at 0.27 to 1+ percent copper. Enriched copper sulfide ores are as much as 750 m thick but most are tens to several hundred meters thick and consist of tens of megatons to more than 1.5 gigatons at 0.4 to 1.7 percent copper. Enriched copper sulfide ores are invari-ably higher grade than underlying hypogene ore or copper-mineralized rock, whereas grades of copper oxide ore zones are both lower and higher than grades of hypogene sources. Relatively low cost recovery of copper from oxide minerals by acid dissolution and precipitation of copper from solution has enabled processing of low-grade oxide deposits.
Formation and Distribution
Weathering and significant enrichment of PCDs is controlled by a large number of factors including the presence of thick hypogene ore zones; permeability provided by faults, fractures, and stockwork veins; configuration and mineralogy of hypogene alteration zones, especially pyrite/copper sulfide and acid-buffering capacity; erosion and oxidation rates (climate), tectonism, topography, and time (Sillitoe, 2005).
66 Porphyry Copper Deposit Model
Changing chemical conditions produce disequilibrium mineral associations and metastable phases in complex paragenetic relationships. Processes involved in weathering and copper enrichment of PCDs are described by Sillitoe (2005), Titley and Marozas (1995), and Anderson (1982).
Leached capping may enclose zones of copper oxide minerals, but most nonexotic copper oxide ore zones are immediately above zones of sulfide enrichment. Copper oxide ore developed over hypogene ore or copper-mineralized rocks with low pyrite concentrations tend to be relatively uniform vertically and grade laterally into leached capping over pyrite haloes (fig. J1; Sillitoe, 2005). Copper oxide ore in or above enriched copper sulfide zones developed over hypogene ore or copper-mineralized rocks with pyrite/copper sulfides on the order of 5/1 are usually small and discontinuous both verti-cally and laterally and confined to lenses at the base of leached capping (Sillitoe, 2005).
Enriched copper sulfide ore is best developed above hypogene ore or copper-mineralized rocks that contain about 5 times as much pyrite as copper sulfide minerals. Copper grades of enriched copper sulfide zones are up to 3 times those of underlying hypogene ore or copper-mineralized rock in Andean PCDs (Sillitoe, 2005). Enrichment factors in some southwestern North American PCDs approach 8, based on hypogene ore grades of 0.07 to 0.6 percent copper and enrich-ment ore grades 0.34 to 1.12 percent copper, and pyrite/chal-copyrite in hypogene ore that varies from about 3 to more than 10 (Titley and Marozas, 1995).
Mineralogy
Common copper minerals in oxide ores include brochan-tite, copper pitch, cuprite, native copper, tenorite, chrysocolla, neotocite, malachite, and atacamite; numerous other copper carbonate, oxide, silicate, and sulfate minerals have been identified (table G1). Copper in exotic oxide deposits is mostly in chrysocolla, wad, and atacamite (Sillitoe, 2005). Oxide ore mineralogy is largely controlled by fluid pH, which is in turn controlled by pyrite/copper sulfide minerals in hypogene ore or copper-mineralized rock, or supergene ore, and by acid neutralization capacity of host rocks (Sillitoe, 2005).
Copper in enriched sulfide ore is mostly in chalcocite; lesser copper is derived from covellite and CuxSy minerals. Mixed oxide-sulfide ores containing combinations of copper oxide and sulfide minerals occur in some in PCDs. As a group, supergene copper minerals are reported in recent compilations from fewer deposits than hypogene copper minerals (Singer and others, 2002; table G1), reflecting maturity of operating mines and infrequent discovery of enriched deposits. Ferri-molybdite is the common molybdenum mineral in copper oxide ores and leached capping; forms of gold and silver in PCDs have not been determined.
Mineral Associations and Assemblages
Supergene ore mostly consists of hypogene and super-gene gangue minerals (greater than 98 percent); supergene ore and gangue mineral associations and assemblages are described in sections H–K, “Hypogene and Supergene Gangue Characteristics.”
Textures and Grain Size
Copper oxide ore minerals occur mostly in crystalline aggregates that fill fractures and line vugs and pockets in leached capping, or are finely distributed in alteration and primary minerals in supergene copper sulfide ore, and less often in hypogene ore or copper-mineralized rock. Copper oxide minerals locally display colloform texture (chryso-colla, malachite) and form collectible euhedrons in vugs and leached pockets. Grain sizes vary highly from micrometers to centimeters.
Textures and grains sizes in enriched sulfide ore closely resemble those of the hypogene ore on which enrichment has been superimposed in that distribution, and sites of supergene copper sulfide minerals largely mimic those of hypogene pyrite and copper sulfide minerals. Supergene chalcocite, and lesser covellite and CuxSy minerals, occur in several textural forms including: (1) partial replacement of disseminated and vein pyrite,
chalcopyrite, and other copper sulfide minerals by chal-cocite rims and internal fractures filled with chalcocite; partial replacement is characteristic of the lower parts of enrichment zones where they grade into hypogene ore or copper-mineralized rock; and
(2) complete replacement of disseminated and vein pyrite by chalcocite in mature and upper parts of enrichment zones.Chalcocite grain size and appearance vary from sooty
black microcrystalline aggregates to fine-grained (sub-millimeter to millimeter) steel-gray crystalline aggregates. Chalcocite form may reflect depth and aging (Sillitoe, 2005).
L. Weathering/Supergene Processes
(Floyd Gray)
Introduction
Weathering, resulting in oxidation and(or) supergene enrichment, is an important process in the economic viabil-ity of many porphyry copper deposits (for example, Sillitoe and McKee, 1996; Sillitoe, 2005). Supergene (secondary)
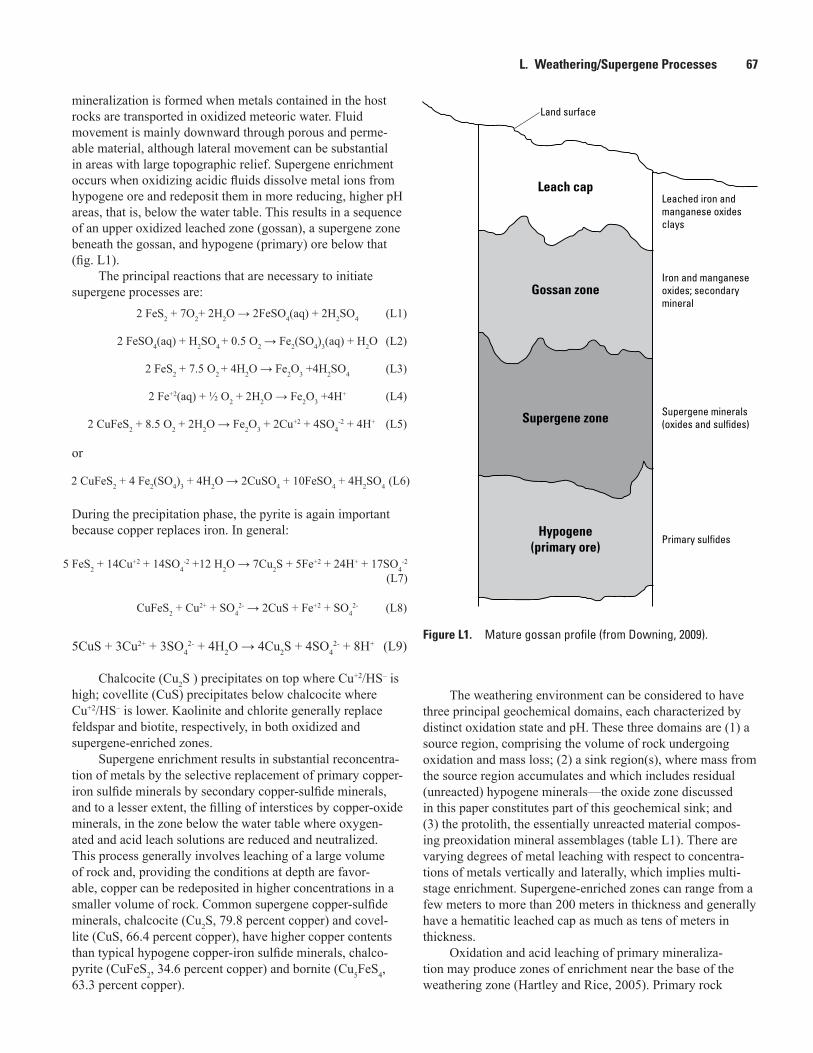
Gossan zone
Hypogene(primary ore)
Supergene zone
Land surface
Iron and manganese oxides; secondarymineral
Leached iron and manganese oxidesclays
Supergene minerals(oxides and sulfides)
Primary sulfides
Leach cap
Figure L1. Mature gossan profile (from Downing, 2009).
L. Weathering/Supergene Processes 67
mineralization is formed when metals contained in the host rocks are transported in oxidized meteoric water. Fluid movement is mainly downward through porous and perme-able material, although lateral movement can be substantial in areas with large topographic relief. Supergene enrichment occurs when oxidizing acidic fluids dissolve metal ions from hypogene ore and redeposit them in more reducing, higher pH areas, that is, below the water table. This results in a sequence of an upper oxidized leached zone (gossan), a supergene zone beneath the gossan, and hypogene (primary) ore below that (fig. L1).
The principal reactions that are necessary to initiate supergene processes are: 2 FeS2 + 7O2+ 2H2O → 2FeSO4(aq) + 2H2SO4 (L1)
2 FeSO4(aq) + H2SO4 + 0.5 O2 → Fe2(SO4)3(aq) + H2O (L2)
2 FeS2 + 7.5 O2 + 4H2O → Fe2O3 +4H2SO4 (L3)
2 Fe+2(aq) + ½ O2 + 2H2O → Fe2O3 +4H+ (L4)
2 CuFeS2 + 8.5 O2 + 2H2O → Fe2O3 + 2Cu+2 + 4SO4-2 + 4H+ (L5)
or
The weathering environment can be considered to have three principal geochemical domains, each characterized by distinct oxidation state and pH. These three domains are (1) a source region, comprising the volume of rock undergoing oxidation and mass loss; (2) a sink region(s), where mass from the source region accumulates and which includes residual (unreacted) hypogene minerals—the oxide zone discussed in this paper constitutes part of this geochemical sink; and (3) the protolith, the essentially unreacted material compos-ing preoxidation mineral assemblages (table L1). There are varying degrees of metal leaching with respect to concentra-tions of metals vertically and laterally, which implies multi-stage enrichment. Supergene-enriched zones can range from a few meters to more than 200 meters in thickness and generally have a hematitic leached cap as much as tens of meters in thickness.
Oxidation and acid leaching of primary mineraliza-tion may produce zones of enrichment near the base of the weathering zone (Hartley and Rice, 2005). Primary rock
2 CuFeS2 + 4 Fe2(SO4)3 + 4H2O → 2CuSO4 + 10FeSO4 + 4H2SO4 (L6)
During the precipitation phase, the pyrite is again important because copper replaces iron. In general:
5 FeS2 + 14Cu+2 + 14SO4-2 +12 H2O → 7Cu2S + 5Fe+2 + 24H+ + 17SO4
-2
(L7)
CuFeS2 + Cu2+ + SO42- → 2CuS + Fe+2 + SO4
2- (L8)
5CuS + 3Cu2+ + 3SO42- + 4H2O → 4Cu2S + 4SO4
2- + 8H+ (L9)
Chalcocite (Cu2S ) precipitates on top where Cu+2/HS– is high; covellite (CuS) precipitates below chalcocite where Cu+2/HS– is lower. Kaolinite and chlorite generally replace feldspar and biotite, respectively, in both oxidized and supergene-enriched zones.
Supergene enrichment results in substantial reconcentra-tion of metals by the selective replacement of primary copper-iron sulfide minerals by secondary copper-sulfide minerals, and to a lesser extent, the filling of interstices by copper-oxide minerals, in the zone below the water table where oxygen-ated and acid leach solutions are reduced and neutralized. This process generally involves leaching of a large volume of rock and, providing the conditions at depth are favor-able, copper can be redeposited in higher concentrations in a smaller volume of rock. Common supergene copper-sulfide minerals, chalcocite (Cu2S, 79.8 percent copper) and covel-lite (CuS, 66.4 percent copper), have higher copper contents than typical hypogene copper-iron sulfide minerals, chalco-pyrite (CuFeS2, 34.6 percent copper) and bornite (Cu5FeS4, 63.3 percent copper).
68 Porphyry Copper Deposit Model
composition and postmineralization hydrogeology, together with one or more cycles of uplift and(or) climate change, are important to the formation of an economically viable deposit. Prominent examples of oxidation and supergene enrichment include the deposits at Morenci, Arizona, and Chuquicamata and La Escondida, Chile. Like hypogene profiles, the devel-opment of supergene profiles is progressive and involves multiple stages. Supergene histories typically involve long time periods and multiple weathering environments.
Mineralogy
The mineralogy of weathered deposits has been discussed in detail by Anderson (1982), Alpers and Brimhall (1989), Chavez (2000), and Sillitoe (2005). Common minerals in strongly leached rocks, referred to as “leached caps,” include goethite, jarosite, hematite, gypsum, alunite, and kaolinite. Supergene and oxide minerals include malachite, azurite, chrysocolla, neotocite, cuprite, chalco cite, covellite, djurleite, digenite, anilite, and idaite. Chavez (2000) provides a more complete listing of minerals in the oxide zones as shown in table L2.
Cook (1988) described copper-bearing mineral assem-blages at the Lake shore mine in Arizona, as follows: chalco-cite zone, brochantite zone, chrysocolla zone, copper wad zone, and goethite zone. These zones do not form distinct horizons but occur throughout the supergene orebodies.
The geochemistry is reflective of the oxide mineral assemblage; thus, its complexity depends on the complexity of the assemblage mix. For example, in a profile across the goethite, chrysocolla, and chalcocite zones at Lakeshore, Cook (1988) found SiO2, Al2O3, MgO, and Na2O to be depleted in all three zones, but the amount of SiO2 depletion is a func-tion of the copper content. The silica depletion reflected the amount of chrysocolla present; that is, the greatest depletion was in the goethite zone. The ratio of Fe+3 to Fe+2 increased, but the total iron concentration did not. Calcium was depleted in the goethite zone, but gypsum was present in the chalcocite zone. Copper oxide was enriched across the whole profile. For additional discussion, the reader is referred to Anderson (1982), Alpers and Brimhall (1989), Chávez (2000), and Sillitoe (2005).
Rates
A detailed understanding of the importance of multiple weathering cycles and weathering rates requires careful petro-graphic study and detailed age information. Although analyti-cal methods such as 40Ar/39Ar dating have been applied to the problem, great care in sampling, sample preparation and analysis, and data interpretation is required to obtain meaning-ful results. Growth bands indicative of multiple depositional events often can only be documented as a period during which oxidation took place but may not yield rates of weathering (for example, Mote and others, 2001). At El Salvador, Chile, Mote
and others (2001) found weathering to have begun within 6 m.y. (about 36–35 Ma) from the end of hypogene mineral-ization at about 41 Ma. They identified mul tiple supergene events at 35 Ma, 25 Ma, 14 Ma, and 11 Ma. Mote and others (2001) concluded that the supergene events were driven by regional to global climatological events, including global climate change near the Eocene-Oligocene boundary. Sillitoe (2005) provides additional discussion of weathering rates.
Effects of Micro and Macro Climates
Supergene sulfide enrichment processes, once thought to take place primarily in arid climates, are now known to take place in a range of climates spanning tropical to arid condi-tions (Titley, 1978). In fact, supergene processes have been shown to occur in the hyperarid climate typical of the present-day Atacama Desert in Chile (Reich and others, 2009). The critical factor is sufficient permeability to allow water circula-tion. Research suggests that the effects of climatic cycles may be a principal factor in supergene processes. Alternate wetting and drying cycles, either seasonally or over longer time periods, may be the primary cause for water-table fluctuations that result in downward movement of copper into redeposi-tional zones.
Effects of Hydrologic Setting
Supergene processes are facilitated when hypogene ore or protore is uplifted and exposed to oxidative weathering in a relatively stable semiarid climate, and typically, under some-what stable and subhorizontal landform conditions (Mortimer, 1973; Alpers and Brimhall, 1989). Therefore, the complexly intertwined climatic conditions, tectonically induced uplift and resultant erosional events, and geomorphologic relationships are all basic to the metallogeny of supergene mineralization in an environment such as the Andes and the Southwestern United States. As an example, supergene enrichment processes in the central Andes reached a maximum development state in the late Oligocene and early to middle Miocene due to a combination of episodic uplift of the Cordillera Occiden-tal and a prevailing semiarid climate. Precipitation for this period, inferred to be 10 cm/year or more, permitted signifi-cant circulation of meteoric water through the higher regions of the exposed ore deposits but also favored the formation of subhorizontal pediments and open valleys (Clark and others, 1990).
Precipitation, infiltrating through the soil and the unsatu-rated zone, reaches the water table to recharge the groundwater reservoir. Within the unsaturated zone and the saturated zone below, the groundwater flow pattern is governed by undula-tions in topography (geometry), by spatial variations of perme-ability (heterogeneity), and by climate (boundary condition). The result is that flow is vertically organized into local (or shallow), intermediate, and deep.
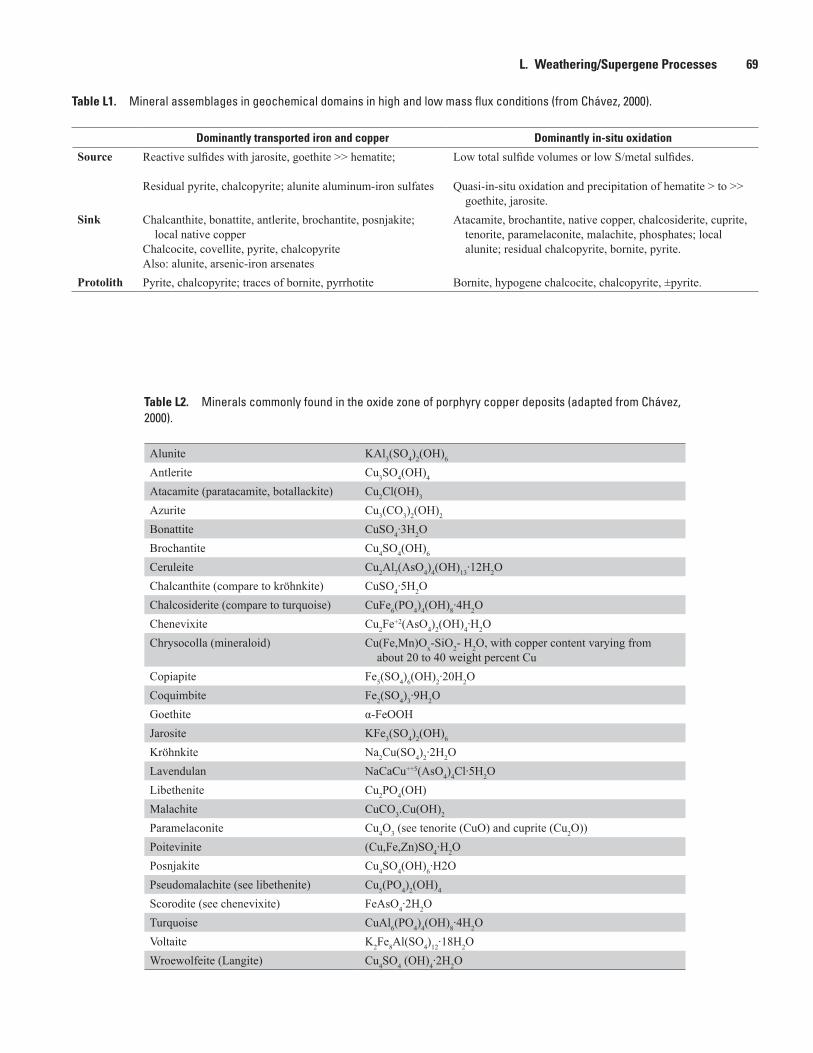
Table L1. Mineral assemblages in geochemical domains in high and low mass flux conditions (from Chávez, 2000).
Dominantly transported iron and copper Dominantly in-situ oxidation
Source Reactive sulfides with jarosite, goethite >> hematite;
Residual pyrite, chalcopyrite; alunite aluminum-iron sulfates
Low total sulfide volumes or low S/metal sulfides.
Quasi-in-situ oxidation and precipitation of hematite > to >> goethite, jarosite.
Sink Chalcanthite, bonattite, antlerite, brochantite, posnjakite; local native copper
Chalcocite, covellite, pyrite, chalcopyriteAlso: alunite, arsenic-iron arsenates
Atacamite, brochantite, native copper, chalcosiderite, cuprite, tenorite, paramelaconite, malachite, phosphates; local alunite; residual chalcopyrite, bornite, pyrite.
Protolith Pyrite, chalcopyrite; traces of bornite, pyrrhotite Bornite, hypogene chalcocite, chalcopyrite, ±pyrite.
Table L2. Minerals commonly found in the oxide zone of porphyry copper deposits (adapted from Chávez, 2000).
Alunite KAl3(SO4)2(OH)6
Antlerite Cu3SO4(OH)4
Atacamite (paratacamite, botallackite) Cu2Cl(OH)3
Azurite Cu3(CO3)2(OH)2
Bonattite CuSO4·3H2OBrochantite Cu4SO4(OH)6
Ceruleite Cu2Al7(AsO4)4(OH)13·12H2OChalcanthite (compare to kröhnkite) CuSO4·5H2OChalcosiderite (compare to turquoise) CuFe6(PO4)4(OH)8·4H2OChenevixite Cu2Fe+2(AsO4)2(OH)4·H2OChrysocolla (mineraloid) Cu(Fe,Mn)Ox-SiO2- H2O, with copper content varying from
about 20 to 40 weight percent CuCopiapite Fe5(SO4)6(OH)2·20H2OCoquimbite Fe2(SO4)3·9H2OGoethite α-FeOOHJarosite KFe3(SO4)2(OH)6
Kröhnkite Na2Cu(SO4)2·2H2OLavendulan NaCaCu++5(AsO4)4Cl·5H2OLibethenite Cu2PO4(OH)Malachite CuCO3.Cu(OH)2
Paramelaconite Cu4O3 (see tenorite (CuO) and cuprite (Cu2O))Poitevinite (Cu,Fe,Zn)SO4·H2OPosnjakite Cu4SO4(OH)6·H2OPseudomalachite (see libethenite) Cu5(PO4)2(OH)4
Scorodite (see chenevixite) FeAsO4·2H2OTurquoise CuAl6(PO4)4(OH)8·4H2OVoltaite K2Fe8Al(SO4)12·18H2OWroewolfeite (Langite) Cu4SO4 (OH)4·2H2O
L. Weathering/Supergene Processes 69
70 Porphyry Copper Deposit Model
M. Geochemical Characteristics
(Peter G. Vikre, Robert A. Ayuso, and Robert J. Bodnar)
Geochemical characteristics of porphyry copper deposits result from a large number of physical and chemical processes including magma generation, differentiation, emplacement, and degassing; high-temperature reactions between degassed fluids, crystallized intrusions, wall rocks, and meteoric water; and near-surface reactions between low-temperature meteoric water and earlier formed, high-temperature minerals. Descrip-tion of geochemical characteristics can be categorized by the type of material analyzed and analytic strategy: (1) litho-chemistry of host rocks, (2) minor-element zoning patterns, (3) mineral compositions, and (4) fluid compositions.
Lithochemistry
(Peter G. Vikre)
Major-oxide and minor-element compositions of premin-eralization, mineralized, and postmineralization rocks have been determined for many individual porphyry copper depos-its and districts. These whole-rock data have been collected mainly by mining companies for exploration and mining applications, and most analyses are unpublished. Applications include discrimination of altered from unaltered host rocks and distinguishing mineralized from unmineralized intru-sions. In a recent investigation, gradients (vectors) to known deposits in different host rocks at the Collahuasi group of porphyry copper-molybdenum and epithermal copper-silver-gold deposits in Chile were defined by alteration indices (modified Pearce element ratio analysis), a method that uses ratios of major (calcium, sodium, potassium) and conserva-tive (relatively immobile) elements (zirconium, titanium, and aluminum; for example, K/Al) to quantify metasomatism in host rocks (Urqueta and others, 2009; fig. M1). Alteration index vectors are defined in figure M1 by distal “cool” colors (blue tones=unaltered rocks), medial “warmer” colors (green and yellow tones), and proximal “hot” colors (orange tones and red-filled circles at deposit sites). These vectors demon-strate that lithochemistry can be effective in identification of resources in porphyry copper-molybdenum districts.
Lithogeochemistry also has been used within porphyry copper districts to determine mass gains and losses during alteration by comparison of whole-rock and minor-element abundances among altered and unaltered host rocks (figs. M2; M3). At Sar Cheshmeh, Iran (fig. M2; Hezarkhani, 2006), major components added to rocks during potassic altera-tion include Fe2O3, K2O, and Na2O; components removed include SiO2 and minor amounts of water. As a result of sericitic alteration, rocks gained SiO2 and lost TiO2, Al2O3, MgO, K2O, Na2O, and Cu. Sulfur was added to rocks during
both alteration events. At Bajo de la Alumbrera, Argentina, significantly elevated concentrations of Zn, Pb, Au, Cu, and W and significant depletions of Sr and Ba were detected in the potassic zone and in quartz-magnetite alteration. However, copper was strongly enriched only in the feldspar destructive zone where feldspar destructive alteration overprinted potas-sic alteration with preexisting copper mineralization. Elevated concentrations of zinc and tin and depletions in chromium, rubidium, strontium, and tungsten were found in chlorite-epidote altered rocks. Copper was found to be strongly enriched, and gold, strontium, and tungsten depleted in rocks characterized by feldspar destruction (Ulrich and Heinrich, 2002; fig. M3).
Very few regional comparisons of mineralized and unmineralized intrusions of similar ages are reported in the literature. In one investigation, analyses of 165 metaluminous and peraluminous Laramide granitoids (about 75–50 Ma) in southwestern North America revealed no significantly elevated copper or other metals (Mo, W, Sn, Pb, Zn, and Sb), indicat-ing no metal enrichment in lower crustal rocks from which these intrusions were derived (Haxel and others, 2003). The analyzed granitoids included both intrusions not known to be mineralized and unaltered samples of mineralized intrusions.
Minor Element Zoning Patterns
(Peter G. Vikre)
The spatial distribution of selected minor element compositions of PCDs, mainly copper, molybdenum, silver, and gold, have been routinely determined for decades at porphyry copper-molybdenum mines for grade control and mine planning. Analyses of these and other minor element abundances in rocks and rock derivatives (soils and sediments) also have been routinely used for decades in exploring for PCDs (for example, Chaffee, 1982a; 1982b). More recently, minor element and isotope analyses of surface water, ground-water, gases, and floras have become common components of geochemical exploration programs (for example, Leybourne, 2007). However, no systematic investigation of the temporal distribution of minor elements in PCDs has been published.
Vertical and lateral zoning patterns of minor elements in rock, including copper, molybdenum and gold, have been published for some PCDs. At Bingham, Utah, copper, gold, and molybdenum grade sections and plans show largely cospa-tial relationships, whereas at Bajo de la Alumbrera, copper and gold are largely cospatial, but the highest molybdenum grades approximately coincide with the outer, lower grade parts of the copper zone (Phillips and others, 1997; Ulrich and Heinrich, 2002; fig. M4). Detailed distribution of copper, molybdenum, and a large number of other elements in the PCDs at Red Mountain and San Manuel (Kalamazoo), Arizona, have been determined by analysis of drill core and cuttings (Chaffee, 1982b; written commun., 2009). At Kalamazoo, elevated concentrations of boron, barium, strontium, and lithium occur
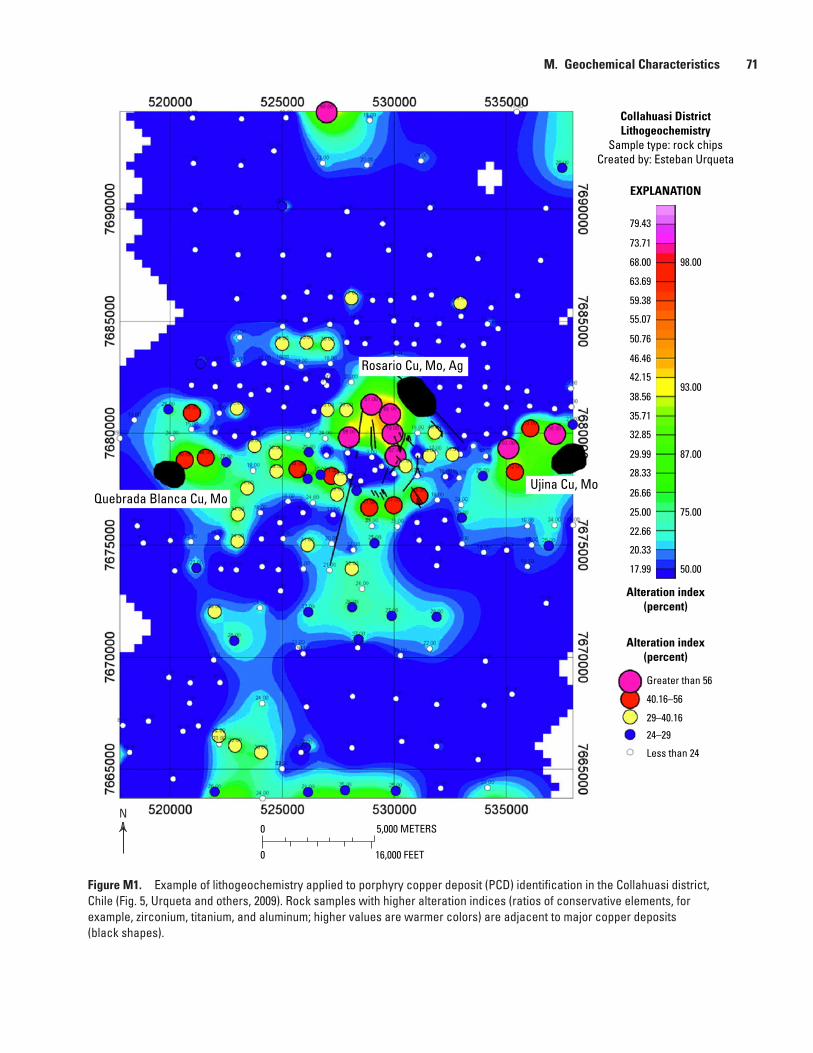
Figure M1. Example of lithogeochemistry applied to porphyry copper deposit (PCD) identification in the Collahuasi district, Chile (Fig. 5, Urqueta and others, 2009). Rock samples with higher alteration indices (ratios of conservative elements, for example, zirconium, titanium, and aluminum; higher values are warmer colors) are adjacent to major copper deposits (black shapes).
Ujina Cu, Mo
Rosario Cu, Mo, Ag
Alteration index(percent)
Alteration index(percent)
Quebrada Blanca Cu, Mo
79.43
73.71
68.00
63.69
59.38
55.07
50.76
46.46
42.15
38.56
35.71
32.85
29.99
28.33
26.66
25.00
22.66
20.33
17.99
98.00
93.00
87.00
75.00
50.00
Greater than 56
40.16–56
29–40.16
24–29
Less than 24
0 5,000 METERS
0 16,000 FEET
EXPLANATION
Collahuasi DistrictLithogeochemistry
Sample type: rock chipsCreated by: Esteban Urqueta
N
M. Geochemical Characteristics 71
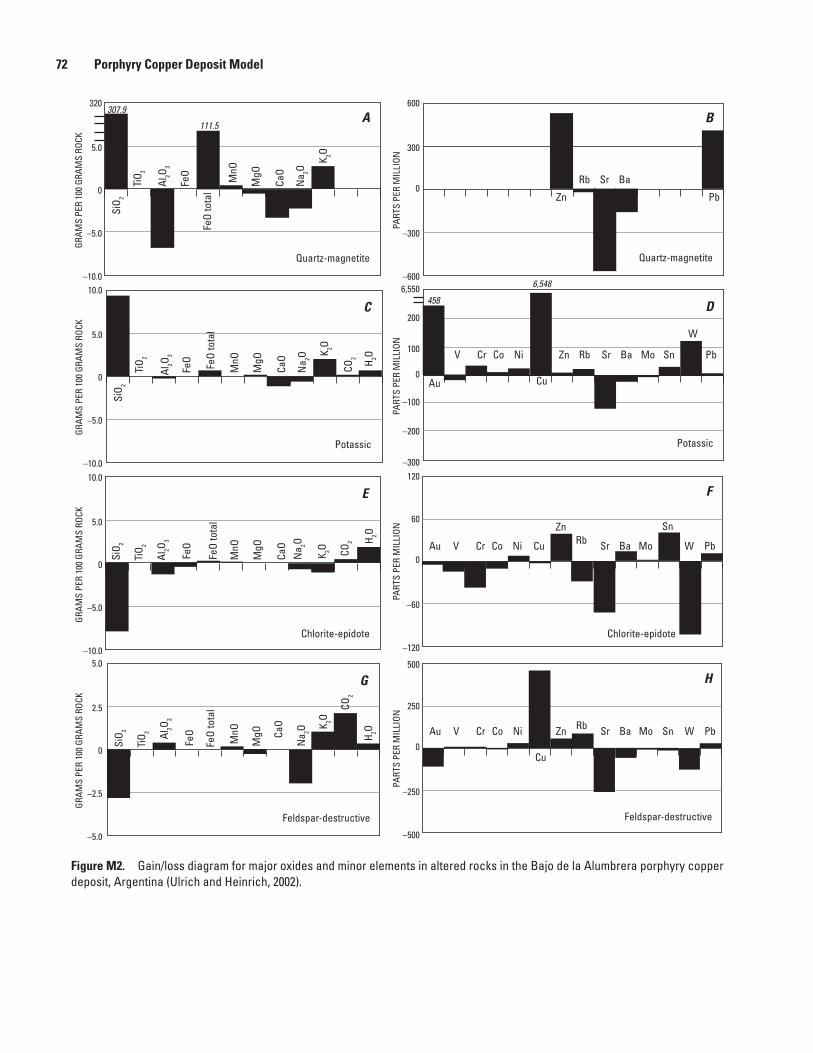
Figure M2. Gain/loss diagram for major oxides and minor elements in altered rocks in the Bajo de la Alumbrera porphyry copper deposit, Argentina (Ulrich and Heinrich, 2002).
A B
C D
E F
G H
TiO 2
Al2O 3
FeO
MgO
CaO
Na 2O
MnO
SiO 2
FeO
tota
l
K 2O
320
5.0
0
–5.0
–10.0
PART
S PE
R M
ILLI
ON
600
300
0
–300
–600
PART
S PE
R M
ILLI
ON
120
60
0
–60
–120
Quartz-magnetite Quartz-magnetite
TiO 2
FeO
MgO
CaO
Na 2O
MnO
SiO 2
K 2O
Potassic
Al2O 3
FeO
tota
l
CO2
H 2O
GRAM
S PE
R 10
0 GR
AMS
ROCK
10.0
5.0
0
–5.0
–10.0
PART
S PE
R M
ILLI
ON
6,550
200
100
0
–100
–300
–200Potassic
TiO 2
FeO
MgO
CaO
Na 2O
MnO
SiO 2
K 2O
Al2O 3
FeO
tota
l
CO2 H 2O
GRAM
S PE
R 10
0 GR
AMS
ROCK
10.0
5.0
0
–5.0
–10.0
GRAM
S PE
R 10
0 GR
AMS
ROCK
5.0
2.5
0
–2.5
–5.0
PART
S PE
R M
ILLI
ON
500
250
0
–250
–500
TiO 2
FeO
MgO Ca
O
Na 2O
MnO
SiO 2 K 2O
Al2O 3
FeO
tota
l CO2
H 2O
Chlorite-epidote Chlorite-epidote
Feldspar-destructive Feldspar-destructive
Au V Cr Co Ni Zn Sr Ba Mo Sn W Pb
Cu
Rb
Au V Cr Co Ni
Zn
Sr Ba Mo
Sn
W PbCu Rb
Au
V Cr Co Ni Zn Sr Ba Mo Sn
W
Pb
Cu
Rb
Zn
Sr Ba
Pb
Rb
GRAM
S PE
R 10
0 GR
AMS
ROCK
307.9
111.5
458
6,548
72 Porphyry Copper Deposit Model
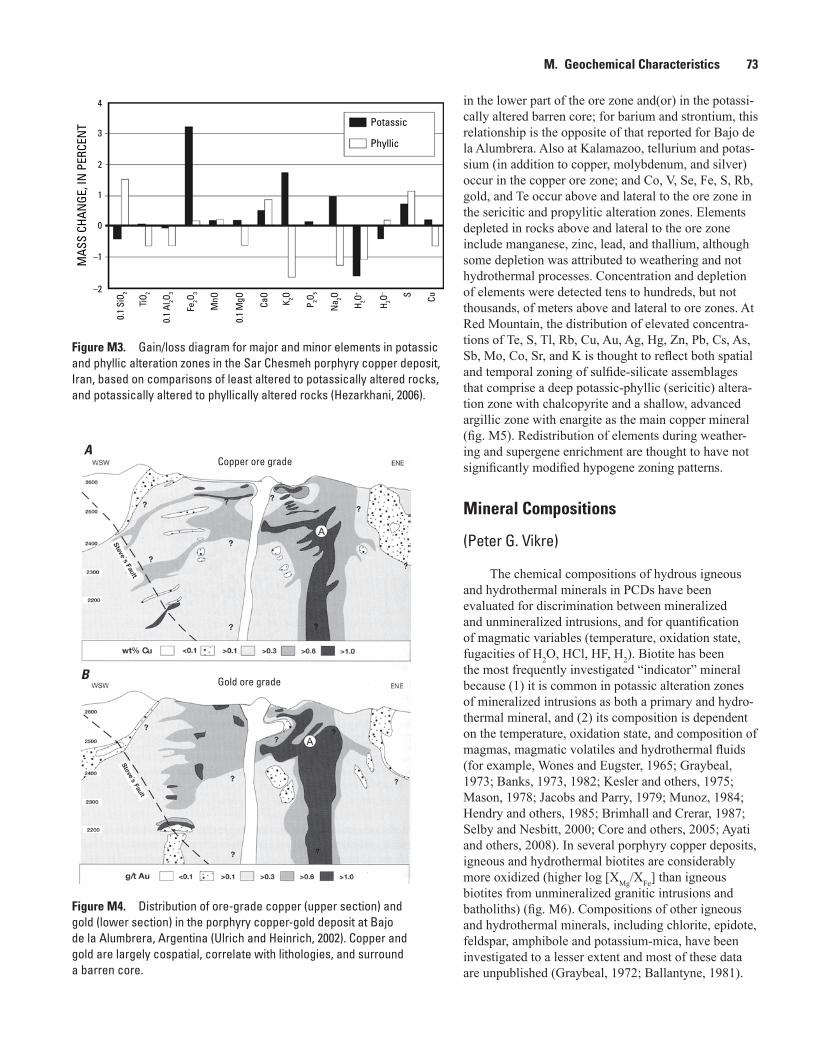
Figure M4. Distribution of ore-grade copper (upper section) and gold (lower section) in the porphyry copper-gold deposit at Bajo de la Alumbrera, Argentina (Ulrich and Heinrich, 2002). Copper and gold are largely cospatial, correlate with lithologies, and surround a barren core.
Figure M3. Gain/loss diagram for major and minor elements in potassic and phyllic alteration zones in the Sar Chesmeh porphyry copper deposit, Iran, based on comparisons of least altered to potassically altered rocks, and potassically altered to phyllically altered rocks (Hezarkhani, 2006).
MAS
S CH
ANGE
, IN
PER
CEN
T
–2
–1
0
1
2
3
4
0.1
SiO 2
TiO 2
0.1
Al2O 3
0.1
MgO
Fe2O 3
Na 2O
H 2O+
H 2O– S Cu
P 2O 5
K 2O
MnO Ca
O
Potassic
Phyllic
Copper ore grade
Gold ore grade
A
B
M. Geochemical Characteristics 73
in the lower part of the ore zone and(or) in the potassi-cally altered barren core; for barium and strontium, this relationship is the opposite of that reported for Bajo de la Alumbrera. Also at Kalamazoo, tellurium and potas-sium (in addition to copper, molybdenum, and silver) occur in the copper ore zone; and Co, V, Se, Fe, S, Rb, gold, and Te occur above and lateral to the ore zone in the sericitic and propylitic alteration zones. Elements depleted in rocks above and lateral to the ore zone include manganese, zinc, lead, and thallium, although some depletion was attributed to weathering and not hydrothermal processes. Concentration and depletion of elements were detected tens to hundreds, but not thousands, of meters above and lateral to ore zones. At Red Mountain, the distribution of elevated concentra-tions of Te, S, Tl, Rb, Cu, Au, Ag, Hg, Zn, Pb, Cs, As, Sb, Mo, Co, Sr, and K is thought to reflect both spatial and temporal zoning of sulfide-silicate assemblages that comprise a deep potassic-phyllic (sericitic) altera-tion zone with chalcopyrite and a shallow, advanced argillic zone with enargite as the main copper mineral (fig. M5). Redistribution of elements during weather-ing and supergene enrichment are thought to have not significantly modified hypogene zoning patterns.
Mineral Compositions
(Peter G. Vikre)
The chemical compositions of hydrous igneous and hydrothermal minerals in PCDs have been evaluated for discrimination between mineralized and unmineralized intrusions, and for quantification of magmatic variables (temperature, oxidation state, fugacities of H2O, HCl, HF, H2). Biotite has been the most frequently investigated “indicator” mineral because (1) it is common in potassic alteration zones of mineralized intrusions as both a primary and hydro-thermal mineral, and (2) its composition is dependent on the temperature, oxidation state, and composition of magmas, magmatic volatiles and hydrothermal fluids (for example, Wones and Eugster, 1965; Graybeal, 1973; Banks, 1973, 1982; Kesler and others, 1975; Mason, 1978; Jacobs and Parry, 1979; Munoz, 1984; Hendry and others, 1985; Brimhall and Crerar, 1987; Selby and Nesbitt, 2000; Core and others, 2005; Ayati and others, 2008). In several porphyry copper deposits, igneous and hydrothermal biotites are considerably more oxidized (higher log [XMg/XFe] than igneous biotites from unmineralized granitic intrusions and batholiths) (fig. M6). Compositions of other igneous and hydrothermal minerals, including chlorite, epidote, feldspar, amphibole and potassium-mica, have been investigated to a lesser extent and most of these data are unpublished (Graybeal, 1972; Ballantyne, 1981).
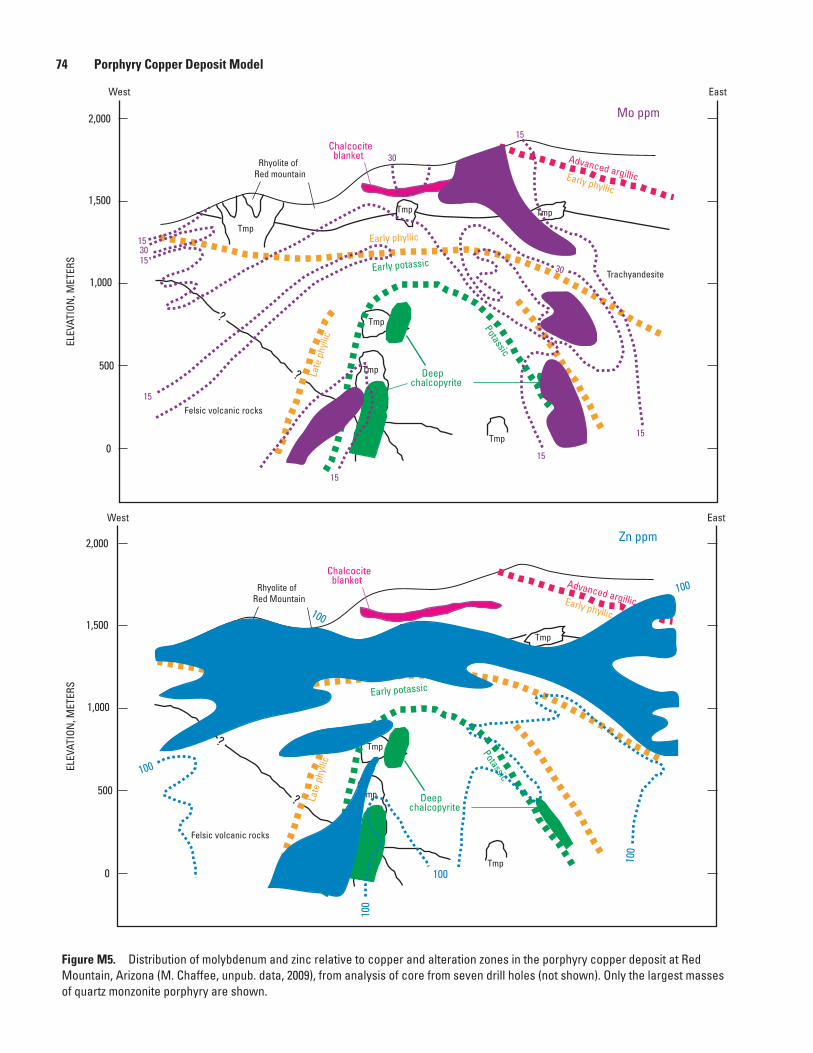
2,000
500
1,000
1,500
0
?
? Tmp
Tmp
TmpTmp
Tmp
Tmp
Rhyolite ofRed Mountain
Trachyandesite
Felsic volcanic rocks
PotassicLa
te p
hylli
c
Chalcocite blanket
Deep chalcopyrite
Advanced argillic
Early potassic
Early phyllic
Early phyllic
500
500
500
100
100
100
100
100
100
Zn ppm
ELEV
ATIO
N, M
ETER
S
Felsic volcanic rocks
ELEV
ATIO
N, M
ETER
S
2,000
500
1,000
1,500
0
?
? Tmp
Tmp
TmpTmp
Tmp
Tmp
Rhyolite ofRed mountain
Trachyandesite
PotassicLa
te p
hylli
c
Chalcocite blanket
Deep chalcopyrite
Advanced argillic
Early potassic
Early phyllic
Early phyllic
15
50
15
15
50
15
1530
50
30
50
30
15
15
Mo ppm
West East
West East
Figure M5. Distribution of molybdenum and zinc relative to copper and alteration zones in the porphyry copper deposit at Red Mountain, Arizona (M. Chaffee, unpub. data, 2009), from analysis of core from seven drill holes (not shown). Only the largest masses of quartz monzonite porphyry are shown.
74 Porphyry Copper Deposit Model
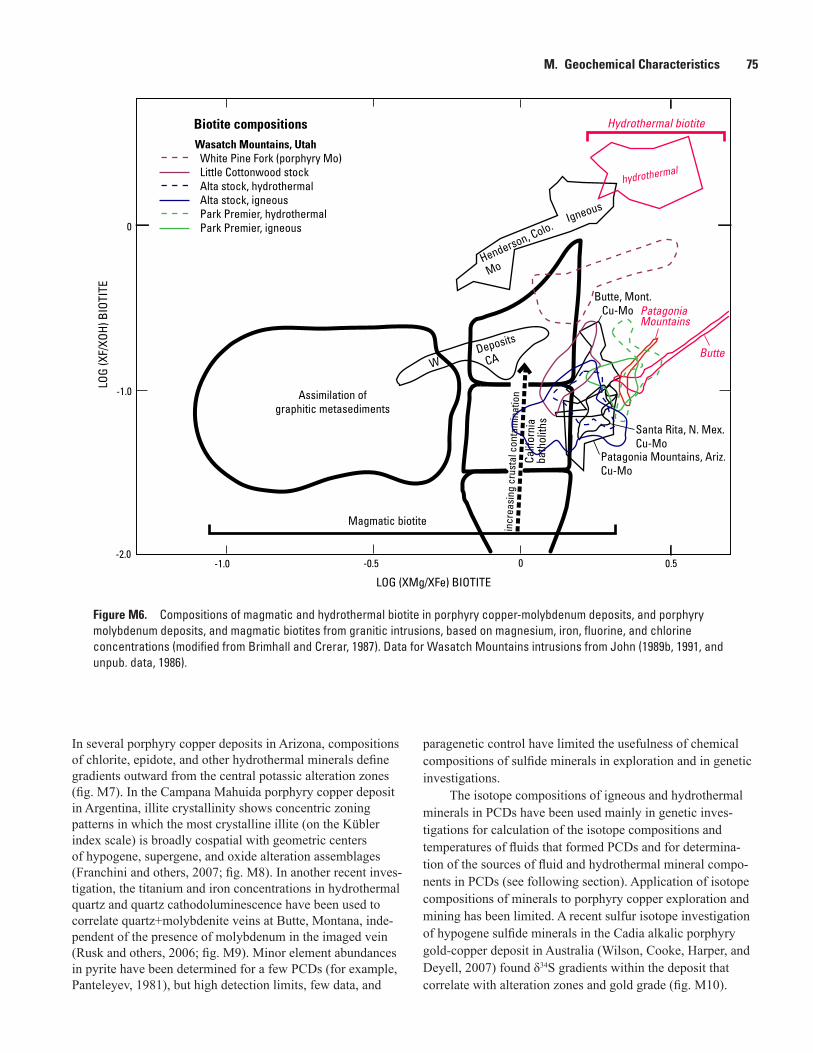
Figure M6. Compositions of magmatic and hydrothermal biotite in porphyry copper-molybdenum deposits, and porphyry molybdenum deposits, and magmatic biotites from granitic intrusions, based on magnesium, iron, fluorine, and chlorine concentrations (modified from Brimhall and Crerar, 1987). Data for Wasatch Mountains intrusions from John (1989b, 1991, and unpub. data, 1986).
LOG (XMg/XFe) BIOTITE
LOG
(XF/
XOH)
BIO
TITE
0
-1.0
-2.0-1.0 0-0.5 0.5
W Deposits
CA
Henderson, Colo.
Mo
hydrothermal
Igneous
Santa Rita, N. Mex.Cu-Mo
Butte, Mont. Cu-Mo
Calif
orni
aba
thol
iths
Assimilation of graphitic metasediments
incr
easi
ng c
rust
al c
onta
min
atio
n
Biotite compositions
Patagonia Mountains, Ariz.Cu-Mo
PatagoniaMountains
Butte
Magmatic biotite
Hydrothermal biotite
Wasatch Mountains, Utah White Pine Fork (porphyry Mo) Little Cottonwood stock Alta stock, hydrothermal Alta stock, igneous Park Premier, hydrothermal Park Premier, igneous
M. Geochemical Characteristics 75
In several porphyry copper deposits in Arizona, compositions of chlorite, epidote, and other hydrothermal minerals define gradients outward from the central potassic alteration zones (fig. M7). In the Campana Mahuida porphyry copper deposit in Argentina, illite crystallinity shows concentric zoning patterns in which the most crystalline illite (on the Kübler index scale) is broadly cospatial with geometric centers of hypogene, supergene, and oxide alteration assemblages (Franchini and others, 2007; fig. M8). In another recent inves-tigation, the titanium and iron concentrations in hydrothermal quartz and quartz cathodoluminescence have been used to correlate quartz+molybdenite veins at Butte, Montana, inde-pendent of the presence of molybdenum in the imaged vein (Rusk and others, 2006; fig. M9). Minor element abundances in pyrite have been determined for a few PCDs (for example, Panteleyev, 1981), but high detection limits, few data, and
paragenetic control have limited the usefulness of chemical compositions of sulfide minerals in exploration and in genetic investigations.
The isotope compositions of igneous and hydrothermal minerals in PCDs have been used mainly in genetic inves-tigations for calculation of the isotope compositions and temperatures of fluids that formed PCDs and for determina-tion of the sources of fluid and hydrothermal mineral compo-nents in PCDs (see following section). Application of isotope compositions of minerals to porphyry copper exploration and mining has been limited. A recent sulfur isotope investigation of hypogene sulfide minerals in the Cadia alkalic porphyry gold-copper deposit in Australia (Wilson, Cooke, Harper, and Deyell, 2007) found δ34S gradients within the deposit that correlate with alteration zones and gold grade (fig. M10).
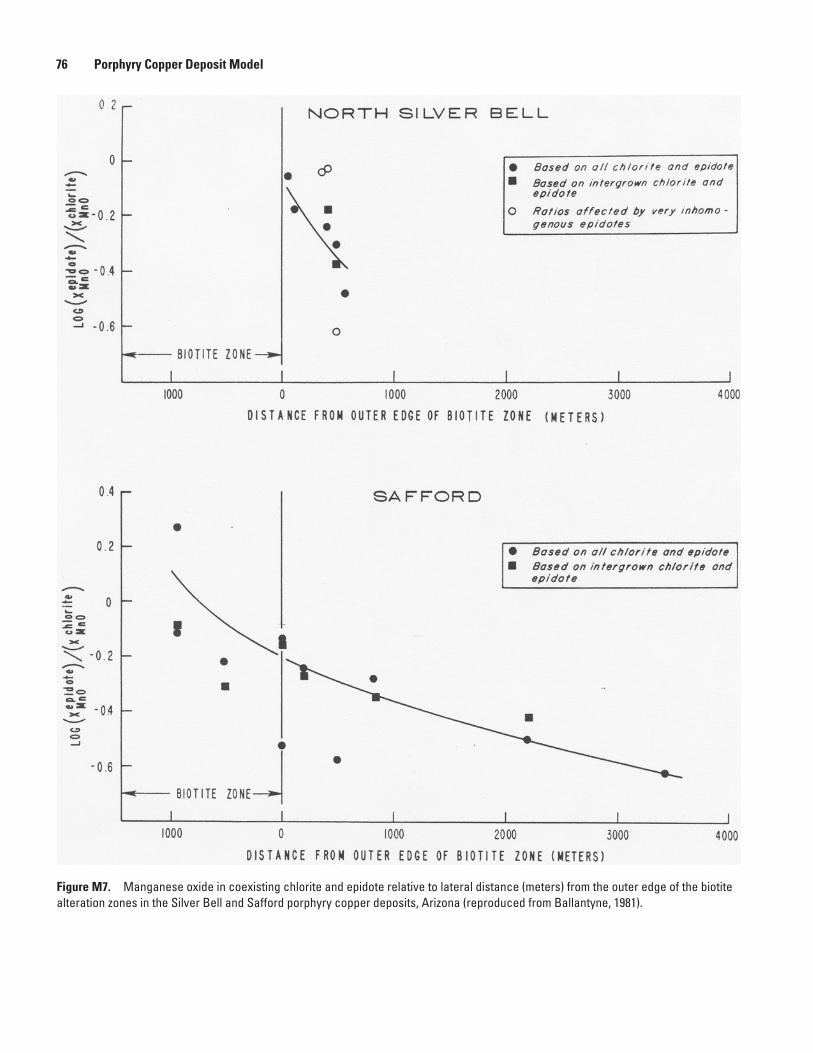
Figure M7. Manganese oxide in coexisting chlorite and epidote relative to lateral distance (meters) from the outer edge of the biotite alteration zones in the Silver Bell and Safford porphyry copper deposits, Arizona (reproduced from Ballantyne, 1981).
76 Porphyry Copper Deposit Model
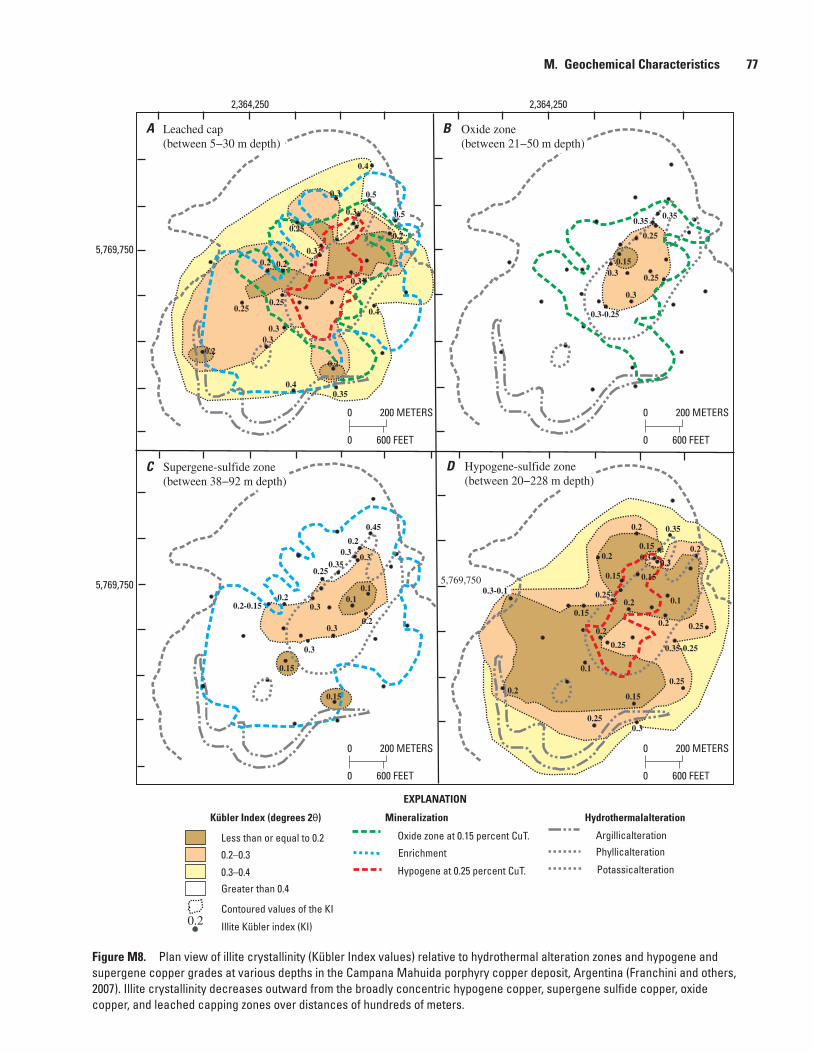
Figure M8. Plan view of illite crystallinity (Kübler Index values) relative to hydrothermal alteration zones and hypogene and supergene copper grades at various depths in the Campana Mahuida porphyry copper deposit, Argentina (Franchini and others, 2007). Illite crystallinity decreases outward from the broadly concentric hypogene copper, supergene sulfide copper, oxide copper, and leached capping zones over distances of hundreds of meters.
Potassicalteration
Phyllicalteration
Argillicalteration
Hydrothermalalteration
Hypogene at 0.25 percent CuT.
Enrichment
Mineralization
0.2 Illite Kübler index (KI)
Contoured values of the KI
Less than or equal to 0.2
Greater than 0.4
0.3–0.4
0.2–0.3
EXPLANATION
Oxide zone at 0.15 percent CuT.
Kübler Index (degrees 2θ)
0
0
200 METERS
600 FEET
0.3
0.2
0.250.25
0.35
0.3
0.3
0.30.3
0.4
0.4
0.20.2
0.350.2
0.2
0.15
0.25
0.25
0.35-0.25
0.25
0.2
0.2
0.10.25
0.1
0.2
0.25
0.15
5,769,750
5,769,750
0.3-0.25
0.3
0.25
0.150.3
0.35
5,769,7500.1
0.1
0.45
0.2-0.150.2
0.25
0.20.3
0.350.3
0.3
0.20.3
0.3
0.15
0.15
0.2
0.15
0.15
0.15
0.2
0.25
0.3
0.2
0.5
0.25
0.4
0.2
0.3-0.1
0.30.3
0.5 0.35
0.3
2,364,2502,364,250
Leached cap(between 5−30 m depth)
Supergene-sulfide zone(between 38−92 m depth)
Hypogene-sulfide zone(between 20−228 m depth)
Oxide zone(between 21−50 m depth)
A B
C D
0
0
200 METERS
600 FEET
0
0
200 METERS
600 FEET
0
0
200 METERS
600 FEET
M. Geochemical Characteristics 77
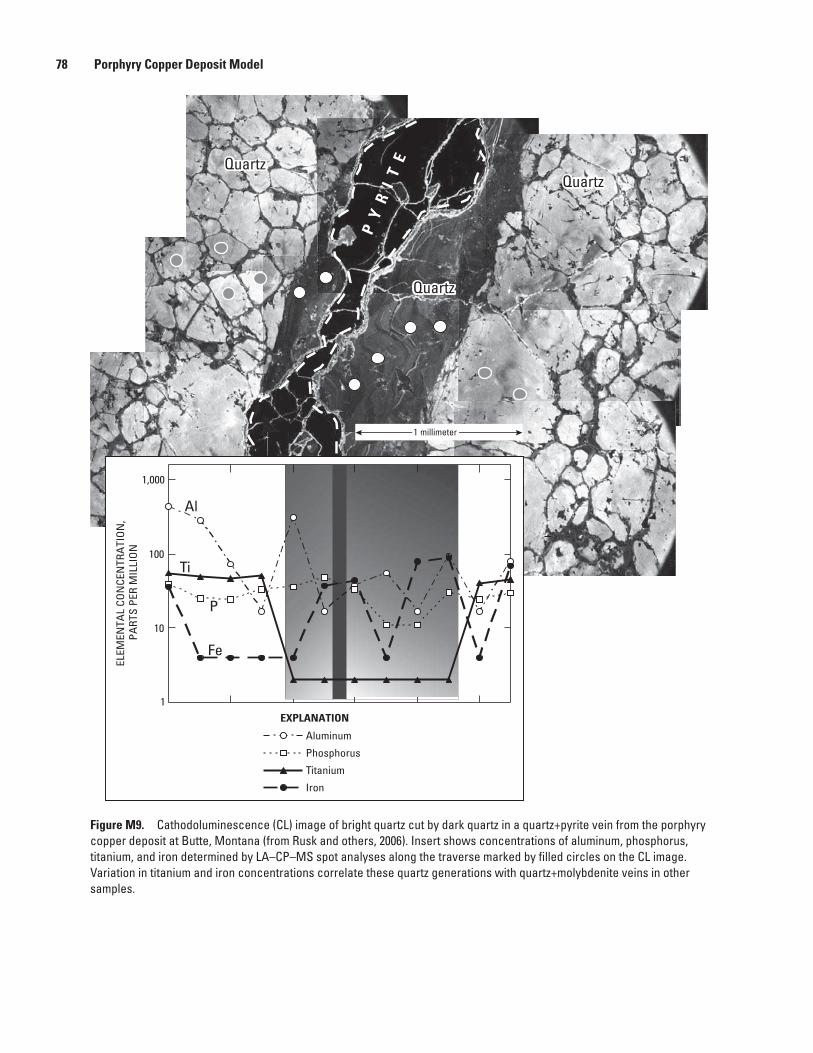
Figure M9. Cathodoluminescence (CL) image of bright quartz cut by dark quartz in a quartz+pyrite vein from the porphyry copper deposit at Butte, Montana (from Rusk and others, 2006). Insert shows concentrations of aluminum, phosphorus, titanium, and iron determined by LA–CP–MS spot analyses along the traverse marked by filled circles on the CL image. Variation in titanium and iron concentrations correlate these quartz generations with quartz+molybdenite veins in other samples.
PY
RI
TE
Quartz
QuartzQuartz
Quartz
QuartzQuartz
1
10
100
1,000
Aluminum
EXPLANATION
Phosphorus
Titanium
Iron
Al
P
Ti
Fe
ELEM
ENTA
L CO
NCE
NTR
ATI
ON
, PA
RTS
PER
MIL
LIO
N
1 millimeter
78 Porphyry Copper Deposit Model
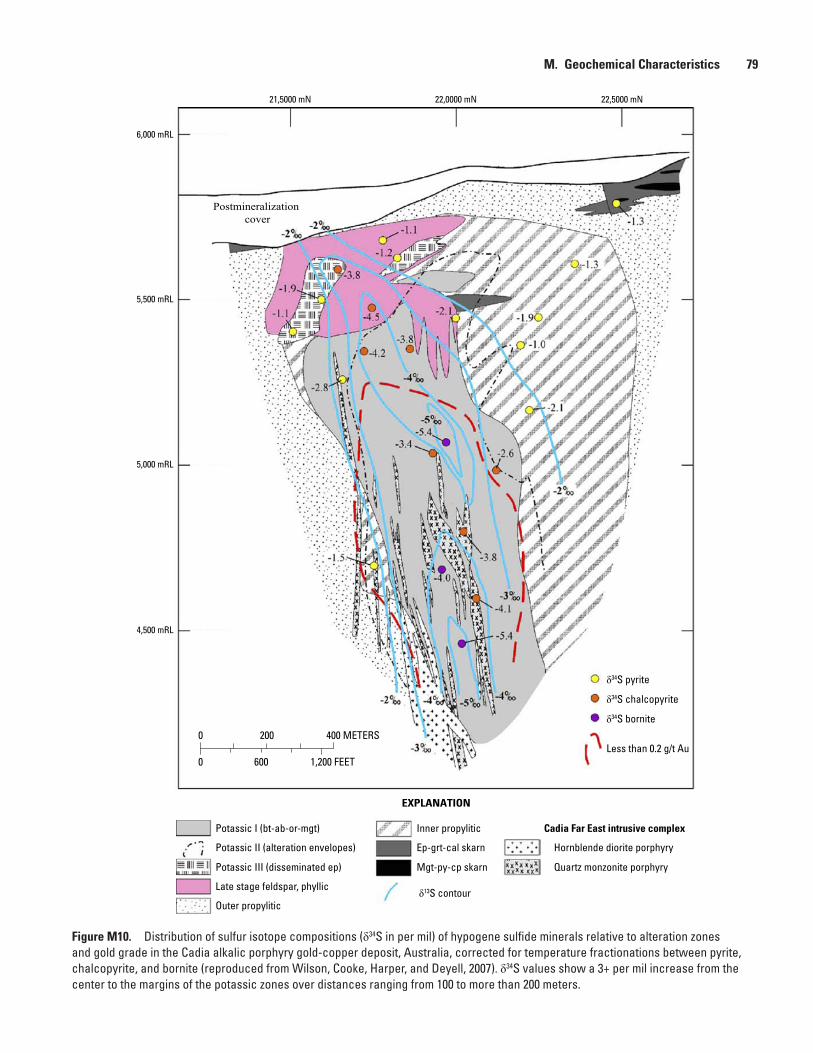
Figure M10. Distribution of sulfur isotope compositions (δ34S in per mil) of hypogene sulfide minerals relative to alteration zones and gold grade in the Cadia alkalic porphyry gold-copper deposit, Australia, corrected for temperature fractionations between pyrite, chalcopyrite, and bornite (reproduced from Wilson, Cooke, Harper, and Deyell, 2007). δ34S values show a 3+ per mil increase from the center to the margins of the potassic zones over distances ranging from 100 to more than 200 meters.
21,5000 mN 22,0000 mN 22,5000 mN
6,000 mRL
5,500 mRL
5,000 mRL
4,500 mRL
Potassic I (bt-ab-or-mgt)
EXPLANATION
Potassic II (alteration envelopes)
Potassic III (disseminated ep)
Late stage feldspar, phyllic
Inner propylitic
Ep-grt-cal skarn
Mgt-py-cp skarn
Cadia Far East intrusive complex
Hornblende diorite porphyry
Quartz monzonite porphyry
δ13S contourOuter propylitic
Less than 0.2 g/t Au
δ34S bornite
δ34S chalcopyrite
δ34S pyrite
Postmineralization cover
0 200 400 METERS
0 600 1,200 FEET
M. Geochemical Characteristics 79
80 Porphyry Copper Deposit Model
Fluid-Inclusion Thermometry and Geochemistry
(Peter G. Vikre and Robert J. Bodnar)
Fluids that form porphyry copper systems vary widely in composition, from low-salinity vapor or dilute liquid to high-salinity brine. Fluids are derived from magmas and from external sources including groundwater (meteoric water), seawater, formation water, and metamorphic water. Much of our knowledge of the physical and chemical environment of formation of PCDs comes from studies of fluid inclusions trapped in ore and gangue minerals. Fluid inclusion techniques that have been used to determine the physical properties and compositions of hydrothermal fluids that formed PCDs include petrography, microthermometry, and direct analysis of fluid inclusions. Physical and chemical data derived from these techniques, supplemented by thermodynamic model-ing of equilibrium reactions between hydrous fluids and igneous and hydrothermal mineral assemblages that make up PCDs (section I, “Hydrothermal Alteration”), have been used to interpret the genesis of PCDs. Physical properties and compositions of hydrothermal fluids that can be obtained from fluid inclusion petrography and microthermometry include temperature, pressure (or depth), density, and major solute concentrations (salts and gases). Edwin Roedder pioneered the quantification of these parameters at conditions that are pertinent to fluids in the magmatic-hydrothermal transition and lower temperature hydrothermal environments. In addi-tion to major solutes and gases in the fluids, recent advances in instrumentation now make it possible to determine minor and trace-element (including ore metals) concentrations and isotopic compositions of fluids causing alteration and mineral-ization in PCDs.
Much valuable information concerning the physical state and composition of fluids associated with PCDs is easily acquired by petrographic examination of thin sections. Indeed, Lindgren (1905) observed halite-bearing fluid inclusions in samples from the Morenci porphyry copper deposit and noted that “They [halite-bearing inclusions] prove, I think conclu-sively, that the acid porphyry magma [at Morenci] was accom-panied by notable quantities of aqueous solutions containing a large quantity of salt which probably was NaCl.” and that “It is perhaps a significant fact that these inclusions are absent in the diorite porphyries, which as a rule have no connection to the copper deposits.” More recently, Nash (1976) described the general petrographic characteristics of fluid inclusions in PCDs and reported four types of inclusions that are commonly observed in these deposits, including his Type III inclusions that contain halite at room temperature (fig. M11; photo-graph D). These high-salinity inclusions commonly also contain sylvite and occasionally chalcopyrite that precipitated in inclusions as fluids cooled (fig. M11; photographs E–K). In addition to the Type III inclusions, Nash (1976) described vapor-rich Type II inclusions (fig. M11; photograph F) commonly coexisting with halite-bearing inclusions (fig. M11; photographs D, G), the most common liquid-rich, low to
moderate salinity Type I (fig. M11; photographs A, B), and the least common CO2-rich Type IV inclusions. Coexist-ing halite-bearing and vapor-rich fluid inclusions (fig. M11; photographs D, G) are considered characteristic of porphyry copper deposits (for example, Lindgren, 1905; Nash, 1976; Bodnar, 1995). It should be noted that the types of fluid inclu-sions observed in PCDs are not restricted to these ore deposits. Rather, these inclusion types are characteristic of most shallow silicic plutons (for example, John, 1989a) and are a reflection of the PT conditions of pluton emplacement and crystallization and the phase equilibrium properties of the H2O-NaCl system (Bodnar and others, 1985).
Current descriptive typing of fluid inclusions usually is based on the phase assemblages in the inclusions at room temperature, and(or) the mode of homogenization (tempera-tures at which two inclusion phases, for example, liquid and vapor, become one phase), to avoid confusion when using the Type designation proposed by Nash (1976). Thus, Nash’s Type III (halite-bearing) fluid inclusions would be described as “halite-bearing inclusions that homogenize by halite disso-lution,” or “halite-bearing inclusions that homogenize by bubble disappearance,” and so forth. For two-phase (liquid + vapor) inclusions, Rusk, Reed, and Dilles (2008) introduced a terminology that reflects the volume percent of the inclusion that is filled with vapor (bubble, or “B”) at room temperature; thus, a “B30” inclusion contains about 30 volume percent vapor (bubble) when observed at room temperature (fig. M11; photograph E).
Microthermometry involves nondestructive (optical) monitoring of the behavior of phases in fluid inclusions (usually liquid, vapor, and salts) over a broad tempera-ture range, commonly –190°C to more than 500°C, using a microscope equipped with a stage that allows observa-tion of the inclusions during controlled heating and cooling. Microthermometry enables quantitative determination of the minimum temperature of entrapment of an inclusion (which in some cases is the precipitation temperature of the host hydrothermal mineral), semiquantification of salinity, and identification and semiquantification of some volatiles such as carbon dioxide. Homogenization temperatures of fluid inclusions in PCDs span a wide range, from about 150°C to more than 1,000°C, although most investigations of fluid inclusions in PCDs list maximum temperatures of 600°C or less. However, this temperature limit is likely biased by the unavailability of microscope heating stages for analyses above 600°C, and many workers report that some inclu-sions had not homogenized when heated to the maximum temperature achievable with the heating stage. Those workers who have had access to stages with higher maximum heating limits often report homogenization temperatures in excess of 600°C. For example, in the Granisle and Bell PCDs in British Columbia, Wilson and others (1980) reported homogenization temperatures less than or equal to 1290°C or less and 800°C or less, respectively. At Santa Rita, New Mexico, Reynolds and Beane (1985) reported homogenization temperatures in excess of 800°C; at Bougainville, Papua New Guinea, Eastoe
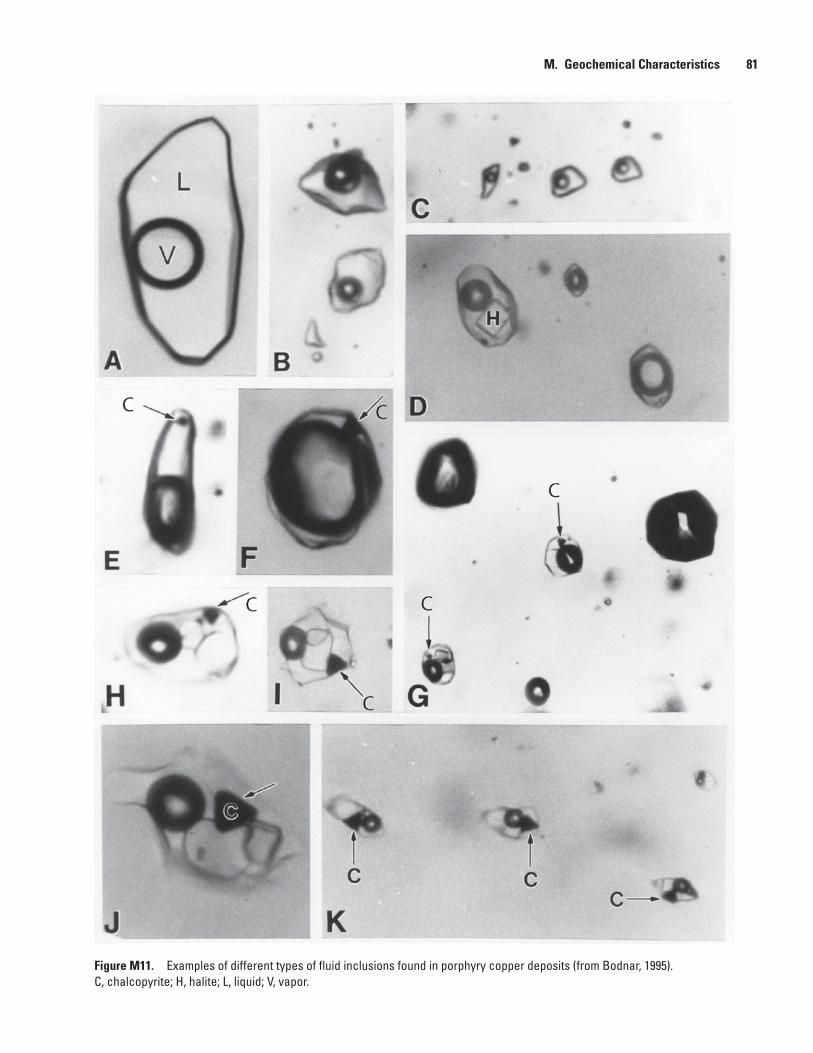
Figure M11. Examples of different types of fluid inclusions found in porphyry copper deposits (from Bodnar, 1995). C, chalcopyrite; H, halite; L, liquid; V, vapor.
M. Geochemical Characteristics 81
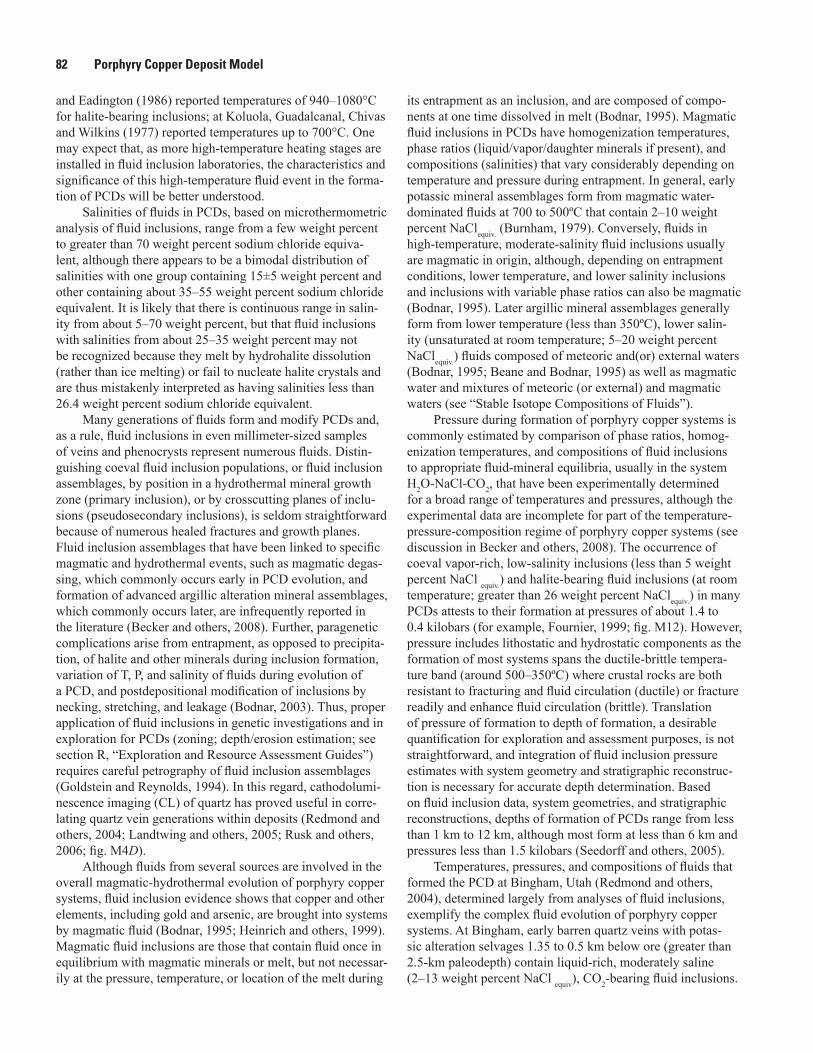
82 Porphyry Copper Deposit Model
and Eadington (1986) reported temperatures of 940–1080°C for halite-bearing inclusions; at Koluola, Guadalcanal, Chivas and Wilkins (1977) reported temperatures up to 700°C. One may expect that, as more high-temperature heating stages are installed in fluid inclusion laboratories, the characteristics and significance of this high-temperature fluid event in the forma-tion of PCDs will be better understood.
Salinities of fluids in PCDs, based on microthermometric analysis of fluid inclusions, range from a few weight percent to greater than 70 weight percent sodium chloride equiva-lent, although there appears to be a bimodal distribution of salinities with one group containing 15±5 weight percent and other containing about 35–55 weight percent sodium chloride equivalent. It is likely that there is continuous range in salin-ity from about 5–70 weight percent, but that fluid inclusions with salinities from about 25–35 weight percent may not be recognized because they melt by hydrohalite dissolution (rather than ice melting) or fail to nucleate halite crystals and are thus mistakenly interpreted as having salinities less than 26.4 weight percent sodium chloride equivalent.
Many generations of fluids form and modify PCDs and, as a rule, fluid inclusions in even millimeter-sized samples of veins and phenocrysts represent numerous fluids. Distin-guishing coeval fluid inclusion populations, or fluid inclusion assemblages, by position in a hydrothermal mineral growth zone (primary inclusion), or by crosscutting planes of inclu-sions (pseudosecondary inclusions), is seldom straightforward because of numerous healed fractures and growth planes. Fluid inclusion assemblages that have been linked to specific magmatic and hydrothermal events, such as magmatic degas-sing, which commonly occurs early in PCD evolution, and formation of advanced argillic alteration mineral assemblages, which commonly occurs later, are infrequently reported in the literature (Becker and others, 2008). Further, paragenetic complications arise from entrapment, as opposed to precipita-tion, of halite and other minerals during inclusion formation, variation of T, P, and salinity of fluids during evolution of a PCD, and postdepositional modification of inclusions by necking, stretching, and leakage (Bodnar, 2003). Thus, proper application of fluid inclusions in genetic investigations and in exploration for PCDs (zoning; depth/erosion estimation; see section R, “Exploration and Resource Assessment Guides”) requires careful petrography of fluid inclusion assemblages (Goldstein and Reynolds, 1994). In this regard, cathodolumi-nescence imaging (CL) of quartz has proved useful in corre-lating quartz vein generations within deposits (Redmond and others, 2004; Landtwing and others, 2005; Rusk and others, 2006; fig. M4D).
Although fluids from several sources are involved in the overall magmatic-hydrothermal evolution of porphyry copper systems, fluid inclusion evidence shows that copper and other elements, including gold and arsenic, are brought into systems by magmatic fluid (Bodnar, 1995; Heinrich and others, 1999). Magmatic fluid inclusions are those that contain fluid once in equilibrium with magmatic minerals or melt, but not necessar-ily at the pressure, temperature, or location of the melt during
its entrapment as an inclusion, and are composed of compo-nents at one time dissolved in melt (Bodnar, 1995). Magmatic fluid inclusions in PCDs have homogenization temperatures, phase ratios (liquid/vapor/daughter minerals if present), and compositions (salinities) that vary considerably depending on temperature and pressure during entrapment. In general, early potassic mineral assemblages form from magmatic water-dominated fluids at 700 to 500ºC that contain 2–10 weight percent NaClequiv. (Burnham, 1979). Conversely, fluids in high-temperature, moderate-salinity fluid inclusions usually are magmatic in origin, although, depending on entrapment conditions, lower temperature, and lower salinity inclusions and inclusions with variable phase ratios can also be magmatic (Bodnar, 1995). Later argillic mineral assemblages generally form from lower temperature (less than 350ºC), lower salin-ity (unsaturated at room temperature; 5–20 weight percent NaClequiv.) fluids composed of meteoric and(or) external waters (Bodnar, 1995; Beane and Bodnar, 1995) as well as magmatic water and mixtures of meteoric (or external) and magmatic waters (see “Stable Isotope Compositions of Fluids”).
Pressure during formation of porphyry copper systems is commonly estimated by comparison of phase ratios, homog-enization temperatures, and compositions of fluid inclusions to appropriate fluid-mineral equilibria, usually in the system H2O-NaCl-CO2, that have been experimentally determined for a broad range of temperatures and pressures, although the experimental data are incomplete for part of the temperature-pressure-composition regime of porphyry copper systems (see discussion in Becker and others, 2008). The occurrence of coeval vapor-rich, low-salinity inclusions (less than 5 weight percent NaCl equiv.) and halite-bearing fluid inclusions (at room temperature; greater than 26 weight percent NaClequiv.) in many PCDs attests to their formation at pressures of about 1.4 to 0.4 kilobars (for example, Fournier, 1999; fig. M12). However, pressure includes lithostatic and hydrostatic components as the formation of most systems spans the ductile-brittle tempera-ture band (around 500–350ºC) where crustal rocks are both resistant to fracturing and fluid circulation (ductile) or fracture readily and enhance fluid circulation (brittle). Translation of pressure of formation to depth of formation, a desirable quantification for exploration and assessment purposes, is not straightforward, and integration of fluid inclusion pressure estimates with system geometry and stratigraphic reconstruc-tion is necessary for accurate depth determination. Based on fluid inclusion data, system geometries, and stratigraphic reconstructions, depths of formation of PCDs range from less than 1 km to 12 km, although most form at less than 6 km and pressures less than 1.5 kilobars (Seedorff and others, 2005).
Temperatures, pressures, and compositions of fluids that formed the PCD at Bingham, Utah (Redmond and others, 2004), determined largely from analyses of fluid inclusions, exemplify the complex fluid evolution of porphyry copper systems. At Bingham, early barren quartz veins with potas-sic alteration selvages 1.35 to 0.5 km below ore (greater than 2.5-km paleodepth) contain liquid-rich, moderately saline (2–13 weight percent NaCl equiv), CO2-bearing fluid inclusions.
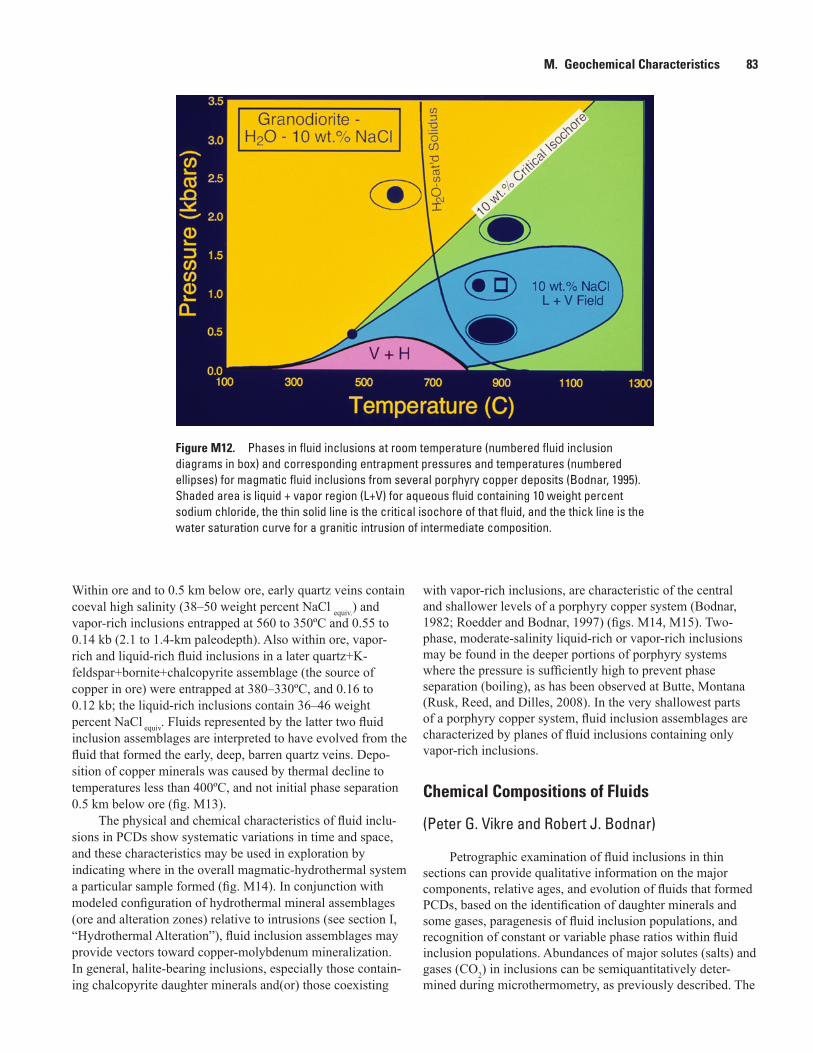
Figure M12. Phases in fluid inclusions at room temperature (numbered fluid inclusion diagrams in box) and corresponding entrapment pressures and temperatures (numbered ellipses) for magmatic fluid inclusions from several porphyry copper deposits (Bodnar, 1995). Shaded area is liquid + vapor region (L+V) for aqueous fluid containing 10 weight percent sodium chloride, the thin solid line is the critical isochore of that fluid, and the thick line is the water saturation curve for a granitic intrusion of intermediate composition.
M. Geochemical Characteristics 83
Within ore and to 0.5 km below ore, early quartz veins contain coeval high salinity (38–50 weight percent NaCl equiv.) and vapor-rich inclusions entrapped at 560 to 350ºC and 0.55 to 0.14 kb (2.1 to 1.4-km paleodepth). Also within ore, vapor-rich and liquid-rich fluid inclusions in a later quartz+K- feldspar+bornite+chalcopyrite assemblage (the source of copper in ore) were entrapped at 380–330ºC, and 0.16 to 0.12 kb; the liquid-rich inclusions contain 36–46 weight percent NaCl equiv. Fluids represented by the latter two fluid inclusion assemblages are interpreted to have evolved from the fluid that formed the early, deep, barren quartz veins. Depo-sition of copper minerals was caused by thermal decline to temperatures less than 400ºC, and not initial phase separation 0.5 km below ore (fig. M13).
The physical and chemical characteristics of fluid inclu-sions in PCDs show systematic variations in time and space, and these characteristics may be used in exploration by indicating where in the overall magmatic-hydrothermal system a particular sample formed (fig. M14). In conjunction with modeled configuration of hydrothermal mineral assemblages (ore and alteration zones) relative to intrusions (see section I, “Hydrothermal Alteration”), fluid inclusion assemblages may provide vectors toward copper-molybdenum mineralization. In general, halite-bearing inclusions, especially those contain-ing chalcopyrite daughter minerals and(or) those coexisting
with vapor-rich inclusions, are characteristic of the central and shallower levels of a porphyry copper system (Bodnar, 1982; Roedder and Bodnar, 1997) (figs. M14, M15). Two-phase, moderate-salinity liquid-rich or vapor-rich inclusions may be found in the deeper portions of porphyry systems where the pressure is sufficiently high to prevent phase separation (boiling), as has been observed at Butte, Montana (Rusk, Reed, and Dilles, 2008). In the very shallowest parts of a porphyry copper system, fluid inclusion assemblages are characterized by planes of fluid inclusions containing only vapor-rich inclusions.
Chemical Compositions of Fluids
(Peter G. Vikre and Robert J. Bodnar)
Petrographic examination of fluid inclusions in thin sections can provide qualitative information on the major components, relative ages, and evolution of fluids that formed PCDs, based on the identification of daughter minerals and some gases, paragenesis of fluid inclusion populations, and recognition of constant or variable phase ratios within fluid inclusion populations. Abundances of major solutes (salts) and gases (CO2) in inclusions can be semiquantitatively deter-mined during microthermometry, as previously described. The
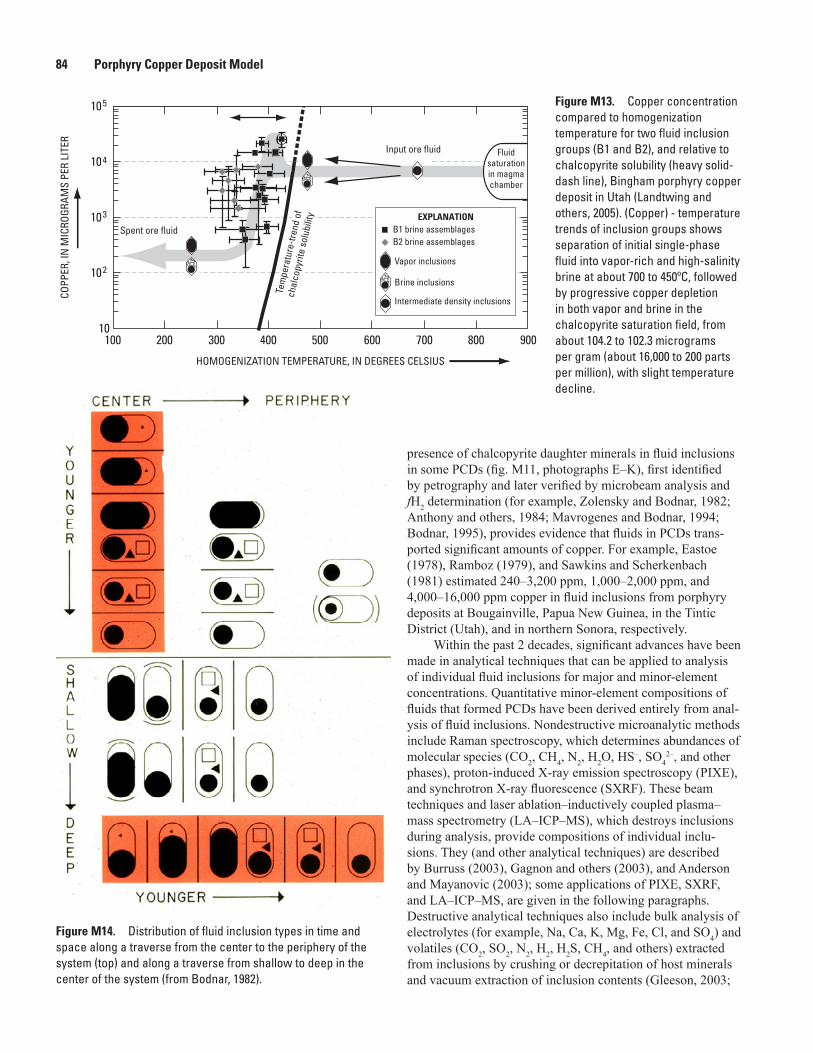
Figure M14. Distribution of fluid inclusion types in time and space along a traverse from the center to the periphery of the system (top) and along a traverse from shallow to deep in the center of the system (from Bodnar, 1982).
Figure M13. Copper concentration compared to homogenization temperature for two fluid inclusion groups (B1 and B2), and relative to chalcopyrite solubility (heavy solid-dash line), Bingham porphyry copper deposit in Utah (Landtwing and others, 2005). (Copper) - temperature trends of inclusion groups shows separation of initial single-phase fluid into vapor-rich and high-salinity brine at about 700 to 450ºC, followed by progressive copper depletion in both vapor and brine in the chalcopyrite saturation field, from about 104.2 to 102.3 micrograms per gram (about 16,000 to 200 parts per million), with slight temperature decline.
10
102
103
104
105
100 200 300 400 500 600 700 800 900
Intermediate density inclusions
Input ore fluid
Spent ore fluid
Vapor inclusions
Brine inclusions
COPP
ER, I
N M
ICRO
GRAM
S PE
R LI
TER
Tem
pera
ture
-tren
d of
chal
copy
rite
solu
bilit
y
HOMOGENIZATION TEMPERATURE, IN DEGREES CELSIUS
B2 brine assemblagesB1 brine assemblages
EXPLANATION
Fluid saturation in magma chamber
84 Porphyry Copper Deposit Model
presence of chalcopyrite daughter minerals in fluid inclusions in some PCDs (fig. M11, photographs E–K), first identified by petrography and later verified by microbeam analysis and fH2 determination (for example, Zolensky and Bodnar, 1982; Anthony and others, 1984; Mavrogenes and Bodnar, 1994; Bodnar, 1995), provides evidence that fluids in PCDs trans-ported significant amounts of copper. For example, Eastoe (1978), Ramboz (1979), and Sawkins and Scherkenbach (1981) estimated 240–3,200 ppm, 1,000–2,000 ppm, and 4,000–16,000 ppm copper in fluid inclusions from porphyry deposits at Bougainville, Papua New Guinea, in the Tintic District (Utah), and in northern Sonora, respectively.
Within the past 2 decades, significant advances have been made in analytical techniques that can be applied to analysis of individual fluid inclusions for major and minor-element concentrations. Quantitative minor-element compositions of fluids that formed PCDs have been derived entirely from anal-ysis of fluid inclusions. Nondestructive microanalytic methods include Raman spectroscopy, which determines abundances of molecular species (CO2, CH4, N2, H2O, HS–, SO4
2–, and other phases), proton-induced X-ray emission spectroscopy (PIXE), and synchrotron X-ray fluorescence (SXRF). These beam techniques and laser ablation–inductively coupled plasma–mass spectrometry (LA–ICP–MS), which destroys inclusions during analysis, provide compositions of individual inclu-sions. They (and other analytical techniques) are described by Burruss (2003), Gagnon and others (2003), and Anderson and Mayanovic (2003); some applications of PIXE, SXRF, and LA–ICP–MS, are given in the following paragraphs. Destructive analytical techniques also include bulk analysis of electrolytes (for example, Na, Ca, K, Mg, Fe, Cl, and SO4) and volatiles (CO2, SO2, N2, H2, H2S, CH4, and others) extracted from inclusions by crushing or decrepitation of host minerals and vacuum extraction of inclusion contents (Gleeson, 2003;
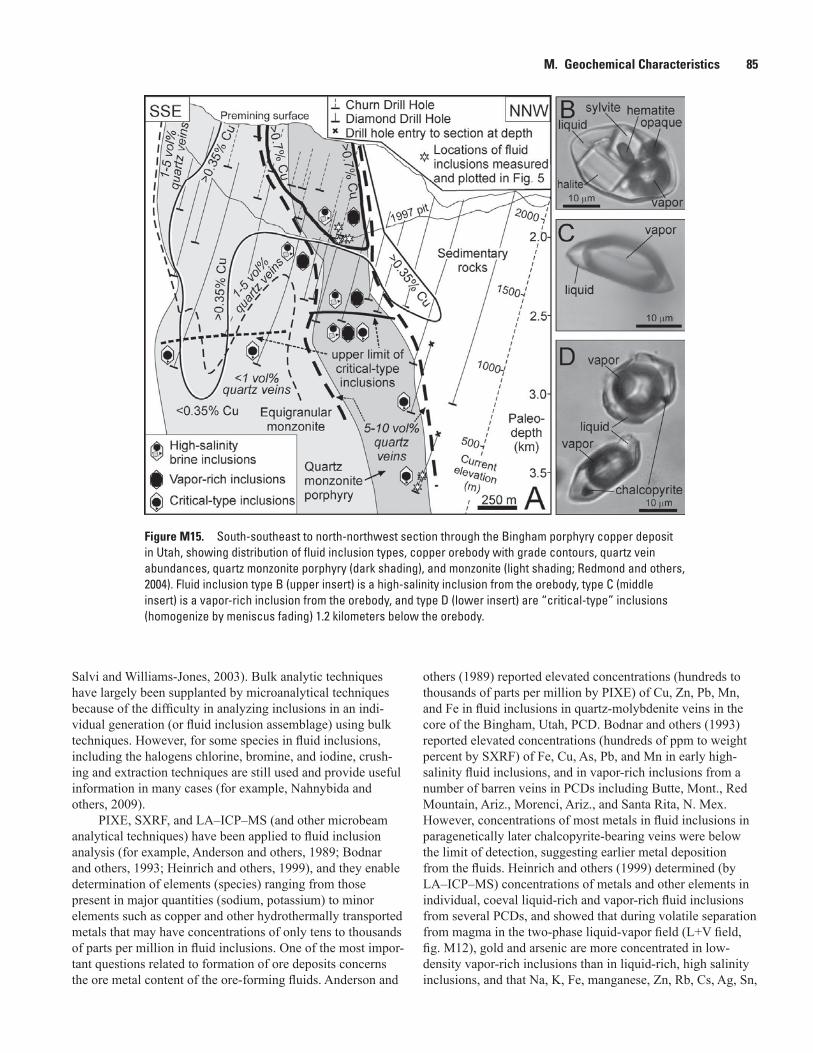
Figure M15. South-southeast to north-northwest section through the Bingham porphyry copper deposit in Utah, showing distribution of fluid inclusion types, copper orebody with grade contours, quartz vein abundances, quartz monzonite porphyry (dark shading), and monzonite (light shading; Redmond and others, 2004). Fluid inclusion type B (upper insert) is a high-salinity inclusion from the orebody, type C (middle insert) is a vapor-rich inclusion from the orebody, and type D (lower insert) are “critical-type” inclusions (homogenize by meniscus fading) 1.2 kilometers below the orebody.
M. Geochemical Characteristics 85
Salvi and Williams-Jones, 2003). Bulk analytic techniques have largely been supplanted by microanalytical techniques because of the difficulty in analyzing inclusions in an indi-vidual generation (or fluid inclusion assemblage) using bulk techniques. However, for some species in fluid inclusions, including the halogens chlorine, bromine, and iodine, crush-ing and extraction techniques are still used and provide useful information in many cases (for example, Nahnybida and others, 2009).
PIXE, SXRF, and LA–ICP–MS (and other microbeam analytical techniques) have been applied to fluid inclusion analysis (for example, Anderson and others, 1989; Bodnar and others, 1993; Heinrich and others, 1999), and they enable determination of elements (species) ranging from those present in major quantities (sodium, potassium) to minor elements such as copper and other hydrothermally transported metals that may have concentrations of only tens to thousands of parts per million in fluid inclusions. One of the most impor-tant questions related to formation of ore deposits concerns the ore metal content of the ore-forming fluids. Anderson and
others (1989) reported elevated concentrations (hundreds to thousands of parts per million by PIXE) of Cu, Zn, Pb, Mn, and Fe in fluid inclusions in quartz-molybdenite veins in the core of the Bingham, Utah, PCD. Bodnar and others (1993) reported elevated concentrations (hundreds of ppm to weight percent by SXRF) of Fe, Cu, As, Pb, and Mn in early high-salinity fluid inclusions, and in vapor-rich inclusions from a number of barren veins in PCDs including Butte, Mont., Red Mountain, Ariz., Morenci, Ariz., and Santa Rita, N. Mex. However, concentrations of most metals in fluid inclusions in paragenetically later chalcopyrite-bearing veins were below the limit of detection, suggesting earlier metal deposition from the fluids. Heinrich and others (1999) determined (by LA–ICP–MS) concentrations of metals and other elements in individual, coeval liquid-rich and vapor-rich fluid inclusions from several PCDs, and showed that during volatile separation from magma in the two-phase liquid-vapor field (L+V field, fig. M12), gold and arsenic are more concentrated in low-density vapor-rich inclusions than in liquid-rich, high salinity inclusions, and that Na, K, Fe, manganese, Zn, Rb, Cs, Ag, Sn,
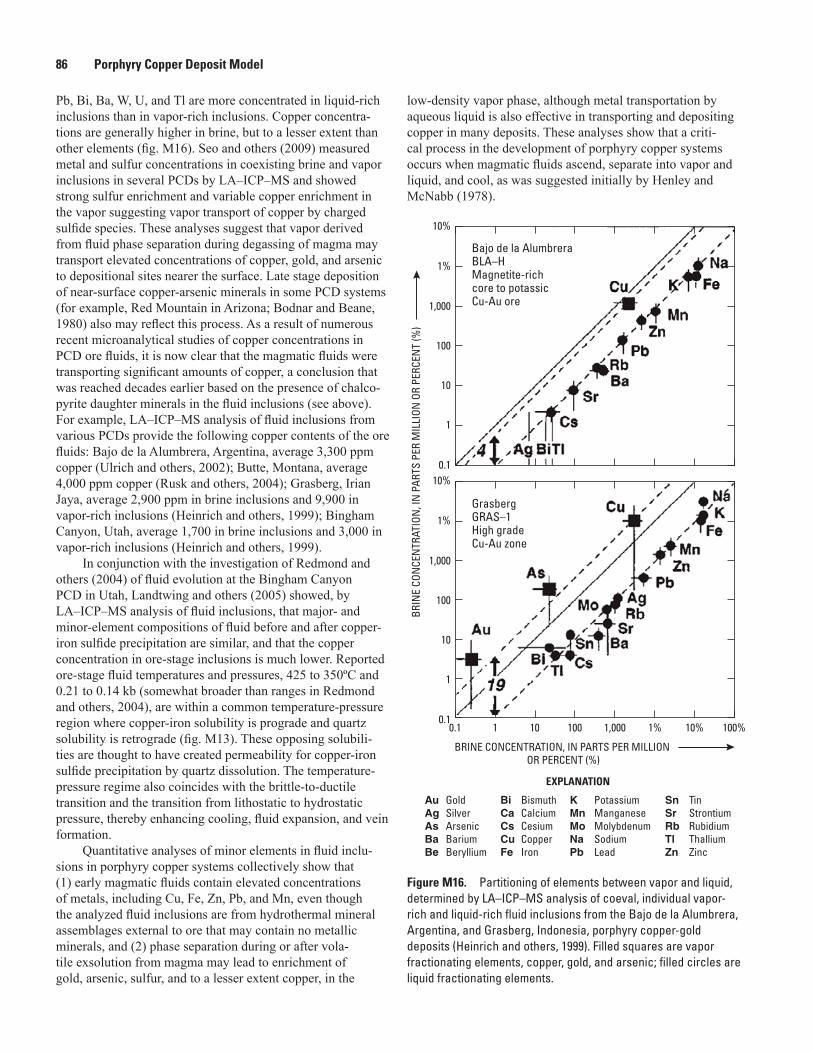
Figure M16. Partitioning of elements between vapor and liquid, determined by LA–ICP–MS analysis of coeval, individual vapor-rich and liquid-rich fluid inclusions from the Bajo de la Alumbrera, Argentina, and Grasberg, Indonesia, porphyry copper-gold deposits (Heinrich and others, 1999). Filled squares are vapor fractionating elements, copper, gold, and arsenic; filled circles are liquid fractionating elements.
BRIN
E CO
NCE
NTR
ATIO
N, I
N P
ARTS
PER
MIL
LION
OR
PERC
ENT
(%)
0.1
1
10
100
1,000
1%
10%
0.1
1
10
100
1,000
1%
10%
Bajo de la AlumbreraBLA–HMagnetite-richcore to potassicCu-Au ore
GrasbergGRAS–1High gradeCu-Au zone
BRINE CONCENTRATION, IN PARTS PER MILLION OR PERCENT (%)
EXPLANATION
0.1 1 1% 10% 100%10 100 1,000
GoldSilverArsenicBariumBeryllium
AuAgAsBaBe
BismuthCalciumCesiumCopperIron
BiCaCsCuFe
PotassiumManganeseMolybdenumSodiumLead
KMnMoNaPb
TinStrontiumRubidiumThalliumZinc
SnSrRbTlZn
86 Porphyry Copper Deposit Model
Pb, Bi, Ba, W, U, and Tl are more concentrated in liquid-rich inclusions than in vapor-rich inclusions. Copper concentra-tions are generally higher in brine, but to a lesser extent than other elements (fig. M16). Seo and others (2009) measured metal and sulfur concentrations in coexisting brine and vapor inclusions in several PCDs by LA–ICP–MS and showed strong sulfur enrichment and variable copper enrichment in the vapor suggesting vapor transport of copper by charged sulfide species. These analyses suggest that vapor derived from fluid phase separation during degassing of magma may transport elevated concentrations of copper, gold, and arsenic to depositional sites nearer the surface. Late stage deposition of near-surface copper-arsenic minerals in some PCD systems (for example, Red Mountain in Arizona; Bodnar and Beane, 1980) also may reflect this process. As a result of numerous recent microanalytical studies of copper concentrations in PCD ore fluids, it is now clear that the magmatic fluids were transporting significant amounts of copper, a conclusion that was reached decades earlier based on the presence of chalco-pyrite daughter minerals in the fluid inclusions (see above). For example, LA–ICP–MS analysis of fluid inclusions from various PCDs provide the following copper contents of the ore fluids: Bajo de la Alumbrera, Argentina, average 3,300 ppm copper (Ulrich and others, 2002); Butte, Montana, average 4,000 ppm copper (Rusk and others, 2004); Grasberg, Irian Jaya, average 2,900 ppm in brine inclusions and 9,900 in vapor-rich inclusions (Heinrich and others, 1999); Bingham Canyon, Utah, average 1,700 in brine inclusions and 3,000 in vapor-rich inclusions (Heinrich and others, 1999).
In conjunction with the investigation of Redmond and others (2004) of fluid evolution at the Bingham Canyon PCD in Utah, Landtwing and others (2005) showed, by LA–ICP–MS analysis of fluid inclusions, that major- and minor-element compositions of fluid before and after copper-iron sulfide precipitation are similar, and that the copper concentration in ore-stage inclusions is much lower. Reported ore-stage fluid temperatures and pressures, 425 to 350ºC and 0.21 to 0.14 kb (somewhat broader than ranges in Redmond and others, 2004), are within a common temperature-pressure region where copper-iron solubility is prograde and quartz solubility is retrograde (fig. M13). These opposing solubili-ties are thought to have created permeability for copper-iron sulfide precipitation by quartz dissolution. The temperature-pressure regime also coincides with the brittle-to-ductile transition and the transition from lithostatic to hydrostatic pressure, thereby enhancing cooling, fluid expansion, and vein formation.
Quantitative analyses of minor elements in fluid inclu-sions in porphyry copper systems collectively show that (1) early magmatic fluids contain elevated concentrations of metals, including Cu, Fe, Zn, Pb, and Mn, even though the analyzed fluid inclusions are from hydrothermal mineral assemblages external to ore that may contain no metallic minerals, and (2) phase separation during or after vola-tile exsolution from magma may lead to enrichment of gold, arsenic, sulfur, and to a lesser extent copper, in the
low-density vapor phase, although metal transportation by aqueous liquid is also effective in transporting and depositing copper in many deposits. These analyses show that a criti-cal process in the development of porphyry copper systems occurs when magmatic fluids ascend, separate into vapor and liquid, and cool, as was suggested initially by Henley and McNabb (1978).
M. Geochemical Characteristics 87
Stable Isotope Compositions of Fluids
(Peter G. Vikre)
Stable isotope compositions of fluids that form PCDs have been exclusively determined from fluids extracted from inclusions by crushing or thermal decrepitation of host minerals in a vacuum. Bulk analysis of isotope compositions of fluids inclusions, analogous to bulk analyses of chemical compositions, is compromised by the numerous generations of fluid inclusions in millimeter-scale samples of hydrothermal (and igneous) minerals in porphyry copper systems. Neverthe-less, guided bulk sampling apparently isolates dominant fluids or fluid regimes because fluid isotope compositions in most deposits reflect alteration assemblages and fluid sources, or define depositional processes, that generally fit the modeled evolution of a system being investigated.
The most frequently analyzed stable isotopes in porphyry copper systems are hydrogen, oxygen, and sulfur, expressed as δD per mil (deuterium; parts per mil), δ18O per mil, and δ34S per mil, respectively, because these isotopes reveal sources of aqueous fluids and sulfur and processes that formed hydro-thermal mineral assemblages including ore. For inclusions in nonhydrous minerals, mainly quartz, δD is measured directly in extracted aqueous fluid, as postentrapment fluid-mineral isotope exchange is nil (although hydrogen diffusion is poten-tially significant (Mavrogenes and Bodnar, 1994). For hydrous minerals, such as biotite, δD is determined in a mineral separate, and δD of the fluid in equilibrium with the mineral is calculated from experimentally determined fractionation factors and assumed temperatures of mineral precipitation. Mineral precipitation temperatures commonly are determined by microthermometry of the analyzed mineral, as in quartz, or in coexisting minerals such as quartz, or calculated from the isotope compositions of coexisting oxygen- and sulfur-bearing mineral pairs (Bowman and others, 1987; Field and Fifarek, 1985). Similar to δD, δ18O in all oxygen-bearing minerals is determined from a mineral separate, and the fluid δ18O value is calculated. For sulfur-bearing minerals, commonly sulfides and sulfates in PCDs, δ34S is determined in a mineral separate, and the fluid δ34S value is calculated. Sulfate minerals contain as many as four crystal sites in which isotope exchange with fluid occurs. Temperature fractionations for these sites, and categorization of mineral depositional environment based on exchange processes, have been determined for alunite (Rye, 2005), a fairly common sulfate mineral in porphyry copper systems with advanced argillic alteration.
Stable isotope compositions of fluid in PCDs indicate multiple fluid sources in addition to time-space variations in fluid composition (fig. M17). In general, early potassic altera-tion and some sericitic (muscovite) alteration are character-ized by water isotope compositions similar to magmatic water (δ18O from 5 to 9 per mil, and δD from about –20 to –80 per mil; for example, fluids that formed Bingham potassic B and sericitic alteration C, La Caridad potassic and sericitic
alteration, and some El Salvador muscovite alteration A; fig. M17). The large δD variations in alteration fluids, both between and within systems, reflect δD control by latitude and by magma degassing, in addition to mixing of magmatic and meteoric (external) waters (for example, Butte, Mont., fig. M17). Magma degassing depletes residual liquid in deuterium by about 20 per mil, leaving felsic magmatic water lighter than andesite volcanic vapors, and residual magmatic water (that measured and calculated from hydrous minerals, for example, biotite, hornblende), further depleted in deuterium (Taylor, 1992; Horita and others 1995; fig. M17). Further, open-system degassing (separation of exsolved volatiles from magma) results in larger variations in δD than closed-system degassing (exsolved volatiles and magma remain together).
Sericitic (muscovite), argillic and advanced argillic (kaolinite, dickite, alunite, pyrophyllite) alteration fluids have δ18O isotope values that are nearer to the meteoric water line or lower δ18O isotope values (for example, fluids that formed El Salvador muscovite alteration A, alunite-pyrophyllite alter-ation B, and kaolinite-dickite alteration C), reflecting mixtures of magmatic and meteoric water in alteration processes. Oxygen isotope compositions also distinguish absorption of magmatic SO2 in groundwater as one process that forms para-genetically late alunite.
Sulfur isotope compositions of fluids that deposited sulfide and sulfate minerals in porphyry copper systems comprise a large range because (1) the bulk sulfur isotopic composition of porphyry magmas varies considerably as a result of diverse inputs of sulfur that include the mantle, subduction-zone fluids, and assimilation of wall rock, brine-vapor immiscibility of magmatic-hydrothermal fluids, and loss of sulfur during magma ascent that can result in signifi-cant changes in H2S/SO4
2– and δ34SΣS; (2) δ34S values are very sensitive to the oxidation state of fluid, largely determined by H2S/SO4
2–, and temperature, which vary among systems, and in some cases, during the evolution of a system; and (3) fractionation between sulfide and sulfate minerals that, where deposited simultaneously, can exceed 20 per mil at PCD temperatures (Ohmoto and Rye, 1979; Ohmoto, 1986; Rye, 2005). Most recent investigations of sulfur isotopes in PCDs have focused on sulfide and sulfate minerals because altera-tion processes and temperatures can be determined from δ34S, δ18O, and δD compositions of coexisting sulfide and sulfate mineral pairs, of which pyrite-anhydrite and pyrite-alunite are the most useful (Rye, 2005; Field and others, 2005). Analysis of coexisting pyrite-anhydrite and pyrite-alunite pairs from several PCDs suggest deposition from relatively oxidizing fluids with H2S/SO4
2– less than 0.5 to 1 and with variable δ34SΣS values (about +1 (Panguna) to +10 (Butte); Rye, 2005; Field and others, 2005). For example, the heavy δ34SΣS value at Butte (+9.9) is interpreted to reflect incorporation of isotopically heavy evaporite sulfate into porphyry copper magmas from underlying sedimentary rocks (Field and others, 2005).
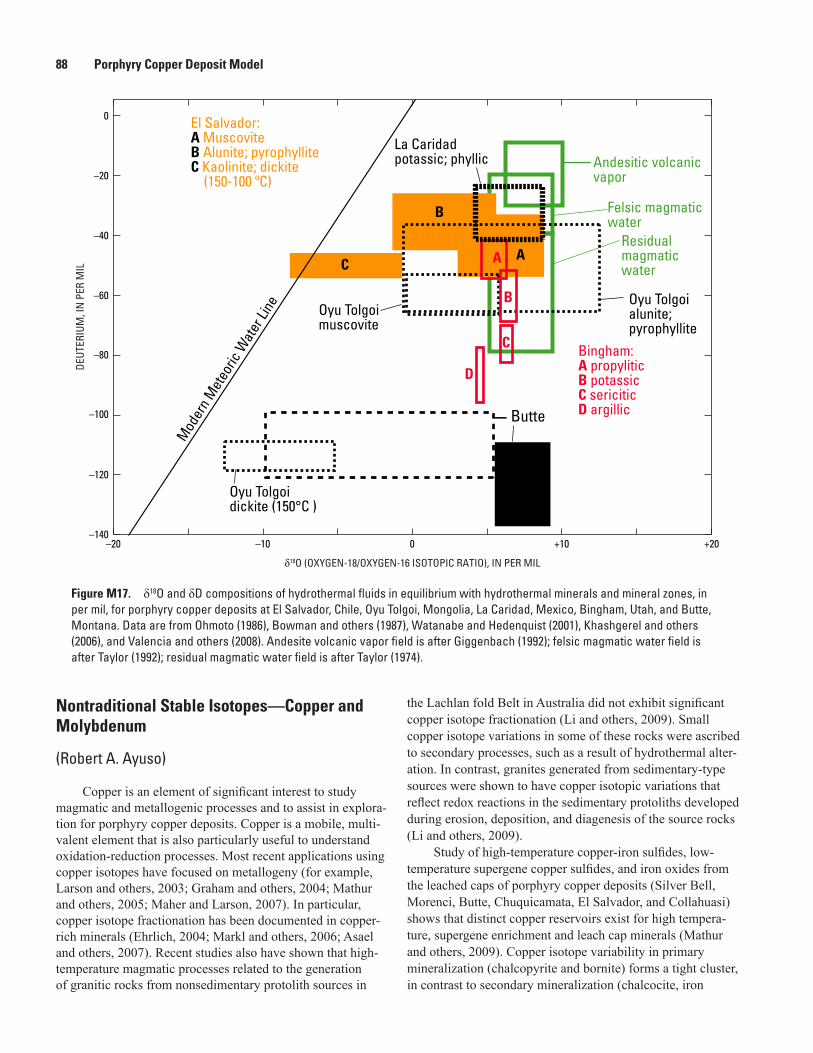
Figure M17. δ18O and δD compositions of hydrothermal fluids in equilibrium with hydrothermal minerals and mineral zones, in per mil, for porphyry copper deposits at El Salvador, Chile, Oyu Tolgoi, Mongolia, La Caridad, Mexico, Bingham, Utah, and Butte, Montana. Data are from Ohmoto (1986), Bowman and others (1987), Watanabe and Hedenquist (2001), Khashgerel and others (2006), and Valencia and others (2008). Andesite volcanic vapor field is after Giggenbach (1992); felsic magmatic water field is after Taylor (1992); residual magmatic water field is after Taylor (1974).
Andesitic volcanic vapor
Felsic magmatic water
Residual magmaticwater
El Salvador:A MuscoviteB Alunite; pyrophylliteC Kaolinite; dickite (150-100 ºC)
AC
B
Oyu Tolgoialunite; pyrophyllite
Oyu Tolgoimuscovite
Oyu Tolgoidickite (150°C )
Bingham:A propyliticB potassicC sericiticD argillic
A
B
C
D
La Caridad potassic; phyllic
0
–20
–40
–60
–80
–100
–120
–140–20 –10 0 +10 +20
δ18O (OXYGEN-18/OXYGEN-16 ISOTOPIC RATIO), IN PER MIL
DEUT
ERIU
M, I
N P
ER M
IL
Mod
ern M
eteo
ric W
ater
Line
Butte
88 Porphyry Copper Deposit Model
Nontraditional Stable Isotopes—Copper and Molybdenum
(Robert A. Ayuso)
Copper is an element of significant interest to study magmatic and metallogenic processes and to assist in explora-tion for porphyry copper deposits. Copper is a mobile, multi-valent element that is also particularly useful to understand oxidation-reduction processes. Most recent applications using copper isotopes have focused on metallogeny (for example, Larson and others, 2003; Graham and others, 2004; Mathur and others, 2005; Maher and Larson, 2007). In particular, copper isotope fractionation has been documented in copper-rich minerals (Ehrlich, 2004; Markl and others, 2006; Asael and others, 2007). Recent studies also have shown that high-temperature magmatic processes related to the generation of granitic rocks from nonsedimentary protolith sources in
the Lachlan fold Belt in Australia did not exhibit significant copper isotope fractionation (Li and others, 2009). Small copper isotope variations in some of these rocks were ascribed to secondary processes, such as a result of hydrothermal alter-ation. In contrast, granites generated from sedimentary-type sources were shown to have copper isotopic variations that reflect redox reactions in the sedimentary protoliths developed during erosion, deposition, and diagenesis of the source rocks (Li and others, 2009).
Study of high-temperature copper-iron sulfides, low-temperature supergene copper sulfides, and iron oxides from the leached caps of porphyry copper deposits (Silver Bell, Morenci, Butte, Chuquicamata, El Salvador, and Collahuasi) shows that distinct copper reservoirs exist for high tempera-ture, supergene enrichment and leach cap minerals (Mathur and others, 2009). Copper isotope variability in primary mineralization (chalcopyrite and bornite) forms a tight cluster, in contrast to secondary mineralization (chalcocite, iron
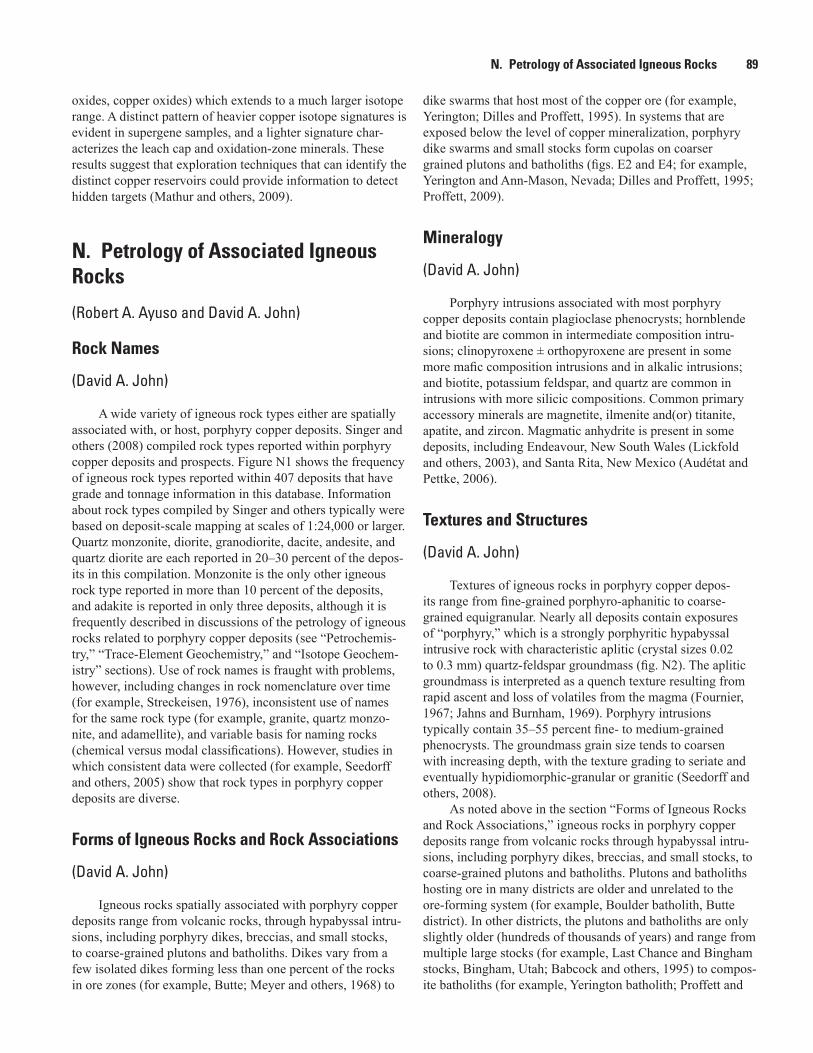
N. Petrology of Associated Igneous Rocks 89
oxides, copper oxides) which extends to a much larger isotope range. A distinct pattern of heavier copper isotope signatures is evident in supergene samples, and a lighter signature char-acterizes the leach cap and oxidation-zone minerals. These results suggest that exploration techniques that can identify the distinct copper reservoirs could provide information to detect hidden targets (Mathur and others, 2009).
N. Petrology of Associated Igneous Rocks
(Robert A. Ayuso and David A. John)
Rock Names
(David A. John)
A wide variety of igneous rock types either are spatially associated with, or host, porphyry copper deposits. Singer and others (2008) compiled rock types reported within porphyry copper deposits and prospects. Figure N1 shows the frequency of igneous rock types reported within 407 deposits that have grade and tonnage information in this database. Information about rock types compiled by Singer and others typically were based on deposit-scale mapping at scales of 1:24,000 or larger. Quartz monzonite, diorite, granodiorite, dacite, andesite, and quartz diorite are each reported in 20–30 percent of the depos-its in this compilation. Monzonite is the only other igneous rock type reported in more than 10 percent of the deposits, and adakite is reported in only three deposits, although it is frequently described in discussions of the petrology of igneous rocks related to porphyry copper deposits (see “Petrochemis-try,” “Trace-Element Geochemistry,” and “Isotope Geochem-istry” sections). Use of rock names is fraught with problems, however, including changes in rock nomenclature over time (for example, Streckeisen, 1976), inconsistent use of names for the same rock type (for example, granite, quartz monzo-nite, and adamellite), and variable basis for naming rocks (chemical versus modal classifications). However, studies in which consistent data were collected (for example, Seedorff and others, 2005) show that rock types in porphyry copper deposits are diverse.
Forms of Igneous Rocks and Rock Associations
(David A. John)
Igneous rocks spatially associated with porphyry copper deposits range from volcanic rocks, through hypabyssal intru-sions, including porphyry dikes, breccias, and small stocks, to coarse-grained plutons and batholiths. Dikes vary from a few isolated dikes forming less than one percent of the rocks in ore zones (for example, Butte; Meyer and others, 1968) to
dike swarms that host most of the copper ore (for example, Yerington; Dilles and Proffett, 1995). In systems that are exposed below the level of copper mineralization, porphyry dike swarms and small stocks form cupolas on coarser grained plutons and batholiths (figs. E2 and E4; for example, Yerington and Ann-Mason, Nevada; Dilles and Proffett, 1995; Proffett, 2009).
Mineralogy
(David A. John)
Porphyry intrusions associated with most porphyry copper deposits contain plagioclase phenocrysts; hornblende and biotite are common in intermediate composition intru-sions; clinopyroxene ± orthopyroxene are present in some more mafic composition intrusions and in alkalic intrusions; and biotite, potassium feldspar, and quartz are common in intrusions with more silicic compositions. Common primary accessory minerals are magnetite, ilmenite and(or) titanite, apatite, and zircon. Magmatic anhydrite is present in some deposits, including Endeavour, New South Wales (Lickfold and others, 2003), and Santa Rita, New Mexico (Audétat and Pettke, 2006).
Textures and Structures
(David A. John)
Textures of igneous rocks in porphyry copper depos-its range from fine-grained porphyro-aphanitic to coarse-grained equigranular. Nearly all deposits contain exposures of “porphyry,” which is a strongly porphyritic hypabyssal intrusive rock with characteristic aplitic (crystal sizes 0.02 to 0.3 mm) quartz-feldspar groundmass (fig. N2). The aplitic groundmass is interpreted as a quench texture resulting from rapid ascent and loss of volatiles from the magma (Fournier, 1967; Jahns and Burnham, 1969). Porphyry intrusions typically contain 35–55 percent fine- to medium-grained phenocrysts. The groundmass grain size tends to coarsen with increasing depth, with the texture grading to seriate and eventually hypidiomorphic-granular or granitic (Seedorff and others, 2008).
As noted above in the section “Forms of Igneous Rocks and Rock Associations,” igneous rocks in porphyry copper deposits range from volcanic rocks through hypabyssal intru-sions, including porphyry dikes, breccias, and small stocks, to coarse-grained plutons and batholiths. Plutons and batholiths hosting ore in many districts are older and unrelated to the ore-forming system (for example, Boulder batholith, Butte district). In other districts, the plutons and batholiths are only slightly older (hundreds of thousands of years) and range from multiple large stocks (for example, Last Chance and Bingham stocks, Bingham, Utah; Babcock and others, 1995) to compos-ite batholiths (for example, Yerington batholith; Proffett and
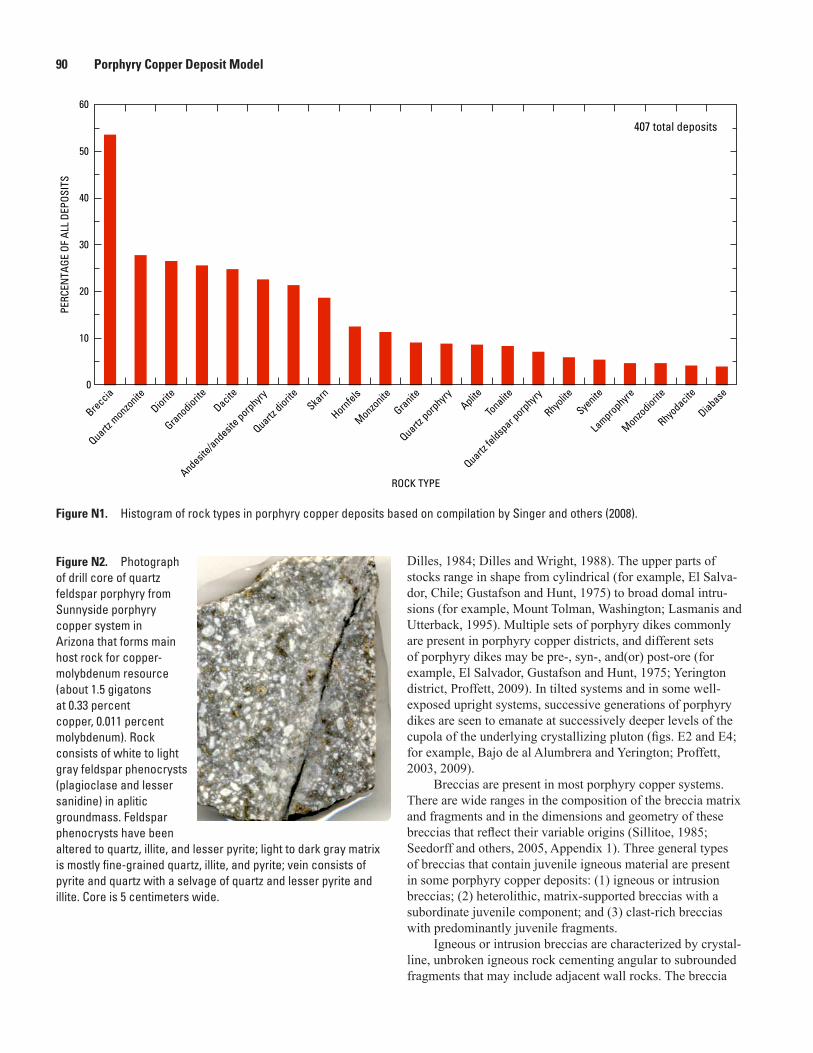
Figure N2. Photograph of drill core of quartz feldspar porphyry from Sunnyside porphyry copper system in Arizona that forms main host rock for copper-molybdenum resource (about 1.5 gigatons at 0.33 percent copper, 0.011 percent molybdenum). Rock consists of white to light gray feldspar phenocrysts (plagioclase and lesser sanidine) in aplitic groundmass. Feldspar phenocrysts have been altered to quartz, illite, and lesser pyrite; light to dark gray matrix is mostly fine-grained quartz, illite, and pyrite; vein consists of pyrite and quartz with a selvage of quartz and lesser pyrite and illite. Core is 5 centimeters wide.
0
10
20
30
40
50
60
Breccia
Quartz m
onzonite
Diorite
GranodioriteDacite
Andesite/andesit
e porphyry
Quartz diorite
Skarn
Hornfels
Monzonite
Granite
Quartz porphyry
Aplite
Tonalite
Quartz fe
ldspar p
orphyry
Rhyolite
Syenite
Lamprophyre
Monzodiorite
Rhyodacite
Diabase
ROCK TYPE
PERC
ENTA
GE O
F AL
L DE
POSI
TS
407 total deposits
Figure N1. Histogram of rock types in porphyry copper deposits based on compilation by Singer and others (2008).
90 Porphyry Copper Deposit Model
Dilles, 1984; Dilles and Wright, 1988). The upper parts of stocks range in shape from cylindrical (for example, El Salva-dor, Chile; Gustafson and Hunt, 1975) to broad domal intru-sions (for example, Mount Tolman, Washington; Lasmanis and Utterback, 1995). Multiple sets of porphyry dikes commonly are present in porphyry copper districts, and different sets of porphyry dikes may be pre-, syn-, and(or) post-ore (for example, El Salvador, Gustafson and Hunt, 1975; Yerington district, Proffett, 2009). In tilted systems and in some well-exposed upright systems, successive generations of porphyry dikes are seen to emanate at successively deeper levels of the cupola of the underlying crystallizing pluton (figs. E2 and E4; for example, Bajo de al Alumbrera and Yerington; Proffett, 2003, 2009).
Breccias are present in most porphyry copper systems. There are wide ranges in the composition of the breccia matrix and fragments and in the dimensions and geometry of these breccias that reflect their variable origins (Sillitoe, 1985; Seedorff and others, 2005, Appendix 1). Three general types of breccias that contain juvenile igneous material are present in some porphyry copper deposits: (1) igneous or intrusion breccias; (2) heterolithic, matrix-supported breccias with a subordinate juvenile component; and (3) clast-rich breccias with predominantly juvenile fragments.
Igneous or intrusion breccias are characterized by crystal-line, unbroken igneous rock cementing angular to subrounded fragments that may include adjacent wall rocks. The breccia
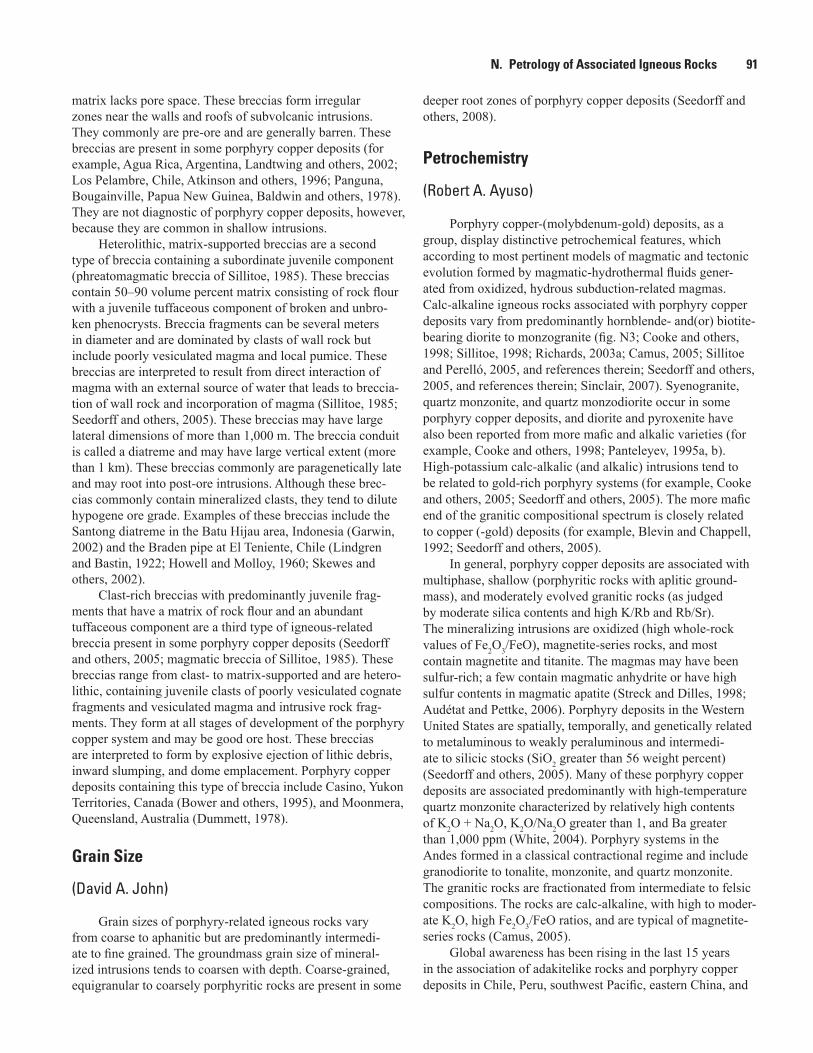
N. Petrology of Associated Igneous Rocks 91
deeper root zones of porphyry copper deposits (Seedorff and others, 2008).
Petrochemistry
(Robert A. Ayuso)
Porphyry copper-(molybdenum-gold) deposits, as a group, display distinctive petrochemical features, which according to most pertinent models of magmatic and tectonic evolution formed by magmatic-hydrothermal fluids gener-ated from oxidized, hydrous subduction-related magmas. Calc-alkaline igneous rocks associated with porphyry copper deposits vary from predominantly hornblende- and(or) biotite-bearing diorite to monzogranite (fig. N3; Cooke and others, 1998; Sillitoe, 1998; Richards, 2003a; Camus, 2005; Sillitoe and Perelló, 2005, and references therein; Seedorff and others, 2005, and references therein; Sinclair, 2007). Syenogranite, quartz monzonite, and quartz monzodiorite occur in some porphyry copper deposits, and diorite and pyroxenite have also been reported from more mafic and alkalic varieties (for example, Cooke and others, 1998; Panteleyev, 1995a, b). High-potassium calc-alkalic (and alkalic) intrusions tend to be related to gold-rich porphyry systems (for example, Cooke and others, 2005; Seedorff and others, 2005). The more mafic end of the granitic compositional spectrum is closely related to copper (-gold) deposits (for example, Blevin and Chappell, 1992; Seedorff and others, 2005).
In general, porphyry copper deposits are associated with multiphase, shallow (porphyritic rocks with aplitic ground-mass), and moderately evolved granitic rocks (as judged by moderate silica contents and high K/Rb and Rb/Sr). The mineralizing intrusions are oxidized (high whole-rock values of Fe2O3/FeO), magnetite-series rocks, and most contain magnetite and titanite. The magmas may have been sulfur-rich; a few contain magmatic anhydrite or have high sulfur contents in magmatic apatite (Streck and Dilles, 1998; Audétat and Pettke, 2006). Porphyry deposits in the Western United States are spatially, temporally, and genetically related to metaluminous to weakly peraluminous and intermedi-ate to silicic stocks (SiO2 greater than 56 weight percent) (Seedorff and others, 2005). Many of these porphyry copper deposits are associated predominantly with high-temperature quartz monzonite characterized by relatively high contents of K2O + Na2O, K2O/Na2O greater than 1, and Ba greater than 1,000 ppm (White, 2004). Porphyry systems in the Andes formed in a classical contractional regime and include granodiorite to tonalite, monzonite, and quartz monzonite. The granitic rocks are fractionated from intermediate to felsic compositions. The rocks are calc-alkaline, with high to moder-ate K2O, high Fe2O3/FeO ratios, and are typical of magnetite-series rocks (Camus, 2005).
Global awareness has been rising in the last 15 years in the association of adakitelike rocks and porphyry copper deposits in Chile, Peru, southwest Pacific, eastern China, and
matrix lacks pore space. These breccias form irregular zones near the walls and roofs of subvolcanic intrusions. They commonly are pre-ore and are generally barren. These breccias are present in some porphyry copper deposits (for example, Agua Rica, Argentina, Landtwing and others, 2002; Los Pelambre, Chile, Atkinson and others, 1996; Panguna, Bougainville, Papua New Guinea, Baldwin and others, 1978). They are not diagnostic of porphyry copper deposits, however, because they are common in shallow intrusions.
Heterolithic, matrix-supported breccias are a second type of breccia containing a subordinate juvenile component (phreatomagmatic breccia of Sillitoe, 1985). These breccias contain 50–90 volume percent matrix consisting of rock flour with a juvenile tuffaceous component of broken and unbro-ken phenocrysts. Breccia fragments can be several meters in diameter and are dominated by clasts of wall rock but include poorly vesiculated magma and local pumice. These breccias are interpreted to result from direct interaction of magma with an external source of water that leads to breccia-tion of wall rock and incorporation of magma (Sillitoe, 1985; Seedorff and others, 2005). These breccias may have large lateral dimensions of more than 1,000 m. The breccia conduit is called a diatreme and may have large vertical extent (more than 1 km). These breccias commonly are paragenetically late and may root into post-ore intrusions. Although these brec-cias commonly contain mineralized clasts, they tend to dilute hypogene ore grade. Examples of these breccias include the Santong diatreme in the Batu Hijau area, Indonesia (Garwin, 2002) and the Braden pipe at El Teniente, Chile (Lindgren and Bastin, 1922; Howell and Molloy, 1960; Skewes and others, 2002).
Clast-rich breccias with predominantly juvenile frag-ments that have a matrix of rock flour and an abundant tuffaceous component are a third type of igneous-related breccia present in some porphyry copper deposits (Seedorff and others, 2005; magmatic breccia of Sillitoe, 1985). These breccias range from clast- to matrix-supported and are hetero-lithic, containing juvenile clasts of poorly vesiculated cognate fragments and vesiculated magma and intrusive rock frag-ments. They form at all stages of development of the porphyry copper system and may be good ore host. These breccias are interpreted to form by explosive ejection of lithic debris, inward slumping, and dome emplacement. Porphyry copper deposits containing this type of breccia include Casino, Yukon Territories, Canada (Bower and others, 1995), and Moonmera, Queensland, Australia (Dummett, 1978).
Grain Size
(David A. John)
Grain sizes of porphyry-related igneous rocks vary from coarse to aphanitic but are predominantly intermedi-ate to fine grained. The groundmass grain size of mineral-ized intrusions tends to coarsen with depth. Coarse-grained, equigranular to coarsely porphyritic rocks are present in some
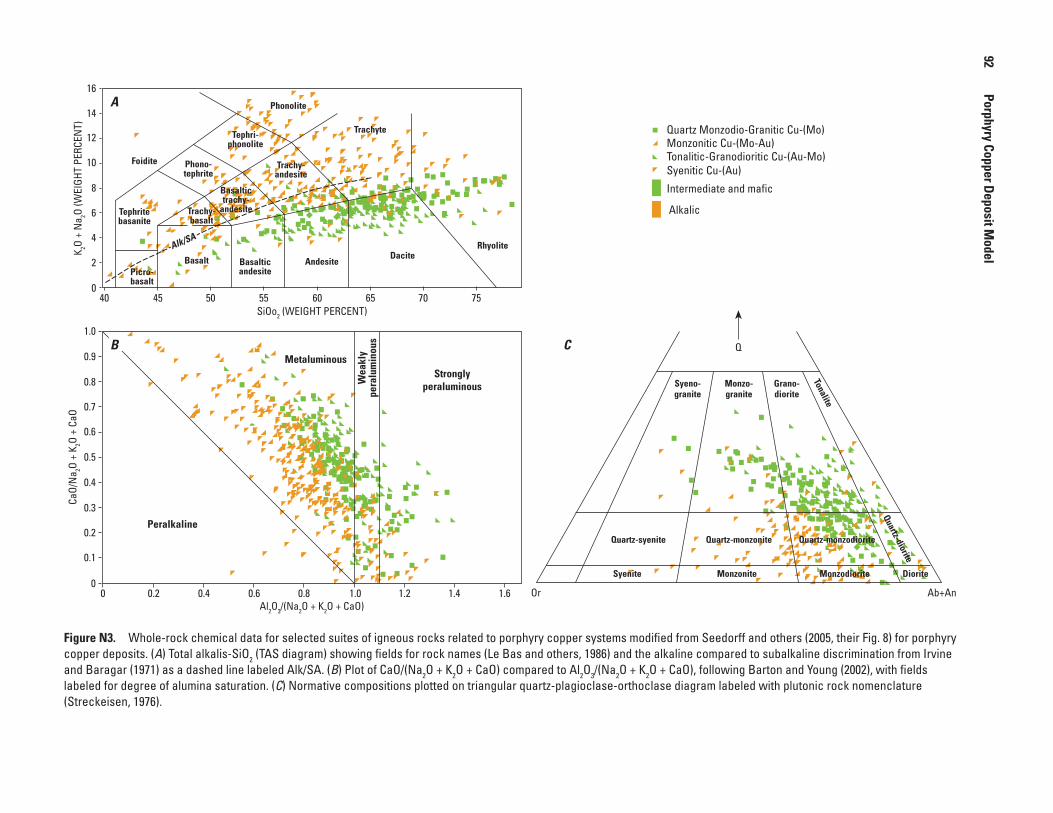
Figure N3. Whole-rock chemical data for selected suites of igneous rocks related to porphyry copper systems modified from Seedorff and others (2005, their Fig. 8) for porphyry copper deposits. (A) Total alkalis-SiO2 (TAS diagram) showing fields for rock names (Le Bas and others, 1986) and the alkaline compared to subalkaline discrimination from Irvine and Baragar (1971) as a dashed line labeled Alk/SA. (B) Plot of CaO/(Na2O + K2O + CaO) compared to Al2O3/(Na2O + K2O + CaO), following Barton and Young (2002), with fields labeled for degree of alumina saturation. (C) Normative compositions plotted on triangular quartz-plagioclase-orthoclase diagram labeled with plutonic rock nomenclature (Streckeisen, 1976).
16
14
12
10
8
6
4
2
0
Intermediate and mafic
Quartz Monzodio-Granitic Cu-(Mo)Monzonitic Cu-(Mo-Au)Tonalitic-Granodioritic Cu-(Au-Mo)Syenitic Cu-(Au)
Alkalic
A
B C
K 2O +
Na 2O
(WEI
GHT
PERC
ENT)
SiOo2 (WEIGHT PERCENT)40 45 50 55 60 65 70 75
1.0
0.7
0.8
0.9
0.6
0.5
0.4
0.3
0.2
0.1
0
CaO/
Na 2O
+ K 2O
+ Ca
O
Al2O3/(Na2O + K2O + CaO)0 0.2 0.4 0.6 0.8 1.0 1.2 1.61.4 Or Ab+An
Q
Phonolite
Trachyte
Trachy-andesite
Basaltictrachy-
andesite
Tephri-phonolite
Phono-tephrite
Trachy-basalt
Tephritebasanite
Foidite
Picro-basalt
Basalt Basalticandesite
AndesiteDacite
RhyoliteAlk/SA
Stronglyperaluminous
MetaluminousW
eakl
ype
ralu
min
ous
Peralkaline
Tonalite
Monzo-granite
Grano-diorite
Syeno-granite
Quartz-syenite Quartz-monzonite Quartz-monzodiorite
Syenite Monzonite Monzodiorite Diorite
Quartz-diorite
92
Porphyry Copper Deposit Model
N. Petrology of Associated Igneous Rocks 93
Mexico (for example, Gutscher and others, 2000; Gonzalez-Partida and others, 2003; Rae and others, 2004; Wang and others, 2006). The term adakite was introduced by Defant and Drummand (1990) for unusual magnesium-rich andes-ites present near Adak Island in the Aleutians that were first described by Kay (1978). As described by Kay (1978), these rocks were characterized by high lanthanum/ytterbium ratios (that is, high ratios of light rare earth elements to heavy rare earth elements), high strontium concentrations (about 1,800 ppm), and relatively high magnesium number (about 0.5, as used in the review of the function of adakite in metal-logenesis by Richards and Kerrich, 2007), chromium and nickel concentrations compared with normal andesites, but they had nonradiogenic lead and strontium isotope composi-tions (table N1). Kay (1978) suggested that these chemical characteristics were consistent with an origin as partial melts of subducted, garnetiferous (that is, eclogitized) oceanic crust, which had then reacted and partially equilibrated with the peri-dotitic asthenospheric mantle wedge during ascent. The close relationship between adakitic magmatism and porphyry copper deposits, for example, in the Chilean Andes (Thieblemont and others, 1997), is of interest to investigate the possible func-tion of the subducting slab as the source of metals and fluids, transport processes (Reich and others, 2003), and the genetic linkage between adakitic magmatism (water-rich, highly oxidized melts) derived from a slab source in a flat subduction setting and the size of porphyry copper deposits (Oyarzun and others, 2001). This genetic linkage, however, is controversial and has been evaluated by Richards and Kerrich (2007). They concluded that typical upper plate magmatic processes of the MASH model (Hildreth and Moorbath, 1988) and assimila-tion-fractional crystallization reactions commonly influencing arc magmas adequately account for the chemical features of adakitelike rocks. Moreover, the MASH model also explains the production of fertile, oxidized calc-alkaline magmas from slab dehydration and transfer of water, sulfur, halogens, LILE (Rb, K, Cs, Ba, Sr), and metals into the mantle wedge (Rich-ards, 2005). In this view, slab dehydration is a fundamental process that makes calc-alkaline magmas fertile, as a result of melting of the metasomatized, metal-enriched mantle wedge, and slab melting was unsatisfactory as a unique factor in the porphyry copper genesis. Nonetheless, adakites have contin-ued to be reported in porphyry copper deposits. Table N1 summarizes the evolution of chemical parameters used to define “adakites” from 1990 to 2007 and recent descriptions of “adakitic rocks” related to porphyry copper deposits. Table N2 summarizes general chemical and isotopic characteristics of selected porphyry copper intrusions.
In the Peruvian-Chilean belt, many of the large porphyry deposits are assigned to the last intrusive event. In some of the largest porphyry copper deposits, for example at El Teniente, rocks evolved from low-potassium tholeiitic to high-potassium calc-alkaline, and the stocks associated with the mineralizing events are high-silica (SiO2 greater than 65 weight percent) quartz diorite to dacite porphyry (Stern and Skewes, 1995; Camus, 2005). Major-element chemical variations generally
do not distinguish among mineralizing stocks and barren stocks. At other giant porphyry copper deposits in central Chile, for example, Los Pelambres, stocks associated with the mineralizing events have SiO2 contents from 62 to 72 weight percent and higher contents of Al2O3 and Na2O than the barren magmatic rocks (Reich and others, 2003). In addition, ratios of K2O/Na2O less than 1, Mg# from 38 to 75, and aluminum satu-ration indices (ASI) of about 1.0 also suggest that the adakite-like signature of the mineralizing stocks is related in time and space to ridge subduction.
Porphyry copper-molybdenum deposits in the South Carpathians are related to mineralizing stocks that are calc-alkaline to high potassium calc-alkaline, and rarely shoshon-itic. All the granitic rocks have an I-type affinity (Dupont and others, 2002). In central Iran, the porphyry copper deposits have major-element compositions that do not clearly distin-guish between mineralized and barren intrusions (Shahab-pour and Kramers, 1987). Both groups are calc-alkalic and alkali-calcic I-types, but the ore-hosting hornblende- and biotite-bearing porphyries have somewhat higher ASI (more peraluminous) than the barren intrusions (mostly metalumi-nous). The overall geochemical features of major porphyry copper deposits and prospects in the Kerman region of central Iran indicate adakite affinities and a postcollisional tectonic setting that formed after subduction ceased (Shafiei and others, 2009).
A genetic link to adakites has been suggested for many porphyry copper systems in Asia. For example, ore-bearing alkali-rich porphyries (shoshonitic to potassic calc-alka-line) from Himalayan porphyry copper-molybdenum-gold belts contain higher SiO2 (greater than 63 weight percent) and generally show adakitic features compared to barren porphyries (Zengqian and others, 2005). The synorogenic plagiogranites in the Tuwu-Yandong copper porphyry belt of eastern Tianshan, Northwest China, have SiO2 (65–73 weight percent), Al2O3 (0.9–2.2 weight percent), MgO (3–16 weight percent), Na2O and K2O contents from 3 to 6 and 1 to 2 weight percent, respectively; Na2O/K2O ratios from 1.3 to 4.6, and trace-element compositions that closely resemble adakites derived from partial melting of a subducted oceanic slab (Zhang and others, 2006; Han and others, 2006). Similarly, adakitic porphyries occur in southern China, but these are linked to an extensional rather than a more typical compres-sional tectonic regime and to slab-derived adakitic rocks (Wang and others, 2004, 2006). However, in this case, barren adakites are interpreted as having been produced from thick lower crust, in contrast to adakites related to porphyry copper deposits that are associated with delaminated lower crust (Wang and others, 2006). The adakites are composition-ally similar to highly oxidized I-type or magnetite-series granitic rocks, with relatively low FeOT/MgO (1.16–2.68) ratios and Al2O3 (14.5–17.5 weight percent) contents, and relatively high MgO (1.80–5.00 percent), Cr (30–120 ppm), Ni (12–36 ppm) and Yb (0.28–1.40 ppm) contents compared with either thick lower crust-derived adakitic rocks or pure slab melts. Large volumes of granites and associated porphyry
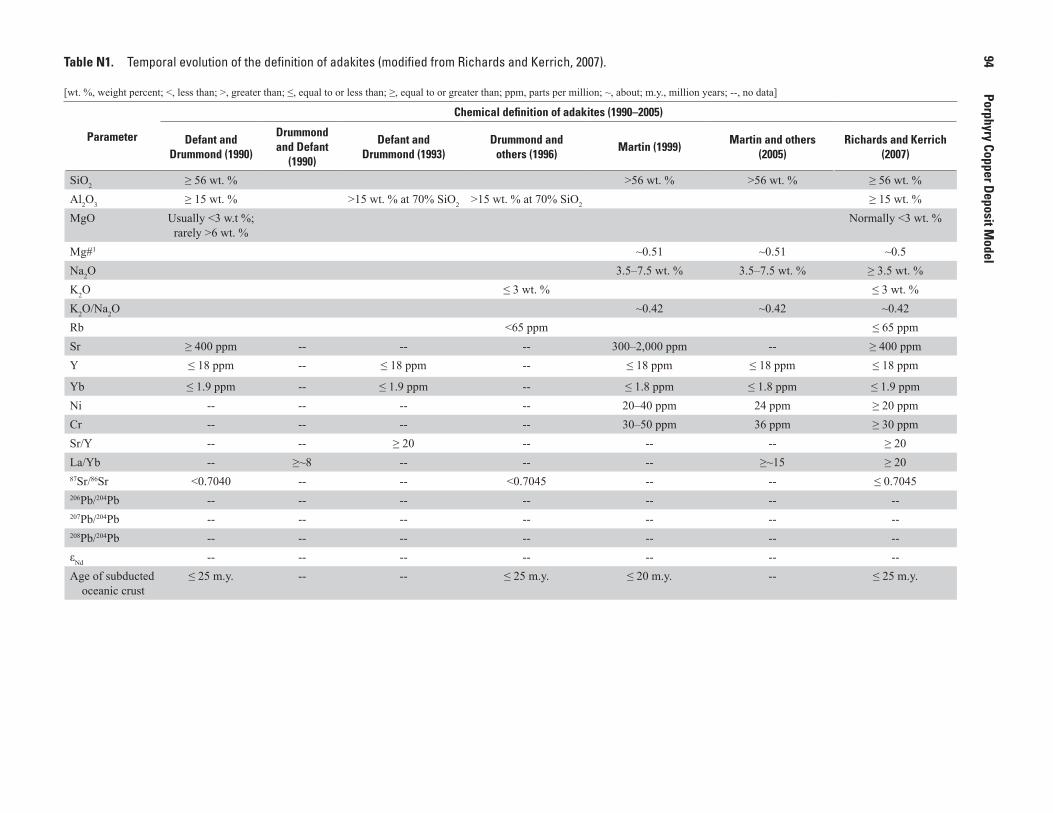
Table N1. Temporal evolution of the definition of adakites (modified from Richards and Kerrich, 2007). —Continued
[wt. %, weight percent; <, less than; >, greater than; ≤, equal to or less than; ≥, equal to or greater than; ppm, parts per million; ~, about; m.y., million years; --, no data]
Parameter
Chemical definition of adakites (1990–2005)
Defant and Drummond (1990)
Drummond and Defant
(1990)
Defant and Drummond (1993)
Drummond and others (1996)
Martin (1999)Martin and others
(2005)Richards and Kerrich
(2007)
SiO2 ≥ 56 wt. % >56 wt. % >56 wt. % ≥ 56 wt. %Al2O3 ≥ 15 wt. % >15 wt. % at 70% SiO2 >15 wt. % at 70% SiO2 ≥ 15 wt. %MgO Usually <3 w.t %;
rarely >6 wt. %Normally <3 wt. %
Mg#1 ~0.51 ~0.51 ~0.5Na2O 3.5–7.5 wt. % 3.5–7.5 wt. % ≥ 3.5 wt. %K2O ≤ 3 wt. % ≤ 3 wt. %K2O/Na2O ~0.42 ~0.42 ~0.42Rb <65 ppm ≤ 65 ppmSr ≥ 400 ppm -- -- -- 300–2,000 ppm -- ≥ 400 ppmY ≤ 18 ppm -- ≤ 18 ppm -- ≤ 18 ppm ≤ 18 ppm ≤ 18 ppm
Yb ≤ 1.9 ppm -- ≤ 1.9 ppm -- ≤ 1.8 ppm ≤ 1.8 ppm ≤ 1.9 ppmNi -- -- -- -- 20–40 ppm 24 ppm ≥ 20 ppmCr -- -- -- -- 30–50 ppm 36 ppm ≥ 30 ppmSr/Y -- -- ≥ 20 -- -- -- ≥ 20La/Yb -- ≥~8 -- -- -- ≥~15 ≥ 2087Sr/86Sr <0.7040 -- -- <0.7045 -- -- ≤ 0.7045206Pb/204Pb -- -- -- -- -- -- --207Pb/204Pb -- -- -- -- -- -- --208Pb/204Pb -- -- -- -- -- -- --εNd -- -- -- -- -- -- --Age of subducted
oceanic crust≤ 25 m.y. -- -- ≤ 25 m.y. ≤ 20 m.y. -- ≤ 25 m.y.
94
Porphyry Copper Deposit Model
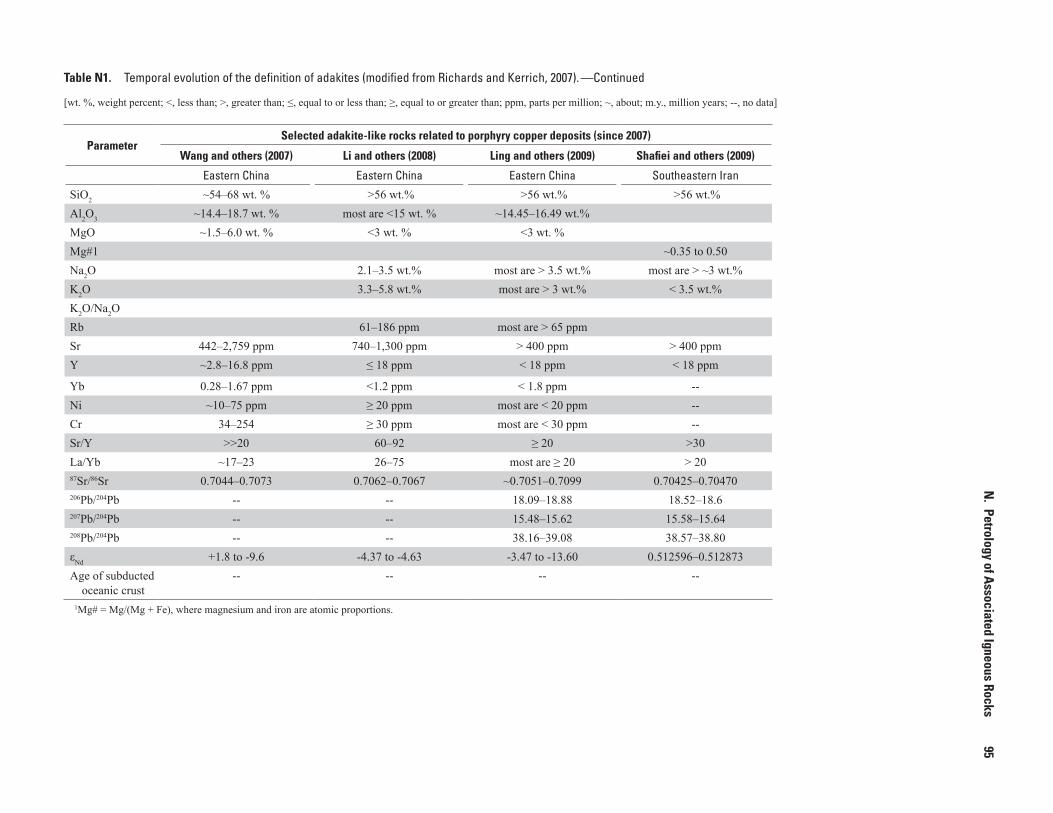
Table N1. Temporal evolution of the definition of adakites (modified from Richards and Kerrich, 2007). —Continued
[wt. %, weight percent; <, less than; >, greater than; ≤, equal to or less than; ≥, equal to or greater than; ppm, parts per million; ~, about; m.y., million years; --, no data]
ParameterSelected adakite-like rocks related to porphyry copper deposits (since 2007)
Wang and others (2007) Li and others (2008) Ling and others (2009) Shafiei and others (2009)
Eastern China Eastern China Eastern China Southeastern Iran
SiO2 ~54–68 wt. % >56 wt.% >56 wt.% >56 wt.%Al2O3 ~14.4–18.7 wt. % most are <15 wt. % ~14.45–16.49 wt.%MgO ~1.5–6.0 wt. % <3 wt. % <3 wt. %Mg#1 ~0.35 to 0.50Na2O 2.1–3.5 wt.% most are > 3.5 wt.% most are > ~3 wt.%K2O 3.3–5.8 wt.% most are > 3 wt.% < 3.5 wt.%K2O/Na2ORb 61–186 ppm most are > 65 ppmSr 442–2,759 ppm 740–1,300 ppm > 400 ppm > 400 ppmY ~2.8–16.8 ppm ≤ 18 ppm < 18 ppm < 18 ppm
Yb 0.28–1.67 ppm <1.2 ppm < 1.8 ppm --Ni ~10–75 ppm ≥ 20 ppm most are < 20 ppm --Cr 34–254 ≥ 30 ppm most are < 30 ppm --Sr/Y >>20 60–92 ≥ 20 >30La/Yb ~17–23 26–75 most are ≥ 20 > 2087Sr/86Sr 0.7044–0.7073 0.7062–0.7067 ~0.7051–0.7099 0.70425–0.70470206Pb/204Pb -- -- 18.09–18.88 18.52–18.6207Pb/204Pb -- -- 15.48–15.62 15.58–15.64208Pb/204Pb -- -- 38.16–39.08 38.57–38.80εNd +1.8 to -9.6 -4.37 to -4.63 -3.47 to -13.60 0.512596–0.512873Age of subducted
oceanic crust-- -- -- --
1Mg# = Mg/(Mg + Fe), where magnesium and iron are atomic proportions.
N. Petrology of Associated Igneous Rocks
95
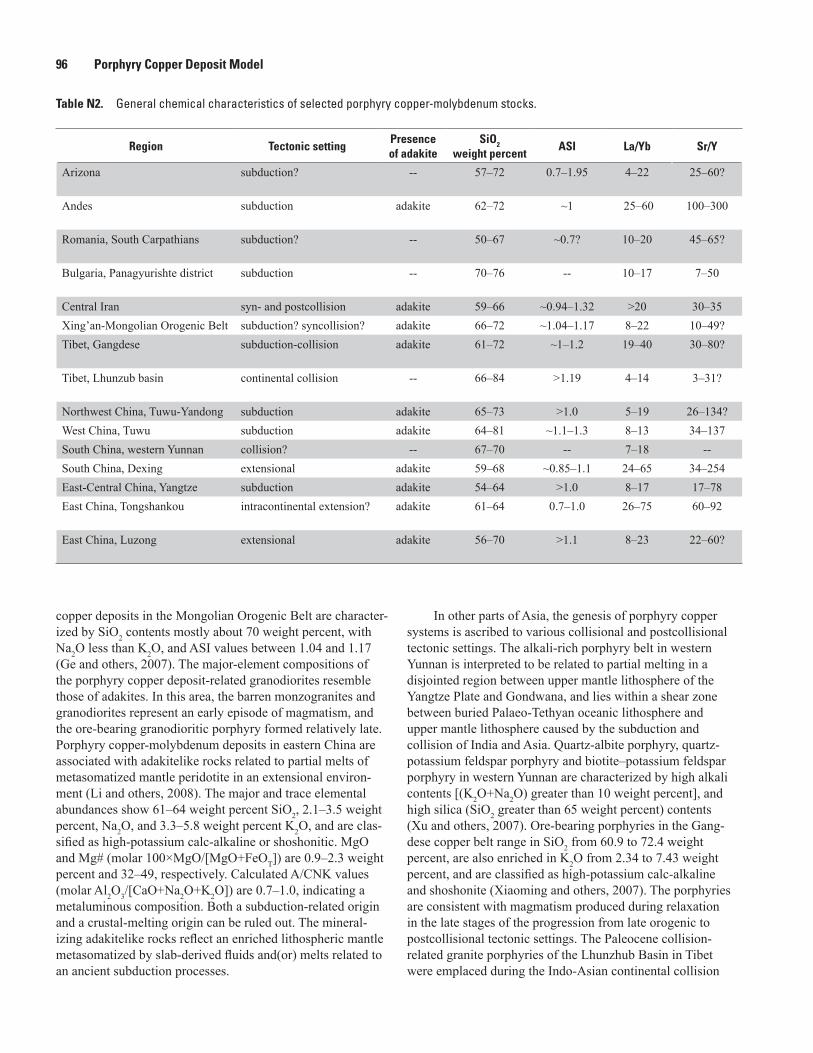
Region Tectonic settingPresence of adakite
SiO2 weight percent
ASI La/Yb Sr/Y 207Pb/204Pb 87Sr/86Sr (initial) 143Nd/144Nd (initial) 176Hf/177Hf Magma type Data sources
Arizona subduction? -- 57–72 0.7–1.95 4–22 25–60? 17.34–22.66 0.7040–>0.7100 0 to -14 -- calc-alkalic Lang and Titley, 1998; Bouse and others, 1999.
Andes subduction adakite 62–72 ~1 25–60 100–300 ~15.55–15.65 ~0.7030 ~0 to 3 6 to 8.5 calc-alkaline to high K calc-alkaline
Reich and others, 2003; Muñoz and others, 2008.
Romania, South Carpathians subduction? -- 50–67 ~0.7? 10–20 45–65? ~15.63–15.66 0.7042–0.7058 -0.2 to 3.9 -- calc-alkaline to high K calc- alkaline
Dupont and others, 2002; Mar-coux and others, 2002.
Bulgaria, Panagyurishte district subduction -- 70–76 -- 10–17 7–50 ~15.58–15.67 0.7046–0.7061 -0.03 to 2.27 5.4 to 9.6 medium to high K calc-alkaline von Quadt and others, 2002; Kouzmanov and others, 2009.
Central Iran syn- and postcollision adakite 59–66 ~0.94–1.32 >20 30–35 15.58–15.65 0.7043–0.7047 0.51260 to 0.51287 -- calc-alkalic, alkali-calcic Shafiei and others, 2009.Xing’an-Mongolian Orogenic Belt subduction? syncollision? adakite 66–72 ~1.04–1.17 8–22 10–49? -- -- -- -- calc-alkaline Ge WenChun and others, 2007.Tibet, Gangdese subduction-collision adakite 61–72 ~1–1.2 19–40 30–80? 15.50–15.64 -- -- -- high K calcalkaline,
shoshoniticQu Xiaoming and others, 2007.
Tibet, Lhunzub basin continental collision -- 66–84 >1.19 4–14 3–31? 15.50–15.62 -- -- -- calc-alkaline to high K calc-alkaline
Wang and others, 2007.
Northwest China, Tuwu-Yandong subduction adakite 65–73 >1.0 5–19 26–134? 15.39–15.44 0.7032–0.7038 5.0 to 9.4 -- calc-alkaline Zhang and others, 2006.West China, Tuwu subduction adakite 64–81 ~1.1–1.3 8–13 34–137 15.40–15.45 0.7039–0.7067 -- -- calc-alkaline Han and others, 2006.South China, western Yunnan collision? -- 67–70 -- 7–18 -- ~15.44–15.63 >0.7060 -- -- alkaline Xu and others, 2007.South China, Dexing extensional adakite 59–68 ~0.85–1.1 24–65 34–254 -- 0.7044–0.7047 -1.14 to 1.80 -- calc-alkaline Wang and others, 2006.East-Central China, Yangtze subduction adakite 54–64 >1.0 8–17 17–78 -- -- -- -- high K calcalkaline, shoshonite Jiancheng Xie and others, 2009.East China, Tongshankou intracontinental extension? adakite 61–64 0.7–1.0 26–75 60–92 -- 0.7062–0.7067 -4.37 to -4.63 -3.3 to -7.6 high K calc-alkaline,
shoshoniticLi and others, 2008.
East China, Luzong extensional adakite 56–70 >1.1 8–23 22–60? 15.45-15.62 0.7051- 0.7057 -3.46 to -6.28 -- middle to high K calcalkaline, shoshonite
Qiang Wang and others, 2006.
Table N2. General chemical characteristics of selected porphyry copper-molybdenum stocks. —Continued
96 Porphyry Copper Deposit Model
copper deposits in the Mongolian Orogenic Belt are character-ized by SiO2 contents mostly about 70 weight percent, with Na2O less than K2O, and ASI values between 1.04 and 1.17 (Ge and others, 2007). The major-element compositions of the porphyry copper deposit-related granodiorites resemble those of adakites. In this area, the barren monzogranites and granodiorites represent an early episode of magmatism, and the ore-bearing granodioritic porphyry formed relatively late. Porphyry copper-molybdenum deposits in eastern China are associated with adakitelike rocks related to partial melts of metasomatized mantle peridotite in an extensional environ-ment (Li and others, 2008). The major and trace elemental abundances show 61–64 weight percent SiO2, 2.1–3.5 weight percent, Na2O, and 3.3–5.8 weight percent K2O, and are clas-sified as high-potassium calc-alkaline or shoshonitic. MgO and Mg# (molar 100×MgO/[MgO+FeOT]) are 0.9–2.3 weight percent and 32–49, respectively. Calculated A/CNK values (molar Al2O3/[CaO+Na2O+K2O]) are 0.7–1.0, indicating a metaluminous composition. Both a subduction-related origin and a crustal-melting origin can be ruled out. The mineral-izing adakitelike rocks reflect an enriched lithospheric mantle metasomatized by slab-derived fluids and(or) melts related to an ancient subduction processes.
In other parts of Asia, the genesis of porphyry copper systems is ascribed to various collisional and postcollisional tectonic settings. The alkali-rich porphyry belt in western Yunnan is interpreted to be related to partial melting in a disjointed region between upper mantle lithosphere of the Yangtze Plate and Gondwana, and lies within a shear zone between buried Palaeo-Tethyan oceanic lithosphere and upper mantle lithosphere caused by the subduction and collision of India and Asia. Quartz-albite porphyry, quartz-potassium feldspar porphyry and biotite–potassium feldspar porphyry in western Yunnan are characterized by high alkali contents [(K2O+Na2O) greater than 10 weight percent], and high silica (SiO2 greater than 65 weight percent) contents (Xu and others, 2007). Ore-bearing porphyries in the Gang-dese copper belt range in SiO2 from 60.9 to 72.4 weight percent, are also enriched in K2O from 2.34 to 7.43 weight percent, and are classified as high-potassium calc-alkaline and shoshonite (Xiaoming and others, 2007). The porphyries are consistent with magmatism produced during relaxation in the late stages of the progression from late orogenic to postcollisional tectonic settings. The Paleocene collision-related granite porphyries of the Lhunzhub Basin in Tibet were emplaced during the Indo-Asian continental collision
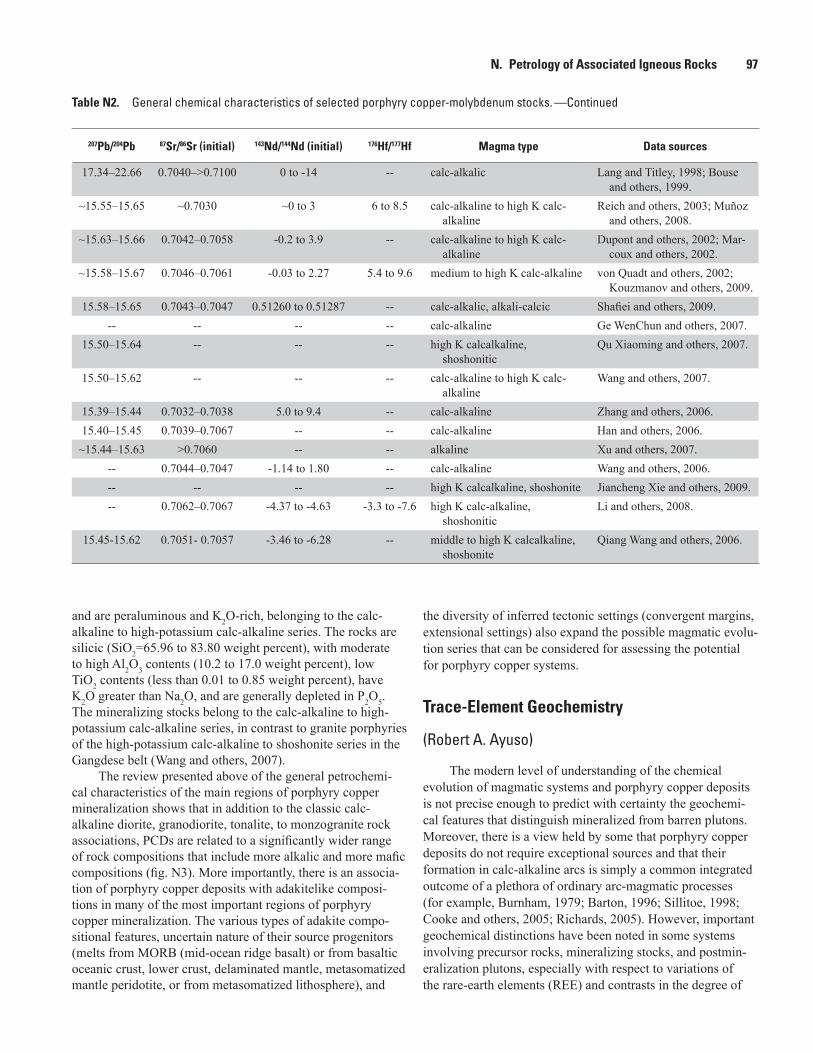
Table N2. General chemical characteristics of selected porphyry copper-molybdenum stocks. —Continued
Region Tectonic settingPresence of adakite
SiO2 weight percent
ASI La/Yb Sr/Y 207Pb/204Pb 87Sr/86Sr (initial) 143Nd/144Nd (initial) 176Hf/177Hf Magma type Data sources
Arizona subduction? -- 57–72 0.7–1.95 4–22 25–60? 17.34–22.66 0.7040–>0.7100 0 to -14 -- calc-alkalic Lang and Titley, 1998; Bouse and others, 1999.
Andes subduction adakite 62–72 ~1 25–60 100–300 ~15.55–15.65 ~0.7030 ~0 to 3 6 to 8.5 calc-alkaline to high K calc-alkaline
Reich and others, 2003; Muñoz and others, 2008.
Romania, South Carpathians subduction? -- 50–67 ~0.7? 10–20 45–65? ~15.63–15.66 0.7042–0.7058 -0.2 to 3.9 -- calc-alkaline to high K calc- alkaline
Dupont and others, 2002; Mar-coux and others, 2002.
Bulgaria, Panagyurishte district subduction -- 70–76 -- 10–17 7–50 ~15.58–15.67 0.7046–0.7061 -0.03 to 2.27 5.4 to 9.6 medium to high K calc-alkaline von Quadt and others, 2002; Kouzmanov and others, 2009.
Central Iran syn- and postcollision adakite 59–66 ~0.94–1.32 >20 30–35 15.58–15.65 0.7043–0.7047 0.51260 to 0.51287 -- calc-alkalic, alkali-calcic Shafiei and others, 2009.Xing’an-Mongolian Orogenic Belt subduction? syncollision? adakite 66–72 ~1.04–1.17 8–22 10–49? -- -- -- -- calc-alkaline Ge WenChun and others, 2007.Tibet, Gangdese subduction-collision adakite 61–72 ~1–1.2 19–40 30–80? 15.50–15.64 -- -- -- high K calcalkaline,
shoshoniticQu Xiaoming and others, 2007.
Tibet, Lhunzub basin continental collision -- 66–84 >1.19 4–14 3–31? 15.50–15.62 -- -- -- calc-alkaline to high K calc-alkaline
Wang and others, 2007.
Northwest China, Tuwu-Yandong subduction adakite 65–73 >1.0 5–19 26–134? 15.39–15.44 0.7032–0.7038 5.0 to 9.4 -- calc-alkaline Zhang and others, 2006.West China, Tuwu subduction adakite 64–81 ~1.1–1.3 8–13 34–137 15.40–15.45 0.7039–0.7067 -- -- calc-alkaline Han and others, 2006.South China, western Yunnan collision? -- 67–70 -- 7–18 -- ~15.44–15.63 >0.7060 -- -- alkaline Xu and others, 2007.South China, Dexing extensional adakite 59–68 ~0.85–1.1 24–65 34–254 -- 0.7044–0.7047 -1.14 to 1.80 -- calc-alkaline Wang and others, 2006.East-Central China, Yangtze subduction adakite 54–64 >1.0 8–17 17–78 -- -- -- -- high K calcalkaline, shoshonite Jiancheng Xie and others, 2009.East China, Tongshankou intracontinental extension? adakite 61–64 0.7–1.0 26–75 60–92 -- 0.7062–0.7067 -4.37 to -4.63 -3.3 to -7.6 high K calc-alkaline,
shoshoniticLi and others, 2008.
East China, Luzong extensional adakite 56–70 >1.1 8–23 22–60? 15.45-15.62 0.7051- 0.7057 -3.46 to -6.28 -- middle to high K calcalkaline, shoshonite
Qiang Wang and others, 2006.
N. Petrology of Associated Igneous Rocks 97
and are peraluminous and K2O-rich, belonging to the calc-alkaline to high-potassium calc-alkaline series. The rocks are silicic (SiO2=65.96 to 83.80 weight percent), with moderate to high Al2O3 contents (10.2 to 17.0 weight percent), low TiO2 contents (less than 0.01 to 0.85 weight percent), have K2O greater than Na2O, and are generally depleted in P2O5. The mineralizing stocks belong to the calc-alkaline to high-potassium calc-alkaline series, in contrast to granite porphyries of the high-potassium calc-alkaline to shoshonite series in the Gangdese belt (Wang and others, 2007).
The review presented above of the general petrochemi-cal characteristics of the main regions of porphyry copper mineralization shows that in addition to the classic calc-alkaline diorite, granodiorite, tonalite, to monzogranite rock associations, PCDs are related to a significantly wider range of rock compositions that include more alkalic and more mafic compositions (fig. N3). More importantly, there is an associa-tion of porphyry copper deposits with adakitelike composi-tions in many of the most important regions of porphyry copper mineralization. The various types of adakite compo-sitional features, uncertain nature of their source progenitors (melts from MORB (mid-ocean ridge basalt) or from basaltic oceanic crust, lower crust, delaminated mantle, metasomatized mantle peridotite, or from metasomatized lithosphere), and
the diversity of inferred tectonic settings (convergent margins, extensional settings) also expand the possible magmatic evolu-tion series that can be considered for assessing the potential for porphyry copper systems.
Trace-Element Geochemistry
(Robert A. Ayuso)
The modern level of understanding of the chemical evolution of magmatic systems and porphyry copper deposits is not precise enough to predict with certainty the geochemi-cal features that distinguish mineralized from barren plutons. Moreover, there is a view held by some that porphyry copper deposits do not require exceptional sources and that their formation in calc-alkaline arcs is simply a common integrated outcome of a plethora of ordinary arc-magmatic processes (for example, Burnham, 1979; Barton, 1996; Sillitoe, 1998; Cooke and others, 2005; Richards, 2005). However, important geochemical distinctions have been noted in some systems involving precursor rocks, mineralizing stocks, and postmin-eralization plutons, especially with respect to variations of the rare-earth elements (REE) and contrasts in the degree of
98 Porphyry Copper Deposit Model
chemical evolution of the mineralizing stocks compared to barren plutons. The following section summarizes a few of the most important geochemical parameters that help distinguish mineralized from barren plutons related to porphyry copper provinces of the cordilleras of North and South America, Iran, China, and the Philippines.
The most applicable general model of magmatic evolu-tion of the igneous rocks associated with porphyry copper deposits includes highly oxidized, calc-alkaline magmas having a characteristic relative enrichment in the large-ion lithophile and fluid mobile elements (for example, Cs, Rb, Ba, U, K, Pb, and Sr). The magmas also have typical rela-tive depletions in multielement primitive mantle-normalized diagrams for niobium, tantalum, phosphorus, and titanium. Porphyry copper deposits are associated with multiphase, shallow (porphyritic rocks with aplitic groundmass), moder-ately evolved granitic rocks (as judged by chemical param-eters such as potassium/rubidium, and rubidium/strontium ratios, and moderate silica contents), sulfur-rich, and oxidized (high whole-rock values of Fe2O3/FeO) (for example, Rich-ards, 2003a). Intrusions and volcanic rocks of the magnetite-series (magnetite+titanite-bearing granitic rocks) comprise the magmatic systems (for example, Blevin and Chappell, 1992, 1995).
In the Andes, productive intrusions associated with porphyry deposits show compositional distinctions including fractionated REE patterns and depletions for manganese and thorium, and relative depletion in the heavy REE and yttrium compared to barren plutons (for example, Baldwin and Pearce, 1982; Kay and others, 1999; Richards and others, 2001; Richards, 2003a). Major porphyry deposits in the Peruvian-Chilean belt are hosted by more chemically evolved rocks (Richards, 2003a and references therein). In these systems, heavy REE and yttrium depletions are attributed to amphi-bole and(or) deep-crustal garnet fractionation and the low manganese content due to loss of manganese-rich fluids from the magma. In the El Teniente super large porphyry copper deposit, rock compositions point to a change from residual pyroxene to residual hornblende in the fractionating mineral assemblage. The geochemical changes are documented by values of lanthanum/ytterbium ratios increasing from the tholeiitic to calc-alkaline rocks (Kay and Kurtz, 2005, refer-enced in Camus, 2005). The mineralizing stocks at El Teniente have high lanthanum/ytterbium ratios (40–60) (Stern and Skewes, 1995; Camus, 2005). The geochemical evolution was interpreted to demonstrate a progression from low-pres-sure, anhydrous assemblages to medium-pressure, hydrous, and oxidizing assemblages that evolved to higher pressure, hydrous assemblages in the younger sequences. Hornblende occurs in the residue of fractional crystallization reactions and is proposed to be a key genetic feature (Kay and Kurtz, 2005). The younger sequences are in equilibrium with residual garnet. In other giant porphyry copper deposits, for example at Los Pelambres in central Chile, stocks related to mineraliza-tion have higher Sr/Y and LaN/YbN ratios than barren granitic rocks (Reich and others, 2003). The stocks also have strongly
fractionated chondrite-normalized REE patterns and generally have relatively depleted heavy REE patterns compared to the relatively flat and less fractionated REE patterns in the barren igneous rocks.
In the Western United States, Lang and Titley (1998) found distinctive REE chondrite-normalized patterns associ-ated with productive plutons in southeastern Arizona. The productive plutons have lower total REE contents, steeper slopes in chondrite-normalized REE patterns, with relative contents of the light REE that are less depressed than the heavy REE, increasing upward concavity in the heavy REE, and less negative (to even positive) europium anomalies rela-tive to barren intrusions and nonproductive stocks. Also, the high-field-strength elements (Zr, Hf, Ta, and Nb), manganese, and Y are depleted in productive stocks compared to nonpro-ductive stocks. Granitic rocks from both northern Mexico (Sonora) and Arizona are underlain by Precambrian basement. In northern Mexico, granitic rocks associated with porphyry copper (molybdenum-tungsten) deposits have higher total REE contents (in contrast to the mineralizing stocks in south-eastern Arizona), light REE fractionated patterns in chondrite-normalized plots and deeper negative europium anomalies than Laramide granitic rocks that did not interact with North American basement (Valencia-Moreno and others, 2001).
The REEs also have been used to highlight differences between barren and productive stocks in China (Zhitian and Kezhang, 1989) and Papua New Guinea (Lang and Titley, 1998), and from the copper-molybdenum-gold deposits in Iran and the Himalayan-Tibet orogenic zone (for example, Hou and others, 2007). The conclusions of these studies in Papua New Guinea closely parallel the results found in Arizona complexes (Lang and Titley, 1998). Geochemical comparisons of the ore-hosting porphyry granitic rocks and barren intrusions in southeastern Iran also show that ore-hosting porphyries are relatively depleted in manganese, Nb, Zr, Hf, Ti, and Y, have steeper chondrite-normalized REE patterns (heavy REE deple-tion), and have incipient depletion of the middle REE (upward concavity) compared to the barren intrusions (fig. 6, Shafiei and others, 2009).
The ore-bearing alkali-rich porphyries from the Himala-yan-Tibet orogenic zone are enriched in large-ion lithophile elements (potassium, rubidium, barium), have lower yttrium, and overall adakitic features (Zengqian and others, 2005). Other mineralizing stocks in the Mongolian Orogenic Belt also have distinctly low concentrations of Y and Yb, high Sr contents and high Sr/Y and (La/Yb)N ratios, which are similar to those of adakite (fig. N4). In contrast, the unmineralized plutons in the region have relatively high concentrations of Y and low (La/Yb)N ratios (Ge and others, 2007). The genetic link to adakites is again evident in the plagiogranites associ-ated with porphyry copper deposits in the Tuwu-Yandong copper porphyry belt of eastern Tianshan, northwest China (Zhang and others, 2006). The ore-bearing plagiogranite porphyries there are highly enriched in Rb, K, Th, and Sr and highly depleted in Nb, Ta, and Ti and the heavy rare-earth elements relative to post-ore quartz porphyries. Ratios of
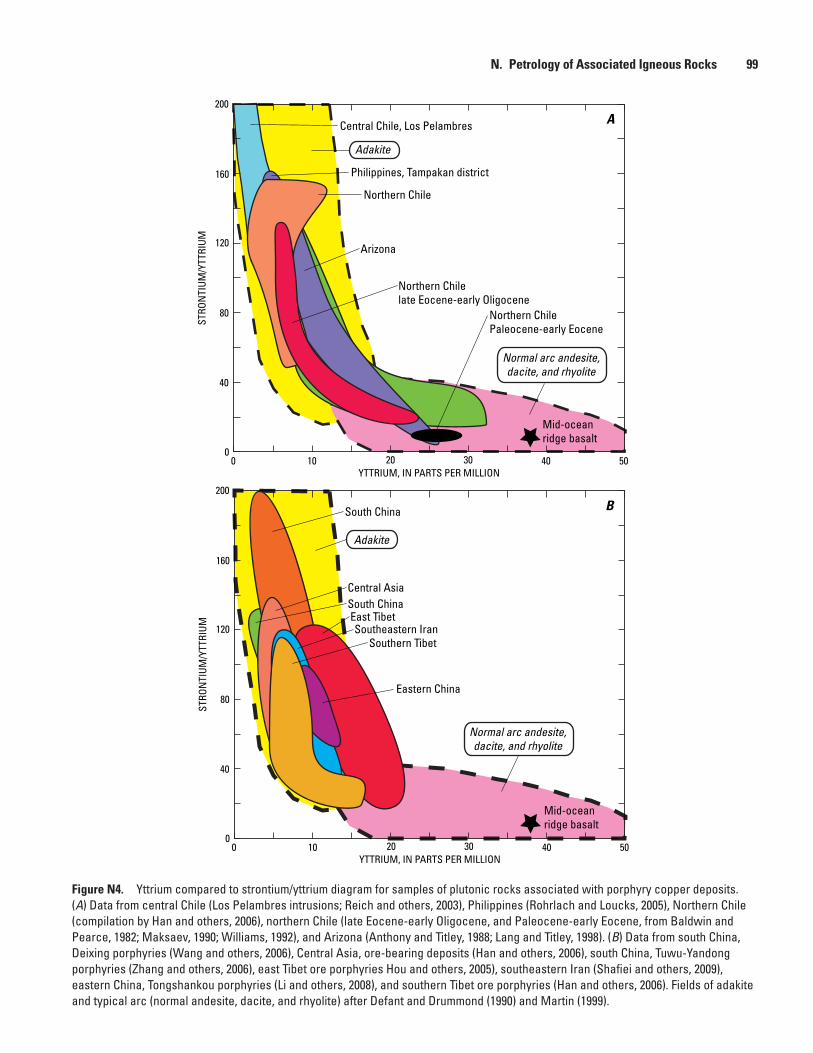
Figure N4. Yttrium compared to strontium/yttrium diagram for samples of plutonic rocks associated with porphyry copper deposits. (A) Data from central Chile (Los Pelambres intrusions; Reich and others, 2003), Philippines (Rohrlach and Loucks, 2005), Northern Chile (compilation by Han and others, 2006), northern Chile (late Eocene-early Oligocene, and Paleocene-early Eocene, from Baldwin and Pearce, 1982; Maksaev, 1990; Williams, 1992), and Arizona (Anthony and Titley, 1988; Lang and Titley, 1998). (B) Data from south China, Deixing porphyries (Wang and others, 2006), Central Asia, ore-bearing deposits (Han and others, 2006), south China, Tuwu-Yandong porphyries (Zhang and others, 2006), east Tibet ore porphyries Hou and others, 2005), southeastern Iran (Shafiei and others, 2009), eastern China, Tongshankou porphyries (Li and others, 2008), and southern Tibet ore porphyries (Han and others, 2006). Fields of adakite and typical arc (normal andesite, dacite, and rhyolite) after Defant and Drummond (1990) and Martin (1999).
Northern Chile
Central Chile, Los Pelambres
Arizona
Northern Chilelate Eocene-early Oligocene
Mid-ocean ridge basalt
Philippines, Tampakan district
Normal arc andesite, dacite, and rhyolite
Adakite
Northern ChilePaleocene-early Eocene
South China
Eastern China
East Tibet
Normal arc andesite, dacite, and rhyolite
Adakite
STRO
NTI
UM/Y
TTRI
UM
YTTRIUM, IN PARTS PER MILLION0 10 20 30 40 50
0
40
80
120
160
200
Southern Tibet
Central Asia
Southeastern Iran
South China
STRO
NTI
UM/Y
TTRI
UM
YTTRIUM, IN PARTS PER MILLION0 10 20 30 40 50
0
40
80
120
160
200
A
B
Mid-ocean ridge basalt
N. Petrology of Associated Igneous Rocks 99
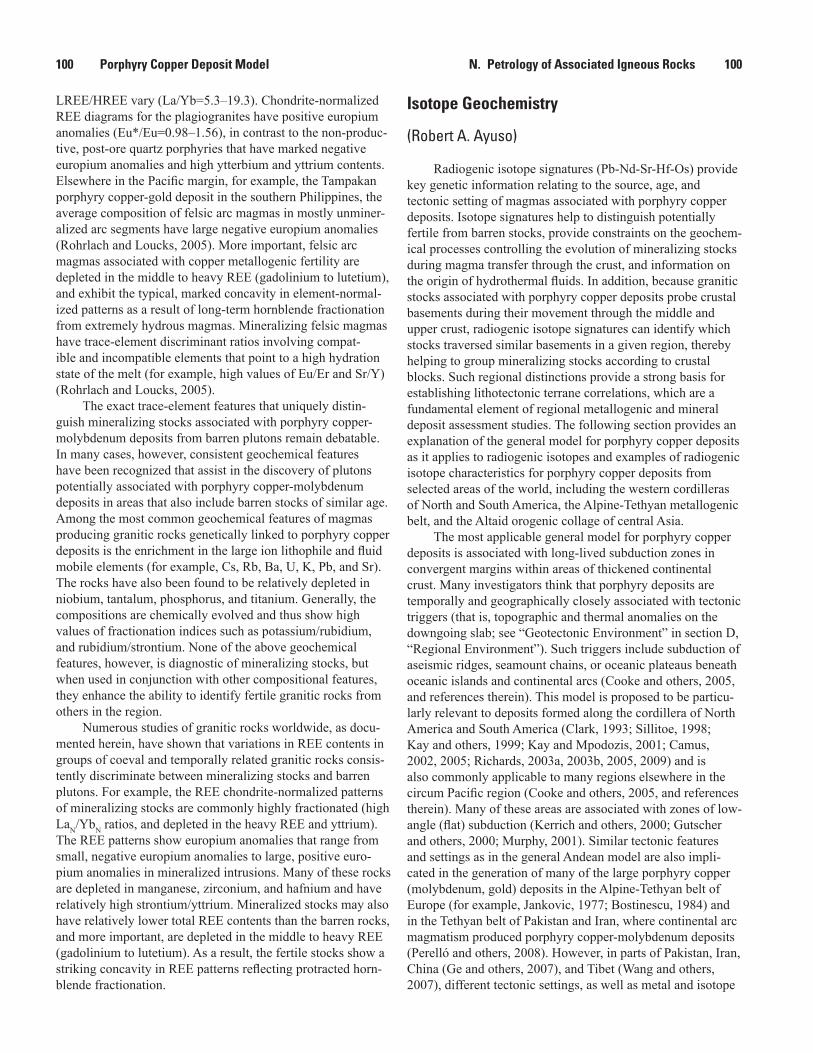
100 Porphyry Copper Deposit Model N. Petrology of Associated Igneous Rocks 100
LREE/HREE vary (La/Yb=5.3–19.3). Chondrite-normalized REE diagrams for the plagiogranites have positive europium anomalies (Eu*/Eu=0.98–1.56), in contrast to the non-produc-tive, post-ore quartz porphyries that have marked negative europium anomalies and high ytterbium and yttrium contents. Elsewhere in the Pacific margin, for example, the Tampakan porphyry copper-gold deposit in the southern Philippines, the average composition of felsic arc magmas in mostly unminer-alized arc segments have large negative europium anomalies (Rohrlach and Loucks, 2005). More important, felsic arc magmas associated with copper metallogenic fertility are depleted in the middle to heavy REE (gadolinium to lutetium), and exhibit the typical, marked concavity in element-normal-ized patterns as a result of long-term hornblende fractionation from extremely hydrous magmas. Mineralizing felsic magmas have trace-element discriminant ratios involving compat-ible and incompatible elements that point to a high hydration state of the melt (for example, high values of Eu/Er and Sr/Y) (Rohrlach and Loucks, 2005).
The exact trace-element features that uniquely distin-guish mineralizing stocks associated with porphyry copper-molybdenum deposits from barren plutons remain debatable. In many cases, however, consistent geochemical features have been recognized that assist in the discovery of plutons potentially associated with porphyry copper-molybdenum deposits in areas that also include barren stocks of similar age. Among the most common geochemical features of magmas producing granitic rocks genetically linked to porphyry copper deposits is the enrichment in the large ion lithophile and fluid mobile elements (for example, Cs, Rb, Ba, U, K, Pb, and Sr). The rocks have also been found to be relatively depleted in niobium, tantalum, phosphorus, and titanium. Generally, the compositions are chemically evolved and thus show high values of fractionation indices such as potassium/rubidium, and rubidium/strontium. None of the above geochemical features, however, is diagnostic of mineralizing stocks, but when used in conjunction with other compositional features, they enhance the ability to identify fertile granitic rocks from others in the region.
Numerous studies of granitic rocks worldwide, as docu-mented herein, have shown that variations in REE contents in groups of coeval and temporally related granitic rocks consis-tently discriminate between mineralizing stocks and barren plutons. For example, the REE chondrite-normalized patterns of mineralizing stocks are commonly highly fractionated (high LaN/YbN ratios, and depleted in the heavy REE and yttrium). The REE patterns show europium anomalies that range from small, negative europium anomalies to large, positive euro-pium anomalies in mineralized intrusions. Many of these rocks are depleted in manganese, zirconium, and hafnium and have relatively high strontium/yttrium. Mineralized stocks may also have relatively lower total REE contents than the barren rocks, and more important, are depleted in the middle to heavy REE (gadolinium to lutetium). As a result, the fertile stocks show a striking concavity in REE patterns reflecting protracted horn-blende fractionation.
Isotope Geochemistry
(Robert A. Ayuso)
Radiogenic isotope signatures (Pb-Nd-Sr-Hf-Os) provide key genetic information relating to the source, age, and tectonic setting of magmas associated with porphyry copper deposits. Isotope signatures help to distinguish potentially fertile from barren stocks, provide constraints on the geochem-ical processes controlling the evolution of mineralizing stocks during magma transfer through the crust, and information on the origin of hydrothermal fluids. In addition, because granitic stocks associated with porphyry copper deposits probe crustal basements during their movement through the middle and upper crust, radiogenic isotope signatures can identify which stocks traversed similar basements in a given region, thereby helping to group mineralizing stocks according to crustal blocks. Such regional distinctions provide a strong basis for establishing lithotectonic terrane correlations, which are a fundamental element of regional metallogenic and mineral deposit assessment studies. The following section provides an explanation of the general model for porphyry copper deposits as it applies to radiogenic isotopes and examples of radiogenic isotope characteristics for porphyry copper deposits from selected areas of the world, including the western cordilleras of North and South America, the Alpine-Tethyan metallogenic belt, and the Altaid orogenic collage of central Asia.
The most applicable general model for porphyry copper deposits is associated with long-lived subduction zones in convergent margins within areas of thickened continental crust. Many investigators think that porphyry deposits are temporally and geographically closely associated with tectonic triggers (that is, topographic and thermal anomalies on the downgoing slab; see “Geotectonic Environment” in section D, “Regional Environment”). Such triggers include subduction of aseismic ridges, seamount chains, or oceanic plateaus beneath oceanic islands and continental arcs (Cooke and others, 2005, and references therein). This model is proposed to be particu-larly relevant to deposits formed along the cordillera of North America and South America (Clark, 1993; Sillitoe, 1998; Kay and others, 1999; Kay and Mpodozis, 2001; Camus, 2002, 2005; Richards, 2003a, 2003b, 2005, 2009) and is also commonly applicable to many regions elsewhere in the circum Pacific region (Cooke and others, 2005, and references therein). Many of these areas are associated with zones of low-angle (flat) subduction (Kerrich and others, 2000; Gutscher and others, 2000; Murphy, 2001). Similar tectonic features and settings as in the general Andean model are also impli-cated in the generation of many of the large porphyry copper (molybdenum, gold) deposits in the Alpine-Tethyan belt of Europe (for example, Jankovic, 1977; Bostinescu, 1984) and in the Tethyan belt of Pakistan and Iran, where continental arc magmatism produced porphyry copper-molybdenum deposits (Perelló and others, 2008). However, in parts of Pakistan, Iran, China (Ge and others, 2007), and Tibet (Wang and others, 2007), different tectonic settings, as well as metal and isotope
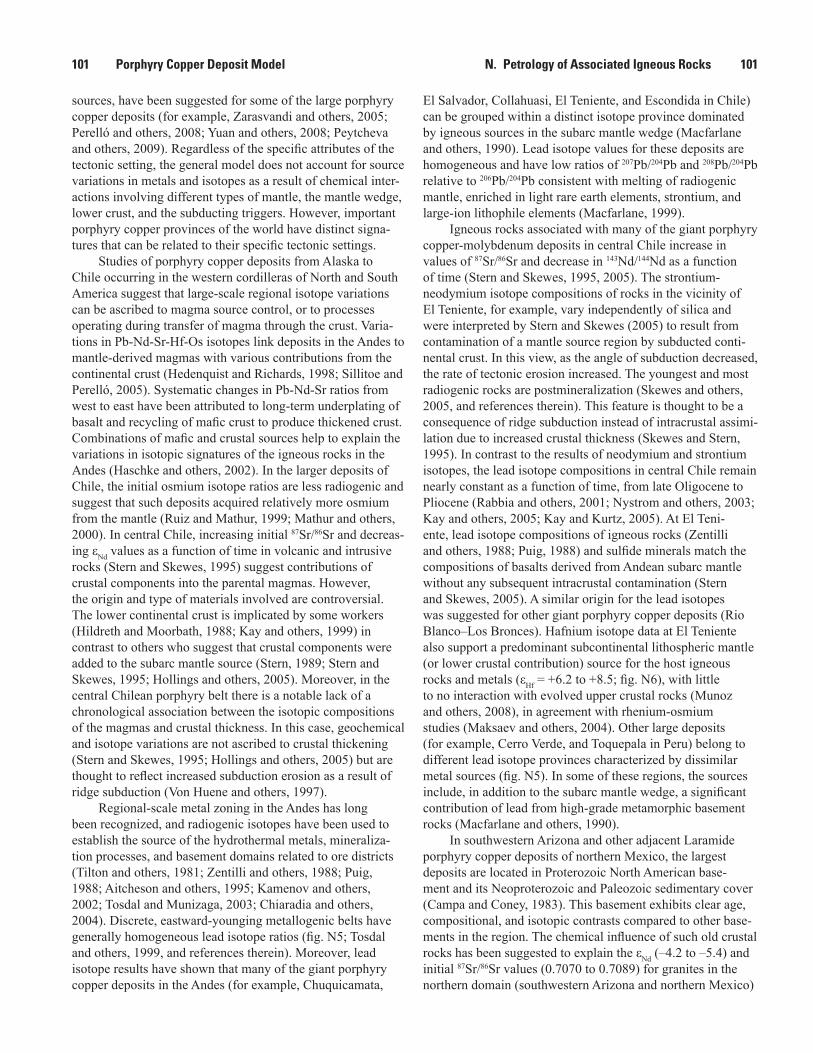
N. Petrology of Associated Igneous Rocks 101101 Porphyry Copper Deposit Model
sources, have been suggested for some of the large porphyry copper deposits (for example, Zarasvandi and others, 2005; Perelló and others, 2008; Yuan and others, 2008; Peytcheva and others, 2009). Regardless of the specific attributes of the tectonic setting, the general model does not account for source variations in metals and isotopes as a result of chemical inter-actions involving different types of mantle, the mantle wedge, lower crust, and the subducting triggers. However, important porphyry copper provinces of the world have distinct signa-tures that can be related to their specific tectonic settings.
Studies of porphyry copper deposits from Alaska to Chile occurring in the western cordilleras of North and South America suggest that large-scale regional isotope variations can be ascribed to magma source control, or to processes operating during transfer of magma through the crust. Varia-tions in Pb-Nd-Sr-Hf-Os isotopes link deposits in the Andes to mantle-derived magmas with various contributions from the continental crust (Hedenquist and Richards, 1998; Sillitoe and Perelló, 2005). Systematic changes in Pb-Nd-Sr ratios from west to east have been attributed to long-term underplating of basalt and recycling of mafic crust to produce thickened crust. Combinations of mafic and crustal sources help to explain the variations in isotopic signatures of the igneous rocks in the Andes (Haschke and others, 2002). In the larger deposits of Chile, the initial osmium isotope ratios are less radiogenic and suggest that such deposits acquired relatively more osmium from the mantle (Ruiz and Mathur, 1999; Mathur and others, 2000). In central Chile, increasing initial 87Sr/86Sr and decreas-ing εNd values as a function of time in volcanic and intrusive rocks (Stern and Skewes, 1995) suggest contributions of crustal components into the parental magmas. However, the origin and type of materials involved are controversial. The lower continental crust is implicated by some workers (Hildreth and Moorbath, 1988; Kay and others, 1999) in contrast to others who suggest that crustal components were added to the subarc mantle source (Stern, 1989; Stern and Skewes, 1995; Hollings and others, 2005). Moreover, in the central Chilean porphyry belt there is a notable lack of a chronological association between the isotopic compositions of the magmas and crustal thickness. In this case, geochemical and isotope variations are not ascribed to crustal thickening (Stern and Skewes, 1995; Hollings and others, 2005) but are thought to reflect increased subduction erosion as a result of ridge subduction (Von Huene and others, 1997).
Regional-scale metal zoning in the Andes has long been recognized, and radiogenic isotopes have been used to establish the source of the hydrothermal metals, mineraliza-tion processes, and basement domains related to ore districts (Tilton and others, 1981; Zentilli and others, 1988; Puig, 1988; Aitcheson and others, 1995; Kamenov and others, 2002; Tosdal and Munizaga, 2003; Chiaradia and others, 2004). Discrete, eastward-younging metallogenic belts have generally homogeneous lead isotope ratios (fig. N5; Tosdal and others, 1999, and references therein). Moreover, lead isotope results have shown that many of the giant porphyry copper deposits in the Andes (for example, Chuquicamata,
El Salvador, Collahuasi, El Teniente, and Escondida in Chile) can be grouped within a distinct isotope province dominated by igneous sources in the subarc mantle wedge (Macfarlane and others, 1990). Lead isotope values for these deposits are homogeneous and have low ratios of 207Pb/204Pb and 208Pb/204Pb relative to 206Pb/204Pb consistent with melting of radiogenic mantle, enriched in light rare earth elements, strontium, and large-ion lithophile elements (Macfarlane, 1999).
Igneous rocks associated with many of the giant porphyry copper-molybdenum deposits in central Chile increase in values of 87Sr/86Sr and decrease in 143Nd/144Nd as a function of time (Stern and Skewes, 1995, 2005). The strontium-neodymium isotope compositions of rocks in the vicinity of El Teniente, for example, vary independently of silica and were interpreted by Stern and Skewes (2005) to result from contamination of a mantle source region by subducted conti-nental crust. In this view, as the angle of subduction decreased, the rate of tectonic erosion increased. The youngest and most radiogenic rocks are postmineralization (Skewes and others, 2005, and references therein). This feature is thought to be a consequence of ridge subduction instead of intracrustal assimi-lation due to increased crustal thickness (Skewes and Stern, 1995). In contrast to the results of neodymium and strontium isotopes, the lead isotope compositions in central Chile remain nearly constant as a function of time, from late Oligocene to Pliocene (Rabbia and others, 2001; Nystrom and others, 2003; Kay and others, 2005; Kay and Kurtz, 2005). At El Teni-ente, lead isotope compositions of igneous rocks (Zentilli and others, 1988; Puig, 1988) and sulfide minerals match the compositions of basalts derived from Andean subarc mantle without any subsequent intracrustal contamination (Stern and Skewes, 2005). A similar origin for the lead isotopes was suggested for other giant porphyry copper deposits (Rio Blanco–Los Bronces). Hafnium isotope data at El Teniente also support a predominant subcontinental lithospheric mantle (or lower crustal contribution) source for the host igneous rocks and metals (εHf = +6.2 to +8.5; fig. N6), with little to no interaction with evolved upper crustal rocks (Munoz and others, 2008), in agreement with rhenium-osmium studies (Maksaev and others, 2004). Other large deposits (for example, Cerro Verde, and Toquepala in Peru) belong to different lead isotope provinces characterized by dissimilar metal sources (fig. N5). In some of these regions, the sources include, in addition to the subarc mantle wedge, a significant contribution of lead from high-grade metamorphic basement rocks (Macfarlane and others, 1990).
In southwestern Arizona and other adjacent Laramide porphyry copper deposits of northern Mexico, the largest deposits are located in Proterozoic North American base-ment and its Neoproterozoic and Paleozoic sedimentary cover (Campa and Coney, 1983). This basement exhibits clear age, compositional, and isotopic contrasts compared to other base-ments in the region. The chemical influence of such old crustal rocks has been suggested to explain the εNd (–4.2 to –5.4) and initial 87Sr/86Sr values (0.7070 to 0.7089) for granites in the northern domain (southwestern Arizona and northern Mexico)
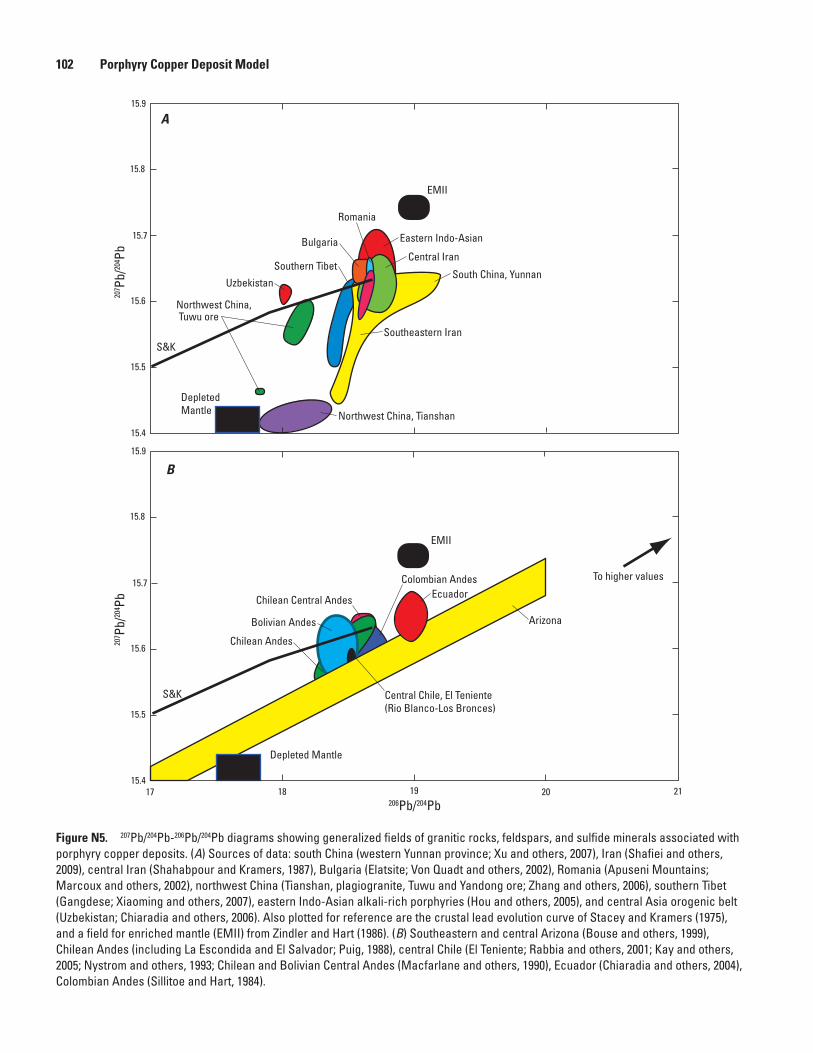
Figure N5. 207Pb/204Pb-206Pb/204Pb diagrams showing generalized fields of granitic rocks, feldspars, and sulfide minerals associated with porphyry copper deposits. (A) Sources of data: south China (western Yunnan province; Xu and others, 2007), Iran (Shafiei and others, 2009), central Iran (Shahabpour and Kramers, 1987), Bulgaria (Elatsite; Von Quadt and others, 2002), Romania (Apuseni Mountains; Marcoux and others, 2002), northwest China (Tianshan, plagiogranite, Tuwu and Yandong ore; Zhang and others, 2006), southern Tibet (Gangdese; Xiaoming and others, 2007), eastern Indo-Asian alkali-rich porphyries (Hou and others, 2005), and central Asia orogenic belt (Uzbekistan; Chiaradia and others, 2006). Also plotted for reference are the crustal lead evolution curve of Stacey and Kramers (1975), and a field for enriched mantle (EMII) from Zindler and Hart (1986). (B) Southeastern and central Arizona (Bouse and others, 1999), Chilean Andes (including La Escondida and El Salvador; Puig, 1988), central Chile (El Teniente; Rabbia and others, 2001; Kay and others, 2005; Nystrom and others, 1993; Chilean and Bolivian Central Andes (Macfarlane and others, 1990), Ecuador (Chiaradia and others, 2004), Colombian Andes (Sillitoe and Hart, 1984).
15.4
15.5
15.6
15.7
15.8
South China, Yunnan
Southeastern Iran
Central IranBulgaria
Romania
Northwest China, Tianshan
Northwest China, Tuwu ore
Southern Tibet
Eastern Indo-Asian
Depleted Mantle
EMII
S&K
207 Pb
/204 Pb
Uzbekistan
15.9
Colombian Andes
Central Chile, El Teniente(Rio Blanco-Los Bronces)
S&K
Ecuador
Arizona
To higher values
Chilean Andes
Chilean Central Andes
Bolivian Andes
Depleted Mantle
EMII
17 18 19 20 21206Pb/204Pb
A
B
15.4
15.5
15.6
15.7
15.8
207 Pb
/204 Pb
15.9
102 Porphyry Copper Deposit Model
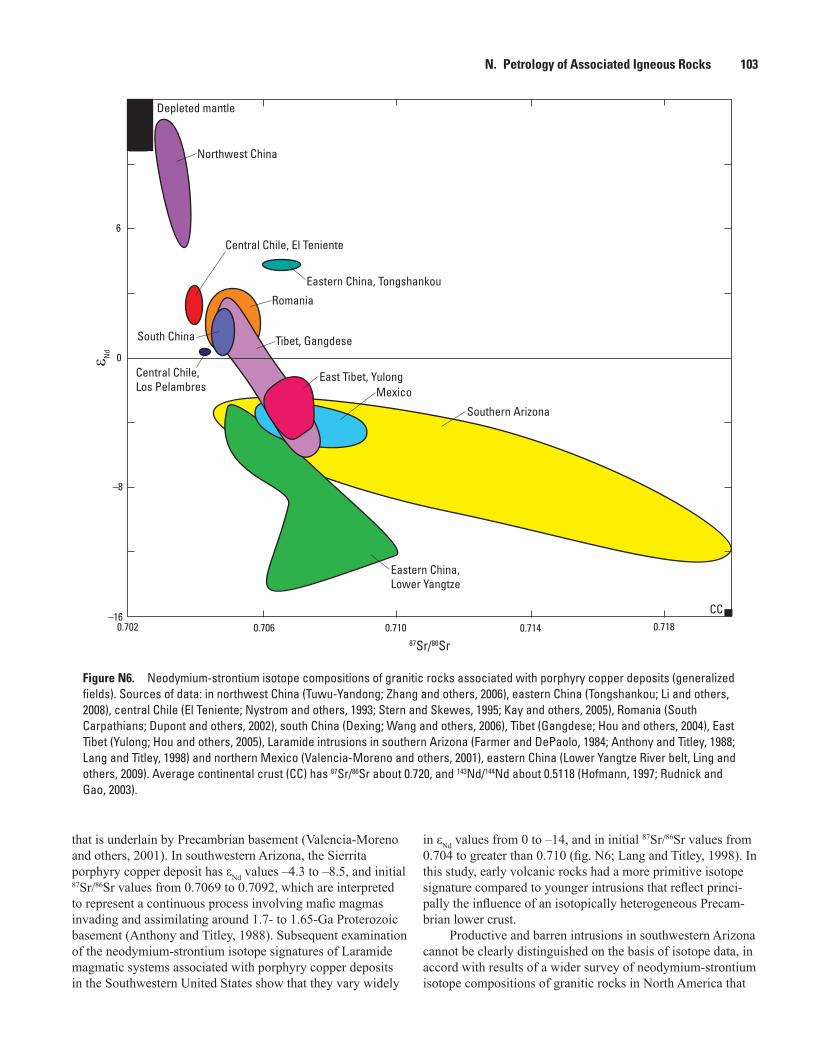
0
–8
–16
6
0.702 0.706 0.710 0.714 0.718
Eastern China, Lower Yangtze
CC
Mexico
Depleted mantle
Northwest China
Southern Arizona
South China
Eastern China, Tongshankou
Romania
Tibet, Gangdese
East Tibet, Yulong
Central Chile, El Teniente
Central Chile, Los Pelambres
87Sr/86Sr
ε Nd
Figure N6. Neodymium-strontium isotope compositions of granitic rocks associated with porphyry copper deposits (generalized fields). Sources of data: in northwest China (Tuwu-Yandong; Zhang and others, 2006), eastern China (Tongshankou; Li and others, 2008), central Chile (El Teniente; Nystrom and others, 1993; Stern and Skewes, 1995; Kay and others, 2005), Romania (South Carpathians; Dupont and others, 2002), south China (Dexing; Wang and others, 2006), Tibet (Gangdese; Hou and others, 2004), East Tibet (Yulong; Hou and others, 2005), Laramide intrusions in southern Arizona (Farmer and DePaolo, 1984; Anthony and Titley, 1988; Lang and Titley, 1998) and northern Mexico (Valencia-Moreno and others, 2001), eastern China (Lower Yangtze River belt, Ling and others, 2009). Average continental crust (CC) has 87Sr/86Sr about 0.720, and 143Nd/144Nd about 0.5118 (Hofmann, 1997; Rudnick and Gao, 2003).
N. Petrology of Associated Igneous Rocks 103
that is underlain by Precambrian basement (Valencia-Moreno and others, 2001). In southwestern Arizona, the Sierrita porphyry copper deposit has εNd values –4.3 to –8.5, and initial 87Sr/86Sr values from 0.7069 to 0.7092, which are interpreted to represent a continuous process involving mafic magmas invading and assimilating around 1.7- to 1.65-Ga Proterozoic basement (Anthony and Titley, 1988). Subsequent examination of the neodymium-strontium isotope signatures of Laramide magmatic systems associated with porphyry copper deposits in the Southwestern United States show that they vary widely
in εNd values from 0 to –14, and in initial 87Sr/86Sr values from 0.704 to greater than 0.710 (fig. N6; Lang and Titley, 1998). In this study, early volcanic rocks had a more primitive isotope signature compared to younger intrusions that reflect princi-pally the influence of an isotopically heterogeneous Precam-brian lower crust.
Productive and barren intrusions in southwestern Arizona cannot be clearly distinguished on the basis of isotope data, in accord with results of a wider survey of neodymium-strontium isotope compositions of granitic rocks in North America that
104 Porphyry Copper Deposit Model
also failed to distinguish between mineralized and barren systems (Farmer and DePaolo, 1984). Lead isotope composi-tions of Late Cretaceous and early Tertiary plutons and sulfide minerals associated with porphyry copper deposits in Arizona are heterogeneous (fig. N5; Wooden and others, 1988; Bouse and others, 1999). The lead isotope compositions of the Proterozoic basement rocks define several isotope provinces (and a number of smaller lead isotope subprovinces). Each of these provinces contains porphyry copper deposits. Magmatic lead is clearly implicated in and adjacent to major mineral-izing stocks, but lead isotope compositions of distal deposits commonly is more scattered, less magmatic in origin, and significantly more radiogenic. The lead isotope compositions cannot distinguish between large economic porphyry copper deposits and less rich and smaller deposits (Bouse and others, 1999).
In the Alpine-Tethyan metallogenic belt, porphyry copper deposits have lead isotope compositions that reflect a direct origin from associated calc-alkaline stocks with a primitive mantle-derived source (fig. N5; Marcoux and others, 2002). Similar lead isotope signatures characterize the deposits at a district scale, suggesting that they shared the same source of metals. Variably radiogenic lead isotope compositions provide evidence of magma transfer through different basements and various degrees of crustal assimilation. Strontium-neodymium isotope studies of porphyry copper-molybdenum deposits (initial 87Sr/86Sr = 0.7042 to 0.7058; εNd = –0.2 to +3.9, fig. N6) in the South Carpathians indicate that the calc-alkaline (to high-potassium calc-alkaline) mineralizing stocks represent magmas from heterogeneous lithospheric mantle, or young mafic crust derived from the mantle, which have been variably contaminated with upper crustal material (Dupont and others, 2002). Isotope studies of other porphyry deposits (Bulgaria) indicate that the mineralizing stocks originated from a mixed mantle-crust source (initial 87Sr/86Sr = 0.70492 to 0.70571; εNd = –0.03 to +2.27), that the magmas likely included an enriched mantle source (εHf = +5.4 to +6.9), and that the intru-sions contain radiogenic, inherited, crustal lead (von Quadt and others, 2002; Kouzmanov and others, 2009). Porphyry copper deposits from central Iran have fairly uniform lead isotope compositions for the mineralizing stocks, potassic alteration, and ore minerals, consistent with magmatic origins for the metals (Shahabpour and Kramers, 1987). Radiogenic lead isotope values characterize the sericitic alteration and indicate influx of meteoric water. The lead-strontium isotope compositions of the deposits are best explained as originating in subduction-related, primitive to mature island-arc settings. Other porphyry copper deposits in southern Iran, however, are associated with garnet-bearing stocks that have orogenic and mantle-derived lead, nonradiogenic strontium isotope (initial 87Sr/86Sr = 0.70425 to 0.70470), and neodymium isotope values (0.512596 to 0.512873). These data are consistent with a model for the mineralizing stocks involving interaction of collisional mantle-derived mafic, hydrous melts and thickened mafic lower crustal rocks (Shafiei and others, 2009).
In the Altaid orogenic collage of Central Asia, lead isotope compositions of mineral deposits (including porphyry copper-gold deposits) are terrane-dependent and characterized by variable contributions of the lower crust and MORB-type mantle (Chiaradia and others, 2006). The major porphyry copper deposits included here occur in western and southern China, Mongolia and Tibet, and eastern China. The large Tuwu porphyry copper deposit in western China constitutes an example of an ore-bearing porphyry with a deep-seated source and shallow emplacement (Han and others, 2006). Initial strontium isotope values of 0.7039 to 0.7067 indicate a predominant mantle source for the mineralizing stocks together with crustal contamination (Rui and others, 2002). In the Tuwu-Yandong porphyry copper belt, the mineralizing stocks and the ore minerals have similar Pb-Nd-Sr isotope compositions (Zhang and others, 2006). Moreover, the Pb-Nd-Sr isotopes match the values of typical MORB reservoirs; for example, plagiogranite porphyries and ore minerals plot on the mantle evolution curve for lead and resemble mantle-derived reservoirs for εNd (+5.0 to +9.4) and initial 87Sr/86Sr (0.70316 to 0.70378). The ore-bearing porphyries are thought to represent magmas with adakitelike affinities that formed during fast and oblique convergence (Zhang and others, 2006). A similar inter-pretation has been proposed for adakitic porphyries in south-ern China that are associated with an extensional environment instead of the typical compressional tectonic regime linked to slab-derived adakitic rocks (Wang and others, 2004, 2006). Values of εNd (–1.14 to +1.80) and initial 87Sr/86Sr (0.7044 to 0.7047) are similar to bulk earth and most likely reflect partial melting of delaminated lower crust, as asthenospheric mantle upwelled in a rift zone.
In the Mongolian Orogenic Belt, voluminous granites and associated porphyry copper deposits are characterized by low initial strontium isotope ratios, positive εNd values, and relatively young neodymium model ages (0.5–1.0 Ga), indicat-ing juvenile crustal growth (Ge and others, 2007). Some of the deposits are ascribed to subduction of the Pacific plate in the Mesozoic, and others to collision of crustal blocks in the Early Paleozoic. In the southern Tibetan Plateau, porphyry copper (molybdenum, gold) deposits consist of subduction-related, shoshonitic to high-potassium calc-alkaline series, late orogenic granitic porphyries generated during postcollisional crustal relaxation (Xiaoming and others, 2007). Lead isotope data for the stocks and ore minerals match, and the lead isotope signatures can be divided into distinct lead isotope provinces. The most likely sources of metals are Indian Oceanic MORB with a contribution from Indian Oceanic sediments. This interpretation is consistent with an origin for the porphyry magmas from partial melting of subducted oceanic crust and mantle wedge components. Other large porphyry copper deposits in Tibet (Qulong) are also associ-ated with shoshonitic, calc-alkaline stocks with nonradiogenic strontium isotope values, but their genesis is controversial (Zheng and others, 2007). The deposits have been alterna-tively taken as adakites from slab melting, lower crustal melts, magmas from mantle delamination, or magmas from melting
N. Petrology of Associated Igneous Rocks 105
of metasomatized lithosphere. Recent Pb-Nd-Sr-Hf isotope studies suggest that stocks are fractionated products that evolved from dioritic magma derived from a newly formed mafic lower crustal source and belonging to the postcollisional class (Yang and others, 2008).
In eastern China, porphyry copper-molybdenum deposits related to adakitelike rocks have εNd (–4.37 to –4.63), initial 87Sr/86Sr (0.7062 to 0.7067), and εHf (–3.3 to –7.6) that indicate the involvement of crustal components into the mantle source (Li and others, 2008). Porphyry copper-gold deposits asso-ciated with alkaline porphyries in western Yunnan, China, are best interpreted as resulting from partial melting along a regional shear zone (Xu and others, 2007, and references therein). Moreover, other porphyry copper deposits in the region have been linked to various genetic models (and highly variable metal sources), including rift-related, intraplate defor-mational, and strike slip. Relatively radiogenic lead isotopes and initial 87Sr/86Sr isotope variations (greater than 0.706) suggest that the origin of the alkaline porphyries in western Yunnan, China, can be linked to multiple mantle-derived sources, including N-MORB (normal type of mid-ocean ridge basalt), EMII (mantle enriched in incompatible elements as a result of incorporation of sediments), and OIB (ocean island basalt).
The foregoing review of the radiogenic isotope compo-sitions of rocks and metal sources from selected porphyry copper deposits worldwide indicates that wide isotope variations and significant differences in isotope signatures characterize metal-enriched provinces compared to those normally present in long-lived subduction zones. The associa-tion of many porphyry copper deposits with ridge subduc-tion processes and adakitelike compositions is documented globally. The wide range of lithologic sources capable of explaining adakite compositional features and the multiplicity of inferred tectonic environments also enlarge the potential contributors that can be related to porphyry copper systems (figs. N5 and N6). For example, Andean porphyry copper sources can be generalized as juvenile and characterized by minor contributions of crustal material (fig. N6). However, in northwest China, the sources associated with porphyry copper systems range from predominantly mantle-derived to those in eastern China that indicate primarily old, evolved crustal sources (fig. N6). The Laramide plutons in southwestern Arizona and northern Mexico, in contrast, reflect the prepon-derant control of ancient crustal basements (fig. N6). Lead isotope signatures also indicate the influence of the mantle in the Andean rocks (central Chile, Bolivia, and Colombia) and help detect input from crustal sources (Ecuador). In China and Tibet, isotope signatures show a wide range, implicating nearly exclusively mantle sources in some cases (northwest China) to compositions typical of average crust (southern Tibet) (fig. N5).
Differences in isotope signatures among the porphyry copper regions and those thought to be available in long-lived subduction zones may to some degree reflect the nature and chemical influence of thermal triggers, such as subducted
ridges, ocean plateaus, and seamount chains, associated with porphyry copper metallogenesis (Cooke and others, 2005) and lode gold generation (Haeussler and others, 1995). A possible function of ridge subduction and slab window generation (Dickinson and Snyder, 1979; Thorkelson, 1996), as well as related magmatic rocks (and mineralization), has been documented in many subduction zones in the Circum-Pacific (McCrory and Wilson, 2009; Bradley and others, 2003). Such areas include the United States–Canadian northwest (Breit-sprecher and others, 2003), Mexico (Benoit and others, 2002), Central America (Defant and Drummond, 1990), southern Chile (Lagabrielle and others, 1994), south Pacific (Whit-taker and others, 2007), and China (Ling and others, 2009, and references therein). However, the character and poten-tial chemical input of ridge subduction to magma and metal sources is poorly understood.
Based on an overview of ridge-trench interactions in modern and ancient settings, Sisson and others (2003) suggested that although no unique geological signature of ridge subduction events has been found, a combination of features that include igneous rock sequences and associated processes, records of thermal events, and changes in plate kinematics can be diagnostic. In some cases, it is thought that volatiles from the ridge metasomatize the mantle wedge, increase the sulfur flux (Hollings and others, 2005) and gener-ate oxidized melts that carry copper, gold, and sulfur from the mantle to the upper crust (Richards, 2003a). Near-trench plutons, as well as mafic and felsic intrusions developed in the slab window in south-central Alaska, for example, provide an excellent opportunity to identify the contribution of mantle-derived components into magmas generated by ridge subduc-tion (Sisson and others, 2003, and references therein). In this area, granitic batholiths and mafic and felsic intrusions associated with porphyry copper-molybdenum-gold deposits do not have obvious adakite features. In south-central Alaska, ridge/trench interaction produced hot, dense MORB-type basaltic magmas that upwelled into the opening slab window gap, interacted with peridotite in the mantle wedge underlying the volcanic arc, formed compositionally transitional MORB-like to arc magmas, and triggered partial melting of a hetero-geneous source region (Ayuso and others, 2008, 2009). The ultimate nature of the mantle-derived magma that interacted with the crust and its contribution to the metal inventory of the plutonic rocks during ridge subduction and slab window evolution is unclear. Ridge subduction acted predominantly as a migrating thermal trigger.
We conclude that our survey of radiogenic isotope signatures (Pb-Nd-Sr-Hf-Os) supply fundamental informa-tion about the igneous and metal sources, as well as tectonic environments of magmas linked to porphyry copper depos-its. The isotope signatures facilitate selection of fertile from barren igneous rocks, constrain geochemical processes during transport through the crust, and provide information on the evolution and source of hydrothermal fluids, despite the fact that in most cases available information is incomplete to identify exactly the relative contributions of mantle and
106 Porphyry Copper Deposit Model
crustal reservoirs. The radiogenic isotope signatures also can be used to identify groups of mineralizing stocks that passed through geologically comparable basements in a given region, helping in this way to distinguish mineralizing stocks on the basis of crustal, regional blocks. Radiogenic isotope data thus supply a reliable foundation for lithotectonic terrane correla-tions, which are an essential part of regional metallogenic assessment studies.
Radiogenic isotope studies, as summarized above, supply fundamental data on the age of mineralized systems, prov-enance of hydrothermal fluids, and source of metals. Isotope variations have provided key information to determine the source of metals in porphyry copper deposits worldwide and to discriminate granitic rocks potentially associated with porphyry copper-molybdenum deposits from barren stocks. Mineral exploration efforts have long used isotope data to identify prospects of similar age, which were affected by similar geochemical processes leading to ore formation and which share similar source isotopic signatures. For example, metal zoning at a continental scale was discovered in the Andes, central Asia, and Mongolia on the basis of lead isotopes. In other cases, for example in the Alpine-Tethyan metallogenic belt, the porphyry copper deposits have similar radiogenic isotope compositions, suggesting that they shared the same source of metals at a district scale. Distinct metallogenic belts were found in Chile that have generally homogeneous lead isotope ratios (but also neodymium and strontium). The isotope variations help to group mineralized stocks according to shared metal sources. Moreover, many of the giant porphyry copper deposits in South America are located in discrete isotope provinces that reflect genesis from the subarc mantle wedge. This information has been used for lithotectonic terrane correlations and constitutes an essential component of mineral-deposit assessment studies.
Although isotope data cannot discriminate between mineralized and barren stocks in southwestern Arizona and northern Mexico, the isotope signatures document the influ-ence of different basement domains. Mineralizing stocks and ore minerals closely resemble the basement rocks, suggest-ing that the metals were inherited from the old crustal rocks. This information can be used to group the porphyry copper mineralized stocks on the basis of the distribution of the differ-ent basements and may help to explain metal contents and ore/metal ratios in the porphyry copper deposits.
Radiogenic Isotopes of Ore
(Robert A. Ayuso)
Radiogenic isotope studies of ores have been used to determine the age of mineralized systems and the source of metals. Much of this work, as summarized herein and in sections discussed previously, historically has been focused on applications of the U-Th-Pb system using ore miner-als, particularly galena (Cannon and others, 1961) and other
sulfide or sulfosalt minerals that have low uranium contents compared to their lead contents (for example, Tosdal and others, 1999). The common lead isotope signatures of lead-rich ore minerals such as galena record instantly the isotope composition of the source reservoir and commonly remain undisturbed after deposition (no additional radiogenic lead growth as a function of time due to the absence of uranium and thorium in the galena crystal structure). The isotope compositions can then be interpreted to constrain age and metal sources using the compositions and evolution of model isotope reservoirs representing the mantle, and the lower and upper crust (for example, the plumbotectonics model of Zartman and Doe, 1981). Alternatively, evaluation of regional and local reservoirs is done by comparing the compositions of sulfide minerals, coeval magmatic rocks, and country rocks to ore minerals. This effort is appreciably more difficult as it requires measurement of the common lead compositions, as well as uranium, thorium, and lead concentrations. The elemental and isotopic data are used to calculate age-corrected compositions equivalent to the age of the ore minerals. This approach provides comparisons of the ore mineral composi-tions with local and regional isotope reservoirs and does not rely on generalized model isotope reservoirs. More recently, the scope of radiogenic isotope applications using ore minerals has expanded considerably with the advent of isotope systems such as rhenium-osmium using molybdenite, pyrite, and other sulfide minerals.
The radiogenic features of ore minerals, especially those related to galena, have been used extensively to investigate the relationship of isotope variations to identify major mineralized areas (for example, Cannon and others, 1971; Heyl and others, 1966; Stacey and others, 1968). Isotope data on ore minerals also have been used to identify prospects that have the same isotopic features, characterize large mineralized systems in a given region, and to distinguish various types of mineraliza-tion for exploration purposes (for example, Doe and Stacey, 1974; Doe, 1978; Godwin and Sinclair, 1982; Gulson and Mizon, 1980; Gulson, 1986). More complete insight into the sources of ore minerals (and by inference other metal sources) in a given hydrothermal system is obtained if the compositions of isotope reservoirs in the fluid-rock paths are also consid-ered. Samarium-neodymium and rubidium-strontium data are also obtained on ore minerals and gangue to further constrain the nature of the possible isotope reservoirs.
Many studies have shown that the lead isotope composi-tions of ore deposits reflect different scales of homogeneity (for example, Kerrich, 1991). Detailed radiogenic isotope studies of sulfides from porphyry copper deposits show that the contributions from external metal sources during hydro-thermal alteration often can be detected. For example, at the Porgera gold deposit in New Guinea, the ore minerals have a narrow range of lead isotope compositions, which differ from the spatially and genetically related porphyry-type rocks but more closely reflect the composition of sedimentary wall rocks (Richards and others, 1991). The extent of ore-mineral isotope homogeneity and similarity between the ore minerals and host
P. Petrology of Associated Metamorphic Rocks 107
igneous rocks is often expressed at the mine or district level, for example, in porphyry copper deposits from Romania, Iran, Colombian Andes, and Tibet (Marcoux and others, 2002; Shahabpour and Kramers, 1987; Sillitoe and Hart, 1984; Xiaoming and others, 2007). In contrast, lead isotopes of sulfide minerals (and by inference hydrothermal fluids) in Eocene to Pliocene porphyry copper-molybdenum deposits in Chile are relatively homogeneous over a distance of 1,000 km (for example, Puig, 1988; Williams, 1995; Tosdal and others, 1999; Tosdal and Munizaga, 2003). The ore minerals and host granodiorite porphyries in many Chilean deposits have similar isotope compositions (for example, El Salvador, Tosdal, 1995; Rio Blanco–Los Bronces, Kurtz and others, 1997) that can be related to a unique metal source, in contrast to other types of deposits in the region (Zentilli and others, 1988). However, unlike such examples of porphyry deposits directly linked to igneous metal sources, some show evidence of an external lead source. For example, at the Portrerillos-Cobre porphyry copper-molybdenum deposit, sulfide minerals from the potas-sic zone match the isotope compositions of the stocks but sulfides from late veins are similar to older igneous rocks in the vicinity (Tosdal and others, 1999).
Regional lead isotope studies of ore minerals in porphyry copper deposits in Arizona did not identify a distinctive source that could be attributed to all of the deposits (Bouse and others, 1999). In this case, the igneous rocks hosting the deposits and the ore minerals show a wide range in composi-tions that likely indicate the absence of a unique, regional hydrothermal fluid, in addition to contributions of diverse, local, rock and fluid isotope reservoirs during ore deposition. In some cases, for example, at the Baghdad porphyry copper-molybdenum deposit, chalcopyrite in the host granodiorite porphyry matches the lead isotope composition of the host igneous rocks. Sulfides from sericitic alteration, however, record the isotope contributions from the country rocks (Tosdal and others, 1999). Similar results were also found elsewhere in Arizona, at the Ray and Mineral Park deposits (Bouse and others, 1999).
Radiogenic isotope applications, particularly focused on uranium-thorium-lead isotope applications, provide important constraints on the regional source of metals and hydrothermal fluids in porphyry copper systems. Lead isotopes, in contrast to neodymium and strontium isotopes, can be routinely measured on rocks and ore minerals, providing information from three different radiogenic isotope schemes originating from parents that differ in geochemical behavior. Study of ore minerals in porphyry copper deposits, as previously described, assists in the identification of lead and metal sources in hydro-thermal systems, helps in the evaluation of isotope and metal contributions from external reservoirs as a result of fluid/rock
interaction, and contributes to the better understanding of large-scale controls on ore genesis.
Depth of Emplacement
(David A. John)
Ore zones at most porphyry copper deposits formed at depths ranging from less than 1 to 6 km (fig. E2; Seedorff and others, 2005). A few deposits were emplaced at greater depths, such as at Butte, Montana, where fluid inclusion data for ore fluids indicate early porphyry copper-molybdenum mineraliza-tion formed at about 7 to 9 km (Roberts, 1975; Rusk, Reed, and Dilles, 2008). Source plutons that produce ore fluids for PCDs are somewhat deeper, generally more than 3 to 10 km. In a systematic evaluation of depths of emplacement of over 1,600 Mesozoic and early Tertiary (Laramide) intrusions in the Western United States, Barton and others (1988) showed that porphyry deposits are widespread in areas where average depths of erosion were less than 8 km and were most abundant in those regions where erosional depths averaged less than 4 km (for example, southeast Arizona; fig. N7).
O. Petrology of Associated Sedimentary Rocks
Not relevant to this model.
P. Petrology of Associated Metamorphic Rocks
(David A. John)
Marbles, hornfels, and skarns may be developed during pluton emplacement and contact metamorphism and(or) metasomatism. Metamorphic assemblages formed during contact metamorphism contain low-pressure minerals such as andalusite and cordierite in aluminous rocks and lack garnets except in calcic rocks. As discussed in section D, “Relations to Metamorphic Rocks,” thermal metamorphic effects may indicate the presence of an unexposed pluton.
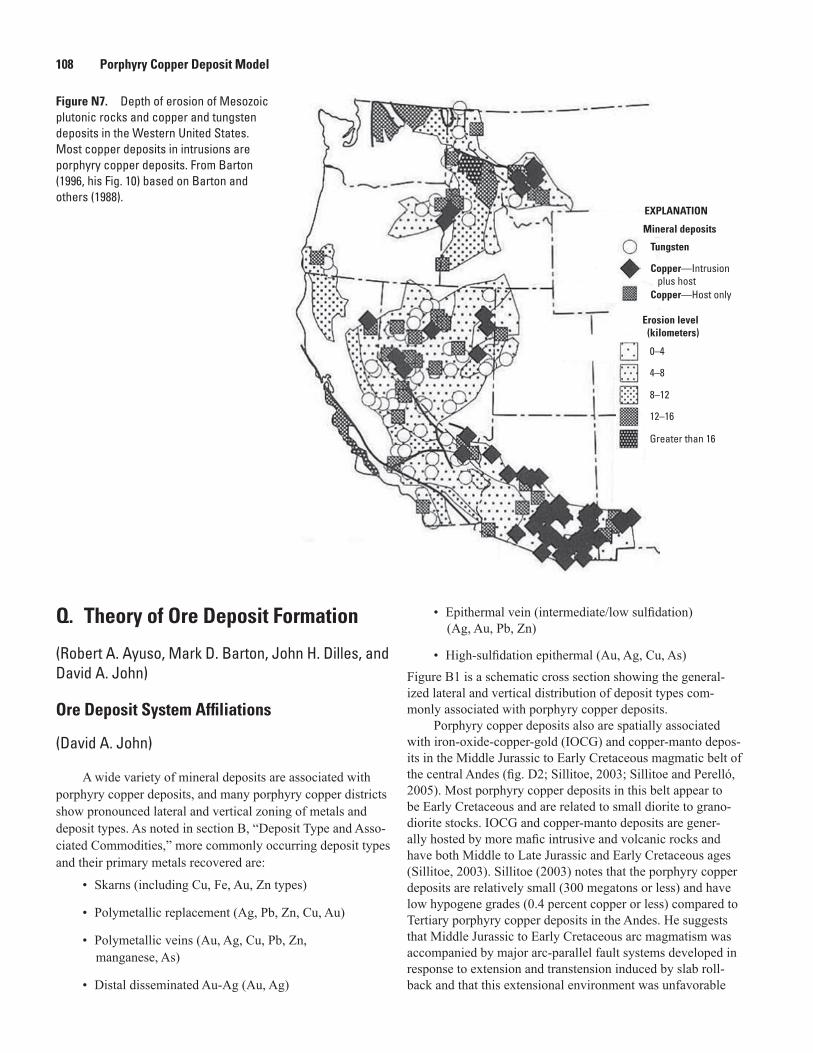
Mineral deposits
EXPLANATION
Tungsten
Copper—Intrusion plus hostCopper—Host only
Erosion level (kilometers)
0–4
4–8
8–12
12–16
Greater than 16
Figure N7. Depth of erosion of Mesozoic plutonic rocks and copper and tungsten deposits in the Western United States. Most copper deposits in intrusions are porphyry copper deposits. From Barton (1996, his Fig. 10) based on Barton and others (1988).
108 Porphyry Copper Deposit Model
Q. Theory of Ore Deposit Formation
(Robert A. Ayuso, Mark D. Barton, John H. Dilles, and David A. John)
Ore Deposit System Affiliations
(David A. John)
A wide variety of mineral deposits are associated with porphyry copper deposits, and many porphyry copper districts show pronounced lateral and vertical zoning of metals and deposit types. As noted in section B, “Deposit Type and Asso-ciated Commodities,” more commonly occurring deposit types and their primary metals recovered are:
• Skarns (including Cu, Fe, Au, Zn types)
• Polymetallic replacement (Ag, Pb, Zn, Cu, Au)
• Polymetallic veins (Au, Ag, Cu, Pb, Zn, manganese, As)
• Distal disseminated Au-Ag (Au, Ag)
• Epithermal vein (intermediate/low sulfidation) (Ag, Au, Pb, Zn)
• High-sulfidation epithermal (Au, Ag, Cu, As)Figure B1 is a schematic cross section showing the general-ized lateral and vertical distribution of deposit types com-monly associated with porphyry copper deposits.
Porphyry copper deposits also are spatially associated with iron-oxide-copper-gold (IOCG) and copper-manto depos-its in the Middle Jurassic to Early Cretaceous magmatic belt of the central Andes (fig. D2; Sillitoe, 2003; Sillitoe and Perelló, 2005). Most porphyry copper deposits in this belt appear to be Early Cretaceous and are related to small diorite to grano-diorite stocks. IOCG and copper-manto deposits are gener-ally hosted by more mafic intrusive and volcanic rocks and have both Middle to Late Jurassic and Early Cretaceous ages (Sillitoe, 2003). Sillitoe (2003) notes that the porphyry copper deposits are relatively small (300 megatons or less) and have low hypogene grades (0.4 percent copper or less) compared to Tertiary porphyry copper deposits in the Andes. He suggests that Middle Jurassic to Early Cretaceous arc magmatism was accompanied by major arc-parallel fault systems developed in response to extension and transtension induced by slab roll-back and that this extensional environment was unfavorable
Q. Theory of Ore Deposit Formation 109
for development of large, high-grade porphyry copper deposits (fig. D3; consult Tosdal and Richards, 2001).
Monzonitic alkaline epithermal gold systems may grade downward into higher temperature alteration and gold-rich porphyry copper systems (Jensen and Barton, 2000). The La Plata, Colorado, and Tuava (Emporer), Fiji, districts are examples where alkaline epithermal gold systems are superim-posed on or proximal to copper-mineralized porphyry centers (Jensen and Barton, 2000, table 1).
Controls on Permeability and Fluid Flow
(John H. Dilles)
The upper 10 km of continental crust in many cases can be demonstrated to contain ambient groundwaters under hydrostatic pressure conditions (Ingebritsen and Manning, 1999). In contrast, magma bodies that supply magmatic-hydrothermal fluids to PCDs lie at lithostatic conditions and are separated from the hydrostatically pressurized zone by a relatively impermeable zone. Fournier (1999) proposed that this impermeable zone is a result of quartz and biotite deforming ductilely under relatively low strain rates at high temperatures, whereas in the hydrostatic pressure environment at lower temperatures the same minerals and rocks have brittle deformation. Thus, the brittle/ductile transition marks the boundary between shallow advecting groundwaters and deep magmas and magmatic-hydrothermal fluids.
In the PCD environment, mafic magma injection, buoy-ancy of magmatic-hydrothermal fluids in granitoid cupolas, or far-field tectonic stresses may trigger high strain rates that cause the ductile carapace of the magma chamber to have brittle behavior and fracture. Once fractures initiate and magmatic-hydrothermal fluid rises, it expands and produces further fracturing through pressure-volume change energy (Henley and McNabb, 1978; Burnham, 1979; Burnham and Ohmoto, 1980; Geiger and others, 2005). The fractured zone typically extends to the volcanic environment and creates a near-vertical or upwardly radiating hydrofractured column of rock through which magmatic vapor rises in a plume (Henley and McNabb, 1978). A key element of production of the fracture permeability is that the ascending and depressurizing magmatic-hydrothermal fluid (or vapor) derived from magma at more than 5-km depth that contains about 5 weight percent dissolved salts enters a field of immiscibility between about 1,400 and 220 bars and from about 700°C to about 375°C separates into brine and vapor phases (fig. Q1). This fluid separation leads to significantly greater volume expansion of the fluid and buoyancy than would be expected otherwise. Likewise, if the source magma lies at less than 5-km depth, then both brine and vapor phases may be directly derived from the melt.
Fractures produced by the magmatic-hydrothermal fluid that form A, B, and D veins dictate virtually all fluid moves upward and outward under a pressure gradient from lithostatic to near-hydrostatic conditions. Magmatic-hydrothermal fluids
are overpressured with respect to ambient hydrostatically pres-sured fluids and displace these. The main flux of magmatic-hydrothermal fluids likely occurs at pressures intermediate between lithostatic and hydrostatic, with near-lithostatic pres-sures only occurring during sealing and low flow. Fractures typically are dominated during a single fluid-flow event by one strike direction with a vertical dip where far-field tectonic stress fields dominate, but the strike may change between intrusions. These fractures produce parallel or so-called sheeted vein sets and commonly subparallel porphyry dike orientations typical of most porphyry deposits (fig. D6B; consult Heidrick and Titley, 1982; Tosdal and Richards, 2001). Where such sheeted fractures dominate, they extend great distances (more than 5 km) laterally, as well as vertically from the source cupola and may host porphyry dikes and hydrother-mal alteration and provide fluid pathways for entry of external nonmagmatic fluids into the outer part of the hydrothermal system. Sodic-calcic alteration is therefore favored by envi-ronments, where the two subhorizontal principal stresses are significantly different and a dominant fracture set is formed such as at Yerington, Nevada, and in the Southwest United States (Dilles and Einaudi, 1992; Seedorff and others, 2008).
In a few examples, magma-centric forces dominate to form pluglike stocks and steeply dipping radial fractures and veins, as well as gently outwardly dipping concentric A, B, and D veins (fig. D6A; Tosdal and Richards, 2001). Such geometries are relatively common in rhyolite or Climax-type porphyry deposits, such as at Henderson, Colorado (Carten and others, 1993) but are only sometimes well developed adjacent to pluglike intrusions in porphyry copper deposits (for example, Alumbrera B and D veins, Proffett, 2003, and El Salvador D veins, Gustafson and Hunt, 1975).
Permeability in the column of rock from the cupola to the surface can be maintained as long as magmatic–hydrothermal fluids ascend from the cupola. When these fluid temperatures decrease, fracture permeability decreases by way of vein mineral precipitation. As noted by Fournier (1999), quartz is the principal gangue mineral and strongly dominates perme-ability by sealing along many pressure-temperature paths. Depressurizing and cooling hydrothermal fluids precipitate abundant A and B type quartz veins at about 700 to 500°C (consult Rusk and Reed, 2002), but retrograde quartz solubil-ity in the temperature range of 350 to 500°C typically leads to local cycles of dissolution and precipitation so that fractures do not seal between 500° and 350°C. For the same reason, nonmagmatic fluids may freely advect during heating to about 450°C without sealing.
Sources of Fluids and Metals
(Robert A. Ayuso)
A generalized model for porphyry copper deposits involves the interplay between magmatic metal sources and hydrothermal fluid systems manifested in igneous rocks that are related geographically, temporally, and genetically.
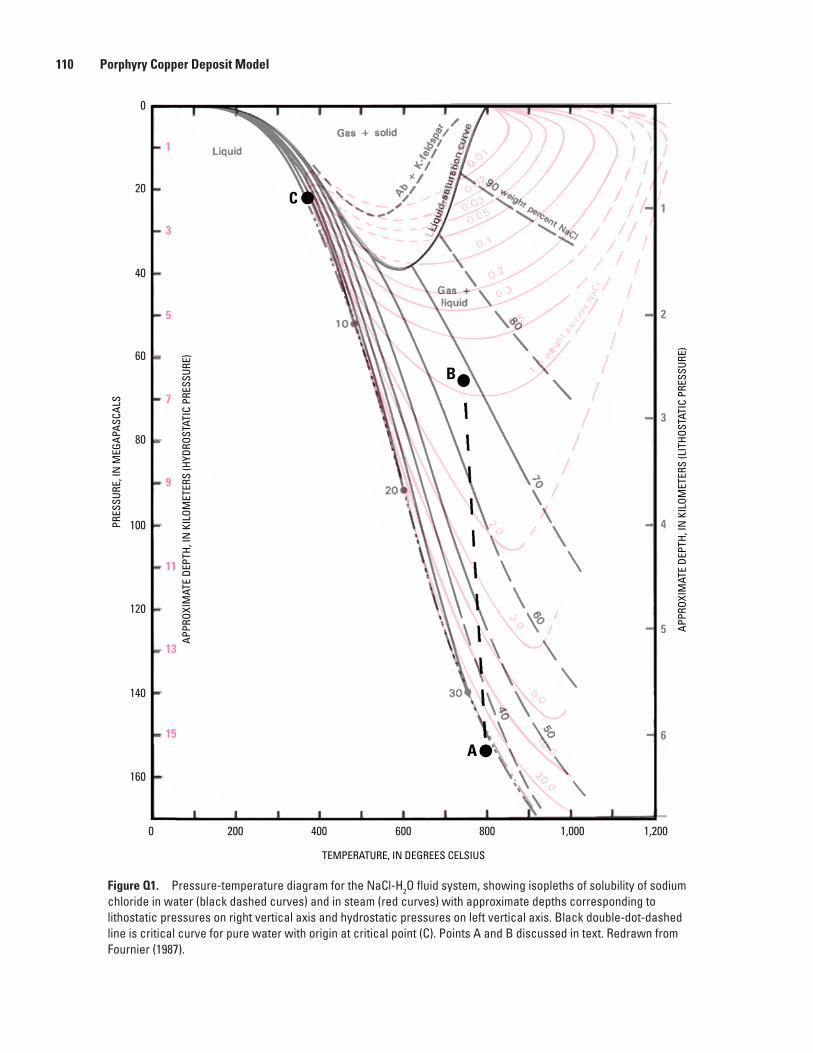
Figure Q1. Pressure-temperature diagram for the NaCl-H2O fluid system, showing isopleths of solubility of sodium chloride in water (black dashed curves) and in steam (red curves) with approximate depths corresponding to lithostatic pressures on right vertical axis and hydrostatic pressures on left vertical axis. Black double-dot-dashed line is critical curve for pure water with origin at critical point (C). Points A and B discussed in text. Redrawn from Fournier (1987).
B
A
C
APPR
OXIM
ATE
DEPT
H, IN
KIL
OMET
ERS
(LIT
HOST
ATIC
PRE
SSUR
E)
PRES
SURE
, IN
MEG
APAS
CALS
TEMPERATURE, IN DEGREES CELSIUS
0 200 400 600 800 1,000 1,200
60
40
20
160
140
120
100
80
1
3
5
7
9
11
13
15
APPR
OXIM
ATE
DEPT
H, IN
KIL
OMET
ERS
(HYD
ROST
ATIC
PRE
SSUR
E)
0
1
2
3
4
5
6
110 Porphyry Copper Deposit Model
Q. Theory of Ore Deposit Formation 111
Geologic studies have long established an intimate relation-ship between high-temperature mineral assemblages, vein abundances, and particular intrusions, demonstrating a close connection in space and time to magma emplacement and, by inference, magmatic sources of components (for example, El Salvador [Gustafson and Hunt, 1975], Yerington [Proffett, 1979; Dilles and Einaudi, 1992; Dilles and Proffett, 1995], Bajo de la Alumbrera [Proffett, 2003], Batu Hijau [Clode and others, 1999]). Similarly, isotopic, fluid inclusion, and melt inclusion studies indicate mostly a magmatic origin for high-temperature fluids in porphyry systems (for example, David-son and others, 2005; Harris and others, 2008), but there are instances in which external fluids were likely involved during ore formation (Frikken and others, 2005).
Magma-derived fluids in the classic orthomagmatic model (Burnham 1967, 1979; Whitney, 1984) containing water, salts, metals, and sulfur are extracted during second boiling. Intrusions emplaced at high crustal levels crystallize inward, resulting in volatile saturation and separation. The locus of key phase separation is uncertain and might result from deeper levels of crystallization (see summary in Sinclair, 2007). Many hydrothermal systems involve mixtures of magmatic fluids and nonmagmatic fluids. While the latter are best evidenced in the waning stages of hydrothermal activity, at least a few systems show clear evidence of involvement of cyclical alternation between magmatic and nonmagmatic fluids (for example, Carten, 1986). Such fluids react with cogenetic intrusions and overlying rocks and as a consequence may modify the porphyry copper (molybdenum, gold) deposit systems; but in most cases the fluids only redistribute and do not introduce additional ore components. We highlight below how the mantle and crustal sources associated with the general model for porphyry copper deposits explain the characteristic ore metal distributions by using selected global deposits.
The fundamental aspects of magma production in continental margins point to multiple, multistage processes summarized as the melting, assimilation, storage, and homogenization (MASH) model (Hildreth and Moorbath, 1988). Processes associated with the MASH model account for crustal contributions to Andean arc magmatism and are particularly valuable to emphasize the fundamental control of thick basement rocks in determining the non-mantle-derived metal inventory in porphyry deposits. There is general agreement that for the most part copper, gold, and the PGE in porphyry deposits point to mafic melts and lower crustal or mantle sources, and molybdenum, tungsten, and tin are derived from crustal sources or possibly from the subducting slab (for example, Seedorff and others, 2005). The nature of the upper crust is thought to have little influence on the fertil-ity of arc magmas, but it may exert some control on ore metal ratios (Kesler, 1973).
At El Teniente and other deposits in central and north-ern Chile, copper and molybdenum were derived from the mineralizing stocks, which had been ultimately formed from sub-Andean mantle contaminated by subduction of a small amount of pelagic and terrigenous sediment and continental
crust tectonically eroded off the continental margin (Stern and Skewes, 1995, 2005; Mathur and others, 2000). Copper, molybdenum, gold, platinum-group elements, and osmium were introduced into the crust from the mantle wedge and(or) subducted material (Sillitoe, 1972; Hedenquist and Richards, 1998; Ruiz and Mathur, 1999). At Los Pelambres porphyry copper deposit, the scale of the mineralization can be explained by recycling of metals associated with both the magmatic activity of a subducted hotspot chain and crustal material tectonically incorporated into the source region (Reich and others, 2003).
The source of the igneous rocks and ore metals in southwestern Arizona and northern Mexico likely includes basement rocks, older igneous rocks, and the lower crust. Hybridized lower continental sources are favored for lead and other metals in the mineralizing stocks and porphyry copper deposits (Bouse and others, 1999), although a continu-ous process of progressive assimilation involving mafic magmas invading and reacting with continental crust has also been suggested (Anthony and Titley, 1988). In southeastern Arizona, metal contents and ore/metal ratios in porphyry copper deposits may reflect the nature of the basement terranes (Titley, 2001). Similarly, in the case of the Laramide magmas from northern Mexico, interaction of magmas with base-ment rocks is thought to have had fundamental control on the metallogenesis of the large porphyry copper-molybdenum systems (Valencia-Moreno and others, 2001, 2007). In this case, Mexican porphyry systems underlain by North American crust are associated with copper, molybdenum, and tungsten deposits, whereas other, younger basement terranes are associ-ated with copper-gold deposits.
Porphyry copper deposits in southern Iran suggest that much of the metals and a significant proportion of sulfur were supplied from mafic melts derived from a mixed reservoir at the mantle/lowermost crust boundary and then recycled into intermediate-composition hybrid magmas produced by MASH-type processes (Shafiei and others, 2009).
Porphyry copper-gold deposits in the southern Altaids are distributed among several terranes characterized by various contributions of the lower crust and MORB-type mantle (Chiaradia and others, 2006). There is no unique basement or crustal reservoir supplying the huge amount of gold in these deposits. The Tuwu porphyry copper deposit in western China sulfur (and ore metals?) was derived from the deep crust or upper mantle (Han and others, 2006). In the Tuwu-Yandong porphyry copper belt, the ore-bearing plagiogranite porphyries point to MORB (basaltic oceanic crust) as the dominant source of copper, gold, water, and chlorine (Zhang and others, 2006). In the Dexing area of southern China, a similar interpreta-tion has been proposed for adakitic porphyries associated with an extensional environment (Wang and others, 2006). A mantle source is implicated for the chalcophile elements of the copper mineralization. Moreover, adakitic magmas derived by partial melting of delaminated lower crust are suggested as highly prospective for the generation of porphyry copper-gold deposits.
112 Porphyry Copper Deposit Model
Porphyry copper (molybdenum, gold) deposits in the southern Tibetan Plateau consist of subduction-related, late orogenic granitic porphyries generated from partial melting of subducted oceanic crust and mantle wedge components (Xiaoming and others, 2007). The most likely sources of metals are Indian Ocean MORB with a contribution from Indian Ocean sediments. Large porphyry copper deposits in Tibet (Zheng and others, 2007) and the mineralizing stocks (and copper, molybdenum, and other metals) are likely derived from a newly formed mafic lower crustal source region belonging to a postcollisional environment (Yang and others, 2008). Porphyry copper-molybdenum deposits in eastern China are related to partial melts of mantle (ore metal source?) (Li and others, 2008). In western Yunnan, China, porphyry copper-gold deposits associated with alkaline porphyries formed by partial melting of large masses of oceanic litho-sphere and upper-mantle lithosphere (Xu and others, 2007).
A survey of proposed sources of metals associated with porphyry copper deposits occurring within the North and South American Cordillera, and from selected deposits of major porphyry copper districts elsewhere, shows that the general porphyry copper model does not account for contribu-tions from recently documented metal and isotope sources that are different than those typically associated with long-lived subduction zones in convergent margins within areas of thickened continental crust. In the general model, the dominant sources of metals have been referred to as “mantle” and “crust” in general terms and have been attributed to the mantle wedge and(or) subducted materials that include pelagic and terrigenous sediment and to continental crust tectonically eroded off the continental margin. Attributing the genesis of all of the porphyry copper deposits described in this appraisal to the classic Andean model is overly simplistic. Additional types of mantle, for example, recycled and enriched mantle reservoirs such as HIMU (mantle characterized by highly radiogenic lead possibly reflecting recycling of ancient ocean crust lithosphere), EMII (reflecting incorporation of terrig-enous, continental sediment), and EMI (from recycling of mantle-wedge plus pelagic sediment) (Zindler and Hart, 1986; Dickin, 2005), and various types of crustal contributions have been identified elsewhere. Moreover, the function of adakites and their suggested magmatic sources, which include oceanic crust, thickened lower crust, metasomatized lithosphere, and delaminated mafic lower crust, have also notably extended the range of possible metal reservoirs involved with porphyry copper deposits. In addition, the nature and possible chemi-cal influence of low-angle subduction triggers (ridges, ocean plateaus, seamount chains, and so forth) thought to be asso-ciated with porphyry copper metallogenesis remain poorly understood. Recent research has also improved the under-standing of tectonic settings associated with porphyry copper deposits, and again, these show differences from the classic Andean convergent margin setting. For example, the Tethyan belt is associated with an area of continent-continent colli-sion (attempted subduction of a continental plate?). Moreover, there is now considerable geochemical data showing that
many adakitic porphyries in Asia are associated with an exten-sional environment, and that notable mineralization is related to shoshonitic to high-potassium calc-alkaline series granitic porphyries generated during postcollisional crustal relaxation. We conclude that the MASH model together with multistage igneous processes invoked for magma genesis and the increas-ingly varied set of tectonic settings associated with porphyry copper deposits suggest that a general subduction model is not broad enough to account for all the possible metal sources involved with porphyry copper deposits.
Chemical Transport and Transfer Processes
(Robert A. Ayuso)
The wealth of geologic, geochemical, and petrologic evidence shows that porphyry copper systems are fundamen-tally orthomagmatic with hydrothermal systems dominated by magma-derived fluids that carry and deposit metals, create associated hydrothermal alteration, and drive consanguine-ous fracturing (for example, Burnham 1967, 1979; Whitney, 1984). Emplacement and subsequent evolution of hydrous magma bodies in the upper crust is, of necessity, followed by separation and ascent of magmatic volatiles as the intrusions crystallize. Volatile phase supersaturation and separation can occur by a variety of mechanisms including crystallization and(or) saturation with decreasing pressure in a convecting magma column.
Fluid-phase separation from porphyry copper magmas fractionates metals, sulfur, and other ligands and controls sulfide mineral precipitation and results from density varia-tions and degree of miscibility of saline fluids (for example, Candela and Piccoli, 1995; Candela, 1997; Heinrich, 2007). Near magmatic temperatures, fluids derived from most magmas more than about 5-km depth are supercritical and have moderate salinities (point A, fig. Q1), with declining pressure they separate into a high-salinity brine and a lower salinity vapor (point B, fig. Q1; Henley and McNabb, 1978; Cline and Bodnar, 1991; Fournier, 1999). Because the forma-tion of porphyry deposits requires passage of considerable fluid, a focusing mechanism is required. As has been long recognized, these foci are the apices (cupolas) of magma chambers, although they seldom coincide with central volca-nic structures (for example, Proffett, 2003, 2009; Seedorff and others, 2005, 2008); others have postulated that regional structural controls may localize fluid flow as well as upper crustal magmatism (for example, Hildenbrand and others, 2001; Drew, 2006; Berger and others, 2008).
In porphyry systems, saline aqueous fluids may take the form of moderate-salinity supercritical fluids, high-density brines, and low-salinity vapors (see section M, “Fluid-Inclusion Thermometry and Geochemistry”). At low pres-sures (below about 1,400 bars), two aqueous phases can coexist (high-salinity brine and low-salinity vapor), as is often observed in fluid inclusions (figs. M11, M12, M15).
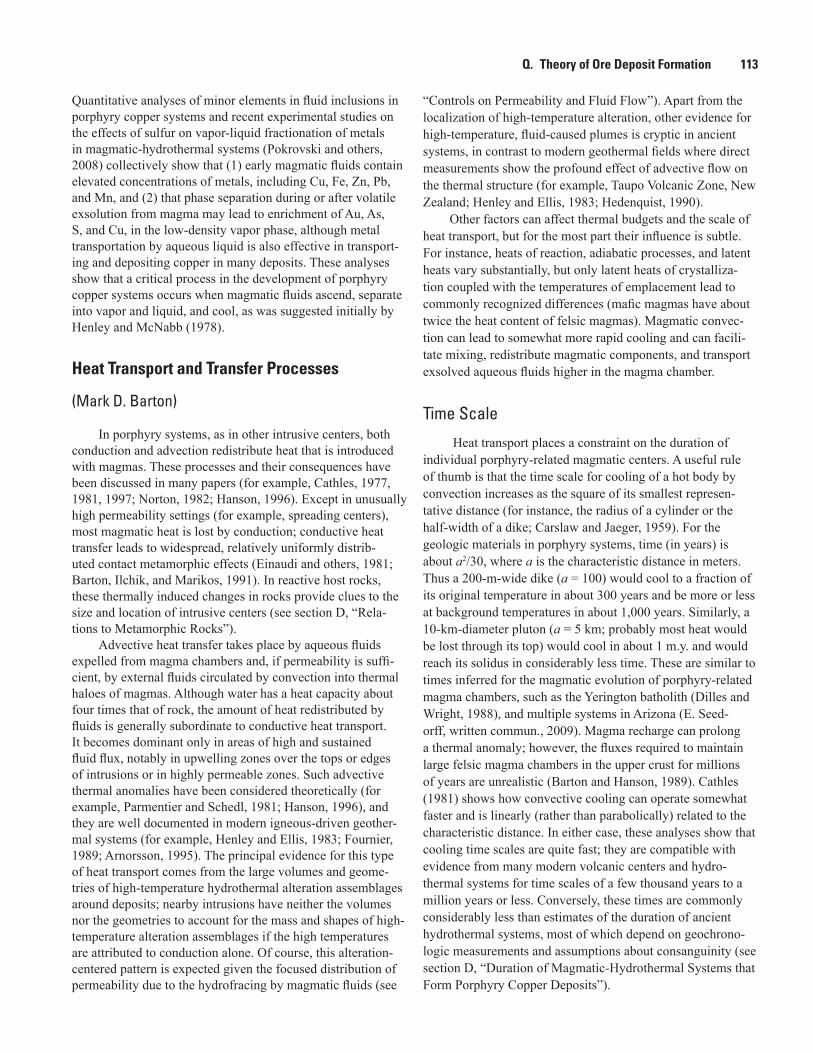
Q. Theory of Ore Deposit Formation 113
Quantitative analyses of minor elements in fluid inclusions in porphyry copper systems and recent experimental studies on the effects of sulfur on vapor-liquid fractionation of metals in magmatic-hydrothermal systems (Pokrovski and others, 2008) collectively show that (1) early magmatic fluids contain elevated concentrations of metals, including Cu, Fe, Zn, Pb, and Mn, and (2) that phase separation during or after volatile exsolution from magma may lead to enrichment of Au, As, S, and Cu, in the low-density vapor phase, although metal transportation by aqueous liquid is also effective in transport-ing and depositing copper in many deposits. These analyses show that a critical process in the development of porphyry copper systems occurs when magmatic fluids ascend, separate into vapor and liquid, and cool, as was suggested initially by Henley and McNabb (1978).
Heat Transport and Transfer Processes
(Mark D. Barton)
In porphyry systems, as in other intrusive centers, both conduction and advection redistribute heat that is introduced with magmas. These processes and their consequences have been discussed in many papers (for example, Cathles, 1977, 1981, 1997; Norton, 1982; Hanson, 1996). Except in unusually high permeability settings (for example, spreading centers), most magmatic heat is lost by conduction; conductive heat transfer leads to widespread, relatively uniformly distrib-uted contact metamorphic effects (Einaudi and others, 1981; Barton, Ilchik, and Marikos, 1991). In reactive host rocks, these thermally induced changes in rocks provide clues to the size and location of intrusive centers (see section D, “Rela-tions to Metamorphic Rocks”).
Advective heat transfer takes place by aqueous fluids expelled from magma chambers and, if permeability is suffi-cient, by external fluids circulated by convection into thermal haloes of magmas. Although water has a heat capacity about four times that of rock, the amount of heat redistributed by fluids is generally subordinate to conductive heat transport. It becomes dominant only in areas of high and sustained fluid flux, notably in upwelling zones over the tops or edges of intrusions or in highly permeable zones. Such advective thermal anomalies have been considered theoretically (for example, Parmentier and Schedl, 1981; Hanson, 1996), and they are well documented in modern igneous-driven geother-mal systems (for example, Henley and Ellis, 1983; Fournier, 1989; Arnorsson, 1995). The principal evidence for this type of heat transport comes from the large volumes and geome-tries of high-temperature hydrothermal alteration assemblages around deposits; nearby intrusions have neither the volumes nor the geometries to account for the mass and shapes of high-temperature alteration assemblages if the high temperatures are attributed to conduction alone. Of course, this alteration-centered pattern is expected given the focused distribution of permeability due to the hydrofracing by magmatic fluids (see
“Controls on Permeability and Fluid Flow”). Apart from the localization of high-temperature alteration, other evidence for high-temperature, fluid-caused plumes is cryptic in ancient systems, in contrast to modern geothermal fields where direct measurements show the profound effect of advective flow on the thermal structure (for example, Taupo Volcanic Zone, New Zealand; Henley and Ellis, 1983; Hedenquist, 1990).
Other factors can affect thermal budgets and the scale of heat transport, but for the most part their influence is subtle. For instance, heats of reaction, adiabatic processes, and latent heats vary substantially, but only latent heats of crystalliza-tion coupled with the temperatures of emplacement lead to commonly recognized differences (mafic magmas have about twice the heat content of felsic magmas). Magmatic convec-tion can lead to somewhat more rapid cooling and can facili-tate mixing, redistribute magmatic components, and transport exsolved aqueous fluids higher in the magma chamber.
Time Scale
Heat transport places a constraint on the duration of individual porphyry-related magmatic centers. A useful rule of thumb is that the time scale for cooling of a hot body by convection increases as the square of its smallest represen-tative distance (for instance, the radius of a cylinder or the half-width of a dike; Carslaw and Jaeger, 1959). For the geologic materials in porphyry systems, time (in years) is about a2/30, where a is the characteristic distance in meters. Thus a 200-m-wide dike (a = 100) would cool to a fraction of its original temperature in about 300 years and be more or less at background temperatures in about 1,000 years. Similarly, a 10-km-diameter pluton (a = 5 km; probably most heat would be lost through its top) would cool in about 1 m.y. and would reach its solidus in considerably less time. These are similar to times inferred for the magmatic evolution of porphyry-related magma chambers, such as the Yerington batholith (Dilles and Wright, 1988), and multiple systems in Arizona (E. Seed-orff, written commun., 2009). Magma recharge can prolong a thermal anomaly; however, the fluxes required to maintain large felsic magma chambers in the upper crust for millions of years are unrealistic (Barton and Hanson, 1989). Cathles (1981) shows how convective cooling can operate somewhat faster and is linearly (rather than parabolically) related to the characteristic distance. In either case, these analyses show that cooling time scales are quite fast; they are compatible with evidence from many modern volcanic centers and hydro-thermal systems for time scales of a few thousand years to a million years or less. Conversely, these times are commonly considerably less than estimates of the duration of ancient hydrothermal systems, most of which depend on geochrono-logic measurements and assumptions about consanguinity (see section D, “Duration of Magmatic-Hydrothermal Systems that Form Porphyry Copper Deposits”).
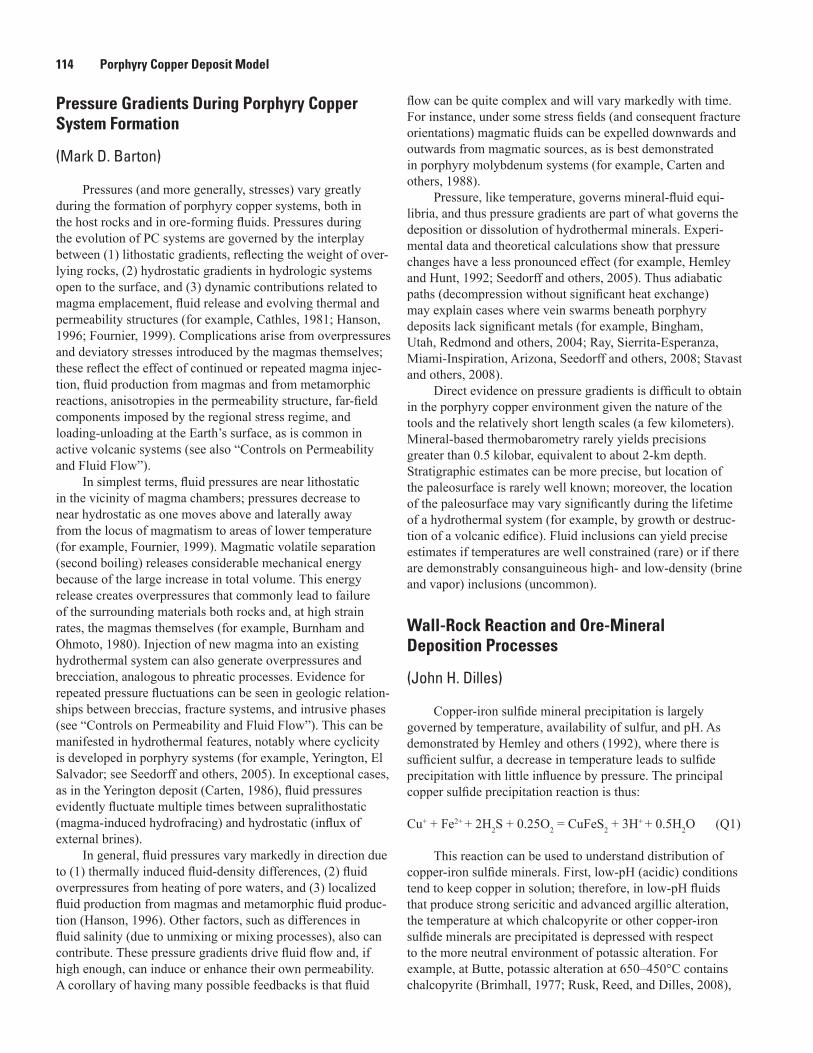
114 Porphyry Copper Deposit Model
Pressure Gradients During Porphyry Copper System Formation
(Mark D. Barton)
Pressures (and more generally, stresses) vary greatly during the formation of porphyry copper systems, both in the host rocks and in ore-forming fluids. Pressures during the evolution of PC systems are governed by the interplay between (1) lithostatic gradients, reflecting the weight of over-lying rocks, (2) hydrostatic gradients in hydrologic systems open to the surface, and (3) dynamic contributions related to magma emplacement, fluid release and evolving thermal and permeability structures (for example, Cathles, 1981; Hanson, 1996; Fournier, 1999). Complications arise from overpressures and deviatory stresses introduced by the magmas themselves; these reflect the effect of continued or repeated magma injec-tion, fluid production from magmas and from metamorphic reactions, anisotropies in the permeability structure, far-field components imposed by the regional stress regime, and loading-unloading at the Earth’s surface, as is common in active volcanic systems (see also “Controls on Permeability and Fluid Flow”).
In simplest terms, fluid pressures are near lithostatic in the vicinity of magma chambers; pressures decrease to near hydrostatic as one moves above and laterally away from the locus of magmatism to areas of lower temperature (for example, Fournier, 1999). Magmatic volatile separation (second boiling) releases considerable mechanical energy because of the large increase in total volume. This energy release creates overpressures that commonly lead to failure of the surrounding materials both rocks and, at high strain rates, the magmas themselves (for example, Burnham and Ohmoto, 1980). Injection of new magma into an existing hydrothermal system can also generate overpressures and brecciation, analogous to phreatic processes. Evidence for repeated pressure fluctuations can be seen in geologic relation-ships between breccias, fracture systems, and intrusive phases (see “Controls on Permeability and Fluid Flow”). This can be manifested in hydrothermal features, notably where cyclicity is developed in porphyry systems (for example, Yerington, El Salvador; see Seedorff and others, 2005). In exceptional cases, as in the Yerington deposit (Carten, 1986), fluid pressures evidently fluctuate multiple times between supralithostatic (magma-induced hydrofracing) and hydrostatic (influx of external brines).
In general, fluid pressures vary markedly in direction due to (1) thermally induced fluid-density differences, (2) fluid overpressures from heating of pore waters, and (3) localized fluid production from magmas and metamorphic fluid produc-tion (Hanson, 1996). Other factors, such as differences in fluid salinity (due to unmixing or mixing processes), also can contribute. These pressure gradients drive fluid flow and, if high enough, can induce or enhance their own permeability. A corollary of having many possible feedbacks is that fluid
flow can be quite complex and will vary markedly with time. For instance, under some stress fields (and consequent fracture orientations) magmatic fluids can be expelled downwards and outwards from magmatic sources, as is best demonstrated in porphyry molybdenum systems (for example, Carten and others, 1988).
Pressure, like temperature, governs mineral-fluid equi-libria, and thus pressure gradients are part of what governs the deposition or dissolution of hydrothermal minerals. Experi-mental data and theoretical calculations show that pressure changes have a less pronounced effect (for example, Hemley and Hunt, 1992; Seedorff and others, 2005). Thus adiabatic paths (decompression without significant heat exchange) may explain cases where vein swarms beneath porphyry deposits lack significant metals (for example, Bingham, Utah, Redmond and others, 2004; Ray, Sierrita-Esperanza, Miami-Inspiration, Arizona, Seedorff and others, 2008; Stavast and others, 2008).
Direct evidence on pressure gradients is difficult to obtain in the porphyry copper environment given the nature of the tools and the relatively short length scales (a few kilometers). Mineral-based thermobarometry rarely yields precisions greater than 0.5 kilobar, equivalent to about 2-km depth. Stratigraphic estimates can be more precise, but location of the paleosurface is rarely well known; moreover, the location of the paleosurface may vary significantly during the lifetime of a hydrothermal system (for example, by growth or destruc-tion of a volcanic edifice). Fluid inclusions can yield precise estimates if temperatures are well constrained (rare) or if there are demonstrably consanguineous high- and low-density (brine and vapor) inclusions (uncommon).
Wall-Rock Reaction and Ore-Mineral Deposition Processes
(John H. Dilles)
Copper-iron sulfide mineral precipitation is largely governed by temperature, availability of sulfur, and pH. As demonstrated by Hemley and others (1992), where there is sufficient sulfur, a decrease in temperature leads to sulfide precipitation with little influence by pressure. The principal copper sulfide precipitation reaction is thus:
Cu+ + Fe2+ + 2H2S + 0.25O2 = CuFeS2 + 3H+ + 0.5H2O (Q1)
This reaction can be used to understand distribution of copper-iron sulfide minerals. First, low-pH (acidic) conditions tend to keep copper in solution; therefore, in low-pH fluids that produce strong sericitic and advanced argillic alteration, the temperature at which chalcopyrite or other copper-iron sulfide minerals are precipitated is depressed with respect to the more neutral environment of potassic alteration. For example, at Butte, potassic alteration at 650–450°C contains chalcopyrite (Brimhall, 1977; Rusk, Reed, and Dilles, 2008),
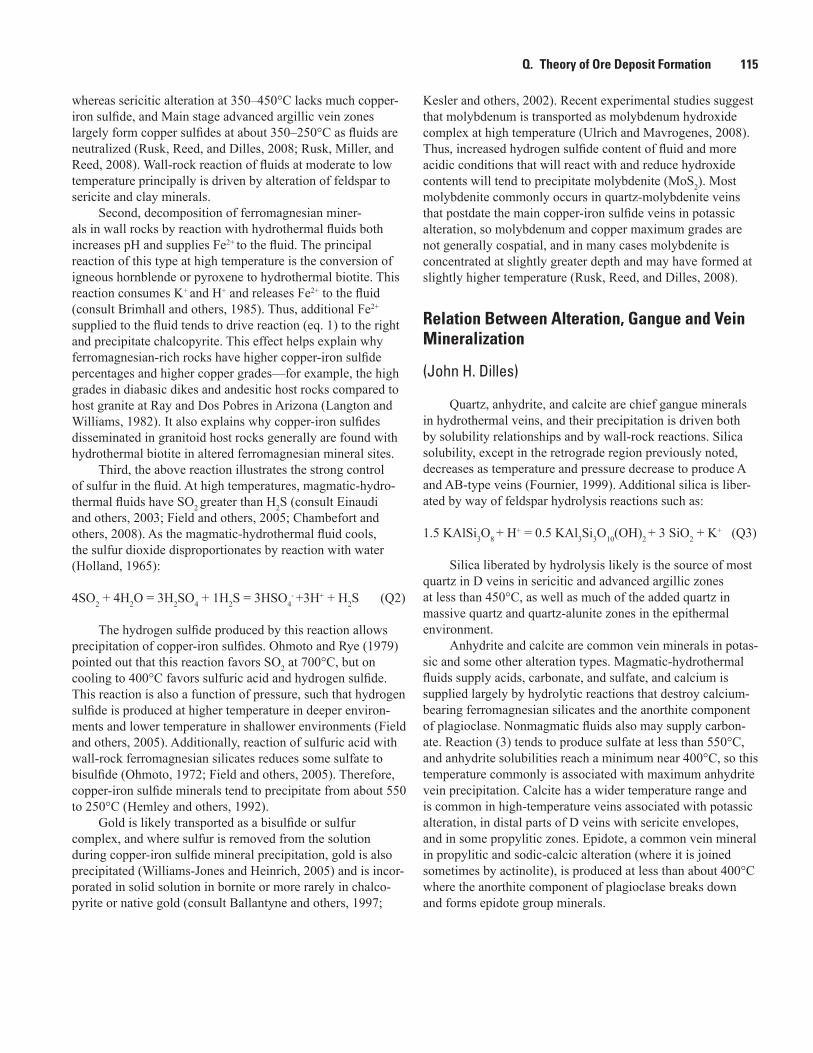
Q. Theory of Ore Deposit Formation 115
whereas sericitic alteration at 350–450°C lacks much copper-iron sulfide, and Main stage advanced argillic vein zones largely form copper sulfides at about 350–250°C as fluids are neutralized (Rusk, Reed, and Dilles, 2008; Rusk, Miller, and Reed, 2008). Wall-rock reaction of fluids at moderate to low temperature principally is driven by alteration of feldspar to sericite and clay minerals.
Second, decomposition of ferromagnesian miner-als in wall rocks by reaction with hydrothermal fluids both increases pH and supplies Fe2+ to the fluid. The principal reaction of this type at high temperature is the conversion of igneous hornblende or pyroxene to hydrothermal biotite. This reaction consumes K+ and H+ and releases Fe2+ to the fluid (consult Brimhall and others, 1985). Thus, additional Fe2+ supplied to the fluid tends to drive reaction (eq. 1) to the right and precipitate chalcopyrite. This effect helps explain why ferromagnesian-rich rocks have higher copper-iron sulfide percentages and higher copper grades—for example, the high grades in diabasic dikes and andesitic host rocks compared to host granite at Ray and Dos Pobres in Arizona (Langton and Williams, 1982). It also explains why copper-iron sulfides disseminated in granitoid host rocks generally are found with hydrothermal biotite in altered ferromagnesian mineral sites.
Third, the above reaction illustrates the strong control of sulfur in the fluid. At high temperatures, magmatic-hydro-thermal fluids have SO2 greater than H2S (consult Einaudi and others, 2003; Field and others, 2005; Chambefort and others, 2008). As the magmatic-hydrothermal fluid cools, the sulfur dioxide disproportionates by reaction with water (Holland, 1965):
4SO2 + 4H2O = 3H2SO4 + 1H2S = 3HSO4- +3H+ + H2S (Q2)
The hydrogen sulfide produced by this reaction allows precipitation of copper-iron sulfides. Ohmoto and Rye (1979) pointed out that this reaction favors SO2 at 700°C, but on cooling to 400°C favors sulfuric acid and hydrogen sulfide. This reaction is also a function of pressure, such that hydrogen sulfide is produced at higher temperature in deeper environ-ments and lower temperature in shallower environments (Field and others, 2005). Additionally, reaction of sulfuric acid with wall-rock ferromagnesian silicates reduces some sulfate to bisulfide (Ohmoto, 1972; Field and others, 2005). Therefore, copper-iron sulfide minerals tend to precipitate from about 550 to 250°C (Hemley and others, 1992).
Gold is likely transported as a bisulfide or sulfur complex, and where sulfur is removed from the solution during copper-iron sulfide mineral precipitation, gold is also precipitated (Williams-Jones and Heinrich, 2005) and is incor-porated in solid solution in bornite or more rarely in chalco-pyrite or native gold (consult Ballantyne and others, 1997;
Kesler and others, 2002). Recent experimental studies suggest that molybdenum is transported as molybdenum hydroxide complex at high temperature (Ulrich and Mavrogenes, 2008). Thus, increased hydrogen sulfide content of fluid and more acidic conditions that will react with and reduce hydroxide contents will tend to precipitate molybdenite (MoS2). Most molybdenite commonly occurs in quartz-molybdenite veins that postdate the main copper-iron sulfide veins in potassic alteration, so molybdenum and copper maximum grades are not generally cospatial, and in many cases molybdenite is concentrated at slightly greater depth and may have formed at slightly higher temperature (Rusk, Reed, and Dilles, 2008).
Relation Between Alteration, Gangue and Vein Mineralization
(John H. Dilles)
Quartz, anhydrite, and calcite are chief gangue minerals in hydrothermal veins, and their precipitation is driven both by solubility relationships and by wall-rock reactions. Silica solubility, except in the retrograde region previously noted, decreases as temperature and pressure decrease to produce A and AB-type veins (Fournier, 1999). Additional silica is liber-ated by way of feldspar hydrolysis reactions such as:
1.5 KAlSi3O8 + H+ = 0.5 KAl3Si3O10(OH)2 + 3 SiO2 + K+ (Q3)
Silica liberated by hydrolysis likely is the source of most quartz in D veins in sericitic and advanced argillic zones at less than 450°C, as well as much of the added quartz in massive quartz and quartz-alunite zones in the epithermal environment.
Anhydrite and calcite are common vein minerals in potas-sic and some other alteration types. Magmatic-hydrothermal fluids supply acids, carbonate, and sulfate, and calcium is supplied largely by hydrolytic reactions that destroy calcium-bearing ferromagnesian silicates and the anorthite component of plagioclase. Nonmagmatic fluids also may supply carbon-ate. Reaction (3) tends to produce sulfate at less than 550°C, and anhydrite solubilities reach a minimum near 400°C, so this temperature commonly is associated with maximum anhydrite vein precipitation. Calcite has a wider temperature range and is common in high-temperature veins associated with potassic alteration, in distal parts of D veins with sericite envelopes, and in some propylitic zones. Epidote, a common vein mineral in propylitic and sodic-calcic alteration (where it is joined sometimes by actinolite), is produced at less than about 400°C where the anorthite component of plagioclase breaks down and forms epidote group minerals.
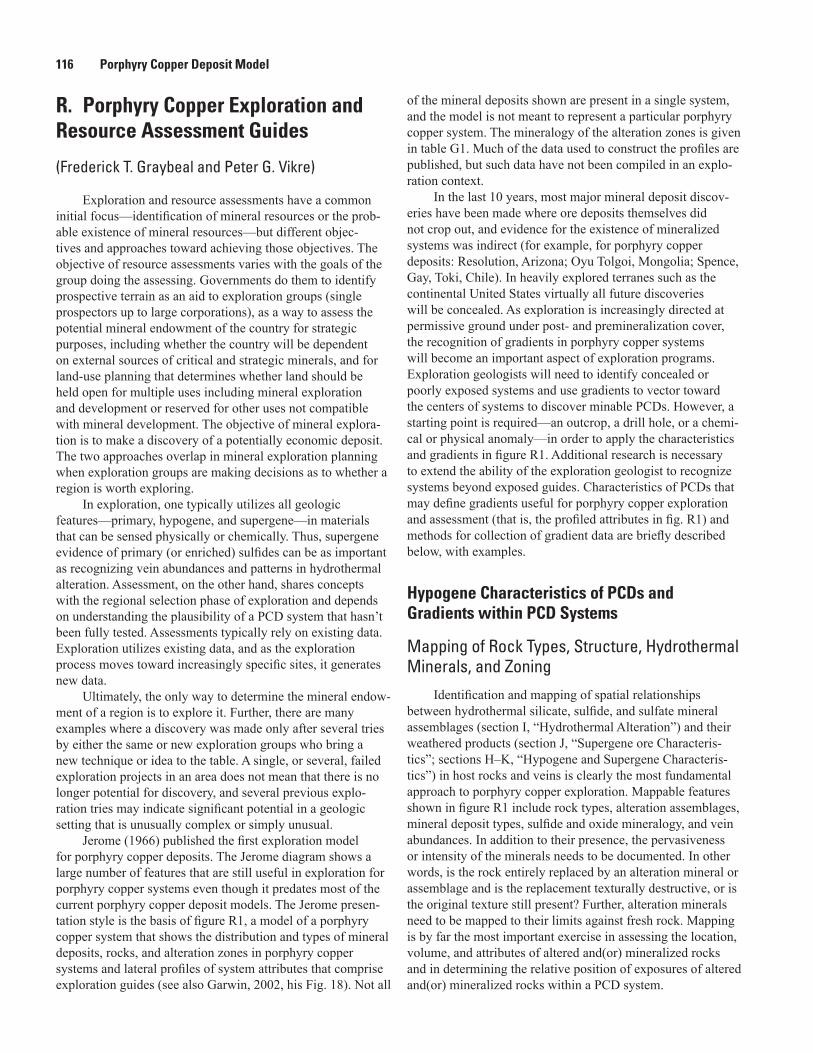
116 Porphyry Copper Deposit Model
R. Porphyry Copper Exploration and Resource Assessment Guides
(Frederick T. Graybeal and Peter G. Vikre)
Exploration and resource assessments have a common initial focus—identification of mineral resources or the prob-able existence of mineral resources—but different objec-tives and approaches toward achieving those objectives. The objective of resource assessments varies with the goals of the group doing the assessing. Governments do them to identify prospective terrain as an aid to exploration groups (single prospectors up to large corporations), as a way to assess the potential mineral endowment of the country for strategic purposes, including whether the country will be dependent on external sources of critical and strategic minerals, and for land-use planning that determines whether land should be held open for multiple uses including mineral exploration and development or reserved for other uses not compatible with mineral development. The objective of mineral explora-tion is to make a discovery of a potentially economic deposit. The two approaches overlap in mineral exploration planning when exploration groups are making decisions as to whether a region is worth exploring.
In exploration, one typically utilizes all geologic features—primary, hypogene, and supergene—in materials that can be sensed physically or chemically. Thus, supergene evidence of primary (or enriched) sulfides can be as important as recognizing vein abundances and patterns in hydrothermal alteration. Assessment, on the other hand, shares concepts with the regional selection phase of exploration and depends on understanding the plausibility of a PCD system that hasn’t been fully tested. Assessments typically rely on existing data. Exploration utilizes existing data, and as the exploration process moves toward increasingly specific sites, it generates new data.
Ultimately, the only way to determine the mineral endow-ment of a region is to explore it. Further, there are many examples where a discovery was made only after several tries by either the same or new exploration groups who bring a new technique or idea to the table. A single, or several, failed exploration projects in an area does not mean that there is no longer potential for discovery, and several previous explo-ration tries may indicate significant potential in a geologic setting that is unusually complex or simply unusual.
Jerome (1966) published the first exploration model for porphyry copper deposits. The Jerome diagram shows a large number of features that are still useful in exploration for porphyry copper systems even though it predates most of the current porphyry copper deposit models. The Jerome presen-tation style is the basis of figure R1, a model of a porphyry copper system that shows the distribution and types of mineral deposits, rocks, and alteration zones in porphyry copper systems and lateral profiles of system attributes that comprise exploration guides (see also Garwin, 2002, his Fig. 18). Not all
of the mineral deposits shown are present in a single system, and the model is not meant to represent a particular porphyry copper system. The mineralogy of the alteration zones is given in table G1. Much of the data used to construct the profiles are published, but such data have not been compiled in an explo-ration context.
In the last 10 years, most major mineral deposit discov-eries have been made where ore deposits themselves did not crop out, and evidence for the existence of mineralized systems was indirect (for example, for porphyry copper deposits: Resolution, Arizona; Oyu Tolgoi, Mongolia; Spence, Gay, Toki, Chile). In heavily explored terranes such as the continental United States virtually all future discoveries will be concealed. As exploration is increasingly directed at permissive ground under post- and premineralization cover, the recognition of gradients in porphyry copper systems will become an important aspect of exploration programs. Exploration geologists will need to identify concealed or poorly exposed systems and use gradients to vector toward the centers of systems to discover minable PCDs. However, a starting point is required—an outcrop, a drill hole, or a chemi-cal or physical anomaly—in order to apply the characteristics and gradients in figure R1. Additional research is necessary to extend the ability of the exploration geologist to recognize systems beyond exposed guides. Characteristics of PCDs that may define gradients useful for porphyry copper exploration and assessment (that is, the profiled attributes in fig. R1) and methods for collection of gradient data are briefly described below, with examples.
Hypogene Characteristics of PCDs and Gradients within PCD Systems
Mapping of Rock Types, Structure, Hydrothermal Minerals, and Zoning
Identification and mapping of spatial relationships between hydrothermal silicate, sulfide, and sulfate mineral assemblages (section I, “Hydrothermal Alteration”) and their weathered products (section J, “Supergene ore Characteris-tics”; sections H–K, “Hypogene and Supergene Characteris-tics”) in host rocks and veins is clearly the most fundamental approach to porphyry copper exploration. Mappable features shown in figure R1 include rock types, alteration assemblages, mineral deposit types, sulfide and oxide mineralogy, and vein abundances. In addition to their presence, the pervasiveness or intensity of the minerals needs to be documented. In other words, is the rock entirely replaced by an alteration mineral or assemblage and is the replacement texturally destructive, or is the original texture still present? Further, alteration minerals need to be mapped to their limits against fresh rock. Mapping is by far the most important exercise in assessing the location, volume, and attributes of altered and(or) mineralized rocks and in determining the relative position of exposures of altered and(or) mineralized rocks within a PCD system.
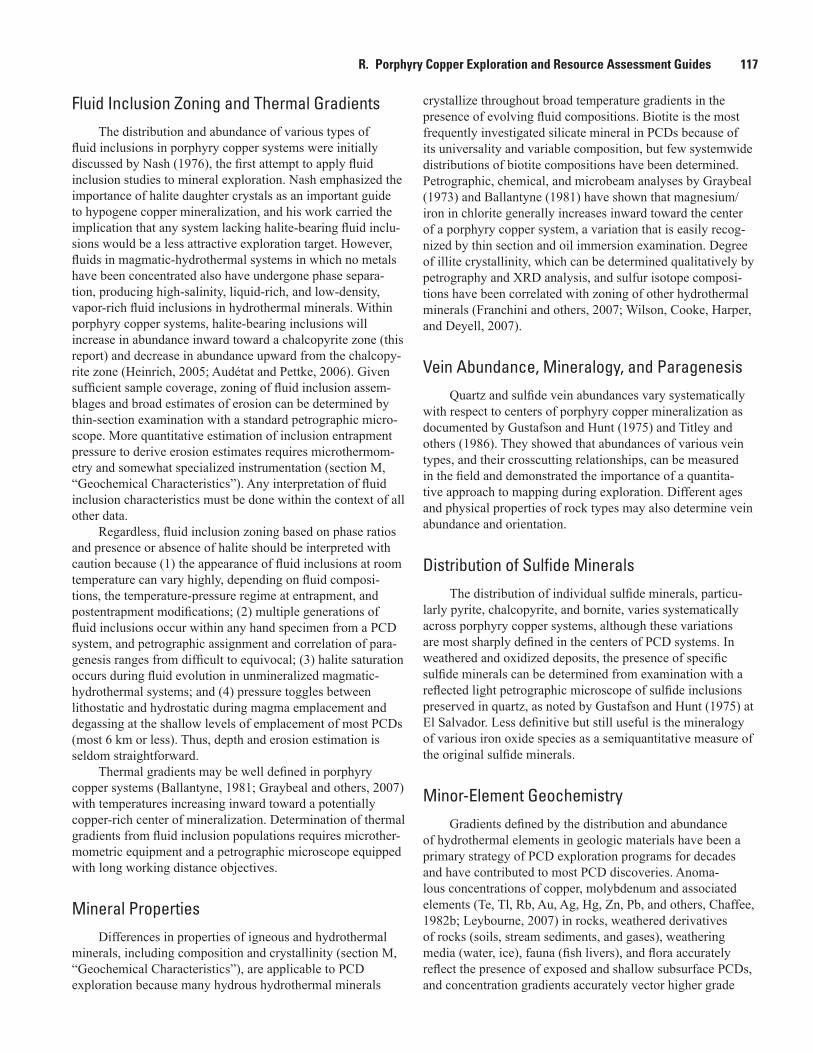
R. Porphyry Copper Exploration and Resource Assessment Guides 117
Fluid Inclusion Zoning and Thermal Gradients The distribution and abundance of various types of
fluid inclusions in porphyry copper systems were initially discussed by Nash (1976), the first attempt to apply fluid inclusion studies to mineral exploration. Nash emphasized the importance of halite daughter crystals as an important guide to hypogene copper mineralization, and his work carried the implication that any system lacking halite-bearing fluid inclu-sions would be a less attractive exploration target. However, fluids in magmatic-hydrothermal systems in which no metals have been concentrated also have undergone phase separa-tion, producing high-salinity, liquid-rich, and low-density, vapor-rich fluid inclusions in hydrothermal minerals. Within porphyry copper systems, halite-bearing inclusions will increase in abundance inward toward a chalcopyrite zone (this report) and decrease in abundance upward from the chalcopy-rite zone (Heinrich, 2005; Audétat and Pettke, 2006). Given sufficient sample coverage, zoning of fluid inclusion assem-blages and broad estimates of erosion can be determined by thin-section examination with a standard petrographic micro-scope. More quantitative estimation of inclusion entrapment pressure to derive erosion estimates requires microthermom-etry and somewhat specialized instrumentation (section M, “Geochemical Characteristics”). Any interpretation of fluid inclusion characteristics must be done within the context of all other data.
Regardless, fluid inclusion zoning based on phase ratios and presence or absence of halite should be interpreted with caution because (1) the appearance of fluid inclusions at room temperature can vary highly, depending on fluid composi-tions, the temperature-pressure regime at entrapment, and postentrapment modifications; (2) multiple generations of fluid inclusions occur within any hand specimen from a PCD system, and petrographic assignment and correlation of para-genesis ranges from difficult to equivocal; (3) halite saturation occurs during fluid evolution in unmineralized magmatic-hydrothermal systems; and (4) pressure toggles between lithostatic and hydrostatic during magma emplacement and degassing at the shallow levels of emplacement of most PCDs (most 6 km or less). Thus, depth and erosion estimation is seldom straightforward.
Thermal gradients may be well defined in porphyry copper systems (Ballantyne, 1981; Graybeal and others, 2007) with temperatures increasing inward toward a potentially copper-rich center of mineralization. Determination of thermal gradients from fluid inclusion populations requires microther-mometric equipment and a petrographic microscope equipped with long working distance objectives.
Mineral PropertiesDifferences in properties of igneous and hydrothermal
minerals, including composition and crystallinity (section M, “Geochemical Characteristics”), are applicable to PCD exploration because many hydrous hydrothermal minerals
crystallize throughout broad temperature gradients in the presence of evolving fluid compositions. Biotite is the most frequently investigated silicate mineral in PCDs because of its universality and variable composition, but few systemwide distributions of biotite compositions have been determined. Petrographic, chemical, and microbeam analyses by Graybeal (1973) and Ballantyne (1981) have shown that magnesium/iron in chlorite generally increases inward toward the center of a porphyry copper system, a variation that is easily recog-nized by thin section and oil immersion examination. Degree of illite crystallinity, which can be determined qualitatively by petrography and XRD analysis, and sulfur isotope composi-tions have been correlated with zoning of other hydrothermal minerals (Franchini and others, 2007; Wilson, Cooke, Harper, and Deyell, 2007).
Vein Abundance, Mineralogy, and ParagenesisQuartz and sulfide vein abundances vary systematically
with respect to centers of porphyry copper mineralization as documented by Gustafson and Hunt (1975) and Titley and others (1986). They showed that abundances of various vein types, and their crosscutting relationships, can be measured in the field and demonstrated the importance of a quantita-tive approach to mapping during exploration. Different ages and physical properties of rock types may also determine vein abundance and orientation.
Distribution of Sulfide MineralsThe distribution of individual sulfide minerals, particu-
larly pyrite, chalcopyrite, and bornite, varies systematically across porphyry copper systems, although these variations are most sharply defined in the centers of PCD systems. In weathered and oxidized deposits, the presence of specific sulfide minerals can be determined from examination with a reflected light petrographic microscope of sulfide inclusions preserved in quartz, as noted by Gustafson and Hunt (1975) at El Salvador. Less definitive but still useful is the mineralogy of various iron oxide species as a semiquantitative measure of the original sulfide minerals.
Minor-Element GeochemistryGradients defined by the distribution and abundance
of hydrothermal elements in geologic materials have been a primary strategy of PCD exploration programs for decades and have contributed to most PCD discoveries. Anoma-lous concentrations of copper, molybdenum and associated elements (Te, Tl, Rb, Au, Ag, Hg, Zn, Pb, and others, Chaffee, 1982b; Leybourne, 2007) in rocks, weathered derivatives of rocks (soils, stream sediments, and gases), weathering media (water, ice), fauna (fish livers), and flora accurately reflect the presence of exposed and shallow subsurface PCDs, and concentration gradients accurately vector higher grade
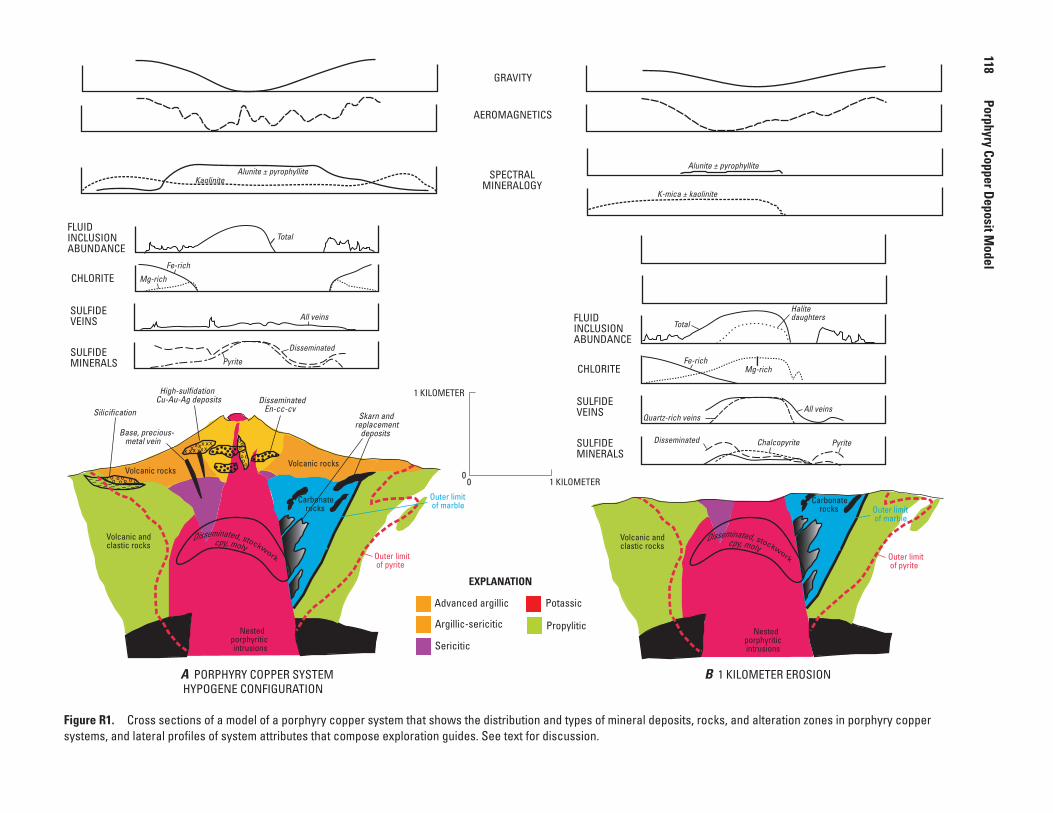
º
ººººººº
ºººº
ººººº
x xxx
xxx xxx
xx
●●
●●
●●●●●●
●●●●● ●●●●
●●●●●● ●●
●●●● ●●
_______
_______ _
º
ººººººº
ºººº
ººººº
x xxx
xxx xxx
xx
●●
●●
●●●●●●
●●●●● ●●●●
●●●●●● ●●
●●●● ●●
_______
_______ _
silicificationdisseminated en-cc-cv
base, precious- metal vein
skarn and replacement deposits
high-sulfidationCu-Au-Ag deposits
Basement Basement Nested porphyritic intrusions
Volcanic rocks
Carbonate rocks
Volcanic and clastic rocks
Outer limit of pyrite
Outer limit of marble
SilicificationDisseminated En-cc-cv
Base, precious- metal vein
Skarn and replacement deposits
High-sulfidationCu-Au-Ag deposits
Advanced argillic
EXPLANATION
Sericitic
Potassic
Argillic-sericitic
SULFIDEMINERALS
SULFIDEVEINS
CHLORITE
FLUID INCLUSIONABUNDANCE
SPECTRALMINERALOGY
Pyrite
Disseminated
All veins
Fe-rich
Mg-rich
Total
SULFIDEMINERALS
SULFIDEVEINS
CHLORITE
FLUID INCLUSIONABUNDANCE
KaoliniteAlunite ± pyrophyllite
Propylitic
Disseminated Chalcopyrite Pyrite
All veinsQuartz-rich veins
Fe-richMg-rich
Total
Halite daughters
Alunite ± pyrophyllite
K-mica ± kaolinite
AEROMAGNETICS
GRAVITY
Volcanic rocks
A PORPHYRY COPPER SYSTEMHYPOGENE CONFIGURATION
Basement Basement Nested porphyriticintrusions
Carbonate rocks
Volcanic and clastic rocks
Outer limit of pyrite
Outer limit of marble
B 1 KILOMETER EROSION
1 KILOMETER00
1 KILOMETER
Figure R1. Cross sections of a model of a porphyry copper system that shows the distribution and types of mineral deposits, rocks, and alteration zones in porphyry copper systems, and lateral profiles of system attributes that compose exploration guides. See text for discussion.
118
Porphyry Copper Deposit Model
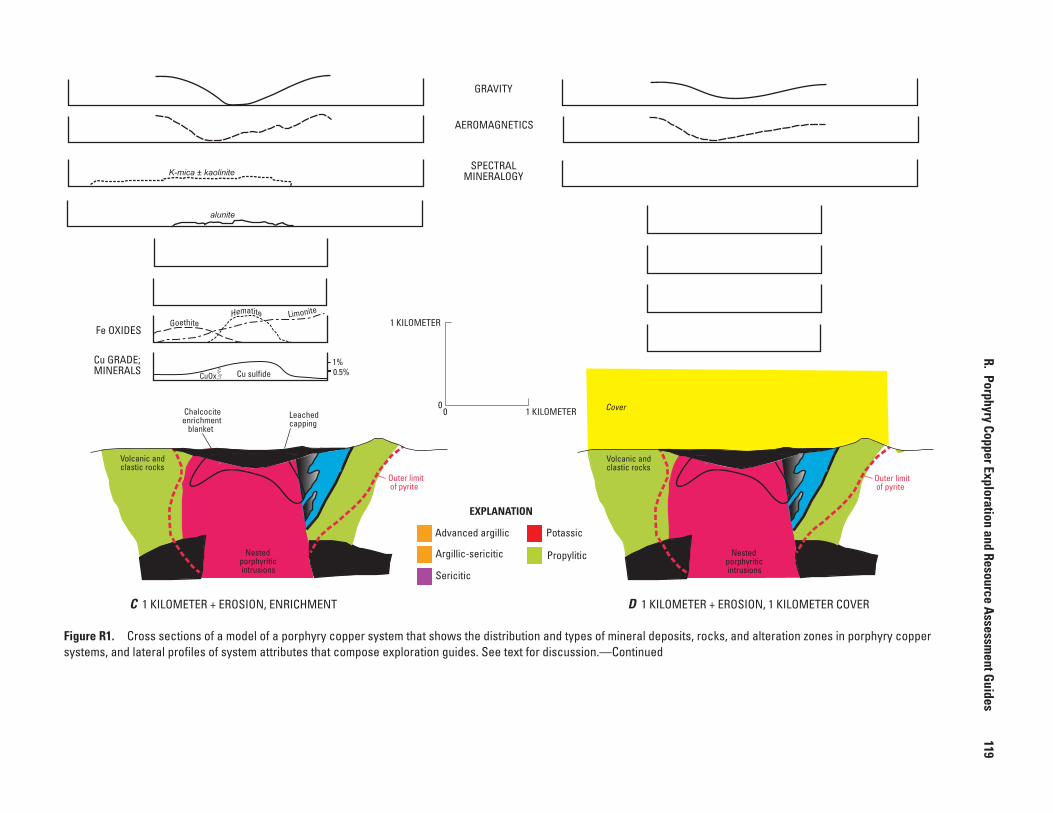
outer limit of marble
outer limit of marble
Advanced argillic
EXPLANATION
Sericitic
Potassic
Argillic-sericitic Propylitic
C 1 KILOMETER + EROSION, ENRICHMENT D 1 KILOMETER + EROSION, 1 KILOMETER COVER
1 KILOMETER00
1 KILOMETER
Volcanic and clastic rocks
Leached capping
Chalcocite enrichment blanket
Fe OXIDES
Cu GRADE; MINERALS
1%0.5%Cu sulfideCuOx
Outer limit of pyrite
Outer limit of pyrite
Basement Basement Nested porphyritic intrusions
Basement Basement Nested porphyritic intrusions
Volcanic and clastic rocks
SPECTRALMINERALOGY
AEROMAGNETICS
GRAVITY
K-mica ± kaolinite
alunite
Cover
Figure R1. Cross sections of a model of a porphyry copper system that shows the distribution and types of mineral deposits, rocks, and alteration zones in porphyry copper systems, and lateral profiles of system attributes that compose exploration guides. See text for discussion.—Continued
R. Porphyry Copper Exploration and Resource Assessment Guides
119
120 Porphyry Copper Deposit Model
mineralization within PCD systems (section M, “Geochemical Characteristics”). Vectoring in the simplest terms may involve nothing more than collecting many samples, contouring their values on a map, and drilling the central portion of the contour pattern, but it is a very powerful exploration tool. Statistical techniques may be applied to the recognition of significant patterns where values are erratic or geochemical contrast is low.
High values of pathfinder elements in single samples may be important indicators of proximity even if vectoring is not possible. Proximal dispersion is desirable in that it enlarges permissive PCD tracts. Improvements in element detection (progressively lower detection limits) combined with analytic efficiencies (relatively low cost multielement analytic pack-ages) have further enlarged permission tracts. However, with increasing distance from source, dilution reduces hydrother-mal element concentrations to background levels, and element geochemistry becomes ineffective for detecting PCDs.
Spectral Imagery
Although geophysical gradients are measured remotely, the phrase “remote sensing” usually refers to distal recordation of reflected (and inversely, absorbed) visible and near-visible electromagnetic radiation by geologic materials. Reflectance data collected by hand-held field spectrometers and sensors mounted on airplanes and satellites were initially limited to a small number of wavelengths. Modern remote sensing records hundreds of bandwidths (hyperspectral surveys) that are processed to identify many hydrothermal minerals common to PCDs including quartz, iron oxides (after iron sulfides), illite, kaolinite, dickite, alunite, and pyrophyllite. Precision of mineral distributions is determined by pixel shape and size, usually squares with meters to tens of meters on a side. Remotely sensed mineralogy can be used to assist mapping of hydrothermal mineral zoning in PCD systems, although it does not directly distinguish between hypogene and supergene mineral assemblages. Highly sensitive hand-held spectrom-eters are increasingly being used to discriminate between minerals within alteration assemblages in weathered outcrops.
Supergene-Enriched and Oxidized PCDs
Porphyry copper deposits were originally bulk-mined for the high-grade, supergene-enriched chalcocite blankets that resulted from leaching of lower grade hypogene miner-alization. Successive leaching of hypogene mineralization by downward percolating meteoric water developed blanket-like zones of chalcocite with up to 8 times the grades of the original hypogene mineralization. These blankets are consid-ered to have formed at the top of the water table because their upper boundaries are generally planar and parallel to the present surface or to a paleosurface. The lower boundaries of enrichment blankets are more diffuse and marked by a gradual
decrease in chalcocite abundance and copper grade and increase in unenriched chalcopyrite with depth.
Supergene Enrichment and Leached Capping Characteristics
The process of supergene enrichment of PCDs leaves leached capping, a layer of porous and partly decomposed iron oxide-rich rock above the chalcocite blanket, from which copper and other acid-soluble rock components have been dissolved. Leaching is only possible when the rate of leaching and drawdown of the water table exceed the rate of erosion and where the pyrite content of the sulfide mineralization is sufficiently high to generate enough sulfuric acid to keep copper in solution until it reaches the water table. As the chalcocite content of the sulfide mineralization being leached increases, the mineralogy and texture of iron oxides in the leached capping changes.
Pyrite generates leached capping dominated by yellow to brown to black limonite, a high percentage of which is trans-ported out of the original pyrite site. Chalcopyrite will gener-ate goethite-dominated capping with a high percentage of the iron oxide remaining in the chalcopyrite site as a rectangular boxwork. Chalcocite generates hematite-dominated capping with most of the iron remaining in the chalcocite site or the site of the original sulfide mineral. Mapping the abundance of each iron oxide mineral species and texture, and identification of relict sulfide minerals based on the amount of indigenous and transported iron oxides, allow the grade of the subja-cent chalcocite blanket to be estimated. The thickness of the blanket cannot be determined directly from leached capping, but leached capping interpretation is a powerful method for the evaluation of drilling targets in porphyry copper systems and is carried out during geologic mapping.
Leaching ends when pyrite has been replaced by chalcoc-ite to the extent that sulfuric acid generation is insufficient to leach remaining copper minerals. At this point the chalcocite blanket may oxidize and erode, along with hypogene copper minerals in low-pyrite parts of systems. The result is a weath-ered outcrop with mostly indigenous hematite in a varied but often very colorful mixture of various copper oxide minerals. In optimal conditions, the hypogene overprinting of earlier chalcopyrite-rich mineralization by later pyrite-rich sericitic alteration and the gradual drawdown of the water table creates an ideal chemical environment for the development of thick, high-grade chalcocite blankets.
Copper-Oxide Minerals Copper-oxide deposits are concentrations of relatively
soluble copper carbonate, silicate, and sulfate minerals (brochantite, malachite, azurite, chrysocolla, atacamite, and numerous other minerals). They may be found (1) adjacent to leached capping in arid weathering environments, (2) in the central part of porphyry copper systems where all hypogene
R. Porphyry Copper Exploration and Resource Assessment Guides 121
sulfide minerals have been replaced by chalcocite and the chalcocite begins to oxidize as described in the previous paragraph, and (3) in exotic deposits where the geochemi-cal environment favored lateral transport of significant amounts of copper hundreds or thousands of meters from its initial hypogene position. The latter two settings can develop large deposits of continuous and high grade mineralization (section J, “Supergene Ore Characteristics”). Initial explora-tion for PCDs, following successful bulk mining in the early 1900s, focused on copper oxide-rich portions of weathered porphyry copper systems, and drilling often missed higher grade chalcocite blankets under adjacent, but thoroughly leached, outcrops.
Spatial relationships of copper oxides over unenriched hypogene copper mineralization, leached capping, and chal-cocite enrichment (modified from Titley, 1982) are shown in figure R1. The highest grade volume of hypogene mineraliza-tion is not the site of the highest grade chalcocite enrichment. With the advent of heap leaching and solvent exchange-electrowinning (SX–EW) technologies, zones of readily soluble copper-oxide minerals have become as attractive or more attractive for exploration than the chalcocite blankets.
Other complications have been reported in the explora-tion of weathered porphyry copper systems. At Toquepala, Peru, Richard and Courtright (1958) noted that relatively pyritic, hematite-poor leached capping occurred over well-developed supergene chalcocite mineralization. This relation-ship resulted from development of an early chalcocite blanket, followed by rapid uplift of the entire region and concomitant drawdown of the water table to below the base of the early chalcocite blanket. Subsequent erosion and enrichment formed a new chalcocite blanket below the base of the earlier-formed blanket. Leached capping immediately above the second blanket, therefore, reflected the presence of low-grade protore and concealed the presence of the second stage blanket.
Recognition of Permissive Terrain for Porphyry Copper Exploration and Assessment
Postmineralization Cover and Proximity to Porphyry Copper Deposits
The identification of permissive terrain requires recog-nition of large-scale features important for the localization and formation of porphyry copper deposits. Areas of post-mineralization cover near porphyry copper deposits that are large enough to conceal porphyry copper systems constitute prospective sites of other deposits. Any partly concealed intru-sion that has similar mineralogy, porphyritic texture, or age to an intrusion that can be genetically linked to nearby porphyry copper systems and that also extends under postmineralization cover may be indicative of a concealed system.
Regional Structure and Intrusion EmplacementRegional structures are an important component of the
evaluation of postmineralization rocks. Porphyry copper deposits are spatially, if not temporally, related to regional fault zones tens of kilometers or more in length, and covered areas along these fault zones are highly prospective. These fault zones and other elongated or aligned features, often termed lineaments or trends, are a very important aspect of regional porphyry copper exploration and assessment but can be easily misused where lineaments are not geologically justifiable. Regional faults may be obliterated by intrusions that generate porphyry copper systems, but elongation of the intrusions along the fault projection is evidence for structural control on intrusion emplacement. In addition to intrusion aspect, alignment of intrusions constitutes a regional vector along which younger rocks may conceal porphyry copper deposits.
Perhaps the best example of regional structural control of porphyry copper deposits is the West Fissure in northern Chile that extends through Radomir Tomic, Chuquicamata-Exotica, MM, Escondida, and El Salvador. Another example is the alignment and elongation of Laramide intrusions and porphyry copper deposits in the Patagonia Mountains and Santa Rita Mountains of southern Arizona and northern Sonora in Mexico, including La Caridad, Cananea, Sonora, Red Moun-tain, Helvetia, Sierrita–Twin Buttes–Mission, and Silver Bell.
Continental-Scale Permissive Terrains On a still larger scale, any covered ground in a porphyry
copper province should be given a higher priority than covered ground in a region with no known porphyry copper occur-rences. Taking this to a continental scale, most porphyry copper deposits are restricted to mountain belts that formed above subduction zones along convergent plate boundaries, although this scale may be too large to be useful for mineral-resource assessments.
Depth LimitationsThe depth to which porphyry copper deposits can be
conventionally mined, although somewhat variable, has been set at 1 km in some mineral-resource assessments. The typical grade range of porphyry copper deposits cannot counter the steady increase in costs of conventional mining with depth. Existing oil field technology applied to solution copper mining and copper recovery from oxide and enriched deposits could enable economic recovery of copper from deep and low-grade resources. The utility of in-situ copper mining was demon-strated on a buried (800 m) oxidized and enriched zone in the Santa Cruz porphyry copper deposit in Arizona. Dilute sulfuric acid was circulated between adjacent injection and recovery
122 Porphyry Copper Deposit Model
wells in a commercial scale 5-spot pattern and pumped to a surface SX–EW plant where refinery-grade copper was recov-ered. Although the project was terminated when the Bureau of Mines, which provided 75 percent of the funding, was dismantled by the U.S. Congress, the project demonstrated that copper is recoverable from deep deposits containing acid-soluble copper minerals. The single objective of the project was proof of concept (Graybeal, 2005); termination was unrelated to project economics, which remained to be evalu-ated, or copper prices. Given the current level of understand-ing of in-situ mining, the broad implication of this project is that a 1-km depth cutoff for both exploration and assessment purposes is not valid for some porphyry copper deposits.
S. Geoenvironmental Features
(Robert R. Seal)
Weathering Processes
Modern weathering processes associated with mine wastes from porphyry copper deposits are similar in many respects to those operating in the supergene environment after the initial formation of the mineral deposit (section L, “Weathering/Supergene Processes”). Nevertheless, some important differences exist. Acid-mine drainage is one of the most significant challenges associated with these deposits due to the abundance of pyrite. However, because pyrite is present in these ores in abundances of just a small percentage, much of the acid-generating potential may be offset by acid-neutralizing potential offered by feldspars and trace amounts of carbonate minerals found in the ores. The geochemistry of acid-mine drainage has been reviewed by Nordstrom and Alpers (1999), and additional aspects of the weathering of a variety of ore and gangue minerals were discussed by Plumlee (1999). Cox and others (1995), Day and Rees (2006), and Berger and others (2008) have reviewed the geoenvironmental characteristics of porphyry deposits.
Geochemical aspects of the formation of acid-mine drain-age and its burden of metals and other elements of concern can be divided into three broad topics: sulfide-oxidation, acid-generation, and acid-neutralization processes. The pres-ence of pyrite in porphyry deposits dominates most aspects of the environmental behavior of these deposits and their mine wastes. The acid generated by their oxidative weathering can aggressively attack other ore and gangue minerals, thereby liberating a variety of potentially toxic elements including aluminum and manganese, which are not part of the “typical” ore assemblage of metals but instead are found in silicate and carbonate gangue minerals. These acidic, metal-laden acid-sulfate waters can adversely affect the surrounding surface water and groundwater. Within the hydrologic system of mine workings or mine wastes, minerals and other compounds, such as lime used in flotation circuits, and even monosulfide
minerals, such as sphalerite, can neutralize acid generated by the oxidative weathering of sulfide minerals. Thus, the chemis-try of drainage from a mine site is the result of the competing processes of acid generation and acid neutralization.
The oxidation of pyrite and other sulfide minerals proceeds with either dissolved oxygen (O2) or dissolved ferric iron (Fe3+) as the oxidizing agent. Dissolved oxygen is the most important oxidant at pH values above about 4, whereas ferric iron dominates below about 4 (Williamson and others, 2006). The aqueous oxidation of pyrite by dissolved oxygen is described by reaction S1:
FeS2 + 7/2 O2 + H2O → Fe2+ + 2 SO42– + 2 H+ (S1)
Reaction S1 actually represents the mass action of numer-ous intermediate reactions. The aqueous oxidation of pyrite by ferric iron is described by reaction S2:
FeS2 + 14 Fe3+ + 8 H2O → 15 Fe2+ + 2 SO42– + 16 H+ (S2)
For reaction S2 where ferric iron is the oxidant, ferrous iron must be oxidized to ferric iron to perpetuate the reaction as described by reaction S3:
Fe2+ + ¼ O2 + H+ → Fe3+ + ½ H2O (S3)
The rate of the oxidation of ferrous iron to ferric iron is greatly enhanced by the iron-oxidizing bacterium Acidithio-bacillus ferrooxidans. Singer and Stumm (1970) observed that A. ferrooxidans increased the rate of oxidation of ferrous iron to ferric iron by a factor of 100,000 compared to the abiotic rate. In the case of both sets of reactions for pyrite oxidation, additional acid is generated by the oxidation and hydrolysis of the aqueous ferrous iron as described by reaction S4:
Fe2+ + ¼ O2 + 5/2 H2O → Fe(OH)3 + 2 H+ (S4)
which also produces the orange and brown precipitates that typify acid-mine drainage.
The oxidative weathering of chalcopyrite by dissolved oxygen can be described by reaction S5:
CuFeS2 + 4 O2 → Cu2+ + Fe2+ + 2 SO42– (S5)
which does not generate acid. However, the continued oxida-tion and hydrolysis of iron, as described by Reaction S4, will. The oxidative weathering of chalcopyrite by ferric iron can be described by reaction S6:
CuFeS2 + 16 Fe3+ + 8 H2O → Cu2+ + 17 Fe2+ + 2 SO42– + 16 H+
(S6)
As with reaction S5, the continued oxidation and hydro-lysis of iron, as described by reaction S4, will generate addi-tional acid.
S. Geoenvironmental Features 123
Gangue minerals in the host rocks generally react to consume the acid generated by the oxidation of sulfides. Carbonate minerals, such as calcite, consume acid as described by reaction S7:
CaCO3 + H+ → Ca2+ + HCO3– (S7)
Aluminosilicate minerals such as feldspars can consume acid, even though they are not as reactive as carbonate miner-als (Plumlee, 1999; Jambor and others, 2002). The reaction of these minerals typically adds dissolved constituents such as aluminum to the water and produces secondary phases. For example, acid neutralization by potassium feldspar can be described by reaction S8:
KAlSi3O8 + H+ + 7 H2O → K+ + 3 H4SiO4(aq) + Al(OH)3(s) (S8)
where dissolved potassium and silica and solid aluminum hydroxide result. Acid neutralization by anorthite can be described, for example, by reaction S9:
CaAl2Si2O8 + 2 H+ + H2O → Ca2+ + Al2Si2O5(OH)4(s) (S9)
where dissolved calcium and kaolinite result. The products in these acid-neutralization reacts will ultimately depend upon the activities of relevant components in solution.
Pre-Mining Baseline Signatures in Soil, Sediment, and Water
Baseline characterization studies of porphyry copper deposits are limited in the literature, particularly in regard to the diversity of climatic settings in which they are found. Therefore, extrapolation of the insights provided by the case studies summarized herein to other deposits should be done with caution. Baseline data are available in the litera-ture for rock, soil, stream sediment, and groundwater and surface water from a variety of deposits. Data for soil from the tropical setting around Tanamá, Puerto Rico (Learned and Boissen, 1973), show different metal abundances in the B-horizon of residual soil over magnetite-rich (1.4 weight percent sulfur) and pyrite-rich (2.5 weight percent sulfur) copper ore zones. These data illustrate how acid, which is released as pyrite oxidizes, leaches metals from soil. An exception is molybdenum, which is not readily leached in low-pH environments. More recent work around the Pebble deposit in the tundra of southwestern Alaska produced data for transects crossing the deposit (Fey and others, 2008). Metals and related elements showed a range of values in soils in the study area including iron (2.3–7.4 weight percent), sulfur (0.02–0.87 weight percent), arsenic (7–78 ppm), cadmium (less than 0.1–0.6 ppm), copper (11.4–1,830 ppm), molybdenum (0.6–27.1 ppm), lead (7.1–17.4 ppm), and zinc (36–142 ppm).
Stream-sediment data are available in the vicinity of several porphyry copper deposits in Arizona and Puerto Rico, and in the vicinity of the Pebble deposit, Alaska. Chaffee and others (1981) indicated that stream sediment from the area draining the unmined Red Mountain porphyry copper deposit in arid southeastern Arizona contains elevated abundances of molybdenum, lead, and tellurium. The Mineral Butte and Vekol, Arizona, deposits are other arid-climate porphyry-copper deposits for which pre-mining geochemical data are available. Chaffee (1976, Table 1, and 1977, Table 3) presents ranges, backgrounds, and geochemical anomaly thresholds for manganese, cadmium, copper, cobalt, fluorine, gold, lead, bismuth, mercury, molybdenum, silver, and zinc abundances in bedrock and residual soil samples collected in the vicinity of these deposits. Abundances of most of these elements are elevated in the vicinity of these deposits relative to those char-acteristic of other geologic environments; these elevated abun-dances identify appropriate baseline geochemical values that may be useful in setting remediation standards for mines asso-ciated with this deposit type in arid climates. In the vicinity of unmined porphyry copper deposits in the Cordillera Central in Puerto Rico, Plaza-Toledo (2005) found a range of values for various elements including iron (6.3–10.6 weight percent), arsenic (less than 10 ppm), cadmium (less than 2 ppm), copper (64–804 ppm), molybdenum (less than 2–10 ppm), lead (less than 4–14 ppm), and zinc (104–291 ppm). In the vicin-ity of unmined Pebble porphyry copper deposit in southwest Alaska, Fey and others (2008) found a range of values for various elements including iron (2.5–4.9 weight percent), arsenic (4–37 ppm), cadmium (less than 0.1–0.3 ppm), copper (3.2–75 ppm), molybdenum (1.6–6.5 ppm), lead (9–16.6 ppm), and zinc (59–115 ppm).
Surface-water and groundwater data prior to mining are somewhat limited in the literature. Plaza-Toledo (2005) found surface waters downstream from unmined porphyry copper deposits in the Cordillera Central of Puerto Rico to reach maximum dissolved concentrations of 110 mg/L sulfate, 0.56 mg/L aluminum, 0.13 mg/L copper, 15.9 mg/L iron, and 0.04 mg/L zinc. The pH was high (7.7–8.6). Fey and others (2008) documented surface-water pH values between 4.1 and 7.3 and specific-conductance values between 0.01 and 0.40 mS/cm in the vicinity of the Pebble deposit. Alkalinity ranged between 0 and 100 mg/L CaCO3 equivalent, sulfate between less than 1 and 85 mg/L, and hardness between 2 and 130 mg/L CaCO3 equivalent. Dissolved trace-element concen-trations showed a range of values including arsenic (less than 1–36.2 μg/L), cadmium (less than 0.2–11.6 μg/L), copper (less than 0.5–688 μg/L), iron (less than 20–4,260 μg/L), molybde-num (less than 2–21.9 μg/L), lead (less than 0.05–18.8 μg/L), and zinc (less than 0.5–68 μg/L). Leybourne and Cameron (2006) documented high-salinity groundwaters associated with the unmined Spence deposit in the Atacama Desert of Chile, reaching 10,000 to 55,000 mg/L, with one outlier at 145,000 mg/L. The pH of the groundwaters varied widely between 4.7 and 9.2. Dissolved sulfate concentrations in groundwaters were between 5,000 and 10,000 mg/L.
124 Porphyry Copper Deposit Model
Past and Future Mining Methods and Ore Treatment
Most porphyry copper deposits are mined by open-pit methods and, less commonly, by underground methods. For those deposits with associated skarns, underground or open-pit mining methods may be used to mine the skarn deposits. Sulfide ores are generally crushed to a fine-grain size, and ore minerals (chalcopyrite, bornite, molybdenite, and pyrite, if gold-bearing) are separated by conventional flotation methods to form a concentrate. Gold-bearing pyrite concentrates may be roasted onsite to oxidize the pyrite prior to treatment with cyanide to extract the gold. Low-grade and oxide ores may undergo less intensive crushing prior to being treated by solvent-extraction electrowinning (SX–EW) methods with acidic solutions on leach pads to extract copper (Lynch and others, 1994).
Volume of Mine Waste and Tailings
Due to the low percentages of ore minerals typically associated with porphyry copper deposits, the tonnages of flotation tailings and SX–EW leach-pad wastes are essentially identical to the tonnages of the deposits being mined. Volumes of waste rock will depend upon the depth of the deposit, the geometry of the deposit, and the competency of the country rock as it relates to stripping ratios. On average, about 1.5 tons of waste rocks and overburden must be removed for every ton of ore grade mined (Phillips and Niemuth, 1993).
Mine Waste Characteristics
Mineralogy: In addition to the primary minerals associ-ated with the ores, a number of secondary minerals can form in the mine wastes. These include jarosite, schwertmannite, ferrihydrite, goethite, manganese hydroxides, authigenic clays, covellite, pickeringite, bonattite, chalcanthite, melanterite, and rozenite (Dold and Fontboté, 2001; Hansen and others, 2005).
Acid/Base Accounting
Net neutralization potentials reported in the literature for tailings from several porphyry copper deposits in Chile are net acid, ranging from –101.6 to –18.2 kilograms calcium carbonate per ton (kg CaCO3/t) (Dold and Fontboté, 2001). Net neutralizing potentials for hypogene and supergene ores from Morenci, Arizona, range from dominantly net acid to slightly net alkaline (–257.0 to 1.1 kg CaCO3/t; Enders and others, 2006).
Metal Mobility Related to Mining in Groundwater and Surface Water
Mine drainage data are available for deposits in British Columbia (Day and Rees, 2006), the Globe mining district in Arizona (Eychaner, 1991; Stollenwerk, 1994; Brown and others, 1998; Lind and others, 1998; Conklin and others, 2001), and the Morenci mining district, Arizona (Enders and others, 2006). In British Columbia, Day and Rees (2006) documented mine waters with pH values ranging from 2 to 8.5, and sulfate was the dominant anionic species (1–30,000 mg/L). The concentration of trace elements varied widely, including aluminum (0.001–1,000 mg/L), manga-nese (0.001–100 mg/L), iron (0.005–1,000 mg/L), copper (0.0005–1,000 mg/L), and zinc (0.001–100 mg/L). In the Globe mining district in Arizona, a stream was blocked by mill tailings, causing a lake to form. Water from this lake entered an alluvial aquifer by seepage; the aquifer and a stream to the north were contaminated (Eychaner, 1991; Stollenwerk, 1994; Brown and others, 1998; Lind and others, 1998; Conklin and others, 2001). The most contaminated groundwater in the aquifer had a pH of 3.3 and contained about 9,600 mg/L sulfate, 2,800 mg/L iron, 300 mg/L aluminum, and 190 mg/L copper. As the plume traveled north through the aquifer, the concentration of constituents decreased as the plume inter-acted with carbonate-bearing alluvium and was diluted by uncontaminated water (groundwater flowing upward from lower basin fill, water in uncontaminated streams that join the contaminated wash, and surface rainwater). Enders and others (2006) reported analyses of seeps and springs in the Morenci district of Arizona that had pH values between 2.6 and 4.6, and specific-conductance values between 1,400 and 6,000 µS/cm. Sulfate concentrations were between 550 and 4,300 mg/L, iron between 15 and 420 mg/L, aluminum between 0.48 and 370 mg/L, copper between 0.46 and 960 mg/L, and zinc between 0.8 and 159 mg/L.
Pit Lakes
Pit lakes, particularly in porphyry copper mining districts that are riddled with historical underground mine workings, such as that at Butte, Montana, which has a 140-year mining history, can be problematic. The Berkeley pit lake at Butte contains more than 100 billion liters of pH-2.5 mine water (Gammons and others, 2005; Gammons and Duaime, 2005). The pit lake has high dissolved solids (greater than 7 µS/cm) and elevated concentrations of iron, copper, zinc, and sulfate (Gammons and Duaime, 2005). In contrast, pit lakes in the Yerington and Robinson districts of Nevada have pH values that typically range from 7.0 to 8.5 with a few outliers near
T. Knowledge Gaps and Future Research Directions 125
4.7, which have been attributed to discharge from solvent-extraction operations rather than groundwater/rock interac-tions in the vicinity of the pits (Shevenell and others, 1999). In Nevada, total dissolved solids are generally less than 6 g/L, iron concentrations reach a maximum of 4.5 mg/L, arsenic is less than 0.05 mg/L, manganese is less than 5 mg/L, and selenium is less than 0.14 mg/L.
Ecosystem Issues
Acidic mine drainage and associated dissolved metals may pose threats to surrounding aquatic ecosystems depend-ing upon geologic and hydrologic setting and engineering aspects of the mine and the waste piles. Host rocks with higher neutralization potentials, such as carbonate rocks, tend to limit the mobility of metals and related compounds. Hydrologic and climatic settings that are subject to distinct wetting and drying cycles associated with waste piles tend to promote the formation of efflorescent metal sulfate salts that may cause acute toxic effects to aquatic ecosystems if drainage directly enters surface water. Improperly constructed water-contain-ment structures may allow contaminated mine water to enter surrounding surface water.
Acidity will be associated with the pH of the water and the dissolved concentrations of ferrous and ferric iron, alumi-num, and manganese; thus, because of incomplete hydrolysis of these elements and incomplete oxidation of dissolved iron and manganese, the pH may provide an inaccurate portrayal of the acidity of mine drainage (Kirby and Cravotta, 2005a, b). Elements or compounds with the greatest likelihood of causing problems for aquatic ecosystems and drinking-water sources for terrestrial organisms include, in alphabetical order, aluminum, arsenic, copper, iron, manganese, sulfate, and zinc.
Human Health Issues
Contaminated groundwater plumes associated with tailings impoundments may pose threats to drinking-water supplies, depending upon hydrologic and geologic setting and engineering aspects of the mine and the waste piles. Host rocks with higher neutralization potentials, such as carbon-ate rocks, tend to limit the mobility of metals and related compounds. Hydrologic and climatic settings that experience net evaporative loss of water may cause evaporative concen-tration of solutes that may enter groundwater used as drink-ing-water supplies in the vicinity of mines and waste piles. Improperly constructed water-containment structures may allow contaminated mine water to enter surrounding ground-water. Elements or compounds with the greatest likelihood of contaminating aquatic ecosystems and drinking-water sources for terrestrial organisms include, in alphabetical order, alumi-num, arsenic, copper, iron, manganese, sulfate, and zinc.
Climate Effects on Geoenvironmental Signatures
The understanding of the effects of various climate regimes on the geoenvironmental signature specific to porphyry copper deposits is limited. In most cases, the inten-sity of environmental impact associated with sulfide-mineral-bearing mineral deposits is greater in wet climates than in dry climates. Acidity and total metal concentrations in mine drainage in arid environments are several orders of magnitude greater than in more temperate climates because of the concen-trating effects of mine-effluent evaporation and the resulting “storage” of metals and acidity in highly soluble metal-sulfate-salt minerals. However, minimal surface-water flow in these areas inhibits generation of significant volumes of highly acidic, metal-enriched drainage. Concentrated release of these stored contaminants to local watersheds may be initi-ated by precipitation following a dry spell. Present surface and near-surface chemical relations and mineral assemblages may reflect preexisting (wetter) climate in the Southwestern United States. Dold and Fontboté (2001) investigated the environmental-geochemical characteristics of tailings from Chilean porphyry copper deposits in hyperarid, Mediterranean, and alpine climates. They concluded that climatic variations provide fundamental controls on the mobility of metals. Under precipitation-dominant conditions, divalent metals such as copper, zinc, and manganese are leached in the oxidized zone of mine waste piles, are carried downward and are sequestered in the piles due to replacement sulfide minerals in the reduced zone of mine waste piles. Under evaporation-dominant condi-tions, leached solutes are carried upward due to capillary action and form efflorescent metal-sulfate salts, which are then available for later dissolution during heavy rainstorms or snowmelt.
T. Knowledge Gaps and Future Research Directions
(Peter G. Vikre and David A. John)
Despite more than 100 years of bulk mining (see section C, “History of Porphyry Copper Deposits”) and research beginning with early USGS studies of porphyry copper deposits in southwestern North America (for example, Ransome, 1903, 1904, 1919; Lindgren, 1905; Emmons, 1910), many questions remain regarding the localization, character-istics, and genesis of these deposits that inhibit development of effective and cost-efficient techniques for assessment and exploration. Further, concealed PCDs magnify assessment and exploration challenges as exemplified by the relatively recent discovery, in the mature porphyry copper deposit
126 Porphyry Copper Deposit Model
province of southwestern North America, of the largely concealed, yet giant Resolution porphyry copper system in Arizona (Manske and Paul, 2002), and the numerous uncer-tainties regarding the relationship to Resolution of tectonism, weathering, and other deep copper mineralization in the area (Sell, 1995). Seedorff and others (2005) outlined numer-ous “challenges” that affect the understanding of porphyry deposits and have both scientific and practical implications. Similarly, this model of porphyry copper deposits has identi-fied several knowledge gaps that affect our understanding of the genesis of deposits and our ability to assess and explore for undiscovered deposits.
Some remaining questions and research directions that specifically address exploration and assessment needs are:1. Detailed definition of PCD characteristics in time and
space to enhance recognition of poorly exposed, con-cealed, and dismembered PC systems from limited data.
2. Determination of cryptic edges of PC systems (mineral-ogy, trace elements), thereby enlarging system size and improving exploration efficiency and assessment accu-racy, especially for concealed deposits.
3. Improved definition of physical, chemical, and isotope gradients in PC systems, especially in system extremities, to enable efficient vectoring toward copper concentra-tions, both hypogene and supergene.
4. Reconstruction of paleoterranes in PCD provinces that have been dismembered by postmineralization tectonism to account for all pieces of dismembered PCDs, thereby providing explorationists with targets and assessors with more accurate deposit inventories and densities.
5. Determination of characteristics of advanced argillic alteration assemblages that are specific to PC systems.
6. Determination of characteristics of coeval volcanic rocks, paleosurfaces, and paleodeposits that indicate the pres-ence of PC systems.
7. Evaluation of favorable terranes for PCD enrichment by number and length of erosion cycles, colluvium thickness, tectonism, and basin history.
8. Improved modeling of transport-sink cycles of PCD components near weathered or weathering PCDs for geoenvironmental applications, as well as for exploration and assessment, especially of concealed PC systems.
9. Improved understanding of the formation of exotic copper occurrences and deposits to enable vectoring of hypogene and supergene copper sources.
10. Evaluation of magmatic systems for specific characteris-tics that lead to PCD formation, including sites and struc-tural settings of magma genesis and emplacement, magma compositions (including metals [copper, molybdenum, gold] and volatiles [water, sulfur, chlorine]), relationships
among emplacement levels and cooling, crystallization and degassing rates, and relationships between copper grade, copper inventory, and multiple magmatic pulses.
11. Improved understanding of the function of regional struc-tures (faults, rock contacts) at high crustal levels in the control of igneous systems that develop PCD systems.
12. Improved understanding of fundamental controls on major differences in characteristics of PCDs, for example, controls on metal ratios, timing and distribution of molyb-denum, and timing and association of most copper with early potassic alteration or later sericitic alteration.
U. Broader Implications and Societal Relevance of Porphyry Copper Systems
(Mark D. Barton)
Porphyry copper systems, their distribution and their impacts, have broader implications for society. Beyond their overwhelming importance as the principal source of critical materials, the production of porphyry deposits constitutes a major disturbance of the Earth’s surface and elicits diverse reactions from communities affected by their occurrence and production. Understanding deposit characteristics and distri-bution can and should have a broader effect on many other aspects of human activity.
Porphyry copper systems are numerous: where they occur, they affect significant volumes in the upper crust, and their production is one of the principal modern processes affecting the Earth’s surface. Mining of porphyry deposits moves several cubic kilometers of the Earth’s upper crust per year—a volume comparable to arc volcanism (fig. U1; Barton and others, 2005). Estimates of magma and fluid fluxes in arcs suggest that porphyrylike features (magmatic-hydrothermal systems) comprise a significant fraction (perhaps 5–10 percent) of the upper arc crust in the vicinity of magmatic centers (Johnson, 2000) and hydrothermal alteration is ubiquitous in associated volcanic rocks (Barton and others, 1988). This is supported by the distribution of mineralized systems in the geologic record, the ubiquity of geothermal systems with central volcanic complexes and calderas, and estimates based on the number of porphyry systems in the geologic record (Kesler and Wilkinson, 2008). Thus, by them-selves, alteration by magmatic hydrothermal systems creates large mineralogical and geochemical anomalies that may affect baselines for significant regions with arc terrains.
The natural and human-driven life cycles of porphyry systems bear on all these factors (fig. U2). The geologic components begin with the physical and chemical architec-ture that hosts and contributes to formation of ore-forming intrusive complexes. The hydrothermal systems themselves are complex, varied entities with major differences between
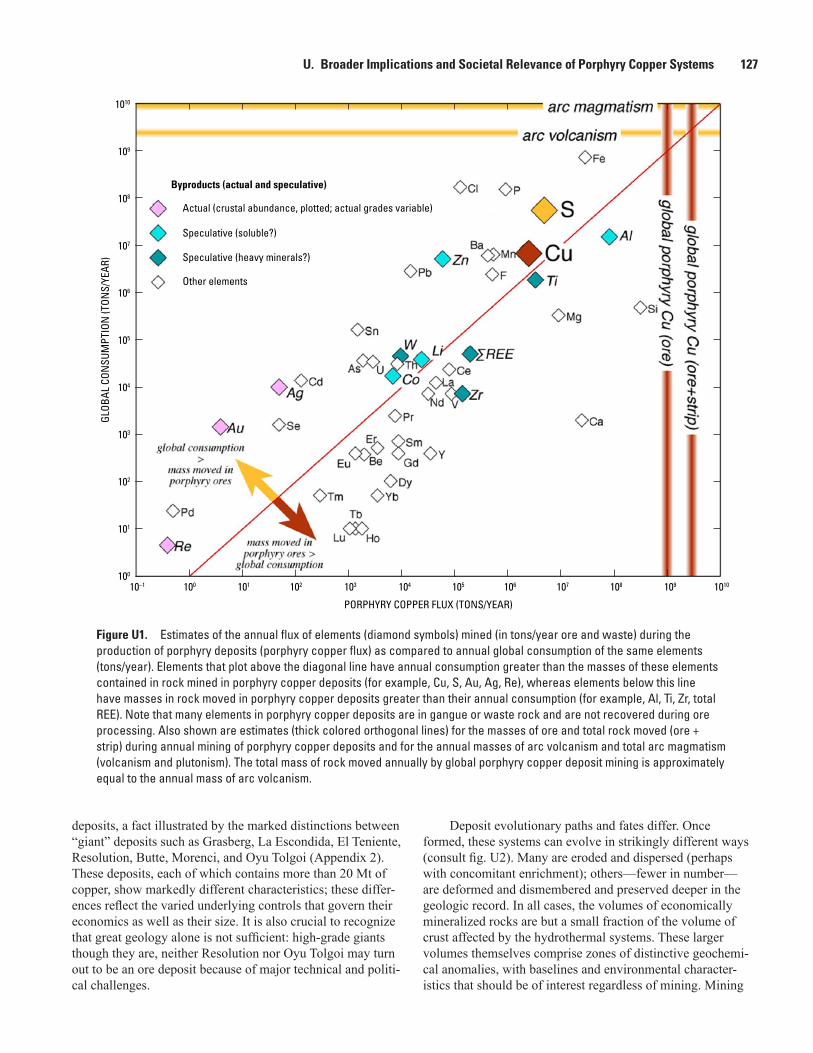
Figure U1. Estimates of the annual flux of elements (diamond symbols) mined (in tons/year ore and waste) during the production of porphyry deposits (porphyry copper flux) as compared to annual global consumption of the same elements (tons/year). Elements that plot above the diagonal line have annual consumption greater than the masses of these elements contained in rock mined in porphyry copper deposits (for example, Cu, S, Au, Ag, Re), whereas elements below this line have masses in rock moved in porphyry copper deposits greater than their annual consumption (for example, Al, Ti, Zr, total REE). Note that many elements in porphyry copper deposits are in gangue or waste rock and are not recovered during ore processing. Also shown are estimates (thick colored orthogonal lines) for the masses of ore and total rock moved (ore + strip) during annual mining of porphyry copper deposits and for the annual masses of arc volcanism and total arc magmatism (volcanism and plutonism). The total mass of rock moved annually by global porphyry copper deposit mining is approximately equal to the annual mass of arc volcanism.
PORPHYRY COPPER FLUX (TONS/YEAR)
GLOB
AL C
ONSU
MPT
ION
(TON
S/YE
AR)
10–1 100 101
101
102
102
103
103
104
104
105
105
106
106
107
107
108
108
109
109
1010
1010
100
Byproducts (actual and speculative)
Actual (crustal abundance, plotted; actual grades variable)
Speculative (soluble?)
Speculative (heavy minerals?)
Other elements
U. Broader Implications and Societal Relevance of Porphyry Copper Systems 127
deposits, a fact illustrated by the marked distinctions between “giant” deposits such as Grasberg, La Escondida, El Teniente, Resolution, Butte, Morenci, and Oyu Tolgoi (Appendix 2). These deposits, each of which contains more than 20 Mt of copper, show markedly different characteristics; these differ-ences reflect the varied underlying controls that govern their economics as well as their size. It is also crucial to recognize that great geology alone is not sufficient: high-grade giants though they are, neither Resolution nor Oyu Tolgoi may turn out to be an ore deposit because of major technical and politi-cal challenges.
Deposit evolutionary paths and fates differ. Once formed, these systems can evolve in strikingly different ways (consult fig. U2). Many are eroded and dispersed (perhaps with concomitant enrichment); others—fewer in number—are deformed and dismembered and preserved deeper in the geologic record. In all cases, the volumes of economically mineralized rocks are but a small fraction of the volume of crust affected by the hydrothermal systems. These larger volumes themselves comprise zones of distinctive geochemi-cal anomalies, with baselines and environmental character-istics that should be of interest regardless of mining. Mining
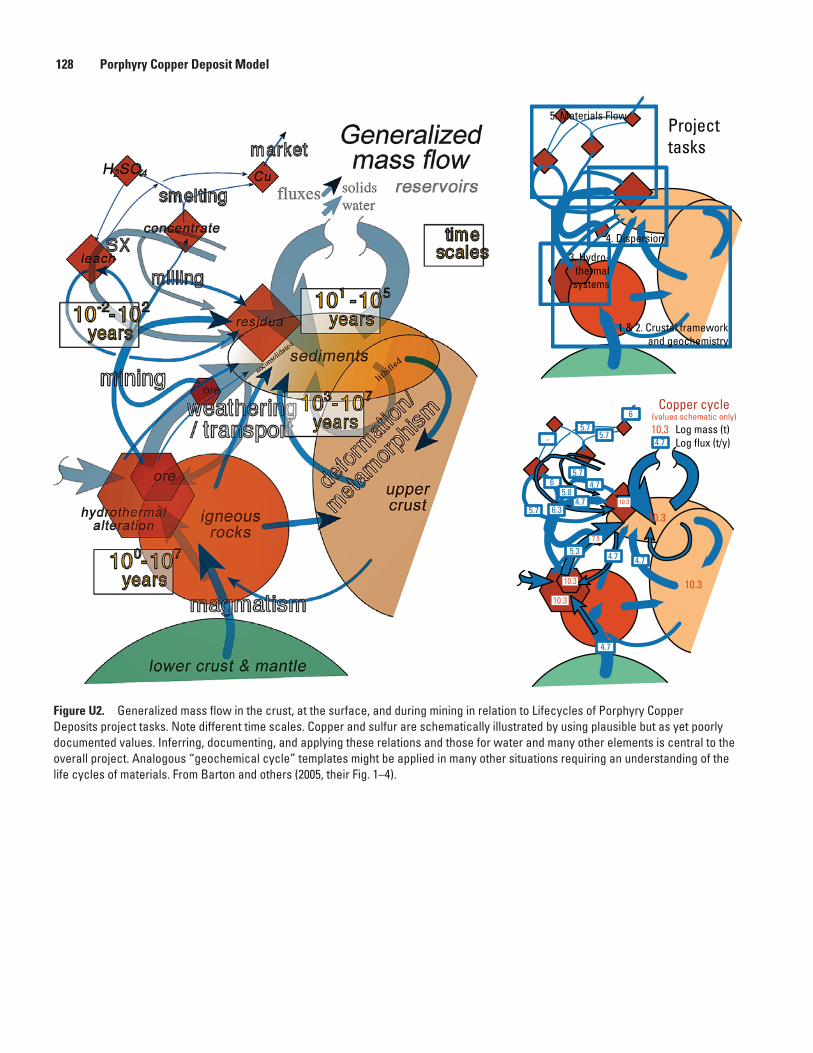
Figure U2. Generalized mass flow in the crust, at the surface, and during mining in relation to Lifecycles of Porphyry Copper Deposits project tasks. Note different time scales. Copper and sulfur are schematically illustrated by using plausible but as yet poorly documented values. Inferring, documenting, and applying these relations and those for water and many other elements is central to the overall project. Analogous “geochemical cycle” templates might be applied in many other situations requiring an understanding of the life cycles of materials. From Barton and others (2005, their Fig. 1–4).
Copper cycle(values schematic only)
Log mass (t)Log flux (t/y)
10.34.7
4.74.7
6.3
4.75.7
5.75.7
6
5.710.3
10.310.310.3
10.3
10.3
6
4.75.8
7.5
4.7
5.3
-
3. Hydro-thermalsystems
4. Dispersion
5. Materials Flow
1 & 2. Crustal frameworkand geochemistry
Projecttasks
128 Porphyry Copper Deposit Model
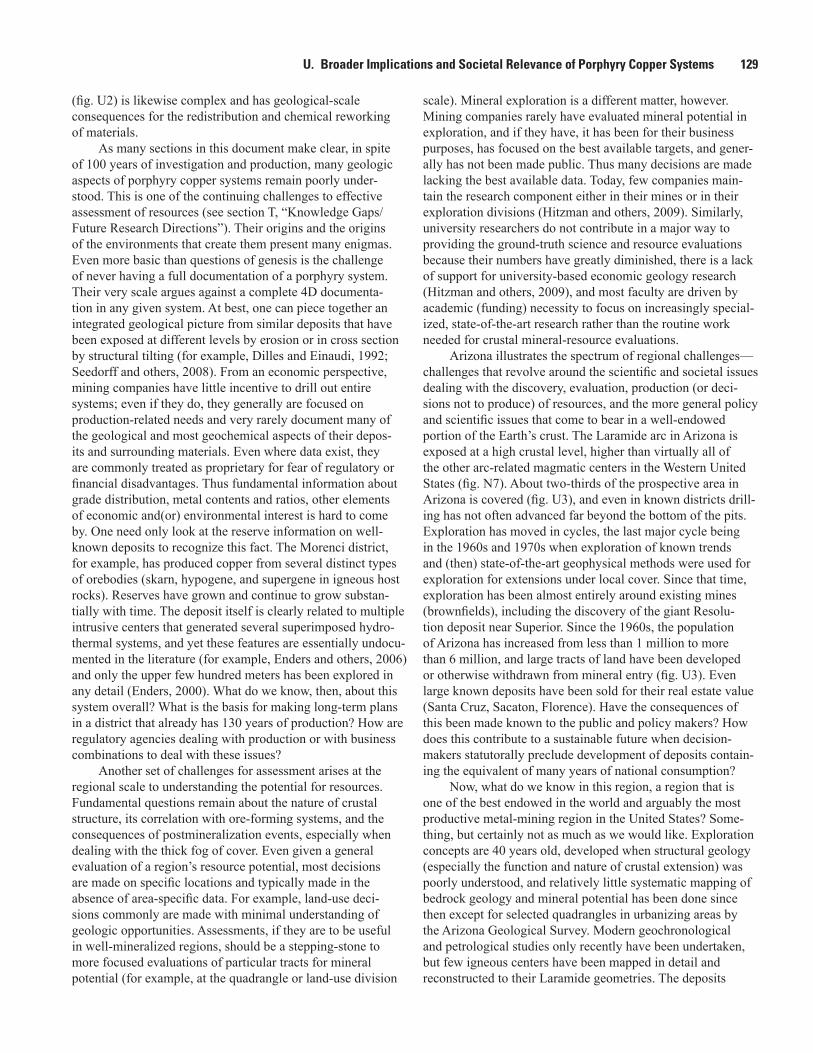
U. Broader Implications and Societal Relevance of Porphyry Copper Systems 129
(fig. U2) is likewise complex and has geological-scale consequences for the redistribution and chemical reworking of materials.
As many sections in this document make clear, in spite of 100 years of investigation and production, many geologic aspects of porphyry copper systems remain poorly under-stood. This is one of the continuing challenges to effective assessment of resources (see section T, “Knowledge Gaps/Future Research Directions”). Their origins and the origins of the environments that create them present many enigmas. Even more basic than questions of genesis is the challenge of never having a full documentation of a porphyry system. Their very scale argues against a complete 4D documenta-tion in any given system. At best, one can piece together an integrated geological picture from similar deposits that have been exposed at different levels by erosion or in cross section by structural tilting (for example, Dilles and Einaudi, 1992; Seedorff and others, 2008). From an economic perspective, mining companies have little incentive to drill out entire systems; even if they do, they generally are focused on production-related needs and very rarely document many of the geological and most geochemical aspects of their depos-its and surrounding materials. Even where data exist, they are commonly treated as proprietary for fear of regulatory or financial disadvantages. Thus fundamental information about grade distribution, metal contents and ratios, other elements of economic and(or) environmental interest is hard to come by. One need only look at the reserve information on well-known deposits to recognize this fact. The Morenci district, for example, has produced copper from several distinct types of orebodies (skarn, hypogene, and supergene in igneous host rocks). Reserves have grown and continue to grow substan-tially with time. The deposit itself is clearly related to multiple intrusive centers that generated several superimposed hydro-thermal systems, and yet these features are essentially undocu-mented in the literature (for example, Enders and others, 2006) and only the upper few hundred meters has been explored in any detail (Enders, 2000). What do we know, then, about this system overall? What is the basis for making long-term plans in a district that already has 130 years of production? How are regulatory agencies dealing with production or with business combinations to deal with these issues?
Another set of challenges for assessment arises at the regional scale to understanding the potential for resources. Fundamental questions remain about the nature of crustal structure, its correlation with ore-forming systems, and the consequences of postmineralization events, especially when dealing with the thick fog of cover. Even given a general evaluation of a region’s resource potential, most decisions are made on specific locations and typically made in the absence of area-specific data. For example, land-use deci-sions commonly are made with minimal understanding of geologic opportunities. Assessments, if they are to be useful in well-mineralized regions, should be a stepping-stone to more focused evaluations of particular tracts for mineral potential (for example, at the quadrangle or land-use division
scale). Mineral exploration is a different matter, however. Mining companies rarely have evaluated mineral potential in exploration, and if they have, it has been for their business purposes, has focused on the best available targets, and gener-ally has not been made public. Thus many decisions are made lacking the best available data. Today, few companies main-tain the research component either in their mines or in their exploration divisions (Hitzman and others, 2009). Similarly, university researchers do not contribute in a major way to providing the ground-truth science and resource evaluations because their numbers have greatly diminished, there is a lack of support for university-based economic geology research (Hitzman and others, 2009), and most faculty are driven by academic (funding) necessity to focus on increasingly special-ized, state-of-the-art research rather than the routine work needed for crustal mineral-resource evaluations.
Arizona illustrates the spectrum of regional challenges—challenges that revolve around the scientific and societal issues dealing with the discovery, evaluation, production (or deci-sions not to produce) of resources, and the more general policy and scientific issues that come to bear in a well-endowed portion of the Earth’s crust. The Laramide arc in Arizona is exposed at a high crustal level, higher than virtually all of the other arc-related magmatic centers in the Western United States (fig. N7). About two-thirds of the prospective area in Arizona is covered (fig. U3), and even in known districts drill-ing has not often advanced far beyond the bottom of the pits. Exploration has moved in cycles, the last major cycle being in the 1960s and 1970s when exploration of known trends and (then) state-of-the-art geophysical methods were used for exploration for extensions under local cover. Since that time, exploration has been almost entirely around existing mines (brownfields), including the discovery of the giant Resolu-tion deposit near Superior. Since the 1960s, the population of Arizona has increased from less than 1 million to more than 6 million, and large tracts of land have been developed or otherwise withdrawn from mineral entry (fig. U3). Even large known deposits have been sold for their real estate value (Santa Cruz, Sacaton, Florence). Have the consequences of this been made known to the public and policy makers? How does this contribute to a sustainable future when decision-makers statutorally preclude development of deposits contain-ing the equivalent of many years of national consumption?
Now, what do we know in this region, a region that is one of the best endowed in the world and arguably the most productive metal-mining region in the United States? Some-thing, but certainly not as much as we would like. Exploration concepts are 40 years old, developed when structural geology (especially the function and nature of crustal extension) was poorly understood, and relatively little systematic mapping of bedrock geology and mineral potential has been done since then except for selected quadrangles in urbanizing areas by the Arizona Geological Survey. Modern geochronological and petrological studies only recently have been undertaken, but few igneous centers have been mapped in detail and reconstructed to their Laramide geometries. The deposits
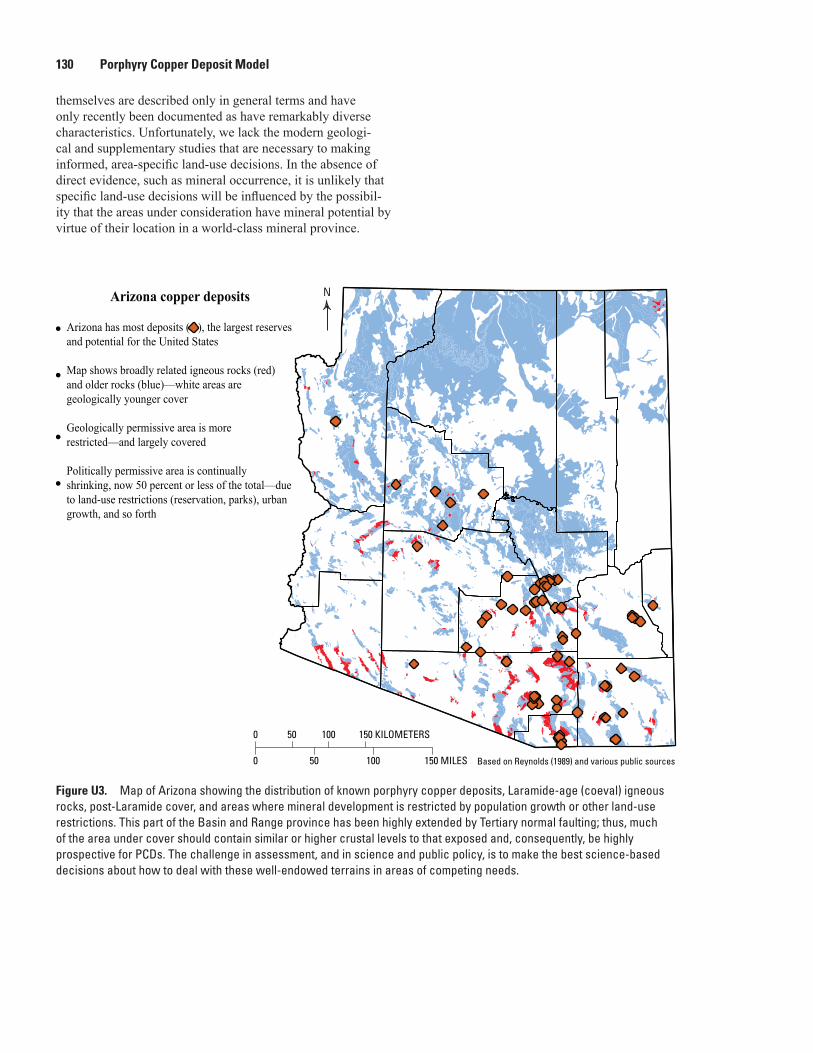
Figure U3. Map of Arizona showing the distribution of known porphyry copper deposits, Laramide-age (coeval) igneous rocks, post-Laramide cover, and areas where mineral development is restricted by population growth or other land-use restrictions. This part of the Basin and Range province has been highly extended by Tertiary normal faulting; thus, much of the area under cover should contain similar or higher crustal levels to that exposed and, consequently, be highly prospective for PCDs. The challenge in assessment, and in science and public policy, is to make the best science-based decisions about how to deal with these well-endowed terrains in areas of competing needs.
Arizona copper deposits
Arizona has most deposits ( ), the largest reserves and potential for the United States
Map shows broadly related igneous rocks (red) and older rocks (blue)—white areas are geologically younger cover
Geologically permissive area is more restricted—and largely covered
Politically permissive area is continually shrinking, now 50 percent or less of the total—due to land-use restrictions (reservation, parks), urban growth, and so forth
Based on Reynolds (1989) and various public sources
0 150 KILOMETERS10050
0 50 100 150 MILES
N
130 Porphyry Copper Deposit Model
themselves are described only in general terms and have only recently been documented as have remarkably diverse characteristics. Unfortunately, we lack the modern geologi-cal and supplementary studies that are necessary to making informed, area-specific land-use decisions. In the absence of direct evidence, such as mineral occurrence, it is unlikely that specific land-use decisions will be influenced by the possibil-ity that the areas under consideration have mineral potential by virtue of their location in a world-class mineral province.
References Cited 131
References Cited
Abrams, M.J., and Brown, D., 1984, Silver Bell, Arizona, porphyry copper test site report, in the Joint NASA/Geosat Test Case Project, final report, chapter 4, p. 4–1 to 4–73: The American Association of Petroleum Geologists, Tulsa, Okla.
Abrams, M.J., Brown, L., Lepley, R., and Sadowski, P., 1983, Remote sensing for porphyry copper deposits in Southern Arizona: Economic Geology, v. 78, p. 591–604.
AIME, 1933, Ore deposits of the Western States (Lindgren volume): New York, American Institute of Mining and Metallurgical Engineers, 797 p.
Aitcheson, S.J., Harmon, R.S., Moorbath, S., Schneider, A., Soler, P., Soria-Escalante, E., Steele, G., and Worner, G., 1995, Pb isotopes define basements of the Altiplano, central Andes: Geology, v. 23, p. 555–558.
Alavi, Mehdi, 1980, Tectonostratigraphic evolution of the Zagrosides of Iran: Geology, v. 8, p. 144–149.
Alpers, C.N., and Brimhall, G.H., 1989, Paleohydrologic evolution and geochemical dynamics of cumulative super-gene metal enrichment at La Escondida, northern Chile: Economic Geology, v. 84, p. 229–255.
Ambrus, J., 1977, Geology of the El Abra porphyry copper deposit, Chile: Economic Geology, v. 72, p. 1062–1085.
Amidi, S.M., 1984, Geological map of the Saveh quadrangle: Geological Survey of Iran, Tehran, scale 1:250,000.
Anderson, A.J., Clark, A.H., Ma, X-P, Palmer, G.R., MacArthur, J.D., and Roedder, E., 1989, Proton-induced X-ray and gamma-ray emission analysis of unopened fluid inclusions: Economic Geology, v. 84, p. 924–939.
Anderson, A.J., and Mayanovic, R.A., 2003, Electron, nuclear and X-ray probe microanalysis of fluid inclusions, in Samson, I., Anderson, A., and Marshall, D., eds., Fluid inclusions—Analysis and interpretation: Geological Asso-ciation of Canada short course series, v. 32, p. 323–351.
Anderson, J.A., 1982, Characteristics of leached capping and techniques of appraisal, in Titley, S.R., ed., Advances in geology of the porphyry copper deposits, southwestern North America: Tucson, Arizona,The University of Arizona Press, p. 275–295.
Anthony, E.Y., Reynolds, T.J., and Beane, R.E., 1984, Identi-fication of daughter minerals in fluid inclusions using scan-ning electron microscopy and energy dispersive analysis: American Mineralogist, v. 69, p. 1053–1057.
Anthony, E.Y., and Titley, S.R., 1988, Progressive mixing of isotopic reservoirs during magma genesis at the Sier-rita porphyry copper deposit, Arizona—Inverse solutions: Geochimica et Cosmochimica Acta, v. 52, p. 2235–2249.
Arif, J., and Baker, T., 2004, Gold paragenesis and chem-istry at Batu Hijau, Indonesia: implications for gold-rich porphyry copper deposits: Mineralium Deposita, v. 39, p. 523–535.
Arizona Geological Society, 1976, Proceedings of the Porphyry Copper Symposium: Arizona Geological Society Digest XI, 178 p.
Arnorsson, S., 1995, Geothermal systems in Iceland—Struc-ture and conceptual models I. High-temperature areas: Geothermics, v. 24, p. 561–602.
Arribas, Antonio., Jr., Hedenquist, J.W., Itaya, T., Okada, T., Concepción, R.A., and Garcia, J.S., Jr., 1995, Contempo-raneous formation of adjacent porphyry and epithermal Cu-Au deposits over 300 ka in northern Luzon, Philippines: Geology, v. 23, p. 337–340.
Asael, Dan, Mathews, A., Bar-Mathews, M., and Halicz, L., 2007, Copper isotope fractionation in sedimentary copper mineralization (Tima Valley, Israel): Chemical Geology, v. 243, p. 238–254.
Atkinson, W.W., Jr., and Einaudi, M.T., 1978, Skarn forma-tion and mineralization in the contact aureole at Carr Fork, Bingham, Utah: Economic Geology, v. 73, p. 1326–1365.
Atkinson, W.W., Jr., Souviron, A., Vehrs, T.I., and Faunes, G.A., 1996, Geology and mineral zoning of the Los Pelam-bres porphyry copper deposit, Chile: Society of Economic Geologists Special Publication 5, p. 131–156.
Audétat, Andreas, and Pettke, T., 2006, Evolution of a porphyry-Cu mineralized magma system at Santa Rita, New Mexico (United States): Journal of Petrology, v. 47, p. 2021–2046.
Ayati, F., Yaviz, F., Noghreyan, M., Haroni, H.A., and Yavuz, R., 2008, Chemical characteristics and compositions of hydrothermal biotite from the Dalli porphyry copper pros-pect, Arak, central province of Iran: Mineralogy and Petrol-ogy, v. 94, p. 107–122.
Ayuso, R.A., Haeussler, P.J., and Bradley, D.C., 2008, Nd-Sr-Pb geochemistry and petrogenetic framework for metallogenesis, south-central Alaska (abs.): Geochemi-cal Society, Goldschmidt Conference, Vancouver, Canada, Geochimica et Cosmochimica Acta, v. 178, p. A39.
132 Porphyry Copper Deposit Model
Ayuso, R.A., Haeussler, P.J., Bradley, D.C., Wandless, G.A., Foley, N.K., and Farris, D., 2009, The role of ridge subduction in determining the geochemistry and Nd–Sr–Pb isotopic evolution of the Kodiak batholith in Southern Alaska: Tectonophysics, v. 464, p. 137–163 doi:10.1016/j.tecto.2008.09.029.
Babcock, R.C., Ballantyne, G.H., and Phillips, C.H., 1995, Summary of the geology of the Bingham district, Utah, in Pierce, F.W., and Bolm, J.G., eds., Porphyry copper deposits of the American Cordillera: Arizona Geological Society Digest, v. 20, p. 316–335.
Baldwin, J.A., and Pearce, J.A., 1982, Discrimination of productive and nonproductive porphyritic intrusions in the Chilean Andes: Economic Geology, v. 77, p. 664–674.
Baldwin, J.T., Swain, H.D., and Clark, G.H., 1978, Geology and grade distribution of the Panguna porphyry copper deposit, Bougainville, Papua New Guinea: Economic Geology, v. 73, p. 690–702.
Ballantyne, G.H., 1981, Chemical and mineralogical varia-tions in propylitic zones surrounding porphyry copper deposits: Salt Lake City, University of Utah, Ph.D. thesis, 208 p.
Ballantyne, G.H., Smith, T.W., and Redmond, P.B., 1997, Distribution and mineralogy of gold and silver in the Bingham Canyon porphyry copper deposit, Utah, in John, D.A., and Ballantyne, G.H., eds., Geology and ore deposits of the Oquirrh and Wasatch Mountains, Utah: Society of Economic Geologists Guidebook Series, v. 29, p. 147–153.
Banks, N.G., 1973, Biotite as a source of some of the sulfur in porphyry copper deposits: Economic Geology, v. 68, p. 697–703.
Banks, N.G., 1982, Sulfur and copper in magma and rocks, in Titley, S.R., ed., Advances in geology of the porphyry copper deposits, southwestern North America: Tucson, Arizona, The University of Arizona Press, p. 227–257.
Barton, Mark, Brown, James, Haxel, Gordon, Hayes, Timothy, Jensen, Eric, Johnson, David, Kamilli, Robert, Long, Keith, Maher, David, and Seedorff, Eric, 2005, Center for Mineral Resources—U.S. Geological Survey–University of Arizona, Department of Geosciences Porphyry Copper Deposit Life Cycles Field Conference, southeastern Arizona, May 21–22, 2002: U.S. Geological Survey, Scientific Investigations Report 2005–5020, 50 p.
Barton, M.D., 1996, Granitic magmatism and metallogeny of southwestern North America: Transactions of the Royal Society of Edinburgh, Earth Sciences, v. 87, 261–280.
Barton, M.D., Battles, D.A., Bebout, G.E., Capo, R.C., Chris-tensen, J.N., Davis, S.R., Hanson, R.B., Michelsen, C.J., and Trim, H.E., 1988, Mesozoic contact metamorphism in the western United States, in Ernst,W.G., ed., Metamor-phism and crustal evolution, western conterminous United States: Englewood Cliffs, New Jersey, Prentice-Hall, Rubey Volume VII, p. 110–178.
Barton, M.D., and Hanson, R.B., 1989, Magmatism and the development of low-pressure metamorphic belts—Implica-tions from the western United States and thermal modeling: Geological Society of America Bulletin, v. 101, p. 1051–1065.
Barton, M.D., Ilchik, R.P., and Marikos, M.A., 1991, Meta-somatism, in Kerrick, D.M., ed., Contact metamorphism: Reviews in Mineralogy 26, p. 321–350.
Barton, M.D., Staude, J.-M., Johnson, D.A., and Snow, E.A., 1991, Aureole systematics, in Kerrick, D.M., ed., Contact metamorphism: Reviews in Mineralogy, v. 26, p. 723–847.
Barton, M.D., Seedorff, E., Maher, D.J., Stavast, W.J.A., Kamilli, R.J., Hayes, T., Long, K., Haxel, G., and Cook, S., 2007, Laramide porphyry copper systems and superimposed Tertiary extension—A life cycle approach to the Globe-Superior-Ray area—Guide Book No. 4 for Arizona Geolog-ical Association Ores & Orogenesis Symposium, September 24–30, 2007: Tucson, Arizona Geological Society, 61 p.
Barton, M.D., and Young, S.E., 2002, Non-pegmatitic deposits of beryllium—Mineralogy, geology, phase equilibria and origin: Reviews in Mineralogy, v. 50, p. 591–691.
Bartos, P.J., 1987, Prograde and retrograde base metal lode deposits and their relationship to underlying porphyry copper deposits: Economic Geology, v. 84, p. 1671–1683.
Barzegar, Hassan, 2007, Geology, petrology and geochemi-cal characteristics of alteration zones within the Seridune prospect, Kerman, Iran, [unpublished Ph.D. thesis]: Geo resources and material technology of the Rheinisch West-fäli Technical University Aachen, Aachen, Germany, 180 p., http://darwin.bth.rwth-aachen.de/opus3/volltexte /2007/2009/pdf/Barzegar_Hassan.pdf.
Baumgartner, Regina, Fontboté, L., and Vennemann, T., 2008, Mineral zoning and geochemistry of epithermal polymetal-lic Zn-Pb-Ag-Cu-Bi mineralization at Cerro de Pasco, Peru: Economic Geology, v. 103, p. 493–537.
Beane, R.E., and Bodnar, R.J., 1995, Hydrothermal fluids and hydrothermal alteration in porphyry copper deposits, in Pierce, F.W., and Bohm, J.G., eds., Porphyry copper depos-its of the American Cordillera: Arizona Geological Society Digest, v. 20, p. 82–93.
References Cited 133
Becker, S.P., Fall, A., and Bodnar, R.J., 2008, Synthetic fluid inclusions XVII. PVTX properties of high salin-ity H2O-NaCl solutions (greater than 30 weight percent NaCl)—Application to fluid inclusions that homogenize by halite disappearance from porphyry copper and other hydrothermal ore deposits: Economic Geology, v. 103, p. 539–554.
Behn, Geraldo, Camus, F., Carrasco, P., and Ware, H., 2001, Aeromagnetic signature of porphyry copper systems in northern Chile and its geologic implications: Economic Geology, v. 96, p. 239–248.
Benoit, M., Aguillon-Robles, A., Calmus, T., Maury, R.C., Bellon, H., Cotton, J., Bourgois, J., and Michaud, F., 2002, Geochemical diversity of Miocene volcanism in southern Baja California, Mexico—Implication of mantle and crustal sources during the opening of an asthenospheric window: Journal of Geology, v. 110, p. 627–648.
Berberian, F., Muir, I.D., Pankhurst, R.J., and Berberian, M., 1982, Late Cretaceous and Early Miocene Andean-type plutonic activity in northern Makran and central Iran: Journal of the Geological Society of London, v. 139, p. 605–614.
Berger, B.R., Ayuso, R.A., Wynn, J.C., and Seal, R.R., 2008, Preliminary model of porphyry copper deposits: U.S. Geological Survey Open-File Report 2008–1321, 55 p., http://pubs.usgs.gov/of/2008/1321/.
Berger, B.R., King, T.V.V., Morath, L.C., and Phillips, J.D., 2003, Utility of high-altitude infrared spectral data in mineral exploration—Application to northern Pata-gonia Mountains, Arizona: Economic Geology, v. 98, p. 1003–1018.
Blakely, R.J, Wells, R.E., Weaver, C.S., and Johnson, S.Y., 2002, Location, structure, and seismicity of the Seattle fault zone, Washington—Evidence from aeromagnetic anomalies, geologic mapping, and seismic-reflection data: Geological Society of America Bulletin, v. 114, p. 169–177.
Blanchard, Roland, 1968, Interpretation of leached outcrops: Nevada Bureau of Mines and Geology Bulletin 66, 196 p.
Blevin, P.L., 2002, The petrographic and compositional character of variably K-enriched magmatic suites associ-ated with Ordovician porphyry copper–Au mineralization in the Lachlan fold belt: Mineralium Deposita, v. 37, no. 1, p. 87–99.
Blevin, P.L., and Chappell, B.W., 1992, The role of magma sources, oxidation states and fractionation in determining the grani toid metallogeny of eastern Australia: Transactions of the Royal Society of Edinburgh, Earth Sciences, v. 83, p. 305–316.
Blevin, P.L., and Chappell, B.W., 1995, Intrusive metallogenic provinces in eastern Australia based on granite source and com position: Transactions of the Royal Society of Edin-burgh, Earth Sciences, v. 87, p. 281–290.
Boardman, J.W., Kruse, F.A., and Green, R.O., 1995, Mapping target signatures via partial unmixing of AVIRIS data: Proceedings of the Fifth JPL Airborne Earth Science Work-shop, JPL Publication, Pasadena, Calif., v. 95–01, p. 23–26.
Bodnar, R.J., 1982, Fluid inclusions in porphyry-type deposits: Mineral Deposits Research Review for Industry, University Park, Pa., April 7–9, 1982, p. RB1–RB25.
Bodnar, R.J., 1995, Fluid-inclusion evidence for a magmatic source for metals in porphyry copper deposits, in Thomp-son, J.F.H., ed., Magmas, fluids, and ore deposits: Miner-alogical Association of Canada short course series, v. 23, p. 139–152.
Bodnar, R.J., 2003, Reequilibration of fluid inclusions, in Samson, I., Anderson, A., and Marshall, D., eds., Fluid inclusion—Analysis and interpretation: Geological Associa-tion of Canada short course series, v. 32, p. 213–231.
Bodnar, R.J., and Beane, R.E., 1980, Temporal and spatial variations in hydrothermal fluid characteristics during vein filling in preore cover overlying deeply buried porphyry copper-type mineralization at Red Mountain, Arizona: Economic Geology, v. 75, p. 876–893.
Bodnar, R.J., Burnham, C.W., and Sterner, S.M., 1985, Synthetic fluid inclusions in natural quartz. III. Deter-mination of phase equilibrium properties in the system H2O-NaCl to 1000°C and 1500 bars: Geochimica et Cosmochimica Acta, v. 49, p. 1861–1873.
Bodnar, R.J., Mavrogenes, J.A., Anderson, A.J., Bajt, S., Sutton, S.R., and Rivers, M.I., 1993, Synchrotron XRF evidence for the sources and distribution of metals in porphyry copper deposits (abs.): EOS Transactions, Ameri-can Geophysical Union, v. 74, p. 669.
Bostinescu, 1984, Porphyry copper systems in the South Apuseni Mountains, Romania: Anuarul Institutului Geologic al Romaniei, v. 64, p. 163–175.
Bouse, R.M., Ruiz, J., Titley, S.R., Tosdal, R.M., and Wooden, J.L., 1999, Lead isotopic compositions of Late Cretaceous and early Tertiary igneous rocks and sulfide minerals in Arizona—Implications for the sources of plutons and metals in porphyry copper deposits: Economic Geology, v. 94, p. 211–244.
Boutwell, J.M., 1905, Economic geology of the Bingham mining district, Utah: U.S. Geological Survey Professional Paper 38, 413 p.
134 Porphyry Copper Deposit Model
Bower, B., Payne, J., DeLong, C., and Rebagliati, C.M., 1995, The oxide-gold, supergene and hypogene zones at the Casino gold-copper-molybdenum deposit, west-central Yukon, in Schroeter, T.G., ed., Porphyry deposits of the northwestern Cordillera of North America: Canadian Institute of Mining, Metallurgy and Petroleum Special Volume 46, p. 352–366.
Bowman, J.R., Parry, W.T., Kropp, W.P., and Kruer, S.A., 1987, Chemical and isotopic evolution of hydrothermal solutions at Bingham, Utah: Economic Geology, v. 82, p. 395–428.
Bradley, D.C., Kusky, T., Haeussler, P., Goldfarb, R.J., Miller, M.L., Dumoulin, J.A., Nelson, S.W., and Karl, S.M., 2003, Geologic signature of early Tertiary ridge subduction in Alaska, in Sisson, V.B., Roeske, S.M., and Pavlis, T.L., eds., Geology of a transpressional orogen developed during ridge-trench interaction along the North Pacific margin: Geological Society of America Special Paper, v. 371, p. 19–50.
Brant, A.A., 1966, Geophysics in the exploration for Arizona porphyry deposits, in Titley, S.R., and Hicks, C.L., eds., Geology of the porphyry copper deposits, southwestern North America: Tucson, Arizona, University of Arizona Press, p. 87–110.
Breitsprecher, K., Thorkelson, D.J., Groome, W.G., Dostal, J., 2003, Geochemical confirmation of the Kula–Farallon slab window beneath the Pacific Northwest in Eocene time: Geology, v. 31, p. 351–354.
Brimhall, G.H., Jr., 1977, Early fracture-controlled dissemi-nated mineralization at Butte, Montana: Economic Geology, v. 72, p. 37–59.
Brimhall, G.H., Jr., Agee, C., and Stoffregen, R.E., 1985, The hydrothermal conversion of hornblende to biotite: Canadian Mineralogist, v. 23, p. 369–379.
Brimhall, G.H., and Crerar, D.A., 1987, Ore fluids—Magmatic to supergene, in Carmichael, I.S.E., and Eugster, H.P., eds., Thermodynamic modeling of geological materials—Minerals, fluids, and melts: Reviews in Mineralogy, v. 17, p. 235–321.
Brown, J.G., Bassett, R.L., and Glynn, P.D., 1998, Analysis and simulation of reactive transport of metal contaminants in groundwater in Pinal Creek Basin, Arizona: Journal of Hydrology, v. 209, p. 225–250.
Brown, S.C., 2005, A review of the geology and mineraliza-tion of the Alumbrera copper-gold deposit, northwestern Argentina, in Porter, T.M., ed., Superporphyry copper and gold deposits—A global perspective: Adelaide, Porter GeoConsultancy Publishing, v. 1, p. 115–131.
Burnham, C.W., 1967, Hydrothermal fluids at the magmatic stage, in Barnes, H.L., ed., Geochemistry of hydrothermal ore deposits: New York, Holt, Rinehart and Winston, Inc., p. 34–76.
Burnham, C.W., 1979, Magmas and hydrothermal fluids, in Barnes, H.L., ed., Geochemistry of hydrothermal ore depos-its, 2d ed.: New York, John Wiley and Sons, p. 71–136.
Burnham, C.W., and Ohmoto, H., 1980, Late-stage processes of felsic magmatism: Mining Geology Special Issue 8, p. 1–11.
Burruss, R.C., 2003, Raman spectroscopy of fluid inclusions, in Samson, I., Anderson, A., and Marshall, D., eds., Fluid inclusions—Analysis and interpretation: Geological Asso-ciation of Canada short course series, v. 32, p. 279–289.
Campa, M.F., and Coney, P.J., 1983, Tectono-stratigraphic terranes and mineral resource distribution in Mexico: Cana-dian Journal of Earth Sciences, v. 20, p. 1040–1051.
Camus, Francisco, 2002, The Andean porphyry systems, in Cooke, D.R., and Pongratz, J., eds., Giant ore deposits—Characteristics, genesis, and exploration: CODES Special Publication no. 4, University of Tasmania, p. 5–22.
Camus, Francisco, 2005, Andean porphyry systems, in Porter, T.M., ed., Super porphyry copper and gold deposits, a global perspective: Adelaide, Porter GeoConsultancy Publishing, v. 1, p. 45–63.
Candela, P.A., 1997, A review of shallow, ore-related gran-ites—Textures, volatiles, and ore metals: Journal of Petrol-ogy, v. 38, p. 1619–1633.
Candela, P.A., and Piccoli, P.M., 1995, Model ore-metal partitioning from melts into vapor/brine mixtures: Miner-alogical Association of Canada short course series, v. 23, p. 101–127.
Cannell, J., Cooke, D.R., Walshe, J.L., and Stein, H., 2005, Geology, mineralization, alteration, and structural evolu-tion of the El Teniente porphyry Cu-Mo deposit: Economic Geology, v. 100, p. 979–1003.
Cannon, R.S., Pierce, A.P., Antweiller, J.C., and Buck, K.L., 1961, The data of lead isotope geology related to problems of ore genesis: Economic Geology, v. 56, p. 1–38.
Cannon, R.S., Pierce, A.P., and Antweiller, J.C., 1971, Suggested uses of lead isotopes in exploration, in Boyle, R.W., and McGerrigle, J.I., eds., Geochemical explora-tion: Canadian Institute of Mining Special Volume 11, p. 457–463.
Carslaw, H.S., and Jaeger, J.G., 1959, Conduction of heat in solids: London, Oxford University Press, 510 p.
References Cited 135
Carten, R.B., 1986, Sodium-calcium metasomatism—Chemi-cal, temporal, and spatial relationships at the Yerington, Nevada, porphyry copper deposit: Economic Geology, v. 81, p. 1495–1519.
Carten, R.B., Geraghty, E.P., Walker, B.M., and Shannon, J.R., 1988, Cyclic development of igneous features and their relationship to high-temperature igneous features in the Henderson porphyry molybdenum deposit, Colorado, Economic Geology, v. 83, p. 266–296.
Carten, R.B., White, W.H., and Stein, H.J., 1993, High-grade granite-related molybdenum systems—Classification and origin: Geological Association of Canada Special Paper 40, p. 521–554.
Cassidy, K.F., Kerrich, R., Lueck, B.A., and Stanley, C.R., 1994, Geochemical characteristics and tectonic implications of Mesozoic alkaline plutonism in Stikinia and Quesnellia, Canadian Cordillera (abs.): Geological Society of America, Abstracts with Programs, v. 26, no. 7, p. 39.
Cathles, L.M. III, 1977, An analysis of the cooling of intru-sives by groundwater convection which includes boiling: Economic Geology, v. 72, p. 804–826.
Cathles, L.M. III, 1981, Fluid flow and genesis of hydrother-mal ore deposits: Economic Geology, 75th Anniversary Volume, p. 424–457.
Cathles, L.M. III, 1997, Thermal aspects of ore formation, in Barnes, H.L., ed., Geochemistry of hydrothermal ore depos-its, 3d ed.: New York, John Wiley and Sons, p. 191–227.
Chaffee, M.A., 1976, Geochemical exploration techniques based on distribution of selected elements in rocks, soils, and plants, Mineral Butte copper deposit, Pinal County, Arizona: U.S. Geological Survey Bulletin 1278–D, p. D1–D55.
Chaffee, M.A., 1977, Geochemical exploration techniques based on distribution of selected elements in rocks, soils, and plants, Vekol porphyry copper deposit area, Pinal County, Arizona: U.S. Geological Survey Bulletin 1278–E, p. E1–D30.
Chaffee, M.A., 1982a, Geochemical prospecting techniques for porphyry copper deposits, southwestern United States and northern Mexico, in Titley, S.R., ed., Advances in geology of the porphyry copper deposits, southwestern North America: Tucson, Arizona, The University of Arizona Press, p. 297–307.
Chaffee, M.A., 1982b, A geochemical study of the Kalamazoo porphyry copper deposit, Pinal County, Arizona, in Titley, S.R., ed., Advances in geology of the porphyry copper deposits, southwestern North America: Tucson, Arizona, The University of Arizona Press, p. 211–225.
Chaffee, M.A., Hill, R.H., Sutley, S.J., and Waterson, J.R., 1981, Regional geochemical studies in the Patagonia Moun-tains, Santa Cruz County, Arizona: Journal of Geochemical Exploration, v. 14, p. 135–153.
Chambefort, Isabelle, Dilles, J.H., and Kent, A.J.R., 2008, Anhydrite-bearing andesite and dacite as a source for sulfur in magmatic-hydrothermal mineral deposits: Geology, v. 36, p. 719–722.
Chávez, W.X., Jr., 2000, Supergene oxidation of copper depos-its—Zoning and distribution of copper oxide minerals: Society of Economic Geologists Newsletter 41, p. 1, 10–21.
Chen, Xiafeng, Warner, T.A., and Campagna, D.J., 2007, Integrating visible, near-infrared and short-wave infra-red hyperspectral and multispectral thermal imagery for geological mapping at Cuprite, Nevada: Remote Sensing of the Environment, v. 110, p. 344–356.
Chesley, J.T., and Ruiz, J., 1997, Preliminary Re-Os dating on molybdenite mineralization from the Bingham canyon porphyry copper deposit, Utah, in John, D.A., and Ballan-tyne, G.H., Geology and ore deposits of the Oquirrh and Wasatch Mountains, Utah: Society of Economic Geologists Guidebook Series Volume 29, p. 165–169.
Chiaradia, Massimo, Fontboté, L., and Paladines, A., 2004, Metal sources in mineral deposits and crustal rocks of Ecuador (1°N-4°S)—A lead isotope synthesis: Economic Geology, v. 99, p. 1085–1106.
Chiaradia, Massimo, Konopelko, D., Seltman, R., and Cliff, R.A., 2006, Lead isotope variations across terrane bound-aries of the Tien Shan and Chinese Altay: Mineralium Deposita, v. 41, p. 411–428.
Chivas, A.R., and Wilkins, R.W.T., 1977, Fluid inclusion studies in relation to hydrothermal alteration and mineral-ization at the Koloula porphyry copper prospect, Guadalca-nal: Economic Geology, v. 72, p. 153–169.
Clark, A.H., 1993, Are outsize porphyry copper deposits either anatomically or environmentally distinctive? in Whiting, B.H., ed., Giant ore deposits: Society of Economic Geolo-gists Special Publication 2, p. 213–283.
Clark, A.H., Tosdal, R.M., Farrar, E., and Armando-Plazolles,V., 1990, Geomorphologic environment and age of supergene enrichment of the Cuajone, Quellaveco, and Toquepala porphyry copper deposits, Southeastern Peru: Economic Geology, v. 85, p. 1604–1628.
Clark, D.A., 1999, Magnetic petrology of igneous intrusions—Implications for exploration and magnetic interpretation: Exploration Geophysics, v. 20, p. 5–26.
136 Porphyry Copper Deposit Model
Clark, R.N., Swayze, G.A., Gallagher, A.J., King, T.V.V., and Calvin, W.M., 1993, The U.S. Geological Survey Digital Spectral Library, version 1, 0.2 to 3.0 microns: U.S. Geolog-ical Survey Open-File Report 93–592, 1,340 p.
Claveria, R.J., 2001, Mineral paragenesis of the Lepanto copper and gold and Victoria gold deposits, Mankayan mineral district, Philippines: Resource Geology, v. 51, no. 2, p. 97–106.
Cline, J.S., and Bodnar, R.J., 1991, Can economic porphyry copper mineralization be generated by a typical calc-alkaline melt?: Journal of Geophysical Research, v. 96, p. 8113–8126.
Clode, C.H., Proffett, J.M., Jr., Mitchell, P.A., and Munajat, I., 1999, Relationships of intrusion, wall-rock alteration and mineralisation in the Batu Hijau copper-gold porphyry deposit: PACRIM ’99, Australasian Institute of Mining and Metallurgy Congress, Bali, Indonesia, 10–13 October 1999, Proceedings, p. 485–498.
Cloos, Mark, and Housh, T.B., 2008, Collisional delamina-tion—Implications for porphyry-type Cu-Au ore formation in New Guinea, in Spencer, J.E., and Titley, S.R., eds., Ores and orogenesis: Circum-Pacific tectonics, geologic evolu-tion, and ore deposits: Arizona Geological Society Digest, v. 22, p. 235–244.
Cloos, Mark, Sapiie, Benyamin, van Ufford, A.Q., Weiland, R.J., Warren, P.Q., and McMahon, T.P., 2005, Collisional delamination in New Guinea—The geotectonics of subduct-ing slab breakoff: Geological Society of America, Special Paper 400, 51 p.
CODELCO, 2007, Annual Report, http://www.codelco.com/english/la_corporacion/memorias/memoria2007/pdf/CodelcoInstitucional07english.pdf accessed last on May 11, 2009.
Condie, K.C., and Kröner, Alfred, 2008, When did plate tectonics begin? Evidence from the geologic record, in Condie, K.C., and Pease, Victoria, eds., When did plate tectonics begin on Earth?: Geological Society of America Special Paper 440, p. 281–294.
Conklin, M., Villinski, J., and Kay, J., 2001, Geochemistry of acid mine contamination-aquifer interactions: International Journal of Occupational Health, v. 14, p. 249–259.
Cook, S.S., 1988, Supergene copper mineralization at the Lakeshore mine, Pinal County, Arizona: Economic Geology, v. 83, p. 297–309.
Cooke, D.R., Heithersay, P.S., Wolfe, R., and Calderon, A.L., 1998, Australian and western Pacific porphyry copper-Au deposits: Journal of Australian Geology and Geophysics, v. 17, no. 4, p. 97–104.
Cooke, D.R., Hollings, P., and Walshe, J.L., 2005, Giant porphyry deposits—Characteristics, distribution, and tectonic controls: Economic Geology, v. 100, p. 801–818.
Cooksley, J.W., 2005, Application of reflection-seismic method to leached cap exploration over porphyry copper deposits: Mining Engineering, v. 57, p. 71–75.
Core, D.P., Kesler, S.E., Essene, E.J., Dufresne, E.B., Clarke, R., Arms, D.A., Walko, D., and Rivers, M.L., 2005, Copper and zinc in silicate and oxide minerals in igneous rocks from the Bingham-Park City belt, Utah—Synchrotron X-ray fluorescence data: Canadian Mineralogist, v. 43, p. 1781–1796.
Core, D.P., Kesler, S.E., and Essene, E.J., 2006, Unusually Cu-rich magmas associated with giant porphyry copper deposits—Evidence from Bingham, Utah: Geology, v. 34, no. 1, p. 41–44.
Cox, D.P., and Singer, D.A., 1992, Distribution of gold in porphyry copper deposits, in DeYoung, J.H., and Hammer-strom, J.M., eds., Contributions to commodity research: U.S. Geological Survey Bulletin 1877, p. C1–C14.
Cox, L.J., Chaffee, M.A., Cox, D.P., and Klein, D.P., 1995, Porphyry Cu deposits: U.S. Geological Survey Open-File Report 95–831, p. 75–89.
Cunningham, C.G., Austin, G.W., Naeser, C.W., Rye, R.O., Ballantyne, G.H., Stamm, R.G., and Barker, C.E., 2004, Formation of a paleothermal anomaly and disseminated gold deposits associated with the Bingham Canyon porphyry Cu-Au-Mo system, Utah: Economic Geology, v. 99, p. 789–806.
Cunningham, C.G., Rye, R.O., Rockwell, B.W., Kunk, M.J., and Councell, T.B., 2005, Supergene destruction of a hydrothermal replacement alunite deposit at Big Rock Candy Mountain, Utah—Mineralogy, spectroscopic remote sensing, stable-isotope, and argon-age evidences: Chemical Geology, v. 215, 317–337.
Davidson, P., Kamenetsky, V., Cooke, D.B., Frikken, P., and 7 others, 2005, Magmatic precursors of hydrothermal fluids at the Rio Blanco Cu-Mo deposit, Chile—Links to silicate magmas and metal transport: Economic Geology, v. 100, p. 963–978.
Day, Stephen, and Rees, Ben, 2006, Geochemical controls on waste-rock seepage chemistry at several porphyry mines in the Canadian Cordilleran, in Barnhisel, R.I., ed., Proceed-ings 7th International Conference on Acid Rock Drain-age, St. Louis, Missouri, p. 439–456: American Society of Mining and Reclamation (ASMR), 3134 Montavesta Road, Lexington, KY 40502.
References Cited 137
DeCelles, P.G., 2004, Late Jurassic to Eocene evolution of the Cordilleran thrust belt and foreland basin system, western U.S.A.: American Journal of Science; v. 304, issue 2, p. 105–168.
Defant, M.J., and Drummond, M.S., 1990, Derivation of some modern arc magmas by melting of the subducted lithosphere in a volcanic arc: Geology, v. 21, p. 547–550.
Defant, M.J., and Drummond, M.S., 1993, Mount St Helens—Potential example of the partial melting of the subducted lithosphere in a volcanic arc: Geology, v. 21, p. 547–550.
Dickin, A.P., 2005, Radiogenic isotope geology, 2d ed.; Cambridge University Press, 492 p.
Dickinson, W.R., and Snyder, W.S., 1979, Geometry of triple junctions related to San Andreas transform: Journal of Geophysical Research, v. 84, p. 561–572.
Dilles, J.H., 1987, Petrology of the Yerington batholith, Nevada—Evidence for evolution of porphyry copper ore fluids: Economic Geology, v. 82, p. 1750–1789.
Dilles, J.H., and Einaudi, M.T., 1992, Wall-rock alteration and hydrothermal flow paths about the Ann-Mason porphyry copper deposit, Nevada—A 6-km vertical reconstruction: Economic Geology, v. 87, p. 1963–2001.
Dilles, J.H., Einaudi, M.T., Proffett, J., and Barton, M.D., 2000, Overview of the Yerington porphyry copper district—Magmatic to nonmagmatic sources of hydrothermal fluids—Their flow paths and alteration effects on rocks and Cu-Mo-Fe-Au ores: Society of Economic Geologists Guide-book Series, v. 32, p. 55–66.
Dilles, J.H., and Gans, P.B., 1995, The chronology of Ceno-zoic volcanism and deformation in the Yerington area, western Basin and Range and Walker Lane: Geological Society of America Bulletin, v. 107, p. 474–486.
Dilles, J.H., Martin, M.W., Stein, H., and Rusk, B., 2003, Re-Os and U-Pb ages for the Butte copper district, Montana—A short- or long-lived hydrothermal system? [abs]: Geological Society of America Abstracts with Programs, v. 35, no. 6, p. 400.
Dilles, J.H., and Proffett, J.M., 1995, Metallogenesis of the Yerington batholith, Nevada, in Pierce, F.W., and Bolm, J.G., eds., Porphyry copper deposits of the American Cordillera: Arizona Geological Society Digest, v. 20, p. 306–315.
Dilles, J.H., Proffett, John, and Einaudi, M.T., 2000b, Magmatic and hydrothermal features of the Yerington batholith with emphasis on the porphyry copper (Mo) deposit in the Ann-Mason area: Society of Economic Geolo-gists Guidebook Series, v. 32, p. 67–89.
Dilles, J.H., Soloman, G.C., Taylor, H.P., Jr., and Einaudi, M.T., 1992, Oxygen and hydrogen isotope characteristics of the Ann-Mason porphyry copper deposit, Yerington, Nevada: Economic Geology, v. 87, p. 44–63.
Dilles, J.H., Tomlinson, A.J., Martin, M.W., and Blanco, N., 1997, El Abra and Fortuna complexes—A porphyry copper batholith sinistrally displaced by the Falla Oeste: Congreso Geológico Chileano, Actas, 8th, Antofagasta, v. 3, p. 1883–1887.
Dilles, J.H., and Wright, J.E., 1988, The chronology of early Mesozoic arc magmatism in the Yerington district, Nevada, and its regional implications: Geological Society of America Bulletin, v. 100, p. 644–652.
Dimitrijevic, M.D., 1973, Geology of the Kerman Region: Geological Survey of Iran, Tehran, Report Yu/52.
Doe, B.R., 1978, The application of lead isotopes to mineral prospect evaluation of Cretaceous-Tertiary magmatothermal ore deposits in the western United States, in Watterson, J.R., and Theobald, P.K., eds., Geochemical Exploration 1978, Proceedings 7th International Geochemical Exploration Symposium: Golden, Colorado, Association of Exploration Geochemists, p. 227–232.
Doe, B.R., and Stacey, J.S., 1974, The application of lead isotopes to the problems of ore genesis and ore pros-pect evaluation—A review: Economic Geology, v. 69, p. 757–776.
Dold, Bernhard, and Fontboté, Lluis, 2001, Element cycling and secondary mineralogy in porphyry copper tailings as a function of climate, primary mineralogy, and mineral processing: Journal of Geochemical Exploration, v. 74, p. 3–55.
Downing, B.W., 2009, Acid rock generation/drainage in mineral deposits throughout time (Kemess case study), http://technology.infomine.com/enviromine/ard/Case%20Studies/kemess.html accessed last on March 10, 2010.
Drew, L.J., 2006, A tectonic model for the spatial occurrence of porphyry copper and polymetallic vein deposits—Appli-cations to Central Europe: U.S. Geological Survey Scien-tific Investigations Report 2005–5272, 36 p.
Drummond, M.S., and Defant, M.J., 1990, Derivation of some modern arc magmas by melting of young subducted litho-sphere: Nature, v. 347, p. 662–665.
Drummond, M.S., Defant, M.J., and Kepezhinskas, P.K., 1996, Petrogenesis of slab derived trondjhemite-tonalite-dacite/adakite magmas: Geological society of America, Special Paper 315, p. 205–215.
Dummett, H.T., 1978, Geology of the Moonmera porphyry deposit, Queensland, Australia: Economic Geology, v. 73, p. 922–944.
138 Porphyry Copper Deposit Model
Dupont, Alain, Auwera, J.V., Pin, C., Marincea, S., and Berza T., 2002, Trace element and isotope (Sr, Nd) geochemistry of porphyry- and skarn-mineralizing Late Cretaceous intru-sions from Banat, western South Carpathians, Romania: Mineralium Deposita, v. 37, p. 569–586.
Eastoe, C.J., 1978, A fluid inclusion study of the Panguna porphyry copper deposit, Bougainville, Papua New Guinea: Economic Geology, v. 73, p. 721–748.
Eastoe, C.J., and Eadington, P.J., 1986, High-temperature fluid inclusions and the role of the biotite granodiorite in mineralization at the Panguna porphyry copper deposit, Bougainville, Papua New Guinea: Economic Geology, v. 81, p. 478–483.
Ehrlich, S., 2004, Experimental study of copper isotope fractionation between aqueous Cu (II) and covellite, CuS: Chemical Geology, v. 209, p. 259–269.
Einaudi, M.T., 1977, Petrogenesis of the copper bearing skarn at the Mason Valley mine, Yerington district, Nevada: Economic Geology, v. 72, p. 769–795.
Einaudi, M.T., 1982a, Description of skarns associated with porphyry copper plutons, southwestern North America, in Titley, S.R., ed., Advances in geology of the porphyry copper deposits, southwestern North America: Tucson, University of Arizona Press, p. 139–183.
Einaudi, M.T., 1982b, General features and origin of skarns associated with porphyry copper plutons, southwestern North America, in Titley, S.R., ed., Advances in geology of the porphyry copper deposits, southwestern North America: Tucson, University of Arizona Press, p. 185–209.
Einaudi, M.T., 2000, Field trip day three—Skarns of the Yerington district, Nevada—A trip log and commentary: Society of Economic Geologists Guidebook Series, v. 32, p. 101–125.
Einaudi, M.T., Hedenquist, J.W., and Inan, E.E., 2003, Sulfidation state of fluids in active and extinct hydrothermal systems—Transitions from porphyry to epithermal environ-ments: Society of Economic Geologists Special Publica-tion 10, p. 285–313.
Einaudi, M.T., Meinert, L.D., and Newberry, R.J., 1981, Skarn deposits: Economic Geology 75th Anniversary Volume, p. 317–391.
Emmons, S.F., 1910, Cananea mining district of Sonora, Mexico: Economic Geology, v. 5, p. 312–356.
Emmons, S.F., 1918, Principles of economic geology, 1st ed.: New York, McGraw-Hill, 550 p.
Enders, M.S., 2000, The evolution of supergene enrichment in the Morenci porphyry copper deposit, Greenlee County, Arizona: Tucson, University of Arizona, Ph.D. dissertation, 517 p.
Enders, M.S., Knickerbocker, C., Titley, S.R., and Southam, G., 2006, The role of bacteria in the supergene environment of the Morenci porphyry copper deposit, Greenlee County, Arizona: Economic Geology, v. 101, p. 59–70.
Eychaner, J.H., 1991, The Globe, Arizona, research site—Contaminants related to copper mining in a hydrologically integrated environment, in Mallard, G.E., and Aronson, D.A., eds., U.S. Geological Survey Toxic Substances Hydrology Program—Proceedings of the technical meeting, Monterey, California, March 11–15, 1991: U.S. Geological Survey Water-Resources Investigations Report 91–4034, p. 439–447.
Farmer, G.L., and DePaolo, D.J., 1984, Origin of Meso-zoic and Tertiary granite in the western United States and implications for pre-Mesozoic crustal structure—2. Nd and Sr isotopic studies of unmineralized and Cu- and Mo-mineralized granite in the Precambrian craton: Journal of Geophysical Research, v. 89, p. 10141–10160.
Ferneyhough, A.B., 2000, Case history study of the Batu Hijau copper-gold porphyry deposit in Indonesia, in Ellis, R.B., Irvine, R., and Fritz, F., eds., Northwest Mining Association 1998 Practical Geophysics Short Course, selected papers on CD–ROM: Spokane, Washington, Northwest Mining Association, paper 5, 9 p.
Fey, D.L., Granitto, M., Giles, S.A., Smith, S.M., Eppinger R.G., and Kelley, K.D., 2008, Geochemical data for samples collected in 2007 near the concealed Pebble porphyry Cu-Au-Mo deposit, southwest Alaska: U.S. Geologi-cal Survey Open-File Report 2008–1132, 2008, 154 p., http://pubs.usgs.gov/of/2008/1132/.
Field, C.W., and Fifarek, R.H., 1985, Light stable-isotope systematics in the epithermal environment, in Berger, B.R., and Bethke, P.M., eds., Geology and geochemistry of epithermal systems: Reviews in Economic Geology, v. 2, p. 99–128.
Field, C.W., Zhang, L., Dilles, J.H., Rye, R.O., and Reed, M.H., 2005, Sulfur and oxygen isotope record in sulfate and sulfide minerals of early, deep, pre-Main Stage porphyry Cu-Mo and late Main Stage base-metal mineral depos-its, Butte district, Montana: Chemical Geology, v. 215, p. 61–93.
References Cited 139
Ford, Ken, Keating, P., and Thomas, M.D., 2007, Overview of geophysical signatures associated with Canadian ore depos-its, in Goodfellow, W.D., ed., Mineral deposits of Canada—A synthesis of major deposit-types, district metallogeny, the evolution of geological provinces, and exploration methods: Special Publication 5, Mineral Deposits Division, Geologi-cal Association of Canada, Part 5, 21 p.
Fournier, R.O., 1967, The porphyry copper deposit exposed in the Liberty open-pit mine near Ely, Nevada. Part I. Syngenetic formation: Economic Geology, v. 90, p. 2–16.
Fournier, R.O., 1987, Conceptual models of brine evolution in magmatic-hydrothermal systems: U.S. Geological Survey Professional Paper 1350, p. 1487–1506.
Fournier, R.O., 1989, Geochemistry and dynamics of the Yellowstone National Park hydrothermal system: Annual Review of Earth and Planetary Sciences, v. 17, p. 13–53.
Fournier, R.O., 1999, Hydrothermal processes related to movement of fluid from plastic into brittle rock in the magmatic-epithermal environment: Economic Geology, v. 94, p. 1193–1211.
Franchini, Marta, Impiccini, A., Meinert, L., Grathoff, G., and Schalamuk, I.B.A., 2007, Clay mineralogy and zonation in the Campana Mahuida porphyry copper deposit, Neuquen, Argentina—Implications for porphyry copper exploration: Economic Geology, v. 102, p. 17–54.
Fraser, T.M., Godvin, C.I., Thompson, J.F.H., and Stanley, C.R., 1993, Geology and alteration of the Mount Polley alkalic porphyry copper-gold deposit, British Columbia, in Grant, B., and Newell, J.M., eds., Geological fieldwork 1992: British Columbia Ministry of Energy, Mines and Petroleum Resources, Paper 1993–1, p. 295–300.
Fraser, T.M., Stanley, C.R., Nikic, Z.T., Pesalj, R., and Gorc, D., 1995, The Mount Polley alkalic porphyry copper-gold deposit, south-central British Columbia, in Schroeter, T.G., ed., Porphyry deposits of the northwestern Cordillera of North America: Canadian Institute of Mining, Metallurgy and Petroleum Special Volume 46, p. 609–622.
Frikken, P.H., Cooke, D.R., Walshe, J.L., Archibald, D., and three others, 2005, Mineralogical and isotopic zonation in the Sur-Sur Tourmaline breccia, Rio Blanco-Los Bronces Cu-Mo deposit, Chile—Implications for ore genesis: Economic Geology, v. 100, p. 935–962.
Fujisada, H.F., 1995, Design and performance of ASTER instrument, in Proceedings of SPIE: Paris, France, Interna-tional Society Optical Engineering, v. 2583, p. 16–25.
Gagnon, J.E., Samson, I.M., and Fryer, B.J., 2003, LA–ICP–MS analysis of fluid inclusions, in Samson, I., Anderson, A., and Marshall, D., eds., Fluid inclusions—Analysis and interpretation: Geological Association of Canada short course series, v. 32, p. 291–322.
Gammons, C.H., and Duaime, T.E., 2005, Long term changes in the limnology and geochemistry of the Berkeley pit lake, Butte, Montana: Mine Water and the Environment, v. 25, p. 76–85.
Gammons, C.H., Metesh, J.J., and Duaime, T.E., 2005, An overview of the mining history and geology of Butte, Montana: Mine Water and the Environment, v. 25, p. 70–75.
Garwin, Steve, 2000, The setting, geometry and timing of intrusion-related hydrothermal systems in the vicinity of the Batu Hijau porphyry copper-gold deposit, Sumbawa, Indonesia: Nedlands, University of Western Australia, Ph.D. thesis, 320 p.
Garwin, Steve, 2002, The geologic setting of intrusion-related hydrothermal systems near the Batu Hijau porphyry copper-gold deposit, Sumbawa, Indonesia: Society of Economic Geologists Special Publication 9, p. 333–366.
Garwin, Steve, Hall, Robert, and Watanabe, Yashushi, 2005, Tectonic setting, geology, and gold and copper mineraliza-tion in Cenozoic magmatic arcs of southeast Asia and the west Pacific: Society of Economic Geologists, Economic Geology 100th Anniversary Volume, p. 891–930.
Ge, W., Wu, F., Zhou, C., and Zhang, J., 2007, Porphyry Cu-Mo deposits in the eastern Xing’an-Mongolian Orogenic Belt—Mineralization ages and their geodynamic implica-tions: Chinese Science Bulletin, v. 52, p. 3416–3427.
Geiger, S., Driesner, T., Heinrich, C.A., and Matthai, S.K., 2005, On the dynamics of NaCl-H2O fluid convection in the Earth’s crust: Journal of Geophysical Research, v. 110, B07101, 23 p., doi:10.1029/2004JB003362
Geiger, S., Haggerty, R.D., Dilles, J.H., Reed, M.H., and Matthäi, S.F., 2002, The evolution of the early hydrothermal alteration at Butte, Montana—New insights from reactive transport modeling: Geofluids, v. 2, p. 185–201.
Giggenbach, W.F., 1992, Isotopic shifts in waters from geothermal and volcanic systems along convergent plate boundaries and their origin: Earth and Planetary Science Letters, v. 113, p. 495–510.
Gilmour, Paul, 1995, A field guide to leached capping inter-pretation, in Pierce, F.W., and Bolm, J.G., eds., Porphyry copper deposits of the American Cordillera: Arizona Geological Society Digest, v. 20, p. 169–179.
140 Porphyry Copper Deposit Model
Gleeson, S.A., 2003, Bulk analysis of electrolytes in fluid inclusions, in Samson, I., Anderson, A., and Marshall, D., eds., Fluid inclusions—Analysis and interpretation: Geological Association of Canada short course series, v. 32, p. 233–247.
Godwin, C.I., and Sinclair, A.J., 1982, Average lead isotope growth curves for shale-hosted lead-zinc deposits, Canadian Cordillera: Economic Geology, v. 77, p. 82–94.
Goldstein, R.H., and Reynolds, T.J., 1994, Systematics of fluid inclusions in diagenetic minerals: Society of Economic Mineralogists and Paleontologists short course 31, 199 p.
Gonzalez-Partida, E., Levresse, G., Carillo-Chavez, A., Cheil-letz, A., Gasquet, D., and Jones, D., 2003, Paleocene adakite Au-Fe bearing rocks, Mezcala, Mexico—Evidence from geochemical characteristics: Journal of Geochemical Explo-ration, v. 80, p. 25–40.
Gow, P.A., and Walshe, J.L., 2005, The role of pre-existing geologic architecture in the formation of giant porphyry-related Cu ± Au deposits—Examples from New Guinea and Chile: Economic Geology, v. 100, p. 819–833.
Graham, S., Pearson, N., Jackson, S., Griffin, W., and O’Reilly, S.Y., 2004, Tracing Cu and Fe from source to porphyry—In-situ determination of Cu and Fe isotope ratios in sulfides from Grasberg Cu-Au deposit: Chemical Geology, v. 207, p. 147–169.
Grant, J.A., 1986, The isochon diagram—A simple solution to Gresen’s equation for metasomatic alteration: Economic Geology, v. 81, p. 1976–1982.
Graybeal, F.T., 1972, The partition of trace elements among coexisting minerals in some Laramide intrusive rocks in Arizona: Tucson, University of Arizona, Ph.D. thesis, 220 p.
Graybeal, F.T., 1973, Copper, manganese, and zinc in coex-isting mafic minerals from Laramide intrusive rocks in Arizona: Economic Geology, v. 68, p. 785–798.
Graybeal, F.T., 1996, Sunnyside—A vertically-preserved porphyry copper system, Patagonia Mountains, Arizona: Society of Economic Geologists Newsletter, no. 26, July 1996, p. 1–14.
Graybeal, F.T., 2005, Poor economics did not close the Santa Cruz in situ project: Mining Engineering, v. 57, no. 5, p. 7.
Graybeal, F.T., Applebee, D.J., Stavast, W.J.A., Aiken, D.M., Baugh, G.A., Veek, B.M., and Cook, S.S., 2007, Porphyry copper systems of southern Arizona: Arizona Geological Society, Ores and Orogenesis Symposium Field Trip no. 8 Guidebook, composite pagination.
Green, R.O., Westwood, M.L., Sarture, C.M., Chrien, T.G., Aronsson, M., Chippendale, B.J., Faust, J.A., Pavri, B.E., Chovit, C.J., Solis, J., Olah, M.R., and Williams, O., 1998, Imaging spectroscopy and the Airborne Visible/Infrared Imaging Spectrometer (AVIRIS): Remote Sensing of Envi-ronment, v. 65, p. 227–248.
Gresens, R.L., 1967, Composition-volume relationships of metasomatism: Chemical Geology, v. 2, p. 47–55.
Groves, D.I., Vielreicher, R.M., Goldfarb, R.J., and Condie, K.C., 2005, Controls on the heterogeneous distribution of mineral deposits through time: Geological Society of London, Special Publications, v. 248, p. 71–101.
Gulson, B.L., 1986, Lead isotopes in mineral exploration: Developments in economic geology, Elsevier Science Publishers, 245 p.
Gulson, B.L., and Mizon, K.J., 1980, Lead isotope studies at Jabiluka, in Ferguson, J., and Goleby, A.B., eds., Uranium in the Pine Creek geosyncline: International Atomic Energy Agency, Vienna, Austria, p. 439–455.
Gustafson, L.B., and Hunt, J.P., 1975, The porphyry copper deposit at El Salvador, Chile: Economic Geology, v. 70, p. 857–912.
Gustafson, L.B., Orquera, W., McWilliams, M., Castro, M., Olivares, O., Rojas, G., Maluenda, J., and Mendez, M., 2001, Multiple centers of mineralization in the Indio Muerto district, El Salvador, Chile: Economic Geology, v. 96, p. 325–350.
Gustafson, L.B., and Quiroga, G., Jorge, 1995, Patterns of mineralization and alteration below the porphyry copper orebody at El Salvador, Chile: Economic Geology, v. 90, p. 2–16.
Gutscher, M.A., Maury, R., Eissen, J., and Bourdon, E., 2000, Can slab melting be caused by flat subduction?: Geology, v. 28, p. 535–538.
Haeussler, P. J., Bradley, D.C., Goldfarb, R.J., Snee, L.W., and Taylor, Cliff, 1995, Link between ridge subduction and gold mineralization in southern Alaska: Geology, v. 23, no. 11, p. 995–998.
Hajian, H., 1977, Geological map of the Tafresh area: Geolog-ical Survey of Iran, Tehran Iran, scale 1:100,000.
Halter, W.E., Bain, N., Becker, K., Heinrich, C.A., Landt-wing, M., VonQuadt, A., Bissig, T., Clark, A.H., Sasso, A.M., and Tosdal, R.M., 2004, From andesitic volcanism to the formation of a porphyry-Cu-Au mineralizing magma chamber—The Farallón Negro Volcanic Complex, north-western Argentina: Journal of Volcanology and Geothermal Research, v. 136, p. 1–30.
References Cited 141
Halter, W.E., Heinrich, C.A., and Tettke, Thomas, 2005, Magma evolution and the formation of porphyry Cu-Au ore fluids—Evidence from silicate and sulfide melt inclusions: Mineralium Deposita, v. 39, p. 845–863.
Han, C., Xiao, W., Zhao, G., Mao, J., Yang, J., Wang, Z., Yan, Z., and Mao, Q., 2006, Geological characteristics and genesis of the Tuwu porphyry copper deposits, Hami, Xinjiang, central Asia: Ore Geology Reviews, v. 29, p. 77–94.
Hansen, H.K., Yianatos, J.B., and Ottosen, L.M., 2005, Speciation and leachability of copper in mine tailings from porphyry copper mining—Influence of particle size: Chemosphere, v. 60, p. 1497–1503.
Hanson, R.B., 1996, Hydrodynamics of magmatic and mete-oric fluids in the vicinity of granitic intrusions: Transactions of the Royal Society of Edinburgh, Earth Sciences, v. 87, p. 251–259.
Harris, A.C., Bryan, S.E., and Holcombe, R.J., 2006, Volca-nic setting of the Bajo de la Alumbrera porphyry Cu-Au deposit, Farallón Negro volcanics, northwest Argentina: Economic Geology, v. 101, p. 71–94.
Harris, A.C., Dunlap, W.J., Reiners, P.W., Allen, C.M., Cooke, D.R., White, N.C., Campbell, I.H., and Golding, S.D., 2008, Multimillion year thermal history of a porphyry copper deposit—Application of U-Pb, 40Ar/39Ar and (U-Th)/He chronometers, Bajo de la Alumbrera copper-gold deposit, Argentina: Mineralium Deposita, v. 43, p. 295–314.
Hartley, A.J., and Rice, C.M., 2005, Controls on supergene enrichment of porphyry copper deposits in the Central Andes—A review and discussion: Mineralium Deposita, v. 40, p. 515–525.
Haschke, M.R., Gunther, A., and Scheuber, E., 2002, Repeated crustal thickening and recycling during the Andean orogeny in north Chile (21°-26°S): Journal of Geophysical Research, v. 107, ECV 6 1–18.
Hassanzadeh, Jamshid, 1993, Metallogenic and tectonomag-matic events in the SE sector of the Cenozoic active conti-nental margin of central Iran (Shahr e Babak area, Keman Province): Los Angeles, University of California, Ph.D. thesis, 204 p.
Haxel, G.B., Johnson, D.A., Briskey, J.A., and Tosdal, R.M., 2003, Abundance and behavior of ore and other metals in latest Cretaceous to early Tertiary (“Laramide”) metalumi-nous and peraluminous granitoids, south-central Arizona and north-central Sonora [abs.]: Geological Society of America, Abstracts with Programs, v. 35, no. 6, p. 232.
Hedenquist, J.W., 1990, The thermal and geochemical struc-ture of the Broadlands-Ohaaki geothermal system: Geother-mics, v. 19, p. 151–185.
Hedenquist, J.W., Arribas, Antonio, Jr., and Gonzalez-Urien, Eliseo, 2000, Exploration for epithermal gold deposits, in Hagemann, S.G., and Brown, P.E., eds., Gold in 2000: Reviews in Economic Geology, v. 13, p. 245–277.
Hedenquist, J.W., Arribas, A., Jr., and Reynolds, T.J., 1998, Evolution of an intrusion-centered hydrothermal system—Far Southeast-Lepanto porphyry and epithermal Cu-Au deposits, Philippines: Economic Geology, v. 93, p. 373–404.
Hedenquist, J.W., and Richards, J.P., 1998, The influence of geochemical techniques on the development of genetic models for porphyry copper deposits: Reviews in Economic Geology, v. 10, p. 235–256.
Heidrick, T.L., and Titley, S.R., 1982, Fracture and dike patterns in Laramide plutons and their structural and tectonic implications, in Titley, S.R., ed., Advances in geology of the porphyry copper deposits, southwest-ern United States: Tucson, University of Arizona Press, p. 73–92.
Heinrich, C.A., 2005, The physical and chemical evolution of low- to medium-salinity magmatic fluids at the porphyry to epithermal transition—A thermodynamic study: Mineralium Deposita, v. 39, p. 864–889.
Heinrich, C.A., 2007, Fluid-fluid interactions in magmatic-hydrothermal ore formation: Reviews in Mineralogy and Geochemistry, v. 65, p. 363–387.
Heinrich, C.A., Günter, D., Audétat, A., Ulrich, T., and Frisch-knecht, R., 1999, Metal fractionation between magmatic brine and vapor determined by microanalysis of fluid inclu-sions: Geology, v. 27, p. 755–758.
Hemley, J.J., Cygan, G.L., Fein, J.B., Robinson, G.R., and d’Angelo, W.M., 1992, Hydrothermal ore-forming processes in the light of studies in rock-buffered systems—I. Iron-copper-zinc-lead sulfide solubility relations: Economic Geology, v. 87, p. 1–22.
Hemley, J.J., and Hunt, J.P., 1992, Hydrothermal ore-forming processes in the light of studies in rock-buffered systems: II. Some general geologic applications: Economic Geology, v. 87, p. 23–43.
Hemley, J.J., and Jones, W.R., 1964, Chemical aspects of hydrothermal alteration with emphasis on hydrogen meta-somatism: Economic Geology, v. 59, p. 538–569.
Hemley, J.J., Montoya, J.W., Marinenko, J.W., and Luce, R.W., 1980, Equilibria in the system Al2O3-SiO2-H2O and some general implications for alteration/mineralization processes: Economic Geology, v. 75, p. 210–228.
142 Porphyry Copper Deposit Model
Hendry, D.A.F., Chivas, A.R., Long, J.V.P., and Reed, S.J.B., 1985, Chemical differences between minerals from miner-alizing and barren intrusions from some North American porphyry copper deposits: Contributions to Mineralogy and Petrology, v. 89, p. 317–329.
Henley, R.W., and Ellis, A.J., 1983, Geothermal systems ancient and modern—A geochemical review: Earth Science Reviews, v. 19, p. 1–50.
Henley, R.W., and McNabb, A., 1978, Magmatic vapor plumes and groundwater interaction in porphyry copper emplace-ment: Economic Geology, v. 73, p. 1–20.
Heyl, A.V., Delevaux, M.H., Zartman, R.E., and Brock, M.R., 1966, Isotopic study of galenas from the Upper Mississippi Valley, the Illinois-Kentucky, and some Appalachian Valley mineral deposits—A review: Economic Geology, v. 61, p. 933–961.
Hezarkhani, Ardeshir, 2006, Mass changes during hydrother-mal alteration/mineralization at the Sar-Cheshmeh porphyry copper deposit, southeastern Iran: International Geology Review, v. 48, p. 841–860.
Hildenbrand, T.G., Berger, Barney, Jachens, R.C., and Luding-ton, Steve, 2001, Utility of magnetic and gravity data in evaluating regional controls on mineralization—Examples from the western United States: Reviews in Economic Geology, v. 14, p. 75–109.
Hildreth, Wes, and Moorbath, S., 1988, Crustal contributions to arc magmatism in the Andes of Central Chile: Contribu-tions to Mineralogy and Petrology, v. 98, p. 455–489.
Hill, K.C., Kendrick, R.D., Crowhurst, P.V., and Gow, P.A., 2002, Copper-gold mineralization in New Guinea—Tecton-ics, lineaments, thermochronology and structure: Australian Journal of Earth Sciences, v. 49, p. 737–752.
Hitzman, Murray, Dilles, John, Barton, Mark, and Boland, Maeve, 2009, Mineral resource geology in academia—An impending crisis: GSA Today, v. 19, no. 8, p. 26–28.
Hodson, C.J., Bailes, R.J., and Verzosa, R.S., 1976, Cariboo-Bell, in Sutherland Brown, A., ed., Porphyry deposits of the Canadian Cordillera of North America: Canadian Institute of Mining, Metallurgy and Petroleum Special Volume 15, p. 388–401.
Hofmann, A.W., 1997, Mantle geochemistry—The message from oceanic volcanism: Nature, v. 385, p. 219–229.
Holick, P.A., and Wood, S.A., 1999, Fluid-inclusion study of the Morenci porphyry copper deposit, Arizona; metal content of the ore-forming brine (abs.): Geological Society of America, Abstracts with Programs, v. 31, no. 7, p. 404.
Holland, H.D., 1965, Some applications of thermochemical data to problems of ore deposits, II. Mineral assemblages and the composition of ore-forming fluids: Economic Geology, v. 60, p. 1101–1166.
Holliday, J.R., Wilson, A.J., Blevin, P.L., Tedder, I.J., Dunham, P.D., and Pfitzner, M., 2002, Porphyry gold-copper mineral-ization in the Cadia district, eastern Lachlan fold belt, New South Wales, and its relationship to shoshonitic magmatism: Mineralium Deposita, v. 37, no. 1, p. 100–116.
Hollings, P., Cooke, D., and Clark, A., 2005, Regional geochemistry of Tertiary igneous rocks in Central Chile—Implications for the geodynamic environment of giant porphyry copper and epithermal gold mineralization: Economic Geology, v. 100, p. 887–904.
Horita, Juske, Cole, D.R., and Wesolowski, D.J., 1995, The activity-composition relationship of oxygen and hydrogen isotopes in aqueous salt solutions; III, Vapor-liquid water equilibration of NaCl solutions to 350 degrees C: Geochi-mica et Cosmochimica Acta, v. 59, p. 1139–1151.
Hou, Q., Khin Zaw, Pan, G., Xu, Q., Hu, Y., and Li, X., 2007, Sanjiang Tethyan metallogenesis in S.W. China—Tectonic setting, metallogenic epochs and deposit types: Ore Geology Reviews, v. 31, p. 279–303.
Hou, Z.Q., Gao, Y.F., Xiaoming, Q., Rui, Z.Y., and Mo, X.X., 2004, Orign of adakitic intrusives generated during mid-Miocene east-west extension in southern Tibet: Earth and Planetary Science Letters, v. 220, p. 139–155.
Hou, Zengquian, Meng, X., Xiaoming, Q., and Gao, Y., 2005, Copper ore potential of adakitic intrusions in Gangdese porphyry copper belt, Xizang, China—Constraints from rock phase and deep melting process: Mineral Deposits (Kuangchuang Dizhi), v. 24, p. 108–121.
Howell, F.H., and Molloy, J.S., 1960, Geology of the Braden orebody, Chile, South America: Economic Geology, v. 55, p. 863–905.
Huber, H., 1969, Geological map of Iran sheet no. 5, south-central Iran: National Iranian Oil Company, scale 1:1,000,000.
Hunt, G.R., 1977, Spectral signatures of particulate minerals in the visible and near infrared: Geophysics, v. 42, no. 3, p. 501–513.
Hunt, G.R., and Ashley, R.P., 1979, Spectra of altered rocks in the visible and near infrared: Economic Geology, v. 74, no. 7, p. 1613–1629.
Hunt, G.R., Salisbury, J.W., and Lenhoff, C.J., 1971a, Visible and near-infrared spectra of minerals and rocks: III. Oxides and hydroxides: Modern Geology, v. 2, p. 195–205.
References Cited 143
Hunt, G.R., Salisbury, J.W., and Lenhoff, C.J., 1971b, Visible and near-infrared spectra of minerals and rocks: IV. Sulphides and sulphates: Modern Geology, v. 3, p. 1–14.
Hunt, R.N., 1933, Bingham mining district: 16th International Geological Congress, Washington D.C., Guidebook 17, p. 45–56.
Idrus, Arifudin, Kolb, Jochen, and Meyer, F.M., 2007, Chemi-cal composition of rock-forming minerals in copper-gold-bearing tonalite porphyries at the Batu Hijau deposit, Sumbawa Island, Indonesia—Implications for crystalliza-tion conditions and fluorine-chlorine fugacity: Resource Geology, v. 57, p. 102–113.
Imai, A., 2000, Mineral paragenesis, fluid inclusions and sulfur isotope systematics of the Lepanto Far Southeast Porphyry Cu-Au Deposit, Mankayan, Philippines: Resource Geology, v. 50, no. 3, p. 151–168.
Imai, A., and Ohno, S., 2005, Primary ore mineral assemblage and fluid inclusion study of the Batu Hijau porphyry Cu-Au deposit, Sumbawa Indonesia: Resource Geology, v. 55, no. 3, p. 239–248.
Ingebritsen, S.E., and Manning, C.E., 1999, Geological impli-cations of a permeability-depth curve for the continental crust: Geology, v. 27, p. 1107–1100.
Irvine, T.N., and Baragar, W.R.A., 1971, A guide to the chemi-cal classification of the common volcanic rocks: Canadian Journal of Earth Sciences, v. 8, p. 523–548.
Ivanhoe Mines, Ltd., 2010, Ivanhoe Mines releases New Integrated Development Plan for Oyu Tolgoi copper-gold mining complex in Mongolia, 17 p., accessed July 20, 2010, at http://www.ivanhoemines.com/i/pdf/2010May11.pdf.
Jacobs, D.C., and Parry, W.T., 1979, Geochemistry of biotite in the Santa Rita porphyry copper deposit, New Mexico: Economic Geology, v. 74, p. 860–887.
Jahns, R.H., and Burnham, C.W., 1969, Experimental studies of pegmatite genesis: I. A model for the derivation and crystallization of granitic pegmatites: Economic Geology, v. 64, p. 843–864.
Jambor, J.L., Dutrizac, J.E., Groat, L.A., and Raudsepp, M., 2002, Static tests of neutralization potentials of silicate and aluminosilicate minerals: Environmental Geology, v. 43, p. 1–17.
Jankovic, S., 1977, The copper deposits and geotectonic setting of the Tethyan Eurasian metallogenic belt: Minera-lium Deposita, v. 12, p. 37–47.
Jensen, E.P., and Barton, M.D., 2000, Gold deposits related to alkaline magmatism: Reviews in Economic Geology, v. 13, p. 279–314.
Jerome, S.E., 1966, Some features pertinent in the explo-ration of porphyry copper deposits, in Titley, S.R., and Hicks, C.L., eds., Geology of the porphyry copper deposits, southwestern North America: Tucson, University of Arizona Press, p. 75–85.
Jiancheng, Xie, Xiaoyong, Yang, Weidong, Sun, Jianguo, Du, Wei, Xu, Libin, Wu, Keyou, Wang, and Xiaowei, Du, 2009, Geochronological and geochemical constraints on formation of the Tongling metal deposits, middle Yangtze metallogenic belt, east-central China: International Geology Review, v. 51, p. 388–421.
John, D.A., 1989a, Geologic setting, depths of emplacement, and distribution of fluid inclusions in intrusions of the central Wasatch Mountains, Utah: Economic Geology, v. 84, p. 386–409.
John, D.A., 1989b, Evolution of hydrothermal fluids in the Park Premier stock, central Wasatch Mountains, Utah: Economic Geology, v. 84, p. 879–902.
John, D.A., 1991, Evolution of hydrothermal fluids in the Alta stock, central Wasatch Mountains, Utah: U.S. Geological Survey Bulletin 1977, 51 p.
Johnson, D.A., 2000, Studies of iron-oxide(-Cu-REE-Au-Co-Ag-Ni-U) mineralization and associated sodic alteration in the Great Basin: Tucson, University of Arizona, Ph.D. thesis, 277 p.
Kamenov, G., Macfarlane, A.W., and Riciputi, L., 2002, Sources of lead in the San Cristobal, Pulcayo, and Potosi mining districts, Bolivia, and a reevaluation of regional ore lead isotope provinces: Economic Geology, v. 97, p. 573–592.
Kay, R.W., 1978, Aleutian magnesian andesite—Melts from subducted Pacific Ocean crust: Journal of Volcanological and Geothermal Research, v. 4, p. 497–522.
Kay, S.M., Godoy, E., and Kurz, A., 2005, Episodic arc migra-tion, crustal thickening, subduction erosion, and magmatism in the south-central Andes: Geological Society of America Bulletin, v. 117, p. 67–88.
Kay, S.M., and Kurtz, A.C., 2005, Magmatic and tectonic characterization of the El Teniente region. Codelco-Chile, Division El Teniente, in Porter, T.M., ed., Super porphyry copper and gold deposits a global perspective: Adelaide, Porter GeoConsultancy Publishing, v. 1, p. 45–63.
Kay, S.M., and Mpodozis, C., 2001, Central Andean ore deposits linked to evolving shallow subduction systems and thickening crust: GSA Today, v. 11, p. 4–9.
Kay, S.M., Mpodozis, C., and Coira, B., 1999, Neogene magmatism, tectonism, and mineral deposits of the Central Andes (22° to 33° S latitude): Society of Economic Geolo-gists, special publication 7, p. 27–59.
144 Porphyry Copper Deposit Model
Keith, J.D., Whitney, J.A., Hattori, K., Ballantyne, G.H., Christiansen, E.H., Barr, D.L., Cannan, T.M., and Hooks, C.J., 1997, The role of magmatic sulphides and mafic alkaline magmas in the Bingham and Tintic mining districts, Utah: Journal of Petrology. v. 38, no. 12, p. 1679–1690.
Keith, S.B., and Swan, M.M., 1996, The great Laramide porphyry copper cluster of Arizona, Sonora, and New Mexico—The tectonic setting, petrology, and genesis of a world class porphyry metal cluster: Proceedings, Geology and Ore Deposits of the American Cordillera Symposium, Geological Society of Nevada: U.S. Geological Survey—Sociedad Geológica de Chile, v. 3, p. 1667–1747.
Keller, G.V., 1987, Rock and mineral properties, in Nabighian, M.N., ed., Electromagnetic methods in applied geophysics theory: Tulsa, Okla., Society of Exploration Geophysicists, Tulsa, v.1, p. 13–51.
Kerrich, Robert, 1991, Radiogenic isotope systems applied to mineral deposits: Mineralogical Association of Canada Short Course Handbook, v. 19, p. 365–421.
Kerrich, Robert, Goldfarb, R., Groves, D., and Garwin, S., 2000, The geodynamics of world-class gold deposits—Characteristics, space-time distributions, and origins: Reviews in Economic Geology, v. 13, p. 501–551.
Kesler, S.E., 1973, Copper, molybdenum, and gold abun-dances in porphyry copper deposits: Economic Geology, v. 68, p. 106–112.
Kesler, S.E., Chryssoulis, S.L., and Simon, G., 2002, Gold in porphyry copper deposits: its distribution and fate: Ore Geology Reviews, v. 21, p. 103–124.
Kesler, S.E., Issigonis, M.J., Brownlow, A.H., Damon, P.E., Moore, W.J., Northcote, K.E., and Preto, V.A., 1975, Geochemistry of biotites from mineralized and barren intru-sive systems: Economic Geology, v. 70, p. 569–567.
Kesler, S.E., and Wilkinson, B.H., 2008, Earth’s copper resources estimated from tectonic diffusion of porphyry copper deposits: Geology, v. 36, p. 255–258.
Khashgerel, B-E, Kavalieris, Imants, and Hayashi, K-I., 2008, Mineralogy, textures, and whole-rock geochemistry of advanced argillic alteration—Hugo Dummett porphyry copper-Au deposit, Oyu Tolgoi mineral district, Mongolia: Mineralium Deposita, v. 43, p. 913–932.
Khashgerel, B-E., Rye, R.O., Hedenquist, J.W., and Kavalieris, I., 2006, Geology and reconnaissance stable isotope study of the Oyu Tolgoi porphyry copper-Au system, South Gobi, Mongolia: Economic Geology, v. 101, p. 503–522.
Kirby, C.S., and Cravotta, C.A. III, 2005a, Net alkalinity and net acidity 1—Theoretical considerations: Applied Geochemistry, v. 20, p. 1920–1940.
Kirby, C.S, and Cravotta, C.A. III, 2005b, Net alkalinity and net acidity 2—Practical considerations: Applied Geochem-istry, v. 20, p. 1941–1964.
Korzhinski, D.S., 1959, Physicochemical basis for the analysis of the paragenesis of minerals (English translation): New York, Consultants Bureau, 142 p.
Kotylar, B.B., Theodore, T.G., Singer, D.A., Moss, Ken, Campo, A.M., and Johnson, S.D., 1998, Geochemistry of the Au-skarn environment at Copper Canyon, Battle Mountain mining district, Nevada, in Lentz, D.R., ed., Mineralized intrusion-related skarn systems: Mineral-ogical Association of Canada short course series, v. 26, p. 415–443.
Kouzmanov, K., and seven others, 2009, Late Cretaceous porphyry copper and epithermal Cu-Au association in the Southern Panagyurishte District, Bulgaria—The paired Vlaykov Vruh and Eshitsa deposits: Mineralium Deposita, v. 44, p. 611–646.
Krohn, M.D., Abrams, M.J., and Rowan, L.C., 1978, Discrimi-nation of hydrothermal altered rocks along the Battle Moun-tain–Eureka, Nevada, mineral belt using Landsat images: U.S. Geological Survey Open-File Report 78–585, 84 p.
Kurtz, A.C., Kay, S.M., Charrier, R., and Farrar, E., 1997, Geochronology of Miocene plutons and exhumation history of the El Teniente region, central Chile (34-35S): Revista Geologica de Chile, v. 24, p. 75–90.
Lagabrielle, Y., Lemoigne, J., Maury, R.C., Cotton, J., and Bourgois, J., 1994, Volcanic record of the subduction of an active spreading ridge, Taitao Peninsula (southern Chile): Geology, v. 22, p. 515–518.
Landtwing, M.R., Dillenbeck, E.D., Leake, M.H., and Hein-rich, C.A., 2002, Evolution of the breccia-hosted porphyry copper-Mo-Au deposit at Agua Rica, Argentina—Progres-sive unroofing of a magmatic hydrothermal system: Economic Geology, v. 97, p. 1273–1292.
Landtwing, M.R., Pettke, T., Halter, W.E., Heinrich, C.A., Redmond, P.B., Einaudi, M.T., and Kunze, K., 2005, Copper deposition during quartz dissolution by cooling magmatic-hydrothermal fluids—The Bingham porphyry: Earth and Planetary Science Letters, v. 235, 229–243.
Lang, J.R., Stanley, C.R., and Thompson, J.F.H., 1995, Porphyry copper-gold deposits related to alkalic igneous rocks in the Triassic-Jurassic arc terranes of British Colum-bia, in Pierce, F.W., and Bolm, J.G., eds., Porphyry copper deposits of the American Cordillera: Tucson, Arizona Geological Society Digest 20, p. 219–236.
References Cited 145
Lang, J.R., and Titley, S.R., 1998, Isotopic and geochemical characteristics of Laramide magmatic systems in Arizona and implications for the genesis of porphyry copper depos-its: Economic Geology, v. 93, p. 138–170.
Langton, J.M., 1973, Ore genesis in the Morenci-Metcalf district: Society of Mining Engineers, Society Transactions, v. 254, p. 247–257.
Langton, J.M., and Williams, S.A., 1982, Structural, petrologi-cal and mineralogical controls for the Dos Pobres orebody; Lone Star mining district, Graham County, Arizona, in Titley, S.R., ed., Advances in geology of porphyry copper deposits; southwestern North America: Tucson, University of Arizona Press, p. 335–352.
Lanier, George, Raab, W.J., Folsom, R.B., and Cone, S., 1978, Alteration of equigranular monzonite, Bingham mining district, Utah: Economic Geology, v. 73, p. 1270–1286.
Larson, P.B., Maher, K., Ramos, F.C., Chang, Z.S., and Meinert, L.D., 2003, Copper isotope ratios in magmatic and hydrothermal ore-forming environments: Chemical Geology, v. 201, p. 337–350.
Lasmanis, Raymond, and Utterback, W.C., 1995, The Mount Tolman porphyry molybdenum-copper deposit, Ferry County, Washington: Canadian Institute of Mining, Metal-lurgy and Petroleum Special Volume 46, p. 718–731.
Learned, R.E., and Boissen, Rafael, 1973, Gold, a useful path-finder element in the search for porphyry copper deposits in Puerto Rico, in Jopnes, M.J., ed., Geochemical exploration, 1972: International Geochemical Exploration Symposium, 4th, London, U.K., 1972, Proceedings, p. 93–103.\
Le Bas, M.J., LeMaitre, R.W., Streckeisen, A., and Zanettin, B., 1986, A chemical classification of volcanic rocks based on the total alkali-silica diagram: Journal of Petrology, v. 27, p. 745–750.
Leybourne, M.I., 2007, Aqueous geochemistry in mineral exploration, in Goodfellow, W.D., ed., Mineral deposits of Canada—A synthesis of major deposit-types, district metal-logeny, the evolution of geological provinces, and explora-tion methods: Geological Association of Canada, Mineral Deposits Division, Special Publication no. 5, p. 1007–1033.
Leybourne, M.I., and Cameron, E.M., 2006, Composition of groundwaters associated with porphyry-Cu deposits, Atacama Desert, Chile—Elemental and isotopic constraints on water sources and water-rock reactions: Geochimica et Cosmochimica Acta, v. 70, p. 1616–1635.
Li, J., Zhao, X., Zhou, M., and 6 others, 2008, Origin of the Tongshankou porphry skarn Cu-Mo deposits, eastern Yangtze craton, Eastern China—Geochronological, geochemical, and Sr-Nd-Hf isotopic constraints: Minera-lium Deposita, v. 43, p. 315–336.
Li, T., and Eaton, D.W., 2005, Delineating the Tuwu porphyry copper deposit at Xinjiang, China, with seismic-reflection profiling: Geophysics, v. 70, p. B53–B60.
Li, W., Jackson, S.E., Pearson, N.J., Alard, O., and Chappell, B.W., 2009, The Cu isotopic signature of granites from the Lachlan Fold Belt, SE Australia: Chemical Geology, v. 258, p. 38–49.
Lickfold, Vanessa, Cooke, D.R., Smith, S.G., and Ullrich, T.D., 2003, Endeavour copper-gold porphyry deposits, Northparkes, New South Wales—Intrusive history and fluid evolution: Economic Geology, v. 98, p. 1607–1636.
Lind, C.J., Creasey, C.L., and Angeroth, C., 1998, In-situ alteration of minerals by acidic groundwater resulting from mining activities—Preliminary evaluation of method: Journal of Geochemical Exploration, v. 64, p. 293–305.
Lindgren, Waldemar, 1905, The copper deposits of the Clifton-Morenci district, Arizona: U.S. Geological Survey Profes-sional Paper 43, 375 p.
Lindgren, Waldemar, and Bastin, E.S., 1922, The geology of the Braden mine, Rancagua, Chile: Economic Geology, v. 17, p. 75–99.
Ling, M., Wang, F., Ding, X., Hu, Y., and 4 others, 2009, Cretaceous ridge subduction along the lower Yangtze River belt, Eastern China: Economic Geology, v. 104, p. 303–321.
Long, K.R., 1995, Production and reserves of Cordilleran (Alaska to Chile) porphyry copper deposits, in Pierce, F.W., and Bolm, J.G., eds., Porphyry copper deposits of the American Cordillera: Arizona Geological Society Digest, v. 20, p. 35–68.
Lowell, J.D., 1968, Geology of the Kalamazoo orebody, San Manuel district, Arizona: Economic Geology, v. 63, p. 645–654.
Lowell, J.D., and Guilbert, J.M., 1970, Lateral and vertical alteration-mineralization zoning in porphyry ore deposits: Economic Geology, v. 65, p. 373–408.
Lund, Karen, Aleinikoff, J.N., Kunk, M.J., and Unruh, D.M., 2007, Shrimp U-Pb and 40Ar/39Ar age constraints for relat-ing plutonism and mineralization in the Boulder batholith region, Montana: U.S. Geological Survey Circular 1305, p. 39–46.
Luo, Yanzhong, and Zhang, G., 1998, Theory and application of spectral induced polarization: Society of Exploration Geophysicists, Geophysical Monograph Series, no. 8, 171 p.
Lynch, A.J., Taylor, A., and Avendaño Varas, C., 1994, Solvent extraction boom in Latin America: Engineering and Mining Journal, December 1994, p. 18–21.
146 Porphyry Copper Deposit Model
MacDonald, G.D., and Arnold, L.C., 1994, Geological and geochemical zoning of the Grasberg igneous complex, Irian Jaya, Indonesia: Journal of Geochemical Exploration, v. 50, p. 143–178.
Macfarlane, A.W., 1999, Isotopic studies of northern Andean crustal evolution and ore metal sources, in Skinner, B.J., ed., Geology and ore deposits of the central Andes: Society of Economic Geologists, Special Publication, no. 7, p. 195–217.
Macfarlane, A.W., Marcet, P., LeHuray, A.P., and Petersen, U., 1990, Lead isotope provinces of Central Andes inferred from ores and crustal rocks: Economic Geology, v. 85, p. 1857–1880.
Maher, K.C., and Larson, P.B., 2007, Variations in copper isotope ratios and controls on fractionation in hypogene skarn mineralization at Coroccohuayco and Tintaya, Peru: Economic Geology, v. 102, p. 225–237.
Maksaev, V., 1990, Metallogeny, geological evolution, and thermochronology of the Chilean Andes between latitudes 21.1 and 21 south and the origin of mayor porphyry copper deposits: Halifax, Canada, Dalhousie University, Ph.D. thesis, 553 p.
Maksaev, V., Munizaga, F., McWilliams, M., Fanning, M., Mathur, R., Ruíz, J., and Zentilli, M., 2004, New chronol-ogy for El Teniente, Chilean Andes, from U-Pb, 40Ar/39Ar, Re-Os, and fission-track Dating—Implications for the evolution of a supergiant porphyry Cu-Mo Deposit, in Silli-toe, R.H., Perelló, J., and Vidal, C.E., eds, Andean metal-logeny—New discoveries, concepts and updates: Society of Economic Geologists, Special Publication, no. 11, p. 15–54.
Manske, S.L., and Paul, A.H., 2002, Geology of a major new porphyry copper center in the Superior (Pioneer) district, Arizona: Economic Geology, v. 97, p. 197–220.
Marcoux, Eric, Grancea, L., Lupulescu, M., and Milesi, J.P., 2002, Lead isotope signatures of epithermal and porphyry-type ore deposits from the Romanian Carpathian Moun-tains: Mineralium Deposits, v. 37, p. 173–184.
Markl, Gregor, Lahaye, Y., and Schwinn, G., 2006, Copper isotopes as monitors or redox processes in hydrothermal mineralization: Geochimica et Cosmochimica Acta, v. 70, p. 4215–4228.
Mars, J.C., and Rowan, L.C., 2006, Regional mapping of phyllic- and argillic-altered rocks in the Zagros magmatic arc, Iran, using Advanced Spaceborne Thermal Emission and Reflection Radiometer (ASTER) data and logical opera-tor algorithms: Geosphere, v. 2, p. 161–186, 2 plates.
Mars, J.C., and Rowan, L.C., 2007, Mapping sericitic and argillic-altered rocks in southeastern Afghanistan using Advanced Spaceborne Thermal Emission and Reflec-tion Radiometer (ASTER) data, U.S. Geological Survey Open-File Report 2007–1006, 1 plate, http://pubs.usgs.gov/of/2007/1006/.
Martin, Herve, 1999, Adakitic magmas: modern analogues of Archean granitoids: Lithos, v. 46, p. 411–429.
Martin, Herve, Smithies, R.H., Rapp, R., Moyen, J., and Champion, D., 2005, An overiview of adakite, tonalite-trondhjemite-granodiorite (TTG), and sanukitoid—Rela-tionships and some implications for crustal evolution: Lithos, v. 79, p. 1–24.
Mason, D.R., 1978, Compositional variations in ferromagne-sion minerals from porphyry copper-generating and barren intrusions of the western highlands, Papua New Guinea: Economic Geology, v. 73, p. 878–890.
Mathur, Ryan, Ruiz, J., and Munizaga, F., 2000, Relationship between copper tonnage of Chilean base metal porphyry deposits and Os isotope ratios: Geology, v. 28, p. 555–558.
Mathur, Ryan, Ruiz, J., Titley, S., Liermann, L., Buss, H., and Brantley, S., 2005, Cu isotopic fractionation in the super-gene environment with and without bacteria: Geochimica et Cosmochimica Acta, v. 69, p. 5233–5246.
Mathur, Ryan, Titley, S., Barra, F., Brantley, S., and 6 others, 2009, Exploration potential of Cu isotope fractionation in porphyry copper deposits: Chemical Geology, v. 102, p. 1–6.
Maughan, D.T., Keith, J.D., Christiansen, E.H., Pulsipher, T., Hattori, K., and Evans, N.J., 2002, Contributions from mafic alkaline magmas to the Bingham porphyry Cu-Au-Mo deposit, Utah, United States: Mineralium Deposita, v. 37, p. 14–37.
Mavrogenes, J.A., and Bodnar, R.J., 1994, Experimental evidence and geologic implications of hydrogen movement into and out of fluid inclusions in quartz: Geochimica et Cosmochimica Acta, v. 58, p. 141–148.
McCandless, T.E., and Ruiz, J., 1993, Rhenium-osmium evidence for regional mineralization in southwestern North America: Science, v. 261, p. 1282–1286.
McCrory, P.A., and Wilson, D.S., 2009, Introduction to Special Issue on—Interpreting the tectonic evolution of Pacific Rim margins using plate kinematics and slab-window volcanism: Tectonophysics, v. 464, p. 30-42.
McKinstry, H.E., 1948, Mining geology: Englewood Cliffs, N.J., Prentice-Hall, 680 p.
References Cited 147
McMillan, W.J., 2005, Porphyry Cu-Mo deposits of the Highland Valley district, Guichon Creek batholith, British Columbia, Canada, in Porter, T.M., ed., Superporphyry copper and gold deposits—A global perspective: Adelaide, Porter GeoConsultancy Publishing, v. 1, p. 259–274.
McMillan, W.J., and Panteleyev, A., 1995, Porphyry copper deposits of the Canadian Cordillera, in Pierce, F.W., and Bolm, J.G., eds., Porphyry copper deposits of the American Cordillera: Tucson, Arizona Geological Society Digest 20, p. 203–218.
McMillan, W.J., Thompson, J.F.H., Hart, C.J.R., and John-ston, S.T., 1995, Regional geological and tectonic setting of porphyry deposits in British Columbia and Yukon Territory, in Schroeter, T.G., ed., Porphyry deposits of the north-western Cordillera of North America: Canadian Institute of Mining, Metallurgy and Petroleum Special Volume 46, p. 40–57.
Melchiorre, E.B., and Enders, M.S., 2003, Stable isotope geochemistry of copper carbonates at the northwest expen-sion deposit, Morenci district, Arizona—Indications of conditions of supergene oxidation and related mineraliza-tion: Economic Geology, v. 98, p. 607–621.
Meldrum, S.J., Aquino, R.S., Gozales, R.I., Burke, R.J., Suyadi, Artha, Irianto, Bombang, and Clarke, D.S., 1994, The Batu Hijau porphyry copper-gold deposit, Sumbawa island, Indonesia: Journal of Geochemical Exploration, v. 50, p. 203–220.
Meyer, Charles, 1965, An early potassic type of wall-rock alteration at Butte, Montana: American Mineralogist, v. 50, p. 1717–1722.
Meyer, Charles, 1981, Ore-forming processes through geologic history: Economic Geology 75th Anniversary Volume, p. 6–41.
Meyer, Charles, and Hemley, J.J., 1967, Wall rock altera-tion, in Barnes, H.L., ed., Geochemistry of hydrothermal ore deposits: New York, Holt, Rinehart, and Winston, Inc., p. 166–235.
Meyer, Charles, Shea, E.P., Goddard, C.C., Jr., and staff, 1968, Ore deposits at Butte, Montana, in Ridge, J.D., ed., Ore Deposits of the United States, 1933–1967 (Graton-Sales Volume): New York, American Institute of Mining, Metal-lurgical, and Petroleum Engineers, v. 2, p. 1373–1416.
MINFILE, 2008, Highland Valley Copper, Report no. 092ISW012, 5 p.: British Columbia Ministry of Energy, Mines and Petroleum Resources.
Moolick, R.T., and Durek, J.J., 1966, The Morenci district, in Titley, S.R., and Hicks, C.L., eds., Geology of the porphyry copper deposits, southwestern North America: Tucson, University of Arizona Press, p. 221–231.
Mortimer, Cedrig, 1973, The Cenozoic history of the southern Atacama Desert, Chile: Journal of the Geological Society of London, v. 129, p. 505–526.
Mote, T.L., Becker, T.A., Renne, P., and Brimhall, G.H., 2001, Chronology of exotic mineralization at El Salvador, Chile, by 40Ar/39Ar dating of copper wad and supergene alunite: Economic Geology, v. 96, p. 351–366.
Müller, D., and Forrestal, P., 1998, The shoshonite porphyry Cu-Au association at Bajo de la Alumbrera, Catamarca province, Argentina: Mineralogy and Petrology, v. 64, p. 47–64.
Munoz, J.L., 1984, F-OH and Cl-OH exchange in micas with applications to hydrothermal ore deposits, in Bailey, S.W., ed., Micas: Reviews in Mineralogy, v. 13, p. 469–494.
Muñoz, M., Charrier, R., Maksaev, V., and Fanning, M., 2008, Tracing petrogenetic crustal and mantle processes in zircon crystals from rocks associated with the El Teni-ente porphyry Cu-Mo deposit in the high Andes of central Chile—Preliminary results: 7th International Symposium on Andean Geodynamics (ISAG 2008, Nice), extended abstracts, p. 357–360.
Murphy, J.B., 2001, Flat slab subduction in the geological record—Consideration of modern analogues (abs.): Geolog-ical society of America Abstracts with Programs, v. 33, p. A–208.
Nabavi, M.H., 1972, Geologic map of the Yazd quadrangle: Geological Survey of Iran, Tehran, scale 1:250,000.
Nahnybida, Taras, Gleeson, S.A., Rusk, B.G., and Wassenaar, L.I., 2009, Cl/Br ratios and stable isotope analysis of magmatic-hydrothermal fluid inclusions from Butte, Montana and Bigham Canyon, Utah: Mineralium Deposita, v. 44, p. 837–848.
Nash, J.T., 1976, Fluid inclusion petrology; data from porphyry copper deposits and applications to exploration: U.S. Geological Survey Professional Paper 907D, 16 p.
Nelson, P.H., 1997, Induced polarization research at Kennecott, 1965–1977: The Leading Edge, v. 16, p. 29–33.
Newcrest Mining Staff, 1998, Cadia gold–copper deposit, in Berkman, D.A., and Mackenzie, D.H., eds., Geology of Australian and Papua New Guinea mineral deposits: Melbourne, Australasian Institute of Mining and Metallurgy Monograph 22, p. 641–646.
Niemeyer, H., and Munizaga, R., 2008, Structural control of the emplacement of the Portrerillos porphyry copper, central Andes of Chile: Journal of South American Earth Sciences, v. 26, p. 261–270.
148 Porphyry Copper Deposit Model
Nordstrom, D.K., and Alpers, C.N., 1999, Geochemistry of acid mine waters, in Plumlee, G.S., and Logsdon, M.J., eds., The environmental geochemistry of mineral deposits, Part A—Processes, techniques, and health issues: Reviews in Economic Geology, v., 6A, p. 161–182.
Northern Dynasty Minerals, Ltd., 2009, The Pebble deposit, http://pebblepartnership.com/ accessed July 3, 2009.
Norton, D.L., 1982, Fluid and heat transport phenomena typical of copper-bearing pluton environments, southeastern Arizona, in Titley, S.R., ed., Advances in geology of the porphyry copper deposits, southwestern North America, Tucson, University of Arizona Press, p. 59–72.
Nystrom, J.O., Parada, M.A., and Vergara, M., 1993, Sr-Nd isotope compositions of Cretaceous to Miocene volcanic rocks in central Chile—A trend towards a MORB signature and reversal with time (abs.): Second International Sympo-sium of Andean Geodynamics, Oxford, Extended Abstracts, p. 411–414.
Nystrom, J.O., Vergara, M., Morata, D., and Levi, B., 2003, Tertiary volcanism during extension in the Andean foothills of Central Chile (33°15′–33°45′S): Geological Society of America Bulletin, v. 115, p. 1523–1537.
Ohmoto, Hiroshi, 1972, Systematics of sulfur and carbon isotopes in hydrothermal ore deposits: Economic Geology, v. 67, p. 551–578.
Ohmoto, Hiroshi, 1986, Stable isotope geochemistry of ore deposits, in Valley, J.W., Taylor, H.P., and O’Neil, J.R., eds., Stable isotope in high temperature geological processes: Reviews in Mineralogy, v. 16, p. 491–559.
Ohmoto, Hiroshi, and Rye, R.O., 1979, Isotopes of sulfur and carbon, in Barnes, H.L., ed., Geochemistry of hydrothermal ore deposits, 2nd ed.: New York, John Wiley and Sons, p. 509–567.
Oldenburg, D.W., Li, Y., and Ellis, R.G., 1997, Inversion of geophysical data over a copper gold porphyry deposit—A case history for Mt. Milligan: Geophysics, v. 62, p. 1419–1431.
Ossandón C.G., Fréraut, C.R., Gustafson, L.B., Lindsay, D.D., and Zentilli, M., 2001, Geology of the Chuquica-mata mine—A progress report: Economic Geology, v. 96, p. 249–270.
Ostapenko, M.J., and Jones, M.S., 1976, Valley Copper, in Sutherland Brown, A., ed., Porphyry deposits of the Canadian Cordillera of North America: Canadian Institute of Mining, Metallurgy and Petroleum Special Volume 15, p. 130–143.
Ott, Norbert, Kollersberger, Tanja, Tassara, Andrés, 2006, GIS analyses and favorability mapping of optimized satellite data in northern Chile to improve exploration for copper mineral deposits: Geosphere, v. 2, no. 4, p. 236–252.
Oyarzun, R., Marquez, A., Lillo, J., Lopez, I., and Rivera, S., 2001, Giant vs small porphyry copper deposits of Cenozoic age in northern Chile—Adakitic vs normal calc-alkaline magmatism: Mineralium Deposita, v. 36, p. 794–798.
Padilla Garza, R.A., Titley, S.R., and Pimental, F.B., 2001, Geology of the Escondida porphyry copper deposit, Antofa-gasta region, Chile: Economic Geology, v. 96, p. 307–324.
Palacky, G.J., 1987, Resistivity characteristics of geologic targets, in Nabighian, M.N., ed., Electromagnetic methods in applied geophysics theory: Tulsa, Okla., Society of Exploration Geophysicists, v. 1, p. 53–129.
Panteleyev, Andre, 1981, Berg porphyry copper-molybdenum deposit, geologic setting, mineralization, zoning, and pyrite geochemistry: Province of British Columbia, Ministry of Energy Miners and Petroleum Resources, Bulletin 66, 158 p.
Panteleyev, Andre, 1995a, Porphyry Cu-Au—Alkalic, in Lefe-bure, D.V., and Ray, G.E., eds., Selected British Columbia mineral deposit profiles, volume 1, Metallics and Coal: British Columbia Ministry of Energy of Employment and Investment, Open File 1995–20, p. 83–86.
Panteleyev, Andre, 1995b, Porphyry Cu±Mo±Au, in Lefe-bure, D.V., and Ray, G.E., eds., Selected British Columbia mineral deposit profiles, volume 1, Metallics and Coal: British Columbia Ministry of Energy of Employment and Investment, Open File 1995–20, p. 87–91.
Parmentier, E.M., and Schedl, A., 1981, Thermal aureoles of igneous intrusions—Some possible indication of hydrother-mal convective cooling: Journal of Geology, v. 89, p. 1–22.
Parry, W.T., Wilson, P.N., Jasumback, M.D., and Heizler, M.T., 1997, Clay mineralogy and 40Ar/39Ar dating of phyllic and argillic alteration at Bingham Canyon, Utah, in John, D.A., and Ballantyne, G.H., eds., Geology and ore depos-its of the Oquirrh and Wasatch Mountains, Utah: Society of Economic Geologists Guidebook Series Volume 29, p. 171–188.
Parry, W.T., Wilson, P.N., Moser, D., and Heizler, M.T., 2001, U-Pb dating of zircon and 40Ar/39Ar dating of biotite at Bingham, Utah: Economic Geology, v. 96, p. 1671–1683.
Parsons, A.B., 1933, The porphyry coppers: New York, Ameri-can Institute of Mining and Metallurgical Engineers, 581 p.
References Cited 149
Paterson, J.T., and Cloos, M., 2005a, Grasberg porphyry Cu-Au deposit, Papua, Indonesia—1. Magmatic history, in Porter, T.M., ed., Superporphyry copper and gold depos-its—A global perspective: Adelaide, Porter GeoConsultancy Publishing, v. 2, p. 313–329.
Paterson, J.T., and Cloos, M., 2005b, Grasberg porphyry Cu-Au deposit, Papua, Indonesia—2. Pervasive hydrother-mal alteration, in Porter, T.M., ed., Superporphyry copper and gold deposits—A global perspective: Adelaide, Porter GeoConsultancy Publishing, v. 2, p. 331–355.
Perelló, José, Cox, D., Garamjav, D., Sanjdorj, S., Diakov, S., Schissel, D., Munhbat, T.-O., and Oyun, G., 2001, Oyu Tolgoi, Mongolia—Silurian-Devonian porphyry Cu-Au-(Mo) and high-sulfidation Cu mineralization with a Creta-ceous chalcocite blanket: Economic Geology, v. 96, no. 6, p. 1407–1428.
Perelló, José, and eight others, 2004, Cotabambras—Late Eocene porphyry copper-gold mineralization southwest of Cuzco, Peru: Society of Economic Geologists Special Publication 11, p. 213–230.
Perelló, José, Razique, A., Schloderer, J., and Rehman, A., 2008, The Chagai porphyry copper belt, Baluchistan Prov-ince, Pakistan: Economic Geology, v. 103, p. 1583–1612.
Peytcheva, I., Neubauer, F., Frank, M., Nedialkov, R., Heinrich, C., and Strashimirov, S., 2009, U–Pb dating, Hf-isotope characteristics and trace-REE-patterns of zircons from Medet porphyry copper deposit, Bulgaria—Impli-cations for timing, duration and sources of ore-bearing magmatism: Mineralogy and Petrology, 23 p. (doi:10.1007/s00710-009-0042-9).
Phillips, C.H., Harrison, E.D., and Smith, T.W., 2005, Geology of the Bingham mining district, Salt Lake County, Utah, in Porter, T.M., ed., Superporphyry copper and gold depos-its—A global perspective: Adelaide, Porter GeoConsultancy Publishing, v. 1, p. 243–257.
Phillips, C.H., Smith, T.W., and Harrison, E.D., 1997, Altera-tion, metal zoning, and ore controls in the Bingham Canyon porphyry copper deposits, Utah, in John, D.A., and Ballan-tyne, G.H., eds., Geology and ore deposits of the Oquirrh and Wasatch Mountains, Utah: Society of Economic Geolo-gists Guidebook Series, v. 29, p. 133–145.
Phillips, J.D., 1998, Processing and interpretation of aeromag-netic data for the Santa Cruz basin—Patagonia Mountains area, south-central Arizona: U.S. Geological Survey Open-File Report 2002–98. http://geopubs.wr.usgs.gov/open-file/of02-98, 16 plates.
Phillips, K.A., and Niemuth, N.J., 1993, The primary copper industry of Arizona in 1991: Arizona Department of Mines and Mineral Resources, Special Report 18, 53 p.
Plaza-Toledo, M., 2005, Natural rock drainage associated with unmined porphyry copper deposits in the Río Grande de Arecibo watershed, Puerto Rico: Mayagüez, University of Puerto Rico, unpublished Master’s thesis, 162 p.
Plumlee, G.S., 1999, The environmental geology of mineral deposits, in Plumlee, G.S., and Logsdon, M.J., eds., The environmental geochemistry of mineral deposits, Part A—Processes, techniques, and health issues: Reviews in Economic Geology, v. 6A, p. 71–116.
Pokrovski, G.B., Borisova, A.Y., and Harrichoury, J., 2008, The effect of sulfur on vapor-liquid fractionation of metals in hydrothermal systems: Earth and Planetary Science Letters, v. 266, p. 345–362.
Pollard, P.J., and Taylor, R.G., 2002, Paragenesis of the Gras-berg Cu–Au deposit, Irian Java, Indonesia—Results from logging section 13: Mineralium Deposita, v. 37, p. 117–136.
Pollard, P.J., Taylor, R.G., and Peters, L., 2005, Ages of intru-sion, alteration, and mineralization at the Grasberg Cu-Au deposit, Papua, Indonesia: Economic Geology, v. 100, p. 1005–1020.
Porter, T.M., 2005, The Escondida porphyry copper deposit, northern Chile—Discovery, setting, geology, hypogene mineralisation and supergene ore—A review, in Porter, T.M., ed., Superporphyry copper and gold deposits—A global perspective: Adelaide, Porter GeoConsultancy Publishing, v. 1, p. 133–149.
Porter, T.M., and Glen, R.A., 2005, The porphyry Au-Cu deposits and related shoshonitic magmatism of the Paleo-zoic Macquarie volcanic arc, eastern Lachlan orogen in the New South Wales, Australia, a review, in Porter, T.M., ed., Superporphyry copper and gold deposits—A global perspective: Adelaide, Porter GeoConsultancy Publishing, v. 1, p. 287–312.
Presnell, R.D., 1997, A summary of the structural controls on plutonism and metallogeny in the Wasatch and Oquirrh Mountains, Utah, in John, D.A., and Ballantyne, G.H., eds., Geology and ore deposits of the Oquirrh and central Wasatch Mountains, Utah: Society of Economic Geologists Guidebook 29, p. 1–9.
Proffett, J.M., Jr., 1973, Structure of the Butte district, Montana: Society of Economic Geologists Guidebook Series 1, p. G1–G12, plus figures.
Proffett, J.M., Jr., 1977, Cenozoic geology of the Yerington district, Nevada, and implications for the nature and origin of Basin and Range faulting: Geological Society of America Bulletin, v. 88, p. 247–266.
150 Porphyry Copper Deposit Model
Proffett, J.M., Jr., 1979, Ore deposits of the western United States—A summary, in Ridge, J.D., ed., Papers on mineral deposits of western North America—The International Association on the Genesis of Ore Deposits Fifth Quadren-nial Symposium: Nevada Bureau of Mines and Geology Report 33, p. 13–32.
Proffett, J.M., Jr., 2003, Geology of the Bajo de la Alum-brera porphyry copper-gold deposit, Argentina: Economic Geology, v. 98, p. 1535–1574.
Proffett, J.M., Jr., 2009, High Cu grades in porphyry copper deposits and their relationship to emplacement depth of magmatic sources: Geology, v. 37, p. 675–678.
Proffett, J.M., Jr., and Dilles, J.H., 1984, Geologic map of the Yerington district, Nevada: Nevada Bureau of Mines and Geology Map 77, scale 1:24,000.
Puig, Alvaro, 1988, Geologic and metallogenic significance of the isotopic composition of lead in galenas of the Chilean Andes: Economic Geology, v. 83, p. 843–858.
Rabbia, O.M., Reich, M., Hernandez, L., King, R., and Lopez-Escobar, J., 2001, Sr-Nd-Pb isotope compositions of felsic intrusions in the El Teniente and Laguna La Huifa areas, Central Chile: III Simposio Sudamericano de Geólo-gia Isotópica, Pucon, Chile, Extended Abstractos (CD), p. 523–526.
Rae, A.J., Cooke, D.R., Phillips, D., and Zaide-Delfin, M., 2004, The nature of magmatism at Palinpinon geothermal field, Negros Island, Philippines—Implications for geother-mal activity and regional tectonics: Journal of Volcanology and Geothermal Research, v. 129, p. 321–342.
Raines, G.L., 1978, Porphyry copper exploration model for northern Sonora, Mexico: U.S. Geological Survey Journal of Research, v. 6, p. 51–58.
Ramboz, C., 1979, A fluid inclusion study of the copper miner-alization in the southwest Tintic District (Utah): Bulletin de Société français de Minéralogie et de Cristallographie, v. 102, p. 622–632.
Ranjbar, H., Honarmand, M., and Moezifar, Z., 2004, Appli-cation of the Crosta technique for porphyry copper altera-tion mapping, using ETM+ data in the southern part of the Iranian volcanic sedimentary belt: Journal of Asian Earth Sciences, v. 24, p. 237–243.
Ransome, F.L., 1903, Geology of the Globe copper district, Arizona: U.S. Geological Survey Professional Paper 12, 168 p.
Ransome, F.L., 1904, The geology and ore deposits of the Bisbee quadrangle, Arizona: U.S. Geological Survey Professional Paper 21, 168 p.
Ransome, F.L., 1919, The copper deposits of Ray and Miami, Arizona: U.S. Geological Survey Professional Paper 115, 192 p.
Redmond, P.B., Einaudi, M.T., Inan, E.E., Landtwing, M.R., and Heinrich, C.A., 2004, Copper deposition by fluid cooling in intrusion-centered systems—New insights from the Bingham porphyry ore deposit, Utah: Geology, v. 32, p. 217–220.
Regard, V., Bellier, O., Thomas, J.-C., Abbassi, M.R., Mercier, J., Shabanian, E., Feghhi, K., and Soleymani, S., 2004, Accommodation of Arabia-Eurasia convergence in the Zagros-Makran transfer zone, SE Iran—A transition between collision and subduction through a young deform-ing system: Tectonics, v. 23, 24 p.
Reich, Martin, Palacios, C., Vargas, G., Luo, S., Cameron, E.M., Leybourne, M.I., Parada, M.A., Zuniga, A., and You, C-F., 2009, Supergene enrichment of copper deposits since the onset of modern hyperaridity in the Atacama Desert, Chile: Mineralium Deposita, v. 44, p. 497–504.
Reich, Martin, Parada, M.A., Palacios, C., Dietrich, A., Schultz, F., and Lehman, B., 2003, Adakite-like signature of Late Miocene intrusions at the Los Pelambres giant porphyry copper deposit in the Andes of Central Chile—Metallogenic implications: Mineralium Deposita, v. 38, p. 876–885.
Reyes, A.G., 1990, Petrology of Philippine geothermal systems and the application of alteration mineralogy to their assessment: Journal of Volcanology and Geothermal Research, v. 43, p. 279–309.
Reynolds, S.J., 1989, A new geologic map of Arizona: Arizona Geological Society Digest, v. 17, p. 863–866.
Reynolds, T.J., and Beane, R.E., 1985, Evolution of hydro-thermal fluid characteristics at the Santa Rita, New Mexico, porphyry copper deposit: Economic Geology, v. 80, p. 1328–1347.
Richard, K.E., and Courtright, J.H., 1958, Geology of Toque-pala, Peru: Mining Engineering, v. 10, p. 262–266.
Richards, J.P., 2003a, Metallogeny of the Neo-Tethys arc in central Iran: Proceedings Bicentennial SGA meeting, 7th, Athens 2003, Rotterdam, Millpress, p. 1237–1239.
Richards, J.P., 2003b, Tectono-magmatic precursors for porphyry Cu-(Mo-Au) deposit formation: Economic Geology, v. 98 p. 1515–1533.
Richards, J.P., 2005, Cumulative factors in the generation of giant calc-alkaline porphyry copper deposits, in Porter, T.M., ed., Super porphyry copper and gold deposits—A global perspective: Adelaide, Porter GeoConsultancy Publishing, v. 1, p. 7–25.
References Cited 151
Richards, J.P., 2009, Post-subduction porphyry Cu-Au and epithermal Au deposits—Products of remelting of subduc-tion modified lithosphere: Geology, v. 37, p. 247–250.
Richards, J.R., Boyce, A.J., and Pringle, M.S., 2001, Geologic evolution of the Escondida area, Northern Chile—A model for spatial and temporal localization of porphyry copper mineralization: Economic Geology, v. 96, p. 271–305.
Richards, J.P., and Kerrich, R., 2007, Adakite-like rocks—Their diverse origins and questionable role in metallogen-esis: Economic Geology, v. 102, p. 537–576.
Richards, J.P., McCulloch, M.T., Chappell, B.W., and Kerrich, R., 1991, Sources of metals in the Porgera gold deposit, Papua New Guinea—Evidence from alteration, isotope and noble gas geochemistry: Geochimica et Cosmochica Acta, v. 55, p. 565–580.
Rio Tinto PLC, 2008, Resolution Copper Mining LLC reports an inferred resource of over 1 billion tonnes at its property in Arizona, USA: Rio Tinto PLC press release http://www.riotinto.com/documents/PR647g_Resolution_Copper_Mining_LLC_reports_an_Inferred_Resource_of_over_1_billion_tonnes_at_its_property_in_Arizona_USA.PDF accessed March 11, 2010.
Roberts, R.J., and Arnold, D.C., 1965, Ore deposits of the Antler Peak quadrangle, Humboldt and Lander counties, Nevada: U.S. Geological Survey Professional Paper 459–B.
Roberts, S.A., 1975, Early hydrothermal alteration and miner-alization in the Butte district, Montana: Cambridge, Mass., Harvard University, Ph.D. thesis, 173 p.
Roedder, Edwin, and Bodnar, R.J., 1997, Fluid inclusion studies of hydrothermal ore deposits, in Barnes, H.L., ed., Geochemistry of hydrothermal ore deposits: New York, Wiley, p. 657–698.
Rohrlach, B.D., and Loucks, R.R., 2005, Multi-million-year cyclic ramp-up of volatiles in a lower crustal magma reser-voir trapped below the Tampakan copper-gold deposit by Mio-Pliocene crustal compression in the southern Philip-pines, in Porter, T.M., ed., Super porphyry copper and gold deposits—A global perspective: Adelaide, Porter GeoCon-sultancy Publishing, v. 2, p. 369–407.
Rowan, L.C., Hook, S.J., Abrams, M.J., and Mars, J.C., 2003, Mapping hydrothermally altered rocks at Cuprite, Nevada, using the Advanced Spaceborne Thermal Emission and Reflection Radiometer (ASTER), a new satellite-imaging system: Economic Geology, v. 98, no. 5, p. 1019–1027.
Rowan, L.C., and Mars, J.C., 2003, Lithologic mapping in the Mountain Pass, California area using Advanced Spaceborne Thermal Emission and Reflection Radiometer (ASTER) data: Remote Sensing of Environment, v. 84, no. 3, p. 350–366.
Rowan, L.C., Schmidt, R.G., and Mars, J.C., 2006, Distribu-tion of hydrothermally altered rocks in the Reko Diq, Paki-stan mineralized area based on spectral analysis of ASTER data: Remote Sensing of Environment, v. 104, p. 74–87.
Rowan, L.C., and Wetlaufer, P.H., 1981, Relation between regional lineament systems and structural zones in Nevada: American Association of Petroleum Geologists Bulletin, v. 65, p. 1414–1432.
Rowan, L.C., Wetlaufer, P.H., Goetz, A.F.H., Billingsley, F.C., and J.H. Stewart, 1974, Discrimination of rock types and detection of hydrothermally altered areas in south-central Nevada: U.S. Geological Survey Professional Paper 883, 35 p.
Roy, Baishali, and Clowes, R.M., 2000, Seismic and potential-field imaging of the Guichon Creek batholith, British Columbia, Canada, to delineate structures hosting porphyry copper deposits: Geophysics, v. 65, p. 1418–1434.
Rudnick, R.L., and Gao, S., 2003, The composition of the continental crust, in Holland, H.D., and Turekian, K.K., eds., Treatise on geochemistry, v. 3: Oxford, Elsevier-Pergamon, p. 1–64.
Rui, Z.Y., Wang, L.S., Wang, Y.T., and Liu, Y.L., 2002, Discussion on metallogenic epoch of Tuwu and Yandong porphyry copper deposits in East Tianshan Mountains, Xinjiang: Mineral Deposits, v. 21, p. 16–22.
Ruiz, Joaquin, and Mathur, R., 1999, Metallogenesis in conti-nental margins—Re-Os evidence from porphyry copper deposits in Chile: Reviews in Economic Geology, v. 12, p. 1–28.
Rusk, B.G., Miller, B.J., and Reed, M.H., 2008, Fluid-inclusion evidence for the formation of Main Stage poly-metallic base-metal veins, Butte, Montana, United States, in Spencer, J.E., and Titley, S.R., eds., Ores and orogenesis: Circum-Pacific tectonics, geologic evolution, and ore depos-its: Arizona Geological Society Digest 22, p. 573–581.
Rusk, B.G., and Reed, M.H., 2002, Scanning electron microscope-cathodoluminescence of quartz reveals complex growth histories in veins from the Butte porphyry copper deposit, Montana: Geology, v. 30, p. 727–730.
Rusk, B.G, Reed, M.H., Dilles, J.H., Klemm, L.M., and Heinrich, C., 2004, Compositions of magmatic hydrother-mal fluids determined by LA-ICP-MS of fluid inclusions from the porphyry copper-molybdenum deposit at Butte, Montana: Chemical Geology, v. 210, p. 173–199.
Rusk, B.G., Reed, M.H., and Dilles, J.H., 2008, Fluid inclu-sion evidence for magmatic-hydrothermal fluid evolution in the porphyry copper-molybdenum deposit at Butte, Montana: Economic Geology, v. 103, p. 307–334.
152 Porphyry Copper Deposit Model
Rusk, B.G., Reed, M.H., Dilles, J.H., and Kent, A.J.R., 2006, Intensity of quartz cathodoluminesccnce and trace-element content in quartz from the porphyry copper deposit at Butte, Montana: American Mineralogist, v. 91, p. 1300–1312.
Rye, R.O., 2005, A review of the stable isotope geochemistry of sulfate minerals in selected igneous environments and related hydrothermal systems: Chemical Geology, v. 215, p. 5–36.
Sajona, F., Izawa, E., Motomura, Y., Imai, A., Sakakibara, H., and Watanabe, K., 2002, Victoria carbonate-base metal gold deposit and its significance in the Mankayan mineral district, Luzon, Philippines: Resource Geology, v. 52, no. 4, p. 315–328.
Sales, R.H., 1914, Ore deposits at Butte, Montana: American Institute of Mining and Metallurgical Engineers Transac-tions, v. 46, p. 4–106.
Sales, R.H., and Meyer, C., 1948, Wall rock alteration at Butte, Montana: American Institute of Mining and Metallurgical Engineers Transactions, v. 178, p. 9–35.
Sales, R.H., and Meyer, C., 1950, Interpretation of wall rock alteration at Butte, Montana: Golden, Colorado School of Mines Quarterly, v. 45, p. 261–273.
Salvi, Stefano, and Williams-Jones, A.E., 2003, Bulk analysis of volatiles in fluid inclusions, in Samson, I., Anderson, A., and Marshall, D., eds., Fluid inclusions—Analysis and interpretation: Geological Association of Canada short course series, v. 32, p. 247–278.
Sasso, A.M., and Clark, A.H., 1998, The Farallon Negro Group, northwest Argentina—Magmatic, hydrothermal and tectonic evolution and implications for Cu-Au metallogeny in the Andean back-arc: Society of Economic Geologists Newsletter, n. 34, p. 1, 8–18.
Sawkins, F.J., and Scherkenback, D.A., 1981, High copper content of fluid inclusions in quartz from northern Sonora—Implications for ore-genesis theory: Geology, v. 9, p. 37–40.
Schmidt, R.G., 1976, Exploration for porphyry copper depos-its in Pakistan using digital processing of Landsat-1 image data: U.S. Geological Survey Journal of Research, v. 4, no. 1, p. 27–34.
Seedorff, Eric, Barton, M.D., Stavast, W.J.A., and Maher, D.J., 2008, Root zones of porphyry systems—Extending the porphyry model to depth: Economic Geology, v. 103, p. 939–956.
Seedorff, Eric, Dilles, J.H., Proffett, J.M., Jr., Einaudi, M.T., Zurcher, L., Stavast, W.J.A., Johnson, D.A., and Barton, M.D., 2005, Porphyry deposits—Characteristics and origin of hypogene features: Society of Economic Geologists, Economic Geology 100th Anniversary Volume, 1905–2005, p. 251–298.
Selby, David, and Nesbitt, B.E., 2000, Chemical composition of biotite from the Casino porphyry Cu-Au-Mo mineraliza-tion, Yukon, Canada—Evaluation of magmatic and hydro-thermal fluid chemistry: Chemical Geology, v. 17, p. 77–93.
Sell, J.D., 1995, Discovery of a deep (3500 feet) unexposed porphyry copper deposit at Superior East, Pinal county, Arizona: Arizona Geological Society Digest, v. 20, p. 373–395.
Seo, J.H., Guillong, Marcel, and Heinrich, C.A., 2009, The role of sulfur in the formation of magmatic-hydrothermal copper-gold deposits: Earth and Planetary Science Letters, v. 282, p. 323–328.
Setyandhaka, D., Arif, J., and Proffett, J., 2008, Characteris-tics of the roots of a classic Cu-Au porphyry system—The Batu Hijau porphyry deposit, Indonesia, PACRIM Congress 2008, Extended Abstracts: Carlton, Victoria, Australasian Institute of Mining and Metallurgy, p. 445–450.
Shafiei, Behnam, Haschke, M., and Shahabpour, J., 2009, Recycling of orogenic arc crust triggers porphyry copper mineralization in Kerman Cenozoic arc rocks, southeastern Iran: Mineralium Deposita, v. 44, p. 265–283.
Shahabpour, J., 1999, The role of deep structures in the distri-bution of some major ore deposits in Iran, NE of the Zagros thrust zone: Journal of Geodynamics, v. 28, p. 237–250.
Shahabpour, J., and Kramers, J.D., 1987, Lead isotope data from the Sar-Cheshmeh porphyry copper deposit, Iran: Mineralium Deposita, v. 22, p. 278–281.
Shevenell, Lisa, Connors, K.A., and Henry, C.D., 1999, Controls on pit lake water quality at sixteen open-pit mines in Nevada: Applied Geochemistry, v. 14, p. 669–687.
Sillitoe, R.H., 1972, A plate tectonic model for the origin of porphyry copper deposits: Economic Geology, v. 67, p. 184–197.
Sillitoe, R.H., 1985, Ore-related breccias in volcanoplutonic arcs: Economic Geology, v. 80, p. 1467–1514.
Sillitoe, R.H., 1997, Characteristics and controls of the largest porphyry copper-gold and epithermal gold deposits in the circum-Pacific region: Australian Journal of Earth Sciences, v. 44, p. 373–388.
Sillitoe, R.H., 1998, Epochs of intrusion-related copper miner-alization in the Andes: Journal of South American Earth Sciences, v. 1, p. 89–108.
Sillitoe, R.H., 2000, Styles of high-sulphidation gold, silver, and copper mineralization in porphyry and epithermal envi-ronments: The AusIMM Proceedings, v. 305, p. 19–34.
Sillitoe, R.H., 2003, Iron oxide-copper-gold deposits—An Andean view: Mineralium Deposita, v. 38, p. 787–812.
References Cited 153
Sillitoe, R.H., 2005, Supergene oxidized and enriched porphyry copper and related deposits: Society of Economic Geologists, Economic Geology 100th Anniversary Volume, p. 723–768.
Sillitoe, R.H., and Bonham, H.F., 1990, Sediment-hosted gold deposits—Distal products of magmatic-hydrothermal systems: Geology, v. 18, p. 157–161.
Sillitoe, R.H., and Gappé, I.M., Jr., 1984, Philippine porphyry copper deposits—Geologic setting and characteristics: United Nations Economic Social Commission Asia-Pacific, Committee for Coordination of Joint Prospecting for Mineral Resources in Asian Offshore Areas, Technical Publication 14, 89 p.
Sillitoe, R.H., and Hart, S.R., 1984, Lead-isotopic signatures of porphyry copper deposits in oceanic and continental settings, Colombian Andes: Geochimica et Cosmochimica Acta, v. 48, p. 2135–2142.
Sillitoe, R.H., and Hedenquist, J.W., 2003, Linkages between volcanotectonic settings, ore-fluid compositions, and epith-ermal precious metal deposits: Society of Economic Geolo-gists Special Publication 10, p. 315–343.
Sillitoe, R.H., and McKee, E.H., 1996, Age of supergene oxidation and enrichment in the Chilean porphyry copper province: Economic Geology, v. 91, p. 164–179.
Sillitoe, R.H., Marquardt, J.C., Ramirez, F., Becerra, H., and Gomez, M., 1996, Geology of the concealed MM porphyry copper deposit, Chuquicamata district, northern Chile: Society of Economic Geologists Special Publication 5, p. 59–70.
Sillitoe, R.H., and Perelló, J., 2005, Andean copper prov-ince—Tectonomagmatic settings, deposit types, metal-logeny, explora tion, and discovery: Society of Economic Geologists, Economic Geology 100th Anniversary Volume, p. 845–890.
Simmons, S.F., White, N.C., and John, D.A., 2005, Geological characteristics of epithermal precious and base metal depos-its: Society of Economic Geologists, Economic Geology 100th Anniversary Volume, p. 485–522.
Sinclair, W.D., 2007, Porphyry deposits, in Goodfellow, W.D., ed., Mineral deposits of Canada: Geological Association of Canada Special Publication 5, p. 223–243.
Singer, D.A., Berger, V.I., and Moring, B.C., 2002, Porphyry copper deposits of the world—Database, maps, and prelimi-nary analysis: U.S. Geological Survey Open-File Report 2002–268, 62 p., http://geopubs.wr.usgs.gov/open-file/of02-268/.
Singer, D.A., Berger, V.I., and Moring, B.C., 2008, Porphyry copper deposits of the world—Database and grade and tonnage models, 2008: U.S. Geological Survey Open-File Report 2008–1155, 45 p., http://pubs.usgs.gov/of/2008/1155/
Singer, P.C., and Stumm, W., 1970, Acidic mine drain-age—The rate-determining step: Science, v. 167, no. 3921, p. 1121–1123.
Sisson, V.B., Pavlis, T.L., Roeske, S.M., and Thorkelson, D.J., 2003, Introduction—An overview of ridge–trench interactions in modern and ancient settings, in Sisson, V.B., Roeske, S.M., and Pavlis, T.L., eds., Geology of a transpres-sional orogen developed during ridge–trench interaction along the North Pacific Margin: Geological Society of America Special Paper, v. 371, p. 1–18.
Skewes, M.A., Arévalo, A., Floody, R., Zuñiga, P., and Stern, C.R., 2002, The giant El Teniente breccia deposit—Hypo-gene copper distribution and emplacement: Society of Economic Geologists Special Publication 9, p. 299–332.
Skewes, M.A., Arevalo, A., Floody, R., Zuñiga, P.H., and Stern, C.R., 2005, The El Teniente megabreccia deposit, the world’s largest copper deposit, in Porter, T.M., ed., Super-porphyry copper and gold deposits—A global perspec-tive: Adelaide, Porter GeoConsultancy Publishing, v. 1, p. 83–113.
Skewes, M.A., and Stern, C.R., 1995, Genesis of the giant late Miocene to Pliocene copper deposits of central Chile in the context of Andean magmatic and tectonic evolution: International Geology Reviews, v. 37, p. 71–84.
Skewes, M.A., and Stern, C.R., 2007, Geology, mineraliza-tion, alteration, and structural evolution of the El Teni-ente porphyry Cu-Mo deposit—A discussion: Economic Geology, v. 102, p. 1165–1180.
Spatz, D.M., and Wilson, R.T., 1995, Remote sensing char-acteristics of porphyry copper systems, western America Cordillera, in Pierce, F.W. and Bolm, J. G., eds., Arizona Geological Society Digest, v. 20, p. 94–108.
Spies, B.R., and Frischknecht, F.C., 1991, Electromagnetic sounding, in Nabighian, M.N., ed., Electromagnetic methods in applied geophysics: Tulsa, Okla., Society of Exploration Geophysicists, v. 2, part B, p. 285–425.
Stacey, J.S., and Kramers, J.D., 1975, Approximation of terrestrial lead isotope evolution by a two-stage model: Earth and Planetary Science Letters, v. 26, p. 207–221.
Stacey, J.S., Zartman, R.E., and Nkomo, I.T., 1968, A lead isotope study of galenas and selected feldspars from mining districts in Utah: Economic Geology, v. 63, p. 796–814.
154 Porphyry Copper Deposit Model
Stavast, W.J.A., Butler, R.F., Seedorff, E., Barton, M.D., and Ferguson, C.A., 2008, Tertiary tilting and dismemberment of the Laramide arc and related hydrothermal systems, Sierrita Mountains, Arizona: Economic Geology, v. 103, p. 629–636.
Stern, C.R., 1989, Miocene to Present migration of the volca-nic front, Andean Southern Volcanic Zone, central Chile: Revista Geologica de Chile, v. 16, p. 145–162.
Stern, C.R., and Skewes, M.A., 1995, Miocene to present magmatic evolution at the northern end of the Andean Southern Volcanic Zone, central Chile: Revista Geologica de Chile, v. 22, p. 261–272.
Stern, C.R., and Skewes, M.A., 2005, Origin of giant Miocene and Pliocene Cu-Mo deposits in Central Chile—Role of ridge subduction, decreased subduction angle, subduction erosion, crustal thickening and long-lived, batholith-sized, open-system magma chambers, in Porter, T.M., ed., Super-porphyry copper and gold deposits—A global perspective: Adelaide, Porter Geoconsultancy Publishing, v. 1, p. 65–82.
Stollenwerk, K.G., 1994, Geochemical interactions between constituents in acidic groundwater and alluvium in an aquifer near Globe, Arizona: Applied Geochemistry, v. 9, p. 353–369.
Streck, M.J., and Dilles, J.H., 1998, Sulfur evolution of oxidized arc magmas recorded in apatite—Evidence from the Yerington porphyry copper batholith, Nevada: Geology, v. 26, p. 523–524.
Streckeisen, A., 1976, To each plutonic rock its proper name: Earth Science Reviews, v. 12, p. 1–33.
Taylor, B.E., 1992, Degassing of H2O from rhyolitic magma during eruption and shallow intrusion, and the isotopic composition of magmatic water in hydrothermal systems: Geological Survey of Japan Report, v. 279, p. 190–194.
Taylor, H.P., Jr., 1974, The application of oxygen and hydro-gen isotope studies to problems of hydothermal alteration and ore deposition: Economic Geology, v. 69, p. 747–764.
Telford, W.M., Geldart, L.P., and Sheriff, R.E., 1990, Applied geophysics, 2d ed.: Cambridge University Press, 770 p.
Theodore, T.G., 2000, Geoogy of pluton-related gold miner-alization at Battle Mountain, Nevada: Tucson, Arizona, Center for Mineral Resources, Monographs in Mineral Resources, no. 2, 271 p.
Thieblemont, D., Stein, G., and Lescuyer, J.L., 1997, Epithermal and porphyry deposits—The adakite connection: Comptes Rendus de l’Academie des Sciences, v. 325, p. 103–109.
Thoman, M.W., Zonge, K.L., and Liu, D., 2000, Geophysical case history of North Silver Bell, Pima County, Arizona—A supergene-enriched porphyry copper deposit, in Ellis, R.B., Irvine, R., and Fritz, F., eds., Northwest Mining Association 1998 Practical Geophysics Short Course Selected Papers on CD-ROM: Spokane, Washington, Northwest Mining Association, paper 4, 42 p.
Thorkelson, D.J., 1996, Subduction of diverging plates and the principles of slab window formation: Tectonophysics v. 255, p. 47–63.
Tilton, G.R., Pollak, R.J., Clark, A., and Robertson, R.C., 1981, Isotopic composition of Pb in Central Andean ore deposits: Geological Society of America Memoir, v. 154, p. 791–816.
Titley, S.R., 1972, Intrusion and wall rock porphyry copper deposits: Economic Geology, v. 67, p. 122.
Titley, S.R., 1978, Geologic history, hypogene features, and processes of secondary sulfide enrichment at the Plesyumi copper prospect, New Britain, Papua New Guinea: Economic Geology, v. 73, p. 768–784.
Titley, S.R., 1982, The style and progress of mineraliza-tion and alteration in porphyry copper systems, American southwest, in Titley, S.R., ed., Advances in geology of the porphyry copper deposits, southwestern North America: Tucson, University of Arizona Press, p. 93–116.
Titley, S.R., 1997, 1997 Jackling lecture—Porphyry copper geology—A late century view: Mining Engineering, v. 49, no. 7, p. 57–63.
Titley, S.R., 2001, Crustal affinities of metallogenesis in the American Southwest: Economic Geology, v. 96, p. 1323–1342.
Titley, S.R., and Hicks, C.L., 1966, Geology of the porphyry copper deposits, southwestern North America: Tucson, University of Arizona Press, 287 p.
Titley, S.R., and Marozas, D.C., 1995, Processes and products of supergene copper enrichment, in Pierce, F.W., and Bolm, J.G., eds., Porphyry copper deposits of the American cordil-lera: Arizona Geological Society Digest, v. 20, p. 156–168.
Titley, S.R., Thompson, R.C., Haynes, F.M., Manske, S.L., Robison, L.C., and White, J.L., 1986, Evolution of frac-tures and alteration in the Sierrita-Esperanza hydrothermal system, Pima County, Arizona: Economic Geology, v. 81, p. 343–370.
Tomlinson, A.J., and Blanco, N., 1997, Structural evolu-tion and displacement history of the West fault system, Precordillera, Chile—Part 1 Synmineral history: Congreso Geológico Chileno, 8th, Antofagasta, Actas, v. 3, p. 1873–1877.
References Cited 155
Tommaso, I.D., and Rubinstein, N., 2007, Hydrothermal alteration mapping using ASTER data in the Infiernillo porphyry deposit, Argentina: Ore Geology Reviews, v. 32, p. 275–290.
Tosdal, R.M., 1995, Metal source differences in Cenozoic porphyry Cu-Mo-Au deposits in the central Chilean Andes between 26° and 28°—An influence on the size of porphyry deposits?, in Clark, A.H., Hodgson, C.J., and Mason, R., eds., Proceedings of the second giant ore deposits work-shop, Giant ore deposits—II; Controls on the scale of orogenic magmatic-hydrothermal mineralization: Kingston, Ontario, Canada, Queen’s University, p. 124–138.
Tosdal, R.M., and Munizaga, F., 2003, Lead sources in Meso-zoic and Cenozoic Andean ore deposits, north-central Chile (30–34°S): Mineralium Deposita, v. 38, p. 234–250.
Tosdal, R.M., and Richards, J.P., 2001, Magmatic and struc-tural controls on the development of porphyry copper ±Mo ±Au deposits: Reviews in Economic Geology, v. 14, p. 157–181.
Tosdal, R.M., Wooden, J.L., and Bouse, R.M., 1999, Pb isotopes, ore deposits, and metallogenic terranes: Society of Economic Geologists, Reviews in Economic Geology, v. 12, p. 1–12.
Ulrich, Thomas, Günter, Detlep, and Heinrich, C.A., 2002, The evolution of a porphyry Cu-Au deposit, based on LA–ICP–MS analysis of fluid inclusions—Bajo de la Alum-brera, Argentina: Economic Geology, v. 97, p. 1889–1920.
Ulrich, Thomas, and Heinrich, C.A., 2002, Geology and alter-ation of the porphyry Cu-Au deposit at Bajo de la Alum-brera, Argentina: Economic Geology, v. 97, p. 1865–1888.
Ulrich, Thomas, and Mavrogenes, John, 2008, An experi-mental study of the solubility of molybdenum in H2O and KCl-H2O solutions from 500 degrees C to 800 degrees C, and 150 to 300 MPa: Geochimica et Cosmochimica Acta, v. 72, p. 2316–2330.
Urqueta, Esteban, Kyser, T.K., Clark, A.H., Stanley, C.R., and Oates, C.J., 2009, Lithogeochemistry of the Collahuasi porphyry Cu-Mo and epithermal Cu-Ag(-Au) cluster, north-ern Chile—Pearce element ratio vectors to ore: Geochemis-try; Exploration, Environment, Analysis, v. 9, p. 9–17.
Valencia, V.A., Eastoe, C., Ruiz, J., Ochoa-Landin, L., Gehrels, G., Gonzalez-Leon, C., Barr, F., and Espinosa, E., 2008, Hydrothermal evolution of the porphyry copper deposit at La Caridad, Sonora, Mexico, and the relation-ship with a neighboring high-sulfidation epithermal deposit: Economic Geology, v. 103, p. 473–491.
Valencia-Moreno, M., Ochoa-Landin, L., Noguez-Alcantara, B., Ruiz, J., and Perez-Segura, E., 2007, Geological and metallogenic characteristics of the porphyry copper deposits of Mexico and their situation in the world context, in Alaniz-Alavarez, S.A., and Nieto-Samaniego, A.F., eds., Geology of Mexico—Celebrating the Cente-nary of the Geological Society of Mexico: Geological Society of America Special Paper 422, p. 433–458, doi: 10.1130/2007.2422(16).
Valencia-Moreno, M., Ruiz, J., Barton, M.D., Patchett, P.J., Zurcher, L., Hodkinson, D.G., and Roldan-Quintana, J., 2001, A chemical and isotopic study of the Laramide granitic belt of northwestern Mexico—Identification of the southern edge of the North American Precambrian basement: Geological Society of America Bulletin, v. 113, p. 1409–1422.
Van Leeuwen, T.M., 1994, 25 years of mineral exploration and discovery in Indonesia: Journal of Geochemical Explora-tion, v. 50, p. 13–90.
Van Voorhis, G.D., Nelson, P.H., and Drike, T.L., 1973, Complex resistivity spectra of porphyry copper mineraliza-tion: Geophysics, v. 38, p. 49–60.
Von Huene, R., Corvalan, J., Flueh, E., Hinz, K., Korstgard, J., Ranero, C., Weinrebe, W., and CONDOR scientists, 1997, Tectonic control of the subducting Juan Fernandez Ridge on the Andean margin near Valparaiso, Chile: Tectonics, v. 16, p. 474–488.
von Quadt, Albrecht, Peytcheva, I., Kamenov, B., Fanger, L., Heinrich, C., and Frank, M., 2002, The Elatsite porphyry copper deposit in the Panagyurishte ore district, Sredno-gorie, Bulgaria—U–Pb zircon geochronology and isotope-geochemical investigations of magmatism and ore genesis, in Blundell, D.J., Neubauer, F., and von Quadt, Albrecht, eds., The timing and location of major ore deposits in an evolving orogen: Geological Society of London, Special Publications, v. 204, p. 119–135.
Vozoff, K., 1991, The magnetotelluric method, in Nabighian, M.N., ed., Electromagnetic methods in applied geophysics: Tulsa, Okla., Society of Exploration Geophysicists, v. 2, part B, p. 641–711.
Waite, K.A., Keith J.D., Christiansen, E.H., Whitney, J.A., Hattori, K., Tingey, D.G., and Hook, C.J., 1997, Petrogen-esis of the volcanic and intrusive rocks associated with the Bingham porphyry Cu-Au-Mo deposit, Utah, in John, D.A., and Ballantyne, G.H., eds., Geology and ore deposits of the Wasatch and Oquirrh Mountains: Society of Economic Geologists, Guidebook Series, no. 29, p. 91–128.
156 Porphyry Copper Deposit Model
Wang, L., Zhu, D., Geng, Q., Liao, Z., and Pan, G., 2007, Ages and tectonic significance of the collision related granite porphyries in the Lhunzhub basin, Tibet, China: Chinese Science Bulletin, v. 52, p. 1669–1679.
Wang, Q., Wyman, D.A., Xu, J., Zhao, Z., Jian, P., and Zi, F., 2007, Partial melting of a thickened or delaminated lower crust in the middle of Eastern China—Implications for Cu-Au mineralization: Journal of Geology, v. 115, p. 149–161.
Wang, Qiang, Xu, J., Jian, P., Bao, Z., Zhao, Z., Li, C., Xiong, X., and Ma, J., 2006, Petrogenesis of adakitic porphyries in an extensional setting, Dexing, South China—Implications for the genesis of porphyry copper mineralization: Journal of Petrology, v. 47, p. 119–144.
Wang, Qiang, Zhao, Z., Bao, Z., Xu, J., Liu, W., and Li, C., 2004, Geochemistry and petrogenesis of the Tongshankou and Yinzu adakitic intrusive rocks and the associated porphyry copper-molybdenum mineralization in southeast Hubei, east China: Resource Geology, v. 54, p. 137–152.
Washburn, M., 2007, Postmineral sedimentation and Devo-nian shortening of the Cadia East alkalic porphyry Cu-Au deposit, New South Wales, Australia, in “Ores and Orogen-esis,” a symposium honoring the career of William R. Dick-inson, Program with Abstracts: Tucson, Arizona Geological Society, p. 187–188.
Watanabe, Yasushi, and Hedenquist, J.W., 2001, Mineralogic and stable isotope zonation at the surface over El Salvador porphyry copper deposit, Chile: Economic Geology, v. 96, p. 1775–1797.
Waterman, G.C., and Hamilton, R.L., 1975, The Sar Chesh-meh porphyry copper deposit: Economic Geology, v. 70, p. 568–576.
White, A.J.R., 2004, Porphyry copper mineralization of western United States, in Blevin, P.H., Jones, M., and Chap-pell, B.W., eds., Magmas to mineralization, The Ishihara Symposium, Granites and associated metallogenesis: Geoscience Australia, p. 139–140.
Whitney, J.A., 1984, Volatiles in magmatic systems, in Fluid-mineral equilibria in hydrothermal systems: Reviews in Economic Geology, v. 1, p. 155–175.
Whittaker, J.M., Miffler, R.D., Sdrolias, M., and Heine, C., 2007, Sunda-Java trench kinematics, slab window forma-tion and overriding plate deformation since the Cretaceous: Earth and Planetary Science Letters, v. 255, p. 445–457.
Wilkins, Joe, Jr., and Heidrick, T.L., 1995, Post-Laramide extension and rotation of porphyry copper deposits, south-western United States, in Pierce, F.W., and Bolm, J.G., eds., Porphyry copper deposits of the American Cordillera: Arizona Geological Society Digest, v. 20, p. 109–127.
Williams, W.C., 1992, Magmatic and structural controls in mineralization in the Paleocene magmatic arc between 22°40′ and 23°45′ south latitude, Antofagasta, II region, Chile: Tucson, University of Arizona, Ph.D. thesis, 182 p.
Williams, W.C., 1995, The crustal heritage of ore deposits in northern Chile (abs.): Geological Society of America Abstracts with Programs, v. 27, p. A410.
Williams-Jones, A.E., and Heinrich, C.A., 2005, Vapor trans-port of metals and the formation of magmatic-hydrothermal ore deposits: Economic Geology, v. 100, p. 1287–1312.
Williamson, M.A., Kirby, C.S., and Rimstidt, J.D., 2006, Iron dynamics in acid mine drainage, in Barnhisel, R.I., ed., The 7th International Conference on Acid Rock Drainage, St. Louis, Missouri: Lexington, Kentucky, American Society of Mining and Reclamation (ASMR), p. 2411–2423.
Wilson, A.J., Cooke, D.R., and Harper, B.J., 2003, The Ridge-way gold-copper deposit—A high-grade alkalic porphyry deposit in the Lachlan fold belt, New South Wales, Austra-lia: Economic Geology, v. 98, p.1637–1666.
Wilson, A.J., Cooke, D.R., Harper, B.J., and Deyell, C.L., 2007, Sulfur isotopic zonation in the Cadia district, south-eastern Australia—Exploration significance and implication for the genesis of alkalic porphyry gold-copper deposits: Mineralium Deposita, v. 42, p. 465–487.
Wilson, A.J., Cooke, D.R., Stein, H.J., Fanning, C.M., Holly-day, J.R., and Tedder, I.J., 2007, U-Pb and Re-Os geochro-nologic evidence for two alkalic porphyry ore-forming events in the Cadia district, New South Wales, Australia: Economic Geology, v. 102, p. 3–26.
Wilson, J.W.J., Kesler, S.E., Cloke, P.L., and Kelly, W.C., 1980, Fluid inclusion geochemistry of the Granisle and Bell porphyry copper deposits, British Columbia: Economic Geology, v. 75, p. 45–61.
Wones, D.R., and Eugster, H.P., 1965, Stability of biotite—Experiment, theory, and application: American Mineralo-gist, v. 50, p. 1228–1272.
Wooden, J.L., Stacey, J.S., Howard, K.A., Doe, B.R., and Miller, D.M., 1988, Lead isotopic evidence for the forma-tion of Pro terozoic crust in the southwestern United States, in Ernst, W.G., ed., Metamorphism and crustal evolution, western contermi nous United States, Rubey Volume 7: Engelwood Cliffs, New Jersey, Prentice-Hall, p. 68–86.
Xiaoming, Qu, Hou, Zengqian, Zaw, Khin, and Li, Youguo, 2007, Characteristics and genesis of Gangdese porphyry copper deposits in the southern Tibetan plateau—Prelimi-nary geochemical and geochronologic results: Ore Geology Reviews, v. 31, p. 205–223.
References Cited 157
Xu, Xing-wang, Cai, Xin-Ping, Xiao, Qi-Bing, and Peters, S.G., 2007, Porphyry copper-Au and associated polymetal-lic Fe-Cu-Au deposits in the Beiya area, western Yunnan province, south China: Ore Geology Reviews, v. 31, p. 224–246.
Yang, Z., Hou, Z., Song, Y., and Li, Z., 2008, Geology of the Qulong copper-molybdenum deposit, Tibet (abs.): 33d International Geological Congress, Oslo, 2008, August 6–14, 2008.
Yuan, C., Sun, M., Xiao, W., Wilde, S., and six others, 2008, Garnet-bearing tonalite porphyry from East Kunlun, north-east Tibetan plateau—Implications for adakite and magmas from the MASH zone: International Journal of Earth Sciences (Geol. Rundsch.), v. 98, p. 1489–1510.
Zarasvandi, A., Liaghat, S., and Zentilli, K., 2005, Porphyry copper deposits of the Urumieh-Dokhtar magmatic arc, Iran, in Porter, T.M., ed., Super porphyry copper and gold deposits—A global perspective, v. 2: Linden Park, South Australia, Porter GeoConsultancy Publishing, p. 441–452.
Zartman, R.E., and Doe, B. R., 1981, Plumbotectonics—The model: Tectonophysics, v. 75, p. 135–162.
Zengqian, Hou, Zhong, Dalai, Deng, Wanming, and Kin Zaw, 2005, A tectonic model for porphyry copper-molybdenum-gold deposits in the eastern Indo-Asian collision zone, in Porter, T.M., ed., Super porphyry copper and gold depos-its—A global perspective, Adelaide, Porter GeoConsultancy Publishing, v. 2, p. 423–440.
Zentilli, M., Doe, B., Hedge, C.E., Alvarez, C.E., Tidy, E., and Daroca, J.A., 1988, Isotopos de plomo en yacimientos de tipo porfido cuprifero comparados con otros depositos metaliferos en los Andes del norte de Chile y Argentina: Congreso Geológico Chileno, 5th, Santiago, August 8–12, Actas, p. B331–369.
Zhang, L., 2000, Stable isotope investigation of a hydrother-mal alteration system—Butte porphyry copper deposit: Corvallis, Oregon State University, Ph.D. dissertation, 182 p.
Zhang, L., Xiao, W., Qin, K., and Zhang, Q., 2006, The adakite connection of the Tuwu-Yandong copper porphyry belt, eastern Tianshan, NW China—Trace element and Sr-Nd-Pb isotope geochemistry: Mineralium Deposita, v. 41, p. 188–200.
Zheng, Y., Duo, J., Cheng, S., Gao, S., and Dai, F., 2007, Progress in porphyry copper exploration from the Gang-dise belt, Tibet, China: Frontiers Earth Science China, v. 1, p. 226–232.
Zhitian, W., and Kezhang, Q., 1989, REE geochemical char-acter of porphyry copper molybdenum multimetal metallo-genic series and its application to distinguishing ore-bearing quality of porphyries in Mnazhouli-Xinbaerhuyouqi area of Inner Mongolia: International Geological Congress, 28th, Washington, D.C., Progress in Geosciences of China (1985–1988)-Papers, p. 125–128.
Zindler, A., and Hart, S.R., 1986, Chemical geodynamics: Annual Reviews of Earth and Planetary Sciences, v. 14, p. 493–571.
Zolensky, M.E., and Bodnar, R.J., 1982, Identification of fluid inclusion daughter minerals using Gandolfi X-ray tech-niques: American Mineralogist, v. 67, p. 137–141.
Zonge, K.L., and Hughes, L.J., 1991, Controlled source audio-frequency magnetotellurics, in Nabighian, M.N., ed., Electromagnetic methods in applied geophysics: Tulsa, Okla., Society of Exploration Geophysicists, v. 2, part B, p. 713–810.
Zonge, K.L., and Wynn, J.C., 1975, Recent advances and applications in complex resistivity measurements: Geophys-ics, v. 40, p. 851–864.
Zonge, K.L., Wynn, J.C., and Urquahart, S.A., 2005, Resistiv-ity, induced polarization, and complex resistivity: Society of Exploration Geophysicists Special Volume on Near Surface Geophysics, p. 265–300.
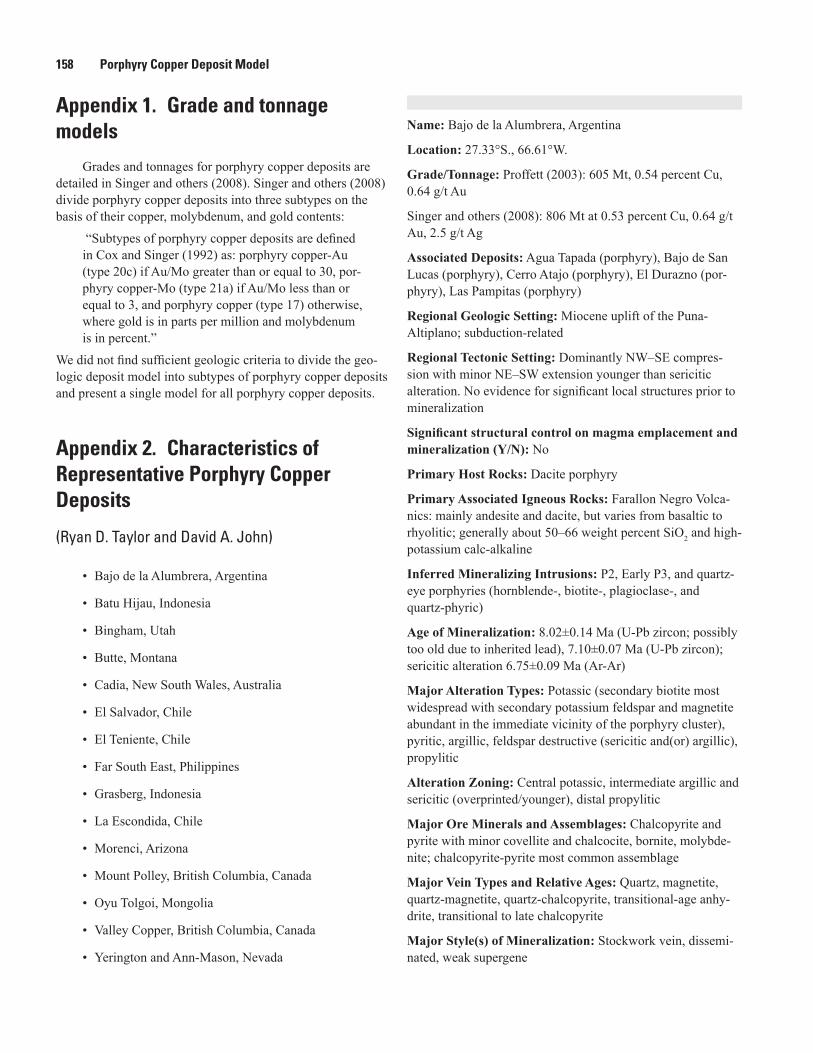
158 Porphyry Copper Deposit Model
Appendix 1. Grade and tonnage models
Grades and tonnages for porphyry copper deposits are detailed in Singer and others (2008). Singer and others (2008) divide porphyry copper deposits into three subtypes on the basis of their copper, molybdenum, and gold contents:
“Subtypes of porphyry copper deposits are defined in Cox and Singer (1992) as: porphyry copper-Au (type 20c) if Au/Mo greater than or equal to 30, por-phyry copper-Mo (type 21a) if Au/Mo less than or equal to 3, and porphyry copper (type 17) otherwise, where gold is in parts per million and molybdenum is in percent.”
We did not find sufficient geologic criteria to divide the geo-logic deposit model into subtypes of porphyry copper deposits and present a single model for all porphyry copper deposits.
Appendix 2. Characteristics of Representative Porphyry Copper Deposits
(Ryan D. Taylor and David A. John)
• Bajo de la Alumbrera, Argentina
• Batu Hijau, Indonesia
• Bingham, Utah
• Butte, Montana
• Cadia, New South Wales, Australia
• El Salvador, Chile
• El Teniente, Chile
• Far South East, Philippines
• Grasberg, Indonesia
• La Escondida, Chile
• Morenci, Arizona
• Mount Polley, British Columbia, Canada
• Oyu Tolgoi, Mongolia
• Valley Copper, British Columbia, Canada
• Yerington and Ann-Mason, Nevada
Name: Bajo de la Alumbrera, Argentina
Location: 27.33°S., 66.61°W.
Grade/Tonnage: Proffett (2003): 605 Mt, 0.54 percent Cu, 0.64 g/t Au
Singer and others (2008): 806 Mt at 0.53 percent Cu, 0.64 g/t Au, 2.5 g/t Ag
Associated Deposits: Agua Tapada (porphyry), Bajo de San Lucas (porphyry), Cerro Atajo (porphyry), El Durazno (por-phyry), Las Pampitas (porphyry)
Regional Geologic Setting: Miocene uplift of the Puna-Altiplano; subduction-related
Regional Tectonic Setting: Dominantly NW–SE compres-sion with minor NE–SW extension younger than sericitic alteration. No evidence for significant local structures prior to mineralization
Significant structural control on magma emplacement and mineralization (Y/N): No
Primary Host Rocks: Dacite porphyry
Primary Associated Igneous Rocks: Farallon Negro Volca-nics: mainly andesite and dacite, but varies from basaltic to rhyolitic; generally about 50–66 weight percent SiO2 and high-potassium calc-alkaline
Inferred Mineralizing Intrusions: P2, Early P3, and quartz-eye porphyries (hornblende-, biotite-, plagioclase-, and quartz-phyric)
Age of Mineralization: 8.02±0.14 Ma (U-Pb zircon; possibly too old due to inherited lead), 7.10±0.07 Ma (U-Pb zircon); sericitic alteration 6.75±0.09 Ma (Ar-Ar)
Major Alteration Types: Potassic (secondary biotite most widespread with secondary potassium feldspar and magnetite abundant in the immediate vicinity of the porphyry cluster), pyritic, argillic, feldspar destructive (sericitic and(or) argillic), propylitic
Alteration Zoning: Central potassic, intermediate argillic and sericitic (overprinted/younger), distal propylitic
Major Ore Minerals and Assemblages: Chalcopyrite and pyrite with minor covellite and chalcocite, bornite, molybde-nite; chalcopyrite-pyrite most common assemblage
Major Vein Types and Relative Ages: Quartz, magnetite, quartz-magnetite, quartz-chalcopyrite, transitional-age anhy-drite, transitional to late chalcopyrite
Major Style(s) of Mineralization: Stockwork vein, dissemi-nated, weak supergene
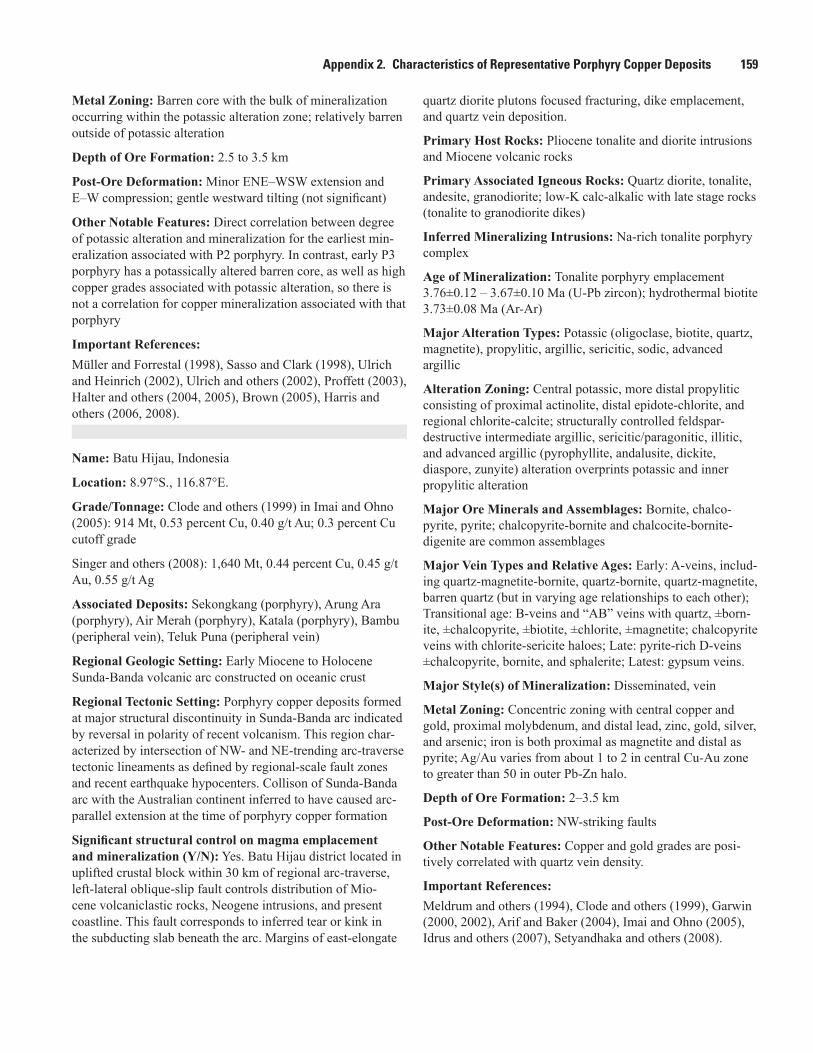
Appendix 2. Characteristics of Representative Porphyry Copper Deposits 159
Metal Zoning: Barren core with the bulk of mineralization occurring within the potassic alteration zone; relatively barren outside of potassic alteration
Depth of Ore Formation: 2.5 to 3.5 km
Post-Ore Deformation: Minor ENE–WSW extension and E–W compression; gentle westward tilting (not significant)
Other Notable Features: Direct correlation between degree of potassic alteration and mineralization for the earliest min-eralization associated with P2 porphyry. In contrast, early P3 porphyry has a potassically altered barren core, as well as high copper grades associated with potassic alteration, so there is not a correlation for copper mineralization associated with that porphyry
Important References: Müller and Forrestal (1998), Sasso and Clark (1998), Ulrich and Heinrich (2002), Ulrich and others (2002), Proffett (2003), Halter and others (2004, 2005), Brown (2005), Harris and others (2006, 2008).
Name: Batu Hijau, Indonesia
Location: 8.97°S., 116.87°E.
Grade/Tonnage: Clode and others (1999) in Imai and Ohno (2005): 914 Mt, 0.53 percent Cu, 0.40 g/t Au; 0.3 percent Cu cutoff grade
Singer and others (2008): 1,640 Mt, 0.44 percent Cu, 0.45 g/t Au, 0.55 g/t Ag
Associated Deposits: Sekongkang (porphyry), Arung Ara (porphyry), Air Merah (porphyry), Katala (porphyry), Bambu (peripheral vein), Teluk Puna (peripheral vein)
Regional Geologic Setting: Early Miocene to Holocene Sunda-Banda volcanic arc constructed on oceanic crust
Regional Tectonic Setting: Porphyry copper deposits formed at major structural discontinuity in Sunda-Banda arc indicated by reversal in polarity of recent volcanism. This region char-acterized by intersection of NW- and NE-trending arc-traverse tectonic lineaments as defined by regional-scale fault zones and recent earthquake hypocenters. Collison of Sunda-Banda arc with the Australian continent inferred to have caused arc-parallel extension at the time of porphyry copper formation
Significant structural control on magma emplacement and mineralization (Y/N): Yes. Batu Hijau district located in uplifted crustal block within 30 km of regional arc-traverse, left-lateral oblique-slip fault controls distribution of Mio-cene volcaniclastic rocks, Neogene intrusions, and present coastline. This fault corresponds to inferred tear or kink in the subducting slab beneath the arc. Margins of east-elongate
quartz diorite plutons focused fracturing, dike emplacement, and quartz vein deposition.
Primary Host Rocks: Pliocene tonalite and diorite intrusions and Miocene volcanic rocks
Primary Associated Igneous Rocks: Quartz diorite, tonalite, andesite, granodiorite; low-K calc-alkalic with late stage rocks (tonalite to granodiorite dikes)
Inferred Mineralizing Intrusions: Na-rich tonalite porphyry complex
Age of Mineralization: Tonalite porphyry emplacement 3.76±0.12 – 3.67±0.10 Ma (U-Pb zircon); hydrothermal biotite 3.73±0.08 Ma (Ar-Ar)
Major Alteration Types: Potassic (oligoclase, biotite, quartz, magnetite), propylitic, argillic, sericitic, sodic, advanced argillic
Alteration Zoning: Central potassic, more distal propylitic consisting of proximal actinolite, distal epidote-chlorite, and regional chlorite-calcite; structurally controlled feldspar-destructive intermediate argillic, sericitic/paragonitic, illitic, and advanced argillic (pyrophyllite, andalusite, dickite, diaspore, zunyite) alteration overprints potassic and inner propylitic alteration
Major Ore Minerals and Assemblages: Bornite, chalco-pyrite, pyrite; chalcopyrite-bornite and chalcocite-bornite-digenite are common assemblages
Major Vein Types and Relative Ages: Early: A-veins, includ-ing quartz-magnetite-bornite, quartz-bornite, quartz-magnetite, barren quartz (but in varying age relationships to each other); Transitional age: B-veins and “AB” veins with quartz, ±born-ite, ±chalcopyrite, ±biotite, ±chlorite, ±magnetite; chalcopyrite veins with chlorite-sericite haloes; Late: pyrite-rich D-veins ±chalcopyrite, bornite, and sphalerite; Latest: gypsum veins.
Major Style(s) of Mineralization: Disseminated, vein
Metal Zoning: Concentric zoning with central copper and gold, proximal molybdenum, and distal lead, zinc, gold, silver, and arsenic; iron is both proximal as magnetite and distal as pyrite; Ag/Au varies from about 1 to 2 in central Cu-Au zone to greater than 50 in outer Pb-Zn halo.
Depth of Ore Formation: 2–3.5 km
Post-Ore Deformation: NW-striking faults
Other Notable Features: Copper and gold grades are posi-tively correlated with quartz vein density.
Important References: Meldrum and others (1994), Clode and others (1999), Garwin (2000, 2002), Arif and Baker (2004), Imai and Ohno (2005), Idrus and others (2007), Setyandhaka and others (2008).
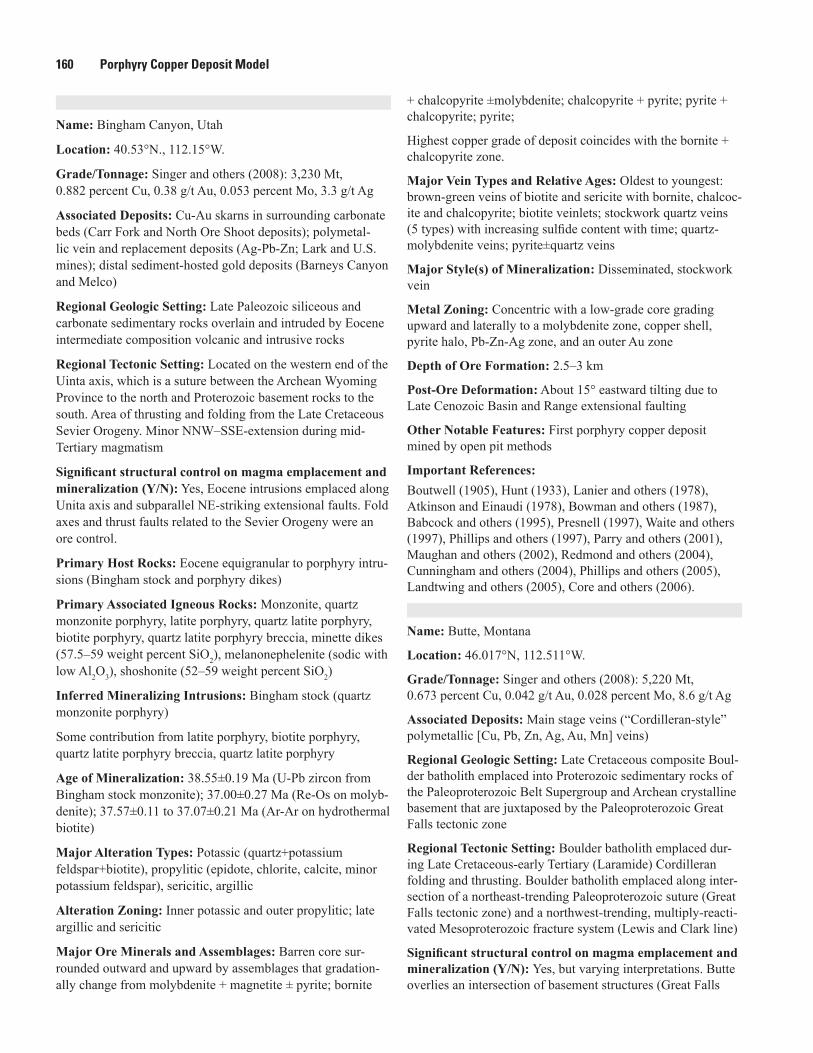
160 Porphyry Copper Deposit Model
Name: Bingham Canyon, Utah
Location: 40.53°N., 112.15°W.
Grade/Tonnage: Singer and others (2008): 3,230 Mt, 0.882 percent Cu, 0.38 g/t Au, 0.053 percent Mo, 3.3 g/t Ag
Associated Deposits: Cu-Au skarns in surrounding carbonate beds (Carr Fork and North Ore Shoot deposits); polymetal-lic vein and replacement deposits (Ag-Pb-Zn; Lark and U.S. mines); distal sediment-hosted gold deposits (Barneys Canyon and Melco)
Regional Geologic Setting: Late Paleozoic siliceous and carbonate sedimentary rocks overlain and intruded by Eocene intermediate composition volcanic and intrusive rocks
Regional Tectonic Setting: Located on the western end of the Uinta axis, which is a suture between the Archean Wyoming Province to the north and Proterozoic basement rocks to the south. Area of thrusting and folding from the Late Cretaceous Sevier Orogeny. Minor NNW–SSE-extension during mid-Tertiary magmatism
Significant structural control on magma emplacement and mineralization (Y/N): Yes, Eocene intrusions emplaced along Unita axis and subparallel NE-striking extensional faults. Fold axes and thrust faults related to the Sevier Orogeny were an ore control.
Primary Host Rocks: Eocene equigranular to porphyry intru-sions (Bingham stock and porphyry dikes)
Primary Associated Igneous Rocks: Monzonite, quartz monzonite porphyry, latite porphyry, quartz latite porphyry, biotite porphyry, quartz latite porphyry breccia, minette dikes (57.5–59 weight percent SiO2), melanonephelenite (sodic with low Al2O3), shoshonite (52–59 weight percent SiO2)
Inferred Mineralizing Intrusions: Bingham stock (quartz monzonite porphyry)
Some contribution from latite porphyry, biotite porphyry, quartz latite porphyry breccia, quartz latite porphyry
Age of Mineralization: 38.55±0.19 Ma (U-Pb zircon from Bingham stock monzonite); 37.00±0.27 Ma (Re-Os on molyb-denite); 37.57±0.11 to 37.07±0.21 Ma (Ar-Ar on hydrothermal biotite)
Major Alteration Types: Potassic (quartz+potassium feldspar+biotite), propylitic (epidote, chlorite, calcite, minor potassium feldspar), sericitic, argillic
Alteration Zoning: Inner potassic and outer propylitic; late argillic and sericitic
Major Ore Minerals and Assemblages: Barren core sur-rounded outward and upward by assemblages that gradation-ally change from molybdenite + magnetite ± pyrite; bornite
+ chalcopyrite ±molybdenite; chalcopyrite + pyrite; pyrite + chalcopyrite; pyrite;
Highest copper grade of deposit coincides with the bornite + chalcopyrite zone.
Major Vein Types and Relative Ages: Oldest to youngest: brown-green veins of biotite and sericite with bornite, chalcoc-ite and chalcopyrite; biotite veinlets; stockwork quartz veins (5 types) with increasing sulfide content with time; quartz-molybdenite veins; pyrite±quartz veins
Major Style(s) of Mineralization: Disseminated, stockwork vein
Metal Zoning: Concentric with a low-grade core grading upward and laterally to a molybdenite zone, copper shell, pyrite halo, Pb-Zn-Ag zone, and an outer Au zone
Depth of Ore Formation: 2.5–3 km
Post-Ore Deformation: About 15° eastward tilting due to Late Cenozoic Basin and Range extensional faulting
Other Notable Features: First porphyry copper deposit mined by open pit methods
Important References: Boutwell (1905), Hunt (1933), Lanier and others (1978), Atkinson and Einaudi (1978), Bowman and others (1987), Babcock and others (1995), Presnell (1997), Waite and others (1997), Phillips and others (1997), Parry and others (2001), Maughan and others (2002), Redmond and others (2004), Cunningham and others (2004), Phillips and others (2005), Landtwing and others (2005), Core and others (2006).
Name: Butte, Montana
Location: 46.017°N, 112.511°W.
Grade/Tonnage: Singer and others (2008): 5,220 Mt, 0.673 percent Cu, 0.042 g/t Au, 0.028 percent Mo, 8.6 g/t Ag
Associated Deposits: Main stage veins (“Cordilleran-style” polymetallic [Cu, Pb, Zn, Ag, Au, Mn] veins)
Regional Geologic Setting: Late Cretaceous composite Boul-der batholith emplaced into Proterozoic sedimentary rocks of the Paleoproterozoic Belt Supergroup and Archean crystalline basement that are juxtaposed by the Paleoproterozoic Great Falls tectonic zone
Regional Tectonic Setting: Boulder batholith emplaced dur-ing Late Cretaceous-early Tertiary (Laramide) Cordilleran folding and thrusting. Boulder batholith emplaced along inter-section of a northeast-trending Paleoproterozoic suture (Great Falls tectonic zone) and a northwest-trending, multiply-reacti-vated Mesoproterozoic fracture system (Lewis and Clark line)
Significant structural control on magma emplacement and mineralization (Y/N): Yes, but varying interpretations. Butte overlies an intersection of basement structures (Great Falls
Appendix 2. Characteristics of Representative Porphyry Copper Deposits 161
tectonic zone and Lewis and Clark line) that may have been reactivated during emplacement of the Boulder batholith and porphyry copper formation. Alternatively, it has been sug-gested that Boulder batholith was emplaced along Laramide-age frontal thrust belt within a pull-apart basin between two east-striking transfer faults that were active as the thrust front pushed east.
Primary Host Rocks: Late Cretaceous (74.5 Ma, U-Pb zir-con) Butte Quartz Monzonite (part of Boulder batholith) and younger quartz porphyry dikes (66.5 Ma, U-Pb zircon)
Primary Associated Igneous Rocks: Quartz porphyry dikes (plagioclase-biotite-potassium feldspar-quartz phyric)
Inferred Mineralizing Intrusions: Quartz porphyry dikes
Age of Mineralization: Two centers of Pre-Main stage porphyry copper-Mo mineralization, Anaconda (western) and Pittsmont (eastern) domes. Pre-Main stage porphyry copper-Mo mineralization: 66-64 Ma (Re-Os molybdenite, Ar-Ar biotite); Pittsmont dome may be about 1 m.y. older than Ana-conda dome; Main stage veins: about 61.5 Ma (Ar-Ar)
Major Alteration Types: Pre-Main stage: potassic, sericitic, propylitic; Main stage: advanced argillic, sericitic, intermedi-ate argillic, propylitic
Alteration Zoning: Pre-Main stage porphyry-related altera-tion consists of broad, overlapping concentric shells bordering centimeter-scale stockwork veins; alteration zoned outward and upward in both Pittsmont and Anaconda domes: (1) BQ (barren quartz) and QMB (quartz-molybdenite) mostly in deep core of barren stockwork quartz ± molybdenite ± anhydrite veins with narrow potassium feldspar envelopes, (2) EDM (early dark micaceous) quartz-chalcopyrite-pyrite±anhydrite veins with biotite-potassium feldspar-sericite-pyrite envelopes, (3) PGS (pale green sericite) quartz-chalcopyrite-magnetite-pyrite veins with potassium feldspar-quartz-green sericite envelopes, and (4) shallowest GS (gray sericitic) pyrite-quartz veins with quartz-pyrite-sericite envelopes. Outermost pre-Main stage veins are pyrite-spahalerite-galena-rhodochrosite-chalcopyrite-epidote veins in potassium feldspar-bearing propylitic alteration. Pre-Main stage veins cut by Main stage veins consisting of covellite-enargite-bornite-sphalerite-galena-rhodochrosite-pyrite-chalcopyrite-quartz veins with zoned alteration envelopes from inner advanced argillic to sericitic to intermediate argillic to outer propylitic
Major Ore Minerals and Assemblages: Pre-Main stage: chalcopyrite, molybdenite; Main stage: covellite, enargite, bornite, sphalerite, galena, chalcopyrite
Major Vein Types and Relative Ages: See “Alteration Zon-ing” above; vein sequence from early to late generally EMB, PGS, BQ/QMB, GS, Main stage
Major Style(s) of Mineralization: Stockwork veining, dis-seminated as replacement of mafic phenocrysts
Metal Zoning: Two centers of pre-Main stage porphyry copper-Mo mineralization (Anaconda and Pittsmont domes), separated by 1.5-km-wide zone of pervasive gray sericitic alteration. Main stage veins mostly lie above and west of Anaconda dome. Main stage veins strongly zoned with interior copper-rich zone, to intermediate copper-zinc zone, to periph-eral Mn-Pb-Zn-Ag zone
Depth of Ore Formation: Pre-Main stage: 6-9 km; Main stage: mostly 4–5 km
Post-Ore Deformation: Pittsmont dome and porphyry Cu-Mo mineralization cut and offset by north-striking, 55° west-dip-ping Continental fault with about 1,250 m down-to-the-west normal displacement
Other Notable Features:
Important References: Sales (1914), Sales and Meyer (1948), Meyer and others (1968), Proffett (1973), Roberts (1975), Brimhall (1977, 1980), Hildenbrand and others (2001), Dilles and others (2003), Lund and others (2007), Rusk, Reed, and Dilles (2008), Rusk, Miller, and Reed (2008).
Name: Cadia district, New South Wales, Australia (includes Cadia Hill, Ridgeway, Cadia Quarry, and Cadia East deposits)
Location: 33.467°S., 149°W.
Grade/Tonnage: Total district resources including skarn deposits: 1,212 Mt at 0.32 percent Cu and 0.75 g/t Au (Wilson and others, 2007)
Associated Deposits: Fe-Cu-Au skarn deposits (Big Cadia and Little Cadia)
Regional Geologic Setting: Late Ordovician–Early Silurian island-arc-related volcano-plutonic rocks (Macquarie arc) overlying and intruding Ordovician volcaniclastic rocks
Regional Tectonic Setting: Eastern Lachlan Fold Belt (700-km-wide belt of deformed Paleozoic deep and shallow marine sedimentary rocks, cherts, and mafic volcanic rocks)
Significant structural control on magma emplacement and mineralization (Y/N): Yes, deposits lie along WNW-trending structure that appears to be part of crustal scale lineament (Lachlan Traverse Zone); Cadia Hill and Cadia Quarry depos-its appear localized by the intersection of north-striking faults and WNW-trending structure
Primary Host Rocks: Ordovician volcaniclastic siltstone (Weemalla Formation); Ordovician volcaniclastic conglomer-ate, sandstone, minor limestone and shoshonitic volcanic rocks (Forest Reefs Volcanics); Ordovician pyroxene-plagioclase-phyric dikes; Late Ordovician–Early Silurian monzodioritic to monzonitic intrusions (Cadia Intrusive Complex)
162 Porphyry Copper Deposit Model
Primary Associated Igneous Rocks: Late Ordovician–Early Silurian Cadia Intrusive Complex (high-potassium shoshonitic gabbro, diorite, monzodiorite, quartz monzodiorite)
Inferred Mineralizing Intrusions: Monzonite to monzodio-ritic intrusions (Cadia Intrusive Complex);
Age of Mineralization: 439±6 Ma (U-Pb)
Major Alteration Types: Potassic (orthoclase-biotite-quartz-magnetite); calc-potassic (actinolite-biotite-orthoclase); propy-litic (chlorite, calcite, albite, pyrite, prehnite, hematite); sodic (albite-pyrite); sericitic (illite-muscovite-pyrite)
Alteration Zoning: Cores of potassic or calc-potassic alteration with peripheral propylitic and sodic and late-stage sericitic mostly in fault zones
Major Ore Minerals and Assemblages: Chalcopyrite, bornite
Major Vein Types and Relative Ages: Early (includes quartz-magnetite±actinolite, calcite, orthoclase, bornite, chalcopy-rite); transitional (includes quartz-chalcopyrite ±orthoclase, pyrite, magnetite); late (quartz-pyrite±sericite, chlorite), and peripheral (includes epidote, chlorite, calcite, prehnite, pyrite, quartz, chalcopyrite) stages
Major Style(s) of Mineralization: Ridgeway: Sheeted and stockwork quartz-sulfide-magnetite-calcite veins; Cadia Hill and Cadia Quarry: sheeted quartz-sulfide-calcite veins and minor pegmatitic breccia; Cadia East: shallow stratabound Cu-Au in volcaniclastic sedimentary rocks; deeper dissemi-nated(?) Cu-Au in and around quartz monzonite porphyry dikes
Metal Zoning: Ridgeway and Cadia East: bornite-rich cores surrounded by chalcopyrite-rich haloes and peripheral pyrite zones
Cadia Hill and Cadia Quarry: chalcopyrite-rich cores with pyrite-rich haloes; Cadia Hill has shallow bornite-rich zone
Depth of Ore Formation: Unknown
Post-Ore Deformation: Post-Silurian reverse faulting has locally dismembered parts of Cadia Hill deposit
Other Notable Features: Characteristic hematite dusting (red stain) of feldspar phenocrysts in propylitic alteration; signifi-cant sulfur isotope zoning
Important References: Blevin (2002), Holliday and others (2002), Newcrest Min-ing Staff (1998), Porter and Glen (2005), Washburn (2007), Wilson and others (2003), Wilson, Cooke, Harper, and Deyell (2007), Wilson, Cooke, Stein, and others (2007).
Name: El Salvador, Chile
Location: 26.25°S., 69.55°W.
Grade/Tonnage: Singer and others (2008): 3,836.3 Mt, 0.447 percent Cu, 0.1 g/t Au, 0.022 percent Mo, 1.5 g/t Ag
Associated Deposits: Potrerillos (porphyry), Damiana (exotic), Quebrada Turquesa (exotic), Exotica Alicia (exotic)
Regional Geologic Setting: Subduction-related, continental magmatic arc
Regional Tectonic Setting: Eocene sinistral transpressive deformation superimposed on earlier contractional faults
Significant structural control on magma emplacement and mineralization (Y/N): Not obvious with this deposit, although other porphyry deposits in the locale are controlled by NE and NW faults subparallel to the orogen.
Primary Host Rocks: Paleocene and early Eocene volcanic rocks
Primary Associated Igneous Rocks: High-potassium calc-alkaline with high Fe2O3/FeO; four phases of granodiorite porphyry, I-type
Inferred Mineralizing Intrusions: “X” porphyry is a weakly porphyritic fine-grained granodiorite. The “K” feldspar porphyry has abundant plagioclase and mafic phenocrysts and intrudes the “X” porphyry. The “L” feldspar porphyry is younger than most of the mineralization and intrudes the before-mentioned porphyries.
Age of Mineralization: Mineralized porphyries intruded from 42 to 41 Ma; about 42 Ma (Re-Os on molybdenite). Supergene enrichment 36–23 Ma (K-Ar on supergene alunite)
Major Alteration Types: Propylitic, advanced argillic, potas-sic (potassium feldspar and biotite), muscovite-andalusite zone, muscovite zone, sericitic
Alteration Zoning: Central potassic with peripheral propyl-itic formed early. Later andalusite with potassium feldspar or muscovite surrounds the central porphyry. Latest argillic is associated with pebble dikes around the central porphyry.
Major Ore Minerals and Assemblages: Chalcopyrite-bornite, chalcopyrite-pyrite, pyrite-bornite-chalcopyrite, pyrite-bornite-digenite, supergene chalcocite-covellite
Major Vein Types and Relative Ages: Early to late: “A” veins: granular quartz-potassium feldspar-anhydrite-sulfide with disseminated chalcopyrite-bornite.
“B” veins: quartz-anhydrite-sulfide with molybdenite-chalco-pyrite. Coarse-grained quartz.
“C” veins: abundant sulfide with sericite, biotite, anhydrite and minor quartz.
“D” veins: sulfide-anhydrite with minor quartz. Predominant pyrite with chalcopyrite, bornite, enargite, tennantite, sphaler-ite and galena.
Major Style(s) of Mineralization: Supergene enrichment, exotic, minor veining
Appendix 2. Characteristics of Representative Porphyry Copper Deposits 163
Metal Zoning: Central bornite-chalcopyrite surrounded by pyrite-chalcopyrite to a pyrite fringe. Increasing Cu/Fe inward and decreasing S/Cu+Fe downward.
Depth of Ore Formation: About 2 km
Post-Ore Deformation: Minor southerly tilting
Other Notable Features: Rich supergene ore (340 Mt, 1.5 percent Cu)
Important References: Gustafson and Hunt (1975), Gustafson and Quiroga (1995), Gustafson and others (2001), Mote and others (2001), Wata-nabe and Hedenquist (2001), Sillitoe and Perelló (2005).
Name: El Teniente, Chile
Location: 34.09°S., 70.34°W.
Grade/Tonnage: CODELCO 2007 annual report: 20,031 Mt at 0.56 percent Cu (0.2 percent Cu cutoff grade), 0.02 percent Mo
Singer and others (2008): 20,731 Mt, 0.62 percent Cu, 0.005 g/t Au, 0.019 percent Mo, 0.52 g/t Ag
Associated Deposits: Los Pelambres (megabreccia/porphyry), Rio Blanco-Los Bronces (megabreccia/porphyry)
Regional Geologic Setting: Andean Cordillera of central Chile, subduction-related
Regional Tectonic Setting: Contractional deformation
Significant structural control on magma emplacement and mineralization (Y/N): Yes, the Codegua fault and the north-east strike-slip Teniente fault zone. Also, localized stresses from emplacement of a large pluton caused concentric and radial vein orientations.
Primary Host Rocks: Mid-late Miocene Farellones Forma-tion; principally andesites and dacite intrusions
Primary Associated Igneous Rocks: I-type, calc-alkaline dacites and other felsic to intermediate intrusions. No consis-tent trend toward more mafic or felsic compositions with time.
Inferred Mineralizing Intrusions: Dacite pipes and dacite porphyry dike, latite; or a large mafic magma chamber at greater depth responsible for the mineralization
Age of Mineralization: dacite and latite intrusions 5.7–4.8 Ma (U-Pb); molybdenite mineralization 5.89–4.7 Ma (Re-Os); late hydrothermal mineralization continued until 4.37±0.05 Ma (Ar-Ar and K-Ar)
Major Alteration Types: Potassic (biotite), propylitic, sericitic
Alteration Zoning: Central potassic, transitional potassic-propylitic, peripheral propylitic; sericitic overprints the transi-tional zone; sericitic locally overprints potassic
Major Ore Minerals and Assemblages: Bornite, chalcopy-rite, molybdenite, pyrite, chalcocite
Major Vein Types and Relative Ages: “Type 1” veins are premineralization and composed of magnetite + quartz + anhydrite + actinolite + plagioclase or quartz veins with vari-able tourmaline, sericite, chlorite.
“Type 2” veins are late magmatic stage and are typically quartz + anhydrite + sulfide, but many vein subtypes with vari-able composition occur at this stage.
“Type 3” veins are of the principal hydrothermal phase and are composed of quartz, anhydrite and sulfide.
“Type 4” veins are late hydrothermal phase and are commonly carbonate with various gangue and sulfide minerals.
Major Style(s) of Mineralization: Vein, stockwork, super-gene enrichment, breccia
Metal Zoning: A barren core surrounded by concentric zoning of bornite greater than chalcopyrite greater than pyrite
Depth of Ore Formation: The current depth to which copper mineralization extends to is still unknown.
Post-Ore Deformation:
Other Notable Features: This is the world’s largest known Cu-Mo deposit. Skewes and others (2005) classify this deposit as a megabreccia copper deposit and stipulate that the breccia-tion, mineralization, and felsic porphyry emplacement were all generated and caused by a large mafic laccolith at greater depth.
Important References: Lindgren and Bastin (1922), Howell and Molloy (1960), Skewes and others (2002, 2005), Cannell and others (2005), Sillitoe and Perelló (2005), Stern and Skewes (2005), Skewes and Stern (2007), CODELCO (2007).
Name: Far Southeast, Philippines
Location: 16.86°N., 120.78°E.
Grade/Tonnage: Singer and others (2008): 650 Mt at 0.65 percent Cu, 1.33 g/t Au and 0.93 g/t Ag
Associated Deposits: Lepanto (high sulfidation epithermal Au-Ag), Bulalacuao (porphyry), Guinaoang (porphyry), Santo Tomas II (porphyry), Santo Niño (porphyry), Lobo-Boneng (porphyry), Victoria (intermediate sulfidation epithermal Au-Ag)
Regional Geologic Setting: Island-arc setting
Regional Tectonic Setting: Luzon Central Cordillera is affected by major left-lateral transcurrent faulting.
Significant structural control on magma emplacement and mineralization (Y/N): Yes, quartz diorite porphyry and Pliocene-Pleistocene volcanic rocks are localized by the
164 Porphyry Copper Deposit Model
NW-striking Lepanto fault which is a splay of the Abra River fault that is part of the Philippine fault system.
Primary Host Rocks: Late Cretaceous to middle Miocene metavolcanic and volcaniclastic rocks, Miocene tonalite intru-sion, Pliocene Imbanguila hornblende dacite
Primary Associated Igneous Rocks: Pliocene-Pleistocene calc-alkaline intermediate composition volcanic rocks and intrusions
Inferred Mineralizing Intrusions: NW-elongated quartz diorite porphyry dikes and irregular intrusions
Age of Mineralization: Age of alteration minerals range from 1.45 to 1.22 Ma, suggesting 300 kyr of hydrothermal activity: biotite 1.45±0.04 Ma (K-Ar); illite 1.22±0.06 Ma (K-Ar)
potassic alteration 1.41±0.05 Ma (average of 6 biotite K-Ar ages); quartz-alunite alteration 1.42 ±0.08 (average of 5 K-Ar ages)
Major Alteration Types: Potassic (biotite-magnetite±potassium feldspar), sericite-clay-chlorite-hematite (SCC), sericitic, advanced argillic (pyrophyllite and quartz-alunite), propylitic (epidote-calcite-chlorite)
Alteration Zoning: Potassic core overprinted by sericite-clay-chlorite (SCC), grading outward and upward sericitic±pyrophyllite, to pyrophyllite-quartz-anhydrite-kaolinite/dickite, and uppermost quartz-alunite±anhydrite-dickite-diaspore-pyrophyllite that formed over top of porphyry system; potassic, SCC, and pyrophyllite alteration fringed by propylitic alteration
Major Ore Minerals and Assemblages: Early: bornite, chal-copyrite, native Au, pyrite; later: pyrite-hematite-chalcopyrite
Breccia pipe: chalcopyrite-gold-molybdenite
Major Vein Types and Relative Ages: Early anhedral vitre-ous quartz and quartz-anhydrite veins associated with potassic alteration; intermediate age euhedral quartz veins containing anhydrite-white mica-hematite-pyrite-chalcopyrite-bornite with sericite/illite envelopes; later euhedral quartz veins ±anhydrite-dickite-diaspore-pyrophyllite precipitated in dilat-ant fractures and reopened veins
Major Style(s) of Mineralization: Breccia, stockwork and sheeted vein
Metal Zoning: Concentric Cu-Au zoning around quartz dio-rite porphyry dikes and irregular intrusions
Depth of Ore Formation: ≥1.5 km
Post-Ore Deformation: Later faulting on the Lepanto fault
Other Notable Features: Porphyry copper mineralization temporally and spatially associated with the Lepanto high sulfidation epithermal Au-Ag deposit, suggesting a genetic relationship between the two different deposits
Important References: Arribas and others (1995), Hedenquist and others (1998), Imai (2000), Claveria (2001), Sajona and others (2002).
Name: Grasberg, Indonesia
Location: 3.82°S., 137.23°E.
Grade/Tonnage: van Leeuwen (1994) 4,000 Mt at 0.6 percent Cu, 0.64 g/t Au; minable: 675 Mt at 1.45 percent Cu, 1.87 g/t Au
Singer and others (2008): 4,000 Mt at 0.6 percent Cu, 0.64 g/t Au, 2 g/t Ag
Associated Deposits: Ertsberg and Ertsberg East (Cu-Au skarn), Dom (Cu-Au skarn), Big Gossan (Cu-Au skarn), Wanagon (epithermal), West Grasberg (epithermal)
Regional Geologic Setting: Postsubduction magmatic arc overlying continental crust
Regional Tectonic Setting: Magmatic arc emplaced into foreland fold and thrust belt (Papuan Fold Belt) formed dur-ing Miocene collision and subduction of Australian continent beneath Melanesian island arc complex. Pliocene-Pleistocene transpressional tectonic environment followed cessation of subduction and facilitated formation of dilational zones around intersections of frontal thrust faults and orogen-transverse faults thereby allowing emplacement of postsubduction mantle-derived magmas. Rapid uplift and exhumation of fold and thrust belt immediately prior to mineralization.
Significant structural control on magma emplacement and mineralization (Y/N): Yes, intrusive contacts and intersec-tions of faults, especially with the strike-slip Meren Valley fault and the Ertsberg #1 fault.
Primary Host Rocks: Pliocene Grasberg Igneous Complex emplaced into Cretaceous and Tertiary siliciclastic and carbon-ate rocks
Primary Associated Igneous Rocks: High-potassium calc-alkaline to K-alkaline (shoshonitic) Grasberg Igneous Com-plex (quartz diorite to quartz monzonite)
Inferred Mineralizing Intrusions: Dalam diatreme, Main Grasberg stock, South Kali dikes
Age of Mineralization: Intrusive rocks: 3.06±0.03 Ma (biotite Ar-Ar); hydrothermal biotite: 3.33 ±0.12 to 3.01 ±0.06 Ma (Ar-Ar); molybdenite veins: 2.88 ± 0.01 Ma (molybdenite Re-Os)
Major Alteration Types: Early potassic (potassium feld-spar, biotite, and magnetite stages), sericitic, sericitic-argillic (muscovite-illite-kaolinite; “white clay-illite”), advanced argil-lic (andalusite), insignificant propylitic occurs in igneous rocks
Appendix 2. Characteristics of Representative Porphyry Copper Deposits 165
Alteration Zoning: Interior potassic grading outward into sericitic (heavy sulfide) along margins of intrusive complex. Sericitic-argillic developed mostly along steeply dipping struc-tures. Advanced argillic is locally developed at deep levels within the sericitic-argillic alteration.
Major Ore Minerals and Assemblages: Chalcopyrite-bornite±native gold; bornite-chalcopyrite-pyrite; mixed copper sulfide consisting of chalcopyrite-bornite-nuku-ndamite-digenite-covellite-pyrite; covellite-enargite-pyrite; covellite-pyrite/marcasite-chalcopyrite
Major Vein Types and Relative Ages: (Early to late): prem-ineralization ptygmatic quartz and quartz-magnetite-potassium feldspar; granular quartz-anhydrite with potassium feldspar-biotite-amphibole-bornite-chalcopyrite-pyrite; molybdenite; chalcopyrite-bornite±native gold-hematite-minor quartz (Gras-berg Cu-Au veins); quartz-sericite; massive pyrite with quartz veins (heavy sulfide); vuggy quartz-anhydrite(?); quartz-car-bonate; covellite-pyrite/marcasite-sericite-chalcopyrite; sulfur; sphalerite-galena
Major Style(s) of Mineralization: Stockwork, disseminated; lacks significant supergene
Metal Zoning: Central core of Cu-Au ringed by Cu; deep Mo
Depth of Ore Formation: About 2 to more than 3.5 km
Post-Ore Deformation: Rapid uplift of the Papuan Fold Belt
Other Notable Features: Three separate mineralizing phases occurred: (1) Grasberg Cu-Au; (2) heavy sulfide (mostly pyrite with minor chalcopyrite); (3) mixed copper sulfide (high-sulfidation Cu)
Important References: MacDonald and Arnold (1994), Van Leeuwen (1994), Paterson and Cloos (2005a, 2005b), Pollard and Taylor (2002), Pollard and others (2005), Cloos and Housh (2008).
Name: La Escondida, Chile
Location: 24.27°S., 69.07°W.
Grade/Tonnage: Singer and others (2008): 11,158 Mt at 0.77 percent Cu, 0.25 g/t Au, 0.0062 percent Mo, 5 g/t Ag
Associated Deposits: Zaldivar (porphyry), Escondida Norte (porphyry)
Regional Geologic Setting: Subduction-related continental magmatic arc
Regional Tectonic Setting: Mesozoic extension, Late Creta-ceous compression, Eocene to Miocene transcurrent tectonics
Significant structural control on magma emplacement and mineralization (Y/N): Yes, transtensional pull-apart structures at the intersection of the Archibarca lineament (NW trending) and the West Fissure zone (N-S strike-slip fault)
Primary Host Rocks: Eocene Escondida stock and Paleocene to early Eocene andesite
Primary Associated Igneous Rocks: quartz monzonitic to granodiorite (4 phases of the Escondida stock):
1st: Colorado Grande intrusion
2d: Escondida intrusion
3d: a porphyry-breccia
4th: narrow granodioritic dikes
Later rhyolite porphyry
Inferred Mineralizing Intrusions: Escondida stock
Age of Mineralization: Colorado Grande intrusion 37.9±1.1 Ma (U-Pb zircon), Escondida intrusion 37.7±0.8 Ma; rhyolite porphyry 35.7±0.3 – 35.2±0.3 Ma (Ar-Ar alunite; postdates first two hydrothermal/veins/alteration events)
Stage 1 biotite about 36 Ma (Ar-Ar)
Stage 3 molybdenite 33.7±0.3 Ma (Re-Os)
Supergene blanket formation 18 – 14.6 Ma (K-Ar on super-gene alunites)
Major Alteration Types: potassic (mainly potassium feldspar with phlogopite in the Mg-rich volcanic rocks)
Alteration Zoning:
Stage 1: Potassic (potassium feldspar in porphyry, biotite in surrounding andesite) out to broad propylitic zone
Stage 2: Sericitic with quartz-sericite in core and chlorite-sericite±quartz in surrounding andesite
Stage 3: Advanced argillic
Major Ore Minerals and Assemblages: Chalcopyrite, pyrite, bornite, chalcocite, molybdenite, covellite, digenite
Magnetite-bornite-chalcopyrite, pyrite-chalcopyrite, bornite-chalcopyrite-pyrite, pyrite-molybdenite
Major Vein Types and Relative Ages:
Stage 1 veins: barren quartz veins, quartz with bornite-chalcopyrite, quartz-orthoclase±biotite±anhydrite
Stage 2 veins: thin sulfide veins, pyrite±chalcopyrite veins, quartz sulfide
Stage 3 veins: banded veins starting with quartz and followed by bornite-chalcopyrite, pyrite-chalcopyrite, chalcopyrite-covellite-chalcocite, enargite, pyrite, sphalerite-chalcopyrite-tennantite, galena, and alunite
Major Style(s) of Mineralization: Supergene, disseminated, vein
Metal Zoning:
166 Porphyry Copper Deposit Model
Depth of Ore Formation:
Post-Ore Deformation: Unmineralized (post-ore) intrusion of quartz-monzonite dikes at 31.5±2.8 Ma (K-Ar on sericite) and 31.0±2.8 Ma (whole rock).
Uplift and erosion, sinistral movement on the West Fissure zone
Other Notable Features:
Important References: Alpers and Brimhall (1989), Padilla Garza, and others (2001), Richards and others (2001), Porter (2005).
Name: Morenci, Arizona
Location: 33.10°N., 109.36°W.
Grade/Tonnage: Singer and others (2008): (Morenci-Metcalf) 6,470 Mt at 0.524 percent Cu, 0.028 g/t Au, 0.0095 percent Mo, 1.6 g/t Ag
Associated Deposits: Metcalf (porphyry), Modoc skarn
Regional Geologic Setting: Laramide feature
Regional Tectonic Setting: Located in the transitional zone between the stable Colorado Plateau and the extensional Basin and Range province.
Significant structural control on magma emplacement and mineralization (Y/N): Yes, NE-trending fissures
Primary Host Rocks: Mainly quartz monzonite porphyry; also weakly mineralized granite porphyry, Precambrian gran-ite, diabase dikes, and extends into surrounding sedimentary rocks about 500 meters.
Primary Associated Igneous Rocks: Monzonite porphyry, granite porphyry
Inferred Mineralizing Intrusions: Quartz monzonite-granite porphyry
Age of Mineralization: 55.8±0.9 Ma (Re-Os on molyb-denite); mineralizing intrusion 57.4±1.7 Ma (unspecified method); hypogene chalcopyrite mineralization at 56–55 Ma.
Major Alteration Types: Potassic (quartz-potassium feldspar-biotite±sericite±siderite), sericitic (quartz-sericite), propylitic, argillic
Alteration Zoning: Central potassic surrounded by sericitic surrounded by propylitic. Supergene argillic overprints the upper sericitic and potassic.
Major Ore Minerals and Assemblages: Chrysocolla, pyrite, chalcopyrite, molybdenite, sphalerite, galena, gold, silver, chalcocite±covellite in supergene ore
Major Vein Types and Relative Ages: Oldest to young-est: potassium feldspar+quartz, quartz+molybdenite, quartz+pyrite±chalcopyrite, quartz+chalcopyrite±pyrite
Major Style(s) of Mineralization: Stockwork veins and frac-tures, supergene, disseminated
Metal Zoning: Gold and silver are more abundant in less altered areas away from high-temperature molybdenite-chalcopyrite mineralization. Chalcopyrite-rich core is sur-rounded by pyrite envelope which is surrounded by protore.
Depth of Ore Formation: Unknown
Post-Ore Deformation: Predominantly NW-striking normal faulting
Other Notable Features: Acidophilic iron-oxidizing bacteria contributed to leaching of copper, and this bacteria is common in acidic environments.
This deposit is one of the largest supergene porphyry copper deposits in the world.
Important References: Moolick and Durek (1966), Langton (1973), McCandless and Ruiz (1993), Holick and Wood (1999), Enders (2000), Melchi-orre and Enders (2003), Enders and others (2006).
Name: Mount Polley, British Columbia, Canada
Location: 52.55°N., 121.64°W.
Grade/Tonnage: (1995) 293 Mt at 0.23 percent Cu and 0.30 g/t Au at 0.20 percent Cu equivalent cutoff
Singer and others (2008): 293 Mt at 0.23 percent Cu, 0.3 g/t Au, 0.001 percent Mo, 4 g/t Ag
Associated Deposits: Rayfield River (porphyry), Afton (porphyry), Ajax (porphyry), Crescent (porphyry), Pothook (porphyry), Big Onion (porphyry)
Regional Geologic Setting: Located within the Quesnellia terrane, which is an intraoceanic island arc-terrane
Regional Tectonic Setting: Intermontane
Significant structural control on magma emplacement and mineralization (Y/N): Likely, as the intrusive units are elon-gate along the NNW-trending normal Polley fault.
Primary Host Rocks: Diorite intrusion, plagioclase porphyry
Primary Associated Igneous Rocks: Oldest to youngest: dio-rite (about 49 weight percent SiO2, higher total Fe, MnO, MgO and P2O5), plagioclase porphyry (about 59 weight percent SiO2, low total Fe, MnO, MgO and P2O5), postmineral porphy-ritic augite monzodiorite (about 48-49 weight percent SiO2, higher total Fe, MnO, MgO and P2O5), postmineral potassium feldspar phyric monzonite (about 59 weight percent SiO2, low total Fe, MnO, MgO and P2O5), postmineral dikes of augite porphyry (about 48 weight percent SiO2, higher total Fe, MnO, MgO and P2O5) and biotite lamprophyre. All are alkaline.
Inferred Mineralizing Intrusions: Plagioclase porphyry, monzonite
Appendix 2. Characteristics of Representative Porphyry Copper Deposits 167
Age of Mineralization: Diorite host 201.6±0.5 Ma (unspeci-fied method)
Hydrothermal biotite 184±7 Ma (K-Ar)
Major Alteration Types: Potassic (with a biotite zone, actino-lite zone and potassium feldspar-albite zone), garnet-epidote-albite-potassium feldspar, garnet-epidote-pyrite-albite-calcite, propylitic (albite-epidote-pyrite-calcite-magnetite)
Alteration Zoning: Potassic and sodic core, intermediate calc-potassic (garnet) alteration, surrounded by extensive propylitic alteration
Major Ore Minerals and Assemblages: Chalcopyrite, pyrite, bornite
Major Vein Types and Relative Ages: Oldest to youngest: actinolite-diopside-chalcopyrite-magnetite, magnetite-chalco-pyrite-trace diopside-trace pyrite, magnetite-bornite-chalcopy-rite, epidote-calcite-pyrite, albite, quartz, calcite-zeolite
Major Style(s) of Mineralization: Mostly vein and dissemi-nated within hydrothermal breccia
Metal Zoning: Relatively constant Cu:Au ratio, but higher concentrations in the core grading to lower grade margins. Mineralogy zones outward to increasing pyrite-dominated.
Depth of Ore Formation: Unknown, but shallow inferred from abundant brecciation
Post-Ore Deformation: Faulting and synclinal folding; accre-tion of host terrane to North America
Other Notable Features: Similar to other alkaline porphyry systems, argillic and sericitic alteration are absent.
Deposit formed within Quesnellia exotic terrane and was later accreted to North America
Important References: Hodson and others (1976), Fraser and others (1993, 1995), Cassidy and others (1994), Lang and others (1995), McMillan and others (1995), McMillan and Panteleyev (1995).
Name: Oyu Tolgoi, Mongolia
Location: 43.00°N., 106.87°E.
Grade/Tonnage: Ivanhoe Mines (2010): Measures + indicated resources: 1,387 Mt at 1.33 percent Cu and 0.47 g/t Au
Inferred resources: 2,367 Mt at 0.78 percent Cu and 0.33 g/t Au
Singer and others (2008): 3,107.1 Mt at 0.676 percent Cu, 0.24 g/t Au
Associated Deposits: Hugo Dummett (porphyry)
Regional Geologic Setting: Paleozoic island-arc setting
Regional Tectonic Setting: Regional compression and uplift
Significant structural control on magma emplacement and mineralization (Y/N): Likely, several major faults and linea-ments traverse the area, although the local structure is poorly constrained. Sheeted NW-trending veinlets are also noted with their orientation likely structurally caused.
Primary Host Rocks: Augite basalt flow, dacitic ash-flow tuffs, dacitic block-ash tuff, quartz monzodiorite
Primary Associated Igneous Rocks: Late Devonian quartz monzodiorite intrusions, postmineral basalt to rhyolite, syenite dikes
Inferred Mineralizing Intrusions: Multiple quartz monzo-diorite intrusions; high-potassium calc-alkaline, I-type
Age of Mineralization: Dacitic ash-flow tuff 365±4 Ma (U-Pb zircon); synmineral quartz monzodiorite 378±3 Ma, 371±3 Ma, 362±2 Ma (U-Pb zircon from the SW Oyu Tolgoi)
Molybdenite 372±1.2 and 373±1.3 Ma (Re-Os)
Supergene enrichment 117–93 Ma (K-Ar on supergene alunite)
Major Alteration Types: Extensive argillic, early potassic (biotite with potassium feldspar in groundmass), possible earlier sodic based on augite altered to actinolite, propylitic (epidote-chlorite-illite-pyrite), magnetite alteration, musco-vite alteration, albite alteration, chlorite alteration, carbonate alteration (siderite, vein calcite, vug-filling dolomite)
Alteration Zoning: Potassic zoned outward to propylitic
Major Ore Minerals and Assemblages: Chalcopyrite and bornite are the dominant copper minerals, gold, chalcocite; pyrite-covellite, bornite-chalcopyrite
Major Vein Types and Relative Ages: Early dismembered magnetite veins, high temperature quartz veins that underwent ductile deformation; dickite veins within the argillic zone
Major Style(s) of Mineralization: Disseminated, stockwork and sheeted veins, breccia, supergene
Metal Zoning: Bornite core outwards to chalcopyrite; upward to pyrite±enargite and covellite at shallower depth
Depth of Ore Formation: Unknown
Post-Ore Deformation: Semiductile deformation of sulfides; Late Paleozoic rifting
Other Notable Features: This system contains five individual deposits (South, Southwest, and Central Oyu Tolgoi and North and South Hugo Dummett) with the majority of the resource found within the Hugo Dummett deposits.
Important References: Perelló and others (2001), Khashgerel and others (2006, 2008), Ivanhoe Mines Ltd. (2010).
168 Porphyry Copper Deposit Model
Name: Valley Copper, British Columbia, Canada
Name: Valley Copper, British Columbia, Canada
Location: 50.49°N., 121.05°W.
Grade/Tonnage: (2002) 833.5 Mt at 0.432 percent Cu and 0.0067 percent Mo at 0.25 percent Cu cutoff grade
Singer and others (2008): 833.5 Mt at 0.432 percent Cu, 0.006 g/t Au, 0.0067 percent Mo, 1.9 g/t Ag
Associated Deposits: Bethlehem (porphyry), JA (porphyry), Highmont (porphyry), Lornex (porphyry)
Regional Geologic Setting: Deposit formed in an island-arc setting prior to accretion with North America
Regional Tectonic Setting: Located in the Quesnellia island-arc terrane was later accreted to North America.
Significant structural control on magma emplacement and mineralization (Y/N): Yes, N- and NW-striking faults.
Primary Host Rocks: Calc-alkaline porphyritic granodiorites and quartz monzonite (Guichon Creek batholith-Bethsaida phase), porphyries
Primary Associated Igneous Rocks: Calc-alkaline granodiorite
Inferred Mineralizing Intrusions:
Age of Mineralization: Guichon Creek batholith 210±3 Ma (U-Pb zircon), 205±10 Ma (Rb-Sr), 202±8 Ma (K-Ar)
Mineralization formed 202–192 Ma
Hydrothermal sericite 198±4 to 186±8 Ma (K-Ar)
Major Alteration Types: propylitic, potassic (potassium feldspar), silicic, sericitic: quartz, sericite, potassium feldspar, kaolinite, chlorite, epidote, limonite, malachite
Alteration Zoning: Potassic enveloped laterally and upwardly by sericitic surrounded by propylitic. Argillic is present with sericitic and potassic.
Early potassic in core with weak peripheral propylitic. Ser-icitic and argillic then overprint and dominate the intermediate region. Silicic cuts into all other zones as a “re-entrant”.
Major Ore Minerals and Assemblages: Bornite, chalcopy-rite, molybdenite, pyrite; molybdenite-chalcopyrite
Major Vein Types and Relative Ages: Quartz veinlets with alteration envelopes (associated with mineralization) and quartz veinlets without alteration envelope. Postmineral gyp-sum, anhydrite, kaolinite and fluorite veinlets.
Major Style(s) of Mineralization: Mostly in fractures, veins, faults or breccia bodies
Metal Zoning: A relatively barren core is surrounded by areas with the highest copper concentration. Surrounding this is a region of highest molybdenum and highest zinc surrounds that.
Depth of Ore Formation:
Post-Ore Deformation: Collision of the host terrane with North America; faulting
Other Notable Features:
Important References: Ostapenko and Jones (1976), McMillan and others (1995), McMillan (2005), MINFILE (2008).
Name: Yerington Mine and Ann-Mason Pass, Nevada, United States
Location: 38.98°N., 119.2°W.
Grade/Tonnage: Ann-Mason Pass (1982 resource): 495 Mt at 0.4 percent Cu, 0.01 percent Mo
Yerington Mine (past production): 162 Mt at 0.55 percent Cu
Associated Deposits: Casting Copper (skarn), Douglas Hill (skarn), Bluestone (skarn), Mason Valley (skarn), McConnel Mine (skarn), MacArthur (porphyry), Bear-Lagomarsino (por-phyry), Buckskin Mine (Au-Cu veins), Ludwig Mine (carbon-ate replacement/skarn)
Regional Geologic Setting: Andean-type magmatic arc setting
Regional Tectonic Setting:
Significant structural control on magma emplacement and mineralization (Y/N): No
Primary Host Rocks: Yerington batholith
Primary Associated Igneous Rocks: Yerington batho-lith (three phases oldest to youngest: McLeod Hill quartz monzodiorite, Bear quartz monzonite, Luhr Hill Granite). 55-69 weight percent SiO2, high-potassium, rocks sit at bound-ary between alkali-calcic and calc-alkaline
Inferred Mineralizing Intrusions: Granite porphyry dikes within the cogenetic Luhr Hill Granite
Age of Mineralization: Mineralizing granite dikes 168.5±0.4 Ma (U-Pb zircon)
Appendix 2. Characteristics of Representative Porphyry Copper Deposits 169
Early quartz monzodiorite of the Yerington batholith 169.4±0.4 (U-Pb zircon)
Major Alteration Types: Pre-Main stage endoskarn (garnet, albite ± clinopyroxene); Main stage potassic (biotite ± potas-sium feldspar), sodic-calcic (actinolite, sodic plagioclase), pro-pylitic (actinolite, chlorite); late stage sericitic, sodic, chloritic
Alteration Zoning: Likely contemporaneous central potassic with deeper and lateral sodic-calcic with peripheral propylitic; albitic (albite-chlorite) and sericitic alteration overprint the earlier alteration with sericitic alteration increasing at shal-lower levels. Ann-Mason has late albite alteration strongly developed along pre-tilt western side of copper zone
Major Ore Minerals and Assemblages: chalcopyrite, born-ite, chalcocite, pyrite.
Pyrite-chalcopyrite, chalcopyrite, chalcopyrite-bornite assemblages.
Major Vein Types and Relative Ages: Common veins oldest to youngest in ore zone: quartz±potassium feldspar; chalco-pyrite ± pyrite or bornite ±quartz ± chlorite; epidote + quartz ± chlorite + chalcopyrite ± pyrite or bornite; pyrite ± quartz ± chalcopyrite ± tourmaline
Major Style(s) of Mineralization: Disseminated, vein, breccia
Metal Zoning: Yerington Mine: central magnetite-bornite ±chalcopyrite, or ±chalcocite/digenite. Outer chalcopyrite ±magnetite ±pyrite and outermost pyrite. For Ann-Mason Pass: Large central zone of chalcopyrite ±bornite, ±pyrite to outer pyrite, magnetite minor to absent. Highest copper grades associated with greatest potassic alteration.
Depth of Ore Formation: 2.5–4 km (Yerington mine); 2.7–4.7 (Ann-Mason Pass)
Post-Ore Deformation: Cenozoic east-dipping normal fault-ing and about 90° westward tilting
Other Notable Features: Late Cenozoic normal faulting has caused deep parts of the system to be exhumed and allows inspection of at least 8 km of vertical section in cross-section.
Important References: Proffett (1979), Proffett and Dilles (1984), Carten (1986), Dilles (1987), Dilles and Wright (1988), Dilles and Einaudi (1992), Dilles and others (1992), Dilles and Proffett (1995), Dilles, Einaudi, and others (2000), Dilles, Proffett, and Ein-audi (2000), Proffett (2009).
Publishing support provided by:Denver Publishing Service Center
For more information concerning this publication, contact:
Center Director, USGS Central Mineral and Environmental Resources Science CenterBox 25046, Mail Stop 973Denver, CO 80225(303) 236-1562
Or visit the Central Mineral and Environmental Resources Science Center Web site at: http://minerals.cr.usgs.gov/

Printed on recycled paper
John and others— Porphyry Copper D
eposit Model, Chapter B
of Mineral D
eposit Models for Resource A
ssessment—
Scientific Investigations Report 2010–5070–B