POPULATION - York, Maine
17
Population Chapter Comprehensive Plan Inventory & Analysis November 2, 2004 Planning Board of York, Maine Barrie Munro, Chair David Marshall, Vice Chair Glenn Farrell Glen McWilliams Richard Smith Tom Manzi, Alternate Lee Corbin, Alternate ENACTMENT BY THE LEGISLATIVE BODY Date of Town vote to enact this Chapter of the Comprehensive Plan: ______________. Certified by the Town Clerk: _________________________________ on ___________. (signature) (date)
Transcript of POPULATION - York, Maine

Population Chapter
Comprehensive Plan Inventory & Analysis
November 2, 2004
Planning Board of York, Maine Barrie Munro, Chair
David Marshall, Vice Chair Glenn Farrell
Glen McWilliams Richard Smith
Tom Manzi, Alternate Lee Corbin, Alternate
Date of Town vot
Certified by the T
ENACTMENT BY THE LEGISLATIVE BODY
e to enact this Chapter of the Comprehensive Plan: ______________.
own Clerk: _________________________________ on ___________. (signature) (date)
Comprehensive Plan – York, Maine
POPULATION This chapter is a portion of the Inventory and Analysis section of the York Comprehensive Plan. Its purpose is to provide information about the seasonal and year-round population of York because understanding of population information and trends is critical to understanding planning issues and establishing appropriate public policies. The text of this Chapter is organized into 3 sections: year-round population; seasonal population; and characteristics of the year-round population. Comprehensive Plans in Maine must comply with the legal requirements of state law, specifically Title 30-A §4326. The law establishes that land use policy must be based on information and analysis, and accordingly the law establishes that comprehensive plans must contain an Inventory and Analysis section. This Chapter is one part of the Inventory and Analysis section of the York Comprehensive Plan. This Chapter, and others being prepared at this time, marks a change in format for the Plan. The Inventory and Analysis section is being converted to a series of technical reports on individual subjects (population, housing, land use, natural resources, etc.). Each is complete as a stand-alone report on its specific subject, but taken as a set they comprise the complete Inventory and Analysis section. This new format should encourage the Town to keep the Plan up to date, and should increase public access to information contained in the Inventory and Analysis. During the transition from a single Inventory and Analysis section to a series of single-subject reports, some degree of overlap of content and information is expected. For purposes of interpretation, the most current document shall supersede any earlier version or chapter of the Inventory and Analysis section. When the entire set of Inventory and Analysis chapters is adopted, the 1999 Inventory and Analysis section of the York Comprehensive Plan can be repealed. Year-Round Population One of the predominant measures of the size of a community is its year-round population. It is important to understand the number of people in a community and the trends that have led to the current condition. 1. 2003 Population Estimate
The estimated 2004 year-round population of York is 13,500 people. This estimate is an update of the most recent census data based on new home construction. The calculations are presented in Appendix A. Based on this estimate, the average annual rate of population growth has been 1.23% since 2000. This is lower than the average annual rate of population growth of 2.73% experienced in York during the 1990s, and is consistent with the slower economy and imposition of the residential growth cap.
Population Chapter – Inventory and Analysis Page 1

Comprehensive Plan – York, Maine
The current population density is 0.37 people per acre, or 234 people per square mile. This is based on the current population estimate and the area of York at 36,922 acres or 57.7 square miles.
2. Population Trends
While the current population is important for understanding today’s demands and issues, it is also important to understand changes experienced in the community. The best population data available is the decennial U.S. Census of Population and Housing. This is a federally compiled census of all U.S. residents. Though its primary purpose is to ensure proper allocation of congressional districts, extensive data is collected for a multitude of other purposes. The population census (there are other censuses relating to the economy, agriculture, and other such matters) is conducted once every 10 years (1900, 1910, 1920…) on April 1st of that year. Unless otherwise indicated, the term “census” in this Chapter will refer to U.S. Census of Population and Housing in general, and to a specific year when so noted.
A. YORK
According to 2000 Census figures, York’s year-round population was 12,854. York is the 4th largest town in York County. York’s year-round population was 2,668 in 1900. The average annual population increase during this 100-year period was 1.58%. The year-round population of York was relatively stable until the 1950s, then it increased dramatically. Since 1950 the number of year-round residents has quadrupled.
Year-Round Population, York, Maine
0
2,000
4,000
6,000
8,000
10,000
12,000
14,000
1900 1910 1920 1930 1940 1950 1960 1970 1980 1990 2000
Year
Peop
le
B. COMPARISON WITH OTHER AREAS
Population Chapter – Inventory and Analysis Page 2
To set York’s situation in context, Town data is compared to neighboring communities, York County, and the State of Maine. Neighboring communities include Kittery, Eliot, South Berwick, Wells and Ogunquit.

Comprehensive Plan – York, Maine
While Wells does not currently border York, it did until Ogunquit seceded from Wells in the 1970s. For data provided prior to succession, Wells is the only Town listed. The term, “York Area” includes York and all the neighboring communities listed above.
Year-Round Population Source: U.S. Census of Population, 1900 through 2000
Year Yor
k
Kitt
ery
Elio
t
S. B
erw
ick
Ogu
nqui
t
Wel
ls
Yor
k A
rea
Cou
nty
Sta
te
1900 2,668 2,872 1,458 3,188 - 2,007 12,193 64,885 694,4661910 2,802 3,533 1,530 2,935 - 1,908 12,708 68,526 742,3711920 2,727 4,763 1,530 2,955 - 1,943 13,918 70,696 768,0141930 2,532 4,400 1,462 2,650 - 2,047 13,091 72,934 797,4231940 3,283 5,374 1,932 2,546 - 2,144 15,279 82,550 847,2261950 3,256 8,380 2,509 2,646 - 2,321 19,112 93,541 913,7741960 4,663 10,689 3,133 3,112 - 3,528 25,125 99,402 969,2651970 5,690 11,028 3,497 3,488 - 4,448 28,151 111,576 992,0481980 8,465 9,314 4,948 4,046 1,492 6,719 34,984 139,666 1,124,6601990 9,818 9,372 5,329 5,877 974 7,778 39,148 164,587 1,227,9282000 12,854 9,543 5,954 6,671 1,226 9,400 45,648 186,742 1,274,923
Through the 20th Century, York County and the State of Maine experienced population growth in every decade. The York Area grew in 9 of the 10 decades, declining only in ‘20s. Each of the York Area communities grew in at least 7 of the decades. York’s most recent decade with a decline in population was the 1940s. Only Kittery and Ogunquit experienced any decades of decline in the second half of the Century. From 1900 to 2000, York grew by 382%. This is higher than the York Area (274%), York County (188%), and Maine (84%). Among York Area towns, only Wells/Ogunquit had a higher percentage change (429%). York grew at 1.5 times the York Area rate, 2 times the York County rate, and 4.5 times the State rate. Regarding rates of population growth, the Town of York has experienced higher rates of growth than most communities, particularly since 1950. Since 1950, the rate of growth in York was greater than the York Area and State in all 5 decades, and was greater than York County in 4 out of 5 decades. The County experienced a higher rate of growth in the 1980s.
Population Chapter – Inventory and Analysis Page 3
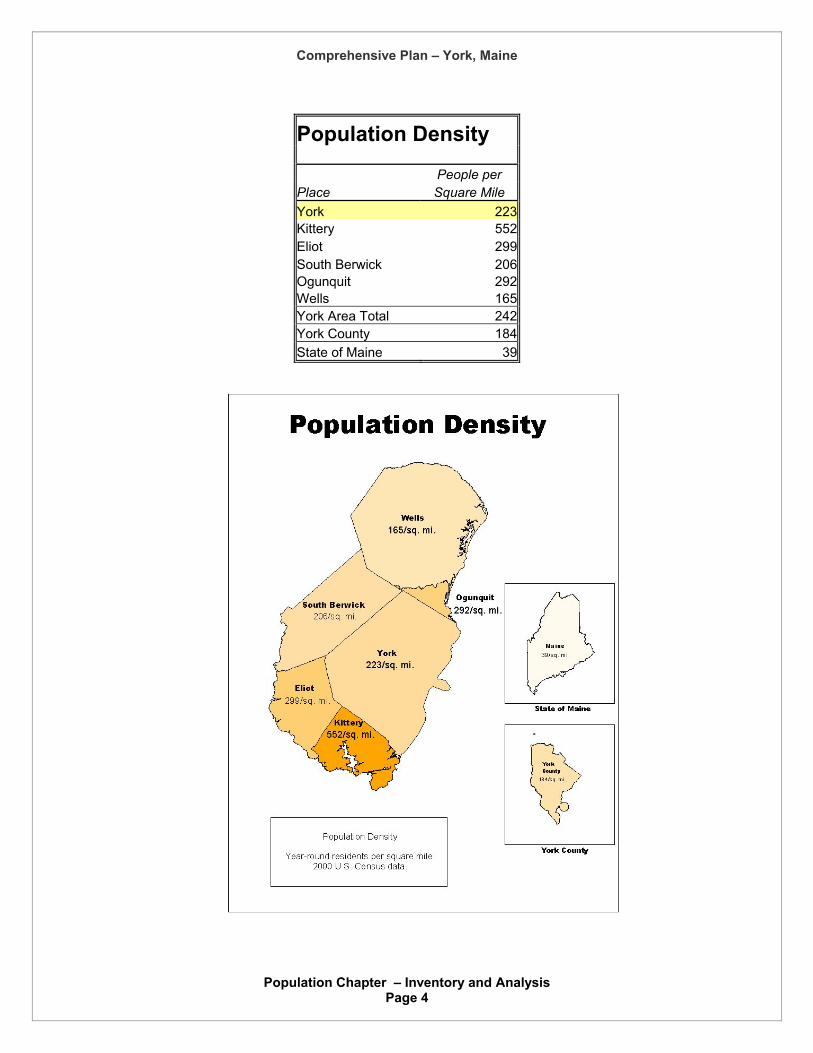
Population density in York is higher than the population densities of South Berwick, Wells, York County and the State. Density is lower, however,
Comprehensive Plan – York, Maine
Population Density People per Place Square Mile York 223Kittery 552Eliot 299South Berwick 206Ogunquit 292Wells 165York Area Total 242York County 184State of Maine 39
Population Chapter – Inventory and Analysis Page 4

Comprehensive Plan – York, Maine
than those in Kittery, Eliot, Ogunquit, and the York Area. The population density table and map clearly demonstrate the relatively high population densities in the southern counties in general, and within this area in particular. Another geographic level that could be useful is the Portsmouth-Dover-Rochester NH-ME Metropolitan Statistical Area (MSA), which is the urban center closest to York. This is a Census-created geography, established to identify larger cities and their area of influence. York is a part of this MSA, which centers on the 4 cities of Portsmouth, Dover, Somersworth and Rochester, New Hampshire. The boundary for this MSA area has changed since the 1990 Census, so analysis of change through time would be time-consuming and is beyond the scope of a community plan. It is interesting to note that York is within the northern border of Boston’s Consolidated Metropolitan Statistical Area (CMSA). The CMSA is the grouping of metropolitan areas that surrounds a large central city. The fact that York is within Boston’s CMSA indicates that York is susceptible to outside influences from as far away as Boston. The following map (from the Census Bureau’s web site) shows the extensive urban area south of York, and the smaller urban area around Portland to the north. With continued growth in the northeast, development pressures in York and neighboring towns will come from both the north and south as the area between the two urban areas gets filled in. In the foreseeable future, the gap between the Boston CMSA and the Portland MSA will close, and Megalopolis will extend through this area all the way to Portland.
Population Chapter – Inventory and Analysis Page 5

Comprehensive Plan – York, Maine
Seasonal Population in York Year-round population is only part of the story. Being an ocean-front community, York’s population swells during the summer. The overnight and daytime populations change radically from those of the off season. 1. Peak-Season Overnight Population
The peak-season overnight population is the number of people staying overnight in York during the summer. The estimated 2004 peak-season overnight population in York is 26,300 people. The calculation of this figure is presented in Appendix B .In addition to year-round residents, it includes seasonal residents staying in vacation homes and trailer parks, and people staying overnight in transient accommodations (hotels, motels, bed-and-breakfasts, and campgrounds). The size of this population impacts demands on municipal services such as emergency services, water supply, sewage treatment, and so forth, and significantly impacts community character. It is interesting to note that these calculations validate conventional wisdom, that the summertime overnight population is double that of the year-round population.
2. Peak-Season Daytime Population The peak-season daytime population is the number of people in York during a busy summer day. This is certainly a large number for York, being a tourist destination. The size of this population directly impacts demands on municipal facilities and services such as emergency services, beach services, public parking, road capacity, and so forth. Conventional wisdom is that summer daytime population is triple the year-round population, which would be about 40,000 people. It is reported that former Police Chief Bill Foster estimated a summer peak of 65,000 people in the late 1990s, but there is no written record of this estimate. To estimate peak daytime population, the estimate will need to consider: year-round and seasonal residents; transient overnight guests; day-trippers; out-of-town workers; travelers passing through, not stopping; and perhaps others, too. It will be a very difficult task. How many of York’s residents are in York on a busy summer weekend? How many people are on the road, stuck in the lines of traffic? How many day-trippers come to York? These and many other issues must be addressed. Because of the complexity of calculation and time it would take to accurately estimate the peak-season daytime population, the number is not estimated.
Population Characteristics
Population Chapter – Inventory and Analysis Page 6
This section highlights characteristics of York’s year-round population. The Census provides the best available information about the characteristics of York’s year-round

Comprehensive Plan – York, Maine
population. It also provides information for other jurisdictions that can be used for comparison. Except as noted, information in this Section pertains to the year 2000. 1. Age and Gender
The median age of York residents is 43 years old. Compared to the County and State, York’s median age is noticeably older. York’s population is aging. In 1990 the percent of people 65 and over was 14.6% of the total. In 2000 the percent of people 65 and over was 17.0%. Nationally there was a slight decline, so York’s trend is unique. The following table shows York’s population categorized by gender and age. Each age group is known as a cohort.
Age & Gender
Cohort Female Male Total 0-4 299 337 6365-9 433 422 855
10-14 458 475 93315-19 355 363 71820-24 164 187 35125-29 227 225 45230-34 344 302 64635-39 547 508 1,05540-44 600 546 1,14645-49 641 559 1,20050-54 564 529 1,09355-59 442 414 85660-64 372 354 72665-69 311 270 58170-74 308 257 56575-79 283 195 47880-84 170 129 29985-89 113 62 17590+ 72 17 89
Subtotal 6,703 6,151 12,854Percent 52% 48%
Population Chapter – Inventory and Analysis Page 7
The figures in this table are shown graphically in what is known as a population histogram. The Baby Boomers, people between the ages of 35 and 54 in 2000, are represented by the 4 widest bands in the center of the histogram. York’s age distribution is significantly different than county, state and national patterns, as shown in the age/gender histogram. York’s population is skewed towards an older mix of people, with higher percentages of people 40 and older. Younger age groups are proportionately reduced, especially in the 20 to 35 year old age groups. This shows clearly in the narrow bands below the Baby Boomers. Compare the

Comprehensive Plan – York, Maine
shape of York’s histogram to the shape of the U.S. histogram and the differences show clearly.
Population Chapter – Inventory and Analysis Page 8

Comprehensive Plan – York, Maine
The gender distribution in York is not significantly different than other areas. In York, females comprise 52% of the population, while females comprise 51% of the population in the county, state and nation.
2. Population Living in Group Quarters Because York has no colleges, prisons, military bases or other major institutions, the group quarters population is not a major influence. In York, people living in group quarters include only adults living in some form of elderly housing with medical care. Of the 186 living in group quarters, 91% are older than 64 years old.
3. Race There is little racial diversity in York. The population is over 98% white, and no other race comprises even 1% of the population.
Race Race # People % of Total White 12,643 98.4% Black or African American 32 0.2% American Indian and Alaska Native 14 0.1% Asian 63 0.5% Native Hawaiian, Other Pacific Islander 3 0.0% Other Race 25 0.2% Two or More Races 74 0.6% Total Population 12,854
4. Educational Attainment
The average educational attainment of York’s residents is significantly higher than that of the county, state or nation. The percentage of adults in York that have no high school diploma is very low. On the other end of the spectrum, York has a high proportion of residents with college degrees.
Population Chapter – Inventory and Analysis Page 9
Educational Attainment People aged 25 years and over Highest Level Attained York County State U.S. No high school diploma 6.9% 13.5% 14.6% 19.6%High school graduate (includes equivalency) 24.3% 35.0% 36.2% 28.6%Some college, no degree 21.4% 20.4% 19.0% 21.0%Associate degree 9.7% 8.2% 7.3% 6.3%Bachelor's degree 26.7% 15.6% 14.9% 15.5%Graduate or professional degree 10.9% 7.3% 7.9% 8.9%College Degree 47.3% 31.1% 30.1% 30.7%

Comprehensive Plan – York, Maine
5. Propensity to Move
The Census figures show that 70% of York’s residents were born in another state. Compared to national, state and county figures, York has experienced a disproportionate change. These figures show that York has experienced a huge in-migration of residents.
Nativity and Place of Birth Place of Birth York County State U.S.Native 97% 97% 97% 89% Born in USA 97% 97% 96% 88% State of residence 27% 53% 67% 60% Different state 70% 44% 29% 28% Born outside USA 1% 1% 1% 1%Foreign born 3% 3% 3% 11%
6. Income Considered as a whole, York is more affluent than the County or the State. Whether comparing average household income, median household income, average family income, median family income, or per capita income, York is consistently and significantly higher than the County and State.
Income Income in 1999 York County State Average Household Income $75,759 $52,821 $47,383Median Household Income $56,171 $43,630 $37,240Average Family Income $88,957 $60,415 $55,216Median Family Income $65,082 $51,419 $45,179Per Capita Income $30,895 $21,225 $19,533
Population Chapter – Inventory and Analysis Page 10
While higher average and median incomes in a community tend to be viewed positively, it is important to consider the entire range of incomes in York. York is viewed as an affluent community, but income is not evenly distributed. About 1/5th of the households in York earned less than 50% of the median household income (earned $28,086 or less in 1999). At the high end of the income range, about 1/3rd earned more than 150% of the median household income $84,257 or more in 1999). York has a significantly larger share of wealthy households than the County and State.

Comprehensive Plan – York, Maine
Income in 1999 Households Families York County State York County State Less than $10,000 5% 8% 10% 1% 4% 5%$10,000 to $14,999 4% 6% 8% 2% 4% 5%$15,000 to $24,999 10% 13% 15% 8% 10% 12%$25,000 to $34,999 12% 13% 14% 10% 12% 14%$35,000 to $49,999 15% 18% 18% 15% 19% 20%$50,000 to $74,999 21% 23% 19% 23% 28% 24%$75,000 to $99,000 15% 11% 8% 18% 13% 11%$100,000 to $149,999 11% 6% 5% 13% 8% 6%$150,000 to $199,999 3% 1% 1% 4% 2% 2%$200,000 or more 6% 1% 1% 8% 2% 2%
Poverty status was also determined in the 2000 Census. York again fared better than the County and State, but there was still a sizeable number of people in poverty. In 1999, 480 people had income below the poverty level in York. Counted by families and households, 50 families and 189 non-family households had incomes below the poverty level. Counted by age, 65 were children, 275 were adults under 65, and 140 were adults 65 and older.
Poverty Status of Individuals Category York County State U.S. Of all people for whom poverty is calculated 4% 8% 11% 12%Of people under 18 years old 2% 10% 14% 17%Of people 65 years and older 7% 9% 10% 10%
7. Enrollment in York Public Schools
Population Chapter – Inventory and Analysis Page 11
Because of its fiscal and policy implications, the number of students enrolled in York’s public schools is of interest. In the 2002-2003 school year, there were 2,108 students enrolled. Enrollment had been higher in three of the prior five years. The average annual enrollment growth has been 1.74% over the past 10 years, which is slightly lower that the average annual rate of population growth over this same time period (2.17% for the population at large).

Comprehensive Plan – York, Maine
School Enrollment School Year K - 4 5 - 8 9 - 12 Total1992 - 1993 704 567 503 1,7741993 - 1994 722 571 517 1,8101994 - 1995 753 600 531 1,8841995 - 1996 792 615 521 1,9281996 - 1997 818 623 566 2,0071997 - 1998 814 664 573 2,0511998 - 1999 837 679 623 2,1391999 - 2000 781 703 624 2,1082000 - 2001 777 734 642 2,1532001 - 2002 765 695 656 2,1162002 - 2003 737 705 666 2,108 Note: enrollment as of October 1st each school year.
Population Chapter – Inventory and Analysis Page 12

Comprehensive Plan – York, Maine
Appendix A Calculation of 2004 Year-Round Population
The estimate of year-round population is 13,500. The year-round population in York is estimated by taking the most recent census count, in this case the 2000 U.S. Census, and adjusting it with other available data, in this case the number of new homes built. Data used is 2000 U.S. Census data unless otherwise noted. The following series of steps document the calculation of the estimate of the year-round population for the year 2004: 1. There were 12,854 people living year-round in York on April 1, 2000. 2. There were 1.6 year-round residents per housing unit in 2000. This is based on
12,854 year-round residents and 8,053 housing units (year-round and seasonal). The assumption is made that new housing will be mixed between year-round and seasonal use in the same proportion of as the existing housing stock.
3. The Town issued building permits for 377 new residential units in 2000, 2001,
2002 and 2003 (Town building permit records). 4. As of April 1, 2004, there were 603 new year-round residents. This is the product
of the average number of year-round residents per housing unit times the number of new housing units.
5. The estimate of year-round population is 13,500. The sum of the year 2000
population and the new residents is 13,457. This number is rounded to the nearest 100 because the estimate is not precise, and rounding communicates this lack of precision.
Population Chapter – Inventory and Analysis Page 13
Comprehensive Plan – York, Maine
Appendix B Calculation of 2004 Seasonal Population
The estimate of seasonal overnight population is 26,300. This is calculated by adding the year-round population, the seasonal population, and overnight visitors. 1. SEASONAL POPULATION IN HOUSING
It is estimated there were about 20,300 people staying in housing in York during the summer of 2004. This is the sum of the estimated year-round population (13,500) plus the number of people staying in seasonal housing units (6,800). The number of people staying in seasonal housing units was calculated by first determining the number of seasonal units, then by estimating the average number of people occupying each unit. The U.S. Census indicates there were 2,666 seasonal housing units in 2000, which is 33% of the housing stock. Of newly constructed housing units, it is assumed that 33% of the newly constructed units will be used seasonally. There were 377 new housing units, so 124 seasonal units are added, resulting in 2,790 seasonal housing units for Summer 2004. Regarding vacancy rates, there is no actual data available. For lack of better data, it is assumed that all seasonal units are full in the summer (the vacancy rate is 0%). While there will always be some units that are vacant, this number establishes an upper limit, and it is probably close to reality. Sensitivity analysis reveals the total seasonal population estimate varies by about 67 people for every percent of vacancy added. It requires a vacancy rate over 7% to significantly change the result (when the result is rounded to the nearest 1,000). This means that potential error in the estimated vacancy rate should not significantly affect the final calculation.
Population Chapter – Inventory and Analysis Page 14
Regarding the number of people occupying each seasonal unit, there is no actual data available. As a starting point, it is assumed that each seasonal unit will be occupied at a rate of 2.42 persons per household (PPH). This is the Census-derived occupancy rate for year-round housing in York in 2000. There are probably very different occupancy patterns for the seasonal residents, but until further research is completed this is the best estimate available. Sensitivity analysis reveals the total seasonal population estimate varies by 276 people for every 1/10th change in PPH (2.32 PPH reduces the total by 276 people, 2.22 PPH reduces the total by 551 people; 2.52 PPH increases the total by 276 people, 2.62 PPH increases the total by 551 people, and so forth). Persons per household in the range of 2.26 and 2.61 will not significantly change the result (when the result is rounded to the nearest 1,000). Because there is no information about occupancy of seasonal units, further research into this variable would be worthwhile. Sensitivity analysis of both variables indicates large changes of both variables at the same
Comprehensive Plan – York, Maine
time could affect the result (when rounded) by 1,000, but not likely by 2,000, so York’s summertime overnight population living in housing most likely in the range of 19,300 to 21,300.
2. SEASONAL POPULATION IN TRANSIENT ACCOMMODATIONS
It is estimated that 6,000 people stay overnight in transient accommodations in York on a busy summer night. This includes accommodations in hotels, motels, bed & breakfasts, campgrounds and other such facilities. The State licenses all overnight accommodations in the State, and their data is the only source of data that is comprehensive. The Town licenses bed & breakfasts, and hotels/motels with cooking facilities, but does not annually license other types of transient overnight accommodations. Data received from the State on May 20, 2003, indicates there are a total of 1,348 overnight rooms for transient occupancy in York. This includes inns, hotels, motels and bed & breakfasts. None of these rooms would be included in the Census counts. The State data indicates there are a total of 976 campsites in York. Current Assessing records indicate 574 of these sites have camper-trailers that are located on the sites year-round, which the Census counts as seasonal housing units. The remainder of sites, totaling 402, would be available for transient use. The State data also indicates there are 106 rental cottages in York, and these, too, are included in the Census count of seasonal housing units. The total number of rooms and sites available for transient occupancy that are not included in the count of seasonal housing is 1,750. Because the intent of this analysis is to estimate the maximum of people likely to be staying overnight, it is reasonable to assume 100% occupancy of transient units. Additionally, it is necessary to estimate the average number of people staying in each accommodation, and this certainly varies widely. A State report on tourism indicates the average travel party size in Maine is 3.4 people (Travel & Tourism in Maine: 2001 Visitor Study, Maine Office of Tourism, 9/5/2002, page 121). Using this figure, there will be about 6,000 people staying in transient overnight accommodations during the peak of the summer.
Population Chapter – Inventory and Analysis Page 15

Comprehensive Plan – York, Maine
Population Chapter – Inventory and Analysis Page 16
Appendix C Consistency of Town Data and Census Count
In the draft 1990 Inventory & Analysis, a document never adopted by the Town, there is an extensive criticism of the accuracy of U.S. Census figures for York. The text compares Census counts of school-age children with enrollment figures for the public schools, and compares the Census count of adults to the number of registered voters and identified discrepancies. The 2000 Census data matches reasonably well to Town data, thereby lending credence to the validity of the 2000 Census data. Regarding school-age children, the Census count on April 1, 2000 for children aged 5 to 17 was 2,299. School enrollment in York Public Schools on October 1, 1999 (the same school year in which the Census was conducted) was 2,108. Given the fact that some children attend private school, and the fact that the dates are ½ year off, the school enrollment figures are reasonably consistent. Regarding voting-age adults, the Census count on April 1, 2000 for adults was 9,919. The Town Clerk’s closest statistic of the total number of registered voters dates to May 15, 2001, and her total was 11,595. On its face, the Town figures would tend to indicate a discrepancy in the Census count. However, the Town Clerk’s opinion is that the list of voters tends to over count the number of people actually eligible to vote. It is her opinion that the over count is significant. She is working to remove names of people no longer eligible to be included on the list, and her starting point is 3,600 people who did not vote in any recent elections. This means about 8,000 of the adults on the current list have voted in recent elections, which would be a high percentage of all adults in York. While York’s voter participation rate may be high, it does not refute the Census count of adults.