Population Trends in Maryland, 2000-2006 2007 Spring Planning Directors Meeting May 22, 2007.
53
Population Trends in Maryland, 2000-2006 2007 Spring Planning Directors Meeting May 22, 2007
-
Upload
cornelius-wilkerson -
Category
Documents
-
view
216 -
download
0
Transcript of Population Trends in Maryland, 2000-2006 2007 Spring Planning Directors Meeting May 22, 2007.

Population Trends in Maryland, 2000-2006
2007 Spring Planning Directors Meeting
May 22, 2007

Population Data Source
• U.S. Census Bureau annual estimates through July 1, 2006
– Data for states released end of December, 2006
– Data for counties released end of March, 2007

U.S. Census Bureau Population Cohort Component Estimates
• Births & deaths from administrative records
• Internal (domestic) migration from federal tax returns and Medicare records
• International migration – a national estimate is distributed to states & counties based on Census 2000 ratios

Maryland Population, 2000 & 2006 (and rank within U.S.)
5,296,4865,615,727
0
1,000,000
2,000,000
3,000,000
4,000,000
5,000,000
6,000,000
2000 2006(19th) (19th)

Maryland Population Change,2000- 2006
• Total Change = 319,221 (14th largest)
• Percent Change = 6.0% (21st fastest)– But below the overall U.S. rate of 6.4%


Annual Population Change for Maryland (and rank within U.S.)
15,189
68,10061,554
65,335
46,565
36,350
26,128
0
10,000
20,000
30,000
40,000
50,000
60,000
70,000
4/1/00-7/1/00
7/1/00-7/1/01
7/1/01-7/1/02
7/1/02-7/1/03
7/1/03-7/1/04
7/1/04-7/1/05
7/1/05-7/1/06
14th 14th 10th 16th 18th 27th

Annual Pct Change in Pop in Maryland, 2000- 2006 (and rank within U.S.)
0.3%
1.3%
1.1%1.2%
0.8%0.7%
0.5%
0.0%
0.2%
0.4%
0.6%
0.8%
1.0%
1.2%
1.4%
4/1/00-7/1/00
7/1/00-7/1/01
7/1/01-7/1/02
7/1/02-7/1/03
7/1/03-7/1/04
7/1/04-7/1/05
7/1/05-7/1/06
13th 18th 12th 22nd 27th 36th
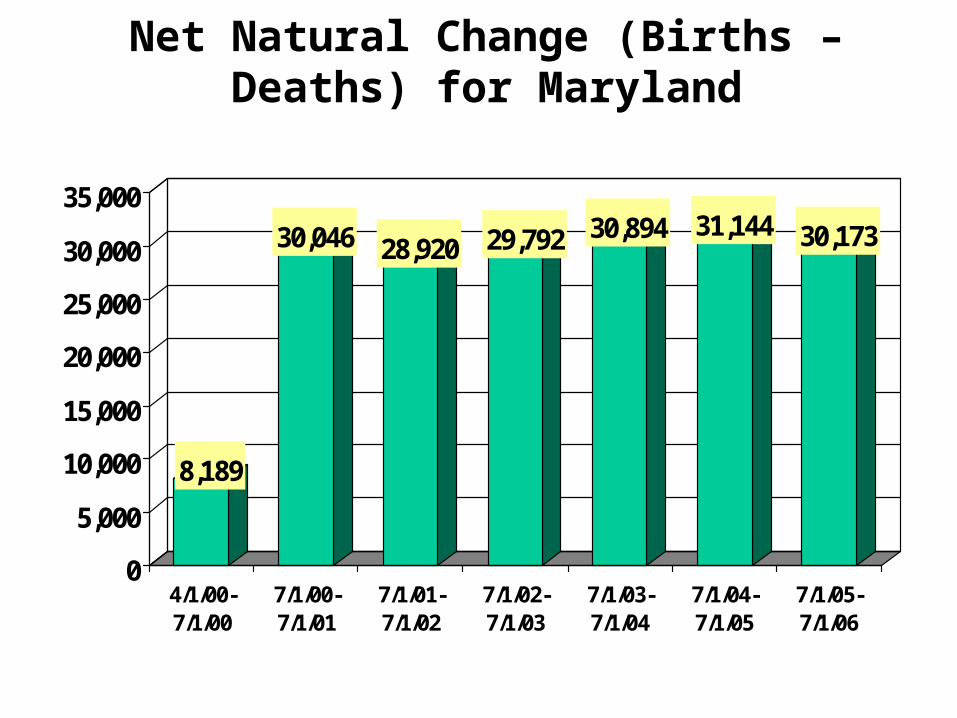
Net Natural Change (Births – Deaths) for Maryland
8,189
30,046 28,920 29,792 30,894 31,144 30,173
0
5,000
10,000
15,000
20,000
25,000
30,000
35,000
4/1/00-7/1/00
7/1/00-7/1/01
7/1/01-7/1/02
7/1/02-7/1/03
7/1/03-7/1/04
7/1/04-7/1/05
7/1/05-7/1/06

Net International Migration and Federal Citizens’ Movement for Maryland
6,627
23,61821,917
15,655
20,99519,783
21,135
0
5,000
10,000
15,000
20,000
25,000
4/1/00-7/1/00
7/1/00-7/1/01
7/1/01-7/1/02
7/1/02-7/1/03
7/1/03-7/1/04
7/1/04-7/1/05
7/1/05-7/1/06

Net Internal Migration for Maryland, 2000 – 2006 *
190
10,01513,309
8,560
-7,801-11,680
-25,610-30,000
-25,000
-20,000
-15,000
-10,000
-5,000
0
5,000
10,000
15,000
4/1/00-7/1/00
7/1/00-7/1/01
7/1/01-7/1/02
7/1/02-7/1/03
7/1/03-7/1/04
7/1/04-7/1/05
7/1/05-7/1/06
(24th) (14th) (11th) (15th)
(40th) (42nd) (43rd)
* And rank of net internal migration among the 50 states and District of Columbia

Components of Population Change for Maryland: 2000 - 2006
189,158
129,730
-13,017
13,350
-50,000
0
50,000
100,000
150,000
200,000
Net NaturalChange
InternationalMigration
DomesticMigration
Residual
Prepared by the Maryland Department of Planning from U.S. Census Bureau Population Estimates, December, 2006


Reasons for Maryland NetInternal Out Migration
• Decreasing relative “economic vitality”
• Higher housing costs compared to neighboring states

Annual Pct Change in MD W&S Jobs and Pct Pt Difference: MD – U.S.
-5%
-4%
-3%
-2%
-1%
0%
1%
2%
3%
4%
5%
6%
Pct change in MD W&S jobs Pct Pt Difference: Maryland - U.S.

Intra-U.S. Net Migration Flows for Maryland (Less Wash. D.C.) and Differential in Job Growth (MD-U.S.)
-25
-20
-15
-10
-5
0
5
10
15
20
Mig
rati
on
(th
ou
san
ds)
-3.0%
-2.0%
-1.0%
0.0%
1.0%
2.0%
3.0%
Jo
b G
row
th D
iffe
ren
tial
Migration Job Growth Differential
Prepared by the Maryland Department of Planning, Planning Data Services based on summary data prepared by the Internal Revenue Service.

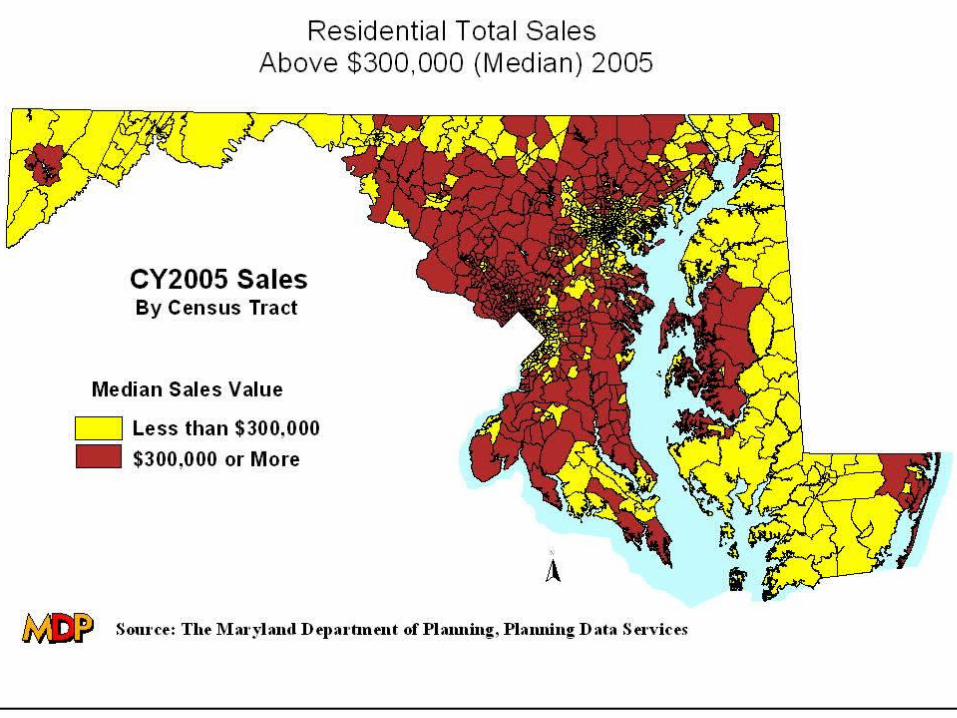
2000 Median Value of Owner Occupied Housing – Bordering Counties, MD & PA
$0
$100,000
$200,000
$300,000
$400,000
$500,000
$600,000

2005 Median Value of Owner Occupied Housing – Bordering Counties, MD & PA*
$0
$100,000
$200,000
$300,000
$400,000
$500,000
$600,000
* Median value, plus and minus the margin of error

Change in Median Value of Owner Occupied Housing, 2000-2005
40,400 48,40031,800
47,700
175,100150,100
98,200 89,80074,900
$0
$100,000
$200,000
$300,000
Source: Census 2000 and the 2005 American Community Survey

2005 Median Value of Owner Occupied Housing Built Between 2000 and 2004 *
$0
$100,000
$200,000
$300,000
$400,000
$500,000
$600,000
* Median value, plus and minus the margin of error

Inmigration to Maryland From PA and Outmigration from Maryland To PA
8,000
12,000
16,000
20,000
1997 1998 1999 2000 2001 2002 2003 2004 2005
Inflows Outflows

Net Migration for Maryland With Pennsylvania
-169-735 -458 -450
-126
-1,218
-3,070
-4,337
-6,889-8,000
-7,000
-6,000
-5,000
-4,000
-3,000
-2,000
-1,000
0
1997 1998 1999 2000 2001 2002 2003 2004 2005

Net Migration for Maryland With Pennsylvania
-6,000
-5,000
-4,000
-3,000
-2,000
-1,000
0
1,000
2,000
1997 1998 1999 2000 2001 2002 2003 2004 2005
Border counties * Rest of Maryland
*Baltimore, Carroll, Frederick, Harford & Washington

Net Migration for Maryland WithWest Virginia
-1,578-1,284
-1,606
-2,085-2,379
-2,822-3,000
-2,500
-2,000
-1,500
-1,000
-500
0
2000 2001 2002 2003 2004 2005

Net Migration for Maryland WithDelaware
-801
-607
-859-985 -949
-1,560-1,800
-1,600
-1,400
-1,200
-1,000
-800
-600
-400
-200
0
2000 2001 2002 2003 2004 2005

Total Population Change for Maryland’s Jurisdictions, 2000 - 2006
137869571,026
2,2502,3242,845
5,6787,343
11,82512,62213,55514,241
19,36319,64419,870
22,81224,610
27,66233,092
40,62457,966
0 10,000 20,000 30,000 40,000 50,000 60,000 70,000
Garrett Kent
Dorchester Somerset
Talbot Worcester
Caroline Queen Anne's
Wicomico Washington
St. Mary's Cecil
Calvert Carroll
Anne Arundel Charles Harford Howard
Frederick Baltimore
Prince George's Montgomery


Population Change, 2000 - 2006
-19,788
-2,099
-24,000
-20,000
-16,000
-12,000
-8,000
-4,000
0
Baltimore City Allegany(-3.0%) (-2.8%)

Components of Population Change for Allegany County, 2000-2006
-1,367
137
-862
236
-243
-1,600
-1,200
-800
-400
0
400
Netnaturalchange
ForeignMig
DomesticMig
GroupQuarters
Residual
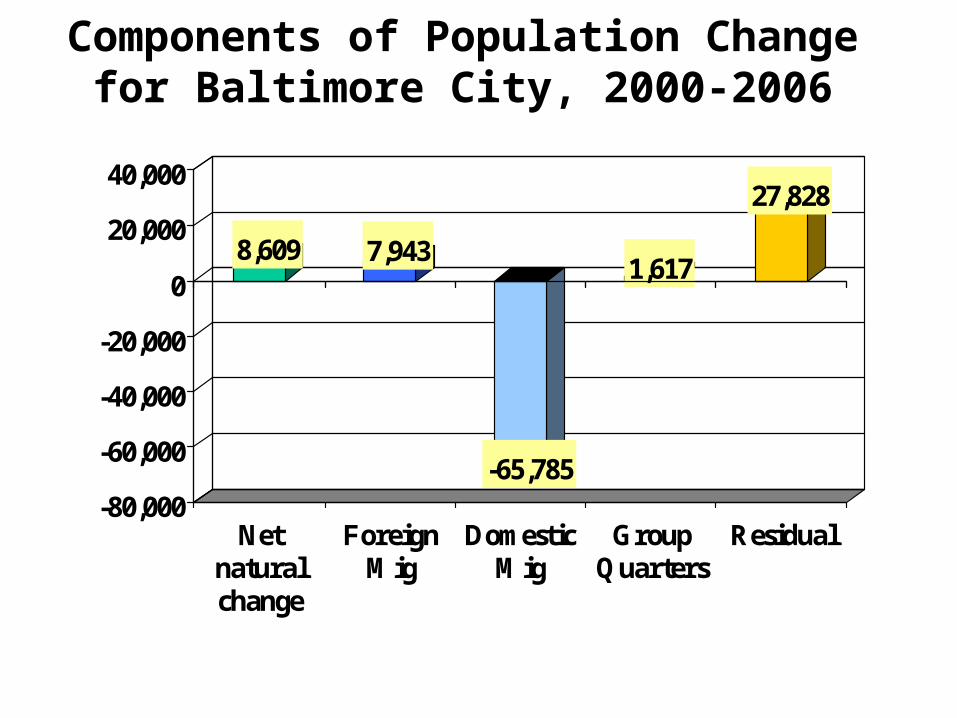
Components of Population Change for Baltimore City, 2000-2006
8,609 7,943
-65,785
1,617
27,828
-80,000
-60,000
-40,000
-20,000
0
20,000
40,000
Netnaturalchange
ForeignMig
DomesticMig
GroupQuarters
Residual

Net Internal Migration for Baltimore City
-3,341
-13,052-12,008
-10,773-10,160
-8,597-7,854
-14,000
-12,000
-10,000
-8,000
-6,000
-4,000
-2,000
0
4/1/00-7/1/00
7/1/00-7/1/01
7/1/01-7/1/02
7/1/02-7/1/03
7/1/03-7/1/04
7/1/04-7/1/05
7/1/05-7/1/06
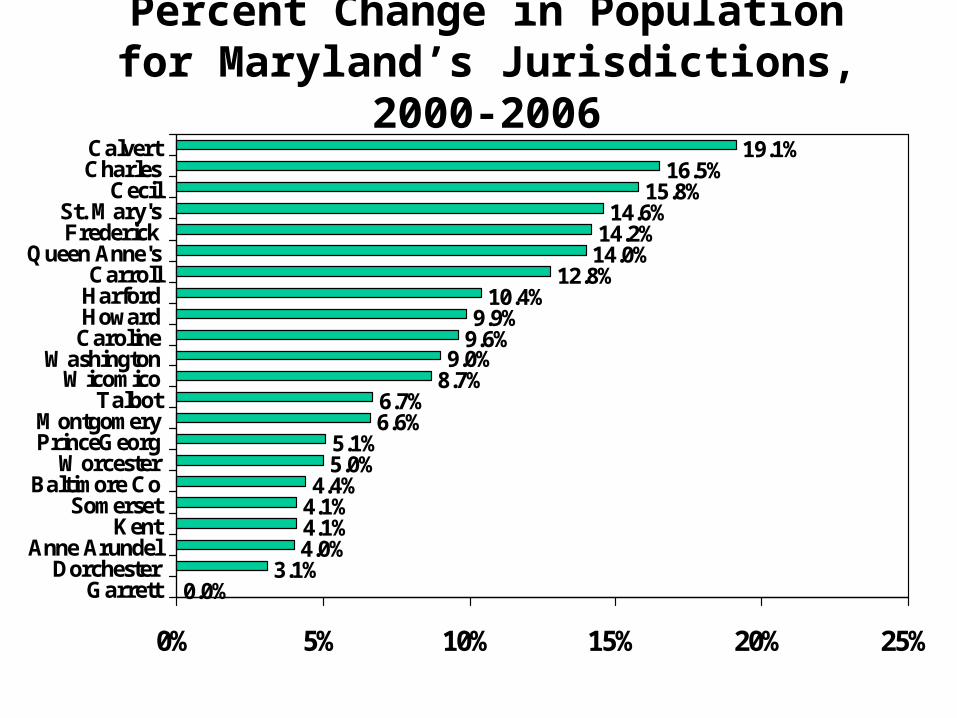
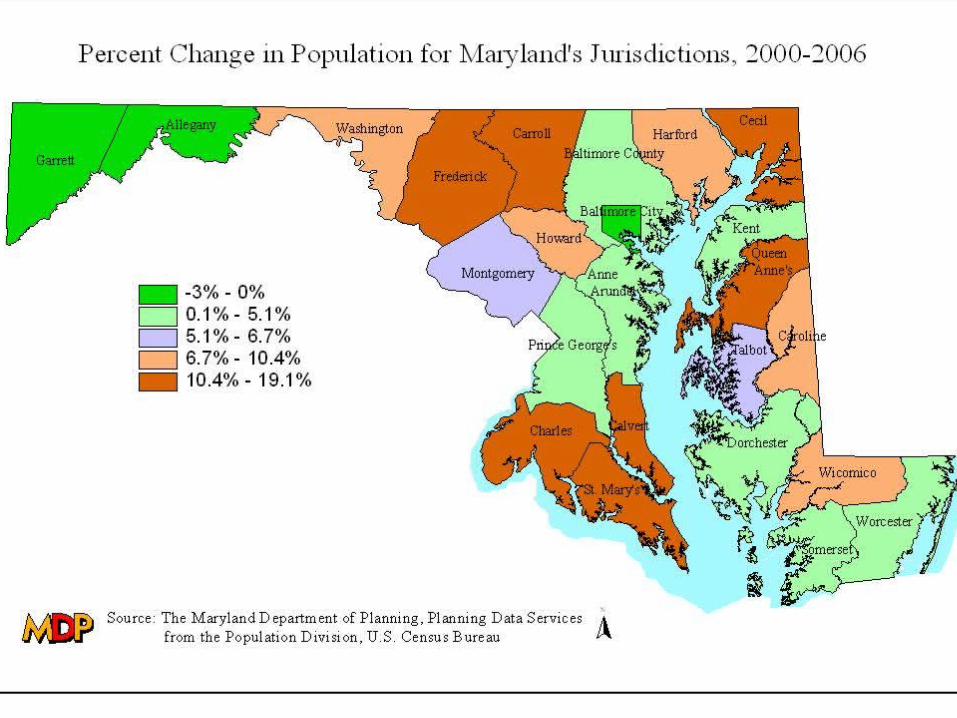
Percent Change in Population for Maryland’s Jurisdictions, 2000-2006
0.0%3.1%
4.0%4.1%4.1%4.4%
5.0%5.1%
6.6%6.7%
8.7%9.0%
9.6%9.9%
10.4%12.8%
14.0%14.2%
14.6%15.8%
16.5%19.1%
0% 5% 10% 15% 20% 25%
Garrett Dorchester
Anne Arundel Kent
Somerset Baltimore Co
Worcester PrinceGeorg Montgomery
Talbot Wicomico
Washington Caroline Howard Harford Carroll
Queen Anne's Frederick St. Mary's
Cecil Charles Calvert

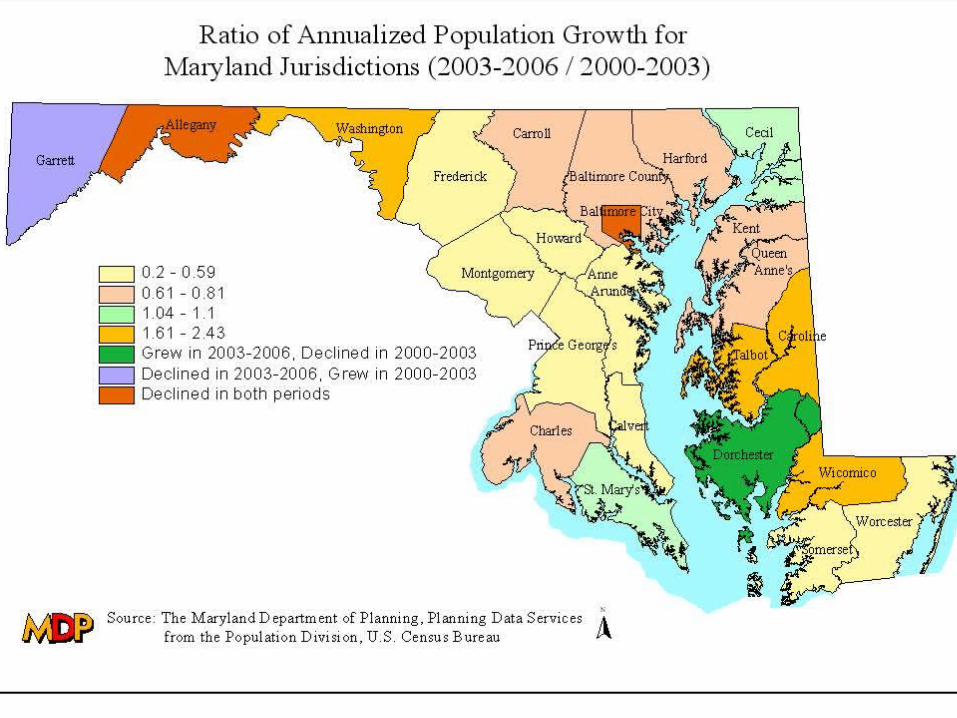
Annualized Pop Change for Maryland’s Jurisdictions, 2000-2003 & 2003-2006
1,4631,9462,128
2,9023,805
4,5523,5464,021
4,9115,582
6,3319,868
12,933
2,3572,1002,213
1,6032,332
1,6172,782
3,2482,883
3,1744,172
2,8515,311
230214605
3371,105795
148
93519120
5846961,586
357102
0 2,000 4,000 6,000 8,000 10,000 12,000 14,000 16,000 18,000 20,000
Kent Dorchester
Somerset Talbot
Worcester Caroline
Queen Anne's Wicomico
Washington St. Mary's
Cecil Calvert Carroll
AnneArundel Charles Harford Howard
Frederick Baltimore
PrinceGeorge Montgomery
2000-2003 2003-2006


Population Growth in the Upper & Lower Eastern Shore Regions, as a Pct of
Statewide Growth, 1991-2006
0%
5%
10%
15%
20%
25%
30%
7/90
-7/91
7/91
-7/92
7/92
-7/93
7/93
-7/94
7/94
-7/95
7/95
-7/96
7/96
-7/97
7/97
-7/98
7/98
-7/99
7/99
-7/00
7/00
-7/01
7/01
-7/02
7/02
-7/03
7/03
-7/04
7/04
-7/05
7/05
-7/06
Total Upper Lower

Population Growth in the Eastern Shore Region & Washington County, as a Pct of
Statewide Growth, 1991-2006
0%
5%
10%
15%
20%
25%
30%
35%
7/90
-7/91
7/91
-7/92
7/92
-7/93
7/93
-7/94
7/94
-7/95
7/95
-7/96
7/96
-7/97
7/97
-7/98
7/98
-7/99
7/99
-7/00
7/00
-7/01
7/01
-7/02
7/02
-7/03
7/03
-7/04
7/04
-7/05
7/05
-7/06


Net Migration Outflow from Baltimore County to Pennsylvania, 2000 - 2005
-431-524 -576
-1,012
-1,367
-1,602
-1800
-1600
-1400
-1200
-1000
-800
-600
-400
-200
0
2000 2001 2002 2003 2004 2005
Source: Maryland Department of Planning, Planning Data Services, from IRS County-to-County Migration data

Net Migration Outflow From Carroll County to Pennsylvania, 2000 - 2005
-584-453
-675
-851
-1,018
-1,429
-1,600
-1,400
-1,200
-1,000
-800
-600
-400
-200
0
2000 2001 2002 2003 2004 2005
Source: Maryland Department of Planning, Planning Data Services, from IRS County-to-County Migration data

Net Migration Outflow From Frederick County to Pennsylvania, 2000 - 2005
44
-93-18
-401
-537
-788-800
-700
-600
-500
-400
-300
-200
-100
0
100
2000 2001 2002 2003 2004 2005
Source: Maryland Department of Planning, Planning Data Services, from IRS County-to-County Migration data

Net Migration Outflow From Frederick County To Washington Co., 2000 - 2005
-424 -398
-889
-1,316
-1,766 -1,841-2000
-1800
-1600
-1400
-1200
-1000
-800
-600
-400
-200
0
2000 2001 2002 2003 2004 2005
Source: Maryland Department of Planning, Planning Data Services, from IRS County-to-County Migration data

Net Migration Inflow To Frederick Co. From Montgomery County, 2000 - 2005
1,986
2,528
3,3833,681
4,214 4,247
0
500
1000
1500
2000
2500
3000
3500
4000
4500
2000 2001 2002 2003 2004 2005
Source: Maryland Department of Planning, Planning Data Services, from IRS County-to-County Migration data

Net Migration Inflow To Washington Co from Montgomery Co, 2000 - 2005
177 152
275
390
516
750
0
100
200
300
400
500
600
700
800
2000 2001 2002 2003 2004 2005
Source: Maryland Department of Planning, Planning Data Services, from IRS County-to-County Migration data

Net Migration Inflow To Cecil Co from Harford Co, 2000 - 2005
295333
383
520
704765
0
100
200
300
400
500
600
700
800
2000 2001 2002 2003 2004 2005
Source: Maryland Department of Planning, Planning Data Services, from IRS County-to-County Migration data
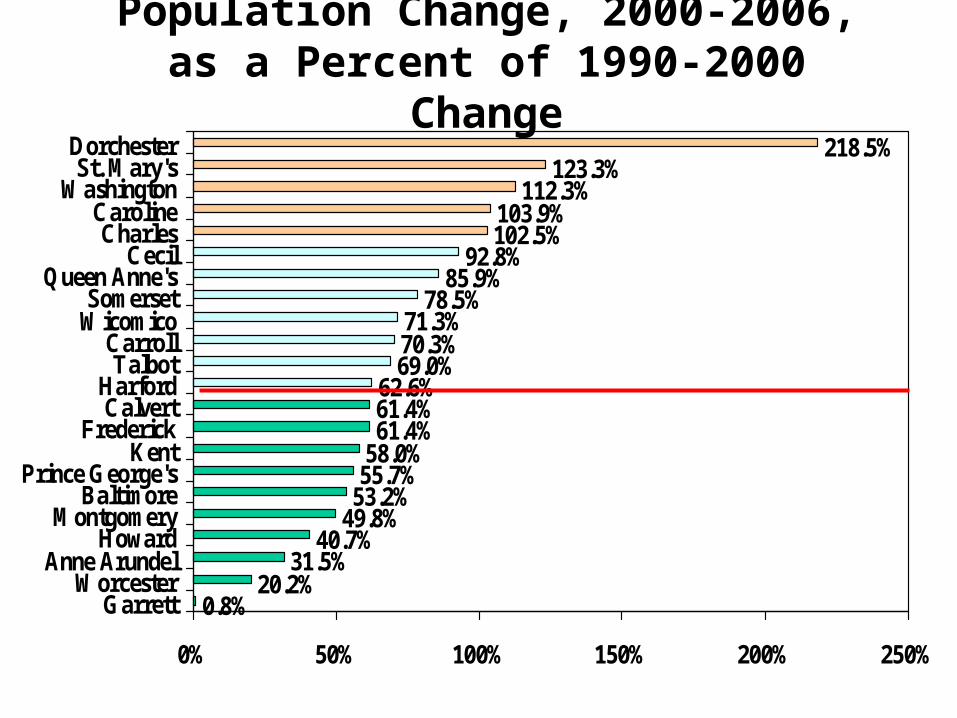
Population Change, 2000-2006, as a Percent of 1990-2000 Change
0.8%20.2%
31.5%40.7%
49.8%53.2%55.7%58.0%61.4%61.4%62.6%
69.0%70.3%71.3%
78.5%85.9%
92.8%102.5%103.9%
112.3%123.3%
218.5%
0% 50% 100% 150% 200% 250%
GarrettWorcester
Anne ArundelHoward
MontgomeryBaltimore
Prince George'sKent
FrederickCalvert
HarfordTalbot
CarrollWicomicoSomerset
Queen Anne'sCecil
CharlesCaroline
WashingtonSt. Mary's
Dorchester


Summary
• Slower overall population growth in Maryland in last three years due to increasing net out migration
• Increasing out migration linked to decreasing relative economic vitality and higher housing prices
• Slower growth more apparent in central Maryland

Summary (cont.)
• Outlying areas with relatively lower housing prices have been the recipient of some of the displaced growth from central Maryland
• This has led to these outlying areas accounting for a greater share of statewide growth and in some cases to have surpassed the previous decade’s total growth