Population survey and trend assessment for … survey and trend assessment for Eucephalus vialis at...
19
Population survey and trend assessment for Eucephalus vialis at Beatty Creek ACEC Final Report 2010 Denise E. L. Giles-Johnson, Andrea S. Thorpe & Robert T. Massatti Institute for Applied Ecology A Challenge Cost Share project funded jointly by Bureau of Land Management, Roseburg District and Institute for Applied Ecology
Transcript of Population survey and trend assessment for … survey and trend assessment for Eucephalus vialis at...
Population survey and trend assessment for
Eucephalus vialis at Beatty Creek ACEC Final Report
2010
Denise E. L. Giles-Johnson, Andrea S. Thorpe & Robert T. Massatti
Institute for Applied Ecology
A Challenge Cost Share project funded jointly by
Bureau of Land Management, Roseburg District and
Institute for Applied Ecology

Eucephalus vialis population survey, 2010 ii
PREFACE
This report is the result of a cooperative Challenge Cost Share project between the Institute for
Applied Ecology (IAE) and the USDI Bureau of Land Management. IAE is a non-profit
organization dedicated to natural resource conservation, research, and education. Our aim is to
provide a service to public and private agencies and individuals by developing and
communicating information on ecosystems, species, and effective management strategies and by
conducting research, monitoring, and experiments. IAE offers educational opportunities through
internships. Our current activities are concentrated on rare and endangered plants and invasive
species.
Questions regarding this report or IAE should be directed to:
Andrea S. Thorpe, Conservation Research Program Director
Institute for Applied Ecology
PO Box 2855
Corvallis, Oregon 97339-2855
Phone: 541-753-3099, ext. 401
Fax: 541-753-3098
Email: [email protected]
ACKNOWLEDGEMENTS
The authors gratefully acknowledge the contributions and cooperation by the Roseburg District
Bureau of Land Management, particularly Susan Carter. Support was also provided by IAE staff
and interns: Michelle Allen, Alexis Brickner, Geoff Gardner, Rachel Newton and Shell
Whittington. Cover photographs: Eucephalus vialis population and north-facing slope at
Beatty Creek ACEC. Photos by R.T. Massatti.
Please cite this report as:
Giles-Johnson, D.E.L., A.S. Thorpe, and R.T. Massatti. 2010. Population survey and trend
assessment for Eucephalus vialis at Beatty Creek ACEC. Institute for Applied Ecology,
Corvallis, Oregon and USDI Bureau of Land Management, Roseburg District. iv + 15
pp.
Eucephalus vialis population survey, 2010 iii
TABLE OF CONTENTS
Preface............................................................................................................................................. ii Acknowledgements ......................................................................................................................... ii Table of contents ............................................................................................................................ iii
List of figures ................................................................................................................................. iv List of tables ................................................................................................................................... iv Introduction ..................................................................................................................................... 1
Background ................................................................................................................................. 1 Study Area .................................................................................................................................. 1
Natural history of Eucephalus vialis ........................................................................................... 1 Project objectives ........................................................................................................................ 2
Methods........................................................................................................................................... 2
Population survey........................................................................................................................ 2 Population monitoring ................................................................................................................ 2 Population size ............................................................................................................................ 3
Results and Discussion ................................................................................................................... 4 Population surveys ...................................................................................................................... 4
Population monitoring ................................................................................................................ 5 Population size ............................................................................................................................ 6 Recommended actions ................................................................................................................ 6
Literature cited .............................................................................................................................. 12 Appendix A. Gear list, datasheets, and directions ....................................................................... 13

Eucephalus vialis population survey, 2010 iv
LIST OF FIGURES
Figure 1. Eucephalus vialis inflorescence.
Figure 2. Intuitive Controlled survey routes, E. vialis subpopulations, and monitoring transects
at Beatty Creek ACEC.
Figure 3. Estimated extent of Eucephalus vialis population based on surveys and population
monitoring transects.
LIST OF TABLES
Table 1. Lat/Longs for transect starting and ending points.
Table 2. Comparison of average plant measurements for the Forest Canopy Thinning plots
(FCT) and Beatty Creek.
Table 3. Results of E. vialis monitoring along 18 (2009) and 23 (2010) transects located at
Beatty Creek ACEC.
Eucephalus vialis population survey, 2010 1
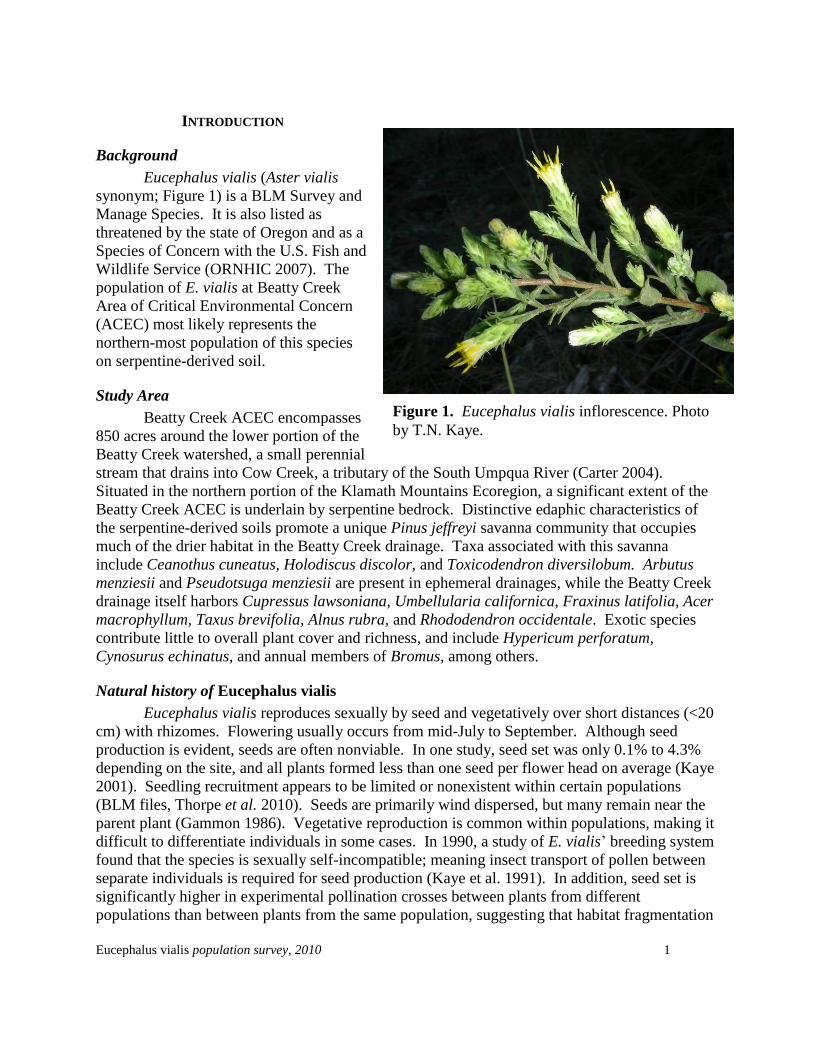
Figure 1. Eucephalus vialis inflorescence. Photo
by T.N. Kaye.
INTRODUCTION
Background
Eucephalus vialis (Aster vialis
synonym; Figure 1) is a BLM Survey and
Manage Species. It is also listed as
threatened by the state of Oregon and as a
Species of Concern with the U.S. Fish and
Wildlife Service (ORNHIC 2007). The
population of E. vialis at Beatty Creek
Area of Critical Environmental Concern
(ACEC) most likely represents the
northern-most population of this species
on serpentine-derived soil.
Study Area
Beatty Creek ACEC encompasses
850 acres around the lower portion of the
Beatty Creek watershed, a small perennial
stream that drains into Cow Creek, a tributary of the South Umpqua River (Carter 2004).
Situated in the northern portion of the Klamath Mountains Ecoregion, a significant extent of the
Beatty Creek ACEC is underlain by serpentine bedrock. Distinctive edaphic characteristics of
the serpentine-derived soils promote a unique Pinus jeffreyi savanna community that occupies
much of the drier habitat in the Beatty Creek drainage. Taxa associated with this savanna
include Ceanothus cuneatus, Holodiscus discolor, and Toxicodendron diversilobum. Arbutus
menziesii and Pseudotsuga menziesii are present in ephemeral drainages, while the Beatty Creek
drainage itself harbors Cupressus lawsoniana, Umbellularia californica, Fraxinus latifolia, Acer
macrophyllum, Taxus brevifolia, Alnus rubra, and Rhododendron occidentale. Exotic species
contribute little to overall plant cover and richness, and include Hypericum perforatum,
Cynosurus echinatus, and annual members of Bromus, among others.
Natural history of Eucephalus vialis
Eucephalus vialis reproduces sexually by seed and vegetatively over short distances (<20
cm) with rhizomes. Flowering usually occurs from mid-July to September. Although seed
production is evident, seeds are often nonviable. In one study, seed set was only 0.1% to 4.3%
depending on the site, and all plants formed less than one seed per flower head on average (Kaye
2001). Seedling recruitment appears to be limited or nonexistent within certain populations
(BLM files, Thorpe et al. 2010). Seeds are primarily wind dispersed, but many remain near the
parent plant (Gammon 1986). Vegetative reproduction is common within populations, making it
difficult to differentiate individuals in some cases. In 1990, a study of E. vialis’ breeding system
found that the species is sexually self-incompatible; meaning insect transport of pollen between
separate individuals is required for seed production (Kaye et al. 1991). In addition, seed set is
significantly higher in experimental pollination crosses between plants from different
populations than between plants from the same population, suggesting that habitat fragmentation
Eucephalus vialis population survey, 2010 2
may isolate plants and cause inbreeding depression due to reduced long distance pollination.
Because inbreeding depression can occur when pollen flow is restricted to a single site,
maintaining as many of the known sites as possible in a reproductive state, large population
sizes, and connectivity between populations is important to the long term viability o f E. vialis
(Kuykendall 1991).
Project objectives
The primary objective of this study is to determine long-term population trends of E.
vialis at Beatty Creek. In 2009, IAE surveyed Beatty Creek ACEC to determine the size of the
E. vialis population. We used this information to design a long-term monitoring protocol and
conduct population monitoring. This protocol was used to survey the population again in 2010.
IAE has conducted studies of this species at multiple sites in the Eugene District, BLM, which
will allow us to make comparisons between population size and trends at Beatty Creek and
populations elsewhere in the species’ range.
METHODS
Population survey
On August 26th
, 2009, Intuitive Controlled surveys were employed to determine the
extent of the E. vialis population (Whiteaker et al. 1998). As subpopulations were encountered,
GPS points were recorded and notes were taken describing their sizes, locations in a landscape
context, and the associated plant communities. In 2010 we conducted additional surveys on the
boundaries of the population in order to refine our estimates of the extent of the population.
Minor changes were made in the southernmost drainage and along Beatty Creek.
These data were summarized and used to estimate the population boundary for the E.
vialis population in MapWindow GIS (e.g. Figure 3). A random point generator function in
MapWindow was then used to place points within the polygon. A sufficient number of points
were generated such that the list could be pared down to include only those points located on the
east side of Beatty Creek and the south side of the six ephemeral drainages on the west slope of
Beatty Creek and still have at least two points in each of the ephemeral drainages and twelve
points in the Beatty Creek drainage. Points were selected in these respective areas so that
transects would run perpendicular through the E. vialis populations (e.g. across the drainages);
additionally, for ease of plot establishment and future monitoring, origin points were grouped on
the same side of drainages.
Population monitoring
Twenty-two monitoring transects were established, (17 on September 15th
through
September 17th
, 2009 and 5 on August 23rd
through August 25th
). Points were randomly chosen
from the list of points generated in MapWindow GIS (see above); two to four transects were
established in each of the six ephemeral tributaries feeding Beatty Creek (fifteen total) and seven
transects were randomly established across Beatty Creek (Figure 2). Transects were located
between 370 and 490 meters elevation. (An additional transect was placed just outside the
northern population boundary of Beatty Creek, but is not considered in this study, because there
were no plants in the transect.)

Eucephalus vialis population survey, 2010 3
Transect origins were located using a navigation grade GPS unit (Garmin GPSmap
60CSx). At each point, a 4 foot long metal conduit was pounded into the ground so that 2 feet
were protruding and a numbered metal tag was wired to its base (Table 1). The transect azimuth
was determined by sighting to a distant landmark perpendicular to and across the drainage to the
north (for a tributary drainage) or to the west (for the Beatty Creek drainage). Because of the
variable tree and shrub density across the landscape, landmarks had to continually be sighted
with a compass as a 100 meter measuring tape was stretched along the azimuth. In 2009, a short
piece of metal conduit was pounded into the ground so that at least 6 inches were visible, at 100
meters; no end posts were put in place in 2010. Flagging was tied around the start and end
conduits as well as around tree trunks, tree branches, and/or shrubs in the vicinity of the
respective point. GPS coordinates were recorded at each origin and end (Table 1). Five
photographs were taken at the origin of each transect, one at each of the cardinal directions and
one along the transect itself.
All E. vialis occurring within 2 meters of either side of the tape were measured.
Measurements included the number of stems per plant, the length of each stem, the total number
of capitula per plant, and the approximate location of the plant along the transect (meter and side
of the tape). The number of stems on each plant that were browsed by deer and/or insects was
also recorded; deer (ungulate) damage was evidenced by stems that were clearly clipped
somewhere along the stem or occasionally stems stripped of leaves, while insect damage
included any type of rips or holes in E. vialis leaves. If deer or insect damage resulted in the loss
of any capitula, an estimate of the percent of capitula damaged or lost was recorded.
Population size
Based on Intuitive Controlled surveys, transect monitoring, and aerial photographs, a
polygon was created in MapWindow GIS that approximates the E. vialis population boundary
(Figure 3). Included were all known subpopulations of E. vialis as well as adjacent habitat that
had similar biotic and abiotic characteristics (e.g. aspect, plant community). The Calculate
Polygon Area feature in MapWindow GIS was used to compute an estimate of the E. vialis range
(245,527 m2). Data from the monitoring transects were then scaled up to represent the
population at Beatty Creek ACEC (discussed further in Results).
Eucephalus vialis population survey, 2010 4
RESULTS AND DISCUSSION
Population surveys
Intuitive Controlled surveys performed in 2009 estimated 2,400 Eucephalus vialis
individuals at 132 points within the Beatty Creek drainage and its tributaries to the west (Figure
2). Subpopulations ranged in size from 1 to greater than 150 individuals and were generally
located on the north-facing slopes of the Beatty Creek tributary drainages and the east-facing
slopes of the Beatty Creek drainage adjacent to the creek (between the tributary drainages).
Eucephalus vialis also commonly occurred along game trails adjacent to the east side of Beatty
Creek. Complete survey routes are shown in Figure 2.
Eucephalus vialis was commonly associated with transitional zones between mesic plant
communities dominating the drainages and xeric communities on the adjacent slopes. Woody
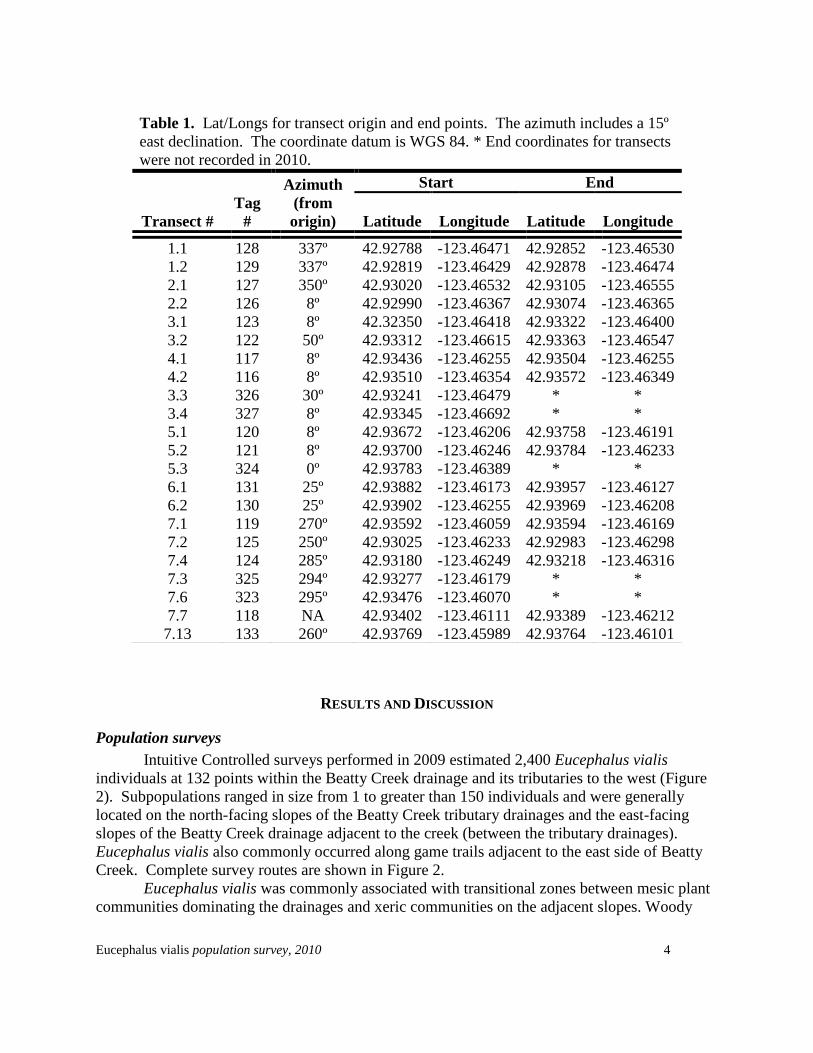
Table 1. Lat/Longs for transect origin and end points. The azimuth includes a 15º
east declination. The coordinate datum is WGS 84. * End coordinates for transects
were not recorded in 2010.
Azimuth
(from
origin)
Start End
Transect #
Tag
# Latitude Longitude Latitude Longitude
1.1 128 337º 42.92788 -123.46471 42.92852 -123.46530
1.2 129 337º 42.92819 -123.46429 42.92878 -123.46474
2.1 127 350º 42.93020 -123.46532 42.93105 -123.46555
2.2 126 8º 42.92990 -123.46367 42.93074 -123.46365
3.1 123 8º 42.32350 -123.46418 42.93322 -123.46400
3.2 122 50º 42.93312 -123.46615 42.93363 -123.46547
4.1 117 8º 42.93436 -123.46255 42.93504 -123.46255
4.2 116 8º 42.93510 -123.46354 42.93572 -123.46349
3.3 326 30º 42.93241 -123.46479 * *
3.4 327 8º 42.93345 -123.46692 * *
5.1 120 8º 42.93672 -123.46206 42.93758 -123.46191
5.2 121 8º 42.93700 -123.46246 42.93784 -123.46233
5.3 324 0º 42.93783 -123.46389 * *
6.1 131 25º 42.93882 -123.46173 42.93957 -123.46127
6.2 130 25º 42.93902 -123.46255 42.93969 -123.46208
7.1 119 270º 42.93592 -123.46059 42.93594 -123.46169
7.2 125 250º 42.93025 -123.46233 42.92983 -123.46298
7.4 124 285º 42.93180 -123.46249 42.93218 -123.46316
7.3 325 294º 42.93277 -123.46179 * *
7.6 323 295º 42.93476 -123.46070 * *
7.7 118 NA 42.93402 -123.46111 42.93389 -123.46212
7.13 133 260º 42.93769 -123.45989 42.93764 -123.46101
Eucephalus vialis population survey, 2010 5
plants common in the drainages included Pseudotsuga menziesii, Calocedrus decurrens,
Umbellularia californica, Cupressus lawsoniana, Rhododendron occidentale, and Holodiscus
discolor, whereas common upland associations included either Ceanothus cuneatus shrubland
with scattered Pinus jeffreyi (especially on the west-facing slope of main drainage and the ridges
and south-facing slopes of the tributaries) or P. jeffreyi savanna with scattered Arbutus menziesii,
H. discolor, and Toxicodendron diversilobum. While E. vialis occasionally strayed farther into
P. jeffreyi woodlands, it was never found in C. cuneatus shrublands. Similarly, E. vialis was
occasionally spotted underneath denser canopy cover of P. menziesii and/or C. decurrens
(especially in tributary drainages), but was never found in the interior of the more mesic and
shaded habitat of the main Beatty Creek drainage (including U. californica, C. lawsoniana, and
R. occidentale).
Population monitoring
In 2009, monitoring along eighteen transects recorded 443 plants with an average of 1.6
stems per plant. Reproductive plants accounted for 38% of the population (167 individuals) and
supported 3,386 capitula, or about 20 capitula per reproductive plant. The average longest stem
of each plant (44.8 cm) was only slightly longer than the average stem length (41.4 cm). Deer
browsed 186 stems (26%) and accounted for a loss of approximately 31% of potential capitula.
Insect damage was observed on 656 stems (93%) but only resulted in an estimated loss of 3.2%
of potential capitula.
In 2010, monitoring of 23 transects recorded 552 plants with an average of 1.5 stems per
plant. Reproductive plants accounted for 42% of the population (229 individuals) and supported
4,348 capitula or about 19 capitula per plant. The average longest stem of each plant (43.7 cm)
was only slightly longer the average stem length (41.5 cm). Deer browsed 322 stems (40%) and
accounted for a loss of approximately 33% of potential capitula. Insect damage was observed on
679 stems (84%) but only resulted in an estimated loss of 0.6% of potential capitula. It is unclear
the effect that insect grazing on leaves leads to stress in the plant which may halt or delay the
formation of flowers.
These data allow the Beatty Creek population to be compared to E. vialis plants located
in the Eugene District BLM in Forest Canopy Thinning (FCT) plots and plots which received no
canopy manipulation (unthinned)(Thorpe et al. 2010). The average longest stem length per plant
was greater in the FCT compared to Beatty Creek (54.9 vs. 43.8cm respectively); the total stem
length per plant was over double in the FCT plots (128.6.cm vs. 57.3cm). This trend can be
attributed to a greater number of stems per plant present in the FCT population (2.3 vs. 1.5) and a
slightly longer average stem length. However, a slightly greater percentage of plants flowered at
Beatty Creek (41%) than in the FCT plots (36%).
The most notable difference was that populations with an open canopy (Beatty Creek and
the FCT plots) had much higher flowering rates (41% and 36% respectively) than the unthinned,
control plots (3%). As their name suggests, the FCT plots have been subjected to an
experimental regime to determine the efficacy of different forest canopy thinning treatments in
terms of plant reproduction. The Beatty Creek population is not constrained by disturbances to
keep the canopy open in order to promote reproduction; the serpentine-derived substrate
precludes plant communities that form dense canopies except where plenty of water is present
(e.g. drainages).
Eucephalus vialis population survey, 2010 6
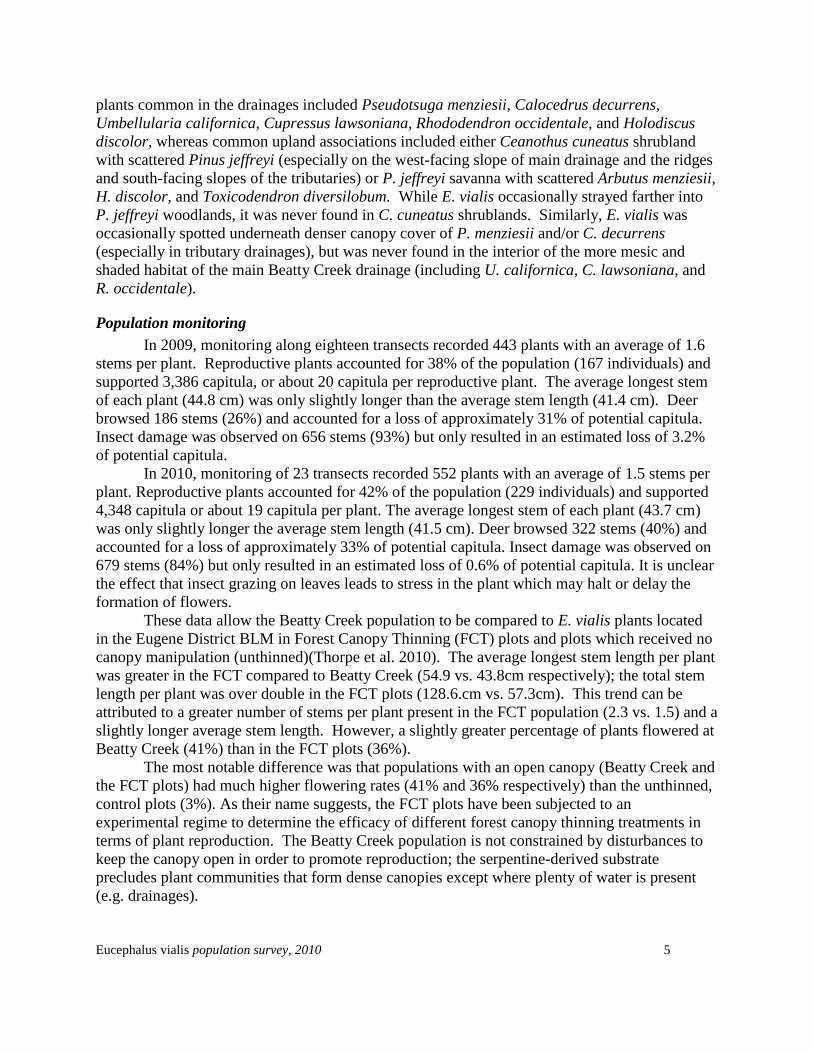
Table 2. Comparison of plant data from Beatty Creek, Forest Canopy Thinning (FCT) plots and
those with the canopy intact.
FCT Plots Unthinned plots Beatty Creek
2010 2009 2010 2009 2010 2009
Average stem length(cm) 55.5 55.9 36.8 37.8 41.5 41.1
Average stems per plant 2.3 2.2 1.7 1.8 1.5 1.6
% Reproductive 36% 29% 3% 3% 41% 38%
Ave. Capitula per Repro. Plant 23.9 30.0 29.7 17.9 19.0 20.3
Capitula per Plant 8.5 8.8 0.88 0.58 7.9 7.6
Longest Stem (cm) 54.9 53.1 22.67 24.15 43.75 44.33
Total Stem Length (cm) 128.6 120.7 47.59 48.78 57.3 61.8
Deer Browse (#) Stems 0.8 0.6 0.3 0.1 0.4 0.4
(%) Capitula 10.5 3.0 0 0 33.9 21.0
Insect Herbivory (#) Stems 2.1 1.9 1.2 1.3 0.8 1.5
(%) Capitula 0.0 0.8 0 0 0.7 3.7
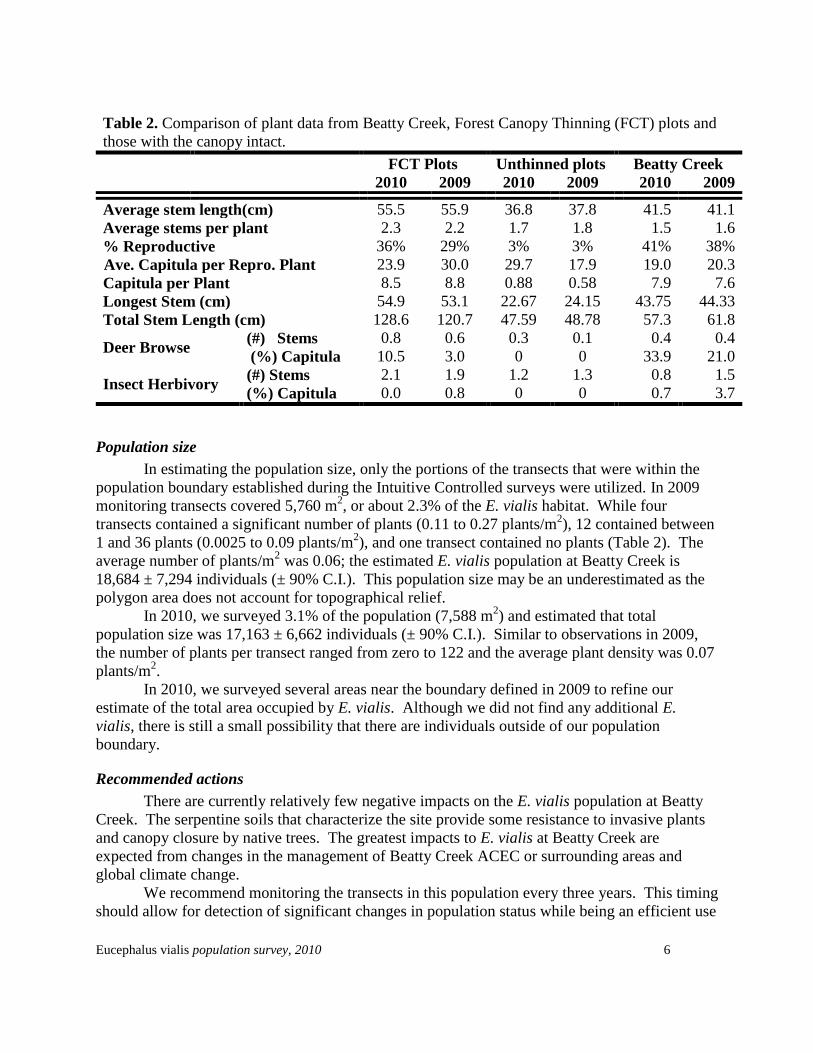
Population size
In estimating the population size, only the portions of the transects that were within the
population boundary established during the Intuitive Controlled surveys were utilized. In 2009
monitoring transects covered 5,760 m2, or about 2.3% of the E. vialis habitat. While four
transects contained a significant number of plants (0.11 to 0.27 plants/m2), 12 contained between
1 and 36 plants (0.0025 to 0.09 plants/m2), and one transect contained no plants (Table 2). The
average number of plants/m2 was 0.06; the estimated E. vialis population at Beatty Creek is
18,684 ± 7,294 individuals (± 90% C.I.). This population size may be an underestimated as the
polygon area does not account for topographical relief.
In 2010, we surveyed 3.1% of the population (7,588 m2) and estimated that total
population size was 17,163 ± 6,662 individuals (± 90% C.I.). Similar to observations in 2009,
the number of plants per transect ranged from zero to 122 and the average plant density was 0.07
plants/m2.
In 2010, we surveyed several areas near the boundary defined in 2009 to refine our
estimate of the total area occupied by E. vialis. Although we did not find any additional E.
vialis, there is still a small possibility that there are individuals outside of our population
boundary.
Recommended actions
There are currently relatively few negative impacts on the E. vialis population at Beatty
Creek. The serpentine soils that characterize the site provide some resistance to invasive plants
and canopy closure by native trees. The greatest impacts to E. vialis at Beatty Creek are
expected from changes in the management of Beatty Creek ACEC or surrounding areas and
global climate change.
We recommend monitoring the transects in this population every three years. This timing
should allow for detection of significant changes in population status while being an efficient use

Eucephalus vialis population survey, 2010 7
of resources. In future years, additional conduit should be added to each transect (e.g. at every
25m) in order to assist with sighting the transect orientation. This would allow a comparison of
not only shifts in total population, but also shifts in plant density throughout the population.
Eucephalus vialis population survey, 2010 8
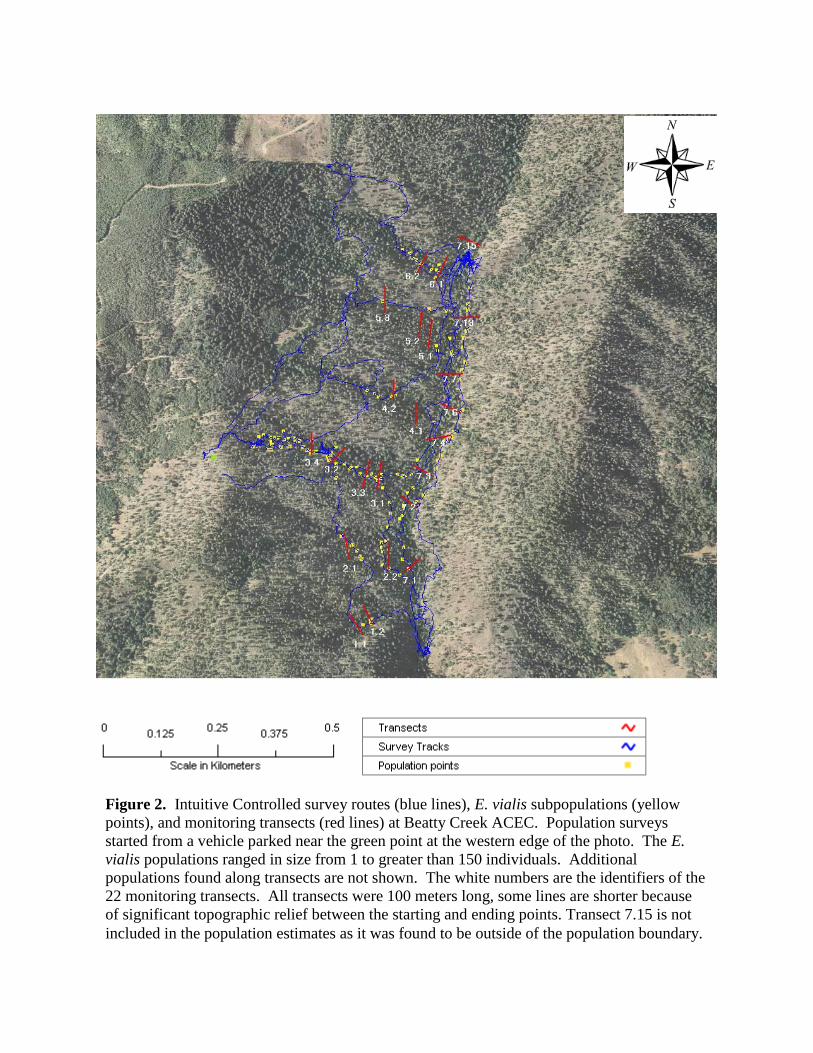
Figure 2. Intuitive Controlled survey routes (blue lines), E. vialis subpopulations (yellow
points), and monitoring transects (red lines) at Beatty Creek ACEC. Population surveys
started from a vehicle parked near the green point at the western edge of the photo. The E.
vialis populations ranged in size from 1 to greater than 150 individuals. Additional
populations found along transects are not shown. The white numbers are the identifiers of the
22 monitoring transects. All transects were 100 meters long, some lines are shorter because
of significant topographic relief between the starting and ending points. Transect 7.15 is not
included in the population estimates as it was found to be outside of the population boundary.

Eucephalus vialis population survey, 2010 9
Figure 3. Estimated extent of Eucephalus vialis population based on population surveys and
population monitoring transects. Populations recorded during Intuitive Controlled surveys
are shown with yellow dots.

Eucephalus vialis population survey, 2010 10
Table 3. Results of E. vialis monitoring along 17 transects located at Beatty Creek ACEC in 2009.
Transect # Area
(m2)
Tag # Number
of plants
Average #
stems per
plant
Average
stem length
(cm)
Average
longest stem
length (cm)
Total #
capitula
Deer Browsed Insect Browsed
Total #
stems
Average %
capitula
Total #
stems
Average %
capitula
1.1 300 128 1 1.0 17.0 17.0 0 1 100.0 1 0.0
1.2 320 129 25 1.3 46.6 47.9 203 3 6.0 33 6.4
2.1 280 127 2 2.0 41.8 50.5 0 0 0.0 4 0.0
2.2 400 126 44 1.3 39.2 42.1 139 6 4.4 58 3.6
3.1 400 123 69 1.6 38.2 42.2 390 31 27.5 105 0.0
3.2 200 122 68 2.2 65.9 71.8 1647 17 10.6 149 13.5
4.1 400 117 9 1.3 31.0 31.9 11 5 33.3 8 5.6
4.2 264 116 8 1.3 28.5 29.3 2 7 78.6 9 0.0
5.1 400 120 16 1.9 44.4 48.6 59 13 40.8 30 0.9
5.2 400 121 109 1.3 25.4 26.4 215 38 14.1 107 0.0
6.1 256 131 13 1.5 53.6 57.9 121 2 15.4 18 0.0
6.2 328 130 36 1.8 32.0 34.9 185 35 39.6 60 3.2
7.1 360 119 10 1.6 56.6 58.9 76 9 65.4 16 6.0
7.2 324 125 0
7.4 400 124 14 2.1 55.5 64.4 156 5 4.9 30 10.9
7.7 400 118 15 1.4 53.5 57.0 182 14 56.0 20 0.7
7.13 328 133 4 2.0 33.4 35.3 0 0 0.0 8 0.0
AVERAGES: 339 26.1 1.6 41.4 44.8 211.6
TOTALS: 5760 443 3386 186 656
Estimated population size 18,684 ± 7,294 (90%C.I.)

Eucephalus vialis population survey, 2010 11
Table 3 Cont. Results of E. vialis monitoring along 22 transects located at Beatty Creek ACEC in 2010.
Transect # Area
(m2)
Tag # Number
of plants
Average
stem
length
(cm)
Average #
stems per
plant
Average
longest stem
length (cm)
Total #
capitula
Deer Browsed Insect Browsed
Total #
stems
Average %
capitula
Total #
stems
Average %
capitula
1.1 300 128 8 55.3 1.5 74.1 117 0.9 43.1 1.3 10.0
1.2 320 129 54 59.3 1.5 75.2 541 0.3 12.7 1.0 0.9
2.1 280 127 5 52.0 2.4 85.0 24 1.0 50.0 1.0 0.0
2.2 400 126 21 49.3 1.3 56.1 180 0.4 36.2 1.3 0.0
3.1 400 123 36 39.6 1.3 47.4 244 0.8 28.0 1.0 0.4
3.2 200 122 45 45.8 1.7 63.7 360 1.0 48.8 1.2 0.0
3.3 400 326 75 54.8 1.9 86.1 1239 0.5 23.0 1.6 0.0
3.4 400 327 62 44.2 1.5 58.4 827 0.7 34.2 1.4 0.0
4.1 400 117 4 37.3 2.8 84.3 0 2.5 100.0 2.8 0.0
4.2 264 116 16 28.9 1.4 37.1 5 0.9 78.4 1.3 0.0
5.1 400 120 7 39.9 1.7 62.7 6 0.4 42.9 1.7 14.3
5.2 400 121 122 29.2 1.2 32.5 206 0.5 36.6 1.0 1.0
5.3 400 324 18 44.3 1.2 48.9 134 0.6 39.4 1.1 0.0
6.1 256 131 15 43.2 1.4 56.8 149 0.5 38.3 1.3 0.0
6.2 328 130 33 45.9 1.3 53.9 356 0.7 32.8 1.2 0.0
7.1 360 119 10 57.4 1.2 67.9 64 0.7 65.0 1.2 1.0
7.2 324 125 0
7.3 400 325 0 0
7.4 400 124 0
7.7 400 118 15 48.1 1.5 65.1 0 0.2 6.7 1.5 0.0
7.6 228 323 0
7.13 328 133 6 26.8 1.3 33.8 0 0.5 16.7 1.3 0.0
AVERAGES: 335.5 25.1 44.5 1.6 60.5 234.3 0.7 40.7 1.3 1.5
TOTALS: 7588 552 4452
Estimated Population size 17,163 ± 6,662 (90%C.I.)
Eucephalus vialis population survey, 2010 12
LITERATURE CITED
Carter, S. 2004. Beatty Creek Research Natural Area. Kalmiopsis, vol. 11, pp 54-62.
Gammon, J. 1986. Unpublished Draft Status Report, Aster vialis. Oregon Natural Heritage
Data Base. Portland, Oregon. 49 pp.
Kaye, T., K. Kuykendall, and W. Messinger. 1991. Aster vialis Inventory, Monitoring, and
Pollination Biology. Final Report Submitted to the BLM by the Oregon Department of
Agriculture. October 1990. 22 pp.
Kaye, T.N. 2001. Propagation methods and preliminary evidence of the importance of
population size for Aster vialis, a rare plant of western Oregon forests. Institute for Applied
Ecology, Corvallis, Oregon and Eugene District, BLM, Eugene, Oregon. 15 pp.
Kuykendall, K. 1991. Pollination Study of Aster vialis. Senior Thesis, Portland State University
Honor's Program. 10 pp.
Oregon Natural Heritage Information Center. 2007. Rare, Threatened and Endangered
Species of Oregon. Oregon Natural Heritage Information Center, Oregon State University,
Portland, Oregon. 100 pp.
Thorpe, A.S., R.E. Newton, and T.N. Kaye. 2010. Experimental habitat manipulation of
wayside aster (Eucephalus vialis). Institute for Applied Ecology, Corvallis, Oregon, USDI
Bureau of Land Management, Eugene District, and National Fish and Wildlife Foundation.
iv + 54.
Whiteaker, L., J. Henderson, R. Holmes, L. Hoover, R. Lesher, J. Lippert, E. Olson, L. Potash, J.
Seevers, M. Stein, N. Wogen. 1998. Survey protocols for survey & manage strategy 2
vascular plants. V 2.0. Bureau of Land Management.
http://www.blm.gov/or/plans/surveyandmanage/SP/VascularPlants/cover.htm

Eucephalus vialis population survey, 2010 13
APPENDIX A. GEAR LIST, DATASHEETS, AND DIRECTIONS
Gear List for EUVI – Roseburg
100 meter tape (2)
Candy canes (4)
1 meter plot frame sections (4)
Compass
Tatum and Clipboard
Pencils
Extra lead
Data sheets (Rite in Rain)
Rulers (4)
Flora
GPS
Camera
Extra batteries
Gazetteer
Roseburg Resource Area transportation map (the one with the route highlighted)
Flagging
Conduit (1 tall, 1 small per plot)
Mallet
Wire
Numbered tags
Pliers
Aerial photos and local topos
Water jugs
Health and safety box (make sure there is tecnu)
Camping gear

Eucephalus vialis population survey, 2010 14
Eucephalus vialis, Beatty Creek
Names:
Transect #: GPS Coords (Datum = ): Start:
Date: Azimuth (from origin): End:
Plant # # stems Stem Lengths (cm) # capitula
Deer Browse Insect Browse
NOTES # stems % capitula # stems % capitula

Eucephalus vialis population survey, 2010 15
Directions to Beatty Creek ACEC/RNA
From I-5, take exit 103 and drive west on Riddle Bypass Road (Pruner Rd). After ~6 miles,
slight right onto Cow Creek Road (might seem like road just continues). After ~3.7 miles there
is another slight right to stay on Cow Creek Road. Drive ~2 miles and turn right onto Doe Creek
Rd (you have to cross over railroad tracks, BLM 30.7.23). Reset your odometer once you turn
onto Doe Creek. All mileages hereafter are from the junction of Cow Creek and Doe Creek
Roads. Stay right after ~1.1 miles. After ~1.9 miles turn right. At about 2.5 miles you will
reach a 3- or 4-way junction, take a hard left. Stay right at ~2.6 miles. Stay right at ~3.0 miles.
At ~3.7 miles take a right off of the improved road. At ~4.4 miles stay right (road looks even
worse). At 5.0 miles you are at the parking place. There are several spots in the last section that
are washed out and passable only with a high clearance vehicle and someone spotting the driver.
Be careful! It would be better to walk the extra quarter mile than to get a tow truck out here.