
Population Representation in the Military Services · At the close of FY 1998, the Total Force...
124
Population Representation in the Military Services Fiscal Year 1998 November 1999 November 1999
Transcript of Population Representation in the Military Services · At the close of FY 1998, the Total Force...

PopulationRepresentation
in the Military Services
Fiscal Year 1998
November 1999November 1999

1-1
Chapter 1
INTRODUCTION
This is the 25th annual Department of Defense (DoD) report on social representation in the U.S.Military Services. Such a profile of the social demography of the military was initiated in response to amandate by the Senate Committee on Armed Services (Report 93-884, May 1974). Since fiscal year(FY) 1975, the Directorate for Accession Policy, Office of the Assistant Secretary of Defense (ForceManagement Policy) has provided annual data addressing the quality and representativeness of enlistedaccessions and personnel compared to the civilian population. In keeping with an increased emphasisand reliance on a Total Force, Accession Policy has expanded this report to include statistics not onlyfor active duty enlisted personnel but for officers and reservists as well.
Added for the first time this year are data on the U.S. Coast Guard (USCG). Although theCoast Guard is routinely under the Department of Transportation, in times of war and nationalemergency, this armed force reports to the Department of the Navy. The USCG has fewer personnelrequirements than any of the Military Services but it confronts many of the same personnel managementissues including recruitment, personnel selection, and representation.
The term “representation” may suggest a focus on race/ethnicity and gender demographicgroups. However, this report presents a broader array of characteristics. In addition to routinedemographics (e.g., age, gender, race/ethnicity) estimates of cognitive ability supplemented with morecomplex composite measures (e.g., socioeconomic status) and service characteristics (e.g., years ofservice and pay grade) are used to describe the force. Further, historical data are included to aid inanalyzing trends to render the statistics more interpretable. Thus, recruit quality, representation rates,and the like can be viewed within the context of the preceding decades. These data are invaluable tomilitary personnel policymakers and analysts as well as others interested in monitoring the characteristicsof people serving in the Military Services.
The aim of the Population Representation report is to disseminate facts regarding thedemographic, educational, aptitude, and socioeconomic levels of applicants, new recruits, and enlistedand officer members of the Active Forces and Reserve Components. Aptitude, education levels, age,race/ethnicity, and gender are among the mainstay statistics that shed light on the formidable task ofrecruiting. Years of service and pay provide measures of the degree of personnel experience as well ascareer progress that are particularly informative when examined by gender and race/ethnicity. Indeedthis report has increased in volume and coverage over the years, but it has not outgrown its usefulness.Representation levels may change only slightly from year to year but monitoring racial/ethnic and genderparticipation together with additional relevant factors maintains an ever present focus on equalopportunity.
The chapters that follow provide a narrative description with selected tables and graphs, as wellas a detailed set of technical appendices addressing many of the traits and characteristics of currentmilitary personnel. This chapter sets the tone and provides some interpretive guidance with regard tothe voluminous contents of the Population Representation report.
1-2
Fiscal Year 1998: A New Military for a New Age
FY 1998 marks the 25th Anniversary of the All Volunteer Force (AVF). The enthusiasticparticipation of Blacks in the military and the expanded use of women has been a hallmark of the AVF.FY 1998 also is the 50th Anniversary of the integration of minorities and women in the military. In July1948, President Harry S. Truman issued Executive Order 9981 and ended the policy of raciallysegregating units. A month earlier, in that same year, Congress passed the Women’s Armed ForcesIntegration Act. At the crossroads of these two anniversaries, it is an appropriate time to reflect on theresults of these policy changes and how they have altered the U.S. military to make it one of the finestand most complex that history has known.
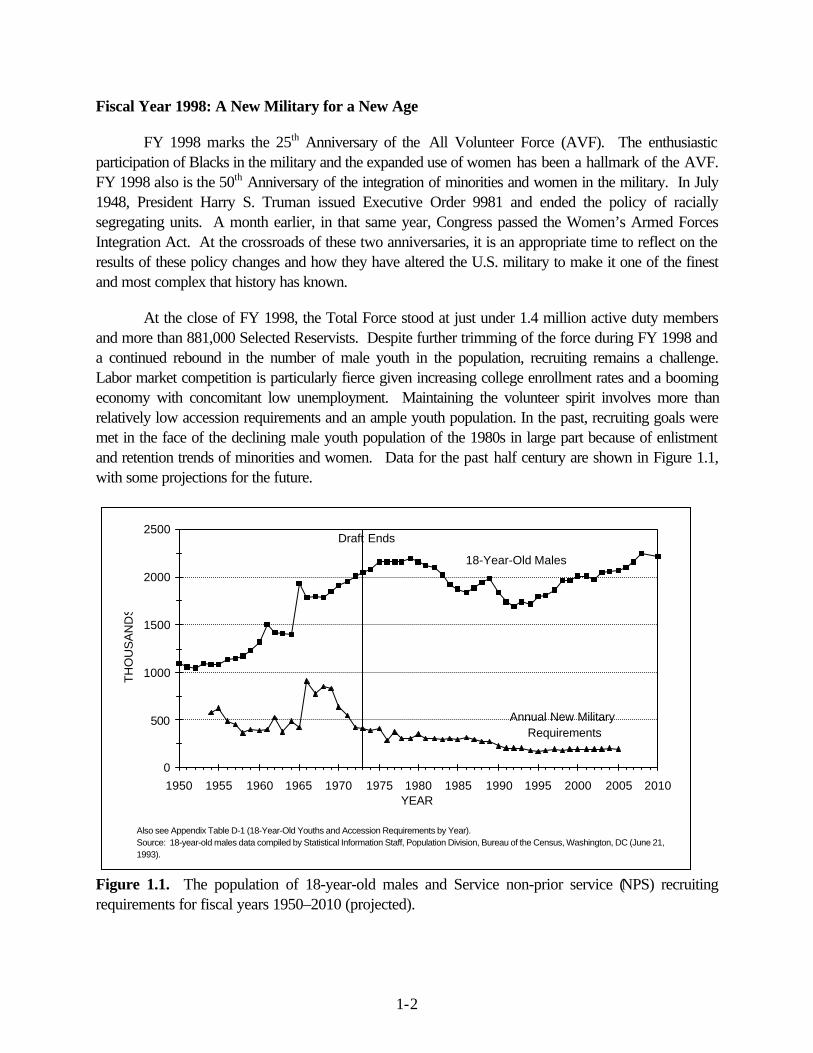
At the close of FY 1998, the Total Force stood at just under 1.4 million active duty membersand more than 881,000 Selected Reservists. Despite further trimming of the force during FY 1998 anda continued rebound in the number of male youth in the population, recruiting remains a challenge.Labor market competition is particularly fierce given increasing college enrollment rates and a boomingeconomy with concomitant low unemployment. Maintaining the volunteer spirit involves more thanrelatively low accession requirements and an ample youth population. In the past, recruiting goals weremet in the face of the declining male youth population of the 1980s in large part because of enlistmentand retention trends of minorities and women. Data for the past half century are shown in Figure 1.1,with some projections for the future.
18-Year-Old Males
Annual New Military Requirements
0
500
1000
1500
2000
2500
1950 1955 1960 1965 1970 1975 1980 1985 1990 1995 2000 2005 2010YEAR
THO
US
AN
DS
Draft Ends
Also see Appendix Table D-1 (18-Year-Old Youths and Accession Requirements by Year).Source: 18-year-old males data compiled by Statistical Information Staff, Population Division, Bureau of the Census, Washington, DC (June 21, 1993).
Figure 1.1. The population of 18-year-old males and Service non-prior service (NPS) recruitingrequirements for fiscal years 1950–2010 (projected).

1-3
Diversity continues to grow. Blacks maintain their strong military presence and have made gainsin the officer corps. Hispanics and other racial/ethnic minorities comprise notable proportions ofenlisted members and officers alike. The real representation issue concerns women. While theycomprise half of the youth population, they stand at less than 20 percent of both enlisted and officeraccessions. However, these figures are all-time highs in the representation of women entering themilitary. Before the AVF, in FY 1964, less than 1 percent of enlisted accessions were women.Women climbed to 5 percent in 1973. Ten years ago, women stood at 13 percent of accessions and asof FY 1998 they accounted for 18 percent of new recruits. At just over 19 percent, theirrepresentation among officer accessions was even stronger. The representation levels for womenamong active component enlisted members and the officer corps were also record breaking at 14percent, each.
Remaining Challenges
Volunteers for today’s military lifestyle and missions come from a myriad of demographic andsocial lines and paths: Black, White, and “Other”; North, South, East, and West; middle class, rich, andpoor; married and single; and men and women. This constellation of people train and fight or keeppeace in an unstable interwoven world including the volatility of Kosovo and the lethal potential broughtto the fore by the nuclear weapons potential of unpredictable states such as Iraq and North Korea. Inaddition to search and rescue missions, the domestically based Coast Guard must tackle such difficultduties as drug interdiction.
The challenges today’s deployed military personnel confront are different than the challenges ofthose deployed in the wars of the 1950s, 1960s and 1970s. Since the end of the Cold War, the UnitedStates has struggled with its new and multifaceted strategic role in the world. While today’s military hasfewer people, the new strategic realities mean there are more roles and missions for those reducednumbers to fulfill. Additionally, the end of the draft brought with it a recruiting climate which compelledmanpower and personnel planners to think outside of the box. With a strong economy and largernumbers of college-bound youth, recruiting and representation are tandem concerns that today’s militarypersonnel management must confront. Retention within and beyond the initial period of obligation is alsocritical. Reducing personnel turnover and turbulence not only eases recruiting strain but feeds neededlevels of diversity and experience to the career force.
Today many minorities and women not only participate in the military, but also achieve highlevels of success and recognition. While the news is good, significant challenges remain. For example, itis easy to over-emphasize the problems of women’s increased integration or under-emphasize the needto continue to foster positive race relations. Fifty years ago, minorities and women were given apermanent role in the military. Today’s volunteer military relies upon the resultant multicultural cadre ofquality men and women who stand ready to carry out missions at home and around the globe. In theinterest of military cohesion, morale, and readiness in the 21st century, progress toward equitable accessto the risks and rewards of military service must continue.
1-4
Data Sources
The primary sources for this report are computerized data files on military personnel maintainedby the Defense Manpower Data Center (DMDC). In addition, the Bureau of Labor Statistics (BLS)provides the bulk of the comparison data on the national population. Though the data sources haveremained constant, refinements have been made over the years, most of them in regard to the civiliancomparisons. Starting with the report for FY 1994, Census data were adjusted to provide a moreaccurate comparison for military applicants and accessions (yearly average rather than last month ofthe fiscal year). Age comparisons for prior-service enlisted accessions to the Selected Reserve werealso adjusted, from the 18- to 44-year-old civilian labor force to the 20- to 39-year-old civilian laborforce. Comparisons for Selected Reserve enlisted members were changed from 18- to 44-year-oldcivilians to 18- to 49-year-olds. Starting with data for FY 1995, a further age refinement wasintroduced for comparisons with the officer corps. Previously the comparison group for ActiveComponent officers comprised civilian workforce college graduates who were 21 and older. This wasadjusted by establishing an upper bound at age 49, making the more precise comparison, collegegraduates aged 21 to 49 who are in the workforce. In addition, beginning with the FY 1995Population Representation report, DMDC provided edited, rather than raw, data on applicants forenlistment. Last year, prior service accession data for the Active Component were added. U.S. CoastGuard representation statistics are included for the first time this year. A brief description of the datasources for FY 1998 follows:
Subject Data Source
Active Components
Applicants to Enlisted Military DMDC U.S. Military Entrance ProcessingCommand (USMEPCOM) Edit Files,October 1997 through September 1998
Enlisted Accessions DMDC USMEPCOM Edit Files, October1997 through September 1998
Enlisted Force DMDC Active and Loss Edit File,September 1998
Officer Accessions DMDC Officer Gain Files, October 1997through September 1998
Officer Corps DMDC Officer Master and Loss Edit File,September 1998

1-5
Recruit Socioeconomic Status DMDC Survey of Recruit SocioeconomicBackgrounds, October 1997 throughSeptember 1998
Reserve Components
Selected Reserve Enlisted andOfficer Accessions
Reserve Components Common PersonnelData System (RCCPDS), October 1997through September 1998
Selected Reserve EnlistedForce and Officer Corps
Reserve Components Common PersonnelData System (RCCPDS), September 1998
Civilian Comparisons
Civilian Comparison Groupsfor Applicants, Accessions,and Active and ReserveMembers
Bureau of Labor Statistics CurrentPopulation Survey Files, October 1997through September 1998
Civilian SocioeconomicComparison Data
Bureau of Labor Statistics CurrentPopulation Survey Files, October 1997through September 1998
Civilian Comparisons forMilitary Entrance Test Data
Profile of American Youth (Washington,DC: Office of the Assistant Secretary ofDefense [Manpower, Reserve Affairs, andLogistics], March 1982).

2-1
Chapter 2
ACTIVE COMPONENT ENLISTED APPLICANTS AND ACCESSIONS
The Services are one of the largest employers in the United States, enlisting more than 180,000young men and women in the Active Components in FY 1998. Recruiting a quality force is asimportant as ever, perhaps more important, given the smaller number of men and women in the militaryand the increasing sophistication of weapons and methods for fighting modern wars. Service missionsare changing to include peacekeeping and humanitarian efforts, requiring additional skills from today'smen and women in uniform.
Military recruiting is challenging in today’s society. The Youth Attitude Tracking Study(YATS), conducted annually, measures propensity to enlist. About one-quarter (26 percent) of youngmen (16- to 21-year-olds) reported that they planned definitely or probably to enlist in the military in thenext few years.1 Overall propensity, as measured by YATS, has not changed significantly since 1994.The significant drop in the propensity of 16- to 21-year-old Hispanic men, from 43 percent in 1996 to37 percent in 1997, rebounded to 44 percent in 1998. Also, propensity of 16- to 21-year-old womenincreased slightly from 12 percent in 1997 to 13 percent in 1998.2
The Monitoring the Future (MtF) project, a survey of high school students, also measures youthenlistment intentions. Results from the most recent period—1991 to 1997—have shown the lowestpropensity since the MtF project began collecting data in 1975. This time period can be characterizedby a large-scale military downsizing during an economic boom. The percent reporting that theydefinitely will enlist in the Armed Forces, a stable measure across time and grade-level, dropped below5 percent and at the same time the percent declaring that they definitely would not enlist climbed above70 percent.3
As the United States experiences its lowest unemployment rate in 30 years,4 employers—including the military—find recruiting qualified personnel very competitive. The increasing proportion ofhigh school graduates attending college limits the supply of high-quality applicants to the Services. Mosthigh school seniors report that they plan to go to college (77 percent right after high school and 15
1 Enlistment propensity is measured with the Youth Attitude Tracking Study (YATS) conducted annually bythe Department of Defense.
2 Ibid.
3 Segal, D.R., Bachman, J.G., Freedman-Doan, P., and O’Malley, P.M., “Propensity to Serve in the U.S. Military:Temporal Trends and Subgroup Differences,” Armed Forces & Society, 25 (1999), pp. 407–427.
4 Labor force statistics extracted from the Current Population Survey, Bureau of Labor Statistics. (Seasonallyadjusted unemployment rate of 16-year-olds and older and 16- to 19-year-olds in the civilian labor force.)URL:http://www.dol.gov.

2-2
percent a year or more after graduating).5 About 67 percent of today's high schoolers actually enroll incollege in the Fall after graduation, compared to 65 percent last year and about half of high schoolgraduates 15 years ago.6 The increasing desire to participate in post-secondary education is importantto monitor as propensity of college-bound youth is lower than for those not planning to attend college.7
In spite of relatively low propensity, record low unemployment rates, and increasing competition withcolleges and universities, military recruiters were able to enlist a high-quality accession cohort in FY1998.8 Recruiting is likely to continue to be a challenge as recruiting objectives increase amid a strongeconomy and increasing opportunities for post-secondary education.9 This chapter introduces theActive Component enlistment process, followed by demographic characteristics of enlisted applicantsand recruits.
The Recruiting Process
Initial contacts between military recruiters and youth interested in military service areexploratory. In most cases, youth seek information from recruiters in more than one Service. Oncethey select a Service and take the Armed Services Vocational Aptitude Battery (ASVAB), youth maywait before deciding to proceed with enlistment processing.
In addition to providing information to the prospective enlistee, recruiters determine anapplicant's eligibility for military service. They ask questions regarding age, citizenship, education,involvement with the law, use of drugs, and physical and medical conditions that could precludeenlistment. Most prospects take an aptitude screening test at a recruiting office. Estimates are that 10to 20 percent of prospects do not continue beyond this point.10
The Armed Services Vocational Aptitude Battery. Prospects who meet initialqualifications take the ASVAB, the first formal step in the process of applying to enlist in the ArmedForces. The ASVAB is a battery of tests used by DoD to determine enlistment eligibility and 5 Lehnus, J. and Lancaster, A., “Declining Interest in Military Service: Quantitative Observations,” in YouthAttitudes Toward Military Service in the Post-Cold War Era: Selected Papers Presented at the InternationalMilitary Testing Association, San Antonio, Texas, 1996 (DMDC Report No. 97-001).
6 U.S. Department of Education, The Digest of Education Statistics 1998 (NCES 1999-036) (Washington, DC:National Center for Education Statistics, 1999), Table 183.
7 Segal, D.R., Bachman, J.G., Freedman-Doan, P., and O’Malley, P.M., “Propensity to Serve in the U.S. Military:Temporal Trends and Subgroup Differences,” Armed Forces & Society, 25 (1999), pp. 407–427.
8 Memorandum from F. M. Rush, Acting Assistant Secretary of Defense (Force Management Policy), Subject:1998 Youth Attitude Tracking Study, January 5, 1999.
9 Gilroy, C. and Sellman, W.S., Today’s Recruiting Challenge and The Economic Implications of an All-Volunteer Force, paper presented as part of Panel on Recruitment in the All-Volunteer Era: Theory, practice, andresults at the 1999 Inter-University Seminar of Armed Forces and Society Biennial Conference, Baltimore, October1999.
10 Waters, B.K., Laurence, J.H., and Camara, W.J., Personnel Enlistment and Classification Procedures in theU.S. Military (Washington, DC: National Academy Press, 1987), p. 12.

2-3
qualifications for military occupations. It consists of 10 tests, four of which comprise the Armed ForcesQualification Test (AFQT): Arithmetic Reasoning, Mathematics Knowledge, Word Knowledge, andParagraph Comprehension. The AFQT, a general measure of trainability and a predictor of on-the-jobperformance, is the primary index of recruit aptitude.
AFQT scores, expressed on a percentile scale, reflect an applicant's standing relative to thenational population of men and women 18–23 years of age.11 The scores are grouped into fivecategories based on the percentile score ranges shown in Table 2.1. Persons who score in Categories Iand II tend to be above average in trainability; those in Category III, average; those in Category IV,below average; and those in Category V, markedly below average. By law, Category V applicants andthose in Category IV who have not graduated from high school are not eligible for enlistment. Over andabove these legal restrictions, each Service prescribes its own aptitude and education criteria foreligibility. Each Service uses combinations of ASVAB test scores to determine an applicant's aptitudeand eligibility for different military occupations.
Table 2.1. Armed Forces Qualification Test (AFQT) Categories andCorresponding Percentile Score Ranges
AFQT Category Percentile Score Range
I 93–99
II 65–92
IIIA 50–64
IIIB 31–49
IV 10–30
V 1–9
Educational Credentials. DoD implemented a three-tier classification of education credentialsin 1987. The three tiers are:
• Tier 1—Regular high school graduates, adult diploma holders, and non-graduates with atleast 15 hours of college credit.
• Tier 2—Alternative credential holders, including those with a General EducationDevelopment (GED) certificate of high school equivalency.
• Tier 3—Those with no education credentials.
11 The score scale is based on a 1980 study, the Profile of American Youth, conducted by DoD in cooperationwith the Department of Labor (DoL). Participants were drawn from a nationally representative sample of young menand women selected for an ongoing DoL study, the National Longitudinal Survey of Youth Labor Force Behavior.An effort is currently underway to update the Profile of American Youth study.

2-4
The system was developed after research indicated a strong relationship between educationcredentials and successful completion of the first term of military service.12 Current research continuesto show that education attainment of youth predicts first-term military attrition.13 In conjunction with theNational Academy of Sciences, the Defense Department developed a mathematical model that linksrecruit quality and recruiting resources to job performance. The model was then used to establish therecruit quality benchmarks now specified in Defense Planning Guidance. Service programs are requiredto ensure that a minimum of 90 percent of non-prior service (NPS) recruits are high school diplomagraduates. At least 60 percent of these recruits must be drawn from AFQT Categories I–IIIA; no morethan 4 percent of the recruits can come from Category IV. This DoD policy does not prohibit theServices from setting their own targets above these benchmarks. These benchmarks were set byexamining the relationship between costs associated with recruiting, training, attrition, and retention usingas a standard the performance level obtained by the reference cohort of 1990, the cohort that served inOperations Desert Shield and Desert Storm. Thus, these benchmarks reflect the recruit quality levelsnecessary to minimize personnel and training costs while maintaining Desert Shield/Desert Storm cohortperformance.14
The Services have different standards for individuals in each tier. Generally, Tier 3 applicantsmust have higher AFQT test scores than Tier 2 applicants, who must have higher test scores than Tier 1individuals. The Air Force and Marine Corps follow these differential standards, requiring differentminimum test scores for each tier. The other Services apply the standards slightly differently. The Armyand Navy require applicants with alternative credentials (Tier 2) and those with no credentials (Tier 3)to meet the same AFQT standards, which are more stringent than those for high school graduates (Tier1).
With the proliferation of alternative credential programs, particularly home schooling, theDepartment of Defense initiated a pilot study in FY 1999—The Alternative Educational Credential PilotProgram. The goals of the project are to assess the interest in enlistment of home school graduates andparticipants earning GED certificates through the National Guard ChalleNGe program and to evaluatethe performance of the alternative credential holders in these programs who do enlist. At the conclusionof the study, the results will be used to provide a recommendation on permanent tier status of homeschool graduates and ChalleNGe GED applicants.
12 See Flyer, E.S., Factors Relating to Discharge for Unsuitability Among 1956 Airman Accessions to the AirForce (Lackland AFB, TX: Personnel Research Laboratory, December 1959); and Elster, R.E. and Flyer, E.S., A Studyof the Relationship Between Educational Credentials and Military Performance Criteria (Monterey, CA: NavalPostgraduate School, July 1981).
13 For attrition by education credential, see Department of Defense, Educational Enlistment Standards:Recruiting Equity for GED Certificates, Report to Congress (Washington, DC: Office of the Assistant Secretary ofDefense [Force Management Policy], April 1996); and Laurence, J.H., Does Education Credential Still PredictAttrition?, paper presented as part of Symposium, Everything Old is New Again—Current Research Issues inAccession Policy, at the 105th Annual Convention of the American Psychological Association, Chicago, August1998.
14 Sellman, W.S., Public Policy Implications for Military Entrance Standards, Keynote Address presented atthe 39th Annual Conference of the International Military Testing Association, Sydney, Australia, October 1998.
2-5
Physical Examination. If an applicant achieves qualifying ASVAB scores and wants tocontinue the application process, he or she is scheduled for a physical examination and backgroundreview at a Military Entrance Processing Station (MEPS). The examination assesses physical fitness formilitary service. It includes measurement of blood pressure, pulse, visual acuity, and hearing; bloodtesting and urinalysis; drug and HIV testing; and medical history. Some Services also require tests ofstrength and endurance. If a correctable or temporary medical problem is detected, the applicant maybe required to get treatment before proceeding. Other applicants may require a Service waiver of somedisqualifying medical conditions before being allowed to enlist.
Moral Character Standards . Each applicant must meet rigorous moral character standards.In addition to the initial screening by the recruiter, an interview covering each applicant's background isconducted at the MEPS. For some individuals, a financial credit check and/or a computerized searchfor a criminal record is conducted. Some types of criminal activity are clearly disqualifying; other casesrequire a waiver, wherein the Service examines the applicant's circumstances and makes an individualdetermination of qualification. Moreover, applicants with existing financial problems are not likely toovercome those difficulties on junior enlisted pay. Consequently, credit histories also may beconsidered as part of the enlistment decision.
Occupational Area Counseling. If the applicant's ASVAB scores, educational credentials,physical fitness, and moral character qualify for entry, he or she meets with a Service classificationcounselor at the MEPS to discuss options for enlistment. Up to this point, the applicant has made nocommitment. The counselor has the record of the applicant's qualifications and computerizedinformation on available Service training/skill openings, schedules, and enlistment incentives.
A recruit can sign up for a specific skill or for a broad occupational area (such as the mechanicalor electronics areas). In the Army, all recruits enter for specific skill training. Approximately 60 percentof Air Force recruits enter for a specific skill, while the rest sign up for an occupational area and areclassified into a specific skill while in basic training. In the Navy, approximately 70 percent of recruitsenlist for a specific skill, while the rest go directly to the fleet after basic training, classified in airman,fireman, or seaman programs. Approximately 85 percent of Marine Corps enlistees enter with aguaranteed occupational area and are assigned a specific skill within that area after recruit training; therest enlist with either a specific job guarantee or assignment to a job after recruit training.
Normally an applicant will be shown a number of occupations. In general, the higher theindividual's test scores, the more choices he or she will have. While the process differs by Service,specific skills and occupational groupings are arranged similarly to an airline reservation system, with the"seat" and time of travel (to recruit training) based upon either school or field unit position openings.The counselor discusses the applicant's interests and explains what the Service has to offer. Thecounselor may suggest incentives to encourage the applicant to choose hard-to-fill occupationalspecialties. The applicant, however, is free to accept or reject the offer.
Many applicants do not decide immediately, but take time to discuss options with family andfriends; others decide not to enlist. A review of the enlistment decision process indicates that the

2-6
military continues to compete with civilian employment and educational opportunities even after theprospect has completed the application stage of the enlistment process.15
The Delayed Entry Program (DEP). When the applicant accepts an offer, he or she signs anenlistment contract. Only a small proportion of new enlistees is sent to a recruit training center from theMEPS within a month of their enlistment. Most enter the delayed entry program (DEP), which allowsup to a year before the individual reports for duty, with up to a 6-month extension upon approval by therespective Service Secretary.16 The DEP controls recruit flow into training "seats" at technical schools.Average time in the DEP is about four months.
Qualified high school students may enlist in the DEP with a reporting date after graduation; theirenlistment contract is contingent upon successfully completing high school. Not all DEP enlisteesactually enter active duty. By Service, an average of 11 to 19 percent of individuals in the DEPchanged their minds and asked to be released from their enlistment contracts in FY 1998. The Servicesconsider enlistment in the DEP a serious commitment, but they do not require youth to enter militaryservice against their will during peacetime.
Characteristics of Active Component Non-Prior Service Applicants
In FY 1998, approximately 347,000 individuals applied to serve in the active enlisted militaryforce (Appendix Table A-1). The distribution of FY 1998 Active Component NPS applicants byrace/ethnicity and gender is shown in Table 2.2.
Seventy-eight percent of the applicants were male, of whom 63 percent were White, 20 percentBlack, 11 percent Hispanic, and 7 percent “Other.”17 For female applicants, approximately 53 percentwere White, 30 percent Black, 10 percent Hispanic, and 7 percent “Other.” Additional statistics onapplicant characteristics (e.g., age, education levels, AFQT scores, and marital status, by gender andrace/ethnicity) are contained in Appendix A, Tables A-1 through A-8.
Characteristics of Active Component Accessions
During FY 1998, 180,031 Active Component non-prior service recruits (individuals who hadnot previously served in the military) and 5,508 prior service recruits (individuals with militaryexperience) shipped to recruit training centers (Table 2.3). This does not include individuals whoentered the DEP in FY 1998 but had not been sent to basic training by September 30, 1998, nor doesit include Reserve Component recruits (see Chapter 5 for Reserve Component enlisted accession data).
15 Orvis, B.R. and Gahart, M.T., Enlistment Among Applicants for Military Service: Determinants andIncentives (Santa Monica, CA: RAND Corporation, 1990), p. vii.
16 10 U.S.C. 513, as amended December 1996.
17 Includes Native Americans, Asians, and Pacific Islanders.

2-7
Table 2.2. Race/Ethnicity and Gender of FY 1998 Active Component NPS Applicants*, by Service(Percent)
Army Navy Marine Corps Air Force DoD
MALES
White 60.7 59.2 66.5 70.0 62.6
Black 23.0 20.1 15.0 17.1 20.1
Hispanic 10.8 10.9 12.9 7.1 10.8
Other 5.5 9.8 5.7 5.9 6.5
Total 100.0 100.0 100.0 100.0 100.0
FEMALES
White 50.5 50.3 57.6 60.5 53.0
Black 33.4 28.8 21.0 25.5 30.0
Hispanic 10.1 11.1 13.9 7.2 10.0
Other 6.0 9.8 7.5 6.9 7.1
Total 100.0 100.0 100.0 100.0 100.0
TOTAL
Male 76.0 78.7 89.9 67.9 77.7
Female 24.0 21.3 10.1 32.1 22.3Columns may not add to total due to rounding.
* Applicant data reported for FY 1998 are based on the DMDC Edit version of the MEPCOM file, which has been "cleaned" by theedit process. FY 1998 applicant data are consistent with Information Delivery System (IDS) data. However, comparisons of FY1998 applicant data to data reported in Population Representation reports for FY 1994 or earlier (from unedited MEPCOM files)may show differences.Also see Appendix Tables A-3 (Race/Ethnicity by Service and Gender) and A-4 (Ethnicity by Service).
Table 2.3. FY 1998 Active Component Non-Prior Service (NPS) andPrior Service Enlisted Accessions
Enlisted Accessions
ServicePrior
ServiceNon-PriorService Total
Non-Prior Service Percent of Service Total
Army 4,299 68,321 72,620 94.1
Navy 707 46,726 47,433 98.5
Marine Corps 184 33,450 33,634 99.5
Air Force 318 31,534 31,852 99.0
DoD Total 5,508 180,031 185,539 97.0
Also see Appendix Tables B-13 through B-22 (Prior Service Accessions).
In the Active Component, 97 percent of accessions have never served in the military before.The small number of prior service accessions enlisting in FY 1998 are older and more likely to bemarried than their NPS counterparts. Prior service recruits more closely resemble the ActiveComponent enlisted force—in terms of age and marital status—from which most of them came. Interms of other characteristics, they are similar to their non-prior service counterparts. Additional
2-8
statistics on prior service accession characteristics (e.g., race/ethnicity, education levels, and AFQTscores) are contained in Appendix B, Tables B-13 through B-22. The remainder of this sectionexamines a number of sociodemographic characteristics of FY 1998 NPS recruits, and compares themwith the 18- to 24-year-old civilian non-institutionalized U.S. population.
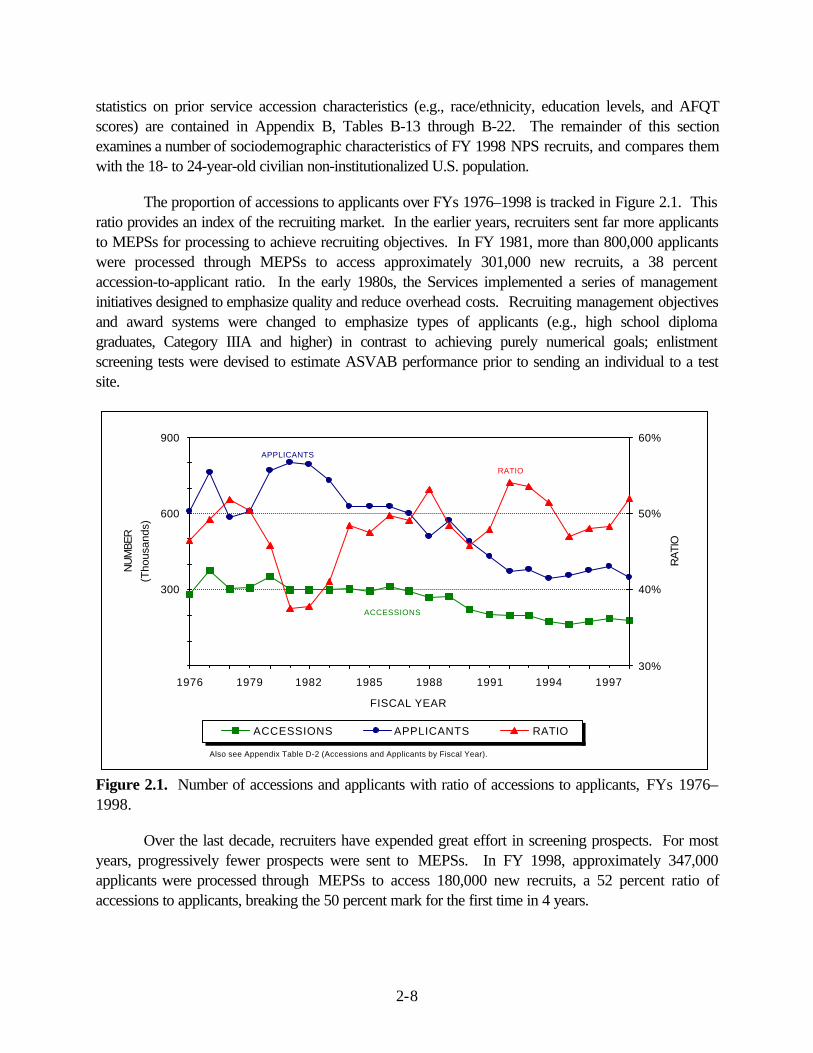
The proportion of accessions to applicants over FYs 1976–1998 is tracked in Figure 2.1. Thisratio provides an index of the recruiting market. In the earlier years, recruiters sent far more applicantsto MEPSs for processing to achieve recruiting objectives. In FY 1981, more than 800,000 applicantswere processed through MEPSs to access approximately 301,000 new recruits, a 38 percentaccession-to-applicant ratio. In the early 1980s, the Services implemented a series of managementinitiatives designed to emphasize quality and reduce overhead costs. Recruiting management objectivesand award systems were changed to emphasize types of applicants (e.g., high school diplomagraduates, Category IIIA and higher) in contrast to achieving purely numerical goals; enlistmentscreening tests were devised to estimate ASVAB performance prior to sending an individual to a testsite.
ACCESSIONS
APPLICANTS
RATIO
300
600
900
1976 1979 1982 1985 1988 1991 1994 1997
FISCAL YEAR
NU
MBE
R(T
hous
ands
)
30%
40%
50%
60%
RAT
IO
ACCESSIONS APPLICANTS RATIO
Also see Appendix Table D-2 (Accessions and Applicants by Fiscal Year).
Figure 2.1. Number of accessions and applicants with ratio of accessions to applicants, FYs 1976–1998.
Over the last decade, recruiters have expended great effort in screening prospects. For mostyears, progressively fewer prospects were sent to MEPSs. In FY 1998, approximately 347,000applicants were processed through MEPSs to access 180,000 new recruits, a 52 percent ratio ofaccessions to applicants, breaking the 50 percent mark for the first time in 4 years.

2-9
Age. By law, Active Component recruits must be between 17 and 35 years old; 17-year-oldsmust have parental permission to enlist.18 Within the 17–35 age range, the Services have different ageceilings. The Army and Navy accept applicants up to age 35; the Air Force accepts recruits prior totheir 28th birthday, and the Marine Corps age limit is 29.
The age distribution of FY 1998 active duty NPS accessions is shown in Table 2.4.Approximately, 87 percent of new recruits are 18- to 24-year-olds, compared to about 35 percent ofthe comparable civilian population. The Marine Corps enlists the greatest percentage of 17- and 18-year-old recruits (48 percent) and the smallest percentage of those over age 21 (11 percent). TheArmy has the greatest proportion of recruits older than age 21 (23 percent) and the smallest proportionof 17- and 18-year-old recruits (38 percent).
Table 2.4. Age of FY 1998 Active Component NPS Accessions, by Service, andCivilians 17–35 Years Old (Percent)
Age Army NavyMarineCorps
Air ForceDoD
17- to 35-Year-OldCivilians
Number of Accessionsper 1,000 Civilians
17 5.9 6.1 6.9 4.4 5.9 5.5 2.7
18 31.8 34.6 41.2 34.4 34.8 5.3 15.9
19 20.2 22.6 23.7 24.1 22.2 5.2 10.4
20 11.4 12.3 10.9 13.7 11.9 5.0 5.9
21 7.6 7.5 5.9 8.3 7.4 4.9 3.7
22 5.6 4.9 3.7 5.6 5.0 4.6 2.7
23 4.4 3.3 2.5 3.6 3.6 4.8 1.9
24 3.2 2.4 1.7 2.2 2.5 4.8 1.3
>24 10.0 6.2 3.4 3.8 6.7 59.8 0.3
Total 100.0 100.0 100.0 100.0 100.0 100.0 2.5
Columns may not add to total due to rounding.Also see Appendix Table B-1 (Age by Service and Gender).Source: Civilian data from Bureau of Labor Statistics Current Population Survey File, October 1997 – September 1998.
The right column of Table 2.4 shows the numerical rate at which civilian youth in each age groupenlisted in the Armed Services in FY 1998. For example, an average of 15.9 of every 1,000 18-year-olds and 1.3 of every 1,000 24-year-olds enlisted in FY 1998.
Race/Ethnicity. Significant racial/ethnic differences exist among the Services, as shown inTable 2.5. Approximately 39 and 41 percent of Army and Navy accessions, respectively, areminorities, as compared to 32 percent of Marine Corps recruits and 31 percent of Air Force recruits.The Services maintained their 36 percent rate of minority recruitment in FY 1998. The proportion ofHispanics and “Other” minorities increased as the proportions of Blacks and Whites decreased,generally mirroring the trend in the comparable civilian population.
18 10 U.S.C. 505.

2-10
Table 2.5. Race/Ethnicity and Gender of FY 1998 Active Component NPS Accessions, by Service,and Civilians 18–24 Years Old (Percent)
Army NavyMarineCorps Air Force DoD
MALES
White 63.8 61.2 69.1 71.6 65.5
Black 20.8 18.3 12.8 15.7 17.7
Hispanic 10.4 11.1 13.0 7.0 10.6
Other 5.0 9.4 5.1 5.7 6.3
Total 100.0 100.0 100.0 100.0 100.0
FEMALES
White 51.3 52.6 61.8 61.3 55.0
Black 33.7 27.2 17.4 24.8 28.4
Hispanic 9.6 11.0 14.2 7.0 9.7
Other 5.3 9.2 6.6 7.0 6.9
Total 100.0 100.0 100.0 100.0 100.0
TOTAL
Male 81.1 81.0 92.6 73.9 81.9
Female 18.9 19.0 7.4 26.1 18.1
White 61.5 59.6 68.6 68.9 63.6
Black 23.2 20.0 13.1 18.1 19.6
Hispanic 10.3 11.1 13.1 7.0 10.4
Other 5.0 9.4 5.3 6.0 6.4
Non-Institutionalized Civilians 18–24 Years Old
White
65.9
Black
14.2
Hispanic
15.0
Other
4.9
Total
100.0
Male
50.1
Female
49.9Columns may not add to total due to rounding.Also see Appendix Tables B-3 (Race/Ethnicity by Service and Gender) and B-4 (Ethnicity by Service).Source: Civilian data from Bureau of Labor Statistics Current Population Survey File, October 1997 – September 1998.
Figure 2.2 illustrates the race/ethnicity distribution of enlisted accessions for the 25-year period,FYs 1973–1998.19 Understanding the race/ethnicity profiles requires some explanation of events duringthe years up to 1985, before describing the current situation. The percentage of minority enlistedaccessions increased, with some fluctuations, during the years following the end of conscription. Thenumber of Black accessions peaked in FY 1979. Hispanic accessions also peaked in FY 1979(ignoring aberrant data for FY 1976). Accessions of "Other" minorities, a very small proportion of newrecruits, have generally shown a gradual increase from less than 1 percent in FY 1973 to 6 percent inFY 1998. The increase of minorities coincided with a miscalibration of the ASVAB, and consequentdrop in the aptitude of accessions, both Whites and minorities, beginning in January 1976. The 19 See Appendix Tables D-5 (White accessions), D-6 (Black accessions), D-7 (Hispanic accessions), and D-8("Other" accessions) by Service and fiscal year.

2-11
miscalibration led to erroneous enlistment of many low-scoring applicants. Thus, representation ofminorities, particularly Blacks (whose test scores, on average, are generally lower than those of Whites),increased during the miscalibration period. The error was corrected by September 1980.20
WHITE
BLACK
HISPANICOTHER
0%
10%
20%
30%
40%
50%
60%
70%
80%
1974 1976 1978 1980 1982 1984 1986 1988 1990 1992 1994 1996 1998
FISCAL YEAR
White Black Hispanic Other
Also see Appendix Table D-4 (Race/Ethnicity by Fiscal Year).
Figure 2.2. Race/ethnicity of Active Component NPS accessions, FYs 1973–1998.
Revised AFQT and education standards in the early 1980s limited the high minorityrepresentation levels of the late 1970s.21 By FY 1983, the proportion of Black recruits had returned toapproximately the same level as before the test scoring error (18 percent Blacks in FY 1975). By themid-1980s, a gradual increase had resumed. Not until FY 1987 did Hispanic recruit levels return to FY1975 proportions. Higher high school dropout rates among Hispanics (25 percent), compared toWhites and Blacks (8 and 13 percent, respectively), confound the recruitment of qualified Hispanicapplicants.22 The Services have accessed a greater proportion of Hispanics each year since FY 1985,when less than 4 percent of enlistees were Hispanic. Today, more than 10 percent of enlistees areHispanic.
Blacks. In FY 1998, Blacks comprised nearly 20 percent of enlisted recruits, approximately 5percentage points more than in the civilian population (14 percent). The Army continues to have thehighest percentage of Black accessions, 23 percent in FY 1998. In the aftermath of Operations Desert
20 Office of the Assistant Secretary of Defense (Manpower, Reserve Affairs, and Logistics), A Report to theHouse Committee on Armed Services: Aptitude Testing of Recruits (Washington, DC, 1980).
21 Congressional Budget Office, Social Representation in the U. S. Military (Washington, DC, 1989), p. 54.
22 See U.S. Department of Education, The Digest of Education Statistics 1998 (NCES 1999-036) (Washington,DC: National Center for Education Statistics, 1999), Table 105.

2-12
Shield and Desert Storm and in the midst of the drawdown (FY 1991), there were lower proportions ofBlack recruits than in previous years. FYs 1992 to 1998 saw slight increases each year toward pre-drawdown levels of 21 percent Black accessions. In FY 1998, there was a slight decrease in Blackenlistees.
While Black men comprise nearly 18 percent of DoD male recruits, Black women make upmore than 28 percent of female recruits (Table 2-5 and Appendix Table B-3). Black women in FY1998 comprised 34 percent of Army female recruits, 27 percent of Navy female recruits, 17 percent ofMarine Corps female recruits, and 25 percent of Air Force female recruits. In comparison, theproportion of Black men ranged from 13 percent of Marine Corps male recruits to 21 percent of Armymale recruits.
Hispanics. As the proportion of Hispanics has been increasing in the civilian population, so hasthe proportion of enlisted Hispanics. However, Hispanics were underrepresented among enlistedaccessions in FY 1998, 10 percent of recruits compared to 15 percent of civilian 18- to 24-year-olds.The Marine Corps had the highest proportion of Hispanic accessions (13 percent) in FY 1998,followed by the Navy, Army, and Air Force (11, 10, and 7 percent, respectively).
The proportion of Hispanic accessions has increased over the years (Appendix Table D-7). InFY 1983, less than 4 percent of new recruits were Hispanic. Today, more than 10 percent of enlistedaccessions are Hispanic. One factor influencing the representation of Hispanics in the military is highschool graduation rates. In FY 1998, 57 percent of 18- to 24-year-old Hispanics completed highschool (Tier 1) or earned an alternative credential (Tier 2) compared to 74 percent of Blacks and 84percent of Whites. Although Hispanics are less likely to earn a high school diploma than those in otherracial/ethnic groups, the graduation rates for this ethnic group generally have been on the rise.23
In contrast to Black females, Hispanic females are slightly less represented among femalerecruits than Hispanic men are among male recruits. Approximately 10 percent of NPS accessions areHispanic; 11 percent of male recruits and 10 percent of female recruits are Hispanic.
"Other" minorities. Members of "Other" racial minorities (e.g., Native Americans, Asians, andPacific Islanders), at 6 percent, are slightly overrepresented in the Services. The proportion of "Other"minorities ranges from 5.0 to 9.4 in the Services, with the Navy the highest. In the civilian population, 5percent of 18- to 24-year-olds are "Other" racial minorities, an increase of more than 3 percentagepoints since FY 1981.
Gender. Figure 2.3 illustrates the trend in the proportion of female recruits since the start of theAll Volunteer Force. Appendix Table D-9 shows the number and proportion of NPS femaleaccessions by Service in FY 1964 and FYs 1970 through 1998. The Air Force traditionally has thelargest proportion of women recruits and the Marine Corps the smallest, in part a result of the numberof positions open to women in these Services.
23 See U.S. Department of Education, The Condition of Education 1999 (NCES 1999-022) (Washington, DC:National Center for Education Statistics, 1999), p. 247; and previous Population Representation reports.

2-13
ARMY
NAVY
USMC
USAF
DoD
0%
5%
10%
15%
20%
25%
30%
1973 1975 1977 1979 1981 1983 1985 1987 1989 1991 1993 1995 1997
FISCAL YEAR
ARMY NAVY USMC USAF DoD
Also see Appendix Table D-9 (Female Accessions by Service and Fiscal Year).
Figure 2.3. Women as a percentage of Active Component NPS accessions, FYs 1973–1998.
The proportion of NPS women accessing into the Services, 18 percent in FY 1998, is notcomparable to female representation in the civilian population (50 percent). One reason for thedifference is the lower inclination of women than men to apply for and enter the military.24 With policychanges concerning women in combat,25 more women may enter the Services and retention mayincrease among female members. The gender-integration policy is just beginning to have an effect onthe numbers of women; FY 1995 was the first year under the new rules.26
Under a gender-neutral recruiting program since FY 1990, the Air Force leads the Services inthe proportion of female accessions. The Air Force has increased its proportion of female recruits, from20 percent in FY 1990 to 26 percent in FY 1998, a slight decrease from 28 percent in FY 1997 (seeTable D-9). When the Navy adopted a gender-neutral recruiting policy in FY 1994, the proportion ofwomen accessions in the Navy increased 3 percentage points (from 17 percent in FY 1994 to 20percent in FY 1995). However, the Navy dropped its gender-neutral recruiting policy because of the
24 The annual DoD-sponsored Youth Attitude Tracking Study indicates that young women, depending uponage, are approximately one-half less inclined to join the military than young men.
25 Memorandum from Les Aspin, Secretary of Defense, Subject: Policy on the Assignment of Women in theArmed Forces, April 28, 1993; Memorandum from Les Aspin, Secretary of Defense, Subject: Direct Ground CombatDefinition and Assignment Rule, January 13, 1994.
26 Memorandum from William Perry, Secretary of Defense, Subject: Application of the Definition of DirectGround Combat and Assignment Rule, July 28, 1994.

2-14
constrained berthing facilities on Navy vessels. The Navy’s decision to rescind gender-neutral recruitingmay be a factor in the 6-percentage-point drop of female accessions from FY 1995 to FY 1997 (from20 to 14 percent).27 However, the Navy was able to recruit a significantly larger proportion of womenin FY 1998 (19 percent).
Marital Status. The majority of accessions are young high school graduates and the military isoften their first full-time job. Thus, very few are married. In FY 1998, 9 percent of male and 12percent of female recruits were married, compared to 55 and 44 percent of male and female enlistedmembers, respectively. Table 2.6 compares marriage rates of accessions in the Services with 18- to24-year-old civilians in the labor force. Civilians are more likely to be married than accessions (15versus 9 percent). Within the Services, Army recruits are most likely to be married (14 percent) andMarine Corps recruits are least likely (4 percent). Figure 2.4 shows marital status trends for FYs 1976–
1998 by Service.
Table 2.6. FY 1998 Active Component NPS Accessions Who Are Married, by Gender and Service, andCivilians 18–24 Years Old (Percent)
Gender Army NavyMarine Corps
Air Force DoD
18- to 24-Year-OldCivilians
Males 13.5 5.0 4.1 9.3 8.7 10.6
Females 18.3 6.0 6.5 9.6 11.8 19.1
Total 14.4 5.2 4.3 9.3 9.2 14.8Also see Appendix Table B-2 (Marital Status by Age and Gender).Source: Civilian data from Bureau of Labor Statistics Current Population Survey File, October 1997 – September 1998.
A R M Y
NAVYUSMC
USAF
D o D
0%
2%
4%
6%
8%
10%
12%
14%
16%
18%
1976 1978 1980 1982 1984 1986 1988 1990 1992 1994 1996 1998
FISCAL YEAR
MAR
RIE
D
ARMY NAVY USMC USAF DoD
Also see Appendix Table D-10 (Mar i ta l Sta tus by Serv ice and F isca l Year) .
Figure 2.4. Marital status trends of Active Component NPS accessions, by Service, FYs 1976–1998.
27 Born, D.H., Women in the Military-Trends 1990 to 1996 (Washington, DC: Office of the Assistant Secretaryof Defense [Force Management Policy/Accession Policy]).

2-15
Research shows that marriage is important to a member’s long-term career and can enhanceindividual readiness.28 This is true if the member is in a strong marriage to a supportive but independentspouse. However, combining marriage and a military career can create challenges for youngerServicemembers as well as the Service. Entering into marriage just prior to or soon after enlisting in theService can place extra burdens on the recruit, the family, and the military, particularly when frequent orunexpected deployments separate the “new” family. Thus, marital status trends of accessions (andmembers) are an important characteristic to monitor.
Education. More than 30 years of research indicates that enlistees who are high schoolgraduates are much more likely than non-graduates to complete their first term of enlistment (80 percentversus 50 percent).29 In the late 1960s and early 1970s, the Services gave high school graduates,including those with alternative education credentials, higher priority for enlistment. In the mid- to late1970s, the Army, Navy, and Air Force classified GED holders and high school graduates differentlybecause evidence showed that persons with GED certification experienced higher first-term attrition.Today, in all Services, applicants with GEDs need higher AFQT scores to enlist than do high schooldiploma graduates.
Additional research indicates that those with other alternative credentials, such as adulteducation and correspondence school diplomas, also have attrition rates greater than regular high schoolgraduates.30 In 1987, DoD implemented a three-tier classification of education credentials. Table 2.7shows the percentage of FY 1998 active duty NPS accessions by education tier. Ninety-four percentof recruits possessed high school diplomas and/or some college education (Tier 1); 6 percent heldalternative high school credentials (Tier 2); and less than 1 percent had not completed high school (Tier3). It should be noted that enlisted occupations are generally comparable to civilian jobs not requiringcollege education.
While 99 percent of FY 1998 accessions were in Tiers 1 and 2, only 79 percent of 18- to 24-year-old civilians were high school graduates or possessed a GED certificate. Differences amongServices in FY 1998 high school graduate accessions were small, ranging from 99 percent (Air Force)to 90 percent (Army). The Army had the highest proportion of recruits with Tier 2 credentials (10percent); the Air Force had the lowest (1 percent). In FY 1998, the Navy did not enlist any applicantswithout education credentials; the other Services’ acceptance of recruits with no high school credentialsranged from less than one-tenth of one percent to less than 2 percent.
28 Office of the Assistant Secretary of Defense (Personnel and Readiness), Family Status and Initial Term ofService, Volume I – Summary (Washington, DC: Author, December 1993).
29 See Flyer, E.S., Factors Relating to Discharge for Unsuitability Among 1956 Airman Accessions to the AirForce (Lackland AFB, TX: Personnel Research Laboratory, December 1959); Elster, R.E. and Flyer, E.S., A Study ofthe Relationship Between Educational Credentials and Military Performance Criteria (Monterey, CA: NavalPostgraduate School, July 1981); and Lindsley, D.H., Recruiting of Women, presented to 1995 Committee on Womenin the NATO Forces Conference, June 2, 1995.
30 Laurence, J.H., Military Enlistment Policy and Educational Credentials: Evaluation and Improvement(Alexandria, VA: Human Resources Research Organization, September 1987).

2-16
Table 2.7 Levels of Education of FY 1998 Active Component NPS Accessions, by Service, andCivilians 18–24 Years Old (Percent)
Education Level1 Army NavyMarineCorps
AirForce DoD
18- to 24-Year-OldCivilians*
Tier 1: Regular High SchoolGraduate or Higher
90.1 94.5 95.6 99.1 93.9
Tier 2: GED, AlternativeCredentials
9.9 5.5 2.7 0.7 5.778.8
Tier 3: No Credentials ** 0.0 1.7 0.2 0.4 21.2
Total 100.0 100.0 100.0 100.0 100.0 100.0
College Experience(Part of Tier 1)2 6.9 3.6 2.5 17.8 7.1 45.8Columns may not add to total due to rounding.* Civilian numbers and percentages combine Tiers 1 and 2 as civilian data include GED certificates with high school graduate rates.** Less than one-tenth of one percent.1 Service data from OASD(FMP)(MPP)/Accession Policy have been reviewed and updated by the Services for official submission.Data presented in this table may differ slightly from the data shown in appendix tables that are taken from DMDC's USMEPCOMEdit File.2 College experience data from the Services are defined as those individuals with the following credentials: associate degree,professional nursing diploma, baccalaureate, master's, post master's, doctorate, first-professional, or completed one semester ofcollege.Also see Appendix Tables B-7 (Education by Service and Gender) and B-8 (Education by Service and Race/Ethnicity).Source: Service data from OASD(FMP)(MPP)/Accession Policy—submitted in accordance with DoD Instruction 7730.56. USMCcollege experience from DMDC’s USMEPCOM Edit File. Civilian data from Bureau of Labor Statistics Current Population SurveyFile, October 1997 – September 1998.
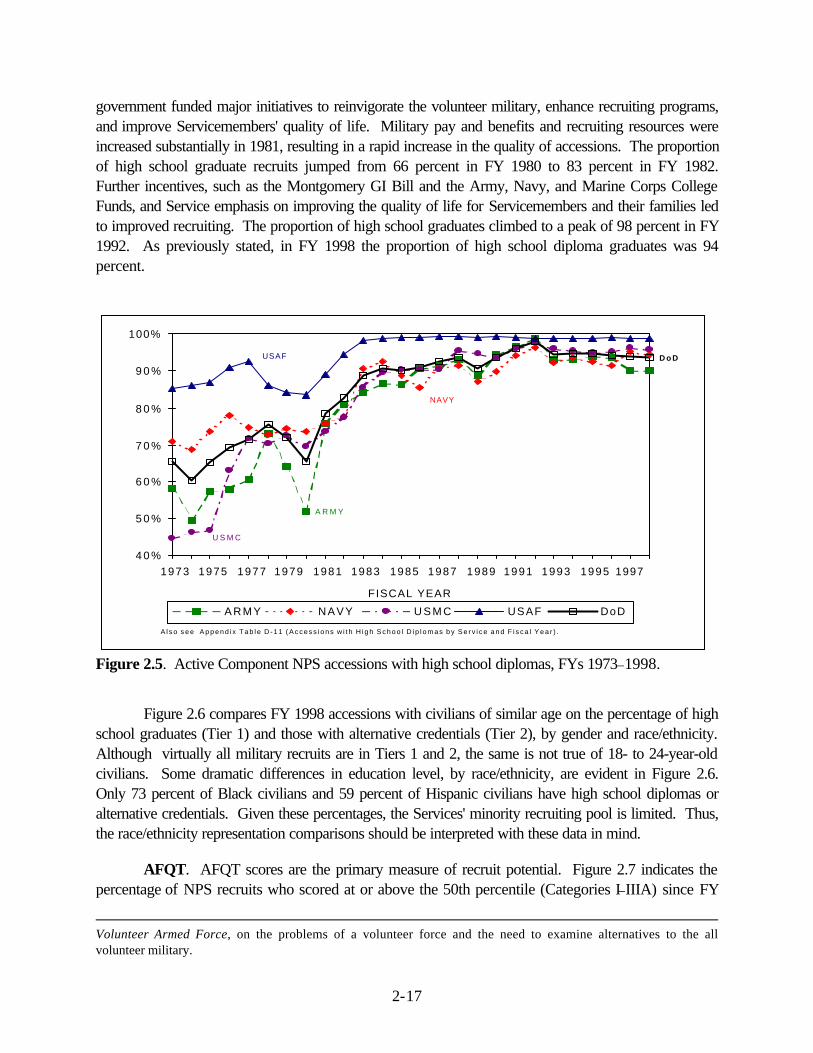
The proportion of accessions with high school diplomas by Service for FYs 1973 through 1998is shown in Figure 2.5. During most of the first decade of the volunteer military (FYs 1973–1982), theServices differed significantly in the proportion of high school diploma graduates. In addition, therewere significant variations across years. Across Services, the proportion of accessions with high schooldiplomas fell from 75 percent in FY 1978 to 66 percent in FY 1980. The drop was most pronouncedin the Army, declining from 73 to 52 percent over that period.
During the mid-1970s, the Services operated with reduced recruiting budgets. At the sametime, there were highly publicized reports of shrinking military benefits and significant gaps in paycomparability with the civilian sector. Media articles cited the hemorrhage of talent from the Servicesdue to loss of benefits, and the percentage of Servicemembers eligible for food stamps.
Because of lower education levels of new recruits, lower test scores, and increasing minorityrepresentation during this period, debates began on whether to replace the volunteer force with either aform of national service or a return to the draft.31 The Executive and Legislative branches of
31 In December 1976, the Department of Defense released a report, The All Volunteer Force: Current Status andProspects, which listed seven alternatives to the all volunteer military. On June 20, 1978, the Senate Subcommittee onManpower and Personnel of the Committee on Armed Services conducted an extensive hearing, Status of the All-
2-17
government funded major initiatives to reinvigorate the volunteer military, enhance recruiting programs,and improve Servicemembers' quality of life. Military pay and benefits and recruiting resources wereincreased substantially in 1981, resulting in a rapid increase in the quality of accessions. The proportionof high school graduate recruits jumped from 66 percent in FY 1980 to 83 percent in FY 1982.Further incentives, such as the Montgomery GI Bill and the Army, Navy, and Marine Corps CollegeFunds, and Service emphasis on improving the quality of life for Servicemembers and their families ledto improved recruiting. The proportion of high school graduates climbed to a peak of 98 percent in FY1992. As previously stated, in FY 1998 the proportion of high school diploma graduates was 94percent.
A R M Y
NAVY
U S M C
USAF D o D
4 0 %
5 0 %
6 0 %
7 0 %
8 0 %
9 0 %
100%
1973 1975 1977 1979 1981 1983 1985 1987 1989 1991 1993 1995 1997
FISCAL YEAR
A R M Y NAVY U S M C USAF DoD
A l s o s e e A p p e n d i x T a b l e D - 1 1 ( A c c e s s i o n s w i t h H i g h S c h o o l D i p l o m a s b y S e r v i c e a n d F i s c a l Y e a r ) .
Figure 2.5. Active Component NPS accessions with high school diplomas, FYs 1973–1998.
Figure 2.6 compares FY 1998 accessions with civilians of similar age on the percentage of highschool graduates (Tier 1) and those with alternative credentials (Tier 2), by gender and race/ethnicity.Although virtually all military recruits are in Tiers 1 and 2, the same is not true of 18- to 24-year-oldcivilians. Some dramatic differences in education level, by race/ethnicity, are evident in Figure 2.6.Only 73 percent of Black civilians and 59 percent of Hispanic civilians have high school diplomas oralternative credentials. Given these percentages, the Services' minority recruiting pool is limited. Thus,the race/ethnicity representation comparisons should be interpreted with these data in mind.
AFQT. AFQT scores are the primary measure of recruit potential. Figure 2.7 indicates thepercentage of NPS recruits who scored at or above the 50th percentile (Categories I–IIIA) since FY
Volunteer Armed Force, on the problems of a volunteer force and the need to examine alternatives to the allvolunteer military.

2-18
1973. Numerical data are in Appendix D, Table D-12. The drop in Category I–IIIA recruits after FY1976 was due primarily to the miscalibration of the ASVAB.32 In FY 1976, when new versions of theASVAB were introduced, an error in calibrating the score scales made the new versions "easier" thanthe old versions (i.e., applicants received test scores higher than their actual ability). In FY 1980, anindependent study of the calibration was made and the test was correctly calibrated. Then, Congressadded legal provisions stipulating that no more than 20 percent of accessions could be in Category IVand that such accessions had to be high school diploma graduates.33 However, as previously stated,Defense Planning Guidance decreases this limit even further, allowing no more than 4 percent of recruitsto come from Category IV.
0%10%20%30%40%50%60%70%80%90%
100%
Male Female White Black Hispanic Other
DoD Civilian
Source: Civilian data from Bureau of Labor Statistics Current Population Survey, October 1996 - September 1997.
Figure 2.6. FY 1998 accessions and 18- to 24-year-old civilians who earned high school diplomas(Tier 1) or alternative credentials (Tier 2), by gender and race/ethnicity.
Figure 2.7 shows FY 1977 as the low point and FY 1992 as the high point in accessing recruitsin Categories I to IIIA. In FY 1977, 34 percent of accessions scored in the top half of the AFQT 32 See two documents: Sims, W.H. and Truss, A.R., A Reexamination of the Normalization of Armed ServicesVocational Aptitude Battery (ASVAB) Forms 6, 7, 6E, and 7E (Alexandria, VA: Center for Naval Analyses,September 1980); and Laurence, J.H. and Ramsberger, P.F., Low-Aptitude Men in the Military: Who Profits, WhoPays? (New York: Praeger, 1991).
33 10 U.S.C. 520.

2-19
distribution. Only 13 percent of Blacks, 19 percent of Hispanics, and 20 percent of "Others" scored inCategories I–IIIA.34 Fifteen years later, in FY 1992, the majority of minority accessions achievedscores in the I–IIIA range (Blacks - 56 percent, Hispanics - 67 percent, "Others" - 67 percent).Hispanics have shown the most marked increase, with a 48-percentage-point gain in Category I to IIIAaccessions from FY 1977 to FY 1992.
0%
10%
20%
30%
40%
50%
60%
70%
80%
1973 1975 1977 1979 1981 1983 1985 1987 1989 1991 1993 1995 1997
FISCAL YEARAlso see Appendix Table D-12 (AFQT Category by Fiscal Year).
ASVAB Misnorming
Figure 2.7. Percentage of NPS accessions in AFQT categories I–IIIA, FYs 1973–1998.
A graphic view of the increasing trend in AFQT performance of accessions from FY 1981through FY 1992 is provided in Figure 2.8. The more significant gains were in Categories I to IIIA,where the percentages increased from 47 percent in FY 1981 to 75 percent in FY 1992. Conversely,there has been a steady decline in the percentage of Category IIIB accessions. Most dramatic has beenthe decrease in accessions who score in Category IV—from 33 percent in FY 1979 to one percent orless since FY 1991. There has been a slight decline in the percentage of accessions in Categories I toIIIA in the last six years, from 75 percent in FY 1992 to 68 percent in FY 1998.
The percentages of FY 1998 active duty NPS accessions in each AFQT category are shownin Table 2.8. The percentage of recruits in Categories I and II was slightly higher than for their civiliancounterparts (males - 40 versus 39 percent; females - 36 versus 33 percent). Category III accessionsgreatly exceeded civilian proportions (males - 59 versus 30 percent; females - 64 versus 37 percent),while the percentage of recruits in Category IV was much lower than in the civilian population (males - 1
34 Data from Defense Manpower Data Center.

2-20
percent versus 20 percent; females - less than 1 percent versus 22 percent). The low percentage ofCategory IV recruits is, in part, a result of DoD limits of 4 percent Category IV recruits, with evenlower Service limits. Ten percent of civilian males and 9 percent of civilian females scored in CategoryV; DoD allows no Category V recruits.
Sixty-eight percent of recruits scored at or above the 50th percentile on the AFQT (CategoriesI–IIIA). Air Force recruits scored higher than those of the other three Services. Seventy-eight percentof Air Force recruits scored in Categories I–IIIA, compared to 68 percent of Army, and 64 percent ofboth Navy and Marine Corps recruits.
0%
10%
20%
30%
40%
50%
60%
70%
80%
90%
100%
1973 1975 1977 1979 1981 1983 1985 1987 1989 1991 1993 1995 1997
FISCAL YEAR
Category I Category II Category IIIA Category IIIB Category IV
Also see Appendix Table D-12 (AFQT Category by Fiscal Year).
Figure 2.8. Percentage of NPS accessions in AFQT categories I–IV, FYs 1973–1998.
High Quality. One impact of the defense drawdown is the Services' redesign of a number ofcareer fields, with incumbents assuming a more diverse workload and greater responsibilities. Theredesign both increases the number of tasks assigned to an individual, and requires incumbents toperform new tasks of greater complexity.35 The Services believe that as the levels of job/task difficultyand importance increase, so will the need to bring in and retain greater proportions of individuals withabove-average aptitude. The Services define high-quality recruits as high school diploma graduateswho score in the top 50 percent on the AFQT, Categories I through IIIA. Figure 2.9 shows the trendsin the proportion of high-quality accessions since FY 1973. In FY 1998, the percentage of high-qualityrecruits ranged from 56 percent in the Army to 74 percent in the Air Force.
35 See Sellman, W.S., Since We Are Reinventing Everything Else, Why Not Occupational Analysis? Keynoteaddress to the 9th Occupational Analyst Workshop, San Antonio, TX, May 31–June 2, 1995.

2-21
Table 2.8. AFQT Scores of FY 1998 Active Component NPS Accessions, by Gender and Service (Percent)
AFQT Category1 Army NavyMarineCorps
AirForce DoD
MALES
I 4.3 5.3 3.6 5.4 4.6
II 32.5 34.7 33.2 43.9 35.0
IIIA 29.7 24.3 27.4 30.0 27.8
IIIB 31.1 35.7 35.0 20.4 31.4
IV 2.4 0.0 0.9 0.3 1.1
V 0.0 0.0 0.0 0.0 0.0
Total 100.0 100.0 100.0 100.0 100.0
FEMALES
I 2.8 3.0 4.7 3.0 3.1
II 31.9 31.0 33.2 35.5 32.7
IIIA 40.1 27.8 30.1 34.1 34.4
IIIB 24.7 38.2 31.8 27.3 29.7
IV 0.5 0.0 0.3 0.1 0.2
V 0.0 0.0 0.0 0.0 0.0
Total 100.0 100.0 100.0 100.0 100.0
Columns may not add to total due to rounding. * Less than one-tenth of one percent.1 Service data from OASD(FMP)(MPP)/Accession Policy are "cleaned" by the Services for official submission. Data presented inthis table may differ slightly from the data shown in appendix tables that are taken from DMDC's USMEPCOM Edit File.Also see Appendix Tables B-5 (AFQT by Service and Gender) and B-6 (AFQT by Service and Race/Ethnicity).Source: Service data from OASD(FMP)(MPP)/Accession Policy—submitted in accordance with DoD Instruction 7730.56. The1980 civilian comparison group distribution for the total population (males and females) is 7 percent in Category I, 28 percent inCategory II, 15 percent in Category IIIA, 19 percent in Category IIIB, 21 percent in Category IV, and 10 percent in Category V.Civilian data from Profile of American Youth (Washington, DC: Office of the Assistant Secretary of Defense [Manpower, ReserveAffairs, and Logistics], March 1982).
Reading Ability. Because reading requirements for many military occupations are substantial,reading ability of recruits is important. The reading grade level (RGL) is estimated by converting theASVAB verbal composite score to its RGL equivalent.36 Table 2.9 shows that the mean RGL for FY1998 recruits was at a level that would be expected of an 11th grade student, compared to 10th gradelevel for the average FY 1984 accession. 36 See Waters, B.K., Barnes, J.D., Foley, P., Steinhaus, S.D., and Brown, D.C., Estimating the Reading Skills ofMilitary Applicants: The Development of an ASVAB to RGL Conversion Table (Alexandria, VA: Human ResourcesResearch Organization, October 1988).

2-22
ARMY
NAVY
USMC
USAF
D o D
10%
20%
30%
40%
50%
60%
70%
80%
90%
1973 1975 1977 1979 1981 1983 1985 1987 1989 1991 1993 1995 1997
FISCAL YEAR
ARMY NAVY USMC USAF DoD
Also see Appendix Table D-13 (High Quality by Service).
ASVAB Misnorming
Figure 2.9. Percentage of high-quality NPS accessions, FYs 1973–1998.
Table 2.9. Mean Reading Grade Level of FY 1984–1998 Active Component NPS Accessions,
By Service, and 1980 Civilians 18–23 Years Old
Fiscal Year Army NavyMarineCorps
AirForce DoD
1980 CivilianYouth Population
1984 10.0 10.2 9.8 10.5 10.1
1985 10.6 10.5 10.1 10.8 10.6
1986 11.2 11.0 11.1 11.4 11.1
1987 11.2 11.1 11.2 11.6 11.2
1988 11.2 11.1 11.2 11.5 11.2
1989 11.1 11.0 11.2 11.4 11.2
1990 11.2 11.1 11.2 11.7 11.3
1991 11.4 11.0 11.3 11.7 11.3 10.3
1992 11.5 11.4 11.3 11.7 11.5
1993 11.5 11.5 11.2 11.8 11.5
1994 11.4 11.3 11.2 11.7 11.4
1995 11.3 11.3 11.2 11.7 11.4
1996 11.3 11.3 11.1 11.7 11.4
1997 11.2 11.2 11.1 11.6 11.3
1998 11.2 11.2 11.1 11.5 11.2Source: 1980 civilian youth population data from the Profile of American Youth (Washington, DC: Office of the AssistantSecretary of Defense [Manpower, Reserve Affairs, and Logistics], March 1982); and Waters, et al., Estimating the Reading Skills ofMilitary Applicants: The Development of an ASVAB to RGL Conversion Table (Alexandria, VA: Human Resources ResearchOrganization, October 1988).

2-23
Inter-Service differences in RGL were relatively small in FY 1998, with mean RGLs rangingfrom 11.1 for the Marine Corps to 11.5 for the Air Force. The 1980 nationally representative sampleof 18- to 23-year-olds, on whom ASVAB scores are based, read at a mean 10th grade level.
Geography. The percentages of recruits from some census regions of the United States haveremained fairly stable since the inception of the volunteer force. However, as Figure 2.10 illustrates, inother regions some substantial shifts have taken place. The percentage of accessions from theNortheast dropped 8 points from a high of 22 percent in FY 1977 to a low of 14 percent in FY 1989.Today, 15 percent of enlisted recruits are Northeasterners. The proportion of accessions from theSouth increased 9 percentage points from 34 percent in FY 1985 to 43 percent in FY 1995. In FY1998, 42 percent of new recruits were from the South.
N EAST
N CNTRL
SOUTH
WEST
OTHER0%
5%
10%
15%
20%
25%
30%
35%
40%
45%
1973 1975 1977 1979 1981 1983 1985 1987 1989 1991 1993 1995 1997
FISCAL YEAR
N East N Cntrl South West Other*
*"Other" includes U.S. territories and possessions.Also see Appendix Table D-14 (Accessions by Geographic Region and Fiscal Year).
Figure 2.10. NPS accessions by geographic region, FYs 1973–1998.
Changes in geographical representation are related to factors such as shifts in demographicpatterns, unemployment, college enrollment, and employment compensation rates, which vary widelyacross regions of the country.37 Obviously, no one factor can explain variations in enlistment ratesbetween different sections of the country; they are more likely attributable to a wide array of economic,social, and demographic factors.
37 Kostiuk, P.F., Geographic Variations in Recruiting Market Conditions (Alexandria, VA : Center for NavalAnalyses, 1989).

2-24
Table 2.10 presents FY 1998 accession statistics by geographic region, division, and state. Thethird and fourth columns show percentages of accessions and percentages of the 18- to 24-year-oldcivilian population, respectively, in each area. The fifth column presents military/civilian representationratios—the percentage of enlisted accessions divided by the percentage of civilians in each area. Arepresentation ratio of 1.00 means that the area has the same proportion of accessions as of the youthpopulation—for example, 8 percent of all recruits and 8 percent of all youth aged 18–24. A ratio of lessthan 1.00 means that relatively few youth in an area enlist in the military, while a ratio of more than 1.00indicates above-average market penetration. The last two columns of the table present the percentagesof high-quality accessions (high school graduates in AFQT Categories I–IIIA) and mean AFQT scoresfor each area.
Table 2.10. Selected Statistics for FY 1998 NPS Accessions byRegion, Division, and State, and Civilians 18–24 Years Old
CENSUS REGION CENSUS DIVISION STATE
Area'sContributionof All NPSAccessions
Area'sPercent
of All NPSAccessions
Area'sPercent
of All 18-to 24-Year-
Olds
Represen-tationRatio
Percent ofHigh-QualityAccessions*
MeanAFQT
PercentileScore
NORTHEAST REGION 26,878 15.1 18.1 0.8 62.0 60.2
New England Division 5,996 3.4 4.4 0.8 63.9 61.5 Maine 1,089 0.6 0.4 1.6 68.0 63.0 New Hampshire 783 0.4 0.4 1.1 68.8 64.1 Vermont 323 0.2 0.2 0.9 67.2 64.3 Massachusetts 2,081 1.2 2.2 0.5 61.1 60.2 Rhode Island 470 0.3 0.3 0.8 60.9 60.3 Connecticut 1,250 0.7 0.9 0.8 62.2 60.4
Middle Atlantic Division 20,882 11.7 13.7 0.9 61.5 59.8 New York 10,077 5.7 6.5 0.9 59.9 59.2 New Jersey 3,778 2.1 2.8 0.8 59.9 58.5 Pennsylvania 7,027 3.9 4.3 0.9 64.6 61.3
NORTH CENTRAL REGION 34,574 19.4 24.0 0.8 65.0 61.6
East North Central Division 23,635 13.3 16.6 0.8 64.4 61.1 Ohio 6,610 3.7 4.1 0.9 64.7 61.1 Indiana 3,172 1.8 2.2 0.8 64.5 61.9 Illinois 6,541 3.7 4.4 0.8 61.6 59.9 Michigan 5,000 2.8 4.0 0.7 65.0 60.8 Wisconsin 2,312 1.3 1.9 0.7 69.6 64.1
West North Central Division 10,939 6.1 7.3 0.8 66.4 62.5 Minnesota 1,921 1.1 1.7 0.6 69.4 64.6 Iowa 1,639 0.9 1.1 0.9 70.9 64.1 Missouri 3,692 2.1 2.2 1.0 61.5 60.0 North Dakota 377 0.2 0.3 0.8 74.3 67.3 South Dakota 564 0.3 0.4 0.9 70.6 63.5 Nebraska 1,119 0.6 0.7 0.9 64.8 62.4 Kansas 1,627 0.9 1.1 0.8 67.1 62.7
(Continued)

2-25
Table 2.10. Selected Statistics for FY 1998 NPS Accessions byRegion, Division, and State, and Civilians 18–24 Years Old (Continued)
CENSUS REGION CENSUS DIVISION STATE
Area'sContributionof All NPSAccessions
Area'sPercent
of All NPSAccessions
Area'sPercent
of All 18-to 24-Year-
Olds
Represen-tationRatio
Percent ofHigh-QualityAccessions*
MeanAFQT
PercentileScore
SOUTH REGION 76,302 42.9 34.7 1.2 58.5 58.4
South Atlantic Division 37,722 21.2 16.7 1.3 58.3 58.4 Delaware 452 0.3 0.3 0.9 60.4 58.4 Maryland 3,570 2.0 1.5 1.3 61.1 59.8 District of Columbia 248 0.1 0.2 0.7 49.6 54.0 Virginia 5,693 3.2 2.2 1.5 59.0 59.4 West Virginia 1,494 0.8 0.7 1.3 58.1 57.4 North Carolina 5,111 2.9 2.9 1.0 57.4 57.8 South Carolina 3,596 2.0 1.3 1.5 55.7 56.5 Georgia 5,983 3.4 2.8 1.2 55.8 57.2 Florida 11,575 6.5 4.9 1.3 59.8 59.3
East South Central Division 11,509 6.5 6.1 1.1 55.9 57.1 Kentucky 2,347 1.3 1.5 0.9 58.9 58.4 Tennessee 3,147 1.8 1.9 0.9 60.5 59.3 Alabama 3,874 2.2 1.6 1.4 53.6 55.9 Mississippi 2,141 1.2 1.1 1.1 49.9 54.5
West South Central Division 27,071 15.2 11.8 1.3 59.8 58.9 Arkansas 2,114 1.2 1.0 1.1 57.3 58.2 Louisiana 3,728 2.1 1.9 1.1 53.9 55.7 Oklahoma 3,070 1.7 1.2 1.5 61.4 59.5 Texas 18,159 10.2 7.8 1.3 61.0 59.5
WEST REGION 40,164 22.6 23.3 1.0 62.3 60.3
Mountain Division 12,917 7.3 6.9 1.1 64.2 61.4 Montana 1,064 0.6 0.3 1.7 71.0 63.5 Idaho 1,006 0.6 0.5 1.1 65.1 63.1 Wyoming 570 0.3 0.2 1.7 67.5 63.2 Colorado 2,660 1.5 1.6 1.0 64.1 62.1 New Mexico 1,551 0.9 0.6 1.4 60.0 59.4 Arizona 3,695 2.1 1.9 1.1 62.5 60.0 Utah 1,046 0.6 1.1 0.5 67.2 63.2 Nevada 1,325 0.7 0.6 1.3 64.6 61.5
Pacific Division 27,247 15.3 16.5 0.9 61.4 59.7 Washington 3,991 2.2 2.0 1.1 66.8 63.9 Oregon 2,351 1.3 1.2 1.1 66.7 63.3 California 19,547 11.0 12.6 0.9 59.7 58.4 Alaska 539 0.3 0.2 1.4 66.6 63.1 Hawaii 819 0.5 0.4 1.1 54.7 56.8
Total (50 STATES + D.C.) 177,918**
100.0 100.0 1.0 61.1 59.7
Columns may not add to total due to rounding.* High-quality accessions are high school graduates who score at or above the 50th percentile on the AFQT. This column is thenumber of high-quality accessions in area divided by the total number of accessions in area.** Does not include 2,113 recruits from the territories and unknowns.Source: Civilian data from Bureau of Labor Statistics Current Population Survey, File, October 1997 – September 1998
2-26
The South region had the greatest ratio of enlistees (1.2). The South Atlantic and West SouthCentral divisions had the strongest representation (1.3 each). The Northeast and North Central regionshad representation ratios of 0.8 and the West region had a representation ratio of 1.0.
Slightly more than half of the states had representation ratios of 1.0 or more. These included:Maine and New Hampshire in the Northeast; Missouri in the North Central; all states except Utah andCalifornia in the West; and all states, except Delaware, Kentucky, Tennessee, and the District ofColumbia, in the South. Among all states and the District of Columbia, the ratios ranged from a low of0.5 in Massachusetts and Utah to a high of 1.7 in Montana and Wyoming.
The sixth column of Table 2.10 shows the proportion of high-quality accessions by geographicalarea. There were only minor differences by region in FY 1998. The proportion of high-qualityaccessions by region ranged from a low of 59 percent in the South to a high of 65 percent in the NorthCentral region. Differences across divisions were somewhat larger. Nearly 11 percentage pointsseparated the East South Central and West North Central divisions. Differences at the state level werestill larger, ranging from 50 percent in the District of Columbia and Mississippi to 74 percent in NorthDakota.
The last column of Table 2.10 shows the mean AFQT score by each geographical area.Occasionally interest has been expressed in using AFQT scores as an indicator of the performance ofstate educational systems. AFQT statistics are not particularly suitable for this purpose for severalreasons. As a sample of youth in a state, ASVAB test-takers reflect a number of selection biases, thetotal effect of which is unknown. Those who take the test as part of the enlistment process excludemany students who intend to enroll in college, prospects who fail the enlistment screening test, and youthwho do not have an interest in military enlistment. Therefore, youth who take the ASVAB should notbe presumed to be representative of the communities or school systems from which they are drawn.Even without the biases, it would be difficult to determine how much the test scores reflect differences inschool performance from state to state, or how much they reflect other state characteristics, such associal composition and economic conditions. In sum, while the ASVAB is an excellent instrument forthe purposes for which it was designed, it does not provide valid state-by-state school performancedata.
Nevertheless, AFQT scores by state may be of interest for purposes other than assessingschool system performance. The AFQT figures in Table 2.10 reflect the mean AFQT percentile scoresfor accessions in each state. Percentiles displayed in Table 2.10 are all above 50 because low-scoringapplicants are screened out.

3-1
Chapter 3
ACTIVE COMPONENT ENLISTED FORCE
At the end of Fiscal Year 1998, enlisted force end-strength was 1.17 million, down from 1.20million in FY 1997. Enlisted end-strength has dropped each year since FY 1987, when the ActiveComponent counted 1.85 million enlisted members, which was more than in any year since FY 1974.Figure 3.1 displays trend lines by Service for the active duty enlisted force size since FY 1973, andAppendix Table D-15 provides end-strength data by year and by Service for FYs 1964 and 1973through 1998.
ARMY NAVY
USMC
USAF
0
100
200
300
400
500
600
700
800
1973 1975 1977 1979 1981 1983 1985 1987 1989 1991 1993 1995 1997
FISCAL YEAR
END
-STR
ENG
TH (T
hous
ands
)
ARMY NAVY MARINE CORPS AIR FORCE
Also see Appendix Table D-15 (Enlisted Strength by Fiscal Year).
Figure 3.1. Active Component enlisted force end-strength, by Service, FYs 1973–1998.
Characteristics of Active Component Enlisted Force
Age. Trained person-years are more important than end-strength when evaluating personnelreadiness. Greater proportions of trained person-years reduce training costs and enable the Services tocut recruiting objectives. To gain increased person-years with the same number of Servicemembers,DoD and Service planners increase the mean initial term of enlistment and restructure the mix of first-term and career force personnel.
The mean number of months in service per enlisted Servicemember is highlighted in Figure 3.2.Mean time in service rose from 75 months in FY 1987 to 90 months in FY 1994 and then droppedslightly to 88 months in FY 1998. Although the cumulative effect of various policies put in place sincethe early 1980s resulted in an increase in the mean age of the Services' enlisted force from 25 years old

3-2
in FY 1980 to more than 27 years old in FY 1997, current retention problems have led to a slightdecrease in mean age and time in Service in FY 1998.
MEANAGE
MEANMONTHS
24
25
26
27
28
1973 1975 1977 1979 1981 1983 1985 1987 1989 1991 1993 1995 1997
FISCAL YEAR
ME
AN
AG
E IN
YE
AR
S
60
66
72
78
84
90
96
102
108
ME
AN
MO
NTH
S IN
SE
RV
ICE
Also see Appendix Table D-16 (Age and Months in Service by Fiscal Year).
Figure 3.2. Active Component enlisted force average age and months in service, FYs 1973–1998.
Force structure, retention, and personnel policies govern the distribution of Servicemembers byoccupation and grade. These factors have resulted in an overall DoD force profile whereinapproximately half the force (51 percent) has less than 6 years of service, with slightly less than half (45percent) having 6 to 19 years, and 4 percent having more than 20 years.1 Pay grade and time in serviceare highly correlated. Paralleling the years in service data, pay grade distributions include slightlymore than half of the enlisted force in pay grades E1 through E4 (54 percent) and slightly less than halfin pay grades E5 through E9 (46 percent), as shown in Table 3.1. Progression from E1 and E2(trainees) to E3 occurs quickly; consequently, relatively few enlisted members are in pay grades E1 andE2 (15 percent). Nearly three-quarters (74 percent) of the enlisted force is in pay grades E3 throughE6. Service differences primarily are the result of retention trends as well as the force structure andpersonnel requirements needed to support Service-unique roles and missions. Thus, time in service andpay grade data should be interpreted cautiously.
In FY 1998, 45 percent of the enlisted force was 17–24 years old, yet a little more than 1percent was older than 44, as shown in Table 3.2. For those who make the military a career, the 20-year retirement option results in many leaving service while in their late 30s and early 40s. In the Army,Navy, and Marine Corps, a large proportion of the enlisted force was under age 25 (45, 42, and 67percent, respectively). Marine Corps members were the “youngest” with two-thirds under age 25, and
1 See Timenes, N., Jr., Force Reductions and Restructuring in the United States, presented to NATO Seminaron Defense Policy and Management, Brussels, Belgium, July 2, 1992. The derived force was based on thedistribution by years of service from FY 1987 through FY 1989—a period of stable funding preceding the drawdown.

3-3
3 percent 40 years or older. Air Force members were the "oldest" with 35 percent under age 25, and 8percent older than 39. The Marine Corps traditionally has the youngest accessions. The Air Forceexperiences higher enlisted retention rates than the other Services, contributing to somewhat “older”enlisted members.
Table 3.1. FY 1998 Pay Grade of Active Component Enlisted Members, by Service
Pay Grade Army Navy Marine Corps Air Force DoD
E1 6.7 6.5 8.8 3.9 6.2
E2 8.4 8.4 13.2 6.1 8.5
E3 15.1 15.1 26.2 15.3 16.6
E4 25.5 19.6 19.0 23.2 22.4
E5 18.1 21.8 15.3 25.2 20.5
E6 13.7 17.6 8.9 13.1 14.0
E7 9.2 7.9 5.7 10.2 8.6
E8 2.6 2.1 2.2 2.0 2.3
E9 0.8 1.0 0.8 1.0 0.9
Unknown 0.1 * * 0.0 *
Total 100.0 100.0 100.0 100.0 100.0 Columns may not add to total due to rounding. * Less than one-tenth of one percent. Also see Appendix Table B-46 (Active Component by Pay Grade and Service).
Table 3.2. FY 1998 Age of Active Component Enlisted Members, by Service, andCivilian Labor Force 17 and Older (Percent)
Age Army NavyMarineCorps Air Force DoD
Civilian Labor Force
17–19 11.2 9.7 17.7 7.1 10.6 5.0
20–24 33.9 31.9 49.3 28.3 34.0 9.9
25–29 23.2 20.5 15.3 20.0 20.6 11.6
30–34 15.1 15.9 7.9 17.7 15.0 12.3
35–39 10.9 15.0 6.9 19.3 13.6 13.8
40–44 4.1 5.4 2.3 6.5 4.8 13.7
45–49 1.1 1.4 0.6 1.1 1.1 11.8
50+ 0.2 0.2 0.1 0.1 0.2 21.9
Unknown 0.4 * 0.0 * 0.1 0.0
Total 100.0 100.0 100.0 100.0 100.0 100.0Columns may not add to total due to rounding.* Less than one-tenth of one percent.Also see Appendix Table B-23 (Active Component by Age Group, Service, and Gender).Source: Civilian data from Bureau of Labor Statistics Current Population Survey File, September 1998.

3-4
Although 45 percent of the enlisted force was in the 17–24 age group, less than one-sixth of thecivilian labor force fell in this range. At the other end of the distribution, one-fifth of the civilian laborforce was 50 years old or older, compared with two-tenths of one percent of enlisted members.
Race/Ethnicity. The military attracts and retains higher proportions of Blacks and "Other"minority groups but lower proportions of Hispanics than are in the civilian labor force. As Table 3.3indicates, the overall proportion of enlisted minorities was higher than in the civilian labor force in FY1998 (36 and 30 percent, respectively). While Hispanics were underrepresented among enlistedmembers (8 percent versus 13 percent), the Services have made gains since 1987, when only 4 percentof the enlisted force was Hispanic.
Table 3.3. FY 1998 Race/Ethnicity of Active Component Enlisted Members,by Service, and Civilian Labor Force 18–44 Years Old (Percent)
Race/Ethnicity Army Navy
MarineCorps
AirForce DoD
18- to 44-Year-OldCivilians
White 56.3 63.2 66.6 73.0 63.7 70.5
Black 29.5 19.9 16.6 17.8 22.2 12.3
Hispanic 7.6 9.0 12.3 5.1 8.0 12.5
Other 6.6 7.9 4.5 4.2 6.1 4.7
Total 100.0 100.0 100.0 100.0 100.0 100.0Columns may not add to total due to rounding.Also see Appendix Table B-25 (Race/Ethnicity by Service and Gender).Source: Civilian data from Bureau of Labor Statistics Current Population Survey File, September 1998.
Twenty-two percent of the enlisted force was Black, compared with 12 percent of the civilianlabor force (18–44 year-olds). This near 2:1 ratio for Black members was higher than for FY 1998accessions, primarily because retention was higher among Blacks than Whites. The Army had thehighest proportion of Black enlisted members in FY 1998 (30 percent).
Changes over time in the percentage of Black enlisted members in each Service are shown inFigure 3.3. Black soldiers in the Army increased from 18 percent in FY 1973 to a high of 33 percent inFY 1981. That proportion decreased to 30 percent by the mid-1980s, in large part due to an increasein entrance standards and the Army's decision not to renew enlistment contracts of low-scoringmembers who entered during the ASVAB misnorming. The proportion of Blacks in the Army hasremained stable since FY 1993 at 30 percent.
The Marine Corps has experienced slight decreases in Blacks during recent years, parallelingthe drop in minority accessions in FY 1991 and the concomitant decrease in the propensity to enlistamong Black youth. Black male propensity declined 19 percentage points between 1991 and 1998.2
The Navy, on the other hand, exhibited a consistent long-term increase in the proportion of Blacks,
2 Memorandum from F. M. Rush, Acting Assistant Secretary of Defense (Force Management Policy), Subject:1998 Youth Attitude Tracking Study, January 5, 1999.

3-5
from 8 percent in FY 1973 to 20 percent in FY 1998. In all Services, the percentage of femalemembers who are Black significantly exceeds the percentage of male members who are Black(Appendix Table B-25).
ARMY
NAVY
USMC USAF
DoD
0%
5%
10%
15%
20%
25%
30%
35%
1973 1975 1977 1979 1981 1983 1985 1987 1989 1991 1993 1995 1997
FISCAL YEAR
ARMY NAVY USMC USAF DoD
Also see Appendix Table D-17 (Black Enlisted Members by Service and Fiscal Year).
Figure 3.3. Blacks as a percentage of Active Component enlisted members, by Service, FYs 1973–1998.
In FY 1998, active duty Hispanic enlisted members were a smaller part of the enlisted forcethan of the civilian labor force in the 18–44 age group (8 percent and 12 percent, respectively). Thehighest representation of Hispanics was in the Marine Corps (12 percent). The proportions of "Other"minority individuals in the Army and Navy were similar (7 and 8 percent, respectively), while the MarineCorps and Air Force had somewhat less (5 and 4 percent, respectively).
Gender. Trends in the percentage of enlisted women since FY 1973 are shown in Figure 3.4(Appendix Table D-19 provides numerical data). Thirty years ago, because of legal restrictions,women constituted less than 2 percent of military members. In 1967, Public Law 90-30 removed the2-percent cap on women in the military.3 However, policies, particularly those related to the roles ofwomen, did not change accordingly. It took nearly 20 years for the Services to achieve 10 percentrepresentation of women.
3 Born, D.H. and Lehnus, J.D., The World of Work and Women at War, paper presented at the InternationalMilitary Testing Association, Toronto, Canada, October 1995.

3-6
ARMY
NAVY
USMC
USAF
DoD
0%
2%
4%
6%
8%
10%
12%
14%
16%
18%
20%
1973 1975 1977 1979 1981 1983 1985 1987 1989 1991 1993 1995 1997
FISCAL YEAR
ARMY NAVY MARINE CORPS AIR FORCE DoD
Also see Appendix Table D-19 (Female Enlisted Members by Service and Fiscal Year).
Figure 3.4. Women as a percentage of Active Component enlisted members, by Service, FYs 1973–1998.
Four factors affect the proportion of enlisted female members. First, women have a lowerinclination to enlist than men do4; only 13 percent of females age 16–21 planned to enlist in 1998compared to 26 percent of males ages 16–21.5 Second, combat exclusion policies restrict the positionsand skills in which women may serve. However, as directed by former Secretary of Defense LesAspin, the Services have opened more positions for women. Third, the military personnel system is a"closed" system. Growth must come from within, and from the bottom up; lateral entries play nosignificant role. Consequently, the gender structure of the career force is shaped primarily by theproportion of females recruited. Fourth, women leave the Services at a higher rate than men. Thus, thepercentage of women in the military may not change much from current levels unless there are significantincreases in female recruiting or retention.
As a result of policy and social changes, the number of active duty enlisted women increasedfrom nearly 28,000 in FY 1972 to a pre-drawdown peak of 196,000 in FY 1989, then down to160,000 in FY 1995. The number and proportion of women has increased to nearly 165,000, morethan 14 percent women, in FY 1998. The increase in women in the military since FY 1972 broughtabout significant changes across all aspects of personnel management: in training programs and physicalfitness regimens, in assignments, in living arrangements, and in medical services. It also created newadministrative issues regarding pregnancy, the proportion of single parents in the military, child care
4 Memorandum from F.M. Rush, Acting Assistant Secretary of Defense (Force Management Policy), Subject:1998 Youth Attitude Tracking Study, January 5, 1999.
5 Ibid.
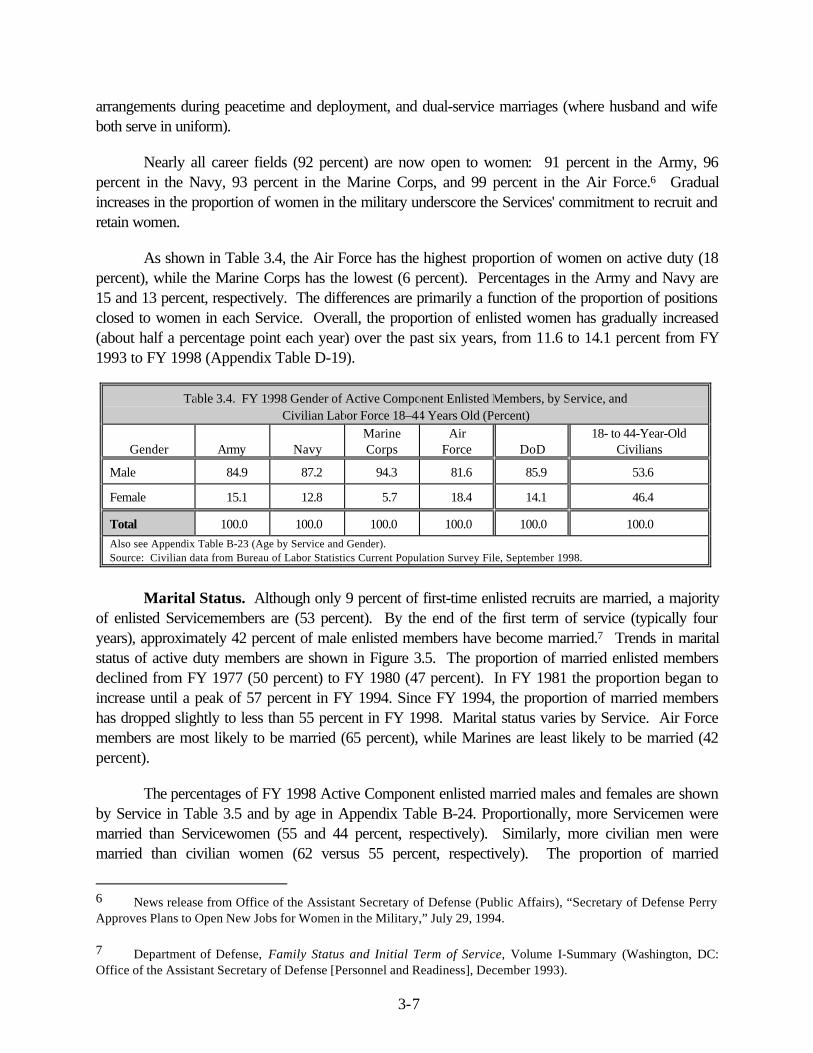
3-7
arrangements during peacetime and deployment, and dual-service marriages (where husband and wifeboth serve in uniform).
Nearly all career fields (92 percent) are now open to women: 91 percent in the Army, 96percent in the Navy, 93 percent in the Marine Corps, and 99 percent in the Air Force.6 Gradualincreases in the proportion of women in the military underscore the Services' commitment to recruit andretain women.
As shown in Table 3.4, the Air Force has the highest proportion of women on active duty (18percent), while the Marine Corps has the lowest (6 percent). Percentages in the Army and Navy are15 and 13 percent, respectively. The differences are primarily a function of the proportion of positionsclosed to women in each Service. Overall, the proportion of enlisted women has gradually increased(about half a percentage point each year) over the past six years, from 11.6 to 14.1 percent from FY1993 to FY 1998 (Appendix Table D-19).
Table 3.4. FY 1998 Gender of Active Component Enlisted Members, by Service, andCivilian Labor Force 18–44 Years Old (Percent)
Gender Army NavyMarineCorps
AirForce DoD
18- to 44-Year-OldCivilians
Male 84.9 87.2 94.3 81.6 85.9 53.6
Female 15.1 12.8 5.7 18.4 14.1 46.4
Total 100.0 100.0 100.0 100.0 100.0 100.0Also see Appendix Table B-23 (Age by Service and Gender).Source: Civilian data from Bureau of Labor Statistics Current Population Survey File, September 1998.
Marital Status. Although only 9 percent of first-time enlisted recruits are married, a majorityof enlisted Servicemembers are (53 percent). By the end of the first term of service (typically fouryears), approximately 42 percent of male enlisted members have become married.7 Trends in maritalstatus of active duty members are shown in Figure 3.5. The proportion of married enlisted membersdeclined from FY 1977 (50 percent) to FY 1980 (47 percent). In FY 1981 the proportion began toincrease until a peak of 57 percent in FY 1994. Since FY 1994, the proportion of married membershas dropped slightly to less than 55 percent in FY 1998. Marital status varies by Service. Air Forcemembers are most likely to be married (65 percent), while Marines are least likely to be married (42percent).
The percentages of FY 1998 Active Component enlisted married males and females are shownby Service in Table 3.5 and by age in Appendix Table B-24. Proportionally, more Servicemen weremarried than Servicewomen (55 and 44 percent, respectively). Similarly, more civilian men weremarried than civilian women (62 versus 55 percent, respectively). The proportion of married
6 News release from Office of the Assistant Secretary of Defense (Public Affairs), “Secretary of Defense PerryApproves Plans to Open New Jobs for Women in the Military,” July 29, 1994.
7 Department of Defense, Family Status and Initial Term of Service, Volume I-Summary (Washington, DC:Office of the Assistant Secretary of Defense [Personnel and Readiness], December 1993).

3-8
Servicemen was somewhat lower than married 18- to 44-year-old men in the civilian population (55and 62 percent, respectively). The proportion of married Servicewomen was lower than that of womenin the comparable civilian population (44 and 55 percent, respectively).
ARMYNAVY
USMC
USAF
DoD
20%
25%
30%
35%
40%
45%
50%
55%
60%
65%
70%
1973 1975 1977 1979 1981 1983 1985 1987 1989 1991 1993 1995 1997
FISCAL YEAR
MAR
RIE
D*
ARMY NAVY USMC USAF DoD
* Affected by large number of unknowns in FY 1973-1976. Because most unknowns were in their first year of service, and unlikely to be married, they were coded as unmarried in calculating the percentage.Also see Appendix Table D-20 (Marital Status by Service and Fiscal Year).
Figure 3.5. Percentage of Active Component enlisted members who were married, by Service, FYs1973–1998.
Table 3.5. FY 1998 Active Component Enlisted Members Who Were Married,by Gender and Service, and Civilian Labor Force 18–44 Years Old (Percent)
Gender Army NavyMarineCorps
AirForce DoD
18- to 44-Year-OldCivilians
Male 53.5 54.6 41.7 65.4 54.9 61.5
Female 44.3 37.6 38.3 50.0 44.2 54.7
Total 52.1 52.4 41.5 62.6 53.4 58.3Also see Appendix Table B-24 (Age by Marital Status and Gender).Source: Civilian data from Bureau of Labor Statistics Current Population Survey File, September 1998.
The percentage of married military women has changed significantly since FY 1973.8 Twenty-five years ago women constituted 2 percent of military members. Military women were not expected tobe married; retention directives implicitly encouraged separation of married enlisted women. In FY1973, 18 percent of military women were married, increasing to 36 percent in FY 1978 and to 44percent in FY 1998.
8 Department of Defense, Population Representation in the Military Services: Fiscal Year 1989(Washington, DC: Office of the Assistant Secretary of Defense [Force Management and Personnel], July 1990).

3-9
During and after the Persian Gulf War, questions were raised regarding the deployment of bothparents in a dual-service marriage (i.e., a marriage wherein both husband and wife are militarymembers). The proportion of members in each Service who are married and the proportion of thosemarried who are members of a dual-service marriage are shown in Table 3.6.
Table 3.6. FY 1998 Active Component Enlisted Personnel Who Were Married, andin Dual-Service Marriages, by Gender and Service (Number and Percent)
MarriedMarried Who Were InDual-Service Marriages
Gender End-Strength Number Percent Number* Percent**
ARMY
Male 341,153 182,381 53.5 12,494 6.9
Female 60,830 26,945 44.3 11,301 41.9
Total 401,983 209,326 52.1 23,795 11.4
NAVY
Male 280,731 153,176 54.6 8,351 5.5
Female 41,367 15,565 37.6 6,605 42.4
Total 322,098 168,741 52.4 14,956 8.9
MARINE CORPS
Male 146,335 60,954 41.7 2,835 4.7
Female 8,925 3,416 38.3 2,094 61.3
Total 155,260 64,370 41.5 4,929 7.7
AIR FORCE
Male 238,048 155,640 65.4 14,412 9.3
Female 53,542 26,785 50.0 14,657 54.7
Total 291,590 182,425 62.6 29,069 15.9
DoD
Male 1,006,267 552,151 54.9 38,092 6.9
Female 164,664 72,711 44.2 34,657 47.7
Total 1,170,931 624,862 53.4 72,749 11.6 * There are some differences between the number of males and females reporting dual-service marriages.** These percentages reflect the proportion of married enlisted members who are married to a Servicemember. For example, 12,494male Army enlisted personnel are in dual-service marriages. That is, 6.9 percent of married male Army enlisted members (182,381)are in dual-service marriages.
Larger proportions of men than women are married, but significantly greater proportions ofwomen are members of dual-service marriages (48 percent of married women versus 7 percent ofmarried men; Table 3.6). The Marine Corps has the greatest variance, with 5 percent of married menbut 61 percent of married women in dual-service marriages. Proportionally, more Air Force personnel

3-10
are members of dual-service marriages (16 percent). Across the Services, 12 percent of enlistedmembers are in dual-service marriages.
Education. The majority of the enlisted force have high school diplomas (95 percent), asindicated in Table 3.7. In FY 1998, 97 percent of female and 95 percent of male enlisted personnelwere high school diploma graduates (Tier 1). There were fewer people with no credentials in themilitary than in the civilian labor force (2 versus 12 percent), and fewer people with college experience(28 versus 55 percent). This latter comparison is misleading because enlisted occupations are generallycomparable to civilian occupations that do not require college degrees. Most military members withcollege degrees are officers (98 percent of officers have undergraduate or advanced degrees). Theeducation levels of the officer corps are discussed in Chapter 4.
Table 3.7. FY 1998 Education of Active Component Enlisted Members, by Service, andCivilian Labor Force 18–44 Years Old (Percent)
Education Level Army NavyMarineCorps
AirForce DoD
18- to 44-Year-Old
Civilians*Tier 1: Regular High SchoolGraduate or Higher 92.9 93.4 95.3 99.9 95.1Tier 2: GED,Alternative Credentials 3.1 4.7 4.6 0.1 3.0
88.1
Tier 3: No Credentials 4.0 1.9 0.2 ** 1.9 11.9
Total 100.0 100.0 100.0 100.0 100.0 100.0
College Experience(Part of Tier 1)1 10.0 4.9 2.7 90.8 27.7 54.6
* Civilian percentages combine Tiers 1 and 2. ** Less than one-tenth of one percent.1 Military data represent only enlisted members. Officers, who usually have college degrees, are not included. See Chapter 4 for adiscussion of officers.Also see Appendix Table B-27 (Education by Service and Gender).Source: Civilian data from Bureau of Labor Statistics Current Population Survey File, September 1998.
The Army, Navy, and Marine Corps had roughly the same proportion of high school diplomagraduate enlisted members in FY 1998, ranging from 93 to 95 percent. Almost all Air Force membersheld diplomas (99+ percent). The Army had the largest proportion without at least a high schooldiploma (7 percent), while the Air Force had the smallest (one-tenth of one percent). Because of theway in which its forces are deployed, Air Force members can more readily schedule and attend off-dutyeducation programs. As a result, more than 90 percent of Air Force members have some collegeexperience—much more than in the other Services (3, 5, and 10 percent, for the Marine Corps, Navy,and Army, respectively).
The Services encourage members to continue their education while in the military. In-servicetuition assistance programs pay 75 percent of tuition costs. Members also can use the Montgomery GIBill to cover the majority of the cost of off-duty college and technical courses.9 The investment in
9 Department of Defense, Biennial Report to Congress on the Montgomery GI Bill Education BenefitsProgram (Washington, DC: Office of the Assistant Secretary of Defense [Force Management Policy], May 1998).

3-11
continuing education is a sound one. Enlisted personnel who used tuition assistance had higherpromotion rates and stayed in the service longer than those who did not.10
Representation Within Occupations . The percentages of enlisted personnel by occupationalarea in FY 1998 are shown in Table 3.8. No shifts in the occupational distribution of the forceoccurred during that year. Occupations such as infantry and related specialties, craftsmen, and serviceand supply included less than one-third (29 percent) of enlisted personnel. Many enlisted members (43percent) were in jobs requiring mid-level skills, including medical and dental specialties, functionalsupport and administration, and electrical/mechanical equipment repair. The high-skilled and high-techareas—electronic equipment repair, communications and intelligence specialists, and other alliedspecialists—made up about 21 percent of the force. The remaining 7 percent were non-occupational, toinclude patients, students, and those with unassigned duties.
Table 3.8. FY 1998 Occupational Areas of Active Component Enlisted Personnel by Gender (Percent)
Occupational Code and Area Males FemalesTotal DoD
0 Infantry, Gun Crews, and Seamanship Specialists 19.0 4.3 16.9
1 Electronic Equipment Repairers 9.9 5.4 9.3
2 Communications and Intelligence Specialists 8.7 9.2 8.7
3 Medical and Dental Specialists 5.6 16.6 7.1
4 Other Allied Specialists 3.1 2.9 3.0
5 Functional Support and Administration 13.2 33.0 16.0
6 Electrical/Mechanical Equipment Repairers 21.9 8.9 20.1
7 Craftsmen 3.9 1.8 3.6
8 Service and Supply Handlers 8.3 9.9 8.5
9 Non-occupational* 6.6 8.0 6.8
Total 100.0 100.0 100.0 Columns may not add to total due to rounding. * Non-occupational includes patients, students, those with unassigned duties, and unknowns. See Appendix Tables B-29 (Occupational Area by Service and Gender) and B-30 (Occupational Area by Service and Race/Ethnicity).
The assignment of enlisted personnel to military occupations depends on eligibility (determinedby ASVAB scores and sometimes other tests or requirements), individual preference, and theavailability of openings. As part of the occupational classification process, the military uses aptitudecomposites made up of ASVAB test scores related to occupations. The composites vary by Service,and are developed empirically to predict the probability of training success.
Men tend to score higher than women on the ASVAB tests in the mechanical and electronicscomposites, while women tend to do better on administrative measures. On average, Whites havehigher test scores than Hispanics and “Other” minorities, who in turn have higher scores than Blacks.
10 See Boesel, D. and Johnson, K., The DoD Tuition Assistance Program: Participation and Outcomes(Arlington, VA : Defense Manpower Data Center, May 1988).

3-12
Within each demographic group, there is wide variation in ASVAB test scores, and most recruits qualifyfor a number of occupations. The recruits' preferences and the availability of openings for which theyare qualified determine the occupations to which individuals are assigned.
Representation of women within occupations. The major shift that has occurred in assignmentpatterns for women in the last two decades has been to increase their presence in "non-traditional" jobs.In the early 1970s, most enlisted women (88 percent) were in two occupational areas: functionalsupport and administration, and medical/dental.11 In FY 1998, 33 and 17 percent, respectively, servedin these occupations. Viewed another way, approximately 12 percent of enlisted women in the 1970sserved in areas considered non-traditional (gun crews, communications, craftsmen, etc.), and in FY1998 half of all Servicewomen were in these occupations (50 percent).
Women are ineligible for infantry and other positions in which the primary mission is tophysically engage the enemy.12 However, the direct ground combat rule allows women to serve onaircraft and ships engaged in combat. The proportion of women in occupational code 0 (infantry, guncrews, and seamanship specialists) in FY 1998 was 4 percent. The percentage of men in theseoccupations was approximately five times that of women because of the direct ground combat exclusionpolicy for women.
The occupational differences by gender are illustrated in Table 3.8. In FY 1998, the percentageof women in functional support and administration as well as medical and dental occupations wasapproximately two times that of men. Although the percentages of women in the technical andcraftsmen occupations are greater now than when women first joined the military, men account for thepreponderance of Servicemembers in these areas.
Representation of minorities within occupations. In FY 1998, the proportions of Blacks,Whites, and Hispanics were similar in four of the nine occupational areas—communications andintelligence specialists, medical and dental specialists, other allied specialists, and craftsmen (Table 3.9).In electronic equipment repair, where the proportions of Blacks and Hispanics were very similar, theproportion of Whites was substantially higher. The proportions of Hispanics and Whites wereapproximately the same in service and supply handlers, and were lower than Blacks. Inelectrical/mechanical equipment repair, Whites and Hispanics were similar and were higher than Blacks.Blacks were more heavily represented in the functional support and administration area and, to a lesserextent, the service and supply area.
Pay Grade. Enlisted pay grades, E1 to E9, correspond to the ranks of Private in the Army andMarine Corps, Seaman Recruit in the Navy, and Airman Basic in the Air Force through Sergeant Majorin the Army and Marine Corps, Master Chief Petty Officer in the Navy, and Chief Master Sergeant inthe Air Force. Enlisted personnel in grades E1 and E2 are trainees. Members in pay grades E3 and E4are at the apprentice level, working under journeymen, who are at pay grades E5 and E6. Supervisor
11 Department of Defense, Population Representation in the Military Services: Fiscal Year 1993(Washington, DC: Office of the Assistant Secretary of Defense [Force Management Policy], November 1994), p. 4-13.
12 Memorandum from Les Aspin, Secretary of Defense, Subject: Direct Ground Combat Definition andAssignment Rule, January 13, 1994.

3-13
positions are at pay grades E7 through E9. Soldiers, marines, and airmen at pay grades E5 and aboveand some at E4 are noncommissioned officers (NCOs), with demonstrated ability in the job and as aleader. In the Navy, those at pay grades E4 and above are petty officers, with leadershipresponsibilities. Servicemembers in NCO and petty officer positions are required to lead, supervise,and train entry-level enlisted personnel. They perform the work as well as direct the work of others.
Table 3.9. FY 1998 Occupational Areas of Active Component Enlisted Personnel by Race/Ethnicity (Percent)
Occupational Code and Area White Black Hispanic Other
0 Infantry, Gun Crews, and SeamanshipSpecialists 18.2 13.2 17.9 15.4
1 Electronic Equipment Repairers 10.7 6.7 7.2 6.4
2 Communications and Intelligence Specialists9.4 8.0 7.4 6.2
3 Medical and Dental Specialists 6.3 8.3 7.7 10.6
4 Other Allied Specialists 3.3 2.5 2.5 2.6
5 Functional Support and Administration 12.2 25.6 17.2 18.3
6 Electrical/Mechanical Equipment Repairers 21.9 15.2 19.0 20.4
7 Craftsmen 3.9 3.0 3.2 3.4
8 Service and Supply Handlers 7.2 12.1 8.7 9.3
9 Non-occupational* 6.9 5.5 9.2 7.5
Total 100.0 100.0 100.0 100.0Columns may not add to total due to rounding. * Non-occupational includes patients, students, those with unassigned duties, and unknowns.Also see Appendix Tables B-29 (Occupational Area by Service and Gender) and B-30 (Occupational Area by Service and Race/Ethnicity).
More than half of the enlisted force is in pay grades E1 through E4 (54 percent). Grades E4and E5 have the largest concentration of the enlisted force (22 and 21 percent, respectively). Thisdistribution is necessary to provide a sufficient number of trained leaders to fill the higher ranks; not allpersonnel in the lower ranks reenlist and progress to the higher grades. There are slight variationsamong racial/ethnic groups (Table 3.10) as well as differences between male and female enlistedmembers (Table 3.11).
A comparison of pay grade distributions by race/ethnicity shows larger percentages of Blackand “Other” minorities at pay grades E5 through E7 than Whites and Hispanics. Hispanics fill the lowergrades (E1 through E3) in greater proportions than the other racial/ethnic groups. Retention rates play arole in these distributions. Blacks traditionally have higher retention rates than other racial/ethnic groups.
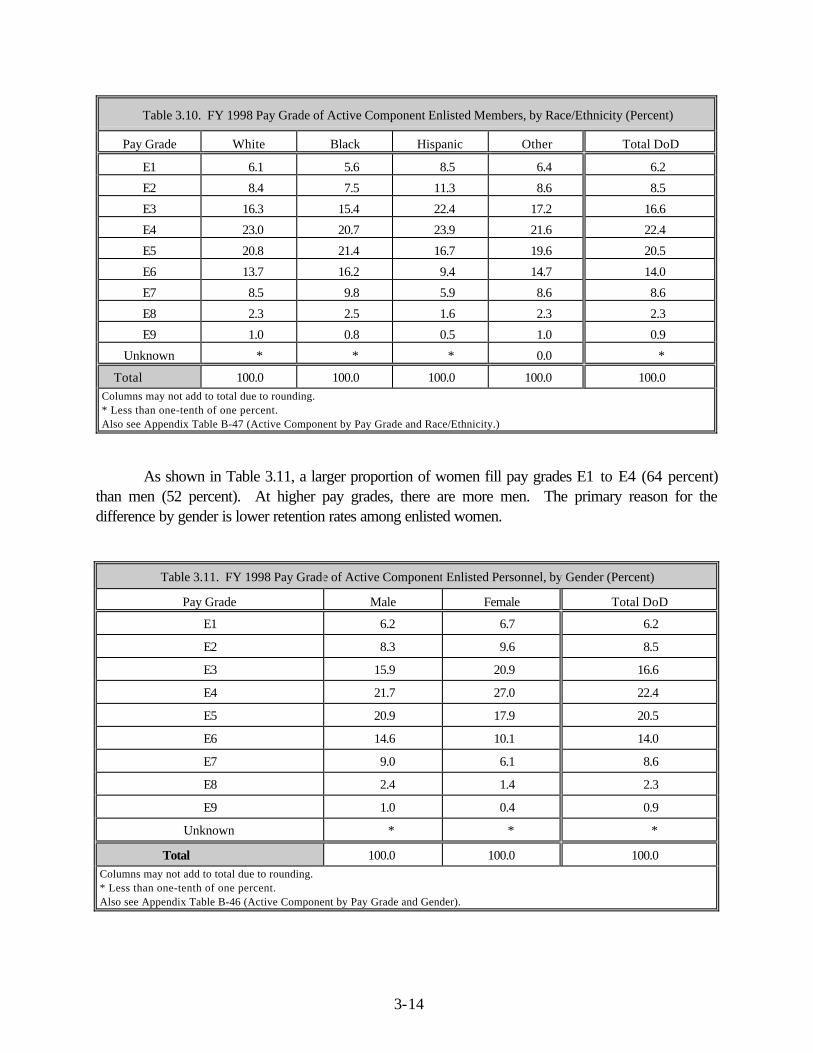
3-14
Table 3.10. FY 1998 Pay Grade of Active Component Enlisted Members, by Race/Ethnicity (Percent)
Pay Grade White Black Hispanic Other Total DoD
E1 6.1 5.6 8.5 6.4 6.2
E2 8.4 7.5 11.3 8.6 8.5
E3 16.3 15.4 22.4 17.2 16.6
E4 23.0 20.7 23.9 21.6 22.4
E5 20.8 21.4 16.7 19.6 20.5
E6 13.7 16.2 9.4 14.7 14.0
E7 8.5 9.8 5.9 8.6 8.6
E8 2.3 2.5 1.6 2.3 2.3
E9 1.0 0.8 0.5 1.0 0.9
Unknown * * * 0.0 *
Total 100.0 100.0 100.0 100.0 100.0Columns may not add to total due to rounding.* Less than one-tenth of one percent.Also see Appendix Table B-47 (Active Component by Pay Grade and Race/Ethnicity.)
As shown in Table 3.11, a larger proportion of women fill pay grades E1 to E4 (64 percent)than men (52 percent). At higher pay grades, there are more men. The primary reason for thedifference by gender is lower retention rates among enlisted women.
Table 3.11. FY 1998 Pay Grade of Active Component Enlisted Personnel, by Gender (Percent)
Pay Grade Male Female Total DoD
E1 6.2 6.7 6.2
E2 8.3 9.6 8.5
E3 15.9 20.9 16.6
E4 21.7 27.0 22.4
E5 20.9 17.9 20.5
E6 14.6 10.1 14.0
E7 9.0 6.1 8.6
E8 2.4 1.4 2.3
E9 1.0 0.4 0.9
Unknown * * *
Total 100.0 100.0 100.0Columns may not add to total due to rounding.* Less than one-tenth of one percent.Also see Appendix Table B-46 (Active Component by Pay Grade and Gender).

4-1
Chapter 4
ACTIVE COMPONENT OFFICERS
The commissioned officer corps (with civilian oversight) is the senior leadership andmanagement of the Armed Forces. This chapter presents a view of the demographic and socialcharacteristics of both Active Component officer accessions and the commissioned officer corps in FY1998.1 Also highlighted are longitudinal changes among officers. Figure 4.1 illustrates the trend inActive Component officer strength by Service since 1973. Supporting data are provided in AppendixTable D-25.
Army
Navy
USMC
USAF
20
40
60
80
100
120
140
1973 1975 1977 1979 1981 1983 1985 1987 1989 1991 1993 1995 1997
FISCAL YEAR
END
-STR
ENG
TH(T
hous
ands
)
ARMY NAVY USMC USAF
Also see Appendix Table D-25 (Officer Strength by Fiscal Year).
Figure 4.1. Active Component officer end-strength, by Service, FYs 1973–1998.
These data depict two drawdowns and one buildup in the Active Component officer corps.These changes in military strength can be attributed, at least partially, to changes in the world situation.The first decline, during the 1973 to 1979 period, can be attributed to the demobilization following theend of the Vietnam Conflict; the defense buildup of the 1980s was predicated by the escalation of the“Cold War”; and the most recent drawdown can be attributed to the fall of communism and the end ofthe Cold War. At a few more than 208,100, the FY 1998 Active Component officer end-strength is 2percent smaller than in FY 1997 and less than three-quarters the size of the FY 1986 officers corps,which was the peak of the buildup. The FY 1998 officer end-strength represents the smallest officercorps since the advent of the All Volunteer Force 25 years ago.
1 Data are for commissioned officers; warrant officers are excluded for the most part. A brief sketch of warrantofficers is presented at the end of this chapter.

4-2
The overall number of individuals commissioned by the Services decreased slightly (1 percent)in FY 1998 to approximately 15,600 (Figure 4.2). As the Army experienced a 6-percent drop inaccessions, the other Services increased their numbers of officer appointments. The Navy and MarineCorps accessed 1 percent more new officers than in FY 1997. The FY 1998 Air Force accessioncohort grew by more than 4 percent compared to FY 1997.
ARMY
NAVY
USMC2
4
6
8
10
12
1973 1975 1977 1979 1981 1983 1985 1987 1989 1991 1993 1995 1997
FISCAL YEAR
ACC
ESSI
ON
S(T
hous
ands
)
ARMY NAVY USMC USAF
USAF
Also see Appendix Table D-21 (Officer Accession by Fiscal Year).
Figure 4.2. Active Component officer accessions, by Service, FYs 1973–1998.
Characteristics of Active Component Officers
Table 4.1 shows the number and percentage of FY 1998 Active Component officer accessionsand officers by Service. In total personnel, the Army is the largest Service, but the Air Force has thehighest officer content. The Air Force stood at slightly less than 72,000 active duty officers in contrast tothe Army's almost 67,000. This variation in force structure is most likely due to variations in missionrequirements of the two Services.
While the Air Force has more total active duty officers than the Army, the Army continues toaccess more officers than the Air Force. This pattern suggests that annual requirements rest on morethan the relative size of the Service, to include retention and its underlying influencers.
Pay Grade. The commissioned officer corps is divided into 10 pay grades [O-1 through O-10]. Officers in pay grades O-1 through O-3 are considered company grade officers. In the Army,Marine Corps, and Air Force, these pay grades correspond to the ranks of second lieutenant (O-1),first lieutenant (O-2), and captain (O-3), and in the Navy, ensign, lieutenant junior grade, and lieutenant.

4-3
Officers in the next three pay grades (O-4 through O-6) are considered field grade officers. In theArmy, Marine Corps, and Air Force, these pay grades correspond to the ranks of major (O-4),lieutenant colonel (O-5), and colonel (O-6), and in the Navy, lieutenant commander, commander, andcaptain. The last four pay grades are reserved for general officers in the Army, Marine Corps, and AirForce, and flag officers in the Navy. The ranks associated with each pay grade are as follows: in theArmy, Marine Corps, and Air Force, brigadier general (O-7), major general (O-8), lieutenant general(O-9), and general (O-10); in the Navy, rear admiral-lower half, rear admiral-upper half, vice admiral,and admiral.
Table 4.1. FY 1998 Active Component Officer Accessions and Officer Corps (Number and Percent)1
Active Component Officer Accessions Active Component Officer Corps
Service Number Percent Number Percent
Army 5,381 34.5 66,980 32.2
Navy 4,007 25.7 53,206 25.6
Marine Corps 1,443 9.3 16,075 7.7
Air Force 4,763 30.5 71,893 34.5
Total 15,594 100.0 208,154 100.01 End-strength reflects commissioned officers only (it excludes warrant officers).
Also see Tables D-21 (Officer Accessions) and D-25 (Officer Strength).
As Table 4.2 shows, the force structure of the officer corps is that of a pyramid with thecompany grade officers making up the broad base (60 percent of officers in FY 1998), followed byfield grade officers representing the narrower middle (40 percent of officers in FY 1998), andgeneral/flag officers representing the pinnacle (less than 1 percent of officers in FY 1998). This paygrade distribution is influenced not only by the military’s emphasis on youth and fitness, but also by thechoices and competition engendered by “up or out” career progression policies.
Source of Commission. The criteria for the selection of potential officers for commissioninginclude age, U.S. citizenship, physical fitness, moral character, education, and cognitive ability. Giventhat officers form the military’s leadership and professional echelons and that investment in officereducation programs is high, the selection standards are quite stringent.2
With few exceptions, a 4-year college degree is a prerequisite for commissioning. To this end,two of the primary commissioning programs, the Service academies and the Reserve Officers TrainingCorps (ROTC), are administered in conjunction with an individual’s academic preparation. The UnitedStates Military Academy (USMA), the United States Naval Academy (USNA), and the United StatesAir Force Academy (USAFA) each offer room, board, medical and dental care, salary, and tuition
2 See Eitelberg, M.J., Laurence, J.H., and Brown, D.C., "Becoming Brass: Issues in the Testing, Recruiting, andSelection of American Military Officers," in B.R. Gifford and L.C. Wing (Eds.), Test Policy in Defense: Lessons fromthe Military for Education, Training, and Employment (Boston: Kluwer Academic Publishers, 1991).

4-4
throughout a 4-year undergraduate program of instruction leading to a baccalaureate degree.3 Locatedat numerous undergraduate colleges and universities throughout the country, ROTC has bothscholarship and non-scholarship options.4
Table 4.2. FY 1998 Active Component Officer Corps, by Rank/Pay Grade1 and Service (Percent)
Rank* Pay Grade Army Navy Marine Corps Air Force DoD
Second Lieutenant(Ensign)
O-1 12.4 11.5 15.3 9.5 11.4
First Lieutenant
(Lieutenant Jr. Grade)O-2 14.4 12.5 17.0 10.3 12.7
Captain (Lieutenant) O-3 33.1 35.6 31.4 38.3 35.4
Major (LieutenantCommander)
O-4 20.6 19.8 21.1 21.7 20.8
Lieutenant Colonel(Commander)
O-5 13.5 13.9 10.9 14.5 13.8
Colonel (Captain) O-6 5.4 6.3 3.9 5.3 5.5
Brigadier General (RearAdmiral - Lower Half)
O-7 0.2 0.2 0.3 0.2 0.2
Major General (RearAdmiral - Upper Half)
O-8 0.2 0.1 0.2 0.1 0.1
Lieutenant General (ViceAdmiral)
O-9 0.1 ** 0.1 0.1 0.1
General (Admiral) O-10 ** ** ** ** **
Total 100.0 100.0 100.0 100.0 100.0
Columns may not add to total due to rounding.* Ranks in parenthesis are Navy designations.** Less than one-tenth of one percent.1 Excludes those with unknown rank/pay grade.Also see Appendix Table B-48 (Pay Grade by Gender and Service).
The two remaining primary commissioning programs, Officers Candidate/Training School(OCS/OTS) and Direct Commissioning, are designed almost exclusively for individuals who alreadypossess at least a baccalaureate degree. OCS/OTS exists as a rather quick commissioning source forcollege graduates who did not receive military training or indoctrination as part of theirundergraduate education. This source also provides a means for promising enlisted personnel to earn acommission. Direct commissions, with a minimum of military training, are offered to professionals infields such as law, medicine, and the ministry. Because of their advanced degrees and/or work 3 There is no separate Marine Corps academy, but a percentage of each Naval Academy graduating classpledges to become Marine Corps officers.
4 Non-scholarship ROTC is not without benefits, such as a subsistence allowance upon progress to advancedtraining.

4-5
experience, officers directly appointed are often commissioned at ranks higher than the customarysecond lieutenant or ensign. There are other specialized commissioning sources that, together with theprimary programs, ensure that the Services have access to a number of different pools of personnel withdiverse skills.
Table 4.3 highlights the flexibility afforded officer procurement by the alternative commissioningprograms. The largest proportion of FY 1998 officer accessions (40 percent) came through ROTCprograms—and most were recipients of a college scholarship (29 percent of all officer accessions and72 percent of ROTC accessions). Among officers on active duty who were commissioned throughROTC, slightly more did not receive scholarships than those who did get them. However, this isexclusively an Army phenomenon. Direct appointments accounted for 20 percent and academygraduates accounted for 18 percent of incoming officers. OCS/OTS produced about 17 percent of FY1998 Active Component officer accessions.
Table 4.3. FY 1998 Source of Commission of Active Component Officer Accessions and Officer Corps, by Service (Percent)
Source of Commission Army Navy Marine Corps Air Force DoDACTIVE COMPONENT OFFICER ACCESSIONS
Academy 16.7 19.5 10.7 17.0 17.8
ROTC–Scholarship 39.3 16.8 11.8 32.2 28.8
ROTC–No Scholarship 21.4 1.5 0.0 10.9 11.1
OCS/OTS 5.6 23.7 59.0 11.2 16.9
Direct Appointment 16.5 24.5 1.3 25.7 20.0
Other * ** 13.8 17.2 0.3 5.2
Unknown 0.5 0.3 0.0 0.0 0.2
Total 100.0 100.0 100.0 100.0 100.0
ACTIVE COMPONENT OFFICER CORPS
Academy 16.4 19.8 11.9 19.8 18.1
ROTC–Scholarship 18.9 19.7 16.6 21.8 19.9
ROTC–No Scholarship 40.1 2.5 0.0 20.4 20.6
OCS/OTS 8.3 20.6 56.9 19.2 19.0
Direct Appointment 15.7 21.7 1.3 18.7 17.2
Other * 0.1 14.6 13.4 0.1 4.8
Unknown 0.5 1.3 0.0 0.0 0.5
Total 100.0 100.00 100.00 100.00 100.00Columns may not add to total due to rounding.* Includes officers trained in one Service and accessed into another (primarily Marine Corps).**Less than one-tenth of one percent.Also see Appendix Tables B-40 (Active Component Officer Accessions by Source of Commission, Service, and Gender) and B-41(Active Component Officer Corps by Source of Commission, Service, and Gender).

4-6
There were Service differences in reliance on the various commissioning sources. For example,59 percent of the Marine Corps’ newly commissioned officers came through OCS-type pipelines andonly one percent were recipients of direct commissions. In fact, the Marine Corps does not have aService academy or ROTC program. Midshipmen at the Naval Academy and in the Navy’s ROTCprogram can opt to enter the Marine Corps upon program completion. The Marine Corps relies on theNavy for officers in medical and dental specialties and chaplains, thereby lowering its need for directcommissioning. The Service differences are probably influenced by retention rates, budgetconsiderations, and historical fluctuations in officer recruiting needs.
Age. As shown in Table 4.4, officers, on average, tend to be older than enlisted personnel.Upon commissioning in FY 1998, the average officer was 23 years old in contrast to 20 years old forthe average enlisted accession. The mean age of all active officers was 34 years and that of enlistedmembers was 27 years. The mean age of officer accessions varies by source of commission. In FY1998, the average age of newly commissioned officers ranged from 23 years for Service academygraduates to 33 years for officers commissioned directly.5
Table 4.4. FY 1998 Mean Age of Active Component Officer Accessions and Officer Corps in Comparison to Enlisted Personnel
Officers Enlisted
Active Component Accessions 22.7 19.9
Active Component Force 34.2 27.3
Also see Appendix Table B-31 (Age by Service).
Figures 4.3 and 4.4 (together with Appendix Table B-31) highlight the military's emphasis onyouth. In particular, Marine Corps officer accessions and officer corps were younger than those inother Services. About 6 percent of Marine Corps officers were 31 or older upon entry. Theproportion within this age range among the other Services' newly commissioned officers was greater butstill notably small. The percentage who were 31 years or older was 10 percent in the Army, 22 percentin the Navy, and 16 percent in the Air Force. The rigorous physical demands and rapid deployment ofMarines, and this Service’s absence of officers in medical and ministry fields, no doubt are related to therelative youth of Marine Corps officers.
Figure 4.5 shows that along with age, there has been a steady increase in the tenure of officers.On average, as of FY 1998, the typical commissioned officer was around 34 years old and had been inuniform for nearly 11 years.
Race/Ethnicity. The percentages of minorities among newly commissioned officers and theActive Component officer corps are shown in Table 4.5. In FY 1998, almost 21 percent of enteringofficers were minorities—Black, Hispanic, and “Other” (e.g., Native Americans, Asians, and PacificIslanders)—and 16 percent of all commissioned officers on active duty were members of minoritygroups. The Air Force had the smallest proportion of minority officer accessions at 18 percent and the 5 Data from Defense Manpower Data Center.

4-7
Army had the largest proportion at 23 percent. The most populous minority group, Blacks, wererepresented at 9 percent of officer accessions and 8 percent of all active duty officers.
Army
Navy
U S M C
USAF
0%
5%
10%
15%
20%
25%
30%
17-20 22 24 26 28 30 32 34 36+A G E
A R M Y NAVY U S M C USAF
A l s o s e e A p p e n d i x T a b l e B - 3 0 ( A c t i v e C o m p o n e n t O f f i c e r C o r p s b y A g e a n d S e r v i c e ) .
Figure 4.3. Age of FY 1998 Active Component officer accessions, by Service.
0%
5%
10%
15%
20%
25%
30%
35%
20-24 25-29 30-34 35-39 40-44 45-49 50+
AGE GROUP
ARMY NAVY USMC USAF
Also see Appendix Table B-30 (Active Component Officer Corps by Age and Service).
Figure 4.4. Age of FY 1998 Active Component officer corps, by Service.

4-8
32.0
32.5
33.0
33.5
34.0
34.5
1974 1976 1978 1980 1982 1984 1986 1988 1990 1992 1994 1996 1998
FISCAL YEAR
MEA
N A
GE
IN Y
EAR
S
114
120
126
132
138
144
MEA
N M
ON
THS
IN S
ERVI
CE
AGE
SERVICE
Also see Appendix Table D-26 (Age and Months in Service by Fiscal Year)
Figure 4.5. Active Component officers’ mean years of age and months of service, FYs 1973–1998.
Table 4.5. FY 1998 Active Component Minority Officer Accessions andOfficer Corps, by Service (Percent)
Minority Army Navy Marine Corps Air Force DoD
ACTIVE COMPONENT OFFICER ACCESSIONS
Black 10.7 7.7 9.4 6.6 8.5
Hispanic 4.9 6.1 7.1 1.1 4.3
Other 7.6 6.5 5.7 10.3 7.9
Total Minority Officer Accessions 23.2 20.3 22.2 18.0 20.7
ACTIVE COMPONENT OFFICER CORPS
Black 11.1 6.1 6.3 6.1 7.7
Hispanic 3.6 4.0 4.5 2.1 3.3
Other 5.1 4.3 3.1 4.9 4.7
Total Minority Officers 19.8 14.4 13.9 13.1 15.7 Columns may not add to total due to rounding. “Other" includes Native Americans, Asians, and Pacific Islanders. Also see Appendix Table B-34 (Race/Ethnicity by Service).

4-9
Over the last few years the focus on minority representation within the officer corps hasincreased. Concern stems from the appearance of underrepresentation among officers in stark contrastto the trends for the enlisted ranks. A number of factors contribute to the seeming underrepresentationof Blacks and Hispanics (though not "Other" minorities) in the officer corps. For reasons toocomplicated to dissect within this report, minorities disproportionately suffer from poverty anddisorderly learning environments.6 These risk factors take their toll in the form of lower collegeenrollment and graduation rates, and, on average, lower achievement than other population groups.Although test score trends have improved for minorities over the past two decades, large averagedifferences compared to Whites remain. For example, the mean verbal Scholastic Assessment Test(SAT) scores for college-bound seniors in 1997 were 526 for Whites and 434 for Blacks; mean mathscores were 526 for Whites and 423 for Blacks.7 In light of these and other factors (e.g., fierce labormarket competition for college-educated minorities),8 minority representation among officer accessionsappears rather equitable when compared to the 21- to 35-year-old civilian population of collegegraduates which stands at 7.8 percent Black, 5.5 percent Hispanic, and 8.3 percent “Other.” Blacksare proportionately represented and Hispanics and “Other” minorities are slightly underrepresented.
Academic achievement differences factor into the divergent racial/ethnic distributions across thecommissioning sources as shown in Tables 4.6 and 4.7. In FY 1998, White and “Other” minorityofficer accessions were more likely than other racial/ethnic groups to be commissioned via one of theacademies, but were less likely to have attended OCS/OTS than other groups. “Other” racial/ethnicofficer accessions were more likely than other groups to have direct appointments, but were the leastlikely to attend OCS/OTS. For the overall Active Component officer corps in FY 1998, Black officerswere less likely to have attended a Service academy, but more likely to have graduated from a non-scholarship ROTC program. Among the FY 1998 officer corps, “Other” minorities were more likelythan other groups to be given a direct appointment.
The DoD is actively looking into issues affecting minority officer recruitment, performance,promotion, and retention in keeping with its track record of dedication to equal opportunity. TheServices have programs designed to increase minority participation in the officer corps. In addition toacademy preparatory schools, ROTC programs have a considerable presence at Historically BlackColleges and Universities (HBCUs) and there are Army ROTC units placed at predominantly Hispanicinstitutions. Furthermore, there are incentive and preparation programs aimed at boosting the presenceof minorities within ROTC programs and the officer corps.
6 See Smith, T.M., The Educational Progress of Black Students (Washington, DC: U.S. Department ofEducation, Office of Educational Research and Improvement, May 1996).
7 For recentered scores—not comparable with older scores—see U.S. Department of Education, Digest ofEducation Statistics 1998 (NCES 1999-036) (Washington, DC: National Center for Education Statistics, 1999), Table131.
8 See Eitelberg, M.J., Laurence, J.H., and Brown, D.C., “Becoming Brass: Issues in the Testing, Recruiting, andSelection of American Military Officers,” in B.R. Gifford and L.C. Wing (Eds.), Test Policy in Defense: Lessons fromthe Military for Education, Training, and Employment (Boston: Kluwer Academic Publishers, 1991).

4-10
Table 4.6 FY 1998 Source of Commission of Active Component Officer Accessions,by Race/Ethnicity and Gender (Percent)
Source of Commission White Black Hispanic Other Male Female
Academy 18.7 10.7 14.1 18.0 18.9 13.1
ROTC–Scholarship 29.1 28.1 24.6 29.1 28.0 32.3
ROTC–No Scholarship 10.1 17.4 17.1 11.4 11.5 9.3
OCS/OTS 16.6 17.3 30.5 12.1 18.5 10.1
Direct Appointment* 20.0 19.6 10.0 25.4 17.1 32.2
Other** 5.3 6.8 3.8 3.9 5.8 2.9
Unknown 0.3 0.0 0.0 0.1 0.3 0.2
Total 100.0 100.0 100.0 100.0 100.0 100.0Columns may not add to total due to rounding.* Females accessed through direct appointment are primarily health care professionals.** Includes officers trained in one Service and accessed into another (primarily Marine Corps).Also see Appendix Table B-42 (Source of Commission by Service and Race/Ethnicity) and B-40 (Source of Commission by Serviceand Gender).
Table 4.7. FY 1998 Source of Commission of Active Component Officer Corps,by Race/Ethnicity and Gender (Percent)
Source of Commission White Black Hispanic Other Male Female
Academy 18.6 11.7 17.3 19.4 19.4 10.3
ROTC–Scholarship 20.2 17.5 16.6 21.3 20.2 18.5
ROTC–No Scholarship 19.4 32.6 23.7 19.9 21.4 15.6
OCS/OTS 19.4 16.8 22.1 13.1 19.8 13.9
Direct Appointment* 17.0 16.6 15.1 22.4 13.6 38.5
Other** 4.9 4.7 5.0 3.5 5.2 2.8
Unknown 0.5 0.2 0.2 0.5 0.5 0.4
Total 100.0 100.0 100.0 100.0 100.0 100.0Columns may not add to total due to rounding.* Females accessed through direct appointment are primarily health care professionals.** Includes officers trained in one Service and accessed into another (primarily Marine Corps).Also see Appendix Table B-43 (Source of Commission by Service and Race/Ethnicity) and B-41 (Source of Commission by Serviceand Gender).
Targeted recruiting programs, together with a focus on equal opportunity once commissioningtakes place, have contributed to increased representation of minorities (especially Blacks) within theofficer corps over the years (see Appendix Tables D-22, D-23, D-27, and D-28). The 8.5 percentof Blacks, for example, among officer accessions in FY 1998 compares favorably with figures from oneand two decades ago (1988: 7.5 percent; 1978: 6.3 percent).

4-11
These accession trends have been contributing to greater minority strength levels in the totalofficer corps. For example, Blacks comprised 4 percent of all active duty officers in FY 1978, 7percent in FY 1988, and 8 percent by the end of this past fiscal year. The lagging long-term minorityprogress seen through the Active Component officer percentages, relative to the near-term success seenamong officer accessions, is mirrored in the pay grade distribution differences by minority status asshown in Table 4.8.
Table 4.8. FY 1998 Pay Grade1 of Active Component Officers, by Service and Race/Ethnicity (Percent)
Race/Ethnicity andPay Grade Army Navy Marine Corps Air Force DoD
White
O-1 through O-3 58.7 57.4 61.5 57.0 58.0
O-4 through O-6 40.8 42.2 38.0 42.6 41.6
O-7 through O-10 0.5 0.5 0.3 0.4 0.5
Total 100.0 100.0 100.0 100.0 100.0
Black
O-1 through O-3 61.2 72.2 74.1 59.8 63.8
O-4 through O-6 38.5 27.6 25.6 40.0 35.9
O-7 through O-10 0.3 0.2 0.3 0.2 0.3
Total 100.0 100.0 100.0 100.0 100.0
Hispanic
O-1 through O-3 69.1 73.7 80.4 54.6 68.5
O-4 through O-6 30.8 26.3 19.3 45.2 31.4
O-7 through O-10 0.1 0.1 0.3 0.2 0.1
Total 100.0 100.0 100.0 100.0 100.0
Other
O-1 through O-3 70.6 73.4 78.2 76.8 73.9
O-4 through O-6 29.3 26.5 21.8 23.1 26.0
O-7 through O-10 0.1 * 0.0 0.1 0.1
Total 100.0 100.0 100.0 100.0 100.0Columns may not add to total due to rounding.* Less than one-tenth of one percent.1 Excludes those with unknown rank/pay grade.Also see Appendix Table B-49 (Active Component Officer Corps by Pay Grade, Service, and Race/Ethnicity).
Compared to Whites, higher percentages of minority members are found in the lower grades(O-1 through O-3). More notable differences between Whites and minorities were found in the Navyand Marine Corps, where 57 and 62 percent of Whites, respectively, held the rank of captain or lowerbut 72 and 74 percent of Blacks and 74 and 80 percent of Hispanics, respectively, were companygrade officers. The pay grade distributions were closest in the Air Force, with approximately 3percentage points separating Whites and Blacks in terms of the percentage in grade O-3 and below.Additionally, the Air Force has a slightly greater proportion of Hispanics than Whites in field grade

4-12
positions. Factors such as increased college graduation rates and targeted recruiting programs haveprovided minorities greater access to the officer corps. However, it is also important to monitorprogress further along the pipeline.
Gender. As shown in Table 4.9, women constituted about 19 percent of officer accessionsand 14 percent of the officer corps in FY 1998. The Air Force holds its place as the most gender-integrated regarding officers, with the Army and the Navy not far behind. Though the levels of womenin the officer corps are nowhere near college graduate population proportions, sustained growth hasoccurred in the representation of women among officers (see Appendix Tables D-24 and D-29 fortrends among accessions and the officer corps since FY 1973).
Table 4.9. FY 1998 Active Component Female Officer Accessions andOfficer Corps (Percent)
Army Navy Marine Corps Air Force DoD
Active Component Accessions 19.6 17.2 9.2 23.2 19.1
Active Component Officer Corps 14.4 14.5 4.6 16.7 14.4
Also see Appendix Table B-32 (Gender by Service).
The primary source of commission for women in FY 1998 continued to be the directappointment (32 percent), as shown in Table 4.6. Female officer accessions were less likely than malesto have attended an academy. The majority of directly appointed officers are in the professional groups(i.e., medical, dental, legal, and ministry). Officers from these professional groups are classified as“non-line,” are managed separately, and do not assume command responsibilities over “line” officers.Career opportunities tend to be somewhat limited for non-line officers and can result in differences inpay grade distributions. Table 4.10 shows pay grade by gender for each of the Services and for DoDas a whole. There were pay grade differences between the genders, though not to the same degree asamong racial/ethnic groups. Across DoD, 41 percent of male officers were O-4s through O-6s,whereas the percentage of women in these grades was 8 percentage points lower at 33 percent.
Commissioning source differences complicate the interpretation of variations in pay gradedistributions by gender. For example, direct commissions may provide an early grade boost forwomen, since advanced degree requirements associated with occupations in the professional echelonsare rewarded by DoD with advanced pay grade initially for commissioned officers. However,assignment differences and command restrictions, as well as networking obstacles, may retard retention,continuation, and hence career progression for women. Assignment qualifications, interests, and policyalso affect pay grade. In the Air Force, for example, status as a pilot would contribute to enhancedcareer prospects. (Assignment data are provided later in this chapter in the discussion of occupationareas.)
Marital Status . As indicated in Table 4.11, officers were more likely to be married than theenlisted personnel they lead. It is interesting to note that for officers as well as enlisted personnel,women on active duty were less likely than men to be married. In fact, while nearly three-quarters ofmale officers were married, only 54 percent of women officers had a spouse. Furthermore, whereas

4-13
male officers were more likely than their civilian counterparts (college graduates in the workforce 21 to49 years of age) to be married, female officers were less likely to be married. This suggests that womenin the officer corps are more divergent from their civilian peers regarding family patterns.
Table 4.10. FY 1998 Pay Grade1 of Active Component Officers, by Service and Gender (Percent)
Pay Grade Army Navy Marine Corps Air Force DoD
MALES
O-1 through O-3 58.7 59.1 63.0 56.2 58.3
O-4 through O-6 40.8 40.4 36.5 43.4 41.2
O-7 through O-10 0.5 0.5 0.5 0.5 0.5
Total 100.0 100.0 100.0 100.0 100.0
FEMALES
O-1 through O-3 67.6 62.4 77.4 67.8 66.5
O-4 through O-6 32.4 37.5 24.4 32.2 33.4
O-7 through O-10 0.1 0.1 0.3 0.1 0.1
Total 100.0 100.0 100.0 100.0 100.0
Columns may not add to total due to rounding.1
Excludes those with unknown rank/pay grade.Also see Appendix Table B-48 (Pay Grade by Gender and Service).
Table 4.11. FY 1998 Married Active Component Officer Corps and Enlisted Personnel, by Gender (Percent)
Gender Officers Enlisted
Males 74.0 54.9
Females 53.8 44.2
Total 71.1 53.4Also see Appendix Table B-33 (Marital Status by Service).
Though female officers are less likely to be married than male officers, among those who aremarried women are considerably more likely to be a partner in a dual-military marriage. As can be seenfrom Table 4.12, married female officers are more than eight times more likely than married maleofficers to have a spouse in uniform. This trend is more than a curiosity, as dual-service marriages poseunique challenges to assignment and deployment, in addition to affecting Servicemembers' satisfactionwith military life.
Education. Given Service requirements, with few exceptions, that commissioned officers haveat least a 4-year college degree, the education levels of FY 1998 Active Component officer accessionscome as no surprise. Table 4.13 clearly shows the officer corps’ reliance on the college-educated.Five percent of officers commissioned in FY 1998 did not have at least a bachelor's degree; most likely

4-14
these officers were former enlisted personnel. A notable percentage of newly commissioned officers(14 percent)—mostly lawyers, chaplains, and health care professionals (i.e., physicians, dentists, etc.)—held advanced degrees.
Table 4.12. FY 1998 Active Component Officers Who Were Married, and in Dual-Service Marriages,By Gender and Service (Number and Percent)
MarriedMarried Who Were InDual-Service Marriages
Gender End-Strength Number Percent Number* Percent
ARMY
Male 57,371 41,796 72.9 2,451 5.9
Female 9,609 5,206 54.2 2,481 47.7
Total 66,980 47,002 70.2 4,932 10.5
NAVY
Male 45,512 32,788 72.0 639 2.0
Female 7,694 3,923 51.0 849 21.6
Total 53,206 36,711 69.0 1,488 4.1
MARINE CORPS
Male 15,337 10,716 69.9 326 3.0
Female 738 316 42.8 210 66.5
Total 16,075 11,032 68.6 536 4.9
AIR FORCE
Male 59,922 46,450 77.5 2,388 5.1
Female 11,971 6,698 56.0 2,478 37.0
Total 71,893 53,148 73.9 4,866 9.2
DoD
Male 178,142 131,750 74.0 5,804 4.4
Female 30,012 16,143 53.8 6,018 37.3
Total 208,154 147,893 71.1 11,822 8.0
* There are some differences between the number of males and females reporting dual-service marriages.
Not only are college graduates amply represented among newly commissioned officers, but theeducation levels in the officer corps indicate that the Services promote continuing education. Significantproportions of officers attained advanced degrees while serving. The Air Force had the greatest

4-15
proportion (57 percent) of officers with advanced degrees, and was the only Service with a greaterproportion of officers with advanced degrees than bachelor's degrees. The Marine Corps had fewerofficers with advanced degrees than the other Services. A contributing factor may be that the Navyprovides the Marine Corps with health professionals, chaplains, or other such direct appointees, whotypically have advanced degrees.
Table 4.13. FY 1998 Educational Attainment of Active Component Officer Accessions and Officer Corps, by Service (Percent)
Educational Attainment Army NavyMarineCorps* Air Force DoD
ACTIVE COMPONENT OFFICER ACCESSIONS
Less than College Graduate 1.1 15.0 5.2 1.8 4.9
College Graduate (B.A., B.S., etc.) 86.1 71.0 91.5 79.3 81.0
Advanced Degree (M.A., Ph.D., etc.) 12.9 13.9 3.3 18.9 14.2
Total 100.0 100.0 100.0 100.0 100.0
ACTIVE COMPONENT OFFICER CORPS
Less than College Graduate 0.8 6.1 5.8 0.5 2.4
College Graduate (B.A., B.S., etc.) 59.2 56.1 76.2 42.8 54.0
Advanced Degree (M.A., Ph.D., etc.) 40.0 37.8 18.1 56.8 43.7
Total 100.0 100.0 100.0 100.0 100.0Columns may not add to total due to rounding.Percentages do not include "Unknown" data.* Marine Corps accession data provided by U.S. Marine Corps, Officer Appointments.Also see Appendix Table B-35 (Education by Service).
Representation Within Occupations . Tables 4.14 and 4.15 present the distribution ofofficers across occupational areas by gender and race/ethnic group, respectively. At a glance, the datasuggest the need for officers to have technical knowledge in addition to more general leadership andmanagement skills. More than one-third of officers were working in jobs classified as part of tacticaloperation. Together, the second, third, and fourth most populous occupations—health care, engineeringand maintenance, and supply—approximated the manning levels of tactical operations. Appendix TableB-37 provides FY 1998 occupational area data by Service, including personnel classified as non-occupational.
Representation of women within occupations. Table 4.14 shows significant assignmentdifferences between male and female officers. Despite expanding numbers of and roles for women, ittakes time to bring women into new positions and career fields, as has been the case in FY 1998.Significantly greater percentages of men than women were in tactical operations (44 and 9 percent,respectively), whereas greater percentages of women than men were in "traditional" female occupationsof administration (12 and 5 percent, respectively) and health care (46 and 14 percent, respectively).Appendix Table B-38 shows the assignment patterns by Service and gender.
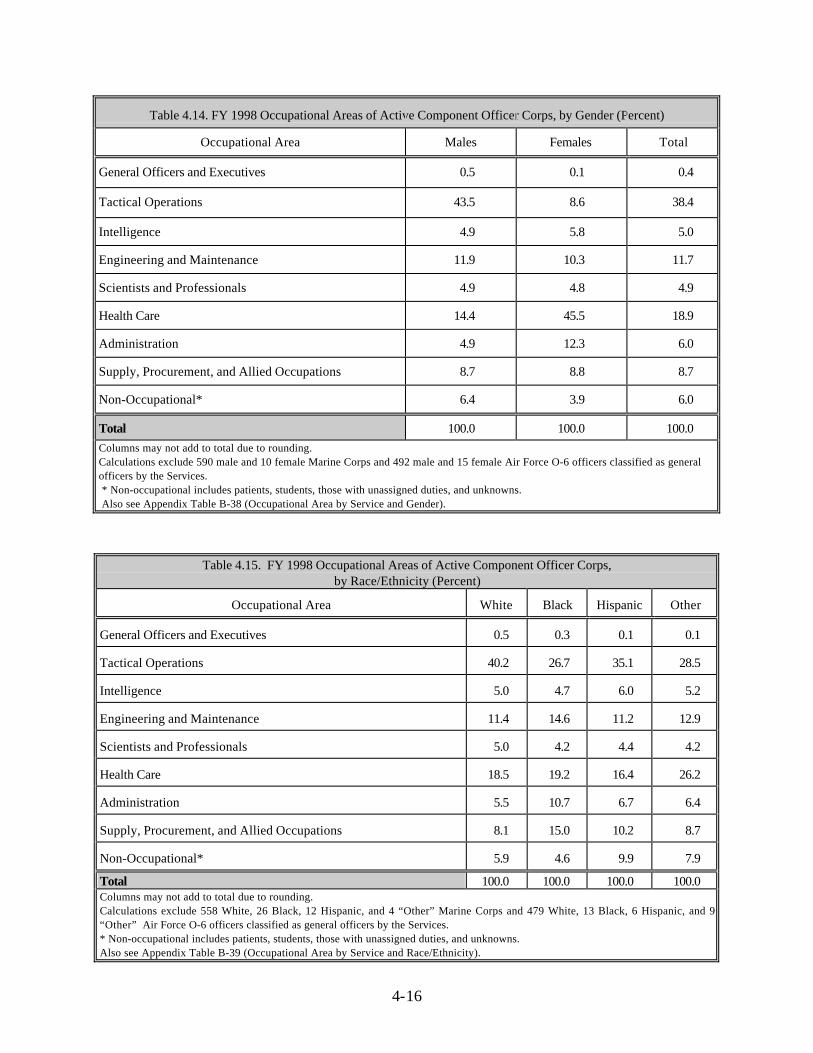
4-16
Table 4.14. FY 1998 Occupational Areas of Active Component Officer Corps, by Gender (Percent)
Occupational Area Males Females Total
General Officers and Executives 0.5 0.1 0.4
Tactical Operations 43.5 8.6 38.4
Intelligence 4.9 5.8 5.0
Engineering and Maintenance 11.9 10.3 11.7
Scientists and Professionals 4.9 4.8 4.9
Health Care 14.4 45.5 18.9
Administration 4.9 12.3 6.0
Supply, Procurement, and Allied Occupations 8.7 8.8 8.7
Non-Occupational* 6.4 3.9 6.0
Total 100.0 100.0 100.0Columns may not add to total due to rounding.Calculations exclude 590 male and 10 female Marine Corps and 492 male and 15 female Air Force O-6 officers classified as generalofficers by the Services. * Non-occupational includes patients, students, those with unassigned duties, and unknowns. Also see Appendix Table B-38 (Occupational Area by Service and Gender).
Table 4.15. FY 1998 Occupational Areas of Active Component Officer Corps,by Race/Ethnicity (Percent)
Occupational Area White Black Hispanic Other
General Officers and Executives 0.5 0.3 0.1 0.1
Tactical Operations 40.2 26.7 35.1 28.5
Intelligence 5.0 4.7 6.0 5.2
Engineering and Maintenance 11.4 14.6 11.2 12.9
Scientists and Professionals 5.0 4.2 4.4 4.2
Health Care 18.5 19.2 16.4 26.2
Administration 5.5 10.7 6.7 6.4
Supply, Procurement, and Allied Occupations 8.1 15.0 10.2 8.7
Non-Occupational* 5.9 4.6 9.9 7.9
Total 100.0 100.0 100.0 100.0Columns may not add to total due to rounding.Calculations exclude 558 White, 26 Black, 12 Hispanic, and 4 “Other” Marine Corps and 479 White, 13 Black, 6 Hispanic, and 9“Other” Air Force O-6 officers classified as general officers by the Services.* Non-occupational includes patients, students, those with unassigned duties, and unknowns.Also see Appendix Table B-39 (Occupational Area by Service and Race/Ethnicity).

4-17
Representation of minorities within occupations. The percentage of each racial/ethnic categoryby officer occupational areas is shown in Table 4.15. In FY 1998, racial and ethnic groups of officersgenerally had similar patterns of representation across occupational areas, although fewer Blacks,Hispanics, and "Others" were assigned to tactical operations. Greater percentages of officers in the"Other" racial category than Whites, Blacks, or Hispanics were in health care positions. Largerproportions of Hispanics than Whites and “Other” minorities were in intelligence, administration, andsupply occupations. Proportionately more Blacks than other racial/ethnic groups were in theengineering and maintenance, supply, and administration occupations. The Services strive to achieveracial/ethnic balance during the assignment process. Such a focus is important because occupationalassignment is related to promotion opportunities and success as an officer.
Regardless of race/ethnicity, the largest percentage of officers worked in tactical operations; thelowest percentages worked in intelligence and scientific/professional occupations. Appendix Table B-39 provides data on occupational areas by Service and race/ethnicity.
Warrant Officers 9
Warrant officers comprise a relatively small but vital group of technicians and specialists whoserve in the Army, Navy, and Marine Corps. These Servicemembers ordinarily do not assume typicalofficer command responsibilities and their careers emphasize depth rather than breadth of experience, incontrast to commissioned officers.10, 11 The status and duties of these experts, trainers, and specialtymanagers have grown and otherwise changed since their grades were established around 1920. Today,they can be found advancing within military careers such as aviation, physicians’ assistant, nuclearweapons, and administration.
Although some warrant officers may enter directly from civilian life (e.g., helicopter pilots), mostwarrant officers previously were in the upper enlisted ranks. In FY 1998, 1,496 warrant officeraccessions were added to the force and the overall total force of warrant officers on active duty stoodat 15,413. Table 4.16 presents gender and race/ethnicity statistics on FY 1998 warrant officers. Theyare overwhelmingly male (94 percent) but have greater minority representation than commissionedofficers. Blacks, in particular, are more highly represented among warrant officers, accounting for 15percent of active duty warrant officers (in contrast to 8 percent of commissioned officers). AppendixTables B-44 and B-45 provide a glimpse of warrant officer accessions and the corps of warrant officerson active duty by gender and race/ethnicity.
9 For more detailed information on warrant officers, see Department of Defense, DoD Report on the "WarrantOfficer Management Act" (WOMA) (Washington, DC: Author, 1989).
10 Upper-level warrant officers, however, frequently function in foreman-type roles within their systemspecialties.
11 The Air Force discontinued its warrant officer program in 1959 and increased promotion opportunities forsenior enlisted personnel.

4-18
Table 4.16. FY 1998 Active Component Warrant Officer Accessions and Officer Corps, by Race/Ethnicity, Gender, and Service* (Percent)
Race/Ethnicity and Gender Army Navy Marine Corps DoD
ACTIVE COMPONENT WARRANT OFFICER ACCESSIONS
White 70.5 73.2 68.1 70.5
Black 19.8 20.8 17.2 19.6
Hispanic 5.1 2.3 10.8 5.5
Other 4.7 3.7 3.9 4.4
Male 90.8 94.0 93.1 91.6
Female 9.2 6.0 6.9 8.4
Total 100.0 100.0 100.0 100.0
ACTIVE COMPONENT WARRANT OFFICER CORPS
White 75.3 77.9 77.1 75.8
Black 15.2 15.4 14.1 15.1
Hispanic 4.7 1.5 6.6 4.5
Other 4.9 5.1 2.2 4.6
Male 93.4 93.6 93.7 93.7
Female 6.6 6.4 6.4 6.4
Total 100.0 100.0 100.0 100.0
Columns may not add to total due to rounding.* The Air Force does not have warrant officers.Also see Appendix Tables B-44 (Warrant Officer Accessions and Officers by Gender) and B-45 (Warrant Officer Accessions andOfficers by Race/Ethnicity).
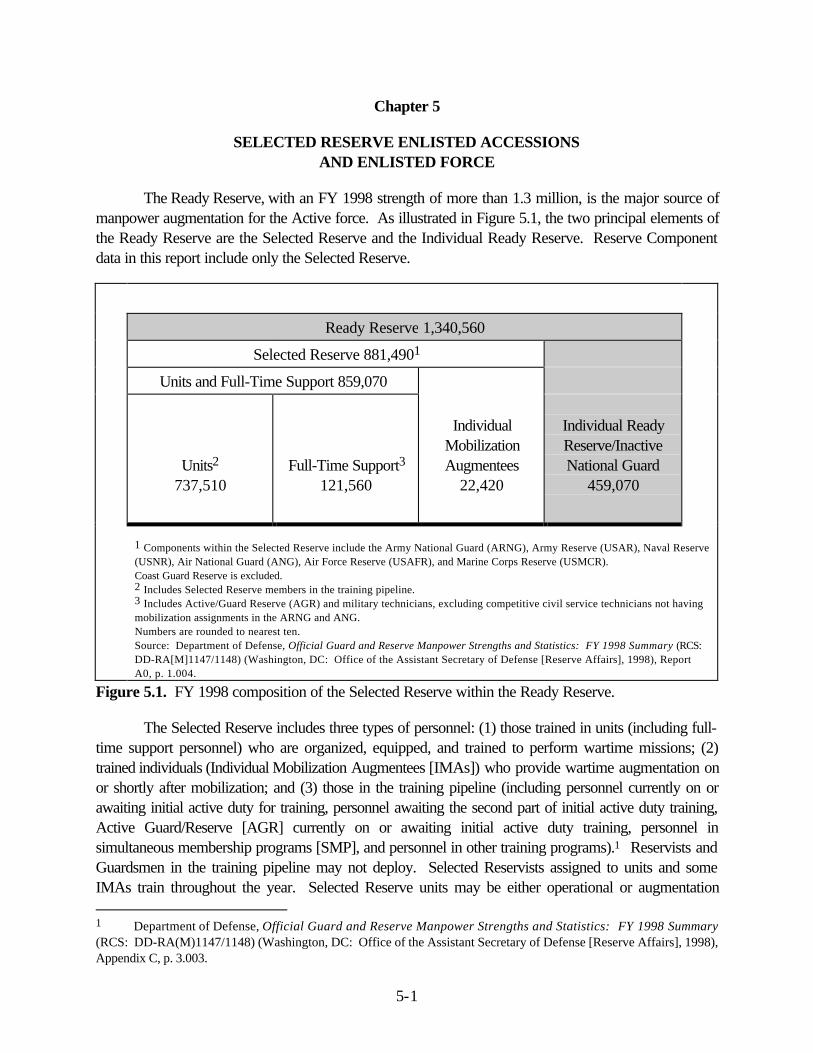
5-1
Chapter 5
SELECTED RESERVE ENLISTED ACCESSIONSAND ENLISTED FORCE
The Ready Reserve, with an FY 1998 strength of more than 1.3 million, is the major source ofmanpower augmentation for the Active force. As illustrated in Figure 5.1, the two principal elements ofthe Ready Reserve are the Selected Reserve and the Individual Ready Reserve. Reserve Componentdata in this report include only the Selected Reserve.
Ready Reserve 1,340,560
Selected Reserve 881,4901
Units and Full-Time Support 859,070
Units2
737,510Full-Time Support3
121,560
IndividualMobilizationAugmentees
22,420
Individual ReadyReserve/InactiveNational Guard
459,070
1 Components within the Selected Reserve include the Army National Guard (ARNG), Army Reserve (USAR), Naval Reserve(USNR), Air National Guard (ANG), Air Force Reserve (USAFR), and Marine Corps Reserve (USMCR).Coast Guard Reserve is excluded.2 Includes Selected Reserve members in the training pipeline.3 Includes Active/Guard Reserve (AGR) and military technicians, excluding competitive civil service technicians not havingmobilization assignments in the ARNG and ANG.Numbers are rounded to nearest ten.Source: Department of Defense, Official Guard and Reserve Manpower Strengths and Statistics: FY 1998 Summary (RCS:DD-RA[M]1147/1148) (Washington, DC: Office of the Assistant Secretary of Defense [Reserve Affairs], 1998), ReportA0, p. 1.004.
Figure 5.1. FY 1998 composition of the Selected Reserve within the Ready Reserve.
The Selected Reserve includes three types of personnel: (1) those trained in units (including full-time support personnel) who are organized, equipped, and trained to perform wartime missions; (2)trained individuals (Individual Mobilization Augmentees [IMAs]) who provide wartime augmentation onor shortly after mobilization; and (3) those in the training pipeline (including personnel currently on orawaiting initial active duty for training, personnel awaiting the second part of initial active duty training,Active Guard/Reserve [AGR] currently on or awaiting initial active duty training, personnel insimultaneous membership programs [SMP], and personnel in other training programs).1 Reservists andGuardsmen in the training pipeline may not deploy. Selected Reservists assigned to units and someIMAs train throughout the year. Selected Reserve units may be either operational or augmentation 1 Department of Defense, Official Guard and Reserve Manpower Strengths and Statistics: FY 1998 Summary(RCS: DD-RA(M)1147/1148) (Washington, DC: Office of the Assistant Secretary of Defense [Reserve Affairs], 1998),Appendix C, p. 3.003.

5-2
units. Operational units train and deploy as units; augmentation units train as units in peacetime, but areabsorbed into Active Component units upon mobilization.
The Selected Reserve Recruiting Process
The recruiting process is similar for the Reserve and Active Components.2 With the exceptionof a number of Air National Guard (ANG) units, Reserve recruiters process their non-prior service(NPS) applicants through Military Entrance Processing Stations (MEPSs), following procedures almostidentical to the Active Component.
Recruiters describe the demands and opportunities of military service, and evaluate prospectiverecruits to determine eligibility for enlistment. The prospect is asked about his or her age, education,involvement with the law, use of drugs, and physical and medical factors that could preclude enlistment.The prospect may take an enlistment screening test. Non-prior service prospects take the ASVAB ateither a local test site or at a MEPS. If an NPS applicant achieves qualifying ASVAB scores andwishes to continue the application process, he or she is scheduled for a physical examination andbackground review at a MEPS. If the applicant's education, ASVAB scores, physical fitness, andmoral character qualify for enlistment, he or she meets with a Service classification counselor at a MEPS(or in some instances at a National Guard unit) to discuss options for enlistment.
Up to this point, the applicant has made no commitment. The counselor has the record of theapplicant's qualifications and computerized information on available training/skill openings, schedules,and enlistment incentives. They discuss the applicant's interests. The counselor may offer bonuses toencourage the applicant to choose hard-to-fill occupational specialties. The applicant, however, is freeto accept or reject the offer. Many applicants do not decide immediately, but take time to discussoptions with family and friends. When the applicant accepts the offer, he or she signs an enlistmentcontract and is sworn into the Reserve.
One of the most critical factors in achieving Reserve readiness is the ability to meet SelectedReserve manpower requirements—in numbers, skills, and quality. More than half (61 percent in FY1998) of Selected Reserve accessions have prior service experience, primarily from active duty.However, a sizable proportion of new recruits enter the National Guard or Reserve without previousmilitary affiliation. Recruiting must target both populations. Success in meeting recruiting and retentiongoals varies significantly from unit to unit. First, there are substantial differences in unit size; larger unitsrequire greater effort. Second, National Guard and Reserve units differ significantly in skills required.Third, National Guard and Reserve units exist in thousands of localities, and each locality presents aunique set of labor market characteristics. The size of the community, distinct demographic andsocioeconomic profiles, the mix of skills in the local civilian labor force and among recent veterans, localcivilian wage levels and hours worked, frequency and duration of employment, employer attitudesregarding National Guard or Reserve duty, attitudes toward the military, effect of recent mobilizationson propensity to enlist, and other secondary job opportunities create recruiting and retention challengesfor Selected Reserve units. 2 For a description of NPS Selected Reserve recruiting, see Tan, H.W., Non-prior Service Reserve Enlistments:Supply Estimates and Forecasts (Santa Monica, CA: RAND Corporation, 1991).

5-3
The 1998 Youth Attitude Tracking Study shows that enlistment propensity for the SelectedReserve is lower than for the active Services (19 percent versus 26 percent, respectively, for 16- to 21-year-old males). Moreover, propensity is consistently higher for the Service Reserves than for theNational Guard. Among 16- to 21-year-old males, there is a 4-percentage-point difference betweeninterest in the two components (10 percent National Guard versus 14 percent Reserves); smallerdifferences (3 percentage points) are found with 22- to 24-year-old males and 16- to 21-year-oldfemales. In 1997, 22- to 24-year-old females also showed a difference of 3 percentage points betweenthe two components; however, in 1998 the difference was reduced to 1 percentage point. Propensityamong 16- to 21-year-old women did not change from 1997 to 1998. While trends indicate lessinterest today among the primary recruit population—male youth 16 to 21 years old—to enter theSelected Reserve than 7 years ago (25 percent in 1991, 19 percent in 1998), results of the surveyillustrate relatively stable levels of National Guard and Reserve propensity over the last 3 years.3
The occupational distribution among the Active and Reserve Components varies (e.g., 11percent of active Navy enlistees serve in administration while 22 percent of Naval Reserve [USNR]members serve in administration). Some units have to recruit more NPS individuals to fill unit vacancies.Another factor that can create large differences in manning success across skills is marketability,including civilian skill transferability, quality of training, equipment, and promotion opportunity. Tocombat the limited training opportunities, expense of field training, and lack of access to trainingfacilities, the Reserve Component Virtual Training Program was created at the Mounted WarfareSimulation Training Center in Fort Knox, Kentucky. It provides structured, simulation-based trainingcurrently used in the Army National Guard (ARNG).4
The diversity of mission and force structure among the Reserve Components affects thedemographic composition of units. A National Guard or Reserve company with a combat mission mayneed a significantly higher proportion of young NPS accessions. Conversely, combat service supportfunctions may require more experienced personnel and thus have greater proportions of prior servicerecruiting requirements.
The population representation profiles of the Reserve Components are different from the ActiveServices due to a number of factors:
• The proportional distribution of combat, combat support, and combat servicesupport skills in the Selected Reserve;
• The location of units, given the requirement for Reserve Components to recruit forlocal unit vacancies within a 50-mile radius; and
3 Memorandum from F.M. Rush, Acting Assistant Secretary of Defense (Force Management Policy), Subject:1998 Youth Attitude Tracking Study, January 5, 1999.
4 Hoffman, R.G., Graves, C.R., Koger, M.E., Flynn, M.R., and Sever, R.S., Developing the Reserve ComponentVirtual Training Program: History and Lessons Learned (Fort Knox, KY: U.S. Army Research Institute for theBehavioral and Social Sciences, 1994).

5-4
• Differences between the force structure and occupational distribution of the Activeand Reserve Components in conjunction with the prior service requirements of theNational Guard and Reserve.
This chapter provides demographic characteristics and the distribution of FY 1998 enlistedaccessions and the enlisted force of the Selected Reserve. Characteristics of Selected Reserve NPSaccessions are described and, where applicable, are compared to prior service accessions.Characteristics and distribution of Selected Reserve officer accessions and the officer corps arecontained in Chapter 6.
Characteristics of Selected Reserve Accessions
FY 1998 Reserve Component recruiting results for NPS and prior service gains and assignedend-strengths are shown in Table 5.1. In FY 1998, the Reserve Component recruited nearly 135,500enlisted persons compared to the Active Component's almost 180,500. The Army Reserve (USAR) isagain the largest Reserve Component recruiting program, followed by the ARNG. The USAR recruitedmore than 15,000 NPS enlistees, approximately 8,000 less than the ARNG. However, the USARrecruited just over 30,700 prior service recruits, almost 10,000 more than the ARNG. Recognizing theimportance of experience provided by qualified prior service personnel to the Reserve Forces,Congress established additional prior service accessions for the ARNG as part of the Army GuardCombat Reform Initiative: "The Secretary of the Army, shall increase the number of qualified prioractive-duty enlisted members in the Army National Guard."5 While the legislation applies only to theARNG, the Secretary of the Army has required the Army Reserve to comply, which would explain thelarge number of prior service accessions to the USAR and the ARNG.
Table 5.1. FY 1998 Selected Reserve Non-Prior Service (NPS) andPrior Service Enlisted Accessions and End-Strengths
Enlisted Accessions
ComponentNon-Prior
ServicePrior
Service Total
Prior Service Percent of
Component TotalEnlisted
End-Strength
Army National Guard 28,846 26,538 55,384 47.9 323,150
Army Reserve 15,281 30,707 45,988 66.8 161,286
Naval Reserve 2,474 15,177 17,651 86.0 73,490
USMC Reserve 6,132 4,255 10,387 41.0 36,620
Air National Guard 3,435 5,304 8,739 60.7 94,861
Air Force Reserve 1,285 6,135 7,420 82.7 56,032
DoD Total 57,453 88,116 145,569 60.5 745,439Also see Appendix Tables C-1 (NPS Age by Component and Gender), C-9 (Prior Service Age by Component and Gender), C-15(Enlisted Member Age by Component and Gender).
5 Army National Guard Combat Readiness Reform Act of 1992, Section 1111, Public Law 102-484.

5-5
Selected Reserve recruiting achievements increased slightly, adding nearly 2,000 enlistedaccessions from FY 1997 to FY 1998 (from almost 144,000 to nearly 146,000). The increase waslimited to the Army National Guard and Air Force Reserve; the other components experienced cuts.
Due to differences in mission and force structure, the size of recruit cohorts by componentvaried greatly. Therefore, comparisons between the Reserve Component percentages must beinterpreted with care. The Army Components—the ARNG and USAR—had the largest SelectedReserve recruit cohorts, recruiting 70 percent of total Reserve Component accessions (38 and 32percent for the ARNG and USAR, respectively) in FY 1998. The Naval Reserve and Air ForceReserve (USAFR) had the highest proportion of prior service recruits (86 percent and 83 percent oftheir total recruiting efforts, respectively). The Marine Corps Reserve (USMCR) had the lowestproportion of recruits with past military experience (41 percent). Prior service accessions provide theReserve Component with a more experienced personnel base, contributing to increased readiness tomeet future missions.
The increase in availability of prior service recruits, a temporary phenomenon due to the largernumber of active duty members leaving service during the drawdown, has ended. The result is fewerprior service individuals from which the Reserve Component can recruit. The numerical effects of thedrawdown coupled with changes in the Reserve mission and increased combat risks may lead todifficulties in Reserve recruiting. "Future Reserve recruits are likely to consider [the] risk, the costs andbenefits associated with [serving], and the likelihood that security threats in the future will differ fromthose in the past."6 A decision to join the Selected Reserve today likely involves more tradeoffs than inthe past. Potential recruits are likely to find combat risk, family hardships, and financial losses during amobilization more important in the Reserve participation decision today and in the future.
Age. The largest proportions of FY 1998 NPS Reserve Component accessions were in the17- to 19-year age group (Table 5.2). The one exception to this trend was the USNR, which had 62percent falling in the 25- to 34-year age group. This was true, despite the increase in the percentage ofunknown age for NPS Reserve Component accessions to the USNR (11 percent to 21 percent fromFY 1997 to FY 1998).
Several factors contribute to age differences within the Reserve Component, including the sizeof the recruiting mission and the incentives used by recruiters. ARNG and USAR recruiters workextensively with the high school population because of the size of their respective NPS recruitingmissions. Although the high school senior market is their primary target, recruiters use the split trainingoption as an important incentive. This option allows high school juniors to enlist and attend basictraining after their junior year of high school, and then enter skill training a year later upon graduatingfrom high school. In FY 1998, 33 and 21 percent, respectively, of ARNG and USAR NPS recruitswere students still enrolled in high school.
6 Asch, B.J., Reserve Supply in the Post-Desert Storm Recruiting Environment (Santa Monica, CA: RANDCorporation, 1993), p. 5.

5-6
Table 5.2. FY 1998 Selected Reserve Non-Prior Service Enlisted Accessions, by Age and Component, and Civilian Labor Force 17–35 Years Old (Percent)
AgeGroup
ArmyNationalGuard
ArmyReserve
NavalReserve
MarineCorps
Reserve
AirNationalGuard
AirForce
ReserveTotalDoD
17- to 35-Year-OldCivilians
17–19 62.5 68.9 0.2 65.9 53.4 39.2 60.8 16.0
20–24 23.0 22.5 1.5 28.2 31.9 38.5 23.4 24.2
25–29 8.4 6.1 34.4 5.3 9.5 13.8 8.8 25.7
30–34 3.9 2.3 27.4 0.6 4.7 8.0 4.3 27.9
35–39 1.3 0.1 15.5 * 0.4 0.5 1.4 6.2
40–44 0.4 * 0.3 0.0 * 0.0 0.2
45–49 0.2 * 0.0 0.0 * 0.0 0.1
50+ 0.1 * 0.0 0.0 0.0 0.0 0.1
Unknown 0.2 * 20.7 0.1 * 0.0 1.0
Total 100.0 100.0 100.0 100.0 100.0 100.0 100.0 100.0Columns may not add to total due to rounding. * Less than one-tenth of one percent.Also see Appendix Tables C-1 (Age by Component and Gender) and C-2 (Age by Marital Status and Gender).Source: Civilian data from Bureau of Labor Statistics Current Population Survey File, October 1997 – September 1998.
Race/Ethnicity. Table 5.3 presents the racial/ethnic makeup of FY 1998 NPS enlistedaccessions by Selected Reserve Component. These figures are similar to those seen in FY 1997, withthe greatest changes being found in the USAR NPS recruits, as the percentage of Whites increasedfrom 59 percent in FY 1997 to 65 percent in FY 1998. The percentage of USAR prior service Whitesalso increased from FY 1997 to FY 1998 (62 to 66 percent). The percentage of USAFR NPSHispanics increased 3 percentage points. Other than these results, differences in the racial/ethnicmakeup of the FY 1997 and FY 1998 cohorts were generally less than 3 percentage points.
Since the inception of the All Volunteer Force, Blacks have been somewhat overrepresented inthe active duty ranks, while Whites and Hispanics have been underrepresented as compared to thenation's youth population as a whole. We would expect this to be reflected in the makeup of theReserve Forces. Table 5.3 demonstrates that the proportion of prior service Black accessions in eachof the Selected Reserve components, except the ANG, is higher than their representation among the20- to 39-year-old civilian labor force. Conversely, Hispanics are underrepresented across the board,with the exception of the USMCR’s prior service recruits. In previous years, Whites also have madeup a smaller proportion of Reserve accessions than of the comparison group. However, in FY 1998,the proportion of NPS White accessions in the ARNG, USMCR, and ANG and prior service Whiteaccessions in the ARNG and ANG was higher than in the civilian comparison groups.
Black females represented the largest proportion of minority Reserve accessions (see AppendixTables C-3 and C-11). Across the Reserve Component, the proportion of Black women (29 and 31percent for NPS and prior service, respectively) was nearly twice that of Black men (14 and 18 percentfor NPS and prior service, respectively). The USAR had the highest proportion of Black femalerecruits (35 percent of NPS and 37 percent of prior service). The USAFR also had a 35-percentproportion of NPS Black females.

5-7
Table 5.3. FY 1998 Selected Reserve Non-Prior Service and Prior Service Enlisted Accessions,by Race/Ethnicity, and Civilians (Percent)
Race/Ethnicity
ArmyNationalGuard
ArmyReserve
NavalReserve
MarineCorps
Reserve
AirNationalGuard
AirForce
ReserveTotalDoD Civilians*
NON-PRIOR SERVICE
White 72.5 64.5 63.5 68.3 76.2 58.8 69.5 65.9
Black 15.9 24.5 18.5 11.6 10.3 25.8 17.7 14.2
Hispanic 7.0 5.7 11.6 13.2 5.5 7.7 7.4 15.0
Other 4.7 5.3 6.5 6.9 8.0 7.7 5.4 4.9PRIOR SERVICE
White 69.4 65.8 70.5 66.7 77.1 73.5 69.0 69.8
Black 19.0 25.3 16.7 13.8 11.8 15.7 19.9 12.6
Hispanic 7.2 4.8 8.5 13.9 5.6 5.7 6.7 12.8
Other 4.4 4.2 4.3 5.6 5.5 5.1 4.5 4.7TOTAL ACCESSIONS
White 71.0 65.4 69.5 67.6 76.8 71.0 69.2
Black 17.4 25.0 16.9 12.5 11.2 17.4 19.9
Hispanic 7.1 5.1 9.0 13.5 5.6 6.1 7.0
Other 4.5 4.5 4.6 6.4 6.5 5.5 4.8Columns may not add to total due to rounding.* NPS civilian comparison is 18- to 24-year-old civilians; prior service civilian comparison is 20- to 39-year-old civilian laborforce.Also see Appendix Tables C-3 (NPS Race/Ethnicity by Component and Gender) and C-11 (Prior Service Race/Ethnicity byComponent and Gender).Source: Civilian data from Bureau of Labor Statistics Current Population Survey File, October 1997 – September 1998.
Gender. The proportion of Selected Reserve accessions in FY 1998 who were women wasslightly greater (19 percent) than in the Active Component (18 percent). Table 5.4 reflects the genderpercentages for NPS and prior service accessions by Component. The USAR and USAFR had thehighest proportion of female accessions in the Selected Reserve (26 and 23 percent, respectively), whilethe USMCR had the lowest (5 percent). With the exception of the USMCR, the proportion of priorservice female recruits was lower than NPS female recruits.
Marital Status. Approximately 10 percent of FY 1998 Selected Reserve NPS enlistedaccessions were married (Table 5.5). The marriage rates of prior service recruits look markedlydifferent, with 40 percent married. The FY 1998 prior service cohort, predominantly those leavingactive duty enlisted service who chose to affiliate with the Reserves, were less likely to be married thanactive duty enlisted members (53 percent). Also, prior service Reserve recruits were less likely to bemarried than their civilian counterparts, 20- to 39-year-old civilians in the labor force (51 percent).Among FY 1998 prior service Reserve accessions, a somewhat larger proportion of males weremarried than females, consistent with the trend in the 20- to 39-year-old civilian population. There wereno marital status differences by gender for FY 1998 NPS Reserve accessions.

5-8
Table 5.4. FY 1998 Selected Reserve Non-Prior Service and Prior Service Accessions, by Gender(Percent)
Non-Prior Service Prior Service Total
Component Males Females Males Females Males Females
Army National Guard 80.8 19.2 90.4 9.6 85.4 14.6
Army Reserve 63.5 36.5 78.6 21.4 73.6 26.4
Naval Reserve 69.8 30.2 83.9 16.1 81.9 18.1
USMC Reserve 95.3 4.7 94.4 5.6 94.9 5.1
Air National Guard 70.5 29.5 81.9 18.1 77.4 22.6
Air Force Reserve 62.0 38.0 78.5 21.5 75.6 24.4
DoD Total 76.2 23.8 84.0 16.0 81.0 19.1Also see Appendix Tables C-1 (NPS Age by Component and Gender) and C-9 (Prior Service Age by Component and Gender).
Table 5.5. FY 1998 Married Selected Reserve Non-Prior Service and Prior Service Enlisted Accessions and ActiveComponent Non-Prior Service Enlisted Accessions and Enlisted Members, by Gender,
and Civilians (Percent)
Gender
Non-PriorServiceReserve
Accessions
Civilians,17–35 Years
Old
Prior ServiceReserve
Accessions
CivilianLabor Force,20–39 Years
Old
Non-PriorService Active
ComponentAccessions
Active ComponentEnlisted Members
Male 10.4 35.8 41.5 51.3 8.7 54.9
Female 10.3 42.3 34.3 50.7 11.8 44.2
Total 10.4 39.1 40.3 51.0 9.2 53.4Also see Appendix Tables C-2 (NPS Age by Marital Status and Gender), C-10 (Prior Service Age by Marital Status and Gender), B-2(NPS Active Component Enlisted Accession by Age, Marital Status and Gender), and B-23 (Active Component Enlisted Members byAge, Service, and Gender).Source: Civilian data from Bureau of Labor Statistics Current Population Survey File, October 1997 – September 1998.
Education. More Selected Reserve NPS recruits completed high school than was the case fortheir civilian peers, as indicated in Table 5.6. Approximately 91 percent of FY 1998 Selected ReserveNPS accessions were in Tiers 1 (high school graduates) and 2 (alternative credentials), compared to 79percent of 18- to 24-year-old civilians. The most marked differences among the Reserve Componentsin FY 1998 high school graduate NPS recruits were between the Army and “non-Army” Components.In the Army National Guard and Army Reserve, 87 and 77 percent of NPS enlistees were high schooldiploma graduates, respectively. In comparison, the USMCR, accessed 97 percent NPS high schoolgraduates. The percentage in Tier 1 for all Components except the Army National Guard decreasedfrom FY 1997 to 1998, with decreases ranging from less than 1 percentage point to 16 percentagepoints. The Army National Guard and Air National Guard had the highest proportion of Tier 2accessions (7 and 6 percent, respectively). The proportion of Tier 2 accessions for the ARNGdecreased from 17 in FY 1997. The Army Reserve experienced a significant increase in Tier 3accessions from 3 percent in FY 1997 to 20 percent in FY 1998.

5-9
College experience refers to individuals who have completed at least one semester in juniorcollege or a 4-year institution. The USNR had, by far, the highest proportion of accessions with collegeexperience (33 percent). Most enlisted occupations are generally comparable to civilian jobs notrequiring college education.
Table 5.6. FY 1998 Selected Reserve Non-Prior Service Enlisted Accessions, by Education Tier and Component,and Civilians 18–24 Years Old (Percent)
EducationTier
ArmyNational
GuardArmy
ReserveNaval
Reserve
MarineCorps
Reserve
AirNational
Guard
AirForce
ReserveTotalDoD
18- to 24-Year-Old
Civilians*
Tier 1: RegularHigh SchoolGraduate orHigher**
86.5 77.4 92.7 96.5 92.5 96.0 86.0
78.8Tier 2: GED,AlternativeCredentials
6.7 2.7 5.4 3.2 6.3 3.0 5.1
Tier 3: NoCredentials 6.8 19.9 1.8 0.3 1.3 1.1 8.9 21.2
Total 100.0 100.0 100.0 100.0 100.0 100.0 100.0 100.0
CollegeExperience (PartofTier 1)1
2.1 3.7 33.1 4.0 5.4 5.4 4.4 45.8
Columns may not add to total due to rounding. *Civilian percentages combine Tiers 1 and 2. **Tier 1 includes members still in high school.1 These military data represent only Selected Reserve NPS enlisted accessions. Officers, who usually have college degrees, are notincluded. See Chapter 6 for a discussion of Reserve officers.Also see Appendix Tables C-7 (Education by Component and Gender) and C-8 (Education by Component and Race/Ethnicity).Source: Civilian data from Bureau of Labor Statistics Current Population Survey File, October 1997 – September 1998.
AFQT. FY 1998 Selected Reserve NPS accessions are compared with civilian youth byAFQT category, gender, and Reserve Components in Table 5.7. The percentage of Reserve malerecruits who scored in AFQT Categories I to IIIA was greater than for their civilian counterparts (59versus 54 percent). Sixty-eight to 75 percent of USAR, USMCR, ANG, and USAFR NPS maleaccessions were in AFQT Categories I through IIIA, compared to 54 percent in the civilian group.Fifty-three percent of ARNG NPS male recruits scored in AFQT Categories I through IIIA,comparable to the civilian group. The differences between scores of female recruits and theircomparable civilian group were similar to male accessions; however, ARNG NPS female recruitsscored 2 percentage points higher in AFQT Categories I–IIIA than the comparable civilian group.

5-10
Table 5.7. FY 1998 Selected Reserve Non-Prior Service Enlisted Accessions, by AFQT Category, Gender, and Component (Percent)
AFQTCategory
ArmyNational
GuardArmy
ReserveNaval
Reserve
MarineCorps
Reserve
AirNational
Guard
AirForce
ReserveTotalDoD
MALES
I 3.9 5.7 0.5 7.6 7.6 5.9 4.9
II 27.9 35.0 7.8 42.9 46.1 44.7 32.0
IIIA 20.8 27.6 5.8 22.3 23.3 24.5 22.1
IIIB 39.8 23.2 6.6 22.6 21.7 24.0 31.2
IV 2.2 2.4 1.3 0.3 0.0 0.0 1.8
V 0.0 0.0 0.0 0.0 0.0 0.0 0.0
Unknown 5.5 6.0 78.1 4.3 1.2 1.0 8.0
Total 100.0 100.0 100.0 100.0 100.0 100.0 100.0
FEMALES
I 2.2 2.6 0.1 3.8 4.3 2.9 2.5
II 25.9 24.7 2.3 46.5 40.3 31.2 25.8
IIIA 22.7 26.1 2.7 29.9 26.6 33.4 23.8
IIIB 45.8 39.6 2.0 14.2 28.0 32.0 38.4
IV 1.1 1.3 0.4 0.0 0.0 0.4 1.0
V 0.0 0.0 0.0 0.0 0.0 0.0 0.0
Unknown 2.4 5.8 92.5 5.6 0.7 0.2 8.5
Total 100.0 100.0 100.0 100.0 100.0 100.0 100.0Columns may not add to total due to rounding.* Less than one-tenth of one percent.Also see Appendix Tables C-5 (AFQT by Component and Gender) and C-6 (AFQT by Component and Race/Ethnicity).
Source: Service data from Defense Manpower Data Center. The 1980 civilian comparison group distribution for the totalpopulation (males and females) is 7 percent in Category I, 28 percent in Category II, 15 percent in Category IIIA, 19 percent inCategory IIIB, 21 percent in Category IV, and 10 percent in Category V. Civilian data from the Profile of American Youth(Washington, DC: Office of the Assistant Secretary of Defense [Manpower, Reserve Affairs, and Logistics], 1982).
Characteristics of the Selected Reserve Enlisted Force
Reserve Component forces perform a variety of important missions in the event of nationalemergency, and assist the Active Component in meeting its peacetime operating requirements. Figure5.2 shows the Selected Reserve enlisted end-strengths for FYs 1974 to 1998.
Age. Substantive differences exist among the Reserve Components in the proportion ofenlisted members in various age groups, as shown in Table 5.8. The Air Force Reserve Components(ANG and USAFR) have the "oldest" members with 33 and 34 percent, respectively, of enlistedmembers 40 years of age or older. These proportions are strikingly different from the ActiveComponent and other Reserve Components. For example, only 4 percent of USMCR enlistedmembers are 40 or older.

5-11
ARNG
USAR
USNR
USMCR
ANG
USAFR50
100
150
200
250
300
350
400
450
1974 1976 1978 1980 1982 1984 1986 1988 1990 1992 1994 1996 1998
FISCAL YEAR
EN
D S
TRE
NG
TH (T
hous
ands
))
ARNG USAR USNR USMCR ANG USAFR
Also see Appendix Table D-30 (Reserve Component Enlisted Strength).
Figure 5.2. Reserve Component enlisted end-strength, FYs 1974–1998.
Table 5.8. FY 1998 Selected Reserve Enlisted Members, by Age and Component,and Civilian Labor Force Over 16 Years Old (Percent)
AgeGroup
ArmyNational
GuardArmy
ReserveNaval
Reserve
MarineCorps
Reserve
AirNationalGuard
AirForce
ReserveTotalDoD Civilians
17–19 9.2 10.5 1.1 12.8 2.6 1.0 7.4 5.0
20–24 20.0 22.3 10.8 48.3 10.9 7.1 18.9 9.9
25–29 20.4 18.7 21.4 22.1 15.9 15.3 19.3 11.6
30–34 15.3 14.8 23.1 8.5 19.2 20.8 16.5 12.3
35–39 13.5 13.4 20.6 4.8 18.6 21.5 15.0 13.8
40–44 8.3 9.0 11.8 1.9 11.5 13.6 9.3 13.7
45–49 6.5 5.8 6.3 0.9 10.3 10.2 6.8 11.8
50+ 6.8 5.0 4.9 0.7 11.0 10.5 6.7 21.9
Unknown 0.0 0.5 0.0 0.2 0.0 0.0 0.1 0.0
Total 100.0 100.0 100.0 100.0 100.0 100.0 100.0 100.0Columns may not add to total due to rounding.* Less than one-tenth of one percent.Also see Appendix Table C-15 (Age by Component and Gender).Source: Civilian data from Bureau of Labor Statistics Current Population Survey File, September 1998.
Age differences among the Components result from diverse mission requirements and retention.The mission drives the NPS/prior service mix in each of the Reserve Components. For example, thelabor-intensive requirements of infantry and other ground combat units usually mandate the need for

5-12
younger individuals, while equipment-intensive requirements demand more formal training. Normally,longer training periods result in the Services seeking recruits for longer terms of enlistment or maintaininga force with greater experience. Individuals in equipment-intensive or high-technology fields, such asthose found more often in the USNR, ANG, and USAFR, usually are more experienced, and thereforeolder.
Race/Ethnicity. As shown in Table 5.9, the proportion of minority Servicemembers varies byReserve Component. The proportion of Blacks is higher than in the comparable civilian group (18 and12 percent, respectively), but lower than in the Active Component (22 percent). The USAR has thelargest proportion of Blacks (28 percent), while the ANG has the lowest (9 percent). The USMCR hasthe greatest proportion of Hispanic members (13 percent) and, along with the ANG, the greatestproportion of "Other" racial minorities (6 percent). The USAR data are affected by the large number ofFY 1998 accessions with unknown race/ethnicity who are included in the "Other" minorities category.
Table 5.9. FY 1998 Selected Reserve Enlisted Members, by Race/Ethnicity, Gender,And Component, and Civilian Labor Force 18–49 Years Old (Percent)
Race/Ethnicity
ArmyNationalGuard
ArmyReserve
NavalReserve
MarineCorps
Reserve
AirNationalGuard
AirForce
ReserveTotalDoD
MALESWhite 73.8 61.9 74.0 68.9 80.6 73.6 72.1Black 15.3 23.5 13.7 11.9 7.7 15.9 15.6Hispanic 7.4 8.9 7.8 13.1 5.7 5.7 7.7Other 3.5 5.8 4.5 6.1 6.1 4.8 4.6
Total 100.0 100.0 100.0 100.0 100.0 100.0 100.0
FEMALESWhite 61.3 46.8 64.6 59.8 72.6 62.5 58.3Black 28.4 40.9 23.7 20.7 15.5 27.6 30.3Hispanic 6.2 6.8 7.3 13.8 5.2 4.9 6.4Other 4.1 5.5 4.3 5.7 6.7 5.0 5.1
Total 100.0 100.0 100.0 100.0 100.0 100.0 100.0
TOTALWhite 72.6 58.2 72.2 68.5 79.3 71.4 70.0Black 16.6 27.7 15.6 12.3 9.0 18.2 17.8Hispanic 7.3 8.3 7.7 13.1 5.6 5.5 7.5Other 3.6 5.7 4.5 6.1 6.1 4.9 4.7
Total 100.0 100.0 100.0 100.0 100.0 100.0 100.0
CIVILIAN LABOR FORCE 18–49 YEARS OLD
White Black Hispanic Other Total71.6 12.1 11.7 4.6 100.0
Columns may not add to total due to rounding.Also see Appendix Tables C-17 (Race/Ethnicity by Component and Gender) and C-18 (Ethnicity by Component).Source: Civilian data from Bureau of Labor Statistics Current Population Survey File, September 1998.

5-13
Substantial gender differences exist in the racial and ethnic composition of Reserve Componentmembers (Appendix Table C-17). While Black males represent 16 percent of the male enlistedSelected Reserve, Black females represent 30 percent of females. Approximately 54 percent of USARfemales are minorities: 41 percent Black, 7 percent Hispanic, and 6 percent in the "Other" racialcategory. Conversely, the ANG has the lowest proportion of minority females (27 percent), comparedto 28 percent in the 18- to 49-year-old civilian labor force.
Gender. The proportion of enlisted women is slightly greater in the Selected Reserve than inthe Active Component (15 versus 14 percent, respectively). However, as Table 5.10 makes clear,there are differences in the proportion of women among the Reserve Components. The Componentwith the highest proportion of women is the USAR (24 percent), while the other Army Component, theARNG, has 10 percent and the USMCR, with the lowest proportion, has 4 percent. Differences ingender composition are the result of the types of units in the Components. For example, the ARNGand USMCR have mainly combat units and the USAR has primarily combat support and combatservice support units.
Table 5.10. FY 1998 Selected Reserve Enlisted Members, by Gender and Component,and Civilian Labor Force 18–49 Years Old (Percent)
Gender
ArmyNationalGuard
ArmyReserve
NavalReserve
MarineCorps
Reserve
AirNationalGuard
AirForce
ReserveTotalDoD
18- to 49-Year-OldCivilians
Male 90.0 75.6 81.3 95.7 84.0 80.2 84.8 53.6
Female 10.0 24.4 18.7 4.3 16.0 19.8 15.2 46.4Also see Appendix Table C-15 (Age by Component and Gender).Source: Civilian data from Bureau of Labor Statistics Current Population Survey File, September 1998.
Marital Status. Just over half of Selected Reserve members are married (Table 5.11). Thisproportion is lower than for the comparable civilian population (56 percent), and for enlisted membersin the Active Component (55 percent). The proportion of married female Selected Reserve members(37 percent) is much lower than the proportion of married female civilians (55 percent). This differenceis in part explained by the younger age of women enlisted members compared to their civiliancounterparts.
Table 5.11. FY 1998 Married Selected Reserve Enlisted Members, by Gender,and Civilian Labor Force 18–49 Years Old (Percent)
Gender DoD 18- to 49-Year-Old Civilians
Male 53.6 56.9
Female 37.1 53.6
Total 51.1 55.3Also see Appendix Table C-16 (Age by Marital Status and Gender).Source: Civilian data from Bureau of Labor Statistics Current Population Survey File, September 1998.
Education. As shown in Table 5.12, 99 percent of FY 1998 Selected Reserve enlistedmembers have a high school diploma or alternative credential (Tiers 1 and 2), compared to 89 percent

5-14
of the comparably aged civilian labor force. Comparing Table 5.6 (education levels of SelectedReserve accessions) with Table 5.12 suggests that a significant number of enlisted members gain collegeexperience while in the Selected Reserve (5 percent of NPS accessions versus 20 percent of enlistedmembers).
Table 5.12. FY 1998 Selected Reserve Enlisted Members, by Education Levels and Component, andCivilian Labor Force 18–49 Years Old (Percent)1
EducationTier
ArmyNationalGuard
ArmyReserve
NavalReserve
MarineCorps
Reserve
AirNationalGuard
AirForce
ReserveTotalDoD
18- to 49-Year-OldCivilians*
Tier 1: RegularHigh SchoolGraduate orHigher
99.2 92.9 98.2 97.2 99.1 99.6 97.788.6
Tier 2: GED,AlternativeCredentials
0.0 3.7 1.0 2.6 0.8 0.3 1.2
Tier 3: NoCredentials
0.8 3.5 0.8 0.1 0.1 0.1 1.2 11.4
Total 100.0 100.0 100.0 100.0 100.0 100.0 100.0 100.0CollegeExperience(Part ofTier 1)
20.3 13.5 36.4 8.2 17.3 24.0 19.7 55.7
Columns may not add to total due to rounding.* Civilian percentages combine Tiers 1 and 2.1 Comparisons between FY 1998 data and previous years’ data may show some large changes due to extensive updates andcorrections made to the education data in October 1997.Also see Appendix Tables C-19 (Education by Component and Gender) and C-20 (Education by Component and Race/Ethnicity).Source: Civilian data from Bureau of Labor Statistics Current Population Survey File, September 1998.
Representation Within Occupations . The assignment of Reserve Component personnel tooccupations is based upon individual qualifications and desires, military requirements, and unitvacancies. The changing missions of the Armed Services, including domestic and internationalhumanitarian efforts, affect personnel assignment. Table 5.13 shows the occupational area distributionof Reserve and Active Components.
Table 5.14 indicates that the occupational distribution among Active and ReserveComponents varies. The differences reflect each Reserve Component's unique mission requirements andforce structure. These differences may preclude some direct transfers from active duty to the NationalGuard and Reserve within the same skill. For example, 13 percent of active Navy enlisted membersserve in electronics specialties, but Naval Reserve requirements account for only 7 percent of this skillarea. On the other hand, only 10 percent of active Navy enlistees serve in administration while 21percent of USNR enlistees serve in administration. Similar occupational differences are found in eachService component. Some occupational areas may not be able to absorb all transfers, while other areasmay have to recruit more NPS individuals to fill unit vacancies or retrain those with prior service. Theoccupational distribution percentages for FY 1998 are relatively similar to those of FY 1997.

5-15
Table 5.13. Comparison of FY 1998 Reserve and Active Enlisted Occupational Areas (Percent)
Occupational Code and Area Reserve Active
0 Infantry, Gun Crews, and Seamanship Specialists 18.6 16.9
1 Electronic Equipment Repairers 4.6 9.3
2 Communications and Intelligence Specialists 4.9 8.7
3 Medical and Dental Specialists 6.8 7.1
4 Other Allied Specialists 2.7 3.0
5 Functional Support and Administration 18.4 16.0
6 Electrical/Mechanical Equipment Repairers 16.6 20.1
7 Craftsmen 5.8 3.6
8 Service and Supply Handlers 10.3 8.5
9 Non-occupational* 11.2 6.8
Total 100.0 100.0Columns may not add to total due to rounding.* Non-occupational includes patients, students, those with unassigned duties, and unknowns.Also see Appendix Tables B-29 and C-21 (Occupational Area by Service/Component and Gender) and B-30 and C-22 (OccupationalArea by Service/Component and Race/Ethnicity).
Table 5.14. Comparison of FY 1998 Occupational Area Distribution of Enlisted Members,by Active and Reserve Components (Percent)
Active and Reserve Occupational Area*Components 0 1 2 3 4 5 6 7 8 9ARMY Active Component Army National Guard Army Reserve
26.625.216.5
6.63.62.3
9.95.04.5
8.34.6
11.2
3.42.43.2
15.913.623.0
14.414.310.6
2.03.85.0
12.411.014.7
0.716.69.2
NAVY Active Component Naval Reserve
9.89.8
13.37.3
9.68.2
8.110.0
2.10.8
10.321.2
26.521.8
5.415.0
4.84.9
10.11.1
MARINE CORPS Active Component USMC Reserve
22.426.0
6.13.0
7.17.6
0.00.0
2.41.2
16.112.8
15.612.6
2.53.1
13.115.2
14.718.4
AIR FORCE Active Component Air National Guard USAF Reserve
8.57.8
11.9
10.310.25.5
7.23.62.8
8.24.9
10.7
3.94.83.4
22.222.226.3
23.227.524.7
4.47.76.5
4.95.94.7
7.25.63.6
* Occupational Area Codes: 0=Infantry, 1=Electronics, 2=Communications, 3=Medical, 4=Other Technical, 5=Administration,6=Electrical, 7=Craftsmen, 8=Supply, 9=Non-occupational.
Representation of minorities within occupations. As shown in Table 5.15, about two-thirds ofall Selected Reserve personnel are in four occupational areas: infantry, administration,electrical/mechanical equipment repair, and service and supply. The largest percentage of Blacks and“Others” are in functional support and administration, while combat occupations are the most prevalentamong Whites and Hispanics.

5-16
Table 5.15. FY 1998 Occupational Areas of Selected Reserve Enlisted PersonnelWithin Race/Ethnicity (Percent)
Occupational Code and Area White Black Hispanic Other
0 Infantry, Gun Crews, and Seamanship Specialists 19.6 14.6 20.1 18.1
1 Electronic Equipment Repairers 5.0 3.6 3.7 4.7
2 Communications and Intelligence Specialists 5.3 3.7 4.4 4.2
3 Medical and Dental Specialists 6.3 8.3 7.4 8.4
4 Other Allied Specialists 2.9 2.4 2.3 2.2
5 Functional Support and Administration 16.3 26.2 18.1 20.1
6 Electrical/Mechanical Equipment Repairers 17.7 12.3 16.9 15.6
7 Craftsmen 6.4 4.2 5.3 5.4
8 Service and Supply Handlers 9.5 13.7 11.2 8.3
9 Non-occupational* 11.1 11.1 10.7 13.0
Total 100.0 100.0 100.0 100.0Columns may not add to total due to rounding.* Non-occupational includes patients, students, those with unassigned duties, and unknowns.Also see Appendix Table C-22 (Occupational Area by Component and Race/Ethnicity).
Representation of women within occupations. The assignment patterns for Selected Reserveenlisted men and women in occupational areas are reflected in Table 5.16. Most National Guard andReserve enlisted women are assigned to two occupational areas: functional support (41percent) andmedical (16 percent). Enlisted men are assigned primarily to infantry (21 percent) andelectrical/mechanical equipment repair (19 percent).
Table 5.16. FY 1998 Occupational Areas of Selected Reserve Enlisted Personnel, by Gender (Percent)
Occupational Code and Area Male Female
0 Infantry, Gun Crews, and Seamanship Specialists 21.2 4.4
1 Electronic Equipment Repairers 5.0 2.4
2 Communications and Intelligence Specialists 5.1 3.7
3 Medical and Dental Specialists 5.2 15.9
4 Other Allied Specialists 2.8 2.2
5 Functional Support and Administration 14.4 41.0
6 Electrical/Mechanical Equipment Repairers 18.6 5.6
7 Craftsmen 6.5 2.3
8 Service and Supply Handlers 10.5 9.1
9 Non-occupational* 10.7 13.4
Total 100.0 100.0
Columns may not add to total due to rounding.* Non-occupational includes patients, students, those with unassigned duties, and unknowns.Also see Appendix Table C-21 (Occupational Area by Component and Gender).

5-17
The April 1993 policy7 to open more specialties and assignments to women resulted in newopportunities for women in both the Active and Reserve Components. Women are not permitted toserve in direct ground combat roles, but positions on ships and aircraft engaging in combat are nowopen to women. In FY 1998, 4 percent of women served in infantry, gun crew, and seamanshipspecialties, as illustrated in Table 5.16.
The proportion of Selected Reserve women in non-traditional occupations, such as technicaland craftsmen, was relatively low in FY 1998. Women were nearly three times more likely than men toserve in the traditional occupational areas of medical and administration. In the future, the proportion ofwomen enlisting in non-traditional positions in the National Guard and Reserves will depend to aconsiderable extent on the number of Active Component women in non-traditional skills, theirwillingness to join a Selected Reserve unit upon separating from active duty, and the proportion oftechnical skill vacancies in Guard and Reserve units. However, with the end of the military drawdown,there are fewer prior service women available to enter the Selected Reserve. Consequently, it isimportant to continue monitoring occupational trends by gender in both the Active and ReserveComponents.
7 Memorandum from Les Aspin, Secretary of Defense, Subject: Policy on the Assignment of Women in theArmed Forces, April 28, 1993.

6-1
Chapter 6
SELECTED RESERVE OFFICER ACCESSIONSAND OFFICER CORPS
This chapter describes demographic characteristics of Selected Reserve officer accessions andcommissioned officers in FY 1998.1 The total officer accessions for Reserves increased in FY 1998(from 14,379 in FY 1997 to 15,482 in FY 1998). The FY 1998 officer corps decreased by about 3percent from FY 1997 (from 127,009 to 124,309). On the whole, however, the Selected Reserveofficer corps of FY 1998 looks similar to the FY 1997 officer corps. Figure 6.1 shows the ReserveComponent officer corps end-strengths for FYs 1974 to 1998.
ARNG
USAR
USNR
USMCR
ANGUSAFR
10
20
30
40
50
60
70
1974 1976 1978 1980 1982 1984 1986 1988 1990 1992 1994 1996 1998
FISCAL YEAR
EN
D-S
TR
EN
GT
H (T
hous
ands
)
ARNG USAR USNR USMCR ANG USAFR
Also see Appendix Table D-31 (Officer Strength by Fiscal Year).
Figure 6.1. Reserve Component officer corps end-strength, FYs 1974–1998.
Table 6.1 compares the number and proportion of Reserve officer accessions with the officercorps. The ARNG and the USAR account for the largest proportion of Selected Reserve officers. Thetwo Army components comprise 57 percent of Reserve officer accessions and 58 percent of Reserveofficer end-strength. With the exception of the ANG and USMCR, accessions increased for allcomponents in FY 1998. End-strength decreased in all components except the USAFR.
1 Data are for commissioned officers; warrant officers are excluded. A brief look at Reserve Component warrantofficers is provided in Appendix Tables C-34 and C-35.

6-2
Table 6.1. FY 1998 Selected Reserve Officer Accessions and Officer Corps End-Strength(Number and Percent)
Reserve Officer AccessionsReserve Officer Corps
End-Strength
Component Number Percent Number Percent
Army National Guard 2,387 15.4 31,306 25.2
Army Reserve 6,474 41.8 40,665 32.7
Naval Reserve 2,968 19.2 19,405 15.6
USMC Reserve 694 4.5 3,760 3.0
Air National Guard 1,100 7.1 13,235 10.6
Air Force Reserve 1,859 12.0 15,938 12.8
Total 15,482 100.0 124,309 100.0
Columns may not add to total due to rounding.Also see Appendix Tables C-23 (Officer Accessions by Age and Component) and C-24 (Officers by Age and Component).
Characteristics of Selected Reserve Officer Accessions and Officer Corps
Age. The differing missions and force structures of the Reserve Component affect the agecomposition of the officer corps as shown in Figure 6.2. The USAR and USAFR have the largestproportions of officers aged 40 and older (52 and 54 percent, respectively). Conversely, the ARNGand USMCR have the smallest proportions of officers 40 or older (34 and 41 percent, respectively).The ARNG and USAR have the greatest proportions of officers aged 29 and younger (18 and 10percent, respectively).
Recruiting policies affect the age structure of the Selected Reserve officer corps. As in theActive Component, one might expect the USMCR to have a greater proportion of younger officers thanthe other Reserve Components. However, this is not the case. The USMCR’s policy to recruit onlyofficers with prior military service increases the age of its officers.
Race/Ethnicity. The percentages of FY 1998 Selected Reserve officer accessions and officercorps by race/ethnicity are shown in Table 6.2. The proportions of Black and Hispanic officeraccessions in the Selected Reserve are comparable to the proportions in the Active Component(Blacks: Active - 9 percent, Reserve - 9 percent; Hispanics: Active - 3 percent, Reserve - 3 percent).In FY 1998, the Active Component accessed more new officers of “Other” race/ethnicity than theSelected Reserve (7 percent versus 4 percent), but the Reserve Component maintained the sameproportion as the Active Component of “Others” in their officer corps (4 percent each).

6-3
0%
5%
10%
15%
20%
25%
30%
35%
18-24 25-29 30-34 35-39 40-44 45-49 50+
A G E
ARNG USAR USNR USMCR ANG USAFR
Also see Appendix Table C-24 (Officer Strength by Fiscal Year).
Figure 6.2. Percent of Selected Reserve officer corps by age group, FY 1998.
The Army components of the Selected Reserve have the highest proportions of Black andHispanic officers (Blacks: ARNG 8 percent/USAR 13 percent; Hispanic: ARNG 5 percent/USAR 4percent), while the USNR has the lowest (Blacks: 3 percent; Hispanics: 2 percent) with the USAFRalso having 2 percent Hispanic officers. In the remaining components, the proportions of Black officersrange from 4 to 6 percent and the proportions of Hispanic officers are all approximately 3 percent.
Gender. Women comprise 19 percent of Selected Reserve officer accessions and 18 percentof the Selected Reserve officer corps, as shown in Table 6.3. The proportion of Selected Reservefemale officer accessions is the same as the Active Component (both 19 percent). However, theproportion of women in the Selected Reserve officer corps is larger than in the Active Component (18and 14 percent, respectively), due to higher retention among female officers in the Reserve Component.
The impact of force structure and mission diversity is reflected in the distribution of womenofficers among the Reserve Component. The proportion of female officers in the USMCR is 5 percent,while 23 percent of the USAR and 24 percent of the USAFR officers are female. Reasons for thisdivergence are discussed in the portion of this chapter dealing with the occupational assignment ofofficers.

6-4
Table 6.2. FY 1998 Selected Reserve Officer Accessions and Officer Corps,by Race/Ethnicity (Percent)
Component White Black Hispanic Other Total
SELECTED RESERVE OFFICER ACCESSIONS
Army National Guard 82.6 8.2 4.7 4.6 100.0
Army Reserve 78.5 13.3 3.5 4.8 100.0
Naval Reserve 90.9 3.4 2.0 3.7 100.0
USMC Reserve 89.1 5.0 3.3 2.6 100.0
Air National Guard 86.6 5.5 2.6 5.3 100.0
Air Force Reserve 88.6 4.7 1.9 4.8 100.0
Total DoD 83.8 8.7 3.1 4.5 100.0
SELECTED RESERVE OFFICER CORPS
Army National Guard 85.3 7.4 4.5 2.9 100.0
Army Reserve 77.4 14.3 3.9 4.5 100.0
Naval Reserve 90.9 3.4 1.9 3.8 100.0
USMC Reserve 90.5 4.2 2.8 2.5 100.0
Air National Guard 87.2 5.0 3.0 4.8 100.0
Air Force Reserve 88.0 5.6 2.5 3.9 100.0
Total DoD 84.3 8.5 3.4 3.9 100.0
Rows may not add to total due to rounding.Also see Appendix Table C-27 (Race/Ethnicity by Component).
Table 6.3. FY 1998 Selected Reserve Female Officer Accessions and Officer Corps (Percent)
ArmyNational
GuardArmy
ReserveNaval
ReserveUSMCReserve
AirNational
Guard
AirForce
ReserveDoDTotal
Officer Accessions 12.2 22.8 16.0 5.0 17.0 23.5 18.7
Officer Corps 9.7 24.7 17.6 5.4 14.4 24.4 18.1Also see Appendix Table C-25 (Gender by Component).
Marital Status . In FY 1998, the proportion of Selected Reserve officer accessions andofficers who were married was higher than for enlisted members (Table 6.4). As in the ActiveComponent, more males were married than females. As detailed in Appendix Table C-26, theproportion of married male Selected Reserve officers (76 percent) is larger than the proportion of themale civilian college graduate labor force who are married (72 percent). However, the proportion of

6-5
married female Selected Reserve officers (57 percent) is lower than for their comparable female civiliancollege graduate labor force who are married (62 percent).
Table 6.4. FY 1998 Married Selected Reserve Officers and Enlisted Members, by Gender,and Civilians (Percent)
Gender
ReserveOfficer
Accessions
21- to 35-Year-OldCivilian College
Graduates
ReserveOfficerCorps
CivilianCollege Graduatesin the Work Force
ReserveEnlisted
Members18- to 49-Year-Old
Civilians
Male 58.2 50.6 76.0 71.7 53.6 56.9
Female 44.2 55.6 57.3 62.0 37.1 53.6
Total 55.6 53.2 72.1 67.2 51.1 55.3Also see Appendix Tables C-16 (Enlisted Members by Age, Marital Status, and Gender) and C-26 (Officers by Gender, Marital Status,and Component).Source: Civilian data from Bureau of Labor Statistics Current Population Survey File, October 1997 – September 1998.
Source of Commission. Each Reserve Component applies its own selection procedures forofficer candidates. Many officers who transfer from an Active Component already possess at least acollege degree. Officer candidates who do not have a degree undergo rigorous selection procedures,and must successfully complete an officer candidate or training school. For example, in FY 1998, 14percent of ARNG officer accessions received their commissions through the ARNG Officer CandidateSchools (OCS) located in each state and territory (down from 20 percent in FY 1997); 28 percent ofANG officer accessions were commissioned through its Academy of Military Science (AMS) located inTennessee (similar to FY 1997 with 29 percent; Table 6.5).
Table 6.5. FY 1998 Source of Commission of Selected Reserve Officer Accessions (Percent)
Source of Commission
ArmyNationalGuard
ArmyReserve
NavalReserve
USMCReserve
AirNationalGuard
AirForce
ReserveDoDTotal
Service Academy 1.2 2.1 11.6 4.6 10.8 14.5 6.0
ROTC–Scholarship 5.3 4.5 16.9 0.0 5.7 15.1 8.2
ROTC–No Scholarship 19.3 9.0 3.3 15.7 16.0 18.6 11.4
OCS/OTS/PLC 1.9 1.8 20.8 79.7 11.0 16.1 11.3
ANG AMS/ARNG OCS 13.6 1.8 0.0 0.0 28.2 3.3 5.2
Direct Appointment 8.8 10.6 38.0 0.0 25.9 31.4 18.7
Other 49.1 0.3 6.2 0.0 2.4 1.0 9.2
Unknown 0.8 69.9 3.1 0.0 0.0 0.0 30.0
Total 100.0 100.0 100.0 100.0 100.0 100.0 100.0Columns may not add to total due to rounding.Also see Appendix Table C-33 (Officers by Source of Commission and Component).

6-6
The variation in levels of reliance on the various sources of commission by the ReserveComponent is evident in Table 6.5. In the USNR and USAFR, the largest source of commissions wasthrough direct appointments. The overwhelming majority of USMCR officer accessions (80 percent)obtained their commissions through OCS or the Marine Corps Platoon Leader Class (PLC). PLC is asplit-training program in which candidates normally attend officer training in the summers after theirjunior and senior years of college. The Army's components rely heavily on the Reserve OfficersTraining Corps (ROTC), primarily without scholarships. Approximately 9 percent of officer accessionsare commissioned from other programs, primarily through the aviation cadet and aviation trainingprograms.2
Education. The Reserve Component also tends to vary in the educational attainment levels ofits officer accessions (Table 6.6). Overall in FY 1998, 85 percent of Reserve officer accessions wereat least college graduates (bachelor and/or advanced degrees). The USNR had the highest proportionof officer accessions with at least a college degree (99 percent). In the other components, thepercentage of officer accessions with degrees ranged from 70 percent in the ARNG to 96 percent in theUSAFR.
Table 6.6. FY 1998 Educational Attainment of Selected Reserve Officer Accessions and Officer Corps(Percent)
Educational Attainment*
ArmyNational
GuardArmy
ReserveNaval
ReserveUSMC
Reserve
AirNational
Guard
AirForce
ReserveDoDTotal
SELECTED RESERVE OFFICER ACCESSIONS
Less than College Graduate 30.3 15.0 1.1 12.7 17.1 4.3 14.9
College Graduate (B.A., B.S.,etc.)
57.3 63.0 63.1 68.6 59.6 58.9 61.3
Advanced Degree (M.A., Ph.D.,etc.)
12.4 22.0 35.8 18.6 23.3 36.9 23.8
Total 100.0 100.0 100.0 100.0 100.0 100.0 100.0
SELECTED RESERVE OFFICER CORPS
Less than College Graduate 18.7 11.5 2.0 2.0 5.0 3.4 10.0
College Graduate (B.A., B.S.,etc.)
61.0 56.0 57.9 69.6 66.7 49.1 58.3
Advanced Degree (M.A., Ph.D.,etc.)
20.3 32.5 40.1 28.4 28.3 47.5 31.7
Total 100.0 100.0 100.0 100.0 100.0 100.0 100.0Columns may not add to total due to rounding.* Excludes unknowns.Also see Appendix Table C-28 (Education by Component).
2 For Reserve Component commissioned officer accessions, "other" sources of commission are defined as:Merchant Marine Academy, Aviation Cadet, and Aviation Training Program.

6-7
For all of the Reserve Components, except the USNR. the proportion of officers with at leastan undergraduate degree is higher than that of its officer accessions. This difference is particularlyevident in the ANG where 83 percent of the accessions and 95 percent of the officer corps have acollege degree.
Several factors help explain why more officers have college degrees than do officer accessions.A number of Selected Reserve accessions have college credits but have not yet earned a degree whenthey join the Selected Reserve. Because of Service emphasis on an educated officer corps, manyindividuals join to take advantage of educational opportunities and education financing (e.g., theMontgomery G.I. Bill), and many non-degreed officers complete their college education while serving inthe Selected Reserve.
Representation Within Occupations. The distribution of officers across occupational areasis shown in Table 6.7 for both Active and Reserve Components. The largest proportions of ReserveComponent officers (56 percent) and Active Component officers (57 percent) are assigned to tacticaloperations and health care positions. However, due to assigned missions, the Reserve Component hasa smaller proportion than the Active Component in tactical operations (34 and 39 percent,respectively), but a greater proportion of officers in health care (22 and 19 percent, respectively).
Table 6.7. FY 1998 Occupational Areas of Active and Selected Reserve Officer Corps (Percent)
Occupational AreaActive
ComponentReserve
Component
General Officers and Executives * 0.4 0.5
Tactical Operations 38.4 33.9
Intelligence 5.0 5.1
Engineering and Maintenance 11.7 10.1
Scientists and Professionals 4.9 6.4
Health Care 18.9 21.3
Administration 6.0 7.7
Supply, Procurement, and Allied Occupations 8.7 10.5
Non-Occupational** 6.0 4.6
Total 100.0 100.0
* Reserve Component calculations do not include 770 O-6 officers classified as general or executive officers by the Services (1 -ARNG,1 - USAR, 305 - USMCR, 314 - ANG, and 149 - USAFR).** Non-occupational includes patients, students, those with unassigned duties, and unknowns.Also see Appendix Tables B-37 (Occupational Area by Service and Gender) and C-31 (Occupational Area by Component).

6-8
Differences in occupational assignment among the Reserve Component are shown in Table 6.8.With the exception of the USAR and the USAFR, the largest proportion of officers in each componentis in tactical operations. The ARNG and USMCR have the greatest proportions of officers in tacticaloperations (48 and 57 percent, respectively). The USAR and USAFR have the smallest proportions ofofficers in tactical operations (20 and 27 percent, respectively).
Table 6.8. Comparison of FY 1998 Occupational Area Distribution of Officers,by Active and Reserve Component (Percent)
Active and Reserve Occupational Area* Components 0** 1 2 3 4 5 6 7 8ARMY Active Component Army National Guard Army Reserve
0.50.60.3
39.646.919.9
6.32.54.5
10.37.99.1
4.33.69.3
21.210.729.9
5.96.39.4
10.510.214.1
1.411.33.6
NAVY Active Component Naval Reserve
0.40.3
38.838.3
4.010.7
9.810.5
3.93.8
21.122.7
5.06.0
5.47.1
11.70.8
MARINE CORPS Active Component USMC Reserve
0.50.3
51.957.1
4.45.3
8.37.6
2.75.7
0.00.0
5.76.6
12.715.5
13.82.0
AIR FORCE Active Component Air National Guard USAF Reserve
0.41.10.5
34.240.528.1
4.72.67.4
15.116.212.4
6.64.59.1
19.215.927.5
6.810.06.1
8.66.88.3
4.52.60.6
Rows may not add to total due to rounding.* Occupational Area Codes: 0=General Officers, 1=Tactical Operations, 2=Intelligence, 3=Engineering and Maintenance,4=Scientists and Professionals, 5=Health Care, 6=Administration, 7=Supply, Procurement, and Allied, 8=Non-occupational.** Reserve Component calculations do not include 770 O-6 officers classified as general or executive officers by the Services (1 -ARNG,1 - USAR, 305 - USMCR, 314 - ANG, and 149 - USAFR).Also see Appendix Tables B-37 (Occupational Area by Service and Gender) and C-30 (Occupational Area by Component).
Many Selected Reserve officers are health care professionals. The USAR and USAFR havethe greatest proportion of officers in health care occupations (30 and 28 percent, respectively). Healthcare comprises the second largest percentage of officers in the ARNG and USNR (11 and 23 percent,respectively). Relatively few Reserve officers are in intelligence, science and professional, andadministrative occupations.
Representation of women within occupations. The occupational assignments by gender ofSelected Reserve officers are shown in Table 6.9. More than half (53 percent) of all female officers areassigned to health care positions and 13 percent to administration positions. As indicated in AppendixTable C-31, the assignment of women into officer occupational areas differs by component. Acrosscomponents, female officers serving in health care positions range from 32 percent in the ARNG to 58percent in the USAR and 59 percent in the USNR. Two percent of USAR female officers hold tacticaloperations positions compared to 9 percent in the ANG. As in the Selected Reserve enlisted force,reasons for this distribution include the differing missions of each component; the occupational

6-9
preferences of female officers; the number of Active Component female officers possessing such skillswho join a Selected Reserve unit after separation from active duty; the proportion of technical skill unitvacancies; and direct ground combat exclusion policies.
Table 6.9. FY 1998 Occupational Areas of Selected Reserve Officer Corps, by Gender (Percent)
Occupational Area Male Female Total
General Officers and Executives* 0.6 0.1 0.5
Tactical Operations 40.5 4.1 33.9
Intelligence 5.1 5.3 5.1
Engineering and Maintenance 10.8 7.2 10.1
Scientists and Professionals 7.0 3.4 6.4
Health Care 14.3 52.9 21.3
Administration 6.4 13.3 7.7
Supply, Procurement, and Allied Occupations 10.6 10.3 10.5
Non-Occupational*** 4.8 3.6 4.6
Total 100.0 100.0 100.0
Columns may not add to total due to rounding.* Calculations do not include 752 male and 18 female O-6 officers classified as general or executive officers by the Services.** Less than one-tenth of one percent.*** Non-occupational includes patients, students, those with unassigned duties, and unknowns.Also see Appendix Table C-31 (Occupational Area by Component and Gender).
Representation of minorities within occupations. An overview of the distribution of SelectedReserve officers by race/ethnicity is provided in Table 6.10. More than half of Whites, Hispanics, and"Others" serve in either tactical operations or health care occupations. The largest proportions of Whiteand Hispanic officers are in tactical operations (36 and 30 percent, respectively); the largestpercentages of Black and "Other" racial category officers are in health care occupations (26 and 29percent, respectively).
As detailed in Appendix Table C-32, there are race/ethnicity differences among the ReserveComponents by occupational areas. For example, 42 percent of White officers in the ANG haveoccupations in tactical operations, while only 20 percent of Black officers do. Other occupational areassuch as health care attract members of different race/ethnic groups more uniformly. For example, in theUSAFR, 42 percent of Blacks, 39 percent of “Other” racial categories, and 32 percent of Hispanicsserve in health care, compared to 26 percent of Whites.

6-10
Table 6.10. FY 1998 Occupational Areas of Selected Reserve Officer Corps, by Race/Ethnicity (Percent)
Occupational Area White Black Hispanic Other Total
General Officers and Executives* 0.5 0.3 0.3 0.2 0.5
Tactical Operations 36.0 18.3 29.5 27.3 33.9
Intelligence 5.4 2.5 4.0 5.1 5.1
Engineering and Maintenance 9.9 11.7 11.3 11.0 10.1
Scientists and Professionals 6.7 4.5 4.6 5.0 6.4
Health Care 20.3 26.4 22.3 29.4 21.3
Administration 7.0 13.2 9.2 7.5 7.7
Supply, Procurement, and AlliedOccupations
9.8 17.7 12.9 8.8 10.5
Non-Occupational** 4.4 5.4 5.9 5.7 4.6
Total 100.0 100.0 100.0 100.0 100.0Columns may not add to total due to rounding.* Calculations do not include 745 White, 7 Black, 6 Hispanic, and 12 Other O-6 officers classified as general or executive officers bythe Services.** Non-occupational includes patients, students, those with unassigned duties, and unknowns.Also see Appendix Table C-32 (Occupational Areas by Component and Race/Ethnicity).

7-1
Chapter 7
SOCIOECONOMIC STATUS OF ENLISTED ACCESSIONS
Differing viewpoints on the socioeconomic status of accessions have been the basis for seriousdebates regarding the viability of the All Volunteer Force. While the concern that the volunteer militarywould recruit primarily from the lower economic and social levels has not been borne out, it is importantto understand the socioeconomic composition of the military. This chapter reviews issues surroundingthese aspects of the military and provides data on the social background of FY 1998 recruits.
Socioeconomic Status in Perspective
Imbalances in socioeconomic representation in the military often have been a controversialsocial and political issue.1 In debate over the establishment of the volunteer force, opponents arguedthat it would lead to a military composed of those from poor and minority backgrounds, forced to turnto the military as an employer of last resort. Some critics anticipated that the consequences would benot only inequitable, but dangerous. They argued that by recruiting primarily from an underclass, thevolunteer force would create a serious cleavage between the military and the rest of society.2
The belief that the enlisted military drew recruits primarily from lower socioeconomic groupswas a major element in proposals for either a return to conscription or some form of national serviceprogram that would draw all classes into military or civilian service. The philosophical basis for theseproposals was the conviction that all social classes should contribute their share to the national defense.A 1988 report by the Democratic Leadership Council stated, “We cannot ask the poor and under-privileged alone to defend us while our more fortunate sons and daughters take a free ride, forgingahead with their education and careers.”3
Many of the assertions about the class composition of the military have been based onimpressions and anecdotes rather than on empirical data. Analysis of Vietnam era veterans indicatedthat individuals of high socioeconomic status comprised about half the proportion of draftees comparedto their representation in the overall population.4 Three systematic analyses of the socioeconomiccomposition of accessions during the volunteer period suggest that little has changed with the AllVolunteer Force. All found that members of the military tended to come from backgrounds that were 1 See, for example, Cooper, R.V.L., Military Manpower and the All-Volunteer Force (Santa Monica, CA:RAND Corporation, 1977).
2 See, for example, Janowitz, M., “The All Volunteer Military as a Socio-Political Problem,” Social Problems(February 1975), pp. 432–449.
3 Democratic Leadership Council, Citizenship and National Service: A Blueprint for Civic Enterprise(Washington, DC: Author, May 1988), p. 25.
4 Boulanger, G., “Who Goes to War?” in A. Egendorf, C. Kadushin, R.S. Laufer, G. Rothbart, and L. Sloan (Eds.),Legacies of Vietnam: Comparative Adjustment of Veterans and Their Peers, Vol. 4. Long-term Stress Reactions:Some Causes, Consequences, and Naturally Occurring Support Systems (Washington, DC: U.S. GovernmentPrinting Office, 1981), pp. 494–515.

7-2
somewhat lower in socioeconomic status than the U.S. average, but that the differences between themilitary and the comparison groups were relatively modest.5 These results have been confirmed inrecent editions of this report, which portray a socioeconomic composition of enlisted accessions similarto the population as a whole, but with the top quartile of the population underrepresented.6 While thesocioeconomic status of recruits is slightly lower than the general population, today’s recruits havehigher levels of education, measured aptitudes, and reading skills than their civilian counterparts.
Operations Desert Shield and Desert Storm revived concerns that Blacks would bear adisproportionate share of fighting and dying in future wars. The Chairman of the House Committee onArmed Services stated, “The…Committee spent some considerable time on this [issue] and came to arather surprising conclusion about it. It’s not true."7 A related report concluded that the volunteersystem provided quality enlistees; that minorities would not bear a much heavier burden of combat; andthat a draft would neither be as fair nor produce a force as high in quality as the current system.8 Thereport indicated that a draft would lead to a less educated, less motivated, and less competent force,even though it might be more representative of the upper and lower social strata.
Defining Socioeconomic Status
Although the term “socioeconomic status” is used frequently, there is no general consensusregarding how to define and measure this construct. Often, measures cited in the literature are those ofconvenience or availability (e.g., race, zip code). In general, socioeconomic status is considered as anindicator of economic and social position.9
Research suggests that occupation is the best single indicator of socioeconomic position.10
However, including additional information, such as education and income, can increase explainedvariance in the measure of social class. In addition, different items may assess unique dimensions of
5 See (1) Cooper, R.V.L., Military Manpower and the All Volunteer Force (Santa Monica, CA: RANDCorporation, 1977), pp. 223–250; (2) Fredland, J.E. and Little, R.D., Socioeconomic Characteristics of the AllVolunteer Force: Evidence from the National Longitudinal Survey, 1979 (Annapolis, MD: U.S. Naval Academy,1982); (3) Fernandez, R.L., Social Representation in the U.S. Military (Washington, DC: Congressional BudgetOffice, October 1989).
6 See Population Representation in the Military Services, Fiscal Years 1991–1997.
7 Aspin, L., Chairman, House Committee on Armed Services, The All Volunteer Force: Assessing Fairness andFacing the Future, before the Association of the U. S. Army, Crystal City, VA, April 26, 1991.
8 Aspin, L., All Volunteer: A Fair System, A Quality Force (Washington, DC: Chairman, House Committee onArmed Services, April 26, 1991).
9 Stawarski, C.A. and Boesel, D., Representation in the Military: Socioeconomic Status (Alexandria, VA:Human Resources Research Organization, 1988).
10 Powers, M.G., “Measures of Socioeconomic Status: An Introduction,” in M.G. Powers (Ed.), Measures ofSocioeconomic Status: Current Issues (Boulder, CO: Westview, 1981), pp. 1–28.

7-3
socioeconomic status, which together may represent the construct more completely.11 The variablestraditionally used to assess social standing are education, occupation, and income; additional measuresinclude employment status, possessions, and presence of reading materials in the home.12
Measuring Socioeconomic Status
Socioeconomic representation has been included in the annual Population Representation inthe Military Services since the FY 1986 report. However, there were no reliable socioeconomic datato report at that time. Available data included the zip code of a recruit’s current address and associatedstatistics from census data. While this type of data is useful for demographic trend analysis andadvertising and marketing research, it is not reliable for comparing socioeconomic representation in themilitary to that of the general population. For example, applicants and recruits may not come from thebackground indicated by the zip code for their current address (i.e., these individuals may move awayfrom home to go to college or to work).13
The Survey of Recruit Socioeconomic Backgrounds, first administered in March 1989, iscurrently administered on a continuing basis at recruit training centers. Participants answer questionsabout their parents’ education, employment status, occupation, and home ownership. While income is awidely used measure of socioeconomic status, research provides evidence that recruit-aged youth arenot accurate at estimating their parents’ income.14 Therefore, home ownership is included as a proxyfor income.
Several researchers have devised a summary statistic for socioeconomic status.15 Thesocioeconomic index (SEI), derived from predicted prestige scores based on levels of income andeducation within occupations, is one means of defining socioeconomic status. Stevens and Cho16
developed such scores for each 3-digit occupation code in the 1980 Census, revising earlier work byDuncan, and Featherman et al.17 More recently, this index has been revised by Hauser and Warren18 to
11 Nam, C.B. and Terrie, E.W., “Measurement of Socioeconomic Status from United States Census Data,” in M.G.Powers (Ed.), Measures of Socioeconomic Status: Current Issues (Boulder, CO: Westview, 1981), pp. 29–42.
12 Department of Defense, Population Representation in the Military Services: Fiscal Year 1986(Washington, DC: Office of the Assistant Secretary of Defense [Force Management and Personnel], 1987).
13 Ibid.
14 Ibid.
15 Stevens, G. and Cho, J.H., “Socioeconomic Indices and the New 1980 Census Occupational ClassificationScheme,” Social Science Research, 14 (1985), pp. 142–168.
16 Ibid.
17 See Duncan, O.D., “A Socioeconomic Index for All Occupations,” in A.J. Reiss, Jr. (Ed.), Occupations andSocial Status (New York: Free Press, 1981), pp. 139–161; Featherman, D.L., Jones, F.L., and Hauser, R.M.,“Assumptions of Social Mobility Research in the U.S.: The Case of Occupational Status,” Social Science Research,4 (1975), pp. 329–360.

7-4
incorporate prestige ratings from the General Social Survey conducted by the National OpinionResearch Center,19 as well as occupational income and education data from the 1990 Census. Thisreport uses a version of the SEI that incorporates income and educational data about both males andfemales; it is termed the Total Socioeconomic Index (TSEI). TSEI scores for recruits can be calculatedusing parental occupational information reported in the Survey of Recruit Socioeconomic Backgrounds.
In FY 1998, the Survey of Recruit Socioeconomic Backgrounds was given to both active dutyand Reserve Component recruits without prior military experience. Approximately 12,200 active dutyand 3,200 Reserve Component enlisted accessions provided information on the marital status,education, employment, and occupation of their parents.20 The survey requested information on theparents with whom the recruit was last living, whether they were biological parents, stepparents, orother legal guardians. Throughout this discussion, these will be referred to as “recruit or DoD parents.”
For civilians, similar information is collected by the Bureau of the Census. These measuresinclude marital status, highest level of education, home ownership, employment status, and occupation.For comparison, information is provided for parents of civilian youth between the ages of 14 and 21,inclusive, who were living at home. These data are taken from the Current Population Survey (CPS),an ongoing survey conducted by the Bureau of the Census for the Bureau of Labor Statistics.21 Theywill be referred to as “CPS parents.”
Comparisons between DoD and CPS parents should be tempered by the fact that the DoDgroup does not include officer accessions. Since Active Component officer accessions represent nearly8 percent of total Active Component accessions, adding officer socioeconomic measures could producea moderate change in the overall DoD results. However, for most of the variables reported in thissection, including officer data would produce little change in the reported values, because the civilianand military distributions are quite similar. Specific areas in which adding officer data might change thecomparisons will be noted in the following discussion.
18 Hauser, R.M. and Warren, J.R. Socioeconomic Indexes for Occupations: A Review, Update, and Critique(Madison, WI: Center for Demography and Ecology, June 1996).
19 Nakao, K. and Treas, J., “Updating Occupational Prestige and Socioeconomic Scores: How the New MeasuresMeasure Up,” in P. Marsden (Ed.), Sociological Methodology, 1994 (Washington, DC: American SociologicalAssociation, 1994), pp. 1–72.
20 Navy recruits who said that they were in the TARS program were counted as active duty recruits.
21 To facilitate comparison between the military and civilian data sets, the CPS data were weighted to match themilitary data in terms of age. CPS sample weights were ratio-adjusted to age distributions, in 5-year intervals, ofrecruits’ parents. Consequently, the adjusted CPS data contain the same percentage of parents in a specific genderand age group (e.g., male parents age 40–44) as the military data set. When sample sizes are large, small differencesin magnitude can be statistically significant. For comparisons between DoD and CPS parents, any difference greaterthan about one percentage point is statistically significant; the comparable figure for comparisons between Servicesor between active duty and Reserve Components is 3 percent.

7-5
Socioeconomic Status of Enlisted Accessions and Civilians
The remainder of this chapter presents the results of the 1998 recruit survey and civiliancomparison data from the CPS. These data provide several measures of socioeconomic status,including the TSEI scores.
Family Status. The number of parents in a family household is closely related to otherindicators of socioeconomic status. For example, data from the CPS indicate that the median income offamily households with two parents present is more than twice that of households headed by singlefemales and 40 percent greater than households headed by single males.22 The Survey of RecruitSocioeconomic Backgrounds asks respondents to indicate the people who were in their householdwhen they last lived with their parents, stepparents, or guardians. Approximately 69 percent ofaccessions indicated that they lived with both father and mother,23 compared with 71 percent of CPShouseholds (Table 7.1). Those who lived with one parent were more than three times more likely to livewith their mother than with their father. The percentage of accessions living with two parents wasgreater for the Air Force (73 percent) than for the other three Services (from 66 to 68 percent). Therewere no other differences of consequence among the other Services, nor between active duty andReserve Component accessions. Overall, the family composition of enlisted accessions was quitesimilar to that of the civilian population.
Table 7.1. Parents in Family of FY 1998 NPS Recruits, by Service, with Civilian Comparison Group (Percent)
Active Component DoD Subtotal TotalAdults at Home
Army NavyMarineCorps
AirForce
ActiveDuty
Guard/Reserve DoD CPS
Father, Stepfather,or Male Guardian 6.8 7.1 8.2 6.3 7.0 5.9 6.8 6.2Mother,Stepmother, orFemale Guardian
25.7 25.3 26.2 20.9 24.8 24.6 24.8 23.3
Both 67.5 67.6 65.6 72.8 68.1 69.5 68.5 70.5Source: Civilian data from Bureau of Labor Statistics Current Population Survey File, October 1997–September 1998.
Education. The socioeconomic status of children and adolescents is closely related to mothers’education, fathers’ education, average family income, and fathers’ occupational status. Analysis of datacollected for the Profile of American Youth study showed that mothers’ education approximated theeffects of all four variables.24 Thus, the measure of recruit mothers’ education becomes important as an 22 U.S. Bureau of the Census, Current Population Reports, P60-200, Money Income in the United States: 1997(With Separate Data on Valuation of Noncash Benefits) , U.S. Government Printing Office, Washington, DC, 1998.
23 For purposes of this discussion, the term “father” represents either a biological father, a stepfather, or othermale guardian, and the term “mother” represents either a biological mother, a stepmother, or other female guardian.
24 Office of the Assistant Secretary of Defense (Manpower, Reserve Affairs, and Logistics), Profile of AmericanYouth: 1980 Nationwide Administration of the Armed Services Vocational Aptitude Battery (Washington, DC:March 1982), pp. 40–42.

7-6
indicator of high-quality recruits. Approximately 20 percent of recruit mothers earned a college degreeor better; an additional 29 percent accrued some college credits.
CPS fathers were somewhat better educated than DoD fathers (Table 7.2). The CPS fatherswere more likely to have graduated from college than DoD fathers (29 percent for CPS and 24 percentfor DoD), while DoD fathers were more likely to be a high school graduate or less (51 percent for DoDand 47 percent for CPS). CPS mothers were also slightly better educated than their DoD counterparts,although the pattern of results is somewhat different. Approximately the same percentage of DoD andCPS mothers attended college, whether or not they graduated (49 percent for DoD and 50 percent forCPS). However, a slightly greater percentage of CPS mothers graduated college than did DoDmothers (22 percent for CPS and 20 percent for DoD). Similarly, CPS mothers were slightly morelikely to have graduated from high school than DoD mothers (36 percent for CPS and 34 percent forDoD).
Table 7.2. Education of Parents of FY 1998 NPS Recruits, by Gender and Service,with Civilian Comparison Group (Percent at Each Education Level)
Active Component DoD Subtotal Total
Highest Levelof Education Army Navy
MarineCorps
AirForce
ActiveDuty
Guard/Reserve DoD CPS
FATHERS
Less than HighSchool Graduate 19.2 16.1 20.5 11.9 17.2 17.1 17.2 15.2
High SchoolGraduate
34.0 33.3 31.5 33.7 33.3 33.7 33.4 31.3
Some College(No 4-Yr. Degree) 23.9 26.9 24.0 30.0 25.9 25.8 25.9 25.0
College Graduate* 22.9 23.7 24.0 24.4 23.6 23.4 23.5 28.5
MOTHERS
Less than HighSchool Graduate 18.6 17.5 18.9 11.6 17.0 17.5 17.1 14.6
High SchoolGraduate
32.9 33.1 34.8 36.5 34.0 33.6 33.9 35.9
Some College(No 4-Yr. Degree) 29.0 29.5 26.6 33.4 29.5 29.0 29.4 27.6
College Graduate* 19.6 19.9 19.7 18.5 19.5 19.9 19.6 21.9
* College graduate includes "greater than college graduate" level.Source: Civilian data from Bureau of Labor Statistics Current Population Survey File, October 1997–September 1998.

7-7
For both DoD and CPS parents, fathers were somewhat more educated than mothers. Thisdifference is reflected in the greater percentage of college graduates among fathers (24 percent for DoDand 29 percent for CPS) than among mothers (20 percent for DoD and 22 percent for CPS). CPSfathers are also more likely to have education beyond high school than CPS mothers (54 percent forCPS fathers and 50 percent for CPS mothers); while a comparable difference was not found betweenDoD fathers and mothers.
On the average, parents of Air Force accessions had more advanced educational credentialsthan parents in the other Services. Both Air Force fathers and mothers were more likely to have at leasta high school diploma (88 percent for both fathers and mothers) than the overall active duty average (83percent for both fathers and mothers). They were also more likely to have attended or graduatedcollege (54 percent for fathers and 52 percent for mothers) than the active duty average (50 percent forfathers and 49 percent for mothers). There were no other differences of note in parent educationbetween Services or between parents of active duty and Reserve Component accessions.
Home Ownership. Both CPS mothers and fathers were more likely to own their home thanDoD parents (Table 7.3). On the other hand, CPS parents were less likely than DoD parents to havehousing arrangements other than buying or renting. This arrangement was very rare among CPSparents, but occurred for roughly 5 percent of DoD parents. Although there were no differencesbetween the parents of Active and Reserve Component accessions, within the active duty Servicecategories both mothers and fathers of Air Force recruits were more likely to own their homes thanparents in the other Services. Finally, both DoD and CPS fathers were more likely to own their homesthan mothers, who were more likely to rent.
Table 7.3. Home Ownership Status of Parents of FY 1998 NPS Recruits,by Gender and Service, with Civilian Comparison Group (Percent)
Active Component DoD Subtotal Total
Residence Army NavyMarineCorps
AirForce
ActiveDuty
Guard/Reserve DoD CPS
FATHERS
Own Rent Other
76.119.8 4.1
77.117.4 5.6
76.319.4 4.3
79.516.2 4.4
77.118.4 4.6
79.915.8 4.3
77.817.7 4.5
83.915.2 1.0
MOTHERS
Own Rent Other
69.226.4 4.4
71.622.7 5.8
69.026.7 4.4
76.019.9 4.1
71.124.2 4.7
73.722.0 4.4
71.723.6 4.6
77.321.7 1.0
Source: Civilian data from Bureau of Labor Statistics Current Population Survey File, October 1997–September 1998.
Employment Status. Table 7.4 reports, by Service, the rates of fathers and mothers whowere employed. In the CPS, the civilian labor force is defined as all employed and unemployed civilians16 years and over.25 Unemployed, however, is limited to those civilians who made a specific effort to 25 See Bureau of the Census, Statistical Abstract of the United States: 1998 (Washington, DC: U.S. GovernmentPrinting Office, 1998), pp. 400–401, for a detailed explanation of labor force employment categories and thecomponent parts of each category.
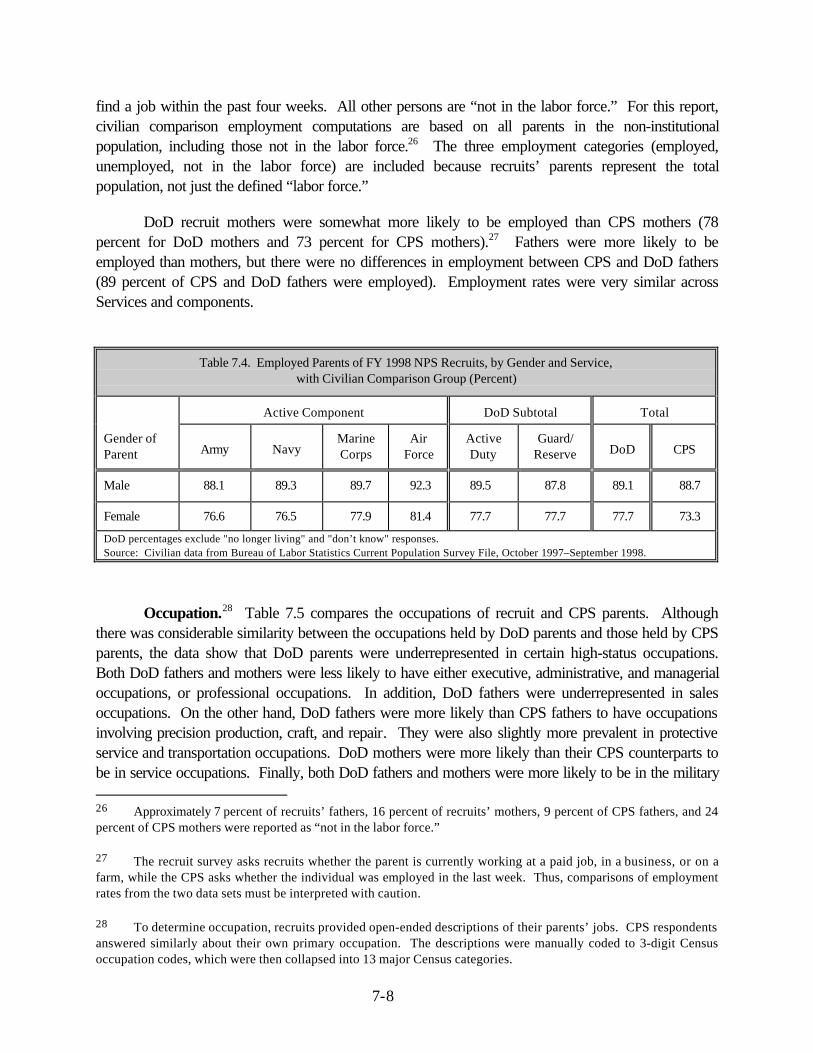
7-8
find a job within the past four weeks. All other persons are “not in the labor force.” For this report,civilian comparison employment computations are based on all parents in the non-institutionalpopulation, including those not in the labor force.26 The three employment categories (employed,unemployed, not in the labor force) are included because recruits’ parents represent the totalpopulation, not just the defined “labor force.”
DoD recruit mothers were somewhat more likely to be employed than CPS mothers (78percent for DoD mothers and 73 percent for CPS mothers).27 Fathers were more likely to beemployed than mothers, but there were no differences in employment between CPS and DoD fathers(89 percent of CPS and DoD fathers were employed). Employment rates were very similar acrossServices and components.
Table 7.4. Employed Parents of FY 1998 NPS Recruits, by Gender and Service,with Civilian Comparison Group (Percent)
Active Component DoD Subtotal Total
Gender ofParent Army Navy
MarineCorps
AirForce
ActiveDuty
Guard/Reserve DoD CPS
Male 88.1 89.3 89.7 92.3 89.5 87.8 89.1 88.7
Female 76.6 76.5 77.9 81.4 77.7 77.7 77.7 73.3
DoD percentages exclude "no longer living" and "don’t know" responses.Source: Civilian data from Bureau of Labor Statistics Current Population Survey File, October 1997–September 1998.
Occupation.28 Table 7.5 compares the occupations of recruit and CPS parents. Althoughthere was considerable similarity between the occupations held by DoD parents and those held by CPSparents, the data show that DoD parents were underrepresented in certain high-status occupations.Both DoD fathers and mothers were less likely to have either executive, administrative, and managerialoccupations, or professional occupations. In addition, DoD fathers were underrepresented in salesoccupations. On the other hand, DoD fathers were more likely than CPS fathers to have occupationsinvolving precision production, craft, and repair. They were also slightly more prevalent in protectiveservice and transportation occupations. DoD mothers were more likely than their CPS counterparts tobe in service occupations. Finally, both DoD fathers and mothers were more likely to be in the military 26 Approximately 7 percent of recruits’ fathers, 16 percent of recruits’ mothers, 9 percent of CPS fathers, and 24percent of CPS mothers were reported as “not in the labor force.”
27 The recruit survey asks recruits whether the parent is currently working at a paid job, in a business, or on afarm, while the CPS asks whether the individual was employed in the last week. Thus, comparisons of employmentrates from the two data sets must be interpreted with caution.
28 To determine occupation, recruits provided open-ended descriptions of their parents’ jobs. CPS respondentsanswered similarly about their own primary occupation. The descriptions were manually coded to 3-digit Censusoccupation codes, which were then collapsed into 13 major Census categories.

7-9
than were CPS parents.29 There were no significant differences between the occupations of Active andReserve Component parents.
Table 7.5. Parents of FY 1998 NPS Recruits in Each Occupational Category,by Gender and Component, with Civilian Comparison Group (Percent)
Fathers Mothers
Occupation* Active Reserve CPS Active Reserve CPS
Executive, Administration, &Managerial
13.8 12.7 18.6 10.7 10.4 13.6
Professional 8.9 10.7 14.1 15.7 17.2 19.2Technicians & Related Services 3.8 3.5 2.6 3.9 4.4 3.8
Sales 7.3 7.2 10.0 11.0 9.8 9.9
Clerical & AdministrativeSupport
5.0 4.2 4.7 26.2 24.2 24.5
Protective Services 4.8 4.0 2.7 1.1 1.0 0.6
Other Service Occupations 3.8 3.7 4.5 18.2 20.2 16.4
Farming, Forestry, & Fishing 2.9 3.7 3.8 1.2 1.0 1.2
Precision Production, Craft, &Repair
27.4 25.8 21.2 3.4 3.1 2.4
Machine Operators 6.1 7.0 6.9 4.8 5.1 5.7
Transportation 9.8 11.3 7.5 1.8 2.0 1.2
Handlers, Helpers, Laborers 3.2 3.3 3.5 1.8 1.5 1.5
Military 3.3 2.8 ** 0.3 0.3 *** Those not classified (15.7 percent of male parents and 26.5 percent of female parents) are excluded.** Less than one-tenth of one percent.Source: Civilian data from Bureau of Labor Statistics Current Population Survey File, October 1997–September 1998.
Socioeconomic Index Scores. Socioeconomic index scores reflecting the education, income,and prestige associated with individual occupations were computed from responses to DoD and CPSsurveys. We used a common scale, the TSEI,30 to indicate occupation prestige for both fathers andmothers.
The TSEI scores ranged from 10 to 81 for both DoD and CPS fathers. Figure 7.1 shows thedistribution of TSEI scores for active duty, Reserve Component, and CPS fathers. In addition, thefigure shows the Active and Reserve Component representation ratios for each of the TSEI categories.For any range of TSEI scores, this number is the ratio of the percentage of DoD fathers (either active
29 Differences in the number of parents in the military are due, at least in part, to differences in the way theseoccupations are coded in the military and civilian surveys. In the CPS data, an occupation is assigned a military codeonly if the military job cannot be classified in another occupational category. In the DoD data, all parents in themilitary are assigned a military occupational code.
30 Hauser, R.M. and Warren, J.R. Socioeconomic Indexes for Occupations: A Review, Update, and Critique(Madison, WI: Center for Demography and Ecology, October 1996).

7-10
duty or Reserve Component) in the range to the percentage of CPS fathers in the range. Arepresentation ratio of greater than 1.0 for any TSEI category indicates a greater proportion of DoDparents in the category, compared to CPS parents, while a ratio of less than 1.0 indicates fewer DoDparents in the category, compared to CPS parents. The magnitude of the representation ratio indicatesthe extent to which the DoD and CPS distributions differ.
0%
10%
20%
30%
1-15
16-2
0
21-2
5
26-3
0
31-3
5
36-4
0
41-4
5
46-5
0
51-5
5
56-6
0
61-6
5
66-7
0
71-7
5
76-8
0
81-8
5
FATHER'S TSEI* CATEGORY
0.0
0.5
1.0
1.5
DoD
REP
RES
ENTA
TIO
N R
ATIO
Active Reserve Civilian Actv./Civ. Rsrv./Civ.
Source: Civilian data from Bureau of Labor Statistics Current Population Survey File, October 1997-September 1998* Total socioeconomic index.
Figure 7.1. TSEI distribution for DoD and CPS fathers with DoD representation ratio.
With one exception, the representation ratios for active duty and Reserve Component fatherswere very close; consequently, they will be described together. DoD fathers were underrepresented inthe lowest two TSEI categories. This range of scores includes low-status service occupations, as wellas some machine operators. The range of TSEI scores from 21 to 50 included over three quarters ofthe CPS fathers and 85 percent of DoD fathers. This difference produces a representation ratio of 1.1,indicating a slightly larger proportion of DoD fathers than CPS fathers in this range. For TSEI scoresbetween 51 and 75, DoD representation decreased. It averages approximately 0.8 over the range,which encompasses 11 percent of DoD fathers and 14 percent of CPS fathers. DoD representationwas lowest for the two highest TSEI categories; one percent of DoD fathers and 3 percent of CPSfathers were included in these categories. Thus, enlisted accessions tend to have fathers withoccupations in the middle of the TSEI distribution, with both the high and low extremesunderrepresented.
Mothers’ TSEI scores ranged from 7 to 81 for both DoD and CPS mothers. As was the casewith fathers, the TSEI distribution was similar for Active and Reserve Components. As shown in Figure7.2, the pattern of results for mothers is similar to the pattern for fathers shown in Figure 7.1. DoD

7-11
mothers were underrepresented in both the lowest two and highest four TSEI categories, withrepresentation ratios of approximately 0.8 and 0.6, respectively. In the range of TSEI between 21 and65, the distribution of DoD mothers matched the distribution of CPS mothers, although it decreasedslightly over this range. Overall, this range represented 87 percent of CPS mothers and 89 percent ofDoD mothers, for a representation ratio of slightly greater than 1.0. Since the Survey of RecruitSocioeconomic Backgrounds excludes officer accessions, it would be expected to understate theaverage status of DoD parents.
0%
10%
20%
30%
1-15
16-2
0
21-2
5
26-3
0
31-3
5
36-4
0
41-4
5
46-5
0
51-5
5
56-6
0
61-6
5
66-7
0
71-7
5
76-8
0
81-8
5
MOTHER'S TSEI* CATEGORY
0.0
0.5
1.0
1.5
DoD
REP
RES
ENTA
TIO
N R
ATIO
Active Reserve Civilian Actv./Civ. Rsrv./Civ.
Source: Civilian data from Bureau of Labor Statistics Current Population Survey File, October 1997-September 1998.* Total socioeconomic index.
Figure 7.2. TSEI distribution for DoD and CPS mothers with DoD representation ratio.
Although both DoD mothers and fathers were underrepresented in high-status occupations, asmeasured by the TSEI scales, these occupations represent only a small portion of the overall TSEIdistribution in the general population. Figure 7.3 shows the representation of DoD parents from eachquartile of the general population. As the quartiles divide CPS parents into equal fourths with regard toTSEI, DoD parents would also be equally divided among the quartiles if they were represented equallyat all levels of TSEI. Figure 7.3 shows that the highest quartile of the TSEI distribution wasunderrepresented among enlisted accessions. The deficit in the fourth quartile was compensated for byan excess in the second quartile, while the first and third quartiles were accurately represented. Therewere no substantial differences between mothers and fathers or between active duty and ReserveComponent accessions. Thus, there is no indication that enlisted personnel are drawn primarily from thelowest social strata.
In summary, enlisted accessions come from all socioeconomic levels. However, there is atendency for accessions to come from families in the lower three-quarters of the status distribution.These differences are expressed in the occupations of the parents of accessions, as well as

7-12
discrepancies in education and home ownership. No systematic differences were discovered betweenactive duty and Reserve Component accessions. Including officer accessions in the analysis would beexpected to increase the representation of higher social strata among military accessions, but wouldprobably not eliminate differences between DoD and CPS parents.
0%
25%
50%
1 2 3 4
CPS DISTRIBUTION QUARTILE
Active FathersActive Mothers
Reserve FathersReserve Mothers
Note: Twenty-five percent of the civilian population is in each quartile. TSEI is the comparison index for both fathers and mothers.Source: Civilian data from Bureau of LaborStatistics Current Population Survey File, October 1997-September 1998.
Figure 7.3. DoD TSEI distribution related to CPS distribution quartiles.
Racial and Ethnic Differences in Socioeconomic Status. Racial and ethnic differences insocioeconomic status are reflected in the characteristics of DoD parents, as well as in CPS comparisondata. Both Hispanics and Blacks show lower socioeconomic status than Whites using severalmeasures. However, racial and ethnic differences among recruits are less than the comparabledifferences in the civilian population, as the following discussion illustrates.
Table 7.6 shows the number of parents in the family for White, Black, and Hispanic recruits,and gives comparable percentages for the civilian population. Black youth are much less likely to livewith both parents than White youth are. In the civilian population, fewer than half (42 percent) of Blackyouth live with two parents, while more than three-quarters (76 percent) of White youth and nearly two-thirds of Hispanic youth (65 percent) do. Both White and Hispanic recruits are similar to their CPScounterparts in this respect. Black recruits are more likely than Black CPS youth to live with bothparents (50 percent vs. 42 percent), although they are still less likely than either White or Hispanicrecruits to live with two parents (75 percent and 67 percent, respectively).
Other measures also indicate the relative disadvantage of minority families within the civilianpopulation, although the patterns vary (Table 7.7). Within the CPS data, 51 percent of Hispanicparents completed high school compared to the overall average of 85 percent. Similarly, White fathersand mothers are more likely to own their home (89 percent and 85 percent, respectively) than are eitherBlack (75 percent and 57 percent, respectively) or Hispanic (65 percent and 58 percent, respectively)

7-13
parents. Differences in employment rates are smaller, but indicate greater employment for Whiteparents. Overall differences within the civilian population are summarized by the median TSEI scores,which are highest for White parents and lowest for Hispanic parents, with Black parents obtainingintermediate values.
Table 7.6. Parents in Family of FY 1998 Recruits, by Race/Ethnicity,with Civilian Comparison Group (Percent)
DoD CPSAdults at HomeWhite Black Hispanic Total White Black Hispanic Total
Father,Stepfather, orMale Guardian
7.0 6.0 5.7 6.8 6.1 6.3 6.2 6.2
Mother,Stepmother, orFemale Guardian
18.6 44.0 27.1 24.8 17.5 52.2 28.7 23.3
Both 74.5 50.0 67.2 68.5 76.4 41.5 65.0 70.5Source: Civilian data from Bureau of Labor Statistics Current Population survey File, October 1997–September 1998
Table 7.7. Selected Characteristics of Parents of FY 1998 NPS Recruits, by Race/Ethnicity,with Civilian Comparison GroupDoD CPSHighest Level of
Education White Black Hispanic Total White Black Hispanic TotalFATHERS
High SchoolGraduate of More
86.0% 82.2% 68.1% 82.7% 90.7% 81.1% 50.8% 84.8%
Own their Home 82.4% 69.9% 67.5% 78.3% 88.7% 74.9% 65.4% 83.9%CurrentlyEmployed
90.2% 86.8% 87.1% 89.3% 90.8% 79.9% 84.1% 88.7%
Median TSEI 36.1 31.3 31.9 36.1 38.5 29.7 25.8 37.0MOTHERS
High SchoolGraduate of More
86.6% 85.0% 66.1% 83.1% 92.5% 81.2% 51.2% 85.4%
Own their Home 78.7% 59.0% 60.9% 72.0% 85.0% 56.8% 57.9% 77.3%CurrentlyEmployed
79.0% 79.9% 70.2% 77.8% 76.6% 70.1% 58.8% 73.3%
Median TSEI 31.1 30.3 30.3 30.9 35.8 29.7 24.6 31.7Source: Civilian data from Bureau of Labor Statistics Current Population Survey File, October 1997–September 1998.
The disparity in socioeconomic status among CPS parents is represented at a reduced levelamong DoD parents. In general, White DoD parents have lower values on several differentsocioeconomic measures than their CPS counterparts, while minority parents of recruits have highervalues than do minority CPS parents. As shown in Table 7.7, there is very little difference in medianTSEI among DoD mothers, while there is an 11-point range among CPS mothers. Similarly, thedifference between racial and ethnic groups among DoD fathers is 5 points or less, compared to a 13-point difference among CPS fathers. Overall, racial and ethnic differences in socioeconomic statusamong recruit parents reflect differences in the population as a whole, but at a reduced level.

8-1
Chapter 8
U. S. COAST GUARD
Background
This year marks a significant addition to the Population Representation in the MilitaryServices Report, the U.S. Coast Guard (USCG). While on a day-to-day basis the USCG fallsunder the jurisdiction of the Department of Transportation, the USCG is at all times an armedforce—a full time military organization with a true peacetime mission. 1 During times of war orat the direction of the President, the USCG functionally transfers to the Department of Defensefalling under the Secretary of the Navy.
The U.S. Coast Guard is the Nation’s oldest continuous seagoing service which can traceits history to 1790 with the introduction of the Revenue Cutter Service, whose mission was theenforcement of the first tariff laws enacted by Congress under the Constitution. What we knowas today’s Coast Guard is actually a combination of five Federal agencies. In addition to theCutter Service, these agencies included the Lighthouse Service, the Steamboat InspectionService, the Bureau of Navigation, and the Lifesaving Service. The multiple missions andresponsibilities of today’s Coast Guard can be traced back to these initial agencies with fourmain mission areas today—maritime law enforcement, maritime safety, marine environmentalprotection, and national security. 2
In this chapter, the characteristics of both the Active and Reserve Components of theUSCG are presented. Comparisons are presented for applicants (active enlisted only),accessions, and end-strength for enlisted members, officer corps, and warrant officers. Whereapplicable, these comparisons include overall DoD3 figures and comparable civilian data forreference.
Active Component Enlisted Applicants and Accessions
As with the other Armed Services, the USCG has entrance standards for age, physicalfitness, maximum number of dependents, citizenship status, moral character, and mental abilityto include minimum scores on the Armed Forces Qualification Test (AFQT). In the followingsections various demographic characteristics of USCG active component enlisted applicants andaccessions along with similar overall DoD figures and civilian comparisons are reported.
Characteristics of Active Component Non-Prior Service Applicants
In FY 1998, a total of 7,999 individua ls without prior military experience applied to servein the USCG. The distribution of FY 1998 USCG and overall DoD Active Component NPSapplicants’ race/ethnicity by gender is shown in Table 8.1. Eighty-two percent of the USCG
1 USCG International Training Handbook. URL: http://www.uscg.mil/hq/g-ci/sect1.htm. p. 2 of 5.
2 Ibid., p. 3 of 5.
3 Overall DoD refers to the combined total of the Army, Navy, Marine Corps, and Air Force.
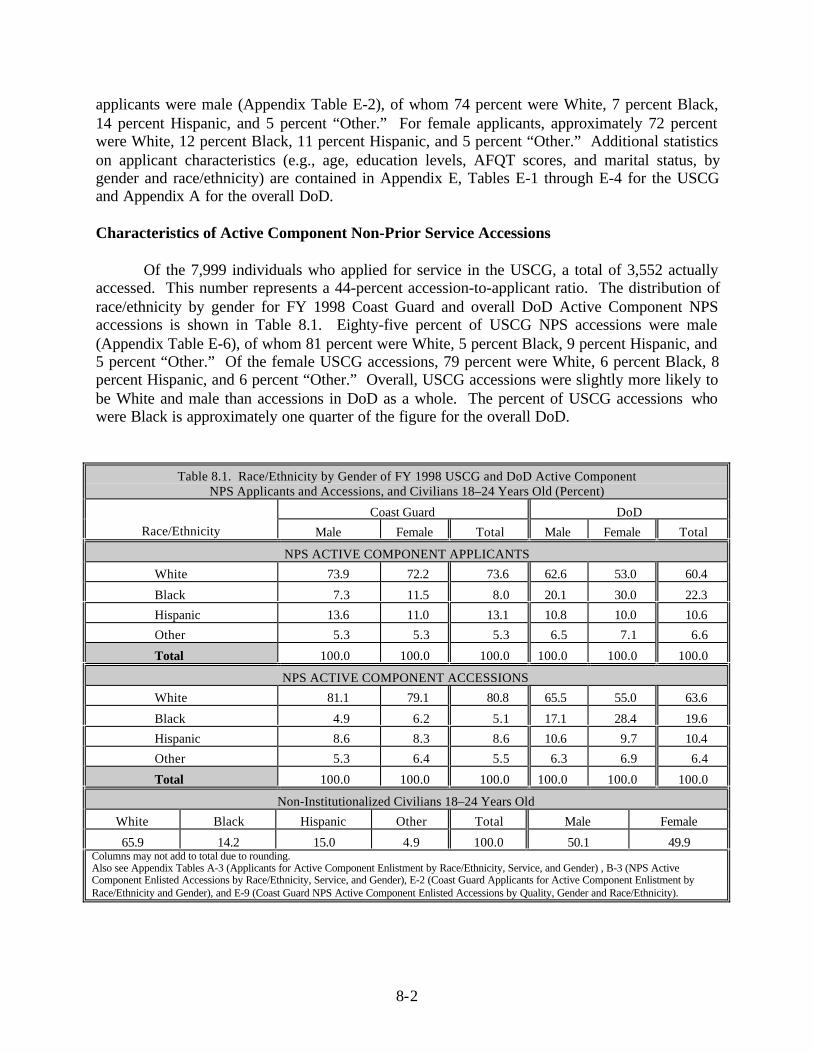
8-2
applicants were male (Appendix Table E-2), of whom 74 percent were White, 7 percent Black,14 percent Hispanic, and 5 percent “Other.” For female applicants, approximately 72 percentwere White, 12 percent Black, 11 percent Hispanic, and 5 percent “Other.” Additional statisticson applicant characteristics (e.g., age, education levels, AFQT scores, and marital status, bygender and race/ethnicity) are contained in Appendix E, Tables E-1 through E-4 for the USCGand Appendix A for the overall DoD.
Characteristics of Active Component Non-Prior Service Accessions
Of the 7,999 individuals who applied for service in the USCG, a total of 3,552 actuallyaccessed. This number represents a 44-percent accession-to-applicant ratio. The distribution ofrace/ethnicity by gender for FY 1998 Coast Guard and overall DoD Active Component NPSaccessions is shown in Table 8.1. Eighty-five percent of USCG NPS accessions were male(Appendix Table E-6), of whom 81 percent were White, 5 percent Black, 9 percent Hispanic, and5 percent “Other.” Of the female USCG accessions, 79 percent were White, 6 percent Black, 8percent Hispanic, and 6 percent “Other.” Overall, USCG accessions were slightly more likely tobe White and male than accessions in DoD as a whole. The percent of USCG accessions whowere Black is approximately one quarter of the figure for the overall DoD.
Table 8.1. Race/Ethnicity by Gender of FY 1998 USCG and DoD Active ComponentNPS Applicants and Accessions, and Civilians 18–24 Years Old (Percent)
Coast Guard DoDRace/Ethnicity Male Female Total Male Female Total
NPS ACTIVE COMPONENT APPLICANTS
White 73.9 72.2 73.6 62.6 53.0 60.4
Black 7.3 11.5 8.0 20.1 30.0 22.3
Hispanic 13.6 11.0 13.1 10.8 10.0 10.6
Other 5.3 5.3 5.3 6.5 7.1 6.6
Total 100.0 100.0 100.0 100.0 100.0 100.0
NPS ACTIVE COMPONENT ACCESSIONS
White 81.1 79.1 80.8 65.5 55.0 63.6
Black 4.9 6.2 5.1 17.1 28.4 19.6
Hispanic 8.6 8.3 8.6 10.6 9.7 10.4
Other 5.3 6.4 5.5 6.3 6.9 6.4
Total 100.0 100.0 100.0 100.0 100.0 100.0
Non-Institutionalized Civilians 18–24 Years Old
White Black Hispanic Other Total Male Female
65.9 14.2 15.0 4.9 100.0 50.1 49.9Columns may not add to total due to rounding.Also see Appendix Tables A-3 (Applicants for Active Component Enlistment by Race/Ethnicity, Service, and Gender) , B-3 (NPS ActiveComponent Enlisted Accessions by Race/Ethnicity, Service, and Gender), E-2 (Coast Guard Applicants for Active Component Enlistment byRace/Ethnicity and Gender), and E-9 (Coast Guard NPS Active Component Enlisted Accessions by Quality, Gender and Race/Ethnicity).
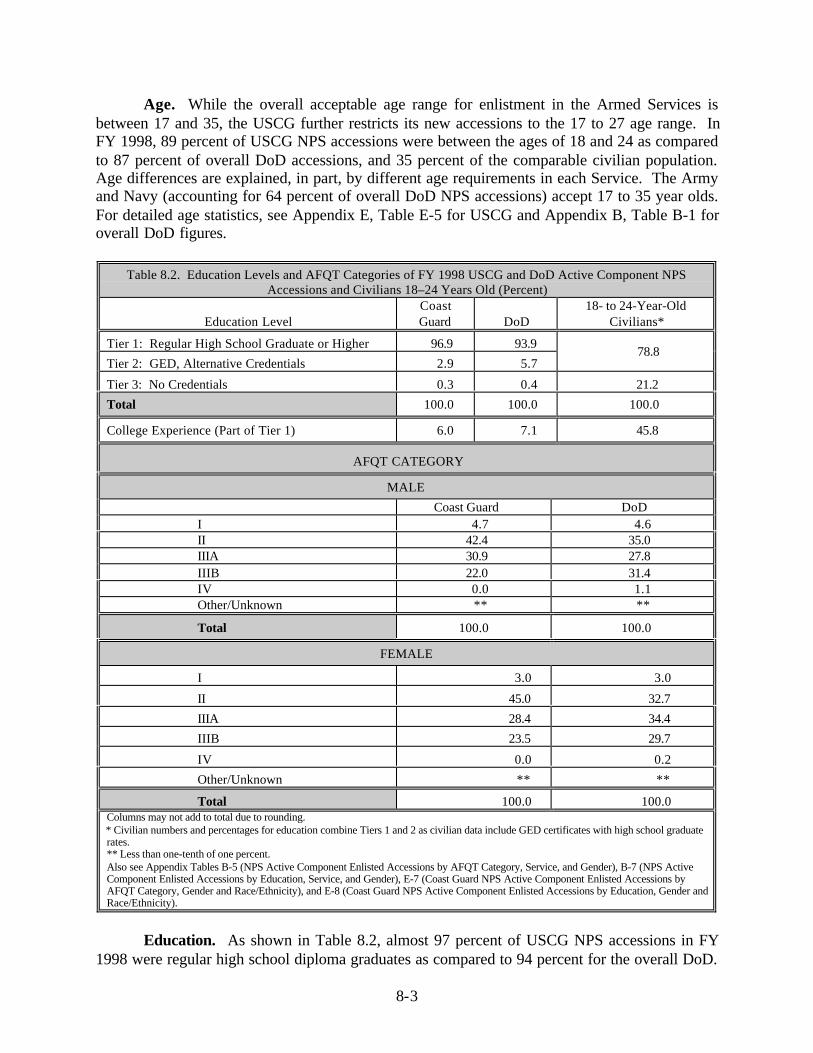
8-3
Age. While the overall acceptable age range for enlistment in the Armed Services isbetween 17 and 35, the USCG further restricts its new accessions to the 17 to 27 age range. InFY 1998, 89 percent of USCG NPS accessions were between the ages of 18 and 24 as comparedto 87 percent of overall DoD accessions, and 35 percent of the comparable civilian population.Age differences are explained, in part, by different age requirements in each Service. The Armyand Navy (accounting for 64 percent of overall DoD NPS accessions) accept 17 to 35 year olds.For detailed age statistics, see Appendix E, Table E-5 for USCG and Appendix B, Table B-1 foroverall DoD figures.
Table 8.2. Education Levels and AFQT Categories of FY 1998 USCG and DoD Active Component NPSAccessions and Civilians 18–24 Years Old (Percent)
Education LevelCoastGuard DoD
18- to 24-Year-OldCivilians*
Tier 1: Regular High School Graduate or Higher 96.9 93.9
Tier 2: GED, Alternative Credentials 2.9 5.778.8
Tier 3: No Credentials 0.3 0.4 21.2
Total 100.0 100.0 100.0
College Experience (Part of Tier 1) 6.0 7.1 45.8
AFQT CATEGORY
MALE
Coast Guard DoDI 4.7 4.6II 42.4 35.0IIIA 30.9 27.8IIIB 22.0 31.4IV 0.0 1.1Other/Unknown ** **
Total 100.0 100.0
FEMALE
I 3.0 3.0
II 45.0 32.7
IIIA 28.4 34.4
IIIB 23.5 29.7
IV 0.0 0.2
Other/Unknown ** **
Total 100.0 100.0Columns may not add to total due to rounding.* Civilian numbers and percentages for education combine Tiers 1 and 2 as civilian data include GED certificates with high school graduaterates.** Less than one-tenth of one percent.Also see Appendix Tables B-5 (NPS Active Component Enlisted Accessions by AFQT Category, Service, and Gender), B-7 (NPS ActiveComponent Enlisted Accessions by Education, Service, and Gender), E-7 (Coast Guard NPS Active Component Enlisted Accessions byAFQT Category, Gender and Race/Ethnicity), and E-8 (Coast Guard NPS Active Component Enlisted Accessions by Education, Gender andRace/Ethnicity).
Education. As shown in Table 8.2, almost 97 percent of USCG NPS accessions in FY1998 were regular high school diploma graduates as compared to 94 percent for the overall DoD.

8-4
The difference between the USCG and overall DoD can be accounted for in the numbers of GEDholders accepted by the USCG (3 percent) compared to DoD (6 percent). For both the USCGand DoD as a whole, the overall percentage of accessions with high school credentials, eitherdiplomas or GED certificates, was more than 99 percent, exceeding the comparable civiliangroup at 79 percent.
AFQT. The primary measure of a recruit’s potential for success in training is his or herAFQT score. Table 8.2 shows FY 1998 USCG accessions were more likely than their DoDcounterparts to be in AFQT Categories I – IIIA (i.e., top 50 percent). The overall proportion ofFY 1998 USCG accessions in AFQT Categories I–IIIA was comparable to the distribution in theAir Force (78 and 77 percent, respectively).
Active Component Enlisted Force
At the end of FY 1998, the enlisted end-strength of the USCG stood at 27,297, up fromthe FY 1997 end-strength of 26,847. The FY 1998 Coast Guard enlisted force was 82 percentmale and 18 percent female. Relative to the overall DoD, proportionally the Coast Guard hasmore female enlisted members (18 and 14 percent, respectively).
Characteristics of Active Component Enlisted Force
Race/Ethnicity. The distribution of race/ethnicity by gender for FY 1998 USCG andoverall DoD Active Component enlisted members along with the applicable civilian comparisongroup is shown in Table 8.3. Relative to the comparable civilian population, the USCG enlistedforce was slightly more likely to be White (74 and 71 percent, respectively) and slightly lesslikely to be Black (8 and 12 percent, respectively). Hispanics were underrepresented in DoD (8percent), as a whole, but in the USCG enlisted force Hispanics (13 percent) were proportional tothe civilian comparison group (13 percent).
Table 8.3. Race/Ethnicity by Gender of FY 1998 USCG and DoD Active ComponentEnlisted Members and Civilians 18–24 Years Old (Percent)
Coast Guard DoD
Male Female Total Male Female TotalRace/Ethnicity
ACTIVE COMPONENT ENLISTED MEMBERS
White 73.8 72.2 73.5 65.7 51.6 63.7
Black 7.3 11.5 8.0 20.2 34.8 22.2
Hispanic 13.6 11.0 13.1 8.1 7.6 8.0
Other 5.3 5.3 5.3 6.1 6.1 6.1
Total 100.0 100.0 100.0 100.0 100.0 100.0
Civilians 18–44 Years Old
White Black Hispanic Other Total Male Female
70.5 12.3 12.5 4.7 100.0 53.6 46.4
Columns may not add to total due to rounding.Also see Appendix Table B-25 (Active Component Enlisted Members by Race/Ethnicity, Service, and Gender) and E-15 (Coast Guard ActiveComponent Enlisted Members by Race/Ethnicity and Gender).

8-5
Age. The USCG enlisted force tends to be older than the overall DoD enlisted force, butstill younger than the comparable civilian group. Forty-four percent of the USCG enlisted forcewas 30 years of age or older as compared to 35 percent of the overall DoD, and 73 percent of thecivilian group (Table 8.4).
Table 8.4. Age and Education Level of FY 1998 USCG and DoD Active Component Enlisted Membersand Civilians (Percent)
Coast Guard DoD Civilian Comparison
AgeCivilian Labor Force
17 and Older
17–19 6.3 10.6 5.0
20–24 27.4 34.0 9.9
25–29 22.3 20.6 11.6
30–34 16.7 15.0 12.3
35–39 19.5 13.6 13.8
40–44 6.5 4.8 13.7
45–49 1.1 1.1 11.8
50+ 0.3 0.2 21.9
Unknown 0.0 0.1 0.0
Total 100.0 100.0 100.0
Education Level18- to 44-Year-Old
Civilians*
Tier1: Regular High SchoolGraduate or Higher 95.4 95.1Tier 2: GED, AlternativeCredentials 3.4 3.0
88.1
Tier 3: No Credentials 1.3 1.9 11.9Total 100.0 100.0 100.0
College Experience (Part of Tier 1) 5.0 27.7 54.6Columns may not add to total due to rounding.* Civilian numbers and percentages for education combine Tiers 1 and 2 as civilian data include GED certificates with high schoolgraduate rates.Also see Appendix Tables B-23 (Active Component Enlisted Members by Age Group, Service, and Gender), B-27 (Active ComponentEnlisted Members by Education, Service, and Gender), E-14 (Coast Guard Active Component Enlisted Members by Age Group andGender), and E-16 (Coast Guard Active Component Enlisted Members by Education, Gender, and Race/Ethnicity).
Education. Overall, enlisted members of the USCG and DoD, as a whole, were morelikely than the comparable civilian group to have high school graduation credentials, but thecivilians were more likely to have college experience (Table 8.4). While the USCG participatesin tuition assistance programs and the Montgomery GI Bill, the enlisted members of the USCGwere less likely than the overall DoD group to have college experience. However, it should benoted that the percentage of individuals with college experience in the overall DoD was skewed;excluding the Air Force (91 percent with some college), enlisted members in the USCG and theArmy, Navy, and Marine Corps had the same rate, on average, of post-secondary education (5percent). Enlisted jobs do not require college experience and thus are generally comparable tocivilian occupations not needing college education.

8-6
Representation Within Occupations. The representation of USCG enlisted force byrace/ethnicity and gender in occupational areas with the overall DoD rates for comparison ispresented in Table 8.5. The USCG is unique in that all occupations are open to both men andwomen—no combat restrictions,4 but women were still underrepresented in the “infantry, guncrews, and seamanship specialists” compared to men in the USCG (7 and 16 percent,respectively).
Table 8.5. Occupational Areas of FY 1998 USCG and DoD Active Component Enlisted Personnel byRace/Ethnicity and Gender (Percent)
Coast Guard
Occupational Code and Area Male Female White Black Hispanic OtherUSCGTotal
DoDTotal
0Infantry, Gun Crews,and SeamanshipSpecialists
15.8 7.1 16.7 3.6 9.6 10.6 14.9 16.9
1 Electronic EquipmentRepairers
11.4 5.2 10.9 7.5 11.7 13.0 10.8 9.3
2 Communications andIntelligence Specialists
5.2 7.0 5.3 6.8 5.6 5.3 5.4 8.7
3 Medical and DentalSpecialists
2.4 5.8 2.5 4.5 3.9 3.8 2.8 7.1
4 Other Allied Specialists 5.2 3.9 5.3 3.8 3.5 5.2 5.1 3.05 Functional Support and
Administration12.6 36.5 12.4 39.3 17.7 17.4 15.0 16.0
6 Electrical/MechanicalEquipment Repairers
15.9 3.7 15.2 11.0 13.0 13.4 14.7 20.1
7 Craftsmen 13.7 3.2 13.3 8.2 11.5 10.5 12.7 3.68 Service and Supply
Handlers1.2 ** 1.2 0.1 0.7 1.0 1.1 8.5
9 Non-Occupational* 16.5 27.6 17.2 15.3 22.7 19.8 17.6 6.8
Total 100.0 100.0 100.0 100.0 100.0 100.0 100.0 100.0Columns may not add to total due to rounding.* Non-occupational includes patients, students, those with unassigned duties, and unknowns.** Less than one-tenth of one percent.Also see Appendix Table B-29 (Active Component Enlisted Members by Occupational Area, Service, and Gender) and E-17 (Coast GuardActive Component Enlisted Members by Occupational Area, Gender, and Race/Ethnicity).
Historically, all new USCG enlisted members were directly assigned to field units beforeattending specialty training in the A-schools where the introductory job-specific training coursesare taught. Presently an effort is being made to assign more recruits directly to A-schools incritical specialties. Approximately 15 percent of USCG recruits go directly to advanced trainingafter basic training. A USCG member is admitted to any A-school for which he or she isqualified based on the individual’s Armed Services Vocational Aptitude Battery (ASVAB)scores.5 Training takes place as openings become available, which may explain the higherpercentage of non-occupationals in the USCG enlisted force compared to the overall DoD (18and 7 percent, respectively).
4 USCG Recruiting Frequently Asked Questions. URL: http://www.uscg.mil/jobs/faq.htm, p. 3 of 11.
5 USCG Recruiting Frequently Asked Questions. URL: http://www.uscg.mil/jobs/faq.htm, p. 10 of 11.

8-7
Active Component Officers
The USCG uses a variety of programs to produce its commissioned officers. Theseinclude programs for both civilians and active USCG enlisted members and warrant officers tobecome commissioned officers. In FY 1998, the USCG commissioned a total of 390 newofficers. The USCG commissioned officer corps stood at 5,530 at the end of FY 1998. In Table8.6, the distribution of new USCG officers (accessions) and current officers (corps) by source ofcommission and level of education is presented with applicable overall DoD figures forcomparison.
Characteristics of Active Component Commissioned Officers
Source of Commission. The USCG relies heavily on the U. S. Coast Guard Academyfor its officer accessions. The USCG gets almost half of its new officers from its Academy ascompared to 19 percent for DoD as a whole, as shown in Table 8.6. This large difference can beat least partially explained by the fact that the USCG does not have an ROTC program. The factthat an even greater proportion of the USCG officer corps were Academy graduates is anindication that the retention rate for graduates is higher than for the other sources of officers.
Table 8.6. FY 1998 USCG and DoD Active Component Officer Accessions and Officer Corps by Source ofCommission and Educational Attainment (Percent)
Officer Accessions Officer Corps
Coast Guard DoD Coast Guard DoD
Source of Commission
Academy 44.6 18.9 53.0 18.1
ROTC – Scholarship 0.0 28.0 0.0 20.0
ROTC – No Scholarship 0.0 11.5 0.0 20.7
OCS/OTS 38.3 18.6 36.1 19.1
Direct Appointment 17.1 17.1 10.9 17.3
Other 0.0 5.8 0.0 4.9
Total 100.0 100.0 100.0 100.0
Education Level
Less than College Graduate 23.4 4.9 16.1 2.4
College Graduate (B.A., B.S., etc.) 70.2 81.0 69.6 54.0
Advanced Degree (M.A., Ph.D., etc.) 6.4 14.1 14.3 43.6
Total 100.0 100.0 100.0 100.0Columns may not add to total due to rounding.Percentages do not include “Unknown” data.Also see Appendix Tables B-35 (Active Component Officer Accessions and Officer Corps by Education and Service), B-40 (ActiveComponent Officer Accessions by Source of Commission, Service, and Gender), B-41 (Active Component Officer Corps by Source ofCommission, Service, and Gender), E-20 (Coast Guard Active Component Officer Accessions and Officer Corps by Education), and E-22(Coast Guard Active Component Officer Accessions and Officer Corps by Source of Commission, Gender, and Race/Ethnicity).

8-8
Educational Attainment. Table 8.6 shows that USCG officer accessions and membersof the officer corps were less likely than their overall DoD counterparts to possess a collegedegree. The USCG has two commissioning programs that provide opportunities for acommission without a college degree. An enlisted member of the USCG who has attained thegrade of E-5 and has at least 30 college credits can apply to attend the USCG’s OfficerCandidate School (OCS), thereby making a commission possible without college completion. Ina related program, a USCG member who achieves the rank of chief warrant officer may applyfor OCS attendance or a commission via the “Warrant-to-Lieutenant” program.6 These programsare indicative of USCG’s emphasis on experience and education in its commissioning decisions.
Race/Ethnicity and Gender. The USCG percentage of Whites was slightly higher thanthe overall DoD rate for officer accessions (82 and 79 percent, respectively) and officers (88 and84 percent, respectively), as shown in Table 8.7. By gender, 19 percent of both the USCG andoverall DoD officer accessions were female, but members of the USCG’s officer corps wereslightly more likely to be male than were DoD officers (89 and 86 percent, respectively).
Table 8.7. Race/Ethnicity and Gender of FY 1998 USCG and DoDActive Component Officer Accessions and Officer Corps (Percent)
Officer Accessions Officer Corps
Coast Guard DoD Coast Guard DoD
Race/EthnicityWhite 82.1 79.3 88.1 84.3Black 6.2 8.5 4.1 7.7Hispanic 5.9 4.3 3.8 3.3Other 5.9 7.9 3.9 4.7Total 100.0 100.0 100.0 100.0
GenderMale 81.0 80.9 88.9 85.6Female 19.0 19.1 11.1 14.4Total 100.0 100.0 100.0 100.0
Columns may not add to total due to rounding.Also see Appendix Tables B-32 (Active Component Officer Accessions and Officer Corps by Gender and Service), B-34 (Active ComponentOfficer Accessions and Officer Corps by Race/Ethnicity and Service), and E-19 (Coast Guard Active Component Officer Accessions andOfficer Corps by Race/Ethnicity and Gender).
Representation Within Occupations. As was noted previously, the USCG does nothave any combat restrictions—all occupations are open to both men and women. By gender,USCG female officers were underrepresented in tactical operations and engineering andmaintenance, and overrepresented in the non-occupational area (Table 8.8). By race/ethnicity,minority officers were overrepresented in the non-occupational area; Black officers wereunderrepresented in tactical operations; Hispanic officers were underrepresented in engineeringand maintenance. Compared to the overall DoD, the USCG officer corps comprised,proportionally, more engineering and maintenance officers and fewer health care providers. Thedifference in health care can be partially explained by the USCG’s reliance on the Public HealthService for some of its medical and dental care.
6 USCG Recruiting Frequently Asked Questions. URL: http://www.uscg.mil/jobs/faq.htm, pp. 6 and 7 of 11.

8-9
Table 8.8. Occupational Areas of FY 1998 USCG and DoD Active Component Officer Personnel byRace/Ethnicity and Gender (Percent)
Coast Guard
Occupational Area Male Female White Black Hispanic OtherUSCGTotal
DoDTotal
General Officers andExecutives
0.6 0.0 0.6 0.4 0.0 0.0 0.5 0.4
Tactical Operations 42.8 36.6 42.9 29.0 42.5 38.1 42.1 38.4
Intelligence 0.5 0.2 0.5 0.0 0.0 0.0 0.4 5.0Engineering andMaintenance
33.8 29.9 33.5 35.1 24.5 35.3 33.3 11.7
Scientists andProfessionals
1.6 2.3 1.8 1.3 0.5 0.9 1.7 4.9
Health Care 0.3 0.0 0.3 0.0 0.5 0.0 0.2 18.9
Administration 9.5 9.8 9.6 8.8 10.4 6.9 9.5 6.0Supply, Procurement,and Allied Occupations
0.5 0.5 0.5 0.4 0.5 0.5 0.5 8.7
Non-Occupational 10.6 20.8 10.4 25.0 21.2 18.4 11.7 6.0
Total 100.0 100.0 100.0 100.0 100.0 100.0 100.0 100.0Columns may not add to total due to rounding.Also see Appendix Table B-38 (Active Component Officer Corps by Occupational Area, Service, and Gender) and E-22 (Coast Guard ActiveComponent Officer Corps by Occupational Area, Gender, and Race/Ethnicity).
Characteristics of Active Component Warrant Officers
In FY 1998, the USCG accessed a total of 204 new warrant officers and the warrantofficer end-strength was 1,472. The distribution by race/ethnicity and gender of USCG warrantofficer accessions and warrant officers with overall DoD rates for comparison is presented inTable 8.9. In general, both USCG warrant officer accessions and warrant officers were morelikely to be White and male than their overall DoD counterparts.
Table 8.9. FY 1998 USCG and DoD Active Component Warrant Officer Accessions and Officer Corps byRace/Ethnicity and Gender (Percent)
Warrant Officer Accessions Warrant Officer CorpsCoast Guard DoD Coast Guard DoD
Race/Ethnicity
White 85.3 70.5 90.0 75.8Black 7.4 19.6 4.6 15.1Hispanic 4.4 5.5 3.1 4.5Other 2.9 4.4 2.5 4.6Total 100.0 100.0 100.0 100.0Gender
Male 95.6 91.6 97.3 93.7Female 4.4 8.4 2.7 6.4Total 100.0 100.0 100.0 100.0
Columns may not add to total due to rounding.Also see Appendix Tables B-44 (Active Component Warrant Officer Accessions and Warrant Officer Corps by Gender and Service), B-45(Active Component Warrant Officer Accessions and Warrant Officer Corps by Race/Ethnicity and Service), and E-23 (Coast Guard ActiveComponent Warrant Officer Accessions and Warrant Officers by Race/Ethnicity and Gender).
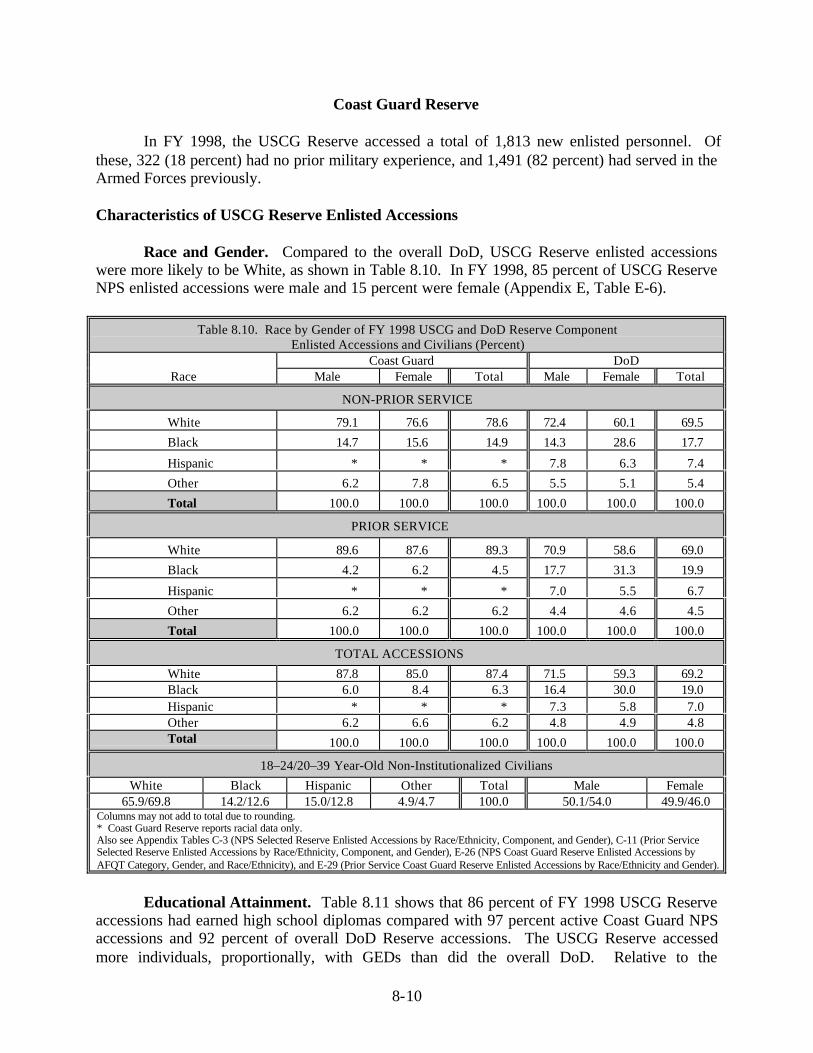
8-10
Coast Guard Reserve
In FY 1998, the USCG Reserve accessed a total of 1,813 new enlisted personnel. Ofthese, 322 (18 percent) had no prior military experience, and 1,491 (82 percent) had served in theArmed Forces previously.
Characteristics of USCG Reserve Enlisted Accessions
Race and Gender. Compared to the overall DoD, USCG Reserve enlisted accessionswere more likely to be White, as shown in Table 8.10. In FY 1998, 85 percent of USCG ReserveNPS enlisted accessions were male and 15 percent were female (Appendix E, Table E-6).
Table 8.10. Race by Gender of FY 1998 USCG and DoD Reserve ComponentEnlisted Accessions and Civilians (Percent)
Coast Guard DoDRace Male Female Total Male Female Total
NON-PRIOR SERVICE
White 79.1 76.6 78.6 72.4 60.1 69.5
Black 14.7 15.6 14.9 14.3 28.6 17.7
Hispanic * * * 7.8 6.3 7.4
Other 6.2 7.8 6.5 5.5 5.1 5.4
Total 100.0 100.0 100.0 100.0 100.0 100.0
PRIOR SERVICE
White 89.6 87.6 89.3 70.9 58.6 69.0
Black 4.2 6.2 4.5 17.7 31.3 19.9
Hispanic * * * 7.0 5.5 6.7
Other 6.2 6.2 6.2 4.4 4.6 4.5
Total 100.0 100.0 100.0 100.0 100.0 100.0
TOTAL ACCESSIONS
White 87.8 85.0 87.4 71.5 59.3 69.2Black 6.0 8.4 6.3 16.4 30.0 19.0Hispanic * * * 7.3 5.8 7.0Other 6.2 6.6 6.2 4.8 4.9 4.8Total 100.0 100.0 100.0 100.0 100.0 100.0
18–24/20–39 Year-Old Non-Institutionalized Civilians
White Black Hispanic Other Total Male Female65.9/69.8 14.2/12.6 15.0/12.8 4.9/4.7 100.0 50.1/54.0 49.9/46.0
Columns may not add to total due to rounding.* Coast Guard Reserve reports racial data only.Also see Appendix Tables C-3 (NPS Selected Reserve Enlisted Accessions by Race/Ethnicity, Component, and Gender), C-11 (Prior ServiceSelected Reserve Enlisted Accessions by Race/Ethnicity, Component, and Gender), E-26 (NPS Coast Guard Reserve Enlisted Accessions byAFQT Category, Gender, and Race/Ethnicity), and E-29 (Prior Service Coast Guard Reserve Enlisted Accessions by Race/Ethnicity and Gender).
Educational Attainment. Table 8.11 shows that 86 percent of FY 1998 USCG Reserveaccessions had earned high school diplomas compared with 97 percent active Coast Guard NPSaccessions and 92 percent of overall DoD Reserve accessions. The USCG Reserve accessedmore individuals, proportionally, with GEDs than did the overall DoD. Relative to the
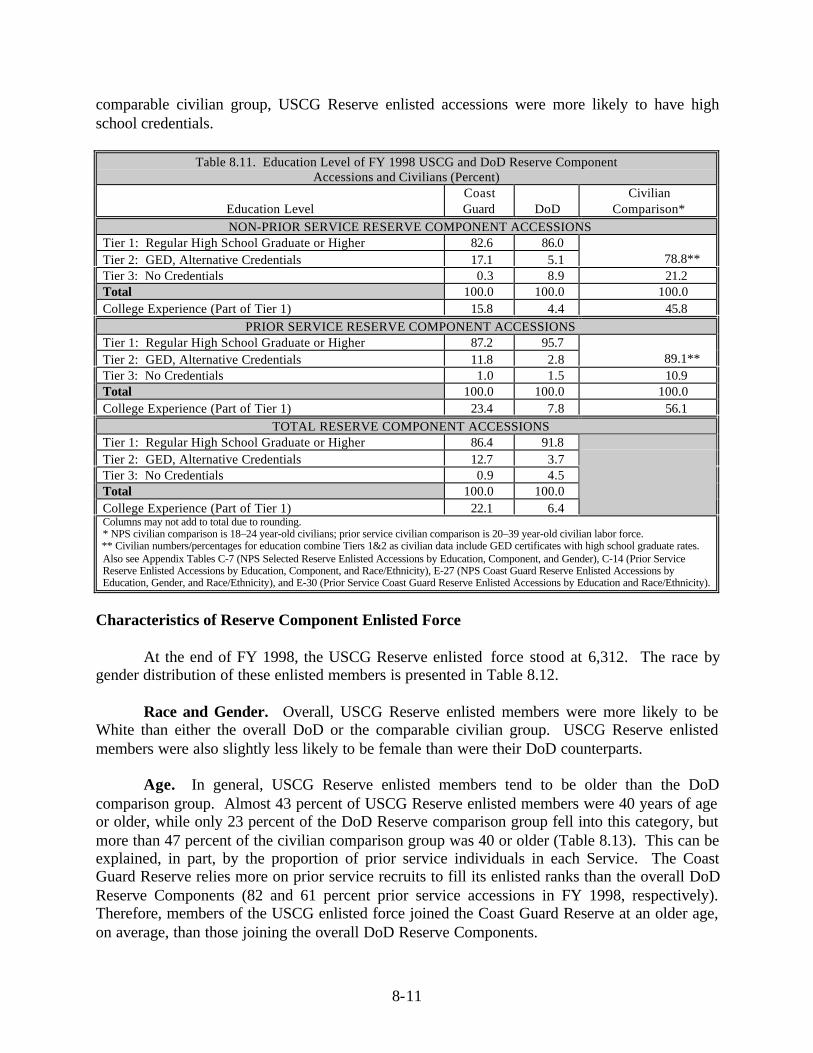
8-11
comparable civilian group, USCG Reserve enlisted accessions were more likely to have highschool credentials.
Table 8.11. Education Level of FY 1998 USCG and DoD Reserve ComponentAccessions and Civilians (Percent)
Education LevelCoastGuard DoD
CivilianComparison*
NON-PRIOR SERVICE RESERVE COMPONENT ACCESSIONSTier 1: Regular High School Graduate or Higher 82.6 86.0Tier 2: GED, Alternative Credentials 17.1 5.1 78.8**Tier 3: No Credentials 0.3 8.9 21.2Total 100.0 100.0 100.0College Experience (Part of Tier 1) 15.8 4.4 45.8
PRIOR SERVICE RESERVE COMPONENT ACCESSIONSTier 1: Regular High School Graduate or Higher 87.2 95.7Tier 2: GED, Alternative Credentials 11.8 2.8 89.1**Tier 3: No Credentials 1.0 1.5 10.9Total 100.0 100.0 100.0College Experience (Part of Tier 1) 23.4 7.8 56.1
TOTAL RESERVE COMPONENT ACCESSIONSTier 1: Regular High School Graduate or Higher 86.4 91.8Tier 2: GED, Alternative Credentials 12.7 3.7Tier 3: No Credentials 0.9 4.5Total 100.0 100.0College Experience (Part of Tier 1) 22.1 6.4Columns may not add to total due to rounding.* NPS civilian comparison is 18–24 year-old civilians; prior service civilian comparison is 20–39 year-old civilian labor force.** Civilian numbers/percentages for education combine Tiers 1&2 as civilian data include GED certificates with high school graduate rates.Also see Appendix Tables C-7 (NPS Selected Reserve Enlisted Accessions by Education, Component, and Gender), C-14 (Prior ServiceReserve Enlisted Accessions by Education, Component, and Race/Ethnicity), E-27 (NPS Coast Guard Reserve Enlisted Accessions byEducation, Gender, and Race/Ethnicity), and E-30 (Prior Service Coast Guard Reserve Enlisted Accessions by Education and Race/Ethnicity).
Characteristics of Reserve Component Enlisted Force
At the end of FY 1998, the USCG Reserve enlisted force stood at 6,312. The race bygender distribution of these enlisted members is presented in Table 8.12.
Race and Gender. Overall, USCG Reserve enlisted members were more likely to beWhite than either the overall DoD or the comparable civilian group. USCG Reserve enlistedmembers were also slightly less likely to be female than were their DoD counterparts.
Age. In general, USCG Reserve enlisted members tend to be older than the DoDcomparison group. Almost 43 percent of USCG Reserve enlisted members were 40 years of ageor older, while only 23 percent of the DoD Reserve comparison group fell into this category, butmore than 47 percent of the civilian comparison group was 40 or older (Table 8.13). This can beexplained, in part, by the proportion of prior service individuals in each Service. The CoastGuard Reserve relies more on prior service recruits to fill its enlisted ranks than the overall DoDReserve Components (82 and 61 percent prior service accessions in FY 1998, respectively).Therefore, members of the USCG enlisted force joined the Coast Guard Reserve at an older age,on average, than those joining the overall DoD Reserve Components.

8-12
Table 8.12. Race by Gender of FY 1998 USCG and DoD Reserve Component Enlisted Membersand Civilian Labor Force 18–49 Years Old (Percent)
Coast Guard DoDRace Male Female Total Male Female Total
Reserved Enlisted MembersWhite 91.9 83.1 90.7 72.1 58.3 70.0Black 4.5 11.9 5.5 15.6 30.3 17.8Hispanic * * * 7.7 6.4 7.5Other 3.7 5.0 3.8 4.6 5.1 4.7Total 100.0 100.0 100.0 100.0 100.0 100.0
Civilian Labor Force 18–49 Years OldWhite Black Hispanic Other Total Male Female71.6 12.1 11.7 4.6 100.0 53.4 46.6
Columns may not add to total due to rounding.* Coast Guard Reserve reports racial data only.Also see Appendix Table C-17 (Selected Reserve Enlisted Members by Race/Ethnicity, Component, and Gender) and E-32 (Coast GuardReserve Enlisted Members by Race/Ethnicity and Gender).
Educational Attainment. More than 99 percent of the USCG Reserve enlisted membershave at least high school credentials, exceeding the civilian comparison of 89 percent (Table8.13). As far as college experience, USCG Reserve enlisted members were more likely thantheir DoD Reserve counterparts to have college experience, but less likely than the civiliancomparison group to have at least some college.
Table 8.13. Age and Education Level of FY 1998 USCG and DoD Reserve ComponentEnlisted Members and Civilians (Percent)
CoastGuard DoD Civilian Comparison
Age Civilian Labor Force17–19 2.8 7.4 5.020–24 9.4 18.9 9.925–29 16.0 19.3 11.630–34 13.3 16.5 12.335–39 15.8 15.0 13.840–44 13.1 9.3 13.745–49 12.5 6.8 11.850+ 17.2 6.7 21.9
Unknown 0.0 0.1 0.0Total 100.0 100.0 100.0
Education Level 18- to 49-Year-Old Civilian Labor ForceTier 1: Regular High SchoolGraduate or Higher 87.5 97.7Tier 2: GED, AlternativeCredentials 11.9 1.2
88.6*
Tier 3: No Credentials 0.7 1.2 11.4Total 100.0 100.0 100.0College Experience (Part of Tier 1) 36.2 19.7 55.7Columns may not add to total due to rounding.* Civilian numbers/percentages for education combine Tiers 1 and 2 as civilian data include GED certificates with high school graduate rates.Also see Appendix Tables C-15 (Selected Reserve Enlisted Members by Age Group, Component, and Gender), C-19 (Selected ReserveEnlisted Members by Education, Component, and Gender), E-31 (Coast Guard Reserve Enlisted Members by Age Group and Gender), andE-33 (Coast Guard Enlisted Members by Education, Gender, and Race/Ethnicity).

8-13
Representation Within Occupations. FY 1998 occupational representation of theUSCG Reserve enlisted force by gender and race is presented in Table 8.14. Female and BlackUSCG Reserve enlisted members were overrepresented in the functional support andadministration occupational area (50 and 34 percent, respectively, compared to 16 percent for theUSCG Reserve as a whole). Relative, proportionally, to DoD, the USCG had more craftsmen,and service and supply handlers; and fewer electrical/mechanical equipment repairers andmedical and dental specialists. Some of the difference between the USCG Reserve and DoDReserve Components in the medical and dental specialties may be explained by the fact that theUSCG uses both internal and external sources (i.e., Public Health Service personnel) formedical/dental services.
Table 8.14. Occupational Areas of FY 1998 USCG and DoD Reserve Component Enlisted Personnelby Race and Gender (Percent)
Coast Guard
Occupational Code and Area Male Female White Black Hispanic OtherUSCGTotal
DoDTotal
0. Infantry, Gun Crews, andSeamanship Specialists
21.4 13.3 21.1 11.3 * 14.9 20.3 18.6
1. Electronic Equipment Repairers 4.6 1.6 4.2 2.9 * 6.2 4.2 4.62. Communications and
Intelligence Specialists2.7 6.2 3.1 2.9 * 2.5 3.1 4.9
3. Medical and Dental Specialists 1.6 3.9 1.8 2.3 * 1.7 1.9 6.84. Other Allied Specialists 4.4 2.1 4.0 4.1 * 5.8 4.1 2.75. Functional Support and
Administration10.7 49.6 14.4 34.0 * 20.3 15.7 18.4
6. Electrical/MechanicalEquipment Repairers
6.1 1.2 5.6 2.6 * 6.6 5.4 16.6
7. Craftsmen 16.1 2.2 14.7 9.0 * 11.6 14.3 5.88. Service and Supply Handlers 25.3 9.4 23.8 18.0 * 18.7 23.3 10.39. Non-Occupational** 7.3 10.4 7.3 12.8 * 11.6 7.7 11.2
Total 100.0 100.0 100.0 100.0 * 100.0 100.0 100.0Columns may not add to total due to rounding.* Coast Guard Reserve reports racial data only.**Non-occupational includes patients, students, those with unassigned duties, and unknowns.Also see Appendix Table C-21 (Selected Reserve Enlisted Members by Occupational Area, Component, and Gender) and E-34 (Coast GuardReserve Enlisted Members by Occupational Area, Gender, and Race/Ethnicity).
Characteristics of Reserve Component Commissioned Officers
In FY 1998, the USCG Reserve accessed a total of 144 new officers and the overallReserve officer corps end-strength stood at 1,059. By race/ethnicity and gender, both the newReserve officers and members of the overall USCG Reserve officer corps were more likely to beWhite and male than were their DoD Reserve counterparts, as shown in Table 8.15.
Source of Commission. Table 8.16 presents source of commission for Reserve officeraccessions and Reserve officers in the Coast Guard and overall DoD Reserve Components. Themost often cited source of commission for both new USCG Reserve officer accessions andmembers of the USCG Reserve officer corps was “Other,” which includes officers trained in oneService, but accessed or serving in another Service. The remainder of new officer accessions or

8-14
officer corps members were commissioned via either OCS or the Coast Guard Academy. TheCoast Guard Reserve does not have an ROTC program.
Table 8.15. Race and Gender of FY 1998 USCG and DoD Reserve ComponentOfficer Accessions and Officer Corps (Percent)
Reserve Officer Accessions Reserve Officer CorpsCoast Guard DoD Coast Guard DoD
RaceWhite 85.4 83.8 91.5 84.3Black 5.6 8.7 3.5 8.5Hispanic * 3.1 * 3.4Other 9.0 4.5 5.0 3.9Total 100.0 100.0 100.0 100.0
GenderMale 88.9 81.1 86.9 81.9Female 11.1 18.9 13.1 18.1Total 100.0 100.0 100.0 100.0
Columns may not add to total due to rounding.* Coast Guard Reserve reports racial data only.Also see Appendix Tables C-25 (Selected Reserve Officer Accessions and Officers by Gender), C-27 (Selected Reserve Officer Accessions andOfficers by Race/Ethnicity), and E-36 (Coast Guard Reserve Officer Accessions and Officer Corps by Race/Ethnicity and Gender).
Educational Attainment. Almost one-in-five of Coast Guard Reserve officer accessionsand officer corps members (both 19 percent) were not college graduates (Table 8.16). As wasmentioned for the Active Component officer corps, USCG has specialized programs that offercommissions to enlisted members who are traditionally less likely to have college credentials.
Table 8.16. FY 1998 USCG and DoD Reserve Component Officer Accessions and Officer Corps by Source ofCommission and Educational Attainment (Percent)
Reserve Officer Accessions Reserve Officer CorpsCoast Guard DoD Coast Guard DoD
Source of CommissionAcademy 0.7 8.9 0.3 5.0ROTC – Scholarship 0.0 11.9 0.0 9.6ROTC – No Scholarship 0.0 16.0 0.0 23.2OCS/OTS 40.3 16.6 19.4 13.3ANG AMS/ARNG OCS 0.0 7.2 0.0 16.4Direct Appointment 0.0 27.2 0.0 29.9Other 59.0 12.3 80.4 2.5Total 100.0 100.0 100.0 100.0
Education LevelLess than College Graduate 18.8 14.4 19.3 10.0College Graduate (B.A., B.S., etc.) 66.0 61.5 58.7 58.3Advanced Degree (M.A., Ph.D., etc.) 15.3 24.1 22.0 31.7Total 100.0 100.0 100.0 100.0Columns may not add to total due to rounding.Also see Appendix Tables C-28 (Selected Reserve Officer Accessions and Officers by Education), C-33 (Selected Reserve Officer Accessionsby Source of Commission), C-34 (Selected Reserve Officers by Source of Commission), and E-37 (Coast Guard Selected Reserve OfficerAccessions and Officers by Education), and E-40 (Coast Guard Reserve Officer Accessions and Officers by Source of Commission).
Representation Within Occupations. Unlike the Active Component, USCG Reserveofficer corps females were equally represented with their male counterparts in tactical operations

8-15
(Table 8.17). But, similar to the Active Component Coast Guard, women in the USCG Reservewere underrepresented in engineering and maintenance and overrepresented in non-occupationalareas. Black USCG Reserve officers were underrepresented in tactical operations.
Table 8.17. Occupational Areas of FY 1998 USCG and DoD Reserve Component Officer Personnel byRace and Gender (Percent)
Coast Guard
Occupational Area Male Female White Black Hispanic OtherUSCGTotal
DoDTotal
General Officers and Executives 0.5 0.0 0.5 0.0 * 0.0 0.5 0.5Tactical Operations 27.3 27.3 28.5 21.6 * 9.4 27.3 33.9Intelligence 3.6 3.6 3.4 2.7 * 7.6 3.6 5.1Engineering and Maintenance 30.9 20.9 29.8 35.1 * 20.8 29.6 10.1Scientists and Professionals 1.3 1.4 1.3 2.7 * 0.0 1.3 6.4Health Care 0.8 0.7 0.8 0.0 * 0.0 0.8 21.3Administration 3.8 5.8 4.2 2.7 * 1.9 4.1 7.7Supply, Procurement, and AlliedOccupations
0.5 0.0 0.5 0.0 * 0.0 0.5 10.5
Non-Occupational 31.3 40.3 30.9 35.1 * 60.4 32.5 4.6Total 100.0 100.0 100.0 100.0 * 100.0 100.0 100.0Columns may not add to total due to rounding.* Coast Guard Reserve reports racial data only.Also see Appendix Table C-32 (Selected Reserve Officers by Occupational Area, Component, and Race/ Ethnicity) and E-39 (Coast GuardReserve Officers by Occupational Area, Gender, and Race/Ethnicity).
Characteristics of Reserve Component Warrant Officers
In FY 1998, the USCG Reserve accessed a total of 24 new warrant officers; their end-strength was 216. The proportion of both USCG warrant officer accessions and warrant officerswho were female was higher than the comparable rate for DoD. Any differences between theUSCG and overall DoD information should be interpreted with caution given the small numbersof USCG Reserve warrant officer accessions and warrant officers (Table 8.18).
Table 8.18. FY 1998 USCG and DoD Reserve Component Warrant Officer Accessions and Officer Corps byRace and Gender (Percent)
Reserve Warrant OfficerAccessions
Reserve Warrant Officer Corps
USCG DoD USCG DoDRace
White 91.7 81.4 90.7 89.5Black 4.2 10.0 6.9 5.1Hispanic * 4.8 * 3.1Other 4.2 3.7 2.3 2.3Total 100.0 100.0 100.0 100.0GenderMale 83.3 88.2 87.5 93.6Female 16.7 11.8 12.5 6.4Total 100.0 100.0 100.0 100.0
Columns may not add to total due to rounding.* Coast Guard Reserve reports racial data only.Also see Appendix Tables C-35 (Selected Reserve Warrant Officer Accessions and Warrant Officers by Gender and Component), C-36(Selected Reserve Warrant Officer Accessions and Warrant Officers by Race/Ethnicity and Component) and E- 41 (Coast Guard ReserveWarrant Officer Accessions and Warrant Officers by Race/Ethnicity and Gender).

8-16
Closing
While the Coast Guard’s organizational positioning is unique—part of one cabinet leveldepartment during peace (Transportation) and another during war or under Presidential direction(Defense)—its contributions to national defense have been significant. The USCG represents theoldest continuous seagoing service in this country and has fought in almost every war sinceimplementation of the U.S. Constitution to include battles with pirates, the War of 1812, theMexican War, the Seminole Indian uprising, the Spanish-American war, both world wars, Korea,Vietnam7, and most recently the Persian Gulf War, where the USCG was the only ArmedService with the ship search capabilities necessary to make the embargo of seagoing goods asuccess.
On a daily basis numerous Coast Guard personnel are serving in joint billets and as partof joint task forces (e.g., drug interdiction) falling under direct oversight of the Department ofDefense. The USCG truly is a full-time military organization with a genuine peacetime mission.
7 U.S. Coast Guard: A Historical Overview. URL: http://www.uscg.mil/g-cp/history/h_USCGhistory.html . p.3 of 9.

9-1
Chapter 9
TWENTY-FIVE YEARS OF THE ALL VOLUNTEER FORCE
Personnel and Mission Changes
The U.S. Armed Forces observed the 25th anniversary of the All Volunteer Force (AVF)in 1998. The recognition of this benchmark brings with it the challenges of an ever-changingconstellation of military personnel issues. Service today is a matter of choice. As a result, themilitary must attract its members from a broad demographic base. Military personnel are, ingeneral, younger, more likely to be female, and more likely to be married than ever before.These and other factors place quality-of-life matters at the forefront of human resource interestsand force management.
The 25-year old AVF is a very active one. Since its inception, it has not only beendeployed all over the world, but it is currently deployed in capacities beyond warfighting.Various public opinion surveys suggest that despite the non-customary nature of today's militaryoperations, there is broad public support to use American troops abroad for peacekeeping,peacemaking, and other non-traditional military operations.
When the AVF was formed 25 years ago, the strategic environment in which the militaryoperated was, in many ways, more transparent than it is today. Distinguishing between enemiesand allies was easier, and international relations were more reliable and less volatile. When theCold War ended, so did the era of superpower rivalry and thus, strategic predictability. Thispost-Cold War world has drawn the military into regional conflicts, civil wars, and ethnicdisputes beyond traditional U.S. security interests. It is no small matter that the internationalevents eliciting American military response today include not only direct U.S. security concernsbut also decisions about humanitarian aid and ethical issues. It is an important and perplexingtask to try to understand how the military’s evolving missions affect today's military recruitingand personnel management.
Competing for Recruits
Because the U.S. economy has enjoyed a spate of economic success the past few years,with low unemployment rates and increased job opportunities for more and varied groups, thesupply of quality military applicants has been tight. The economic detractors from recruiting arecompounded by growing college enrollment rates among youth of enlistment age. Without thedraft to press youth into service, the military must compete for qualified recruits. While amilitary career, or even one term of service, offers many tangible and intangible benefits toinclude pay, job training, educational opportunities, adventure, discipline, and pride, it carriessignificant burdens not the least of which include separation from family, danger, and otherroutine hardships.
As always, reliance on all demographic and social segments in the United States isimperative. Issues of representation arise not just under a draft or in times of war when it isanathema that the defense of the nation would fall disproportionately on selected groups.Representation remains a concern today. Each subgroup represented in the military, whetherracial/ethnic, gender, or otherwise, brings with it unique experiences, concerns, and needs.
9-2
Understanding the opportunities and experiences of all potential personnel allows militaryhuman resource planners to prepare for future trends. Given fierce labor market competition,increased college enrollment, a rapid operating tempo and other factors increasing thecomplexity of recruiting, military personnel policymakers today face significant challenges.After 25 years of maintaining a successful volunteer military, it is timely to reflect on what hasmade it successful and what factors challenge that success.
Declining Representation
Attracting new members depends in part on perceptions that the military is a viable careerpath and an honorable calling. Without the draft to call varied segments of society into service,the over- or underrepresentation of various ethnic/racial and economic subgroups in the militaryis to be expected. Traditionally, Black Americans have participated in the military at higherproportions than their overall representation in the general population, but Asian-Americans andHispanics tend to be underrepresented. While this is so, the military's commitment to equalopportunity and advancement for all its members is strong. It is notable that Eric Shinseki, aJapanese-American, recently became the Army's 34th Chief of Staff, one of the highest-profilepositions in the Army, and the current Secretary of the Army, Louis Caldera, is Hispanic. Tryingto narrow the gap in Hispanic representation, Secretary Caldera has been travelling around theUnited States speaking to young Hispanic audiences telling them that the Army both wants andneeds them. As he explained to one audience, "It's important that the Army represent the greatdiversity of this nation. ... We have to have a nation that pulls together across ethnic lines."
With these examples in the Army and examples in the other Services, minority visibilitywithin the military may have an impact on increasing the numbers of those groups that havetraditionally been underrepresented. Or, it may take more proactive methods, such as theapproach Secretary Caldera is undertaking, to increase the proportions of those inunderrepresented groups.
Much research defining the relationship between propensity to enlist and socioeconomicstatus suggests that when there are economic downturns, individuals will increasingly turn tomilitary or public service as alternative employment. This has been true especially for BlackAmericans who have historically been left out of the rewards of even a strong economy.Compared to the early 1970s when the AVF was just underway, the U.S. is now experiencingeconomic prosperity. Despite the continued chronic economic disparity between majority andminority members, the latter groups are experiencing a comparative cultural and economicboom.
For example, in general, employment, income levels and college enrollment for BlackAmericans are at an all-time high and so is their optimism for a better future. While this is goodnews overall, it may be bittersweet for the military. The military may find that as Blacks havemore economic options available to them, fewer numbers may enlist. Although Blacks are stilloverrepresented in the military relative to youth population proportions, Hispanics areunderrepresented despite their growing population counts. One challenge that the military mustface is how to project an image of viable career contender for all Americans regardless ofeconomic conditions.

9-3
College graduates are another segment of society that is underrepresented in the military'senlisted ranks. Since the military recruits heavily from the high school graduate population, andthe trend indicates an increasing number of high school graduates are college bound, it isreasonable to assume college graduates will remain underrepresented among the active-dutyenlisted corps. However, college graduates are well represented among the officer corps andamong the reserves, so the issue of representation is not one of equity, as in the case of race orgender, but concerns enlistment supply. Defense must grapple with how to attract recruits fromthe growing segment of enlistment-aged youth who are college oriented.
These socioeconomic and demographic trends are important and dynamic forces inAmerican society and culture. Because the military relies exclusively on volunteers for itspersonnel, it must recognize and work with these societal trends. Understanding the economicopportunities available to different groups, the population projections of ethnic and racialminorities, and various other population trends will provide the military with some of theinformation necessary to understand its future recruiting and personnel needs. The same is truefor gender representation.
Female Representation
Both research and conventional wisdom have demonstrated that there are multiple factorscontributing to the levels of women's participation in the military: comparative economicopportunity, increased social acceptance of women in non-traditional roles, increased exposureof women to non-traditional jobs, changes in laws and military policies and so forth. The AVFmarked a turning point in women's participation in the military. During the mid- to late 1970swhen the AVF was suffering recruiting woes, a significant increase in the number of highlyqualified women entering military service helped the AVF survive the transition from the draft.Ironically, 25 years later, when women comprise approximately 18 percent of new recruits and14 percent of the active duty enlisted force, and continue to make inroads into all enlisted andofficer ranks and most occupations, the military is again facing significant recruitment shortfalls.
While women are making inroads into leadership positions, their military roles are stillunsettled. Although the Congressional Commission on Military Training and Gender-RelatedIssues concluded that the Services' current training practices (including mixed genderenvironments in all but the Marine Corps) were contributing to readiness, a minority ofcommissioners were reluctant to endorse removing the barriers to gender interaction at the basictraining phase, in part in reaction to increasing military participation by women.
Though women's representation in the military is at its largest in history, Americanwomen in the general population still suffer pay inequities and are well below men in terms ofmedian income in all racial/ethnic groups. For example, according to the Census Bureau1 thefemale-to-male earnings ratio was 0.74 in 1997. Such pay inequities, at least in terms of parity injob performance, do not exist in the military. This could be a contributing factor as to whywomen's participation is at an historical high and why the military is still a good alternativeemployment opportunity for women. 1 See Timenes, N., Jr., Force Reductions and Restructuring in the United States, presented to NATO Seminaron Defense Policy and Management, Brussels, Belgium, July 2, 1992. The derived force was based on thedistribution by years of service from FY 1987 through FY 1989—a period of stable funding preceding thedrawdown.

9-4
While military representation of minorities is relatively high and has been growing forwomen over the past 25 years, fewer and fewer Americans, proportionately, are serving in themilitary, owing to its smaller size. The military may remain a trusted institution, but fewerveterans means that the direct influence of a family tradition of service to country is lesscommonplace than in the past. Fewer policymakers today have military experience. For example,the ratio of Congressional members with military service has declined from more than 75 percentin 1971, just prior to the inception of the AVF, to less than 34 percent for the current, 106thCongress. No matter how serious or trivial the civil-military divide is in the United States, themilitary cannot ignore the possibility that recruiting may suffer as a result of this widening gap.If young men and women are less exposed to positive military images and stories and feel farremoved from the role the military has in American society, then it is reasonable to assume theirpropensity to enlist will decrease.
Clearly and for many reasons listed above, the U.S. military does not reflect completelythe population from which it is derived. But how representative should the U.S. military be?Among the difficulties in considering representation issues is how and to what extent we as anation want the military to mirror American society, its demographic makeup, its values, itspolitics. Many argue that having a military as diverse and variable as the American populace isan ideal as important as the liberties the Armed Forces are instituted to protect.
But the reality is, the military has moved beyond these basic questions. Plainly, themilitary does not reflect the demographic makeup of the United States. The democratic processof filling military personnel needs, instituted in 1973, is much more palatable to Americans thangoing back to a draft that would constitute a more representative force. So the concern today, atthe AVF's quarter-century mark, is how to attract new members from all segments of society andlevelout the burden of military service to increase participation among underrepresented groups,such as Asians and Hispanics. If we are to have, as Secretary of the Army Caldera stated, "anation that pulls together across ethnic [and other minority] lines," then the military mustactively engage in drawing underrepresented groups into service. Military leadership values thedynamic and diverse characteristics of its personnel. It is concerned about the health of itspersonnel management and about the image the military has among citizens in general. After 25years, the AVF and the nation it protects still struggle with minority representation issues. Butthe military has demonstrated it is willing to continue the struggle to achieve, on the one hand asuccessful warfighting capability, and on the other, an organization that comprises "we thepeople."


![Military Resistance 9G11 Reservists Accuse the Army[1]](https://static.fdocuments.us/doc/165x107/577d278c1a28ab4e1ea42e5f/military-resistance-9g11-reservists-accuse-the-army1.jpg)

