Population genome -wide analysis of geographically distant ... · Population genome -wide analysis...
174
Population genome-wide analysis of geographically distant isolates of the bee pathogen Nosema ceranae By Adrian Pelin Supervisor Dr. Nicolas Corradi Thesis submitted to the Faculty of Graduate and Postdoctoral Studies University of Ottawa In partial fulfillment of the requirements for the M.Sc. degree in the Ottawa-Carleton Institute of Biology Thèse soumise à la Faculté des études supérieures et Postdoctorales Université d'Ottawa En vue de l'obtention de la maîtrise en science à L'Institut de biologie d'Ottawa-Carleton © Adrian Pelin, Ottawa, Canada, 2015
Transcript of Population genome -wide analysis of geographically distant ... · Population genome -wide analysis...
Population genome-wide analysis of geographically distant isolates of the bee pathogen Nosema ceranae
By
Adrian Pelin
Supervisor
Dr. Nicolas Corradi
Thesis submitted to the
Faculty of Graduate and Postdoctoral Studies University of Ottawa
In partial fulfillment of the requirements for the M.Sc. degree in the
Ottawa-Carleton Institute of Biology
Thèse soumise à la Faculté des études supérieures et Postdoctorales
Université d'Ottawa En vue de l'obtention de la maîtrise en science à
L'Institut de biologie d'Ottawa-Carleton
© Adrian Pelin, Ottawa, Canada, 2015

Abstract
Microsporidia are a peculiar phylum of ancestral fungal relatives who have remained enigmatic and
largely unknown up until the end of last century. Recent research has revealed some clues about their
parasitic life style, and provided some answers regarding their basic biology. Research done as part of my
Master’s degree has combined next generation genome sequencing and with powerful bioinformatics
analyses to make new contributions in the field of microsporidian biology. In this dissertation, I will focus
on describing the results of my main project, a population genomic study of an economically important
microsporidium, Nosema ceranae. Infections from this species have been associated with recent global
declines in the populations of western honeybees (Apis mellifera). Despite the outstanding economic and
ecological threat that N. ceranae may represent for honeybees worldwide, many aspects of its biology,
including its mode of reproduction, propagation and ploidy, are either very unclear or unknown. In my
thesis, I aimed to expand our knowledge of N. ceranae biology by sequencing the genome of 8 isolates
(i.e. a population of spores isolated from one single beehive) of this species harvested from 8
geographically distant beehives, and by investigating their level of polymorphism. Consistent with
previous analysis performed using single gene sequences, my analyses exposed a very high genetic
diversity within each isolate, but also very little hive-specific polymorphism. My investigations on the
nature, location and distribution of this variation revealed that that beehives around the globe are infected
by a population of N. ceranae cells that are polyploid (4n or more) and clonal. Furthermore, phylogenetic
analyses I performed using genome-wide SNP data extracted from these parasites and mitochondrial
sequences from their hosts all failed to support the current geographical structure of our isolates,
suggesting that the isolates we analysed have probably spread through human intervention. Altogether,
research done as part of my Master’s degree has resulted in essential breakthroughs in our biological
understanding of an economically and ecologically important parasite of honeybees.
ii
Résumé Les Microsporidies font partie d'un phylum apparenté au règne des Champignons. Ces organismes sont
restés énigmatiques et pratiquement inconnus jusqu'à la fin du siècle dernier. Des recherches récentes ont
finalement commencé a révéler leur style de vie parasitaire et leur biologie. La recherche effectuée durant
ma maîtrise s’est basée sur le séquençage d’ADN à haut débit et l'analyse génomique par outils
bioinformatiques puissants. Cette recherches et analyses ont fortement augmenté nos connaissances sur la
biologie des microsporidies; en particulier celle de Nosema ceranae. Dans cette thèse, je vais me
concentrer sur la description des résultats de mon projet principal, qui est une étude sur la génomique des
populations d'une microsporidie économiquement importante; Nosema ceranae. Cette espèce est un
pathogène dont les infections ont été associées à des baisses dans les populations d'abeilles domestiques
dans le monde entier (Apis mellifera). Malgré la menace économique et écologique exceptionnelle que N.
ceranae peut représenter pour les abeilles à travers le monde, de nombreux aspects de la biologie de ce
parasite, y compris son mode de reproduction, de propagation et de ca ploïdie, sont incompris. Dans cette
thèse, je vise à élargir notre connaissance sur la biologie de N. ceranae en re-séquençant le génome de
huit souches (soit une population de spores isolés à partir d'une seule ruche) de cette espèce récoltés dans
huit endroits géographiquement éloignés, et en explorant sur leur niveau de polymorphisme.
Conformément aux analyses précédentes effectuées à l'aide de séquences de gènes individuelles, nos
analyses ont découvert une diversité génétique très élevée au sein de chaque isolat, mais aussi très peu de
polymorphisme spécifique à chaque ruche. Étonnamment, la nature, l'emplacement et la distribution de
cette variation génétique suggèrent que les ruches à travers le monde pourraient être infectées par des
populations de N. ceranae polyploïdes (4n ou plus), et probablement clonales. Enfin, les analyses
phylogénétiques basées sur les SNPs du génome entier de ces parasites et des séquences mitochondriales
de leurs hôtes (abeilles) n’ont révélé aucune relation entre leure lieu géographique. Dans son 'ensemble, la
recherche effectuée durant ma maîtrise sur des parasites économiquement et écologiquement importantes
a contribué fortement à faire avancer notre connaissance sur la biologie d’un parasite important d’un
point de vue économique et écologique.
iii
Table of Contents Abstract ......................................................................................................................................................... ii
Résumé ......................................................................................................................................................... iii
Acknowledgments ....................................................................................................................................... vii
List of Figures ............................................................................................................................................ viii
Chapter 1: Introduction ................................................................................................................................. 1
What are Microsporidia? ........................................................................................................................... 1
Classification and Cellular Biology .......................................................................................................... 2
From ancient eukaryotes to fungal-like organisms ............................................................................... 2
Inside or outside of the Fungal Kingdom? ............................................................................................ 3
Life Cycle and successful strategies employed during infection .......................................................... 4
Genome Dynamics .................................................................................................................................... 6
Economic and Health impact of Microsporidia ........................................................................................ 7
Microsporidiosis in Humans: Epidemiology, symptoms and treatment ............................................... 7
Economic Importance of Genus Nosema .............................................................................................. 9
The biology of Nosema ceranae and its impact on Colony Collapse Disorder .................................. 10
Research Justification and Goals ............................................................................................................ 12
Chapter 2: Materials and Methods .............................................................................................................. 13
Sample collection and DNA sequencing ................................................................................................ 13
Genome assembly and annotation........................................................................................................... 13
Read processing, mapping and coverage analysis .................................................................................. 15
Intra-isolate polymorphism discovery .................................................................................................... 17
Recombination analysis .......................................................................................................................... 17
Gene diversity estimates ......................................................................................................................... 18
Phylogeny of strains and host ................................................................................................................. 19
Chapter 3: Genome analyses suggest the presence of polyploidy and recent human-driven expansions in eight global populations of the honeybee pathogen Nosema ceranae ........................................................ 22
Abstract ................................................................................................................................................... 23
Introduction ............................................................................................................................................. 24
Results ..................................................................................................................................................... 27
A newly available N. ceranae genome reference: PA08_1199 .......................................................... 27
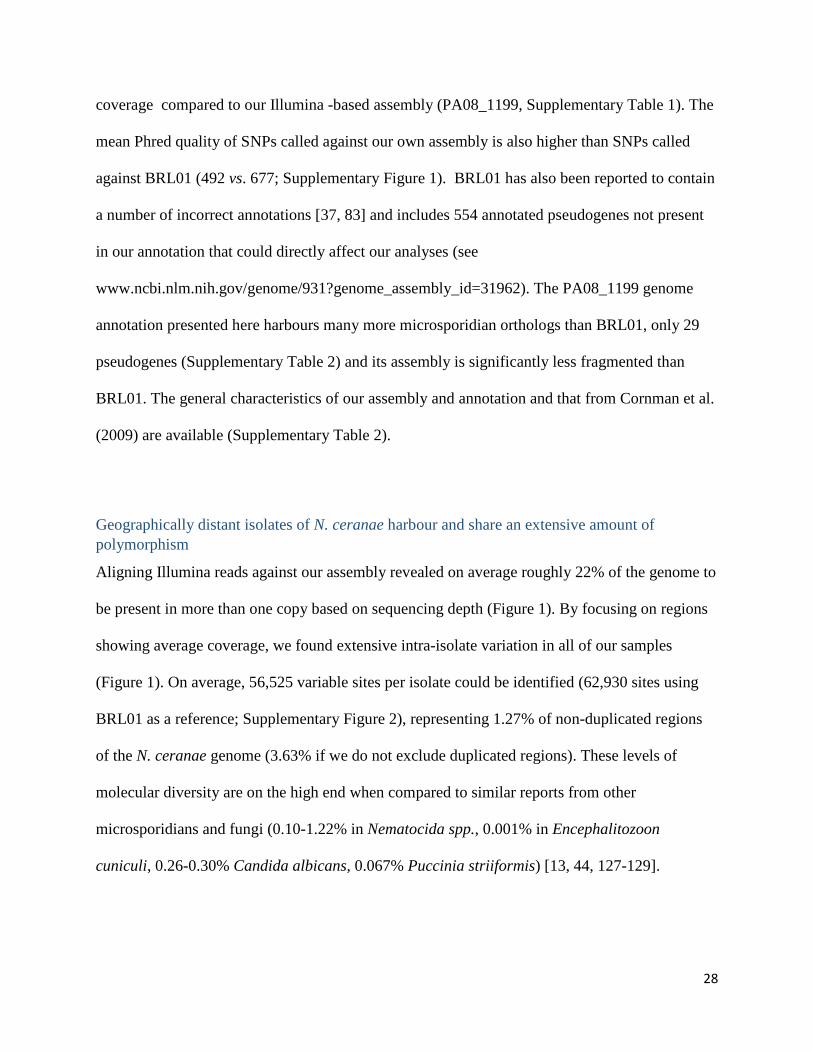
Geographically distant isolates of N. ceranae harbour and share an extensive amount of polymorphism ..................................................................................................................................... 28
Loss of heterozygosity and genes affected by heterozygosity in N. ceranae isolates......................... 30
iv

Most polymorphisms suggest the presence of a polyploid diplokaryon in our N. ceranae isolate ..... 33
Linkage disequilibrium analyses in eight populations of N. ceranae ................................................. 36
Incongruence between the evolutionary relationships of our isolates and their current geographical location ................................................................................................................................................ 39
Discussion ............................................................................................................................................... 42
Acknowledgments ................................................................................................................................... 44
Supplementary Data ................................................................................................................................ 45
Chapter 4: General Discussion, Future directions and Concluding remarks .............................................. 60
Importance of Research .......................................................................................................................... 60
Summary of novel findings ..................................................................................................................... 61
Diversity within and between hives .................................................................................................... 61
Demographic analysis show recent expansion .................................................................................... 62
Virulence genes ................................................................................................................................... 62
Evolution through clonal reproduction ............................................................................................... 63
Further implications and directions......................................................................................................... 64
Concluding remarks ................................................................................................................................ 66
References ................................................................................................................................................... 67
Appendix A: Morphology and phylogeny of Agmasoma penaei (Microsporidia) from the type host, Litopenaeus setiferus, and the type locality, Louisiana, USA .................................................................... 75
Abstract ................................................................................................................................................... 76
Introduction ............................................................................................................................................. 77
Materials and methods ............................................................................................................................ 81
Materials ............................................................................................................................................. 81
Histopathology and analysis of tissue tropism .................................................................................... 81
Spore purification and DNA isolation ................................................................................................ 83
PCR and sequencing procedures, and draft genome assembly as a source of tubulin sequences ....... 84
Phylogenetic analysis .......................................................................................................................... 85
Results ..................................................................................................................................................... 89
Gross pathology, tissue tropism and light microscopy ....................................................................... 89
Scanning electron microscopy (SEM) ................................................................................................ 95
Transmission electron microscopy (TEM).......................................................................................... 96
Phylogenetic relationship of A. penaei–LA with other microsporidia based on ssrRNA ................. 103
Phylogenetic relationship of A. penaei–LA with other microsporidia based on alpha- and beta-tubulin sequences .............................................................................................................................. 110
v

Taxonomic summary ........................................................................................................................ 110
Discussion ............................................................................................................................................. 112
Acknowledgements ............................................................................................................................... 120
References ............................................................................................................................................. 121
Appendix B: Microsporidian Genomes Harbor a Diverse Array of Transposable Elements that Demonstrate an Ancestry of Horizontal Exchange with Metazoans......................................................... 130
Abstract ................................................................................................................................................. 131
Introduction ........................................................................................................................................... 131
Materials and Methods .......................................................................................................................... 134
Sequence Data from Complete Genomes ......................................................................................... 134
Reference Sequences of TEs ............................................................................................................. 138
Tree Reconstruction and Sequence Analysis .................................................................................... 139
Results ................................................................................................................................................... 142
TEs Can Be Very Diverse in Microsporidian Genomes ................................................................... 142
Phylogenetic Reconstructions Reveal Microsporidia-Specific Clades of TEs ................................. 144
Phylogenetic Incongruences for TEs Identified in Microsporidian and Metazoan Genomes ........... 147
Discussion ............................................................................................................................................. 150
Origin of TE Diversity in the Microsporidia..................................................................................... 150
Potential Impact of TEs on the Biology and Evolution of Microsporidia ........................................ 151
Evidence of Extremely Recent and Bidirectional HTs with Metazoans ........................................... 153
Supplementary Material ........................................................................................................................ 154
Acknowledgments ................................................................................................................................. 154
References ............................................................................................................................................. 155
Permission to reprint ……………………………………………………………………….………………………………………………… 163
vi
Acknowledgments
My appreciation goes first and foremost to Dr. Nicolas Corradi. Supervising me for more than 4
years, Dr. Corradi has guided me through my debut in research with irreplaceable knowledge of the
scientific method. Thank you for your caring supervision, for making the work truly rewarding on its own
and for supporting me and keeping me motivated during the most challenging moments. My gratitude is
extended to Dr. Linda Bonen, who aside from being on my committee has provided me with invaluable
mentoring and guidance. Linda, I will always appreciate our casual talks about science encouraging me to
speculate more and share ideas. I would also like to thank the rest of my committee members, Dr. Alex
Wong for answering my questions and helping me understand population genetics, as well as Dr. David
Sankoff for all the valuable feedback and discussions. My appreciation also goes to Dr. Stéphane Aris-
Brosou for the helpful lessons in R and valuable advice, as well as Dr. Doug Johnson for always cheering
me up with a great story.
Additionally, I would like to thank current and former lab members, Rohan Riley, Philippe
Charron, Steve Ndikumana, Timea Marton and Manuela Krüger as well as newer lab members for the
friendly environment, helpful discussions during lab meetings and for all the music! Special thanks goes
to former colleagues Mohammed Selman and Stefan Amyotte, I really enjoyed the work we did together
and the time we spend, you guys were a great influence on me and I consider you among my best friends.
To my project’s collaborators, Raquel Martin Hernandez, Mariano Higes, Soledad Sagastume and
Nuno Henriques-Gil, I am very grateful for the samples of infected honeybees provided as well as for the
useful discussions and research done. Appreciation also goes to Dr. Timothy James, Dr. James Anderson,
Dr. Robert Kofler and all members of the BioStars community for all the useful advice and feedback.
To my parents, Gabriela and Ruslan, thank you for your moral and financial support during these
times. Thanks to the rest of my family for the love and care. Finally, to my beloved wife, Elena, words
cannot do justice for the continuous love, encouragement and understanding, I love you.
vii
List of Figures
Figure 3.1: Total number of specific (red), shared (orange) and common (yellow) polymorphic sites in the eight isolates of N. ceranae …………………………………………………………………………35
Figure 3.2: (A) Distribution of ORF Watterson’s θ values showing average diversity within our populations plotted against # of ORFs. (B-D) Orthologous ORFs found in N. apis, N. antheraeae and Encephalitozoon spp. are shown in a divergence between species (Theta) vs. diversity within isolates (Theta) plot ………………………………………………………………………………………......... 38
Figure 3.3: (A) Allele frequency spectrum based on read counts of bi-allelic SNPs. (B) K-mer distribution calculated for k=23 ………………………………………………………………………..41
Figure 3.4: Linkage Disequilibrium plotted against the largest contig ……………………………....44
Figure 3.5: Rooted Nosema ceranae phylogeny …………………………………………………….. 47
viii
Chapter 1: Introduction
What are Microsporidia?
Microsporidia is a highly diverse and monophyletic group of organisms who were first
recognized as primitive ancient eukaryotes, but are now considered to be a highly evolved sister-group of
Fungi. This phylum consists of very unique pathogens that have been known for over 150 years with
approx. 1400-1500 species in 187 genera described so far [1].
What makes these pathogens so unique is their adaptation to parasitism through reductive
evolution at both structural and genomic levels [2]. The obligate intracellular lifestyle of these pathogens
led to major gene loss associated with functions that are now been carried out by the parasitized host cell
[3]. One particularly radical adaptation in these species is the loss of mitochondria, a trait not shared by
close relatives and present in very few distant protists [4]. Another atypical feature is the innovation of a
unique host invasion apparatus known as the injection tube or polar tube [5].
Such characteristics (among others) shared by all microsporidia give them the ability to rapidly
and successfully proliferate, in some respects similar to viral infection [6]. Their ubiquitous presence [7]
can lead to opportunistic infections in a wide variety of animals, but also protists [8]. Some microsporidia
appear to be generalist and are able to infect many species, even evolutionarily unrelated ones such as
insects and humans, while other species seem to be host specific [9].
Transmission of these parasite occurs most often between hosts (horizontal transmission) [10],
but some species can also spread to the offspring (vertical transmission) [11]. Overall, the ubiquity of
these parasites coupled with their ability to spread rapidly and cause disease, have turned microsporidia
into pathogens of economic and medical importance [8].
1
Classification and Cellular Biology
From ancient eukaryotes to fungal-like organisms
The unique structure and biology of these parasites misled Microsporidian taxonomists
for some time, resulting in drastic changes in their classification from an ancient eukaryotic
group [12] to one with a strong relationship with fungi [1, 8, 13-15]. Specifically, initial
microscopy studies of microsporidia revealed an absence of conventional mitochondria and
Golgi apparatus, while molecular analysis using the ribosomal RNA resulted in their basal
placement within the eukaryotic tree of life [1]. Overall, seemingly primitive features caused
microsporidia to be pigeonholed in a short-lived group of supposedly primitive eukaryotes, the
“Archezoa” [16].
This view has rapidly changed when the first nuclear DNA samples from microsporidian
parasites were analysed using molecular tools [17]. Analysis of nuclear genes from these
organisms revealed the presence of many mitochondrial genes in these supposed
amitochondriates (ex. Hsp70). Antibody targeting of mitochondrial-like Hsp70 genes revealed
under light and electron microscopy tiny double membrane structures, named mitosomes [18],
degenerate mitochondria. These findings revealed that microsporidians were not ancestrally
amitochondriate, questioning the classification of this parasite as an ancient protist. Additional
molecular analysis firmly positioned this taxon as part of Opisthokonta [19], including the
identification of Opisthokont specific insertions in the EF-1α gene in the Microsporidia [20].
In parallel, additional sequencing efforts on microsporidians revealed new links with the
Fungal kingdom, although their exact position within the kingdom remained a matter of debate.
For instance, first beta-tubulin phylogenies suggested association of microsporidians with chytrid
2
fungi [21] while the addition of alpha-tubulin sequences showed a stronger relationship with
zygomycetes [22]. Evidence for an association with chytrids further grew with a 6 gene-based
phylogeny of all Fungi [23], while independent lines of evidence based on conserved genomic
structures reinforced the relatedness of microsporidia to zygomycetes [24] and uncovered the
possibility of these parasites to undergo sexual reproduction.
In order to determine the relatedness of a novel microsporidian species to other
organisms in this phylum, alpha and beta tubulin sequences as well as the small ribosomal
subunit are typically used. During my Master’s research I have used this approach to place
Agmasoma sp. in a phylogenetic context (see Appendix A; [25]).
Inside or outside of the Fungal Kingdom?
Microsporidia and Fungi are not similar morphologically, so their phylogenetic
association has been puzzling for some time. Presently, structural similarities are limited to
presence of cell walls and spindle pole bodies resembling that of ascomycetous fungi [26].
Several genomic synapomorphies have been reported between Fungi and microsporidia. The
most notable example of this is the conserved gene synteny between zygomycetes and some
microsporidian species at a MAT locus [24]. However, further investigations of all genomic
synapomorphies have failed to link microsporidia with any particular fungal phylum [27]. Other
characteristics shared between the two groups include presence of chitin and trehalose, formation
of spores, diplokaryotic nuclei (in some species) and cryptomytosis [16]. However, these
characteristics are not unique to fungi and microsporidia, as they are also found in some protists.
3

Recently, a new hyperdiverse phylum has been discovered to sit at the base of the fungal
tree, and was coined “Cryptomycota” [15]. Importantly, genome sequencing of the first
Cryptomycotan organism Rozella allomycis allowed phylogenetic reconstruction using 200
genes present in Rozella, microsporidia, fungi and eukaryotic outgroups. This analysis firmly
showed that Rozella is ancestral to Microsporidia, with both of them being positioned at the base
of the Fungal tree [14]. The close relationship between Rozella and Microsporidia is also
supported by additional features, including the presence of a degenerate, yet functional
mitochondria, and the presence of genes necessary for intracellular parasitism (nucleotide
phosphate transporters, the nucleoside H+ symporters, and the chitinase class I genes) [14].
Although a “fungal connection” of microsporidia is now widely accepted, the discovery of
phagocytosis in Rozella [28] questioned the identity of Cryptomycota and Microsporidia as true
Fungi, suggesting these to be sister groups instead.
Life Cycle and successful strategies employed during infection
The Microsporidian life cycle alternates between infectious, environmentally resistant,
spores and the meront (proliferative stage) found inside the parasitized cell [1]. Spores consist of
a chitinous cell wall protecting the sporoplasm, inside of which a unique infective apparatus can
be found, the polar tube [5]. Host cell presence triggers spore germination through an
environmental trigger that differs among species and is still poorly understood [29]. Germination
begins by water intake by the spore, causing a buildup of osmotic pressure. This triggers the
release of the polar tube at the apex of the cell, which will be shot forward to potentially
penetrate a host cell. If successful, the entire content of the sporoplasm will passed onto the
cytoplasm of the host, triggering merogany [1]. The absence of motility in microsporidia is thus
4

compensated by the polar tube, which can measure up to 300 µm in length [30]. Following
proliferation, new spores are formed and the cycle resumes.
During the proliferative stage (merogany) the intracellular meronts are in direct contact
with host cytoplasm. The meront is presently thought to gradually take over cell functions,
surrounding itself with the endoplasmic reticulum, mitochondria and the nucleus [26]. The
aggregation of mitochondria around the meront is also known to occur, coinciding with the
meront’s ability to steal ATP from its host [31]. ATP production in microsporidia is limited to
substrate level phosphorylation [17], with most ATP being appropriated from the host cell using
ATP transporters that were once acquired from intracellular bacteria [32]. Recent research by
Cuomo et al. has revealed a novel mechanism through which microsporidia secrete hexokinase
enzymes, thereby stimulating glycolysis in the host cell and increasing availability of ATP [13].
The increased availability of ATP after infection may allow the meront to undergo
subsequent rounds of division (merogony) eventually triggering spore formation (sporogony) [8].
The onset of sporogony is marked mostly by the separation of the diplokaryotic nuclei in
meronts, although meiosis has been observed in some species [33]. Morphological changes in the
host include increased presence of ER, ribosomes and Golgi, with the latter shown to give rise to
the polar tube [34]. Once mature spores are released, some germinate immediately to re-infect a
different cell of the same host while others can be released into the environment via urine or
feces in an attempt to infect a different individual, possibly through the digestive system.
5
Genome Dynamics
Similar to their morphological simplicity, microsporidian genomes are mostly marked by
gene loss, reduction of gene length and genome compaction by shrinkage of intergenic regions
[35]. Genome sizes can range anywhere from 2.3 to 23 Mb, with bigger genome size correlated
with increased abundance of transposable elements [36], but not increased coding capacity [37].
Analyses of microsporidian genomes generally agrees with extensive loss of gene
families in ancestral microsporidia followed by lineage specific diversification [38]. Perhaps the
bacterial-size of these genomes may contribute to the quick and rapid division of microsporidia
(doubling time around 3h [13]). Interestingly, microsporidian genomes have been shown to lack
the retinoblastoma gene regulating cell division, suggesting a more rapid progression through the
cell cycle [13]. Other notable gene losses highlight the reduced metabolic potential in these
parasites, with an absence of TCA and oxidative phosphorylation. Such losses may be
compensated by the host cell [39].
Microsporidian genomes harbor between 1750 and 3266 ORFs [37, 40] numbers much
lower than most eukaryotes and even lower than some bacteria. Overall, 37% of microsporidian
genes show homology to other eukaryotes [38]. This suggests a continuous accumulation of
novel genes throughout microsporidian evolution. Some microsporidian specific proteins are
conserved among all sequenced genomes, suggesting their potential implication in their parasitic
life style [38].
Although gene losses have been frequent in this group, these parasites have also been
shown to be capable of acquiring genes via horizontal gene transfer (HGT). Recent analysis of
Encephalitozoon romaleae and Encephalitozoon hellem genomes show restoration of folate
metabolism through HGT [41, 42]. In fact, the unique ability of microsporidia to survive without
6
a mitochondrion is also thought to be the result of HGT. In this case, their capacity to acquire
ATP from the host is due to the presence of transporters of bacterial origin [32]. Lastly, during
my Master’s research I have contributed to a study that showed these parasites not only to
acquire, but also act as donors of genes to other eukaryotes, suggesting the possibility of bi-
directional transfer (see Appendix B; [36]).
Despite the increased availability of sequenced genomes in the last decade, the nature of
diversity and the ploidy of these parasites remain largely unknown [43]. For instance, studies of
genomic variation in Nematocida spp. revealed an abundance of polymorphic SNPs in a 1:1
ratio, suggestive of diploidy [13]. Although the authors argue a predominantly clonal lifestyle in
this species with evidence of mitotic recombination, presence of meiosis genes does not preclude
sexual reproduction in this parasite [13]. In contrast, similar analysis of several strains of
Encephalitozoon cuniculi showed highly reduced levels of such 1:1 SNPs, suggesting selfing or
frequent mitotic recombination events as possible explanations [44]. To understand more about
the basic biology of these important pathogens, further population genomic studies are warranted
[43].
Economic and Health impact of Microsporidia
Microsporidiosis in Humans: Epidemiology, symptoms and treatment
Microsporidian are ubiquitous in a truly global sense, being abundant in both first world
and third world countries. Although the first microsporidian parasite infecting an arthropod was
discovered in the 1800s, the first case of a human infection coincided with the HIV pandemic in
7

the 1970s [45]. This resulted in an increased interest in these parasites and microsporidia were
ultimately included as a priority pathogen for biodefense research by the NIH. Further studies
indicated microsporidiosis in humans to be abundant, with up to 58% of humans infected in
some populations [46]. Most infections are asymptomatic and could be passed on avoiding
treatment. For instance, close to half of 400 healthy subjects tested for microsporidia in the
Czech Republic showed presence of the parasite in feces [47].
It quickly became apparent that just as with other animals, microsporidian infections are
highly opportunistic in humans. These can occur in several tissues, including the intestines, the
eye and the brain, and are clearly prevalent among immunodeficient individuals. While most of
the infected subjects show no symptoms, microsporidia can have very negative effects in
immunocompromised patients, such as HIV positive individuals, or patients that are undergoing
chemotherapy or received a transplant. All cases where symptomatic microsporidian infections
having been documented [48]. Microsporidiosis, the disease associated with microsporidian
infections, can result in a variety of symptoms, including chronic diarrhea and other symptoms
that are specific to the infected tissue. For example, brain infections can lead to seizures, while
eye infections usually lead to blurry vision [49].
Symptomatic infections are usually fatal when left untreated [50]. Currently, treatment
options are reliant on 2 drugs, fumagillin and albendazole. Although these drugs are highly
effective in reducing spore counts and removing symptoms, re-emergence is not uncommon [51,
52]. Despite a high percent of the population being carriers, epidemic outbreaks of microsporidia
have so far been documented only in India, during the monsoon season [53, 54]. Perhaps, rising
water levels during the monsoon give this waterborne pathogen opportunities to produce ocular
8

infections, as the number of keratitis cases double compared during this particular season the
year [54].
Economic Importance of Genus Nosema
Many microsporidia lead a cryptic existence in their hosts, with many infections
remaining unnoticed due to lack of symptoms and a low spore count. Surveys of low level
infection revealed a much broader host diversity than previously expected, with half of the
metazoan phylum being infected by at least one microsporidium [55]. Estimates of true
microsporidian diversity suggest the number of microsporidian species to be close to that of
animals [56].
Although they are capable of infecting most animals, 69% of 125 surveyed
microsporidian species have been found in insects and crustaceans [7]. Some species are
significant pathogens of aquatic invertebrates [57]. Their targets include the freshwater crayfish
and marine crabs, but many are opportunistic parasites that are capable of infecting multiple
species that are sometimes evolutionarily unrelated [8].
A good example showing the detrimental potential of microsporidia on economic
activities is the discovery and description of the first microsporidian species. In the 1800s the
collapse of the European Silk industry was attributed to an atypical protozoan pathogen [58]. To
date this silkworm infecting microsporidian, Nosema bombycis, remains a threat, resulting in
high costs associated with prevention in the silk industry [59].
Members of the genus Nosema spp., including Nosema bombycis, are known to infect
some of the most commercially important arthropods. Some species have been proposed as
potential bio-control agents [60]. For instance, Nosema whitei infects the Red flour beetle
9
(Tribolium castaneum) [61] while Nosema pyrausta, infects the European corn borer [62], both
classical examples of microsporidia regulating important agricultural pests.
Despite the ability of some microsporidia to act in the benefit of human kind, such cases
are few and are outweighed by the economic damage caused by these species. Perhaps the most
notable example is the widespread infection of main pollinators by microsporidian species from
the genus Nosema. Three such common pathogens, Nosema bombi, Nosema apis and Nosema
ceranae have been described in bumblebee, Asian and European honey bee hosts respectively
[63, 64]. Recently, Nosema ceranae has received increased attention after repeatedly being
detected in unhealthy honey-bee colonies world-wide [65]. Symptoms in the honeybee are
damage to gut-tissue as well as detrimental physiological changes [66]. These effects of Nosema
ceranae make it an important target and warrant further research into its lifestyle and
epidemiology.
The biology of Nosema ceranae and its impact on Colony Collapse Disorder
The economically and ecologically important arthropod Apis mellifera is used in the
commercial production of honey and ensures pollination [67]. Recent trends indicate the overall
abundance of these western honeybees is decreasing [68, 69]. The last 2 decades have seen a rise
in extreme cases where entire colonies perish in a matter of days, a phenomenon labelled as
“colony collapse disorder” (CCD) [70]. The exact causes of CCD remains to be established, but
are thought to involve a mixture of abiotic and biotic elements, such as nicotidic pesticides,
diseases caused by bee-viruses or eukaryotic fungi [71-74].
10
Interestingly, Western European honeybees (Apis mellifera) have long been known to be
infected exclusively by Nosema apis, causing nosemosis, while this latter disease in Asian
honeybees (Apis cerana) is caused mostly by N. ceranae [75] (the parasite under scrutiny in this
present study). The recent identification of N. ceranae in western honeybees [76] has been
suggested to result from a recent host switch [77], and could be the cause for the apparent,
increased virulence of N. ceranae in A. mellifera (as opposed to A. ceranae, the original host).
More importantly, Nosema ceranae has been prevalent in colonies affected by CCD, with
experimental evidence showing its association with increased mortality of honey bees worldwide
[78-81].
Despite the major threat to the apiculture industry at this very moment [82], neither the
biology nor the genetics of N. ceranae are clearly understood. One particular feature of Nosema
ceranae, is its atypical binucleated nucleus (e.g., the diplokaryon: two nuclei bound together
within one nuclear endomembrane [75]). Neither the ploidy nor the chromosome count of these
nuclei are currently known. For instance, attempts at visualization of chromosomes were
unsuccessful [83].
Prior genomic studies of N. ceranae have revealed details about genome size (8 MB) and
genome structure: AT rich, transposon rich, diverse repeat elements and 2614 protein coding
genes [83]. Taken alone, however, this latter genome sequence and annotation did not provide
any clues regarding the mode of propagation, origin and recent increase in virulence of this
parasite. Recently, attempts to acquire information about these important processes have been
made by several groups, most notably through the acquisition of sequence information from
several strains of this species, isolated globally. All of these studies have found the presence of
elevated intra-strain diversity, which has been suggested to result from the presence of recurrent
11

recombination and co-existing inter-strain polymorphism [84-86], overall suggesting of the
presence of frequent sexual reproduction in this species.
Research Justification and Goals
In the present project, we set to obtain additional and more in depth information
regarding the genetics, ecology and evolution of this notorious honeybee parasite. Previous work
addressing these questions has led to debatable conclusions or unexplained results. For instance,
most studies have found beehives to contain many variants of single gene sequences [84, 87-91],
but the origin of this diversity cannot be inferred without a prior knowledge of the ploidy.
Similarly, different studies disagree on the extent and frequency of recombination in Nosema
[87-91], and on the presence or absence of sexual reproduction [84]. Finally, no study has yet
been able to produce a supported phylogeography of this parasite [84].
In this thesis, I aimed to increase the power of our analysis compared to previous work by
investigating diversity of this parasite using genome-wide data. To this end, we have sequenced
the genomes of eight N. ceranae isolates harvested at different chronological times (2007-2011)
and from distant geographic locations in six countries (Argentina, France, Spain, USA, Croatia,
and Turkey). Each of these samples represent populations of N. ceranae spores isolated from
individual bee hive.
Analysis will focus on identifying the presence and origin of diversity in these isolates,
and in characterizing the mode of evolution of this parasite. Moreover, sequence data will also be
used to investigate how these parasites have propagated worldwide, and to understand whether
their genomes have been affected by particular selective pressures.
12
Chapter 2: Materials and Methods
Sample collection and DNA sequencing
Samples were collected from colonies naturally infected with N. ceranae in different
geographical locations (Supplementary Table 1). Each colony represents one population of
spores, originating from 30 to 40 live honeybees part of one beehive. Bees (A. mellifera) were
macerated following previously described methods [92]. DNA was extracted from Percoll®
purified spores using MasterPureTM Complete DNA and RNA purification kit from Epicentre
Biotechnologies (Madison, WI). Libraries were constructed, multiplexed and sequenced using
Illumina HiSeq 2000 technology by Fasteris S.A. (Geneva, Switzerland). Sequencing resulted in
99,255,426 paired end reads 100bp in length with exemplary quality, each library having over
85% of reads at Q30 after demultiplexing. Adaptors were trimmed and overlapping paired reads
were merged using SeqPrep (github.com/jstjohn/SeqPrep). Quality trimming minimizes
downstream artifacts [93] and was performed using the PERL script trim-fastq.pl from the
PoPoolation toolkit [94].
Genome assembly and annotation
Reads from isolate PA08_1199 (Spain) were assembled de novo using SPAdes v3.0 [95] with
high k-mers (k=75, 85) in an effort to remove redundant contigs. Resulting contigs were
screened for contamination using BLAST (Megablast, E-value < 10-100) against the existing
BRL01 assembly (GCA_000182985.1). Contigs that did not return a hit were discarded. Final
assembly size was 5.7 Mb distributed among 536 contigs with an N50 of 42.5 kb. This Whole
13

Genome Shotgun project has been deposited at DDBJ/EMBL/GenBank under the accession
JPQZ00000000. The sequence described in this paper is version JPQZ01000000.
To estimate the haploid genome size of our organism an approach based on k-mer count
distribution was used. We generated k-mer distributions using all sequencing reads of isolate
PA08_1199 for k values of 23, 33 and 43 (Supplementary Figure 12). Since the expected
tetraploid 1:2:4 ratio of peak k-mer coverage for the generated distributions was observed, we
inferred that the impact of contaminating sequence in our assembly to be negligible for the
purposes of genome size estimation. Under ideal circumstances where there are no
contaminating sequences or sequencing errors, and the organism in question is haploid, there is a
simple relationship between the amount of unique k-mers ku, the genome size of the haploid
organism G, and the length of the k-mer kl: ku = G – kl + 1 (since kl is negligible, number of
unique k-mers equal estimated genome size). Estimated Haploid Genome Size = (Total k-mers
under Peak #1 × 0.25) + (Total k-mers under Peak #2 × 0.50) + (Total k-mers under Peak #3).
This approach allows us to estimate the haploid genome size of N. ceranae between 5.26 and
5.99 Mb; values that are consistent with our assembly size of 5.7Mb but yet smaller than the
previously published genome of N. ceranae BRL01 that stands at 7.9Mb.
To determine whether the larger BRL01 assembly size is due to collapsed repetitive regions
or unique sequence, we mapped reads from our isolates to both the BRL01 and PA08_1199
assembly. On average 3.7% ± 0.5% of our reads map uniquely to the BRL01 assembly,
indicating some unique genomic content in the assembly. However, since the BRL01 assembly is
38.6% larger in size, the major reason for the size difference is the repetitiveness of the
assembly. In addition to mapping reads, we tested the unique content of the BRL01 assembly by
masking BRL01 contigs with PA08_1199 sequences. This approach was done using BBDuk,
14

part of BBMap package (available at sourceforge.net/projects/bbmap) with k values of 23 and
31, which confirmed 3.86% to 6% unique content in the BRL01 assembly.
Open reading frames (ORFs) were identified along the assembled portion of the N. ceranae
genome using an in-house script that combines Glimmer’s ab initio gene prediction algorithm
and CCC and GGG motifs found in close proximity of microsporidian Transcription Initiation
Sites [37]. The 3,228 ORFs identified were then queried (BLASTp, E-value < 10-10) against the
NCBI NR database, and their potential protein products were predicted using Blast2GO [96].
ORFs were also searched for the presence of secretion signals using SignalP [97], as well as
conserved domains KOG, GO, KEGG and PFAM using the WebMGA server (weizhong-
lab.ucsd.edu/metagenomic-analysis/server). Raw reads as well as the annotated assembly are
available on NCBI (BioProject PRJNA209464), conserved domains and secretion signals are
catalogued in Supplementary Table 7.
Read processing, mapping and coverage analysis
Trimmed reads from each sample were mapped against our final assembly to quantify
variation. Mapping was done using BWA with parameters "-t 8 -n 0.1" [98]. Resulting SAM files
were converted to BAM format and sorted using samtools v0.1.19-44428cd [99] after which
duplicates were removed using Picard Tools v1.94 (picard.sourceforge.net). All downstream
analyses were performed on the processed BAM files.
Reads that mapped against our genome from each sample were extracted and used for k-mer
analysis using kmergenie [100] (Figure 3B, Supplementary Figure 8). The k-mer distributions
were constructed for each isolate using reads that exclusively map to our reference genome
(PA08_1199; 10% mismatch to reference), individually. This was based on counts, abundance
15
and coverage of unique 23-mers (23-mer coverage), where each density shows the total amount
of 23-mers at that specific coverage against 23-mer coverage values. In all cases, the left side of
the graph reveals a high number of 23-mers with very low coverage, most likely representing
sequencing errors. For higher coverage values, we notice 3 distinct peaks in the plots, with
coverage values in a 1:2:4 ratio. The 3rd peak has coverage values corresponding to average
sequencing depth of the organism, indicating 23-mers in the genome that do not contain any
variation in the sample (homozygous genotypes in the population). The first and second peak
however indicate 23-mer genotypes with frequencies of 25% and 50%. Given that most SNP
variation is shared among populations and that isolates of high coverage show the same trimodal
distribution, our data suggest that these 23-mer genotypes are present in each tetraploid
individual of a clonal population with a maximum of four genotypes in regions of average
coverage.
The sequencing depth of each isolate was calculated as an average depth of the top 10 longest
contigs (Supplementary Table 1). In order to plot allele frequency distribution, all SNPs present
at low and high frequencies were found using the PERL script snp-frequency-diff.pl from the
PoPoolation2 toolkit [94] and plotted using R [101]. To avoid the analysis of variation arising
from paralogy, all regions showing an average sequencing depth for variant discovery > 25%
were excluded from the analyses. Note that these analyses are highly correlated with genome
coverage (i.e., isolates with lower coverage may not display these patterns).
To calculate the fraction of the genome present in more than one copy, we used the
“genomecov” feature of the bedtools kit v2.17.0-99-g5c3bb21 [102]. After plotting nucleotide
coverage along all contigs, we extracted regions deviating from average coverage by more than
25% and summed up their total length. This approach revealed on average 22.68% of the
16

genome to be in more than one copy (Figure 1). Note that this approach gives overestimated
values in isolates of lower sequencing depth.
Intra-isolate polymorphism discovery
Heterozygous variants were identified using FreeBayes v0.9.14-8-g1618f7e [103] with
parameters “--ploidy 4 --pooled-continuous --min-coverage 10 -F 0.10” with a 10% minimum
frequency. SNPs with a coverage depth 25% higher than the isolate's average depth were filtered
out. Variation between isolates was then compared using R to account for shared and unique
variation. To estimate the density of intra-genomic variation, we used the function SNPdensity in
the VCFtools v0.1.12b package [104]. To screen for regions exhibiting loss of heterozygosity
(LOH) we plotted SNP density using a sliding window of 1kb genome-wide, looking for
adjacent windows with less than two SNPs/kb. SNP data has been submitted to dbSNP
(accession number NCBI_ss# 1558296142-1558370986).
Recombination analysis
Linkage disequilibrium r2 was estimated with LDx [105], an approach designed for high-
throughput pooled sequencing. This approach phases pairs of nearby SNPs within and between
paired-end reads (distance between the two SNPs is shorter than insert length) and estimates r2
from a 2 × 2 haplotype table in which observed haplotypes counts are compared to expected
haplotypes counts (from allele frequencies of the two SNPs). LDx takes as input reads aligned to
the reference genome in the SAM format, as well as location of SNPs in the VCF format. For the
purpose of estimating r2, we called SNPs with FreeBayes as described in the previous section
17
(with parameters “--pooled-continuous --min-coverage 10 -C 2 -F 0.01”) but with a 1%
minimum frequency cutoff. Estimated r2 values were then plotted along the five largest
assembled contigs (Figure 4; Supplementary Figure 9). Decay is showed by plotting r2 as a
function of physical distance between pairs of SNPs (Supplementary Figure 10) using ggplot2
[106] in R.
Gene diversity estimates
In order to identify genes displaying high levels of variability, we estimated Watterson’s θ
for each isolate for every single ORF. These θ values were estimated with Pool-Seq as
implemented in PoPoolation [94], based on allele counts. Critically, this approach is unaffected
by ploidy and does not require phased data. Genes with coverage values higher than average
coverage were excluded from this analysis.
The comparison with other species demanded that we estimate Watterson’s θ from already
published genomes. To this effect, N. ceranae orthologs were found in three other species
(Encephalitozoon spp., N. apis and N. antheraeae); ortholog-specific alignments were conducted
at the codon level with MACSE [107], and θ was estimated in R using the function theta.s() from
the pegas package [108]. Estimates of θ among Encephalitozoon species as in Figure 2D are
taken from Pombert, Haag et al. (2015) [109].
All searches for high confidence of orthologs between ORFs of different genomes were done
using the Inparanoid algorithm [110] with as Rozella allomycis as an outgroup and the bootstrap
option turned on. This conservative approach takes advantage of the reciprocal BLAST, as well
as BLAST-ing against an outgroup.
18

Phylogeny of strains and host
To reconstruct a phylogeny among the N. ceranae strains, a number of independent
approaches were used. First, allele counts were used as informative characters rather than an
alignment TreeMix; [111] in a Population Split Pattern Analysis of our samples with 1000
bootstrap replicates. A consensus tree was generated from the bootstrap replicates using the
sumtree tool part of DendroPy package [112].
To confirm the results obtained using this approach, a matrix was built for each SNP detected
which includes information about its presence / absence in each of the eight isolates (only bi-
allelic variation was used, which represent 95% of the total polymorphism detected). The
alignment matrix consists of 72,793 bi-allelic SNPs found in all isolates, with SNPs at identical
frequencies between isolates treated as ancestral events. For each SNP there are four columns
present in the alignment (mirroring a total of four potential chromatids), distributed between the
reference (R) and derived alleles (D), depending on their respective frequencies. Here, alleles
with a 0.00, 0.25, 0.50, 0.75 or even 1.00 frequency were converted into an RRRR, DRRR,
DDRR, DDDR and DDDD alignment pattern specific to each isolate. For example, if one SNP
had a derived allele with a frequency of 0.25 and a reference of A, then the alignment would be
GAAA. If the same SNP had a frequency of 0.5, the resulting alignment would have been
GGAA. In all cases, the Spain 08_1199 assembly (Accession JPQZ01000000) represents our
reference set of alleles. This matrix was then converted to a nucleotide alignment
(Supplementary Note 1), which was used to infer the phylogeny of these strains both in a
maximum likelihood (ML) and in a Bayesian framework. In all cases, the GTR + Γ substitution
model was assumed (e.g.[113]. The ML analyses were done with PHYML v3.0 [114]; 100
bootstrap replicates). The Bayesian analyses were performed with the MPI version of MrBayes
19
r959 [115, 116]; in duplicate, to check for convergence, run for 2,500,000 generations; a
conservative 10% burn-in was removed before inference). These approaches, based on alignment
pattern profiles, provided results that were very similar to those based on allele counts
(Supplementary Figure 11).
Lastly, we analysed the same matrix as above under the multispecies coalescent implemented
in *BEAST [117]. The substitution model was set to GTR + Γ under a lognormal relaxed clock
constant-size coalescent for autosomal loci. Two independent chains were run for 100,000,000
steps to check for convergence; burn-in was again determined visually from trace plots and set to
a conservative 10%.
The host phylogeny was obtained by mapping our reads to the mtDNA of A. mellifera
GenBank isolate (L06178.1), and recreating the consensus sequence of the mtDNA genome for
every isolate using Geneious (www.geneious.com). However, not all strains had enough mtDNA
contamination, in which case we could not include them in the phylogeny. Coverage of the
mtDNA genome varied between 1.6x to 375.3x, all strains included in the analysis had a
minimum of 77% RefSeq coverage. We looked for evidence of multiple mtDNA genomes by
searching contigs of each isolate (assembled with MIRA v4.9.1 [118] using BLASTn and
tBLASTn of conserved Hymenopteran mitochondrial genes, but could only find contigs arising
from one mitochondrial genome. Only minor levels of polymorphisms (up to 185 SNPs with a
minimum allele frequency of 35%) were seen when inspecting read alignments to the reference
genome (L06178.1). To reduce the impact of variability, we called consensus base pairs with
85% read support stringency (i.e., positions where minor alleles exceeded 15% were called as
ambiguous). The reconstructed genomes of all isolates were aligned together with GenBank
isolate L06178.1 and a host tree was reconstructed using the TIM2+I model in PHYML v3.0
20
[114] (1000 bootstrap replicates) and the MPI development version of MrBayes r959 [115, 116]
(2,000,000 generations; lset Nst=6 rates=propinv).
21
Chapter 3: Genome analyses suggest the presence of polyploidy and recent human-driven expansions in eight global populations of the honeybee pathogen Nosema ceranae
Adrian Pelin1, Mohammed Selman1, Stéphane Aris-Brosou2 Laurent Farinelli3, and Nicolas
Corradi1*
1 Canadian Institute for Advanced Research, Department of Biology; University of Ottawa,
Ottawa, ON, Canada
2 Departments of Biology and of Mathematics & Statistics; University of Ottawa, Ottawa, ON,
Canada
3 FASTERIS S.A., Ch. du Pont-du-Centenaire 109, P.O. Box 28, CH-1228 Plan-les-Ouates,
Geneva, Switzerland.
* To whom correspondence should be addressed: [email protected]
Comments:
This work has been accepted for publication in Environmental Microbiology, April 2015. My main contributions to this work include all aspects of this study. Contribution from other authors:
• MS helped with preliminary molecular work and sequence analysis. • SAB helped with Manuscript review and with phylogenetic analysis. • LF provided the sequencing of our isolates.
22

Abstract Nosema ceranae is a microsporidian pathogen whose infections have been associated with recent
global declines in the populations of western honeybees (Apis mellifera). Despite the outstanding
economic and ecological threat that N. ceranae may represent for honeybees worldwide, many
aspects of its biology, including its mode of reproduction, propagation and ploidy, are either very
unclear or unknown. In the present study, we set to gain knowledge in these biological aspects by
re-sequencing the genome of 8 isolates (i.e. a population of spores isolated from one single
beehive) of this species harvested from 8 geographically distant beehives, and by investigating
their level of polymorphism. Consistent with previous analyses performed using single gene
sequences, our analyses uncovered the presence of very high genetic diversity within each
isolate, but also very little hive-specific polymorphism. Surprisingly, the nature, location and
distribution of this genetic variation suggest that beehives around the globe are infected by a
population of N. ceranae cells that may be polyploid (4n or more), and possibly clonal. Lastly,
phylogenetic analyses based on genome-wide SNP data extracted from these parasites and
mitochondrial sequences from their hosts all failed to support the current geographical structure
of our isolates.
23

Introduction The honeybee Apis mellifera is a significant arthropod of ecologic and commercial importance
that produces honey and ensures pollination worldwide [67]. Its obvious benefits for many
human activities have contributed to the export of this arthropod from its native range in South
and South East Asia to many distant geographical locations around the globe. Today, A.
mellifera continues to be commercially exchanged on a large scale and across very distant
geographical locations on a daily basis [119]. Alarmingly, recent reports have suggested that the
global populations of A. mellifera may be undergoing a rapid decline [68, 69] with, in the most
extreme cases, the reduction in numbers of individuals resulting in the rapid extinctions of entire
colonies, a phenomenon referred to as colony collapse disorder (CCD). This recent and drastic
disappearance of honeybee populations around the globe has been of obvious concern to the
public, as well as the apiculture and agriculture industries worldwide. It is also noteworthy that
the continuation and expansion of this disorder may also have devastating effects on the ecology
of many terrestrial ecosystems. The exact causes of CCD and other less severe causes of
morbidity in honey bees are not known, but are presently thought to include both abiotic and
biotic elements, such as nicotidic pesticides, diseases caused by bee viruses or eukaryotic fungi,
or a combination of those [71-74].
One eukaryotic parasite commonly present in beehives affected by CCD is the
microsporidium Nosema ceranae [76]. Microsporidian parasites are ubiquitous intracellular
parasites of many animals and are closely associated with the phylum Cryptomycota [14]. Over
1500 species in 160 genera have been described from this group, some of which are also known
to infect humans (particularly immunosuppressed individuals) [45]. The most notorious cases of
microsporidiosis (the disease associated with microsporidia infection) are known from
24
economically important insects, particularly the silkworm (Bombus mori; [120]) and the western
honeybee (Apis mellifera; [121]). The western honeybee can be infected by several
microsporidia, but the most commonly observed are Nosema apis and Nosema ceranae. The
latter species was first discovered in Asia, but has now spread globally and always dominates in
A. mellifera hives affected by nosemosis [76, 122]. Experimental evidence also showed that N.
ceranae infections, but not N. apis, may actually cause CCD. Specifically, N. ceranae extracted
from infected hives and transmitted to healthy colonies have been found to induce the disease
and CDD. N. ceranae spores can also be isolated from these newly infected colonies, and their
multiplication has been reported to occur all year round, with no variations in pathology.
Fumagillin treatment is effective against CDD but does not prevent reinfection [79-81, 123, 124].
Despite the association of N. cerenae with CCD, neither the biology nor the genetics of this
organism are clearly understood. How did this parasite propagate so rapidly across the globe
from its eastern range, and what is its main mode of reproduction and virulence? To date,
investigations in this area have been restricted to the analysis of single gene sequences amplified
from infected apiaries, and resulted in contrasting claims. In particular, such studies have
revealed that beehives contain many variants of single gene sequences, regardless of their
geographical location [84, 87-91, 125], but the origin of this intra-hive sequence variability is
presently debated. For example, a number of studies have proposed that the high intra-hive
sequence variability around the globe results from the co-existence of highly diverse N. ceranae
populations within infected beehives [87, 89-91]. In these cases, the identification of numerous
recombinant sequences has also been proposed to result from outcrossing events. Depending on
the studies and the genes analysed, recombination has been proposed to be either abundant in
these populations [87, 89, 90], or rare [84, 88]. In sharp contrast with the notion of sexual
25
reproduction, a recent multi-gene analysis of four N. ceranae populations isolated worldwide
(France, Morocco, Lebanon and Thailand) has proposed an alternative scenario for the
emergence of genetic variability in this parasite, which included a clonal mode of evolution and
the potential presence of an atypical nuclear state in this parasite (i.e., polyploidy) [84]. In
addition to studying the above-mentioned patterns, single gene analyses have been used to
reconstruct the phylogeography of N. ceranae. However, such attempts have all been severely
hampered by a lack of phylogenetically informative sites and an excess of intra-hive diversity
along these short regions of the genome. As a result, the phylogenetic relationships among global
populations of N. ceranae, and the means through which they rapidly spread across the globe are
currently unknown.
In the present study, we aimed to acquire conclusive knowledge regarding the genetics,
ecology and evolution of N. ceranae by investigating much larger portions of its genome. To this
end, we sequenced the complete genomes of eight N. ceranae isolates harvested at different
chronological times (2007-2011) and from eight distant geographic locations in five countries
(Argentina, France, Spain, USA, Croatia, and Turkey). Throughout this paper, the term isolates
will be defined as a population of spores isolated from one single beehive. This wealth of
sequence data was used to determine the extent, origin and nature of genetic diversity that exists
both within and among distant beehives infected by N. ceranae. In particular, we aimed to (i)
obtain long-awaited information regarding the ploidy of their atypical binucleated nucleus (e.g.,
the diplokaryon: two nuclei bound together within one nuclear endomembrane; [75]) by
determining the frequency of SNP and genotypes identified in each colony, (ii) acquire insights
into their mode of evolution (i.e., clonal or sexual?) by investigating patterns of linkage
disequilibrium and loss of heterozygosity, (iii) understand how these parasites have spread
26
around the globe (naturally or through human intervention?) by performing phylogenetic
reconstructions using sequence data isolated from each colony and (iv) identify the regions of
their genomes that may be subject to particular selective pressures by analysing diversity levels
exome-wide.
Results
A newly available N. ceranae genome reference: PA08_1199
To determine the extent of genetic diversity present both within and among our isolates, Illumina
reads were aligned against our newly assembled and annotated N. ceranae genome. Briefly, 100
bp paired-end reads from the isolate PA08_1199 (Supplementary Table 1) were assembled using
SPAdes v3.0, resulting in a contaminant-free assembly with a size 5.7 Mb (536 contigs, N50 =
42.5 kb). The number and size of contigs we obtained from N. ceranae compares very
favourably to previous assemblies obtained on microsporidian parasites (with the exception of
streamlined Encephalitozoon genomes), but also suggests the presence of a certain amount of
repetitions in this genome (mostly, transposable elements). This genome draft is available under
the accession number JPQZ01000000 (see Materials and Methods for additional details).
An older, publicly available genome draft of N. ceranae BRL01 (Maryland, US) acquired in
2009 by Cornman and collaborators with a different technology (454 pyrosequencing) was not
used in the primary analyses in order to (i) minimise false positives (i.e., SNP resulting from
sequencing and assembly errors and/or from redundancy/paralogy) and (ii) facilitate the
identification of allelic diversity within coding regions. Indeed, we found that mapping high
quality Illumina reads onto BRL01 resulted in false SNP calls associated with indels, artefactual
changes that can often result from 454 sequencing [126] and also in a 10% lower sequence
27
coverage compared to our Illumina -based assembly (PA08_1199, Supplementary Table 1). The
mean Phred quality of SNPs called against our own assembly is also higher than SNPs called
against BRL01 (492 vs. 677; Supplementary Figure 1). BRL01 has also been reported to contain
a number of incorrect annotations [37, 83] and includes 554 annotated pseudogenes not present
in our annotation that could directly affect our analyses (see
www.ncbi.nlm.nih.gov/genome/931?genome_assembly_id=31962). The PA08_1199 genome
annotation presented here harbours many more microsporidian orthologs than BRL01, only 29
pseudogenes (Supplementary Table 2) and its assembly is significantly less fragmented than
BRL01. The general characteristics of our assembly and annotation and that from Cornman et al.
(2009) are available (Supplementary Table 2).
Geographically distant isolates of N. ceranae harbour and share an extensive amount of polymorphism
Aligning Illumina reads against our assembly revealed on average roughly 22% of the genome to
be present in more than one copy based on sequencing depth (Figure 1). By focusing on regions
showing average coverage, we found extensive intra-isolate variation in all of our samples
(Figure 1). On average, 56,525 variable sites per isolate could be identified (62,930 sites using
BRL01 as a reference; Supplementary Figure 2), representing 1.27% of non-duplicated regions
of the N. ceranae genome (3.63% if we do not exclude duplicated regions). These levels of
molecular diversity are on the high end when compared to similar reports from other
microsporidians and fungi (0.10-1.22% in Nematocida spp., 0.001% in Encephalitozoon
cuniculi, 0.26-0.30% Candida albicans, 0.067% Puccinia striiformis) [13, 44, 127-129].
28
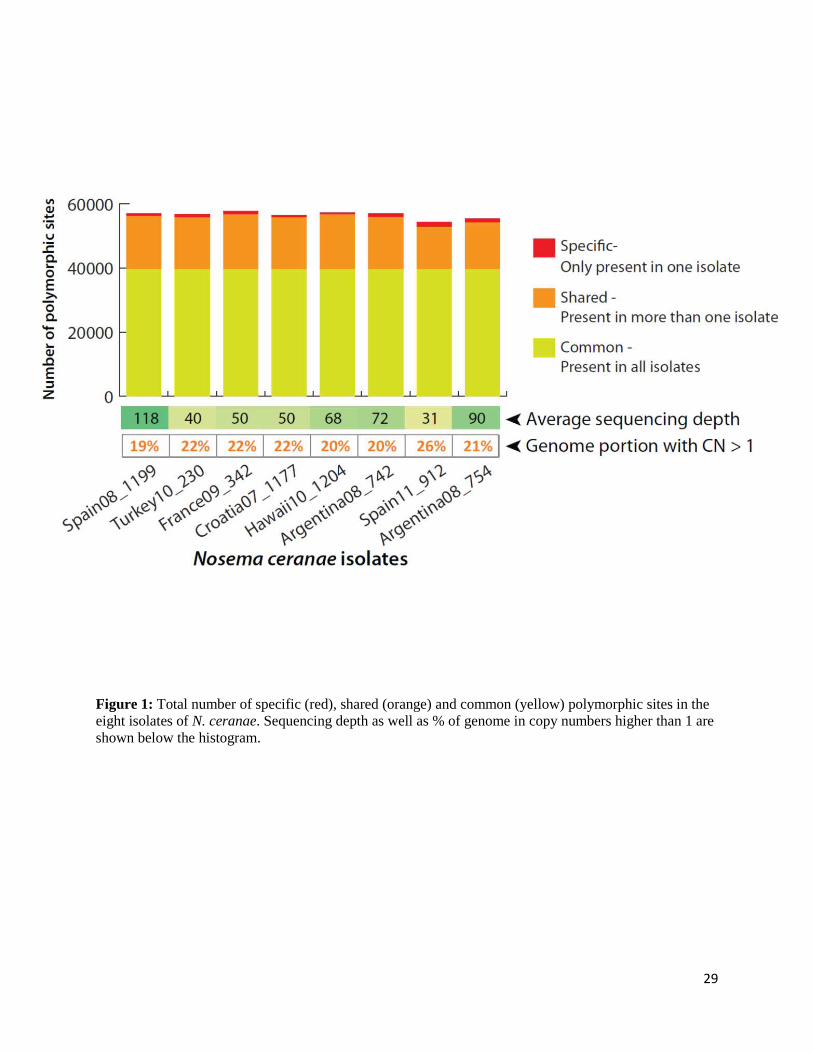
Figure 1: Total number of specific (red), shared (orange) and common (yellow) polymorphic sites in the eight isolates of N. ceranae. Sequencing depth as well as % of genome in copy numbers higher than 1 are shown below the histogram.
29
Remarkably, > 98% of the detected polymorphism is shared among at least two of the
isolates we analysed, regardless of the assembly used (70% of total diversity is shared among all
isolates, 28% shared by at least two isolates, and only 2% is isolate-specific). A subset of the
shared polymorphism we detected here has also been reported by others in N. ceranae isolates
from other geographical areas (Thailand, Morocco, Lebanon and France; Supplementary Table
3; [84]. Furthermore, inspection of host mtDNA (i.e., honeybee) present in our samples also
revealed that each of the isolates we analysed originated from genetically distinct hives
(Supplementary Figure 3). These latter results confirm that the shared polymorphism in our
samples does not result from either cross-contamination during DNA extraction and/or sample
mixing during the production of multiplexed Illumina libraries.
Loss of heterozygosity and genes affected by heterozygosity in N. ceranae isolates
To gather insights into the genome evolution of our isolates and to determine if the accumulation
of substitutions affects particular regions of our isolates, our genome data were assessed for loss
of heterozygosity (LOH), structural changes (i.e., copy number variation) or an atypical degree
of diversity in single copy genes. LOH usually results from mitotic recombination, gene
exchange, chromosome loss or introgression [130]. The presence of such events in our samples
may indicate that one or more of these evolutionary important events are occurring in N.
ceranae, resulting in important insights into their basic biology. In fungi, such events have been
found to affect between 250 kb to 1.2 Mb in C. albicans [129], 200 kb to 2.2 Mb in B.
dendrobatidis [131] or 75 kb to 350 kb in Nematocida spp. [13]. In C. neoformans, LOH can
also involve both whole and partial chromosome loss [132]. Interestingly, in N. ceranae, regions
with LOH are both very rare and shared among our isolates, highlighting again the high genetic
30

similarity of our samples. These involve a maximum window of 33 kb with SNP densities
ranging from 0.125 to 2.45 SNPs/kb (Supplementary Figure 4) in all of our isolates, compared to
a genome average of 13 SNPs/kb.
We also sought if patterns of diversity vary across the N. ceranae exome. For each predicted
protein-coding gene, Watterson’s θ was estimated from our NGS data using an algorithm
adapted to pool-seq implemented in PoPoolation (see Materials and Methods). The exome-wide
average θ equals 0.0039, with individual genes showing a highly skewed distribution (Figure 2A;
Supplementary Table 4). Overall, some genes in the top percentile (27 ORFs with θ > 0.0340,
Figure 2A) were found to contain repeated motifs (e.g., M715_870006810, M715_7900016233,
M715_6500015342), possibly inflating actual diversity. Interestingly, the top 10% most diverse
genes (266 ORFs with θ > 0.0079, Figure 2A) included many predicted hypothetical proteins
unique to N. ceranae (only 16 out of 266 ORFs were found to have orthologs in other species,
Figure 2B-D, Supplementary Table 5).
31
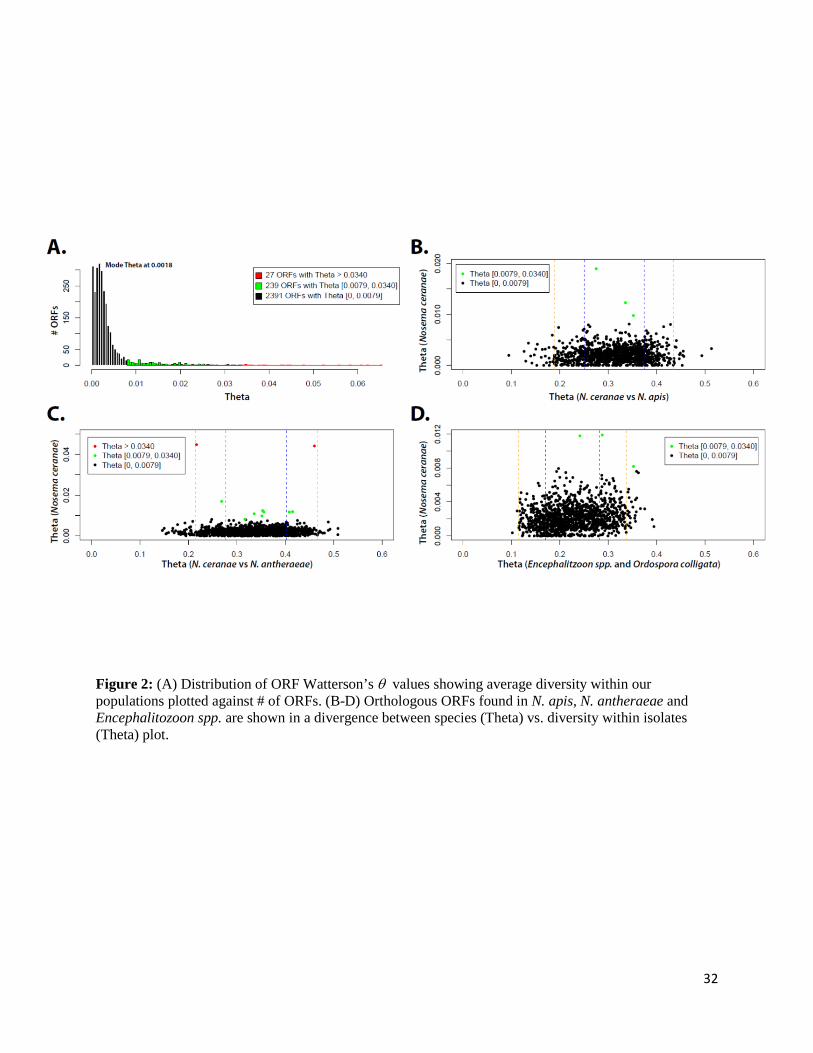
Figure 2: (A) Distribution of ORF Watterson’s θ values showing average diversity within our populations plotted against # of ORFs. (B-D) Orthologous ORFs found in N. apis, N. antheraeae and Encephalitozoon spp. are shown in a divergence between species (Theta) vs. diversity within isolates (Theta) plot.
32
Most polymorphisms suggest the presence of a polyploid diplokaryon in our N. ceranae isolate
In the present study, we demonstrated that the atypically high genetic polymorphism in N.
ceranae is widespread across the genome and is widely shared among geographically distant
isolates of this species. Preliminary investigations into the nature of this variation exposed a
pattern of polymorphism that deviates from the typical 50/50 heterozygosity found in other
microsporidia [13, 44]. Specifically, phasing our reads using FreeBayes [103] revealed regions
which were found to harbour up to four possible haplotypes (minimum haplotype frequency of
10%), suggesting the presence of mixed populations in our samples. Remarkably, however, allele
frequency plots of all SNP were found to follow a trimodal distribution, with peaks at 0.25, 0.5
and 0.75 in all isolates with sufficient coverage, suggesting that variation is highly structured in
our samples (Figure 3A, Supplementary Figure 5). In particular, the peaks at 25, 50, and 75%
(Figure 3A) could represent SNPs segregated across four different chromatids. In a diploid, a
unimodal distribution would be expected, with a peak at 50%. In a haploid, no peaks should be
observed. All reads used in these analyses map exclusively to the N. ceranae assembly, and this
non-random trimodal distribution is also confirmed using previously published assemblies
(Supplementary Figure 6) and assembly-independent approaches applied by others to assess
ploidy (“k-mer” distribution curves, Figure 3B, Supplementary Figures 7 and 8; [133-136]. The
latter analysis is based on abundance and coverage of unique 23-mers (23-mer coverage), where
each plot shows amount of unique 23-mers at various 23-mer coverage values. The left side of
the graph reveals a high number of 23-mers with very low coverage, most likely representing
sequencing errors. The 3 distinct peaks, with coverage values in a 1:2:4 ratio represent,
respectively 23-mer genotypes with frequencies of 25%, 50% (heterozygous genotypes with
specific and conserved frequencies in the population) and 100% (homozygous 23-mer genotypes
33
in the population). These analyses also suggest that the diversity we found in each hive is very
structured, and possibly intragenomic.
34
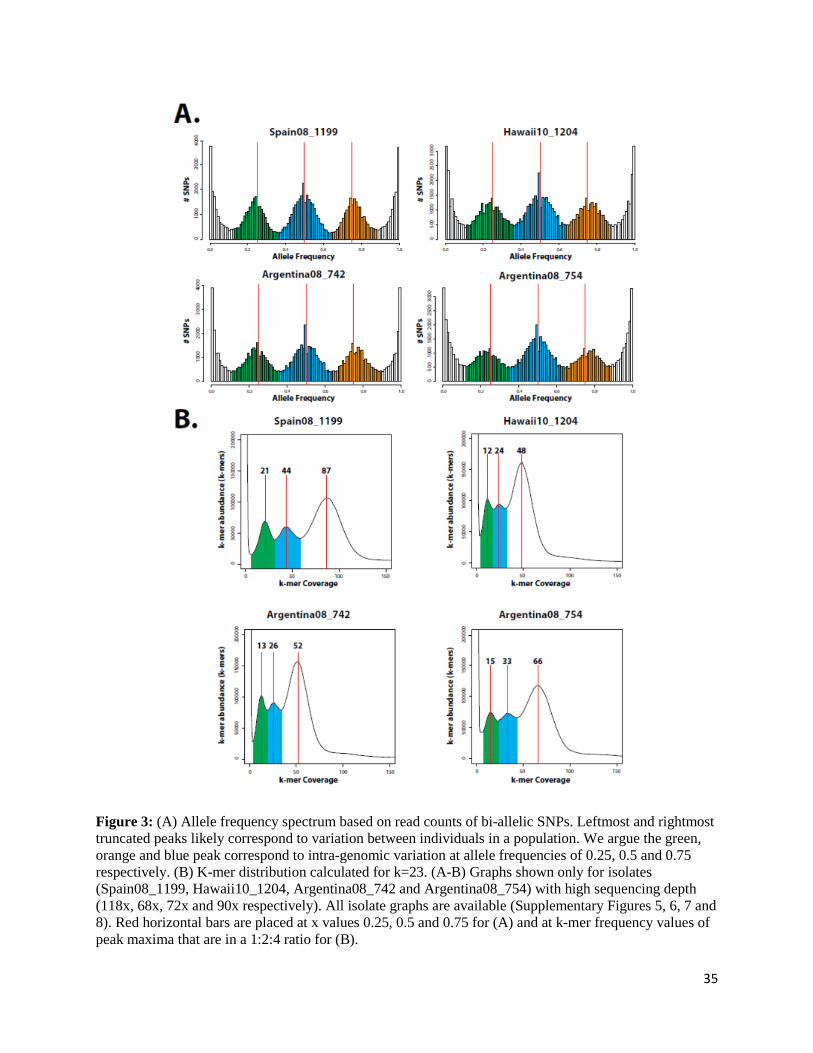
Figure 3: (A) Allele frequency spectrum based on read counts of bi-allelic SNPs. Leftmost and rightmost truncated peaks likely correspond to variation between individuals in a population. We argue the green, orange and blue peak correspond to intra-genomic variation at allele frequencies of 0.25, 0.5 and 0.75 respectively. (B) K-mer distribution calculated for k=23. (A-B) Graphs shown only for isolates (Spain08_1199, Hawaii10_1204, Argentina08_742 and Argentina08_754) with high sequencing depth (118x, 68x, 72x and 90x respectively). All isolate graphs are available (Supplementary Figures 5, 6, 7 and 8). Red horizontal bars are placed at x values 0.25, 0.5 and 0.75 for (A) and at k-mer frequency values of peak maxima that are in a 1:2:4 ratio for (B).
35

Altogether, analyses of SNP frequencies and k-mer distributions indicate that the vast
majority of parasite molecular diversity typically found within infected beehives is highly
structured and may result from the presence of polyploidy in N. ceranae (at least tetraploidy, or
two heterozygous diploid nuclei), rather than from the co-existance of diverse strains within
beehives. However, consistent with previous studies based on single-gene analyses [84, 87],
SNPs with lower frequencies (i.e., mostly singletons) were also found in our samples (see the
left- and rightmost truncated peaks Figure 3A). Although singletons most likely include many
sequencing errors [93], these could partially represent bona-fide polymorphism (i.e., SNPs and
indels) originating from inter-individual variation within our samples.
Linkage disequilibrium analyses in eight populations of N. ceranae
Previous attempts to study the mode of reproduction of N. ceranae have resulted in conflicting
claims. For example, the presence of recombinant cloned sequencing products in various genes
(SSU-rDNA, Enp1B, PTP, etc.) amplified by PCR have been proposed to mirror both frequent
[87, 89, 90] and rare [88] events of recombination, but other analyses based on identical
methodologies have also suggested a mainly clonal mode of reproduction in this parasite [84].
So, is N. ceranae clonal or sexual?
To address this question, our sequence data were explored for the presence of linkage
disequilibrium (LD) using LDx [105]. This approach phases pairs of bi-allelic SNPs at distances
smaller than the average insert size (~250 bp) of our paired-end reads, allowing for the
identification of haplotypes along short regions of our genome. Then r2 values were calculated by
comparing expected haplotype frequencies from allele frequencies to observed haplotype
frequency (see Materials and Methods).
36

These analyses revealed LD levels that are relative high [137], with a mean r2 of 0.6087 (±
0.3953; Figure 4; Supplementary Figure 9). These r2 values are lower than those found in clonal
isolates of C. albicans (mean r2 = 0.88) [138] but are similar to those of other predominantly
clonal pathogens (Leishmania sp. r2 = 0.63; B. dendrobatidis CH r2 = 0.58) [133, 139] (Figure 4;
Supplementary Figure 9). Notably, in the vast majority of cases, variations in r2 along the
genome appear to be extremely conserved among isolates, suggesting that regions of low LD
have accumulated recombination events prior to the divergence of our samples. In addition to
these findings, LD proved to be extremely stable along our short reads (Supplementary Figure
10). While this result does not preclude LD decay at bigger distances, it suggests that distances
of up to 200 bp between pairs of SNPs exhibit little to no recombination breaking haplotypes
apart. It is also noteworthy that the high LD values we obtained may have also resulted from
other processes, such as selection, genetic drift, population expansion and admixture.
37
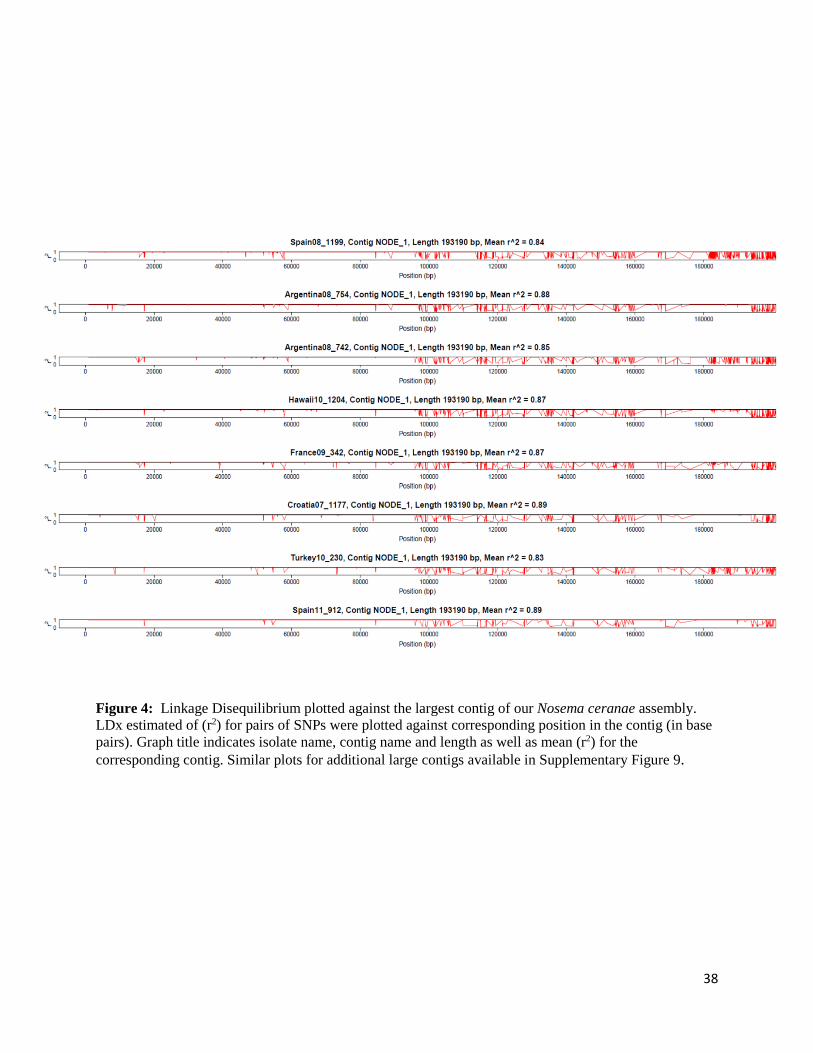
Figure 4: Linkage Disequilibrium plotted against the largest contig of our Nosema ceranae assembly. LDx estimated of (r2) for pairs of SNPs were plotted against corresponding position in the contig (in base pairs). Graph title indicates isolate name, contig name and length as well as mean (r2) for the corresponding contig. Similar plots for additional large contigs available in Supplementary Figure 9.
38
Incongruence between the evolutionary relationships of our isolates and their current geographical location
The excess of intra-isolate diversity in N. ceranae populations has hampered previous attempts to
reconstruct a supported global phylogeograhy of these parasites. To circumvent these issues, we
decided to investigate the evolutionary relationships of our isolates using information from their
genome-wide shared heterozygous (shared alleles) and homozygous (isolate-specific divergence)
polymorphisms.
To this end, we used a phylogenetic reconstruction approach based on allele frequency data,
the Population Split Pattern Analysis implemented in TreeMix (Supplementary Table 6; [111].
The resulting phylogeny resolved two main clades with very strong support, all of which are
composed of isolates of various geographical origins – e.g., the Croatia isolate cluster with
relatives from Hawaii and Argentina, respectively (Figure 5A). Note that isolates originating
from the same country were collected in geographically distant areas: ~900 km between
Argentinian isolates from Lobos and Bonpland and ~50 km between the Spanish isolates from
Pinilla and Villaseca de Uceda (Supplementary Table 1). These samples from areas of identical
toponymy are clearly not closely related as they locate at distant positions within the
phylogenetic trees (Figure 5). An independent confirmation of the lack of phylogeographic
pattern (or isolation by distance) in our data was also obtained using maximum likelihood,
Bayesian approaches and multispecies coalescent models implemented in *BEAST [117]. In this
case, SNP data were extracted from their respective genomic location, assembled into strain-
specific haplotypes (see Supplementary Note 1) and the resulting alignments were used for
phylogenetic analyses (Figure 5B, Supplementary Figure 11). Finally, parallel phylogenetic
analyses based on the host mitochondrial DNA isolated from the same samples also failed to
39
reveal any link with the geographical origin of the hives and the parasites, exposing a complete
absence of host-parasite co-evolutionary processes in all our isolates (Supplementary Figure 3).
40
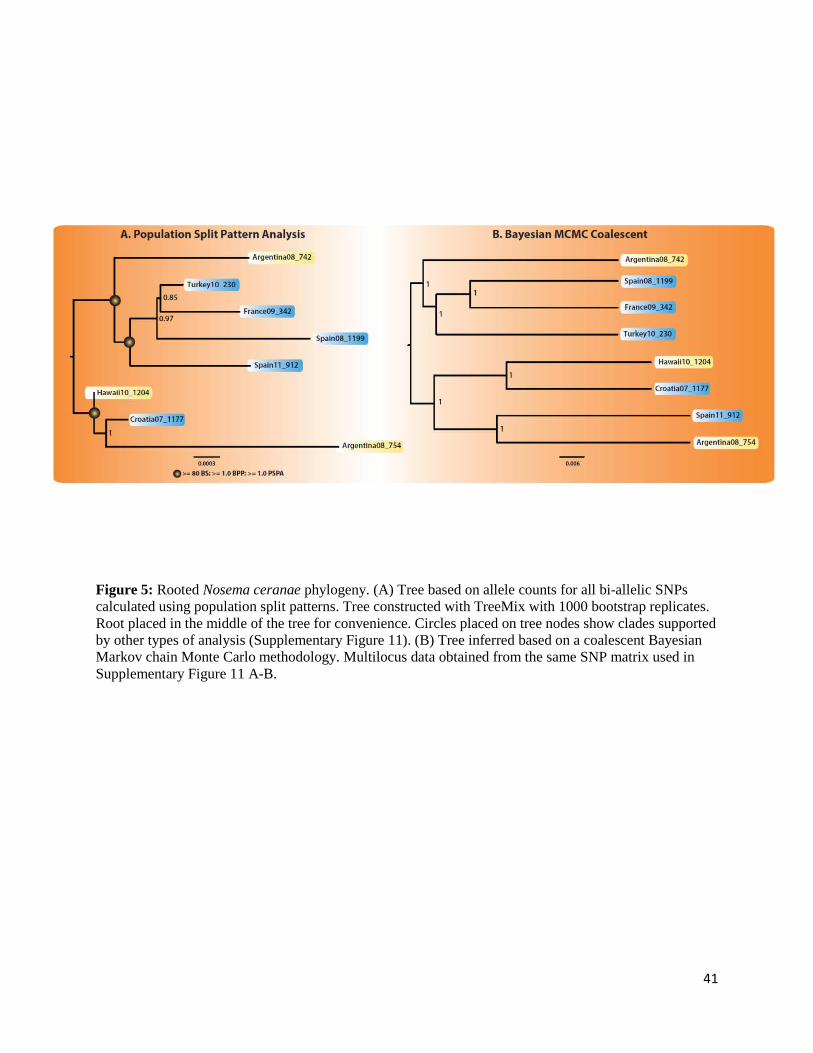
Figure 5: Rooted Nosema ceranae phylogeny. (A) Tree based on allele counts for all bi-allelic SNPs calculated using population split patterns. Tree constructed with TreeMix with 1000 bootstrap replicates. Root placed in the middle of the tree for convenience. Circles placed on tree nodes show clades supported by other types of analysis (Supplementary Figure 11). (B) Tree inferred based on a coalescent Bayesian Markov chain Monte Carlo methodology. Multilocus data obtained from the same SNP matrix used in Supplementary Figure 11 A-B.
41
Discussion While the present study confirms that global populations N. ceranae harbour extreme levels
of genetic diversity, it also provides us with long awaited insights into its origin and on the
overall biology of this parasite. First, by analysing the frequency and coverage of the various
parasite genotypes found in infected beehives, we showed that geographically distant isolates
share a vast amount of polymorphism whose origin is possibly intragenomic (i.e. N. ceranae is
either at least tetraploid, or the Diplokaryon is composed of two divergent diploid nuclei). This is
in sharp contrast with the notion that beehives are infected by highly diverse populations of N.
ceranae, although rare alleles unique to each of our samples are also found. Given these results,
we argue that beehives around the globe can be potentially infected by a population of
individuals that are polyploid and genetically homogeneous.
Evidence for polyploidy in this parasite also suggests that the diplokaryon, an atypical bi-
nucleated nucleus found in N. ceranae and many other microsporidia, may not be diploid, as
previously suggested [140-142]. Importantly, the presence of tetraploidy in the diplokaryons is
not a complete biological novelty, as it has been previously reported to exist in the diplomonad
intracellular parasite, Giardia lamblia [143, 144]. Future studies of genomic diversity in
microsporidians should therefore account for the potential presence of polyploidy in some
species of the group. Flow cytometry may also be considered to confirm the presence of
polyploidy in microsporidia, although its application to intracellular parasites is very
challenging.
Secondly, our study has shown that our isolates diverged into two main clades, which include
geographically unrelated samples. Although the relatively low sampling of our study does not
allow broad conclusions about the global N. ceranae populations, the phylogenies we recovered
42

suggest that our isolates have been introduced into their current locations, possibly through
commercial exchange of infected honeybee colonies, hive structures or royal jelly, or by means
of corbicular pollen – all cases where viable spores of N. ceranae have been recorded [77, 145-
149].
Our data also support a recent demographic expansion, at the global scale, of our sampled
parasite. This is highlighted by the presence of very little isolate-specific homozygous sequence
divergence and their extensive allelic similarity. Interestingly, recent population expansions are
usually followed by accumulation of rare alleles at very low frequencies, a phenomenon that we
observed across all our dataset (over 44% of alleles with frequencies lower than 5% are unique to
each strain), although these may also result from temporal changes in genotype frequencies and
geographical differentiation between hives.
Finally, our study also reveals that our isolates may be evolving through a clonal mode of
evolution. Specifically, we found no evidence of genetic exchange among our samples, and all
signatures of linkage equilibrium we identified are ancestral (i.e., occurred before the separation
of our isolates). Overall, our genome-wide patterns of diversity appear to support the presence of
clonal evolution in this parasite, and include the presence of extreme fixed heterozygosity and
shared LOH, conserved allele frequencies, and LD levels similar to other clonal fungal
pathogens. The presence of clonal reproduction in our N. ceranae isolates is also supported by
previous reports of binary divisions in this parasite, and by the absence of an observable meiotic
cycle [75]. Given that our eight isolates were harvested globally, it is intriguing to speculate that
the patterns of evolution we observed are conserved in other global populations of this bee
pathogen. The alternative is that the five-year span that separates the collection of our isolates
has been too short to allow meaningful events of gene exchange and recombination to appear.
43

Acknowledgments We are grateful to Raquel Martin Hernandez, Mariano Higes, Soledad Sagastume and Nuno
Henriques-Gil for providing us with isolates of infected honeybees as well as V. Albendea, T.
Corrales, M.C. Rogerio and M.C. Abascal from Centro Apícola Regional de Castilla La Mancha
for technical support in sample treatment. We thank Timothy Y. James and Alex Wong for the
critical comments suggestions on previous analyses and on earlier versions of this manuscript,
and Eric Peyretaillade for help with genome annotation. The authors would also like to also
thank three anonymous reviewers for valuable comments on an earlier version of this article. The
authors declare no competing interest. Nicolas Corradi is a Fellow of the Canadian Institute for
Advanced Research. This work was supported by the Discovery program from the Natural
Sciences and Engineering Research Council of Canada (NSERC-Discovery; to SAB and NC)
and an Early Researcher Award from the Ontario Ministry of Research and Innovation (to NC).
44
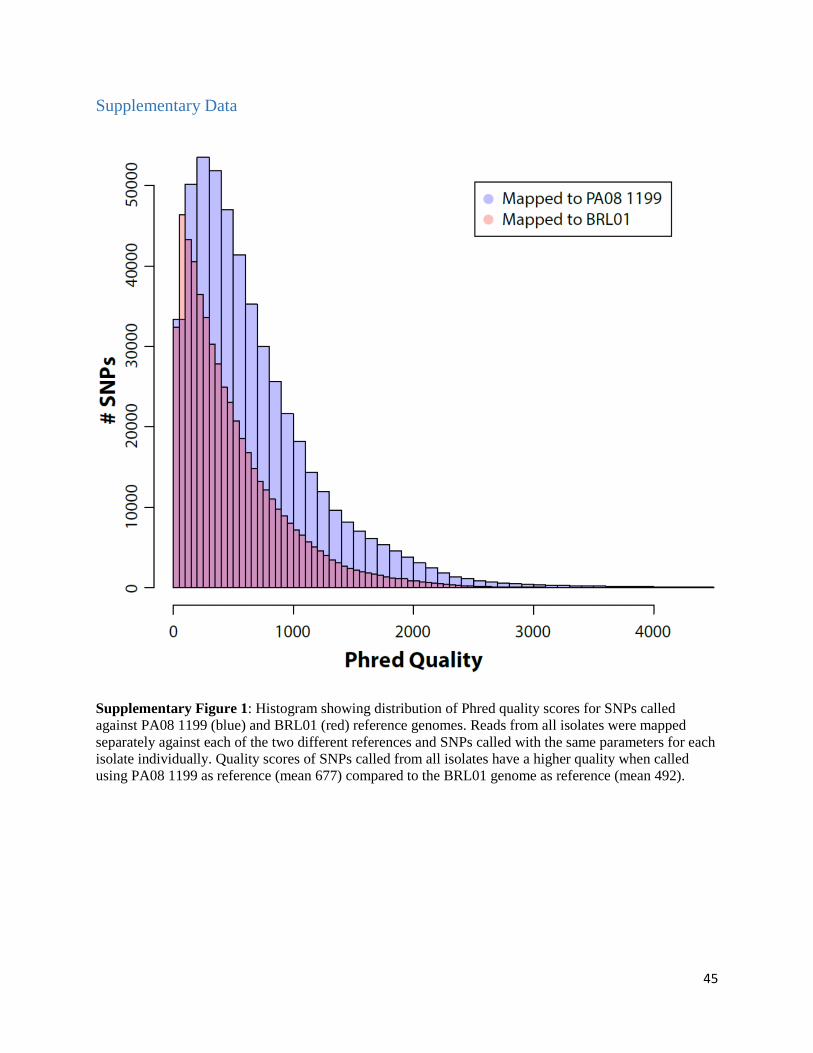
Supplementary Data
Supplementary Figure 1: Histogram showing distribution of Phred quality scores for SNPs called against PA08 1199 (blue) and BRL01 (red) reference genomes. Reads from all isolates were mapped separately against each of the two different references and SNPs called with the same parameters for each isolate individually. Quality scores of SNPs called from all isolates have a higher quality when called using PA08 1199 as reference (mean 677) compared to the BRL01 genome as reference (mean 492).
45
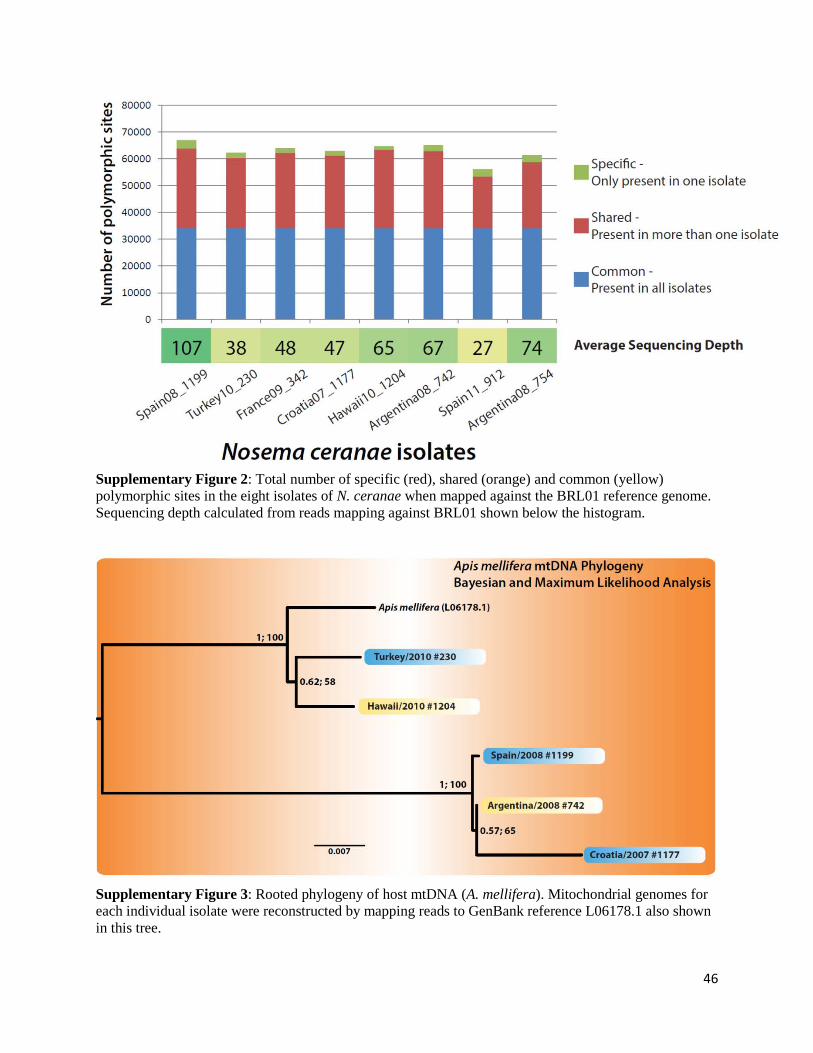
Supplementary Figure 2: Total number of specific (red), shared (orange) and common (yellow) polymorphic sites in the eight isolates of N. ceranae when mapped against the BRL01 reference genome. Sequencing depth calculated from reads mapping against BRL01 shown below the histogram.
Supplementary Figure 3: Rooted phylogeny of host mtDNA (A. mellifera). Mitochondrial genomes for each individual isolate were reconstructed by mapping reads to GenBank reference L06178.1 also shown in this tree.
46
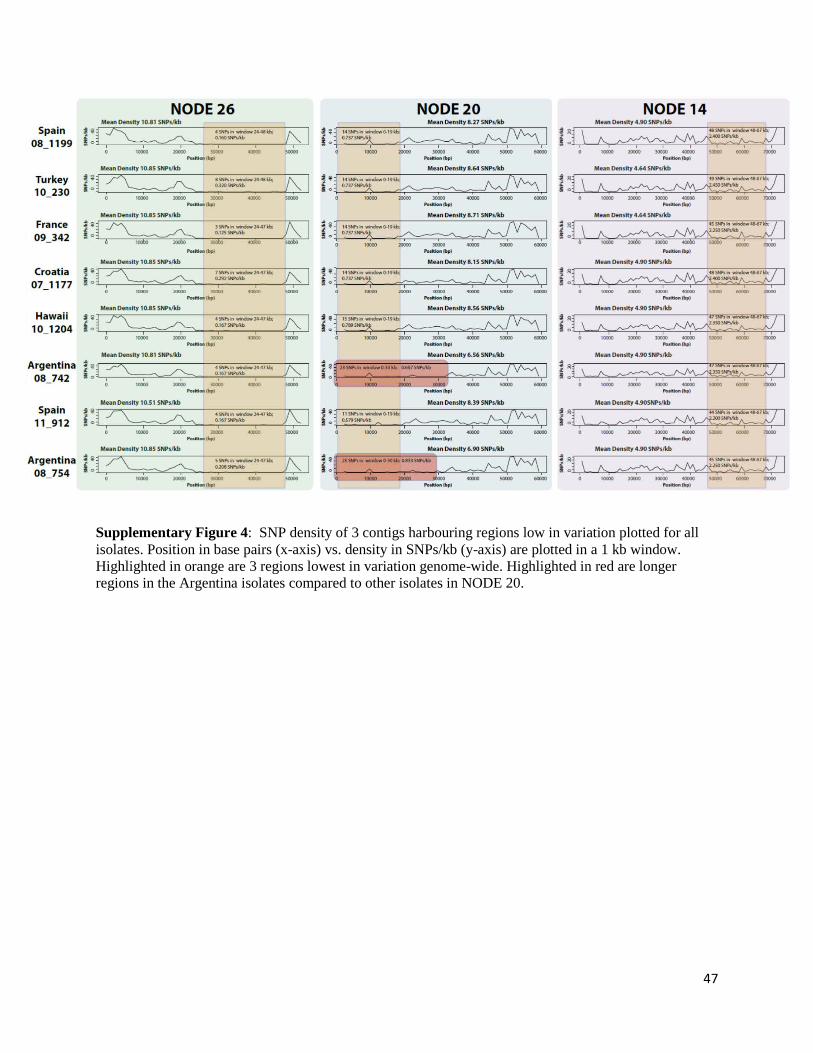
Supplementary Figure 4: SNP density of 3 contigs harbouring regions low in variation plotted for all isolates. Position in base pairs (x-axis) vs. density in SNPs/kb (y-axis) are plotted in a 1 kb window. Highlighted in orange are 3 regions lowest in variation genome-wide. Highlighted in red are longer regions in the Argentina isolates compared to other isolates in NODE 20.
47
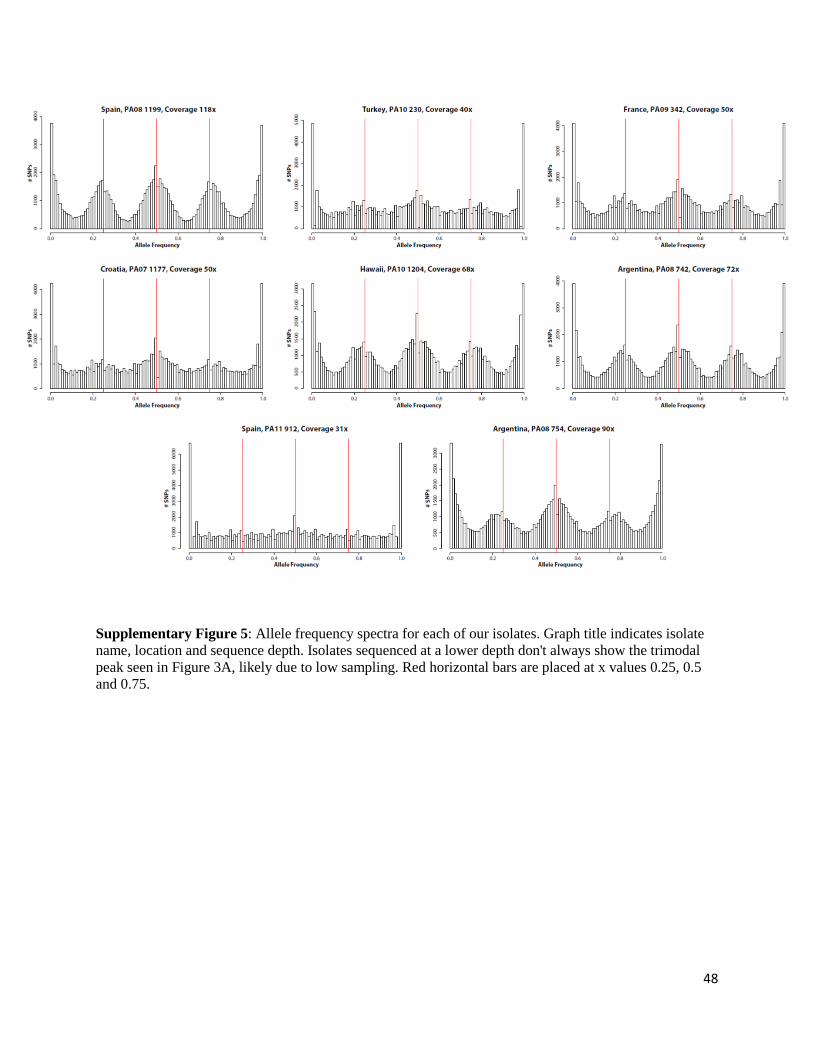
Supplementary Figure 5: Allele frequency spectra for each of our isolates. Graph title indicates isolate name, location and sequence depth. Isolates sequenced at a lower depth don't always show the trimodal peak seen in Figure 3A, likely due to low sampling. Red horizontal bars are placed at x values 0.25, 0.5 and 0.75.
48

Supplementary Figure 6: Allele frequency spectra for each of our isolates calculated after mapping reads to the BRL01 reference genome. Graph title indicates isolate name, location and sequence depth against the reference genome. Isolates sequenced at a lower depth don't always show the trimodal peak seen in Figure 3A, likely due to low sampling. Red horizontal bars are placed at x values 0.25, 0.5 and 0.75.
49
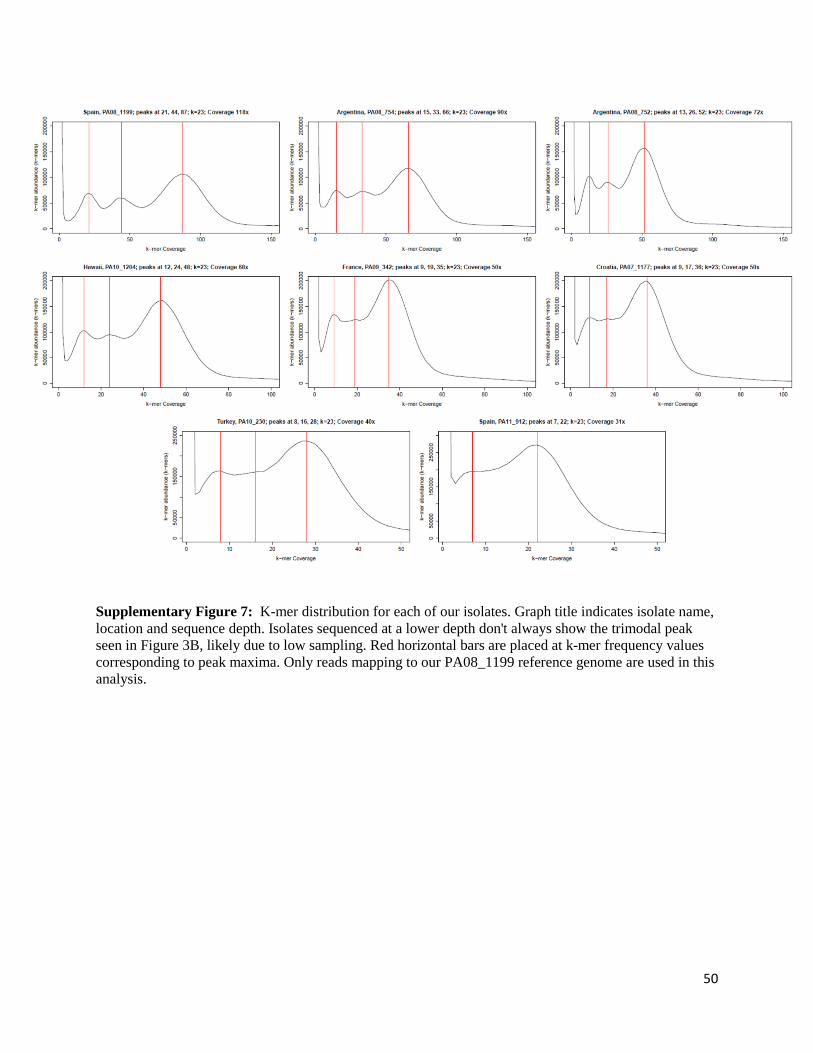
Supplementary Figure 7: K-mer distribution for each of our isolates. Graph title indicates isolate name, location and sequence depth. Isolates sequenced at a lower depth don't always show the trimodal peak seen in Figure 3B, likely due to low sampling. Red horizontal bars are placed at k-mer frequency values corresponding to peak maxima. Only reads mapping to our PA08_1199 reference genome are used in this analysis.
50
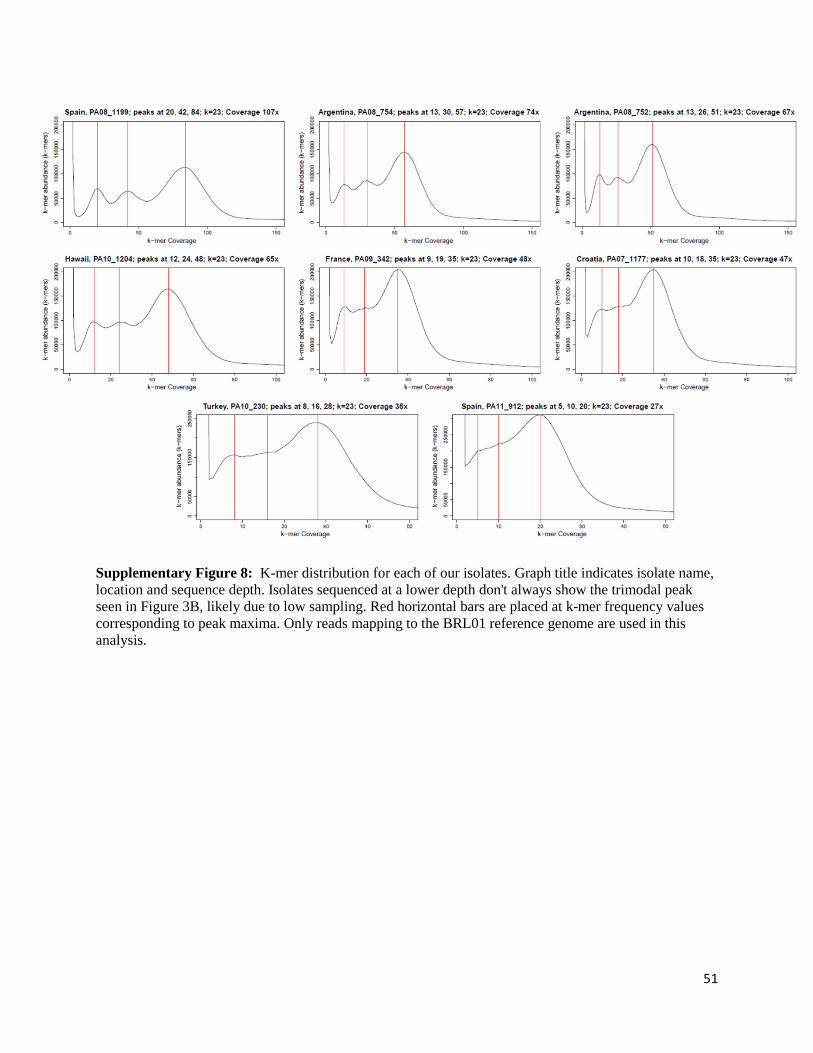
Supplementary Figure 8: K-mer distribution for each of our isolates. Graph title indicates isolate name, location and sequence depth. Isolates sequenced at a lower depth don't always show the trimodal peak seen in Figure 3B, likely due to low sampling. Red horizontal bars are placed at k-mer frequency values corresponding to peak maxima. Only reads mapping to the BRL01 reference genome are used in this analysis.
51
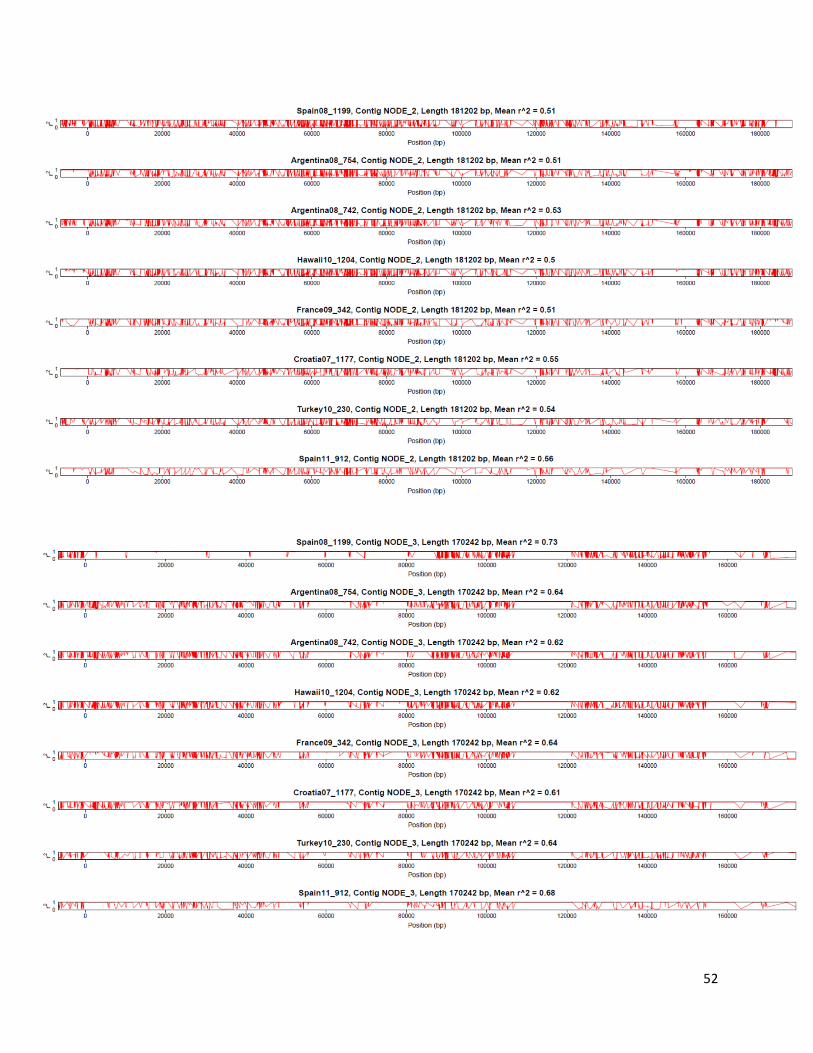
52
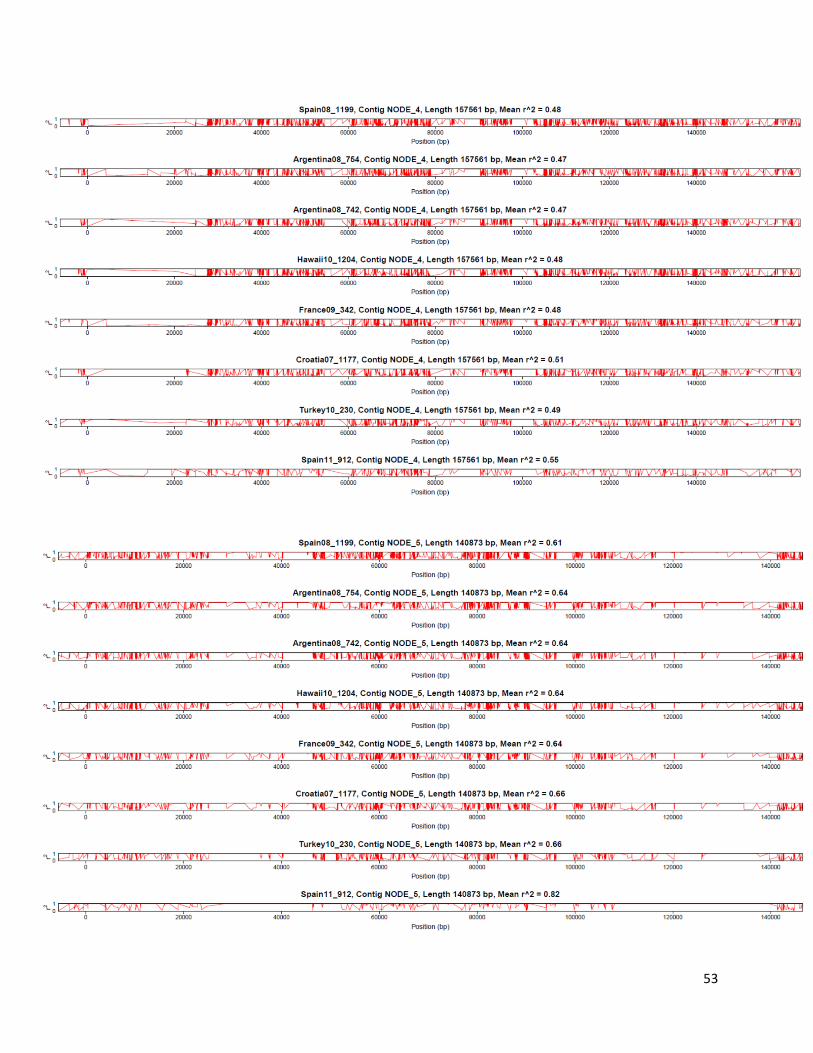
53

Supplementary Figure 9: Linkage disequilibrium plotted against four largest contigs of our Nosema ceranae assembly. LDx estimated of (r2) for pairs of SNPs were plotted against corresponding position in the contig (in base pairs). Graph title indicates isolate name, contig name and length as well as mean (r2) for the corresponding contig.
Supplementary Figure 10: Linkage disequilibrium decay showed by plotting r2 as a function of physical distance between pairs of SNPs using ggplot2 in R. Graph title indicates the isolate name, its mean sequencing depth, average r2 genome-wide, as well as the mean fragment size of sequenced DNA (distance between the first 5’ basepairs of the 2 paired-end reads). Grey area above and below the curve indicates standard deviation of r2 for a given physical distance.
54
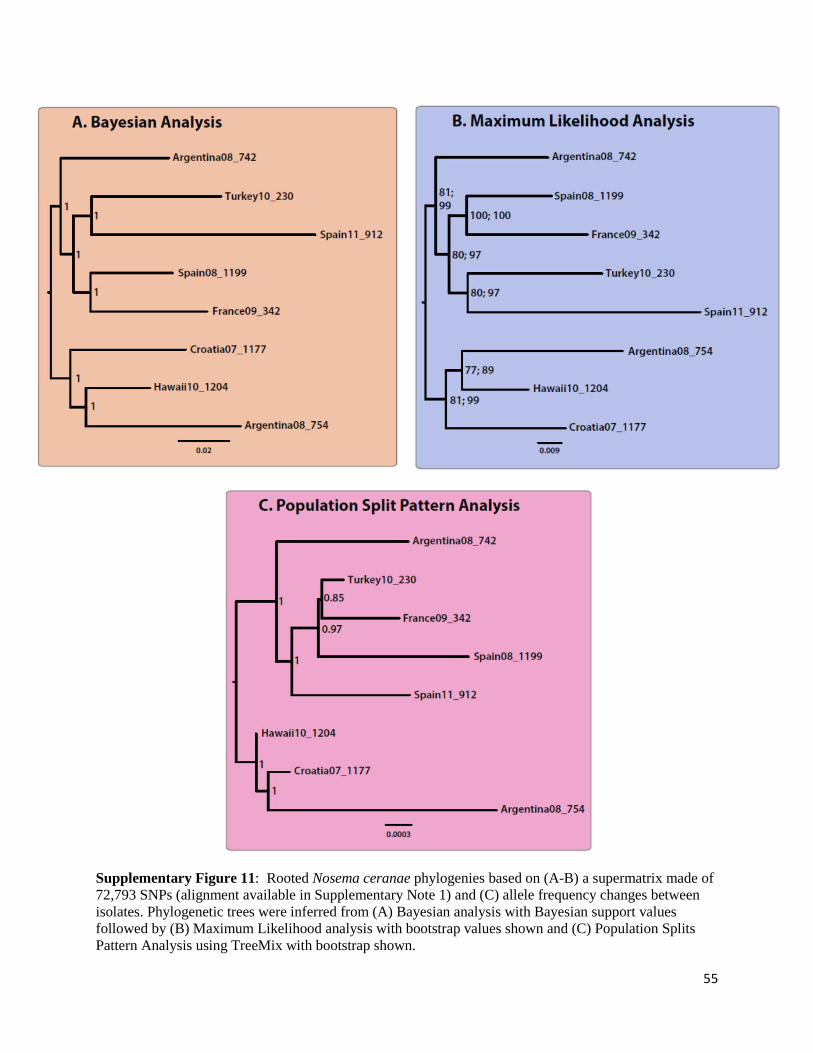
Supplementary Figure 11: Rooted Nosema ceranae phylogenies based on (A-B) a supermatrix made of 72,793 SNPs (alignment available in Supplementary Note 1) and (C) allele frequency changes between isolates. Phylogenetic trees were inferred from (A) Bayesian analysis with Bayesian support values followed by (B) Maximum Likelihood analysis with bootstrap values shown and (C) Population Splits Pattern Analysis using TreeMix with bootstrap shown.
55

Supplementary Figure 12: Haploid genome size estimation using k-mer analysis done on the all Spain08_1199 reads using k values of 23, 33 and 43. Amount of k-mers were counted under each peak for each histogram, and genome size was estimated by dividing amount of k-mers under peak #1 and peak #2 by 4 and 2 respectively before adding these numbers to amount of k-mers under peak #3. There is a trade-off between the k-mer size used to estimate the genome, with lower k-mers underestimating the genome size while higher k-mers overestimating it due to the difficulty of establishing peak boundaries.
56
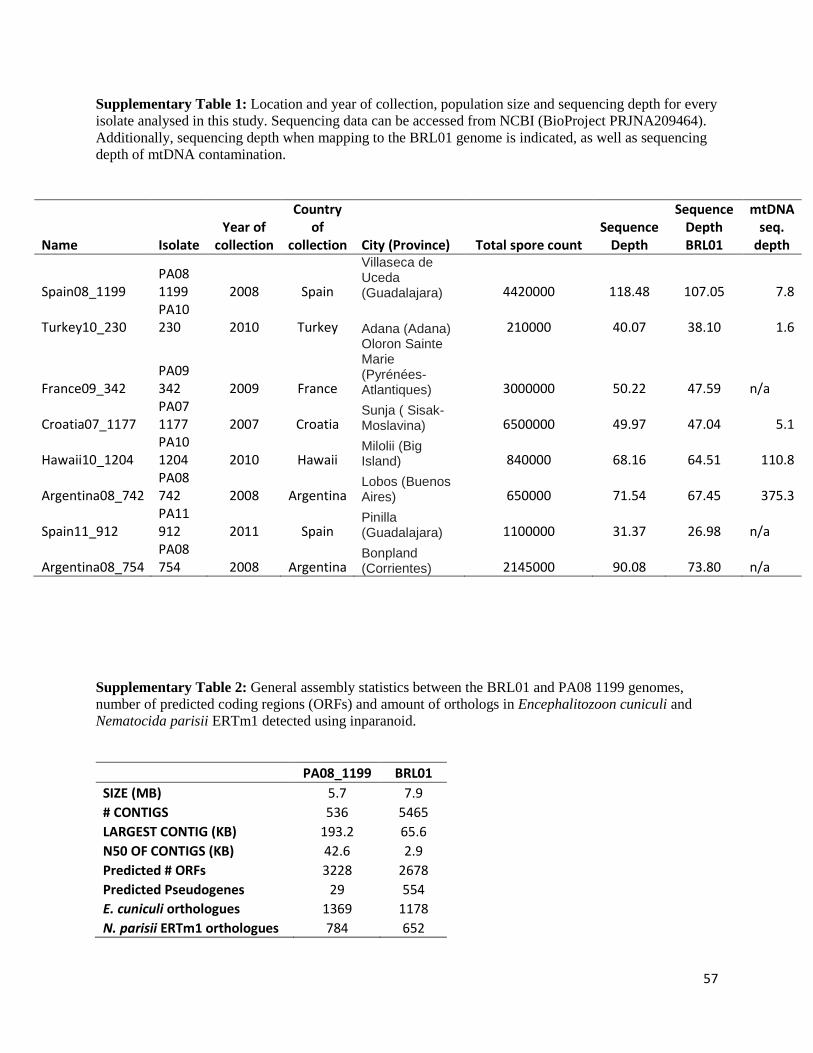
Supplementary Table 1: Location and year of collection, population size and sequencing depth for every isolate analysed in this study. Sequencing data can be accessed from NCBI (BioProject PRJNA209464). Additionally, sequencing depth when mapping to the BRL01 genome is indicated, as well as sequencing depth of mtDNA contamination.
Name Isolate Year of
collection
Country of
collection City (Province) Total spore count Sequence
Depth
Sequence Depth BRL01
mtDNA seq.
depth
Spain08_1199 PA08 1199 2008 Spain
Villaseca de Uceda (Guadalajara) 4420000 118.48 107.05 7.8
Turkey10_230 PA10 230 2010 Turkey Adana (Adana) 210000 40.07 38.10 1.6
France09_342 PA09 342 2009 France
Oloron Sainte Marie (Pyrénées-Atlantiques) 3000000 50.22 47.59 n/a
Croatia07_1177 PA07 1177 2007 Croatia
Sunja ( Sisak-Moslavina) 6500000 49.97 47.04 5.1
Hawaii10_1204 PA10 1204 2010 Hawaii
Milolii (Big Island) 840000 68.16 64.51 110.8
Argentina08_742 PA08 742 2008 Argentina
Lobos (Buenos Aires) 650000 71.54 67.45 375.3
Spain11_912 PA11 912 2011 Spain
Pinilla (Guadalajara) 1100000 31.37 26.98 n/a
Argentina08_754 PA08 754 2008 Argentina
Bonpland (Corrientes) 2145000 90.08 73.80 n/a
Supplementary Table 2: General assembly statistics between the BRL01 and PA08 1199 genomes, number of predicted coding regions (ORFs) and amount of orthologs in Encephalitozoon cuniculi and Nematocida parisii ERTm1 detected using inparanoid.
PA08_1199 BRL01 SIZE (MB) 5.7 7.9 # CONTIGS 536 5465 LARGEST CONTIG (KB) 193.2 65.6 N50 OF CONTIGS (KB) 42.6 2.9 Predicted # ORFs 3228 2678 Predicted Pseudogenes 29 554 E. cuniculi orthologues 1369 1178 N. parisii ERTm1 orthologues 784 652
57

Supplementary Table 3: Single copy genes cloned from 4 isolates by Roudel et. al are screened for polymorphisms and compared to isolates sequenced in this study. Seven single copy genes are shown in columns while different isolates are shown in rows. Values represent polymorphic loci found in a given gene/isolate combination while values in parenthesis indicate how many of these polymorphisms have been found in at least one other isolate. Morocco isolate lacks most polymorphisms present in other isolates for 4 of the genes. This might be due to low sampling since Morocco had an average of 5 clones per gene.
Isolate NCER (gene locus) (This study) 101165 100533 101590 100070 100064 100566 100828 Spain08_1199 6 (6) 0 (0) 3 (3) 10 (10) 1 (1) 6 (6) 0 (0) Turkey10_230 7 (7) 0 (0) 3 (3) 10 (10) 1 (1) 6 (6) 0 (0) France09_342 6 (6) 0 (0) 3 (3) 10 (10) 1 (1) 6 (6) 0 (0) Croatia07_1177 7 (7) 0 (0) 3 (3) 11 (11) 1 (1) 6 (6) 0 (0) Hawaii10_1204 7 (7) 0 (0) 3 (3) 11 (11) 1 (1) 6 (6) 0 (0) Argentina08_742 7 (7) 0 (0) 3 (3) 10 (10) 1 (1) 6 (6) 0 (0) Spain11_912 6 (6) 0 (0) 3 (3) 10 (10) 1 (1) 5 (5) 0 (0) Argentina08_754 7 (7) 0 (0) 3 (3) 11 (11) 1 (1) 6 (6) 0 (0) (Roudel et al.) France 7 (7) 0 (0) 3 (3) 10 (10) 1 (1) 5 (5) 0 (0) Lebanon 7 (7) 0 (0) 3 (3) 10 (10) 1 (1) 7 (6) 0 (0) Morocco 0 (0) 0 (0) 1 (1) 0 (0) 0 (0) 5 (5) 0 (0) Thailand 7 (7) 0 (0) 3 (3) 12 (10) 0 (0) 6 (6) 0 (0)
Supplementary Table 4: List of ORFs with corresponding population diversity values in each isolate as well as average value of all isolates. Population diversity was measured using Watterson’s θ, an estimator of population mutation rate computed as a normalized value of average amount of segregating sites in each ORF.
This table contains over 2000 rows, and was not included in this document since it would occupy over 65 pages. Data in this table is available in the online version of the manuscript or by contacting the corresponding author Nicolas Corradi at ncorradi [AT] uottawa.ca
Supplementary Table 5: Data used to plot Figure 2. Orthologs ORFs between N. ceranae and 3 other species shown, along with divergence values between species estimated using Watterson’s Theta. Theta estimates between Encephalitozoon species are taken from Pombert et al 2015.
This table contains over 2000 rows, and was not included in this document since it would occupy over 65 pages. Data in this table is available in the online version of the manuscript or by contacting the corresponding author Nicolas Corradi at ncorradi [AT] uottawa.ca
58
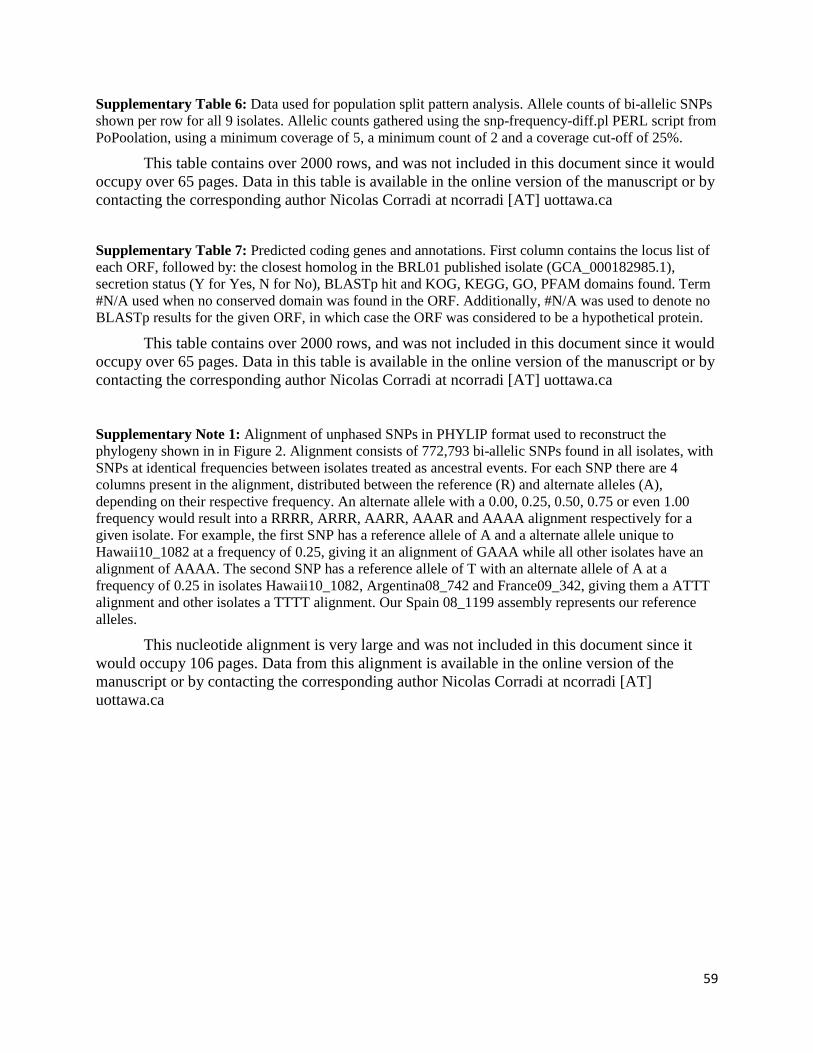
Supplementary Table 6: Data used for population split pattern analysis. Allele counts of bi-allelic SNPs shown per row for all 9 isolates. Allelic counts gathered using the snp-frequency-diff.pl PERL script from PoPoolation, using a minimum coverage of 5, a minimum count of 2 and a coverage cut-off of 25%.
This table contains over 2000 rows, and was not included in this document since it would occupy over 65 pages. Data in this table is available in the online version of the manuscript or by contacting the corresponding author Nicolas Corradi at ncorradi [AT] uottawa.ca
Supplementary Table 7: Predicted coding genes and annotations. First column contains the locus list of each ORF, followed by: the closest homolog in the BRL01 published isolate (GCA_000182985.1), secretion status (Y for Yes, N for No), BLASTp hit and KOG, KEGG, GO, PFAM domains found. Term #N/A used when no conserved domain was found in the ORF. Additionally, #N/A was used to denote no BLASTp results for the given ORF, in which case the ORF was considered to be a hypothetical protein.
This table contains over 2000 rows, and was not included in this document since it would occupy over 65 pages. Data in this table is available in the online version of the manuscript or by contacting the corresponding author Nicolas Corradi at ncorradi [AT] uottawa.ca
Supplementary Note 1: Alignment of unphased SNPs in PHYLIP format used to reconstruct the phylogeny shown in in Figure 2. Alignment consists of 772,793 bi-allelic SNPs found in all isolates, with SNPs at identical frequencies between isolates treated as ancestral events. For each SNP there are 4 columns present in the alignment, distributed between the reference (R) and alternate alleles (A), depending on their respective frequency. An alternate allele with a 0.00, 0.25, 0.50, 0.75 or even 1.00 frequency would result into a RRRR, ARRR, AARR, AAAR and AAAA alignment respectively for a given isolate. For example, the first SNP has a reference allele of A and a alternate allele unique to Hawaii10_1082 at a frequency of 0.25, giving it an alignment of GAAA while all other isolates have an alignment of AAAA. The second SNP has a reference allele of T with an alternate allele of A at a frequency of 0.25 in isolates Hawaii10_1082, Argentina08_742 and France09_342, giving them a ATTT alignment and other isolates a TTTT alignment. Our Spain 08_1199 assembly represents our reference alleles.
This nucleotide alignment is very large and was not included in this document since it would occupy 106 pages. Data from this alignment is available in the online version of the manuscript or by contacting the corresponding author Nicolas Corradi at ncorradi [AT] uottawa.ca
59
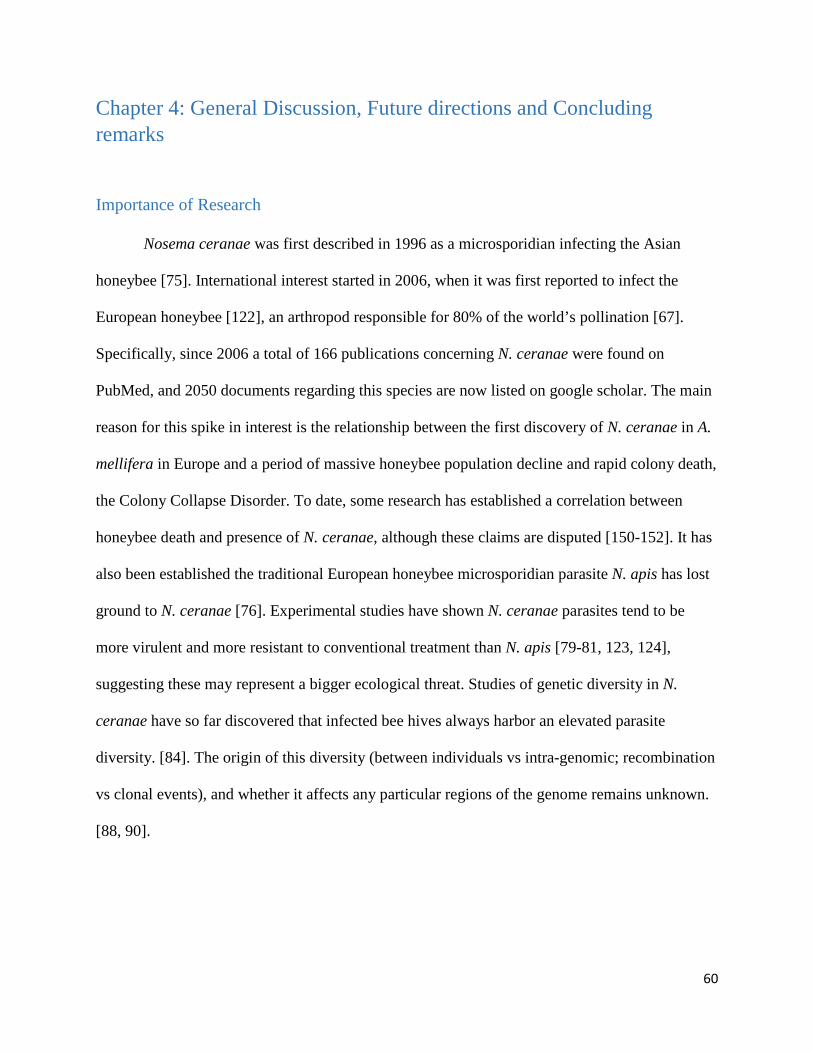
Chapter 4: General Discussion, Future directions and Concluding remarks
Importance of Research
Nosema ceranae was first described in 1996 as a microsporidian infecting the Asian
honeybee [75]. International interest started in 2006, when it was first reported to infect the
European honeybee [122], an arthropod responsible for 80% of the world’s pollination [67].
Specifically, since 2006 a total of 166 publications concerning N. ceranae were found on
PubMed, and 2050 documents regarding this species are now listed on google scholar. The main
reason for this spike in interest is the relationship between the first discovery of N. ceranae in A.
mellifera in Europe and a period of massive honeybee population decline and rapid colony death,
the Colony Collapse Disorder. To date, some research has established a correlation between
honeybee death and presence of N. ceranae, although these claims are disputed [150-152]. It has
also been established the traditional European honeybee microsporidian parasite N. apis has lost
ground to N. ceranae [76]. Experimental studies have shown N. ceranae parasites tend to be
more virulent and more resistant to conventional treatment than N. apis [79-81, 123, 124],
suggesting these may represent a bigger ecological threat. Studies of genetic diversity in N.
ceranae have so far discovered that infected bee hives always harbor an elevated parasite
diversity. [84]. The origin of this diversity (between individuals vs intra-genomic; recombination
vs clonal events), and whether it affects any particular regions of the genome remains unknown.
[88, 90].
60
Summary of novel findings
My thesis aimed to determine the nature, extent and origin of parasite diversity found in
beehives by undertaking a whole genome, population-based approach for the first time. This has
resulted in a number of unexpected findings, all of which contrast with previous analyses of
diversity performed by others, and allowed us to obtain essential information on three main
biological aspects of the N. ceranae biology.
Diversity within and between hives To date, investigations into the diversity of this parasite were restricted to the analysis of
single copy genes with PCR followed by molecular cloning. Such approaches followed by
several groups found consistently elevated amounts of variation within single beehives,
regardless of the sample analyzed [84, 87-91, 125]. The origin of this diversity however remains
highly debated, and is usually attributed to ploidy, recombination and divergent strains infecting
one beehives colony.
In agreement with other groups, I have found each population of N. ceranae to have high
levels of variation. Moreover, my analysis showed this diversity to be present genome-wide,
affecting both coding and non-coding regions. I was also able to show that regions void of
variation, possibly due to loss of heterozygosity (LOH), are scarce and typically conserved
between isolates.
In addition to distribution of diversity, deep sequencing has also allowed me to analyze
the frequency of SNPs responsible for this diversity. My analysis showed most SNPs to have
frequencies of 25%, 50% and 75%, revealing an unexpected structure. This finding allowed me
to conclude that the main origin of this diversity is polyploidy (at least tetraploidy), a novel and
61
exciting finding in N. ceranae previously unreported in Microsporidia and overall rare in the
Fungal kingdom.
Demographic analysis show recent expansion Attempts at reconstructing the phylogeography of various N. ceranae isolates have
remained unsuccessful, largely due to absence of phylogeneticaly informative sites amid high
levels of variation [84]. I was able to overcome this obstacle by identifying genome-wide SNPs
shared between groups of isolates (presumably due to common ancestry) as well as SNPs unique
to particular isolates (isolate-specific divergence). Results showed over 70% of SNPs discovered
to be present in all sampled beehives. The remainder of SNPs consist of 28% shared by at least 2
isolates analysed and close to 2% to be isolate specific. These results suggest an unexpectedly
high degree of relatedness among geographically distant samples.
Using SNPs identified genome-wide, I was able to reconstruct a highly supported
phylogeny of the 8 isolates analysed. This analysis revealed for the first time lack of a
phylogeographic relationship between populations. For instance, isolates originating from the
same country, Spain and Argentina do not cluster together as expected. These findings suggest a
colonization by N. ceranae via non-natural means, such as human commercial exchange of bee-
hives. The little amount of isolate-specific differentiation also provides the first reliable evidence
that N. ceranae has only recently colonized a new niche and spread rapidly and globally.
Virulence genes Most experimental studies agree N. ceranae to have lethal effects on its host, such as
early maturation, disorientation and shortened lifespan [80]. Despite these detrimental effects on
62
honeybees, no molecular studies to date have been able to identify genes associated with
virulence.
In this respect, my work provides the first set of clues into genes potentially responsible
for the increased virulence of N. ceranae. By looking at the distribution of variation exome-wide,
I was able to identify genes which are more polymorphic than others in all isolates analyzed. My
results show that most such genes are specific to N. ceranae with no orthologs present in other
species. Furthermore, some of these genes contained secretion motifs, suggesting these are
important in host-parasite interactions and are potential virulence genes.
Evolution through clonal reproduction Reproduction in parasites is of interest to researchers as it can provide clues about the
general biology of the pathogen. Symptoms of clonal evolution typically include high Linkage
Disequilibrium (LD) as well as a star-phylogeny. Low linkage disequilibrium arises when
frequent recombination events create new combinations of alleles. Additionally, absence of gene
exchange (meiosis) leads to a star-phylogeny due to the continuous accumulation of mutations in
individual populations [153].
Single gene analyses of N. ceranae to date have revealed presence of recombination with
conflicting reports into its frequency and significance. While some studies identify
recombination levels resulting in low LD and suggesting frequent sexual reproduction, other
groups are more cautious in their interpretations [88, 90].
Using deep sequencing reads, I was able to phase near-by SNPs and investigate LD
patterns genome-wide. My analyses shows relatively high LD levels, comparable to those of
pathogens known to be predominantly clonal [133, 139]. Furthermore, genome-wide analysis of
LD in all isolates show correlated LD patterns with drops in LD in the same genomic location in
63
all isolates. These findings suggest that most signals of recombination are ancestral to all
isolates, and have accumulated prior to their divergence.
In disagreement with most groups, I believe N. ceranae populations to be reproducing
clonally, based on absence of significant recombination, a classic signatures of clonal evolution.
Perhaps the ancestor of our strains was able to undergo sexual reproduction, switching to an
asexual life-style and becoming epidemic. This strategy has been previously suggested in other
pathogens and even in microsporidia [154].
Further implications and directions
In order to better understand the biology of N. ceranae more samples need to be
analyzed. Although this study has sampled 8 populations from 6 distant geographical locations,
some continents (North America, Africa, Asia and Australia) are not included in our analysis.
These would be interesting to sample, as some geographical regions are more isolated than
others. Furthermore, strict legislation concerning commercial import of beehives in Australia,
makes it interesting to sample in order to determine the relatedness of N. ceranae parasites to
those colonizing other parts of the world.
We also know N. ceranae infects other hosts besides the European honeybee A. mellifera,
it is of interest for future studies to perform similar analyses on these hosts (i.e. the Asian
honeybee, the bumblebee, etc.). Since N. ceranae possesses the necessary meiotic machinery to
undergo sexual reproduction, recombination can be investigated in other niches (such as other
hosts).
64
The findings described in this study will facilitate future population analysis of N.
ceranae and other microsporidia by providing an important backbone. Firstly, future estimation
of recombination from NGS data can be compared to LD values reported in this study by using
similar methodologies. Such comparisons would allow to infer the significance of recombination
in other samples relative to those analyzed in this study. Secondly, the newly assembled
reference genome can be directly used in future samples. This is beneficial because of the much
higher contiguity of our assembly compared to previous assemblies, and because it allows SNPs
from other isolates to be directly comparable to ours, facilitating comparative analysis.
Third, our study describes new methodologies and approaches previously unused in
microsporidia. For instance, usage of two complementary approaches, k-mer graphs and allele
frequency plots, can be highly useful in indicating the ploidy of an organism. Our findings of
polyploidy in microsporidia warrants further investigation into other microsporidian species.
Indeed, almost all genome and diversity studies in the field have assumed microsporidia to be
either haploid or diploid. Our findings suggests that the potential presence of polyploidy and
perhaps aneuploidy should be expected in microsporidian research. Knowledge of ploidy is
helpful in SNP discovery, as most algorithms perform best when supplied ploidy as prior
information. Ploidy is also helpful in distinguishing between intra-genomic SNPs versus SNPs
between individuals when sequencing populations.
Lastly, our study shows high genome coverage (above 60x) along with high quality
sequencing is a requirement for investigations of variation and ploidy in novel species. Indeed,
the average coverage represents a misleading value, which should always be divided by the total
number of chromatids found in each microsporidian chromosome (in other words organisms of
higher ploidy need to be sequenced at higher coverage values). Furthermore, a high genome
65

coverage is needed for quality draft assemblies. Typically, higher coverage (i.e. sequencing
depth) can more reliably resolve repetitive regions and is less likely to contain assembly gaps,
resulting in higher levels of contiguity.
Concluding remarks
Although genome sequencing has allowed us to answer biological questions about N.
ceranae, some of our findings require further experimental studies. For instance, our study has
revealed the 10th percentile of the most diverse genes to be enriched in hypothetical proteins with
unknown function. These sometimes harbor secretion signals, and require further functional
analysis. They may be important in virulence and host manipulation and could be prime
candidates for drug targets. Given that current treatment of nosemosis is toxic to honeybees and
to the honey produced, novel and safer drugs for treatment are warranted. However, high
throughput analysis requires culturing this parasite in a cell line, efforts for which are already
underway [155]. Since isolates of N. ceranae investigated to date cause non-opportunistic
infections in honeybees, these can be a very useful model in further understanding host pathogen
interactions along with pathogen virulence.
‘
66
References
1. Keeling, P.J. and N.M. Fast, Microsporidia: biology and evolution of highly reduced intracellular parasites. Annu Rev Microbiol, 2002. 56: p. 93-116.
2. Heinz, E., et al., The genome of the obligate intracellular parasite Trachipleistophora hominis: new insights into microsporidian genome dynamics and reductive evolution. PLoS Pathog, 2012. 8(10): p. e1002979.
3. Panek, J., et al., Hijacking of host cellular functions by an intracellular parasite, the microsporidian Anncaliia algerae. PLoS One, 2014. 9(6): p. e100791.
4. Hampl, V., et al., Genetic evidence for a mitochondriate ancestry in the 'amitochondriate' flagellate Trimastix pyriformis. PLoS One, 2008. 3(1): p. e1383.
5. Delbac, F., et al., On proteins of the microsporidian invasive apparatus: complete sequence of a polar tube protein of Encephalitozoon cuniculi. Mol Microbiol, 1998. 29(3): p. 825-34.
6. Bakowski, M.A., et al., Ubiquitin-mediated response to microsporidia and virus infection in C. elegans. PLoS Pathog, 2014. 10(6): p. e1004200.
7. Vossbrinck, C.R. and B.A. Debrunner-Vossbrinck, Molecular phylogeny of the Microsporidia: ecological, ultrastructural and taxonomic considerations. Folia Parasitol (Praha), 2005. 52(1-2): p. 131-42; discussion 130.
8. Vavra, J. and J. Lukes, Microsporidia and 'the art of living together'. Adv Parasitol, 2013. 82: p. 253-319.
9. Legros, M. and J.C. Koella, Experimental evolution of specialization by a microsporidian parasite. BMC Evol Biol, 2010. 10: p. 159.
10. Roth, O., et al., Male-biased sex-ratio distortion caused by Octosporea bayeri, a vertically and horizontally-transmitted parasite of Daphnia magna. Int J Parasitol, 2008. 38(8-9): p. 969-79.
11. Sanders, J.L., et al., Verification of intraovum transmission of a microsporidium of vertebrates: Pseudoloma neurophilia infecting the Zebrafish, Danio rerio. PLoS One, 2013. 8(9): p. e76064.
12. Sprague, V., J.J. Becnel, and E.I. Hazard, Taxonomy of phylum microspora. Crit Rev Microbiol, 1992. 18(5-6): p. 285-395.
13. Cuomo, C.A., et al., Microsporidian genome analysis reveals evolutionary strategies for obligate intracellular growth. Genome Res, 2012. 22(12): p. 2478-88.
14. James, T.Y., et al., Shared signatures of parasitism and phylogenomics unite Cryptomycota and microsporidia. Curr Biol, 2013. 23(16): p. 1548-53.
15. Jones, M.D., et al., Discovery of novel intermediate forms redefines the fungal tree of life. Nature, 2011. 474(7350): p. 200-3.
16. Cavalier-Smith, T., Archamoebae: the ancestral eukaryotes? Biosystems, 1991. 25(1-2): p. 25-38. 17. Katinka, M.D., et al., Genome sequence and gene compaction of the eukaryote parasite
Encephalitozoon cuniculi. Nature, 2001. 414(6862): p. 450-3. 18. Williams, B.A., et al., A mitochondrial remnant in the microsporidian Trachipleistophora hominis.
Nature, 2002. 418(6900): p. 865-9. 19. Adl, S.M., et al., The new higher level classification of eukaryotes with emphasis on the taxonomy
of protists. J Eukaryot Microbiol, 2005. 52(5): p. 399-451. 20. Stechmann, A. and T. Cavalier-Smith, Rooting the eukaryote tree by using a derived gene fusion.
Science, 2002. 297(5578): p. 89-91. 21. Keeling, P.J., M.A. Luker, and J.D. Palmer, Evidence from beta-tubulin phylogeny that
microsporidia evolved from within the fungi. Mol Biol Evol, 2000. 17(1): p. 23-31.
67
22. Keeling, P.J., Congruent evidence from alpha-tubulin and beta-tubulin gene phylogenies for a zygomycete origin of microsporidia. Fungal Genet Biol, 2003. 38(3): p. 298-309.
23. James, T.Y., et al., Reconstructing the early evolution of Fungi using a six-gene phylogeny. Nature, 2006. 443(7113): p. 818-22.
24. Lee, S.C., et al., Microsporidia evolved from ancestral sexual fungi. Curr Biol, 2008. 18(21): p. 1675-9.
25. Sokolova, Y., et al., Morphology and phylogeny of Agmasoma penaei (Microsporidia) from the type host, Litopenaeus setiferus, and the type locality, Louisiana, USA. Int J Parasitol, 2015. 45(1): p. 1-16.
26. Vávra, J., Larsson, J.I.R., Structure of the microsporidia. ASM Press, 1999(The Microsporidia and Microsporidiosis): p. 7-84.
27. Capella-Gutierrez, S., M. Marcet-Houben, and T. Gabaldon, Phylogenomics supports microsporidia as the earliest diverging clade of sequenced fungi. BMC Biol, 2012. 10: p. 47.
28. James, T.Y. and M.L. Berbee, No jacket required--new fungal lineage defies dress code: recently described zoosporic fungi lack a cell wall during trophic phase. Bioessays, 2012. 34(2): p. 94-102.
29. Xu, Y. and L.M. Weiss, The microsporidian polar tube: a highly specialised invasion organelle. Int J Parasitol, 2005. 35(9): p. 941-53.
30. Olsen, P.E., Rice, W.A., Liu, T.P., In vitro germination of Nosema apis spores under conditions favorable for the generation and maintenance of sporoplasms. J. Invertebr. Pathol., 1986. 47: p. 65–73.
31. Vivares, C.P., et al., Functional and evolutionary analysis of a eukaryotic parasitic genome. Curr Opin Microbiol, 2002. 5(5): p. 499-505.
32. Tsaousis, A.D., et al., A novel route for ATP acquisition by the remnant mitochondria of Encephalitozoon cuniculi. Nature, 2008. 453(7194): p. 553-6.
33. Hazard EI, B.J., Karyogamy and meiosis in an Ambylospora sp. (Microspora) in the mosquito Culex salinarius. J. Invert. Pathol, 1984. 44: p. 3-11.
34. J., V., Etude au microscope electronique de la morphologie et du developpement de quelques microsporidies. C. R. Acad. Sci., 1965. 261: p. 3467–70.
35. Corradi, N. and C.H. Slamovits, The intriguing nature of microsporidian genomes. Brief Funct Genomics, 2011. 10(3): p. 115-24.
36. Parisot, N., et al., Microsporidian genomes harbor a diverse array of transposable elements that demonstrate an ancestry of horizontal exchange with metazoans. Genome Biol Evol, 2014. 6(9): p. 2289-300.
37. Peyretaillade, E., et al., Annotation of microsporidian genomes using transcriptional signals. Nat Commun, 2012. 3: p. 1137.
38. Nakjang, S., et al., Reduction and expansion in microsporidian genome evolution: new insights from comparative genomics. Genome Biol Evol, 2013. 5(12): p. 2285-303.
39. Heinz, E., et al., Plasma membrane-located purine nucleotide transport proteins are key components for host exploitation by microsporidian intracellular parasites. PLoS Pathog, 2014. 10(12): p. e1004547.
40. Corradi, N., et al., The complete sequence of the smallest known nuclear genome from the microsporidian Encephalitozoon intestinalis. Nat Commun, 2010. 1: p. 77.
41. Pombert, J.F., et al., Gain and loss of multiple functionally related, horizontally transferred genes in the reduced genomes of two microsporidian parasites. Proc Natl Acad Sci U S A, 2012. 109(31): p. 12638-43.
42. Selman, M., Genomic Analysis of Encephalitozoon Species. 2014, Université d'Ottawa. 43. Corradi, N. and M. Selman, Latest progress in microsporidian genome research. J Eukaryot
Microbiol, 2013. 60(3): p. 309-12.
68

44. Selman, M., et al., Extremely reduced levels of heterozygosity in the vertebrate pathogen Encephalitozoon cuniculi. Eukaryot Cell, 2013. 12(4): p. 496-502.
45. Didier, E.S. and L.M. Weiss, Microsporidiosis: not just in AIDS patients. Curr Opin Infect Dis, 2011. 24(5): p. 490-5.
46. Nkinin, S.W., et al., Microsporidian infection is prevalent in healthy people in Cameroon. J Clin Microbiol, 2007. 45(9): p. 2841-6.
47. Sak, B., et al., Unapparent microsporidial infection among immunocompetent humans in the Czech Republic. J Clin Microbiol, 2011. 49(3): p. 1064-70.
48. Sak, B., et al., Latent microsporidial infection in immunocompetent individuals - a longitudinal study. PLoS Negl Trop Dis, 2011. 5(5): p. e1162.
49. Weiss, L.M. and C.R. Vossbrinck, Microsporidiosis: molecular and diagnostic aspects. Adv Parasitol, 1998. 40: p. 351-95.
50. Didier, E.S., Microsporidiosis: an emerging and opportunistic infection in humans and animals. Acta Trop, 2005. 94(1): p. 61-76.
51. Lanternier, F., et al., Microsporidiosis in solid organ transplant recipients: two Enterocytozoon bieneusi cases and review. Transpl Infect Dis, 2009. 11(1): p. 83-8.
52. Molina, J.M., et al., Fumagillin treatment of intestinal microsporidiosis. N Engl J Med, 2002. 346(25): p. 1963-9.
53. Das, S., et al., Diagnosis, clinical features and treatment outcome of microsporidial keratoconjunctivitis. Br J Ophthalmol, 2012. 96(6): p. 793-5.
54. Reddy, A.K., et al., Is microsporidial keratitis a seasonal infection in India? Clin Microbiol Infect, 2011. 17(7): p. 1114-6.
55. Accoceberry, I., D’Almeida-Fourquet, M., Diagnosis of intestinal microsporidia. Revue Francophone des Laboratoires, 2012(440): p. 27-34.
56. Keeling, P.J. and C.H. Slamovits, Simplicity and complexity of microsporidian genomes. Eukaryot Cell, 2004. 3(6): p. 1363-9.
57. Stentiford, G.D., et al., Microsporidia: diverse, dynamic, and emergent pathogens in aquatic systems. Trends Parasitol, 2013. 29(11): p. 567-78.
58. Nägeli, C., Über die neue Krankheit der Seidenraupe und verwandte Organismen. Bot. Zeitung, 1857. 15: p. 60–761.
59. Bhat, S.A., I. Bashir, and A.S. Kamili, Microsporidiosis of silkworm, Bombyx mori L.(Lepidoptera-Bombycidae): a review. African Journal of Agricultural Research, 2009. 4(13): p. 1519-1523.
60. Hajek, A.E. and I. Delalibera Jr, Fungal pathogens as classical biological control agents against arthropods. BioControl, 2010. 55(1): p. 147-158.
61. Milner, R., Nosema whitei, a microsporidan pathogen of some species of Tribolium: I. Morphology, life cycle, and generation time. Journal of Invertebrate Pathology, 1972. 19(2): p. 231-238.
62. Lewis, L.C., et al., Nosema pyrausta: its biology, history, and potential role in a landscape of transgenic insecticidal crops. Biological Control, 2009. 48(3): p. 223-231.
63. Cameron, S.A., et al., Patterns of widespread decline in North American bumble bees. Proceedings of the National Academy of Sciences, 2011. 108(2): p. 662-667.
64. Chen, Y., et al., Asymmetrical coexistence of Nosema ceranae and Nosema apis in honey bees. Journal of invertebrate pathology, 2009. 101(3): p. 204-209.
65. Fries, I., Nosema ceranae in European honey bees (Apis mellifera). Journal of invertebrate pathology, 2010. 103: p. S73-S79.
66. Dussaubat, C., et al., Gut pathology and responses to the microsporidium Nosema ceranae in the honey bee Apis mellifera. PloS one, 2012. 7(5): p. e37017.
69
67. Kearns, C.A., D.W. Inouye, and N.M. Waser, Endangered mutualisms: The conservation of plant-pollinator interactions. Annual Review of Ecology and Systematics, 1998. 29: p. 83-112.
68. Aizen, M.A. and L.D. Harder, The global stock of domesticated honey bees is growing slower than agricultural demand for pollination. Curr Biol, 2009. 19(11): p. 915-8.
69. Potts, S.G., et al., Global pollinator declines: trends, impacts and drivers. Trends Ecol Evol, 2010. 25(6): p. 345-53.
70. Evans, J.D., et al., Colony collapse disorder: a descriptive study. PloS one, 2009. 4(8): p. e6481. 71. Cepero, A., et al., Holistic screening of collapsing honey bee colonies in Spain: a case study. BMC
Res Notes, 2014. 7: p. 649. 72. Dainat, B., et al., Predictive markers of honey bee colony collapse. PLoS One, 2012. 7(2): p.
e32151. 73. Martin, S.J., et al., Do the honeybee pathogens Nosema ceranae and deformed wing virus act
synergistically? Environ Microbiol Rep, 2013. 5(4): p. 506-10. 74. Pettis, J.S., et al., Pesticide exposure in honey bees results in increased levels of the gut pathogen
Nosema. Naturwissenschaften, 2012. 99(2): p. 153-8. 75. Fries, I., et al., Nosema ceranae n sp (Microspora, Nosematidae), morphological and molecular
characterization of a microsporidian parasite of the Asian honey bee Apis cerana (Hymenoptera, Apidae). European Journal of Protistology, 1996. 32(3): p. 356-365.
76. Martin-Hernandez, R., et al., Outcome of colonization of Apis mellifera by Nosema ceranae. Appl Environ Microbiol, 2007. 73(20): p. 6331-8.
77. Klee, J., et al., Widespread dispersal of the microsporidian Nosema ceranae, an emergent pathogen of the western honey bee, Apis mellifera. J Invertebr Pathol, 2007. 96(1): p. 1-10.
78. Bromenshenk, J.J., et al., Iridovirus and microsporidian linked to honey bee colony decline. PLoS One, 2010. 5(10): p. e13181.
79. Huang, W.F., et al., Nosema ceranae escapes fumagillin control in honey bees. PLoS Pathog, 2013. 9(3): p. e1003185.
80. Huang, W.F., et al., Infectivity and virulence of Nosema ceranae and Nosema apis in commercially available North American honey bees. J Invertebr Pathol, 2015. 124: p. 107-13.
81. Bekele, A.Z., et al., A case report of Nosema ceranae infection in honey bees in Minnesota, USA. Vet Q, 2015: p. 1-3.
82. Botias, C., et al., Nosema spp. infection and its negative effects on honey bees (Apis mellifera iberiensis) at the colony level. Vet Res, 2013. 44: p. 25.
83. Cornman, R.S., et al., Genomic analyses of the microsporidian Nosema ceranae, an emergent pathogen of honey bees. PLoS Pathog, 2009. 5(6): p. e1000466.
84. Roudel, M., et al., New insights on the genetic diversity of the honeybee parasite Nosema ceranae based on multilocus sequence analysis. Parasitology, 2013. 140(11): p. 1346-56.
85. Gomez-Moracho, T., et al., High levels of genetic diversity in Nosema ceranae within Apis mellifera colonies. Parasitology, 2013: p. 1-7.
86. Ironside, J.E., Diversity and recombination of dispersed ribosomal DNA and protein coding genes in microsporidia. PLoS One, 2013. 8(2): p. e55878.
87. Gomez-Moracho, T., et al., Recent worldwide expansion of Nosema ceranae (Microsporidia) in Apis mellifera populations inferred from multilocus patterns of genetic variation. Infect Genet Evol, 2015.
88. Gomez-Moracho, T., et al., Evidence for weak genetic recombination at the PTP2 locus of Nosema ceranae. Environ Microbiol, 2014.
89. Gomez-Moracho, T., et al., High levels of genetic diversity in Nosema ceranae within Apis mellifera colonies. Parasitology, 2014. 141(4): p. 475-81.
70
90. Sagastume, S., et al., Polymorphism and recombination for rDNA in the putatively asexual microsporidian Nosema ceranae, a pathogen of honeybees. Environ Microbiol, 2011. 13(1): p. 84-95.
91. Sagastume, S., et al., Ribosomal gene polymorphism in small genomes: analysis of different 16S rRNA sequences expressed in the honeybee parasite Nosema ceranae (Microsporidia). J Eukaryot Microbiol, 2014. 61(1): p. 42-50.
92. Botias, C., et al., Further evidence of an oriental origin for Nosema ceranae (Microsporidia: Nosematidae). J Invertebr Pathol, 2012. 110(1): p. 108-13.
93. Minoche, A.E., J.C. Dohm, and H. Himmelbauer, Evaluation of genomic high-throughput sequencing data generated on Illumina HiSeq and genome analyzer systems. Genome Biol, 2011. 12(11): p. R112.
94. Kofler, R., et al., PoPoolation: a toolbox for population genetic analysis of next generation sequencing data from pooled individuals. PLoS One, 2011. 6(1): p. e15925.
95. Bankevich, A., et al., SPAdes: a new genome assembly algorithm and its applications to single-cell sequencing. J Comput Biol, 2012. 19(5): p. 455-77.
96. Conesa, A., et al., Blast2GO: a universal tool for annotation, visualization and analysis in functional genomics research. Bioinformatics, 2005. 21(18): p. 3674-6.
97. Petersen, T.N., et al., SignalP 4.0: discriminating signal peptides from transmembrane regions. Nat Methods, 2011. 8(10): p. 785-6.
98. Li, H. and R. Durbin, Fast and accurate short read alignment with Burrows-Wheeler transform. Bioinformatics, 2009. 25(14): p. 1754-60.
99. Li, H., et al., The Sequence Alignment/Map format and SAMtools. Bioinformatics, 2009. 25(16): p. 2078-9.
100. Chikhi, R. and P. Medvedev, Informed and automated k-mer size selection for genome assembly. Bioinformatics, 2014. 30(1): p. 31-7.
101. Team, R.C., R: A Language and Environment for Statistical Computing, R.F.f.S. Computing, Editor. 2013.
102. Quinlan, A.R. and I.M. Hall, BEDTools: a flexible suite of utilities for comparing genomic features. Bioinformatics, 2010. 26(6): p. 841-2.
103. Marth, E.G.a.G., Haplotype-based variant detection from short-read sequencing. Cornell University Library, 2012.
104. Danecek, P., et al., The variant call format and VCFtools. Bioinformatics, 2011. 27(15): p. 2156-8. 105. Feder, A.F., D.A. Petrov, and A.O. Bergland, LDx: estimation of linkage disequilibrium from high-
throughput pooled resequencing data. PLoS One, 2012. 7(11): p. e48588. 106. Wickham, H., ggplot2: elegant graphics for data analysis. 2009: Springer New York. 107. Ranwez, V., et al., MACSE: Multiple Alignment of Coding SEquences accounting for frameshifts
and stop codons. PLoS One, 2011. 6(9): p. e22594. 108. Paradis, E., pegas: an R package for population genetics with an integrated-modular approach.
Bioinformatics, 2010. 26(3): p. 419-20. 109. Pombert, J.F., et al., The Ordospora colligata Genome: Evolution of Extreme Reduction in
Microsporidia and Host-To-Parasite Horizontal Gene Transfer. MBio, 2015. 6(1). 110. O'Brien, K.P., M. Remm, and E.L. Sonnhammer, Inparanoid: a comprehensive database of
eukaryotic orthologs. Nucleic Acids Res, 2005. 33(Database issue): p. D476-80. 111. Pickrell, J.K. and J.K. Pritchard, Inference of population splits and mixtures from genome-wide
allele frequency data. PLoS Genet, 2012. 8(11): p. e1002967. 112. Sukumaran, J. and M.T. Holder, DendroPy: a Python library for phylogenetic computing.
Bioinformatics, 2010. 26(12): p. 1569-71.
71

113. Aris-Brosou, S. and N. Rodrigue, The essentials of computational molecular evolution. Methods Mol Biol, 2012. 855: p. 111-52.
114. Guindon, S., et al., New algorithms and methods to estimate maximum-likelihood phylogenies: assessing the performance of PhyML 3.0. Syst Biol, 2010. 59(3): p. 307-21.
115. Altekar, G., et al., Parallel Metropolis coupled Markov chain Monte Carlo for Bayesian phylogenetic inference. Bioinformatics, 2004. 20(3): p. 407-15.
116. Ronquist, F. and J.P. Huelsenbeck, MrBayes 3: Bayesian phylogenetic inference under mixed models. Bioinformatics, 2003. 19(12): p. 1572-4.
117. Heled, J. and A.J. Drummond, Bayesian inference of species trees from multilocus data. Mol Biol Evol, 2010. 27(3): p. 570-80.
118. Chevreux, B., et al., Using the miraEST assembler for reliable and automated mRNA transcript assembly and SNP detection in sequenced ESTs. Genome Res, 2004. 14(6): p. 1147-59.
119. D. A. Delaney, M.D.M., N. M. Schiff, and W. S. Sheppard, Genetic Characterization of Commercial Honey Bee (Hymenoptera: Apidae) Populations in the United States by Using Mitochondrial and Microsatellite Markers. Annals of the Entomological Society of America, 2009: p. 666-673.
120. Pan, G., et al., Comparative genomics of parasitic silkworm microsporidia reveal an association between genome expansion and host adaptation. BMC Genomics, 2013. 14: p. 186.
121. Chen, Y., et al., Genome sequencing and comparative genomics of honey bee microsporidia, Nosema apis reveal novel insights into host-parasite interactions. BMC Genomics, 2013. 14: p. 451.
122. Higes, M., R. Martin, and A. Meana, Nosema ceranae, a new microsporidian parasite in honeybees in Europe. J Invertebr Pathol, 2006. 92(2): p. 93-5.
123. Higes, M., et al., How natural infection by Nosema ceranae causes honeybee colony collapse. Environmental microbiology, 2008. 10(10): p. 2659-2669.
124. Milbrath, M.O., et al., Comparative virulence and competition between Nosema apis and Nosema ceranae in honey bees (Apis mellifera). Journal of invertebrate pathology, 2015. 125: p. 9-15.
125. Van der Zee, R., et al., Virulence and polar tube protein genetic diversity of Nosema ceranae (Microsporidia) field isolates from Northern and Southern Europe in honeybees (Apis mellifera iberiensis). Environ Microbiol Rep, 2014. 6(4): p. 401-13.
126. Finseth, F.R. and R.G. Harrison, A comparison of next generation sequencing technologies for transcriptome assembly and utility for RNA-Seq in a non-model bird. PLoS One, 2014. 9(10): p. e108550.
127. Bakowski, M.A., et al., Genome Sequence of the Microsporidian Species Nematocida sp1 Strain ERTm6 (ATCC PRA-372). Genome Announc, 2014. 2(5).
128. Zheng, W., et al., High genome heterozygosity and endemic genetic recombination in the wheat stripe rust fungus. Nat Commun, 2013. 4: p. 2673.
129. Butler, G., et al., Evolution of pathogenicity and sexual reproduction in eight Candida genomes. Nature, 2009. 459(7247): p. 657-62.
130. LaFave, M.C. and J. Sekelsky, Mitotic recombination: why? when? how? where? PLoS Genet, 2009. 5(3): p. e1000411.
131. Rosenblum, E.B., et al., Complex history of the amphibian-killing chytrid fungus revealed with genome resequencing data. Proc Natl Acad Sci U S A, 2013. 110(23): p. 9385-90.
132. Li, W., et al., Genetic Diversity and Genomic Plasticity of Cryptococcus neoformans AD Hybrid Strains. G3 (Bethesda), 2012. 2(1): p. 83-97.
133. Farrer, R.A., et al., Chromosomal copy number variation, selection and uneven rates of recombination reveal cryptic genome diversity linked to pathogenicity. PLoS Genet, 2013. 9(8): p. e1003703.
72
134. Pryszcz, L.P., et al., Genome comparison of Candida orthopsilosis clinical strains reveals the existence of hybrids between two distinct subspecies. Genome Biol Evol, 2014. 6(5): p. 1069-78.
135. Rogers, M.B., et al., Chromosome and gene copy number variation allow major structural change between species and strains of Leishmania. Genome Res, 2011. 21(12): p. 2129-42.
136. Voelz, K., et al., Transmission of Hypervirulence traits via sexual reproduction within and between lineages of the human fungal pathogen cryptococcus gattii. PLoS Genet, 2013. 9(9): p. e1003771.
137. de Meeus, T. and F. Balloux, Clonal reproduction and linkage disequilibrium in diploids: a simulation study. Infect Genet Evol, 2004. 4(4): p. 345-51.
138. Nebavi, F., et al., Clonal population structure and genetic diversity of Candida albicans in AIDS patients from Abidjan (Cote d'Ivoire). Proc Natl Acad Sci U S A, 2006. 103(10): p. 3663-8.
139. Rogers, M.B., et al., Genomic confirmation of hybridisation and recent inbreeding in a vector-isolated Leishmania population. PLoS Genet, 2014. 10(1): p. e1004092.
140. Becnel, J.J., et al., Development of Edhazardia aedis (Kudo, 1930) n. g., n. comb. (Microsporida: Amblyosporidae) in the mosquito Aedes aegypti (L.) (Diptera: Culicidae). J Protozool, 1989. 36(2): p. 119-30.
141. Canning, E.U., Nuclear division and chromosome cycle in microsporidia. Biosystems, 1988. 21(3-4): p. 333-40.
142. Ironside, J.E., Multiple losses of sex within a single genus of Microsporidia. BMC Evol Biol, 2007. 7: p. 48.
143. Bernander, R., J.E. Palm, and S.G. Svard, Genome ploidy in different stages of the Giardia lamblia life cycle. Cell Microbiol, 2001. 3(1): p. 55-62.
144. Louis M. Weiss, J.J.B., Sex and the Microsporidia, in Microsporidia: Pathogens of Opportunity. 2014, Wiley-Blackwell.
145. Cox-Foster, D.L., et al., A metagenomic survey of microbes in honey bee colony collapse disorder. Science, 2007. 318(5848): p. 283-7.
146. Higes, M., et al., Experimental infection of Apis mellifera honeybees with Nosema ceranae (Microsporidia). J Invertebr Pathol, 2007. 94(3): p. 211-7.
147. Munoz, I., et al., Presence of Nosema ceranae associated with honeybee queen introductions. Infect Genet Evol, 2014. 23: p. 161-8.
148. Mutinelli, F., The spread of pathogens through trade in honey bees and their products (including queen bees and semen): overview and recent developments. Rev Sci Tech, 2011. 30(1): p. 257-71.
149. Zee, R.v.d., Colony losses in the Netherlands. Journal of Apicultural Research, 2010. 49 (1): p. 121-123.
150. Currie, R.W., S.F. Pernal, and E. Guzmán-Novoa, Honey bee colony losses in Canada. Journal of Apicultural Research, 2010. 49(1): p. 104-106.
151. Genersch, E., Honey bee pathology: current threats to honey bees and beekeeping. Applied microbiology and biotechnology, 2010. 87(1): p. 87-97.
152. Paxton, R.J., Does infection by Nosema ceranae cause “Colony Collapse Disorder” in honey bees (Apis mellifera). Journal of Apicultural Research, 2010. 49(1): p. 80-84.
153. Tibayrenc, M. and F.J. Ayala, Reproductive clonality of pathogens: a perspective on pathogenic viruses, bacteria, fungi, and parasitic protozoa. Proc Natl Acad Sci U S A, 2012. 109(48): p. E3305-13.
154. Haag, K.L., E. Traunecker, and D. Ebert, Single-nucleotide polymorphisms of two closely related microsporidian parasites suggest a clonal population expansion after the last glaciation. Mol Ecol, 2013. 22(2): p. 314-26.
73

155. Gisder, S., et al., A cell culture model for Nosema ceranae and Nosema apis allows new insights into the life cycle of these important honey bee-pathogenic microsporidia. Environ Microbiol, 2011. 13(2): p. 404-13.
74

Appendix A: Morphology and phylogeny of Agmasoma penaei
(Microsporidia) from the type host, Litopenaeus setiferus, and the type
locality, Louisiana, USA
Yuliya Sokolova a,b,*, Adrian Pelin c, John Hawke d, Nicolas Corradic a Department of Comparative Biomedical Studies, School of Veterinary Medicine, Louisiana State University, Baton Rouge, LA, USA b Institute of Cytology, Russian Academy of Sciences, St. Petersburg, Russia c Canadian Institute for Advanced Research, Department of Biology, University of Ottawa, Ottawa, ON K1N 6N5, Canada d Department of Pathobiological Sciences, School of Veterinary Medicine, Louisiana State University, Baton Rouge, LA, USA
Comments:
This work has been published in International journal for parasitology 45.1 (2015): 1-16, January 2015. My main contributions to this work include phylogenetic analysis as well as 16S analysis.
75

Abstract
Since June 2012, samples of wild caught white shrimp, Litopenaeus setiferus, from the Gulf of Mexico,
Plaquemines and Jefferson Parishes (Louisiana, USA) with clinical signs of microsporidiosis have been
delivered to the Louisiana Aquatic Diagnostic Laboratory for identification. Infection was limited
predominantly to female gonads and was caused by a microsporidium producing roundish pansporoblasts
with eight spores (3.6 × 2.1 μm) and an anisofilar (2–3 + 4–6) polar filament. These features allowed
identification of the microsporidium as Agmasoma penaei Sprague, 1950. Agmasoma penaei is known as
a microsporidium with world-wide distribution, causing devastating epizootic disease among wild and
cultured shrimps. This paper provides molecular and morphological characterisation of A. penaei from the
type host and type locality. Comparison of the novel ssrDNA sequence of A. penaei from Louisiana, USA
with that of A. penaei from Thailand revealed 95% similarity, which suggests these geographical isolates
are two different species. The A. penaei sequences did not show significant homology to any other
examined taxon. Phylogenetic reconstructions using the ssrDNA and alpha- and beta-tubulin sequences
supported its affiliation with the Clade IV Terresporidia sensu Vossbrink 2005, and its association with
parasites of fresh and salt water crustaceans of the genera Artemia, Daphnia and Cyclops.
Keywords
Microsporidia; Decapoda; Agmasoma penaei; Litopenaeus setiferus; Louisiana; Electron
microscopy; Molecular taxonomy
76
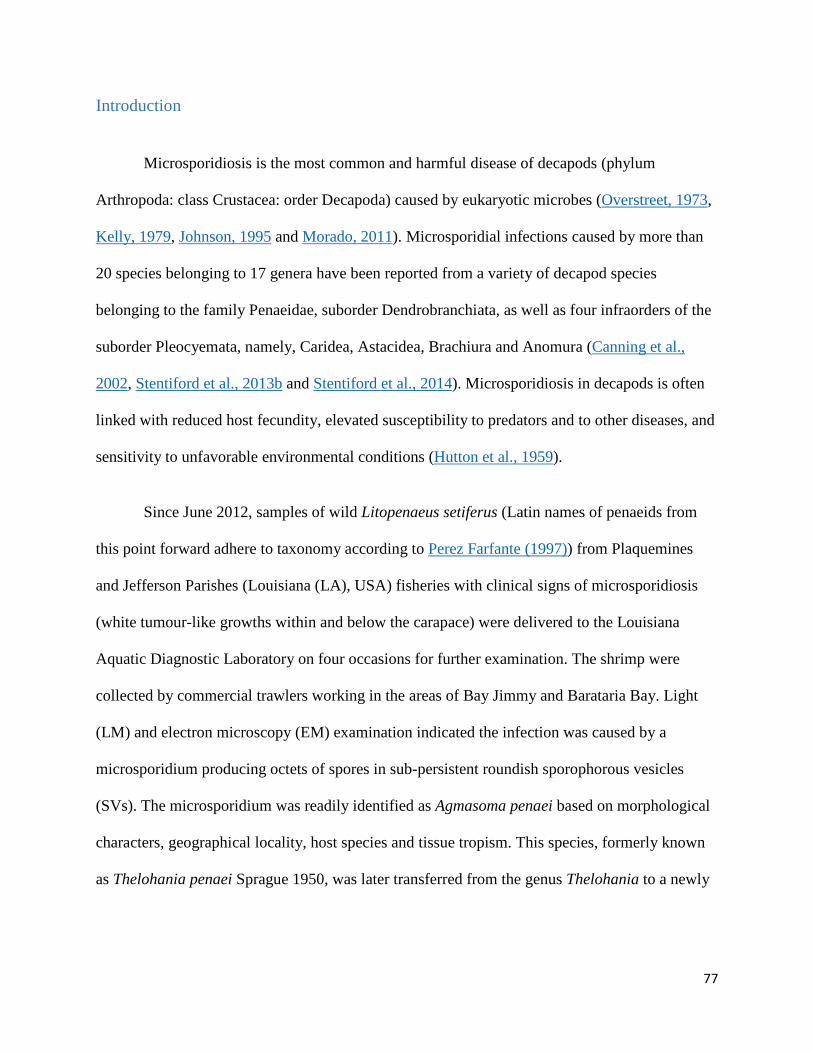
Introduction
Microsporidiosis is the most common and harmful disease of decapods (phylum
Arthropoda: class Crustacea: order Decapoda) caused by eukaryotic microbes (Overstreet, 1973,
Kelly, 1979, Johnson, 1995 and Morado, 2011). Microsporidial infections caused by more than
20 species belonging to 17 genera have been reported from a variety of decapod species
belonging to the family Penaeidae, suborder Dendrobranchiata, as well as four infraorders of the
suborder Pleocyemata, namely, Caridea, Astacidea, Brachiura and Anomura (Canning et al.,
2002, Stentiford et al., 2013b and Stentiford et al., 2014). Microsporidiosis in decapods is often
linked with reduced host fecundity, elevated susceptibility to predators and to other diseases, and
sensitivity to unfavorable environmental conditions (Hutton et al., 1959).
Since June 2012, samples of wild Litopenaeus setiferus (Latin names of penaeids from
this point forward adhere to taxonomy according to Perez Farfante (1997)) from Plaquemines
and Jefferson Parishes (Louisiana (LA), USA) fisheries with clinical signs of microsporidiosis
(white tumour-like growths within and below the carapace) were delivered to the Louisiana
Aquatic Diagnostic Laboratory on four occasions for further examination. The shrimp were
collected by commercial trawlers working in the areas of Bay Jimmy and Barataria Bay. Light
(LM) and electron microscopy (EM) examination indicated the infection was caused by a
microsporidium producing octets of spores in sub-persistent roundish sporophorous vesicles
(SVs). The microsporidium was readily identified as Agmasoma penaei based on morphological
characters, geographical locality, host species and tissue tropism. This species, formerly known
as Thelohania penaei Sprague 1950, was later transferred from the genus Thelohania to a newly
77
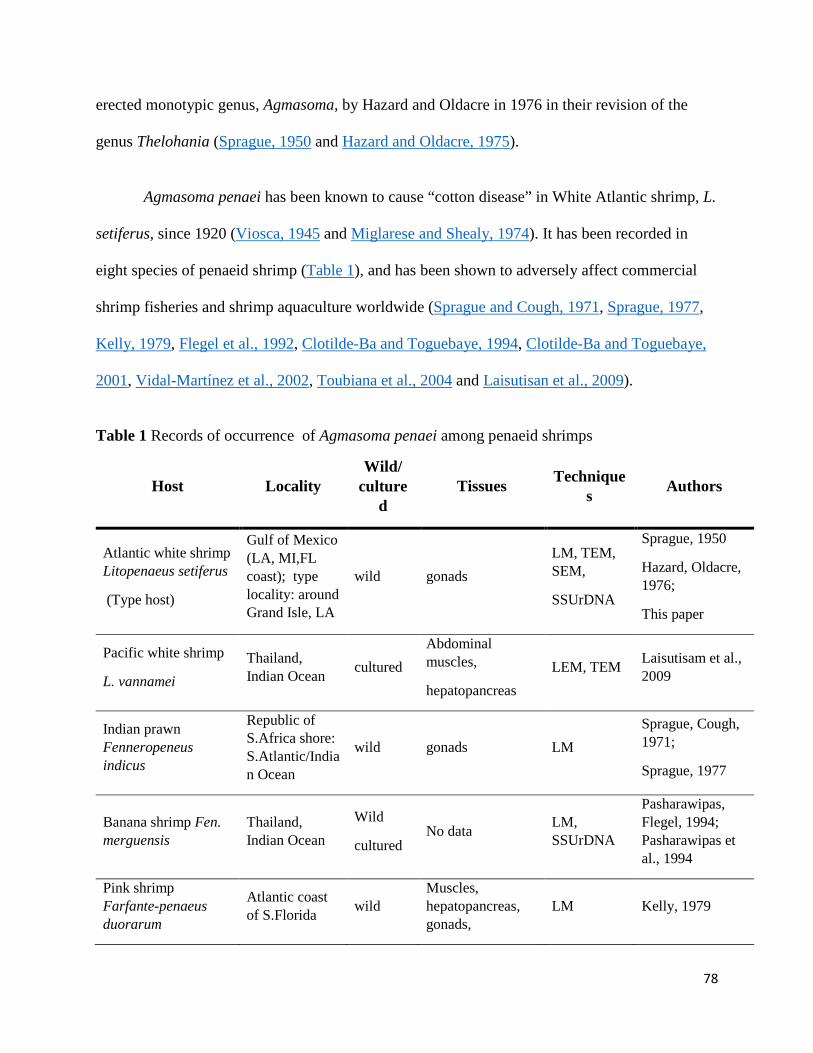
erected monotypic genus, Agmasoma, by Hazard and Oldacre in 1976 in their revision of the
genus Thelohania (Sprague, 1950 and Hazard and Oldacre, 1975).
Agmasoma penaei has been known to cause “cotton disease” in White Atlantic shrimp, L.
setiferus, since 1920 (Viosca, 1945 and Miglarese and Shealy, 1974). It has been recorded in
eight species of penaeid shrimp (Table 1), and has been shown to adversely affect commercial
shrimp fisheries and shrimp aquaculture worldwide (Sprague and Cough, 1971, Sprague, 1977,
Kelly, 1979, Flegel et al., 1992, Clotilde-Ba and Toguebaye, 1994, Clotilde-Ba and Toguebaye,
2001, Vidal-Martínez et al., 2002, Toubiana et al., 2004 and Laisutisan et al., 2009).
Table 1 Records of occurrence of Agmasoma penaei among penaeid shrimps
Host Locality Wild/
cultured
Tissues Techniques Authors
Atlantic white shrimp Litopenaeus setiferus
(Type host)
Gulf of Mexico (LA, MI,FL coast); type locality: around Grand Isle, LA
wild gonads LM, TEM, SEM,
SSUrDNA
Sprague, 1950
Hazard, Oldacre, 1976;
This paper
Pacific white shrimp
L. vannamei Thailand, Indian Ocean cultured
Abdominal muscles,
hepatopancreas LEM, TEM Laisutisam et al.,
2009
Indian prawn Fenneropeneus indicus
Republic of S.Africa shore: S.Atlantic/Indian Ocean
wild gonads LM Sprague, Cough, 1971;
Sprague, 1977
Banana shrimp Fen. merguensis
Thailand, Indian Ocean
Wild
cultured No data LM,
SSUrDNA
Pasharawipas, Flegel, 1994; Pasharawipas et al., 1994
Pink shrimp Farfante-penaeus duorarum
Atlantic coast of S.Florida wild
Muscles, hepatopancreas, gonads,
LM Kelly, 1979
78
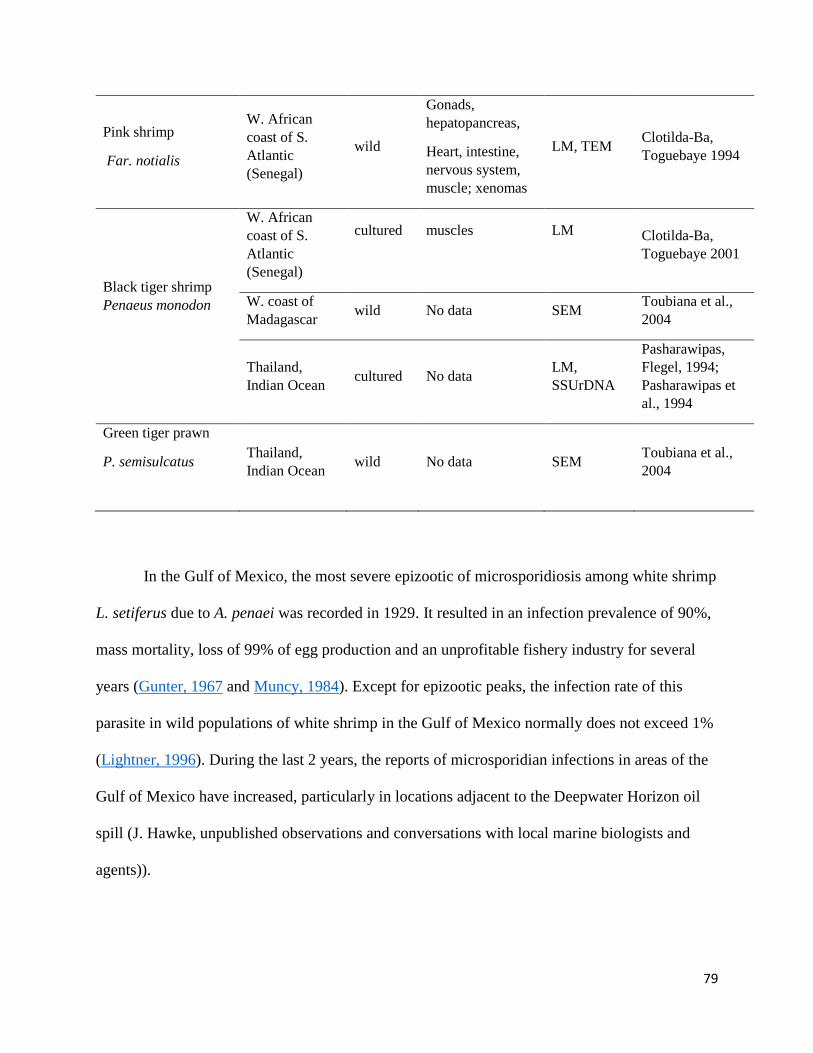
Pink shrimp
Far. notialis
W. African coast of S. Atlantic (Senegal)
wild
Gonads, hepatopancreas,
Heart, intestine, nervous system, muscle; xenomas
LM, TEM Clotilda-Ba, Toguebaye 1994
Black tiger shrimp Penaeus monodon
W. African coast of S. Atlantic (Senegal)
cultured
muscles
LM
Clotilda-Ba, Toguebaye 2001
W. coast of Madagascar wild No data SEM Toubiana et al.,
2004
Thailand, Indian Ocean cultured No data LM,
SSUrDNA
Pasharawipas, Flegel, 1994; Pasharawipas et al., 1994
Green tiger prawn
P. semisulcatus
Thailand, Indian Ocean wild No data SEM Toubiana et al.,
2004
In the Gulf of Mexico, the most severe epizootic of microsporidiosis among white shrimp
L. setiferus due to A. penaei was recorded in 1929. It resulted in an infection prevalence of 90%,
mass mortality, loss of 99% of egg production and an unprofitable fishery industry for several
years (Gunter, 1967 and Muncy, 1984). Except for epizootic peaks, the infection rate of this
parasite in wild populations of white shrimp in the Gulf of Mexico normally does not exceed 1%
(Lightner, 1996). During the last 2 years, the reports of microsporidian infections in areas of the
Gulf of Mexico have increased, particularly in locations adjacent to the Deepwater Horizon oil
spill (J. Hawke, unpublished observations and conversations with local marine biologists and
agents)).
79
Three geographical isolates parasitising three different penaeid hosts from different
geographic locations, were examined ultrastructurally. These are: the Louisiana isolate from
Atlantic white shrimp, L. setiferus (Hazard and Oldacre, 1975), the Senegal isolate from the
Southern pink shrimp, Farfantepenaus notialis (Clotilde-Ba and Toguebaye, 1994), and the
Thailand isolate from Pacific white shrimp, Litopenaeus vannamei (Laisutisan et al., 2009). All
three isolates displayed a similar pattern of octosporous sporogony, pyriform shape of spores and
spore ultrastructure with conspicuous anisofilar polar filaments. Prior to this study, data on fine
morphology of the Louisiana isolate was limited to two EM images (Hazard and Oldacre, 1975).
The Senegal and Thailand isolates of A. penaei have been studied more thoroughly, however the
ultrastructure of the organism has not been described sufficiently. Data on pathogenicity, tissue
tropism, transmission and sexuality are scarce and controversial among these three and other
geographical isolates of A. penaei (Table 1). Only one A. penaei isolate parasitising cultured
Fenneropenaeus merguiensis and Penaeus monodon in Thailand has been characterised using
molecular tools and a fragment of its ssrDNA sequence is available via GenBank (Pasharawipas
and Flegel, 1994 and Pasharawipas et al., 1994).
The major goal of this paper is to provide morphological and molecular characterisation
of A. penaei from the type host and type locality, which would serve as an important reference
for identification of geographical isolates of this microsporidium. We also comparatively
evaluate the fine morphology of three geographical isolates of A. penaei, assess relatedness of A.
penaei from Louisiana to other microsporidia parasitising decapods using ssrDNA-based
phylogenetic analysis, and present molecular and phylogenetic comparisons of A. penaei genes
for ssrRNA and alpha- and beta-tubulins with other microsporidian orthologues available in
GenBank.
80

Materials and methods
Materials
White shrimp, L. setiferus Linnaeus 1767, were caught by commercial trawling in the
Gulf of Mexico in the bays and offshore from Plaquemines and Jefferson Parishes, Louisiana,
USA. An unusually high number of shrimp harbouring macroscopic whitish lesions and tumour-
like growths on the carapaces and abdomens were noticed by shrimpers. Thirty shrimps with
these clinical signs were delivered to the Louisiana Aquatic Diagnostic Laboratory (Louisiana
State University (LSU) School of Veterinary Medicine (SVM), Baton Rouge, LA, USA) from
May 2012 to November 2013. In all of the cases, shrimp were caught alive, kept on ice and
delivered within 6–24 h after being caught. All delivered shrimp were females, with sizes
ranging from 100 to 120 mm for those caught in May, and 130 to 180 mm for those caught later
in the year. The material examined in this study included 18 shrimp; two sampled on 16 May
2012 (case LADL12-047); two on 22 May 2012 (case LADL12-053), eight on 2 October 2012
(case LADL12-113), and six on 11 October 2012 (case LADL12-19). All samples were studied
by LM, but only eight by EM.
Histopathology and analysis of tissue tropism
One to three whole shrimp were injected with 5 ml of Davidson’s fixative, placed in fresh
Davidson’s fixative at approximately 10× their volume for 24 to 48 h and then transferred to
70% ethanol (Bell and Lightner, 1988). Standard histological protocols, based on the procedures
of Luna (1968), were employed by the Louisiana Animal Disease Diagnostic Laboratory,
Histology Laboratory, LSU SVM. Tissues were manually trimmed to a width of 10 mm, placed
in cassettes, processed through an alcohol series and embedded in paraffin in a Tissue Tek VIP 5
81

(Sakura Finetek USA Inc., Torrance, CA, USA). Tissues were sectioned at a thickness of 5 μm,
mounted on glass slides and stained with Hematoxylin-Biebrich scarlet solution (Luna stain).
This stain has traditionally been used to stain erythrocytes and eosinophil granules but has
recently been shown to selectively stain for microsporidia-infected tissue (Peterson et al., 2011).
For observation of microsporidia and ultrastructural studies of the infected tissues, the gonads,
hepatopancreas, thoracal and abdominal muscles, subcuticular lesions of the carapace, and
intestines were isolated from dissected shrimp. Smears from these tissues were either examined
directly under a light microscope with phase contrast optics or were fixed by absolute methanol,
stained with Trichrome stain, Calcofluor and Giemsa, as previously described (Sokolova and
Fuxa, 2008), and examined with bright field optics. Smears and sections were examined with a
Zeiss Axioplan microscope equipped with an Olympus DP73 digital camera, or with a Zeiss
Observer Z1 with mosaic tiling function. ImagePro7.0 software was used for spore
measurements. For EM, small pieces of infected tissues were fixed in a mixture of 2%
paraformaldehyde and 1.25% glutaraldehyde in 0.1 M cacodilate buffer supplemented with 5%
sucrose for 2 h, washed several times in the same buffer and post-fixed in 1% osmium for 1 h.
All procedures were performed at room temperature. Samples were then thoroughly washed in
water and dehydrated in ascending ethanol series and propylene oxide, and embedded in Epon–
Araldite. Blocks were sectioned with Ultratome Leica EM UC7. Thick (0.5–1 μm) sections were
stained with the modified Methylene blue stain (Sokolova and Fuxa, 2008), examined and
photographed under a Zeiss Axioplan microscope equipped with an Olympus DP73 digital
camera. Thin (70–80 nm) sections were stained with uranyl acetate and lead citrate, and
examined in a JEOL JEM 1011 microscope with the attached HAMAMATSU ORCA-HR digital
82

camera. All reagents for LM were from Sigma–Aldrich (St. Louis, MO, USA), and for EM from
EMS Chemicals (Fort Washington, PA, USA).
Spore purification and DNA isolation
Spores were extracted from heavily infected tissues previously stored at −20 °C. Briefly,
thawed tissues were homogenised using a Teflon pestle in a 15 ml Wheaton tissue grinder,
resuspended in PBS and filtered through cheesecloth to remove larger debris. The resulting spore
suspension was then washed 2–3 times in 15 ml tubes with PBS by 10 min centrifugation at
3,000g (AccuSpin Centrifuge, Fisher Scientific, USA). The final pellet was resuspended in 5 ml
of PBS, placed on 100% Percoll (Sigma–Aldrich) in 15 ml tubes and centrifuged at 600g for
35 min. Following centrifugation, cleaned spores were resuspended in PBS and their purity and
integrity was inspected under a phase contrast microscope using 10–15 μl aliquots of spore
suspension. Finally, spores were transferred to 1.5 ml tubes, washed three additional times in
PBS by centrifugation (3,000g; Eppendorf centrifuge 5415C), and the final pellet was
resuspended in 150 ml of TAE buffer (0.04 M Tris acetate, 0.01 M EDTA).
To release the DNA content from the spores, 150 mg of 0.1 mm glass beads were added
to each tube and shaken with a BulletBlender™24 bead-beater (Next Advance, Inc., Averill
Park, NY, USA) for 1 min at the maximum speed. The tube was then immediately placed onto a
hot plate at 95 °C for 3–5 min, after which it was placed on ice. Suspension was checked again
under the phase contrast optics for ruptured spores and used directly or diluted 10 or 100 times as
a DNA template for PCR amplification (Vossbrinck et al., 2004).
83

PCR and sequencing procedures, and draft genome assembly as a source of tubulin sequences
The ssrRNA sequence from the Louisiana isolate of A. penaei (A. penaei–LA) was
amplified using a PCR procedure with 1–3 μl of ruptured spore suspension as a DNA template,
the OneTaq® Quick-load® master mix (New England Biolabs, Inc., Ipswich, MA, USA), and
the following primers: 18f (5′-CAC CAG GTT GAT TCT GCC TGA C-3′) and 1492r (5′-GGT
TAC CTT GTT ACG ACT T-3′) (Vossbrinck et al., 2004). Each PCR cycle included an initial
denaturation step at 95 °C for 5 min, followed by 35 cycles with a denaturation at 95 °C for 30 s,
annealing at 45 °C for 60 s and elongation at 72° for 120 s, with a final extension at 72 °C for
10 min. Amplicons were loaded onto a 2% agarose gel and bands of the expected size (1,200 bp)
were excised and purified using a QIAquick Gel Extraction Kit (QIAGEN, Germantown, MD,
USA). The purified PCR band was sequenced with the Applied BioSystems BigDye Terminator
technology (version 3.1) and the resulting chromatogram was obtained using a Beckman Coulter
Seq 8000 DNA. The primers for sequencing were V1, 530r (5′-CCG CGG C(T/G)G CTG GCA
C-3′), 530f (5′-GTG CCA GC (G/A) GCC GCG G), 1061f (5′-GGT GGT GCA TGG CCG-3′),
and 1492r (Vossbrinck et al., 2004). These primers produced overlapping sequences that were
assembled with ChromasPro. 1.34 software
(http://www.technelysium.com.au/ChromasPro.html). Direct PCR amplification and sequencing
were performed at least twice for each DNA sample from a total of four samples from four
shrimp, collected at different dates. Consensus sequence of the A. penaei small subunit was
deposited in GenBank under accession number KF549987.
The amino acid sequences of the alpha- and beta-tubulins of A. penaei–LA were obtained
from an ongoing genome sequencing project of this isolate and were deposited in GenBank
84
under the accession number PRJNA206557. Preliminary genome assembly was obtained by
subjecting DNA isolated from clean spores of A. penaei to Illumina MiSeq with 250 bp paired
ends; a procedure that produced 12,855,013 pairs of reads. Paired-end reads were later assembled
with MIRA v3.9.18 and the assembly was mined locally for genes encoding α- and β-tubulins
using tBLASTX and tBLASTn (Altschul and Koonin, 1998). This search retrieved one single
orthologue of each gene. The sequences were deposited in GenBank under accession numbers
KJ579182 (alpha-tubulin) and KJ579183 (beta-tubulin).
Phylogenetic analysis
For the ssrRNA phylogeny, 50 sequences were retrieved from GenBank. The selected
sequences included the closest matches in a BLAST search and other sequences of microsporidia
that infect crustaceans and fish (Table 2). In addition, the sequences of microsporidia for which
alpha- and beta-tubulin genes were available were added to the datasets for consistent
comparison of topologies of the ssrRNA- and tubulin genes-inferred trees. One of the important
goals we pursued in reconstructing ssrDNA-based phylogeny was to discover how the novel
species is related to other microsporidia parasitising decapods, including the Thailand isolate of
A. penaei (A. penaei–Thai). To address this issue and given that eight of 15 ssrDNA sequences
of decapod microsporidia available in GenBank covered only 720–900 bp of the query sequence
(the one of A. penaei–LA), the first alignment we created contained 27 sequences, each 720 bp
long, trimmed at the 5′ end at the position 395 to match the shortest sequence in the set, that of A.
penaei–Thai (DQ342240). The sequence of Enterospora canceri (HE584634) was excluded
from the final analysis because it overlapped with the aligned region of the gene by only 279 bp.
The second dataset contained 42 1232 bp long sequences corresponding to the length of the
85
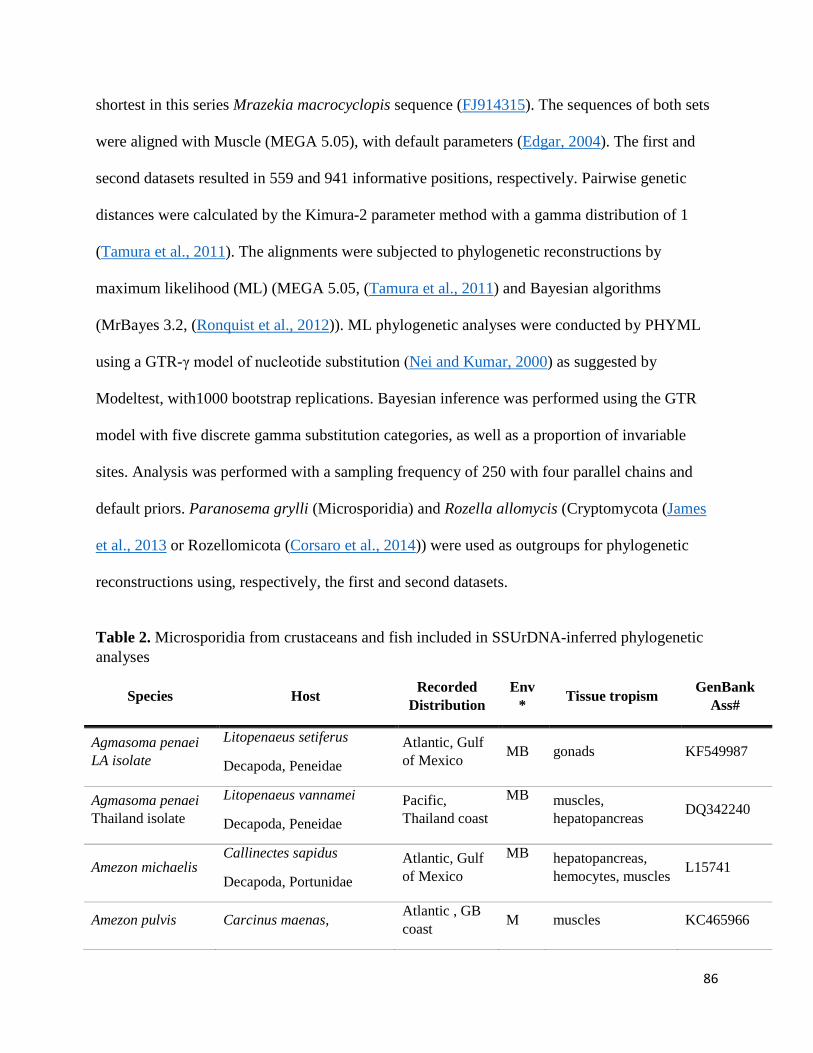
shortest in this series Mrazekia macrocyclopis sequence (FJ914315). The sequences of both sets
were aligned with Muscle (MEGA 5.05), with default parameters (Edgar, 2004). The first and
second datasets resulted in 559 and 941 informative positions, respectively. Pairwise genetic
distances were calculated by the Kimura-2 parameter method with a gamma distribution of 1
(Tamura et al., 2011). The alignments were subjected to phylogenetic reconstructions by
maximum likelihood (ML) (MEGA 5.05, (Tamura et al., 2011) and Bayesian algorithms
(MrBayes 3.2, (Ronquist et al., 2012)). ML phylogenetic analyses were conducted by PHYML
using a GTR-γ model of nucleotide substitution (Nei and Kumar, 2000) as suggested by
Modeltest, with1000 bootstrap replications. Bayesian inference was performed using the GTR
model with five discrete gamma substitution categories, as well as a proportion of invariable
sites. Analysis was performed with a sampling frequency of 250 with four parallel chains and
default priors. Paranosema grylli (Microsporidia) and Rozella allomycis (Cryptomycota (James
et al., 2013 or Rozellomicota (Corsaro et al., 2014)) were used as outgroups for phylogenetic
reconstructions using, respectively, the first and second datasets.
Table 2. Microsporidia from crustaceans and fish included in SSUrDNA-inferred phylogenetic analyses
Species Host Recorded Distribution
Env * Tissue tropism GenBank
Ass#
Agmasoma penaei LA isolate
Litopenaeus setiferus
Decapoda, Peneidae Atlantic, Gulf of Mexico MB gonads KF549987
Agmasoma penaei Thailand isolate
Litopenaeus vannamei
Decapoda, Peneidae Pacific, Thailand coast
MB
muscles, hepatopancreas DQ342240
Amezon michaelis Callinectes sapidus
Decapoda, Portunidae Atlantic, Gulf of Mexico
MB
hepatopancreas, hemocytes, muscles L15741
Amezon pulvis Carcinus maenas, Atlantic , GB coast M muscles KC465966
86
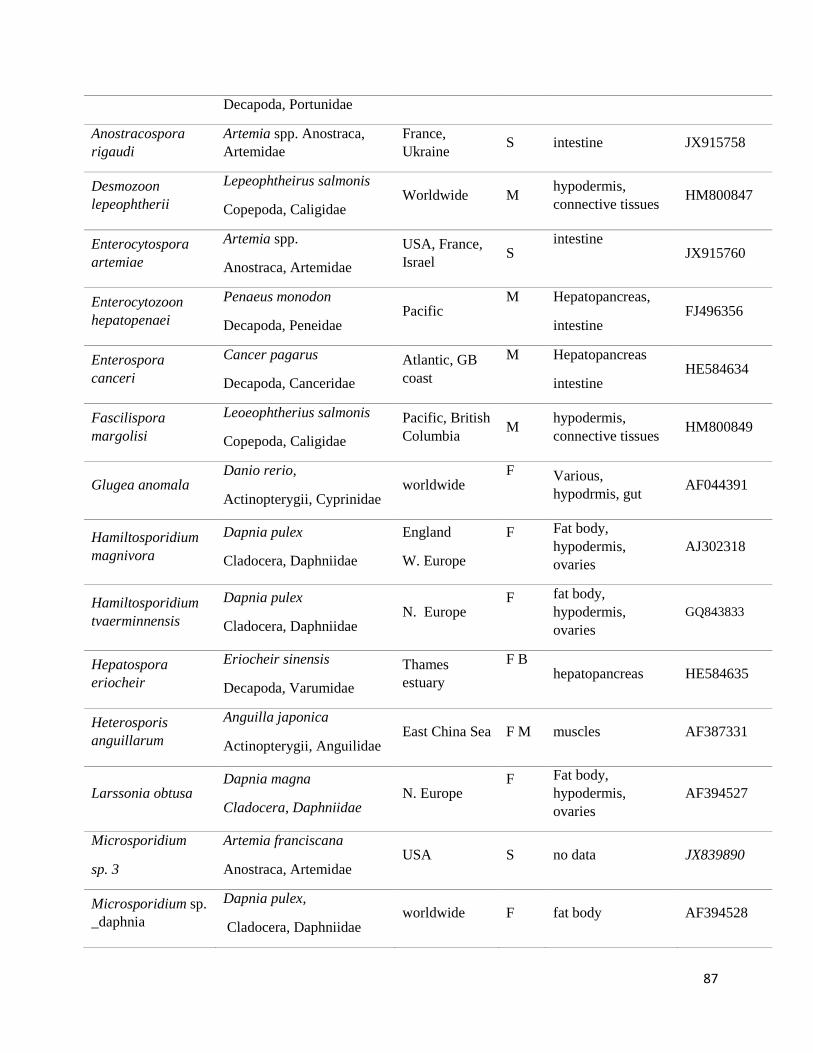
Decapoda, Portunidae
Anostracospora rigaudi
Artemia spp. Anostraca, Artemidae
France, Ukraine S intestine JX915758
Desmozoon lepeophtherii
Lepeophtheirus salmonis
Copepoda, Caligidae Worldwide M hypodermis,
connective tissues HM800847
Enterocytospora artemiae
Artemia spp.
Anostraca, Artemidae USA, France, Israel S
intestine
JX915760
Enterocytozoon hepatopenaei
Penaeus monodon
Decapoda, Peneidae Pacific
M
Hepatopancreas,
intestine FJ496356
Enterospora canceri
Cancer pagarus
Decapoda, Canceridae Atlantic, GB coast
M
Hepatopancreas
intestine HE584634
Fascilispora margolisi
Leoeophtherius salmonis
Copepoda, Caligidae Pacific, British Columbia M hypodermis,
connective tissues HM800849
Glugea anomala Danio rerio,
Actinopterygii, Cyprinidae worldwide
F
Various, hypodrmis, gut AF044391
Hamiltosporidium magnivora
Dapnia pulex
Cladocera, Daphniidae
England
W. Europe
F
Fat body, hypodermis, ovaries
AJ302318
Hamiltosporidium tvaerminnensis
Dapnia pulex
Cladocera, Daphniidae N. Europe
F
fat body, hypodermis, ovaries
GQ843833
Hepatospora eriocheir
Eriocheir sinensis
Decapoda, Varumidae Thames estuary
F B
hepatopancreas HE584635
Heterosporis anguillarum
Anguilla japonica
Actinopterygii, Anguilidae East China Sea F M muscles AF387331
Larssonia obtusa Dapnia magna
Cladocera, Daphniidae N. Europe
F
Fat body, hypodermis, ovaries
AF394527
Microsporidium
sp. 3
Artemia franciscana
Anostraca, Artemidae USA S no data JX839890
Microsporidium sp. _daphnia
Dapnia pulex,
Cladocera, Daphniidae worldwide F fat body AF394528
87

Microsporidium sp. _metapenaeus
Metapenaeus joineri
Decapoda, Peneidae Pacific, Japan coast M muscles AJ295328
Mrazekia macrocyclopis
Macrocyclops albidus
Copepoda, Cyclopidae Europe F fat body FJ914315
Myospora metanephrops
Metanephros challenger
Decapoda,Nephropidae S. Pacific, NZ
M
muscles HM140497
Nadelspora canceri Metacarcinus magister
Decapoda, Canceridae Atlantic
M
muscles AY958070
Nucleospora salmonis
Oncorhynchus tshawytscha
Actinopterygii, Salmonidae Atlantic MF kidney U78176
Perezia nelsoni** Litopenaeus setiferus
Decapoda, Peneidae Atlantic, Gulf of Mexico
MB
muscles AJ252959
Spraguea lophii Lophius spp.
Actinopterygii, Lophiidae worldwide M nervous system AF033197
Thelohania butleri Pandalus jordani, Decapoda, Caridea
Pacific, Canada, coast
M
muscles DQ417114
Thelohania contejeani
Austropotamobius pallipes, Pacifastacus leniusculus
Decapoda, Astacidae Europe F muscles AM261747
Thelohania montirivulorum
Cherax destructor
Decapoda, Parastacidae Australia F uscles AY183664
Triwangia caridinae***
Caridina formosae
Decapoda, Carididae Taiwan F Hepatopancreas,
intestibe, gills JQ268567
Tuzetia weidneri****
Penaeus aztecus
Decapoda, Peneidae Atlantic, Gulf of Mexico MB muscles AJ252958
Outgroup:
Paranosema grylli
Gryllus bimaculatus
Orthoptera, Gryllidae Eurasia T fat body AY305325
*Environment: M– marine; F – fresh water; B – brackish waters; S –salt lakes; T – tererstrian
88
**=Pleistophora sp. LS; **** =Pleistophora sp. (PA) (Cheney et al., 2000); ***=Microsporidia sp. CHW-2012 in GenBank
Agmasoma penaei tubulin gene sequences were retrieved from a draft genome assembly
of this species and used for phylogenetic reconstruction using 24 available sequences from other
microsporidian species and from R.allomycis. Retrieved sequences were aligned using MUSCLE
(Edgar, 2004), and concatenated to produce a supermatrix of 777 amino acids in length. ML
analysis was performed using PHYML with the LG + G + I model as suggested by ProtTest
(Darriba et al., 2011) with 1,000 bootstraps replicates. In parallel, Bayesian analyses were
performed using PhyloBayes (Lartillot et al., 2009)
(http://www.phylo.org/tools/pb_mpiManual1.4.pdf), with the CAT equilibrium frequency
profile, the LG model and four discrete gamma categories, with two chains running until the
maxdiff parameter dropped below 0.1, which is indicative of a good run.
Results
Gross pathology, tissue tropism and light microscopy
The external clinical signs of infection were as follows: (i) cyst-like or small tumour-like
masses located beneath the chitinous cuticle of the carapace (Fig. 1A); (ii) shapeless masses of
tissues located centrally inside the carapace (Fig. 1B); (iii) a narrow elongated formation in the
shape of a cord extending dorsally along the abdomen from the carapace to the last segment (not
shown). All of these formations were white, contrasted well against surrounding tissues and were
clearly visible though the translucent cuticle. Microscopic examination of the white masses
revealed mature spores that completely displaced the host tissue and obscured the nature of the
type of parasitised tissue. Examination of paraffin Luna-stained sections and Epon–Araldite-
89
embedded Methylene blue-stained sections proved that the infection was limited mainly to
hypertrophied gonads (Fig. 1C, D, F). The dorsal cord was in fact the abdominal lobe of the
ovaries. Sub-cuticular “cysts” and small tumour-like formations (Fig. 1A, B, Ea–c) were readily
liberated from infection sites (Fig. 1Eb). The tumour-like growths measured 100–500 μm and
were filled with numerous octets of mature spores enclosed in thin, fragile, easily disrupted
envelopes. Cysts were covered with several layers of flattened haemocytes (Fig. 1Ec). Muscle,
gut epithelium and hepatopancreas were free of parasites, as suggested by examination of
paraffin-embedded Luna stained sections (Fig. 1C, D).
90

Fig.1 Agmasoma penaei: gross pathology and tissue tropism a. Subcuticular cyst-like or small tumor-like masses (arrows) visible through transparent chitinous cuticle. b. Hypertrophied masses of microsporidium-infected ovarian tissue inside the carapace. c, d. Paraffin sections through carapace stained with Luna stain. Tissues infected with microsporidia, ovaries (Ov) and subcuticular spore masses (arrow) are stained pink. c’ demonstrates a region of infected ovaries at higher magnification: tissue is filled with spores. Muscles (Mus) and hepatopancreas (Hep) are not infected. e. 600 nm-thick section of Epon-Araldite-embedded infected ovary, stained with Methylene Blue. Original tissue is completely substituted by microsporidian spores and pre-spore stages (asterisks). f Thick section through subcuticular cysts (C). Cysts are enclosed in thin envelopes (arrow) and covered with several layers of flattened haemocytes (asterisk). f. A periphery of the cyst. f. A cyst liberated from infected
91

shrimp, live preparation. a, b, bar 1cm; c, bar 500 µm; d, bar 250 µm; e, bar 10µm; f, bar 50µm; Figs. c’,f’, bar 5µm; f’’, bar 100µm. Figs c-f, bright field microscopy.
Examination of fresh smears from infected tissues by dark field and phase contrast
microscopy revealed numerous spores. Some spores were enclosed in SVs in sets of eight (Fig.
2A, B), while others were released from fragile SVs as individual spores. Live SVs measured
8.7 ± 0.10 × 7.1 ± 0.11 μm (n = 70), and ranged from 7.0–10.49 × 5.5–9.40 μm. Methanol-fixed
and Trichrome- (Fig. 2C) or Giemsa-stained (Fig. 2D) SVs measured 8.7 ± 0.14 × 7.1 ± 0.11 μm
(n = 40), and ranged from 7.1–10.8 × 5.6–8.8 μm. The membranes of mature SVs were easily
disrupted upon spore maturation and/or physical pressure. For example, even delicate
homogenisation of the infected tissue in a grinder caused splitting of octets into individual
spores. Live spores were 3.5 ± 0.00 × 2.0 ± 0.02 μm (n = 102), ranging from 2.7–4.2 × 1.5–
2.7 μm; methanol-fixed were – 3.3 ± 0.04 × 2.0 ± 0.03 μm (n = 78), ranging from 2.7–4.5 × 1.4–
2.8 μm. In addition to SVs and free spores, roundish pre-spore stages of approximately the same
sizes as SVs (Fig. 2A), and macrospores (5.8 ± 0.16 × 2.8 ± 0.01 μm (n = 10), ranging from 4.7–
7.00 × 2.5–3.13 μm) were occasionally observed. Spores in methanol-fixed smears stained red
with Trichrome. The internal matrices of immature SVs on Trichrome-stained smears were
intensively stained with a counterstain Evans Blue, suggesting the presence of an organic matrix
inside each vesicle (Fig. 2C). Staining with Giemsa revealed the following stages: stages with
paired nuclei (Fig. 2Da), stages with a single nucleus (Fig. 2Db, Dc), and cells with two to eight
nuclei, some in the process of division (Fig. 2Dc–Dg). Sporonts split into individual sporoblasts
at the eight-nucleate stage within the pansporoblast membrane (which upon spore maturation
became a SV membrane) (Fig. 2Dg, Dh). Normally each SV contained eight spores (Fig. 2Ea),
but SVs with four, two or one “macrospores” were not uncommon (Fig. 2Eb, Ec) probably due
92
to teratogenic sporogony. Spores, especially those liberated from subcuticular cysts, readily fired
on smears (Fig. 2G). The length of a polar tube was approximately 40 μm. Staining with
Calcofluor allowed us to distinguish between mature and immature spores: the future chitinous
wall of immature spores was not completely formed and did not bind Calcofluor stain, while
spore walls of mature spores exhibited bright fluorescence (Fig. 2Fa,b). Spores within SVs
contained a single round or slightly elongated nucleus, clearly visible on DAPI- or Giemsa-
stained smears (Fig. 2Ea, Fa,b).
93

Fig.2 A. penaei: light microscopy: spores and stages on smears a. Fresh smears from infected tissues under dark field optics. Octets of spores (black arrows), free spores liberated from sporophorous vesicles (SVs) (white arrows), and round sporonts (black arrowhead) are in the view. b. Two SVs at higher magnification, each containing eight pyriform spores. A round depression inside a spore (white thin arrow) corresponds to the posterior vacuole. c. SVs and a macrospore (asterisk) on a methanol-fixed and Trichrome-stained smear: chitin component of spore walls is stained red, SV internal matrix - blue. d,e. Stages of the microsporidium lifecycle on methanol-fixed smears stained with Giemsa. d1, a stage with paired nuclei; d2, a stage with a single nucleus, presumably the product of merging of diplokaryon counterparts; d3, spores (S) and sporonts (SP) with 1 – 5 nuclei; arrow points to stages with a dividing nucleus. d4, a stage with the nucleus in the process of division; d5, 4-nucleate sporont; d6,d7, eight-nucleate sporonts splitting into 8 sporoblast; d8, immature SVs with sporoblasts, surrounded by more intensively stained mature spores, that had liberated from SVs; e1, arrow points to SV with eight mature spores; e2, SV with 4 teratogenous macrospores; e3, SV with only one
94

teratogenous macrospore. f. Gimsa-stained smear showing bi- and multi-nucleate sporonts (arrowheads), and sporophorous vesicles with mature spores. Extruded polar tubes are arrowed. g. A smear double-stained with Calcofluor and DAPI (left image, fluorescent microscopy; right image, bright field). Calcofluor stains exclusively mature spores with formed chitinous wall (arrowheads). SVs with immature spores are indicated by arrows. An immature macrospore is marked by an asterisk. a, c, f, g, bar 1 µm; b, d, e, bar 5µm
Scanning electron microscopy (SEM)
Masses of SVs were visible in SEM samples of infected tissues. SVs appeared as sacs
with eight spores inside or as “elastic” SV envelopes tightly enclosing spores (Fig. 3). Some SVs
were broken and split in half, exhibiting an internal carcass which isolated spores from each
other (Fig. 3A). Spores liberated from SVs were pyriform with relatively smooth surfaces (Fig.
3B). Fine tubules derived from the surface of some SVs and occasionally the tubules were
associated with accumulation of filamentous material (Fig. 3C).
Fig. 3 A. penaei : scanning electron microscopy a. Infected tissue is seen as a mass of sporophorous vesicles (SV) and free spores (S) liberated from SVs.
95
b. Some SVs are broken and exhibit internal carcass, which isolates spores from each other within a SV (black arrows). c. “Elastic” SVs’ envelopes tightly enclose the spores inside. Fine tubules derive from the surface of some SVs (white arrows). Accumultions of filamentous material
Transmission electron microscopy (TEM)
The earliest stages observed in TEM were diplokaryotic meronts (Fig. 4A). Meronts
divided by binary fission; cells with two diplokaryons and diplokaryons in the process of
division were not uncommon (Fig. 4Ba). Diplokaryotic meronts were often seen in chains, their
nuclei exhibiting tight contact between two nucleus counterparts. Numerous vesicles and
vacuoles, some of which derived from the enlarged regions of perinuclear space, were scattered
over their cytoplasm (Fig. 4A, Ba). A meront was surrounded by a single electron-dense
membrane of approximately 16 (13–19) nm thick. The integrity of the envelope was occasionally
interrupted by electron-dense structures resembling pores, associated with tubular-like structures
presumably excreted by meronts in the surrounding host cytoplasm (Fig. 4Ba,b). After a series of
divisions, dikaryotic cells underwent transformation; their cytoplasm became denser and
electron-dense structures appeared in the nuclei and surrounding cytoplasm. These structures
often accumulated at the cell periphery in the vicinity of the cell membrane (Fig. 4Ca). The
contact between nucleus counterparts became looser and four distinct membranes could be
distinguished in the zone of contact (Fig. 4Ca, Cb). These changes indicated approaching
karyogamy and meiosis. At the next stage of the life cycle, which can be designated as a sporont
(or the mother cell of sporoblasts), synaptonemal complexes became visible in the nucleoplasm,
indicating initiation of meiosis (Fig. 4Da, Db). The contact between diplokaryon counterparts
was barely detectable (Fig. 4Da). The most characteristic feature of this stage was an abundance
of membrane profiles, cisternae, vacuoles and membrane whorls inside the cytoplasm. Some
cisternae contained strips of electron-dense material (Fig. 4Da). While sporont mother cells were
96
undergoing meiosis, an additional layer split off the sporont envelope extracellularly,
corresponding to the envelope of a future SV (Fig. 4Ea, Eb). The space between two envelopes
(episporontal space) ultimately expanded and was filled with homogenous secreted material
composed of fine granules (Fig. 5Aa, B). The electron-transparent cells surrounded by halos of
dense secretions, deposited inside episporontal spaces (Fig. 5Aa), were the second most
abundant stage in sections through infected tissues, after SVs with mature spores. The clumps of
tubular material resulting from meront secretion (Fig. 4Bb) were consistently observed adjacent
to SV envelopes (Fig. 5Aa). Sporont envelopes looked uneven due to deposits of electron-dense
material (Fig. 5Aa,b). Each sporont contained a large centrally located nucleus. The presence of
spindle plaques and kinetochore-like structures (Fig. 5Aa,c) suggested some cells were in the
process of nuclear division. At the next stage, referred to as a multinucleate sporont, at least two
peripherally-located nuclei could be observed inside the parasite cells (Fig. 5B). The envelopes
around sporonts became continuous and thicker (39–47 μm thick). Simultaneously, electron-
dense inclusions appeared within SV lumens (Fig. 5B). In the cell cytoplasm, the strips of
electron-dense material deposited inside membrane cisternae became more numerous. Roundish
vacuoles with an electron-dense core and whorls of membranes were typical components of
sporonts at this stage (Fig. 5B). Multinucleate sporonts eventually split into eight sporoblasts
(Fig. 5E, F), and transitional cells of irregular shape were occasionally seen in sections through
infected ovaries (Fig. 5C, D, F). Nuclei with adjacent cytoplasm were isolated from each other
by the cisternae with strips of electron-dense material and invaginations of the sporont envelope.
SVs containing sporoblasts were filled with material similar in consistency and thickness to the
sporoblast walls (Fig. 5E). Sporoblasts were uninucleate and demonstrated vacuolated cytoplasm
with numerous membrane cisternae and vesicles, among which a large container, presumably
97

with the precursor of the anchoring disk, could be distinguished. Sporoblasts were enclosed in
35–45 nm thick envelopes (Fig. 6A, B). Mature spores resided in SVs, each limited by a thin
membrane. The tubular electron-dense secretion was not observed in SVs with mature spores
(Fig. 6D).
Fig. 4 A. penaei: transmission electron microscopy: merogony a,b Eraly diplokaryotic meronts. a, After completing the cytokinesis cells are keeping together in chains; b, a meront with two not yet dissociated diplokaria (DK). Arrow points to a spindle plaque. Enlarged
98
regions of perinuclear space are indicated by asterisks. Tubular-like structures (insert b-i) are released into host cytoplasm through electron dense structures resembling pores (arrowheads). V, vacuoles derived from perinuclear space. c. Late diplokaryotic meronts with denser cytoplasm and characteristic electron-dense structures scattered through nucleoplasm (white arrows) and cytoplasm (black arrows). At this stage all four membranes can be distinguished in the zone of contact of DK counterparts (insert c-i). Asterisks indicate tubular material secreted at the earlier stage. d. The meront-sporont transitional stage is undergoing meiosis marked by synaptonemal complexes in the nucleoplasm (insert d-i). The zone of contact between nuclei of the former diplokaryon (arrowhead) can be hardly seen. Numerous membrane profiles (asterisks) appear in the cytoplasm. Some of them contain stripes of electron dense material (arrow). e. An additional membrane corresponding to the wall of a future sporophorous vesicle, appears outside the sporont envelope at the transitional meront-sporont stage (arrows, insert e-i). N, nucleus with synaptonemal complexes. c,d,e,b-i, e-i, bar 500 nm; c-i, d-i, bar 250 nm.
99
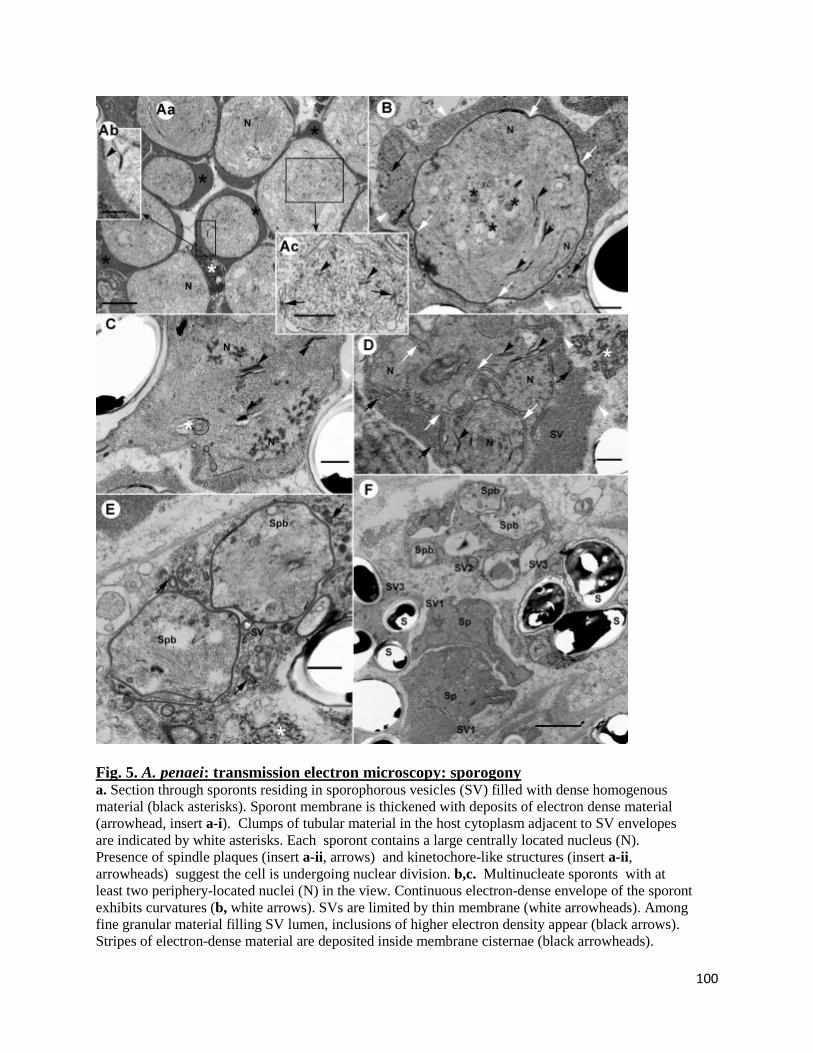
Fig. 5. A. penaei: transmission electron microscopy: sporogony a. Section through sporonts residing in sporophorous vesicles (SV) filled with dense homogenous material (black asterisks). Sporont membrane is thickened with deposits of electron dense material (arrowhead, insert a-i). Clumps of tubular material in the host cytoplasm adjacent to SV envelopes are indicated by white asterisks. Each sporont contains a large centrally located nucleus (N). Presence of spindle plaques (insert a-ii, arrows) and kinetochore-like structures (insert a-ii, arrowheads) suggest the cell is undergoing nuclear division. b,c. Multinucleate sporonts with at least two periphery-located nuclei (N) in the view. Continuous electron-dense envelope of the sporont exhibits curvatures (b, white arrows). SVs are limited by thin membrane (white arrowheads). Among fine granular material filling SV lumen, inclusions of higher electron density appear (black arrows). Stripes of electron-dense material are deposited inside membrane cisternae (black arrowheads).
100
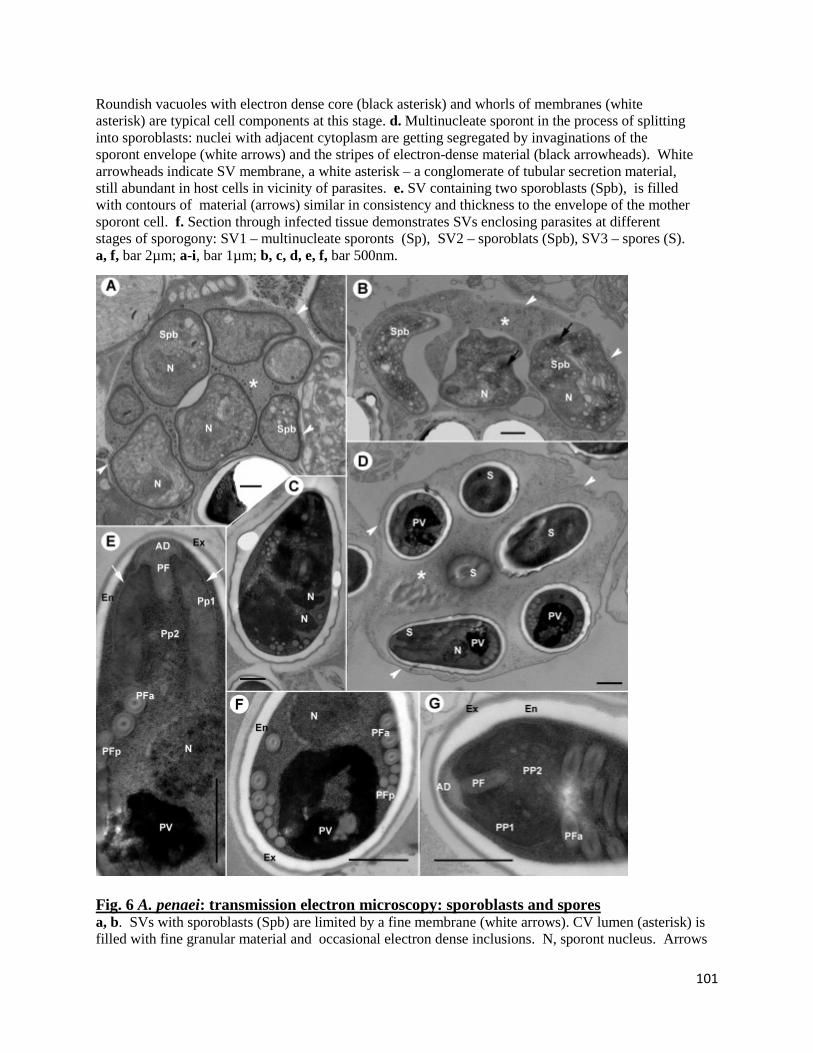
Roundish vacuoles with electron dense core (black asterisk) and whorls of membranes (white asterisk) are typical cell components at this stage. d. Multinucleate sporont in the process of splitting into sporoblasts: nuclei with adjacent cytoplasm are getting segregated by invaginations of the sporont envelope (white arrows) and the stripes of electron-dense material (black arrowheads). White arrowheads indicate SV membrane, a white asterisk – a conglomerate of tubular secretion material, still abundant in host cells in vicinity of parasites. e. SV containing two sporoblasts (Spb), is filled with contours of material (arrows) similar in consistency and thickness to the envelope of the mother sporont cell. f. Section through infected tissue demonstrates SVs enclosing parasites at different stages of sporogony: SV1 – multinucleate sporonts (Sp), SV2 – sporoblats (Spb), SV3 – spores (S). a, f, bar 2µm; a-i, bar 1µm; b, c, d, e, f, bar 500nm.
Fig. 6 A. penaei: transmission electron microscopy: sporoblasts and spores a, b. SVs with sporoblasts (Spb) are limited by a fine membrane (white arrows). CV lumen (asterisk) is filled with fine granular material and occasional electron dense inclusions. N, sporont nucleus. Arrows
101
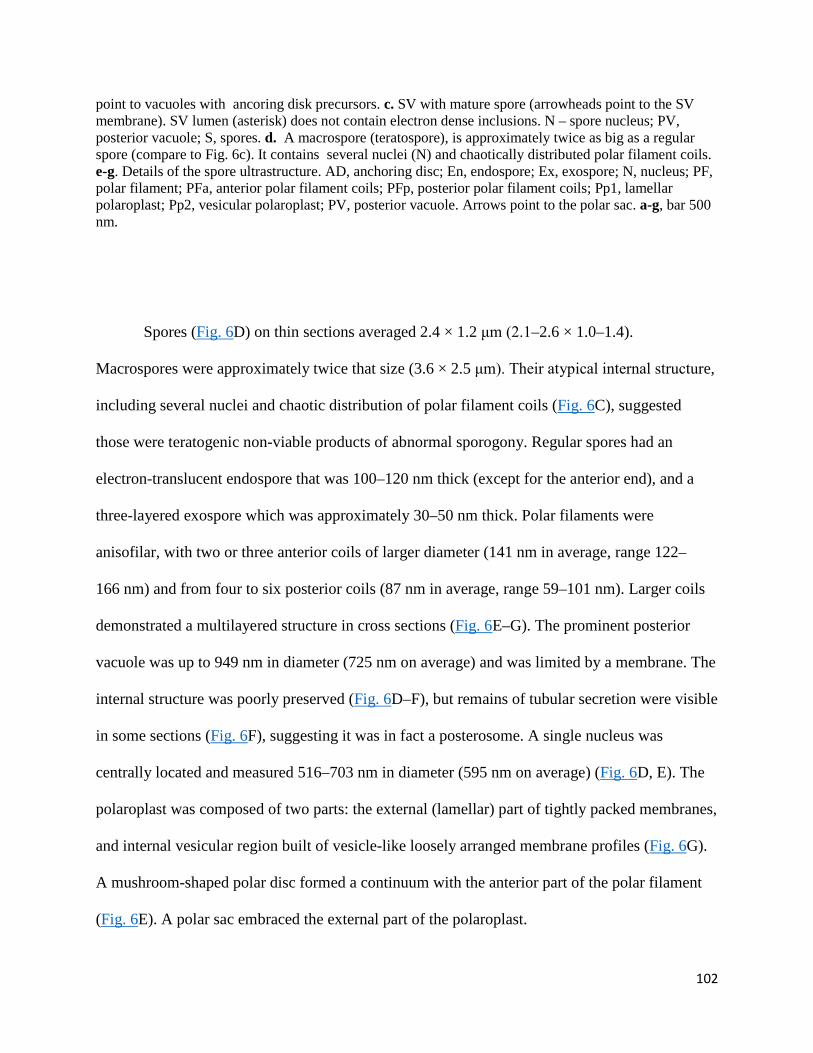
point to vacuoles with ancoring disk precursors. c. SV with mature spore (arrowheads point to the SV membrane). SV lumen (asterisk) does not contain electron dense inclusions. N – spore nucleus; PV, posterior vacuole; S, spores. d. A macrospore (teratospore), is approximately twice as big as a regular spore (compare to Fig. 6c). It contains several nuclei (N) and chaotically distributed polar filament coils. e-g. Details of the spore ultrastructure. AD, anchoring disc; En, endospore; Ex, exospore; N, nucleus; PF, polar filament; PFa, anterior polar filament coils; PFp, posterior polar filament coils; Pp1, lamellar polaroplast; Pp2, vesicular polaroplast; PV, posterior vacuole. Arrows point to the polar sac. a-g, bar 500 nm.
Spores (Fig. 6D) on thin sections averaged 2.4 × 1.2 μm (2.1–2.6 × 1.0–1.4).
Macrospores were approximately twice that size (3.6 × 2.5 μm). Their atypical internal structure,
including several nuclei and chaotic distribution of polar filament coils (Fig. 6C), suggested
those were teratogenic non-viable products of abnormal sporogony. Regular spores had an
electron-translucent endospore that was 100–120 nm thick (except for the anterior end), and a
three-layered exospore which was approximately 30–50 nm thick. Polar filaments were
anisofilar, with two or three anterior coils of larger diameter (141 nm in average, range 122–
166 nm) and from four to six posterior coils (87 nm in average, range 59–101 nm). Larger coils
demonstrated a multilayered structure in cross sections (Fig. 6E–G). The prominent posterior
vacuole was up to 949 nm in diameter (725 nm on average) and was limited by a membrane. The
internal structure was poorly preserved (Fig. 6D–F), but remains of tubular secretion were visible
in some sections (Fig. 6F), suggesting it was in fact a posterosome. A single nucleus was
centrally located and measured 516–703 nm in diameter (595 nm on average) (Fig. 6D, E). The
polaroplast was composed of two parts: the external (lamellar) part of tightly packed membranes,
and internal vesicular region built of vesicle-like loosely arranged membrane profiles (Fig. 6G).
A mushroom-shaped polar disc formed a continuum with the anterior part of the polar filament
(Fig. 6E). A polar sac embraced the external part of the polaroplast.
102
Phylogenetic relationship of A. penaei–LA with other microsporidia based on ssrRNA
The recovered 1271 nucleotide sequence of ssrDNA of A. penaei–LA shared significant
similarities with many orthologues deposited in gene databases and particularly with a 720 bp
long sequence from A. penaei Thai (DQ342240). The pairwise divergence value (“evolutionary
distance”) between two geographical isolates of A. penaei was 0.066, as suggested by pairwise
distance analyses of the alignment of 27 × 720 nucleotide long sequences (Table 3). Alignment
of ssrDNA sequences of Thailand and Louisiana A. penaei isolates revealed several mismatches,
including a 4 bp repeat that appears to be specific to the Thailand isolate (Fig. 7). The genetic
similarity of the Agmasoma isolates was closest to Enterocytozoon hepatopenaei (value of
sequence divergence, 0.278) and Hepatospora eriocheir (0.282), the parasites of decapods, M.
macrocyclopis (0.276) and Desmozoon lepeophtherii (0.284), microsporidia infecting free-living
and parasitic copepods, respectively, Microsporidium sp. from cladocerans of the genus Daphnia
(0.257) and Nucleospora salmonis (0.281) from fish. Other sequences in this alignment,
including those belonging to microsporidia from decapods and penaeid shrimps, exhibited only
0.383–0.535 of ssrDNA sequence divergence with the A. penaei–LA sequence. The most
divergent sequence (0.535) in this series was the one of Ameson michaelis, the microsporidium
infecting blue crabs, Callinectes sapidus, which shares habitat with L. setiferus in the Gulf of
Mexico. On the phylogenetic tree (Fig. 8), most sequences of microsporidia from decapod
crustaceans split among two major well-supported lineages. Only Areospora rohanae clustered
with the Hamiltosporidium branch, although with extremely low support, leaving the position of
this species unresolved. Most decapod taxa appeared to belong to the lineage which also
included microsporidia infecting fish (Sparguea lophii, Glugea anomala and Heterosporis
103
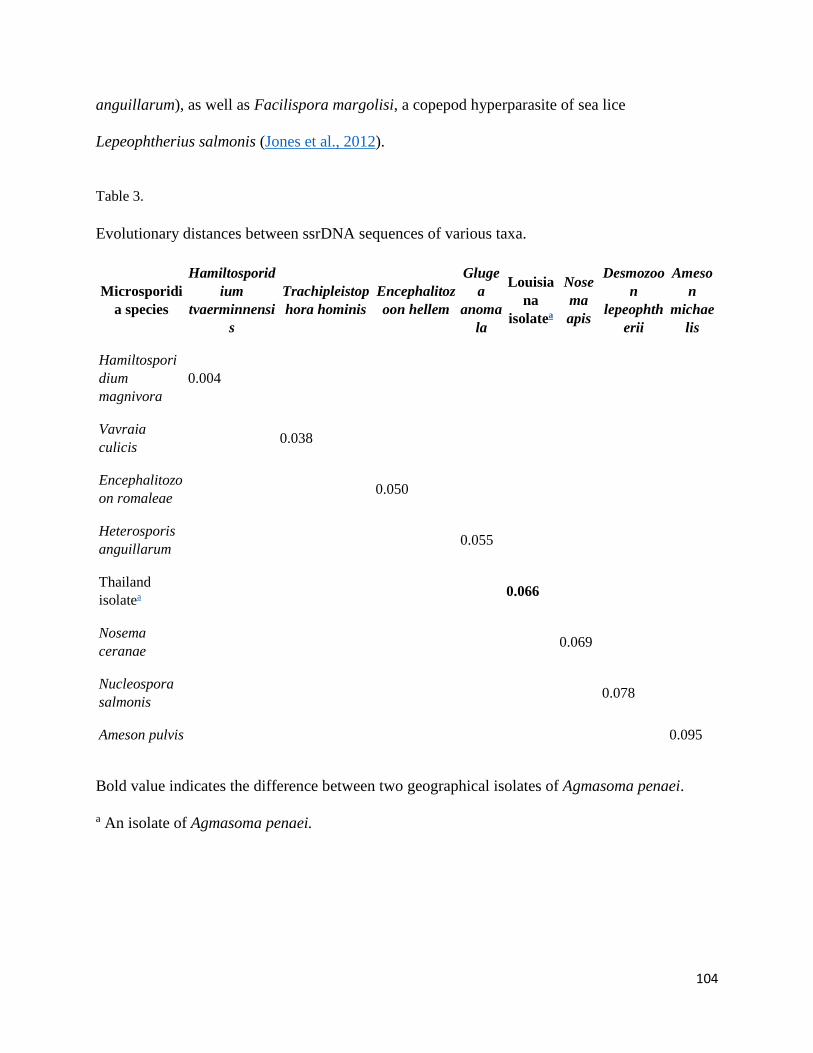
anguillarum), as well as Facilispora margolisi, a copepod hyperparasite of sea lice
Lepeophtherius salmonis (Jones et al., 2012).
Table 3.
Evolutionary distances between ssrDNA sequences of various taxa.
Microsporidia species
Hamiltosporidium
tvaerminnensis
Trachipleistophora hominis
Encephalitozoon hellem
Glugea
anomala
Louisiana
isolatea
Nosema apis
Desmozoon
lepeophtherii
Ameson
michaelis
Hamiltosporidium magnivora
0.004
Vavraia culicis 0.038
Encephalitozoon romaleae 0.050
Heterosporis anguillarum 0.055
Thailand isolatea 0.066
Nosema ceranae 0.069
Nucleospora salmonis 0.078
Ameson pulvis 0.095
Bold value indicates the difference between two geographical isolates of Agmasoma penaei.
a An isolate of Agmasoma penaei.
104
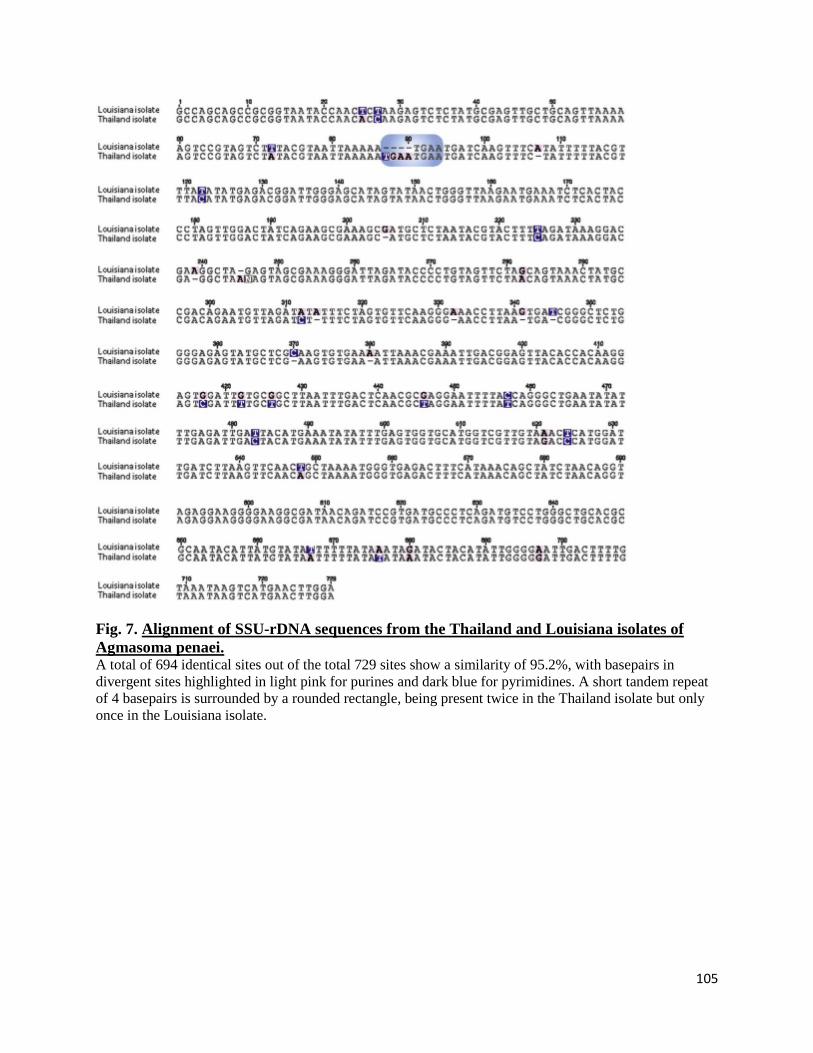
Fig. 7. Alignment of SSU-rDNA sequences from the Thailand and Louisiana isolates of Agmasoma penaei. A total of 694 identical sites out of the total 729 sites show a similarity of 95.2%, with basepairs in divergent sites highlighted in light pink for purines and dark blue for pyrimidines. A short tandem repeat of 4 basepairs is surrounded by a rounded rectangle, being present twice in the Thailand isolate but only once in the Louisiana isolate.
105

Fig. 8. SSUrDNA-inferred phylogenetic analysis by Maximum Likelihood method. Consensus tree based on 559 informative positions of twenty seven 720 bp-long microsporidian sequences. The branches with less that 70% node support are shown as polytomies. Microsporidia infecting marine and brackish water decapods (underlined) fell in two well supported lineages. The Agmasoma branch clusters within the lineage 2.
In our phylogenetic reconstructions, A. penaei-LA clustered together with A. penaei-
Thai, within a lineage that included two microsporidia from decapods, E. hepatopenaei and H.
106
eriocheir, as well as Microsporidium sp. from Daphnia, the dichotomy D. lepeophtherii–N.
salmonis, and M. macrocyclopis from a free-living copepod Macrocyclops albidus. The latter
taxa clustered with moderate but statistically confident support with the A. penaei branch. The
Thelohania spp., Hamiltosporidium spp. and Larssonia obtusa branches formed separate
lineages.
Bayesian and ML analyses applied to the second alignment of 42 × 1271 bp long
sequences resulted in an identical tree topology (Fig. 9A). The increase in informative characters
and the number of included taxa, as well as elimination of short sequences, did not affect
branching of the remaining taxa (Figs. 8 and 9A), but better resolved the position of A. penaei–
LA. Specifically, the latter appeared as a basal and significantly diverged taxon (Fig. 9A;
Supplementary Table S1), falling within a dichotomy with a cluster of species containing
crustacean microsporidia (M. macrocyclopis and two species from Artemia), as well as human
microsporidium Vittaforma corneae and Endoreticulatus sp. from lepidopterans. The
Agmasoma–Mrazekia–Endoreticulatus lineage was well supported and emerged as a sister group
to the Nucleospora–Enterocytozoon clade (Fig. 9A).
107

108

Fig.9. Microsporidian phylogeny inferred from (A) SSU-rDNA and (B) the concatenation of the alpha and beta tubulin genes. Taxa belonging to major microsporidian clades (after Vossbrinck and Debrunner-Vossbrinck, 2005) are surrounded by rounded rectangles. Genus names belonging to taxa present in both phylogenies are highlighted in bold. Bootstrap values of Maximum likelihood analyses performed using PhyML (LG + I + Γ4 model of evolution) are shown first, followed by posterior probabilities of Bayesian analyses performed with MrBayes (GTR + I + Γ4 model of evolution) for the (A) SSU-rDNA phylogeny and PhyloBayes (CATLG + I + Γ4 model of evolution) for the (B) alpha-beta tubulin phylogeny. Black circles indicate bootstrap values and Bayesian posterior probabilities of 100%. Scale bar corresponds to 0.2 substitutions per site.
Overall, the resulting tree identified several clades (Fig. 9A) with branching in good
agreement with previously published ssrDNA-inferred phylogenies (Stentiford et al., 2010,
109
Stentiford et al., 2013a, Stentiford et al., 2013b, Jones et al., 2012 and Rode et al., 2013). The
two clades with highest support were the Ameson–Trachipleistaphora–Glugea–Spragiea clade
and the Nosema–Encephalitozoon–Enterocytozoon–Endoreticulatus–Agmasoma clade. The
former clade corresponded to the clade Marinosporidia (Clade II, microsporidia of saltwater
origin sensu Vossbrinck, Debrunner-Vossbrinck, 2005), and contained all microsporidia from
decapods presented in this analysis, except for A. penaei. The latter was congruent with the clade
Terresporidia (Clade IV, microsporidia of terrestrial origin sensu Vossbrinck, Debrunner-
Vossbrinck, 2005) and included A. penaei.
Phylogenetic relationship of A. penaei–LA with other microsporidia based on alpha- and beta-
tubulin sequences
Phylogenetic reconstructions performed using a concatenation of α- and β-tubulin
sequences resulted in well-supported nodes (Fig. 9B), with a branching that is in overall
agreement with previous analyses based on the same genes (Lee et al., 2008 and Corradi et al.,
2009). The tubulin phylogeny strongly confirmed the placement of A. penaei within the Clade IV
sensu Vossbrink, Debrunner-Vossbrinck (2005), and highlighted an extreme divergence of the A.
penaei branch.
Taxonomic summary
In this study we provide the taxonomic description of the genus Agmasoma and its type
species A. penaei,, updating that of Hazard and Oldacre (1975).
For the genus Agmasoma Hazard and Oldacre 1975, development includes one sequence
that produces octospores within SVs. Diplokaryotic meronts divide by binary fission.
110
Uninucleate sporonts undergo meiosis to produce an eight nucleate stage, in which plasmatomy
occurs via internal budding (multiple division by vacuolation) and gives rise to eight sporoblasts.
The pansporoblast membrane segregates externally from the sporont envelope. Spores have
anisofilar polar filaments. Agmasoma spp. parasitises shrimps of the family Penaeidae
worldwide.
Features of A. penaei (Sprague, 1950) Hazard and Oldacre, 1975
Agmasoma penaei (Sprague, 1950) Hazard and Oldacre, 1975 is a synonym of
Thelohania penaei Sprague 1950 (Sprague, 1950). Merogony and sporogony as described for the
genus. Late multinucleate sporonts are limited by electron-dense envelopes and enclosed in a
pansporoblast membrane; expanded episporontal spaces are filled with dense secretion.
Uninucleate sporoblasts with vacuolated cytoplasm and 35–45 nm thick envelopes reside inside
SVs filled with granular and tubular secretions. Pyriform spores measure 2.7–4.2 × 1.5–3.7 μm;
occasional teratogenic spores (macrospores) measure 4.7–7.00 × 2.5–3.13 μm. A mature spore
displays an anisofilar (2–3 + 4–6 coils) polar tube, bipartite polaroplast and large posterosome. A
spore wall consists of an electron-translucent endospore (100–120 nm) and exospore (30–
50 nm). SVs are subspherical, 7.0–10.49 × 5.5–9.40 μm and limited by a thin membrane.
Lumens of SVs are electron-lucent, without tubular secretion. We include the ssrDNA sequence
with the GenBank accession number KF549987 in the diagnosis of this species. The type host is
Litopenaeus setiferus Linnaeus, 1767. The type locality is defined as the Gulf of Mexico,
offshore from Plaquemines and Jefferson Parishes, Louisiana, USA. The site of infection is in
the female gonads and nodules, presumably produced from hypertrophied phagocytes,
overloaded with spores, surrounded by haemocyte layers.
111
Type material
As we were unable to identify the location of type material, we designate neotype
material, which includes: (i) neosyntype slides with Trichrome and Giemsa-stained smears from
infected tissues and with Methylene blue-stained thick sections, labelled “Ap-Ls_2012LA” (Nos.
01–22) deposited to the slide collection of the Institute of Plant Protection, St. Petersburg, Russia
(“Dr. Issi’s collection”) and stored in the private collection of Y. Sokolova; (ii) TEM blocks of
Epon–Araldite-embedded ovary tissues of shrimps infected with A. penaei (labelled “case12-
053”; “case12-119”) stored in the private collection of Y. Sokolova; (iii) EM images labelled
2012-06-08_Ap-Ls: 001-086 deposited to the database of the Core Microscopy Center of SVM,
LSU, Baton Rouge, LA, USA; and (iv) frozen purified A. penaei spores and samples of DNA
isolated from these spores, stored in the Core Microscopy Center, SVM LSU, Baton Rouge LA,
USA and in the laboratory of Nicolas Corradi at the Canadian Institute for Advanced Research,
Department of Biology, University of Ottawa, Canada.
Discussion
The Louisiana, Thailand and Senegal isolates of A. penaei demonstrated similar
morphology of spores and stages of intracellular development. All three isolates produce octets
of pyriform mononucleate spores. The anisofilar polar filament with a straight manubrial part
and a coiled region composed of two to three broad anterior and four to six narrow posterior
coils, is a synapomorphy shared by all A. penaei isolates, which differentiates the genus
Agmasoma from other octosporogenic Thelohania-like genera (Hazard and Oldacre, 1975).
Despite structural similarity, the average size and proportions of spores reported for the Senegal
isolate (4.7 × 2.9 μm, length-to-width ratio (l/w) = 1.6 (Clotilde-Ba and Toguebaye, 1994)
112
differed significantly from the Louisiana (3.7 × 2.1 μm, l/w = 1.8) (herein) and the Thailand
(3.6 × 2.1 μm, l/w = 1.7) (Laisutisan et al., 2009) isolates.
The information about ultrastructure of pre-spore stages of the Senegal and especially of
the Thailand isolate is scarce, and only a few features can be compared properly. All three
isolates definitely possess a diplokaryotic stage at the onset of sporogony and share the same
mode of sporont division – i.e. “not by budding, but instead, by a delayed aggregation of
protoplasm after three nuclear divisions to form eight spores” (Hazard and Oldacre, 1975). In all
three A. penaei isolates, segregation of individual sporoblasts occurs within a sporont at the
eight-nucleate stage.
The records on the tissue tropism of A. penaei are extremely inconsistent (Table 1). For
example, the A. penaei–Thai isolate was recorded from abdominal muscles and hepatopancreas
of the Pacific white shrimp L. vannamei, whereas the Senegal isolate infected many tissues
including heart musculature, nervous system and gonads of F. notialis and displayed no tissue
specificity at all. Our data confirm that gonads are the primary site of A. penaei infection in the
type host L. setiferus in the type locality, Louisiana coast of the Gulf of Mexico, as it was stated
in the original description of the microsporidium (Sprague, 1950 and Hazard and Oldacre, 1975).
The subcuticular masses of spores, 10–500 nm in diameter, surrounded by haemocyte layers,
probably result from encapsulation of pieces of infected tissues, a common defense reaction
against foreign material in arthropods. Smaller nodule-like formations could be phagocytes
loaded with spores, similar to giant cells described recently in A. rohanae (Stentiford et al.,
2014). We never observed large “xenoma”-type cysts in muscles, such as those reported in F.
notialis infected with the Senegal isolate of A. penaei (Clotilde-Ba and Toguebaye, 1994).
113

Such flexible tissue tropism appears very improbable for one and the same
microsporidium species and may result from misidentification of either the tissues or the parasite
species. Our experience suggests that identification of the tissue of parasite localisation in an
infected shrimp is not easy. The infected gonads are hypertrophied and modified, and spores
contaminate all tissues when isolated from the infected shrimp. We were able to unequivocally
determine the tissues of parasite localisation only in histological sections stained with Luna stain
(Peterson et al., 2011). Moreover, infection of the same shrimp with two or three species of
microsporidia is not unusual (Overstreet, 1973), and some records of multiple tissue tropism
might be attributed to the overlooked double infection. For example, during examination of A.
penaei-infected shrimps for this paper, we found that muscle of two examined animals were co-
infected with Perezia nelsoni (Y. Sokolova and J. Hawke, unpublished observations).
The ssrDNA sequence variations (Fig. 7), as well as the estimated evolutionary distance
between two geographical isolates, suggest that these should rather be considered as separate
species. Indeed, pairwise sequence divergence between the ssrRNA gene of A. penaei isolated
from infected shrimp in the Gulf of Mexico and an orthologue sequence from the Thailand
isolate was 0.066, which is higher than typically recorded intraspecific differences. Comparable
or lesser divergence was observed between congeners. Divergence between ssrDNA sequences
of A. michaelis and Ameson pulvis or Nadelspora canceri (presumably one dimorphic species
(Stentiford et al., 2013a)) was 0.088, and it was as low as 0.004 between ssrDNA genes of
Hamiltosporidium tvaerminnensis and Hamiltosporidium magnivora. Moreover, evolutionary
distances comparable with those separating two A. penaei isolates were found between
representatives of different genera: 0.055 between G. anomala and H. anguillarum and 0.083
between N. salmonis and D. lepeophtherii (Table 3). In the literature, ssrDNA sequences of
114

microsporidia display pairwise distances among congeners ranging from 0.01–0.04 for
Liebermannia spp. (Sokolova et al., 2009), 0.01–0.09 for Amblyospora spp. (Baker et al., 1998),
0.01–0.05 for Paranosema spp. (Sokolova et al., 2003), 0.01–0.03 for Nosema–Vairimorpha spp.
from Lepidoptera (Baker et al., 1994), and 0.03–0.10 for Encephalitozoon spp. (Lange et al.,
2009).
It should be also mentioned here that molecular (Pasharawipas et al., 1994) and
morphological characterisation (Laisutisan et al., 2009) of the Thailand isolate of A. penaei were
performed 15 years apart using different host species (L. vannamei and P. monodon), so it cannot
be excluded that two different forms (strains or species) had been studied in Thailand.
The Senegal isolate can be differentiated from both Louisiana and Thailand isolates by
spore proportions and the ability to produce xenomas, and probably also represents a separate
species. Until more information regarding the ultrastructure and genomics of these and other
strains isolated worldwide is available, we can only speculate that A. penaei represents a cline of
highly related forms, gradually diversifying within penaeid crustaceans over geographical space
and time.
During the unique sporogony of A. penaei, regions of the cytoplasm surrounding sporont
nuclei are isolated from each other by flattened membrane profiles filled with electron-dense
material produced de novo within the sporont cytoplasm (herein; Clotilde-Ba and Toguebaye,
1994). In addition, the envelope of SVs enclosing spore octets at the end of sporogony originates
from the membranous envelope of the eight-nucleate sporont (herein; Clotilde-Ba and
Toguebaye, 1994). Among microsporidia, a similar type of division, termed multiple division by
vacuolisation or internal budding, has been recorded only for two presumably basal groups of
115
microsporidia, metchnikovellids and chytriopsids, as a part of their sac-bound sporogony
(Larsson and Køie, 2006 and Sokolova et al., 2014). Similar to sac-bound sporonts of
metchnikovellids, A. penaei sporonts contained characteristic roundish vacuoles 200–500 nm in
diameter with electron-dense cores, membrane whorls and other membrane structures (Fig. 5B).
In metchnikovellids, however, the whole sporont envelope transforms into a thick cyst wall,
whereas in Agmasoma only a thin submembrane layer of the sporont plasmalemma becomes a
SV membrane. The rest of the membrane thickens to become the wall of the sporoblast mother
cell (the late sporont), which gives rise to sporoblasts. A significant part of this wall seems to
disintegrate during sporulation; in all three isolates studied ultrastructurally, numerous wall
fragment-like inclusions, observed within SVs with sporoblasts and young spores, disappeared
upon spore maturation (Clotilde-Ba and Toguebaye, 1994 and Laisutisan et al., 2009; herein).
Agmasoma development demonstrates that internal budding is not necessarily coupled with cyst-
bound sporogony and might be more widely distributed among microsporidia than has been
previously thought.
The karyogamy of the diplokaryon counterparts and the presence of synaptonemal
complexes (chromosome bivalents in diakinesis) at the onset of sporogony, indicative of meiosis,
followed by three consecutive divisions to produce an octet of spores, are the basal life-cycle
features of microsporidia, probably inherited from a sexual microsporidian-fungal ancestor (Lee
et al., 2008;James et al., 2013), and later eliminated in more derived microsporidian genera such
as Nosema, Encephalitozoon, Enterocytozoon and others.
116
The anisofilar polar filament, with its broad and narrow parts homologous to the
manubrium and manubrial cisternae of metchnikovellids (Sokolova et al., 2013), could also be an
ancestral feature.
Another plesiomorphic feature may be a polyxenous life-cycle (Vossbrinck and
Debrunner-Vossbrinck, 2005), and the presence of an intermediate host in the life cycle of A.
penaei has been suggested by several authors (see below).
White Atlantic shrimp L. setiferus and other seven host species listed for A. penaei (Table
1) all belong to the family Penaeidae. This family represents the suborder Dendrobranchiata and
occupies the basal position on the phylogenetic tree of Decapoda (Porter et al., 2005). The
second suborder Polyciemata, a sister taxon to Dendrobranchiata, unites seven other groups
(infraorders) of extant decapods (Porter et al., 2005 and De Grave et al., 2009). Among the 17
genera of microsporidia recorded from decapods, representatives of four genera (Tuzetia,
Perezia, Enterocytozoon and Agmasoma) are found in penaeid shrimps. The species of the other
13 genera are distributed among four infraorders: Astacidea (crayfish and lobsters, three genera),
Anomura (hermit and snow crabs, two genera), Caridea (shrimps, three genera), and Brachiura
(crabs, five genera) (Canning et al., 2002, Stentiford et al., 2013b and Stentiford et al., 2014).
High divergence of ssrRNA and tubulin genes of A. penaei and the basal position of A. penaei
within the Endoreticulatus–Vittaforma–Agmasoma lineage may reflect a long eco-evolutionary
history of this species with Penaeidae.
Our phylogenetic analyses using tubulin- and small subunit gene sequences consistently
placed A. penaei in the lineage corresponding to the “Clade IV of microsporidia of terrestrial
origin” (Vossbrinck and Debrunner-Vossbrinck, 2005) (Fig. 8 and Fig. 9), together with parasites
117
of brine shrimp, cladocerans and free living copepods inhabiting fresh and salt water inland
reservoirs.
The length of the A. penaei branch, as well as the scarcity of taxa on the tubulin tree,
might be responsible for inconsistency in the position of A. penaei within Clade IV: in small
subunit phylogeny A. penaei clusters with the Vittaforma–Endoreticulatus branch, although with
low statistical support; whilst in alpha- and beta-tubulin phylogeny it clusters with
Enterocytozoon bieneusi. Two microsporidia belonging to distantly related genera, namely
Endoreticulatus sp. Zhenjiang and Nosema bombycis, unexpectedly formed a dichotomy on the
tubulin tree, likely due to an erroneous submission.
Clustering of A. penaei with microsporidia of terrestrial origin parasitising crustaceans
unrelated to penaeids and other groups of hosts also raises ecological considerations. The host of
A. penaei, L. setiferus, plays an exceptional role in the ecology of the Gulf of Mexico coastal
waters, being in the intersection of major food chains. The lifespan of this shrimp contains larval
and early post-larval plankton stages inhabiting river estuaries with low salinity (0.2–10 ppt) and
feeding on algae, insect larvae and small crustaceans, while juveniles and adults are benthic
dwellers migrating far off shore in higher salinity (>35 ppt) sea waters, feeding predominantly on
faecal pellets of fish and invertebrates and becoming, in turn, prey for those (Perez Farfante,
1969 and Muncy, 1984). The life cycle, which includes inhabiting various niches during the life
time, is typical for all extant species of penaeid shrimp and most likely was also characteristic for
their ancestor. Such a lifestyle may have facilitated numerous host switches in the early stages of
Agmasoma evolution, i.e. infection could easily be passed from (to) the shrimp to (from) an
aquatic insect larvae, fresh/brackish water copepod or a fish. As a result, hosts with complicated
118
lifestyles and diverse food habits, such as shrimp or crabs, could play a key role in the
diversification of microsporidia, spreading the parasites along diverse food chains among
terrestrial, freshwater and marine hosts, and perhaps establishing some of the contemporary
host–parasite associations.
The routes of transmission and circulation of A. penaei in marine ecosystems remain
completely unknown. Given the observed infection of female gonads, it may be presumed that
light or benign infection could contribute to transovarial (vertical) transmission. However,
infections of gonads observed during this study as well as by previous authors (Overstreet,
1973 and Kelly, 1979) were always extremely severe and could lead to complete castrations.
Numerous attempts to per-orally infect shrimp with the microsporidium always failed, and it was
hypothesised and supported by a series of circumstantial evidence (Overstreet,
1973 and Johnson, 1995), including application of A. penaei-specific DNA probes (Pasharawipas
and Flegel, 1994), that transmission of A. penaei involves an intermediate host, presumably a
perciform fish. Thus another player, a fish host, might be involved in A. penaei–L. setiferus
interactions, and further studies of this host–parasite system could bring new insights in
uncovering complex ecological bonds within a vulnerable Gulf of Mexico biota, vital for
sustainable shrimp fishery.
The present study also paves the way for future studies based on whole genome analyses,
using A. penaei as a model. Indeed, this species produces a large amount of spores that are easy
to collect and clean, and is thus highly amenable to DNA extraction and next generation
sequencing procedures. To this end, genome sequencing of this species is presently ongoing and
we hope this will result in outstanding insights into mechanisms and tools that A. penaei uses to
119
infect the White Atlantic shrimp. Moreover, this genome sequencing effort may unravel the
presence of many genes that may have resulted from a long-term co-evolution between those
species including horizontal gene transfers, and those involved in the dialogue between A.
penaeia and the shrimp (i.e. effectors and other secreted genes; reviewed in Corradi and Selman,
2013).
Acknowledgements
We acknowledge the Microscopy Core Center of Louisiana State University School of
Veterinary Medicine, USA and funding from Louisiana Department of Wildlife and Fisheries,
USA. We thank Nicolas George (Louisiana State University) for assistance in EM, and two
anonymous reviewers whose suggestions improved the paper. Nicolas Corradi is a fellow of the
Canadian Institute for Advanced research, and his work is supported by Discovery Grants from
the Natural Sciences and Engineering Research Council of Canada. We thank Martin Bourgeois,
Marine Biologist, Louisiana Department of Wildlife and Fisheries and Albert “Rusty” Gaude,
Area Agent of the LSU AgCenter, for information concerning the occurrence of diseased shrimp
and submission of specimens examined in this study.
120

References
Altschul, S.F., Koonin, E.V., 1998. Iterated profile searches with PSI-BLAST – a tool for
discovery in protein databases. Trends Biochem. Sci. 23, 444–447.
Baker, M. D., Vossbrinck, C. R., Becnel, J. J., Andreadis, T. G., 1998. Phylogeny of
Amblyospora (Microsporida : Amblyosporidae) and related genera based on small
subunit ribosomal DNA data: A possible example of host parasite cospeciation. Journal
of Invertebrate Pathology. 71, 199-206.
Baker, M. D., Vossbrinck, C. R., Maddox, J. V., Undeen, A. H., 1994. Phylogenetic relationships
among Vairimorpha and Nosema Species (Microspora) based on ribosomal RNA
sequence data. J. Invertebr. Pathol. 64, 100-106.
Bell, T. A., Lightner, D. V., 1988. A handbook of normal penaeid shrimp histology. World
Aquaculture Society
Canning, E. U., Curry, A., Overstreet, R. M., 2002. Ultrastructure of Tuzetia weidneri sp. n.
(Microsporidia: Tuzetiidae) in skeletal muscle of Litopenaeus setiferus and
Farfantepenaeus aztecus (Crustacea: Decapoda) and new data on Perezia nelsoni
(Microsporidia: Pereziidae) in L. setiferus. Acta Protozoologica. 41, 63-77.
Clotilde-Ba, F. L., Toguebaye, B. S., 1994. Ultrastructure and development of Agmasoma penaei
(Microspora, Thelohaniidae) found in Penaeus notialis (Crustacea, Decapoda, Penaeidae)
from Senegal. European Journal of Protistology. 30, 347-353.
Clotilde-Ba, F. L., Toguebaye, B. S., 2001. Infection of Penaeus monodon (Fabricius,
1798)(Crustacea, Decapoda, Penaeidae) by Agmasoma penaei (Microspora,
Thelohaniidae) in Senegal, West Africa. Bulletin of the European Association of Fish
Pathologists. 21, 157-159.
121
Corradi, N., Haag, K. L., Pombert, J. F., Ebert, D., Keeling, P. J., 2009. Draft genome sequence
of the Daphnia pathogen Octosporea bayeri: Insights into the gene content of a large
microsporidian genome and a model for host-parasite interactions. Genome Biology. 10.
Corsaro, D., Walochnik, J., Venditti, D., Steinmann, J., Müller, K.-D., Michel, R., 2014.
Microsporidia-like parasites of amoebae belong to the early fungal lineage
Rozellomycota. Parasitology Research. 113, 1909-1918.
De Grave, S., Pentcheff, N. D., Ahyong, S. T., Chan, T.-Y., Crandall, K. A., Dworcshak, P. C.,
Felder, D. L., Feldman, R. M., Fransen, C. H., Goulding, L. Y., Lemaitre, R., Low, M. E.,
Martin, J. W., Ng, R. K., Schweltzer, C. E., Tan, S. H., Tshudy, D., Wetzer, R., 2009. A
classification of living and fossil genera of decapod crustaceans. Raffles Bulletin of
Zoology. 1-109.
Edgar, R. C., 2004. MUSCLE: Multiple sequence alignment with high accuracy and high
throughput. Nucleic Acids Research. 32, 1792-1797.
Flegel, T. W., Flegan, D. F., Kongsom, S., Vuthikornudomikit, S., Sriurairatana, S.,
Boonyaratpalin, S., Chantanachookin, C., Vickers, J., MacDonald, O., Occurence,
diagnosis and treatment of shrimp diseases in Thailand. In: W. Fulks, K. Main, Eds.),
Diseases in cultured penaeid shrimp in Asia and the United States. The Oceanic Institute,
Honolulu, HI, 1992, pp. 57-112.
Gunter, G., Some relationships of estuaries to the fisheries of the gulf of Mexico. In: G. A.
Lauff, (Ed.), Estuaries. Am. Assoc. Adv. Sci, 1967, pp. 621-638.
Hazard, E. I., Oldacre, S. W., 1975. Revision of microsporidia (Protozoa) close to Thelohania,
with descriptions of one new family, eight new genera, and thirteen new species.
Technical Bulletin United States Department of Agriculture. 1-104.
122
Hazard, E. I., Oldacre, S. W., Revision of Microsporida (Protozoa) close to Thelohania: with
description of one new family, eight new genera, and thirteen new species., U.S.
Department of Agriculture Technical Bulletin No 1530, 1-104 U.S. Dept of Agriculture,
Agricultural Research Service, 1976.
Hutton, R. F., Sogandares-Bernal, F., Ingles, R. M., Woodburn, K. D., Investigations on the
parasite and deseases of saltwater shrimps (Penaeidae) of sports and commercial
importnace in Florida. Florida Board Conservation Marine Laboratory Technical Series,
1959, pp. 38
Johnson, S. K., Handbook of shrimp diseases. In: D. W. a. F. S. T. A. M. University, (Ed.),
College Station TX, USA 1995, pp. 27.
Jones, S. R. M., Prosperi-Porta, G., Kim, E., 2012. The diversity of microsporidia in parasitic
copepods (Caligidae: Siphonostomatoida) in the northeast pacific ocean with description
of Facilispora margolisi n. g., n. sp. and a new family Facilisporidae n. fam. Journal of
Eukaryotic Microbiology. 59, 206-217.
Kelly, J. F., 1979. Tissue specificities of Thelohania duorara, Agmasoma penaei, and
Pleistophora sp., microsporidian parasites of pink shrimp, Penaeus duorarum. Journal of
Invertebrate Pathology. 33, 331-339.
Laisutisan, K., Prasertsri, S., Chuchird, N., Limsuwan, C., 2009. Ultrastructure of the
microsporidian Thelohania (Agmasoma) penaei in the pacific white shrimp (Litopenaeus
vannamei). Kasetsart Journal - Natural Science. 33, 41-48.
Lange, C. E., Johny, S., Baker, M. D., Whitman, D. W., Solter, L. F., 2009. A new
Encephalitozoon species (Microsporidia) isolated from the lubber grasshopper, Romalea
microptera (Beauvois) (Orthoptera: Romaleidae). Journal of Parasitology. 95, 976-986.
123
Larsson, R., Køie, M., 2006. The ultrastructure and reproduction of Amphiamblys capitellides
(Microspora, Metchnikovellidae), a parasite of the gregarine Ancora sagittata
(Apicomplexa, Lecudinidae), with redescription of the species and comments on the
taxonomy. European Journal of Protistology. 42, 233-248.
Lartillot, N., Lepage, T., Blanquart, S., 2009. PhyloBayes 3: A Bayesian software package for
phylogenetic reconstruction and molecular dating. Bioinformatics. 25, 2286-2288.
Lee, S. C., Corradi, N., Byrnes Iii, E. J., Torres-Martinez, S., Dietrich, F. S., Keeling, P. J.,
Heitman, J., 2008. Microsporidia evolved from ancestral sexual fungi. Current Biology.
18, 1675-1679.
Lightner, D. V., 1996. A handbook of pathology and diagnostic procedures for diseases of
cultured penaeid shrimp. World Aquaculture Society, Baton Rouge LA.
Luna, L. G., 1968. Manual of histologic staining methods of the Armed Forces Institute of
Pathology. The Armed Forces Institute of Pathology, McGraw-Hill, New York.
Miglarese, J. V., Shealy, M. H., 1974. Incidence of microsporidia and trypanorhynch cestodes in
white shrimp, Penaeus setiferus Linnaeus in South Carolina estuaries. Bulletin of the
Southern California Academy of Sciences 36, 93.
Morado, J. F., 2011. Protistan diseases of commercially important crabs: A review. Journal of
Invertebrate Pathology. 106, 27-53.
Muncy, R. J., Species profiles: life histories and environmental requirements of coastal fishes
and invertebrates (south Atlantic): white shrimp. . In: U. S. D. o. I. F. a. W. Service,
(Ed.), FWS/OBS-82/11.27. U.S. Army Corps of Engineers, TR EL-82-4 1984, pp. 19
http://www.sms.si.edu/irlspec/Penaeu_setife.
124
Nei, M., Kumar, S., 2000. Molecular Evolution and Phylogenetics. Oxford University Press,
New York.
Overstreet, R. M., 1973. Parasites of some penaeid shrimps with emphasis on reared hosts.
Aquaculture. 1, 105-140.
Pasharawipas, T., Flegel, T. W., 1994. A specific DNA probe to identify the intermediate host of
a common microsporidian parasite of Penaeus merguensis and P. monodon. Asian
Fisheries Science. 7, 157-167.
Pasharawipas, T., Flegel, T. W., Chaiyaroj, S., Mongkolsuk, S., Sirisinha, S., 1994. Comparison
of amplified RNA gene sequences from microsporidian isolates (Agmasoma or
Thelohania) in Penaeus merguensis and P. monodon. Asian Fisheries Science. 7, 169-
178.
Perez Farfante, I., 1969. Western Atlantic shrimps of the genus Penaeus. Fishery Bulletin. 67,
461-591.
Perez Farfante, I., 1997. Penaeoid and sergestoid shrimps and prawn of the world. Keys and
diagnoses for the families and genera. Memoires du Museum National d'Histoire
Naturelle. 175, 1-233.
Peterson, T. S., Spitsbergen, J. M., Feist, S. W., Kent, M. L., 2011. Luna stain, an improved
selective stain for detection of microsporidian spores in histologic sections. Diseases of
Aquatic Organisms. 95, 175-180.
Porter, M. L., Pérez-Losada, M., Crandall, K. A., 2005. Model-based multi-locus estimation of
decapod phylogeny and divergence times. Molecular Phylogenetics and Evolution. 37,
355-369.
125
Rode, N. O., Landes, J., Lievens, E. J. P., Flaven, E., Segard, A., Jabbour-Zahab, R., Michalakis,
Y., Agnew, P., Vivarès, C. P., Lenormand, T., 2013. Cytological, molecular and life
cycle characterization of Anostracospora rigaudi n. g., n. sp. and Enterocytospora
artemiae n. g., n. sp., two new microsporidian parasites infecting gut tissues of the brine
shrimp Artemia. Parasitology. 140, 1168-1185.
Ronquist, F., Teslenko, M., Van Der Mark, P., Ayres, D. L., Darling, A., Höhna, S., Larget, B.,
Liu, L., Suchard, M. A., Huelsenbeck, J. P., 2012. Mrbayes 3.2: Efficient bayesian
phylogenetic inference and model choice across a large model space. Systematic Biology.
61, 539-542.
Sokolova, Y. Y., Dolgikh, V. V., Morzhina, E. V., Nassonova, E. S., Issi, I. V., Terry, R. S.,
Ironside, J. E., Smith, J. E., Vossbrinck, C. R., 2003. Establishment of the new genus
Paranosema based on the ultrastructure and molecular phylogeny of the type species
Paranosema grylli gen. nov., comb. nov (Sokolova, Selezniov, Dolgikh, Issi 1994), from
the cricket Gryllus bimaculatus Deg. J. Invertebr. Pathol. 84, 159--172.
Sokolova, Y. Y., Fuxa, J. R., 2008. Biology and life-cycle of the microsporidium Kneallhazia
solenopsae Knell Allan Hazard 1977 gen. n., comb. n., from the fire ant Solenopsis
invicta. Parasitology. 135, 903-929.
Sokolova, Y. Y., Lange, C. E., Mariottini, Y., Fuxa, J. R., 2009. Morphology and taxonomy of
the microsporidium Liebermannia covasacrae n. sp. from the grasshopper Covasacris
pallidinota (Orthoptera, Acrididae). Journal of Invertebrate Pathology. 101, 34-42.
Sokolova, Y. Y., Paskerova, G. G., Rotari, Y. M., Nassonova, E. S., Smirnov, A. V., 2013. Fine
structure of Metchnikovella incurvata Caullery and Mesnil 1914 (Microsporidia), a
126

hyperparasite of gregarines Polyrhabdina sp. from the polychaete Pygospio elegans.
Parasitology. 140, 855-867.
Sokolova, Y. Y., Paskerova, G. G., Rotari, Y. M., Nassonova, E. S., Smirnov, A. V., 2014
Description of Metchnikovella spiralis sp.n. (Microsporidia:Metchnikovellidae), with
notes on the ultrastructure of metchnikovellids. Parasitology. 2014 May 9:1-15. [Epub
ahead of print]
Sprague, V., Notes on three microsporidian parasites of decapod Crustacea of Louisiana coastal
water. Occasional papers of the Marine Laboratory, Louisiana State University Baton
Rouge, LA, 1950, pp. 1-8.
Sprague, V., Annotated list of species of Microsporidia. In: L. A. Bulla, T. C. Cheng, Eds.),
Comparative Pathobiology, V.2. Systematics of the Microsporidia. Plenum Press, New
York and London, 1977, pp. 31-334.
Sprague, V., Cough, J., 1971. An annotated list of protozoon parasites, hyperparasites and
commensals of decapod crustacea. Journal of Protozoology. 18, 526-537.
Stentiford, G. D., Bateman, K. S., Feist, S. W., Chambers, E., Stone, D. M., 2013a. Plastic
parasites: Extreme dimorphism creates a taxonomic conundrum in the phylum
Microsporidia. International Journal for Parasitology. 43, 339-352.
Stentiford, G. D., Bateman, K. S., Feist, S. W., Oyarzun, S., Uribe, J. C., Palacios, M., Stone, D.
M., 2014. Areospora rohanae n.gen. n.sp. (Microsporidia; Areosporiidae n. fam.) elicits
multi-nucleate giant-cell formation in southern king crab (Lithodes santolla). Journal of
Invertebrate Pathology.
Stentiford, G. D., Bateman, K. S., Small, H. J., Moss, J., Shields, J. D., Reece, K. S., Tuck, I.,
2010. Myospora metanephrops (n. g., n. sp.) from marine lobsters and a proposal for
127
erection of a new order and family (Crustaceacida; Myosporidae) in the Class
Marinosporidia (Phylum Microsporidia). International Journal for Parasitology. 40, 1433-
1446.
Stentiford, G. D., Feist, S. W., Stone, D. M., Bateman, K. S., Dunn, A. M., 2013b.
Microsporidia: Diverse, dynamic, and emergent pathogens in aquatic systems. Trends in
Parasitology. 29, 567-578.
Tamura, K., Peterson, D., Peterson, N., Stecher, G., Nei, M., Kumar, S., 2011. MEGA5:
Molecular evolutionary genetics analysis using maximum likelihood, evolutionary
distance, and maximum parsimony methods. Molecular Biology and Evolution. 28, 2731-
2739.
Toubiana, M., Guelorget, O., Bouchereau, J. L., Lucien-Brun, H., Marques, A., 2004.
Microsporidians in penaeid shrimp along the west coast of Madagascar. Diseases of
Aquatic Organisms. 58, 79-82.
Vidal-Martínez, V. M., Jiménez-Cueto, A. M., Simá-Álvarez, R., 2002. Parasites and symbionts
of native and cultured shrimps from Yucatán, Mexico. Journal of Aquatic Animal Health.
14, 57-64.
Viosca, P., 1945. A critical analysis of practices in the management of warm-water fish with a
view to greater food production. Transactions of the American Fisheries Society 73, 274-
283.
Vossbrinck, C. R., Andreadis, T. G., Vavra, J., Becnel, J. J., 2004. Molecular phylogeny and
evolution of mosquito parasitic microsporidia (Microsporidia : Amblyosporidae). J.
Eukaryot. Microbiol. 51, 88--95.
128

Vossbrinck, C. R., Debrunner-Vossbrinck, B. A., 2005. Molecular phylogeny of the
Microsporidia: ecological, ultrastructural and taxonomic considerations. Folia
Parasitologica. 52, 131--142.
129
Appendix B: Microsporidian Genomes Harbor a Diverse Array of Transposable Elements that Demonstrate an Ancestry of Horizontal Exchange with Metazoans
Nicolas Parisot 1,2,†, Adrian Pelin 3,†, Cyrielle Gasc1, Valérie Polonais 2,4, Abdel Belkorchia 2,4, Johan Panek 2,4, Hicham El Alaoui 2,4, David G. Biron 2,4, Émilie Brasset 5, Chantal Vaury 5, Pierre Peyret 1, Nicolas Corradi 3,*, Éric Peyretaillade 1,* and Emmanuelle Lerat 6,*
1 Clermont Universite´, Universite´ d’Auvergne, EA 4678 CIDAM, Clermont-Ferrand, France 2 CNRS, UMR 6023, LMGE, Aubiere, France 3 Canadian Institute for Advanced Research, Department of Biology, University of Ottawa, Ontario, Canada 4 Clermont Universite´, Universite´ d’Auvergne, Laboratoire “Microorganismes: Ge´nome et Environnement,” Clermont-Ferrand, France 5 Clermont Universite´, Universite´ d’Auvergne, Clermont-Ferrand, France, Inserm; U 1103, Clermont-Ferrand, France, CNRS; UMR 6293, Clermont-Ferrand, France 6 Universite´ de Lyon; Universite´ Lyon 1; CNRS, UMR 5558, Laboratoire de Biome´trie et Biologie E´ volutive, F-69622 Villeurbanne, France * Corresponding author: E-mail: [email protected]; [email protected]; [email protected]. † These authors contributed equally to this work.
Comments:
This work has been published in Genome biology and evolution 6.9 (2014): 2289-2300, August 2014. My main contributions to this work include phylogenetic analysis, graphical representation of data as well as validation of published genomic scaffolds.
130

Abstract
Microsporidian genomes are the leading models to understand the streamlining in response to a
pathogenic lifestyle; they are gene-poor and often possess small genomes. In this study, we show a feature
of microsporidian genomes that contrasts this pattern of genome reduction. Specifically, genome
investigations targeted at Anncaliia algerae, a human pathogen with a genome size of 23 Mb, revealed the
presence of a hitherto undetected diversity in transposable elements (TEs). A total of 240 TE families per
genome were identified, exceeding that found in many free-living fungi, and searches of microsporidian
species revealed that these mobile elements represent a significant portion of their coding repertoire.
Their phylogenetic analysis revealed that many cases of ancestry involve recent and bidirectional
horizontal transfers with metazoans. The abundance and horizontal transfer origin of microsporidian TEs
highlight a novel dimension of genome evolution in these intracellular pathogens, demonstrating that
factors beyond reduction are at play in their diversification.
Keywords
Microsporidia, transposable elements, diversity, genome evolution, horizontal transfers.
Introduction
Microsporidia are a group of obligate intracellular parasites composed of over 1,500
species and over 187 genera (Vavra and Lukes 2013), which have been recently associated with
a phylum closely related to the fungal kingdom, the Cryptomycota (James et al. 2013). These
organisms are ubiquitous and able to infect potentially all animal phyla, particularly insects but
also humans, so these parasites are considered both medically and ecologically relevant (Vavra
and Lukes 2013). Obligate intracellular lifestyle in microsporidia resulted in severe reduction of
131
their genomes and cells complexity, which, for example, now lacks conventional mitochondria
and Golgi apparatus (Didier et al. 2009; Vavra and Lukes 2013). Microsporidian genomes
sequenced to date encode few known protein coding genes compared with other eukaryotes, so
most members have a minimal metabolic networks and rely on several key transporters to
stealing metabolites from their hosts’ cell, including molecular sources of energy (Nakjang et al.
2013). Interestingly, although the biochemical repertoire of microsporidia is universally reduced,
the genome size within the group can vary over 10-fold (2.3–24 Mb) (Corradi et al. 2009, 2010),
so variation in genome size in this group is not necessarily correlated with significant
improvements in metabolic capabilities, but rather with an expansion in the size of noncoding
regions (i.e., larger intergenic regions), as well as the number of transposable elements (TEs) and
other DNA repeats (Corradi et al. 2009; Peyretaillade et al. 2012; Pan et al. 2013). Indeed, TEs
are found and characterized in microsporidia with comparatively large genomes, including
Nosema spp, Hamiltosporidium tvaerminnensis, and Anncaliia algerae, but are typically absent
in species with smaller genomes, such as Enterocytozoon bieneusi and species in the genus
Encephalitozoon (Katinka et al. 2001; Akiyoshi et al. 2009; Corradi et al. 2010; Keeling et al.
2010; Pombert et al. 2012). To date, no studies have looked at the overall diversity of TEs in
these pathogens, and their potential impact on their ecology and evolution.
TEs are repeated sequences that usually represent a substantial part of the fungal (3–20%)
and metazoan (0.13–50%) genomes (Daboussi and Capy 2003; Hua-Van et al. 2005; Wicker et
al. 2007; Wang et al. 2010; Sun et al. 2012). Among these, two major classes are generally
recognized, including Class I elements (i.e., retrotransposons), which can move through a
reverse-transcribed RNA intermediate and are subdivided into two subclasses according to the
presence or absence of Long Terminal Repeat (LTR) sequences at their extremities, and Class II
132

elements (i.e., DNA transposons) that can transpose directly under the form of DNA intermediate
(Wicker et al. 2007). In most genomes, TEs can rapidly multiply, resulting in several structural
changes, including chromosomal rearrangements, pseudogenizations, and gene shuffling
(Biemont 2010) that are often deleterious. In few cases, however, the presence of TEs can also
benefit an organism, notably by modulating the expression of neighboring genes or by creating
genomic diversity in regions that are important in host–parasite interactions—that is, antigens,
effectors (Raffaele and Kamoun 2012).
TEs also have a high propensity for horizontal transfers (HTs) (Loreto et al. 2008); an HT
is the nonsexual exchange of DNA between organisms that are not necessarily related. Similar
events involving TEs were reported from a variety of lineages, including plants, mammals,
insects, and unicellular eukaryotes such as microsporidia (Yoshiyama et al. 2001; Steglich and
Schaeffer 2006; Laha et al. 2007; Fortune et al. 2008; Hecht et al. 2010; Heinz et al. 2012;
Wallau et al. 2012; Ivancevic et al. 2013; El Baidouri et al. 2014; Zhang et al. 2014), but little is
known about the cellular mechanisms involved in such transfers (Gilbert et al. 2010b).
Nevertheless, some studies proposed that the intimacy of parasitism (direct host–parasite
interaction) could promote HT of TEs across phyla like between vertebrates and invertebrates
(Gilbert et al. 2010a; Gilbert et al. 2010b). In microsporidia, the genetic/cellular intimacy arising
from intracellular parasitism has fuelled a number of HTs (Corradi and Selman 2013), but
intriguingly only few of these have involved TEs (Heinz et al. 2012; Pan et al. 2013). The rarity
of HTs involving TEs in these species may represent a real biological barrier to transfer, but
could also reflect the poor annotation of these elements in genome sequences from this group
because in the multicellular eukaryotes, the HT of TEs usually outnumbers those involving
protein encoding genes (Schaack et al. 2010). To differentiate these two scenarios, and thus
133
better understand the diversity and role of TEs in these parasites, we conducted an exhaustive
search for TEs across all publicly available microsporidian genomes, with a particular focus on a
species with one of the largest genomes known in the group (23 Mb), the human pathogen An.
algerae (Belkorchia et al. 2008). Our analyses demonstrated that TE families can be present in
surprisingly large numbers in microsporidia, and that some of these have been involved in HT
between the animals (possibly the hosts) and microsporidia; possibly in both directions.
Materials and Methods
Sequence Data from Complete Genomes
Genome Data from A. algerae
The contig sequences obtained from An. algerae (Peyretaillade et al. 2012) were searched
using BLASTX (Altschul et al. 1997) against the nonredundant GenBank database to determine
matches to proteins from TEs. We selected 1,785 contigs containing domains supposedly
corresponding to TE sequences and clustered them using BLASTClust
(ftp://ftp.ncbi.nih.gov/blast/documents/blastclust.html, last accessed September 1, 2014) with the
following parameters: 90% of identity and 60% of coverage. We obtained 903 clusters (size
ranges from 1 to 24 sequences). For each cluster of size superior to 1, the sequences were aligned
using MUSCLE (Edgar 2004) and used to build a consensus. This consensus was then used as
query for a BLASTN against all the An. algerae contigs to retrieve sequences with over 90% of
identity over a length of more than 200 bp. The contig sequences were then aligned using
MUSCLE and a new consensus sequence was reconstructed to likely represent a complete TE
sequence. For each consensus, the presence of Open Reading Frame(s) (ORF) and the presence
134

of LTR or Terminal Inverted Repeat (TIR) sequences were detected using ORF Finder (Sayers et
al. 2011) and bl2seq (Altschul et al. 1997), respectively. In total, 240 different consensus
corresponding to different TE families from various types (LTR retrotransposons and DNA
transposons) were obtained (supplementary table S1 and file S1, Supplementary Material
online). The occurrences of each family were determined using RepeatMasker (Smit et al. 1996–
2010) on the sequenced genomes of An. algerae with the consensus sequences used as library,
and the copy numbers were computed using the tool One_code_to_find_them_all (Bailly-Bechet
et al. 2014) (supplementary table S2, Supplementary Material online).
Data from Other Microsporidia
Available microsporidian genomes (16) were retrieved: Edhazardia aedis USNM 41457
(AFBI00000000.2), Encephalitozoon cuniculi EC1 (AEWD00000000.1), Enc. cuniculi EC2
(AEWQ00000000.1), Enc. cuniculi EC3 (AEWR00000000.1), Enc. cuniculi GB-M1
(AL391737.2; AL590442.1–AL590451.1), Encephalitozoon hellem ATCC 50504 (CP002713.1–
CP002724.1), Encephalitozoon intestinalis ATCC 50506 (CP001942.1–CP001952.1),
Encephalitozoon romaleae SJ-2008 (CP003518.1–CP003530.1), Ent. bieneusi H348
(NZ_ABGB00000000.1), Ham. tvaerminnensis OER-3-3 (ACSZ00000000.1), Nematocida
parisii ERTm1 (AEFF00000000.2), Ne. parisii ERTm3 (AEOO00000000.1), Nematocida sp. 1
ERTm2 (AERB00000000.1), Nosema antheraeae YY
(http://silkpathdb.swu.edu.cn/silkpathdb/ftpserver, last accessed September 1, 2014), Nosema
apis BRL 01 (ANPH00000000.1), Nosema bombycis CQ1 (ACJZ00000000.1), Nosema ceranae
BRL01 (NZ_ACOL00000000.1), Spraguea lophii 42_110 (ATCN00000000.1),
Trachipleistophora hominis (ANCC00000000.1), and Vavraia culicis subsp. floridensis
(AEUG00000000.1). Using the reconstructed consensus TE sequences from An. algerae, a
135
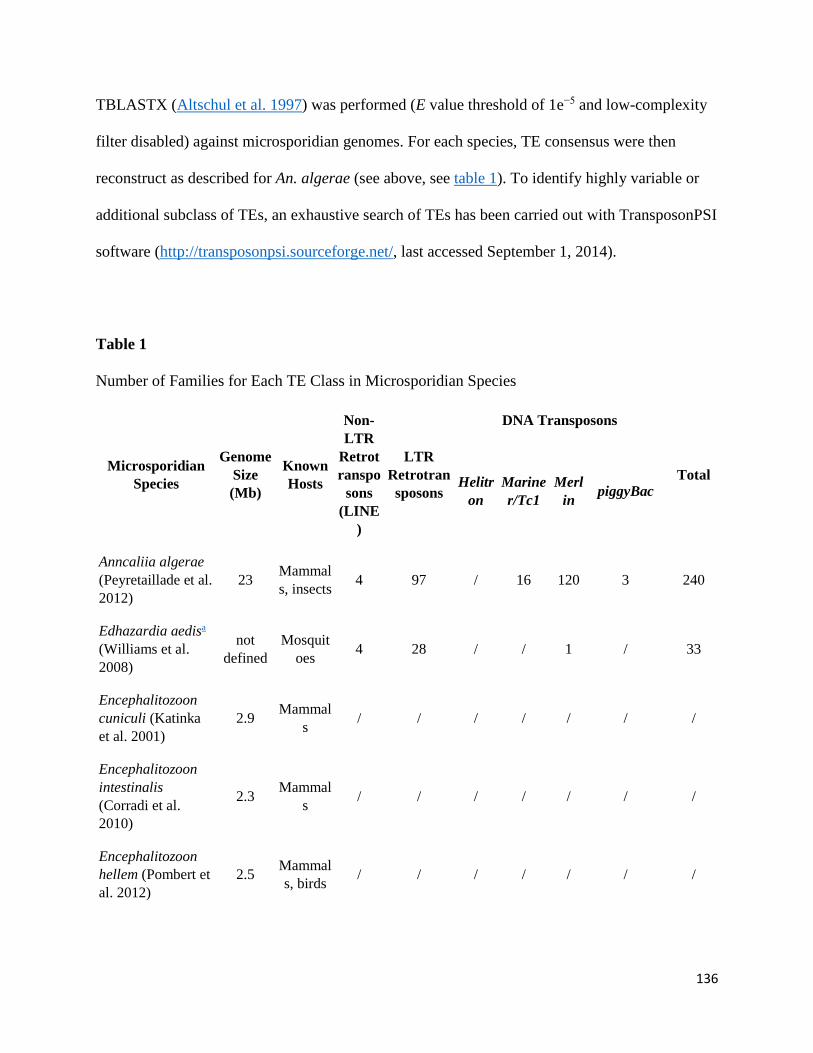
TBLASTX (Altschul et al. 1997) was performed (E value threshold of 1e−5 and low-complexity
filter disabled) against microsporidian genomes. For each species, TE consensus were then
reconstruct as described for An. algerae (see above, see table 1). To identify highly variable or
additional subclass of TEs, an exhaustive search of TEs has been carried out with TransposonPSI
software (http://transposonpsi.sourceforge.net/, last accessed September 1, 2014).
Table 1
Number of Families for Each TE Class in Microsporidian Species
Microsporidian Species
Genome Size (Mb)
Known Hosts
Non-LTR
Retrotranspo
sons (LINE
)
LTR Retrotransposons
DNA Transposons
Total Helitron
Mariner/Tc1
Merlin piggyBac
Anncaliia algerae (Peyretaillade et al. 2012)
23 Mammals, insects 4 97 / 16 120 3 240
Edhazardia aedisa (Williams et al. 2008)
not defined
Mosquitoes 4 28 / / 1 / 33
Encephalitozoon cuniculi (Katinka et al. 2001)
2.9 Mammals / / / / / / /
Encephalitozoon intestinalis (Corradi et al. 2010)
2.3 Mammals / / / / / / /
Encephalitozoon hellem (Pombert et al. 2012)
2.5 Mammals, birds / / / / / / /
136
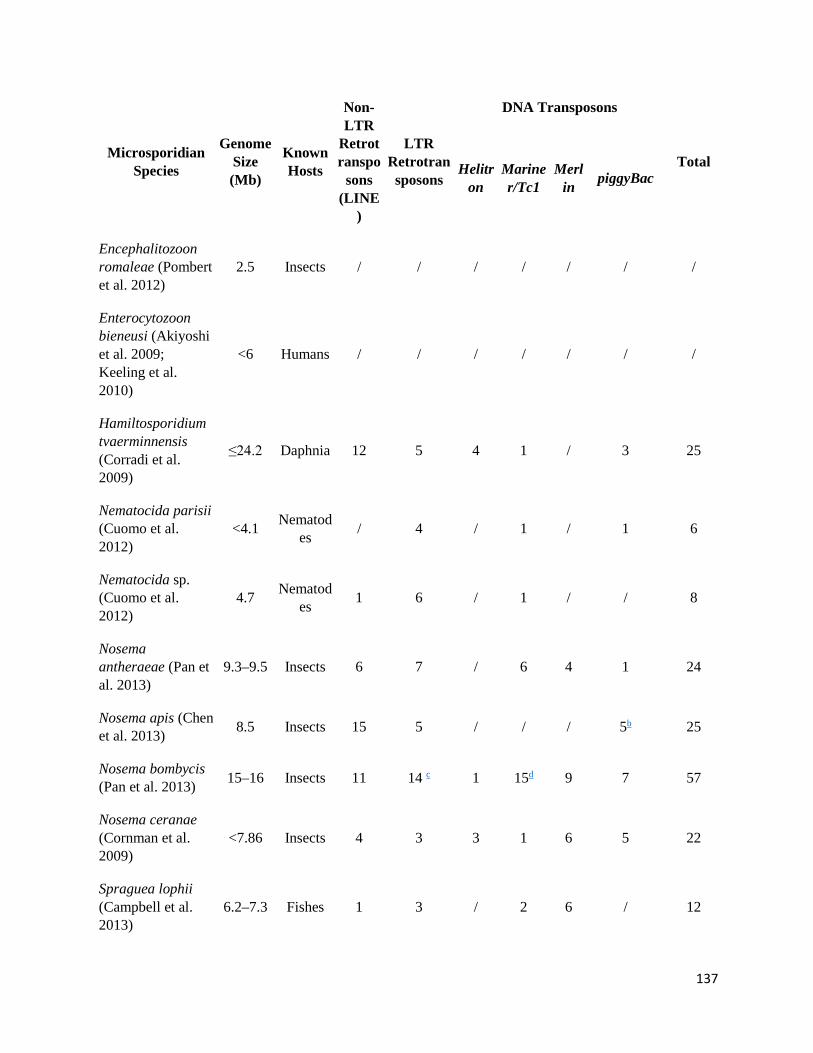
Microsporidian Species
Genome Size (Mb)
Known Hosts
Non-LTR
Retrotranspo
sons (LINE
)
LTR Retrotransposons
DNA Transposons
Total Helitron
Mariner/Tc1
Merlin piggyBac
Encephalitozoon romaleae (Pombert et al. 2012)
2.5 Insects / / / / / / /
Enterocytozoon bieneusi (Akiyoshi et al. 2009; Keeling et al. 2010)
<6 Humans / / / / / / /
Hamiltosporidium tvaerminnensis (Corradi et al. 2009)
≤24.2 Daphnia 12 5 4 1 / 3 25
Nematocida parisii (Cuomo et al. 2012)
<4.1 Nematodes / 4 / 1 / 1 6
Nematocida sp. (Cuomo et al. 2012)
4.7 Nematodes 1 6 / 1 / / 8
Nosema antheraeae (Pan et al. 2013)
9.3–9.5 Insects 6 7 / 6 4 1 24
Nosema apis (Chen et al. 2013) 8.5 Insects 15 5 / / / 5b 25
Nosema bombycis (Pan et al. 2013) 15–16 Insects 11 14 c 1 15d 9 7 57
Nosema ceranae (Cornman et al. 2009)
<7.86 Insects 4 3 3 1 6 5 22
Spraguea lophii (Campbell et al. 2013)
6.2–7.3 Fishes 1 3 / 2 6 / 12
137

Microsporidian Species
Genome Size (Mb)
Known Hosts
Non-LTR
Retrotranspo
sons (LINE
)
LTR Retrotransposons
DNA Transposons
Total Helitron
Mariner/Tc1
Merlin piggyBac
Trachipleistophora hominis (Heinz et al. 2012)
11.6 Humans, mosquito
es 9 1 / / / 1 11
Vavraia culicisa 6.12 Mosquitoes / 1 1 / / 1 3
• a Data from the Microsporidia Comparative Sequencing Project, Broad Institute of Harvard and MIT (http://www.broadinstitute.org/, last accessed September 1, 2014).
• b That were all already described in GenBank. • c Including eight that were already described in GenBank. • d Including two that were already described in GenBank.
Reference Sequences of TEs
Phylogenetic analyses were performed using different eukaryotic protein sequences from
reference TE elements obtained from the Repbase database (Jurka 2000) (supplementary table
S3, Supplementary Material online). We performed BLASTN searches of each An. algerae
consensus on the GenBank databases to add other TE sequences for the different tree
reconstructions (supplementary table S4, Supplementary Material online). We used piggyBac
previously described sequences (Sarkar et al. 2003; Pan et al. 2013) (supplementary table S5,
Supplementary Material online). We used the ISFinder database (Siguier et al. 2006) to retrieve
bacterial sequence for the Merlin phylogenetic analysis.
138
Domain Detection
The protein domains of each consensus were determined using the Pfam database version
27.0 (March 2013, 14,831 families; http://pfam.sanger.ac.uk/, last accessed September 1, 2014)
(Punta et al. 2012) and the batch web CD-search tool
(http://www.ncbi.nlm.nih.gov/Structure/bwrpsb/bwrpsb.cgi, last accessed September 1, 2014)
(Marchler-Bauer et al. 2011).
In Silico Confirmation
TEs representing novel phylogenetic incongruences were validated in silico as being
present in a contig belonging to the host genome rather than a contaminant. Most TEs are present
in multiple copies in the genome, in such cases contigs were selected based on the proximity of
microsporidian coding sequences to TEs. Paired-end reads from Schmidtea mediterranea and
Dendroctonus ponderosae were mapped using Geneious (Geneious version R7 available from
http://www.geneious.com/, last accessed September 1, 2014) against contigs harboring TEs
(Dpon, Mariner12, Merlin7, 10, 2, and 4) and the nucleotide coverage was plotted to validate the
presence of TE in the respective host genome (supplementary fig. S5A–F, Supplementary
Material online). For the TEs of No. apis and Ap. florea, reads consisting of mate pairs were
mapped against contigs to validate the assembly of contigs (supplementary fig. S5H,
Supplementary Material online).
Tree Reconstruction and Sequence Analysis
For each superfamily, the protein sequences were aligned using MAFFT version 6 (Katoh
et al. 2002). Uninformative columns in each of the alignments were removed using the trimAl
139
algorithm (Capella-Gutierrez et al. 2009). In order to determine the amino acid evolution model
to be used in our phylogenetic analysis, we analyzed each alignment with ProtTest (Darriba et al.
2011). This revealed the models LG+Г (LTR retrotransposons), LG+I+Г (Mariner/Tc1),
Blosum62+I+Г (Merlin), and VT+Г (piggyBac) to best explain our data. Maximum-likelihood
analysis was performed using PHYML v3.0 (Guindon et al. 2010) with 100 bootstrap replicates,
whereas Bayesian analysis was performed using MrBayes v3.2.1 (Huelsenbeck and Ronquist
2001) for 5,000,000 generations and a burnin of 25%. In order to use the LG model for Bayesian
analysis, we obtained the latest development version r851 of MrBayes
(http://sourceforge.net/p/mrbayes/, last accessed September 1, 2014).
For the LTR-retrotransposon phylogenetic analyses, 50 complete consensus sequences
and 10 incomplete consensus sequences that corresponded to nearly complete ORFs of
polyproteins were used. Other microsporidian polyproteins consensus sequences were also
included (12 consensus sequences from No. bombycis, 13 from Ed. aedis, 4 from Ne. parisii, 7
from No. antheraeae, 3 from Nematocida sp., 1 from No. ceranae, and 3 from Sp. lophii) as well
as LTR-retrotransposon polyproteins and Pol proteins representative of the Ty3/gypsy
andTy1/copia groups (supplementary tables S3 and S4, Supplementary Material online)
For the Merlin phylogenetic analysis, 82 potentially complete consensus protein
sequences over the 84 identified in An. algerae were selected; those having no complete ORF
were removed. Transposase consensus sequences (34 over 36, two sequences were removed as
too short), all microsporidian consensus sequences (six consensus sequences from No. ceranae,
four from Sp. lophii, nine from No. bombycis, four from No. antheraeae, one from Ed. aedis) as
140
well as several transposase proteins from reference Merlin elements from various organisms
were also included (supplementary table S3, Supplementary Material online).
To build the Mariner/Tc1 phylogenetic tree, 15 protein consensus sequences from An.
algerae Mariner/Tc1 elements and the one described as member of the Tc5 family were selected
as well as consensus sequences reconstructed for the other microsporidian species (15 consensus
sequences from No. bombycis, 1 from Sp. lophii, 5 from No. antheraeae, and 1 from No.
ceranae) and reference elements from various organisms (supplementary tables S3, S4, and S6,
Supplementary Material online).
To reconstruct the evolutionary history of the piggyBac superfamilies, the three
consensus sequences identified in An. algerae, the proteins from the consensus sequences
identified in other microsporidian species (seven consensus sequences from No. bombycis, one
from T. hominis, one from No. antheraeae, and three from No. apis) and 121 protein sequences
from various organisms (supplementary tables S3, S4, and S6, Supplementary Material online)
corresponding to reference elements and also to piggyBac-derived genes were used.
Phylogenetic inconsistencies of TEs clustered with homologs from very distantly related
species were confirmed computing Ks values. We retrieved 26–43 orthologous genes between
Microsporidia and involved metazoans to compute the mean Ks values using seqinR (Charif et
al. 2005). Putative HT sequences sharing over 90% nucleotidic identity with metazoans or
involving poorly annotated genomes were not considered for Ks calculations.
141

Results
TEs Can Be Very Diverse in Microsporidian Genomes
Analyses of the An. algerae genome, identified a diverse collection of TEs, and
consensus sequences could be reconstructed for a total of 97 LTR retrotransposons, four non-
LTR retrotransposons, and 139 DNA transposons (from the superfamilies’ Mariner/Tc1,
piggyBac, and Merlin) (table 1; supplementary table S1 and file S1, Supplementary Material
online). Representative structures of each superfamily for which complete consensus sequences
were reconstructed are shown on figure 1. Because of the highly fragmented state of the An.
algerae genome, only 50 of the 97 different LTR-retrotransposon consensus sequences could be
fully reconstructed (i.e., with LTRs at both extremities and a potentially complete coding
sequence; fig. 1A), whereas others were identified based on the presence of partial sequences or
complete integrase domain (rve). For non-LTR retrotransposons, a total of four distinct families
could be found, all of which encode for a specific reverse transcriptase CDD domain cd01650. In
the case of the Merlin superfamily (DNA transposon), 120 consensus sequences could be
reconstructed, 84 of which consisted in complete sequences with characteristic TIRs and a
transposase coding sequence (880 bp on average). All of these 84 transposases displayed the
DDE_Tnp_IS1595 domain typical of ISXO2-like transposases (fig. 1B). For The Mariner/Tc1
superfamily of DNA transposons, 16 different consensus sequences could be reconstructed, 12 of
them were complete based on the presence of identifiable TIRs at both extremities and a
complete transposase coding gene (fig. 1C). With one exception, transposases displayed the two
protein domains: A “helix-turn-helix” domain that specifies DNA binding and DNA recognition
domain of the Tc3 transposase (HTH_tnp_Tc3-2), and a DDE-3 domain characteristic from DDE
transposase displaying the carboxylate residues responsible for the endonuclease activity of the
142

protein (fig. 1C). The one exception included a transposase with a “helix-turn-helix” domain
characteristic of Tc5 family (HTH_Tnp_Tc5) linked to a DDE-1 endonuclease activity domain.
Finally, we also reconstructed three consensus sequences corresponding to piggyBac elements,
all of which encoded potentially complete transposase genes which displayed the domain
DDE_Tnp_1_7 typical of piggyBac transposases, but for which no TIRs could be detected. The
copy number of each family was also investigated along the An. algerae genome revealing that
LTR retrotransposons and Merlin DNA transposons represent the most abundant families in this
species (supplementary table S2, Supplementary Material online). Importantly, the results
obtained using the same methodology based on publicly available data from two other An.
algerae strains (NCBI [National Center for Biotechnology Information] BioProjects
PRJNA188095 and PRJNA188094) resulted in very similar findings.
Figure 1 Structure of representative complete consensus sequences from the Ty3/gypsy, Merlin, and Mariner/Tc1superfamilies detected in the genome of Anncaliia algerae. (A) Structure of a Ty3/gypsy LTR retrotransposon; (B) structure of a Merlin DNA transposon; (C) structure of a Mariner/Tc1 DNA transposon.
Our searches for TEs were also expanded to all 16 available genome sequences using two
independent approaches (table 1). Specifically, all different consensus sequences retrieved from
143
An. algerae were used as queries for BLAST-based searches against the 16 microsporidian
genomes (see Materials and Methods), and this approach was complemented by a
TransposonPSI analysis of these genomes (http://transposonpsi.sourceforge.net/, last accessed
September 1, 2014) (table 1). These inspections revealed the presence of previously
unrecognized TEs, with ORFs encoding for a helitron helicase-like domain (Pfam domain:
14214) in No. bombycis, No. ceranae, Ham. tvaerminnensis, and V. culicis. In total, our
exploration of other available microsporidian genomes resulted in the identification of 33, 25, 24,
25, 57 and 22 TE families in the Ed. aedis, Ham. tvaerminnensis, No. antheraeae, No. apis, No.
bombycis and No. ceranae genomes, respectively, whereas less than 15 families in total were
detected in the other species (table 1).
Phylogenetic Reconstructions Reveal Microsporidia-Specific Clades of TEs
The evolutionary histories of the four largest microsporidian TE superfamilies were
investigated using Maximum Likelihood and Bayesian analyses of their complete consensus
sequences. These confirmed that the vast majority of microsporidian LTR retrotransposons
correspond to elements from the Ty3/gypsy group (fig. 2 and supplementary fig. S1,
Supplementary Material online), which separate into three main groups that seem to have
specifically diversified in microsporidia (i.e., they do not contain elements from other
eukaryotes; see, e.g., group 1 in supplementary fig. S1, Supplementary Material online).
Anncaliia algerae LTR retrotransposons displayed a pattern of extreme diversification within
three main groups (39 sequences in group 3, 13 and 8 sequences in group 1 and 2, respectively).
A similar pattern of diversification is also found in Ed. aedis, although the total number of
sequences is much smaller than in An. algerae (28 different families; table 1). For the Merlin
144
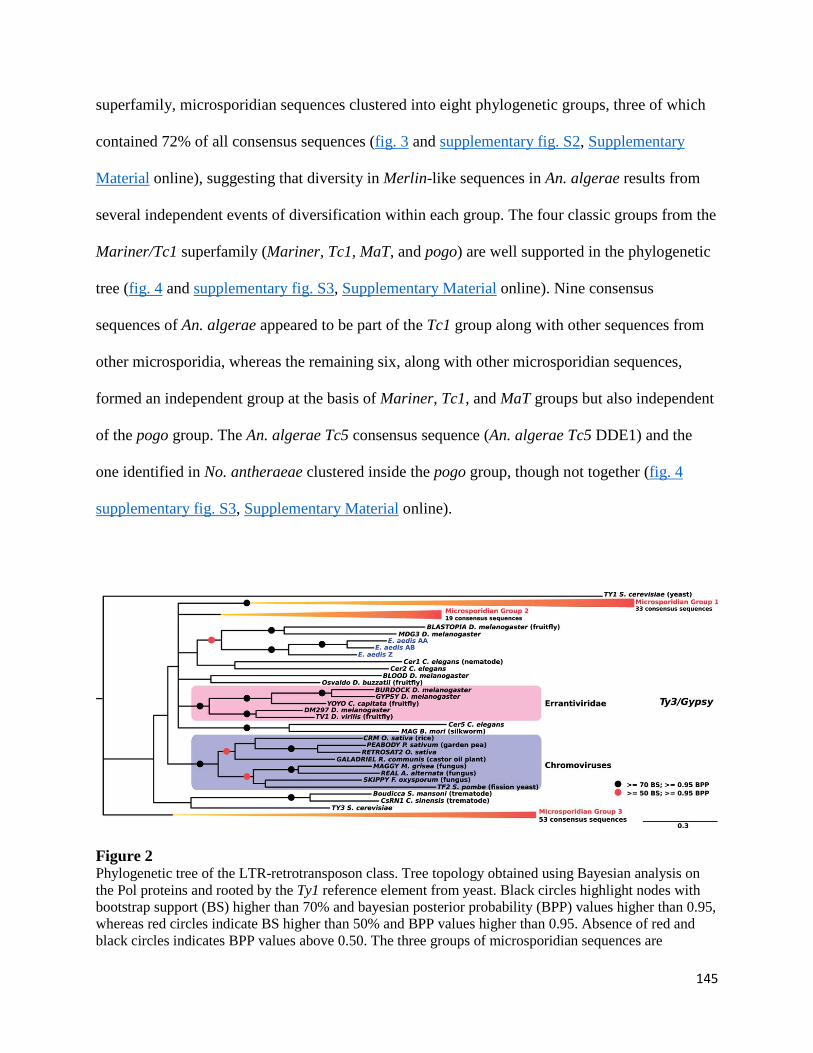
superfamily, microsporidian sequences clustered into eight phylogenetic groups, three of which
contained 72% of all consensus sequences (fig. 3 and supplementary fig. S2, Supplementary
Material online), suggesting that diversity in Merlin-like sequences in An. algerae results from
several independent events of diversification within each group. The four classic groups from the
Mariner/Tc1 superfamily (Mariner, Tc1, MaT, and pogo) are well supported in the phylogenetic
tree (fig. 4 and supplementary fig. S3, Supplementary Material online). Nine consensus
sequences of An. algerae appeared to be part of the Tc1 group along with other sequences from
other microsporidia, whereas the remaining six, along with other microsporidian sequences,
formed an independent group at the basis of Mariner, Tc1, and MaT groups but also independent
of the pogo group. The An. algerae Tc5 consensus sequence (An. algerae Tc5 DDE1) and the
one identified in No. antheraeae clustered inside the pogo group, though not together (fig. 4
supplementary fig. S3, Supplementary Material online).
Figure 2 Phylogenetic tree of the LTR-retrotransposon class. Tree topology obtained using Bayesian analysis on the Pol proteins and rooted by the Ty1 reference element from yeast. Black circles highlight nodes with bootstrap support (BS) higher than 70% and bayesian posterior probability (BPP) values higher than 0.95, whereas red circles indicate BS higher than 50% and BPP values higher than 0.95. Absence of red and black circles indicates BPP values above 0.50. The three groups of microsporidian sequences are
145
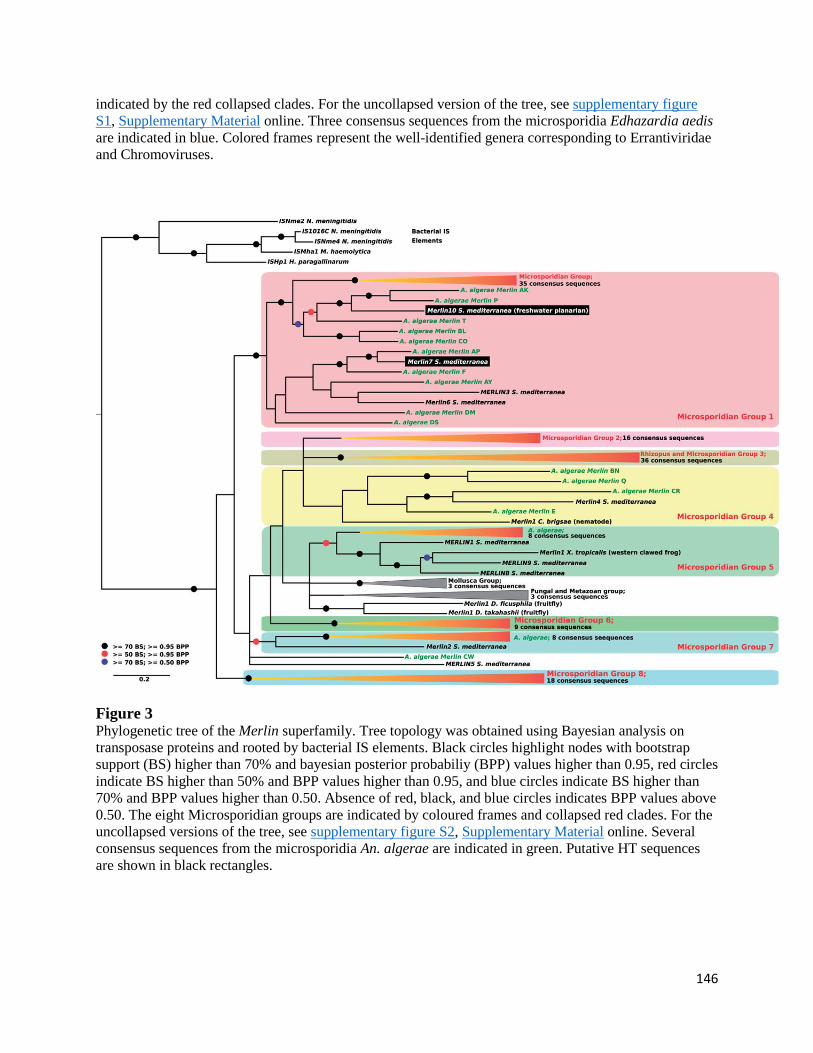
indicated by the red collapsed clades. For the uncollapsed version of the tree, see supplementary figure S1, Supplementary Material online. Three consensus sequences from the microsporidia Edhazardia aedis are indicated in blue. Colored frames represent the well-identified genera corresponding to Errantiviridae and Chromoviruses.
Figure 3 Phylogenetic tree of the Merlin superfamily. Tree topology was obtained using Bayesian analysis on transposase proteins and rooted by bacterial IS elements. Black circles highlight nodes with bootstrap support (BS) higher than 70% and bayesian posterior probabiliy (BPP) values higher than 0.95, red circles indicate BS higher than 50% and BPP values higher than 0.95, and blue circles indicate BS higher than 70% and BPP values higher than 0.50. Absence of red, black, and blue circles indicates BPP values above 0.50. The eight Microsporidian groups are indicated by coloured frames and collapsed red clades. For the uncollapsed versions of the tree, see supplementary figure S2, Supplementary Material online. Several consensus sequences from the microsporidia An. algerae are indicated in green. Putative HT sequences are shown in black rectangles.
146

Figure 4 Phylogenetic tree of the Mariner/Tc1 and pogo superfamilies. Tree topology was obtained using Bayesian analysis on transposase proteins and rooted by elements from the pogo superfamily. Black circles highlight nodes with bootstrap support (BS) higher than 70% and bayesian posterior probability (BPP) values higher than 0.95, red circles indicate BS higher than 50% and BPP values higher than 0.95, and blue circles indicate BS higher than 70% and BPP values higher than 0.50. Absence of red, black, and blue circles indicates BPP values above 0.50. The four classic groups from the Mariner/Tc1 superfamily (Mariner, Tc1, MaT, and pogo) are represented by colored frames and gray collapsed clades. The two Microsporidian groups are represented by red collapsed clades. Some sequences of the microsporidia are indicated in different text colors: green for An. algerae, red for No. bombycis and No. antheraeae, and orange for S. lophii. For the uncollapsed version of the tree, see supplementary figure S3, Supplementary Material online.
Phylogenetic Incongruences for TEs Identified in Microsporidian and Metazoan Genomes
Our phylogenetic reconstruction revealed 17 instances where microsporidian TEs
clustered with homologs from very distantly related species, notably arthropods and
platyhelminthes, or vice versa. Nine of these are strongly supported (Bootstraps values [BS] and
147

Bayesian Posterior Probability [BPP] support over 95%) by two or more nodes, and four are also
backed by an extensive sequence identity. Compelling cases of phylogenetic incongruence
include two Merlin DNA transposons from the planarian Sc. mediterranea (Merlin7 and
Merlin10 in fig. 3) that cluster within clades otherwise exclusively composed of elements from
An. algerae, and others involving piggyBac clustered with homologs from insects (e.g., An.
algerae-piggyBac-A and An. algerae-piggyBac-B; fig. 5 and supplementary fig. S4,
Supplementary Material online). Among these, the sequence An. algerae-piggyBac-B is
particularly intriguing, as it shares over 98.86% of nucleotide identity with a sequence from the
Pine beetle D. ponderosae; suggesting their very recent divergence. Other phylogenetic
inconsistencies include some previously found by others, (i.e., a piggyBac element from T.
hominis related to an ant Harpegnathos saltator, fig. 5 [Heinz et al. 2012] as well as three No.
apis sequences [N. apis 1,2,3; fig. 5 and supplementary fig. S4, Supplementary Material online]).
These sequences cluster and share an identity higher than expected with homologs from different
bee species (respectively 94.18% and 99.20% nucleotide identity with the Ap. florea, and
90.32% identity with the Megachile rotundata; fig. 5). The number of synonymous substitutions
per synonymous site (Ks) was computed for TEs with phylogenetic inconsistencies but sharing
intermediate sequence identity with metazoan homologs. Additional evidence of HTs were found
for piggybac elements from No. bombycis (mean Ks [Camponotus floridanus genes vs. No.
bombycis genes] = 9.03 ± 2.52 vs. Ks [N. bombycis E vs. C. floridanus] = 1.92; mean Ks [M.
rotundata genes vs. No. bombycis genes] = 8.17 ± 3.37 vs. Ks [N. bombycis B vs. M. rotundata
7] = 4.02 and Ks [N. bombycis G vs. M. rotundata 7] = 2.65) and T. hominis (mean Ks [Har.
saltator genes vs. T. hominis genes] = 9.51 ± 1.81 vs. Ks [T. hominis vs. Har. saltator 4] = 0.19).
148
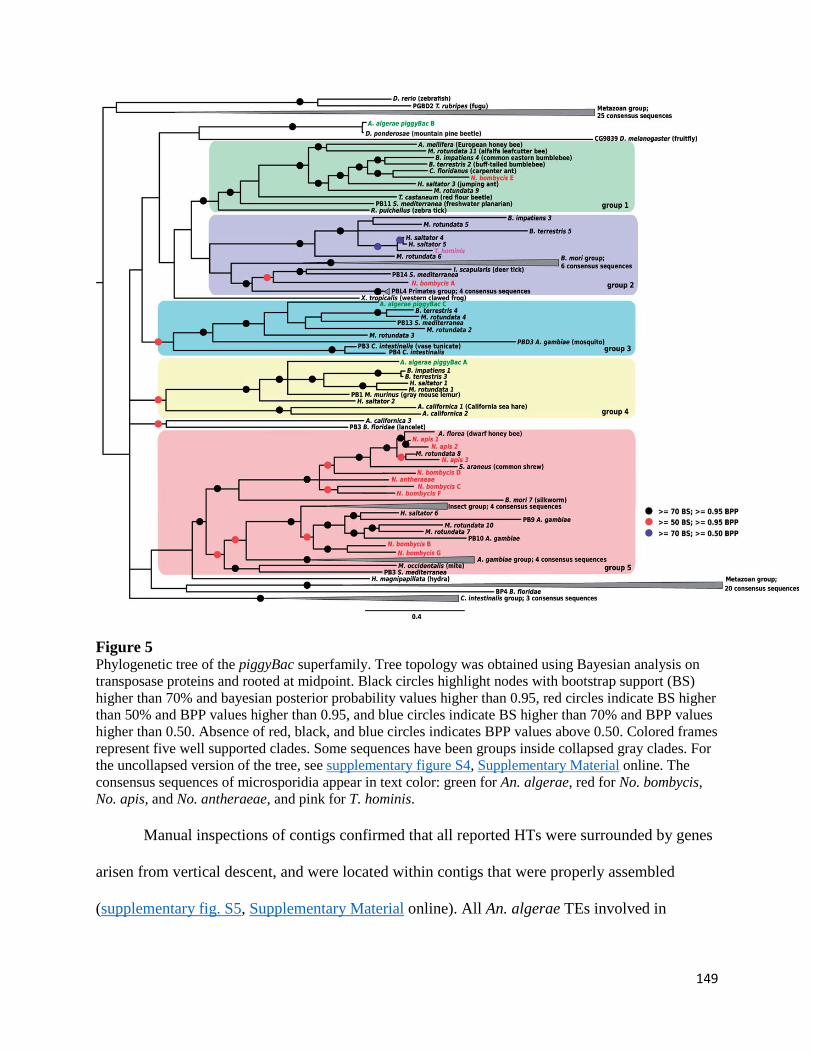
Figure 5 Phylogenetic tree of the piggyBac superfamily. Tree topology was obtained using Bayesian analysis on transposase proteins and rooted at midpoint. Black circles highlight nodes with bootstrap support (BS) higher than 70% and bayesian posterior probability values higher than 0.95, red circles indicate BS higher than 50% and BPP values higher than 0.95, and blue circles indicate BS higher than 70% and BPP values higher than 0.50. Absence of red, black, and blue circles indicates BPP values above 0.50. Colored frames represent five well supported clades. Some sequences have been groups inside collapsed gray clades. For the uncollapsed version of the tree, see supplementary figure S4, Supplementary Material online. The consensus sequences of microsporidia appear in text color: green for An. algerae, red for No. bombycis, No. apis, and No. antheraeae, and pink for T. hominis.
Manual inspections of contigs confirmed that all reported HTs were surrounded by genes
arisen from vertical descent, and were located within contigs that were properly assembled
(supplementary fig. S5, Supplementary Material online). All An. algerae TEs involved in
149
phylogenetic inconsistencies were also found in other An. algerae strains that were cultured,
sequenced, and assembled by others (see Materials and Methods).
Discussion
Origin of TE Diversity in the Microsporidia
The different LTR-retrotransposon families we detected in microsporidia genomes are all
from a Ty3/gypsy group previously described from a wide variety of organisms, such as plants,
fungi, and animals (Llorens et al. 2009). Three different subgroups appeared specific to the
microsporidian species and independent from the well-described subgroups. The structure of
these elements with one polyprotein instead of two ORFs for gag and pol makes them different
from the rest of the Ty3/gypsy elements. They could represent the remnant of ancestral forms of
LTR retrotransposons thought to have emerged from bacterial DNA transposons (Capy et al.
1996). These elements seem to have been particularly successful in An. algerae genome (40.90%
of the total identified TE families), such a diversity is not observed in the other microsporidian
genomes sequenced to date, even if No. bombycis and Ed. aedis showed quite large numbers of
TEs families (table 1). DNA transposons represent the majority of TE sequences identified in the
microsporidia (57.44% of the total identified TE families in this study), with three superfamilies
being characterized (Mariner/Tc1, Merlin, and piggyBac superfamilies). Among the Mariner/Tc1
elements, one microsporidian group does not appear to belong to any of the already described
groups Mariner, Tc1, and MaT. As a cyanobacteria sequence is clustered within this group and
as it has been hypothesized that these elements were derived from bacterial IS elements (Capy et
al. 1996), this group could correspond to ancestral forms of Mariner/Tc1 elements. The
diversification of TE families indicates that the emergence of new families could be a recurrent
150
process as there is evidence that TEs can be viewed as a mosaic of various elements that arose
through recombination process (Capy et al. 1996; Lerat and Capy 1999; Auge-Gouillon et al.
2000). Alternatively, the hypothesis that these new TE families may originate from HTs not
already characterized cannot be completely excluded. Hence, the large diversity of some TE
families in the An. algerae genome could indicate that new TEs can easily be formed or gained
in this species and possibly in other microsporidian genomes. This is particularly clear in the
case of the Merlin DNA transposons whose numbers have drastically expanded in An. algerae. It
has been proposed that the diversity and the size of TE families could be in part due to the
population structure of the species where they are found like the population size (Jurka et al.
2011). In this case, the accumulation of TEs could be the result of genetic drift in small
populations of these parasites, as microsporidian populations can be subject to genetic
bottlenecks like any intracellular organism. Because genetic drift is associated with a decrease in
the efficacy of natural selection, it is expected that deleterious mutations, as for example TE
insertions, will be fixed in small populations. New TEs insertions could thus be fixed by genetic
drift, which would lead to an increase of the genome size in the microsporidian species where
they occur and offset genome reduction processes.
Potential Impact of TEs on the Biology and Evolution of Microsporidia
Microsporidia are renowned for the genes they have lost, and genome sequencing of
these parasites rarely demonstrates complexity that exceeds that found in free-living microbial
eukaryotes. Here, however, we demonstrate that these organisms can harbor exaggerated
numbers of TE families; matching those found in distant fungal symbionts and pathogens with
genomes that are over twice as large (i.e., the plant symbiont Laccaria bicolor with171 TE
151

families in a 60 Mb genome [Labbe et al. 2012]; the plant pathogen Puccinia graminis with 266
families in a 80 Mb genome) (Duplessis et al. 2011). The abundance of these elements in An.
algerae genome (and to a lesser extent other members of this lineage) may reflect their pivotal
role in the ecology and evolution of these parasites, as these elements are known contributors to
genome plasticity in other organisms (Biemont 2010). This plasticity has also been linked with
host–parasite interactions in distant relatives, most notably fungal and oomycete plant pathogens,
so it is literally possible that TE abundance results in similar adaptive processes in microsporidia
(Dean et al. 2005; Amyotte et al. 2012; Raffaele and Kamoun 2012). Recently, a SILAC (Stable
Isotope Labeling by Amino Acids in Cell culture) approach allowed the detection of a Pol
polyprotein among the parasite proteins during an infection process. A specific microsporidian
regulation signal within the putative promoter of this TE suggests its domestication by the
microsporidia, which may have provided an advantage in the evolutionary story of An. algerae to
lure the host innate immune system (Panek et al. 2014). The fact that not all microsporidia share
the same pool of TEs is in agreement with previous reports indicating that variation in the
amount of TEs largely accounts for differences in genome size within this group—that is, bigger
microsporidian genomes harbor more TEs (Williams et al. 2008; Corradi et al. 2009; Corradi and
Slamovits 2011; Peyretaillade et al. 2012). The identification of many TEs families that are
exclusive to microsporidia suggests their ancestral presence in these parasites, and many of these
now continue to evolve through independent expansions and contractions in the different
lineages.
152
Evidence of Extremely Recent and Bidirectional HTs with Metazoans
Microsporidia benefited from HTs in many ways (reviewed in Selman and Corradi 2011),
but to date only two of these have involved TEs (Heinz et al. 2012; Pan et al. 2013). Our study,
however, shows that the role of TEs in the HT may have been overlooked in these parasites.
Among the 17 phylogenetic incongruences identified, nine could conservatively be attributed to
HTs, doubling the number of cases known for microsporidia. These elements appear to have
been exchanged with various metazoan taxa, confirming previous reports based on one TE and
two protein encoding genes (Selman et al. 2011; Heinz et al. 2012; Pombert et al. 2012).
However, the number of cases we identified suggests that genetic exchanges with animals may
be more frequent that previously appreciated. Interestingly, a few cases of HTs involved a
planarian (Sc. mediterranea), a lineage that has never been reported to be infected by
microsporidia. Indeed, prior to this study, An. algerae was only known to infect human and
mosquito. Nevertheless, the very high sequence identity between several TEs from An. algerae,
and, the very distantly related metazoans Sc. mediterranea and D. ponderosae suggest that the
host range of some microsporidian species could be much larger than previously assumed. Host
range is probably only partially known and identification of recent HTs could help us to refine it.
Most previous reports of HTs in microsporidia have involved sequences that are rather
divergent (between 23% and 62%), suggesting that these events were rather ancient (Slamovits
and Keeling 2004; Xiang et al. 2010; Selman et al. 2011; Cuomo et al. 2012; Heinz et al. 2012;
Pombert et al. 2012; Nakjang et al. 2013; Pan et al. 2013), but in this study we found several
compelling cases of HTs involving sequences sharing between 70% and 98% nucleotide identity.
This elevated similarity suggests that microsporidia and metazoans taxa are actively exchanging
153
TEs to this day, and particularly piggyBac elements. We also found cases where TEs appeared to
have been donated by the microsporidia rather than being received. Our conservative analyses
revealed two such cases, namely Merlin7 and Merlin10 (fig. 3), both of which involved the
planaria Sc. mediterranea. Interestingly, this species has been documented to be involved in HTs
in other occasions with Lepidoptera and vertebrates (Novick et al. 2010; Lavoie et al. 2013), so
an intriguing possibility is is that latter HTs were mediated by a microsporidium and facilitated
by the nonisolated germ-line of Sc. mediterranea (Schaack et al. 2010). If the phylogenetic
inconsistencies we observed are real, and not the result of biases introduced by taxonomical
sampling, the capacity of microsporidia to occasionally donate genetic material to other
organisms would underscore their potential to act as “vectors” of genetic information in many
environments, revealing completely new aspects of their biology with far-reaching consequences
for our understanding of their biology.
Supplementary Material
Supplementary file S1, figures S1–S5, and tables S1–S6 are available at Genome Biology
and Evolution online (http://www.gbe.oxfordjournals.org/).
Acknowledgments
This study was financially supported by the French “Direction Générale de l’Armement”
(DGA) to N.P. N.C. is a Fellow of the Integrated Microbial Biodiversity Program of the
Canadian Institute for Advanced Research (CIFAR-IMB). His work was supported by Discovery
grants from the Natural Sciences and Engineering Research Council of Canada. The authors are
grateful to Jason Slot and Thomas Richards or critical discussion of an earlier version of the
154

manuscript. N.C., P.P., E.P., and E.L. planned the study. N.P., A.P., E.P., and E.L. performed the
analyses. N.P., A.P., N.C., E.P., and E.L. wrote the manuscript, with revisions and contributions
by C.G., V.P., A.B., J.P., H.E.A., D.B., E.B., C.V., and P.P. All authors read and approved the
final manuscript. All authors declare no competing interests.
References
Akiyoshi DE, Weiss LM, Feng X, Williams BA, Keeling PJ, Zhang Q et al (2007). Analysis of
the beta-tubulin genes from Enterocytozoon bieneusi isolates from a human and rhesus macaque.
J Eukaryot Microbiol54(1): 38-41.
Altschul SF, Madden TL, Schaffer AA, Zhang J, Zhang Z, Miller W et al (1997). Gapped
BLAST and PSI-BLAST: a new generation of protein database search programs. Nucleic Acids
Res25(17): 3389-3402.
Amyotte SG, Tan X, Pennerman K, Jimenez-Gasco Mdel M, Klosterman SJ, Ma LJ et al (2012).
Transposable elements in phytopathogenic Verticillium spp.: insights into genome evolution and
inter- and intra-specific diversification. BMC Genomics13: 314.
Auge-Gouillon C, Notareschi-Leroy H, Abad P, Periquet G, Bigot Y (2000). Phylogenetic
analysis of the functional domains of mariner-like element (MLE) transposases. Mol Gen
Genet264(4): 506-513.
Bailly-Bechet M, Haudry A, E Lerat E (2014). « One code to find them all »: a perl tool to
conveniently parse RepeatMasker output files. Mob DNAin press.
Belkorchia A, Biderre C, Militon C, Polonais V, Wincker P, Jubin C et al (2008). In vitro
155
propagation of the microsporidian pathogen Brachiola algerae and studies of its chromosome and
ribosomal DNA organization in the context of the complete genome sequencing project.
Parasitol Int57(1): 62-71.
Biemont C (2010). A brief history of the status of transposable elements: from junk DNA to
major players in evolution. Genetics186(4): 1085-1093.
Capella-Gutierrez S, Silla-Martinez JM, Gabaldon T (2009). trimAl: a tool for automated
alignment trimming in large-scale phylogenetic analyses. Bioinformatics25(15): 1972-1973.
Capy P, Vitalis R, Langin T, Higuet D, Bazin C (1996). Relationships between transposable
elements based upon the integrase-transposase domains: is there a common ancestor? J Mol
Evol42(3): 359-368.
Corradi N, Haag KL, Pombert JF, Ebert D, Keeling PJ (2009). Draft genome sequence of the
Daphnia pathogen Octosporea bayeri: insights into the gene content of a large microsporidian
genome and a model for host-parasite interactions. Genome Biol10(10): R106.
Corradi N, Pombert JF, Farinelli L, Didier ES, Keeling PJ (2010). The complete sequence of the
smallest known nuclear genome from the microsporidian Encephalitozoon intestinalis. Nat
Commun1: 77.
Corradi N, Selman M (2013). Latest progress in microsporidian genome research. J Eukaryot
Microbiol60(3): 309-312.
Corradi N, Slamovits CH (2011). The intriguing nature of microsporidian genomes. Brief Funct
Genomics10(3): 115-124.
Cuomo CA, Desjardins CA, Bakowski MA, Goldberg J, Ma AT, Becnel JJ et al (2012).
Microsporidian genome analysis reveals evolutionary strategies for obligate intracellular growth.
Genome Res22(12): 2478-2488.
156

Daboussi MJ, Capy P (2003). Transposable elements in filamentous fungi. Annu Rev
Microbiol57: 275-299.
Darriba D, Taboada GL, Doallo R, Posada D (2011). ProtTest 3: fast selection of best-fit models
of protein evolution. Bioinformatics27(8): 1164-1165.
Dean RA, Talbot NJ, Ebbole DJ, Farman ML, Mitchell TK, Orbach MJ et al (2005). The
genome sequence of the rice blast fungus Magnaporthe grisea. Nature434(7036): 980-986.
Didier ES, Weiss LM, Cali A, Marciano-Cabral F (2009). Overview of the presentations on
microsporidia and free-living amebae at the 10th International Workshops on Opportunistic
Protists. Eukaryot Cell8(4): 441-445.
Duplessis S, Cuomo CA, Lin YC, Aerts A, Tisserant E, Veneault-Fourrey C et al (2011).
Obligate biotrophy features unraveled by the genomic analysis of rust fungi. Proc Natl Acad Sci
U S A108(22): 9166-9171.
Edgar RC (2004). MUSCLE: multiple sequence alignment with high accuracy and high
throughput. Nucleic Acids Res32(5): 1792-1797.
Gilbert C, Schaack S, Pace JK, 2nd, Brindley PJ, Feschotte C (2010). A role for host-parasite
interactions in the horizontal transfer of transposons across phyla. Nature464(7293): 1347-1350.
Guindon S, Dufayard JF, Lefort V, Anisimova M, Hordijk W, Gascuel O (2010). New
algorithms and methods to estimate maximum-likelihood phylogenies: assessing the
performance of PhyML 3.0. Syst Biol59(3): 307-321.
Hecht MM, Nitz N, Araujo PF, Sousa AO, Rosa Ade C, Gomes DA et al (2010). Inheritance of
DNA transferred from American trypanosomes to human hosts. PLoS One5(2): e9181.
Heinz E, Williams TA, Nakjang S, Noel CJ, Swan DC, Goldberg AV et al (2012). The genome
157
of the obligate intracellular parasite Trachipleistophora hominis: new insights into
microsporidian genome dynamics and reductive evolution. PLoS Pathog8(10): e1002979.
Hua-Van A, Le Rouzic A, Maisonhaute C, Capy P (2005). Abundance, distribution and
dynamics of retrotransposable elements and transposons: similarities and differences. Cytogenet
Genome Res110(1-4): 426-440.
Huelsenbeck JP, Ronquist F (2001). MRBAYES: Bayesian inference of phylogenetic trees.
Bioinformatics17(8): 754-755.
Ivancevic AM, Walsh AM, Kortschak RD, Adelson DL (2013). Jumping the fine LINE between
species: horizontal transfer of transposable elements in animals catalyses genome evolution.
Bioessays35(12): 1071-1082.
James TY, Pelin A, Bonen L, Ahrendt S, Sain D, Corradi N et al (2013). Shared signatures of
parasitism and phylogenomics unite cryptomycota and microsporidia. Curr Biol23(16): 1548-
1553.
Jurka J (2000). Repbase update: a database and an electronic journal of repetitive elements.
Trends Genet16(9): 418-420.
Jurka J, Bao W, Kojima KK (2011). Families of transposable elements, population structure and
the origin of species. Biol Direct6: 44.
Katinka MD, Duprat S, Cornillot E, Metenier G, Thomarat F, Prensier G et al (2001). Genome
sequence and gene compaction of the eukaryote parasite Encephalitozoon cuniculi.
Nature414(6862): 450-453.
Katoh K, Misawa K, Kuma K, Miyata T (2002). MAFFT: a novel method for rapid multiple
sequence alignment based on fast Fourier transform. Nucleic Acids Res30(14): 3059-3066.
158

Keeling PJ, Corradi N, Morrison HG, Haag KL, Ebert D, Weiss LM et al (2010). The reduced
genome of the parasitic microsporidian Enterocytozoon bieneusi lacks genes for core carbon
metabolism. Genome Biol Evol2: 304-309.
Labbe J, Murat C, Morin E, Tuskan GA, Le Tacon F, Martin F (2012). Characterization of
transposable elements in the ectomycorrhizal fungus Laccaria bicolor. PLoS One7(8): e40197.
Laha T, Loukas A, Wattanasatitarpa S, Somprakhon J, Kewgrai N, Sithithaworn P et al (2007).
The bandit, a new DNA transposon from a hookworm-possible horizontal genetic transfer
between host and parasite. PLoS Negl Trop Dis1(1): e35.
Lavoie CA, Platt RN, 2nd, Novick PA, Counterman BA, Ray DA (2013). Transposable element
evolution in Heliconius suggests genome diversity within Lepidoptera. Mob DNA4(1): 21.
Lerat E, Brunet F, Bazin C, Capy P (1999). Is the evolution of transposable elements modular?
Genetica107(1-3): 15-25.
Llorens C, Munoz-Pomer A, Bernad L, Botella H, Moya A (2009). Network dynamics of
eukaryotic LTR retroelements beyond phylogenetic trees. Biol Direct4: 41.
Loreto EL, Carareto CM, Capy P (2008). Revisiting horizontal transfer of transposable elements
in Drosophila. Heredity (Edinb)100(6): 545-554.
Marchler-Bauer A, Lu S, Anderson JB, Chitsaz F, Derbyshire MK, DeWeese-Scott C et al
(2011). CDD: a Conserved Domain Database for the functional annotation of proteins. Nucleic
Acids Res39(Database issue): D225-229.
Nakjang S, Williams TA, Heinz E, Watson AK, Foster PG, Sendra KM et al (2013). Reduction
and expansion in microsporidian genome evolution: new insights from comparative genomics.
Genome Biol Evol5(12): 2285-2303.
159

Novick P, Smith J, Ray D, Boissinot S (2010). Independent and parallel lateral transfer of DNA
transposons in tetrapod genomes. Gene449(1-2): 85-94.
Oliver KR, Greene WK (2009). Transposable elements: powerful facilitators of evolution.
Bioessays31(7): 703-714.
Pan G, Xu J, Li T, Xia Q, Liu SL, Zhang G et al (2013). Comparative genomics of parasitic
silkworm microsporidia reveal an association between genome expansion and host adaptation.
BMC Genomics14: 186.
Peyretaillade E, Parisot N, Polonais V, Terrat S, Denonfoux J, Dugat-Bony E et al (2012).
Annotation of microsporidian genomes using transcriptional signals. Nat Commun3: 1137.
Pombert JF, Selman M, Burki F, Bardell FT, Farinelli L, Solter LF et al (2012). Gain and loss of
multiple functionally related, horizontally transferred genes in the reduced genomes of two
microsporidian parasites. Proc Natl Acad Sci U S A109(31): 12638-12643.
Punta M, Coggill PC, Eberhardt RY, Mistry J, Tate J, Boursnell C et al (2012). The Pfam protein
families database. Nucleic Acids Res40(Database issue): D290-301.
Raffaele S, Kamoun S (2012). Genome evolution in filamentous plant pathogens: why bigger
can be better. Nat Rev Microbiol10(6): 417-430.
Sarkar A, Sim C, Hong YS, Hogan JR, Fraser MJ, Robertson HM et al (2003). Molecular
evolutionary analysis of the widespread piggyBac transposon family and related "domesticated"
sequences. Mol Genet Genomics270(2): 173-180.
Sayers EW, Barrett T, Benson DA, Bolton E, Bryant SH, Canese K et al (2011). Database
resources of the National Center for Biotechnology Information. Nucleic Acids Res39(Database
issue): D38-51.
160

Schaack S, Gilbert C, Feschotte C (2010). Promiscuous DNA: horizontal transfer of transposable
elements and why it matters for eukaryotic evolution. Trends Ecol Evol25(9): 537-546.
Selman M, Corradi N (2011). Microsporidia: Horizontal gene transfers in vicious parasites. Mob
Genet Elements1(4): 251-255.
Selman M, Pombert JF, Solter L, Farinelli L, Weiss LM, Keeling P et al (2011). Acquisition of
an animal gene by microsporidian intracellular parasites. Curr Biol21(15): R576-577.
Shao H, Tu Z (2001). Expanding the diversity of the IS630-Tc1-mariner superfamily: discovery
of a unique DD37E transposon and reclassification of the DD37D and DD39D transposons.
Genetics159(3): 1103-1115.
Siguier P, Perochon J, Lestrade L, Mahillon J, Chandler M (2006). ISfinder: the reference centre
for bacterial insertion sequences. Nucleic Acids Res34(Database issue): D32-36.
Slamovits CH, Keeling PJ (2004). Class II photolyase in a microsporidian intracellular parasite. J
Mol Biol341(3): 713-721.
Smit AFA, Hubley R, Green P RepeatMasker Open-3.0. 1996-2010
http://www.repeatmasker.org.
Steglich C, Schaeffer SW (2006). The ornithine decarboxylase gene of Trypanosoma brucei:
Evidence for horizontal gene transfer from a vertebrate source. Infect Genet Evol6(3): 205-219.
Sun C, Shepard DB, Chong RA, Lopez Arriaza J, Hall K, Castoe TA et al (2012). LTR
retrotransposons contribute to genomic gigantism in plethodontid salamanders. Genome Biol
Evol4(2): 168-183.
Teixeira AR, Arganaraz ER, Freitas LH, Jr., Lacava ZG, Santana JM, Luna H (1994). Possible
integration of Trypanosoma cruzi kDNA minicircles into the host cell genome by infection.
Mutat Res305(2): 197-209.
161
Tollis M, Boissinot S (2012). The evolutionary dynamics of transposable elements in eukaryote
genomes. Genome Dyn7: 68-91.
Vavra J, Lukes J (2013). Microsporidia and 'the art of living together'. Adv Parasitol82: 253-319.
Wallau GL, Ortiz MF, Loreto EL (2012). Horizontal transposon transfer in eukarya: detection,
bias, and perspectives. Genome Biol Evol4(8): 689-699.
Wang S, Zhang L, Meyer E, Bao Z (2010). Genome-wide analysis of transposable elements and
tandem repeats in the compact placozoan genome. Biol Direct5: 18.
Wicker T, Sabot F, Hua-Van A, Bennetzen JL, Capy P, Chalhoub B et al (2007). A unified
classification system for eukaryotic transposable elements. Nat Rev Genet8(12): 973-982.
Wijayawardena BK, Minchella DJ, DeWoody JA (2013). Hosts, parasites, and horizontal gene
transfer. Trends Parasitol29(7): 329-338.
Williams BA, Lee RC, Becnel JJ, Weiss LM, Fast NM, Keeling PJ (2008). Genome sequence
surveys of Brachiola algerae and Edhazardia aedis reveal microsporidia with low gene densities.
BMC Genomics9: 200.
Xiang H, Pan G, Vossbrinck CR, Zhang R, Xu J, Li T et al (2010). A tandem duplication of
manganese superoxide dismutase in Nosema bombycis and its evolutionary origins. J Mol
Evol71(5-6): 401-414.
Yoshiyama M, Tu Z, Kainoh Y, Honda H, Shono T, Kimura K (2001). Possible horizontal
transfer of a transposable element from host to parasitoid. Mol Biol Evol18(10): 1952-1958.
Zhang HH, Feschotte C, Han MJ, Zhang Z. (2014). Recurrent horizontal transfers of chapaev transposons in diverse invertebrate and vertebrate animals. Genome Biol Evol. (6):1375–1386.
162
JOHN WILEY AND SONS LICENSETERMS AND CONDITIONS
Apr 27, 2015
This Agreement between Adrian Pelin ("You") and John Wiley and Sons ("John Wiley andSons") consists of your license details and the terms and conditions provided by John Wileyand Sons and Copyright Clearance Center.
License Number 3617111168872
License date Apr 27, 2015
Licensed Content Publisher John Wiley and Sons
Licensed Content Publication Environmental Microbiology
Licensed Content Title Genome analyses suggest the presence of polyploidy and recenthuman-driven expansions in eight global populations of thehoneybee pathogen Nosema ceranae
Licensed Content Author Adrian Pelin,Mohammed Selman,Stéphane Aris-Brosou,LaurentFarinelli,Nicolas Corradi
Licensed Content Date Apr 27, 2015
Pages 1
Type of use Dissertation/Thesis
Requestor type Author of this Wiley article
Format Print and electronic
Portion Full article
Will you be translating? No
Title of your thesis /dissertation
Population genome-wide analysis of geographically distant isolatesof the bee pathogen Nosema ceranae
Expected completion date May 2015
Expected size (number of 166
Rightslink Printable License https://s100.copyright.com/App/PrintableLicenseFrame.jsp?publisherID...
1 of 7 4/27/15 10:56 AM
163

ELSEVIER LICENSETERMS AND CONDITIONS
Apr 23, 2015
This is a License Agreement between Adrian Pelin ("You") and Elsevier ("Elsevier")provided by Copyright Clearance Center ("CCC"). The license consists of your order details,the terms and conditions provided by Elsevier, and the payment terms and conditions.
All payments must be made in full to CCC. For payment instructions, please seeinformation listed at the bottom of this form.
Supplier Elsevier LimitedThe Boulevard,Langford LaneKidlington,Oxford,OX5 1GB,UK
Registered CompanyNumber
1982084
License number 3614820847457
License date Apr 23, 2015
Licensed content publisher Elsevier
Licensed content publication International Journal for Parasitology
Licensed content title Morphology and phylogeny of Agmasoma penaei (Microsporidia)from the type host, Litopenaeus setiferus, and the type locality,Louisiana, USA
Licensed content author None
Licensed content date January 2015
Licensed content volumenumber
45
Licensed content issuenumber
1
Number of pages 16
Start Page 1
End Page 16
Type of Use reuse in a thesis/dissertation
Intended publisher of newwork
other
Portion full article
Format print
Are you the author of thisElsevier article?
Yes
Will you be translating? No
Rightslink Printable License https://s100.copyright.com/App/PrintableLicenseFrame.jsp?publisherID...
1 of 8 4/23/15 10:40 AM
164

Title of yourthesis/dissertation
Population genome-wide analysis of geographically distant isolatesof the bee pathogen Nosema ceranae
Expected completion date May 2015
Estimated size (number ofpages)
166
Elsevier VAT number GB 494 6272 12
Permissions price 0.00 USD
VAT/Local Sales Tax 0.00 USD / 0.00 GBP
Total 0.00 USD
Terms and Conditions
INTRODUCTION
1. The publisher for this copyrighted material is Elsevier. By clicking "accept" inconnection with completing this licensing transaction, you agree that the following termsand conditions apply to this transaction (along with the Billing and Payment terms andconditions established by Copyright Clearance Center, Inc. ("CCC"), at the time that youopened your Rightslink account and that are available at any time athttp://myaccount.copyright.com).
GENERAL TERMS
2. Elsevier hereby grants you permission to reproduce the aforementioned material subject tothe terms and conditions indicated.
3. Acknowledgement: If any part of the material to be used (for example, figures) hasappeared in our publication with credit or acknowledgement to another source, permissionmust also be sought from that source. If such permission is not obtained then that materialmay not be included in your publication/copies. Suitable acknowledgement to the sourcemust be made, either as a footnote or in a reference list at the end of your publication, asfollows:
"Reprinted from Publication title, Vol /edition number, Author(s), Title of article / title ofchapter, Pages No., Copyright (Year), with permission from Elsevier [OR APPLICABLESOCIETY COPYRIGHT OWNER]." Also Lancet special credit - "Reprinted from TheLancet, Vol. number, Author(s), Title of article, Pages No., Copyright (Year), withpermission from Elsevier."
4. Reproduction of this material is confined to the purpose and/or media for whichpermission is hereby given.
5. Altering/Modifying Material: Not Permitted. However figures and illustrations may bealtered/adapted minimally to serve your work. Any other abbreviations, additions, deletionsand/or any other alterations shall be made only with prior written authorization of ElsevierLtd. (Please contact Elsevier at [email protected])
6. If the permission fee for the requested use of our material is waived in this instance,please be advised that your future requests for Elsevier materials may attract a fee.
Rightslink Printable License https://s100.copyright.com/App/PrintableLicenseFrame.jsp?publisherID...
2 of 8 4/23/15 10:40 AM165

OXFORD UNIVERSITY PRESS LICENSETERMS AND CONDITIONS
Apr 22, 2015
This is a License Agreement between Adrian Pelin ("You") and Oxford University Press("Oxford University Press") provided by Copyright Clearance Center ("CCC"). The licenseconsists of your order details, the terms and conditions provided by Oxford University Press,and the payment terms and conditions.
All payments must be made in full to CCC. For payment instructions, please seeinformation listed at the bottom of this form.
License Number 3614340846337
License date Apr 22, 2015
Licensed content publisher Oxford University Press
Licensed content publication Genome Biology and Evolution
Licensed content title Microsporidian Genomes Harbor a Diverse Array of TransposableElements that Demonstrate an Ancestry of Horizontal Exchange withMetazoans:
Licensed content author Nicolas Parisot, Adrian Pelin, Cyrielle Gasc, Valérie Polonais, AbdelBelkorchia, Johan Panek, Hicham El Alaoui, David G. Biron, ÉmilieBrasset, Chantal Vaury, Pierre Peyret, Nicolas Corradi, ÉricPeyretaillade, Emmanuelle Lerat
Licensed content date 09/01/2014
Type of Use Thesis/Dissertation
Institution name None
Title of your work Population genome-wide analysis of geographically distant isolatesof the bee pathogen Nosema ceranae
Publisher of your work n/a
Expected publication date May 2015
Permissions cost 0.00 USD
Value added tax 0.00 USD
Total 0.00 USD
Total 0.00 USD
Terms and Conditions
STANDARD TERMS AND CONDITIONS FOR REPRODUCTION OF MATERIALFROM AN OXFORD UNIVERSITY PRESS JOURNAL
1. Use of the material is restricted to the type of use specified in your order details.
2. This permission covers the use of the material in the English language in the followingterritory: world. If you have requested additional permission to translate this material, theterms and conditions of this reuse will be set out in clause 12.
Rightslink Printable License https://s100.copyright.com/App/PrintableLicenseFrame.jsp?publisherID...
1 of 3 4/22/15 2:31 PM
166